Solid state deposition of chiral amphiphilic porphyrin derivatives on glass surface
Upload
khangminh22Category
view
4download
0
Biophysical Journal Volume 73 December 1997 3039-3055
Structure and Dynamics of an Amphiphilic Peptide in a Lipid Bilayer:A Molecular Dynamics Study
Katarina Belohorcova,* James H. Davis,* Thomas B. Woolf,§ and Benoit Roux#*Department of Physics, University of Guelph, Guelph, Ontario NiG 2W1, Canada; #D6partements de physique et de chimie, Universit6de Montr6al, Montr6al, Qu6bec H3C 3J7, Canada; and §Department of Physiology, Johns Hopkins University School of Medicine,Baltimore, Maryland 21205 USA
ABSTRACT A molecular dynamics simulation of a simple model membrane system composed of a single amphiphilic helicalpeptide (ace-K2GL16K2A-amide) in a fully hydrated 1 ,2-dimyristoyl-sn-glycero-3-phosphocholine bilayer was performed for atotal of 1060 ps. The secondary structure of the peptide and its stability were described in terms of average dihedral angles,0 and qi, and the C. torsion angles formed by backbone atoms; by the average translation per residue along the helix axis;and by the intramolecular peptide hydrogen bonds. The results indicated that residues 6 through 15 remain in a stableright-handed a-helical conformation, whereas both termini exhibit substantial fluctuations. A change in the backbone dihedralangles for residues 16 and 17 is accompanied by the loss of two intramolecular hydrogen bonds, leading to a local butlong-lived disruption of the helix. The dynamics of the peptide was characterized in terms of local and global helix motions.The local motions of the N-H bond angles were described in terms of the autocorrelation functions of P2[cos ONH(t, t + T)] andreflected the different degrees of local peptide order as well as a variation in time scale for local motions. The Xi and X2dihedral angles of the leucine side chains underwent frequent transitions between potential minima. No connection betweenthe side-chain positions and their mobility was observed, however. In contrast, the lysine side chains displayed little mobilityduring the simulation. The global peptide motions were characterized by the tilting and bending motions of the helix. Althoughthe peptide was initially aligned parallel to the bilayer normal, during the simulation it was observed to tilt away from thenormal, reaching an angle of -25° by the end of the simulation. In addition, a slight bend of the helix was detected. Finally,the solvation of the peptide backbone and side-chain atoms was also investigated.
INTRODUCTION
It is now widely accepted that the biological function ofproteins is inherently connected to their motion. Motion canoccur on different time scales (ranging from femtosecondsto many hours), different length scales (from 0.01 A up to100 A), and different energies (0.1-100 kcal/mol) (e.g.,Brooks et al., 1988). Membrane proteins exist in a verycomplex environment, the composition of which varies im-mensely from organism to organism. The function of themembrane is not only to act as a semipermeable barrier, butalso to maintain and facilitate the function and stability ofmembrane proteins (Stowell and Rees, 1995). In principle,spectroscopic techniques (i.e., vibrational or Raman spec-troscopy, NMR spectroscopy, etc.) can be used to elucidatethe nature of protein structure and dynamics in biologicalmembranes. However, spectroscopic measurements provideinformation averaged over the time scale of the experiment.The fine details of the molecular motion are not directlymeasured if the motion is fast relative to the experimentaltime scale (Brooks et al., 1988; Gennis, 1989). More de-tailed information on molecular structure, dynamics, andenergetics on an atomic level can be obtained by theoreticalmethods such as molecular dynamics (MD) (van Gunsteren
Received for publication 17 January 1997 and in final form 21 August1997.Address reprint requests to Dr. James Davis, Department of Physics,Guelph University, Guelph, ON NIG 2W1, Canada. Tel.: 519-824-4120,X2659; Fax: 519-836-9967; E-mail: [email protected] 1997 by the Biophysical Society0006-3495/97/12/3039/17 $2.00
and Mark, 1992). Because MD can, in principle, providedetailed information that is not easily accessible experimen-tally, it is a particularly powerful method for studyingmembrane proteins (Pastor, 1994). However, the bulk of thework in the field of MD consists of simulations of simpleand complex liquids, proteins in vacuum or water, lipidmonolayers and bilayers, DNA, etc., and it is only veryrecently that there has been progress in the study of mem-brane proteins. This paper concentrates on the investigationof static and dynamic properties of a peptide that is incor-porated into a hydrated lipid bilayer, presenting a simplemodel of a biological membrane.
In MD, changes in atomic positions are obtained bysolving Newton's equations of motion. The equations ofmotion are integrated in small time steps, thus producingindividual atomic trajectories (Haile, 1992). From atomictrajectories a wealth of information can be obtained, e.g.,time averages of different macroscopic properties, bothstatic and dynamic, and time dependences of different pro-cesses (Haile, 1992). The MD method does have limitations,however. One of these limits is the use of an empiricalpotential function in which approximations and simplifica-tions have been made to achieve a balance between com-putational efficiency and the accuracy of the potential func-tion (Brooks et al., 1988). Furthermore, the short length ofthe simulation (currently reaching up to a nanosecond) andthe small size of the system (which can comprise a fewthousand atoms) limit the configurational sampling. Finally,the numerical integration of Newton's equations of motionrequires the use of finite-difference methods that may be
3039

Volume 73 December 1997
imprecise because of truncation and round-off errors. Ulti-mately, the computational limitations are related to thecurrent hardware.Many MD simulations of proteins in vacuum or water
(e.g., see Brooks and Karplus, 1989; Kovacs et al., 1995;Hirst and Brooks, 1995; van Gunsteren et al., 1995; etc.)and of lipid bilayers (e.g., see Pastor et al., 1991; Venable etal., 1993; Stouch, 1993; Heller et al., 1993, etc.) have nowbeen performed. These simulations have shown the powerof the method and thus pave the way for simulations ofmore complicated systems, such as biological membranes.However, MD simulations of biological membranes thatinclude a protein embedded in a hydrated lipid bilayer arestill rare, because of the lack of accurate experimentalstructures. Currently, relatively few three-dimensionalstructures of membrane proteins are known with high res-olution, such as bacteriorhodopsin (Grigorieff et al., 1996),the photosynthetic reaction centers of R. viridis (Deisen-hofer and Michel, 1989) and R. sphaeroides (Ennler et al.,1992), prostaglandin synthase (Picot et al., 1994), the light-harvesting complex II of photosystem II (Kuhlbrandt et al.,1994), porin (Weiss and Schulz, 1992), and Staphylococcusaureus a-hemolysin pore (Song et al., 1996). All of thesemembrane proteins have a large molecular weight, and thusa conventional MD simulation of a model membrane con-taining such a membrane protein presents a major challenge.Additional difficulties are presented by the construction ofthe initial configuration of the simulation system. Thus far,a limited number of MD simulations of model membranescontaining a transmembrane peptide have been reported.One of the earliest simulations was that performed by Ed-holm and Johansson (1987). They simulated a polypeptidea-helix inserted into a simplified model membrane com-posed of 16 carbon single-chain amphiphiles harmonicallyattached to a plane to maintain a bilayer configuration; nosolvent water molecules were included. More recently, all-atom MD simulations followed: the gramicidin channel in afully hydrated dimyristoylphosphatidylcholine (DMPC) bi-layer (Woolf and Roux, 1994a, 1996), Pfl coat protein in adipalmitoylphosphatidylcholine (DPPC) bilayer (Roux andWoolf, 1996), a C-terminal fragment (residues 13-41) ofhuman corticotropin-releasing factor in a dioleoylphosphati-dylcholine bilayer (Huang and Loew, 1995), a model all-alanine a helix in DMPC (Shen et al., 1997), individuala-helices from bacteriorhodopsin in DMPC (Woolf, 1996),and melittin in a DMPC bilayer (S. Berneche and B. Roux,private communication). Edholm et al. (1995) performed anMD simulation of the native bacteriorhodopsin in purplemembrane, using a united atom model. To our knowledge,this is the only MD simulation of a multihelix membraneprotein in a lipid bilayer. A few simulations elucidating thediffusion mechanism of small molecules, such as benzeneand 1,4-dihydropyridine calcium channel antagonist, andwater transport through a lipid membrane, have been re-ported (Bassolino-Klimas et al., 1993, 1995; Alper andStouch, 1995; Marrink and Berendsen, 1994). Furthermore,
bilayer have been performed (Damodaran et al., 1995;Damodaran and Merz, 1995).The complexity of motions occurring in a biological
membrane may ultimately require extended simulation pe-
riods with time scales of up to seconds. This is because theequilibration time of the system is longer than the longestintrinsic relaxation time of the system (van Gunsteren andMark, 1992). Although it is not currently possible to per-
form a sufficiently long simulation to investigate such longtime scales, we can still learn about the short-time-scaleprocesses, provided that the system is stable. The durationof equilibration depends on how far the system in its initialconfiguration is from the equilibrium state (Haile, 1992).Therefore the choice of the initial configuration of thesystem is extremely important. One of the possible ap-
proaches to the construction of the initial configuration of a
model membrane is the "overlay" method. This was used byEdholm and Johansson (1987) to build a system composedof a polypeptide a-helix and a simplified model membranecomposed of 100 single-chain amphiphiles harmonicallyattached to a plane. No solvent water molecules were in-cluded. To construct the initial configuration, a number ofchains were removed from a previously equilibrated lipidbilayer, and the helix was inserted into the created cavity.This method worked because of the simplicity of the modelmembrane, the absence of solvent water molecules, and therelatively regular shape of the a-helix. However, thismethod is inappropriate for inserting a protein of a more
complicated shape into a fully hydrated membrane of phos-pholipids molecules with two hydrocarbon chains. A novelprotocol designed by Woolf and Roux (Woolf and Roux,1996; Roux and Woolf, 1996) allows the construction ofmore complicated systems. The basic idea is to assemble a
system from individual preequilibrated components. Thecurrent system was constructed according to this method,starting with a synthetic peptide, prehydrated phospholipids,and bulk water molecules (Woolf and Roux, 1994b, 1996;De Loof et al., 1991; Pastor et al., 1991; Venable et al.,1993).The MD simulation reported here used a transbilayer
synthetic peptide (acetyl-Lys2-Gly-Leul6-Lys2-Ala-amide)belonging to a class of extensively experimentally studiedpeptides with sequences ace-Lys2-Gly-Leun-Lys2-Ala-amide or ace-Lys2-Leun-Lys2-Ala-amide (these will be re-
ferred to as peptide-n, where n is the number of leucines inthe hydrophobic part of the peptide, n = 16, 20, 24). Themodel membrane system consists of a fully hydrated DMPCbilayer into which peptide-16, including an acetylated N-terminus, was inserted. The system composition was chosento correspond to samples studied experimentally (J. Qianand J. H. Davis, private communication). The structure ofthe peptide was chosen so that it would have an amphiphiliccharacter, with a long hydrophobic core, and lysines at bothtermini interacting with the polar environment. Circulardichroism studies (Davis et al., 1983; Prosser et al. 1992)showed that peptide-n molecules adopt an a-helical confor-
MD studies of the interaction of small peptides with a lipid
3040 Biophysical Journal
mation in a lipid bilayer. The synthetic peptide thus repre-
Molecular Dynamics of a Model Membrane
sents a very simple model of a membrane protein, becauseit is believed that the membrane-spanning domain of amembrane protein may generally consist of a single a-helical polypeptide or several structured strands of aminoacids (Mouritsen and Bloom, 1993). The different length ofthe hydrophobic core was designed to study the effect of themismatch of the hydrophobic regions of the peptide and thebilayer on the bilayer thickness (Nezil and Bloom, 1992). Itwas found that the average thickness of the lipid bilayerswas significantly perturbed in cases of a large mismatch.Zhang et al. (1992a) studied the conformation and amidehydrogen exchange of peptide-24 dispersed in fully hy-drated phospholipid bilayers by Fourier transform infraredspectroscopy. Their results indicate that at least 80% of thehelix retains its a-helical conformation, which means thatthe entire polyleucine core of the peptide must be includedin its a-helical domain. The hydrogen exchange experi-ments provide insight into the stability of a-helical confor-mations. The greater propensity for H/D exchange at bothpeptide termini may indicate reduced stability of the a-helical conformation at these ends. X-ray diffraction exper-iments were performed on systems composed of peptide- 16and peptide-24, respectively, inserted in a DPPC bilayer ina gel phase (Huschilt et al., 1989). The lipid:peptide moleratio of the former was 10: 1, and that of the latter was 30: 1.The conclusions were that the helices oriented themselveswith their helical axes perpendicular to the lipid bilayer towithin 250. A NMR dynamics study of the backbone ofpeptide-24 in a DPPC bilayer was performed by Pauls et al.(1985) at different temperatures, both in the gel state and inthe liquid-crystalline state of the bilayer. The results showedthat the average angle between the motional symmetry axisand the N-2H bond was close to 190 in a liquid crystallinestate bilayer at 42°C. The correlation time of the fast reori-entational motion about the helix axis was found to decreasewith increasing temperature.
In the next section, the basic steps of the system con-struction are described. Then the computational details aregiven, after which the equilibration and, finally, the simu-lation are described in detail. The structure of the peptideand its stability were investigated and, when possible, com-pared to experimental results. Local and global helix mo-tions were analyzed to elucidate the nature and the timescales of the peptide motions within the length of thesimulation. The local motions studied include, for example,the dynamics of the NH bonds and isomerizations of theside-chain dihedral angles. The global motions of the helixwere investigated in terms of the tilt angle of the helix axiswith respect to the bilayer normal (z axis) and of the bendangle of the helix.
MODEL AND METHODS
Construction of the initial configuration
The membrane system for the MD simulation consists of a
Gly-LeuM6-Lys2-Ala-amide, 12 DMPC molecules (6 in eachlayer), and 593 water molecules, corresponding to a total of3613 atoms. This is 51% water by weight. The total chargeof the system was +4; however, counterions were notincluded in the system, because of the slow time scale (onthe order of nanoseconds) of ion redistribution in solution(van Gunsteren et al., 1995). Molecular mechanics softwareCHARMM (Brooks et al., 1983) and the all-atom force fieldPARAM 22 (Mackerell et al., 1992) were used to build thesystem and to perform the MD simulation. The system wasconstructed using a protocol designed and described indetail by Woolf and Roux (1996) and in Roux and Woolf(1996, Ch. 17). The basic idea of the method is to constructthe system in a state that is as close as possible to theequilibrium state of the bilayer in the liquid-crystallinephase, to avoid a lengthy heating and equilibration period.The peptide was constructed in an ideal right-handed
a-helical conformation because experiments have indicatedthat the peptide adopts this conformation in lipid bilayers(Davis et al., 1983; Huschilt et al., 1989; Prosser et al.,1992). The helix axis, aligned along the z direction, was
parallel to the bilayer normal. The peptide was then energyminimized. The dihedral angles of the side chains were
harmonically constrained to their optimal values obtainedfrom the backbone-dependent rotamer library for proteins(Dunbrack and Karplus, 1993), the constraining force con-stants being 50 kcal/mol * rad2}. The peptide backbone aswell as CI and C7 atoms of the side chains were initiallyheld fixed. Later they were constrained by a harmonicpotential to their reference positions. The force constant of5.0 kcal/mol - A2 was used first, and then a force constantof 1.0 kcal/mol * A2 was applied. Between changes in theforce constant on the selected atoms, the peptide structurewas energy minimized for 200 steps by the adopted basis-set Newton-Raphson (ABNR) method (Brooks et al., 1983).Finally, all of the constraints were removed and the peptidewas energy minimized for another 300 steps by the ABNRmethod.
In the next stage the cross-sectional area of the systemwas determined. Because the simulation was performedwith a constant number of particles (N) and under constantvolume (V) and constant energy (E) conditions, the cross-
sectional area of the system had to be determined with greatcare, as it has a direct influence on the state of the system(Woolf and Roux, 1996). The cross-sectional area of thepeptide was calculated in the following manner. The totalvolume occupied by peptide atoms was found by searchingthrough a set of grid points for points outside the van derWaals radius of any atom. By dividing the total occupiedvolume by its length, the mean cross-sectional area of thepeptide was determined to be 173.5 A2. The number oflipids surrounding the peptide in each half of the bilayer waschosen to be six for symmetry reasons, and so that therewould not be any large gaps between molecules. The aver-
age cross-sectional area per lipid was assumed to be 64 A2(Gennis, 1989; Nagle, 1993). The cross-sectional area of the
synthetic peptide of the following sequence: acetyl-Lys2-
Belohorcovai et al. 3041
2whole system was calculated to be 557.5 A , defining the
Volume 73 December 1997
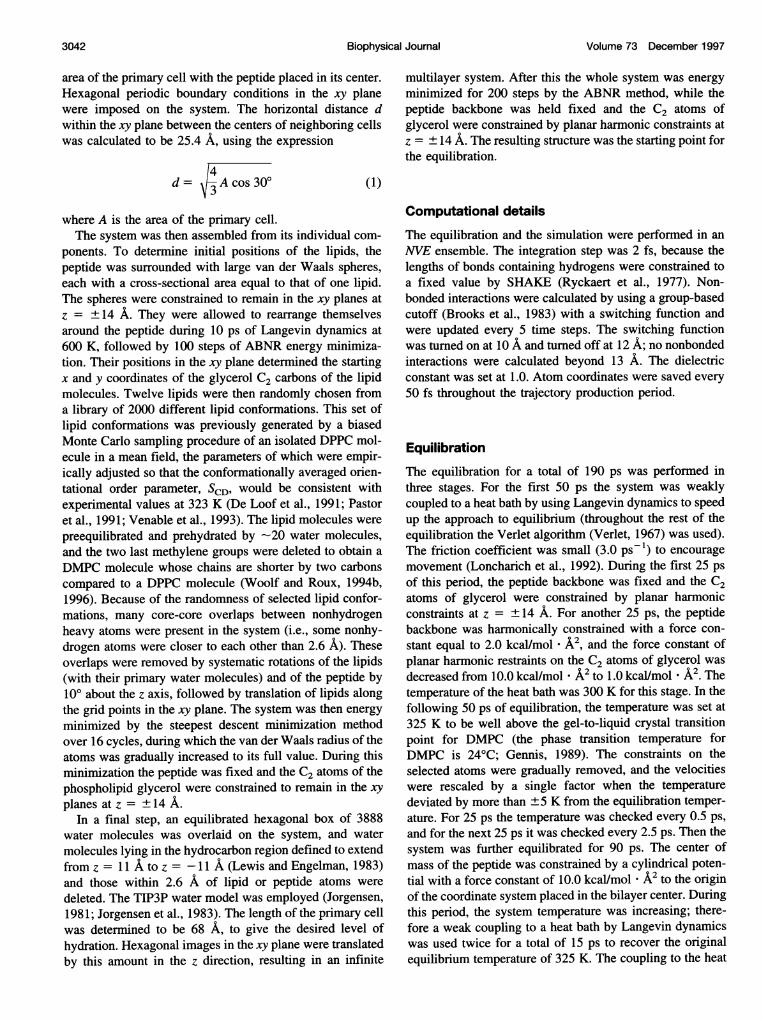
area of the primary cell with the peptide placed in its center.Hexagonal periodic boundary conditions in the xy planewere imposed on the system. The horizontal distance dwithin the xy plane between the centers of neighboring cellswas calculated to be 25.4 A, using the expression
4d= Acos30'
multilayer system. After this the whole system was energyminimized for 200 steps by the ABNR method, while thepeptide backbone was held fixed and the C2 atoms ofglycerol were constrained by planar harmonic constraints atz = + 14 A. The resulting structure was the starting point forthe equilibration.
(1)
where A is the area of the primary cell.The system was then assembled from its individual com-
ponents. To determine initial positions of the lipids, thepeptide was surrounded with large van der Waals spheres,each with a cross-sectional area equal to that of one lipid.The spheres were constrained to remain in the xy planes at
z = ± 14 A. They were allowed to rearrange themselvesaround the peptide during 10 ps of Langevin dynamics at
600 K, followed by 100 steps of ABNR energy minimiza-tion. Their positions in the xy plane determined the startingx and y coordinates of the glycerol C2 carbons of the lipidmolecules. Twelve lipids were then randomly chosen froma library of 2000 different lipid conformations. This set oflipid conformations was previously generated by a biasedMonte Carlo sampling procedure of an isolated DPPC mol-ecule in a mean field, the parameters of which were empir-ically adjusted so that the conformationally averaged orien-tational order parameter, SCD, would be consistent withexperimental values at 323 K (De Loof et al., 1991; Pastoret al., 1991; Venable et al., 1993). The lipid molecules were
preequilibrated and prehydrated by -20 water molecules,and the two last methylene groups were deleted to obtain a
DMPC molecule whose chains are shorter by two carbonscompared to a DPPC molecule (Woolf and Roux, 1994b,1996). Because of the randomness of selected lipid confor-mations, many core-core overlaps between nonhydrogenheavy atoms were present in the system (i.e., some nonhy-drogen atoms were closer to each other than 2.6 A). Theseoverlaps were removed by systematic rotations of the lipids(with their primary water molecules) and of the peptide by100 about the z axis, followed by translation of lipids alongthe grid points in the xy plane. The system was then energy
minimized by the steepest descent minimization methodover 16 cycles, during which the van der Waals radius of theatoms was gradually increased to its full value. During thisminimization the peptide was fixed and the C2 atoms of thephospholipid glycerol were constrained to remain in the xy
planesatz= +14A.In a final step, an equilibrated hexagonal box of 3888
water molecules was overlaid on the system, and water
molecules lying in the hydrocarbon region defined to extendfrom z = 11 A to z = -11 A (Lewis and Engelman, 1983)and those within 2.6 A of lipid or peptide atoms were
deleted. The TIP3P water model was employed (Jorgensen,1981; Jorgensen et al., 1983). The length of the primary cellwas determined to be 68 A, to give the desired level ofhydration. Hexagonal images in the xy plane were translated
by this amount in the z direction, resulting in an infinite
Computational details
The equilibration and the simulation were performed in anNVE ensemble. The integration step was 2 fs, because thelengths of bonds containing hydrogens were constrained toa fixed value by SHAKE (Ryckaert et al., 1977). Non-bonded interactions were calculated by using a group-basedcutoff (Brooks et al., 1983) with a switching function andwere updated every 5 time steps. The switching functionwas turned on at 10 A and turned off at 12 A; no nonbondedinteractions were calculated beyond 13 A. The dielectricconstant was set at 1.0. Atom coordinates were saved every50 fs throughout the trajectory production period.
Equilibration
The equilibration for a total of 190 ps was performed inthree stages. For the first 50 ps the system was weaklycoupled to a heat bath by using Langevin dynamics to speedup the approach to equilibrium (throughout the rest of theequilibration the Verlet algorithm (Verlet, 1967) was used).The friction coefficient was small (3.0 ps 1) to encouragemovement (Loncharich et al., 1992). During the first 25 psof this period, the peptide backbone was fixed and the C2atoms of glycerol were constrained by planar harmonicconstraints at z = + 14 A. For another 25 ps, the peptidebackbone was harmonically constrained with a force con-stant equal to 2.0 kcallmol * A2, and the force constant ofplanar harmonic restraints on the C2 atoms of glycerol wasdecreased from 10.0 kcal/mol * A2 to 1.0 kcaVmol * A2. Thetemperature of the heat bath was 300 K for this stage. In thefollowing 50 ps of equilibration, the temperature was set at325 K to be well above the gel-to-liquid crystal transitionpoint for DMPC (the phase transition temperature forDMPC is 24°C; Gennis, 1989). The constraints on theselected atoms were gradually removed, and the velocitieswere rescaled by a single factor when the temperaturedeviated by more than ±5 K from the equilibration temper-ature. For 25 ps the temperature was checked every 0.5 ps,and for the next 25 ps it was checked every 2.5 ps. Then thesystem was further equilibrated for 90 ps. The center ofmass of the peptide was constrained by a cylindrical poten-tial with a force constant of 10.0 kcal/mol * A2 to the originof the coordinate system placed in the bilayer center. Duringthis period, the system temperature was increasing; there-fore a weak coupling to a heat bath by Langevin dynamicswas used twice for a total of 15 ps to recover the originalequilibrium temperature of 325 K. The coupling to the heat
3042 Biophysical Journal

Molecular Dynamics of a Model Membrane
bath was weak in both cases, with a friction coefficient of0.5 ps'.
Simulation
The total length of the simulation (i.e., the trajectory pro-duction) was 1060 ps. The Verlet algorithm (Verlet, 1967)was used throughout the production run. The simulationwas performed at a temperature of 325K. The center of massof the peptide was restrained by a spherical potential to theorigin of the coordinate system placed in the center of thesimulation cell with a force constant of 1.0 kcal/mol * A2.No coupling to a heat bath was imposed on the systemduring the simulation. To determine whether the system wasin equilibrium, the total energy, its decomposition intokinetic and the potential energies, and the temperature of thesystem were monitored throughout the equilibration and thesimulation. Even though the simulation was performed inthe microcanonical ensemble (i.e., at constant N, V, and E),the total energy was observed to gradually increase, in astepwise fashion, with fairly long periods at a constantvalue. The increase in the total energy over the wholesimulation represented an overall change of 10%. Both thekinetic and the potential energies contributed to the increasein the total energy. The kinetic energy increase may be dueto the finite time step size (2 fs), to the accumulation ofnumerical and round-off errors, or to the choice of an NVErather than a constant pressure simulation system (see Pas-tor and Feller, 1996). The resulting average temperature ofthe simulation was 335.5 K, with a root mean square (rms)deviation of 9.4 K. Despite the slow drift of the temperature,the calculated properties should be characteristic of a sys-tem at a temperature of 336 ± 9 K.
Analysis of results
CHARMM facilities and our own programs were used toanalyze the results.
Determination of the helix axis
To determine the orientation of the helix axis for everysaved coordinate set (each 50 fs), the following procedurewas employed. The moment of inertia tensor of the peptidewas calculated in a coordinate system with its origin placedat the center of mass of the peptide. The tensor was thendiagonalized, and its eigenvalues and eigenvectors werecalculated. Principal axes and principal moments of inertiawere determined, and the helix axis was identified as theprincipal axis corresponding to the smallest eigenvalue (i.e.,to the smallest principal moment of inertia).
Normalized autocorrelation function
The normalized autocorrelation estimate rxx of a discretetime series x(k), where k = 0, 1, . . ., N, was calculated as
follows (Jenkins and Watts, 1968):
CxA(k)rxx(k) = Cxx(o)
where
1 N-k
cxx(k) = N [x(t) - x][x(t + k) - x]t=l
(2)
(3)
and x- = EN lx(k) is the sample mean of the whole series.
Radial distribution function
A convenient tool for investigation of the solvation ofspecified atoms and of the local structure of water aroundselected atoms is the radial distribution function gij(r):
- AN(r)g(r) - pAiV(r) (4)
where
41TAV(r) = 3((r + Ar)3-r3)
AN(r) is the number of molecules i in a spherical shell ofthickness Ar, r is the distance between the molecule j andthe spherical shell, and pi is the bulk density of molecules i.The radial distribution function gives the probability offinding a molecule of type i around a molecule of type j. Itis the ratio of a local density pi(r) of the molecules of typei (e.g., solvent) around a specified atom j to the systemdensity pi (Haile, 1992).The molecular dynamics simulation and analysis of re-
sults were performed on a Silicon Graphics Challenge XLcomputer and on an IBM Risc 6000 workstation. One pi-cosecond of the simulation required -1.1 h of CPU time.The equilibration and the simulation took nearly 7 months.
RESULTS AND DISCUSSION
Structure of the peptide and its stability
It has been shown by circular dichroism experiments thatthe synthetic peptide- 16 adopts an a-helical conformation inlipid bilayers (Davis et al., 1983; Huschilt et al., 1989;Prosser et al., 1992). Therefore, the peptide secondary struc-ture and its stability were carefully examined and comparedto available experimental data.
Backbone dihedral angles
Important factors determining the type of secondary struc-ture adopted by the peptide are the backbone dihedral an-gles: 4, 4', and the C. torsion angles (the Cai torsion anglewas defined by four consecutive C.a atoms, starting at the ithresidue). For an ideal a-helix, 4 and 4' values are near -57°and -47°, respectively (Cantor and Schimmel, 1980); Ca
3043BelohorcovA et al.

Volume 73 December 1997
torsion angles are -50° (Ramakrishnan and Soman, 1982).Fig. 1 shows average dihedral angles 4i, j, and Ca,i torsionangles and their rms deviations for every amino acid resi-due. A detailed analysis shows that residues 6-15 retain ana-helical structure, 4i angles fluctuate about -64°, 4i an-gles fluctuate about -43°, and Cai torsions about 480. Therms deviations of both the 4 and the tf angles in the stableregion of the helix (i.e., from residue 6 to residue 15) are100. The dihedral angles at both ends of the peptide
exhibit rms deviations that are - 1.5 times larger than thosein the stable region of the a-helix, suggesting the deforma-tion of the a-helix, as will be demonstrated later.From the knowledge of 4 and tf time series, Ramachan-
dran maps can be constructed showing unambiguously thetype of the structure adopted by the peptide and its stability.The data points for the Ramachandran maps were collectedevery 5 ps over the whole trajectory. The plots (not shown)
100.0
50.0
0.0
-50.0w
-100.0 K1 3 5 7 9 11 13 15 17
confirmed that the a-helical structure was well preservedfor amino acid residues 4-15 and for residue 18. TheRamachandran data for the first three and for the last threeamino acid residues were scattered over a large region,suggesting deviations from the regular a-helical structure.This effect was most pronounced for the glycine residue,which is known to be a helix breaker. An interesting changein the conformation was observed for Leu17 (see Fig. 2 a).In its Ramachandran map, two distinct regions were occu-pied. The graphs of the evolution of angles O17 and q17 (Fig.2, b and c) show a correlated change of both angles towardlower values. The time dependence of the backbone dihe-dral angles of the neighboring residues, 16 and 18, wasexamined to see if the conformational change at Leu17 waspropagated along the peptide backbone. Concerted changes
0.0 +
+ a
.60.0++
+
I
19 21
C7 ( 0)
50.0
0.0
-50.0
-100.0
- D3v.v80.0 200.0 400.0 600.0 800.0
jl1000.0
80.0 FI
0.01 3 5 7 9 11 13 15 17 19
residue number
FIGURE 1 The average dihedral angles 4), 4' and Ca: torsions versus
residue number. Error bars were obtained from the rms deviations. Dashedlines denote the values typical of an ideal a-helix.
50.0
0.0
-50.0
-100.0
-150.00.0 200.0 400.0 600.0
TIME [PS]
I800.0 1000.0
FIGURE 2 (a) The Ramachandran map of Leu'7. (b) The evolution ofthe +X7 dihedral angle. (c) The evolution of the 417 dihedral angle.
II I~~~~~~~~~~~~~~~~~~~~~~~~~~~~~~~~~~~~~~~~~~~~~~~~~~~~~~~~~~~~~~
Acnrn l--
3044 Biophysical Journal
0
1--
0
I-O
-9-e
1-N
Molecular Dynamics of a Model Membrane
in 416 and 4'16 were observed (&P16 toward higher values),whereas 018 and q118 appeared to be affected only veryslightly. Further analysis (see below) showed that this con-formational change in backbone dihedral angles 4 and q' atleucines 16 and 17 was correlated with the breaking ofhydrogen bonds in this region of the helix, amounting to acorrelated deformation of the corresponding helix turn.
NH bond angles
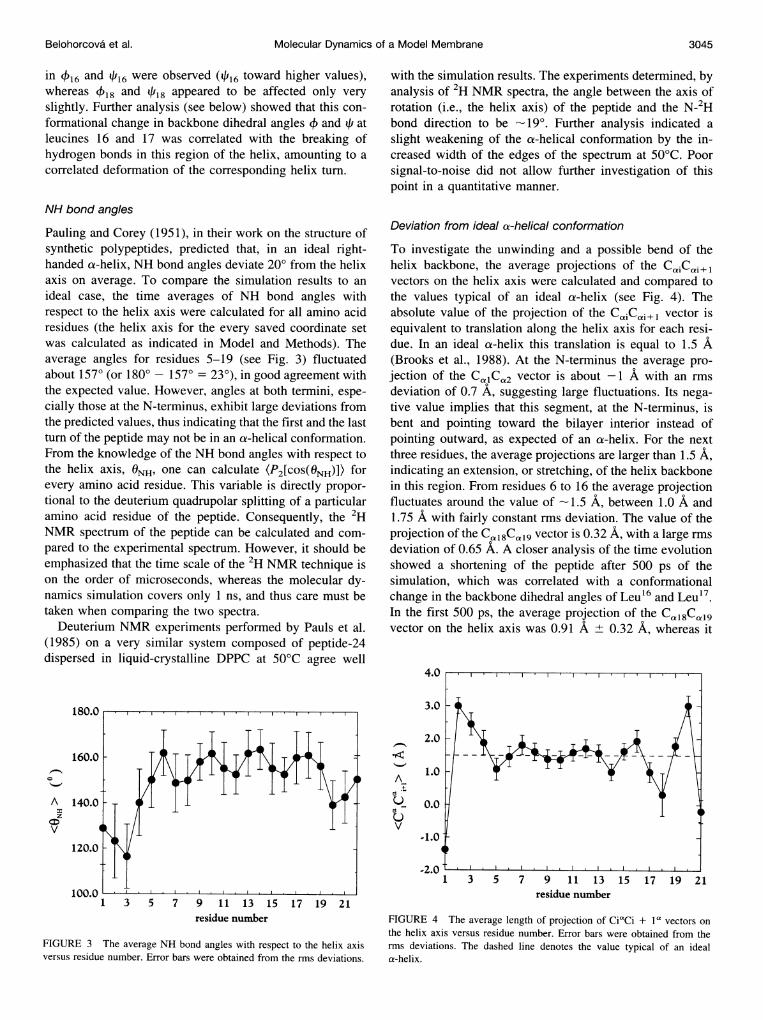
Pauling and Corey (1951), in their work on the structure ofsynthetic polypeptides, predicted that, in an ideal right-handed a-helix, NH bond angles deviate 20° from the helixaxis on average. To compare the simulation results to anideal case, the time averages of NH bond angles withrespect to the helix axis were calculated for all amino acidresidues (the helix axis for the every saved coordinate setwas calculated as indicated in Model and Methods). Theaverage angles for residues 5-19 (see Fig. 3) fluctuatedabout 157° (or 180 -157° = 23°), in good agreement withthe expected value. However, angles at both termini, espe-cially those at the N-terminus, exhibit large deviations fromthe predicted values, thus indicating that the first and the lastturn of the peptide may not be in an a-helical conformation.From the knowledge of the NH bond angles with respect tothe helix axis, ONH, one can calculate (P2[COS(ONH)]) forevery amino acid residue. This variable is directly propor-tional to the deuterium quadrupolar splitting of a particularamino acid residue of the peptide. Consequently, the 2HNMR spectrum of the peptide can be calculated and com-pared to the experimental spectrum. However, it should beemphasized that the time scale of the 2H NMR technique ison the order of microseconds, whereas the molecular dy-namics simulation covers only 1 ns, and thus care must betaken when comparing the two spectra.
Deuterium NMR experiments performed by Pauls et al.(1985) on a very similar system composed of peptide-24dispersed in liquid-crystalline DPPC at 50°C agree well
180.0. . . .
A 140.0 ; 1 ; +
100.0 . .................1 3 5 7 9 11 13 15 17 19 21
residue number
FIGURE 3 The average NH bond angles with respect to the helix axisversus residue number. Error bars were obtained from the rms deviations.
with the simulation results. The experiments determined, byanalysis of 2H NMR spectra, the angle between the axis ofrotation (i.e., the helix axis) of the peptide and the N-2Hbond direction to be -19°. Further analysis indicated aslight weakening of the a-helical conformation by the in-creased width of the edges of the spectrum at 50°C. Poorsignal-to-noise did not allow further investigation of thispoint in a quantitative manner.
Deviation from ideal a-helical conformation
To investigate the unwinding and a possible bend of thehelix backbone, the average projections of the C,iC,i+lvectors on the helix axis were calculated and compared tothe values typical of an ideal a-helix (see Fig. 4). Theabsolute value of the projection of the CaiC ai+l vector isequivalent to translation along the helix axis for each resi-due. In an ideal a-helix this translation is equal to 1.5 A(Brooks et al., 1988). At the N-terminus the average pro-jection of the CalCa2 vector is about -1 A with an rmsdeviation of 0.7 A, suggesting large fluctuations. Its nega-tive value implies that this segment, at the N-terminus, isbent and pointing toward the bilayer interior instead ofpointing outward, as expected of an a-helix. For the nextthree residues, the average projections are larger than 1.5 A,indicating an extension, or stretching, of the helix backbonein this region. From residues 6 to 16 the average projectionfluctuates around the value of - 1.5 A, between 1.0 A and1.75 A with fairly constant rms deviation. The value of theprojection of the CC~l8Ca9 vector is 0.32 A, with a large rmsdeviation of 0.65 A. A closer analysis of the time evolutionshowed a shortening of the peptide after 500 ps of thesimulation, which was correlated with a conformationalchange in the backbone dihedral angles of Leu16 and Leu'7.In the first 500 ps, the average projection of the Cal8CaI9vector on the helix axis was 0.91 A ± 0.32 A, whereas it
4.0
3.0
2.0 ,
A 0
0.0
V
1 3 5 7 9 11 13 15 17 19 21residue number
FIGURE 4 The average length of projection of CiaCi + iP vectors onthe helix axis versus residue number. Error bars were obtained from therms deviations. The dashed line denotes the value typical of an ideala-helix.
Belohorcovca et al. 3045

Volume 73 December 1997
was -0.22 A ± 0.32 A for the rest of the simulation. Inaddition, the average projection of the neighboringCai17Cai8 vector is 1.0 A ± 0.3 A (i.e., shorter than expect-ed). Finally, the last segment, at the C-terminus, is unwoundand pointing toward the bilayer interior, but to a smallerextent than that at the N-terminus.A possible extension of the peptide terminal residues was
observed by Zhang et al. (1992a) in their FTIR experimentsof the peptide-24 embedded in a DPPC lipid bilayer. Theyfound that the peptide was predominantly in an a-helicalconformation (its a-helical domain included the entirepolyleucine core) and observed some non-a-helical struc-tures, possibly in an extended conformation. Similar resultswere obtained for the shorter peptide- 16.
Intramolecular peptide hydrogen bonds
An important characteristic of the a-helical structure is thehydrogen bonds between oxygens and amide hydrogenslocated four residues below (Pauling and Corey, 1951).They are thought to be a primary stabilizing factor for thesecondary structure. Analysis of the existence and durationof these peptide intramolecular hydrogen bonds can be usedto examine the stability of the peptide structure. The hydro-gen bond between Oi and amide Hi+4 was taken to exist ifthe atoms were closer to each other than 2.5 A and if theoxygen-hydrogen-nitrogen angle was greater than 135°(Kovacs et al., 1995). Using this definition of hydrogenbond occurrence, it was determined that oxygens of residues4-14 and of residue 18 were hydrogen bonded to theirrespective hydrogens for at least half of the total simulation.In contrast, the oxygen of Leu17 stayed hydrogen bonded tothe amide hydrogen of Lys2' for only 12% of the simulationtime. The average distances between the oxygens and theamide hydrogens four residues down the helix are shown inFig. 5. The first two oxygens do not hydrogen bond with thepeptide hydrogens at all, because their average distance islarger than 2.5 A for every saved configuration, reflectingthe fact that part of the first turn of the helix is extended.Instead of forming a regular i -> i + 4 bond, 0 washydrogen bonded to H4 for 4.3% of the simulation time and02 was hydrogen bonded to H4 for 15.7% of the simulationtime (0 and 02 OCcupy, on average, the same z region,because of the bend of the backbone at the N-terminus). 03was hydrogen bonded to H7 and to H6 as well, for 6.8% and24.1% of the simulation time, respectively. This arrange-ment of the hydrogen bonds is typical of the 310-helix, withi- i + 3 intramolecular hydrogen bonds. This helicalconformation has been observed at the ends of a-helices,where one helix turn might have this conformation locally(Creighton, 1983).To judge the stability of the helix, the number of intramo-
lecular hydrogen bonds was calculated (see Fig. 6). In a22-residue-long ideal a-helix, the number of intramolecularhydrogen bonds is 18. The maximum number of hydrogenbonds observed in the present case is 16, because the two
lysine oxygens at the N-terminus do not participate in
8.0
*,¢
AI
V
0.0 1
1 3 5 7 9 11 13 15 17residue number
FIGURE 5 The average distances between an oxygen of ith residue andan amide hydrogen of i + 4th residue. Error bars were obtained from therms deviations.
peptide intramolecular hydrogen bonds, as was discussedabove. At -500 ps into the simulation, it can be seen that onaverage another two hydrogen bonds were lost (Fig. 6). Theloss of these hydrogen bonds was caused by a correlatedincrease in 015H19 and 016H20 distances that occurred at-500 ps. Closer investigation showed that the i -- i + 4hydrogen bond was replaced by an i -> i + 5 hydrogen bondin the case of 015. Hl9 thus became free to hydrogen bondto another oxygen, namely to 014, which hydrogen bondedto either Hl9 or to H18, or possibly to both of them at thesame time for very short periods of time during the second
"0la
0
,0.0
"0
to
:0U-
20
18
16
14
12
10
8
6
4
1I
II 111111 11 11111 1
I2 K
0 .0.0 200.0 400.0 600.0
time [ps]800.0 1000.0
FIGURE 6 The evolution of the number of intramolecular hydrogenbonds stabilizing the a-helix. A hydrogen bond was defined to exist if theoxygen-hydrogen distance was less than 2.5 A and if the nitrogen-hydro-gen-oxygen angle was larger than 135° (Kovacs et al., 1995).
I,
3046 Biophysical Journal

Molecular Dynamics of a Model Membrane
half of the simulation. This is directly correlated to theshortening of the projection of Cal8Cal9 vector on the helixaxis, thus bringing Hl9 closer to 014. The breakage of the015H19 bond and the formation of new hydrogen bondsbetween 015 and H20 and between 014 and Hl9 are shownin Fig. 7. The time evolution of the OiHi+4 distance illus-trates the duration of this hydrogen bond; its breakage andits subsequent reformation are reflected in changes inOiHi+4 distance. The breakage of the hydrogen bonds dis-cussed earlier is closely connected to the conformationalchange of the helix backbone between Leu16 and Leu17 (seeFig. 2) and to the helix deformation between Leu17 andLeu'9.When all of the results concerning the helix stability are
considered, it is concluded that, on the average, residues
6.0
5.0
4.0
3.0
2.0
1.0
0.00.4
6-15 retain their a-helical conformation, whereas both he-lix ends exhibit more flexibility. There appears to be along-lived disruption of the a-helix at residues 16 and 17midway through the simulation, resulting in the breakage oftwo hydrogen bonds and a deformation of the correspondinghelix turn.
Finally, the average distance between the carbonyl car-bon of Leu8 and the a carbon of Leul1, and the distancebetween the carbonyl carbon of Leull and the a carbon ofLeu12 were calculated and compared to experimental data(Langlais, 1994). The experimental distance r between la-beled atoms was determined from 13C NMR experimentsthrough the internuclear dipolar coupling D,, which is pro-portional to 1/(r.3.), as follows:
(5)r i3 )-1/3
,,I I'-
I
200.0 400.0 600.0 800.0 1000.0
where rij(t) is the distance between the labeled atoms i andj, and the brackets denote the time average over the exper-imental time scale. To be consistent with the experimentaldetermination of distances between the labeled atoms, Eq. 5was used to evaluate the distances instead of direct calcu-lations. The simulation results and the experimental valuesare in good agreement, as shown in Table 1.
Dynamics of the peptideLocal peptide motionsDynamics of NH bonds
Molecular dynamics simulations can provide informationcomplementary to NMR experiments, even though the timescales of the two methods differ by several orders of mag-nitude. The details of the N2H bond motion that are notobtainable from experiment (because the 2H NMR spectrumof the peptide reflects the averaged motion of the N2H bondangles over the time scale of the experiment) can be studiedin detail by molecular dynamics. In the simulation, amidehydrogen was used instead of deuterium; however, the
200.0 400.0 600.0 800.0 1000.0 behavior of the N2H bond motion is expected to be similarto that of the NH bond.The motion of NH bonds was determined in terms of
autocorrelation functions of P2[cos ONH(t, t + T)], whereONH(t, t + T) is the difference in NH bond angle with respectto the helix axis at times t and t + T. In Fig. 8 theautocorrelation functions of ONH(t, t + T) for three differentresidues are shown, providing a representative sample ofautocorrelation functions obtained for all amino acid resi-dues. The autocorrelation function of the first residue con-sists of two parts, a very fast initial decay followed by a
200.0 400.0 600.0time [ps]
800.0 1000.0
FIGURE 7 Illustration of (a) the breakup of 015HI9 hydrogen bond after-500 ps of the simulation. At the same time, a new hydrogen bond ispossibly formed between O5 and H20 (b) and between oj4 and HIg (c).
TABLE 1 The experimental and calculated distancesbetween the labeled atoms
Atoms Experimental values (A) Simulation results (A)
C8 Cal, 4.5 ± 0.3 4.6 ± 0.2C1l C.12 2.1 ± 0.2 2.5 ± 0.1
0_
-
0s
6.0
5.0
4.0
3.0
2.0
1.0
0.00.0
6.0
5.0
4.0
3.0
2.0
Belohorcovai et al. 3047
L
1.0
0.00.0
Volume 73 December 1997
A 0.6-
+
cn
00
V
(J 0.4 -
0.0 -
FIGURE 8
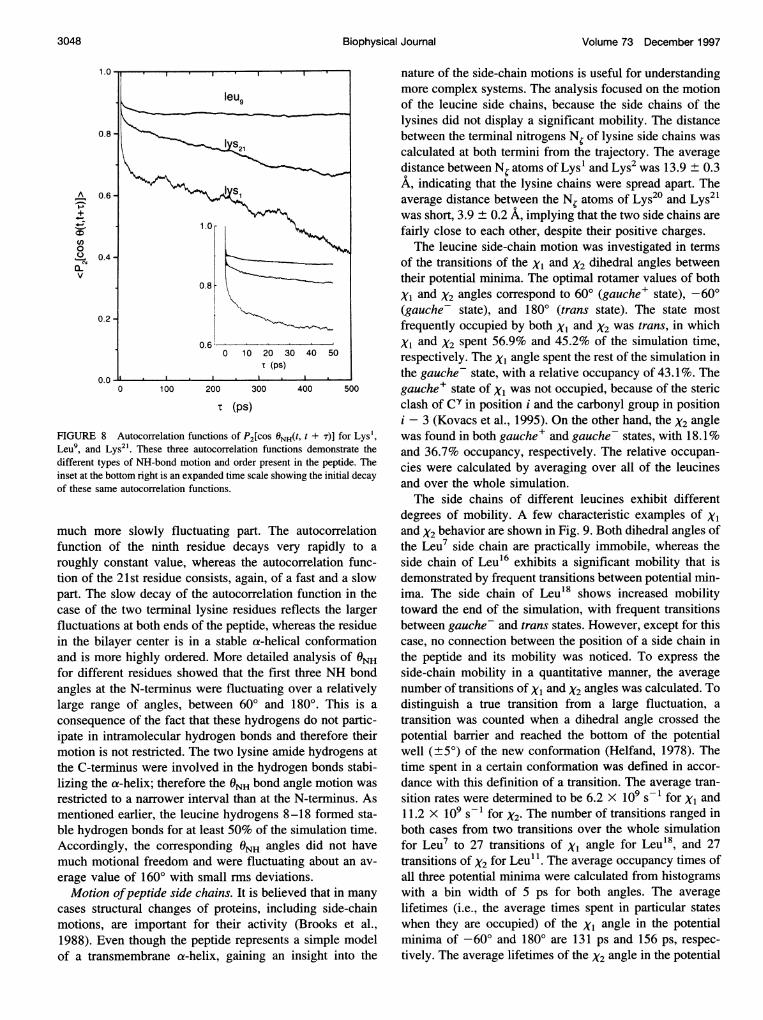
Leu9, and Lydifferent typeinset at the boof these same
much mor
function o
roughly cc
tion of thepart. The s
case of thefluctuationin the bila;and is morfor differeiangles at tilarge rang
consequen
ipate in lnmotion is r
the C-termlizing the c
restricted tmentionedble hydrogAccording]much motierage valu(
Motion (
cases strucmotions, a1988). Evcof a transi
I I I I, , nature of the side-chain motions is useful for understanding
leu more complex systems. The analysis focused on the motion9\s of the leucine side chains, because the side chains of the
lysines did not display a significant mobility. The distancebetween the terminal nitrogens Nr of lysine side chains was
calculated at both termini from the trajectory. The averagedistance between N atoms of Lys' and Lys2 was 13.9 ± 0.3A, indicating that the lysine chains were spread apart. Theaverage distance between the N, atoms of Lys20 and Lys21was short, 3.9 ± 0.2 A, implying that the two side chains are
.1.0 fairly close to each other, despite their positive charges.The leucine side-chain motion was investigated in terms
of the transitions of the XI and X2 dihedral angles between
] 0.8 \ ~ _ _ | their potential minima. The optimal rotamer values of bothXI and X2 angles correspond to 600 (gauche+ state), -600(gauche- state), and 1800 (trans state). The state mostfrequently occupied by both XI and X2 was trans, in which
0.6: - XI and X2 spent 56.9% and 45.2% of the simulation time,0 10 20T(pS) respectively. The XI angle spent the rest of the simulation in
,. the gauche- state, with a relative occupancy of 43. 1%. The0 100 200 300 400 500 gauche+ state of Xi was not occupied, because of the steric
T (ps) clash of Cy in position i and the carbonyl group in positioni- 3 (Kovacs et al., 1995). On the other hand, the X2 angle
Autocorrelation functions of P2[cos ONH(t, t + T)] for Lys', was found in both gauche+ and gauche- states, with 18.1%YS21. These three autocorrelation functions demonstrate the and 36.7% occupancy, respectively. The relative occupan-s of NH-bond motion and order present in the peptide. The cies were calculated by averaging over all of the leucinesittom right is an expanded time scale showing the initial decay and over the whole simulation.autocorrelation functions.
The side chains of different leucines exhibit differentdegrees of mobility. A few characteristic examples of XI
^e slowly fluctuating part. The autocorrelation and X2 behavior are shown in Fig. 9. Both dihedral angles ofof the ninth residue decays very rapidly to a the Leu7 side chain are practically immobile, whereas theinstant value, whereas the autocorrelation func- side chain of Leu16 exhibits a significant mobility that is21st residue consists, again, of a fast and a slow demonstrated by frequent transitions between potential min-;low decay of the autocorrelation function in the ima. The side chain of Leu'8 shows increased mobilitytwo terminal lysine residues reflects the larger toward the end of the simulation, with frequent transitions
vs at both ends of the peptide, whereas the residue between gauche- and trans states. However, except for thisyer center is in a stable a-helical conformation case, no connection between the position of a side chain ine highly ordered. More detailed analysis of 0NH the peptide and its mobility was noticed. To express thent residues showed that the first three NH bond side-chain mobility in a quantitative manner, the averagehe N-terminus were fluctuating over a relatively number of transitions of XI and X2 angles was calculated. Toe of angles, between 600 and 1800. This is a distinguish a true transition from a large fluctuation, ace of the fact that these hydrogens do not partic- transition was counted when a dihedral angle crossed thetramolecular hydrogen bonds and therefore their potential barrier and reached the bottom of the potentialiot restricted. The two lysine amide hydrogens at well (±50) of the new conformation (Helfand, 1978). Theinus were involved in the hydrogen bonds stabi- time spent in a certain conformation was defined in accor-
x-helix; therefore the ONH bond angle motion was dance with this definition of a transition. The average tran-;o a narrower interval than at the N-terminus. As sition rates were determined to be 6.2 X 10⁹ s for Xi andearlier, the leucine hydrogens 8-18 formed sta- 11.2 x 10⁹ s-1 for X2. The number of transitions ranged in,en bonds for at least 50% of the simulation time. both cases from two transitions over the whole simulationly, the corresponding ONH angles did not have for Leu7 to 27 transitions of XI angle for Leu'8, and 27ional freedom and were fluctuating about an av- transitions of X2 for Leul1. The average occupancy times ofe of 1600 with small rms deviations. all three potential minima were calculated from histogramsofpeptide side chains. It is believed that in many with a bin width of 5 ps for both angles. The averagentural changes of proteins, including side-chain lifetimes (i.e., the average times spent in particular statesire important for their activity (Brooks et al., when they are occupied) of the XI angle in the potential-n though the peptide represents a simple model minima of -60° and 1800 are 131 ps and 156 ps, respec-membrane a-helix, gaining an insight into the tively. The average lifetimes of the X2 angle in the potential
3048 Biophysical Journal

Molecular Dynamics of a Model Membrane
0.0.90.0 ,.
,180.0 Ss# W>ix,270.0
-90.0,180.0
-270.0-360.0
0.1
LEU 7
,0 200.0 400.0 600.0 800.0 1000.0
3200.0
3000.0
2800.0
2600.0
2400.00.0 200.0 400.0 600.0 800.0 1000.0
200.0 400.0 600.0 800.0 1000.0
90.0
-90.0
-180.0
-270.0
-360.00.0 200.0 400.0 600.0 800.0 1000.0
time [ps]
FIGURE 9 The motion of side chains of Leu7, Leu'6, and Leu18 isdepicted in terms of the evolution of their respective XI and X2 angles. Thedark line represents the XI angle and the light line represents the X2 angle.
minima of 600, -60°, and 1800 are 440 ps, 59.6 ps, and 70.5ps. The average occupancy times (i.e., the average timespent in a particular state) of the XI angle in the potentialminima of -60° and 180° are 155.5 ps and 204.7 ps,respectively. The average occupancy times of the X2 anglein the potential minima of 600, -60°, and 1800 are 64.2 ps,136.5 ps, and 165.9 ps. Thus the most probable state of bothXI and X2 dihedral angles appears to be the trans state.
Global peptide motions
The evolution of the principal moments of inertia I,, Iyyand I,, (see Fig. 10) illustrates changes of the peptide shapeduring the simulation. Because the helix axis is aligned with
500.0
450.0
400.0
350.0
300.00.0 200.0 400.0 600.0 800.0 1000.0
time [ps]
FIGURE 10 The evolution of the principal moments of inertia of thepeptide.
the z direction, I,. is the smallest principal moment ofinertia. I,, and Iyy were determined so that the principal axes
system would form a right-handed coordinate system. IXXand Iyy are almost equal throughout the whole simulation,indicating that the molecule remains nearly axially symmet-rical at all times. At -250 ps changes in all three momentsof inertia were observed, which were correlated with a
temporary breakage of the O12H16 hydrogen bond. Later inthe simulation, the helix underwent a slight deformation,beginning at -500 ps. IXX and Iyy decreased while I,increased, implying the shortening of the helix, whereas thecross-sectional area of the peptide became larger. However,the global helical shape remained unchanged, because I4was always the smallest principal moment of inertia, ac-
3000.0
2800.0
2
, 2600.0
20-.12400.0
2200.0 L0.0
Belohorcova et al. 3049
",IN0
r.4
I.-N0
C4
A

Volume 73 December 1997
cording to Fig. 10. Taking the helix length as the distancebetween the centers of mass of the first helix turn and thelast (i.e., sixth) helix turn, the evolution of this distanceshows sudden changes that are correlated with the changesof principal moments of inertia. Later it will be shown thatthese changes in the helix length were caused by the defor-mation of the helix. As pointed out earlier, the deformationof the helix is likely to occur between Leu'7 and Leu'9,because of a correlated change in the helix backbone dihe-dral angles at Leu16 and Leu17 at -500 ps.The global change in the helix conformation with respect
to an ideal a-helix was assessed in terms of the rms differ-ence between atom positions on the backbones of the twostructures (the rms difference was obtained after reorientingthe helix and overlapping it with the ideal a-helix). Theevolution of the rms difference is illustrated in Fig. 11. Itcan be observed that for the first 10 ps, the rms differencefluctuated about 1.1 A, then in the next 440 ps about 1.6 A.In the following 60 ps, the rms difference gradually in-creased up to 2.1 A, and it stayed there until the end of thesimulation. This change occurred simultaneously with theconformational change between Leu16 and Leu'7.
Tilting and bending motions. During the simulation thepeptide tilted with respect to the bilayer normal (Z axis). Toinvestigate this type of motion, the angle between the helixaxis and the bilayer normal was calculated (for its timedependence see Fig. 12). The angle fluctuates from 00 to-260, about an average value of 15.30, with an rms devia-tion of 4.9°. For comparison, 2H NMR relaxation studies oforiented multillamellar dispersions of DLPC and 2H ex-change-labeled gramicidin D (similar to the simulated sys-tem, in the sense that both peptides are small helical trans-membrane peptides with an amphiphilic character)indicated that the rms angle formed by the peptide helixaxes and the local bilayer normal was 160 ± 20 (Prosser andDavis, 1994). However, the simulation lasted for 1 ns,which is short compared to the slow time scale of the
3.0
2.5
2.0
1.5A
v 1.0
0.5
0.00.0 200.0 400.0 600.0 800.0 1000.0
time [psec]
FIGURE 11 The evolution of the rms difference, (rd2)"-2, between thehelix backbone and the ideal a-helix backbone.
30.0
20.0
10.0
0.00.0 200.0 400.0 600.0
time [psi800.0 1000.0
FIGURE 12 The evolution of the angle, It' defining the tilt of thea-helix with respect to the bilayer normal. The angle was calculated as theangle between the helix axis and the bilayer normal.
"tilting" motion of the peptide. A much longer simulationwould be required to quantitatively characterize this pro-cess. It is also worth noting that even though the thicknessof the hydrophobic region of the bilayer (defined to be 22 Athick; Lewis and Engelman, 1983) and the length of thehydrophobic core of the peptide (in an ideal a-helix corre-sponding to 24 A) gave a very good match, the peptide tiltedwith respect to the bilayer normal.
Fig. 13 illustrates the difference between the peptideconformation at the end of the simulation and an ideala-helix. It can be seen quite clearly that after more than 1 nsof equilibration and simulation, the helix is tilted with
C1-22
Ca-I
Ca-1
Ca-22
z
FIGURE 13 Comparison of the helix conformation at the end of thesimulation (on the left) with respect to an ideal a-helix (on the right). It canbe seen that at the end of the simulation, both helix termini were pointingtoward the bilayer interior, whereas the helix was tilted with respect to thebilayer normal (the bilayer normal is parallel to the axis of an ideal a-helixon the right). Furthermore, the slight bend in the helix can be seen. It isevident that the N-terminus (the top of the helix) is unwound and extended.
3050 Biophysical Journal
_
'4C)
4
Molecular Dynamics of a Model Membrane
respect to the bilayer normal (as was discussed in theprevious section). Moreover, a very slight bend in the helixcan be observed.The bend in the helix was more closely analyzed by
calculating the bend angle of the helix as the angle definedby the center of mass of the backbone atoms of the secondturn (residues 4-7), the center of mass of the backboneatoms of the third turn (residues 8-11), and the center ofmass of the backbone atoms of the fifth turn (residues15-18). The turns 2, 3, and 5 were chosen because both thefirst and the last turns of the helix displayed a large degreeof instability during the simulation. This would have biasedthe determination of the bend helix angle if they had beenused in the definition. The motion of the centers of mass ofthe turns over the trajectory was calculated in the xy plane,and the centers of mass of the first and of the last turnssampled the largest region of the xy plane. The averagevalue of the bend angle was determined to be 1720, with anrms deviation of 2.90. This indicates a small bend in thehelix with respect to a perfectly straight ideal a-helix.However, occasional excursions of the angle were observed,ranging up to 1550. To estimate contributions from therespective turns toward the total bend angle and to investi-gate the bend at both helix ends, the local bend angles werecalculated. They were defined by the centers of mass ofthree consecutive turns. The largest fluctuations were ob-served at both ends of the helix, as expected. The moststable turns appeared to be turns 2, 3, 4, 5. The bend angleat the C-terminus assumed two different average values; inthe first 500 ps of the simulation it fluctuated about 171.7°+±4.3°. In the rest of the simulation it fluctuated about 144.40± 5.20. The sudden change in the C-terminus conformationis exactly correlated with the breakage of 015H19 and016H20 hydrogen bonds, and with the decrease in the dis-tance between the centers of mass of the first and the lastturns in the second half of the simulation. Thus the de-scribed end effect at the C-terminus has caused the short-ening of the helix and consequently an increase in Iz, theprincipal moment of inertia.Even though the simulation is short (1 ns) compared to
most experimental time scales, there was a variety of dif-ferent peptide motions that can be divided into two groups.Local motions, occurring on a shorter time scale, such as theNH bond motion or the transitions of the peptide side chainsbetween the potential minima, were sufficiently covered bythe simulation. The whole-body molecular motions such asthe tilt or bend of the peptide and the deformation of thepeptide shape were probably not sampled sufficiently in thesimulation. Another type of motion observed visually dur-ing the simulation was the axial diffusion of the peptide.However, this was not examined quantitatively, because ofits long characteristic time.
Solvation of the peptide
Hydrophilic lysine side chains are located at both peptide
that the long and flexible chains are strongly interactingwith the water region. To probe this assumption, the relativewater solvation was analyzed by calculating the solventradial distribution function of water oxygens about thepeptide nonhydrogen atoms. The side-chain carbon atomsCE and N, of all four lysines showed a formation of the firsthydration shell, thus confirming the assumption that theywere well hydrated. The shape of the distribution functionsfor apolar CE atoms was significantly broader than that ofN,, as observed by Brooks and Karplus (1989) in theirmolecular dynamics study of the active site of lysozyme.Even though the C-terminal lysines are located deeper in thelipid bilayer, their radial distribution functions were verysimilar. The terminal backbone atoms were not solvated sig-nificantly by water molecules, reflecting the fact that they wereshielded from the aqueous phase by the side chains.As was mentioned earlier, Leu17 17 was hydrogen
bonded to Lys2' for 12% of the simulation time. Thereforeit was expected that its oxygen would be hydrogen bondedto water molecules throughout the rest of the simulation.The radial distribution function for oxygen of Leu17 indeedclearly shows a sharp peak at 2.7 A (see Fig. 14 a). Mini-mum distances between every peptide oxygen and any
water hydrogen, do Hn, were calculated every 5 ps to see
the evolution of the solvation of the peptide oxygens (adistance between a peptide oxygen and a water hydrogen ofless than 2.5 A indicates the possibility of a hydrogen bond).The evolution of the minimum distance between the oxygenof Leu17 and any water hydrogen, dol7-Hmin (see Fig. 14 b),shows periods of time when the oxygen is possibly hydro-gen bonded to water. As was discussed previously, theoxygen of Leu16 was free in the second half of the simula-tion (formation of the i -> i + 5 hydrogen bond was notseen, as in the case of the oxygen of Leu'5). From Fig. 14c it was seen that it was occasionally bound to a watermolecule. A closer inspection of water molecules aroundoxygens 16 and 17 showed that different water moleculeswere closer than 2.5 A at different times in the simulation.Oxygens 20, 21, and 22 did not participate in the peptideintramolecular hydrogen bonds and remained hydrogenbonded to water molecules for most of the simulation. Thefirst three oxygens at the N-terminus hydrogen bonded towater molecules for short periods of time. As discussedabove, for part of the simulation they were participating ini- i + 3 hydrogen bonds; however, for the rest of the
simulation they were free, i.e., they were not hydrogenbonded to water or to the peptide amide hydrogens, whichseems to be an energetically unfavorable situation.
In a similar fashion, the minimum distances betweenamide protons and any water oxygen were calculated. Thefirst three amide protons at the N-terminus were hydrogenbonded to water oxygens during the last 660 ps of thesimulation. Further analysis of the solvation of these amideprotons was directed toward the investigation of their pos-
sible association with the lipid headgroup phosphoryl oxy-
gens. The radial distribution functions of 013 (for the nam-termini, favorably close to the water interface. It is expected
3051Belohorcovai et al.
ing convention see Sundaralingam, 1972) of DMPC I I

Volume 73 December 1997
10.0
0.0
-CZ'0)
a)c
0#t1.0 2.0 3.0 4.0 5.0 6.0
a8.0 k
6.0 nP
4.0
2.0
r (A)0.0
5.0
4.0U)
I. .U,0.0
CD
1.0
nn
1.0 I00.00.0 200.0 400.0 600.0 800.0 1000.0
200.0 400.0 600.0time [ps]
800.0 1000.0
[
mg - - --- - - - -
o 2 4 6 8 10 12 14 16 18 20 22
F b ^~~~~~
0 2 4 6 8 10 12 14 16 18 20 22residue number
FIGURE 15 (a) The average number of near-neighbor atoms per side-chain atom within a distance of 4.5 A around each side chain. (b) Theaverage number of near-neighbor atoms per backbone atom within adistance of 4.5 A around each backbone residue. White columns representatoms in lipid phosphate groups, black columns represent hydrocarbonchains, and the grey columns represent water molecules.
FIGURE 14 (a) The radial distribution function of water oxygens aboutthe oxygen of Leu 7. (b) The minimum distance between the oxygen ofLeu'7 and any water hydrogen, dO17-Hmi, sampled every 5 ps. (c) Theminimum distance between the oxygen of Leu'6 and any water hydrogen,dOl6-Hmin, sampled every 5 ps.
about HN1, HN2, and HN3 indicated a possible occurrence
of hydrogen bonds between 013 and amide hydrogens. Thedistances between amide protons and a phosphoryl oxygen
013 of DMPC 11 were calculated, and these indicated thatduring the first 400 ps all three amide protons were hydro-gen bonded to this oxygen atom for at least part of the time(HN1 for 33.7% of the simulation, HN2 for 18.2% of thesimulation, and HN3 for 21.5% of the simulation). It wasshown earlier that the C-terminal amide protons participatedin intramolecular hydrogen bonds, and the minimum dis-tances between these amide protons and any water oxygens
were greater than 2.5 A for most of the simulation.An overall picture of the peptide solvation can be ob-
tained from Fig. 15, where the average number of water
molecules, lipid phosphate groups, and lipid chains within a
4.5-A distance of the peptide backbone atoms (Fig. 15 a)and of the peptide side-chain nonhydrogen atoms (Fig. 15 b)is displayed. It can be clearly seen that the backbone atomswere less solvated than the side chains, as noted previously.The backbone atoms at the N-terminus were less solvatedthan the backbone atoms at the C-terminus, with more
contact with the phosphate groups and to the lipid chains.Backbone atoms of Leu6 and Leu8-15 were in contact withhydrocarbon chains only. Some solvation of backbone at-oms of Leu3-5, Leu7, and Leu16-19 was observed. The sidechains at both termini exhibited a high degree of solvationby water molecules. The hydrophobic side chains ofleucines were mainly in contact with hydrocarbon chains.
CONCLUSION
An MD simulation of a system composed of a syntheticpeptide, acetyl-Lys2-Gly-Leul6-Lys2-Ala-amide, and a fully
0.8 -
0.6
Sw 0.4-bO
0.2
0.0 -0.0
5.0
" 4.01-
' 3.0t-2
"-' 2.0
8.0
6.0-4
6 4.0
° 2.0.4Fc
0.00.0
3052 Biophysical Journal
i!
-7
w ini 11 .l

Belohorcova et al. Molecular Dynamics of a Model Membrane 3053
hydrated DMPC bilayer was carried out for 1060 ps. Theinitial configuration of the system was constructed using aprotocol developed by Woolf and Roux (Woolf and Roux,1996; Roux and Woolf, 1996). The calculated properties arecharacteristic of the system at the temperature of 336 ± 9 K.The primary points of interest in this simulation were thepeptide's structural and dynamic properties. The analyzedstructural properties of the peptide included the averagebackbone dihedral angles, the C, torsion angles, the trans-lation per residue along the helix axis, and the formation andduration of peptide intramolecular hydrogen bonds. On av-erage, the peptide residues 6-15 and 18 stayed in thea-helical conformation, whereas both peptide ends exhib-ited more fluctuations. This finding agrees with experimen-tal work showing the predominant secondary structure ofpeptide-n to be a-helical (Davis et al., 1983), and showingpossible extensions of the peptide-n terminal residues(Zhang et al., 1992a). A long-lived disruption of the peptidestructure between Leul6-19 observed midway through thesimulation may have been initated by conformationalchange of the backbone dihedral angles 4 and &p of Leu16and Leu'7. Consequently, the region of the helix betweenresidues 17 and 19 was disrupted, and two regular intramo-lecular hydrogen bonds were lost.The dynamics of the peptide involved local peptide mo-
tions, such as the NH bond dynamics and the side-chaindynamics, and global peptide motions, characterized bytilting and bending of the helix. The NH bond dynamicswere analyzed in terms of the autocorrelation functions ofthe NH bond angles with respect to the helix axis. Theautocorrelation times of residues at both termini differedfrom those in the stable portion of the peptide, because of adifferent degree of peptide "order" in these regions. Thepeptide exhibited considerable fluctuations at both peptidetermini, whereas its hydrophobic core was stable. The mo-tion of the side chains was investigated in terms of thetransitions of XI and X2 dihedral angles between their po-tential minima. All four lysine side chains were not verymobile, spending most of the simulation in one state. Incontrast, the leucine side chains displayed a large variety ofdihedral motions, from no large changes to frequent transi-tions between two or three potential minima. The mostprobable state for both XI and X2 dihedral angles was thetrans state. The evolution of the shape of the peptide wasmonitored, and it was observed that the overall shape of thehelix remained virtually unchanged throughout the simula-tion. However, during the simulation the peptide becameshorter and its cross-sectional area increased slightly. Theevolution of the rms difference between the helix backboneand the ideal a-helix backbone confirmed that the backbonestructure underwent a change after -500 ps of the simula-tion. This is closely connected to changes in the backbonedihedral angles of Leu16 and Leu 7, which were correlatedwith the breakage of the hydrogen bonds and the deforma-tion of helix region between residues 17 and 19. The globalbend of the peptide was quantitatively defined as the angledetermined by the centers of mass of the three helix turns,
2, 3, and 5. For most of the simulation it was very close to1800, as expected for an ideal a-helix. When the unstablefirst and the last peptide turns were taken into account, wefound that the helix underwent a significant bend in thesecond half of the simulation at the C-terminus. This bendin the helix produced the shortening and the slight changesin overall shape monitored by the three principal momentsof inertia of the peptide. In addition to the bend in the helix,the peptide tilted with respect to the bilayer normal. Theaverage tilt angle of the helical axis, calculated from thesimulation, is similar to that deduced from NMR relaxationmeasurements on gramicidin D (Prosser and Davis, 1994)and to that of the simulation of an all-alanine a-helix inDMPC (Shen et al., 1997).
Analysis of the peptide solvation showed that lysine sidechains extended to maximize their contact with the waterphase, whereas the hydrophobic leucine side chains weremainly in contact with hydrocarbon lipid chains. The radialdistribution function of water oxygens about the oxygen ofLeu17 showed a first hydration shell. This indicated thatsome water molecules penetrated quite deeply into the hy-drophobic region of the lipid bilayer. However, no waterwas observed to cross through the hydrophobic region of thebilayer from one side to the other.
Molecular dynamics simulations, such as the current tra-jectory, still cover a relatively short time compared to ex-periment. Nonetheless, the simulation provides a chance toclosely examine the short time dynamics of the system.Even with this time limitation, valuable insights into themolecular behavior of complex systems may be obtained.The present investigation shows that the structure and dy-namics of the transmembrane helix change according to thevariations in the membrane environment. The a-helicalbackbone hydrogen bonds of the residues embedded in thehydrocarbon core are stable, whereas those near the mem-brane-bulk interface exhibit larger fluctuations. On the otherhand, the leucine side chains buried in the nonpolar envi-ronment are more mobile than the solvated lysine sidechains. Future work will explore the influence of the peptideon the structure and dynamics of the membrane.
The authors thank Prof. Bernie Nickel for many valuable discussions andthe Natural Sciences and Engineering Research Council of Canada forfinancial support.
REFERENCES
Alper, H. E., and T. R. Stouch. 1995. Orientation and diffusion of a druganalogue in biomembranes: molecular dynamics simulations. J. Phys.Chem. 99:5724-5731.
Bassolino-Klimas, D., H. E. Alper, and T. R. Stouch. 1993. Solute diffu-sion in lipid bilayer membranes: an atomic level study. Biochemistry.32:12624-12637.
Bassolino-Klimas, D., H. E. Alper, and T. R. Stouch. 1995. Mechanism ofsolute diffusion through lipid bilayer membranes by molecular dynamicssimulation. J. Am. Chem. Soc. 117:4118-4129.
Brooks, B. R., R. E. Bruccoleri, B. D. Olafson, D. J. States, S. Swami-nathan, and M. Karplus. 1983. CHARMM: a program for macromolec-
3054 Biophysical Journal Volume 73 December 1997
ular energy, minimization, and dynamics calculations. J. Comput. Chem.4:187-217.
Brooks, C. L., and M. Karplus. 1989. Solvent effects on protein motion andprotein effects on solvent motion. J. Mol. Biol 208:159-181.
Brooks, C. L., M. Karplus, and B. M. Pettitt. 1988. Proteins: A TheoreticalPerspective of Dynamics, Structure and Thermodynamics. I. Prigogineand S. A. Rice, editors. Advances in Chemical Physics, Vol. LXXI. JohnWiley and Sons, New York.
Cantor, C. R., and P. R. Schimmel. 1980. Biophysical Chemistry. Part I.The Conformations of Biological Macromolecules. W. H. Freeman andCo., San Francisco.
Creighton, T. E. 1983. Proteins: Structures and Molecular Principles. W. H.Freeman and Co., New York.
Damodaran, K. V., and K. M. Merz, Jr. 1995. Interaction of the fusioninhibiting peptide carbobenzoxy-D-Phe-L-Phe-Gly with N-methyldio-leoylphosphatidylethanolamine lipid bilayers. J. Am. Chem. Soc. 117:6561-6571.
Damodaran, K. V., K. M. Merz, Jr., and B. P. Gaber. 1995. Interaction ofsmall peptides with lipid bilayers. Biophys. J. 69:1299-1308.
Davis, J. H., D. M. Clare, R. S. Hodges, and M. Bloom. 1983. Interactionof a synthetic amphiphilic polypeptide and lipids in a bilayer structure.Biochemistry. 22:5298-5305.
Deisenhofer, J., and H. Michel. 1989. The photosynthetic reaction centerfrom the purple bacterium Rhodopseudomonas viridis. Science. 245:1463-1473.
De Loof, H., S. C. Harvey, J. P. Segrest, and R. W. Pastor. 1991. Meanfield stochastic boundary molecular dynamics simulation of a phospho-lipid in a membrane. Biochemistry. 30:2099-2113.
Dunbrack, R. L., and M. Karplus. 1993. Backbone-dependent rotamerlibrary for proteins. Application to side-chain prediction. J. Mol. Biol.230:543-574.
Edholm, O., 0. Berger, and F. Jiihnig. 1995. Structure and fluctuations ofbacteriorhodopsin in the purple membrane: a molecular dynamics study.J. Mol. Biol. 250:94-111.
Edholm, O., and J. Johansson. 1987. Lipid bilayer polypeptide interactionsstudied by molecular dynamics simulation. Eur. Biophys. J. 14:203-209.
Ermler, U., G. Fritzsch, S. Buchanan, and H. Michel. 1992. In Research inPhotosynthesis. N. Murata, editor. Kluwer, Dordrecht, the Netherlands.341-347.
Gennis, R. B. 1989. Biomembranes: Molecular Structure and Function.Springer Verlag, New York.
Grigorieff, N., T. A. Ceska, K. H. Downing, J. M. Baldwin, and R.Henderson. 1996. Electron-crystallographic refinement of the structureof bacteriorhodopsin. J. Mol. Biol. 259:393-421.
Haile, J. M. 1992. Molecular Dynamics Simulations: Elementary Methods.John Wiley and Sons, New York.
Helfand, E. 1978. Brownian dynamics study of transitions in a polymerchain of bistable oscillators. J. Chem. Phys. 69:1010-1018.
Heller, H., M. Schaefer, and K. Schulten. 1993. Molecular dynamicssimulation of a bilayer of 200 lipids in the gel and in the liquid-crystalphases. J. Phys. Chem. 97:8343-8360.
Hirst, J. D., and C. L. Brooks, III. 1995. Molecular dynamics of isolatedhelices of myoglobin. Biochemistry. 34:7614-7621.
Huang, P., and G. H. Loew. 1995. Interaction of an amphiphilic peptidewith a phospholipid bilayer surface by molecular dynamics simulationstudy. J. Biomol. Struct. Dyn. 12:937-956.
Huschilt, J. C., B. Millman, and J. H. Davis. 1989. Orientation of a-helicalpeptides in a lipid bilayer. Biochim. Biophys. Acta. 979:139-141.
Jenkins, G. M., and D. G. Watts. 1968. Spectral Analysis and Its Appli-cations. Holden-Day, San Fransisco.
Jorgensen, W. L. 1981. Quantum and statistical mechanical studies ofliquids. 10. Transferable intermolecular potential functions for water,alcohols and ethers. Application to liquid water. J. Am. Chem. Soc.103:335-345.
Jorgensen, W. L., J. Chandrasekhar, J. D. Madura, R. W. Impey, and M. L.Klein. 1983. Comparison of simple potential functions for simulatingliquid water. J. Chem. Phys. 79:926-935.
Kovacs, H., A. E. Mark, J. Johansson, and W. F. van Gunsteren. 1995. Theeffect of environment on the stability of an integral membrane helix:
molecular dynamics simulations of surfactant protein C in chloroform,methanol and water. J. Mol. Bio. 247:808-822.
Kuhlbrandt, W., D. N. Wang, and Y. Fujiyoshi. 1994. Atomic model ofplant light-harvesting complex by electron crystallography. Nature. 367:614-621.
Langlais, D. B. 1994. Internuclear distance measurements using rotationalresonance. Ph.D. thesis. University of Guelph, Guelph, Ontario, Canada.
Lewis, B. A., and D. M. Engelman. 1983. Lipid bilayer thickness varieslinearly with acyl chain length in fluid phosphatidylcholine vesicles.J. Mol. Biol. 166:211-217.
Loncharich, R. J., B. R. Brooks, and R. W. Pastor. 1992. Langevindynamics of peptides: the frictional dependence of isomerization rates ofN-acetylalanyl-N-methylamide. Biopolymers. 32:523-535.
Mackerell, A. D., D. Bashford, M. Bellot, R. L. Dunbrack, M. J. Field, S.Fischer, J. Gao, H. Guo, D. Joseph, S. Ha, L. Kuchnir, K. Kuczera,F. T. K. Lau, C. Mattos, S. Michnick, D. T. Nguyen, T. Ngo, B.Prodhom, B. Roux, B. Schlenkrich, J. Smith, R. Stote, J. Straub, J.Wiorkiewicz-Kuczera, and M. Karplus. 1992. Self-consistent parametri-zation of biomolecules for molecular modelling and condensed phasesimulations. Biophys. J. 61:A 143.
Marrink, S. J., and H. J. C. Berendsen. 1994. Simulation of water transportthrough a lipid membrane. J. Phys. Chem. 98:4155-4168.
Mouritsen, 0. G., and M. Bloom. 1993. Models of lipid-protein interac-tions in membranes. Annu. Rev. Biophys. Biomol. Struct. 22:145-171.
Nagle, J. F. 1993. Area/lipid of bilayers from NMR. Biophys. J. 64:1476-1481.
Nezil, F. A., and M. Bloom. 1992. Combined influence of cholesterol andsynthetic amphiphilic peptides upon bilayer thickness in model mem-branes. Biophys. J. 61:1176-1183.
Pastor, R. W. 1994. Molecular dynamics and Monte Carlo simulations oflipid bilayer. Curr. Opin. Struct. Bio. 4:486-492.
Pastor, R. W., and S. E. Feller. 1996. Time scales of lipid dynamics andmolecular dynamics. In Biological Membranes: A Molecular Perspec-tive from Computation and Experiment. K. M. Merz, Jr., and B. Roux,editors. Birkhauser, Boston. 3-29.
Pastor, R. W., R. H. Venable, and M. Karplus. 1991. Model for thestructure of the lipid bilayers. Proc. Natl. Acad. Sci. USA. 88:892-896.
Pauling, L., and R. B. Corey. 1951. The structure of synthetic polypeptides.Proc. Natl. Acad. Sci. USA. 37:241-250.
Pauls, K. P., A. L. MacKay, 0. Soderman, M. Bloom, A. K. Tanjea, andR. S. Hodges. 1985. Dynamics properties of the backbone of an integralmembrane polypeptide measured by 2H-NMR. Eur. Biophys. J. 12: 1-11.
Picot, D., P. J. Loll, and R. M. Garavito. 1994. The X-ray structure of themembrane protein prostaglandin H2 synthase-1. J. Mol. Biol. 227:493-509.
Prosser, R. S., and J. H. Davis. 1994. Dynamics of an integral membraneprotein: a deuterium NMR relaxation study of gramicidin. Biophys. J.66:1429-1440.
Prosser, R. S., J. H. Davis, C. Mayer, K. Weisz, and G. Kothe. 1992.Deuterium NMR relaxation studies of peptide-lipid interactions. Bio-chemistry. 31:9355-9363.
Ramakrishnan, C., and K. V. Soman. 1982. Identification of secondarystructures in globular proteins-a new algorithm. Int. J. Pept. ProteinRes. 20:218-237.
Roux, B., and T. B. Woolf. 1996. Molecular dynamics of Pf 1 coat proteinin a phospholipid bilayer. In Biological Membranes: A Molecular Per-spective from Computation and Experiment. K. M. Merz, Jr., and B.Roux, editors. Birkhauser, Boston. 555-587.
Ryckaert, J.-P., G. Ciccotti, and H. J. C. Berendsen. 1977. Numericalintegration of the Cartesian equations of motion of a system withconstraints: molecular dynamics of n-alkanes. J. Comput. Phys. 23:327-341.
Shen, L., D. Bassolino, and T. Stouch. 1997. Structure and interaction of atransmembrane polyalanine alpha-helix with a DMPC bilayer studied bymulti-nanosecond molecular dynamics simulation. Biophys. J. 73:3-20.
Song, L., M. R. Hobaugh, C. Shustak, S. Cheley, H. Bayley, and J. E.Gouaux. 1996. Structure of staphylococcal a-hemolysin, a heptamerictransmembrane pore. Science. 274:1859-1866.

Belohorcova et al. Molecular Dynamics of a Model Membrane 3055
Stouch, T. R. 1993. Lipid membrane structure and dynamics studied byall-atom molecular dynamics simulations of hydrated phospholipid bi-layers. Mol. Sim. 10:335-362.
Stowell, M. H. B., and D. C. Rees. 1995. Structure and stability ofmembrane proteins. Adv. Protein Chem. 46:279-311.
Sundaralingam, M. 1972. Molecular structures and conformations of thephospholipids and sphingomyelins. Ann. N.Y. Acad. Sci. 195:324-355.
van Gunsteren, W. F., P. H. Hunenberger, A. E. Mark, P. E. Smith, andI. G. Tironi. 1995. Computer simulation of protein motion. Comput.Phys. Commun. 91:305-319.
van Gunsteren, W. F., and A. E. Mark. 1992. On the interpretation ofbiochemical data by molecular dynamics computer simulation. Eur.J. Biochem. 204:947-961.
Venable, R. M., Y. Zhang, B. J. Hardy, and R. W. Pastor. 1993. Moleculardynamics simulations of a lipid bilayer and of hexadecane: an investi-gation of membrane fluidity. Science. 262:223-226.
Verlet, L. 1967. Computer experiments on classical fluids. I. Thermody-namical properties of Lennard-Jones molecules. Phys. Rev. 159:98-103.
Weiss, M. S., and G. E. Schulz. 1992. Structure of porin refined at 1.8angstroms resolution. Nature. 367:243-249.
Woolf, T. B. 1996. Molecular dynamics simulations of individual bacte-riorhodopsin helices in explicit DMPC. Biophys. J. 70:A377.
Woolf, T. B., and B. Roux. 1994a. Molecular dynamics simulation of thegramicidin channel in a phospholipid bilayer. Proc. Natl. Acad. Sci.USA. 91:11631-11635.
Woolf, T. B., and B. Roux. 1994b. Conformational flexibility of o-phosphorylcholine and o-phosphorylethanolamine: a molecular dynam-ics study of solvation effects. J. Am. Chem. Soc. 116:5916-5926.
Woolf, T. B., and B. Roux. 1996. Structure, energetics and dynamics oflipid-protein interactions: a molecular dynamics study of the gramicidinA channel in a DMPC bilayer. Proteins. 24:92-114.
Zhang, Y. P., R. N. A. H. Lewis, R. S. Hodges, and R. N. McElhaney.1992a. FTIR spectroscopic studies of the conformation and amide hy-drogen exchange of a peptide model of the hydrophobic transmembranea-helices of membrane proteins. Biochemistry. 31:11572-11578.
Zhang, Y. P., R. N. A. H. Lewis, R. S. Hodges, and R. N. McElhaney.1992b. Interaction of a peptide model of a hydrophobic transmembranea-helical segment of a membrane protein with phosphatidylcholinebilayers: differential scanning calorimetric and FTIR spectroscopic stud-ies. Biochemistry. 31:11579-11588.
Copyright © 2022 FDOKUMEN