Structural Wood Design A Practice-Oriented Approach Using the ASD Method, 0470056789
407
-
Upload
independent -
Category
Documents
-
view
0 -
download
0
Transcript of Structural Wood Design A Practice-Oriented Approach Using the ASD Method, 0470056789


STRUCTURALWOOD DESIGN
Structural Wood Design: A Practice-Oriented Approach Using the ASD Method. Abi Aghayere and Jason VigilCopyright © 2007 John Wiley & Sons, Inc.

STRUCTURALWOOD DESIGN
A P R A C T I C E - O R I E N T E D A P P R O A C H
U S I N G T H E A S D M E T H O D
Abi AghayereJason Vigil
JOHN WILEY & SONS, INC.

This book is printed on acid-free paper. ��
Copyright � 2007 by John Wiley & Sons, Inc. All rights reserved
Published by John Wiley & Sons, Inc., Hoboken, New JerseyPublished simultaneously in Canada
Wiley Bicentennial Logo: Richard J. Pacifico
No part of this publication may be reproduced, stored in a retrieval system, ortransmitted in any form or by any means, electronic, mechanical, photocopying,recording, scanning, or otherwise, except as permitted under Section 107 or 108 of the1976 United States Copyright Act, without either the prior written permission of thePublisher, or authorization through payment of the appropriate per-copy fee to theCopyright Clearance Center, 222 Rosewood Drive, Danvers, MA 01923, (978) 750-8400, fax (978) 646-8600, or on the web at www.copyright.com. Requests to thePublisher for permission should be addressed to the Permissions Department, JohnWiley & Sons, Inc., 111 River Street, Hoboken, NJ 07030, (201) 748-6011, fax (201)748-6008, or online at www.wiley.com/go/permissions.
Limit of Liability /Disclaimer of Warranty: While the publisher and the author haveused their best efforts in preparing this book, they make no representations orwarranties with respect to the accuracy or completeness of the contents of this bookand specifically disclaim any implied warranties of merchantability or fitness for aparticular purpose. No warranty may be created or extended by sales representatives orwritten sales materials. The advice and strategies contained herein may not be suitablefor your situation. You should consult with a professional where appropriate. Neitherthe publisher nor the author shall be liable for any loss of profit or any othercommercial damages, including but not limited to special, incidental, consequential, orother damages.
For general information about our other products and services, please contact ourCustomer Care Department within the United States at (800) 762-2974, outside theUnited States at (317) 572-3993 or fax (317) 572-4002.
Wiley also publishes its books in a variety of electronic formats. Some content thatappears in print may not be available in electronic books. For more information aboutWiley products, visit our web site at www.wiley.com.
Library of Congress Cataloging-in-Publication Data:Aghayere, Abi O.
Structural wood design: a practice-oriented approach using the ASD method/by Abi Aghayere, Jason Vigil.
p. cm.ISBN: 978-0-470-05678-31. Wood. 2. Building, Wooden. I. Vigil, Jason, 1974– II. Title.
TA419.A44 2007624.1�84—dc22
2006033934
Printed in the United States of America
10 9 8 7 6 5 4 3 2 1

v
CONTENTS
Preface xi
chapter one INTRODUCTION: WOOD PROPERTIES, SPECIES, AND GRADES 11.1 Introduction 1
The Project-based Approach 11.2 Typical Structural Components of Wood Buildings 21.3 Typical Structural Systems in Wood Buildings 8
Roof Framing 8Floor Framing 9Wall Framing 9
1.4 Wood Structural Properties 11Tree Cross Section 11Advantages and Disadvantages of Wood as a Structural Material 11
1.5 Factors Affecting Wood Strength 12Species and Species Group 12Moisture Content 13Duration of Loading 14Size Classifications of Sawn Lumber 14Wood Defects 15Orientation of the Wood Grain 16Ambient Temperature 16
1.6 Lumber Grading 16Types of Grading 17Stress Grades 18Grade Stamps 18
1.7 Shrinkage of Wood 191.8 Density of Wood 191.9 Units of Measurement 191.10 Building Codes 20
NDS Code and NDS Supplement 22

vi � C O N T E N T S
References 23Problems 23
chapter two INTRODUCTION TO STRUCTURAL DESIGN LOADS 252.1 Design Loads 25
Load Combinations 252.2 Dead Loads 26
Combined Dead and Live Loads on Sloped Roofs 27Combined Dead and Live Loads on Stair Stringers 28
2.3 Tributary Widths and Areas 282.4 Live Loads 30
Roof Live Load 30Snow Load 32Floor Live Load 35
2.5 Deflection Criteria 392.6 Lateral Loads 42
Wind Load 43Seismic Load 45References 54Problems 54
chapter three ALLOWABLE STRESS DESIGN METHOD FOR SAWN LUMBER ANDGLUED LAMINATED TIMBER 57
3.1 Allowable Stress Design Method 57NDS Tabulated Design Stresses 58Stress Adjustment Factors 59Procedure for Calculating Allowable Stress 66Moduli of Elasticity for Sawn Lumber 66
3.2 Glued Laminated Timber 66End Joints in Glulam 67Grades of Glulam 67Wood Species Used in Glulam 68Stress Class System 68
3.3 Allowable Stress Calculation Examples 693.4 Load Combinations and the Governing Load Duration Factor 69
Normalized Load Method 69References 78Problems 78
chapter four DESIGN AND ANALYSIS OF BEAMS AND GIRDERS 804.1 Design of Joists, Beams, and Girders 80
Definition of Beam Span 80

C O N T E N T S � vii
Layout of Joists, Beams, and Girders 80Design Procedure 80
4.2 Analysis of Joists, Beams, and Girders 86Design Examples 100Continuous Beams and Girders 117Beams and Girders with Overhangs or Cantilevers 117
4.3 Sawn-Lumber Decking 1184.4 Miscellaneous Stresses in Wood Members 121
Shear Stress in Notched Beams 121Bearing Stress Parallel to the Grain 122Bearing Stress at an Angle to the Grain 122Sloped Rafter Connection 123
4.5 Preengineered Lumber Headers 1264.6 Flitch Beams 1284.7 Floor Vibrations 131
Floor Vibration Design Criteria 131Remedial Measures for Controlling Floor Vibrations in Wood Framed Floors 136References 142Problems 143
chapter five WOOD MEMBERS UNDER AXIAL AND BENDING LOADS 1455.1 Introduction 1455.2 Pure Axial Tension: Case 1 146
Design of Tension Members 1465.3 Axial Tension plus Bending: Case 2 151
Euler Critical Buckling Stress 1535.4 Pure Axial Compression: Case 3 153
Built-up Columns 159P–Delta Effects in Members Under Combined Axial Compression and Bending
Loads 1625.5 Axial Compression plus Bending: Case 4 162
Eccentrically Loaded Columns 1785.6 Practical Considerations for Roof Truss Design 178
Types of Roof Trusses 179Bracing and Bridging of Roof Trusses 179References 180Problems 181
chapter six ROOF AND FLOOR SHEATHING UNDER VERTICAL AND LATERAL LOADS(HORIZONTAL DIAPHRAGMS) 183
6.1 Introduction 183Plywood Grain Orientation 183Plywood Species and Grades 183

viii � C O N T E N T S
Span Rating 1856.2 Roof Sheathing: Analysis and Design 1866.3 Floor Sheathing: Analysis and Design 186
Extended Use of the IBC Tables for Gravity Loads on Sheathing 1886.4 Panel Attachment 1896.5 Horizontal Diaphragms 190
Horizontal Diaphragm Strength 192Openings in Horizontal Diaphragms 197Chords and Drag Struts 200Nonrectangular Diaphragms 213References 214Problems 214
chapter seven VERTICAL DIAPHRAGMS UNDER LATERAL LOADS (SHEAR WALLS)216
7.1 Introduction 216Wall Sheathing Types 216Plywood as a Shear Wall 217
7.2 Shear Wall Analysis 219Shear Wall Aspect Ratios 219Shear Wall Overturning Analysis 220Shear Wall Chord Forces: Tension Case 224Shear Wall Chord Forces: Compression Case 226
7.3 Shear Wall Design Procedure 2277.4 Combined Shear and Uplift in Wall Sheathing 242
References 245Problems 245
chapter eight CONNECTIONS 2488.1 Introduction 2488.2 Design Strength 2498.3 Adjustment Factors for Connectors 2498.4 Base Design Values: Laterally Loaded Connectors 2578.5 Base Design Values: Connectors Loaded in Withdrawal 2688.6 Combined Lateral and Withdrawal Loads 2708.7 Preengineered Connectors 2738.8 Practical Considerations 273
References 276Problems 276
chapter nine BUILDING DESIGN CASE STUDY 2789.1 Introduction 278

C O N T E N T S � ix
9.2 Gravity Loads 2799.3 Seismic Lateral Loads 2839.4 Wind Loads 2849.5 Components and Cladding Wind Pressures 2879.6 Roof Framing Design 291
Analysis of a Roof Truss 292Design of Truss Web Tension Members 293Design of Truss Web Compression Members 293Design of Truss Bottom Chord Members 295Design of Truss Top Chord Members 297Net Uplift Load on a Roof Truss 299
9.7 Second Floor Framing Design 299Design of a Typical Floor Joist 300Design of a Glulam Floor Girder 301Design of Header Beams 307
9.8 Design of a Typical Ground Floor Column 3119.9 Design of a Typical Exterior Wall Stud 3129.10 Design of Roof and Floor Sheathing 317
Gravity Loads 317Lateral Loads 317
9.11 Design of Wall Sheathing for Lateral Loads 3199.12 Overturning Analysis of Shear Walls: Shear Wall Chord Forces 322
Maximum Force in Tension Chord 325Maximum Force in Compression Chord 327
9.13 Forces in Horizontal Diaphragm Chords, Drag Struts, and Lap Splices 331Design of Chords, Struts, and Splices 331Hold-Down Anchors 337Sill Anchors 338
9.14 Design of Shear Wall Chords 3399.15 Construction Documents 344
References 345
appendix A Weights of Building Materials 347
appendix B Design Aids 350
Index 391

xi
PREFACE
The primary audience for this book are students of civil and architectural engineering, civil andconstruction engineering technology, and architecture in a typical undergraduate course in woodor timber design. The book can be used for a one-semester course in structural wood or timberdesign and should prepare students to apply the fundamentals of structural wood design to typicalprojects that might occur in practice. The practice-oriented and easy-to-follow but thoroughapproach to design that is adopted, and the many practical examples applicable to typical everydayprojects that are presented, should also make the book a good resource for practicing engineers,architects, and builders and those preparing for professional licensure exams.
The book conforms to the 2005 National Design Specification for Wood Construction, and isintended to provide the essentials of structural design in wood from a practical perspective andto bridge the gap between the design of individual wood structural members and the completedesign of a wood structure, thus providing a holistic approach to structural wood design. Otherunique features of this book include a discussion and description of common wood structuralelements and systems that introduce the reader to wood building structures, a complete woodbuilding design case study, the design of wood floors for vibrations, the general analysis of shearwalls for overturning, including all applicable loads, the many three- and two-dimensional draw-ings and illustrations to assist readers’ understanding of the concepts, and the easy-to-use designaids for the quick design of common structural members, such as floor joists, columns, and wallstuds.
Chapter 1 The reader is introduced to wood design through a discussion and description ofthe various wood structural elements and systems that occur in wood structures as well as theproperties of wood that affect its structural strength.
Chapter 2 The various structural loads—dead, live, snow, wind, and seismic—are discussedand several examples are presented. This succinct treatment of structural loads gives the readeradequate information to calculate the loads acting on typical wood building structures.
Chapter 3 Calculation of the allowable stresses for both sawn lumber and glulam in accordancewith the 2005 National Design Specification as well as a discussion of the various stress adjustmentfactors are presented in this chapter. Glued laminated timber (glulam), the various grades ofglulam, and determination of the controlling load combination in a wood building using thenormalized load method are also discussed.
Chapter 4 The design and analysis of joists, beams, and girders are discussed and several ex-amples are presented. The design of wood floors for vibrations, miscellaneous stresses in woodmembers, the selection of preengineered wood flexural members, and the design of sawn-lumberdecking are also discussed.

xii � P R E F A C E
Chapter 5 The design of wood members subjected to axial and bending loads, such as trussweb and chord members, solid and built-up columns, and wall studs, is discussed.
Chapter 6 The design of roof and floor sheathing for gravity loads and the design of roof andfloor diaphragms for lateral loads are discussed. Calculation of the forces in diaphragm chordsand drag struts is also discussed, as well as the design of these axially loaded elements.
Chapter 7 The design of exterior wall sheathing for wind load perpendicular to the face of awall and the design of wood shear walls or vertical diaphragms parallel to the lateral loads arediscussed. A general analysis of shear walls for overturning that takes into account all applicablelateral and gravity loads is presented. The topic of combined shear and uplift in wall sheathingis also discussed, and an example presented.
Chapter 8 The design of connections is covered in this chapter in a simplified manner. Designexamples are presented to show how the connection capacity tables in the NDS code are used.Several practical connections and practical connection considerations are discussed.
Chapter 9 A complete building design case study is presented to help readers tie together thepieces of wood structural element design presented in earlier chapters to create a total buildingsystem design, and a realistic set of structural plans and details are also presented. This holisticand practice-oriented approach to structural wood design is the hallmark of the book. The designaids presented in Appendix B for the quick design of floor joists, columns, and wall studssubjected to axial and lateral loads are utilized in this chapter.
In conclusion, we would like to offer the following personal dedications and thanksgiving:
To my wife, Josie, the love of my life and the apple of my eye, and to my precious children, Osa, Itohan,Odosa, and Eghosa, for their support and encouragement. To my mother for instilling in me the disciplineof hard work and excellence, and to my Lord and Savior, Jesus Christ, for His grace, wisdom, and strength.
Abi AghayereRochester, New York
For Adele and Ivy; and for Michele, who first showed me that ‘‘I can do all things through Christ whichstrengtheneth me’’ (Phil. 4:13)
Jason VigilRochester, New York

1
c h a p t e r o n e
INTRODUCTION: WOOD
PROPERTIES , SPECIES , AND GRADES
1.1 INTRODUCTION
The purpose of this book is to present the design process for wood structures in a quick andsimple way, yet thoroughly enough to cover the analysis and design of the major structuralelements. In general, building plans and details are defined by an architect and are usually givento a structural engineer for design of structural elements and to present the design in the formof structural drawings. In this book we take a project-based approach covering the design processthat a structural engineer would go through for a typical wood-framed structure.
The intended audience for this book is students taking a course in timber or structural wooddesign and structural engineers and similarly qualified designers of wood or timber structureslooking for a simple and practical guide for design. The reader should have a working knowledgeof statics, strength of materials, structural analysis (including truss analysis), and load calculationsin accordance with building codes (dead, live, snow, wind, and seismic loads). Design loads arereviewed in Chapter 2. The reader must also have available:
1. National Design Specification for Wood Construction, 2005 edition, ANSI/AF&PA (hereafterreferred to as the NDS code) [1]
2. National Design Specification Supplement: Design Values for Wood Construction, 2005 edition,ANSI/AF&PA (hereafter referred to as NDS-S) [2]
3. International Building Code, 2006 edition, International Code Council (ICC) (hereafter re-ferred to as the IBC) [3]
4. Minimum Design Loads for Buildings and Other Structures, 2005 edition, American Society ofCivil Engineers (ASCE) (hereafter referred to as ASCE 7) [4]
The Project-based Approach
Wood is nature’s most abundant renewable building material and a widely used structural materialin the United States, where more than 80% of all buildings are of wood construction. Thenumber of building configurations and design examples that could be presented is unlimited.Some applications of wood in construction include residential buildings, strip malls, offices,hotels, schools and colleges, healthcare and recreation facilities, senior living and retirementhomes, and religious buildings. The most common wood structures are residential and multi-family dwellings as well as hotels. Residential structures are usually one to three stories in height,while multifamily and hotel structures can be up to four stories in height. Commercial, industrial,and other structures that have higher occupancy loads and factors of safety are not typicallyconstructed with wood, although wood may be used as a secondary structure, such as a storagemezzanine. The structures that support amusement park rides are mostly built out of woodbecause of the relatively low maintenance cost of exposed wood structures and its unique abilityto resist the repeated cycles of dynamic loading (fatigue) imposed on the structure by the amuse-
Structural Wood Design: A Practice-Oriented Approach Using the ASD Method. Abi Aghayere and Jason VigilCopyright © 2007 John Wiley & Sons, Inc.

2 � S T R U C T U R A L W O O D D E S I G N
FIGURE 1.1 Perspective overview of a building section.
ment park rides. The approach taken here is a simplified version of the design process requiredfor each major structural element in a timber structure. In Figures 1.1 and 1.2 we identify thetypical structural elements in a wood building. The elements are described in greater detail inthe next section.
1.2 TYPICAL STRUCTURAL COMPONENTS OF WOOD BUILDINGS
The majority of wood buildings in the United States are typically platform construction, in whichthe vertical wall studs are built one story at a time and the floor below provides the platform tobuild the next level of wall that will in turn support the floor above. The walls usually spanvertically between the sole or sill plates at a floor level and the top plates at the floor or rooflevel above. This is in contrast to the infrequently used balloon-type construction, where the vertical

I N T R O D U C T I O N : W O O D P R O P E R T I E S , S P E C I E S , A N D G R A D E S � 3
FIGURE 1.2 Overviewof major structuralelements.
studs are continuous for the entire height of the building and the floor framing is supported onbrackets off the face of the wall studs. The typical structural elements in a wood-framed buildingsystem are described below.
Rafters (Figure 1.3) These are usually sloped sawn-dimension lumber roof beams spaced atfairly close intervals (e.g., 12, 16, or 24 in.) and carry lighter loads than those carried by the rooftrusses, beams, or girders. They are usually supported by roof trusses, ridge beams, hip beams,or walls. The span of rafters is limited in practice to a maximum of 14 to 18 ft. Rafters ofvarying spans that are supported by hip beams are called jack rafters (see Figure 1.6). Sloped roofrafters with a nonstructural ridge, such as a 1� ridge board, require ceiling tie joists or collarties to resist the horizontal outward thrust at the exterior walls that is due to gravity loads onthe sloped rafters. A rafter-framed roof with ceiling tie joists acts like a three-member truss.
Joists (Figure 1.4) These are sawn-lumber floor beams spaced at fairly close intervals of 12,16, or 24 in. that support the roof or floor deck. They support lighter loads than do floor beamsor girders. Joists are typically supported by floor beams, walls, or girders. The spans are usuallylimited in practice to about 14 to 18 ft. Spans greater than 20 ft usually require the use ofpreengineered products, such as I-joists or open-web joists, which can vary from 12 to 24 in.in depth. Floor joists can be supported on top of the beams, either in-line or lapped with otherjoists framing into the beam, or the joist can be supported off the side of the beams using joisthangers. In the former case, the top of the joist does not line up with the top of the beam as itdoes in the latter case. Lapped joists are used more commonly than in-line joists because of theease of framing and the fact that lapped joists are not affected by the width (i.e., the smallerdimension) of the supporting beam.

4 � S T R U C T U R A L W O O D D E S I G N
FIGURE 1.3 Rafterframing options.
FIGURE 1.4 Floorframing elements.
Double or Triple Joists These are two or more sawn-lumber joists that are nailed togetherto act as one composite beam. They are used to support heavy concentrated loads or the loadfrom a partition wall or a load-bearing wall running parallel to the span of the floor joists, inaddition to the tributary floor loads. They are also used to frame around stair openings (seeheader and trimmer joists).
Header and Trimmer Joists These are multiple-dimension lumber joists that are nailed to-gether (e.g., double joists) and used to frame around stair openings. The trimmer joists are parallelto the long side of the floor opening and support the floor joists and the wall at the edge of thestair. The header joists support the stair stringer and floor loads and are parallel to the short sideof the floor opening.
Beams and Girders (Figure 1.5) These are horizontal elements that support heavier gravityloads than rafters and joists and are used to span longer distances. Wood beams can also be builtfrom several joists nailed together. These members are usually made from beam and stringer

I N T R O D U C T I O N : W O O D P R O P E R T I E S , S P E C I E S , A N D G R A D E S � 5
FIGURE 1.5 Types ofbeams and girders.
FIGURE 1.6 Hip andValley rafters.
(B&S) sawn lumber, glued laminated timber (glulam) or parallel strand lumber (PSL), or lami-nated veneer lumber (LVL).
Ridge Beams These are roof beams at the ridge of a roof that support the sloped roof rafters.They are usually supported at their ends on columns or posts (see Figure 1.3)
Hip and Valley Rafters These are sloped diagonal roof beams that support sloped jack raftersin roofs with hips or valleys, and support a triangular roof load due to the varying spans of thejack rafters (see Figure 1.6). The hip rafters are simply supported at the exterior wall and on thesloped main rafter at the end of the ridge. The jack or varying span rafters are supported on thehip rafters and the exterior wall. The top of a hip rafter is usually shaped in the form of aninverted V, while the top of a valley rafter is usually V-shaped. Hip and valley rafters are designedlike ridge beams.
Columns or Posts These are vertical members that resist axial compression loads and mayoccasionally resist additional bending loads due to lateral wind loads or the eccentricity of thegravity loads on the column. Columns or posts are usually made from post and timber (P&T)sawn lumber or glulam. Sometimes, columns or posts are built up using dimension-sawn lumber.Wood posts may also be used as the chords of shear walls, where they are subjected to axial

6 � S T R U C T U R A L W O O D D E S I G N
tension or compression forces from the overturning effect of the lateral and seismic loads on thebuilding.
Roof Trusses (Figure 1.7) These are made up typically of dimension-sawn lumber top andbottom chords and web members that are subject to axial tension or compression plus bending
FIGURE 1.7 Truss profiles.
loads. Trusses are usually spaced at not more than 48 in. oncenters and are used to span long distances up to 120 ft. Thetrusses usually span from outside wall to outside wall. Severaltruss configurations are possible, including the Pratt truss, theWarren truss, the scissor truss, the Fink truss, and the bow-string truss. In building design practice, prefabricated trussesare usually specified, for economic reasons, and these are man-ufactured and designed by truss manufacturers rather than bythe building designer. Prefabricated trusses can also be usedfor floor framing. These are typically used for spans wheresawn lumber is not adequate. The recommended span-to-depth ratios for wood trusses are 8 to 10 for flat or parallelchord trusses, 6 or less for pitched or triangular roof trusses,and 6 to 8 for bowstring trusses [16].
Wall Studs (Figure 1.8) These are axially loaded in com-pression and made of dimension lumber spaced at fairly closeintervals (typically, 12, 16, or 24 in.). They are usually sub-jected to concentric axial compression loads, but exterior studwalls may also be subjected to a combined concentric axialcompression load plus bending load due to wind load actingperpendicular to the wall. Wall studs may be subjected toeccentric axial load: for example, in a mezzanine floor withsingle-story stud and floor joists supported off the narrow faceof the stud by joist hangers. Interior wall studs should, inaddition to the axial load, be designed for the minimum 5 psfof interior wind pressure specified in the IBC.
Wall studs are usually tied together with plywood sheath-ing that is nailed to the narrow face of studs. Thus, wall studsare laterally braced by the wall sheathing for buckling abouttheir weak axis (i.e., buckling in the plane of the wall). Studwalls also act together with plywood sheathing as part of thevertical diaphragm or shear wall to resist lateral loads actingparallel to the plane of the wall. Jack studs (also called jamb ortrimmer studs) are the studs that support the ends of windowor door headers; king studs are full-height studs adjacent to thejack studs and cripple studs are the stubs or less-than-full-heightstud members above or below a window or door opening andare usually supported by header beams. The wall frame con-sisting of the studs, wall sheathing, top and bottom plates areusually built together as a unit on a flat horizontal surface andthen lifted into position in the building.
Header Beams (Figure 1.7) These are the beams thatframe over door and window openings, supporting the dead load of the wall framing above thedoor or window opening as well as the dead and live loads from the roof or floor framing above.They are usually supported with beam hangers off the end chords of the shear walls or on topof jack studs adjacent to the shear wall end chords. In addition to supporting gravity loads, theseheader beams may also act as the chords and drag struts of the horizontal diaphragms in resistinglateral wind or seismic loads. Header beams can be made from sawn lumber, parallel strandlumber, linear veneer lumber, or glued laminated timber, or from built-up dimension
I N T R O D U C T I O N : W O O D P R O P E R T I E S , S P E C I E S , A N D G R A D E S � 7
FIGURE 1.8 Wallframing elements.
FIGURE 1.9 Cantilever framing.
lumber members nailed together. For example, a 2 � 10double header beam implies a beam with two 2 � 10’snailed together.
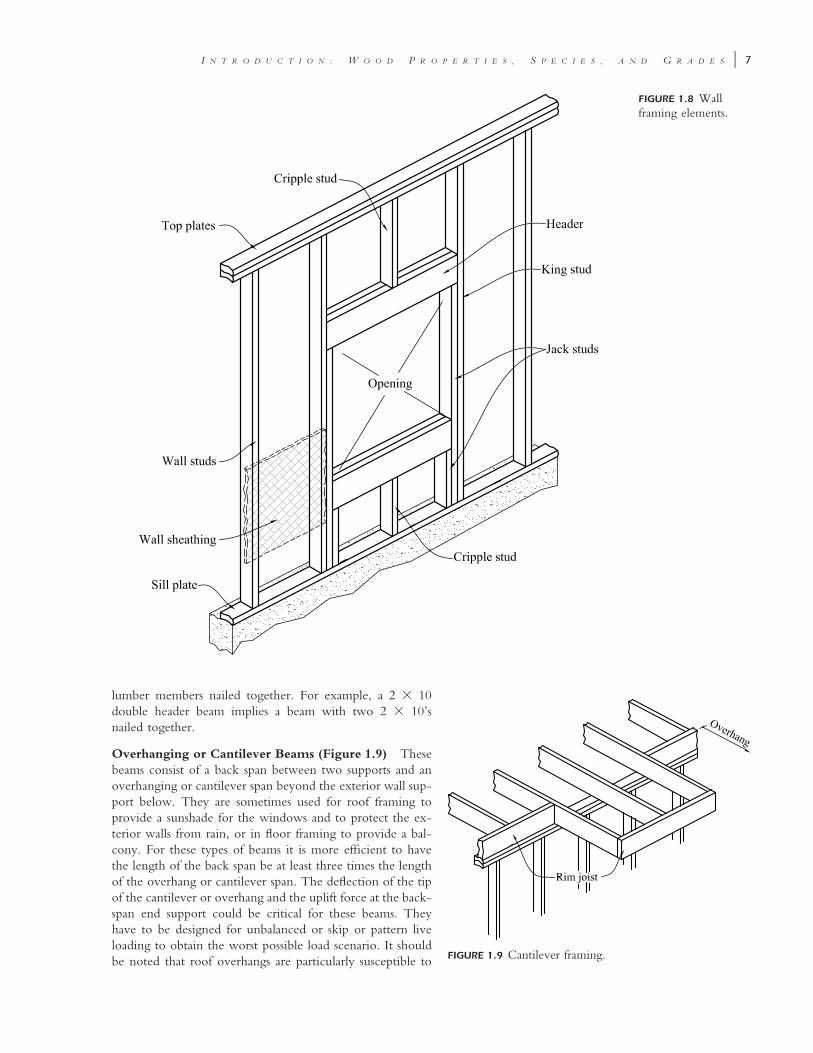
Overhanging or Cantilever Beams (Figure 1.9) Thesebeams consist of a back span between two supports and anoverhanging or cantilever span beyond the exterior wall sup-port below. They are sometimes used for roof framing toprovide a sunshade for the windows and to protect the ex-terior walls from rain, or in floor framing to provide a bal-cony. For these types of beams it is more efficient to havethe length of the back span be at least three times the lengthof the overhang or cantilever span. The deflection of the tipof the cantilever or overhang and the uplift force at the back-span end support could be critical for these beams. Theyhave to be designed for unbalanced or skip or pattern liveloading to obtain the worst possible load scenario. It shouldbe noted that roof overhangs are particularly susceptible to
8 � S T R U C T U R A L W O O D D E S I G N
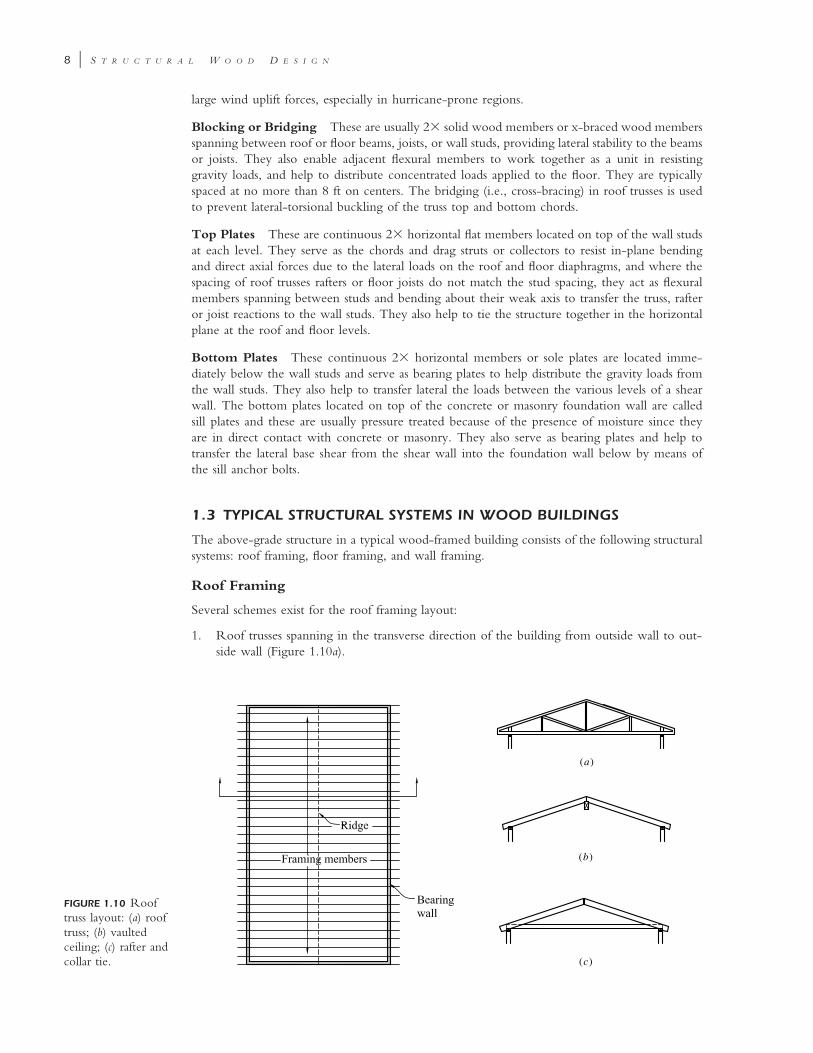
FIGURE 1.10 Rooftruss layout: (a) rooftruss; (b) vaultedceiling; (c) rafter andcollar tie.
(a)
(c)
(b)
large wind uplift forces, especially in hurricane-prone regions.
Blocking or Bridging These are usually 2� solid wood members or x-braced wood membersspanning between roof or floor beams, joists, or wall studs, providing lateral stability to the beamsor joists. They also enable adjacent flexural members to work together as a unit in resistinggravity loads, and help to distribute concentrated loads applied to the floor. They are typicallyspaced at no more than 8 ft on centers. The bridging (i.e., cross-bracing) in roof trusses is usedto prevent lateral-torsional buckling of the truss top and bottom chords.
Top Plates These are continuous 2� horizontal flat members located on top of the wall studsat each level. They serve as the chords and drag struts or collectors to resist in-plane bendingand direct axial forces due to the lateral loads on the roof and floor diaphragms, and where thespacing of roof trusses rafters or floor joists do not match the stud spacing, they act as flexuralmembers spanning between studs and bending about their weak axis to transfer the truss, rafteror joist reactions to the wall studs. They also help to tie the structure together in the horizontalplane at the roof and floor levels.
Bottom Plates These continuous 2� horizontal members or sole plates are located imme-diately below the wall studs and serve as bearing plates to help distribute the gravity loads fromthe wall studs. They also help to transfer lateral the loads between the various levels of a shearwall. The bottom plates located on top of the concrete or masonry foundation wall are calledsill plates and these are usually pressure treated because of the presence of moisture since theyare in direct contact with concrete or masonry. They also serve as bearing plates and help totransfer the lateral base shear from the shear wall into the foundation wall below by means ofthe sill anchor bolts.
1.3 TYPICAL STRUCTURAL SYSTEMS IN WOOD BUILDINGS
The above-grade structure in a typical wood-framed building consists of the following structuralsystems: roof framing, floor framing, and wall framing.
Roof Framing
Several schemes exist for the roof framing layout:
1. Roof trusses spanning in the transverse direction of the building from outside wall to out-side wall (Figure 1.10a).

I N T R O D U C T I O N : W O O D P R O P E R T I E S , S P E C I E S , A N D G R A D E S � 9
(a)
(b)
FIGURE 1.12 Typicalfloor framing layout:(a) framing overgirder; (b) face-mounted joists.
2. Sloped rafters supported by ridge beams and hip or valley beams or exterior walls, used toform cathedral or vaulted ceilings (Figure 1.10b).
FIGURE 1.11 Typical roof framing layout.
3. Sloped rafters with a 1� ridge board at the roof ridge line,supported on the exterior walls by the outward thrust re-sisted by collar or ceiling ties (Figure 1.10c). The intersectingrafters at the roof ridge level support each other by provid-ing a self-equilibrating horizontal reaction at that level. Thishorizontal reaction results in an outward thrust at the oppo-site end of the rafter at the exterior walls, which has to beresisted by the collar or ceiling ties.
4. Wood framing, which involves using purlins, joists, beams,girders, and interior columns to support the roof loads suchas in panelized flat roof systems as shown in Figure 1.11.Purlins are small sawn lumber members such as 2 � 4s and2 � 6s that span between joists, rafter, or roof trusses in pa-nelized roof systems with spans typically in the 8 to 10 ftrange, and a spacing of 24 inches.
Floor Framing
The options for floor framing basically involve using wood framingmembers, such as floor joists, beams, girders, interior columns, andinterior and exterior stud walls, to support the floor loads. The floorjoists are either supported on top of the beams or supported off theside faces of the beams with joist hangers. The floor framing supports the floor sheathing, usuallyplywood or oriented strand board (OSB), which in turn provides lateral support to the floorframing members and acts as the floor surface, distributing the floor dead and live loads. Inaddition, the floor sheathing acts as the horizontal diaphragm that transfers the lateral wind andseismic loads to the vertical diaphragms or shear walls. Examples of floor framing layouts areshown in Figure 1.12.
Wall Framing
Wall framing in wood-framed buildings consists of repetitive vertical 2 � 4 or 2 � 6 wall studsspaced at 16 or 24 in. on centers, with plywood or OSB attached to the outside face of the

10 � S T R U C T U R A L W O O D D E S I G N
FIGURE 1.13 Diagonal let-in bracing. FIGURE 1.14 Typical wall section.
FIGURE 1.15
Overturning, sliding,and racking in woodbuildings.
wall. It also consists of a top plate at the top of the wall, a sole or sill plate at the bottom of thewall, and header beams supporting loads over door and window openings. These walls supportgravity loads from the roof and floor framing and resist lateral wind loads perpendicular to theface of the wall as well as acting as a shear wall to resist lateral wind or seismic loads in the planeof the wall. It may be necessary to attach sheathing to both the interior and exterior faces of thewall studs to achieve greater shear capacity in the shearwall. Occasionally, diagonal let-in bracingis used to resist lateral loads in lieu of structural sheathing, but this is not common (see Figure1.13). A typical wall section is shown in Figure 1.14 (see also Figure 1.8)
Shear Walls in Wood BuildingsThe lateral wind and seismic forces acting on wood buildings result in sliding, overturning,
and racking of a building, as illustrated in Figure 1.15. Sliding of a building is resisted by thefriction between the building and the foundation walls, but in practice this friction is neglected

I N T R O D U C T I O N : W O O D P R O P E R T I E S , S P E C I E S , A N D G R A D E S � 11
FIGURE 1.16 Cellular structure of wood. FIGURE 1.17 Typical tree cross-section.
and sill plate anchors are usually provided to resist the sliding force. The overturning moment,which can be resolved into a downward and upward couple of forces, is resisted by the deadweight of the structure and by hold-down anchors at the end chords of the shear walls. Rackingof a building is resisted by let-in diagonal braces or by plywood or OSB sheathing nailed to thewall studs acting as a shear wall.
The uplift forces due to upward vertical wind loads (or suction) on the roofs of woodbuildings are resisted by the dead weight of the roof and by using toenailing or hurricane orhold-down anchors. These anchors are used to tie the roof rafters or trusses to the wall studs.The uplift forces must be traced all the way down to the foundation. If a net uplift force existsin the wall studs at the ground-floor level, the sill plate anchors must be embedded deep enoughinto the foundation wall or grade beam to resist this uplift force, and the foundation must alsobe checked to ensure that it has enough dead weight, from its self weight and the weight of soilengaged, to resist the uplift force.
1.4 WOOD STRUCTURAL PROPERTIES
Wood is a biological material and is one of the oldest structural materials in existence. It isnonhomogeneous and orthotropic, and thus its strength is affected by the direction of loadrelative to the direction of the grain of the wood, and it is naturally occurring and can berenewed by planting or growing new trees. Since wood is naturally occurring and nonhomo-geneous, its structural properties can vary widely, and because wood is a biological material, itsstrength is highly dependent on environmental conditions. Wood buildings have been knownto be very durable, lasting hundreds of years, as evidenced by the many historic wood buildingsin the United States. In this chapter we discuss the properties of wood that are of importanceto architects and engineers in assessing the strength of wood members and elements.
Wood fibers are composed of small, elongated, round or rectangular tubelike cells (see Figure1.16) with the cell walls made of cellulose, which gives the wood its load-carrying ability. Thecells or fibers are oriented in the longitudinal direction of the tree log and are bound togetherby a material called lignin, which acts like glue. The chemical composition of wood consists ofapproximately 60% cellulose, 30% lignin, and 12% sugar end extractives. The water in the cellwalls is known as bound water, and the water in the cell cavities is known as free water. Whenwood is subjected to drying or seasoning, it loses all its free water before it begins to lose boundwater from the cell walls. It is the bound water, not the free water, that affects the shrinking orswelling of a wood member. The cells or fibers are usually oriented in the vertical direction ofthe tree. The strength of wood depends on the direction of the wood grain. The directionparallel to the tree trunk or longitudinal direction is referred to as the parallel-to-grain direction;the radial and tangential directions are both referred to as the perpendicular-to-grain direction.
Tree Cross Section
There are two main classes of trees: hardwood and softwood. This terminology is not indicativeof how strong a tree is because some softwoods are actually stronger than hardwoods. Hardwoodsare broad-leaved, whereas softwoods have needlelike leaves and are mostly evergreen. Hardwood

12 � S T R U C T U R A L W O O D D E S I G N
trees take longer to mature and grow than softwoods, are mostly tropical, and are generally moredense than softwoods. Consequently, they are more expensive and used less frequently thansoftwood lumber or timber in wood building construction in the United States. Softwoodsconstitute more than 75% of all lumber used in construction in the United States [6], and morethan two-thirds of softwood lumber are western woods such as douglas fir-larch and spruce. Therest are eastern woods such as southern pine. Examples of hardwood trees include balsa, oak,birch, and basswood.
A typical tree cross section is shown Figure 1.17. The growth of timber trees is indicatedby an annual growth ring added each year to the outer surface of the tree trunk just beneaththe bark. The age of a tree can be determined from the number of annual rings in a cross sectionof the tree log at its base. The tree cross section shows the two main sections of the tree, thesapwood and the heartwood. Sapwood is light in color and may be as strong as heartwood, butit is less resistant to decay. Heartwood is darker and older and more resistant to decay. However,sapwood is lighter and more amenable than heartwood to pressure treatment. Heartwood isdarker and functions as a mechanical support for a tree, while sapwood contains living cells fornourishment of the tree.
Advantages and Disadvantages of Wood as a Structural Material
Some advantages of wood as a structural material are as follows:
• Wood is renewable.• Wood is machinable.• Wood has a good strength-to-weight ratio.• Wood will not rust.• Wood is aesthetically pleasing.
The disadvantages of wood include the following:
• Wood can burn.• Wood can decay or rot and can be attacked by insects such as termites and marine borers.
Moisture and air promote decay and rot in wood.• Wood holds moisture.• Wood is susceptible to volumetric instability (i.e., wood shrinks).• Wood’s properties are highly variable and vary widely between species and even between
trees of the same species. There is also variation in strength within the cross section of atree log.
1.5 FACTORS AFFECTING THE STRENGTH OF WOOD
Several factors that affect the strength of a wood member are discussed in this section: (1) speciesgroup, (2) moisture content, (3) duration of loading, (4) size and shape of the wood member,(5) defects, (6) direction of the primary stress with respect to the orientation of the wood grain,and (7) ambient temperature.
Species and Species Group
Structural lumber is produced from several species of trees. Some of the species are groupedtogether to form a species group, whose members are ‘‘grown, harvested and manufactured to-gether.’’ The NDS code’s tabulated stresses for a species group were derived statistically fromthe results of a large number of tests to ensure that all the stresses tabulated for all species withina species group are conservative and safe. A species group is a combination of two or morespecies. For example, Douglas fir-larch is a species group that is obtained from a combinationof Douglas fir and western larch species. Hem-fir is a species group that can be obtained froma combination of western hemlock and white fir.
Structural wood members are derived from different stocks of trees, and the choice of woodspecies for use in design is typically a matter of economics and regional availability. For a given

I N T R O D U C T I O N : W O O D P R O P E R T I E S , S P E C I E S , A N D G R A D E S � 13
TABLE 1.1 Moisture Content Classifications for SawnLumber and Glulam
Lumber Classification
Moisture Content (%)
Sawn Lumber Glulam
Dry �19 �16
Green �19 �16
location, only a few species groups might be readily available. The species groups that have thehighest available strengths are Douglas fir-larch and southern pine, also called southern yellowpine. Examples of widely used species groups (i.e., combinations of different wood species) ofstructural lumber in wood buildings include Douglas fir-larch (DF-L), hem-fir, spruce-pine-fir(SPF), and southern yellow pine (SYP). Each species group has a different set of tabulated designstresses in the NDS-S, and wood species within a particular species group possess similar prop-erties and have the same grading rules.
Moisture Content
The strength of a wood member is greatly influenced by its moisture content, which is defined asthe percentage amount of moisture in a piece of wood. The fiber saturation point (FSP) is themoisture content at which the free water (i.e., the water in cell cavities) has been fully dissipated.Below the FSP, which is typically between 25 and 35% moisture content for most wood species,wood starts to shrink by losing water from the cell walls (i.e., the bound water). The equilibriummoisture content (EMC), the moisture content at which the moisture in a wood member has cometo a balance with that in the surrounding atmosphere, occurs typically at between 10 and 15%moisture content for most wood species in a protected environment. The moisture content inwood can be measured using a hand held moisture meter. As the moisture content increases upto the FSP (the point where all the free water has been dissipated), the wood strength decreases,and as the moisture content decreases below the FSP, the wood strength increases, although thisincrease may be offset by some strength reduction from the shrinkage of the wood fibers. Themoisture content (MC) of a wood member can be calculated as
weight of moist wood � weight of oven-dried woodMC(%) � � 100%
weight of oven-dried wood
There are two classifications of wood members based on moisture content: green and dry.Green lumber is freshly cut wood and the moisture content can vary from as low as 30% to ashigh as 200% [6]. Dry or seasoned lumber is wood with a moisture content no higher than 19%for sawn lumber and less than 16% for glulam (see Table 1.1) Wood can be seasoned by airdrying or by kiln drying. Most wood members are used in dry or seasoned conditions wherethe wood member is protected from excessive moisture. An example of a building where woodwill be in a moist or green condition is an exposed bus garage or shed. The effect of the moisturecontent is taken into account in design by use of the moisture adjustment factor, CM, which isdiscussed in Chapter 3.
Seasoning of LumberThe seasoning of lumber, the process of removing moisture from wood to bring the moisture
content to an acceptable level, can be achieved through air drying or kiln drying. Air dryinginvolves stacking lumber in a covered shed and allowing moisture loss or drying to take placenaturally over time due to the presence of air. Fans can be used to accelerate the seasoningprocess. Kiln drying involves placing lumber pieces in an enclosure or kiln at significantly highertemperatures. The kiln temperature has to be strictly controlled to prevent damage to the woodmembers from seasoning defects such as warp, bow, sweep, twists, or crooks. Seasoned wood isrecommended for building construction because of its dimensional stability. The shrinkage thatoccurs when unseasoned wood is used can lead to problems in the structure as the shape changes
14 � S T R U C T U R A L W O O D D E S I G N
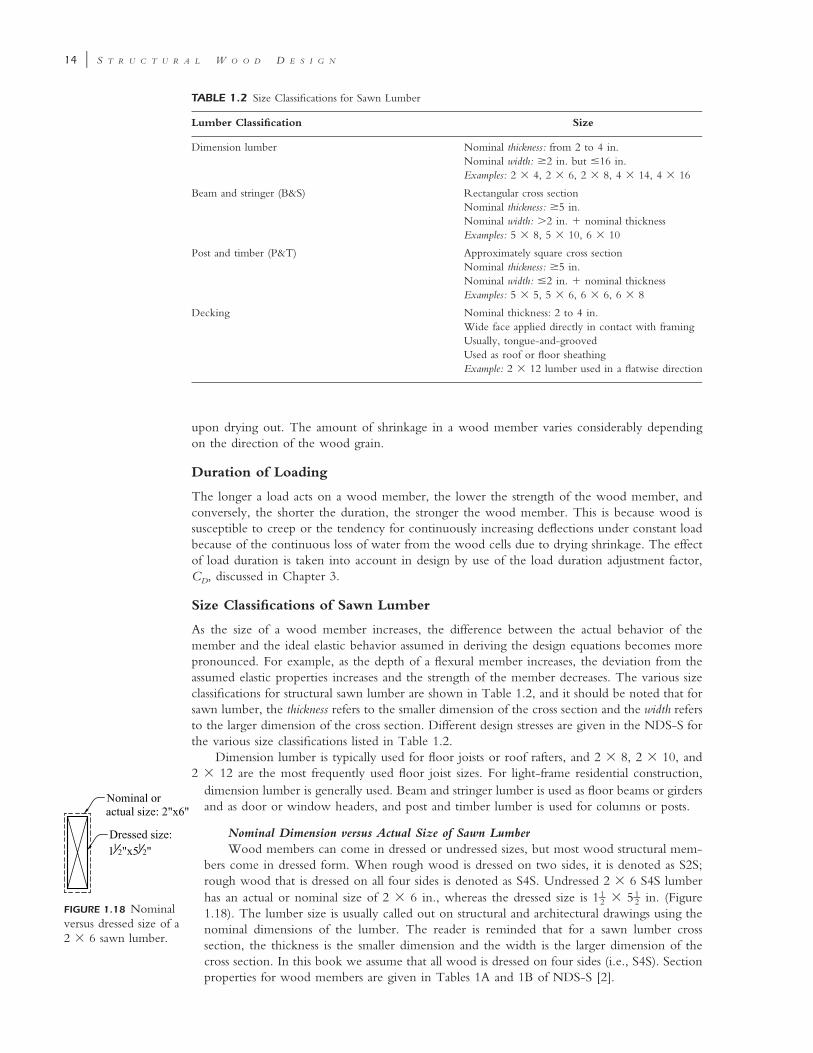
TABLE 1.2 Size Classifications for Sawn Lumber
Lumber Classification Size
Dimension lumber Nominal thickness: from 2 to 4 in.Nominal width: �2 in. but �16 in.Examples: 2 � 4, 2 � 6, 2 � 8, 4 � 14, 4 � 16
Beam and stringer (B&S) Rectangular cross sectionNominal thickness: �5 in.Nominal width: �2 in. � nominal thicknessExamples: 5 � 8, 5 � 10, 6 � 10
Post and timber (P&T) Approximately square cross sectionNominal thickness: �5 in.Nominal width: �2 in. � nominal thicknessExamples: 5 � 5, 5 � 6, 6 � 6, 6 � 8
Decking Nominal thickness: 2 to 4 in.Wide face applied directly in contact with framingUsually, tongue-and-groovedUsed as roof or floor sheathingExample: 2 � 12 lumber used in a flatwise direction
upon drying out. The amount of shrinkage in a wood member varies considerably dependingon the direction of the wood grain.
Duration of Loading
The longer a load acts on a wood member, the lower the strength of the wood member, andconversely, the shorter the duration, the stronger the wood member. This is because wood issusceptible to creep or the tendency for continuously increasing deflections under constant loadbecause of the continuous loss of water from the wood cells due to drying shrinkage. The effectof load duration is taken into account in design by use of the load duration adjustment factor,CD, discussed in Chapter 3.
Size Classifications of Sawn Lumber
As the size of a wood member increases, the difference between the actual behavior of themember and the ideal elastic behavior assumed in deriving the design equations becomes morepronounced. For example, as the depth of a flexural member increases, the deviation from theassumed elastic properties increases and the strength of the member decreases. The various sizeclassifications for structural sawn lumber are shown in Table 1.2, and it should be noted that forsawn lumber, the thickness refers to the smaller dimension of the cross section and the width refersto the larger dimension of the cross section. Different design stresses are given in the NDS-S forthe various size classifications listed in Table 1.2.
Dimension lumber is typically used for floor joists or roof rafters, and 2 � 8, 2 � 10, and2 � 12 are the most frequently used floor joist sizes. For light-frame residential construction,
FIGURE 1.18 Nominalversus dressed size of a2 � 6 sawn lumber.
dimension lumber is generally used. Beam and stringer lumber is used as floor beams or girdersand as door or window headers, and post and timber lumber is used for columns or posts.
Nominal Dimension versus Actual Size of Sawn LumberWood members can come in dressed or undressed sizes, but most wood structural mem-
bers come in dressed form. When rough wood is dressed on two sides, it is denoted as S2S;rough wood that is dressed on all four sides is denoted as S4S. Undressed 2 � 6 S4S lumberhas an actual or nominal size of 2 � 6 in., whereas the dressed size is 1 � 5 in. (Figure1 1– –2 2
1.18). The lumber size is usually called out on structural and architectural drawings using thenominal dimensions of the lumber. The reader is reminded that for a sawn lumber crosssection, the thickness is the smaller dimension and the width is the larger dimension of thecross section. In this book we assume that all wood is dressed on four sides (i.e., S4S). Sectionproperties for wood members are given in Tables 1A and 1B of NDS-S [2].

I N T R O D U C T I O N : W O O D P R O P E R T I E S , S P E C I E S , A N D G R A D E S � 15
FIGURE 1.19
Common defects inwood.
Wood Defects
The various categories of defects in wood are natural, conversion, and seasoning defects. Thenature, size, and location of defects affect the strength of a wood member because of the stressconcentrations that they induce in the member. They also affect the finished appearance of themember. Some examples of natural defects are knots, shakes, splits, and fungal decay. Conversiondefects occur due to unsound milling practices, one example being wanes. Seasoning defectsresult from the effect of uneven or unequal drying shrinkage, examples being various types ofwarps, such as cups, bows, sweep, crooks, or twists [6–8, 12, 14]. The most common types ofdefects in wood members are illustrated in Figure 1.19 and include the following:
• Knots. These are formed where limbs grow out from a tree stem.• Split or check. This occurs due to separation of the wood fibers at an angle to annual rings
and is caused by drying of the wood.• Shake. This occurs due to separation of the wood fibers parallel to the annual rings.• Decay. This is the rotting of wood due to the presence of wood-destroying fungi.• Wane. In this defect the corners or edges of a wood cross section lack wood material or
have some of the bark of the tree as part of the cross section. This leads to a reduction inthe cross-sectional area of the member which affects the structural capacity of the mem-ber.
Defects lead to a reduction in the net cross section, and their presence introduces stressconcentrations in the wood member. The amount of strength reduction depends on the sizeand location of the defect. For example, for an axially loaded tension member, a knot anywherein the cross section would reduce the tension capacity of the member. On the other hand, aknot at the neutral axis of the beam would not affect the bending strength but may affect theshear strength if it is located near the supports. For visually graded lumber, the grade stamp,which indicates the design stress grade assigned by the grading inspector, takes into account thenumber and location of defects in that member.
It is recommended that lumber not be cut indiscriminately on site, as this could affect thestrength of a member adversely [8]. Let us illustrate with an example. A 20-ft-long piece of 2� 14 sawn lumber with a knot at the neutral axis at midspan has been delivered to a site to beused as a simply supported beam. The contractor would like to cut this member to use as a joiston a 12-ft span. To avoid reducing the shear strength of the member, it would need to be cutequally at both ends to maintain the relative location of the knot with respect to both ends ofthe member. Failure to do this would result in lower strength than that assigned by the gradinginspector.
Other types of defects include warping and compression or reaction wood. Warping resultsfrom uneven drying shrinkage of wood, leading the wood member to deviate from the horizontal

16 � S T R U C T U R A L W O O D D E S I G N
or vertical plane. Examples of warping include members with a bow, cup, sweep, or crook. Thisdefect does not affect the strength of the wood member but affects the constructability of themember. For example, if a bowed member is used as a joist or beam, there will be an initial sagor deflection in the member, depending on how it is oriented. This could affect the constructionof the floor or roof in which it is used.
Compression or reaction wood is caused by a tree that grows abnormally in bent shape dueeither to natural effects or bending due to the effect of wind and snow loads. In a leaning treetrunk, one side of the tree cross section is subject to combined compression stresses from bendingdue to the crookedness of the tree trunk and axial load on the cross section from the self-weightof the tree. The wood fibers in the compression zone of the tree trunk will be more brittle andhard and will possess very little tensile strength, due to the existing internal compressive stresses.Compression wood should not be used for structural members.
Orientation of the Wood Grain
Wood is an orthotropic material with strengths that vary depending on the direction of the stressapplied relative to the grain of the wood. As a result of the tubular nature of wood, threeindependent directions are present in a wood member: longitudinal, radial, and tangential. Thevariation in strength in a wood member with the direction of loading can be illustrated by agroup of drinking straws glued tightly together. The group of straws will be strongest when theload is applied parallel to the length of the straws (i.e., longitudinal direction); loads applied inany other direction (i.e., radial or tangential) will crush the walls of the straws or pull apart theglue. The longitudinal direction is referred to as the parallel-to-grain direction, and the tangentialand radial directions are both referred to as the perpendicular-to-grain direction. Thus, wood isstrongest when the load or stress is applied in a direction parallel to the direction of the woodgrain, is weakest when the stress is perpendicular to the direction of the wood grain, and hasthe least amount of shrinkage in the longitudinal or parallel-to-grain direction. The various axesin a wood member with respect to the grain direction are shown in Figure 1.20.
Axial or Bending Stress Parallel to the Grain This is the strongest direction for a woodmember, and examples of stresses and loads acting in this direction are illustrated in Figure 1.21a.
Axial or Bending Stress Perpendicular to the Grain The strength of wood in compressionparallel to the grain is usually stronger than wood in compression perpendicular to the grain (seeFigure 1.21b). Wood has zero strength in tension perpendicular to the grain since only the ligninor glue is available to resist this tension force. Consequently, the NDS code does not permit theloading of wood in tension perpendicular to the grain.
Stress at an Angle to the Grain This case lies between the parallel-to-grain and perpendic-ular-to-grain directions and is illustrated in Figure 1.21c.
Ambient Temperature
Wood is affected adversely by temperature beyond 100�F. As the ambient temperature risesbeyond 100�F, the strength of the wood member decreases. The structural members in mostinsulated wood buildings have ambient temperatures of less than 100�F.
1.6 LUMBER GRADING
Lumber is usually cut from a tree log in the longitudinal direction, and because it is naturallyoccurring, it has quite variable mechanical and structural properties, even for members cut fromthe same tree log. Lumber of similar mechanical and structural properties is grouped into a singlecategory known as a stress grade. This simplifies the lumber selection process and increases econ-omy. The higher the stress grade, the stronger and more expensive the wood member is. Theclassification of lumber with regard to strength, usage, and defects according to the grading rulesof an approved grading agency is termed lumber grading.

I N T R O D U C T I O N : W O O D P R O P E R T I E S , S P E C I E S , A N D G R A D E S � 17
FIGURE 1.20 Longitudinal, radial, and tangential axes in awood member.
(a)
(b)
(c)
FIGURE 1.21 Stress applied (a) parallel to the grain, (b)perpendicular to the grain, and (c) at an angle to the grain ina wood member.
Types of Grading
The two types of grading systems for structural lumber are visual grading and mechanical grading.The intent is to classify the wood members into various stress grades such as Select Structural,No. 1 and Better, No. 1, No. 2, Utility, and so on. A grade stamp indicating the stress gradeand the species or species group is placed on the wood member, in addition to the moisturecontent, the mill number where the wood was produced, and the responsible grading agency.The grade stamp helps the engineer, architect, and contractor be certain of the quality of thelumber delivered to the site and that it conforms to the contract specifications for the project.Grading rules may vary among grading agencies, but minimum grading requirements are setforth in the American Lumber Product Standard US DOC PS-20 developed by the NationalInstitute for Standards and Technology (NIST). Examples of grading agencies in the UnitedStates [2] include the Western Wood Products Association (WWPA), the West Coast LumberInspection Bureau (WCLIB), the Northern Softwood Lumber Bureau (NSLB), the NortheasternLumber Manufacturers Association (NELMA), the Southern Pine Inspection Bureau (SPIB), andthe National Lumber Grading Authority (NLGA).
Visual GradingVisual grading, the oldest and most common grading system, involves visual inspection of
wood members by an experienced and certified grader in accordance with established grading

18 � S T R U C T U R A L W O O D D E S I G N
rules of a grading agency and application of a grade stamp. In visual grading, the lumber qualityis reduced by the presence of defects, and the effectiveness of the grading system is very depen-dent on the experience of the professional grader. Grading agencies usually have certificationexams that lumber graders have to take and pass annually to maintain their certification and toensure accurate and consistent grading of sawn lumber. The stress grade of a wood memberdecreases as the number of defects increases and as their locations become more critical.
Machine Stress RatingMechanical grading is a nondestructive grading system that is based on the relationship
between the stiffness and deflection of wood members. Each piece of wood is subjected to anondestructive test in addition to a visual check. The grade stamp on machine-stress-rated (MSR)lumber includes the value of the tabulated bending stress and the pure bending modulus ofelasticity. Because of the lower variability of material properties for MSR lumber, it is used inthe fabrication of engineered wood products such as parallel strand lumber and laminated veneerlumber. Machine-evaluated lumber (MEL) relies on a relatively new grading process that uses anondestructive x-ray inspection technique to measure density in addition to a visual check. Thevariability of MEL lumber is even lower than that of MSR lumber.
Stress Grades
The various lumber stress grades are listed below in order of decreasing strength. As discussedpreviously, the higher the stress grade, the higher the cost of the wood member.
• Dense Select Structural• Select Structural• No. 1 & Better• No. 1• No. 2• No. 3• Stud• Construction• Standard• Utility
FIGURE 1.22 Typical grade stamp. (Courtesy of the WesternWood Products Association, Portland, OR.)
Grade Stamps
The use of a grade stamp on lumber assures the contractorand the engineer of record that the lumber supplied con-forms to that specified in the contract documents. Lumberwithout a grade stamp should not be allowed on site orused in a project. A typical grading stamp on lumber mightinclude the items shown in Figure 1.22.
1.7 SHRINKAGE OF WOOD
Shrinkage in a wood member takes place as moisture is dissipated from the member beyond thefiber saturation point. Wood shrinks as the moisture content decreases from its value at theinstallation of the member to the equilibrium moisture content, which can be as low as 8–10%in some protected environments. Shrinkage parallel to the grain of a wood member is negligibleand much less than shrinkage perpendicular to the grain. Differential shrinkage is usually morecritical than uniform shrinkage. Shrinkage effects in lumber can be minimized by using seasonedlumber or lumber with an equilibrium moisture content of 15% or less. To reduce the effectsof shrinkage, minimize the use of details that transfer loads perpendicular to the grain. For woodmembers with two or more rows of bolts perpendicular to the direction of the wood grain,shrinkage across the width of the member causes tension stresses perpendicular to the grain in

I N T R O D U C T I O N : W O O D P R O P E R T I E S , S P E C I E S , A N D G R A D E S � 19
TABLE 1.3 Shrinkage Parameters
Wood Species
Width
a b
Thickness
a b
Redwood, western red cedar, northern white cedar 3.454 0.157 2.816 0.128
Other 6.031 0.215 5.062 0.181
Source: Ref. 15.
the wood member between the bolt holes, which could lead to the splitting of the memberparallel to the grain [17]. Shrinkage can also adversely affect the functioning of hold-downanchors in shear walls by causing a gap between the anchor nut and the top of sill plate. As aresult, the shear wall has to undergo excessive lateral displacement before the hold-down anchorscan be engaged.
The effect of shrinkage on tie-down anchor systems can be minimized by pretensioning theanchors or by using proprietary shrinkage compensating anchor devices. [18] One method thathas been used successfully to control the moisture content in wood during construction in orderto achieve the required moisture threshold is by using portable heaters to dry the wood contin-uously during construction [19]. The effect of shrinkage can also be minimized by delaying theinstallation of architectural finishes to allow time for much of the wood shrinkage to occur. Itis important to control shrinkage effects in wood structures by proper detailing and by limitingthe change in moisture content of the member to avoid adverse effects on architectural finishesand to prevent the excessive lateral deflection of shear walls, and loosening of connections orsplitting of wood members at connections.
The amount of shrinkage across the width or thickness of a wood member or element (i.e.,perpendicular to the grain or to the longitudinal direction) is highly variable, but can be estimatedusing the following equation (adapted from ASTM D1990 [15]):
1 � (a � bM )/1002d � d (1.1)� �2 1 1 � (a � bM )/1001
where d1 � initial member thickness or width at the initial moisture content M1, in.d2 � final member thickness or width at the final moisture content M2, in.
M1 � moisture content at dimension d1, %M2 � moisture content at dimension d2, %
The variables a and b are obtained from Table 1.3. The total shrinkage of a wood building detailor section is the sum of the shrinkage perpendicular to the grain of each wood member or elementin that detail or section; longitudinal shrinkage or the shrinkage parallel to the grain is negligible.
1.8 DENSITY OF WOOD
The density of wood is a function of the moisture content of the wood and the weight of thewood substance or cellulose present in a unit volume of wood. Even though the cellulose–lignincombination in wood has a specific gravity of approximately 1.50 and is heavier than water,most wood used in construction floats because of the presence of cavities in the hollow cells ofa wood member. The density of wood can vary widely between species, from as low as 20lb/in3 to as high as 65 lb/in3 [2, 6], and the higher the density, the higher the strength of thewood member. An average wood density of 31.2 lb/in3 is used throughout this book.
1.9 UNITS OF MEASUREMENT
The U.S. system of units is used in this book, and accuracy to at most three significant figuresis maintained in all the example problems. The standard unit of measurement for lumber in theUnited States is the board foot (bf), which is defined as the volume of 144 cubic inches of lumber

20 � S T R U C T U R A L W O O D D E S I G N
EXAMPLE 1.1
Shrinkage in Wood Members
Determine the total shrinkage across (a) the width and (b) the thickness of two green 2 � 6 Douglas fir-larchtop plates loaded perpendicular to the grain as the moisture content decreases from an initial value of 30% to afinal value of 15%.
Solution: For 2 � 6 sawn lumber, the actual width d1 � 5.5 in. and the actual thickness � 1.5 in. The initialmoisture content and the final equilibrium moisture content are M1 � 30 and M2 � 15, respectively.
(a) Shrinkage across the width of the two 2 � 6 top plates. For shrinkage across the width of the top plate, theshrinkage parameters from Table 1.3 are obtained as follows:
a � 6.031
b � 0.215
From Equation 1-1, the final width d2 is given as
1 � [6.031 � (0.215)(15)]/100d � 5.5 � 5.32 in.� �2 1 � [6.031 � (0.215)(30)]/100
Thus, the total shrinkage across the width of the two top plates � d1 � d2 � 5.5 in. � 5.32 in. � 0.18 in.
(b) Shrinkage across the thickness of the two 2 � 6 top plates. For shrinkage across the thickness of the topplate, the shrinkage parameters from Table 1.3 are:
a � 5.062
b � 0.181
The final thickness d2 of each top plate from Equation 1-1 is given as
1 � [5.062 � (0.181)(15)]/100d � 1.5 � 1.46 in.� �2 1 � [5.062 � (0.181)(30)/100
The total shrinkage across the thickness of the two top plates will be the sum of the shrinkage in each of theindividual wood members:
2 top plates � (d � d ) � (2)(1.5 in. � 1.46 in.) � 0.08 in.1 2
using nominal dimensions. The Engineering News-Record, the construction industry leading mag-azine, publishes the prevailing cost of lumber in the United States and Canada in units of 1000board feet (Mbf). For example, 2 � 6 lumber that is 18 ft long is equivalent to 18 board feetor 0.018 Mbf. That is,
(2 in.)(6 in.)(18 ft � 12)� 18 bf or 0.018 Mbf3144 in
1.10 BUILDING CODES
A building code is a minimum set of regulations adopted by a city or state that governs the designof building structures in that jurisdiction. The primary purpose of a building code is safety, andthe intent is that in the worst-case scenario, even though a building is damaged beyond repair,it should stand long enough to enable its occupants to escape to safety. The most widely usedbuilding code in the United States is the International Building Code (IBC), first released in 2000

I N T R O D U C T I O N : W O O D P R O P E R T I E S , S P E C I E S , A N D G R A D E S � 21
EXAMPLE 1.2
Shrinkage at Framed Floors
Determine the total shrinkage at each floor level for the typical wall section shown in Figure 1.23 assumingHem Fir wood species, and the moisture content decreases from an initial value of 19% to a final value of 10%.How much gap should be provided in the plywood wall sheathing to allow for shrinkage?
FIGURE 1.23 Wood shrinkage at a framed floor.
Solution: For a 2 � 6 sawn lumber, the actual thickness � 1.5 in.For a 2 � 12 sawn lumber, the actual width, d1 � 11.25 in.
The initial and final moisture contents are M � 19 and M � 101 2
(a) Shrinkage across the width of the 2 � 12 continuous blocking. The shrinkage parameters from Table 1.3 forshrinkage across the width of the 2 � 12 are
a � 6.031, and b � 0.215
From Equation 1-1, the final width d2 is given as,
1 � [6.031 � (0.215)(10)]/100d � 11.25 � 11.03 in.� �2 1 � [6.031 � (0.215)(19)]/100
Thus, the total shrinkage across the width of the 2 � 12 is
d � d � 11.25 in. � 11.03 in. � 0.22 in.1 2
(b) Shrinkage across the thickness of the two 2 � 6 top plates and one 2 � 6 sole plate. The shrinkage parametersfrom Table 1.3 for shrinkage across the thickness of the 2 � 6 plates are
a � 5.062, and b � 0.181
The final thickness d2 of each plate from Equation 1-1 is given as,
1 � [5.062 � (0.181)(10)]/100d � 1.5 � 1.475 in.� �2 1 � [5.062 � (0.181)(19)/100
The total shrinkage across the thickness of the two top plates and one sill plate will be the sum of the shrinkagein each of the individual wood member calculated as
3 plates � (d � d ) � 3(1.5 in. � 1.475 in.) � 0.075 in.1 2
22 � S T R U C T U R A L W O O D D E S I G N
The longitudinal shrinkage or shrinkage parallel to grain in the 2 � 6 studs is negligible. Therefore, the totalshrinkage per floor, which is the sum of the shrinkage of all the wood members at the floor level, is
1–0.075 in. � 0.22 in. � 0.3 in. Therefore, use in. shrinkage gap.2
An adequate shrinkage gap, typically about in. deep, is provided in the plywood sheathing at each floor level1–2to prevent buckling of the sheathing panels due to shrinkage. It should also be noted that for multi-story woodbuildings, the effects of shrinkage are even more pronounced and critical. For example, a five-story buildingwith a typical detail as shown in Figure 1.23 will have a total accumulated vertical shrinkage of approximatelyfive times the value calculated above!
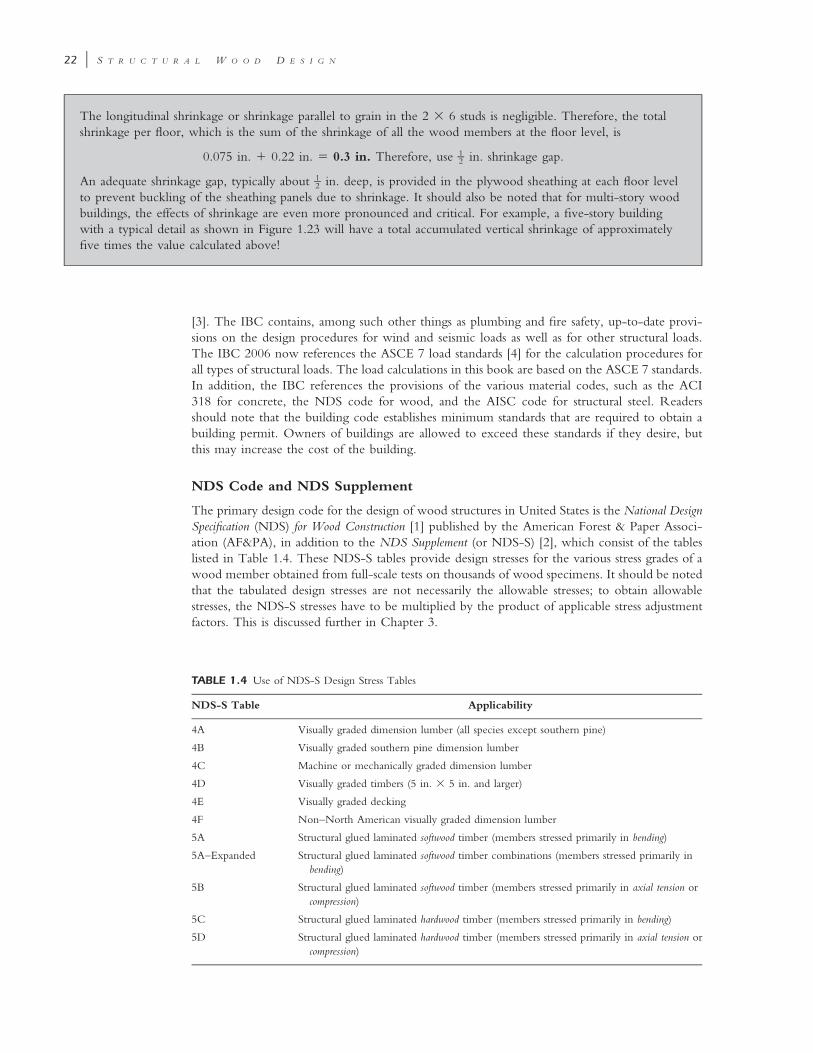
TABLE 1.4 Use of NDS-S Design Stress Tables
NDS-S Table Applicability
4A Visually graded dimension lumber (all species except southern pine)
4B Visually graded southern pine dimension lumber
4C Machine or mechanically graded dimension lumber
4D Visually graded timbers (5 in. � 5 in. and larger)
4E Visually graded decking
4F Non–North American visually graded dimension lumber
5A Structural glued laminated softwood timber (members stressed primarily in bending)
5A–Expanded Structural glued laminated softwood timber combinations (members stressed primarily inbending)
5B Structural glued laminated softwood timber (members stressed primarily in axial tension orcompression)
5C Structural glued laminated hardwood timber (members stressed primarily in bending)
5D Structural glued laminated hardwood timber (members stressed primarily in axial tension orcompression)
[3]. The IBC contains, among such other things as plumbing and fire safety, up-to-date provi-sions on the design procedures for wind and seismic loads as well as for other structural loads.The IBC 2006 now references the ASCE 7 load standards [4] for the calculation procedures forall types of structural loads. The load calculations in this book are based on the ASCE 7 standards.In addition, the IBC references the provisions of the various material codes, such as the ACI318 for concrete, the NDS code for wood, and the AISC code for structural steel. Readersshould note that the building code establishes minimum standards that are required to obtain abuilding permit. Owners of buildings are allowed to exceed these standards if they desire, butthis may increase the cost of the building.
NDS Code and NDS Supplement
The primary design code for the design of wood structures in United States is the National DesignSpecification (NDS) for Wood Construction [1] published by the American Forest & Paper Associ-ation (AF&PA), in addition to the NDS Supplement (or NDS-S) [2], which consist of the tableslisted in Table 1.4. These NDS-S tables provide design stresses for the various stress grades of awood member obtained from full-scale tests on thousands of wood specimens. It should be notedthat the tabulated design stresses are not necessarily the allowable stresses; to obtain allowablestresses, the NDS-S stresses have to be multiplied by the product of applicable stress adjustmentfactors. This is discussed further in Chapter 3.

I N T R O D U C T I O N : W O O D P R O P E R T I E S , S P E C I E S , A N D G R A D E S � 23
REFERENCES
1. ANSI/AF&PA (2005), National Design Specification for Wood Construction, American Forest &Paper Association, Washington, DC.
2. ANSI/AF&PA (2005), National Design Specification Supplement: Design Values for Wood Construc-tion, American Forest & Paper Association, Washington, DC
3. ICC (2006), International Building Code, International Code Council, Washington, DC.4. ASCE (2005), Minimum Design Loads for Buildings and Other Structures, American Society of Civil
Engineers, Reston, VA.5. Willenbrock, Jack H., Manbeck, Harvey B., and Suchar, Michael G. (1998), Residential Building
Design and Construction, Prentice Hall, Upper Saddle River, NJ.6. Faherty, Keith F., and Williamson, Thomas G. (1995), Wood Engineering and Construction,
McGraw-Hill, New York.7. Halperin, Don A., and Bible, G. Thomas (1994), Principles of Timber Design for Architects and
Builders, Wiley, New York.8. Stalnaker, Judith J., and Harris, Earnest C. (1997), Structural Design in Wood, Chapman & Hall,
London.9. NAHB (2000), Residential Structural Design Guide—2000, National Association of Home Builders
Research Center, Upper Marlboro, MD.10. Cohen, Albert H. (2002), Introduction to Structural Design: A Beginner’s Guide to Gravity Loads and
Residential Wood Structural Design, AHC, Edmonds, WA.11. Kang, Kaffee (1998), Graphic Guide to Frame Construction—Student Edition, Prentice Hall, Upper
Saddle River, NJ.12. Kim, Robert H., and Kim, Jai B. (1997), Timber Design for the Civil and Structural Professional
Engineering Exams, Professional Publications, Belmont, CA.13. Hoyle, Robert J., Jr. (1978), Wood Technology in the Design of Structures, 4th ed., Mountain Press,
Missoula, MT.14. Kermany, Abdy (1999), Structural Timber Design, Blackwell Science, London.15. ASTM (1990), Standard Practice for Establishing Allowable Properties for Visually-Graded Dimension
Lumber from In-Grade Tests of Full-Size Specimens, ASTM D 1990, ASTM International, WestConshohocken, PA.
16. AITC (1994), Timber Construction Manual, 4th ed., Wiley, Hoboken, NJ.17. Powell, Robert M. (2004), Wood Design for Shrinkage, STRUCTURE, pp. 24–25, November.18. Nelson, Ronald F., Patel, Sharad T., and Avevalo Ricardo (2002), Continuous Tie-Die System for
Wood Panel Shear Walls in Multi-Story Structures, Structural Engineers Association of CaliforniaConvention, October 28.
19. Knight, Brian (2006), High Rise Wood Frame Construction, STRUCTURE, pp. 68–70, June.
PROBLEMS
1.1 List the typical structural components of a wood building.1.2 What is moisture content, and how does it affect the strength of a wood member?1.3 Define the terms equilibrium moisture content and fiber saturation point.1.4 Describe the various size classifications for structural lumber, and give two examples of
each size classification.1.5 List and describe factors that affect the strength of a wood member.1.6 How and why does the duration of loading affect the strength of a wood member?1.7 What are common defects in a wood member?1.8 Why does the NDS code not permit the loading of wood in tension perpendicular to the
grain?1.9 Describe the two types of grading systems used for structural lumber. Which is more
commonly used?1.10 Determine the total shrinkage across the width and thickness of a green triple 2 � 4
Douglas fir-larch top plate loaded perpendicular to grain as the moisture content decreasesfrom an initial value of 30% to a final value of 12%.

24 � S T R U C T U R A L W O O D D E S I G N
FIGURE 1.24 Two-story exterior wallsection.
1.11 Determine the total shrinkage over the height of a two-story building that has the exteriorwall cross section shown in Figure 1.24 as the moisture content decreases from an initialvalue of 25% to a final value of 12%.
1.12 How many board feet are there in a 4 � 16 � 36 ft-long wood member? How manyMbf are in this member? Determine how many pieces of this member would amount to4.84 Mbf (4840 bf).

25
c h a p t e r t w o
INTRODUCTION TO STRUCTURAL
DES IGN LOADS
2.1 DESIGN LOADS
Several types of loads can act on wood buildings: dead loads, live loads, snow loads, wind loads,and seismic loads. The combinations of these loads that act on any building structure is prescribedby the relevant building code, such as the International Building Code (IBC) [1] or the ASCE 7load specifications [2].
Load Combinations
The various loads that act on a building do not act in isolation and may act on the structuresimultaneously. However, these loads usually will not act on the structure simultaneously at theirmaximum values. The IBC and ASCE 7 load standards prescribe the critical combination ofloads to be used for design; and for allowable stress design, two sets of load combinations, thebasic and the alternate load combinations, are given. The basic load combinations shown inSection 1605.3.1 of the IBC are used in this book and are listed below for reference:
1. D � F (IBC Equation 16-8)2. D � H � F � L � T (IBC Equation 16-9)3. D � H � F � (Lr or S or R) (IBC Equation 16-10)4. D � H � F � 0.75(L � T) � 0.75(Lr or S or R) (IBC Equation 16-11)5. D � H � F � (W or 0.7E) (IBC Equation 16-12)6. D � H � F � 0.75(W or 0.7E) � 0.75L � 0.75(Lr or S or R) (IBC Equation 16-13)7. 0.6D � W � H (IBC Equation 16-14)8. 0.6D � 0.7E � H (IBC Equation 16-15)
where D � dead loadL � live loadLr � roof live loadS � snow loadR � rain loadH � earth pressure, hydrostatic pressure, and pressure due to bulk materialsT � temperature change, shrinkage, or settlement
W � wind loadF � fluid loadE � seismic load
� Eh � Ev in load combinations 5 and 6� Eh � Ev in load combinations 7 and 8
Eh � �QE � horizontal seismic load effect (i.e., due to seismic lateral forces)Ev � 0.2SDSD � vertical seismic load effect
Structural Wood Design: A Practice-Oriented Approach Using the ASD Method. Abi Aghayere and Jason VigilCopyright © 2007 John Wiley & Sons, Inc.

26 � S T R U C T U R A L W O O D D E S I G N
FIGURE 2.1 Typical roof dead load. FIGURE 2.2 Typical floor dead load.
� � redundancy coefficient (see Section 12.3.4 of Ref. 2) � 1.0 or 1.3SDS � design spectral response acceleration parameter at short period (see Section 11.4.4
of Ref. 2)
All structural elements must be designed for the most critical of these combinations. The use ofthese load combinations is described in greater detail later in the book.
Notes [1, 2]
• Where the flat roof snow load Pf � 30 psf, the snow load need not be combined withseismic loads E. Where Pf � 30 psf, only 20% of the snow load is combined with theseismic load.
• Where the load H counteracts the load W or E in combinations 7 and 8, set the loadfactor on H to zero (i.e., neglect H in load combinations 7 and 8).
• In load combinations 5 and 6, when E is included, the load factor on the floor live loadL can be set to 0.5 for all occupancies where the basic floor live load L 0 is 100 psf orless, except for parking garages or areas of public assembly (see Section 12.4.2.3 of Ref. 2).
2.2 DEAD LOADS
Dead loads are the weights of all materials that are permanently and rigidly attached to a structure,including the self-weight of the structure, such that it will vibrate with the structure during aseismic or earthquake event (Figures 2.1 and 2.2). The dead load can be determined with moreaccuracy than other types of load and are not as variable as live loads. Typical checklists for theroof and floor dead loads in wood buildings follow.
Typical Roof Dead Load Checklist
• Weight of roofing material• Weight of roof sheathing or plywood• Weight of framing• Weight of insulation• Weight of ceiling• Weight of mechanical and electrical fixtures (M&E)
Typical Floor Dead Load Checklist
• Weight of flooring (i.e., the topping: hardwood, lightweight concrete, etc.)• Weight of floor sheathing or plywood• Weight of floor framing• Weight of partitions (15 psf minimum; not required when the floor live load is greater
than 80 psf; see Section 4.2.2 of Ref. 2)• Weight of ceiling

I N T R O D U C T I O N T O S T R U C T U R A L D E S I G N L O A D S � 27
FIGURE 2.3 Loads on a sloped roof. FIGURE 2.4 Free-body diagram of a sloped rafter.
• Weight of mechanical and electrical fixtures (M&E)
To aid in the calculation of dead loads, weights of various building materials, such as thosegiven in Appendix A, are typically used. The weights of framing provided in Appendix A arebased on Douglas Fir Larch with a specific gravity of 0.5 and density of 31.2 pcf, which isconservative for most wood buildings. The following are sample roof and floor dead-load cal-culations for typical wood buildings that can serve as a guide to the reader. In the calculationsbelow, the density of wood is assumed to be 31.2 pcf, as stated previously.
Sample Roof Dead-Load Calculation
Roofing (five-ply with gravel) � 6.5 psfReroofing (i.e., future added roof ) � 2.5 psf (assumed)-in. plywood sheathing (� 0.4 psf/ in. � 4)1 1– –2 8 � 1.6 psf
Framing (e.g., assuming 2 � 12 at 16 in. o.c.) � 2.8 psfInsulation (2 in. loose insulation: 0.5 psf/ in. � 2 in) � 1.0 psfChannel-suspended system (steel) � 2.0 psfMechanical and Electrical (M&E) � 5.0 psf (typical for wood buildings)
Total roof dead load Droof � 21.4 psf � 22 psf
Sample Floor Dead-Load Calculation
Floor covering � 12.5 psf(e.g., assuming 1 -in. lightweight concrete at 100 pcf )1–2
1 -in. plywood sheathing (0.4 psf/ in. � 9)1 1– –8 8 � 3.6 psfFraming (assuming 4 � 12 at 4ft 0 in. o.c.) � 2.2 psf-in. drywall ceiling (� 5 psf/ in. � in.1 1– –2 2 � 2.5 psf
Ceiling supports (say, 2 � 4 at 24 in. o.c.) � 0.6 psfMechanical and electrical (M&E) � 5.0 psfPartition loads � 20.0 psf (assumed)
Total floor dead load Dfloor � 46.4 psf � 47 psf
It should be noted that for buildings with floor live loads less than or equal to 80 psf, thepartition dead load must be at least 15 psf (see Section 4.2.2 of Ref. 2), while for buildings withfloor live loads greater than 80 psf, no partition loads have to be considered since for suchassembly occupancies, there is less likelihood that partition walls will be present.
Combined Dead and Live Loads on Sloped Roofs
Since most wood buildings have sloped roofs, we discuss next how to combine the dead loadsacting on the sloped roof surface with the live loads (i.e. snow, rain, or roof live load) actingon a horizontal projected plan area of the roof surface (Figure 2.3). Most building codes givelive loads in units of pounds per square foot of the horizontal projected plan area, while the

28 � S T R U C T U R A L W O O D D E S I G N
dead load of a sloped roof is in units of pounds per square foot of the sloped roof area. Therefore,to combine the dead and live loads in the same units, two approaches are possible:
1. Convert the dead load from units of pounds per square foot of sloped roof area to unitsof psf of horizontal projected plan area and then add to the live load, which is in units ofpsf of horizontal projected plan area. When using this approach, the reader should notforget the horizontal thrust or force acting at the exterior wall from the component ofthe dead and live loads acting parallel to the roof surface. These lateral thrusts must beconsidered in the design of the walls, and collar or ceiling ties should be provided toresist this lateral force.
2. Convert the live load from pounds per square foot of horizontal projected plan area to psfof sloped roof area and then add to the dead load, which is in units of psf of sloped roofarea.
Option 1 is most commonly used in design practice and is adopted in this book. Using theload combination equations presented earlier in this chapter, the total dead plus live load wTL inpsf of horizontal plan area will be
L1w � D � (L or S or R) psf of horizontal plan area (2.1)TL rL 2
where D � roof dead load in psf of sloped roof areaS � roof snow load in psf of horizontal plan areaLr � roof live load in psf of horizontal plan areaR � rain load in psf of horizontal plan area (usually not critical for sloped roofs)L1 � sloped length of rafterL 2 � horizontal projected length of rafter
Calculation of the Horizontal Thrust at an Exterior WallSumming moments about the exterior wall support of the rafter yields (Figure 2.4)
L 2�H(h) � w L � 0TL 2 2
Thus, the horizontal thrust H becomes
w L (L /2)TL 2 2H � (2.2)h
Combined Dead and Live Loads on Stair Stringers
The same equation, (2.1), used for calculating the total load on sloped roofs can be applied tostair stringers. Using the load combinations in Section 2.1, the total load on the stair stringer isgiven as
L1w � D � L psf of horizontal plan area (2.3)TL L2
where D � stair dead load in psf of sloped roof areaL � stair live load in psf of horizontal plan area (100 psf according to IBC Table 1607.1
or ASCE 7 Table 4-1)L1 � sloped length of rafterL 2 � horizontal projected length of rafter
2.3 TRIBUTARY WIDTHS AND AREAS
In this section we introduce the concept of tributary widths and tributary areas (Figure 2.8).These concepts are used to determine the distribution of floor and roof loads to the variousstructural elements. The tributary width (TW) of a beam or girder is defined as the width of floor

I N T R O D U C T I O N T O S T R U C T U R A L D E S I G N L O A D S � 29
EXAMPLE 2.1
Design Loads for a Sloped Roof
Given the following design parameters for a sloped roof (Figure 2.5), (a) calculate the uniform total load and themaximum shear and moment on the rafter. (b) Calculate the horizontal thrust on the exterior wall if rafters areused.
Roof dead load D � 10 psf (of sloped roof area)
Roof snow load S � 66 psf (of horizontal plan area)
Horizontal projected length of rafter L � 18 ft2
Sloped length of rafter L � 20.12 ft1
Rafter or truss spacing � 4 ft 0 in.
FIGURE 2.5 Cross section of a building with a sloped roof.
Solution: (a) Using the load combinations in Section 2.1, the total load in psf of horizontal plan area will be (seeFigure 2.6)
FIGURE 2.6 Free-body diagram of a sloped rafter.
L1w � D � (L or S or R), psf of horizontal plan area� �TL TL 2
20.12 ft� (10 psf ) � 66 psf� �18 ft
� 78 psf of horizontal plan area

30 � S T R U C T U R A L W O O D D E S I G N
The total load in pounds per horizontal linear foot (lb/ft) is given as
w (lb/ft) � w (psf ) � tributary width or spacing of raftersTL TL
� (78 psf )(4 ft) � 312 lb/ft
The horizontal thrust H is
w L (L /2) (312 lb/ft)(18 ft)(18 ft/2)TL 2 2H � � � 5616 lbh 9 ft
The collar or ceiling ties must be designed to resist this horizontal thrust.(b) L2 � 18 ft. The maximum shear force in the rafter is
L 18 ft2V � w � (312) � 2810 lb� �max TL 2 2
The maximum moment in the rafter is
2 2w (L ) (312)(18 ft)TL 2M � � � 12,700 ft-lb � 12.70 ft-kipsmax 8 8
or roof supported by the beam or girder, and is equal to the sum of one-half the distance to theadjacent beam on the right of the beam in question plus one-half the distance to the adjacentbeam on the left of the beam in question. Thus, the tributary width is given as
1 1– –TW � (distance to adjacent beam on the right) � (distance to adjacent beam on the left)2 2
The tributary area of a beam, girder, or column is the floor or roof area supported by the structuralmember. For beams and girders, the tributary area is the product of the span and the tributarywidth of the beam or girder. For columns, it is the plan area bounded by lines located at one-half the distance to the adjacent columns surrounding the column in question. It should be notedthat a column does not have a tributary width, only a tributary area.
2.4 LIVE LOADS
Any item not rigidly attached to a structure is usually classified as a live load. Live loads are short-term nonstationary gravity forces that can vary in magnitude and location. There are three maintypes of live loads: roof live load (Lr), snow load (S ), and floor live load (L). Rain load (R) isalso a roof live load but is rarely critical compared to roof live loads and snow load because ofthe pitched roofs in most wood buildings. These live loads are usually specified in the IBC [1]and the ASCE 7 load standards [2]. The magnitude of live loads depends on the occupancy anduse of the structure and on the tributary area of the structural element under consideration. Liveloads as specified in the IBC and ASCE 7 are given in units of pounds per square foot of thehorizontal projected plan area, but it should be noted that the codes also specify alternativeconcentrated live loads (in pounds), as we discuss later. The live loads specified in the codes areminimum values, and the owner of a building could decide to use higher live load values thanthose given in the code, although this will lead to a more expensive structure.
Roof Live Load
Roof live loads occur due to the weight of equipment and maintenance personnel during theservicing of a roof. The magnitude is a function of the roof slope and the tributary area of thestructural element under consideration. The larger the tributary area, the smaller the probabilitythat the entire tributary area (TA) will be loaded with the maximum roof live load, resulting ina smaller design roof live load. Similarly, the steeper the roof slope, the smaller the design rooflive load.

I N T R O D U C T I O N T O S T R U C T U R A L D E S I G N L O A D S � 31
EXAMPLE 2.2
Design Loads for Stair Stringers
Determine the total dead plus live load on a stair stringer assuming a dead load of 50 psf and a live load of 100psf. The plan and elevation of the stair are shown in Figure 2.7.
FIGURE 2.7 Stair plan and elevation.
Solution: The stair dead load D � 50 psf of the sloped area and the stair live load L � 100 psf of the horizontalplan area. The total uniform load on the stair in psf of horizontal plan area is given as
L1w � D � L psf of horizontal plan areaTL L 2
14.97 ft� (50 psf ) � 100 psf� �11.67 ft
� 164 psf of horizontal plan area
The tributary width for each stair stringer � 4 ft/2 � 2 ft. Thus, the total load in pounds per horizontal linearfoot (lb/ft) on each stair stringer is given as
w (lb/ft) � w (psf ) � tributary width or spacing of raftersTL TL
� (164 psf )(2 ft) � 328 lb/ft
The maximum shear force in the stair stringer is
L 11.67 ft2V � w � (328) � 1914 lb� �max TL 2 2
The maximum moment in the stair stringer is
2 2w (L ) (328)(11.67 ft)TL 2M � � � 5584 ft-lb � 5.6 ft-kipsmax 8 8
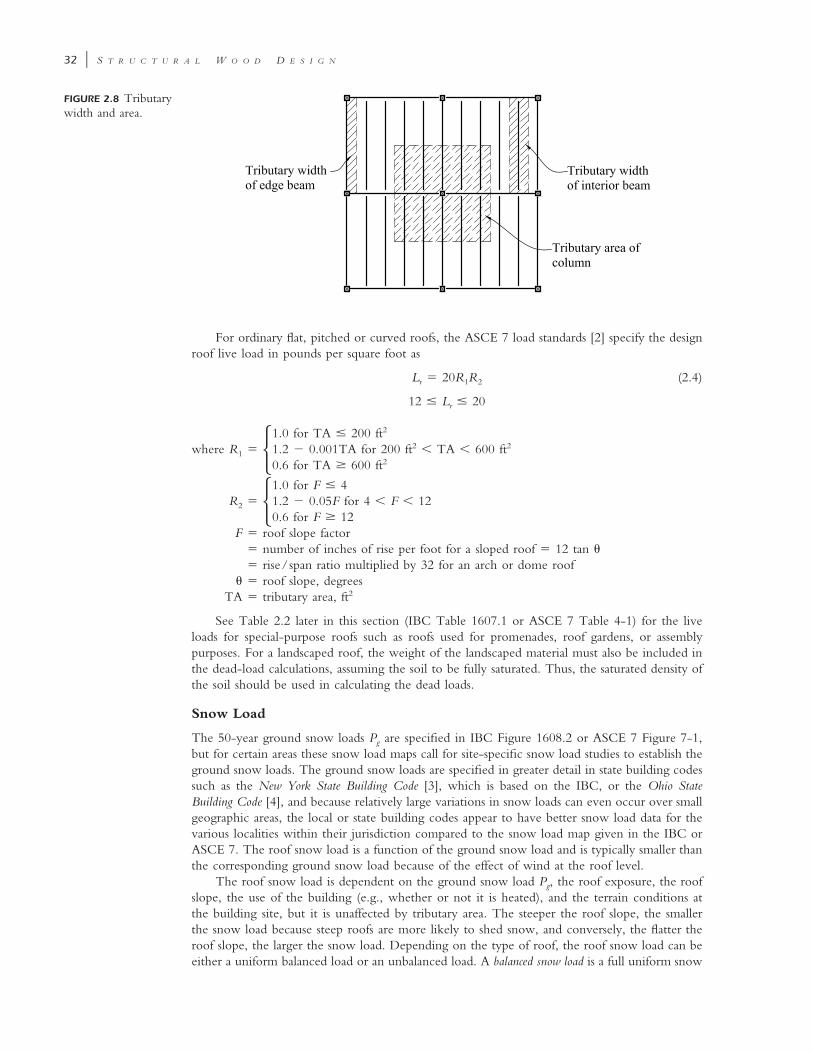
32 � S T R U C T U R A L W O O D D E S I G N
FIGURE 2.8 Tributarywidth and area.
For ordinary flat, pitched or curved roofs, the ASCE 7 load standards [2] specify the designroof live load in pounds per square foot as
L � 20R R (2.4)r 1 2
12 � L � 20r
where R1 �
21.0 for TA � 200 ft2 21.2 � 0.001TA for 200 ft � TA � 600 ft� 20.6 for TA � 600 ft
R2 �1.0 for F � 41.2 � 0.05F for 4 � F � 12�0.6 for F � 12
F � roof slope factor� number of inches of rise per foot for a sloped roof � 12 tan �� rise/span ratio multiplied by 32 for an arch or dome roof
� � roof slope, degreesTA � tributary area, ft2
See Table 2.2 later in this section (IBC Table 1607.1 or ASCE 7 Table 4-1) for the liveloads for special-purpose roofs such as roofs used for promenades, roof gardens, or assemblypurposes. For a landscaped roof, the weight of the landscaped material must also be included inthe dead-load calculations, assuming the soil to be fully saturated. Thus, the saturated density ofthe soil should be used in calculating the dead loads.
Snow Load
The 50-year ground snow loads Pg are specified in IBC Figure 1608.2 or ASCE 7 Figure 7-1,but for certain areas these snow load maps call for site-specific snow load studies to establish theground snow loads. The ground snow loads are specified in greater detail in state building codessuch as the New York State Building Code [3], which is based on the IBC, or the Ohio StateBuilding Code [4], and because relatively large variations in snow loads can even occur over smallgeographic areas, the local or state building codes appear to have better snow load data for thevarious localities within their jurisdiction compared to the snow load map given in the IBC orASCE 7. The roof snow load is a function of the ground snow load and is typically smaller thanthe corresponding ground snow load because of the effect of wind at the roof level.
The roof snow load is dependent on the ground snow load Pg, the roof exposure, the roofslope, the use of the building (e.g., whether or not it is heated), and the terrain conditions atthe building site, but it is unaffected by tributary area. The steeper the roof slope, the smallerthe snow load because steep roofs are more likely to shed snow, and conversely, the flatter theroof slope, the larger the snow load. Depending on the type of roof, the roof snow load can beeither a uniform balanced load or an unbalanced load. A balanced snow load is a full uniform snow

I N T R O D U C T I O N T O S T R U C T U R A L D E S I G N L O A D S � 33
EXAMPLE 2.3
Calculation of Tributary Widths and Areas
Determine the tributary widths and tributary areas of the joists, beams, girders, and columns in the framing planshown in Figure 2.9.
o.c.
o.c.
FIGURE 2.9 Roof and floor framing plan.
Solution: The solution is presented in Table 2.1.
TABLE 2.1 Tributary Widths and Areas of Joists, Beams, and Columns
Structural Member Tributary Width Tributary Area
Joist J1 24 in. 24 in.� � 24 in. � 2 ft
2 2(2 ft) � (16 ft) � 32 ft2
Joist J2 24 in. 24 in.� � 24 in. � 2 ft
2 2(2 ft) � (18 ft) � 36 ft2
Beam or girder G1 16 ft 18 ft� � 17 ft
2 2(17 ft) � (24 ft) � 408 ft2
Girder G2 16 ft 18 ft� � 17 ft
2 2(17 ft) � (18 ft) � 306 ft2
Girder G3 16 ft� 0.25 ft � 8.25 ft
2(8.25 ft) � (24 ft) � 198 ft2
Column C1 — 18 ft 16 ft 24 ft 18 ft 2� � � 357 ft� �� �2 2 2 2
Column C2 — 16 ft 24 ft 18 ft 2� 0.25 ft � � 173.3 ft� �� �2 2 2
Column C3 — 18 ft 24 ft 2� 0.25 ft � 0.25 ft � 113.4 ft� �� �2 2

34 � S T R U C T U R A L W O O D D E S I G N
EXAMPLE 2.4
Roof Load Calculations
For the roof plan shown in Example 2.3, assuming a roof dead load of 10 psf and an essentially flat roof withonly a roof slope of in. per foot for drainage, determine the following loads using the IBC load combinations.1–4(a) the uniform total load on joists J2 in lb/ft; (b) the uniform total load on girder G1 in lb/ft; (c) the totalaxial load on column C1 in lbs. Neglect the rain load R and assume that the snow load S is zero.
Solution: Since the snow and rain load are both zero, the roof live load Lr will be critical. With a roof slope ofin. per foot, the number of inches of rise per foot, F � � 0.25.1 1– –4 4
(a) Joist J2. The tributary width (TW) � 2 ft and the tributary area (TA) � 36 ft2 � 200 ft2. FromSection 2.4, we obtain R1 � 1.0 and R2 � 1.0. Using equation (2.4) gives the roof live load
L � (20)(1)(1) � 20 psfr
The total loads are calculated as follows:
w (psf ) � D � L � 10 � 20 � 30 psfTL r
w (lb/ft) � w (psf ) � TW � (30 psf )(2 ft) � 60 lb/ftTL TL
(b) Girder G1. The tributary width � 17 ft and the tributary area � 408 ft2. Thus, 200 � TA � 600,and from Section 2.4, we obtain R1 � 1.2 � (0.001)(408) � 0.792 and R2 � 1.0. Using equation(2.4) gives the roof live load
L � (20)(0.792)(1) � 16 psfr
The total loads are calculated as follows:
w (psf ) � D � L � 10 � 16 � 26 psfTL r
w (lb/ft) � w (psf ) � TW � (26 psf )(17 ft) � 442 lb/ftTL TL
(c) Column C1. The tributary area of column C1, TA � 357 ft2. Thus, 200 � TA � 600, and fromSection 2.4 we obtain R1 � 1.2 � (0.001)(357) � 0.843 and R2 � 1.0. Using equation (2.4) givesthe roof live load
L � (20)(0.843)(1) � 17 psfr
so
w (psf ) � D � L � 10 � 17 � 27 psfTL r
and the column axial load
2P � (27 psf )(357 ft ) � 9639 lb � 9.7 kips
load over an entire roof surface, and an unbalanced snow load is a nonuniform distribution of snowload over a roof surface. Only balanced snow loads are considered in this book. The variouspossible configurations of snow load are beyond the scope of this book, and the reader is referredto the ASCE 7 load specifications.
The design snow load on a sloped roof, Ps, is obtained using the ASCE 7 load specificationsand is given as
P � C P psf (2.5)s s f
and the flat roof snow load
P � 0.7C C IP psf (2.6)f e t g

I N T R O D U C T I O N T O S T R U C T U R A L D E S I G N L O A D S � 35
where Ce � exposure factor from ASCE 7 Table 7-2Ct � thermal factor from ASCE 7 Table 7-3Cs � roof slope factor from ASCE 7 Figure 7-2
I � importance factor from ASCE Table 7-4Pg � ground snow load from ASCE Figure 7-1 (or governing state code)
In calculating the roof slope factor Cs, the following should be noted:
1. Slippery surface values can be used only where the roof surface is free of obstruction andsufficient space is available below the eaves to accept all the sliding snow.
2. Examples of slippery surfaces include metal, slate, and glass, and bituminous, rubber, andplastic membranes with a smooth surface.
3. Membranes with embedded aggregates, asphalt shingles, and wood shingles must not beconsidered slippery.
Snow Drift and Sliding Snow LoadsSnow accumulation or drifting snow could occur on the lower roof where a high roof is
adjacent to a low roof or where there are large rooftop units or high parapets or other roofobstructions (Figure 2.12). These snow drift loads, which are caused by wind and are triangularin shape, must be superimposed on the uniform balanced roof snow loads. Sliding snow loadoccurs on low roofs where a high sloped roof is adjacent to a lower roof. The sliding snow load,which is uniform in shape, must be superimposed on the uniform balanced roof snow loads.However, the snow drift load and the sliding snow load must not be combined but must betreated separately, with the larger load used in the design of the roof members. The calculationof snow drift and sliding snow loads is beyond the scope of this book, and the reader is referredto the ASCE 7 load specifications.
The reader should refer to Sections 7-6 and 7-7 of ASCE 7 [2] for the calculation procedurefor unbalanced snow loads (due to wind), snow drifts on lower roofs adjacent to high roofs,snow drifts due to roof projections and roof top units, and sliding snow loads on lower roofsadjacent to sloped high roofs. The snow drift load and sliding snow load are superimposedseparately on the balanced snow load to determine the most critical snow load case, but thesnow drift loads must not be combined with sliding snow loads.
Floor Live Load
Floor live loads depend on the use and occupancy of the structure and the tributary area of thestructural member, and are usually available in IBC Table 1607.1 or ASCE 7 Table 4-1. Thesegravity forces are either uniform loads specified in units of pounds per square foot of horizontalplan area or concentrated loads specified in pounds. The uniform and concentrated live loadsare not to be applied simultaneously and, in design practice, the uniform loads govern most ofthe time, except in a few cases such as thin slabs, where the concentrated load may result in amore critical situation, due to the possibility of punching shear. Concentrated live loads alsogovern in the design of stair treads.
Examples of tabulated floor live loads are 40 psf for residential buildings, 50 psf for officespaces in office buildings, and 250 psf for heavy storage buildings. These tabulated live loadsconsist of transient and sustained load components. The sustained live load is the portion of thetotal live load that remains virtually permanent on the structure, such as furnishings, and is muchsmaller than the tabulated live loads. Typical sustained load values are 4 to 8 psf for residentialbuildings and 11 psf for office buildings [6]. For a more complete listing of the minimum liveloads recommended, the reader is referred to Table 2.2.
Floor Live-Load ReductionTo allow for the low probability that floor elements with large tributary areas will have the
entire tributary area loaded with the live load at the same time, the IBC and ASCE 7 loadspecifications allow for floor live loads to be reduced if certain conditions are met. Thus, thefloor live-load reduction factor accounts for the low probability that a structural member witha large tributary area will be fully loaded over the entire area at the same time.
The reduced design live load of a floor L in psf is given as

36 � S T R U C T U R A L W O O D D E S I G N
EXAMPLE 2.5
Roof Snow Load Calculation
The building shown in Figure 2.10 has sloped roof rafters (6�12 slope) spaced 4 ft 0 in. o.c. and is located inLowville, New York. The roof dead load is 10 psf of sloped area. Assume a fully exposed roof and terraincategory C, and use the ground snow load from the state snow map to obtain more accurate ground snow loadvalues. Calculate (a) the total uniform load in lb/ft on a horizontal plane using the IBC, and (b) the maximumshear and moment in the roof rafter.
FIGURE 2.10 Sloped roof.
Solution: (a) The roof slope � for this building is 26.6�.Roof live load Lr. From Section 2.4, the roof slope factor is obtained as F � 6; therefore, R2 � 1.2 �
(0.05)(6) � 0.9. Since the tributary area of the rafter � 4 ft � 18 ft � 72 ft2 � 200 ft2, R1 � 1.0, the roof liveload will be
L � 20R R � (20)(1.0)(0.9) � 18 psfr 1 2
Snow load. Using IBC Figure 1608.2 or ASCE 7 Figure 7-1, we find that Lowville, New York falls withinthe CS areas, where site-specific snow case studies are required. It is common practice in such cases to obtainthe ground snow load from the snow map in the local or state building code. From Figure 1608.2 of the NewYork State Building Code [3], the ground snow load Pg for Lowville, New York is found to be 85 psf.
Assuming a building with a warm roof that is fully exposed and a building site with terrain category C, weobtain the coefficients as follows:
exposure coefficient C � 0.9 (ASCE 7 Table 7-2)e
thermal factor C � 1.0 (ASCE 7 Table 7-3)t
importance factor I � 1.0 (ASCE Table 7-4)
slope factor C � 1.0 (ASCE Figure 7-2 with roof slope � � 26.6� and a warm roof )s
The flat roof snow load
P � 0.7C C IP � (0.7)(0.9)(1.0)(1.0)(85) � 54 psff e t g
Thus, the design roof snow load
P � C P � (1.0)(54) � 54 psfs s f
Therefore, the snow load S � 54 psf.The total load of the horizontal plan area is given as
L1w � D � (L or S or R) psf of horizontal plan areaTL rL 2

I N T R O D U C T I O N T O S T R U C T U R A L D E S I G N L O A D S � 37
Since the roof live load Lr (18 psf ) is less that the snow load S (54 psf ), the snow load is more critical and willbe used in calculating the total roof load.
20.12 ftw � (10 psf ) � 54 psf� �TL 18 ft
� 65 psf of horizontal plan area
The total load in pounds per horizontal linear foot is given as
w (lb/ft) � w (psf ) � tributary width or spacing of raftersTL TL
� (65 psf )(4 ft) � 260 lb/ft
The horizontal thrust is
w (L )(L /2) (260 lb/ft)(18 ft)(18 ft/2)TL 2 2H � � � 4680 lbh 9 ft
The collar or ceiling ties must be designed to resist this horizontal thrust (see Figure 2.11).
FIGURE 2.11 Free-body diagram of a sloped roof.
(b) L 2 � 18 ft. The maximum shear force in the rafter is
L 18 ft2V � w � (260) � 23409 lb � 2.34 kips� �max TL 2 2
The maximum moment in the rafter is
2 2w (L ) (260)(18 ft)TL 2M � � � 10,530 ft-lb � 10.53 ft-kipsmax 8 8
L � (2.7)15
L 0.25 �� �0 �K ALL T
� 0.50L 0 for members supporting one floor (e.g., slabs, beams, and girders)� 0.40L 0 for members supporting two or more floors (e.g., columns)
where L 0 � unreduced design live load from Table 2.2 (IBC Table 1607.1 or ASCE 7 Table4-1)
KLL � live-load element factor (see Table 4-2 of Ref. 2)� 4 (interior and exterior columns without cantilever slabs)� 3 (edge columns with cantilever slabs)

38 � S T R U C T U R A L W O O D D E S I G N
FIGURE 2.12 Snowdrift and sliding snowloads.
TABLE 2.2 Minimum Uniformly Distributed and Concentrated Floor Live Loads
OccupancyUniform Load
(psf )Concentrated Load
(lb)
Apartments, hotels, and multifamily housesPrivate rooms and corridors serving themPublic rooms and corridors serving them
40100
——
BalconiesExteriorOne- and two-family residences only,
and not exceeding 100 ft2
10060
——
Dining rooms and restaurants 100 —
Office buildingsLobbies and first-floor corridorsOfficesCorridors above first floor
1005080
200020002000
Residential (one- and two-family dwellings) 40 —
RoofsOrdinary flat, pitched, and curved roofsPromenadesGardens or assembly
2060
100
———
SchoolsClassroomsCorridors above first floorFirst-floor corridors
4080
100
200020002000
Stairs and exitwaysOne- and two-family residences only
10040
——
StorageLightHeavy
125250
——
StoresRetail
First floorUpper floors
Wholesale
10075
125
100010001000
Source: Adapted from Ref 1, Table 1607.1

I N T R O D U C T I O N T O S T R U C T U R A L D E S I G N L O A D S � 39
� 2 (corner columns with cantilever slabs, edge beams without cantilever slabs, in-terior beams)
� 1 (all other conditions)AT � summation of the floor tributary area in ft2 supported by the member, excluding
the roof area
• For beams and girders (including continuous beams or girders), AT is the tributary widthof the beam or girder multiplied by its center-to-center span between supports.
• For one-way slabs, AT must be less than or equal to 1.5(span of one-way slab)2.• For a member supporting more than one floor area in multistory buildings, AT will be
the summation of all the applicable floor areas supported by that member.
The IBC and ASCE 7 load specifications do not permit floor live-load reductions for floorssatisfying any one of the following conditions:
• KLLAT � 400 ft2.• Floor live load L 0 � 100 psf.• Floors with occupancies used for assembly purposes, such as auditoriums, stadiums, and
passenger car garages, because of the high probability of overloading in such occupanciesduring an emergency.
• For passenger car garage floors, the live load is allowed to be reduced by 20% for mem-bers supporting two or more floors.
The following should be noted regarding the tributary area AT used in calculating thereduced floor live load:
1. Beams are usually supported by girders, which in turn are supported by columns, asindicated in our previous discussions on load paths. The tributary area AT for beams willusually be smaller than those for girders, and thus beams will have less floor live-loadreduction than for girders. The question arises as to which AT to use for calculating theloads on the girders.
2. For the design of the beams, use the AT value of the beam to calculate the reduced liveload that is used to calculate the moments, shears, and reactions. These load effects areused for the design of the beam and the beam–girder or beam–column connections.
3. For the girders, recalculate the beam reactions using the AT value of the girder. Thesesmaller beam reactions are used for the design of girders only.
4. For columns, AT is the summation of the tributary areas of all the floors with reducible liveloads above the level at which the column load is being determined, and it excludes theroof areas.
2.5 DEFLECTION CRITERIA
The limits on deflections due to gravity loads are intended to ensure user comfort and to preventexcessive cracking of plaster ceilings and architectural partitions. These deflection limits are usu-ally specified in terms of the joist, beam, or girder span, and the deflections are calculated basedon elastic analysis of the structural member. The maximum allowable deflections recommendedin IBC Table 1604.3 [1] are as follows:
LMaximum allowable deflection due to live load � �LL 360
LMaximum allowable deflection due to total dead plus live load � �kD�LL 240
where k � creep factor� 0.5 for seasoned lumber used in dry service conditions� 1.0 for unseasoned or green lumber or seasoned lumber used in wet service condi-
tions

40 � S T R U C T U R A L W O O D D E S I G N
EXAMPLE 2.6
Column Load Calculation
A three-story building has columns spaced at 20 ft in both orthogonal directions and is subjected to the roofand floor loads shown below. Using a column load summation table, calculate the cumulative axial loads on atypical interior column with and without live-load reduction. Assume a roof slope of in. per foot for1–4drainage.
Roof loads:
Dead load D � 25 psfroof
Snow load S � 35 psf
Second- and third-floor loads:
Dead load D � 50 psffloor
Floor live load L � 40 psf
Solution: At each level, the tributary area supported by a typical interior column is (20 ft)(20 ft) � 400 ft.2
Roof live load LT. From Section 2.4, the roof slope factor is obtained as F � � 0.25. Therefore, R2 � 1.0.1–4Since the tributary area of the column � 400 ft2, R1 � 1.2 � (0.001)(400) � 0.8. The roof live load will be
L � 20R R � (20)(0.8)(1.0) � 16 psf � 20 psfT 1 2
The reduced or design floor live loads for the second and third floors are calculated using Table 2.3.
TABLE 2.3 Reduced or Design Floor Live-Load Calculations
MemberLevels
Supported
AT
Summationof FloorTributary
Area KLL
UnreducedFloor LiveLoad, L 0
(psf )
Live-Load Reduction
Factor, 0.25 �15
�K ALL T
DesignFloor LiveLoad, L
Thirdfloorcolumn(i.e.,columnbelowroof )
Roof only Floor live-loadreductionnotapplicableto roofs!
— — — 35 psf (snowload)
Second-floorcolumn(i.e.,columnbelowthirdfloor)
1 floor �roof
1 floor �400 ft2 �400 ft2
4KLLAT �
1600 ft2
� 400 ft2;live loadreductionallowed
400.25 �
15� 0.625
�(4)(400)
(0.625)(40)� 25 psf� 0.50L0
� 20 psf
Ground orfirst-floorcolumn(i.e.,columnbelowsecondfloor)
2 floors �roof
2 floors �400 ft2 �800 ft2
4KLLAT �
3200 ft2
� 400 ft2;thereforelive loadreductionallowed
400.25 �
15� 0.52
�(4)(800)
(0.52)(40) �21 psf �0.40L0 �16 psf
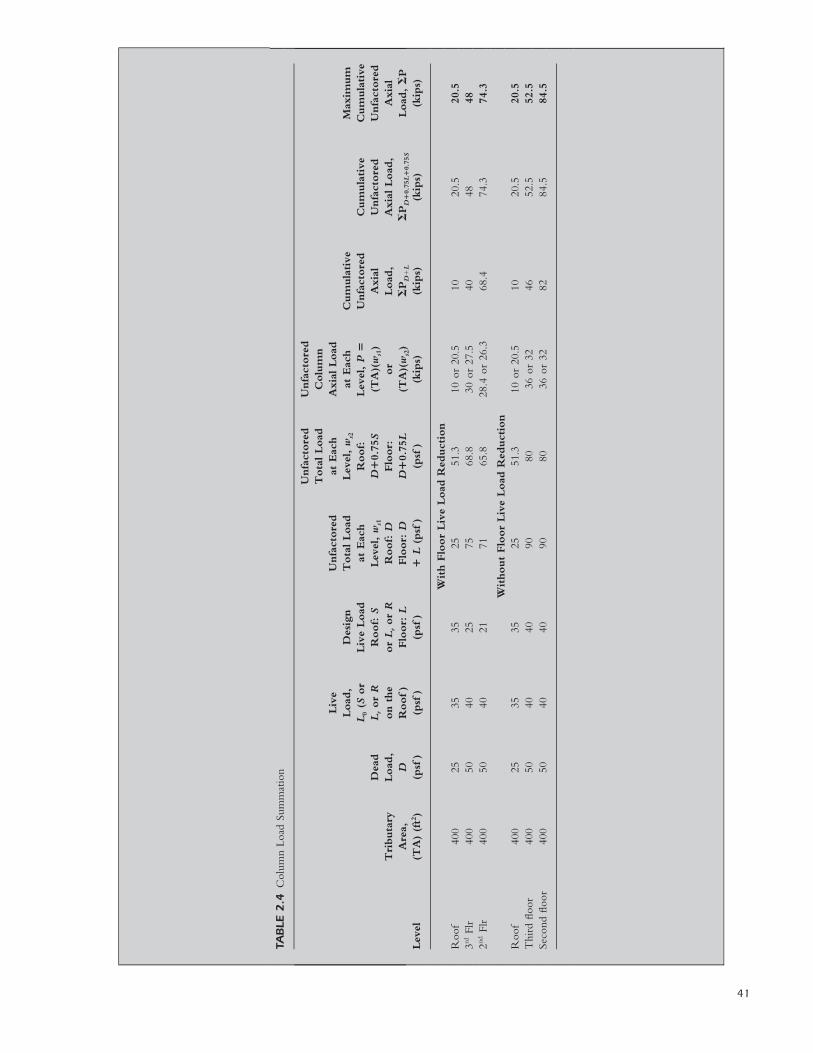
41
TAB
LE2
.4C
olum
nLo
adSu
mm
atio
n
Lev
el
Tri
buta
ryA
rea,
(TA
)(f
t2 )
Dea
dLoad
,D
(psf
)
Liv
eLoad
,L
0(S
or
Lror
Ron
the
Roof)
(psf
)
Des
ign
Liv
eLoad
Roof:
Sor
Lror
RFlo
or:
L(p
sf)
Unfa
ctore
dT
ota
lLoad
atEac
hLev
el,
ws1
Roof:
DFlo
or:
D�
L(p
sf)
Unfa
ctore
dT
ota
lLoad
atEac
hLev
el,
ws2
Roof:
D�
0.75
SFlo
or:
D�
0.75
L(p
sf)
Unfa
ctore
dC
olu
mn
Axi
alLoad
atEac
hLev
el,
P�
(TA
)(w
s1)
or
(TA
)(w
s2)
(kip
s)
Cum
ula
tive
Unfa
ctore
dA
xial
Load
,�
PD
�L
(kip
s)
Cum
ula
tive
Unfa
ctore
dA
xial
Load
,�
PD
�0.
75L
�0.
75S
(kip
s)
Max
imum
Cum
ula
tive
Unfa
ctore
dA
xial
Load
,�
P(k
ips)
With
Flo
or
Liv
eLoad
Red
uct
ion
Roo
f40
025
3535
2551
.310
or20
.510
20.5
20.5
3rdFl
r40
050
4025
7568
.830
or27
.540
4848
2ndFl
r40
050
4021
7165
.828
.4or
26.3
68.4
74.3
74.3
Without
Flo
or
Liv
eLoad
Red
uct
ion
Roo
f40
025
3535
2551
.310
or20
.510
20.5
20.5
Thi
rdflo
or40
050
4040
9080
36or
3246
52.5
52.5
Seco
ndflo
or40
050
4040
9080
36or
3282
84.5
84.5

42 � S T R U C T U R A L W O O D D E S I G N
For this building, all other loads except D, S, Lr and L are zero. Thus,
W � H � T� F � R � E � 0
Substituting these in the ASD load combinations in Section 2.1, and noting that the snow load being greaterthan the roof live load and thus becomes the design live load for the roof, yields the following modified loadcombinations for calculating the unfactored column axial load for this building:
1: D2: D � L3: D � S4: D � 0.75L � 0.75S5: D6: D � 0.75L � 0.75S7: 0.6D8: 0.6D
Therefore, the two most critical load combinations for calculating the column axial loads are load combination2 (D�L) and load combinations 4 or 6 (D�0.75L�0.75S). By inspection, load combination 3 is not critical,and using the applicable ASD load combinations, D�L and D�0.75L�0.75S, the unfactored column axialloads are calculated using the column load summation table (Table 2.4).
Therefore, the ground floor column will be designed for a cumulative axial compression load of 74.3 kips,the second floor column for a load of 48 kips, and the third floor column for a compression load of 20.5 kips.The corresponding values without floor live load reduction are 84.5 kips, 52.5 kips, and 20.5 kips, respectively.For the ground floor column, there is only a 12% reduction in axial load when live load reduction isconsidered. Thus, the effect of floor live load reduction on columns and column footings is not as critical forlow rise buildings as it is for high rise buildings.
D � dead loadLL � live load (i.e., floor live load, roof live load, snow load, or rain load)L � span of joist, beam or girder
For members that support masonry wall or glazing, the allowable total load deflection shouldbe limited to L/600 or 3⁄8 in., whichever is smaller, to reduce the likelihood of cracking of themasonry wall or glazing. For prefabricated members it is common to camber the beams to helpcontrol the total deflection. The amount of the camber is usually some percentage of the deadload to prevent overcambering.
2.6 LATERAL LOADS
The two main types of lateral loads that act on wood buildings are wind and seismic or earth-quake loads. These loads are both random and dynamic in nature, but simplified proceduresusing equivalent static load approaches have been established in the IBC and ASCE 7 for cal-culating the total lateral forces acting on a building due to these loads. The wind loads specifiedin the ASCE 7 load specifications have a 50-year recurrence interval, and the seismic loads havea 2500-year recurrence interval. For any building design, both seismic and wind loads have tobe checked to determine which one governs. It should be noted that even in cases where theseismic load controls the overall design of the lateral force–resisting system in a building, thewind load may still be critical for the the uplift forces on the roof. We present two examples inthis section to illustrate the calculation of wind and seismic lateral forces using the simplifiedcalculation procedures of the ASCE 7 load specifications [2].

I N T R O D U C T I O N T O S T R U C T U R A L D E S I G N L O A D S � 43
Wind Load
There are two types of systems in a building structure for which wind loads are calculated: themain wind force–resisting system (MWFRS) and the components and cladding (C&C). TheMWFRS transfers safely to the ground the overall building lateral wind loads from the variouslevels of the building. Examples are shear walls, braced frames, moment frames, and roof andfloor diaphragms, and these elements are usually parallel to the direction of the wind force.
The components and cladding (C&C) are members that are loaded as individual compo-nents, with the wind load acting perpendicular to these elements. Examples include walls, clad-ding, roofs, uplift force on a column, and a roof deck fastener. The wind pressures on C&C areusually higher than for the MWFRS because of local spikes in the wind pressures over smallareas in components and cladding. The wind pressure is a function of the effective wind areaAe, which is given in the IBC as
2(span of member)A � (span of member)(tributary width) � (2.8)e 3
For cladding and deck fasteners, the effective wind area Ae must not exceed the area that istributary to each fastener. In calculating wind pressures, positive pressures are indicated by aforce ‘‘pushing’’ into the wall or roof surface, and negative pressures are shown ‘‘pulling’’ awayfrom the wall or roof surface. The minimum design wind pressure for the MWFRS and thecomponents and cladding (C&C) is 10 psf (IBC Section 1609.1.2).
Wind Load CalculationThe three methods for determining the design wind loads on buildings and other structures
presented in the ASCE 7 load specifications are as follows:
1. Simplified method (method 1): uses projected areas with the net horizontal and verticalwind pressures on the exterior projected area of the building. The wind pressures areobtained from ASCE 7 Figure 6-2 for the MWFRS and ASCE Figure 6-3 for thecomponents and cladding. The simplified procedure is applicable only if all of thefollowing conditions are satisfied:• Simple diaphragm buildings (i.e., wind load is transferred through the roof and floor
diaphragms to the vertical main wind force–resisting system• Enclosed buildings (i.e., no large opening on any side of the building)• Mean roof height of building � 60 ft• Symmetrical buildings• Buildings with mean roof height � least horizontal dimension of building• Buildings without expansion joints• If the building has moment frames, and roof slope � 30�
2. Analytical method (method 2): wind pressures act perpendicular to the exterior wall androof surfaces.• The analytical method is applicable to buildings with a regular shape (see ASCE 7
Section 6-2) that are not subjected to unusual wind forces, such as across-windloading, vortex shedding, galloping, or flutter.
• In the analytical method positive pressures are applied to the windward walls, andnegative pressures or suction is applied to the leeward walls.
3. Wind tunnel method (method 3)• If method 1 or 2 cannot be used, the wind tunnel procedure must be used.• The wind tunnel procedure is used for very tall and wind-sensitive buildings, and
buildings with height/ least plan dimension greater than 5.0.
The simplified procedure (method 1) is used in this book.

44 � S T R U C T U R A L W O O D D E S I G N
FIGURE 2.13 Wind pressure diagram for a main wind force–resisting system. (Adapted from Ref. 5,Figure 1609.6.2.1.)
Simplified Wind-Load Calculation Method (Method 1 for Low-Rise Buildings)In the simplified method, the wind forces are applied perpendicular to the vertical projected
area (VPA) and the horizontal projected area (HPA) of the building. The wind pressure diagramfor the MWFRS is shown in Figure 2.13. The horizontal pressures represent the combinedwindward and leeward pressures, with the internal pressures canceling out; the vertical pressuresinclude the combined effect of the external and internal pressures. The different wind pressurezones in Figure 2.13 are defined in Table 2.5. Where zone E or G falls on a roof overhang, usethe windward roof overhang wind pressures from ASCE 7 Figure 6-2.
The simplified procedure (method 1) for calculating wind loads involves the following steps:
1. Determine the applicable wind speed for the building location from ASCE 7 Figure 6-1.2. Calculate the mean roof height and determine the wind exposure category.3. Determine the applicable horizontal and vertical wind pressures as a function of the wind
speed, roof slope, zones, and effective wind area from ASCE 7 Figure 6-2 for the mainwind force–resisting system and ASCE 7 Figure 6-3 for components and cladding. Thetabulated values are based on an assumed exposure category of B, a mean roof height of30 ft, and an importance factor of 1.0. These tabulated wind pressures are to be appliedto the horizontal projected area (HPA) and the vertical projected area (VPA) of the build-ing. The horizontal wind pressure on the vertical projected area of the building is thesum of the external windward and external leeward pressures since the internal pressurescancel out. The resulting wind pressures are applied to one side of the building for eachwind direction. Note that the wind pressures on roof overhangs are much higher than atother locations on the roof because of the external wind pressures acting on both thebottom and top exposed surfaces of the overhang.
4. Obtain the design wind pressures (Ps30 for MWFRS and Pnet30 for C&C), as a function ofthe tabulated wind pressures obtained in step 3, the applicable height and exposure adjust-ment factor (from ASCE 7-2 Figures 6-2 or 6-3), the topography factor Kzt (ASCE-7Section 6.5.7), and the importance factor Iw from IBC table 1604.5 or ASCE-7 Tables1-1 and 6-1. (For site conditions with flat topography, Kzt � 1.0)
P � � K I P � 10 psfs30 zt w s30
P � � K I P � 10 psfnet30 zt w net30
5. Apply the calculated wind pressures to the building as shown in ASCE 7 Figure 6-2 forMWFRS. Note that for MWFRS, the end zone width is equal to 2a.

I N T R O D U C T I O N T O S T R U C T U R A L D E S I G N L O A D S � 45
TABLE 2.5 Definition of Wind Pressure Zones, MWFRS
Zone Definition
A End zone horizontal wind pressure on the vertical projected wall surface
B End zone horizontal wind pressure on the vertical projected roof surface
C Interior zone horizontal wind pressure on the vertical projected wall surface
D Interior zone horizontal wind pressure on the vertical projected roof surface
E End zone vertical wind pressure on the windward side of the horizontal projected roof surface
F End zone vertical wind pressure on the leeward side of the horizontal projected roof surface
G Interior zone vertical wind pressure on the windward side of the horizontal projected roof surface
H Interior zone vertical wind pressure on the leeward side of the horizontal projected roof surface
EOH End zone vertical wind pressure on the windward side of the horizontal projected roof overhang surface
GOH Interior zone vertical wind pressure on the windward side of the horizontal projected roof overhang surface
6. Apply the calculated wind pressures to the building walls and roof as shown in ASCE 7Figure 6-3 for components and cladding. Note that for C&C, the end zone width isequal to a, where
a � 0.1 � least horizontal dimension of building
� 0.4 � mean roof height of the building
� 0.04 � least horizontal dimension of building
� 3 ftFor a roof slope of less than 10�, the eave height should be used in lieu of the mean roofheight for calculating the edge zone width 2a.
Sample calculations of wind loads for the MWFRS using the simplified method (method1) is presented in Example 2.7, and the calculation of the wind load on C&C is shown inChapter 9. The more rigorous analytical method (method 2) is beyond the scope of this book.
Seismic Load
Earth’s crust consists of several tectonic plates, many of which have fault lines, especially wherethe various tectonic plates interface with each other. When there is slippage along these faultlines, the energy generated creates vibrations that travel to Earth’s surface and create an earth-quake or seismic event. The effect of an earthquake on a structure depends on the location ofthat structure with regard to the point, the epicenter, at which the earthquake originated. Thesupporting soil for a structure plays a significant role in the magnitude of the seismic accelerationsto which the structure will be subjected. The lateral force on the structure due to an earthquakeis proportional to the mass and acceleration of the structure, in accordance with Newton’s secondlaw. Thus, F � ma � W (a/g), where W is the weight of the structure and any componentsthat will be accelerated at the same rate as the structure and a/g is the acceleration coefficient.The IBC and ASCE 7 equations used for calculating seismic lateral forces were derived fromthis basic equation.
The magnitude of the seismic loads acting on a building structure is a function of the typeof lateral load–resisting system used in the building, the weight of the building, and the soilconditions at the building site. A seismic load calculation example for a wood building is pre-sented in Example 2.8. The solution presented here will be in accordance with ASCE 7-05Section 12.14, which is a simplified analysis procedure. This procedure is permitted for wood-framed structures in seismic use group or occupancy category I that are three stories or less inheight (ASCE 7-05 Section 12-14.1.1), which is the category into which most wood structuresfall. In the calculations, the building is assumed to be fixed at the base. The more in-depthequivalent lateral force analysis procedure presented in ASCE 7 is also permitted but is beyondthe scope of this book.

46 � S T R U C T U R A L W O O D D E S I G N
EXAMPLE 2.7
Simplified Wind Load Calculation for MWFRS
A one-story wood building 50 � 75 ft in plan is shown in Figure 2.14. The truss bearing (or roof datum)elevation is at 15 ft and the truss ridge is 23 ft 4 in. above the ground-floor level. Assume that the building isenclosed and located in Rochester, New York on a site with a category C exposure. Determine the totalhorizontal wind force on the main wind force–resisting system (MWFRS) in both the transverse andlongitudinal directions and the gross and net vertical wind uplift pressures on the roof (MWFRS) in both thetransverse and longitudinal directions assuming a roof dead load of 15 psf.
FIGURE 2.14 Building plan and elevation, wind load example.
Solution:
1. Determine the applicable 3-second gust wind speed for the building location from ASCE 7 Figure 6-1. ForRochester, New York, the wind speed is 90 mph.
2. The wind exposure category is C by assumption.3. Determine the applicable horizontal and vertical wind pressures as a function of the wind speed, roof slope,
effective wind area, and wind load direction for MWFRS and C&C from ASCE 7 Figure 6-2 forMWFRS and ASCE 7 Figure 6-3 for C&C:
23.33 ft � 15 ft�1roof slope � � tan � 18.43�
50 ft/2
The mean roof height � (15 ft � 23.33 ft)/2 � 19.2 ft.
MWFRSFor the building with a roof slope � of 18.43� and a wind speed of 90 mph, the tabulated horizontal windpressures on the vertical projected area of the building are obtained by linear interpolation between windpressure values for � of 0� and 20� from ASCE 7 Figure 6-2 as follows.
Horizontal wind pressures on MWFRS—transverse wind:
18.43� � 0�End zone pressure on wall (zone A) � 12.8 psf � (17.8 psf � 12.8 psf )� �20�
� 17.4 psf
18.43� � 0�End zone pressure on roof (zone B) � �6.7 psf � [(�4.7 psf ) � (�6.7 psf )]� �20�
� �4.9 psf � 0 psf (see footnote 7 in ASCE 7 Figure 6-2)

I N T R O D U C T I O N T O S T R U C T U R A L D E S I G N L O A D S � 47
18.43� � 0�Interior zone pressure on wall (zone C) � 8.5 psf � (11.9 psf � 8.5 psf )� �20�
� 11.6 psf
18.43� � 0�Interior zone pressure on roof (zone D) � �4.0 psf � [(�2.6 psf ) � (�4.0 psf )] � �2.7 psf� �20�
� 0 psf (see footnote 7 in ASCE 7 Figure 6-2)
Horizontal wind pressures on MWFRS—longitudinal wind:
End zone pressure on wall (zone A) � 12.8 psf
Interior zone pressure on wall (zone C) � 8.5 psf
If the horizontal wind pressure on roofs in zones B and D (see Figure 2.13) is less than zero, zero horizontalwind pressure is used for these zones. In the longitudinal wind direction, for roofs with sloped rafters but nohip rafters, the triangular area between the roof datum level and the ridge is a wall surface, so the horizontalwall pressures for zones A and C apply on this surface.
The resulting wind pressure on the MWFRS is not symmetrical, due to the nonsymmetrical location of theend zones and the higher wind pressures acting on the end zones in ASCE 7 Figure 6-2. In this book, weadopt a simplified approach to finding the wind force, using the average horizontal wind pressure. However,the asymmetrical nature of the wind loading on the building and the resulting torsional effect of such loadingshould also be investigated. For this building, the tabulated vertical wind pressures on the horizontal projectedarea of the building are obtained by linear interpolation between wind pressure values for � of 0� and 20� fromthe tables in ASCE 7 Figure 6-2 as follows:
Vertical wind pressures on roof—transverse wind:
End zone on windward roof (zone E) � �15.4 psf
End zone on leeward roof (zone F) � �10.6 psf
Interior zone on windward roof (zone G) � �10.7 psf
Interior zone on leeward roof (zone H) � �8.0 psf
Vertical wind pressures on roof—longitudinal wind:
End zone on windward roof (zone E) � �15.4 psf
End zone on leeward roof (zone F) � �8.8 psf
Interior zone on windward roof (zone G) � �10.7 psf
Interior zone on leeward roof (zone H) � �6.8 psf
The wind pressures are summarized in Figure 2.15. For the MWFRS, the end zone width � 2a according toASCE 7 Figure 6-2, where
a � 0.1 � least horizontal dimension of building� 0.4 � mean roof height of the building and� 0.04 � least horizontal dimension of building� 3 ft

48 � S T R U C T U R A L W O O D D E S I G N
FIGURE 2.15 Summary of wind pressures. (Adapted from Ref. 5, Figure 1609.6.2.1.)
4. Multiply the tabulated wind pressures obtained in step 3 by the applicable height and exposure coefficientsin ASCE 7 Figure 6-2 and the importance factor from ASCE 7 Table 6-1. Tabulate the MWFRS windloads. For a category I building, importance factor Iw � 1.0 (IBC Table 1604.5).
Longitudinal wind. The end zone width is 2a according to ASCE 7 Figure 6-2, where
a � (0.1)(50 ft) � 5 ft (governs)
15 ft � 23.33 ft� (0.4) � 7.7 ft� �2
� (0.04)(50 ft) � 2 ft
� 3 ft
Therefore, the edge zone � 2a � (2)(5 ft) � 10 ft.For simplicity, as discussed previously, we use the average horizontal wind pressure acting on the entire
building, calculated as follows:
average horizontal wind pressure in the longitudinal direction, q(edge zone)(edge zone pressures) � (total width of building � edge zone)(interior zone pressures)
�total width of building
where the total width of the building perpendicular to the longitudinal wind is 50 ft.
(10 ft)(12.8 psf ) � (50 ft � 10 ft)(8.5 psf )q (wall) � � 9.36 psfaverage 50 ft
q (roof ) � 0 psf (per footnote 7 in ASCE 7 Figure 6-2)average

I N T R O D U C T I O N T O S T R U C T U R A L D E S I G N L O A D S � 49
Using exposure C as given (refer to ASCE 7-05 Section 6.5.6.3 for a description of the various exposurecategories), the horizontal forces on the MWFRS are as given in Table 2.6. The total unfactored wind load onthe building at the roof datum level is calculated as
TABLE 2.6 Longitudinal Wind Load, MWFRS
LevelHeight
(ft)
Exposure/HeightCoefficient atMean Roof
Height, � [ASCE7 Figure 6-2]
AverageHorizontal WindPressure, q (psf )
Design Horizontal WindPressure, �Iwq
Total UnfactoredWind Load onthe Building at
Each Level (kips)
Ridge 23.33 1.29 9.36 (1.29)(1.0)(9.36) � 12.1 psf —
Roof datum(i.e., at trussbearing elevation)
15 1.29 9.36 (1.29)(1.0)(9.36) � 12.1 psf 7.1
Base shear 7.1
Note: Mean roof height � 19.2 ft � 20 ft.
1 15 ft(12.1 psf )(23.33 ft � 15 ft) � 12.1 psf (50 ft) � 7058 lb � 7.1 kips�� � � ��2 2
[The term in the equation accounts for the triangular shape of the vertical projected wall area above the roof1–2datum (or truss bearing) level.]
Transverse wind. The end zone width is 2a, where
a � (0.1)(50 ft) � 5 ft (governs)15 ft � 23.33 ft
� (0.4) � 7.7 ft� �2� (0.04)(50 ft) � 2 ft� 3 ft
Therefore, the edge zone � 2a � (2)(5 ft) � 10 ft.For simplicity, as discussed previously, we use the average horizontal wind pressure acting on the entire
building, calculated as follows:
average horizontal wind pressure in the transverse direction, q(edge zone)(edge zone pressures) � (total width of building � edge zone)(interior zone pressures)
�total width of building
where the total width of the building perpendicular to the transverse wind is 75 ft.
(10 ft)(17.4 psf ) � (75 ft � 10 ft)(11.6 psf )q (wall) � � 12.4 psfaverage 75 ftq (roof ) � 0 psf (per footnote 7 in ASCE 7 Figure 6-2)average
Using exposure C as given (refer to ASCE 7-05 Section 6.5.6.3 for the description of the different exposurecategories), the horizontal wind forces on the MWFRS are as given in Table 2.7. The total unfactored windload on the building at the roof datum level is calculated as
15 ft(0 psf )(23.33 ft � 15 ft) � (16 psf ) (75 ft) � 9000 lb � 9.0 kips� � ��2
Note that for the transverse wind direction, the vertical projected area of the roof surface above the roof datum(or truss bearing) level is rectangular in area.
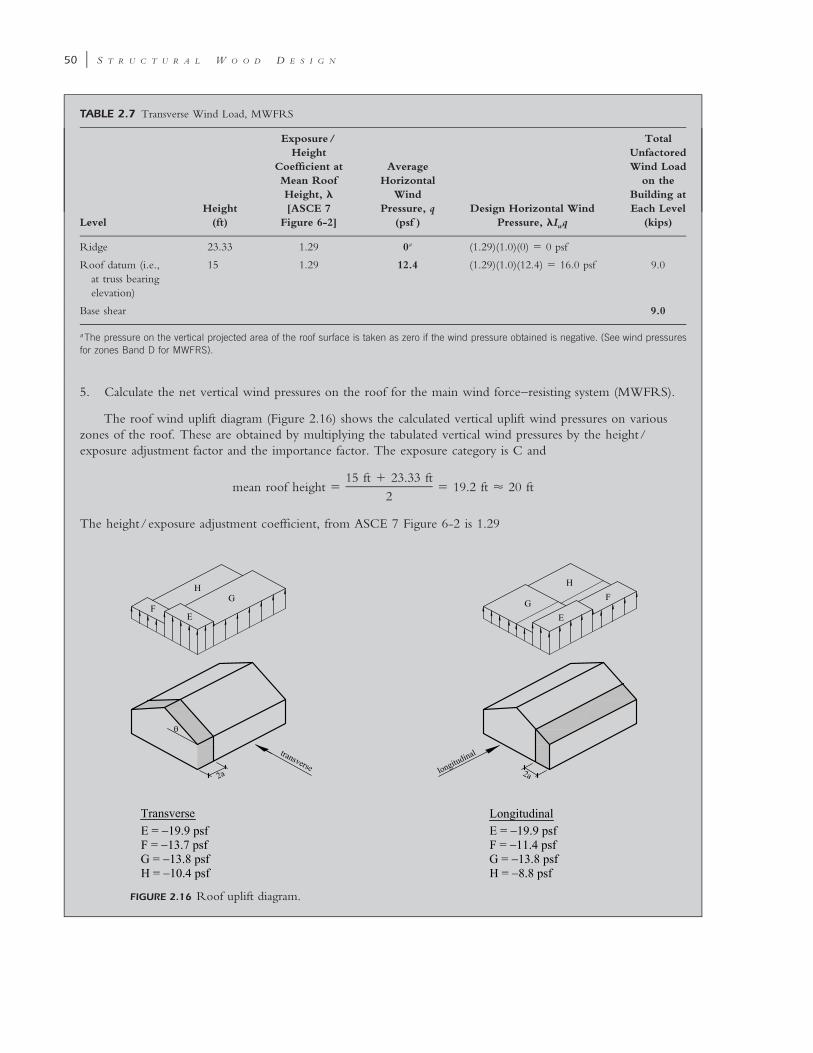
50 � S T R U C T U R A L W O O D D E S I G N
TABLE 2.7 Transverse Wind Load, MWFRS
LevelHeight
(ft)
Exposure/Height
Coefficient atMean RoofHeight, �[ASCE 7
Figure 6-2]
AverageHorizontal
WindPressure, q
(psf )Design Horizontal Wind
Pressure, �Iwq
TotalUnfactoredWind Load
on theBuilding atEach Level
(kips)
Ridge 23.33 1.29 0a (1.29)(1.0)(0) � 0 psf
Roof datum (i.e.,at truss bearingelevation)
15 1.29 12.4 (1.29)(1.0)(12.4) � 16.0 psf 9.0
Base shear 9.0
a The pressure on the vertical projected area of the roof surface is taken as zero if the wind pressure obtained is negative. (See wind pressuresfor zones Band D for MWFRS).
5. Calculate the net vertical wind pressures on the roof for the main wind force–resisting system (MWFRS).
The roof wind uplift diagram (Figure 2.16) shows the calculated vertical uplift wind pressures on variouszones of the roof. These are obtained by multiplying the tabulated vertical wind pressures by the height/exposure adjustment factor and the importance factor. The exposure category is C and
15 ft � 23.33 ftmean roof height � � 19.2 ft � 20 ft
2
The height/exposure adjustment coefficient, from ASCE 7 Figure 6-2 is 1.29
FIGURE 2.16 Roof uplift diagram.

I N T R O D U C T I O N T O S T R U C T U R A L D E S I G N L O A D S � 51
The importance factor Iw � 1.0.Vertical wind pressures on roof—longitudinal wind:
End zone on windward roof (zone E) � (1.29)(1.0)(�15.4 psf ) � �19.9 psf
End zone on leeward roof (zone F) � (1.29)(1.0)(�8.8 psf ) � �11.4 psf
Interior zone on windward roof (zone G) � (1.29)(1.0)(�10.7 psf ) � �13.8 psf
Interior zone on leeward roof (zone H) � (1.29)(1.0)(�6.8 psf ) � �8.8 psf
Vertical wind pressures on roof—transverse wind:
End zone on windward roof (zone E) � (1.29)(1.0)(�15.4 psf ) � �19.9 psf
End zone on leeward roof (zone F) � (1.29)(1.0)(�10.6 psf ) � �13.7 psf
Interior zone on windward roof (zone G) � (1.29)(1.0)(�10.7 psf ) � �13.8 psf
Interior zone on leeward roof (zone H) � (1.29)(1.0)(�8.0 psf ) � �10.4 psf
(Negative vertical wind pressures indicate uplift or suction on the roof; and positive values indicate downwardpressure on the roof.) Using the given roof dead load of 15 psf, the net wind uplift pressures on the roof arecalculated using the controlling IBC load combination 16–14 (i.e., 0.6D � W ) from Section 2.1 as shownbelow.
Net vertical wind pressures on roof—longitudinal wind:
End zone on windward roof (zone E) � (0.6)(15 psf ) � 19.9 psf � �10.9 psf
End zone on leeward roof (zone F) � (0.6)(15 psf ) � 11.4 psf � �2.4 psf
Interior zone on windward roof (zone G) � (0.6)(15 psf ) � 13.8 psf � �4.8 psf
Interior zone on leeward roof (zone H) � (0.6)(15 psf ) � 8.8 psf � � 0.2 psf
Net vertical wind pressures on roof—transverse wind:
End zone on windward roof (zone E) � (0.6)(15 psf ) � 19.9 psf � �10.9 psf
End zone on leeward roof (zone F) � (0.6)(15 psf ) � 13.7 psf � �4.7 psf
Interior zone on windward roof (zone G) � (0.6)(15 psf ) �13.8 psf � �4.8 psf
Interior zone on leeward roof (zone H) � (0.6)(15 psf ) �10.4 psf � �1.4 psf
(Negative net vertical wind pressures indicate uplift or suction or upward pressure on the roof surface, andpositive values indicate downward pressure on the roof.) As an alternate, the height/exposure coefficient, �could have been obtained by linear interpolation of ASCE Figure 6-2 as follows:
1.29 � 1.21� � 1.21 � (19.2 ft � 15 ft) � 1.28
20 ft � 15 ft
The difference between the � value obtained here and the 1.29 value used earlier is less than 1%.

52 � S T R U C T U R A L W O O D D E S I G N
EXAMPLE 2.8
Seismic Load Calculation
For the two-story wood-framed structure shown in Figure 2.17, calculate the seismic base shear V, in kips, andthe lateral seismic load at each level, in kips, given the following information:
FIGURE 2.17 Building plan and elevation, seismic load example.
floor dead load � 30 psf
roof dead load � 20 psf
exterior walls � 15 psf
snow load P � 35 psff
site class � D (ASCE 7 Chapter 20)
importance I � 1.0 (ASCE 7 Table 11.5-1)e
S � 0.25% (ASCE 7 Figure 22-1)S
S � 0.07% (ASCE 7 Figure 22-2)1
R � 6.5 (ASCE 7 Table 12.14-1)
F � 1.1 for a two-story building (ASCE 7 Section 12.14.8.1)
Solution: First calculate the weight tributary W for each level including the weight of the floor structure, theweight of the walls, and a portion of the snow load. Where the flat roof snow load Pf is greater than 30 psf,20% of the flat roof snow load is to be included in W for the roof (ASCE 7 Section 12.14.8.1). See Table 2.8for the calulations.
TABLE 2.8 Building Weights for Seismic Load Calculation
Level Area Tributary Height Weight of Floor Weight of Walls Wtotal
Roof (60 ft)(40 ft)� 2400 ft2
(12 ft /2) � 1.5 ft �7.5 ft
(2400 ft2)[20 psf� (0.2 � 35psf )] � 64.8kips
(7.5 ft)(15 psf ) �(2)(60 ft � 40 ft)� 22.5 kips
64.8 kips � 22.5kips � 87.3kips
Secondfloor
(60 ft)(40 ft)� 2400 ft2
(12 ft /2) � (14 ft /2)� 13 ft
(2400 ft2)(30 psf )� 72.0 kips
(13 ft)(15 psf ) �(2)(60 ft � 40 ft)� 39.0 kips
72.0 kips � 39.0kips � 111 kips
W � 87.3 kips � 111 kips � 198.3 kips

I N T R O D U C T I O N T O S T R U C T U R A L D E S I G N L O A D S � 53
Seismic variables:
F � 1.6 (ASCE 7 Table 11.4-1)a
F � 2.4 (ASCE 7 Table 11.4-2))v
S � F S � (1.6)(0.25) � 0.40 (ASCE 7 Equation 11.4-1)MS a S
S � F S � (2.4)(0.07) � 0.168 (ASCE 7 Equation 11.4-2)M1 a 1
2 2– –S � S � ( )(0.40) � 0.267 (ASCE 7 Equation 11.4-3)DS 3 MS 3
2 2– –S � S � ( )(0.168) � 0.112 (ASCE 7 Eqquation 11.4-4)D1 3 M1 3
Base shear:
FS WDSV � (ASCE Equation 12.14-11)R
(1.1)(0.267)(198.3)� � 8.96 kips
6.5
Force at each level. The lateral force at each level of the building is calculated using IBC Equation 16-57 asfollows:
FS WDS xF � (ASCE 7 Equations 12.14-11 and 12.14-12)x R
(1.1)(0.267)(87.3)F � � 3.94 kipsR 6.5
(1.1)(0.267)(111)F � � 5.02 kips2 6.5
The seismic loads are summarized in Figure 2.18.
FIGURE 2.18 Summary of seismic loads.
Note: A flat roof was assumed in this example, but for buildings with a pitched roof, the weight of the roofand walls that are assigned to the roof level are assumed to act at the roof datum level, which is equivalent tothe top elevation of the exterior walls.
The structural system factor, R used in this example corresponds to that of a plywood panel. Wheresheathing of different materials are used on both sides of the studs in a shear wall, the R value for the wallsystem will be the smaller of the R values of the two sheathing materials, if sheathing on both wall faces areused to resist the lateral load, or the R value of the stronger sheathing material, if the weaker sheathing isneglected and only the stronger sheathing material is used to resist the lateral load. One example of this case isthe use of plywood sheathing (R � 6.5) on the exterior face of a building and gypsum wallboard (R � 2) onthe interior face of the building.
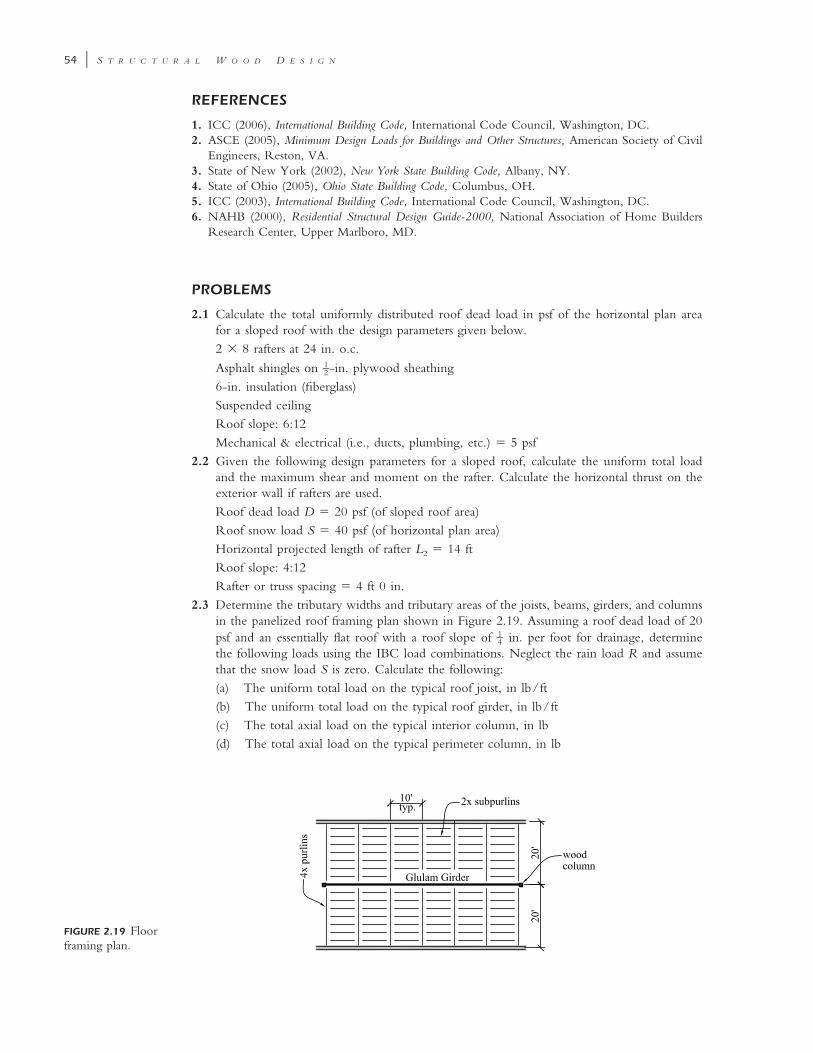
54 � S T R U C T U R A L W O O D D E S I G N
FIGURE 2.19 Floorframing plan.
REFERENCES
1. ICC (2006), International Building Code, International Code Council, Washington, DC.2. ASCE (2005), Minimum Design Loads for Buildings and Other Structures, American Society of Civil
Engineers, Reston, VA.3. State of New York (2002), New York State Building Code, Albany, NY.4. State of Ohio (2005), Ohio State Building Code, Columbus, OH.5. ICC (2003), International Building Code, International Code Council, Washington, DC.6. NAHB (2000), Residential Structural Design Guide-2000, National Association of Home Builders
Research Center, Upper Marlboro, MD.
PROBLEMS
2.1 Calculate the total uniformly distributed roof dead load in psf of the horizontal plan areafor a sloped roof with the design parameters given below.2 � 8 rafters at 24 in. o.c.
Asphalt shingles on -in. plywood sheathing1–26-in. insulation (fiberglass)Suspended ceilingRoof slope: 6:12Mechanical & electrical (i.e., ducts, plumbing, etc.) � 5 psf
2.2 Given the following design parameters for a sloped roof, calculate the uniform total loadand the maximum shear and moment on the rafter. Calculate the horizontal thrust on theexterior wall if rafters are used.Roof dead load D � 20 psf (of sloped roof area)Roof snow load S � 40 psf (of horizontal plan area)Horizontal projected length of rafter L2 � 14 ftRoof slope: 4:12Rafter or truss spacing � 4 ft 0 in.
2.3 Determine the tributary widths and tributary areas of the joists, beams, girders, and columnsin the panelized roof framing plan shown in Figure 2.19. Assuming a roof dead load of 20psf and an essentially flat roof with a roof slope of in. per foot for drainage, determine1–4the following loads using the IBC load combinations. Neglect the rain load R and assumethat the snow load S is zero. Calculate the following:(a) The uniform total load on the typical roof joist, in lb/ft(b) The uniform total load on the typical roof girder, in lb/ft(c) The total axial load on the typical interior column, in lb(d) The total axial load on the typical perimeter column, in lb

I N T R O D U C T I O N T O S T R U C T U R A L D E S I G N L O A D S � 55
FIGURE 2.20 Buildingplan and elevation.
2.4 A building has sloped roof rafters (5�12 slope) spaced at 2 ft 0 in. on centers and is locatedin Hartford, Connecticut. The roof dead load is 22 psf of the sloped area. Assume a fullyexposed roof with terrain category C, and use the ground snow load from the IBC or ASCE7 snow map. The rafter horizontal span is 14 ft.(a) Calculate the total uniform load in lb/ft on a horizontal plane using the IBC.(b) Calculate the maximum shear and moment in the roof rafter.
2.5 A three-story building has columns spaced at 18 ft in both orthogonal directions and issubjected to the roof and floor loads shown below. Using a column load summation table,calculate the cumulative axial loads on a typical interior column with and without a live-load reduction. Assume a roof slope of in. per foot for drainage.1–4
Roof loads:
Dead load D � 20 psfroof
Snow load S � 40 psf
Second- and third-floor loads:
Dead load, D � 40 psffloor
Floor live load L � 50 psf
2.6 A two-story wood-framed structure 36 ft � 75 ft in plan is shown in Figure 2.20 with thefollowing information given. The floor-to-floor height is 10 ft, the truss bearing (or roofdatum) elevation is at 20 ft, and the truss ridge is 28 ft 4 in. above the ground-floor level.The building is enclosed and is located in Rochester, New York on a site with a categoryC exposure. Assume the following additional design parameters:
Floor dead load � 30 psf
Roof dead load � 20 psf
Exterior walls � 10 psf
Snow load P � 40 psff
Site class � D
Importance I � 1.0e
S � 0.25%S
S � 0.07%1
R � 6.5

56 � S T R U C T U R A L W O O D D E S I G N
Calculate the following:(a) The total horizontal wind force on the main wind force–resisting system (MWFRS)
in both the transverse and longitudinal directions(b) The gross and net vertical wind uplift pressures on the roof (MWFRS) in both the
transverse and longitudinal directions(c) The seismic base shear V, in kips(d) The lateral seismic load at each level, in kips
57
c h a p t e r t h r e e
ALLOWABLE STRESS DES IGN
METHOD FOR SAWN LUMBER
AND GLUED LAMINATED TIMBER
3.1 ALLOWABLE STRESS DESIGN METHOD
The allowable stress design (ASD) method is used widely for the structural design of wood structuresin the United States and is adopted in this book. The method is based on stipulating a maximumallowable stress under service conditions that incorporates a factor of safety. The factor of safetyis the ratio of the maximum load or stress a structural member can support before it fails to theallowable load permitted by the Code, and it varies between 1.5 and 2.0 for most buildingstructures. This allowable stress must be greater than or equal to the applied stress which iscalculated on the basis of an elastic structural analysis. The load and resistance factor design (LRFD)method was introduced in the 2005 NDS code [1]. In this method, the load effects are multipliedby various load factors, which are usually greater than 1.0, to give the loads and load effects atthe ultimate limit state. The load effects are usually determined from an elastic structural analysis.The factored resistance of the structural member or element is determined by multiplying thenominal resistance or theoretical strength of the member by a strength reduction or resistancefactor, which is usually less than 1.0. The factored load effect must be less than or equal to thefactored resistance for the structural member to be adequate at the ultimate limit state. Themember is also checked at the serviceability limit state using the unfactored loads. The LRFDmethod accounts better than does the ASD method for the variability of loads in assigning thevarious load factors.
As stated earlier, the ASD method follows the approach that the stress applied must be lessthan or equal to the code-specified allowable stress. The stresses applied are denoted by a lowercase f and the allowable stresses are denoted by an uppercase F. For example, the tension stressapplied parallel to the grain ft (� P/A) must be less than or equal to the allowable tension stressparallel to the grain whereF�,t
F� � F (product of all applicable adjustment or C factors)t t, NDS-S
Similarly, the bending stress applied fb (� M/SX) must be less than or equal to the allowablebending stress whereF�,b
F� � F (product of all applicable adjustment or C factors)b b, NDS-S
In general, the allowable stress is given as
F� � F (product of all applicable adjustment or C factors) (3.1)NDS-S
The applicable adjustment or C factors are given from Tables 3.1 and 3.2. The tabulated designvalues FNDS-S given in the NDS Supplement (NDS-S) [2] assume normal load duration and dry-use conditions.
Structural Wood Design: A Practice-Oriented Approach Using the ASD Method. Abi Aghayere and Jason VigilCopyright © 2007 John Wiley & Sons, Inc.

58 � S T R U C T U R A L W O O D D E S I G N
Bea
ring A
rea
Fac
tor
TABLE 3.1 Applicability of Adjustment Factors for Sawn Lumber
Load
Dura
tion
Fac
tor
Wet
Ser
vice
Fac
tor
Tem
per
ature
Fac
tor
Bea
m S
tability
Fac
tor
Siz
e Fac
tor
Fla
t U
se F
acto
r
Inci
sing F
acto
r
Rep
etitiv
e M
ember
Fac
tor
Colu
mn S
tability
Fac
tor
Buck
ling S
tiffnes
s Fac
tor
� Fb �F�b CD CM Ct CL CF Cfu Ci Cr — — —
� Ft �F�t CD CM Ct — CF — Ci — — — —
� Fv �F�v CD CM Ct — — — Ci — — — —
� Fc� �F�c� — CM Ct — — — Ci — — — Cb
� Fc �F�c CD CM Ct — CF — Ci — CP — —
E� � E � — CM Ct — — — Ci — — CT —
� Emin �E�min — CM Ct — — — Ci — — CT —
Source: Ref. 1, Table 4.3.1. Courtesy of the American Forest & Paper Association, Washington, DC.
TABLE 3.2 Applicability of Adjustment Factors for Glued Laminated Timber
Source: Ref. 1, Table 5.3.1. Courtesy of the American Forest & Paper Association, Washington, DC.a The beam stability factor CL should not be applied simultaneously with the volume factor CV ; the lesser of these twovalues applies (see NDS Section 5.3.6).
Bea
ring
Are
a Fac
tor
Load
Dura
tion
Fac
tor
Wet
Ser
vice
Fac
tor
Tem
per
ature
Fac
tor
Bea
m S
tability
Fac
tora
Volu
me
Fac
tora
Fla
t U
se F
acto
r
Curv
ature
Fac
tor
Colu
mn S
tability
Fac
tor
� Fb �F�b CD CM Ct CL CV Cfu Cc — —
� Ft �F�t CD CM Ct — — — — — —
� Fv �F�v CD CM Ct — — — — — —
� Fc� �F�c� — CM Ct — — — — — Cb
� Fc �F�c CD CM Ct — — — — CP —
E� � E � — CM Ct — — — — — —
� Emin �E�min — CM Ct — — — — — —
NDS Tabulated Design Stresses
The NDS tabulated design values are based on a 5% exclusion value of the clear-wood strengthvalues with a reduction factor or strength ratio of less than 1.0 to allow for the effects of strength-reducing characteristics such as knot size, slope of grain, splits, checks, and shakes. A 5% exclusionvalue implies that five of every 100 pieces of wood are likely to have lower strength than thevalues tabulated in NDS-S. Only the elastic modulus and compression stress perpendicular tograin are based on average values. The combined effect of the strength ratio and other adjustmentfactors on the 5% exclusion clear-wood strength yield factors of safety for wood that range from1.25 to 5.0, with average values of approximately 2.5. Table 3.3 shows the strength reductionfactors applied to the 5% exclusion clear-wood test values. The clear-wood strength propertieswere established from laboratory tests on small straight-grained wood specimens where the woodmembers are loaded from zero to failure within a 5-minute duration. New tests known as in-grade tests were conducted more recently in which more than 70,000 full-size dimension lumberspecimens were tested to failure in bending, tension, and compression parallel to the grain. Thein-grade tests were used to verify the design values from the clear-wood tests.

A L L O W A B L E S T R E S S D E S I G N M E T H O D � 59
TABLE 3.3 Strength Reduction Factors
Stress TypeStrength Reduction
Factorsa Limit State
Bending stress, Fb 0.48 Ultimate strength
Tension parallel to the grain, Ft 0.48 Ultimate strength
Compression parallel to the grain, Fc 0.533 Ultimate strength
Shear parallel to the grain, Fv 0.247 Ultimate strength
Compression perpendicular to the grain,b Fc� 0.667 0.04 in. deformation
Bending modulus of elasticity,b E 1.0 Elastic or proportional limit
Source: Refs. 8 and 10.a The strength reduction factor accounts for strength-reducing defects such as knots, splits, wanes, and decay andnormalizes the stress design values with respect to load duration, stress concentrations, and so on.b Fc and E are based on the average values from the tests.
TABLE 3.4 Adjustment Factors
AdjustmentFactor Description
CD Load duration factor
CM Wet service or moisture factor
CF Size factor
Cfu Flat-use factor
Ct Temperature factor
Cr Repetitive member factor
Ci Incising factor
CP Column stability factor
CL Beam stability factor
CV Volume factor (applies only to glulam)
Cb Bearing area factor
Cc Curvature factor
The allowable stress perpendicular to grain is controlled by a deformation limit state andnot by crushing failure. Under load perpendicular to the grain, the member continues to supportincreasing load because of the densification of the member. The NDS code sets a 0.04-in.deformation limit for the determination of F� .c�
Stress Adjustment Factors
The various stress adjustment factors that are used in wood design and discussed in this chapterare listed in Table 3.4.
Load Duration Factor CD
Wood is susceptible to creep and continues to deflect under constant load due to moistureloss from the cell walls and cavities of the wood member. This creep property of wood isaccounted for in determining the strength of a wood member through use of the load durationfactor. The term duration of load designates the total accumulated length of time that a load isapplied during the life of the structure, and the shorter the load duration, the stronger the woodmember. The load duration factor CD converts stress values for normal load duration to designstress values for other durations of loading. The NDS code defines the normal load duration as10 years, which means that the load is applied on the structure for a cumulative maximumduration of 10 years, and the load duration factor for this normal load duration is 1.0. The loadduration factors for other types of loads are given in Table 3.5.
For any load combination, the governing load duration factor CD will be the value thatcorresponds to the shortest-duration load in that load combination. Thus, the governing CD

60 � S T R U C T U R A L W O O D D E S I G N
TABLE 3.5 Load Duration Factors
Type of LoadCumulative Load
DurationLoad Duration
Factor, CD
Dead load Permanent 0.9
Floor live load 10 years or normal duration 1.0
Snow load 2 months 1.15
Roof live load 7 days 1.25
Construction load 7 days 1.25
Wind 10 minutes 1.6
Seismic (earthquake) 10 minutes 1.6
Impact 1 second or less 2.0
Source: Refs. 1 and 2.
EXAMPLE 3.1
Load Duration Factors in Load Combinations
Determine the load duration factor CD for the following load combinations: (a) dead load � floor live load; (b)dead load � floor live load � snow load; (c) dead load � floor live load � roof live load.
Solution:
(a) Dead load � floor live load:
C for dead load � 0.9D
C for floor live load � 1.0D
Since the largest CD value governs, CD(D�L) � 1.0.
(b) Dead load � floor live load � snow load:
C for dead load � 0.9D
C for floor live load � 1.0D
C for snow load � 1.15D
Since the largest CD value governs, CD(D�L�S) � 1.15.
(c) Dead load � floor live load � roof live load:
C for dead load � 0.9D
C for floor live load � 1.0D
C for roof live load � 1.25D
Since the largest CD value governs, CD(D�L�Lr) � 1.25.
value is equal to the largest CD value in that load combination. It should be noted that the NDScode recommends a load duration factor of 1.6 for wind and seismic loads, rather than the 1.33from the older codes, to reflect the very small duration of these loads. For example, 3-secondwind gust pressures are now used in modern codes such as the IBC and ASCE 7 for wind loadcalculations, reflecting a lower load duration than the wind pressures used in older codes suchas the Uniform Building Code (UBC). However, some jurisdictions may still insist that a loadduration factor of 1.33 be used in that locality, so the reader is advised to consult with the localbuilding plans’ examiner in their jurisdiction for the appropriate load duration factor for windload in that area.
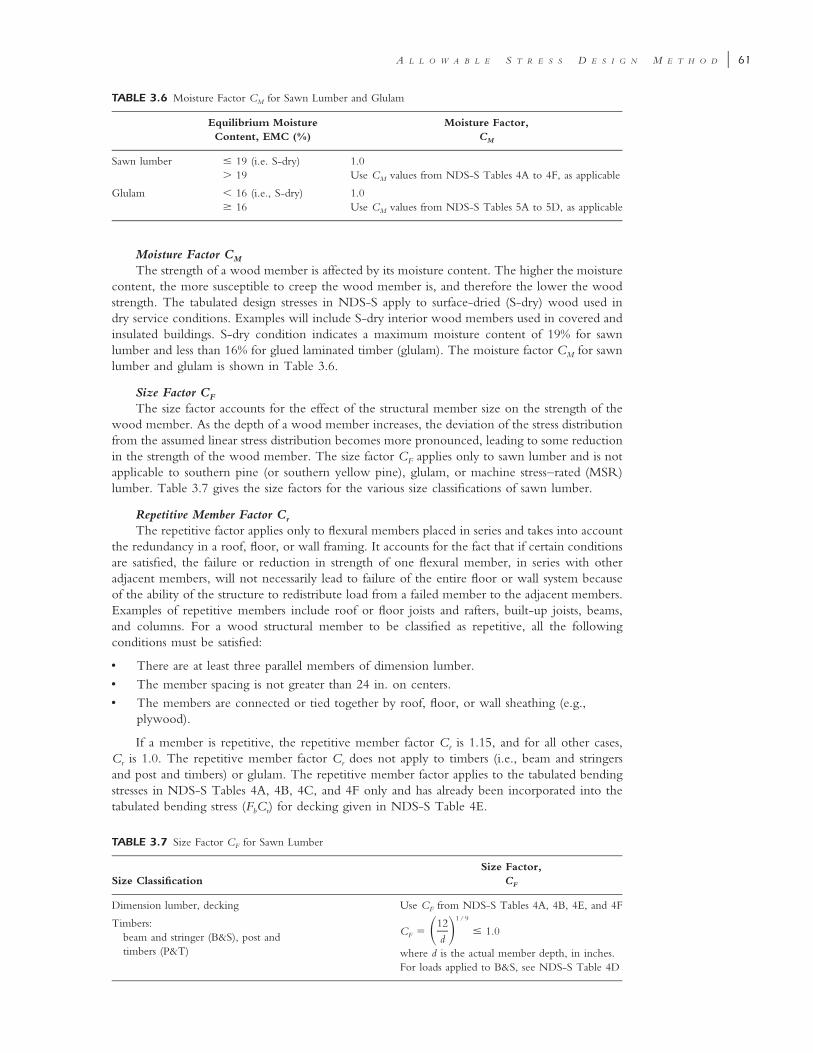
A L L O W A B L E S T R E S S D E S I G N M E T H O D � 61
TABLE 3.6 Moisture Factor CM for Sawn Lumber and Glulam
Equilibrium MoistureContent, EMC (%)
Moisture Factor,CM
Sawn lumber � 19 (i.e. S-dry) 1.0� 19 Use CM values from NDS-S Tables 4A to 4F, as applicable
Glulam � 16 (i.e., S-dry) 1.0� 16 Use CM values from NDS-S Tables 5A to 5D, as applicable
TABLE 3.7 Size Factor CF for Sawn Lumber
Size ClassificationSize Factor,
CF
Dimension lumber, decking Use CF from NDS-S Tables 4A, 4B, 4E, and 4F
Timbers:beam and stringer (B&S), post andtimbers (P&T)
CF � � 1.01 / 912� �d
where d is the actual member depth, in inches.For loads applied to B&S, see NDS-S Table 4D
Moisture Factor CM
The strength of a wood member is affected by its moisture content. The higher the moisturecontent, the more susceptible to creep the wood member is, and therefore the lower the woodstrength. The tabulated design stresses in NDS-S apply to surface-dried (S-dry) wood used indry service conditions. Examples will include S-dry interior wood members used in covered andinsulated buildings. S-dry condition indicates a maximum moisture content of 19% for sawnlumber and less than 16% for glued laminated timber (glulam). The moisture factor CM for sawnlumber and glulam is shown in Table 3.6.
Size Factor CF
The size factor accounts for the effect of the structural member size on the strength of thewood member. As the depth of a wood member increases, the deviation of the stress distributionfrom the assumed linear stress distribution becomes more pronounced, leading to some reductionin the strength of the wood member. The size factor CF applies only to sawn lumber and is notapplicable to southern pine (or southern yellow pine), glulam, or machine stress–rated (MSR)lumber. Table 3.7 gives the size factors for the various size classifications of sawn lumber.
Repetitive Member Factor Cr
The repetitive factor applies only to flexural members placed in series and takes into accountthe redundancy in a roof, floor, or wall framing. It accounts for the fact that if certain conditionsare satisfied, the failure or reduction in strength of one flexural member, in series with otheradjacent members, will not necessarily lead to failure of the entire floor or wall system becauseof the ability of the structure to redistribute load from a failed member to the adjacent members.Examples of repetitive members include roof or floor joists and rafters, built-up joists, beams,and columns. For a wood structural member to be classified as repetitive, all the followingconditions must be satisfied:
• There are at least three parallel members of dimension lumber.• The member spacing is not greater than 24 in. on centers.• The members are connected or tied together by roof, floor, or wall sheathing (e.g.,
plywood).
If a member is repetitive, the repetitive member factor Cr is 1.15, and for all other cases,Cr is 1.0. The repetitive member factor Cr does not apply to timbers (i.e., beam and stringersand post and timbers) or glulam. The repetitive member factor applies to the tabulated bendingstresses in NDS-S Tables 4A, 4B, 4C, and 4F only and has already been incorporated into thetabulated bending stress (FbCr) for decking given in NDS-S Table 4E.

62 � S T R U C T U R A L W O O D D E S I G N
TABLE 3.8 Incising Factor
Design ValueIncising Factor,
Ci
E, Emin 0.95
Fb, Ft, Fc, Fv 0.80
Fc� 1.00
Source: Ref. 1.
Flat Use Factor Cfu
Except for roof or floor decking, the NDS-S tabulated design stresses for dimension lumberapply to wood members bending about their stronger (or x–x) axis, as indicated in Figure 3.1a.
(a) (b)
FIGURE 3.1 Direction of loading with respect toorthogonal axes: (a) bending about the strong axis; (b)bending about the weak axis.
For most cases, the flat use factor Cfu is 1.0, but for the fewsituations where wood members are stressed about theirweaker (y–y) axis as indicated in Figure 3.1b, the flat usefactor Cfu is obtained from NDS-S Tables 4A and 4B fordimension lumber, and from NDS-S Tables 5A to 5D forglulam. An example of a situation where dimension lumbermay be bent about the weaker (y–y) axis is in stair treads.The flat use factor does not apply to decking because thisfactor has already been incorporated in the tabulated NDS-Sdesign values for decking.
For glulam members, the flat use factor is usually greaterthan 1.0 and is applicable to beams subjected to weak axisbending and when the width (or smaller dimension) of the
glulam member is less than 12 in. The Cfu values for glulam are tabulated in the adjustmentfactors section of NDS-S Tables 5A to 5D and are to be applied to the Fby (or weak axis bending)stress only. Although glulam beams are sometimes subjected to combined bending about thestrong and weak axes, it is practical and conservative to assume a Cfu value of 1.0 in design.
Incising Factor Ci
Some species of lumber do not easily accept pressure preservative treatment, and smallincisions parallel to the grain may be cut in the wood to increase the depth of penetration ofpreservatives in the wood member. The incising factor applies only to dimension lumber andhas a value of 1.0 for lumber that is not incised. Design values are multiplied by the factorsshown in Table 3.8 when dimension lumber is incised parallel to the grain, as follows:
maximum depth � 0.4 in.
maximum length � 0.375 in.
2maximum incision density � 1100 per ft
Temperature Factor Ct
Beyond a temperature of 100�F, an increase in temperature leads to a reduction in thestrength of a wood member. The NDS code Table 2.3.3 lists the temperature factors Ct forvarious temperatures. For temperatures not greater than 100�F, the temperature factor Ct is 1.0for wood used in dry or wet service conditions, and this applies to most insulated wood buildingstructures. When the temperature in a wood structure is greater than 100�F, as may occur insome industrial structures, the Ct values can be obtained from NDS code Table 2.3.3.
Beam Stability Factor CL
The beam stability factor accounts for the effect of lateral torsional buckling in a flexuralmember. When a beam is subjected to bending due to gravity loads, the top edge is usually incompression while the bottom edge is in tension. As a result of the compression stresses, the topedge of the beam will be susceptible to out-of-plane or sidesway buckling if it is not braced

A L L O W A B L E S T R E S S D E S I G N M E T H O D � 63
adequately. As the top edge moves sideways, the bottom edge, which is in tension, tends tomove sideways in the opposite direction, and this causes twisting in the beam if the beam endsare restrained. This tendency to twist is called lateral-torsional buckling, and it should be noted thatif the beam ends are unrestrained, the beam will become unstable and could roll over. However,lateral restraints are usually always provided, at least at the beam supports. Generally, if thecompression edge of a flexural member is continuously braced by decking or plywood sheathing,the beam will not be susceptible to lateral-torsional buckling and the beam stability factor willbe 1.0 in this case.
Two methods are prescribed in the NDS code that could be used to determine the beamstability factor CL: rule-of-thumb method and the calculation method.
Rule-of-Thumb Method (NDS Code Section 3.3.3) The beam stability factor CL is 1.0 foreach of the following cases provided that the conditions described for each case are satisfied:
1. If d/b � 2, no lateral support and no blocking are required.Examples: 2 � 4 or 4 � 8 wood member
2. If 2 � d/b � 4, the beam ends are held in position laterally using solid end blocking.Examples: 2 � 6, 2 � 8, or 4 � 16 wood member
3. If 4 � d/b � 5, the compression edge of a beam is laterally supported throughout itslength. Solid end blocking is not required by the NDS code, but is recommended.Example: 2 � 10 wood member with plywood sheathing nailed to the top face of thewood member at fairly regular intervals
4. If 5 � d/b � 6, bridging or full-depth solid blocking is provided at 8-ft intervals or less,or plywood sheathing is nailed to the top face of the wood member and blocking pro-vided at the ends of the joist and at midspan where the joist span exceeds 12 ft or ply-wood sheathing nailed to the top and bottom faces of the joist.Example: 2 � 12
5. If 6 � d/b � 7, both edges of the beam are held in line for the entire length.Examples: 2 � 14 with plywood sheathing nailed to the top face; a ceiling nailed to thebottom face of the wood member
For all five cases above, the member dimensions d and b are the nominal width (largerdimension) and thickness (smaller dimension) of the wood member, respectively.
Calculation Method for CL When the nominal width (or larger dimension) d is greater thanthe nominal thickness (or smaller dimension) b, the beam stability factor is calculated using theequation
21 � F /F* 1 � F /F* F /F*bE b bE b bE bC � � � (3.2)� �L �1.9 1.9 0.95
where FbE � / � Euler critical buckling stress for bending members21.20E� Rmin B
�E�min EminCMCtCiCT � reduced modulus of elasticity for buckling calculations
RB � � 502�l d/be
(when RB is greater than 50, the beam size has to be increased and/or lateralbracing provided to the compression edge of the beam to bring RB within thelimit of 50)
le � effective length obtained from Table 3.9 as a function of the unbraced length lulu � the unsupported length of the compression edge of the beam, or the distance
between points of lateral support preventing rotation and/or lateral displacementof the compression edge of the beam[lu is the unbraced length of the compression edge of the beam in the plane (i.e.,y–y axis) in which lateral torsional buckling will occur; without continuous lateralsupport, there is a reduction in the allowable bending stress, but in many cases,continuous lateral support is provided by the plywood roof or floor sheathing,which is nailed and glued to the compression face of the joists and beams, and forthese cases, the umbraced length is taken as zero]

64 � S T R U C T U R A L W O O D D E S I G N
TABLE 3.9 Effective Length le for Bending Members
Span Condition lu/d � 7
7 � lu/d
7 � lu/d � 14.3 14.3 � lu/d
CantileverUniformly distributed load le � 1.33lu le � 0.90lu � 3dConcentrated load at unsupported end le � 1.87lu le � 1.44lu � 3d
Single span beamUniformly distributed load le � 2.06lu le � 1.63lu � 3dConcentrated load at center with no intermediate le � 1.80lu le � 1.37lu � 3d
lateral supportConcentrated load at center with lateral support
at centerle � 1.11lu
Two equal concentrated loads at points with1–3lateral support at points1–3
le � 1.68lu
Three equal concentrated loads at points with1–4lateral support at points1–4
le � 1.54lu
Four equal concentrated loads at points with1–5lateral support at points1–5
le � 1.68lu
Five equal concentrated loads at points with1–6lateral support at points1–6
le � 1.73lu
Six equal concentrated loads at points with1–7lateral support at points1–7
le � 1.78lu
Seven or more concentrated loads, evenly spaced,with lateral support at points of load application
le � 1.84lu
Equal end moments le � 1.84lu
Single span or cantilever conditions not specifiedabove
le � 2.06lu le � 1.63lu � 3d le � 1.84lu
Source: Ref. 1, Table 3.3.3. Courtesy of the American Forest & Paper Association, Washington, DC.
�F*bx Fbx, NDS-S (product of all applicable adjustable factors except Cfu, CV, and CL )
Column Stability Factor Cp
The column stability factor accounts for buckling stability in columns and is discussed morefully in Chapter 5. It is a function of the column end fixity, the column effective length, andthe column cross-sectional dimensions, and it applies only to the compression stress parallel tothe grain, When a column is fully or completely braced about an axis of buckling such asF�.c
by an intersecting stud wall or by plywood sheathing, the column stability factor Cp about thataxis will be equal to 1.0.
Volume Factor CV
The volume factor, which accounts for size effects in glulam members, is applicable onlyfor bending stress calculations and is be covered in Section 3.2. When designing glulam membersfor bending, the smaller of the beam buckling stability factor CL and the volume factor CV isused to calculate the allowable bending stress. The volume factor is given as
1 / x 1 / x 1 / x 1 / x21 12 5.125 1291.5C � � � 1.0 (3.3)� � � � � � � �V L d b bdL
where L � length of beam between points of zero moment, ft(Conservatively, assume that L � span of beam)
d � depth of beam, in.b � width of beam, in. (� 10.75 in.)

A L L O W A B L E S T R E S S D E S I G N M E T H O D � 65
x � 20 for southern pinex � 10 for all other species
Bearing Area Factor Cb
The bearing area factor accounts for the increase in allowable stresses at interior supports.NDS code Section 3.10.4 indicates that for bearing supports not nearer than 3 in. to the end ofa member and where the bearing length lb measured parallel to the grain of the member is lessthan 6 in., a bearing area adjustment factor Cb could be applied, where
FIGURE 3.2 Bearing stress factors for differentbearing conditions.
l � 0.375bC � for l � 6 in.b blb
� 1.0 for l � 6 in. (3.4)b
� 1.0 for bearings at the ends of a member
This equation accounts for the increase in bearing capacity at interior re-actions or interior concentrated loads (see Figure 3.2) where there areunstressed areas surrounding the stress bearing area.
Curvature Factor Cc
The curvature factor is used to adjust the allowable bending stressesfor curved glulam members such as arches. The curvature factor Cc appliesonly to the curved section of a wood member, and for straight woodmembers, Cc is 1.0. The curvature factor for a curved wood member isgiven as
2tC � 1 � (2000) (3.5)� �c R
where t � thickness of laminations, in.R � radius of curvature of the inside face of the lamination, in.
�tR
for hardwoods and southern pine1
100
� for other softwoods1
125
Buckling Stiffness Factor CT
When a 2 � 4 or smaller sawn lumber is used as a compression chordin a roof truss with a minimum of -in.-thick plywood sheathing attached3–8to its narrow face, the stiffness against buckling is increased by the buckingstiffness factor CT. This is accounted for by multiplying the reference mod-ulus of elasticity for beam and column stability, Emin, by the bucklingstiffness factor CT, which is calculated as
K lm eC � 1 � (3.6)T K ET
where le � effective column length of truss compression chord (� Kel ) �96 in.(for le � 96 in., use le � 96 in.)
Ke � effective column length factor, usually taken as 1.0 formembers supported at both ends

66 � S T R U C T U R A L W O O D D E S I G N
l � unbraced length of the truss top chord between connections or panel pointsKm � 2300 for wood with a moisture content not greater than 19% at the time of
plywood attachment� 1200 for unseasoned wood or partially seasoned wood at the time of plywood
attachment (i.e., wood with moisture content � 19%)KT � 0.59 for visually graded lumber
� 0.75 for machine-evaluated lumber (MEL)� 0.82 for glulams and machine stress-rated (MSR) lumber
Procedure for Calculating Allowable Stress
The procedure for calculating the allowable stresses from the tabulated NDS design stresses is asfollows:
1. Identify the size classification of the wood member: that is, whether it is dimension lum-ber, beam and stringer, or post and timber or decking.
2. Obtain the tabulated design stress values from the appropriate table in NDS-S based onthe size classification of the member, the wood species, the stress grade, and the structuralfunction or stress. Refer to Table 1.4 for the applicable NDS-S tables. Note that thesedesign values already includes a factor of safety.
3. Obtain the applicable adjustment or C factors from the NDS code adjustment factorsapplicability tables (Tables 3.1 and 3.2).
4. Calculate the allowable stress:
F� � F (product of all applicable adjustment factors from Table 3.1 or 3.2)NDS-S
Moduli of Elasticity for Sawn Lumber
There are two moduli of elasticity design values tabulated in NDS-S for sawn lumber. Thereference modulus of elasticity, E, is used for beam deflection calculations, while the reducedmodulus of elasticity, Emin, is used for beam and column stability calculations. Emin is derivedfrom the reference modulus of elasticity E with a factor safety of 1.66 applied, in addition toaccounting for the coefficient of variation in the modulus of elasticity and an adjustment factorto convert reference E values to a pure bending basis.
3.2 GLUED LAMINATED TIMBER
Glulam is the acronym for glued laminated timber, which is made from thin laminations of kilndried sawn lumber. They are used for very long spans (up to 60 ft or more) and to support veryheavy loads where sawn lumber becomes impractical, and are also widely used in architecturallyexposed structures because of their aesthetic appeal. Microlams and Parallams are proprietary
FIGURE 3.3 Glulam cross section.
glulams that are also used for floor beams and girders. Otheradvantages of glulam compared to sawn lumber include higherstrength, better fire rating because of their relatively large sizecompared to sawn lumber framing, beter aesthetics, better qual-ity control because of the small size of the laminations, greaterdispersion of defects in the laminations of the glulam, readyformation to curved shape for arches, and economical for longspans and large loads. Glulams are widely used in the construc-tion of arch and long-span wood structures and are fabricatedfrom very thin laminations of sawn lumber as shown in Figure3.3. They are usually end-jointed and the laminations are
stacked and glued together with water-resistant adhesives to produce wood members of practi-cally any size and length. The lamination thickness varies from or in. for straight/slightly1 3– –1 12 8
curved members and is in. for sharply curved members.3–4

A L L O W A B L E S T R E S S D E S I G N M E T H O D � 67
(a) (b) (c)
FIGURE 3.4 End jointsin glulam: (a) verticalfinger joint; (b)horizontal fingerjoint; (c) scarf joint.
Glulams are available for depths up to 72 inches and the standard glulam widths are 1–3 ,8
and in. for western species glulam (i.e., Douglas fir-larch, hem-fir, and California1 3 3 3– – – –5 , 6 , 8 , 108 4 4 4
redwood), and 3, 5, and in. for southern pine glulam. The most commonly used3 1 1– – –6 , 8 , 104 2 2
wood species for glulam are Douglas fir-larch and southern pine. As noted earlier, the sizes ofglulam are usually called out on plans using their actual dimensions, whereas sawn lumber iscalled out using nominal dimensions. Table 1C of NDS-S lists the various glulam sizes andsection properties. Glulams are usually grade-stamped on the top face for identification. In prac-tice, it is usually more economical for the designer to specify the desired allowable stresses thanto specify the glulam combination: hence the introduction of the stress class system in NDS-STable 5A.
End Joints in Glulam
The two most common types of end jointing system used in glulam members are finger jointsand scarf joints, shown in Figure 3.4. The end joints are usually staggered in the laminations ofthe glulam member and no glue is applied at the end joints. Wet-use adhesives are used underpressure to join glulam laminations together at their interfaces.
Grades of Glulam
Traditionally, the two main structural grades of glulam are bending combination and axial com-bination glulam. The bending combination glulams are given in NDS-S Table 5A–Expanded,and the axial combinations are given in NDS-S Table 5B. The values in NDS-S Tables 5B and5A are for softwood glulam, the most frequently used glulam in the United States, and NDS-STables 5C and 5D are for hardwood glulam. The four standard appearance grades for glulamare framing, industrial, architectural and premium, with the last two grades being the only suitablegrades for architecturally exposed structures [11].
Bending Combination Glulams (NDS-S Tables 5A–Expanded and 5C)The bending combination glulams are used predominantly to resist bending loads, and for
efficiency, their outer laminations are usually made of higher-quality lumber than the innerlaminations. They could also be used to resist axial loads but may not be as efficient for resistaxial loads as axial combination glulams. There are two types of bending combination laminationlayout—balanced and unbalanced layout. In the balanced layout, which is recommended forcontinuous beams, the tension and compression laminations have the same tabulated designbending stress, whereas, in the unbalanced layout, the tension lamination has a higher tabulatedbending stress than the compression lamination. Unbalanced layouts are recommended only forsimply supported beams. An example of a bending combination glulam is 24F–V4, the mostcommonly used unbalanced layout, where the ‘‘24’’ refers to a tabulated bending stress of 2400psi in the tension lamination, ‘‘V’’ refers to glulam with visually graded laminations, and ‘‘4’’ isthe combination symbol. Another example is 22F–E5, where the ‘‘22’’ refers to a tabulatedbending stress of 2200 psi, ‘‘E’’ refers to glulam with machine-stress-rated laminations, and ‘‘5’’is the combination symbol. The most commonly used glulam with a balanced lamination layoutis 24F-V8 [11].

68 � S T R U C T U R A L W O O D D E S I G N
TABLE 3.10 Wood Species Used in Glulam
Wood SpeciesSymbol Description
DF Douglas fir-larch
DFS Douglas fir south
HF Hem-fir
WW Western woods
SP Southern pine
DF/DF Douglas fir-larch wood species are used in both the outer laminations and the innerlaminations
DF/HF Douglas fir-larch wood species are used in the outer laminations, and hem-fir woodspecies are used in the inner laminations
AC Alaska cedar
SW Softwood species
Axial Combination Glulams (NDS-S Tables 5B and 5D)Axial combination glulams are used predominantly to resist axial loads, and therefore all the
laminations are made of the same quality. They could also be used to resist bending loads butare not as efficient as bending combination glulams. One example of an axial combination glulamis 5DF, where ‘‘5’’ is a combination symbol and ‘‘DF’’ refers to the wood species used in theglulam laminations.
Wood Species Used in Glulam
The wood species or species groups used in glulam laminations are shown in Table 3.10. Theouter laminations of glulam are usually of higher-quality lumber than the inner laminations, andoften, the tension outer laminations are made of higher-quality lumber than the compressionouter laminations. In design practice it is recommended and practical to use glulam that uses thesame wood species for both the outer and inner laminations. This would help prevent construc-tion errors that may result from a glulam beam being inadvertently flipped upside down on sitesuch that the lower-strength compression laminations (that should be stressed in compression)become stressed in tension, and the higher-strength tension laminations become stressed in com-pression.
Stress Class System
In the 2005 NDS-S, Table 5A provides an alternative means for specifying glulam based on therequired allowable stress or stress class. This stress class approach is favored by the glulam industrybecause it gives glulam manufacturers flexibility in providing glulams when the required allow-able stresses are specified, rather than specifying a specific glulam combination. The stress classapproach greatly reduces the number of glulam combinations that the designer has to choosefrom, thus increasing design efficiency. In the stress class system of Table 5A, glulam is calledout, for example, as 20F–1.5E, where ‘‘20’’ refers to the tabulated bending stress of 2000 psiand ‘‘E’’ refers to a bending modulus of elasticity of 1.5 � 106 psi obtained by mechanicalgrading. The intent is that future NDS-S editions will use the stress class approach in place ofthe bending combination glulams. The stress class approach does not apply to axial combinationglulams.
NDS-S Tables 5A, 5A–Expanded, and 5BIn NDS-S Tables 5A, 5A–Expanded, and 5B, the allowable bending stress when high-
quality tension laminations are stresses in tension is denoted as The allowable bending stress�F .bx
when lower-quality compression laminations are stressed in tension is denoted as As stated�F .bx
previously, it is preferable and recommended to use glulam with equal tensile strengths in thecompression and tension laminations (i.e., � This is called a balanced lay-up system. Five� �F F ).bx bx
values of elasticity modulus E are given in NDS-S Tables 5A and 5B:

A L L O W A B L E S T R E S S D E S I G N M E T H O D � 69
• Ex is used in deflection calculations for strong (x–x)-axis bending of the glulam member.• Ex, min is used in glulam beam and column stability calculations for buckling about the
x–x axis. It is used in CL and Cp calculations for buckling about the x–x axis.• Ey is used for deflection calculations for weak (y–y axis)-bending of the glulam member.• Ey, min is used in glulam beam and column stability calculations for buckling about the y–y
axis. It is used in CL and CP calculations for buckling about the y–y axis.• Eaxial is used to calculate axial deformations in axially loaded glulam members.
FIGURE 3.5 Bearing stress at supports and atinterior loads.
Two values of compression stress perpendicular to grain (Fc�) aregiven in NDS-S Table 5A, and the location of these stresses in a glulambeam is indicated in Figure 3.5.
• Fc� tension face applies to the bearing stress on the outer face of thetension lamination.
• Fc� compression face applies to the bearing on the outer face of thecompression lamination.
The allowable bearing stresses on the tension and compression lami-nations are given as
F� � F C Cc� t c� tension face M t
F� � F C Cc� c c� compression face M t
3.3 ALLOWABLE STRESS CALCULATION EXAMPLES
In this section we present several examples to illustrate the calculation of allowable stresses forsawn lumber and glulam members.
3.4 LOAD COMBINATIONS AND THE GOVERNING LOADDURATION FACTOR
The IBC basic load combinations were presented in Chapter 2. The distinct critical load com-binations for which the various structural elements in a typical wood structure need to be de-signed are given in Table 3.11. For the roof beams, the seismic and floor live loads are assumedto be zero, while for the floor beams, the roof live loads, snow load, seismic load, and windload are taken as zero since floor beams are not usually subjected to these types of loads. In loadcombinations 7 and 8 in Chapter 2, the wind and seismic loads oppose the dead load. Therefore,W and E take on negative values only in these two load combinations in order to maximize theuplift or overturning effect. These two load combinations are used to include the effects of upliftor overturning in structural elements and systems due to wind and seismic load effects.
Normalized Load Method
From Table 3.11, it is apparent that except for floor beams, several load combinations need tobe considered in the design of wood members, but because of the varying load duration factorsCD, it is not possible or easy to determine by inspection the most critical load combinations forthe design of a particular wood member. Thus, it can become quite tedious to design for allthese load combinations with differing CD values, especially when the design is carried outmanually.
To help in identifying the most critical or governing load combination quickly, thus re-ducing the tedium in design, a normalized load method is adopted in this book. In this methodthe total load for each load combination is normalized with respect to the governing load du-ration factor CD for that load combination. The load combination that has the largest normalizedload is the most critical, and the wood member is designed for the actual total load correspondingto that governing load combination. The reader is cautioned to design for the actual total load,

70 � S T R U C T U R A L W O O D D E S I G N
EXAMPLE 3.2
Allowable Stresses in Sawn Lumber (Dimension Lumber)
Given a 2 � 10 No. 2 Douglas Fir-Larch wood member that is fully braced laterally, subject to dead load andsnow load, and exposed to the weather under normal temperature conditions, determine all the applicableallowable stresses.
Solution:
1. Size classification � dimension lumber. Therefore, use NDS-S Table 4A.2. From NDS-S Table 4A we obtain the following design values:
Bending stress F � 900 psib
Tension stress parallel to the grain F � 575 psit
Horizontal shear stress parallel to the grain F � 180 psiv
Compression stress perpendicular to the grain F � 625 psic�
Compression stress parallel to the grain F � 1350 psic
6Pure bending modulus of elasticity E � 1.6 � 10 psi
3. Determine the applicable stress adjustment or C factors. From Section 3.1, for a dead load plus snow load(D � S) combination, the governing load duration factor CD is 1.15 (i.e., the largest CD value in the loadcombination governs). From the adjustment factors section of NDS-S Table 4A, noting that the woodmember is exposed to the weather, we obtain the following C factors:
C (F ) � 1.0M b
C (F ) � 1.0M t
C (F ) � 0.97M v
C (F ) � 0.67M c�
C (F ) � 0.8M c
C (E ) � 0.9M
C (F ) � 1.1F b
C (F ) � 1.1F t
C (F ) � 1.0F c
C � 1.0 (column stability factor needs to be calculated, but assume 1.0 for this problem)P
C � 1.0 (normal temperature condition)t
C , C , C , C , C � 1.0 (assumed)L fu i r b
Note: If FbCF � 1150, CM(Fb) � 1.0:
F C � (900)(1.1) � 990 � 1150; therefore, C (F ) � 1.0b F M b
If FcCF � 750, CM(Fc) � 1.0
F C � (1350)(1.0) � 1350 � 750; therefore, C (F ) � 0.8c F M c
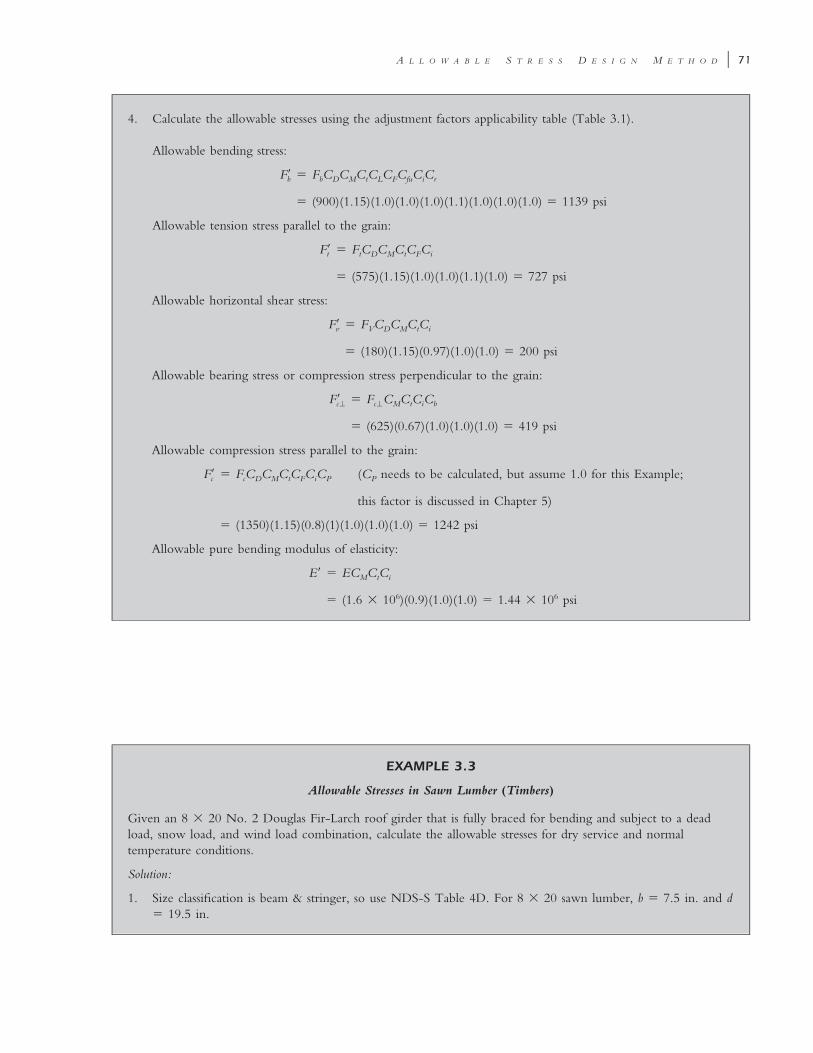
A L L O W A B L E S T R E S S D E S I G N M E T H O D � 71
4. Calculate the allowable stresses using the adjustment factors applicability table (Table 3.1).
Allowable bending stress:
F� � F C C C C C C C Cb b D M t L F fu i r
� (900)(1.15)(1.0)(1.0)(1.0)(1.1)(1.0)(1.0)(1.0) � 1139 psi
Allowable tension stress parallel to the grain:
F� � F C C C C Ct t D M t F i
� (575)(1.15)(1.0)(1.0)(1.1)(1.0) � 727 psi
Allowable horizontal shear stress:
F� � F C C C Cv V D M t i
� (180)(1.15)(0.97)(1.0)(1.0) � 200 psi
Allowable bearing stress or compression stress perpendicular to the grain:
F� � F C C C Cc� c� M t i b
� (625)(0.67)(1.0)(1.0)(1.0) � 419 psi
Allowable compression stress parallel to the grain:
F� � F C C C C C C (C needs to be calculated, but assume 1.0 for this Example;c c D M t F i P P
this factor is discussed in Chapter 5)
� (1350)(1.15)(0.8)(1)(1.0)(1.0)(1.0) � 1242 psi
Allowable pure bending modulus of elasticity:
E� � EC C CM t i
6 6� (1.6 � 10 )(0.9)(1.0)(1.0) � 1.44 � 10 psi
EXAMPLE 3.3
Allowable Stresses in Sawn Lumber (Timbers)
Given an 8 � 20 No. 2 Douglas Fir-Larch roof girder that is fully braced for bending and subject to a deadload, snow load, and wind load combination, calculate the allowable stresses for dry service and normaltemperature conditions.
Solution:
1. Size classification is beam & stringer, so use NDS-S Table 4D. For 8 � 20 sawn lumber, b � 7.5 in. and d� 19.5 in.

72 � S T R U C T U R A L W O O D D E S I G N
2. From NDS-S Table 4D, we obtain the design values:
Bending stress F � 875 psib
Tension stress F � 425 psit
Horizontal shear stress F � 170 psiv
Bearing stress or compression stress perpendicular to the grain F � 625 psic�
Compression stress parallel to the grain F � 600 psic
6Pure bending modulus of elasticity E � 1.3 � 10 psi
3. Determine the applicable stress adjustment or C factors. From Section 3.1, for a dead load plus wind loadplus snow load (D � W � S ) combination, the governing load duration factor CD � 1.6 (i.e., the largestCD value in the load combination governs). As discussed previously, the reader should check to ensure thatthe local code allows a CD value of 1.6 to be used for wind loads. From the adjustment factors section ofNDS-S Table 4D, we obtain the following stress adjustment or C factors:
C � 1.0 (dry service)M
1 / 912C � � 1.0� �F d
1 / 912� � 0.95 � 1.0 OK� �19.5
C � 1.0 (column stability factor; need to calculate, but assume 1.0 for now)P
C � 1.0 (normal temperature conditions apply)t
C � 1.0 (member is fully braced laterally for bending)L
Cfu, Ci, Cr, Cb � 1.0 (Assumed)4. Calculate the allowable stresses using the adjustment factors applicability table (Table 3.1).
Allowable bending stress:
F� � F C C C C C C C Cb b D M t L F fu i r
� (875)(1.6)(1.0)(1.0)(1.0)(0.95)(1.0)(1.0)(1.0) � 1330 psi
Allowable tension stress parallel to the grain:
F� � F C C C C Ct t D M t F i
� (425)(1.6)(1.0)(1.0)(0.95)(1.0) � 646 psi
Allowable horizontal shear stress:
F� � F C C C Cv V D M t i
� (170)(1.6)(1.0)(1.0)(1.0) � 272 psi
Allowable bearing stress or compression stress perpendicular to the grain:
F� � F C C C Cc� c� M t i b
� (625)(1.0)(1.0)(1.0)(1.0) � 625 psi

A L L O W A B L E S T R E S S D E S I G N M E T H O D � 73
Allowable compression stress parallel to the grain:
F� � F C C C C C Cc c D M t F i P
� (600)(1.6)(1)(1)(0.95)(1.0)(1.0) � 912 psi
Note: CP needs to be calculated, and this factor is discussed in Chapter 5. For this example, we assumea value of 1.0
Allowable pure bending modulus of elasticity:
E� � EC C CM t i
6 6� (1.3 � 10 )(1.0)(1.0)(1.0) � 1.3 � 10 psi
EXAMPLE 3.4
Allowable Stresses in Glulam
A � in. 24F–V4 DF/DF simply supported glulam roof girder spans 32 ft (Figure 3.6), is fully braced3 1– –8 344 2
for bending, and supports a dead load, snow load, and wind load combination. Calculate the allowable stressesfor dry service and normal temperature conditions.
FIGURE 3.6 Simply supported Glulam beam.
Solution:
1. Size classification � glulam in bending (i.e., bending combination glulam). Therefore, use NDS-S Table5A. For this glulam beam, the width b � 8.75 in. and depth d � 34.5 in. The distance between points ofzero moments L � 32 ft (simply supported beam).
2. From NDS-S Table 5A, obtain the design values:
�Bending stress with tension laminations stressed in tension F � 2400 psibx
�Bending stress with compression laminations stressed in tension F � 1850 psibx
Bearing stress or compression perpendicular to the grain on tension lamination, F � 650 psic�xx, t
Bearing stress or compression perpendicular to the grain on tension lam, F � 650 psic�xx, c
Horizontal shear stress parallel to the grain, F � 265 psiv,xx
6Pure bending modulus of elasticity E � 1.8 � 10 psixx

74 � S T R U C T U R A L W O O D D E S I G N
3. Determine the applicable stress adjustment or C factors. From Section 3.1, for a dead load plus wind loadplus snow load (D � W � S ) combination, CD � 1.6. (Check if the local code allows a CD value of 1.6to be used for wind loads.) From the adjustment factors section of NDS-S Table 5A, we obtain thefollowing C factors:
C � 1.0 (dry service)M
C � 1.0 (normal temperature)t
C � 1.0 (beam is fully braced)L
C , C and C � 1.0b c fu
From equation (3.3) we calculate the volume factor as1 / x 1 / x 1 / x 1 / x21 12 5.125 1291.5
C � � � 1.0� � � � � � � �v L d b bdL1 / 101291.5
� � 0.82 � 1.0 OK� �(8.75 in.)(34.5 in.)(32 ft)
Recall that in calculating the allowable bending stress for glulams, the smaller of the CV and CL factorsare used. Since CV � 0.82 is less than CL � 1.0, the CV value of 0.82 will govern for the calculation ofthe allowable bending stress.
4. Calculate the allowable stresses.
Allowable bending stress with tension laminations stressed in tension:
� � �F� � the smaller of F C C C C C C or F C C C C C Cbx bx D M t L fu c bx D M t V fu c
� (2400)(1.6)(1.0)(1.0)(1.0)(1.0)(1.0) � 3840 psi
or
� (2400)(1.6)(1.0)(1.0)(0.82)(1.0)(1.0) � 3148 psi (governs)
Therefore,
�F� � 3148 psibx
Allowable bending stress with compression laminations stressed in tension:
� � �F� � the smaller of F C C C C C C or F C C C C C Cbx bx D M t L fu c bx D M t V fu c
� (1850)(1.6)(1.0)(1.0)(1.0)(1.0)(1.0) � 2960 psi
or
� (1850)(1.6)(1.0)(1.0)(0.82)(1.0)(1.0) � 2427 psi (governs)
Therefore,
�F� � 2427 psibx
Allowable bearing stress or compression perpendicular to the grain in the tension lamination:
F� � F C C Cc�xx,t c�xx,t M t b
� (650)(1.0)(1.0)(1.0) � 650 psiAllowable bearing stress or compression perpendicular to the grain in the compression lamination:
F� � F C C Cc�xx,c c�xx,c M t b
� (650)(1.0)(1.0)(1.0) � 650 psi

A L L O W A B L E S T R E S S D E S I G N M E T H O D � 75
Allowable horizontal shear stress:
F� � F� C C Cv,xx v,xx D M t
� (265)(1.6)(1)(1) � 424 psi
Pure bending modulus of elasticity for bending about the strong x–x axis:
E� � E C Cxx xx M t
6 6� (1.8 � 10 )(1)(1) � 1.8 � 10 psi
TABLE 3.11 Applicable Design Load Combinations
Roof Beams Floor Beams Columns
E � 0, L � 0, F � 0,H � 0, T � 0a
Lr � 0, S � 0, E � 0, W �0, H � 0, F � 0, T � 0a
D � (Lr or S or R)
D � 0.75W � 0.75(Lr or S or R)
0.6D � W
D � L
Design for only one loadcombination
Check all eight loadcombinations in Section 2.1
a See load combinations in Section 2.1 for definition of the various load symbols.
EXAMPLE 3.5
Governing Load Combination (Beams)
For a roof beam subject to the following loads, determine the most critical load combination using thenormalized load method: D � 10 psf, Lr � 16 psf, S � 20 psf, W � 5 psf (downward). Assume that the windload was calculated according to the IBC or ASCE 7 load standard.
Solution:
Dead load D � 10 psf
Roof live load L � 16 psfr
Snow load S � 20 psf
Wind load W � �5 psf (since there is no wind uplift, W � 0 in load combination 5)
All other loads are neglected.
Note: Loads with zero values are not considered in determination of the load duration factor for that loadcombination and have been excluded from the load combinations
not the normalized load. The normalized load method is applicable only if all the loads in theload combination are of the same type and pattern. For example, the method is not valid if inthe same load combination, some loads are uniform loads (given in psf or ksf) and others areconcentrated loads (given in kips or lbs). When a load value is zero in a load combination, thatload is neglected when determinating the governing load duration factor CD for that load com-bination.

76 � S T R U C T U R A L W O O D D E S I G N
Since all the loads are distributed uniformly with the same units of pounds per square foot, the load type orpatterns are similar. Therefore, the normalized load method can be used to determine the most critical loadcombination. The applicable load combinations are shown in Table 3.12.
TABLE 3.12 Applicable and Governing Load Combination
Load CombinationValue of Load
Combination, w
CD Factor forLoad
CombinationNormalized Load,
w/CD
D 10 psf 0.9� 11.1
10
0.9
D � Lr 10 � 16 � 26 psf 1.25� 20.8
26
1.25
D � S 10 � 20 � 30 psf 1.15� 26.1 ⇐ (governs)
30
1.15
D � 0.75W � 0.75Lr 10 � (0.75)(5 � 16) � 25.8 psf 1.6� 16.1
25.8
1.6
D � 0.75W � 0.75S 10 � (0.75)(5 � 20) � 28.8 psf 1.6� 18.0
28.8
1.6
0.6D � W (0.6)(10) � (5)a � 11 psf 1.6� 6.9
11
1.6
a In load combinations 7 and 8 given in Section 2.1, the wind load W and seismic load E are always opposed by the dead load D. Therefore,in these combinations, D takes on a positive number while W and E take on negative values only.
Summary:• The governing load combination is D � S because it has the highest normalized load.• The roof beam should be designed for a total uniform load of 30 psf with a load duration factor CD �
1.15.
EXAMPLE 3.6
Governing Load Combination (Columns)
For a two-story column subject to the axial loads given below, determine the most critical load combinationusing the normalized load method. Assume that the wind loads have been calculated in accordance with theIBC or ASCE 7 load standard.
Roof dead load D � 10 kipsroof
Floor dead load D � 10 kipsfloor
Roof live load L � 12 kipsr
Floor live load L � 20 kips
Snow load S � 18 kips
Wind load W � �10 kips
Earthquake or seismic load E � �12 kips

A L L O W A B L E S T R E S S D E S I G N M E T H O D � 77
Solution: In the load combinations, the dead load D is the sum of the dead loads from the all levels of thebuilding. Thus,
D � D � D � 10 kips � 10 kips � 20 kipsroof floor
Since all the loads on this column are concentrated axial loads and therefore similar in pattern or type, thenormalized load method can be used (Table 3.13)
TABLE 3.13 Applicable and Governing Load Combination
Load CombinationValue of Load
Combination, P
CD Factor forLoad
CombinationNormalized Load,
P/CD
D 20 kips 0.9� 22.2
20
0.9
D � L 20 � 20 � 40 kips 1.0� 40
40
1.0
D � Lr 20 � 12 � 32 kips 1.25� 25.6
32
1.25
D � S 20 � 18 � 38 kips 1.15� 33.0
38
1.15
D � 0.75L � 0.75Lr 20 � (0.75)(20 � 12) � 44 kips 1.25� 35.2
44
1.25
D � 0.75L � 0.75S 20 � (0.75)(20 � 18) � 48.5 kips 1.15� 42.2 ⇐48.5
1.15(governs)
D � 0.75W �0.75L � 0.75Lr
20 � (0.75)(10 � 20 � 12)� 51.5kips
1.6� 32.2
51.5
1.6
D � 0.75W �0.75L � 0.75S
20 � (0.75)(10 � 20 � 18) � 56kips
1.6� 35
56
1.6
D � (0.75)(0.7E) �0.75L � 0.75Lr
20 � (0.75)[(0.7)(12) � 20 � 12]� 50.3 kips
1.6� 31.4
50.3
1.6
D � (0.75)(0.7E) �0.75L � 0.75S
20 � 0.75[(0.7)(12) � 20 � 18] �54.8 kips
1.6� 34.3
54.8
1.6
0.6D � W (0.6)(20) � (�10)a � 22 kips 1.6� 13.8
22
1.6
0.6D � 0.7E (0.6)(20) � (0.7)(�12)a � 20.4kips
1.6� 12.8
20.4
1.6
a In load combinations 7 and 8 given in Section 2.1 the wind load W and seismic load E are always opposed by the dead load D. Therefore, inthese combinations, D takes on a positive number while W and E take on negative values only.
Summary:
• The governing load combination is dead load plus floor live load plus snow load (D � 0.75L � 0.75S )because it has the highest normalized load.
• The column should be designed for a total axial load P � 48.5 kips with a load duration factor CD �1.15.

78 � S T R U C T U R A L W O O D D E S I G N
REFERENCES
1. ANSI/AF&PA (2005), National Design Specification for Wood Construction, American Forest &Paper Association, Washington, DC.
2. ANSI/AF&PA (2005), National Design Specification Supplement: Design Values for Wood Construc-tion, American Forest & Paper Association, Washington, DC.
3. Willenbrock, Jack H., Manbeck, Harvey B., and Suchar, Michael G. (1998), Residential BuildingDesign and Construction, Prentice Hall, Upper Saddle River, NJ.
4. Ambrose, James (1994), Simplified Design of Wood Structures, 5th ed., Wiley, New York.5. Halperin, Don A., and Bible, G. Thomas (1994), Principles of Timber Design for Architects and
Builders, Wiley, New York.6. Stalnaker, Judith J., and Harris, Earnest C. (1997), Structural Design in Wood, Chapman & Hall,
London.7. Breyer, Donald et al. (2003), Design of Wood Structures—ASD, 5th ed., McGraw-Hill, New York.8. NAHB (2000), Residential Structural Design Guide—2000, National Association of Home Builders
Research Center, Upper Marlboro, MD.9. Kim, Robert H., and Kim, Jai B. (1997), Timber Design for the Civil and Structural Professional
Engineering Exams, Professional Publications, Belmont, CA.10. Hoyle, Robert J., Jr. (1978), Wood Technology in the Design of Structures, 4th ed., Mountain Press,
Missoula, MT.11. DeStafano, Jim (2003), Exposed Laminated Timber Roof Structures, STRUCTURE, pp. 16–17,
March.
PROBLEMS
3.1 Explain why and how stress adjustment factors are used in wood design.3.2 List the various stress adjustment factors used in the design of wood members.3.3 Determine the load duration factors for the following IBC load combinations.
(a) D � F (IBC Equation 16-8)(b) D � H � F � L � T (IBC Equation 16-9)
(c) D � H � F � (Lr or S or R) (IBC Equation 16-10)(d) D� H � F � 0.75(L � T ) � 0.75(Lr or S or R) (IBC Equation 16-11)(e) D � H � F � (W or 0.7E ) (IBC Equation 16-12)(f) D � H � F � 0.75 (W or 0.7E ) � 0.75L
� 0.75(Lr or S or R) (IBC Equation 16-13)
(g) 0.6D � W � H (IBC Equation 16-14)(h) 0.6D � 0.7E � H (IBC Equation 16-15)
3.4 What is glulam, and how is it manufactured?3.5 Described briefly the various grades of glulam.3.6 Describe the two ways of specifying glulam.3.7 What is the advantage of the stress class system for specifying glulam?3.8 Given a 2 � 12 Douglas fir-larch Select Structural wood member that is fully braced
laterally, subject to dead load � wind load � snow load, and exposed to the weatherunder normal temperature conditions, determine all applicable allowable stresses.
3.9 Given a 10 � 20 Douglas fir-larch Select Structural roof girder that is fully braced forbending and subject to dead load � wind load � snow load. Assuming dry service andnormal temperature conditions, calculate the allowable bending stress, shear stress, modulusof elasticity, and bearing stress perpendicular to the grain.
3.10 A � 36 in. 24F–V8 DF/DF (i.e., 24F–1.8E) simply supported glulam roof girder spans1–58
50 ft, is fully braced for bending, and supports a uniformly distributed dead load � snowload � wind load combination. Assuming dry service and normal temperature conditions,calculate the allowable bending stress, shear stress, modulus of elasticity, and bearing stressperpendicular to the grain.

A L L O W A B L E S T R E S S D E S I G N M E T H O D � 79
3.11 A � 36 in. 24F–V8 DF/DF (i.e., 24F–1.8E) simply supported glulam floor girder3–64
spans 64 ft between simple supports and supports a uniformly distributed dead load � floorlive load combination. The compression edge of the beam is laterally braced at 8 ft oncenters. Assuming dry service and normal temperature conditions, calculate the allowablebending stress, shear stress, modulus of elasticity, and bearing stress perpendicular to thegrain.
3.12 For a roof beam subject to the following loads, determine the most critical load combi-nation using the normalized load method: D � 20 psf, Lr � 20 psf, S � 35 psf, and W� 10 psf (downward). Assume that the wind load was calculated according to the IBC orASCE 7 load standard.
3.13 For a column subject to the axial loads given below, determine the most critical loadcombination using the normalized load method. Assume that the wind loads have beencalculated according to the IBC or ASCE 7 load standard.
Roof dead load D � 8 kipsroof
Floor dead load D � 15 kipsfloor
Roof live load L � 15 kipsr
Floor live load L � 26 kips
Snow load S � 20 kips
Wind load W � �8 kips
Earthquake or seismic load E � �10 kips

80
c h a p t e r f o u r
DESIGN AND ANALYS IS OF BEAMS
AND GIRDERS
4.1 DESIGN OF JOISTS, BEAMS, AND GIRDERS
In this chapter we introduce procedures for the analysis and design of joists, beams, and girders.These horizontal structural members are usually rectangular in cross section with bending aboutthe strong (x–x) axes, and they are used in the framing of roofs and floors of wood buildings.The stresses that need to be checked in the design and analysis of these structural elements include(1) bending stresses (including beam lateral torsional buckling), (2) shear stresses, (3) deflection(live load and long-term deflections), and (4) bearing stresses.
Definition of Beam Span
The span of a beam or girder is defined as the clear span face to face of supports, Ln, plus one-half the required bearing length, lb, req’d, at each end of the beam. Thus, the span L � Ln �lb, req’d (see Figure 4.1). In practice, it is conservative to assume the span of a beam as the distancebetween the centerline of the beam supports.
Layout of Joists, Beams, and Girders
It is more economical to lay out the joists or beams to span the longer direction of the roof orfloor bay with the girders spanning the short direction, since the girders are usually more heavilyloaded than are the joists or beams (Figure 4.2). The maximum economical bay size for woodframing using sawn-lumber joists and girders is approximately 14 � 14 ft. Longer girder spanscan be achieved using glulams.
Design Procedure
In designing beams and girders, the first step is to calculate all the loads and load effects, andthen the beam size is selected to satisfy the bending, shear, deflection, and bearing stress require-ments. The design procedure for sawn-lumber joists, beams, or girders and glulam beams andgirders is as follows.
Check of Bending Stress
1. Calculate all the loads and load effects, including maximum moment, shear, and reactions.Also calculate the dead and live loads that will be used later for deflection calculations.
Note: Because of the relatively significant self-weight of girders, an assumption mustinitially be made for the girder self-weight and included in calculation of the load effectsfor the girder. This self-weight is checked after the final girder selection is made. As pre-viously discussed, a wood density of 31.2 lb/ft3 is used in this book to calculate the self-weight of the wood member. Alternatively, the self-weight could be obtained directly
Structural Wood Design: A Practice-Oriented Approach Using the ASD Method. Abi Aghayere and Jason VigilCopyright © 2007 John Wiley & Sons, Inc.

D E S I G N A N D A N A L Y S I S O F B E A M S A N D G I R D E R S � 81
FIGURE 4.1
Definition of beamspan.
FIGURE 4.2 Typicalroof and floorframing layout.

82 � S T R U C T U R A L W O O D D E S I G N
from NDS-S Table 1B, 1C, or 1D by interpolation between the densities given. This notapplicable to joists because of their relatively small self-weight, which is usually alreadyincluded in the pounds per square foot roof or floor dead load.
2. Assume a stress grade (i.e., Select Structural, No. 1 & Better, No. 1, etc.) and size classifi-cation (i.e., dimension lumber, timbers, glulam, etc.), and determine the applicableNDS-S table to be used in the design.
3. Assume initially that the allowable bending stress is equal to the NDS-S tabulatedF�bbending stress, Fb. That is, assume that � Fb, NDS-S. Therefore, the required approxi-F�bmate section modulus of the member is given as
MmaxS � (4.1)xx, req’d Fb
4. Using the approximate section modulus Sxx calculated in step 3, select a trial member sizefrom NDS-S Table 1B (for sawn lumber), NDS-S Table 1C (for western species glulam),or NDS-S Table 1D (for southern pine glulam). For economy, the member size with theleast area that has a section modulus at least equal to that required from step 2 should beselected.
5. For the member size selected in step 4, determine all the applicable stress adjustment orC factors, obtain the tabulated NDS-S bending stress, Fb and calculate the actual allowablebending stress,
F� � F (product of applicable adjustment or C factors) (4.2)b b
6. Using the size selected in step 4, calculate the applied bending stress fb and compare thisto the actual allowable bending stress calculated in step 5. Check if the applied bendingstress fb � Mmax/Sxx is less than the actual allowable bending stress calculated in step 5.F�b(a) If fb � Mmax/Sxx � the beam is adequate in bending.F�,b
(b) If fb � Mmax/Sxx � the beam is not adequate in bending; increase the memberF�,b
size and repeat the design process.
Check of Shear StressWood is weaker in horizontal shear than in vertical shear because of the horizontal direction
of the wood grain relative to the vertical shear force. Thus, horizontal shear is the most criticalshear stress for wood members. For vertical shear, the shear force is perpendicular to the grain,whereas for horizontal shear, the shear force is parallel to the grain, and only the lignin thatglues the fibers together (see Chapter 1) is available to resist this horizontal shear.
The critical section for shear can conservatively be assumed to be at the face of the beambearing support. Where the beam support is subjected to confining compressive stresses as shownin Figure 4.3, and where there are no applied concentrated loads within a distance d from theface of the beam support, the critical section for shear can be assumed to be at a distance d fromthe face of the beam support. Where a beam or joist is supported off the face of a girder onjoist or beam hangers, the critical for shear should be taken at the face of the support.
The relationship between the shear stress applied in a rectangular wood beam at the cen-terline of the beam support fv and the allowable shear stress is calculated asF�v
1.5Vf � � F� (4.3)v vA
If applicable, the reduced applied shear stress at a distance d from the face of the beam supportis calculated as
1.5V�f� � � F� (4.4)v vA
where V � maximum shear at the critical section; for simplicity, this critical section can con-servatively be assumed to be at the centerline of the joist, beam, or girder bearingsupport

D E S I G N A N D A N A L Y S I S O F B E A M S A N D G I R D E R S � 83
FIGURE 4.3 Critical section for shear. FIGURE 4.4 Beam deflection diagrams.
V� � applied shear at a distance d from the face of the support�F�v allowable shear stress � FvCDCMCtCi
The C factors are discussed in Chapter 3. Where there is a concentrated load on the beamwith full bearing within a distance d from the face of the beam support, the critical section forshear will be at the face of the beam support. For these cases, use equation (4.3). The followingshear design checks need to be made:
1. If fv or � , the beam is adequate in shear.f� F�v v
2. If fv or � , the beam is not adequate; therefore, increase the beam size and recheckf� F�v v
the shear stress.
Note: If the shear stress fv at the centerline of the beam support is adequate (i.e., � F�),v
there is no need to calculate further the shear stress at a distance d from the face of the supportf�vsince it is obvious that would be less than fv and thus will be adequate in that case. However,f�vfor situations where the calculated shear stress fv at the centerline of the beam support is notadequate (i.e., fv � the shear stress should then be checked. If is less than or equal toF�), f� f�v v v
the allowable shear stress, the beam is deemed adequate. If, on the other hand, is alsoF�, f�v v
greater than the beam size and/or stress grade would have to be increased until is just lessF�, f�v v
than or equal to .F�v
Check of Deflection (Calculating the Required Moment of Inertia)The beam or girder deflection is calculated using engineering mechanics principles and
assuming linear elastic material behavior. The maximum deflection is a function of the type ofloading, the span of the beam, and the allowable pure bending modulus of elasticity E� (� ECMCtCi). The formulas for the beam deflections under two common loading conditions areshown in Figure 4.4.
The deflection limits from IBC Section 1604.3.6 [1] are given in Table 4.1, and k is a factorthat accounts for creep effects in wood members, which is the continuous deflection of woodmembers under constant load due to drying shrinkage and moisture loss. It should be noted thatfor the dead plus live load deflection, it is the incremental deflection that needs to be calculatedand compared to the deflection limits, and this incremental dead plus live load deflection includesthe effects of creep, but excludes the instantaneous dead-load deflection, which takes place duringconstruction and before any of the deflection-sensitive elements such as glazing, masonry walls,or marble flooring are installed. If the deflection limits in Table 4.1 are satisfied, the beam is

84 � S T R U C T U R A L W O O D D E S I G N
TABLE 4.1 Deflection Limits for Joists, Beams, and Girdersa
Deflection Deflection Limit
Live-load deflection �LL L360
Incremental long-term deflection due to dead load plus live load(including creep effects), �TL � k�DL � �LL
L240
Source: Ref. 1, Section 1604.3.6.a k is 1.0 for green or unseasoned lumber or glulam used in wet service conditions, 1.0 for seasoned lumber used in wetservice conditions, and 0.5 for seasoned or dry lumber, glulam, and prefabricated I-joists used in dry service conditions.L is the span of a joist, beam, or girder between two adjacent supports, �DL is the deflection due to dead load D, and�LL is the deflection due to live load L or (L r or S).
considered adequate for deflection; otherwise, the beam size has to be increased and the deflec-tion rechecked. When the live load is greater than twice the dead load, the L/360 limit willcontrol.
There might be occasions, especially for large-span girders, such as glulam girders, wherealthough the deflection limits are satisfied, the absolute value of these deflections may be suffi-ciently large (say, greater than 1 in.) as to become unsightly. It can also increase the possibilityof ponding in panelized roofs. Ponding is the increase in rain load on flat roofs due to watercollecting in the roof depressions caused by the beam and girder deflections. This increase inloading causes more deflections which in turn further increases the roof live load. This cycle cancontinue and may lead to roof failure. In these cases it may be prudent to camber the girder tonegate the effect of the downward deflection. Cambering is the fabrication of a beam or girderwith a built-in upward deflection, usually equal to 1.5 times the dead-load deflection for glulamroof beams and 1.0 times the dead load deflection for floor beams with the intent that when loadsare applied, the beam or girder will become essentially flat or horizontal. Cambering of thecantilevered portion of cantilevered beams is not recommended. For beams and girders in flatroofs, further analysis for possible ponding should be carried out when the beam deflectionexceeds in. under a uniform load of 5 psf. [24].1–2
The deflection limits provided in this section are intended to limit the cracking of nonstruc-tural elements and finishes, due to large deflections, and are also intended to help control floorvibrations or bouncing floors. However, these deflection limits have been found to be unsatis-factory for controlling floor vibrations for floor joist with spans exceeding about 15 ft. Wherefloor joist spans exceed about 15 ft, it is recommended [15] that a live-load deflection limit of0.5 in. be used. It should be noted that where floor joists are supported on floor girders insteadof stud walls, the floor vibration will be magnified because of the flexibility of both the joistsand the girders. The girders should be designed to a smaller deflection limit than L/360 tocontrol the floor vibration. To help control floor vibration, it is also recommended that theplywood sheathing be nailed as well as glued to the floor joists. We discuss the topic of floorvibrations in more detail in Section 4.7.
An alternative approach to calculating the deflections is to calculate the required momentof inertia by equating the deflection to the appropriate deflection limit. For example, for auniformly loaded beam or girder, we obtain the required moment of inertia based on the live load,
45w L LLL� � �LL 384E�I 360
Solving and rearranging the equation above yields the required moment of inertia,
35w LLL 4I � (360) in (4.5)req’d 384E�

D E S I G N A N D A N A L Y S I S O F B E A M S A N D G I R D E R S � 85
Similarly, the moment of inertia required based on the total load is obtained for a uniformly loadedbeam or girder as
35w Lk(DL)�LL 4I � (240) in (4.6)req’d 384E�
The higher moment of inertia from equations (4.5) and (4.6) will govern.
Check of Bearing Stress (Compression Stress Perpendicular to the Grain)
FIGURE 4.5 Bearing at supports and at interior loads.
The NDS-S tabulated design stress perpendicular to thegrain, Fc�, is based on a deformation limit of 0.04 in. for asteel plate bearing on a wood member (Figure 4.5). If a lowerdeformation limit is desired, the NDS code provides anequation for calculating the equivalent tabulated design valuefor the lower deformation limit of 0.02 in. based on NDS-S tabulated values:
F � 0.73F (4.7)c�, 0.02 c�, NDS-S
The applied bearing stress or compression stress perpen-dicular to the grain is calculated as
R1f � � F� (4.8)c� c�Abearing
where �F�c� allowable bearing stress perpendicular to the grainR1 � maximum reaction at the support
Abearing � bearing area � (thickness of beam)(bearing length) � blbFc� � NDS-S tabulated design stress perpendicular to the grainfc� � applied bearing stress perpendicular to the grain
The minimum required bearing length lb is obtained by rearranging equation (4.8). Thus,
R1l � (4.9)b, req’d bFc�
If the bearing length lb required from equation (4.9) is greater than the bearing length available,the designer or engineer can do one of two things: increase beam thickness b and/or use a stressgrade that gives a higher value of The practical recommended minimum bearing length isF� .c�
1.5 in. for wood members bearing on wood and 3 in. for wood members bearing on masonryor concrete walls [15].
Some of the bearing details that could be used for joists, beams, or girders are shown inFigure 4.6. In Figure 4.6a, the joists from the adjacent spans butt against each other at the girdersupport with a tolerance gap of approximately in. provided; thus, the bearing length available1–2for the joist will be less than one-half the thickness b of the supporting girder. In the overlappingjoist detail (Figure 4.6c), the bearing length available for the joist is equal to the thickness b ofthe girder. In Figure 4.6b, the joist or beam is supported off the face of the girder with proprietaryjoist or beam hangers. The available bearing length for this detail is given in the manufacturer’scatalog for each hanger. Figure 4.6d shows the girder support at a wood column using a U-shaped column cap. The available length of bearing for the girder in this detail will depend onthe length of the U-shaped column cap.

86 � S T R U C T U R A L W O O D D E S I G N
FIGURE 4.6 Bearingdetails for joist,beams, and girders.
(a)
(c)
(b)
(d)
4.2 ANALYSIS OF JOISTS, BEAMS, AND GIRDERS
In the analysis of beams and girders, the beam or girder size, stress grade, and size classificationare usually known, and the load is usually known or can be calculated. The intent is to determineif the existing beam or girder is adequate to resist the loads applied or to calculate the loadcapacity of the beam or girder. The analysis procedure for sawn-lumber joists, beams, or girdersand glulam beams and girders is as follows.
Check of Bending Stress
1. Calculate all the loads and load effects, including the maximum moment, shear, and re-actions. Also calculate the dead and live loads that will be used later for the deflectioncalculations. Include the self-weight of the member.
2. From the known stress grade (i.e., Select Structural, No. 1 & Better, No. 1, etc.) andsize classification (i.e., dimension lumber, timbers, glulam, etc.), determine the applicableNDS-S table to be used in the design.
3. Determine the cross-sectional area Axx, the section modulus Sxx, and the moment of in-ertia Ixx from NDS-S Table 1B (for sawn lumber), NDS-S Table 1C (for western spe-cies glulam), or NDS-S Table 1D (for southern pine glulam).
4. Determine the applied bending stress fb.
Mmaxf � (4.10)b Sxx
5. Determine all the applicable stress adjustment or C factors, obtain the tabulated NDS-Sbending stress Fb, and calculate the allowable bending stress using equation (4.2):
F� � F (product of applicable adjustment or C factors)b b
6. Compare the applied stress fb from step 4 to the allowable bending stress calculated inF�bstep 5.

D E S I G N A N D A N A L Y S I S O F B E A M S A N D G I R D E R S � 87
EXAMPLE 4.1
Design of Joist (or Beams) and Girders
A typical floor plan in the private room areas of a hotel building is shown in Figure 4.7. Design a typical (a)joist B1 and (b) girder G1 assuming the use of Douglas fir-larch.
FIGURE 4.7 Typical floor plan.
Solution:
(a) Design of floor joist B1 (Figure 4.8). Joist span � 18.5 ft. For private room areas and corridors servingthem, the floor live load L � 40 psf.
FIGURE 4.8 Free-body diagram of joist B1.
Dead load:
1-in. gypsum � 6 psf
1–1-in. plywood sheathing (0.4 psf/ in. � 6) � 2.4 psf (assumed)8
Framing: 2 � 14 at 16 in. o.c. � 3.3 psf (assumed self-weight of floor framing)
Mechanical and electrical � 8 psf (assumed)
Partitions � 20 psf (15 psf is the minimum value allowed; see Chapter 2)
Total dead load D � 39.7 psf � 40 psf

88 � S T R U C T U R A L W O O D D E S I G N
16 in. 2Tributary area of joist or beam B1 � (18.5 ft) � 25 ft� �12
From Chapter 2 and Table 2.2, we obtain the following parameters: AT, the tributary area � 25 ft2 and KLL �2 (interior beam or girder).
2 2 2K A � (2)(25 ft ) � 50 ft � 400 ftLL T
Therefore, no live-load reduction is permitted. The tributary width (TW) of joist or beam B1 � 16 in. � 1.33ft. The total uniform load on the joist that will be used to design the joist for bending, shear, and bearing is
w � (D � L)(TW) � (40 psf � 40 psf )(1.33 ft) � 107 lb/ftTL
Using the free-body diagram of joist B1, the load effects are calculated as follows:
w L (107 lb/ft)(18.5 ft)TLMaximum shear, V � R � � � 990 lbmax max 2 2
2 2w L (107 lb/ft)(18.5 ft)TLMaximum moment M � � � 4580 ft-lb � 55,000 in.-lbmax 8 8
The following loads will be used for calculating the joist deflections:
uniform dead load w � (40 psf )(1.33 ft) � 54 lb/ft � 4.5 lb/in.DL
uniform live load w � (40 psf )(1.33 ft) � 54 lb/ft � 4.5 lb/in.LL
We now proceed with the design following the steps described previously in this chapter.
Check of Bending Stress
1. Summary of load effects (the self-weight of joist B1 was included in the determination of the floor deadload in psf ):
maximum shear V � 990 lbmax
maximum reaction R � 990 lbmax
maximum moment M � 55,000 in.-lbmax
uniform dead load is w � 4.5 lb/in.DL
uniform live load is w � 4.5 lb/in.LL
2. For the stress grade, assume Select Structural, and assume that the size classification for the joist isdimension lumber. Thus, use NDS-S Table 4A.
3. From NDS-S Table 4A, we find that Fb � 1500 psi. Assume initially that � Fb � 1500 psi. FromF�bequation (4.1) the approximate section modulus of the member required is given as
M 55,000max 3S � � � 37 inxx, req’d F 1500b

D E S I G N A N D A N A L Y S I S O F B E A M S A N D G I R D E R S � 89
4. From NDS-S Table 1B, determine the trial size with the least area that satisfies the section modulusrequirement of step 3: Try a 2 � 14 DF-L Select Structural member.
b � 1.5 in. and d � 13.25 in.
Size is still dimension lumber as assumed in step 1. OK
3 3S provided � 43.9 in � 37 in OKxx
2Area A provided � 19.88 in
4I provided � 290.8 inxx
5. The NDS-S tabulated stresses are
F � 1500 psib
F � 180 psiv
F � 625 psic�
6E � 1.9 � 10 psi
The adjustment or C factors are listed in Table 4.2. Using equation (4.2), the allowable bending stress is
F� � F (product of applicable adjustment or C factors)b b
� F C C C C C C C Cb D M t L F r fu i
� (1500)(1.0)(1.0)(1.0)(0.9)(1.15)(1.0)(1.0) � 1553 psi
TABLE 4.2 Adjustment Factors for Joists
Adjustment Factor Symbol Value Rationale for the Value Chosen
Beam stability factor CL 1.0 The compression face is fully braced by the floor sheathing
Size factor CF(Fb) 0.9 From NDS-S Table 4A
Moisture or wetservice factor
CM 1.0 The equilibrium moisture content is � 19%
Load duration factor CD 1.0 The largest CD value in the load combination of dead loadplus floor live load (i.e., D � L)
Temperature factor Ct 1.0 Insulated building; therefore, normal temperatureconditions apply
Repetitive memberfactor
Cr 1.15 All the three required conditions are satisfied:• The 2 � 14 trial size is dimension lumber• Spacing � 16 in. � 24 in.• Plywood floor sheathing nailed to joists
Bearing stress factor Cb 1.0Cb � for lb � 6 in.
l � 0.375b
lb� 1.0 for lb � 6 in.� 1.0 for bearings at the ends of a member
(see Section 3.1)
Flat use factor Cfu 1.0
Incision factor Ci 1.0

90 � S T R U C T U R A L W O O D D E S I G N
6. The actual applied bending stress is
M 55,000 lb-in.maxf � � � 1253 psib 3S 43.9 inxx
� F� � 1553 psi OKb
Therefore, the beam is adequate in bending.
Check of Shear StressVmax � 990 lb. The beam cross-sectional area A � 19.88 in2. The applied shear stress in the wood beam at thecenterline of the beam support is
1.5V (1.5)(990 lb)f � � � 75 psiv 2A 19.88 in
The allowable shear stress is
F� � F C C C C � (180)(1)(1)(1)(1) � 180 psiv v D M t i
Thus, fv � ; therefore, the beam is adequate in shear.F�v
Note: Since the shear stress fv at the centerline of the beam support is adequate (i.e., � there is noF�),v
need to calculate the shear stress further at a distance d from the face of the support since it is obvious thatf � f �v v
would be less than fv, and thus will be adequate in that case.
Check of Deflection (see Table 4.3)The allowable pure bending modulus of elasticity is
6 6E� � EC C C � (1.9 � 10 )(1.0)(1.0)(1.0) � 1.9 � 10 psiM t i
The moment of inertia about the strong axis Ixx � 290.8 in4, the uniform dead load is wDL� 4.5 lb/in., andthe uniform live load is wLL � 4.5 lb/in.
TABLE 4.3 Joist Deflection Limit
Deflection Deflection Limit
Live-load deflection �LL
L (18.5 ft)(12)� � 0.62 in.
360 360
Incremental long-term deflection due to dead load plus live load (including creepeffects),
�TL � k�DL � �LL
L (18.5 ft)(12)� � 0.93 in.
240 240
The dead-load deflection is4 45wL (5)(4.5 lb/in.)(18.5 ft � 12)
� � � � 0.26 in.DL 6 4384E� (384)(1.9 � 10 psi)(290.8 in )I
The live-load deflection is4 45wL (5)(4.5 lb/in)(18.5 ft � 12) L
� � � � 0.26 in. � OKLL 6 4384E� (384)(1.9 � 10 psi)(290.8 in ) 360I
Since seasoned wood in dry service conditions is assumed to be used in this building, the creep factor k � 0.5.The total incremental dead plus floor live load deflection is

D E S I G N A N D A N A L Y S I S O F B E A M S A N D G I R D E R S � 91
� � k(� ) � �TL DL LL
L� (0.5)(0.26 in.) � 0.26 in. � 0.39 in. � OK
240
Alternatively, the required moment of inertia can be calculated using equations (4.5) and (4.6) as follows:
3 35w L (5)(4.5)(18.5 ft � 12)LL 4 4I � (360) in � (360) � 144.2 inreq’d 6384E� (384)(1.6 � 10 )
Similarly, the required moment of inertia based on the total load is obtained for a uniformly loaded beam orgirder as
3 35w L (5)(0.5 � 4.5 � 4.5)(18.5 ft � 12)k(DL)�LL 4 4I � (240) in � (240) � 144.2 inreq’d 6384E� (384)(1.6 � 10 )
Therefore,
4 4the required moment of inertia � 144.2 in � I � 290.8 in OKactual
Check of Bearing Stress (Compression Stress Perpendicular to the Grain)The maximum reaction at the support R1 � 990 lb and the thickness of a 2 � 14 sawn-lumber joist, b � 1.5in. The allowable bearing stress or compression stress parallel to the grain is
F� � F C C C C � (625)(1.0)(1.0)(1.0)(1.0) � 625 psic� c� M t b i
From equation (4.9), the minimum required bearing length lb is
R 990 lb1l � � � 1 in.b, req’d bF� (1.5 in.)(625 psi)c�
The floor joists will be connected to the floor girder using face-mounted joist hangers with the top of the joistsat the same level as the top of the girders. From a proprietary joist hanger load table (Figure 4.9) connectorcatalog, select a face-mounted hanger JH-214 with the following properties:
FIGURE 4.9 Generic load table for joist hangers.
Load duration factor, CD for dead plus floor live load � 1.0 � 100%.
Therefore, the allowable load for JH-214 � 1280 lb � maximum reaction � 990 lb
Available bearing length � 2 in. � L � 1 in. OKb, req’d
Use a 2 � 14 DF-L Select Structural for joist B1.

92 � S T R U C T U R A L W O O D D E S I G N
(b) Design of floor girder G1. Girder span � 25 ft. Since the joist selected was 2 � 14, we would expect thegirder to be larger than a 2 � 14. Thus, the girder is probably going to be a timber (i.e., beam and stringer).Assume the girder self-weight � 90 lb/ft (this will be checked later). For hotels, the live load L � 40 psf.
Dead load:From the design of the floor joist B1, total dead load, D � 40 psf.
18.5 ft 18.0 ftTributary width of girder G1 � � � 18.25 ft
2 2
2Tributary area of girder G1 � (18.25 ft)(25 ft) � 456 ft
From ASCE 7 Table 4-2, AT, the tributary area � 456 ft2, and KLL � 2(interior girder).
• KLLAT � (2)(456 ft2) � 912 ft2 � 400 ft2
• Floor live load L � 40 psf � 100 psf• Floor occupancy is not assembly occupancy
Since all the conditions above are satisfied, live-load reduction is permitted.Live-load reduction. The reduced or design floor live load for the girder is calculated using equation (2.7) as
follows:
15 15L � L 0.25 � � (40 psf ) 0.25 � � 30 psf� � � �0 �K A �(2)(456)LL T
� (0.50)(40 psf ) � 20 psf for members supporting one floor (e.g., slabs, beams, and girders)� (0.40)(40 psf ) � 16 psf for members supporting two or more floors (e.g., columns)
The total uniform load on the girder that will be used to design for bending, shear, and bearing is obtainedbelow using the dead load, the reduced live load calculated above, and the assumed self-weight of the girder,which will be checked later.
w � (D � L) (tributary width) � girder self-weightTL
� (40 psf � 30 psf )(18.25 ft) � 90 lb/ft � 1368 lb/ft
Using the free-body diagram of girder G1 (Figure 4.10), the load effects are calculated as follows:
w L (1368 lb/ft)(25 ft)TLmaximum shear V � � � 17,100 lbmax 2 2
maximum reaction R � 17,100 lbmax
2 2w L (1368 lb/ft)(25 ft)TLmaximum moment M � � � 106,875 ft-lb � 1,282,500 in.-lbmax 8 8
, ,
FIGURE 4.10 Free-body diagram of girder G1.
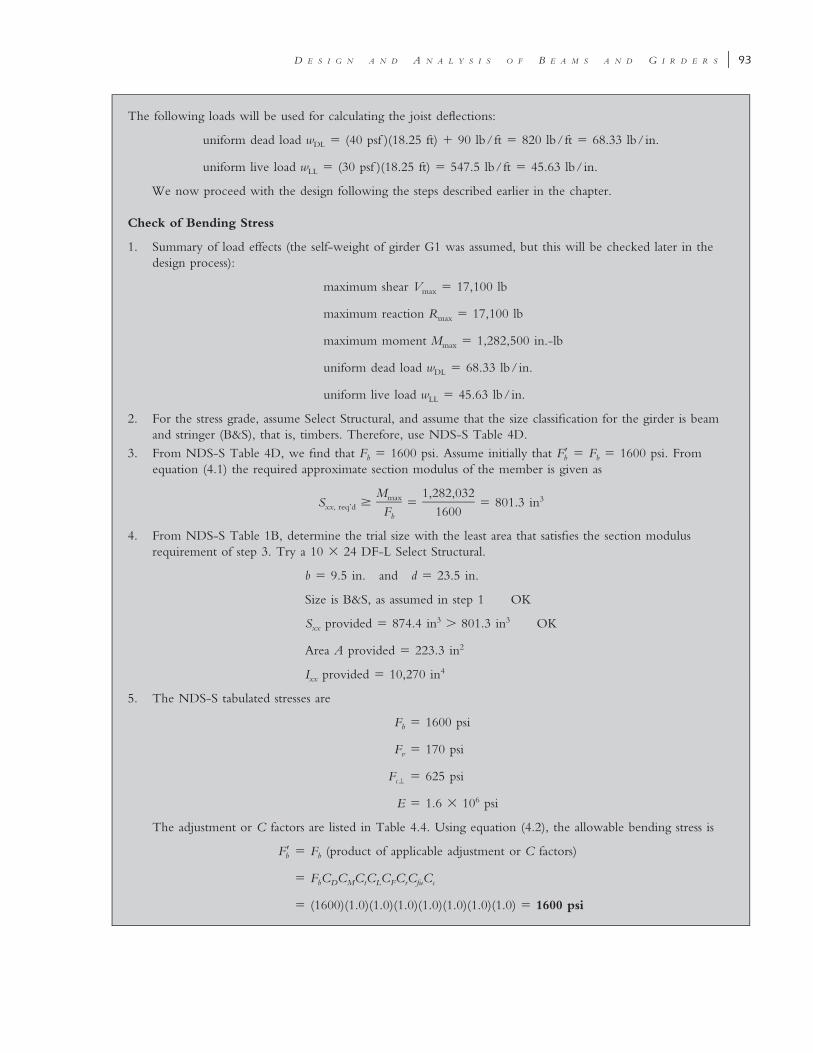
D E S I G N A N D A N A L Y S I S O F B E A M S A N D G I R D E R S � 93
The following loads will be used for calculating the joist deflections:
uniform dead load w � (40 psf )(18.25 ft) � 90 lb/ft � 820 lb/ft � 68.33 lb/in.DL
uniform live load w � (30 psf )(18.25 ft) � 547.5 lb/ft � 45.63 lb/in.LL
We now proceed with the design following the steps described earlier in the chapter.
Check of Bending Stress
1. Summary of load effects (the self-weight of girder G1 was assumed, but this will be checked later in thedesign process):
maximum shear V � 17,100 lbmax
maximum reaction R � 17,100 lbmax
maximum moment M � 1,282,500 in.-lbmax
uniform dead load w � 68.33 lb/in.DL
uniform live load w � 45.63 lb/in.LL
2. For the stress grade, assume Select Structural, and assume that the size classification for the girder is beamand stringer (B&S), that is, timbers. Therefore, use NDS-S Table 4D.
3. From NDS-S Table 4D, we find that Fb � 1600 psi. Assume initially that � Fb � 1600 psi. FromF�bequation (4.1) the required approximate section modulus of the member is given as
M 1,282,032max 3S � � � 801.3 inxx, req’d F 1600b
4. From NDS-S Table 1B, determine the trial size with the least area that satisfies the section modulusrequirement of step 3. Try a 10 � 24 DF-L Select Structural.
b � 9.5 in. and d � 23.5 in.
Size is B&S, as assumed in step 1 OK
3 3S provided � 874.4 in � 801.3 in OKxx
2Area A provided � 223.3 in
4I provided � 10,270 inxx
5. The NDS-S tabulated stresses are
F � 1600 psib
F � 170 psiv
F � 625 psic�
6E � 1.6 � 10 psi
The adjustment or C factors are listed in Table 4.4. Using equation (4.2), the allowable bending stress is
F� � F (product of applicable adjustment or C factors)b b
� F C C C C C C C Cb D M t L F r fu c
� (1600)(1.0)(1.0)(1.0)(1.0)(1.0)(1.0)(1.0) � 1600 psi

94 � S T R U C T U R A L W O O D D E S I G N
TABLE 4.4 Adjustment Factors for Glulam Girder
Adjustment Factor Symbol Value Rationale for the Value Chosen
Beam stability factor CL 1.0 The compression face is fully braced by the floorsheathing
Size factor CF 0.931 / 9 1 / 912 12
� � 0.93� � � �d 23.5 in.
Moisture or wetservice factor
CM 1.0 Equilibrium moisture content is � 19%
Load duration factor CD 1.0 The largest CD value in the load combination of deadload plus floor live load (i.e., D � L)
Temperature factor Ct 1.0 Insulated building; therefore, normal temperatureconditions apply
Bearing stress factor Cb 1.0Cb � for lb � 6 in.
l � 0.375b
lb� 1.0 for lb � 6 in.� 1.0 for bearings at the ends of a member
Flat use factor Cfu 1.0
Curvature factor Cc 1.0
6. The actual applied bending stress is
M 1,282,500 lb-in.maxf � � � 1466 psib 3S 874.4 inxx
� F� � 1600 psi OKb
Therefore, the beam is adequate in bending.
Check of Shear StressVmax � 17,100 lb. The beam cross-sectional area A � 223.3 in2. The applied shear stress in the wood beam atthe centerline of the girder support is
1.5V (1.5)(17,100 lb)f � � � 114.8 psiv 2A 223.3 in
FIGURE 4.11 Girder shear force diagram.

D E S I G N A N D A N A L Y S I S O F B E A M S A N D G I R D E R S � 95
The allowable shear stress is
F� � F C C C C � (170)(1)(1)(1)(1) � 170 psiv v D M t i
Thus, fv � ; therefore, the beam is adequate in shear. See Figure 4.11.F�vNote: Since the shear stress fv at the centerline of the girder support is adequate (i.e., � ), there is noF�v
need to calculate the shear stress at a distance d from the face of the support since it is obvious that wouldf � f �v v
be less than fv and thus will be adequate in that case.
Check of Deflection (see Table 4.5)The allowable pure bending modulus of elasticity is
6 6E� � EC C C � (1.6 � 10 )(1.0)(1.0)(1.0) � 1.6 � 10 psiM t i
The moment of inertia about the strong axis Ixx � 10,270 in4, the uniform dead load is wDL � 68.33 lb/in.,and the uniform live load is wLL � 45.63 lb/in.
TABLE 4.5 Girder Deflection Limit
Deflection Deflection Limit
Live-load deflection �LL L (25 ft)(12)� � 0.83 in.
360 360
Incremental long-term deflection due to dead load plus live load (including creep effects),�TL � k�DL � �LL
L (25 ft)(12)� � 1.25 in.
240 240
The dead-load deflection is
4 45wL (5)(68.33 lb/in.)(25 ft � 12)� � � � 0.44 in.DL 6 4384E � (384)(1.6 � 10 psi)(10,270 in )I
The live-load deflection is
4 45w L (5)(45.63 lb/in.)(25 ft � 12) LLL� � � � 0.29 in. � � 0.83 in. OKLL 6 4384E � (384)(1.6 � 10 psi)(10,270 in ) 360I
Since seasoned wood in dry service conditions is assumed to be used in this building, the creep factor k � 0.5.The total incremental dead plus floor live load deflection is
� � k� � �TL DL LL
L� (0.5)(0.44 in.) � 0.29 in. � 0.51 in. � � 1.25 in. OK
240
Alternatively, the required moment of inertia can be calculated using equations (4.5) and (4.6) as follows:
3 35w L (5)(45.63)(25 ft � 12)LL 4 4I � (360) in � (360) � 3609 inreq’d 6384E� (384)(1.6 � 10 )
Similarly, the required moment of inertia based on total load is obtained for a uniformly loaded beam or girder as
3 35w L (5)(0.5 � 68.33 � 45.63)(25 ft � 12)k(DL)�LL 4 4I � (240) in � (240) � 4208 inreq’d 6384E� (384)(1.6 � 10 )

96 � S T R U C T U R A L W O O D D E S I G N
Therefore,
4 4the required moment of inertia � 4208 in � I � 10,270 in OKactual
Check of Bearing Stress (Compression Stress Perpendicular to the Grain)The maximum reaction at the support R1 � 17,094 lb and the thickness of a 10 � 24 sawn-lumber joist b �9.5 in. The allowable bearing stress or compression stress parallel to the grain is
F� � F C C C C � (625)(1.0)(1.0)(1.0)(1.0) � 625 psic� c� M t b i
From equation (4.7), the minimum required bearing length lb is
R 17,100 lb1l � � � 2.88 in. say, 3 in.b,req’d bF� (9.5 in.)(625 psi)c�
The girders will be connected to the column using a U-shaped column cap detail as shown below, and theminimum length of the column cap required is
1–(3 in.)(2) � -in. clearance between ends of girders � 6.5 in.2
From a proprietary wood connector catalog, the maximum column cap width available for a U-shaped cap is9.5 in. Since this is not less than the thickness (smaller dimension) of the girder, the proprietary U-shaped capcan be used. Therefore, use a U-shaped column cap similar to that shown in Figure 4.6d.
Note: The maximum column cap width available in most catalogs is 9.5 in., so where the width of a girderor beam is greater than this value, a special column cap having a minimum width equal to the thickness (smallerdimension) of the girder or beam would have to be designed.
Check of Assumed Girder Self-WeightAs discussed in Chapter 2, the density of wood is assumed in this book to be 31.2 lb/ft3, and this is used tocalculate the actual weight of the girder selected.
Assumed girder self-weight � 90 lb/ftActual weight of the 10 � 24 girder selected (from NDS-S Table 1B):
2 3223.3 in (31.2 lb/ft )� 49 lb/ft which is less than the assumed value of 90 lb/ft OK
(12 in.)(12 in.)
Note: The actual self-weight of the girder in this example is less than the assumed self-weight. However, letus consider a fictitious case where the actual self-weight is greater than the assumed value by, say, 50%. Theself-weight calculated should then be used to recalculate the design loads, and the member should beredesigned. However, it should be noted that in many cases, the self-weight of the girder is usually a smallpercentage of the total load on the girder, and thus the total load is not affected significantly by even largepositive variations of up to a maximum of 50% in the girder self-weight.
Assume in our fictitious example that we had selected a girder size that has a self-weight of 135 lb/ft,which is 50% heavier than the 90 lb/ft that was assumed initially in the load calculations. Therefore, the revisedtotal load would become
w � (D � L)(tributary width) � girder self-weightTL
� (40 psf � 30 psf )(18.25 ft) � 135 lb/ft � 1413 lb/ft
Compared to the total load of 1368 lb/ft calculated previously using the assumed self-weight of 90 lb/ft, thepercentage increase in the total load and load effect for this fictitious example will be (1413 � 1368)/1368 �100% � 3%! This is quite a small and insignificant change for a 50% increase in girder self-weight, and thus itseffect can be neglected. So we find that for this girder, even a 50% increase in the self-weight of the girderwould not have had a significant effect on the total load and the load effects.
Use a 10 � 24 DF-L Select Structural for girder G1.

D E S I G N A N D A N A L Y S I S O F B E A M S A N D G I R D E R S � 97
(a) If fb � Mmax/Sxx � the beam is adequate in bending.F�,b
(b) If fb � Mmax/Sxx � the beam is not adequate in bending.F�,b
7. To determine the maximum allowable load or moment that a beam or girder can sup-port, based on bending stress alone, equate the allowable bending stress to Mmax/Sxx,F�band solve for the allowable maximum moment Mmax and thus the allowable maximumload. Therefore,
the allowable maximum moment M � F�S in.-lbmax b xx
F�Sb xx� ft-lb12
Knowing the allowable maximum moment, we can determine the allowable maximumload based on bending stress alone, using the relationship between maximum momentand the applied load. For example, for a uniformly loaded beam or girder, we obtain theapplied maximum moment as
2w LTLM �max 8
where L is the span of the beam or girder in feet. Solving and rearranging the equationabove yields the maximum allowable total load:
8M (8)(F�S /12)max b xxw � � lb/ft (4.11)TL 2 2L L
Knowing the allowable total load wTL and the applied dead load wDL on the member,the allowable live load wLL based on bending stress alone can be obtained using the loadcombination relationships (see Section 2.1):
w � w � wTL DL LL
Therefore,
the allowable maximum live load w � w � wLL TL DL
The allowable maximum load can be converted to units of pounds per square foot bydividing the load (lb/ft) by the tributary width of the beam or girder in feet.
Check of Shear Stress
8. Determine the applied shear stress fv or if applicable.f�,v
1.5Vf � (4.12)v A
1.5V�f� � (4.13)v A
where V is the maximum shear at the centerline of the joist, beam, or girder bearingsupport, and V� is the maximum distance d from the face of the support. Use V� tocalculate the applied shear stress only for beams or girders with no concentrated loadswithin a distance d from the face of the support and where the bearing support is sub-jected only to confining compressive stresses. (i.e., use V � only for beams or girderssubject to compression at the support reactions).
9. Determine all the applicable stress adjustment or C factors, obtain the tabulated NDS-Sshear stress Fv, and calculate the allowable shear stress using equation (4.14):
F� � F C C C C (4.14)v v D M t i
10. Compare the applied shear stress fv or from step 8 to the allowable shear stressf� F�v v
calculated in step 9.

98 � S T R U C T U R A L W O O D D E S I G N
(a) If fv or � , the beam is adequate in shear.f� F�v v
(b) If fv or � , the beam is not adequate in shear.f� F�v v
11. To determine the maximum allowable load or shear that a beam or girder can support,based on shear stress alone, equate the allowable shear stress to 1.5V/A or 1.5V�/A,F�vand solve for the allowable shear Vmax and thus the allowable maximum load. That is,
1.5Vmax � F�vAxx
Therefore,
F�Av xxthe allowable maximum shear V or V� � lbmax max 1.5
Knowing the allowable maximum shear at the centerline of the support, we can deter-mine the allowable maximum load based on shear stress alone using the relationship be-tween maximum shear and the applied load. However, it should be noted that shearrarely governs the design of joists, beams, and girders.
Check of Deflection
12. Using the appropriate deflection formulas, determine and compare the live load and totalload deflections to the appropriate deflection limits. For a uniformly loaded beam or girder,we obtain
45w L LLLlive-load deflection � � �LL 384E�I 360
45w L Lk(DL)�LLtotal load deflection (including creep) � � �k(DL)�LL 384E�I 240
where E� � ECMCtCi, the stress adjustment factors are as discussed previously, and Ci
does not apply to glulamk � creep effect
� 1.0 for green or unseasoned lumber or glulam used in wet service condi-tions
� 1.0 for seasoned lumber used in wet service conditions� 0.5 for seasoned or dry lumber, glulam, and prefabricated I-joists used in
dry service conditionsL � span of joist, beam, or girder, in.
�k(DL)�LL � deflection due to total load k(D) � L (or Lr or S ), in.�LL � deflection due to live load L (or Lr or S ), in.
wk(DL)�LL � total load including k(D) � L (or Lr or S ), lb/in.wLL � maximum live load L (or Lr or S ), lb/in.
13. To determine the maximum allowable load that can be supported by a beam or girderbased on deflections alone, equate the calculated deflection to the appropriate deflectionlimit and solve for the allowable maximum load. For example, for a uniformly loaded beamor girder, the live-load deflection is calculated as
45w L LLL� � �LL 384E�I 360
Solving and rearranging the equation above yields the allowable maximum live load,
384E�I Lw � lb/in.� �LL 45L 360
384E�I L� (12) lb/ft (4.15)� �45L 360

D E S I G N A N D A N A L Y S I S O F B E A M S A N D G I R D E R S � 99
Similarly, for a uniformly loaded beam or girder, the maximum allowable total load is givenas
384E�I Lw � lb/in.� �k(DL)�LL 45L 240
384E�I L� (12) lb/ft (4.16)� �45L 240
Knowing that wk(DL)�LL � wk(DL) � wLL � k(wDL) � wLL, we can determine the allowa-ble maximum live load wLL. The smaller of this value and the value calculated fromequation 4.15 will be the allowable maximum live load. This load can be converted tounits of pounds per square foot by dividing this load (lb/ft) by the tributary width ofthe beam or girder in feet.
Check of Bearing Stress (Compression Stress Perpendicular to the Grain)
14. Determine the applied bearing stress or compression stress perpendicular to the grain andcompare to the allowable compression stress perpendicular to the grain.
R R1 1f � � � F� (4.17)c� c�A blbearing b
where �F�c� allowable bearing stress perpendicular to the grain � Fc�CMCtCbCi
R1 � maximum reaction at the supportAbearing � bearing area � (thickness of beam) (bearing length) � bLb
b � thickness (smaller dimension) of the beam or girderlb � length of bearing at the beam or girder support
Fc� � NDS-S tabulated design stress perpendicular to the grain
The minimum required bearing length lb is obtained by rearranging equation (4.17).Thus,
R1l � (4.18)b, req’d bFc�
15. To determine the maximum allowable load (or reaction) that can be supported by abeam or girder, based on bearing stress alone, equate the applied bearing stress to theallowable bearing stress and solve for the reaction R1:
R1 � F�c�Abearing
Thus,
R � A F� � bl F�1 bearing c� b c�
Knowing the allowable maximum reaction R1, we can determine the allowable maxi-mum load based on bearing stress alone using the relationship between the maximumreaction and the applied load. For example, for a uniformly loaded beam or girder, we ob-tain
w LTLR �1,max 2
where L is the span of the beam or girder in feet. Solving and rearranging the equationabove yields the maximum allowable total load,
2R 2A F�1,max bearing c�w � � lb/ftTL L L (4.19)2bl F�b c�� lb/ft
L

100 � S T R U C T U R A L W O O D D E S I G N
EXAMPLE 4.2
Analysis of a Wood Beam
Determine the adequacy of a 4 � 14 southern pine No. 1 sawn-lumber beam to support a concentratedmoving load of 2000 lb that can be located anywhere on the beam. The beam span is 15 ft, normaltemperature and dry service conditions apply, and the beam is laterally braced at the supports only. Assume awood density of 36 lb/ft3 and a load duration factor CD of 1.0. The available bearing length lb is 3 in.Determine the maximum concentrated live load that can be supported by this beam. Assume the creep factor, k� 1.0.
Solution: Since the concentrated load is a moving load, the most critical load locations that will result inmaximum moment, shear, and reaction in the beam have to be determined. For the maximum moment in thissimply supported beam, the critical location of the crane load will be at the midspan of the beam, and formaximum shear the critical location of the concentrated moving load is within a distance d from the face of thesupport. For maximum reaction, the most critical location for the moving load is when the load is as close tothe centerline of the beam support as possible.
Check of Bending Stress
1. Calculate all the loads and load effects, including maximum moment, shear, and reactions. Also calculatethe dead and live loads that will be used for the deflection calculations later. Include the self-weight of themember.
(a) Calculate the self-weight of the beam:3 2w � (36 lb/ft )(46.38 in /144) � 12 lb/ftD, beam
(b) Calculate the maximum moment and shear. Since the concentrated load is a moving load, themaximum moment in the beam will occur when the moving load is at midspan, whereas themaximum shear and reaction will occur when the moving load is at or near the support (Figure 4.12).The maximum moment is calculated as
2 2w L PL (12 lb/ft)(15 ft) (2000 lb)(15 ft)D, beamM � � � �max 8 4 8 4
� 7838 ft-lb � 94,050 in.-lb
The maximum shear at the centerline of the beam support when the concentrated moving load isassumed to be at or very near the face of the beam support (i.e., within a distance d from the face ofthe support) is calculated as
w L (12 lb/ft)(15 ft) 15 ft � 1.23 ftD,beamV � � P � � (2000 lb) � 1926 lb� �max 2 2 15 ft
Knowing the allowable total load wTL and the applied dead load wDL on the member,the allowable live load wLL based on bearing stress alone can be obtained using the loadcombinations in Chapter 2:
w � w � wTL DL LL
Therefore, the allowable maximum live load based on bearing stress alone,
w � w � wLL TL DL
Note: The actual allowable maximum loads for the beam or girder will be thesmallest of the maximum loads calculated for bending stress (step 7), shear stress (step11), deflection (step 13), and bearing stress (step 15).
Design Examples
In this section we present design examples for glulam girders and the structural elements in stairs.

D E S I G N A N D A N A L Y S I S O F B E A M S A N D G I R D E R S � 101
FIGURE 4.12 Free-body diagram of a beam for different loading conditions.
The maximum reaction will occur when the concentrated load is at or very near the centerline of thebeam support and is calculated as
w L (12 lb/ft)(15 ft)D,beamR � � P � � 2000 lb � 2090 lbmax 2 22. From the known stress grade (i.e., Select Structural, No. 1 & Better, No. 1, etc.) and size classification
(i.e., dimension lumber, timbers, glulam, etc.), determine the applicable NDS-S table to be used in thedesign. For 4 � 14 southern pine No. 1 dimension lumber, use NDS-S Table 4B.
3. Determine the cross-sectional area Axx, the section modulus Sxx, and the moment of inertia Ixx fromNDS-S Table 1B (for sawn lumber), NDS-S Table 1C (for western species glulam), or NDS-S Table 1D(for southern pine glulam). From NDS-S Table 1B, we obtain the section properties for 4 � 14 sawnlumber:
2A � 46.38 in (b � 3.5 in. and d � 13.25 in.)xx
4I � 678.5 inxx
4S � 102.4 inxx
From NDS-S Table 4B, we obtain the tabulated stress values:
F � 2850 psib
F � 175 psiv
6E � 1.8 � 10 psi
6E � 0.66 � 10 psimin
F � 565 psic�
4. Determine the applied bending stress fb from equation (4.10):
M 94,050 in.-lbmaxf � � � 918.5 psib 3S 102.4 inxx
5. Determine all the applicable stress adjustment or C factors, obtain the tabulated NDS-S bending stressFb, and calculate the allowable bending stress using equation (4.2). The stress adjustment or C factors fromNDS-S Table 4B are given in Table 4.6. The allowable bending stress of the beam if the beam stabilitycoefficient CL is 1.0 is given as
F* � F C C C C C C C � (2850)(1.0)(1.0)(1.0)(0.9)(1.0)(1.0)(1.0) � 2565 psib b D M t F r fu i
The allowable pure bending modulus of elasticity E� and the bending stability modulus of elasticity E�min
are calculated as
6 6E� � EC C C � (1.8 � 10 )(1.0)(1.0)(1.0) � 1.8 � 10 psiM t i
6 6E� � E C C C C � (0.66 � 10 )(1.0)(1.0)(1.0)(1.0) � 0.66 � 10 psimin min M t i T

102 � S T R U C T U R A L W O O D D E S I G N
TABLE 4.6 Beam Adjustment Factors
Adjustment Factor Symbol Value Rationale for the Value Chosen
Beam stability factor CL 0.746 See calculations below
Size factor CF(Fb) 0.90 See adjustment factors section of NDS-S Table 4B
Moisture or wet service factor CM 1.0 Equilibrium moisture content is � 19%
Load duration factor CD 1.0 The largest CD value in the load combination ofdead load plus floor live load (i.e., D � L)
Temperature factor Ct 1.0 Insulated building, therefore, normal temperatureconditions apply
Repetitive member factor Cr 1.0 Does not satisfy all three requirements needed fora member to be classified as repetitive
Incision factor Cr 1.0 1.0 for wood that is not incised, even if pressuretreated
Buckling stiffness factor CT 1.0 1.0 except for a 2 � 4 truss top chords withplywood sheathing attached
Bearing area factor Cb 1.0Cb � for lb � 6 in.
l � 0.375b
lb� 1.0 for lb � 6 in.� 1.0 for bearings at the ends of a member
Flat use factor Cfu 1.0
Incising factor Ci 1.0
Calculation of the Beam Stability Factor CL
From equation (3.2) the beam stability factor is calculated as follows. The unsupported length of thecompression edge of the beam or distance between points of lateral support preventing rotation and/orlateral displacement of the compression edge of the beam is
l � 15 ft � 180 in.u
l 180 in.u � � 13.6d 13.25 in.
Using the lu/d value, the effective length of the beam of the beam is obtained from Table 3.9 (orNDS code Table 3.3.3) as
l � 1.63l � 3d � (1.63)(180 in.) � (3)(13.25 in.) � 333 in.e u
l d (333)(13.25 in.)eR � � � 19 � 50 OKB 2 2� �b (3.5 in.)
61.20E� (1.20)(0.66 � 10 )minF � � � 2194 psibE 2 2R (19)B
F 2194 psibE � � 0.855F* 2565 psib
From equation (3.2) the beam stability factor is calculated as
21 � F /F*) 1 � F /F* F /F*bE b bE b bE bC � � �� �L �1.9 1.9 0.95
21 � 0.855 1 � 0.855 0.855� � � � 0.746� ��1.9 1.9 0.95
The allowable bending stress in the beam is calculated as
F� � F C C C C C C � F*C � (2565)(0.746) � 1913.5 psib b D M t L F r b L

D E S I G N A N D A N A L Y S I S O F B E A M S A N D G I R D E R S � 103
6. Compare the applied stress fb from step 4 to the allowable bending stress calculated in step 5. TheF�bapplied bending stress (see step 4) fb � 918.5 psi � � 1913.5 psi. Therefore, the beam is adequate inF�bbending.
7. To determine the maximum allowable load or moment the beam or girder can support based on bendingstress alone, equate the allowable bending stress to Mmax/Sxx, and solve for the allowable maximumF�bmoment Mmax and thus the allowable maximum load. The applied maximum moment is given as
2w L PLD, beamM � �max 8 4
The allowable maximum moment is given as
M � F�S in.-lbmax b xx
F�Sb xx� ft-lb12
Equating the Mmax equations and solving for the maximum allowable concentrated load yields
2w L PL F�SD, beam b xx� � ft-lb8 4 12
Therefore,
2 3 24 F�S w L 4 (1913.5 psi)(102.4 in ) (12 lb/ft)(15 ft)b xx D, beamP � � � � lb� �� � � �� �LL L 12 8 15 ft 12 8
� 4264 lb
Since the concentrated load is a live load, the maximum allowable moving load PLL (based on bendingstress alone) is 4264 lb. This assumes that the only dead load on the beam is the uniform self-weight ofthe beam, as specified in the problem statement.
Check of Shear Stress
8. Determine the applied shear stress fv or if applicable. In this problem, since the concentrated load couldf �,v
be located within a distance d from the face of the beam, only the shear stress fv calculated using the shearat the centerline of the beam support V is applicable. Therefore, from equation (4.12) we obtain theapplied shear stress as
1.5V (1.5)(1926)f � � � 62.3 psiv A 46.38
9. Determine all the applicable stress adjustment or C factors, obtain the tabulated NDS-S shear stressFv, and calculate the allowable shear stress using Table 3.1. The allowable shear stress from equation (4.14)is
F� � F C C C C � (175 psi)(1.0)(1.0)(1.0)(1.0) � 175 psiv v D M t i
10. Compare the applied shear stress fv or from step 8 to the allowable shear stress calculated in step 9.f � F�v v
Since fv � 62.3 psi � � 175 psi, the beam is adequate in shear.F�v11. To determine the maximum allowable load or shear that can be supported by the beam or girder based
on shear stress alone, equate the allowable shear stress to 1.5V/A or 1.5V �/A, and solve for theF�vallowable shear Vmax and thus the allowable maximum load. That is,
1.5Vmax � F�vAxx

104 � S T R U C T U R A L W O O D D E S I G N
The allowable maximum shear
F�Av xxV � lbmax 1.5
Knowing the allowable maximum shear at the centerline of the support, we can determine theallowable maximum load based on shear stress alone, using the relationship between maximum shear andthe applied load, while recalling that the concentrated live load is a moving load. For this case, themaximum shear due to applied loads was obtained in step 2 as
w L 15 ft � 1.23 ft F�AD, beam v xxV � � P �� �max 2 15 ft 1.5
Thus, the maximum allowable total concentrated load (based on shear stress alone) is
F�A w Lv xx D, beam0.918P � � lbLL 1.5 2
2(175 psi)(46.38 in ) (12 lb/ft)(15 ft)� �
1.5 2
P � 5796 lbLL
Since this is greater than the value obtained from step 7, this value will not govern because the beam willfail first in bending at the lower load PLL � 4264 lb before the concentrated load reaches the value of5796 lb. As mentioned previously, shear rarely governs the design of wood joists, beams, and girders.
Check of Deflection
12. Using the appropriate deflection formula for a beam with a uniformly distributed dead load (due toself-weight) plus a concentrated crane (live) load, determine and compare the live load and total loaddeflections to the appropriate deflection limits. Since the maximum deflection will take place at midspanwhen the concentrated live load is at the midspan, we obtain the deflections as
3 3P L (2000 lb)(15 ft � 12 in./ft)LLlive-load deflection � � �LL 6 448E�I (48)(1.8 � 10 psi)(678.5 in )
� 0.20 in.
L� � 0.50 in. OK
360
Total load deflection (including creep)
4 35w L P Lk(DL) LL� � �k(DL)�LL 384E�I 48E�I
4 3(5)(12/12 lb/in)(15 ft � 12 in./ft) (2000 lb)(15 ft � 12 in./ft)� �6 4 6 4(384)(1.8 � 10 psi)(678.5 in ) (48)(1.8 � 10 psi)(678.5 in )
� 0.21 in.
L (15 ft)(12 in./ft)� � � 0.75 in. OK
240 240

D E S I G N A N D A N A L Y S I S O F B E A M S A N D G I R D E R S � 105
13. To determine the maximum allowable load that can be supported by the beam or girder based ondeflections alone, equate the calculated deflection to the appropriate deflection limit and solve for theallowable maximum load. That is,
3P L LLL� � �LL 48E�I 360
Therefore, the allowable maximum live load
6 448E�I L (48)(1.8 � 10 )(678.5 in ) 15 ft � 12 in./ftP � � � 5026 lb� � � �LL 3 3L 360 (15 ft � 12 in./ft) 360
The maximum total load deflection
4 35w L P L Lk(DL) LL� � � �k(DL)�LL 384E�I 48E�I 240
Therefore, the allowable maximum live load
448E�I L 5w Lk(DL)P � �� �LL 3L 240 384E�I
6 4 4(48)(1.8 � 10 )(678.5 in ) (15 ft � 12 in./ft) (5)(12/12 lb/in)(15 ft � 12 in./ft)� �� �3 6 4(15 ft � 12 in./ft) 240 (384)(1.8 � 10 )(678.5 in )
� 7425 lb
The smaller PLL value of 5026 lb governs as far as deflections are concerned. However, this value is stillless than the allowable live load calculated in step 7 based on bending stress, so the value of 4264 lb(calculated in step 7) remains the governing allowable maximum live load for this beam.
Check of Bearing Stress (Compression Stress Perpendicular to the Grain)
14. Determine the bearing stress or compression stress applied perpendicular to the grain and compare to theallowable compression stress perpendicular to the grain. From equation (4.17) the bearing stress applied is
R R 2090 lb1 1f � � � � 199 psic� A bl (3.5 in.)(3 in.)bearing b
where b � 3.5 in. and lb (given in the problem statement) � 3 in. The allowable bearing stress orcompression stress perpendicular to the grain is
F� � F C C C C � (565 psi)(1.0)(1.0)(1.0)(1.0) � 565 psi � f � 199 psi OKc� c� M t b i c�
Similar to shear, the beam reaction rarely controls the design strength of a joist or member, and as suchwill not be checked. The actual allowable maximum loads for the beam or girder will be the smallest ofthe maximum loads calculated for bending stress (step 7), shear stress (step 11), and deflection (step 13).Therefore, the allowable maximum live load
P (from step 7) � 4624 lbLL
Thus, the bending stress criterion controls the allowable maximum live load in this beam.
A 4 � 14 southern pine No. 1 is adequate; the maximum live load PLL(max) � 4624 lb.
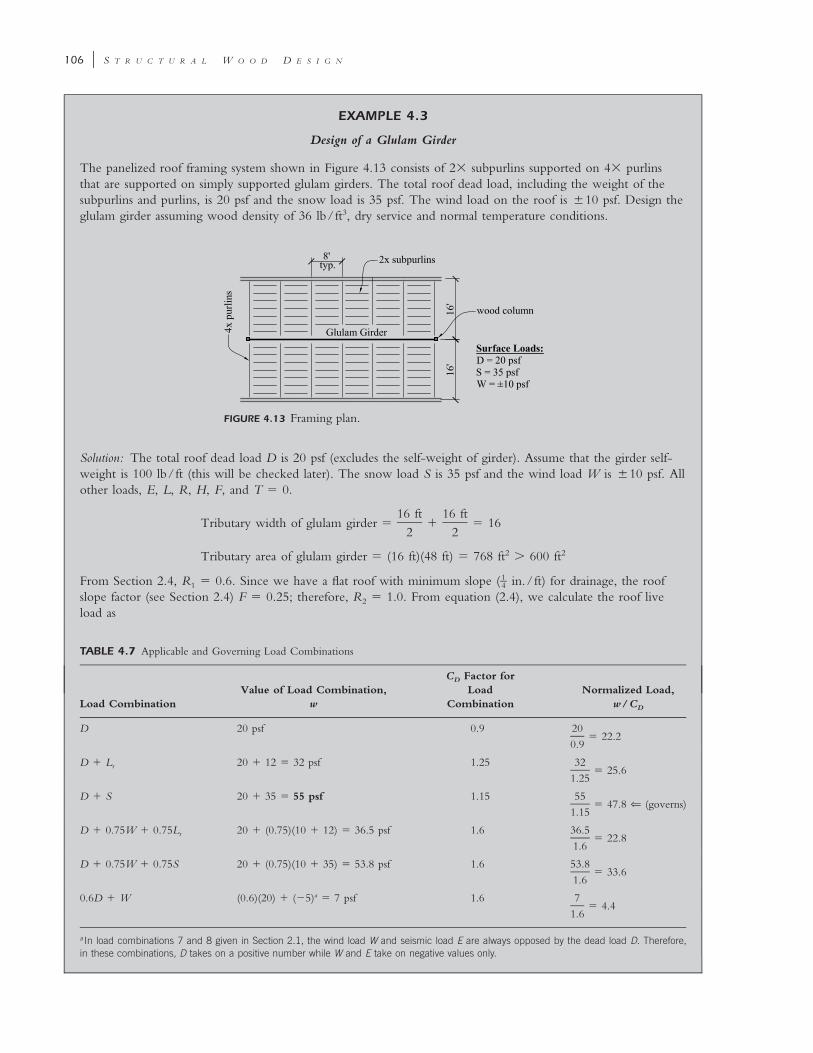
106 � S T R U C T U R A L W O O D D E S I G N
EXAMPLE 4.3
Design of a Glulam Girder
The panelized roof framing system shown in Figure 4.13 consists of 2� subpurlins supported on 4� purlinsthat are supported on simply supported glulam girders. The total roof dead load, including the weight of thesubpurlins and purlins, is 20 psf and the snow load is 35 psf. The wind load on the roof is �10 psf. Design theglulam girder assuming wood density of 36 lb/ft3, dry service and normal temperature conditions.
FIGURE 4.13 Framing plan.
Solution: The total roof dead load D is 20 psf (excludes the self-weight of girder). Assume that the girder self-weight is 100 lb/ft (this will be checked later). The snow load S is 35 psf and the wind load W is �10 psf. Allother loads, E, L, R, H, F, and T � 0.
16 ft 16 ftTributary width of glulam girder � � � 16
2 2
2 2Tributary area of glulam girder � (16 ft)(48 ft) � 768 ft � 600 ft
From Section 2.4, R1 � 0.6. Since we have a flat roof with minimum slope ( in./ft) for drainage, the roof1–4slope factor (see Section 2.4) F � 0.25; therefore, R2 � 1.0. From equation (2.4), we calculate the roof liveload as
TABLE 4.7 Applicable and Governing Load Combinations
Load CombinationValue of Load Combination,
w
CD Factor forLoad
CombinationNormalized Load,
w/CD
D 20 psf 0.9� 22.2
20
0.9
D � Lr 20 � 12 � 32 psf 1.25� 25.6
32
1.25
D � S 20 � 35 � 55 psf 1.15� 47.8 ⇐ (governs)
55
1.15
D � 0.75W � 0.75Lr 20 � (0.75)(10 � 12) � 36.5 psf 1.6� 22.8
36.5
1.6
D � 0.75W � 0.75S 20 � (0.75)(10 � 35) � 53.8 psf 1.6� 33.6
53.8
1.6
0.6D � W (0.6)(20) � (�5)a � 7 psf 1.6� 4.4
7
1.6
a In load combinations 7 and 8 given in Section 2.1, the wind load W and seismic load E are always opposed by the dead load D. Therefore,in these combinations, D takes on a positive number while W and E take on negative values only.

D E S I G N A N D A N A L Y S I S O F B E A M S A N D G I R D E R S � 107
L � 20R R � (20)(1.0) (0.6) � 12 psf � 20 psfr 1 2
Therefore, from Section 2.1, the governing load combination for this roof girder is determined using thenormalized load method. Since the loads E, L, R, H, F, and T are zero, the applicable load combinations aregiven in Table 4.7.
Summary: The governing load combination is D � S with a load duration factor CD of 1.15.
We assume that this girder is subjected to uniform loads because there are at least five equally spacedreaction points where the purlins frame into the girder with equal reactions, indicating that the load on thegirder is actually close to being uniform. The total uniform load on the girder that will be used to design forbending, shear, and bearing is obtained below using the dead load, the snow load, and the assumed self-weightof the girder, which will be checked later.
w � (D � S ) (tributary width) � girder self-weightTL
� (20 psf � 35 psf )(16 ft) � 100 lb/ft � 980 lb/ft
Using the free-body diagram of the girder (Figure 4.14), the load effects are calculated as follows:
w L (980 lb/ft)(48 ft)TLmaximum shear V � � � 23,520 lbmax 2 2
maximum reaction R � 23,520 lbmax
2 2w L (980 lb/ft)(48 ft)TLmaximum moment M � � � 282,240 ft-lbmax 8 8
� 3,386,880 in.-lb
lb/ftlb/ftlb/ft
FIGURE 4.14 Free-body diagramof a glulam girder.
The following loads will be used for calculating the girder deflections:
uniform dead load w � (20 psf )(16 ft) � 100 lb/ft � 420 lb/ft � 35 lb/in.DL
uniform live load w � (35 psf )(16 ft) � 560 lb/ft � 46.7 lb/in.LL
We now proceed with the design following the steps described earlier in the chapter.
Check of Bending Stress (Girders)
7. Summary of load effects (the self-weight of girder G1 was assumed, but this will be checked later in thedesign process):
maximum shear V � 23,520 lbmax
maximum reaction R � 23,520 lbmax
maximum moment M � 3,386,880 in.-lbmax
uniform dead load is w � 35 lb/in.DL
uniform live load is w � 46.7 lb/in.LL

108 � S T R U C T U R A L W O O D D E S I G N
8. For glulam used primarily in bending, use NDS-S Table 5A–Expanded.9. Using NDS-S Table 5A–Expanded, assume a 24F–V4 DF/DF glulam; therefore, � 2400 psi. (tension�Fbx
lamination stressed in tension). Assume initially that � � 2400 psi. From equation (4.1), the� �F� Fbx bx
required approximate section modulus of the member is given as
M 3,386,880 in.-lbmax 3S � � � 1411.2 inxx, req’d �F 2400 psibx
10. From NDS-S Table 1C (for western species glulam), the trial size with the least area that satisfies thesection modulus requirement of step 3 is 6 in. � 36 in.:3–4
b � 6.75 in. and d � 36 in.
3 3S provided � 1458 in � 1411.2 in OKxx
2area A provided � 243 in
4I provided � 26,240 inxx
11. The NDS-S (Table 5A–Expanded) tabulated stresses are
�F � 2400 psi (tension lamination stressed in tension)bx
F � 265 psiv,xx
F � 650 psic�xx, tension lam
6E � 1.8 � 10 psix
6E � 1.6 � 10 psiy
6E � 0.83 � 10 psi (E , and not E , is used for lateral buckling ofy, min y, min x, min
the girder about the weak axis)
The adjustment or C factors are given in Table 4.8.
TABLE 4.8 Adjustment Factors for Glulam
Adjustment Factor Symbol Value Rationale for the Value Chosen
Beam stability factor CL 0.97 See calculation below
Volume factor CV 0.802 See calculation below
Curvature factor Cc 1.0 Glulam girder is straight
Flat use factor Cfu 1.0 Glulam is bending about its strong x–x axis
Moisture or wet service factor CM 1.0 Equilibrium moisture content is � 16%
Load duration factor CD 1.15 The largest CD value in the load combinationof dead load plus snow load (i.e., D � S )
Temperature factor Ct 1.0 Insulated building; therefore, normaltemperature conditions apply
Repetitive member factor Cr — Does not apply to glulams; neglect or enter avalue of 1.0
Bearing area factor Cb 1.0Cb � for lb � 6 in.
l � 0.375b
lb� 1.0 for lb � 6 in.� 1.0 for bearings at the ends of a
member

D E S I G N A N D A N A L Y S I S O F B E A M S A N D G I R D E R S � 109
From the adjustment factor applicability table for glulam (Table 3.2), we obtain the allowable bendingstress of the glulam girder with CV and CL equal to 1.0 as
�F*� � F C C C C C C � (2400)(1.15)(1.0)(1.0)(1.0)(1.0)(1.0) � 2760 psibx bx D M t fu c fu
The allowable pure bending modulus of elasticity and the bending stability modulus of elasticityE� E�x y,min
are calculated as
6 6E� � E C C � (1.8 � 10 )(1.0)(1.0) � 1.8 � 10 psix x M t
6 6E� � E C C � (0.83 � 10 )(1.0)(1.0) � 0.83 � 10 psiy,min y,min M t
Calculating the Beam Stability Factor CL
From equation (3.2) the beam stability factor is calculated as follows: The unsupported length of thecompression edge of the beam or distance between points of lateral support preventing rotation and/or lateraldisplacement of the compression edge of the beam is
l � 8 ft � 96 in. (i.e., the distance between lateral supports provided by the purlins)u
l 96 in.u � � 2.67d 36 in.
We previously assumed a uniformly loaded girder; therefore, using the lu/d value, the effective length of thebeam of the beam is obtained from Table 3.9 (or NDS code Table 3.3.3) as
l � 2.06l � (2.06)(96 in.) � 198 in.e u
l d (198)(36 in.)eR � � � 12.5 � 50 OKB 2 2� �b (6.75 in.)
61.20E� (1.20)(0.83 � 10 )minF � � � 6374 psibE 2 2R (12.5)B
F 6374 psibE � � 2.31F* 2760 psib
From equation (3.2) the beam stability factor is calculated as
21 � F /F* 1 � F /F* F /F*bE b bE b bE bC � � �� �L �1.9 1.9 0.95
21 � 2.31 1 � 2.31 2.31� � � � 0.97� ��1.9 1.9 0.95
Calculating the Volume Factor CV
L � length of beam in feet between adjacent points of zero moment � 48 ft
d � depth of beam � 36 in.
b � width of beam, in. (� 10.75 in.) � 6.75 in.
x � 10 (for western species glulam)
From equation (3.3),1 / x 1 / x 1 / x 1 / x 1 / 1021 12 5.125 1291.5 1291.5
C � � � � 0.802 � 1.0� � � � � � � � � �V L d b bdL (6.75 in.)(36 in.)(48 ft)

110 � S T R U C T U R A L W O O D D E S I G N
The smaller of CV and CL will govern and is used in the allowable bending stress calculation. Since CV � 0.802� CL� 0.97, use CV � 0.802. Using Table 3.2 (i.e., adjustment factor applicability table for glulam), we obtainthe allowable bending stress as
� �F� � F C C C C C (C or C ) � F*(C or C ) � (2760)(0.802) � 2213.5 psibx bx D M t F r L V b L V
12. Using equation (4.10), the actual bending stress applied is
M 3,386,880 lb-in.maxf � � � 2322 psib 3S 1458 inxx
� allowable bending stress F� � 2213.5 psi not good!b
Although this section is only about 5% overstressed, it is prudent to select a larger section that will yieldan applied stress that is slightly lower than the allowable stress. To do this we will need to recalculate CV,CL, the bending stress applied, and the allowable bending stress.
Try a 6 � 37 in. 24F–V4 DF/DF glulam girder (Axx � 253.1 in2; Sxx � 1582 in3; Ixx � 29,6603 1– –4 2
in4), and the reader should verify that the recalculated values of CV, CL, and are as follows:F�b
C � 0.799V
C � 0.963L
�F� � 2205 psibx
�f � 2141 psi � F� OKb bx
Therefore, a 6 � 37 in. 24F–V4 DF/DF glulam girder is adequate in bending.3 1– –4 2
Check of Shear StressVmax � 23,520 lb. The beam cross-sectional area A � 253.1 in2. The shear stress applied in the wood beam atthe centerline of the girder support is
1.5V (1.5)(23,520 lb)f � � � 139.4 psiv 2A 253.1 in
Using the adjustment factor applicability table for glulam from Table 3.2, we obtain the allowable shear stress as
F� � F C C C � (265)(1)(1)(1) � 265 psiv v D M t
Thus, fv � therefore, the girder is adequate in shear. See Figure 4.15.F�;v
FIGURE 4.15 Glulam girder shear force diagram.

D E S I G N A N D A N A L Y S I S O F B E A M S A N D G I R D E R S � 111
Note: Since the shear stress fv at the centerline of the girder support is adequate (i.e., � ), there is noF�vneed to further calculate the shear stress at a distance d from the face of the support since it is obvious thatf � f �v v
would be less than fv and thus will also be adequate.
Check of Deflection (see Table 4.9)The allowable pure bending modulus of elasticity for strong (i.e., x–x)-axis bending of the girder was calculatedpreviously:
6 6E� � E C C � (1.8 � 10 )(1.0)(1.0) � 1.8 � 10 psix x M t
The moment of inertia about the strong axis Ixx � 29,660 in4.
uniform dead load w � 35 lb/in.DL
uniform live load w � 46.7 lb/in.DL
TABLE 4.9 Glulam Girder Deflection Limits
Deflection Deflection Limit
Live-load deflection �LL L (48 ft)(12)� � 1.6 in.
360 360
Incremental long-term deflection due to dead load plus live load (including creep effects),�TL � k�DL � �LL
L (48 ft)(12)� � 2.4 in.
240 240
The dead-load deflection is
4 45w L (5)(35 lb/in.)(48 ft � 12)DL� � � � 0.94 in.DL 6 4384EI (384)(1.8 � 10 psi)(29,660 in )
The live-load deflection is
4 45w L (5)(46.7 lb/in.)(48 ft � 12) LLL� � � � 1.25 in. � � 1.6 in. OKLL 6 4384EI (384)(1.8 � 10 psi)(29,660 in ) 360
Since seasoned wood in dry service conditions is assumed to be used in this building, the creep factor k � 0.5(Table 4.1). The total incremental dead plus floor live load deflection is
� � k� � �TL DL LL
L� (0.5)(0.94 in.) � 1.25 in. � 1.72 in. � � 2.4 in. OK
240
Note: Although the deflections calculated are within the IBC deflection limits, the total load deflection andthe live-load deflection are on the high side (� 1 in.), and therefore the beam should be cambered. Thecamber provided for glulam roof beams should be approximately 1.5 � the dead-load deflection (Section 4.1).With the camber provided, the net downward total deflection becomes
L L1.72 in. � (1.5)(0.94 in.) � 0.31 in. � �� OK
1858 240

112 � S T R U C T U R A L W O O D D E S I G N
Check of Bearing Stress (Compression Stress Perpendicular to the Grain)
Maximum reaction at the support R � 23,520 lb1
3 1– –Width of 6 � 37 in. glulam girder b � 6.75 in.4 2
The allowable bearing stress or compression stress parallel to the grain is
F� � F C C C � (650)(1)(1)(1) � 650 psic� c� M t b
From equation (4.9), the minimum required bearing length lb is
R 23,520 lb1l � � � 5.36 in., say 5.5 in.b, req’d bF� (6.75 in.)(650 psi)c�
The girders will be connected to the column using a U-shaped column cap detail similar to that shown inFigure 4.6d, and the minimum length of column cap required is
1–(5.5 in.)(2) � -in. clearance between ends of girders � 11.5 in.2
Check of Assumed Self-Weight of GirderA wood density of 36 lb/ft3 specified in this example is used to calculate the actual weight of the girderselected.
Assumed girder self-weight � 100 lb/ft
Actual weight of a 6 � 37 in. glulam girder selected from NDS-S Table 1C3 1– –4 2
2 3(253.1 in )(36 lb/ft )�
(12 in.)(12 in.)
� 63 lb/ft which is less than the assumed value of 100 lb/ft OK
Note: Even though the assumed self-weight of the girder differs from the actual self-weight of the girderselected, this difference does not affect the results significantly, as demonstrated below, and thus can beneglected. The total load calculated previously using the assumed self-weight of 100 lb/ft was
w � (D � S )(tributary width) � girder self-weightTL
� (20 psf � 35 psf )(16 ft) � 100 lb/ft � 980 lb/ft
The corresponding total load using the actual self-weight of the girder selected is
w � (D � S )(tributary width) � girder self-weightTL
� (20 psf � 35 psf )(16 ft) � 63 lb/ft � 943 lb/ft
The difference between the assumed and actual self-weight as a percentage of the actual self-weight is
100 � 63� 100% � 59%
63
The difference between the total load calculated using the assumed self-weight and the actual total load wTL is
980 � 943� 100% � 4%!
943
Thus, a 59% error in the self-weight of the girder yields only a 4% error in the total load, which is insignificantand can therefore be neglected, especially since we err on the safe side (i.e., the assumed self-weight was greaterthan the actual self-weight).
Use a 6 � 37 in. 24F–V4 DF/DF glulam girder.3 1– –4 2

D E S I G N A N D A N A L Y S I S O F B E A M S A N D G I R D E R S � 113
EXAMPLE 4.4
Design of Stair Treads and Stringers
For the typical floor plan shown in Figure 4.16 the second-floor dead load is 20 psf and the live load is 40 psf.Assuming hem-fir wood species, design the stair treads and stair stringers (Figure 4.17).
FIGURE 4.16 Second-floor framing plan.
FIGURE 4.17 Plan and elevation of stair.
Solution: Some IBC requirement for stairs (IBC 1009) include the following:
Stair risers must be � 4 in. and � 7 in. (7.75 in. maximum in groups R-2 and R-3).Stair treads (excluding nosing) � 11 in. (10 in. minimum in groups R-2 and R-3).Minimum width of stair � 3 ft 8 in.Minimum head room clearance � 6 ft 8 in.The floor-to-floor height between stair landings must not exceed 12 ft.

114 � S T R U C T U R A L W O O D D E S I G N
To provide comfort for the users, the following rules of thumb are commonly used:
Number of treads � number of risers � 1
2R � T � 25 (ensures the comfort of people using the stair)
where T is the tread width in inches and R is the riser height in inches.
Risers:
1–Floor-to-floor height � 9 ft 4 in. � 112.5 in.2
112.5 in.Assuming 7-in. risers, number of risers � � 16.07
7 in.
112.5 in.Assuming 7.5-in. risers, number of risers � � 15
7.5 in.
Use 15 risers at 7.5 in. � 112.5 in. floor-to-floor height.Treads:
T � 2 � R � 25
T � 25 � (2)(7.5 in.) � 10 in.
Number of treads � number of risers � 1 � 15 � 1 � 14
Use 15 risers at 7.5 in. and 14 treads at 10 in.
Horizontal run of stair � span of stair � 14 treads � 10 in. � 140 in. � 11.67 ft
Width of stair � 4 ft
Design of tread. The tread is bending about its weaker (y–y) axis, and it should be noted that the uniformstair live load of 100 psf will not usually govern for the design of the treads. Instead, the most critical load forwhich the tread should be designed is the alternative 300-lb concentrated live load in addition to the uniformtread self-weight and finishes (see Table 2.2) for the alternative concentrated floor live loads.
Assume 2 � 12 for the treads (actual size � 1.5 in. � 11.25 in.). Therefore, the tread width � 11.25 in.(including nosing of 11.25 in. � 10 in. � 1.25 in.)
(1.5 in.)(11.25 in.) 3 3Self-weight of tread � (26.9 lb/ft ) � 3.2 lb/ft (density of hem-fir � 26.9 lb/ft )144
Span of tread � width of stair � 4 ft
2(3.2 lb/ft)(4 ft) (300 lb)(4 ft)M � � � 307 ft-lb (concentrated load at midspan)max 8 4
(3.2 lb/ft)(4 ft)V � � 300 lb � 307 lb (concentrated load at support)max 2
Try a 2 � 12 hem-fir No. 1 tread. Since this is dimension-sawn lumber, use NDS-S Table 4A. From NDS-STable 1B,
3S � 4.219 in (note that S is used because the tread is bending about the weak axis)yy yy
F � 975 psib
F � 150 psiv
From the adjustment or C factors section of NDS-S Table 4A, we obtain

D E S I G N A N D A N A L Y S I S O F B E A M S A N D G I R D E R S � 115
C (D � L) � 1.0D
C � 1.0 (dry service conditions)M
C � 1.0 (normal temperature conditions)t
C � 1.0F
C � 1.2 (the flat use factor is used since the 2 � 12 tread is usedfu
on the flat and is bending about the weak axis)
Bending stress:
M (307)(12)maxApplied bending stress f � � � 873 psib,yy S 4.219yy
Allowable bending stress F� � F C C C C C C Cb b D M t F fu i r
� (975)(1.0)(1.0)(1.0)(1.0)(1.2)(1.0)(1.0) � 1170 psi � 873 psi OK
Shear stress:
1.5V (1.5)(307)Applied shear stress f � � � 28 psiv,yy A 16.88
Allowable shear stress F� � F C C C C � (150)(1.0)(1.0)(1.0)(1.0) � 150 psi � 28 psi OKv v D M t i
Use a 2 � 12 hem-fir No. 1 tread (nosing � 1.25 in.).
Analysis and Design of Stair Stringer
Width of stair � 4 ft
Actual size of riser � 1.5 in. � 6 in. (see Figure 4.18)
Horizontal run L � 140 in. � 11.67 ft2
Floor-to-floor height H � 9.375 ft
2 2 2 2Sloped length of stair L � �(H) � (L ) � �(9.375 ft) � (11.67 ft) � 15 ft1 2
Stair loads:
Treads � (14 treads � 3.7 lb/ft � 4-ft span)(6.0 in./11.25 in.)/(4 ft� 11.67 ft)
� 4.5 psf
Risers � (15 risers � 3.7 lb/ft � 4-ft span)(6.0 in./11.25 in.)/(4 ft� 11.67 ft)
� 2.6 psf
Two stringers (assume 3 � 16 per stringer) � (2 � 8.3 lb/ft)/4 ft � 4.2 psfHandrails (assume 2 psf ) � 2 psf
Total dead load on stair D � 13.3 psf 14 psf of sloped areaLive load on stair L � 100 psf of horizontal plan area
To convert the dead load to units of psf of horizontal plan area, we use the method introduced in Chapter 2:
L1Total load on stair w (psf on horizontal plane) � D � L (see Chapter 2)TL L2
15 ft� (14 psf ) � 100 psf� �11.67 ft
� 118 psf
4 ftTributary width per stair stringer � � 2 ft
2

116 � S T R U C T U R A L W O O D D E S I G N
Total load on stair stringer w (lb/ft on horizontal plane) � (118 psf )(2 ft) � 236 lb/ftTL
Horizontal span of stair stringer L � 11.67 ft2
The load effects on the stair stringer are calculated as follows:
2 2w (L ) (236 lb/ft)(11.67 ft)TL 2maximum moment M � � � 4018 ft-lbmax 8 8
w L (236 lb/ft)(11.67 ft)TL 2maximum shear V � � � 1378 lbmax 2 2
w L (236 lb/ft)(11.67 ft)TL 2maximum reaction R � � � 1378 lbmax 2 2
Effective depth of stringer. Typically, the stair stringers are notched to provide support for the treads and risers.As a result of this notch, the effective depth of the stringer is reduced (Figure 4.18). The effective depth of stairstringer to be used in design is
actual depth � depth to allow for the treads/risers ‘‘cutting’’ into the stringer for support
� width of unnotched stair stringer, d � tread width � sin �
where
H 9.375 ft�1 �1� � angle of slope of stair � tan � tan � 39�
L 11.67 ft2
The tread width (excluding the nosing) is 10 in. If we assume 3 � 16 stair stringers, the effective stringer depthis 15.25 in. � (10 in.)(sin 39�) � 9 in. Therefore, the effective stringer section � 2.5 � 9 in.
FIGURE 4.18 Effective depth of stair stringer.
The stair stringer should then be designed as a beam (similar to the beam design examples presentedpreviously in this chapter) for the load effects calculated previously using this effective section. The header andtrimmer joists supporting the stair stringer at the second-floor level will be subjected to concentrated loads dueto reactions from the stair stringers, in addition to the second-floor uniform loads. Once the joists have beenanalyzed for the maximum shears, moments, and reactions, the design will follow the same approach as wasused in Example 4.1. A structural analysis software may be needed for the deflection computations for thesenonuniformly loaded joists.

D E S I G N A N D A N A L Y S I S O F B E A M S A N D G I R D E R S � 117
TABLE 4.10 Cantilever Beam Deflection Limitsa
Deflection
Deflection Limit
Back SpanOverhang orCantilever
Live-load deflection �LL Lbs
360
2Lcant
360
Incremental long-term deflection due to deadload plus live load (including creep effects),
�TL � k�DL � �LL
Lbs
240
2Lcant
240
a k � 1.0 for green or unseasoned lumber or glulam used in wet service conditions, 1.0 for seasoned lumber used in wetservice conditions, and 0.5 for seasoned or dry lumber, glulam, and prefabricated I-joists used in dry service condition.Lbs is the back span of a joist, beam, or girder between two adjacent supports, Lcant is the cantilever or overhang span ofjoist, beam, or girder, �DL is the deflection due to dead load D, and �LL is the deflection due to live load L or (Lr or S).
Continuous Beams and Girders
Thus far, we have focused on simply supported single-span beams and girders. For girders sup-ported on three or more columns, it is more cost-effective to analyze the beam or girder as acontinuous beam, subject to the limitations on the length of beams or girders that can be trans-ported. However, the analysis of continuous beams is considerably more tedious than the analysisof simply supported single-span beams. For continuous beams, a pattern load analysis has to becarried out in which the live load is randomly located on the spans of the beam or girders toproduce the maximum load effects. It should be noted that the dead load, on the other hand,is always located over the entire length of the girder. The girder is then analyzed for the differentload cases and the absolute maximum negative or positive moment, the absolute maximumpositive or negative shear, and the absolute maximum reaction are obtained; the girder is thendesigned for these absolute maximum values. The maximum deflection at the midspan of theendspan of the continuous beam is calculated and compared to the beam deflection limits dis-cussed earlier. For continuous roof beams in areas with snow, the partial snow load prescribedin Section 7.5 of ASCE 7 should also be considered.
Beams and Girders with Overhangs or Cantilevers
These types of beams or girders are used to frame balconies or overhanging portions of buildings.It consists of the overhang or cantilever and the back span. It is more efficient to have the lengthof the back span be at least three times the length of the overhang or cantilever span. In thesetypes of beams, the designer needs to, among other things, check the deflection of the tip ofthe cantilever or overhang and the uplift force at the back-span end, as these could be critical.
Similar to continuous beams, a pattern load analysis is required to obtain the maximumpossible moment, shear, reaction, and deflection. The beam would then be designed for thesemaximum load effects using the procedure discussed previously. The partial snowload prescribedin Section 7.5 of ASCE 7 should also be considered for cantilevered roof beams in areas withsnow. The deflection limits for the back span are as presented previously. However, for thecantilever or overhang, the appropriate deflection limits are presented in Table 4.10. The readershould note that the number ‘‘2’’ in the cantilever deflection limits below is a factor that accountsfor the fact that the deflected profile of a cantilever beam is one-half that of a simply supportedsingle-span beam (IBC 1604.3).
At the supports of continuous beams or the interior support of a cantilever girder with anoverhang, the bottom face of the beam between the point of inflection within the back span(near the interior support) and the tip of the cantilever or overhang (point D) is unbraced becauseof the negative moment, which causes compression stresses in the bottom fibers. Lateral bracingis required at the bottom of the beam at the interior support (point C) to prevent lateral instabilityof the column support, and for the same reason, lateral bracing is also required at the supportsof continuous beams and girders. The lateral support can be provided by a member of similar

118 � S T R U C T U R A L W O O D D E S I G N
FIGURE 4.20
Common deck layoutprofiles.
FIGURE 4.19 Beam lateral bracing detail.
depth framing into the continuous beam at the supports or the can-tilever beam at point C. Lateral bracing can also be accomplished byusing a diagonal kicker as shown in Figure 4.19. The diagonal braceor kicker reduces the unbraced length of the bottom face (i.e., com-pression zone) of the beam to the distance between the brace and thefarthest point of inflection on opposite sides of the interior support.
4.3 SAWN-LUMBER DECKING
In lieu of using plywood sheathing (see Chapter 6) to resist gravityloads on roofs and floors, tongue-and-grooved decking may be usedto span longer distances between roof trusses or floor beams. Sawn-lumber decking may also be required on floors where equipment orforklift loading produce concentrated loads for which plywood

D E S I G N A N D A N A L Y S I S O F B E A M S A N D G I R D E R S � 119
TABLE 4.11 Maximum Moments and Deflections for Various Decking Layouts
Type of DeckingLayout
MaximumMoment,
Mmax
MaximumDeflection,
� Remarks
Simple span 2wL8
45wL384EI
Has the least stiffness of all the decklayout systems
Two-span continuous 2wL8
4wL185EI
Combined simple andtwo-span continuous
2wL8
4wL109EI
Average of simple-span and two-spanmaximum deflections
Controlled random layout 2wL10
4wL145EIe
Maximum deflection for three-spandecking used; Ie � 0.67(I ) for2-in. decking and 0.80I for 3 and4 in. decking
Cantilever piecesintermixed
2wL10
4wL105EIe
Source: Refs. 10 and 13.
EXAMPLE 4.5
Design of Sawn-Lumber Decking
Design sawn-lumber roof decking to span 10 ft 0 in. between roof trusses. The superimposed roof dead load is16 psf and the snow load is 35 psf. Assume that dry service and normal temperature conditions apply andDouglas fir-larch commercial decking (DF-L Commercial Dex).
sheathing is inadequate. Decking is also aesthetically pleasing because the underside of the deck-ing creates an attractive ceiling feature, obviating the need for additional plaster or suspendedceiling. Wood decking are manufactured as 2-in.-thick single tongue-and-groove panels at amoisture content of 15% or as 3- and 4-in. thick double tongue-and-groove panels at a moisturecontent of 19%. The standard nominal sizes for wood decking are 2 � 6, 2 � 8, 3 � 6, and 4� 6. Prior to installation, the lumber decking should be allowed to reach the moisture contentof the surrounding atmosphere, to avoid problems that may result from shrinkage.
The tongue and grooves prevent differential deflections of adjacent deck panels, and eachpiece of deck is usually nailed through the tongue at each support. Decking consists of repetitivesawn-lumber members that are used in a flat orientation. However, the flat-use factor shouldnot be applied in calculating the allowable stresses because this factor is already embedded in theNDS-S tabulated design values for decking in NDS-S Table 4E. Single-member and repetitive-member bending stresses are given in this table. The different stress grades of decking includeSelect, Commercial Dex and Select Dex.
There are several possible decking layouts as shown in Figure 4.20. The two most populardecking patterns are (1) nonstaggered decking panels supported on only two supports with allthe panel joints continuous, and (2) staggered decking panels supported on at least two supportswith continuous panel joints parallel to the longer dimension of the panels. It should be notedthat tongue-and-groove lumber decking, although efficient for supporting gravity loads, is notvery efficient as horizontal diaphragms in resisting lateral loads from wind or seismic forces. Itpossesses very low diaphragm shear capacity in the direction where the panel joints are contin-uous. If appreciable diaphragm shear capacity is required in a floor framing with sawn-lumberdecking, the horizontal diaphragm shear capacity can be enhanced by using -in. plywood5––16
sheathing nailed to, and placed on top of, the sawn-lumber decking. Sawn-lumber decking alsoprovides better fire ratings than plywood-sheathed floors. The maximum moments and deflec-tions for the five types of sawn-lumber decking layout are shown in Table 4.11.

120 � S T R U C T U R A L W O O D D E S I G N
Solution:: Assume 3 � 6 in. decking (actual size � 2.5 � 5.5 in.) and simple-span decking layout in Table4.11. The section properties for 3 � 6 in. decking are
2 2A � (13.75 in )(12 in./5.5 in.) � 30 in per foot width of deckxx
3 3S � (5.729 in )(12 in./5.5 in.) � 12.5 in per foot width of deckyy
4 4I � (7.161 in )(12 in./5.5 in.) � 15.62 in per foot width of deckyy
Loads:
2.5 in.Decking self-weight � 31.2 psf � 6.5 psf� �12
Superimposed dead loads � 16 psf
Total dead load D � 22.5 psf
Snow load S � 35 psf
The governing load combination for this roof deck will be dead load plus snow load (D � S ):
total load � D � S � 22.5 � 35 � 57.5 psf
Bending stress:
2 2wL (57.5 psf )(10 ft)Maximum moment M � � � 719 ft-lb per foot width of deckmax 8 8
� 8628 in.-lb per foot width of deck
The tabulated stress values and appropriate adjustment factors from NDS-S Table 4E for 3 � 6 in. decking are:
F C � 1650 psi (repetitive member)b r
F � 625 psic�
6E � 1.7 � 10
C � 1.04 (for 3-in. decking)F
C � 1.0 (lumber is not incised)i
The allowable stresses are calculated using the sawn-lumber adjustment factors applicability table (Table 3.1) asfollows:
F� � F C C C C C C C � (1650)(1)(1)(1)(1)(1.04)(1) � 1716 psib b r D M t L F i
6 6E� � EC C C � (1.7 � 10 )(1)(1)(1) � 1.7 � 10 psiM t i
The applied bending stress for bending about the weak (y–y) axis is
M 8628 lb-in.maxf � � � 690 psi �� allowable stress F� � 1716 psi OKby b3S 12.5 inyy
Deflection:
Dead load D � 22.5 psf � 22.5 lb/ft per foot width of deck � 1.88 lb/in. per foot width of deck
Live load (snow) S � 35 psf � 35 lb/ft per foot width of deck � 2.92 lb/in per foot width of deck
The dead-load deflection is
4 45wL (5)(1.88 lb/in.)(10 ft � 12)� � � � 0.19 in.DL 6 4384E �I (384)(1.7 � 10 psi)(15.62 in )yy

D E S I G N A N D A N A L Y S I S O F B E A M S A N D G I R D E R S � 121
The live-load deflection is
4 45wL (5)(2.92 lb/in.)(10 ft � 12)� � � � 0.30 in.LL 6 4384E �I (384)(1.7 � 10 psi)(15.62 in )yy
L (10 ft)(12 in./ft)� � � 0.33 in. OK
360 360
Since seasoned wood in dry service conditions is assumed to be used in this building, the creep factor k �0.5. The total incremental dead plus floor live load deflection is
� � k� � �TL DL LL
L (10 ft)(12 in./ft)� (0.5)(0.19 in.) � 0.30 in. � 0.40 in. � � � 0.5 in. OK
240 240
Use a 3 � 6 in. DF-L Commercial Dex with a simple-span deck layout.
FIGURE 4.21 Notchesand holes in woodbeams.
4.4 MISCELLANEOUS STRESSES IN WOOD MEMBERS
In this section, several other types of stresses that can occur in wood members are discussed.Examples include amplification of the shear stress in notched beams, end-to-end or parallel-to-grain bearing stress, and bearing stress at an angle to the grain.
Shear Stress in Notched Beams
Sometimes, it may be necessary to provide notches and holes in wood beams to allow for passageof mechanical ducts or because of headroom limitations as shown in Figure 4.21. The limitationson the size and placement of notches [12] and holes [20] are shown in the figure. The sizes andlocation of holes in preengineered lumber is specified by the manufacturer. Preengineered light-gage metal plates that are screwed and/or glued to the sides of the joist can be used for rein-forcing floor joists with larger notches and holes [21].
The notching of a beam creates stress concentrations, in addition to reducing the allowableshear stress due to a reduction in the depth of the beam at the notch. The NDS code require-ments for notched beams are as follows:

122 � S T R U C T U R A L W O O D D E S I G N
• No notches are permitted within the middle third of the beam span.• No notches are permitted within the outer thirds of the beam span on the tension face
(except at beam bearing supports) when the thickness of a beam b is � 3.5 in.• Within the outer thirds of the beam span, the depth of the notched beam, dn, must be �
d.5–6• At the beam supports, the depth of the notched beam, dn, must be � d.3–4• The notch length ln must be � 1–d.3
The NDS code equation for calculating the adjusted applied shear stress when the notch ison the tension face is given as
23–V d2f � � �v bd dn n
� allowable shear stress F� (4.20)v
For a notch on the compression face, the adjusted applied shear stress is given as
3–V2f �v b{d � [(d � d /d ])e}n n
� allowable shear stress F� (4.21)v
where d � total depth of the unnotched beamdn � depth of beam remaining at the notche � horizontal distance from inside face of support to edge of notch (e must be � dn; if
e � dn, use e � dn in calculating the shear stress)
Bearing Stress Parallel to the Grain
FIGURE 4.22 Column bearing end to end.
Bearing stress parallel to the grain occurs at the ends of two axiallyloaded compression members bearing on each other end to end asshown in Figure 4.22. The applied bearing stress parallel to the grainis given as
Pf �c A
� F* (4.22)c
where A � net bearing area�F*c FcCDCMCtCFCi � allowable compression stress parallel to
the grain, excluding the effects of the column stability fac-tor, CP
P � compression loadFc � tabulated compression stress parallel to grain (NDS-S Ta-
bles 4A to 4D)
The adjustment or C factors are as discussed in Chapter 3. NDS code Section 3.10.1.3 requiresthat a steel bearing plate be provided whenever the bearing stress parallel to the grain, fc, isgreater than 0.75 to help distribute the load.F*c
Bearing Stress at an Angle to the Grain
This bearing situation occurs at the supports of sloped rafters or where a sloped member framesand bears on a horizontal member as shown in Figure 4.23. The rafter will be subjected to thebearing stress at an angle to the grain, f�, and the beam or header or horizontal member will besubjected to bearing stress perpendicular to the grain, fc�. The bearing stress applied in the rafterat an angle � to the grain is calculated as

D E S I G N A N D A N A L Y S I S O F B E A M S A N D G I R D E R S � 123
FIGURE 4.23 Bearingat an angle to thegrain.
Pf �� A
� F� (4.23)�
where P � applied load or reactionA � bearing area
�F�� allowable bearing stress at an angle � to the grain� � angle between the direction of the reaction or bearing stress and the direction of
the grain (see Figure 4.23)
The allowable bearing stress at an angle to grain is given in the NDS code by the Hankinsonformula as
F*F�c c�F� � (4.24)� 2 2F* sin � � F� cos �c c�
where �F*c FcCDCMCtCFCi � allowable bearing stress parallel to the grain of the rafter or slopedmember excluding column stability effects
�F�c� Fc�CMCtCiCb � allowable bearing stress perpendicular to the grain of the beam orheader
Note that when � is zero, the load or reaction will be parallel to the grain, and will be equalF��to When � is 90�, the load or reaction will be perpendicular to the grain, and will beF*. F�c �
equal to F� .c�
Sloped Rafter Connection
The design procedure for a sloped rafter connection is as follows:
• If f� � in the sloped rafter, the rafter is adequate in bearing.F��

124 � S T R U C T U R A L W O O D D E S I G N
FIGURE 4.24 Bearing stress in a header. FIGURE 4.25 Alternative sloped rafter detail.
• If f� � increase the bearing area A for the rafter either by increasing the thickness b ofF�,�
the rafter and/or the bearing length provided (i.e., the thickness b of the header).• If fc� � in the beam or header, the header is adequate in bearing.F�c�• If fc� � in the beam or header, the header is not adequate; therefore, either increaseF�c�
the thickness b of the header or use a steel plate to increase the bearing area Abearing andthus reduce the bearing stress perpendicular to the grain in the beam or header (see Fig-ure 4.24). Note that the steel plate will only help relieve the bearing stress in the beam orheader, not the sloped rafter.
The bearing stress at an angle to the grain f� can be avoided by using the detail shown inFigure 4.25.
EXAMPLE 4.6
Bearing Stresses at a Sloped Rafter-to-Stud Wall Connection
The sloped rafter shown in Figure 4.26 is supported on a ridge beam at the ridge line and on the exterior studwall. The reaction from dead load plus the snow load on the rafter at the exterior stud wall is 1800 lb.Assuming No. 1 spruce-pine-fir (SPF) and normal temperature and dry service conditions, determine (a) theallowable bearing stresses at an angle to the grain and the allowable bearing stress or allowable stressF��perpendicular to the grain (b) the bearing stress at an angle to the grain f� in the rafter; and (c) the bearingF� ;c�
stress perpendicular to the grain fc� in the two top plates.
FIGURE 4.26 Sloped rafter-to-stud wall connection.

D E S I G N A N D A N A L Y S I S O F B E A M S A N D G I R D E R S � 125
Solution:
2 � 8 sloped rafter: b � 1.5 in.; d � 7.25 in.
2 � 4 top plates on top of stud wall: d � 3.5 in.
Since the 2 � 8 rafter and 2 � 4 top plates are dimension lumber, use NDS-S Table 4A. Using the table weobtain the tabulated stresses for spruce-pine-fir (SPF) as
bearing stress perpendicular to the grain F � 425 psic�
compression stress parallel to the grain F � 1150 psic
The stress adjustment or C factors are
C � 1.0 (dry service conditions)M
C � 1.0 (normal temperature conditions)t
C � 1.0 (wood is not incised)i
C (F ) � 1.05F c
C � 1.15 (dead load plus snow load)D
The bearing length in the 2 � 4 top plate measured parallel to the grain is the same as the thickness of thesloped rafter. lb � brafter � 1.5 in. Since lb � 1.5 in. � 6 in. and the bearing is not nearer than 3 in. from theend of the top plate and the end of the rafter (see Chapter 3), the bearing stress factor is calculated as
l � 0.375 in. 1.5 in. � 0.375 in.bC � � � 1.25b l 1.5 in.b
The bearing area at the rafter–stud wall connection is
A � (thickness b of rafter)(width d of the 2 � 4 top plates)bearing2� (1.5 in.)(3.5 in.) � 5.25 in
(a) Allowable bearing stresses:
F� � F C C C C � (425)(1)(1)(1)(1.25) � 531 psic� c� M t i b
F* � F C C C C C � (1150)(1.15)(1)(1)(1.05)(1) � 1389 psic c D M t F i
� is the angle between the direction of the reaction or bearing stress and the direction of grain in thesloped wood member. Therefore, tan � � 12/6 and � � 63.4�. Using equation (4.24), the allowablestress at an angle to grain is given as
F*F� (1389)(531)c c�F� � � � 606 psi� 2 2 2 2F* sin � � F� cos � 1389 sin 63.4 � 531cos 63.4c c�
(b) Bearing stress applied at angle � to the grain of the rafter:
P 1800 lbf � �� 2A 5.25 inbearing
� 343 psi � F� � 606 psi OK�
(c) Bearing stress applied perpendicular to the grain of the top plate:
P 1800 lbf � �c� 2A 5.25 inbearing
� 343 psi � F� � 531 psi OKc�

126 � S T R U C T U R A L W O O D D E S I G N
EXAMPLE 4.7
Header Beam Design Using Preengineered Lumber
Refer to Figure 4.27 and the following given information:
floor dead load � 15 psf
floor live load � 40 psf
normal temperature and moisture conditions
full lateral stability is provided (C � 1.0)L
Determine the required header size using prefabricated laminated veneer lumber (LVL) with the followingmaterial properties: Fb � 2600 psi, Fv � 285 psi, and E � 1900 ksi.
Solution: Calculate the maximum moment and shear in the header:
Span of header beam L � 15 ft
Tributary width of the header beam � 8 ft
Dead load w � (15 psf )(8 ft) � 120 lb/ftDL
Live load w � (40 psf )(8 ft) � 320 lb/ftLL
FIGURE 4.27 Partial floorframing plan.
From Section 2.1 the governing load combination is dead plus floor live load; thus, the total load is
w � w � w � 120 � 320 � 440 lb/ftTL DL LL
See Figure 4.28.
4.5 PREENGINEERED LUMBER HEADERS
In this section we discuss the selection of preengineered lumber such as laminated veneer lumber(LVL) and parallel strand lumber (PSL) using manufacturers’ published load tables. These pro-prietary wood members usually have fewer defects and a lower moisture content than sawn-lumber beams and columns. They are less susceptible to shrinkage and are used for spans andloadings that exceed the capacity of sawn-lumber beams.

D E S I G N A N D A N A L Y S I S O F B E A M S A N D G I R D E R S � 127
FIGURE 4.28 Header loadingdiagram.
2 2w L (440)(15)TLM � � � 12,375 ft-lbmax 8 8
w L (440)(15)TLV � � � 3300 lbmax 2 2
Note: After calculating the maximum shear and moment values, the designer could select a specific LVLdirectly from manufacturers’ literature since the manufacturer typically makes this type of information available.After selecting an appropriate product based on shear and moment capacity, the designer would then check thedeflection.
Required section properties:
M (12,375)(12) 3S � � � 57.1 inreq’d F 2600b
1.5V (1.5)(3300) 2A � � � 17.3 inreq’d F 285v
Select two 1 � 11 in. LVLs.3 1– –4 4
Section properties:
2 2A � 2bh � (2)(1.75 in.)(11.25 in.) � 39.3 in � 17.3 in OK
2 22bh (2)(1.75 in.)(11.25 in.) 3 3S � � � 73.8 in � 57.1 in OKx 6 6
3 32bh (2)(1.75 in.)(11.25 in.) 4I � � � 416 inx 12 12
Check the deflection. The live-load deflection is
4 45w L (5)(320/12)(15 � 12)LL� � � � 0.47 in.L 6384EI (384)(1.9 � 10 )(416)
L (15)(12)� � � � 0.5 in. � 0.47 in. OKallowable 360 360
Use two 1 � 11 in. LVLs.3 1– –4 4
Note: Most manufacturers specify fastening requirements for multiple plies of LVLs or PSLs. The fasteningcan be either nailed or bolted, but the designer should refer to the published requirements from the specificmanufacturer for this information.

128 � S T R U C T U R A L W O O D D E S I G N
4.6 FLITCH BEAMS
A flitch beam is a composite section comprised of a steel plate placed between wood membersor steel plates or channels attached to opposite sides of an existing wood beam. These are typicallyused where a solid wood member is not practical, such as depth limitations or heavy loads orwhere an existing wood beam needs to be strengthened to resist higher loads. Historically, flitchbeams have been used as an economical alternative to higher-strength preengineered wood mem-bers. Currently, preengineered wood members such as laminated veneer lumber and parallelstrand lumber are typically readily available, so the use of flitch beams is limited.
A flitch beam consists of dissimilar materials, so the section properties will have to betransformed in the design process so that the two bonded materials will experience the samestrain and deformation. In a transformed section, one material is transformed into an equivalentquantity of the other material. In this case we transform the steel plate into an equivalent amountof wood material. This equivalence is based on the ratio between the modulus of elasticity ofsteel and the modulus of elasticity of wood.
Esn �Ew
where n � modular ratioEs � modulus of elasticity of steel (� 29,000 ksi)Ew � modulus of elasticity of wood (varies with the wood species)
Note that connection design is covered in Chapter 8. The example here is intended toclarify the full scope of what is required for flitch beam design.
EXAMPLE 4.8
Flitch Beam Design
For this example, the following will be assumed (see Figure 4.29):
FIGURE 4.29 Framing plan forflitch beam design.
Flitch beam supports 2 � 8’s at 16 in. spanning 11 ft on each side.
Maximum depth of the flitch beam is 7 in. (depth of a 2 � 8).1–4Total load � 55 psf (dead plus live).Lumber is Douglas Fir Larch, Select Structural.

D E S I G N A N D A N A L Y S I S O F B E A M S A N D G I R D E R S � 129
A � 7 in. steel plate will be assumed. The approach taken here will be to transform the -in. width of3 1 3– – –8 4 8
steel section to an equivalent wood section while maintaining the same depth.
Solution: From NDS Table 4A:
F � 1500 psib
F � 180 psiv
E � 1900 ksiw
The modular ratio is
E 29,000sn � � � 15.2E 1900w
The section properties of the steel plates and wood side members are
2A � nbh � (15.2)(0.375 in.)(7.25 in.) � 41.4 inp
2 2nbh (15.2)(0.375)(7.25) 3S � � � 50.1 inp 6 6
3 3nbh (15.2)(0.375)(7.25) 4I � � � 181 inp 12 12
2 2A � (2)(10.88 in ) � 21.75 inw
2 3S � (2)(13.14 in ) � 26.28 inw
2 4I � (2)(47.6 in ) � 95.3 inw
Allowable stress values: (all C-factors are 1.0 except Cf � 1.2):
F� � 1500 psib
(1.2) � 1800 psi
F� � 180 psiv
E � � 1900 ksiw
Combining the composite section properties yields
2A � 41.4 � 21.75 � 63.1 inc
3S � 50.1 � 26.28 � 76.3 inc
4I � 181 � 95.3 � 276 inc
The total load on the beam is
W � (55 psf )(11 ft) � 605 plfTL

130 � S T R U C T U R A L W O O D D E S I G N
Check the bending and shear stresses:
2 2wL (605)(11)M � � � 9150 ft-lb
8 8
wL (605)(11)V � � � 3328 lb
2 2
M (9150)(12)f � � � 1439 psi � F � 1500 psi OKb bS 76.3
1.5V (1.5)(3328)f � � � 79.1 psi � F � 150 psi OKv vA 63.1
Check the deflection: (ignore creep effects because of the presence of the steel plates)
4 45wL (5)(605/12)(11 ft � 12)� � �DL�LL 6385EI (384)(1.9 � 10 )(276)
L (11 ft)(12)� 0.38 in. � � � 0.55 in. OK
240 240
The composite section is adequate for bending, shear, and deflection. One other item that may need to bedesigned is the connectors between the wood side members and the plate. If the joists frame on top of theflitch beam, only nominal connectors need to be provided. If the joists frame into the side of the woodmembers, the size and spacing of the connectors become critical. One possible solution is to provide a topflange type of connector (see Figure 4.30).
FIGURE 4.30 Various connections for flitch beams.
For this example it will be assumed that the joists frame into the side member with a standard joist hangerconnection. The total load to one wood side member is
W � (55 psf )(5.5 ft) � 303 plfside
For practical reasons, the connectors should be spaced in increments consistent with the joist spacing. In thisexample, the joist spacing is 16 in. Assuming -in. connectors, the allowable shear perpendicular to the grain of1–2the wood side member for one connector is
Z � 310 lb (NDS Table 11B)�
The required spacing is then
303 lbS � � 0.97 ft or 11.7 in.req’d 310 plf

D E S I G N A N D A N A L Y S I S O F B E A M S A N D G I R D E R S � 131
Based on the joist spacing, provide -in. bolts at 8 in. o.c. The bolts should also be staggered for stability (see1–2Figure 4.31). The minimum spacing for the connectors (from Table 8.3) is as follows:
1–edge distance � 4D � (4)( in.) � 2.0 in. (2 in. provided)2
1–center-to-center � 3D � (3)( in.) � 1.5 in. (16 in. provided)2
1–row spacing � 5D � (5)( in.) � 2.5 in. (3.25 in. provided)2
FIGURE 4.31 Flitch beam connection detail.
Note that connection design is covered in Chapter 8. The example here is intended to clarify the full scope ofwhat is required for flitch beam design.
4.7 FLOOR VIBRATIONS
Floor vibrations are usually caused by human activities such as walking or rhythmic activity.Machinery or other external forces, such as vehicular traffic, can also cause floor vibrations.Problems associated with floor vibration are due primarily to resonance, which is a phenomenonthat occurs when the forcing frequency or frequency of the human activity is at or near thenatural frequency of the structure. When human activity such as aerobics occurs, the cyclicalforce due to this activity produces acceleration in the floor, and as each cycle of loading addsenergy to the system, the vibration increases and the acceleration reaches a maximum. Thisvibration is mitigated by the presence of damping elements such as partitions or ceiling elements.
The NDS code does not provide any specific guidance regarding floor vibrations becauseit is a serviceability issue and not safety related. Traditionally, the main serviceability criteria usedto control vibrations was to limit deflection under uniform design loads to L/360. For shorterspans the L/360 limit is typically found to be adequate to control floor vibrations. With theadvent of preengineered joists, combined with longer spans and more wide-open areas (and thusno partitions to provide damping), some floors have been found not to have good performancewith respect to floor vibrations. Some designers use higher deflection limits (usually between L/480 and L/720) to control floor vibrations. The acceptability of floor vibrations is a functionof the occupant’s sensitivity to floor vibrations, which can be quite subjective and variable. Ingeneral, occupants are more sensitive to floor vibrations when they are engaged in low amountsof activity. The limits on vibration and floor acceleration are usually expressed as a percentageof the acceleration due to gravity g. Table 4.12 shows the generally accepted limits on flooracceleration.
Floor Vibration Design Criteria
Rhythmic activity on light-frame floors (i.e., wood floors) is not very common. These activitiesusually occur on combined concrete and steel structures, and preferably should occur on theground floor of a building, if possible. To control floor vibrations due to rhythmic activity, the

132 � S T R U C T U R A L W O O D D E S I G N
TABLE 4.12 Acceleration Limits for Floor Vibrations(Percent)
Activity
Acceleration Limit,a0 � 100%g
Hospital (operating rooms) 0.25
Office, residential, church 0.50
Shopping malls 1.5
Dining, weight lifting 2
Rhythmic activity 5
Source: Ref. 3.
TABLE 4.13 Typical Minimum Floor Frequencies (Hertz)
ActivitySteel/Concrete
FloorLight-Frame
Floor
Dancing and dining 5 10
Rhythmic activity 9 13
natural frequency of the floor needs to be higher than the forcing frequency of the highestharmonic of the activity in question. Table 4.13 lists typical minimum floor frequencies.
The natural frequency of a floor system can estimated as follows:
gf � 0.18 (4.25)n ��T
where fn � natural frequency of the floor system, Hzg � 386 in./s2
�T � total floor deflection, in.� �j � �g � �c
�j � joist deflection, in.�g � girder deflection, in.�c � column deflection, in.
For framing systems without girders or columns (such as wood floor framing supported bybearing walls), the girder and column deflection terms would be ignored. A more in-depthcoverage of controlling vibrations due to rhythmic activity is given in other references [3].
As stated previously, rhythmic activity on wood-framed floors is not very common. Sincewood-framed floors are used primarily for residential, multifamily, and hotel occupancies, theprimary design consideration is with walking vibrations. With rhythmic activity, the accumulatedenergy due to a cyclical load was the primary area of concern. With walking vibrations, themain source of annoyance to the occupants is floor jolts due to a person walking across the floor.
Current research by the ATC, AISC, and others [3–6] is based on response data fromoccupants on various floor types and is used in this book. To control walking vibrations, floordeflections with respect to beam span should be controlled in accordance with the followingequation [4]:
�0.18(L�6.4)� � 0.024 � 0.1e � 0.08 in. (4.26)p
where �p � maximum floor deflection (in.) under a concentrated load of 225 lbL � beam span, ft
This equation can also be shown graphically (Figure 4.32).

D E S I G N A N D A N A L Y S I S O F B E A M S A N D G I R D E R S � 133
-
FIGURE 4.32 Floordeflection versus spancurve for floorvibrations. (Adaptedfrom Ref. 4, Figure2-1. Courtesy of theApplied TechnologyCouncil, Arlington,VA.)
The formula for calculating the floor deflection under a 225-lb concentrated load is givenas
3C PLpd� � (4.27)p N 48EIeff eff
where �p � maximum floor deflection, in.Cpd � continuity factor for point load
� 0.7 for continuous� 1.0 for simple span
Neff � number of effective joists, � 1.0P � 225 lbL � beam span, in.
EIeff � effective flexural stiffness of the floor panel, lb-in2
In calculating the maximum floor deflection due to a point load, the deflection of the supports(i.e., girders and columns) can be ignored if the deflection under total load (dead load plus liveload) is less than L/360 or 0.5 in., whichever is smaller.
The effective flexural stiffness of preengineered products such as I-joists or wood trusses isusually given by the manufacturer of the specific product. For sawn lumber or where productinformation is not available, the effective flexural stiffness can be calculated as follows:
EIEI � (4.28)eff 1 � �EI/C EIfn m
where EI � stiffness of the floor panel, lb-in2 (includes decking and concrete topping)Cfn � 1.0 for simple spans (see Figure 4.33 for continuous spans)E � modulus of elasticity, psiG � modulus of rigidity, psi (for wood, use G � 0.1 � 106 psi or E/G � 20)
� � for sawn lumber (4.29)14.4 E
2(L/ r) G
� � for preengineered joists (4.30)96EIm
2K LsL � joist span, in.r � radius of gyration of the joist, in.
� �I /Am m
Im � moment of inertia of the joistKs � shear deflection constant
� (0.4 � 106)d lb (for preengineered I-joists)� d � 106 lb (for preengineered metal web trusses)� 2 � 106 lb (for preengineered metal plate–connected wood trusses)
d � joist depth, in.

134 � S T R U C T U R A L W O O D D E S I G N
FIGURE 4.33
Continuity factor Cfn
for continuous spans.(Adapted from Ref.4, Figure 4-3.Courtesy of theApplied TechnologyCouncil, Arlington,VA.)
FIGURE 4.34 Typicalfloor section.
It should be noted that shear deflection is not critical for solid sawn members, but sheardeflection is a factor to be considered for preengineered members because of the thinner websand shear deformation at the truss joints.
With reference to Figure 4.34, the flexural stiffness of the floor panel, EI, can be determinedtaking into account the composite action of the decking and concrete topping. For noncompositefloor systems, the flexural stiffness of the floor panel is equal to the flexural stiffness of the joist:
2 2EI � EI � EI � EA y � EA (h � y) (4.31)m top m top top
where EIm � flexural stiffness of the joist, lb-in2
EItop � flexural stiffness of the floor deck parallel to the joist, lb-in2
EItop � EIw, par � EIc � (4.32)3EA EA hw, par c cw
EA � EAw, par c
EAtop � effective axial stiffness of the floor deck parallel to the joist
EAtop � (4.33)EAflr
21 � 10EA /S Lflr flr flr
EAm � axial stiffness of the joistEAflr � axial stiffness of the floor deck, lb (see EAw, par in Table 4.14 for wood panels)EAc � axial stiffness of the concrete deck, lb

D E S I G N A N D A N A L Y S I S O F B E A M S A N D G I R D E R S � 135
TABLE 4.14 Approximate Stiffness Properties of Wood Subflooring (OSB and Plywood) Per Inch Widtha
Panel Thickness(in.)
EIw, par
(lb-in2/ in. � 106)EIw, perp
(lb-in2/ in. � 106)EAw, par
(lb/ in. � 106)EAw, perp
(lb/ in. � 106)
5–8 0.008 0.027 0.35 0.523–4 0.016 0.040 0.46 0.65
a EIw, par, flexural stiffness of the wood panel parallel to the member; EIw, perp, flexural stiffness of the wood panel perpen-dicular to the member; EAw, par, axial stiffness of the wood panel parallel to the member; EAw, perp, axial stiffness of thewood panel perpendicular to the member.
TABLE 4.15 Slip Modulus Sflr (lb/ in./ in.) for Wood Deck Fastening
Type of Deck Nailed Glued and Nailed
OSB or plywood 600 50,000
Tongue and Groove 5,800 100,000
EIc � flexural stiffness of the concrete deck, lb. in.2
Sflr � slip modulus for floor deck connection to the joist (see Table 4.15)Lflr � width of the floor deck (distance between joints in the floor deck), in.
� 48 in. or beam span, L in inches for concrete-topped floorss � joist spacing, in.
hcw � half of the total deck thickness, in.� (td � tc)
1–2htop � distance from the centroid of the floor deck to the centroid of the joist, in.
htop � � td � tc � ydeck (4.34)d2
ydeck � (4.35)EA [(t /2) � t ] � EA (t /2)w, par d c c c
EA � EAw, par c
ydeck � distance from the top of the concrete to the centroid of the floor decktd � thickness of the deck (plywood)tc � thickness of the concretey � distance from the centroid of the system to the centroid of the joist, in.
y � (4.36)EA htop top
EA � EAm top
When calculating the axial and flexural stiffness of the concrete deck, the modulus of elas-ticity is multiplied by 1.2 to account for dynamic loading, thus:
1.5E � (1.2)(33)w �f� (4.37)c c c
where wc � unit weight of the concrete, lb/ft3
�f�c 28-day compressive strength of the concrete, psi
The base equation for the modulus of elasticity is given in ACI 318 [7].The number of effective floor joists Neff in the system is a function of the longitudinal and
transverse stiffness of the floor panel. The presence of transverse blocking or bridging will increasethe number of effective joists by transferring a concentrated load to adjacent joists, which reducesthe point-load deflection of the floor system. However, the amount of stiffness that the blockingor bridging contributes to the system is very small when a concrete topping is used.
For wood-framed floors, the number of effective joists is determined as follows:
1N � (4.38)eff DF � DFb v

136 � S T R U C T U R A L W O O D D E S I G N
where DFb � 0.0294 � 0.536 � 0.516 � 0.31 (4.39)1 / 4 1 / 2 3 / 4K K K1 1 1
DFv � �0.00253 � 0.0854 � 0.079 � 0.00327K2 (4.40)1 / 4 1 / 2K K1 2
K1 � (4.41)Kj
K � Kj bi
K2 � (4.42) Kvi
Kbi
Kj � longitudinal stiffness � EIeff/L3 (4.43)Kbi � stiffness of the transverse flexural components, lb/in.
� 0.585EIbiL/ s3 for panel or deck components (4.44)� (2a/L)1.71EIx/ s3 for strongbacks and straps (4.45)
Kvi � stiffness of the transverse shear components, lb/in.� (2a/L)1.71EvA/ s for cross-bridging or solid blocking (4.46)
a � distance of the element to the closest end of the joist, in.L � joist span, in.s � joist spacing, in.
Ev � effective shear modulus, psi� 1000 psi for 2 � 2 cross-bridging without strapping� 2000 psi for 2 � 2 cross-bridging with strapping� 2000 psi for 2� blocking without strapping� 3000 psi for 2� blocking with strapping
A � effective shear area, in2 � joist depth, in. � 1.5 in.EIx � effective flexural stiffness of strongbacks or straps
E � 1.35 � 106 psi for 2� strongbacks or strapping (with or without strapping)EIbi � flexural stiffness of floor panel or deck per unit width
� EIw, perp (Table 4.14) for wood deck panels
� EIw, perp � EIc � for concrete on wood deck (4.47)3EA EA hw, perp c cw
EA � EAw, perp c
Remedial Measures for Controlling Floor Vibrations in Wood Framed Floors
Walking vibrations was found not to be critical for the two example problems considered in theprevious section. However, there might be situations in practice where the vibration thresholdas measured by the deflection limit) is exceeded and remedial measures have to be taken tomitigate the effects of excessive floor vibrations. The primary ways for controlling walking vi-brations include, increasing the natural frequency of the floor system for floors in the low fre-quency range; adding mass to the floor to increase damping; and adding full height partitions tothe floor also to increase damping. Some available options that could be used to mitigate walkingvibration problems include [3, 4, 25]:
1. Reducing the span of the floor joist by adding a new column, if it is architecturally feasi-ble. This increases the natural frequency of the floor system.
2. Using full-height partitions which increases the amount of damping in the floor.
3. Providing additional bridging between joists. This increases the stiffness of the floor in thedirection perpendicular to the joist, thus increasing the number of joists participating inresisting the vibration effects.
4. Using a thicker flooring system, preferably one that has some structural strength such ashardwood flooring. This increases the floor stiffness and hence the natural frequency ofthe floor system.
5. Reinforcing the existing floor joists by using flitch plates on both sides of the joist. In thecase of I-joist, plywood panels could be attached to both sides of the joist to increase thefloor stiffness.

D E S I G N A N D A N A L Y S I S O F B E A M S A N D G I R D E R S � 137
EXAMPLE 4.9
Floor Vibrations on Floor Framing with Sawn Lumber
Determine if a floor framed with 2 � 10 sawn lumber (DF-L, Select Structural) spaced at 16 in. o.c. and a 14ft 0 in. simple span with -in. plywood nailed to the framing is adequate for walking vibration. Assume a3–4residential occupancy. Neglect the contribution from transverse bridging.
Solution:
Floor stiffness:From the NDS Supplement, the properties of the 2 � 10 sawn lumber are
6E � 1.9 � 10 psi
2A � 13.88 inm
4I � 98.9 inm
6EI � EI � 0.016 � 10 psi/ in. (Table 4.14)top w, par
6 6(EI )(S) � (0.016 � 10 )(16 in.) � 0.256 � 10 psiw, par
6EA � EA � 0.46 � 10 lb/in. (Table 4.14)flr w, par
6 6(EA )(S) � (0.46 � 10 )(16 in.) � 7.36 � 10 lbw, par
S � 600 lb/in./ in. (Table 4.15)flr
C � 1.0 (simple span, see equation 4.28)fn
L � 48 in. (not a concrete-topped floor)flr
From equation 4.34,
3–9.25 in. in.4h � � � 5 in.top 2 2
From equation 4.33,
6EA 7.36 � 10flr 6EA � � � 0.135 � 10 lbtop 2 6 21 � 10EA /S L 1 � (10)(7.36 � 10 )/(600)(48)flr flr flr
From equation 4.36,
6EA h (0.135 � 10 )(5 in.)top topy � � � 0.025 in.6 2 6EA � EA (1.9 � 10 )(13.88 in ) � (0.135 � 10 )m top
The relatively small value for y indicates that the plywood decking does not offer much stiffness.
From equation 4.31,
2 2EI � EI � EI � EA y � EA (h � y)m top m top top
6 6 6 2 6 2� (1.9 � 10 )(98.9) � (0.256 � 10 ) � (1.9 � 10 )(13.88)(0.025) � (0.135 � 10 )(5 � 0.025)
6 2� 191 � 10 lb-in
From equation 4.29,
614.4 E 14.4 1.9 � 10� � � � 0.069� �2 2 6(L/ r) G (14 � 12) (13.88/98.9) 0.1 � 10

138 � S T R U C T U R A L W O O D D E S I G N
where the radius of gyration is
Imr � , and therefore�Am
21 A 13.88 inm� �2 4r I 98.9 inm
From equation 4.28, the effective flexural stiffness
6EI 191 � 10 6 2EI � � � 178 � 10 lb-ineff 6 61 � �EI/C EI 1 � (0.069)(191 � 10 )/(1.0)(1.9 � 10 )(98.9)fn m
Number of effective joists:From equation 4.43, the longitudinal stiffness is
6EI 178 � 10effK � � � 37.46j 3 3L (14 � 12)
From equation 4.44, the stiffness of the transverse flexural deck components is
60.585EI L (0.585) (0.040 � 10 )(14 � 12)biK � � � 960bi 3 3s 16
(EI � EI , Table 4.14)bi w, perp
From equation 4.41,
37.46K � � 0.03761 37.46 � 960
K � 0 (blocking/bridging contribution neglected)2
From equations 4.39 and 4.40, we obtain the following parameters:
1 / 4 1 / 2 3 / 4DF � 0.0294 � 0.536K � 0.516K � 0.31Kb 1 1 1
1 / 4 1 / 2 3 / 4� 0.0294 � (0.536) (0.0376) � (0.516)(0.0376) � (0.31)(0.0376)
� 0.339
1 / 4 1 / 2DF � �0.00253 � 0.0854K � 0.079K � 0.00327Kv 1 2 2
1 / 4� �0.00253 � (0.0854)(0.0376) � 0 � 0
� �0.0401
From equation 4.38, the number of effective joists is
1 1N � � � 2.64eff DF � DF 0.339 � (�0.0401)b v
From equation 4.27, the floor deflection under a 225 lb concentrated load is
3 3C PL 1.0 (225)(14 � 12)pd� � � � 0.047 in.� �p 6N 48EI 2.64 (48)(178 � 10 )eff eff

D E S I G N A N D A N A L Y S I S O F B E A M S A N D G I R D E R S � 139
To control walking vibrations, the floor deflection calculated above must satisfy the following criteria fromequation 4.26:
�0.18(L�6.4)� � 0.024 � 0.1e � 0.08 in.p
L � span of joist, ft � 14 ft
�0.18(14�6.4)� � (0.024) � (0.1)ep
� 0.049 in. � 0.047 in. OK
� 0.08 in.
Using Figure 4.32, the same result is obtained. Therefore, the calculated deflection (0.047 in.) is less than themaximum allowable deflection to control walking vibration (0.049 in.) and the floor is deemed adequate forwalking vibrations.
EXAMPLE 4.10
Floor Vibrations on Floor Framing with Preengineered Joists
With reference to the floor section shown in Figure 4.35 and the following design criteria, determine if thefloor is adequate for floor vibrations:
14-in. I-joists spaced 16 in. o.c.L � 25 ft 0 in. simple span
-in. plywood glued and nailed to the framing3–41.5-in. concrete topping, � 3000 psi; wc � 110 lb/ft3f �c2 � 14 blocking is provided at midspan
FIGURE 4.35 Floor section for preengineered joists.

140 � S T R U C T U R A L W O O D D E S I G N
Solution:
Floor stiffness:The flexural and axial stiffness of the 14-in. I-joists are
6 2EI � 600 � 10 in -lbm
6EA � 20 � 10 lbm
(Note: The values above should be obtained from the joist manufacturer.)
6 6EI � (0.016 � 10 psi/ in.)(16 in.) � 0.256 � 10 psi (Table 4.14)w, par
6EI � 0.040 � 10 psi/ in. (Table 4.14)w, perp
6 6EA � (0.46 � 10 lb/in.)(16 in.) � 7.36 � 10 lb (Table 4.14)w, par
6EA � 0.65 � 10 lb (Table 4.14)w, perp
S � 50,000 lb/in./ in. (Table 4.15)flr
C � 1.0 (simple span, see equation 4.28)fn
From equation 4.37, the dynamic modulus of elasticity and stiffness of the concrete deck are
1.5 1.5 6E � (1.2)(33) w �f � � (1.2)(33)(110) �3000 � 2.5 � 10 psic c c
6 3(2.5 � 10 )(16 in.)(1.5) 6 2EI � � 11.25 � 10 lb-inc 12
6 6EA � (2.5 � 10 )(16 in.)(1.5) � 60 � 10 lbc
The concrete deck and plywood sheathing contribute to the axial stiffness of the floor
6 6 6EA � EA � EA � (60 � 10 ) � (7.36 � 10 ) � 67.36 � 10 lbflr c w, par
From equation 4.35, the distance from the top of the concrete to the centroid of the floor deck is
6 6EA [(t /2) � t ] � EA (t /2) (7.36 � 10 ) [(0.75/2) � 1.5] � (60 � 10 )(1.5/2)w, par d c c cy � � � 0.873 in.deck 6 6EA � EA (7.36 � 10 ) � (60 � 10 )w, par c
From equation 4.34, the distance from the centroid of the floor deck to the centroid of the joist is
d 14h � � t � t � y � � 0.75 � 1.5 � 0.873 � 8.38 in.top d c deck2 2
The effecitve axial stiffness of the floor deck parallel to the joist is obtained from equation 4.33 as
6EA 67.36 � 10flr 6EA � � � 58.6 � 10 lbtop 2 6 21 � 10EA /S L 1 � (10)(67.36 � 10 )/(50,000)(25 � 12)flr flr flr
The flexural stiffness of the floor deck parallel to the joist from equation 4.32 is
3EA EA hw, par c cwEI � EI � EI �top w, par c EA � EAw, par c
6 6 3(7.36 � 10 )(60 � 10 )[(0.75 � 1.5)/2]6 6� (0.256 � 10 ) � (11.25 � 10 ) � 6 6(7.36 � 10 ) � (60 � 10 )
6 2� 20.9 � 10 lb-in

D E S I G N A N D A N A L Y S I S O F B E A M S A N D G I R D E R S � 141
The distance from the centroid of the system to the centroid of the joist from equation 4.36 is
6EA h (58.6 � 10 )(8.38 in.)top topy � � � 6.25 in.6 6EA � EA (20 � 10 ) � (58.6 � 10 )m top
From equation 4.31, the flexural stiffness of the floor panel is
2 2EI � EI � EI � EA y � EA (h � y)m top m top top
6 6 6 2 6 2� (600 � 10 ) � (20.9 � 10 ) � (20 � 10 )(6.25) � (58.6 � 10 )(8.38 � 6.25)
6 2� 1668 � 10 in -lb
From equation 4.30,
696EI (96)(600 � 10 )m� � � � 0.1142 6 2K L (0.4 � 10 )(14 in.)(25 � 12)s
Note that Ks � (0.4 � 106)d for preengineered I-joists where d is the depth of the joist
6EI 1668 � 10 6 2EI � � � 1267 � 10 in -lbeff 6 61 � �EI/C EI 1 � (0.114)(1668 � 10 )/(1.0)(600 � 10 )fn m
Number of effective joists:From equation 4.43,
6EI 1267 � 10effK � � � 46.9j 3 3L (25 � 12)
The flexural stiffness of the floor panel per unit width from equation 4.47 is
3EA EA hw, perp c cwEI � EI � EI �bi w, perp c EA � EAw, perp c
6 6 3(0.65 � 10 )(3.75 � 10 )[(0.75 � 1.5)/2]6 6� (0.040 � 10 ) � (0.704 � 10 ) � 6 6(0.65 � 10 ) � (3.75 � 10 )
6 2� 1.53 � 10 lb-in /in.
From equation 4.44, the stiffness of the transverse flexural deck components is
60.585EI L (0.585)(1.53 � 10 )(25 � 12)biK � � � 65,674 lb/in.bi 3 3s 16
From equation 4.46,
1.71(2a/L) E AvK �vi s
25 ft � 12a � � 150 in. (blocking at midspan)
2
A � joist depth, inches � 1.5 in.
The effective shear modulus, Ev is 2000 psi for 2� blocking without strapping
1.71[(2)(150)/(25 � 12)] (2000)(14)(1.5)K � � 2625 lb/in.vi 16
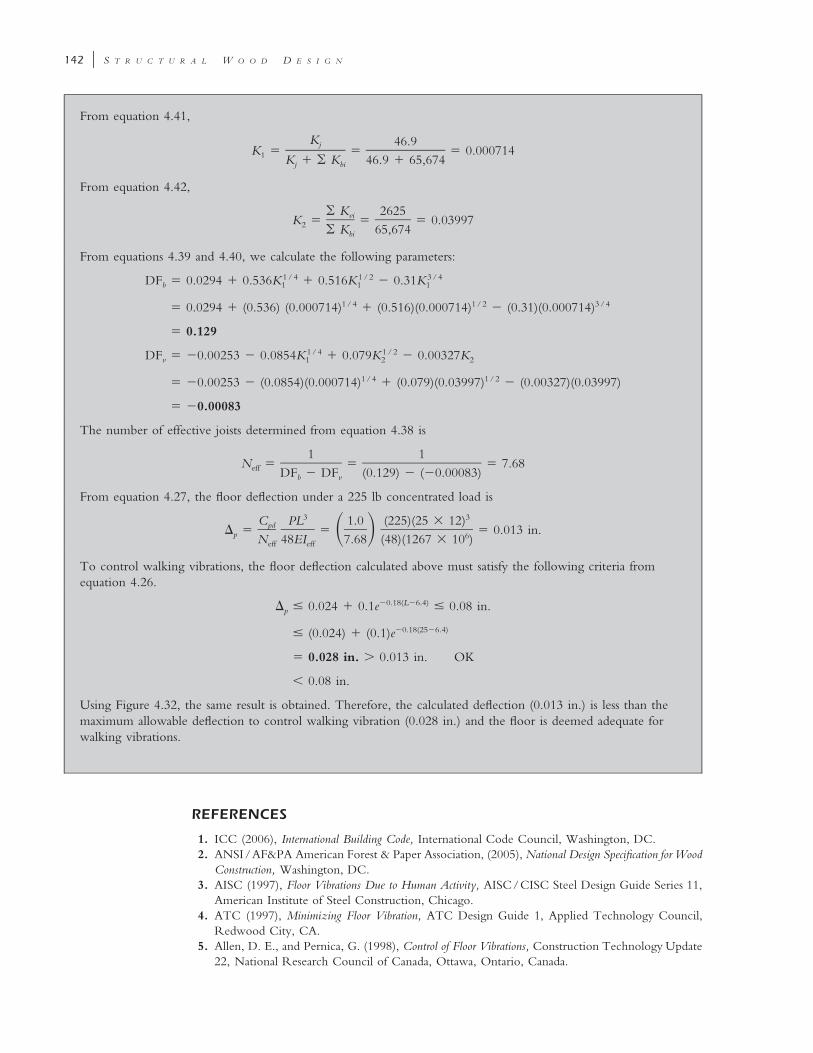
142 � S T R U C T U R A L W O O D D E S I G N
From equation 4.41,
K 46.9jK � � � 0.0007141 K � K 46.9 � 65,674j bi
From equation 4.42,
K 2625viK � � � 0.039972 K 65,674bi
From equations 4.39 and 4.40, we calculate the following parameters:
1 / 4 1 / 2 3 / 4DF � 0.0294 � 0.536K � 0.516K � 0.31Kb 1 1 1
1 / 4 1 / 2 3 / 4� 0.0294 � (0.536) (0.000714) � (0.516)(0.000714) � (0.31)(0.000714)
� 0.129
1 / 4 1 / 2DF � �0.00253 � 0.0854K � 0.079K � 0.00327Kv 1 2 2
1 / 4 1 / 2� �0.00253 � (0.0854)(0.000714) � (0.079)(0.03997) � (0.00327)(0.03997)
� �0.00083
The number of effective joists determined from equation 4.38 is
1 1N � � � 7.68eff DF � DF (0.129) � (�0.00083)b v
From equation 4.27, the floor deflection under a 225 lb concentrated load is
3 3C PL 1.0 (225)(25 � 12)pd� � � � 0.013 in.� �p 6N 48EI 7.68 (48)(1267 � 10 )eff eff
To control walking vibrations, the floor deflection calculated above must satisfy the following criteria fromequation 4.26.
�0.18(L�6.4)� � 0.024 � 0.1e � 0.08 in.p
�0.18(25�6.4)� (0.024) � (0.1)e
� 0.028 in. � 0.013 in. OK
� 0.08 in.
Using Figure 4.32, the same result is obtained. Therefore, the calculated deflection (0.013 in.) is less than themaximum allowable deflection to control walking vibration (0.028 in.) and the floor is deemed adequate forwalking vibrations.
REFERENCES
1. ICC (2006), International Building Code, International Code Council, Washington, DC.2. ANSI/AF&PA American Forest & Paper Association, (2005), National Design Specification for Wood
Construction, Washington, DC.3. AISC (1997), Floor Vibrations Due to Human Activity, AISC/CISC Steel Design Guide Series 11,
American Institute of Steel Construction, Chicago.4. ATC (1997), Minimizing Floor Vibration, ATC Design Guide 1, Applied Technology Council,
Redwood City, CA.5. Allen, D. E., and Pernica, G. (1998), Control of Floor Vibrations, Construction Technology Update
22, National Research Council of Canada, Ottawa, Ontario, Canada.

D E S I G N A N D A N A L Y S I S O F B E A M S A N D G I R D E R S � 143
6. Onysko, D. M. (1988), Performance criteria for residential floors based on consumer responses,Proceedings of the 1988 International Conference on Timber Engineering, Vol. 1, pp. 736–745.
7. ACI (2005), Building Code Requirements for Structural Concrete and Commentary, ACI 318-05, Amer-ican Concrete Institute, Farmington Hills, MI.
8. Willenbrock, Jack H., Manbeck, Harvey B., and Suchar, Michael G. (1998), Residential BuildingDesign and Construction, Prentice Hall, Upper Saddle River, NJ.
9. French, Samuel E. (1996), Determinate Structures: Statics, Strength, Analysis and Design, DelmarPublishers, Albany, NY.
10. Ambrose, James (1994), Simplified Design of Wood Structures, 5th ed., Wiley, New York.11. Faherty, Keith F., and Williamson, Thomas G. (1995), Wood Engineering and Construction,
McGraw-Hill, New York.12. Halperin, Don A. and Bible, G. Thomas (1994), Principles of Timber Design for Architects and
Builders, Wiley, New York.13. Stalnaker, Judith J., and Harris, Earnest C. (1997), Structural Design in Wood, Chapman & Hall,
London.14. Breyer, Donald et al. (2003), Design of Wood Structures—ASD, 5th ed., McGraw-Hill, New York.15. NAHB (2000), Residential Structural Design Guide—2000, National Association of Home Builders
Research Center, Upper Marlboro, MD.16. Cohen, Albert H. (2002), Introduction to Structural Design: A Beginner’s Guide to Gravity Loads and
Residential Wood Structural Design, AHC, Edmonds, WA.17. Newman, Morton (1995), Design and Construction of Wood-Framed Buildings, McGraw-Hill, New
York.18. Kang, Kaffee (1998), Graphic Guide to Frame Construction—Student Edition, Prentice Hall, Upper
Saddle River, NJ.19. Kim, Robert H., and Kim, Jai B. (1997), Timber Design for the Civil and Structural Professional
Engineering Exams, Professional Publications, Belmont, CA.20. Hoyle, Robert J., Jr. (1978), Wood Technology in the Design of Structures, 4th ed., Mountain Press,
Missoula, MT.21. Kermany, Abdy (1999), Structural Timber Design, Blackwell Science, London.22. ICC (2003), International Residential Code, International Code Council, Washington, DC.23. Metwood Building Solutions, Reinforcer technologies by Metwood, http://www.
metwood.com.24. APA (1999), Glulam Beam Camber, Technical Note EWS S550E, April.25. APA (2004), Minimizing Floor Vibration by Design and Retrofit, Technical Note E710, Septem-
ber.
PROBLEMS
4.1 Determine the maximum uniformly distributed floor live load that can be supported by a10 � 24 girder with a simply supported span of 16 ft. Assume that the wood species andstress grade is Douglas fir-larch Select Structural, normal duration loading, normal tem-perature conditions, with continuous lateral support provided to the compression flange.The girder has a tributary width of 14 ft and a floor dead load of 35 psf in addition to thegirder self-weight.
4.2 For the girder in Problem 4.1, determine the minimum bearing length required for a liveload of 100 psf assuming that the girder is simply supported on columns at both ends.
4.3 Determine the joist size required to support a dead load of 12 psf (includes the self-weightof the joist) and a floor live load of 40 psf assuming a joist spacing of 24 in. and a joistspan of 15 ft. Assume southern pine wood species, normal temperature, and dry serviceconditions.
4.4 Determine the joist size required to support a dead load of 10 psf (includes the self-weightof the joist) and a floor live load of 50 psf assuming a joist spacing of 16 in. and ajoist span of 15 ft. In addition, the joists support an additional 10-ft-high partition wallweighing 10 psf running perpendicular to the floor joists at the midspan of the joists.

144 � S T R U C T U R A L W O O D D E S I G N
FIGURE 4.36 Slopedrafter detail.
Assume spruce-pine-fir Select Structural wood species, normal temperature, and dry serviceconditions.
4.5 Design a DF-L tongue-and-grooved roof decking to span 14 ft between roof trusses. Thedecking is laid out in a pattern such that each deck sits on two supports. Assume a deadload of 15 psf, including the self-weight of the deck, and a snow load of 40 psf on ahorizontal projected area. Assume that dry service and normal temperature conditionsapply.
4.6 A 4 � 14 hem-fir Select Structural lumber joist that is part of an office floor framing isnotched 2.5 in. on the tension face at the end supports because of headroom limitations.Determine the maximum allowable end support reaction.
4.7 A simply supported 6 � 12 girder of hem-fir No. 1 species supports a uniformly distrib-uted load (dead plus floor live load) of 600 lb/ft over a span of 24 ft. Assuming normalmoisture and temperature conditions and a fully braced beam, determine if the beam isstructurally adequate for bending, shear, and deflection.
4.8 A 5 � 30 in. 24F–1.8E glulam beam spans 32 ft and supports a concentrated moving1–2load of 5000 lb that can be located anywhere on the beam, in addition to its self-weight.Normal temperature and dry service conditions apply, and the beam is laterally braced atthe supports and at midspan. Assuming a wood density of 36 lb/ft3, a load duration factorCD of 1.0, and the available bearing length lb of 4 in., is the beam adequate for bending,shear, deflection, and bearing perpendicular to the grain?
4.9 The sloped 2 � 10 rafter shown in Figure 4.36 is supported on a ridge beam at the ridgeline and on the exterior stud wall. The reaction from the dead load plus the snow loadon the rafter at the exterior stud wall is 2400 lb. Assuming No. 1 hem-fir, normal tem-perature, and dry service conditions, determine the following:(a) The allowable bearing stresses at an angle to the grain and the allowable bearingF��
stress or allowable stress perpendicular to the grain F�c�(b) The bearing stress at an angle to the grain, f� in the rafter(c) The bearing stress perpendicular to the grain in the top platefc�
4.10 Determine if a floor framed with 2 � 12 sawn lumber (hem-fir, No. 1) spaced at 24 in.o.c. and a 15 ft 0 in. simple span with -in. plywood glued and nailed to the framing is3–4adequate for walking vibration. Assume a residential occupancy. Assume 2 � solid blockingat points.1–3

145
c h a p t e r f i v e
WOOD MEMBERS UNDER AXIAL AND
BENDING LOADS
5.1 INTRODUCTION
Axially loaded members occur in several forms in a timber structure. Some of these includecolumns, wall studs, truss members, shear wall chords, diaphragm chords, and drag struts orcollectors. Columns and wall studs are vertical compression members that carry gravity loadsdown to the foundation. Additionally, they may be subjected to lateral wind loads if located onthe exterior face of the building. In a typical wood-framed building, axially compressed memberssuch as columns and wall studs occur more frequently than members subjected to axial tension.Axial tension members occur most frequently as truss members.
The strength of axially compressed wood members is a function of the unbraced length ofthe member and the end support conditions, and these members fail either by buckling due tolateral instability caused by the slenderness of the member or by crushing of the wood fibers asthey reach their material strength. A more critical load effect that must also be considered foraxially loaded members is the case where bending occurs simultaneously with an axial load. Ingeneral, the four basic design cases for axially loaded members and the corresponding loadingconditions considered in this chapter are as follows:
1. Tension (Figure 5.1a): truss members, diaphragm chords, drag struts, shear wall chords2. Tension plus bending (Figure 5.1b): truss bottom chord members3. Compression (Figure 5.1c): columns, wall studs, truss members, diaphragm chords, drag
struts, shear wall chords4. Compression plus bending (Figure 5.1d ): exterior columns and wall studs, truss top chord
members
Each of these load cases is examined in greater detail in several design examples throughoutthe chapter. In these examples we distinguish between the analysis and design of axially loadedwood members. In the analysis of member strength, the cross-sectional dimensions of the mem-ber, the wood species, and the stress grade are usually known, whereas the member strength isunknown and has to be determined. In design, the applied loads are usually known, but themember size, wood species, and stress grade are unknown and have to be determined.
Structural Wood Design: A Practice-Oriented Approach Using the ASD Method. Abi Aghayere and Jason VigilCopyright © 2007 John Wiley & Sons, Inc.

146 � S T R U C T U R A L W O O D D E S I G N
5.2 PURE AXIAL TENSION: CASE 1
For this design case, axial tension parallel to the grain is considered. Examples of this load casemay occur in truss web members and truss bottom chord members, diaphragm chords, dragstruts, and shear wall chords. The NDS code [1] does not permit tension stress perpendicular tothe grain (see NDS Section 3.8.2) because of the negligible tensile strength of wood in thatdirection. The basic design equation for axial tension stress parallel to grain is
Tf � � F� (5.1)t tAn
where T � applied tension forceAn � net area at the critical section � Ag � � Aholes � Ag � �(dbolt � in.)(thickness,1–8
b)Ag � gross cross-sectional area of the member
� Aholes � sum of the area of the bolt holes perpendicular to the load� (no. of bolts perpendicular to load)(dbolt � in.)(member thickness b)1–8�F�t allowable tension stress
Using the NDS code applicability table presented in Tables 3.1 and 3.2, the allowable tensionstresses are calculated as
(a)
(b)
(c)
(d)
FIGURE 5.1 Basic design load cases:(a) tension; (b) tension plusbending; (c) compression; (d )compression plus bending.
F C C C C C for sawn lumbert D M t F iF� � �t F C C C for glulamst D M t
(5.2)
(5.3)
where Ft � NDS-S tabulated design tension stressC � adjustment factors, as discussed in Chapter 3
For bolted connections, the NDS code requires that the holes be at least to1 1–– ––32 16
in. larger than the diameter of the bolt used (see NDS Section 11.1.2.2). However,it is practical to use in. for ease of installation, and this dimension is used in the1–8examples in this book.
Design of Tension Members
The design procedure for axially loaded tension members is given below and il-lustrated in Example 5.3.
1. Perform structural analysis to determine the member force.
2. Assume a trial member size initially.
3. Analyze the trial member to determine the tension stress applied and thetension stress (or tension load), that is allowable, as in Examples 5.1 and 5.2.
4. If the tension stress applied in the trial member is less than the allowabletension stress, the trial member size is deemed adequate. If the tension stressapplied is much less than the allowable stress, the member is adequate butuneconomical, and in that case, the trial member size should be reduced andthe analysis repeated until the tension stress applied is just less than theallowable tension stress.
5. If the tension stress applied is greater than the allowable tension stress, thetrial size member size must be increased and the analysis repeated until thestress applied is just less than the allowable stress.

W O O D M E M B E R S U N D E R A X I A L A N D B E N D I N G L O A D S � 147
EXAMPLE 5.1
Analysis of a Sawn-Lumber Tension Member
A 2 � 8 wood member (Figure 5.2) is subjected to an axial tension load of 6400 lb caused by dead load plussnow load. Determine the applied tension stress ft and the allowable tension stress and check the adequacy ofF�tthis member. The lumber is hem-fir No. 2, normal temperature conditions apply, and the moisture content isless than 19%. Assume that the connections are made with one row of -in.-diameter bolts.7–8
FIGURE 5.2 Cross section of atension member at a bolt hole.
Solution: The gross area Ag is 10.88 in.2 The area of the bolt holes
7 1 2– –� A � (1 hole)( in. � in.)(1.5 in.) � 1.5 inholes 8 8
The net area of the member at the critical section is
2A � A � � A � 10.88 � 1.5 � 9.38 inn g holes
The axial tension force applied, T � 6400 lb. Therefore, the tension stress applied is
T 6400 lbf � � � 682.3 psit 2A 9.38 inn
Since a 2 � 8 is dimension lumber, the applicable table is NDS-S Table 4A. The tabulated design tensionstress and the adjustment factors from the table are
Ft � 525 psiCD � 1.15 (the CD value for the shorter-duration load in the load combination is used, i.e. the snow load; see
Section 3.1)CM � 1.0 (dry service conditions)Ct � 1.0 (normal temperature conditions)CF � 1.2 (for tension stress)Ci � 1.0 (assumed since no incision is prescribed)
Using the NDS applicability table (Table 3.1), the allowable tension stress is given as
F� � F C C C C Ct t D M t F i
� (525)(1.15)(1.0)(1.0)(1.2)(1.0) � 725 psi
f � 682.3 psi � F� � 725 psi OKt t
Since the applied tension stress ft is less than the allowable tension stress the 2 � 8 hem-fir No. 2 isF�,t
adequate.

148 � S T R U C T U R A L W O O D D E S I G N
EXAMPLE 5.2
Analysis of a Glulam Tension Member
For a 2 � 6 (four laminations) 5DF glulam axial combination member (Figure 5.3) subject to a pure tension1–2load of 15,500 lb caused by dead load plus floor live load, calculate the applied tension stress ft and theallowable tension stress and check the structural adequacy of the member. Assume that normal temperatureF�,t
conditions apply, the moisture content is greater than 16%, and that the connection is made with one row of-in.-diameter bolts.3–4
FIGURE 5.3 Cross section of atension member at a bolt hole.
Solution: The gross area Ag for a 2 � 6 in. glulam is 15 in.2 (Note: The glulam is specified using the actual1–2size.) The area of the bolt holes
3 1 1 2– – –� A � (1 hole)( in. � in.)(2 in.) � 2.19 inholes 4 8 2
The net area at the critical section is
2A � A � � A � 15 � 2.19 � 12.81 inn g holes
The tension stress applied ft is
T 15,500 lbf � � � 1210 psit 2A 12.81 inn
For a 5DF glulam axial combination, use NDS-S Table 5B. The tabulated design tension stress and theapplicable adjustment factors from the table are obtained as follows:
Ft � 1600 psi for 5DF�CM(Ft) 0.80 (wet service since MC � 16%)
CD � 1.0 (the CD value for the shortest-duration load in the load combination is used, i.e., floor live load;see Chapter 3)
Ct � 1.0 (normal temperature conditions)
Using the NDS applicability table (Table 3.2), the allowable tension stress is given as
F� � F C C Ct t D M t
� (1600)(1.0)(0.8)(1.0) � 1280 psi � f OKt
A 2 � 6 5DF glulam tension member is adequate.1–2

W O O D M E M B E R S U N D E R A X I A L A N D B E N D I N G L O A D S � 149
EXAMPLE 5.3
Design of a Wood Tension Member
Design member AF of the typical interior truss shown in Figure 5.4 assuming the following design parameters:
The trusses are spaced 4 ft 0 in. o.c.The dead load is 22.5 psf and the snow load is 40 psf on a horizontal plan area.
The ends of the truss members are connected with one row of -in.-diameter bolts.1–2The wood species/stress grade is No. 2 southern pine.
FIGURE 5.4 Roof truss profile.
Solution:
1. Analyze the truss to obtain the member forces (Figure 5.5). The tributary width of the truss is 4 ft.
FIGURE 5.5 Free-body diagram of the roof truss.
Dead load D � 22.5 psf � 4 ft (tributary width of truss) � 90 lb/ft
Snow load S � 40 psf � 4ft � 160 lb/ft
Total load w � 250 lb/ftTL
Calculate the joint loads:
P � (6 ft/2 � 6 ft/2)(250 lb/ft) � 1500 lb1
P � (6 ft/2 � 6 ft/2)(250 lb/ft) � 1500 lb2
P � (6 ft/2)(250 lb/ft) � 750 lb3
Analyzing the truss using the method of joints or a structural analysis software program, the force in thetruss bottom chord (member AF ) is obtained as
T � 6750 lb (tension)AF
2. Assume the member size. Try a 2 � 8 (dimension lumber). Therefore, use NDS-S Table 4B.

150 � S T R U C T U R A L W O O D D E S I G N
3. From NDS-S Table 4B (southern pine dimension lumber), we obtain the tabulated design tension stressand the adjustment factors as follows. The design tension stress Ft is 650 psi. The adjustment or C factorsare
CD � 1.15 (the CD value for the shortest-duration load in the load combination is used, i.e., the snowload; see Section 3.1)
Ct � 1.0 (normal temperature conditions)CM � 1.0 (dry service, since the truss members are protected from weather)CF � 1.0 (for Southern pine dimension lumber, for d � 12 in., CF � 1.0) For d � 12 in., see the
adjustment factors section of NDS-S Table 4BCi � 1.0 (assumed)
Using the NDS applicability table (Table 3.1), the allowable tension stress is given as
F� � F C C C C Ct t D M t F i
� (650)(1.15)(1.0)(1.0)(1.0)(1.0) � 747.5 psi
From NDS-S Table 1B, the gross area Ag for a 2 � 8 is 10.88 in.2 The available net area at the criticalsection is
1–A � A � (no. of bolt holes perpendicular to force)�(d � in.)(thickness b)n g bolt 8
1 1 2– –� 10.88 � (1)( in. � in.)(1.5 in.) � 9.94 in2 8
4. Tension stress applied
T 6750 lbf � � � 679 psi � F� OKt t2A 9.94 inn
2 � 8 No. 2 southern pine is adequate for the truss bottom chord.
EXAMPLE 5.4
Design of a Wood Tension Member
Design member AF of the truss in Example 5.3 assuming that the wood species and stress grade is Douglas fir-larch Select Structural and the total load (caused by dead load plus snow load) is 500 lb/ft.
Solution:
1. Analyze the truss to obtain the member forces. The given total load (dead plus snow) wTL is 500 lb/ft.Using the truss in Figure 5.5, we calculate the joint loads as follows:
P � (6 ft/2 � 6 ft/2)(500 lb/ft) � 3000 lb1
P � (6 ft/2 � 6 ft/2)(500 lb/ft) � 3000 lb2
P � (6 ft/2)(500 lb/ft) � 1500 lb3
Analyzing the truss using the method of joints or a structural analysis software program, the force in thetruss bottom chord (member AF ) is obtained as
T � 13,500 lb (tension)AF
2. Try a 2 � 8, which is dimension lumber. Therefore, use NDS-S Table 4A.3. From NDS-S Table 4A (DF-L Select Structural) we obtain the tabulated design tension stress and the
adjustment factors as follows. The design tension stress Ft is 1000 psi. The adjustment or C factors are

W O O D M E M B E R S U N D E R A X I A L A N D B E N D I N G L O A D S � 151
CD � 1.15 (the CD value for the shortest-duration load in the load combination is used, i.e., the snowload)
Ct � 1.0 (normal temperature conditions)CM � 1.0 (dry service, since the truss members are protected from the weather)
CF(Ft) � 1.2Ci � 1.0 (assumed)
Using the NDS applicability table (Table 3.1), the allowable tension stress is given as
F� � F C C C C Ct t D M t F i
� (1000)(1.15)(1.0)(1.0)(1.2)(1.0) � 1380 psi
From NDS-S Table 1B, the gross area Ag for a 2 � 8 � 10.88 in.2 The available net area at the criticalsection is
1–A � A � (no. of bolt holes perpendicular to force) � � (d � in.)(thickness b)n g bolt 8
1 1 2– –� 10.88 � (1)( in. � in.) � (1.5 in.) � 9.94 in2 8
4. Applied tension stress
T 13,500 lbf � � � 1358 psi � F� OKt t2A 9.94 inn
A 2 � 8 DF-L Select Structural is adequate for the truss bottom chord.
5.3 AXIAL TENSION PLUS BENDING: CASE 2
For members subjected to combined axial tension and bending loads, such as truss bottom chords,five design checks need to be investigated. It should be noted that for each design check, thecontrolling load duration factor based on the pertinent load combination for each design checkshould be used (see Chapter 3). The required design checks are as follows.
Design Check 1: Tension on the Net AreaTension on the net area (Figure 5.6a) occurs at the ends of the member where the gross
area of the member may be reduced due to the presence of bolt holes at the end connections(e.g., at the ends of truss members). The tension stress applied on the net area
Tf � � F� (5.4)t tAn
where T � tension force appliedallowable tension stress �F�t FtCDCMCtCFCi
An � net area at the critical section � Ag � � Aholes
Ag � gross cross-sectional area of the tension member� Aholes � sum of the area of the bolt holes perpendicular to the load
� (no. of bolts perpendicular to load)(dbolt � in.)(member thick-1–8ness b)
�F�t allowable tension stress
Using the NDS code applicability table (Tables 3.1 and 3.2), the allowable tension stresses arecalculated as
F C C C C C for sawn lumbert D M t F iF� � �t F C C C for glulamst D M t
(5.2)(5.3)
where Ft � NDS-S tabulated design tension stressCD, CM, . . . � adjustment factors, as discussed in Chapter 3

152 � S T R U C T U R A L W O O D D E S I G N
Design Check 2: Tension on the Gross AreaTension on the gross area (Figure 5.6b) occurs at the midspan of the member where there
are no bolt holes, hence the gross area is applicable (e.g., at the midspan of truss members andwall studs). The tension stress applied on the gross area
Tf � � F� (5.5)t tAg
The parameters in equation (5.5) are as defined in design check 1.
Design Check 3: BendingThe maximum bending moment and bending stress occur at the midspan of the member
(Figure 5.6c) and the required design equation is
Mf � � F� (5.6)bt bSx
(a)
(b)
(c)
(d)
(e)
FIGURE 5.6 Stress diagrams forload case 2: (a) design check 1; (b)design check 2; (c) design check 3;(d ) design check 4; (e) designcheck 5.
where fbt � bending stress in the tension fiberM � maximum bending moment in the member (typically, occurs at mid-
span)Sx � section modulus about the axis of bending
�F�b allowable bending stress
Using the applicability table (Tables 3.1 and 3.2), the allowable bending stress isobtained as
F C C C C C C C C (for sawn lumber)b D M t L F i r fuF� � �b F C C C C C C C (for glulam)b D M t L v fu c
where Fb is the NDS-S tabulated design bending stress.
Design Check 4: Bending plus TensionBending plus tension (Figure 5.6d ) occurs in the bottom or tension fibers at
the midspan of the member where the moment and tension force are at their max-imum values, creating the maximum tension stress in the tension or bottom fiberof the member. The interaction equation is given as
f ft bt� � 1.0 (NDS code equation 3.9-1) (5.7)F� F*t b
where ft � tension stress applied due to the axial tension forcefbt � tension stress applied due to bending of the member
�F�t allowable tension stress (see design check 1)
The allowable bending stress is
F C C C C C C C (for sawn lumber)b D M t F i r fuF* � �b F C C C C C C (for glulam)b D M t V fu c
(5.8)(5.9)
It should be noted that the allowable bending stress above does not include thebeam stability factor CL because the fibers in the tension zone of a member subjectedto combined bending plus axial tension are not susceptible to buckling instabilitysince this can only be caused by compressive stresses. Therefore, the allowable bend-ing stress for design is denoted as F*.b
Design Check 5: Bending minus TensionBending plus tension (Figure 5.6e) occurs in the top or compression fibers of
the member subjected to combined axial tension plus bending, with the compressionstresses caused by the bending of the member. The compression stress fbc caused by
the bending moment applied is opposed or counteracted by the tension stress resulting from theaxial tension force P on the member. For this design check, the beam stability factor CL has tobe considered since there is a possibility that a net compression stress could exist in the top fibers

W O O D M E M B E R S U N D E R A X I A L A N D B E N D I N G L O A D S � 153
of the member. Where the axial tension stress ft exceeds the compression stress due to bendingfbc, this design check will not be critical and can be ignored since this condition will produce anet tension stress in the top fibers which is less than the tension stress from design check 4.
The interaction equation for this design check is given as
f � fbc t � 1.0 (NDS code equation 3.9-2) (5.10)F*b
where the bending stress in the compression fibers fbc � M/Sx. Note that fbc is equal to fbt fromdesign check 3 because the wood member has a rectangular cross section. The allowable bendingstress for sawn lumber is given as
F** � F C C C C C C C C (5.11)b b D M t F i r L fu
The allowable bending stress for glulam for this case is:
F** � F C C C C C C (5.12)b b D M t L fu c
It is important to note that it may not be necessary to perform all of the foregoing designchecks for a given problem since some of the design checks could be eliminated by inspection.
Euler Critical Buckling Stress
The Euler critical buckling load for a column is the minimum load at which the column firstbows out, and this load is given as
2� EIP � (5.13)cr 2(K l )e
where E � modulus of elasticityI � moment of inertia about the axis of bending
Kel � effective length of the column � leKe � effective length factor (� 1.0 for column with pinned end supports)
l � unbraced length or height of column
For a rectangular column section with width b and depth d, the Euler critical buckling loadbecomes
2 3� E(bd /12)P � (5.14)cr 2(K l )e
Dividing both sides of the equation above by the cross-sectional area A (� bd ) yields the Eulercritical buckling stress
2 3 2 2� E(bd /12) (� /12)EdF � � (5.15)cE 2 2(K l ) bd (K l )e e
This equation is simplified further to yield the NDS code equation for the Euler critical bucklingstress, which is given as
0.822EF � (5.16)cE 2(K l/d )e
In the NDS code, the modulus of elasticity E in equation (5.16) is replaced by the allowablebuckling modulus of elasticity hence, the equation becomesE� ;min
0.822E�minF � (5.17)cE 2(K l/d )e
5.4 PURE AXIAL COMPRESSION: CASE 3
There are two categories of columns: solid columns and built-up columns. Examples of solidcolumns include interior building columns, struts (such as trench shores), studs (such as wall studs),

154 � S T R U C T U R A L W O O D D E S I G N
EXAMPLE 5.5
Axial Tension plus Bending—Truss Bottom Chord
The roof section of a building shown in Figure 5.7 has 40-ft-span trusses spaced at 2 ft 0 in. o.c. The roof deadload is 15 psf, the snow load is 35 psf, and the ceiling dead load is 15 psf of horizontal plan area. Design atypical bottom chord for the truss assuming the following design parameters:
• No. 1 & Better hem-fir.• Moisture content � 19%, and normal temperature conditions apply.
• The members are connected with a single row of -in.-diameter bolts.3–4
FIGURE 5.7 Roof truss elevation.
Solution: Calculate the joint loads. The given loads in psf of horizontal plan area are as follows:
Roof dead load D (roof) � 15 psf
Ceiling dead load D (ceiling) � 15 psf
Snow load S � 35 psf
Since the tributary area for a typical roof truss is 80 ft2 (i.e., 2-ft tributary width � 40-ft span), the roof liveload Lr from equation (2.4) will be 20 psf, which is less than the snow load S. Therefore, the controlling loadcombination from Chapter 2 will be dead load plus snow load (i.e., D � S).
Total load on roof w � (15 � 35 psf )(2-ft tributary width) � 100 lb/ftTL
Total ceiling load � (15 psf )(2 ft) � 30 lb/ft
The concentrated gravity loads at the truss joints are calculated as follows:
Roof dead load � snow load:
P (top) � (10 ft/2)(100 lb/ft) � 500 lbA
P � (10 ft/2 � 10 ft/2)(100 lb/ft) � 1000 lbD
P � (10 ft/2 � 10 ft/2)(100 lb/ft) � 1000 lbF
P � (10 ft/2 � 10 ft/2)(100 lb/ft) � 1000 lbE
P (top) � P (top) � 500 lbB A
Ceiling dead loads:
P (bottom) � (20 ft/2)(30 lb/ft) � 300 lbA
P (bottom) � (20 ft/2)(30 lb/ft) � 300 lbB
P � (20 ft/2 � 20 ft/2)(30 lb/ft) � 600 lbC
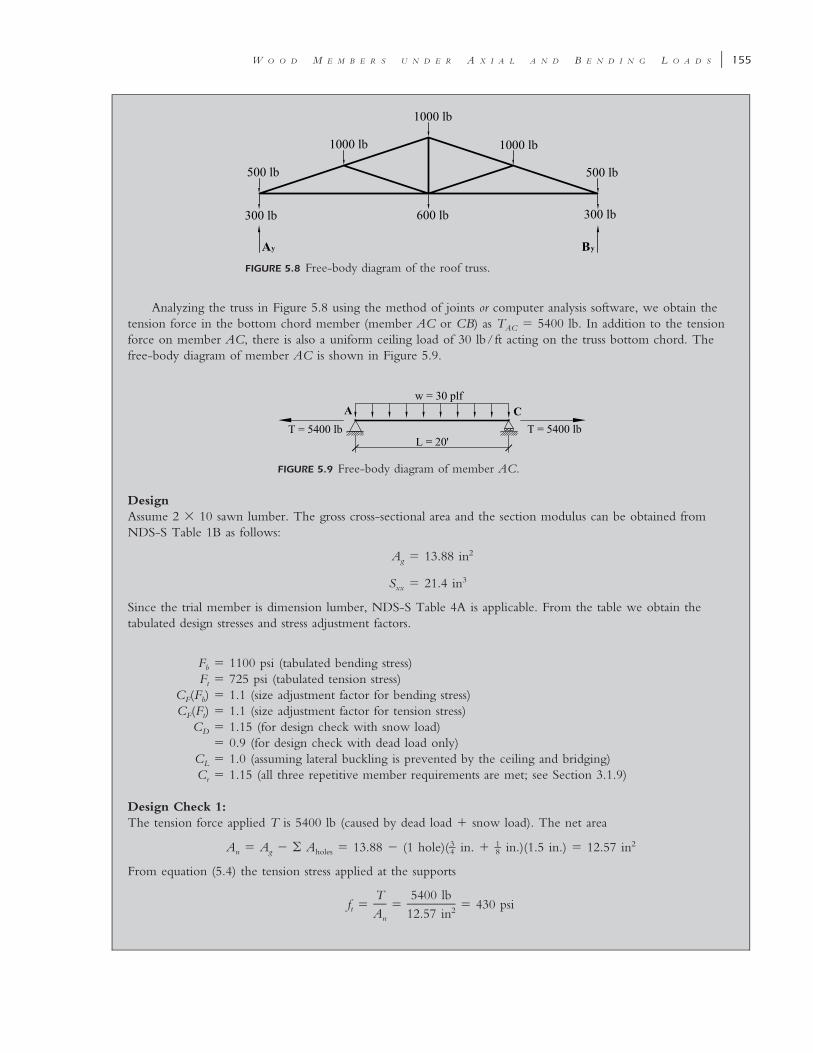
W O O D M E M B E R S U N D E R A X I A L A N D B E N D I N G L O A D S � 155
FIGURE 5.8 Free-body diagram of the roof truss.
Analyzing the truss in Figure 5.8 using the method of joints or computer analysis software, we obtain thetension force in the bottom chord member (member AC or CB) as TAC � 5400 lb. In addition to the tensionforce on member AC, there is also a uniform ceiling load of 30 lb/ft acting on the truss bottom chord. Thefree-body diagram of member AC is shown in Figure 5.9.
FIGURE 5.9 Free-body diagram of member AC.
DesignAssume 2 � 10 sawn lumber. The gross cross-sectional area and the section modulus can be obtained fromNDS-S Table 1B as follows:
2A � 13.88 ing
3S � 21.4 inxx
Since the trial member is dimension lumber, NDS-S Table 4A is applicable. From the table we obtain thetabulated design stresses and stress adjustment factors.
Fb � 1100 psi (tabulated bending stress)Ft � 725 psi (tabulated tension stress)
CF(Fb) � 1.1 (size adjustment factor for bending stress)CF(Ft) � 1.1 (size adjustment factor for tension stress)
CD � 1.15 (for design check with snow load)� 0.9 (for design check with dead load only)
CL � 1.0 (assuming lateral buckling is prevented by the ceiling and bridging)Cr � 1.15 (all three repetitive member requirements are met; see Section 3.1.9)
Design Check 1:The tension force applied T is 5400 lb (caused by dead load � snow load). The net area
3 1 2– –A � A � � A � 13.88 � (1 hole)( in. � in.)(1.5 in.) � 12.57 inn g holes 4 8
From equation (5.4) the tension stress applied at the supports
T 5400 lbf � � � 430 psit 2A 12.57 inn

156 � S T R U C T U R A L W O O D D E S I G N
Using the NDS applicability table (Table 3.1), the allowable tension stress is given as
F� � F C C C C Ct t D M t F i
� (725)(1.15)(1.0)(1.0)(1.1)(1.0) � 917 psi � f OKt
Design Check 2:From equation (5.5), the tension stress applied at the midspan
T 5400 lbf � � � 389 psi � F� � 917 psi OKt t2A 13.88 ing
Design Check 3:The maximum moment which for this member occurs at the midspan is given as
2(30 lb/ft)(20 ft)M � � 1500 ft-lb � 18,000 in.-lbmax 8
This moment is caused by the ceiling dead load only (since no ceiling live load is specified), therefore, thecontrolling load duration factor CD is 0.9. From equation (5.6) the bending stress applied (i.e., tension stress dueto bending) is
M 18,000 in.-lbmaxf � � � 842 psibt 3S 21.4 inx
Using the NDS applicability table (Table 3.1), the allowable bending stress is given as
F� � F C C C C C C C Cb b D M t L F i r fu
� (1100)(0.9)(1.0)(1.0)(1.0)(1.1)(1.0)(1.15)(1.0)
� 1252 psi � f OKbt
Design Check 4:For this case, the applicable load is the dead load plus the snow load; therefore, the controlling load durationfactor CD is 1.15 (see Chapter 3). Using the NDS applicability table (Table 3.1), the allowable axial tensionstress and the allowable bending stress are calculated as follows:
F� � F C C C C Ct t D M t F i
� (725)(1.15)(1.0)(1.0)(1.1)(1.0) � 917 psi
F* � F C C C C C C Cb b D M t F i r ƒu
� (1100)(1.15)(1.0)(1.0)(1.1)(1.0)(1.15)(1.0) � 1600 psi
The axial tension stress applied ft at the midspan is 389 psi, as calculated for design check 2, while the tensionstress applied due to bending fbt is 842 psi, as calculated in design check 3. From equation (5.7) the combinedaxial tension plus bending interaction equation for the stresses in the tension fiber of the member is given as
f ft bt� � 1.0F� F*t b
Substitution into the interaction equation yields
389 psi 842 psi� � 0.95 � 1.0 OK
917 psi 1600 psi

W O O D M E M B E R S U N D E R A X I A L A N D B E N D I N G L O A D S � 157
Design Check 5:The compression stress applied due to bending is
M 18,000 in.-lbmaxf � � � 842 psi (� f since this is a rectangular cross section)bc bt3S 21.4 inx
It should be noted that fbc and fbt are equal for this problem because the wood member is rectangular in crosssection. The load duration factor for this case CD is 1.15 (combined dead � snow loads). Using the NDSapplicability table (Table 3.1), the allowable compression stress due to bending is
F** � F C C C C C C C Cb b D M t L F i r fu
� (1100)(1.15)(1.0)(1.0)(1.0)(1.1)(1.0)(1.15)(1.0) � 1600 psi
From equation (5.10) the interaction equation for this design check is given as
f � fbc t � 1.0F**b
Substituting in the interaction equation yields
842 psi � 389 psi� 0.283 ��� 1.0 OK
1600 psi
From all of the steps above, we find that all five design checks are satisfied; therefore, use 2 � 10 hem-fir No.1 & Better for the bottom chord. Note that if any one of the design checks above had not been satisfied, wewould have had to increase the member size and/or stress grade until all five design checks are satisfied.
and truss members. Built-up columns are made up of individual laminations joined mechanicallywith no spaces between laminations. The mechanical connection between the laminations ismade with through-bolts or nails. Section 15.3 of the NDS code gives the mechanical connectionrequirements for built-up columns. Built-up columns are commonly used within interior orexterior walls of wood-framed buildings because the component members that make up thebuilt-up column are already available on site and can readily be fastened together on site.
The strength of a column is affected by buckling if the column length becomes excessive.There are two types of columns with respect to the column length: short columns and longcolumns. A short column is one in which the axial strength depends only on the crushing ormaterial capacity of the wood. A long column is one in which buckling occurs before the columnreaches the crushing or material capacity of the wood member. The strength of a longF�Ac
column is a function of the slenderness ratio Kel/ r of the column, which is defined as the ratioof the effective length Kel of the column to the least radius of gyration r of the member. Theradius of gyration is given as
Ir � (5.18)�A
where I � moment of inertia of the column member about the axis of bucklingA � cross-sectional area of the column
The required allowable stress design (ASD) equation for this load case is
Pf � � F� (5.19)c cAg
where fc � axial compression stressP � axial compression force applied in the wood column
Ag � gross cross-sectional area of the tension member�F�c allowable compression stress
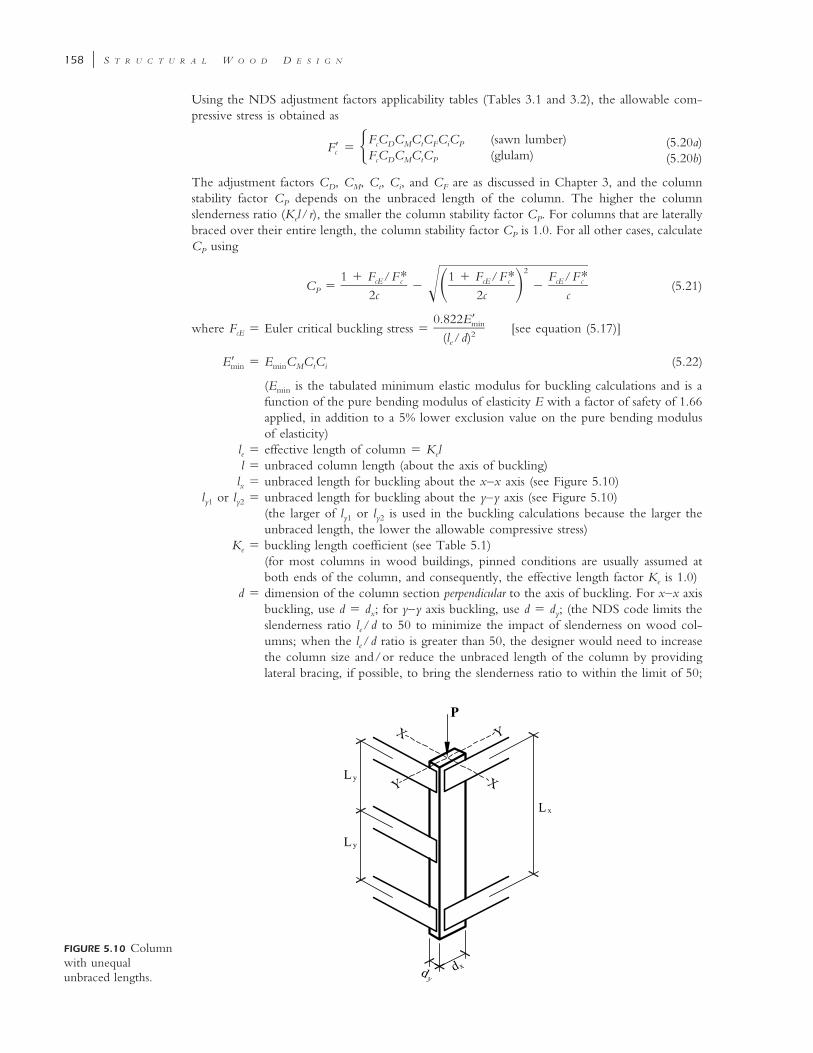
158 � S T R U C T U R A L W O O D D E S I G N
FIGURE 5.10 Columnwith unequalunbraced lengths.
Using the NDS adjustment factors applicability tables (Tables 3.1 and 3.2), the allowable com-pressive stress is obtained as
F C C C C C C (sawn lumber)c D M t F i PF� � �c F C C C C (glulam)c D M t P
(5.20a)(5.20b)
The adjustment factors CD, CM, Ct, Ci, and CF are as discussed in Chapter 3, and the columnstability factor CP depends on the unbraced length of the column. The higher the columnslenderness ratio (Kel/ r), the smaller the column stability factor CP. For columns that are laterallybraced over their entire length, the column stability factor CP is 1.0. For all other cases, calculateCP using
21 � F /F* 1 � F /F* F /F*cE c cE c cE cC � � � (5.21)� �P �2c 2c c
where FcE � Euler critical buckling stress � [see equation (5.17)]0.822E�min
2(l /d)e
�E�min EminCMCtCi (5.22)
(Emin is the tabulated minimum elastic modulus for buckling calculations and is afunction of the pure bending modulus of elasticity E with a factor of safety of 1.66applied, in addition to a 5% lower exclusion value on the pure bending modulusof elasticity)
le � effective length of column � Kell � unbraced column length (about the axis of buckling)
lx � unbraced length for buckling about the x–x axis (see Figure 5.10)ly1 or ly2 � unbraced length for buckling about the y–y axis (see Figure 5.10)
(the larger of ly1 or ly2 is used in the buckling calculations because the larger theunbraced length, the lower the allowable compressive stress)
Ke � buckling length coefficient (see Table 5.1)(for most columns in wood buildings, pinned conditions are usually assumed atboth ends of the column, and consequently, the effective length factor Ke is 1.0)
d � dimension of the column section perpendicular to the axis of buckling. For x–x axisbuckling, use d � dx; for y–y axis buckling, use d � dy; (the NDS code limits theslenderness ratio le/d to 50 to minimize the impact of slenderness on wood col-umns; when the le/d ratio is greater than 50, the designer would need to increasethe column size and/or reduce the unbraced length of the column by providinglateral bracing, if possible, to bring the slenderness ratio to within the limit of 50;

W O O D M E M B E R S U N D E R A X I A L A N D B E N D I N G L O A D S � 159
TABLE 5.1 Buckling Length Coefficients, Ke
Source: Adapted from Ref. 1.
it should be noted that the NDS code allows slenderness ratios of up to 75, butonly during construction)
�F*c crushing strength of column at zero slenderness ratio (i.e., strength when le/d �0)
� Fc (All C-factors except Cp) (5.23)c � interaction factor � 0.8 (for sawn lumber)
� 0.9 (for glulam)� 0.85 (for round timber poles and piles)
Built-up Columns
Built-up columns (Figure 5.11) are commonly used at the end of shear walls as tension orcompression chord members. They can also be used in lieu of a solid post within a stud wall tosupport heavy concentrated loads. Section 15.3 of the NDS code [1] lists the minimum basicprovisions that apply to built-up columns, and these are listed here for reference:
• Each lamination is to be rectangular in cross section.• Each lamination is to be at least 1.5 in. thick.• All laminations are to have the same depth.• Faces of the adjacent laminations are to be in contact.• All laminations are full column length.• The nailed or bolted connection requirements of Sections 15.3.3 and 15.3.4 of the NDS
code are to be met.
The allowable compressive stress in a built-up column is calculated as
F� � F C C C C C Cc c D M t F i P
where CP � (5.24)21 � F /F* 1 � F /F* F /F*cE c cE c cE cK � �� � � f �2c 2c c
�F*c FcCDCMCtCFCi

160 � S T R U C T U R A L W O O D D E S I G N
EXAMPLE 5.6
Column Axial Load Capacity in Pure Compression
Design a column for an axial compression dead load plus snow load of 17 kips given the following parameters:
No. 1 Douglas fir-larch wood species.Column unbraced lengths lx � ly � 12 ft.Dry service and normal temperature conditions apply.
Solution: Several design aids for selecting an appropriate column size for a given load are given in Appendix B.Entering Figure B.10 with an applied load of 17 kips and an unbraced length of 12 ft, a trial size of 6 � 6 isindicated. It is important to note that the load duration factor CD is 1.0 for this chart. Since a load durationfactor CD of 1.15 is given for this problem, it can be seen by inspection that the actual capacity of the 6 � 6would be slightly higher than 17 kips for this example.
A 6 � 6 member is a post and timber (P&T); therefore, NDS-S Table 4D is applicable. From the table thestress adjustment or C factors are
C � 1.0 (normal moisture conditions)M
C � 1.0 (normal temperature conditions)t
C � 1.15 (snow load controls for the given load combination of D � S )D
C � 1.0 (assumed)i
From the table the tabulated design stresses are obtained as follows:
F � 1000 psi (compression stress parallel to grain)c
6E � 1.6 � 10 psi (reference modulus of elasticity)
6E � 0.58 � 10 psi (buckling modulus of elasticity)min
1 / 9C � (12/d ) � 1.0F
� 1.0 for d � 12 in.; therefore, C � 1.0F
The column dimensions are dx � 5.5 in. and dy � 5.5 in. The cross-sectional area A � 30.25 in2. Theeffective length factor Ke is assumed to be 1.0, as discussed earlier in the chapter; therefore, the slenderness ratiosabout the x–x and y–y axes are given as
l (1.0)(12 ft) � (12 in./ft)e � � 26.2 � 50 OKd 5.5 in.x
l (1.0)(12 ft) � (12 in./ft)e � � 26.2 � 50 OKd 5.5 in.y
Using the applicability table (Table 3.1), the allowable modulus of elasticity for buckling calculations is given as
E� � E C C Cmin min M t i
6 6� (0.58 � 10 )(1.0)(1.0)(1.0) � 0.58 � 10 psi
c � 0.8 (sawn lumber)

W O O D M E M B E R S U N D E R A X I A L A N D B E N D I N G L O A D S � 161
The Euler critical buckling stress is calculated as
60.822E� (0.822)(0.58 � 10 )minF � � � 695 psicE 2 2(l /d) (26.2)e
F* � F C C C C Cc c D M t F i
� (1000)(1.15)(1.0)(1.0)(1.0)(1.0) � 1150 psi
F 695 psicE � � 0.604F* 1150 psic
From equation (5.21) the column stability factor is calculated as
21 � 0.604 1 � 0.604 0.604C � � � � 0.502� P �(2)(0.8) (2)(0.8) 0.8
The allowable compression stress
F� � F*C � (1150)(0.502) � 577.3 psic c P
The allowable compression load capacity of the column is
2P � F�A � (577.3 psi)(30.25 in )allowable c g
� 17,463 lb � 17.5 kips � 17 kips OK
Use a 6 � 6 No. 1 DF-L column.
FIGURE 5.11 Built-upcolumn elevation andcross section.

162 � S T R U C T U R A L W O O D D E S I G N
Kf � 0.60 (for nailed columns when calculating FcE using Ley/dy)0.75 (for bolted columns when calculating FcE using Ley/dy)1.0 (for nailed or bolted columns when calculating FcE using Lex/dx)
The first two Kf values above are used when the weak axis of the column controls (i.e., whenley/dy is greater than lex/dx). Where buckling about the strong axes controls or when lex/dx isgreater than ley/dy, Kf is 1.0.
It should be noted that where the built-up column is embedded within a sheathed wallsuch that it is continuously braced for buckling about the weak axis, the column stability factorCpyy will be 1.0. The Kf factor in equation (5.24) applies only to weak-axis buckling and accountsfor the reduction in axial load capacity of the column due to interface shear between the lam-inations of the built-up column. For the minimum nailing or bolting requirements for built-upcolumns, the reader is referred to Sections 15.3.3 and 15.3.4 of the NDS code [1].
P–Delta Effects in Members under Combined Axial and Bending Loads
The bending moments in a member supported at both ends and subjected to combined axialcompression plus bending are amplified by the presence of that axial load. The magnitude ofthe moment amplification is a function of the slenderness ratio of the member. The amplificationof the bending moment in the presence of axial compression load is known as the P–� effect.This concept is illustrated by the free-body diagram in Figure 5.13.
Consider a pin-ended column subjected to combined axial load P and a lateral bending loadW at the midheight as shown in Figure 5.13. The lateral load causes lateral deflection of thecolumn, which is further amplified by the presence of the axial compression load P until equi-librium is achieved at a deflection �; hence, it is called the P–� effect.
Summing moments about point B in the free-body diagram of Figure 5.13b, we obtain
W L�P� � � M � 0
2 2
therefore,
WLM � � P� (5.25)
4
where M � maximum second-order or final momentWL/4 � maximum first-order or maximum moment in the absence of the axial load P
� � maximum lateral deflection
The maximum second-order moment M includes the moment magnification or the P–� moment.Thus, the presence of the axial compression load leads to an increase in the column moment,but the magnitude of the increase depends on the slenderness ratio of the column. The momentmagnification effect is accounted for in the NDS code by multiplying the bending stress termfb/ by the magnifier 1/(1 � fc/FcE), (see equation 5.31) where fc is the applied axial com-F�bpression stress in the column and FcE is the Euler critical buckling stress about the axis of bucklingas calculated in equation (5.17).
5.5 AXIAL COMPRESSION PLUS BENDING: CASE 4
For members subjected to combined axial compression and bending loads, there are four designchecks that need to be investigated. It is important to note that for each design check, thecontrolling load duration factor based on the pertinent load combination for each design checkshould be used (see Chapter 3). The four design checks required are as follows.
Design Check 1: Compression on the Net AreaCompression on the net area (Figure 5.14a) occurs at the ends of the member (i.e., at the
connections) and the column stability factor CP is 1.0 for this case since there can be no bucklingat the ends of the member. The design equation required is

W O O D M E M B E R S U N D E R A X I A L A N D B E N D I N G L O A D S � 163
EXAMPLE 5.7
Axial Load Capacity of a Built-up Column
Calculate the axial load capacity of a 12-ft-long nailed built-up column consisting of three 2 � 6’s (Figure5.12), assuming Douglas fir-larch No. 1 lumber, normal temperature and moisture conditions, and a loadduration factor CD of 1.0.
FIGURE 5.12 Built-up column cross section.
Solution: For three 2 � 6’s, dx � 5.5 in., dy � (3)(1.5 in.) � 4.5 in. (see NDS-S Table 1B). Since a 2 � 6 isdimension lumber, NDS-S Table 4A is applicable. From the table the tabulated design stresses are obtained as
F � 1500 psic
6E � 0.62 � 10 psimin
From NDS-S Table 4A, the size factor for axial compression stress parallel to grain is
C � 1.1 (size factor for axial compression stress parallel to the grain)F(F )c
The following stress adjustment or C factors were specified in the problem:
C � 1.0 (normal moisture conditions)M
C � 1.0 (normal temperature conditions)t
C � 1.0D
C � 1.0 (assumed)i
The unbraced length of the column lx � ly � 12 ft. Ke � 1.0 (building columns are typically assumed to bepinned at both ends).
l K l (1.0)(12 ft)(12 in./ft)ex e x� � � 19.9 � 50 OKd d 5.5x x
l K l (1.0)(12 ft)(12 in./ft)ey e y� � � 32 � 50 OKd d 4.5y y

164 � S T R U C T U R A L W O O D D E S I G N
Since ley/dy � lex/dx, the weak-axis slenderness ratio (ley/dy) governs; therefore, the controlling column stabilityfactor is about the weak axis (i.e., CPyy)
K � 0.60 (nailed built-up column)f
c � 0.8 (visually graded lumber)
E� � E C C Cmin min M t i
6 6� (0.62 � 10 )(1.0)(1.0)(1.0) � 0.62 � 10 psi
60.822E� (0.822)(0.62 � 10 )minF � � � 498 psicEyy 2 2(l /d ) (32)ey y
F* � F C C C C Cc c D M t F i
� (1500)(1.0)(1.0)(1.0)(1.1)(1.0) � 1650 psi
F 498 psicE � � 0.302F* 1650 psic
From equation (5.24) the controlling column stability factor (i.e., CPyy) is calculated as
21 � 0.302 1 � 0.302 0.302C � 0.60 � � � 0.168� � P �(2)(0.8) (2)(0.8) 0.8
The allowable compression stress is given as
F� � F*C � (1650)(0.168) � 277.0 psic c P
The axial load capacity of the built-up column is calculated as
P � F�A � (277.0)(4.5 in.)(5.5 in.)allowable c g
� 6858 lbFrom Section 15.3.3 of the NDS code [1], the minimum nailing requirement is 30d nails spaced vertically at 8in. o.c. and staggered in. with an edge distance of in. and an end distance of in. (see Figure 5.12).1 1 1– – –2 1 32 2 2
Pf � � F� (5.26)c cAn
where fc � axial compression stress appliedP � tension force applied
An � net area at the critical section � Ag � � Aholes
Ag � gross cross-sectional area of the tension member� Aholes � sum of the area of the bolt holes perpendicular to the load
� (no. of bolts perpendicular to load)(dbolt � in.)(member thickness b)1–8�F�c allowable compression stress parallel to the grain
Using the NDS code applicability table (Tables 3.1 and 3.2), the allowable compression stressparallel to the grain is as calculated in equations 5.20a and 5.20b.
In calculating the column stability factor CP, the larger slenderness ratio is used since thisrepresents the most critical condition with respect to buckling.
Design Check 2: Compression on the Gross AreaCompression on the gross area (Figure 5.14b) occurs at the midspan of the member (i.e.,
where no connections exist) and the gross cross-sectional area of the member is applicable. Forthis location, however, column stability is a factor, and thus the column stability factor CP maybe less than 1.0 and has to be calculated. The required design equation is

W O O D M E M B E R S U N D E R A X I A L A N D B E N D I N G L O A D S � 165
(a) (b)
FIGURE 5.13 P–� effect in axially loaded compressionmembers.
(a)
(b)
(c)
(d)
FIGURE 5.14 Stress diagrams for load case 4: (a) design check1; (b) design check 2; (c) design check 3; (d ) design check 4.
Pf � � F� (5.27)c cAg
The parameters in equation (5.27) are as defined in design check 1.
Design Check 3: Bending OnlyBending only (Figure 5.14c) occurs at the point of maximum moment (i.e., at the midspan
of the member) and the required design equation is
Mf � � F� (5.28)bc bSx
where fbc � bending stress in the compression fiberM � maximum bending moment in the member (typically, occurs at midspan)Sx � section modulus about the axis of bending
�F�b allowable bending stress
Using the adjustment factors applicability table (Tables 3.1 and 3.2), the allowable bending stressis obtained as
F C C C C C C C C (for sawn lumber)b D M t L F i r fuF� ��b F C C C C C C C (for glulam)b D M t L v fu c
where Fb is the NDS-S tabulated design bending stress. Note that for dimension-sawn lumberbuilt-up columns with three or more laminations embedded within a sheathed wall and subjectedto bending about its strong axis, the repetitive member factor Cr is 1.15.
Design Check 4: Bending plus CompressionBending plus compression (Figure 5.14d ) occurs at the point of maximum moment (i.e., at
the midspan) where the moment magnification (or P-�) factor is at its maximum value. The

166 � S T R U C T U R A L W O O D D E S I G N
general design interaction equation for combined concentric axial compression load plus biaxialbending is given in the NDS code as
2f f /F� f /F�c bx bx by by� � � 1.0 (5.29)� � 2F� 1 � f /F 1 � f /F � ( f /F )c c cEx c cEy bx bEx
where fc � axial compression stress�F�c allowable compression stress parallel to the grain
fbx � bending stress due to x–x axis bending�F�bx allowable bending stress for bending about the x–x axis
FcEx � Euler critical stress for buckling about the x–x axisFbEx � Euler critical stress for buckling about the x–x axis
fby � bending stress due to y–y axis bending�F�by allowable bending stress for bending about the y–y axis
FcEy � Euler critical stress for buckling about the y–y axis
fc � FcEx � (Euler critical column buckling stress about the x–x axis)0.822E�min
2(l /d )ex x
fc � FcEy � (Euler critical column buckling stress about the y–y axis)0.822E�min
2(l /d )ey y
fby � FbE � (Euler critical lateral-torsional buckling stress for y–y axis bending)1.20E�min
2(R )B
RB � � 50l de x
2� ble � effective length for bending members from Table 3.9
dx � column dimension perpendicular to the x–x axis (see Figure 5.15)b � column dimension perpendicular to the y–y axis
FIGURE 5.15
Column crosssection.
For combined concentric axial load plus uniaxial bending about the strong (x–x) axis of the mem-ber, the interaction equation above reduces to
2f f /F�c bx bx� � 1.0 (5.30)� �F� 1 � f /Fc c cEx
Using the adjustment factors applicability table (Tables 3.1 and 3.2), the allowable bending stressfor each axis of bending is obtained from the equations
F C C C C C C C C (for sawn lumber)b D M t L F i r fuF� � �b F C C C C C C C (for glulam)b D M t L v fu c
where Fb is the NDS-S tabulated design bending stress.Using the adjustment factors applicability table (Tables 3.1 and 3.2), the allowable com-
pressive stress is calculated from equations 5.20a and 5.20b.In the calculation of the column stability factor CP and the allowable compression stress
parallel to grain the larger of the slenderness ratios about both orthogonal axes (lex/dx or leyF�,c
/dy) should be used since the column will buckle about the axes with the larger slendernessratio. The higher the column slenderness ratio Kel/ r, the smaller the column stability factor CP.For columns that are laterally braced over their entire length, the column stability factor CP is1.0. For all other cases, calculate CP using equation 5.21.
21 � F /F* 1 � F /F* F /F*cE c cE c cE cC � � � (5.21)� �P �2c 2c c
where FcE � Euler critical buckling stress � [see equation (5.17)]0.822E�min
2(l /d)e
E� � E C C C (5.22)min min M t i

W O O D M E M B E R S U N D E R A X I A L A N D B E N D I N G L O A D S � 167
EXAMPLE 5.8
Combined Compression plus Bending—Truss Top Chord
Design the top chord member AD of the roof truss in Example 5.5 (Figure 5.16).
FIGURE 5.16 Truss top chord load diagram and cross section.
Solution: The maximum axial compression force in member AD is
P (from computer analysis, method of joints, or method of sections) � 5693 lbmax
The maximum moment in member AD is
2(100 lb/ft)(10 ft)M � � 1250 ft-lb � 15,000 in.-lbmax 8
Select a Trial Member SizeTry 2 � 10 No. 1 & Better hem-fir. A 2 � 10 is dimension lumber; therefore, use NDS-S Table 4A. FromNDS-S Table 1B, we obtain the section properties for the trial member size:
2gross cross-sectional area A � 13.88 ing
3section modulus S � 21.4 inx
d � 9.25 in.x
d � 1.5 in.y
From NDS-S Table 4A, we obtain the tabulated design stress values and the stress adjustment or C factors asfollows:

168 � S T R U C T U R A L W O O D D E S I G N
F � 1350 psic
F � 1100 psib
6E � 0.55 � 10 psimin
C (F ) � 1.0F c
C (F ) � 1.1F b
C � 1.0 (normal moisture conditions)M
C � 1.0 (normal temperature conditions)t
C � 1.0fu
C � 1.15 (the condition for repetitiveness is discussed in Chapter 3)r
C � 1.15 (snow load controls for the load combination D � S )D
C � 1.0 (assumed)i
It should be noted that for each design check, the controlling load duration factor value will correspond to theCD value of the shortest-duration load in the load combination for that design case. Thus, the CD value for thevarious design cases may vary.
Design Check 1: Compression on Net AreaThis condition occurs at the ends (i.e., supports) of the member. For this load case, the axial load P is caused bydead load plus snow load (D � S ); therefore, the load duration factor CD from Chapter 3 is 1.15. Thecompression stress applied
Pf � � F�c cAn
net area A � A � � An g holes
3 1– –� 13.88 � (1 hole)( in. � in.)(1.5 in.)4 8
Therefore,
2A � 12.57 inn
The compressive axial stress applied
P 5693 lbf � � � 453 psic 2A 12.57 inn
At support locations, there can be no buckling; therefore, CP � 1.0.The allowable compression stress parallel to the grain is
F� � F C C C C C Cc c D M t F i P
� (1350)(1.15)(1.0)(1.0)(1.0)(1.0)(1.0)
Therefore,
F� � 1553 psi � f � 453 psi OKc c
Design Check 2: Compression on Gross AreaThis condition occurs at the midspan of the member. The axial load P for this load case is also caused by deadload plus the snow load (D � S ); therefore, the load duration factor CD from Chapter 3 is 1.15. The appliedaxial compressive stress

W O O D M E M B E R S U N D E R A X I A L A N D B E N D I N G L O A D S � 169
P 5693 lbf � � � 411 psic 2A 13.88 ing
Unbraced length. For x–x axis buckling, the unbraced length lux � 10.54 ft. For y–y axis buckling, theunbraced length luy � 0 ft (plywood sheathing braces top chord).
Effective length. For building columns that are supported at both ends, it is usual practice to assume aneffective length factor Ke of 1.0. For x–x axis buckling, effective length
l � K l � (1.0)(10.54 ft) � 10.54 ftex e ux
For y–y axis buckling, effective length
l � K l � (1.0)(0) � 0 ftey e uy
Slenderness ratio. For x–x axis buckling, the effective length is
l (10.54 ft)(12)ex � � 13.7 � 50 (larger slenderness ratio controls)d 9.25 in.x
For y–y axis buckling, the effective length is
l 0ey � � 0 � 50d 1.5 in.y
Therefore,
(l /d ) � 13.7.e max
This slenderness ratio will be used in the calculation of the column stability factor CP and the allowablecompression stress parallel to the grain The buckling modulus of elasticityF�.c
E� � E C C Cmin min M t i
6 6� (0.55 � 10 )(1.0)(1.0)(1.0) � 0.55 � 10 psi
c � 0.8 (visually graded lumber)
The Euler critical buckling stress about the weaker axis (i.e., the axis with the higher slenderness ratio), whichfor this problem happens to be the x–x axis, is
60.822E� (0.822)(0.55 � 10 )minF � � � 2409 psicE 2 2(l /d) (13.7)e max
F* � F C C C C Cc c D M t F i
� (1350)(1.15)(1.0)(1.0)(1.0)(1.0) � 1553 psi
F 2409 psicE � � 1.551F* 1553 psic
From equation (5.21) the column stability factor is calculated as
21 � 1.551 1 � 1.551 (1.551)C � � � � 0.818� P �(2)(0.8) (2)(0.8) (0.8)
The allowable compression stress parallel to the grain is
F� � F*C � (1553)(0.818) � 1270 psi � f � 411 psi OKc c P c

170 � S T R U C T U R A L W O O D D E S I G N
Design Check 3: Bending OnlyThis condition occurs at the point of maximum moment (i.e., at the midspan of the member), and the momentis caused by the uniformly distributed gravity load on the top chord (member AD), and since this load is thedead load plus the snow load, the controlling load duration factor (see Chapter 3) is 1.15. The maximummoment in member AD
2w lD�SM �max 8
2(100 lb/ft)(10 ft)� � 1250 ft-Ib � 15,000 in.-lb.
8
The compression stress applied in member AD due to bending
M 15,000 in.-lbf � � � 701 psibc 3S 21.4 inx
The allowable bending stress
F� � F C C C C C C C Cb b D M t L F i r fu
� (1100)(1.15)(1.0)(1.0)(1.0)(1.1)(1.0)(1.15)(1.0)
� 1600 psi � f � 701 psi OKb
Design Check 4: Bending plus Axial Compression ForceThis condition occurs at the midspan of the member. For this load case, the loads causing the combined stressesare the dead load plus the snow load (D � S); therefore, the controlling load duration factor CD is 1.15. Itshould be noted that because the load duration factor CD for this combined load case is the same as for loadcases 2 and 3, the parameters to be used in the combined stress interaction equation can be obtained fromdesign checks 2 and 3. The reader is cautioned to be aware that the CD value for all four design checks are notnecessarily always equal.
The interaction equation for combined concentric axial load plus uniaxial bending is obtained fromequation (5.30) as
2f f /F�c bx bx� � 1.0� �F� 1 � f /Fc c cEx
where fc � 411 psi (occurs at the midspan; see design check 2)�F�c 1267 psi (occurs at the midspan; see design check 2)
fbx � 701 psi (occurs at the midspan; see design check 3)�F�bx 1600 psi (occurs at the midspan; see design check 3)
The reader should note that in the interaction equation above, it is the Euler critical buckling stress about thex–x axis, FcEx, that is required since the bending of the truss top chord member is about that axis.
The effective length for x–x axis buckling is
l (10.54 ft)(12)ex � � 13.7 � 50d 9.25 in.x
The Euler critical buckling stress about the x–x axis is
60.822E� (0.822)(0.55 � 10 )minF � � � 2409 psicEx 2 2(l /d ) (13.7)ex x
Substituting the parameters above into the interaction equation yields2411 701/1600
� � 0.63 � 1.0 OK� � � �1267 1 � 411/2409
2 � 10 No. 1 & Better hem-fir is adequate for the truss top chord.

W O O D M E M B E R S U N D E R A X I A L A N D B E N D I N G L O A D S � 171
EXAMPLE 5.9
Combined Axial Compression plus Bending—Exterior Stud Wall
Design the ground floor exterior stud wall for the two-story building with the roof and floor plans shown inFigure 5.17. The floor-to-floor height is 10 ft and the wall studs are spaced at 2 ft o.c. Assume Douglas fir-larch (DF-L) wood species and the design loads shown.
o.c.
o.c.
o.c.
FIGURE 5.17 Roof and floor plans.
Solution: First, we calculate the gravity and lateral loads acting on a typical wall stud (Figure 5.18).

172 � S T R U C T U R A L W O O D D E S I G N
FIGURE 5.18 Stud wall section and plan view.
Tributary width of wall stud � 2 ft
Roof dead load D � 20 psf
Roof snow load S � 40 psf
Roof live load L � 20 psf (see Chapter 2)r
Since Lr � S, the snow load controls. The lateral wind load W � 15 psf (acts horizontally). The net verticalwind load is assumed to be zero for this building.
Second-floor dead load D � 20 psf
Second-floor live load L � 40 psf
Second-floor wall self-weight � 10 psf
Ground-floor wall self-weight � 10 psf
Gravity loads:
32 ft 2Tributary area per stud at the roof level � � 2 ft (2 ft) � 36 ft� �2
16 ft 2Tributary area per stud at the second-floor level � (2 ft) � 16 ft2

W O O D M E M B E R S U N D E R A X I A L A N D B E N D I N G L O A D S � 173
The total dead load on the ground-floor studs is
P � P � P � PD D(roof ) D(floor) D(wall)
2 2� (20 psf )(36 ft ) � (20 psf )(16 ft ) � (10 psf )(2 ft stud spacing)(10 ft wall height)
� 1440 lb
The total snow load on the ground-floor studs is
2P � (40 psf )(36 ft ) � 1440 lbS
The total floor live load on the ground-floor studs is
2P � (40 psf )(16 ft ) � 640 lbL
Note that the roof live load Lr has been neglected in this example since it will not govern because its maximumvalue of 20 psf is less than the specified snow load (S � 40 psf ) for this building.
Lateral loads. The wind load acts perpendicular to the face of the stud wall, causing bending of the studabout the x–x (strong) axis (see Figure 5.18). The lateral wind load
w � (15 psf )(2 ft tributary width) � 30 lb/ftwind
The maximum moment due to wind load is calculated as
2wLM �w 8
2(30)(10 )� � 375 ft-lb � 4500 in.-lb
8
The most critical axial load combination and the most critical combined axial and bending loadcombination are now determined following the normalized load procedure outlined in Chapter 3. The axialload P in the wall stud will be caused by the gravity loads D, L, and S, while the bending load and momentwill be caused by the lateral wind load W. The load values to be used in the load combinations are as follows:
D � 1440 lb
S � 1440 lb
L � 640 lb
W � 4500 in.-lb
All other loads are assumed to be zero and are therefore neglected in the load combinations. The applicableload combinations with all the zero loads neglected are shown in Table 5.2.
TABLE 5.2 Applicable and Governing Load Combinations
Load CombinationAxial Load, P
(lb)Moment, M
(in.-lb) CD
NormalizedLoad andMoment
P/CD M/CD
D 1440 0 0.9 1600 0
D � L 1440 � 640 � 2080 0 1.0 2080 0
D � S 1440 � 1440 � 2880 0 1.15 2504 0
D � 0.75L � 0.75S 1440 � (0.75)(640 � 1440) � 3000 0 1.15 2609 0
D � 0.75W � 0.75L � 0.75S 1440 � (0.75)(640 � 1440) � 3000 0.75(4500) � 3375 1.6 1875 2110
0.6D � W (0.6)(1440) � 864 4500 1.6 540 2813

174 � S T R U C T U R A L W O O D D E S I G N
It will be recalled from Chapter 3 that the necessary condition to use the normalized load method is that allthe loads be similar and of the same type. We can separate the load cases in Table 5.2 into two types of loads:pure axial load cases and combined load cases. The most critical load combinations are the load cases with thehighest normalized load or moment. Since not all the loads on this wall stud are pure axial loads only orbending loads only, the normalized load method discussed in Chapter 3 can then be used only to determine themost critical pure axial load case, not the most critical combined load case. The most critical combined axialload plus bending load case would have to be determined by carrying out the design (or analysis) for all thecombined load cases, with some of the load cases eliminated by inspection.
Pure axial load case. For the pure axial load cases, the load combination with the highest normalized loadP/CD) from Table 5.2 is
D � 0.75(L � S ) P � 3000 lb with C � 1.15D
Combined load case. For the combined load cases, the load combinations with the highest normalized loadP/CD and normalized moment M/CD from Table 5.2 are
D � 0.75(L � S � W ) P � 3000 lb M � 3375 in.-lb C � 1.6D
or
0.6D � W P � 864 lb M � 4500 in.-lb C � 1.6D
By inspection it would appear as if the load combination D � (L � S � W ) will control for the combinedload case, but this should be verified through analysis, and so both of these combined load cases will beinvestigated.
Select a Trial Member SizeSeveral design aids are given in Appendix B to help the reader with preliminary sizing of wall studs. UsingFigure B.23, a 2 � 6 DF-L No. 2 appears to be adequate to resist the pure axial load case and the combinedload cases above for the given floor-to-floor height of 10 ft. Try a 2 � 6 DF-L No. 2. A 2 � 6 is dimensionlumber; therefore, use NDS-S Table 4A. From NDS-S Table 1B we obtain the section properties for the trialmember size:
2gross cross-sectional area A � 8.25 ing
3section modulus S � 7.56 inx
d � 5.5 in.x
d � 1.5 in. (fully braced by sheathing)y
From NDS-S Table 4A, we obtain the tabulated design stress values and the stress adjustment or C factors asfollows:
F � 1350 psic
F � 900 psib
F � 625 psic�
6E � 0.58 � 10 psimin
C (F ) � 1.1F c
C (F ) � 1.3F b
C � 1.0 (normal moisture conditions)M
C � 1.0 (normal temperature conditions)t
C � 1.15 (the condition for repetitiveness is discussed in Chapter 3)r
C � 1.0fu
C � 1.0i
W O O D M E M B E R S U N D E R A X I A L A N D B E N D I N G L O A D S � 175
C � 1.0L
C � to be determined for each design checkD
The beam stability factor CL will be 1.0 for bending of the wall stud about the x–x (strong) axis because thewall stud is braced against lateral torsional buckling by the plywood sheathing. The load duration factor CD willbe determined for each design check, and for each design check the controlling load duration factor value willcorrespond to the CD value of the shortest-duration load in the load combination for that design case. Thus, theCD value for the various design cases may vary.
Design Check 1: Compression on Net AreaThis condition occurs at the ends (i.e., supports) of the member. Note that for this design check, which is apure axial load case, the load combination with the highest normalized axial load P/CD will be most critical.This controlling load combination from Table 5.2 is D � 0.75(L � S), for which P � 3000 lb and CD �1.15. Since the ends of the wall studs are usually connected to the sill plates and top plates with nails ratherthan bolts, the net area will be equal to the gross area since there are no bolt holes to consider.
2Net area A � A � � A � A � 8.25 inn g holes g
P 3000 lbCompressive axial stress applied f � � � 364 psic 2A 8.25 inn
At support locations, there can be no buckling; therefore, CP � 1.0.The allowable compression stress parallel to the grain is
F� � F C C C C C Cc c D M t F i P
� (1350)(1.15)(1.0)(1.0)(1.1)(1.0)(1.0)
� 1708 psi � f � 364 psi OKc
It should be noted that design check 1 could have been eliminated by inspection when compared to designcheck 2, since the column stability factor CP for design check 1 is 1.0, which will be greater than that fordesign check 2, and thus the allowable stresses in design check 2 will be smaller.
Design Check 2: Compression on Gross AreaThis is also a pure axial load case that occurs at the midheight of the wall stud, and the most critical loadcombination will be the load combination with the highest normalized axial load P/CD. This controlling loadcombination from Table 5.2 is D � 0.75(L � S), for which P � 3000 lb and CD � 1.15. The axialcompression stress
P 3000 lbf � � � 364 psic 2A 8.25 ing
The compressive stress perpendicular to the grain in the sill plate is
P 3000 lbf � � � 364 psic� 2A 8.25 ing
Unbraced length. For x–x axis buckling, the unbraced length lux is 10 ft. For y–y axis buckling, the unbracedlength luy is 0 ft (plywood sheathing braces y–y axis buckling).
Effective length. Wall studs are usually supported at both ends, therefore, it is usual practice to assume aneffective length factor Ke of 1.0.
For x–x axis buckling, effective length lex � Kelux � (1.0)(10 ft) � 10 ft.For y–y axis buckling, effective length ley � Keluy � (1.0)(0) � 0 ft.
Slenderness ratio. For x–x axis buckling, the effective length is
l (10 ft)(12)ex � � 21.8 � 50 (larger slenderness ratio controls)d 5.5 in.x

176 � S T R U C T U R A L W O O D D E S I G N
For y–y axis buckling, the effective length is
l 0ey � � 0 � 50d 1.5 in.y
Therefore,
(l /d) � 21.8.e max
This slenderness ratio will be used in the calculation of the column stability factor CP and the allowablecompression stress parallel to the grain F�:c
Buckling modulus of elasticity E� � E C C Cmin min M t i
6 6� (0.58 � 10 )(1.0)(1.0)(1.0) � 0.58 � 10 psi
c � 0.8 (visually graded lumber)
The Euler critical buckling stress about the ‘‘weaker’’ axis (i.e., the axis with the higher slenderness ratio),which for this problem happens to be the x–x axis, is
60.822E� (0.822)(0.58 � 10 )minF � � � 1003 psicE 2 2(l /d ) (21.8)e max
F* � F C C C C Cc c D M t F i
� (1350)(1.15)(1.0)(1.0)(1.1)(1.0) � 1708 psi
F 1003 psicE � � 0.587F* 1708 psic
From Equation (5.21) the column stability factor is calculated as
21 � 0.587 1 � 0.587 0.587C � � � � 0.492� P �(2)(0.8) (2)(0.8) 0.8
The allowable compression stress parallel to the grain is
F� � F*C � (1708)(0.492) � 840 psi � f � 364 psi OKc c P c
The allowable compression stress perpendicular to the grain in the sill plate is
F � F C C C � (625)(1.0)(1.0)(1.0)c� c� M t i
� 625 psi � f � 364 psi OKc�
Design Check 3: Bending OnlyThis condition occurs at the midheight of the wall stud, and the bending moment is caused by the lateral windload. Only the two controlling combined load cases in Table 5.2 need be considered for this design check. Theload combination with the maximum normalized moment M/CD is 0.6D � W, for which the maximummoment M � 4500 in.-lb, P � 864 lb, and CD � 1.6.
The compression stress applied in the wall stud due to bending
M 4500 in.-lbf � � � 595 psibc 3S 7.56 inx
The allowable bending stress
F� � F C C C C C C C Cb b D M t L F i r fu
� (900)(1.6)(1.0)(1.0)(1.0)(1.3)(1.0)(1.15)(1.0)
� 2153 psi � f � 595 psi OKb

W O O D M E M B E R S U N D E R A X I A L A N D B E N D I N G L O A D S � 177
Design Check 4: Bending plus Axial Compression ForceThis condition occurs at the midheight of the wall stud, and only the two controlling combined load cases inTable 5.2 need be considered for this design check, and these are
D � 0.75(L � S � W ) P � 3000 lb M � 3375 in.-lb C � 1.6D
and
0.6D � W P � 864 lb M � 4500 in.-lb C � 1.6D
We investigate these load combinations separately to determine the most critical.Load combination D � 0.75(L � S � W ):
P � 3000 lb M � 3375 in.-lb C � 1.6max max D
The bending stress applied is
M 3375 in.-lbmaxf � � � 446 psi (lateral wind load causes bending about the x–x axis)bx 3S 7.56 inxx
The axial compression stress applied at the midheight is
f � 364 psi (from design check 2)c
The allowable bending stress
F� � F C C C C C C C Cb b D M t L F i r fu
� (900)(1.6)(1.0)(1.0)(1.0)(1.3)(1.0)(1.15)(1.0)
� 2153 psi � f � 446 psi OKb
Note that the beam stability factor CL is 1.0 because the compression edge of the stud is braced laterally by thewall sheathing for bending due to loads acting perpendicular to the face of the wall. We now proceed tocalculate the column stability factor CP.
F* � F C C C C Cc c D M t F i
� (1350)(1.6)(1.0)(1.0)(1.1)(1.0) � 2376 psi
The Euler critical buckling stress about the ‘‘weaker’’ axis (i.e., the axis with the higher slenderness ratio),which for this problem happens to be the x–x axis, is
60.822E� (0.822)(0.58 � 10 )minF � � � 1003 psicE(max) 2 2(l /d) (21.8)e max
F 1003 psicE � � 0.422F* 2376 psic
From equation (5.21) the column stability factor is calculated as
21 � 0.422 1 � 0.422 0.422C � � � � 0.377� P �(2)(0.8) (2)(0.8) 0.8
The allowable compression stress parallel to the grain is
F� � F*C � (2376)(0.377) � 896 psi � f � 364 psi OKc c P c
The interaction equation for combined concentric axial load plus uniaxial bending is obtained from equation(5.30) as
2f f /F�c bx bx� � 1.0� �F� 1 � f /Fc c cEx

178 � S T R U C T U R A L W O O D D E S I G N
The Euler critical buckling stress about the x–x axis (i.e., the axis of bending of the wall stud due to lateralwind loads) is
60.822E� (0.822)(0.58 � 10 )minF � � � 1003 psicEx 2 2(l /d ) (21.8)ex x
Substituting the parameters above into the interaction equation yields2364 446/2153
� � 0.49 � 1.0 OK� �896 1 � 364/1003
Load combination 0.6D � W:
P � 864 lb M � 4500 in.-lb C � 1.6max max D
The bending stress applied is
M 4500 in.-lbmaxf � � � 595 psi (lateral wind load causes bending about the x–x axis)bx 3S 7.56 inxx
The axial compression stress
P 864 lbf � � � 105 psic 2A 8.25 ing
Except for the applied bending and axial stresses, all the other parameters used in the interaction equation forthe preceding combined load case would also apply to this load case. Therefore, the interaction equation for thisload case will be
2105 595/2153� � 0.32 � 1.0 OK� �896 1 � 105/1003
It should be noted that because the interaction values obtained are much less than 1.0, a more efficient designcan be obtained by using a lower stress grade for the 2 � 6 wall stud, such as No. 3 grade.
FIGURE 5.19 Typicalroof truss.
Eccentrically Loaded Columns
Wood columns with axial compression loads applied eccentrically are not common in regularwood-framed building structures and therefore are not covered in this book. The interactionequation for this special loading condition, which is more cumbersome than the interactionequation for combined concentric axial load plus bending load presented earlier, can be foundin Section 15.4 of the NDS code.
5.6 PRACTICAL CONSIDERATIONS FOR ROOF TRUSS DESIGN
The application of the four load cases discussed in this chapter to typical roof trusses such asthose shown in Figure 5.19 is discussed next. The slope or pitch of a truss is usually noted as aratio of the vertical to the horizontal dimension, with the horizontal number equal to 12 (e.g.,
W O O D M E M B E R S U N D E R A X I A L A N D B E N D I N G L O A D S � 179
4�12 or 7�12). The slope or pitch of a roof truss is usually determined by the owner or architect,not by the engineer.
The spacing of the roof truss is usually selected by the engineer and is typically 16 or 24in. o.c. The truss spacing should be a multiple of the stud spacing in the bearing walls to ensurethat the truss bears directly on a wall stud, otherwise the top plates have to be designed to resistthe truss reactions resulting in bending of the plates about their weak axis. The analysis of a rooftruss is usually carried out with structural analysis software, and in many cases the design of thetruss members is also performed with computer software. When performing the design of thetypical roof truss in Figure 5.19 for gravity loads, the following four load cases have to beconsidered, and the compression members of the truss must be sized such that the maximumslenderness ratio le/d does not exceed 50.
1. Pure tension (web members BF and CF)2. Combined tension plus bending (bottom chord members AB, BC, and CD)3. Pure compression (web members BG and CE )4. Combined compression plus bending (top chord members AG, GF, FE, and ED)
In practice, roof trusses are preengineered and built by truss manufacturers such as TrusJoist.However, the designer or engineer of record has to specify the truss spacing and profile, thesupport locations, and the gravity and wind loads applied, including those causing uplift of thetruss. The engineer will, however, have to check and approve the shop drawings submitted bythe truss manufacturer.
Wind Uplift on Roof Trusses If there is net wind uplift on a roof truss, stress reversals mayoccur in the bottom chord members, (e.g. members AB, BC, and CD). These members whichare normally in tension will be subjected to compression forces because of the net wind uplift.In addition, the roof truss supports will have to be tied down to the wall studs using hurricaneclips.
Types of Roof Trusses
There are two main categories of roof trusses: lightweight and heavy timber roof trusses. Light-weight roof trusses are made from dimension-sawn lumber, and heavy timber roof trusses aremade from larger sawn-lumber sizes (e.g., 4 � 6 to 8 � 12). Lightweight roof trusses can beused to span up to 60 to 70 ft and are typically spaced at 16 or 24 in. o.c. Heavy timber trusseswere used in the past to span longer distances, up to 120 ft, and are typically spaced much fartherapart than are lightweight roof trusses. A maximum span-to-depth ratio of 8 to 10 is typicallyspecified for flat roof heavy timber trusses and 6 to 8 for bowstring trusses. Heavy timber trussesare no longer used frequently in wood buildings.
Several common profiles of lightweight roof trusses were shown in Figure 1.7. The pitchor rise per foot of roof trusses varies from 3 in 12 to 12 in 12, depending on the span of theroof truss. Roof pitches shallower than 4 in 12 are adequate for shedding rainwater, but pitchesgreater than 4 in 12 are required for proper shedding of snow and ice loads in cold climates.For a given span, the higher the roof pitch, the smaller the axial forces in the compression andtension chords of the truss. The members of lightweight roof trusses are usually connected withtoothed light-gage plate connectors or nailed plate connectors designed in accordance with theTruss Plate Institute’s National Design Standard for Metal Plated Connected Wood Trusses ANSI/TPI 1-2002 [17]. This specification is used by preengineered truss manufacturers for thecomputer-aided design of factory-built roof trusses.
Bracing and Bridging of Roof Trusses
Lateral bracing and bridging are required for lightweight roof trusses during and after erectionto ensure lateral stability. During erection of roof trusses, lateral bracing or bridging perpendicularto the truss span are required to tie the top and bottom chords and web members of adjacenttrusses together for lateral stability and to prevent the trusses from tipping or rolling over ontheir sides before attachment of the roof diaphragms. Lateral braces and bridging should be

180 � S T R U C T U R A L W O O D D E S I G N
provided per BCSI 1-06 [18]. Typically, the top chord members are temporarily braced tomaintain stability until the roof sheathing is installed while the web and bottom chord membersare permanently braced. The temporary top chord bracing consists of horizontal 2� continuouswood members placed in the same plane as the top chord and running perpendicular to the trussspan. They are usually spaced 10 ft on centers for truss spans up to 30 ft; 8 ft on centers fortruss spans between 30 and 45 ft; and 6 ft on centers for truss spans between 45 and 60 ft.Permanent braces for the truss bottom chord members consists of continuous horizontal 2�wood members placed perpendicular to the truss span and in the plane of the bottom chord,and spaced at 8 to 10 ft on centers, and preferably located at a truss web member. Thesecontinuous members are located on top of the bottom chord to avoid interference and shouldbe lapped over at least two trusses. In addition, 2� diagonal braces should be provided in theplane of the bottom chord between all the horizontal braces and these should occur every 10truss spaces or at 20 ft on centers maximum. The permanent bracing for the truss web membersinclude diagonal braces in the vertical plane (perpendicular to the truss span) that is connectedto the webs of several trusses, and the location of these diagonal braces should coincide with thelocation of the bottom chord horizontal braces. The diagonal braces should occur at every 10truss spaces or at 20 ft on centers maximum. Several collapses of roof trusses during erectionhave been reported, so it is imperative that roof trusses be braced adequately to prevent collapse.
FIGURE 5.20 Typical truss bottom chordbridging.
In some cases, roof trusses may be erected in modules of three or moreadjacent trusses laterally braced together on the ground for stability withor without the roof sheathing attached. Without adequate lateral bracingor bridging, it is highly possible for the compression chord members tobuckle out of the plane of the truss even under the self-weight of the trussand buckling failures are usually catastrophic and sudden [18]. The forcein the lateral bracing for compression is usually assumed to be at least 2%of the compression force in the braced member.
During construction, temporary braces should be provided to bracethe first truss to the ground. In addition, diagonal bridging in the verticalplane has to be provided to tie the compression chord to the tension chordof adjacent trusses. The temporary continuous horizontal bridging is locatedat the bottom of the top chord to avoid interference with installation ofthe roof sheathing. The slenderness ratio of the 2� bracing or bridgingelements must not be greater than 50. A minimum of two 16d nails areused to connect the bridging to the truss member. Figure 5.20 shows typ-ical bridging for a roof truss bottom chord. For more information, thereader should refer to the Truss Plate Institute (TPI) publication, Guide toGood Practice for Handling, Installing and Bracing Metal Connected Wood Trusses(BCSI 1-03) [18].
REFERENCES
1. ANSI/AF&PA. (2005), National Design Specification for Wood Construction, American Forest &Paper Association, Washington, DC.
2. Faherty, Keith F., and Williamson, Thomas G. (1995), Wood Engineering and Construction,McGraw-Hill, New York.
3. AITC (American Institute for Timber Construction) (1994), Timber Construction Manual, 4th ed.,Wiley, New York.
4. Willenbrock, Jack H., Manbeck, Harvey B., and Suchar, Michael G. (1998), Residential BuildingDesign and Construction, Prentice Hall, Upper Saddle River, NJ.
5. French, Samuel E. (1996), Determinate Structures: Statics, Strength, Analysis and Design, DelmarPublishers, Albany, NY.
6. Ambrose, James (1994), Simplified Design of Wood Structures, 5th ed., Wiley, NY.7. Halperin, Don A., and Bible, G. Thomas (1994), Principles of Timber Design for Architects and
Builders, Wiley, NY.

W O O D M E M B E R S U N D E R A X I A L A N D B E N D I N G L O A D S � 181
FIGURE 5.21 Rooftruss elevation.
8. Stalnaker, Judith J., and Harris, Earnest C. (1997), Structural Design in Wood, Chapman & Hall,London.
9. Breyer, Donald et al. (2003), Design of Wood Structures—ASD, 5th ed., McGraw-Hill, New York.10. NAHB (2000), Residential Structural Design Guide—2000, National Association of Home Builders
Research Center, Upper Marlboro, MD.11. Cohen, Albert H. (2002), Introduction to Structural Design: A Beginner’s Guide to Gravity Loads and
Residential Wood Structural Design, AHC, Edmonds, WA.12. Newman, Morton (1995), Design and Construction of Wood-Framed Buildings, McGraw-Hill, New
York.13. Kang, Kaffee (1998), Graphic Guide to Frame Construction—Student Edition, Prentice Hall, Upper
Saddle River, NJ.14. Kim, Robert H., and Kim, Jai B. (1997), Timber Design for the Civil and Structural Professional
Engineering Exams, Professional Publications, Belmont, CA.15. Hoyle, Robert J., Jr. (1978), Wood Technology in the Design of Structures, 4th ed., Mountain Press,
Missoula, MT.16. Kermany, Abdy (1999), Structural Timber Design, Blackwell Science, London.17. ANSI/TPI 1-2002, National Design Standard for Metal Plated Connected Wood Truss Construction,
Truss Plate Institute, Alexandria, VA.18. BCSI 1-06, Guide to Good Practice for Handling, Installing, and Bracing Metal Connected Wood Trusses,
Truss Plate Institute, Alexandria, VA.
PROBLEMS
5.1 A 4 � 8 wood member is subjected to an axial tension load of 8000 lb caused by dead loadplus the snow load plus the wind load. Determine the applied tension stress ft and theallowable tension stress and check the adequacy of this member. The lumber is DouglasF�,t
fir-larch No. 1, normal temperature conditions apply, and the moisture content is greaterthan 19%. Assume that the end connections are made with a single row of -in.-diameter3–4bolts.
5.2 A 2 � 10 Hem-fir No. 3 wood member is subjected to an axial tension load of 6000 lbcaused by the dead load plus the snow load. Determine the applied tension stress ft and theallowable tension stress and check the adequacy of this member. Normal temperatureF�,t
and dry service conditions apply, and the end connections are made with a single row of-in.-diameter bolts.3–4
5.3 A � 9 (six laminations) 5DF glulam axial combination member is subjected to an axial1–22
tension load of 20,000 lb caused by the dead load plus the snow load. Determine the tensionstress applied ft and the allowable tension stress and check the adequacy of this member.F�,t
Normal temperature and dry service conditions apply, and the end connections are madewith a single row of -in.-diameter bolts.7–8
5.4 For the roof truss elevation shown in Figure 5.21, determine if a 2 � 10 spruce-pine-firNo. 1 member is adequate for the bottom chord of the typical truss, assuming that the roofdead load is 20 psf, the snow load is 40 psf, and the ceiling dead load is 15 psf of thehorizontal plan area. Assume that normal temperature and dry service conditions apply andthat the members are connected with a single row of -in.-diameter bolts. The trusses span3–436 ft and are spaced at 2 ft o.c.

182 � S T R U C T U R A L W O O D D E S I G N
5.5 For the roof truss in Problem 5.4, determine if a 2 � 10 spruce-pine-fir No. 1 member isadequate for the top chord.
5.6 Determine if 10-ft-high 2 � 6 hem-fir No. 1 interior wall studs spaced at 16 in. o.c. isadequate to support a dead load of 300 lb/ft and a snow load of 600 lb/ft. Assume thatthe wall is sheathed on both sides and that normal temperature and dry service conditionsapply. Neglect interior wind loads.
5.7 Determine the axial load capacity of a nailed built-up column of four 2 � 6’s with a 12-ftunbraced height. Assume hem-fir No. 2, normal temperature and dry service conditions,and a load duration factor CD of 1.0.
5.8 Determine if 2 � 6 Douglas fir-larch Select Structural studs spaced at 2 ft o.c. are adequateat the ground-floor level to support the following loads acting on the exterior stud wall ofa three-story building.Roof: dead load � 300 lb/ft; snow load � 800 lb/ft; roof live load � 400 lb/ft.Third floor: dead load � 400 lb/ft; live load � 500 lb/ft.Second floor: dead load � 400 lb/ft; live load � 500 lb/ft.
Lateral wind load acting perpendicular to the face of the wall � 15 psf. The floor-to-floorheight is 10 ft, the wall studs are spaced at 2 ft o.c., and assume that the studs are sheathedon both sides.

183
c h a p t e r s i x
ROOF AND FLOOR SHEATHING
UNDER VERTICAL AND LATERAL
LOADS (HORIZONTAL DIAPHRAMS)
6.1 INTRODUCTION
There are numerous uses for plywood in wood structures as well as in other structure types. Ina wood structure, plywood is used primarily as roof and floor sheathing and wall sheathing. Thefloor and roof sheathing supports gravity loads and also acts as a horizontal diaphragm to supportlateral wind and seismic loads. Horizontal diaphragms behave like deep horizontal beams span-ning between the vertical lateral force resisting systems, (i.e., shear walls). The wall sheathingsupports transverse wind loads and acts as a vertical diaphragm to support lateral wind and seismicloads. Plywood is also used in composite structural components, such as preengineered I-joistsor as sheathing in a preengineered insulated roof panel. Plywood is manufactured by peeling alog of wood into thin plies or veneers that are approximately to in. thick. Each ply is1 5–– ––16 16
bonded together with adhesive, heat, and pressure, and is typically oriented 90� to adjacent plies.The thickness of the final product typically varies between and 1 in.1 1– –4 8
The use of oriented strand board (OSB) has also gained wide acceptance. OSB is composedof thin strands of wood that are pressed and bonded into mats oriented 90� to adjacent mats.The strength characteristics of OSB are similar to those of plywood and the two are often usedinterchangeably.
The standard size of plywood or OSB is in 4 � 8 ft sheets. Most plywood conforms toProduct Standard PS 1-95, Construction and Industrial Plywood, published by the American Ply-wood Association (APA) [3]. OSB typically conforms to Product Standard PS 2-92, PerformanceStandard for Wood-Based Structural-Use Panels, also published by the APA [5]. PS-1 and PS-2 arevoluntary product standards that contain information pertaining to the use and design propertiesof plywood and OSB panels.
Plywood Grain Orientation
The inner plies of plywood are typically oriented such that the grain of each adjacent ply is atan angle 90� with adjacent plies. The grain in the outer plies is oriented parallel to the 8-ft edge,which is the strongest configuration when the sheet of plywood is oriented perpendicular to thesupporting structure (see Figure 6.1). In three-ply construction, there is one inner band oriented90� with the outer plies or face grain. In four-ply construction, the two inner plies are orientedin the same direction. In five-ply construction the bands typically alternate in grain orientation(see Figure 6.2).
Plywood Species and Grades
Plywood can be manufactured from a variety of wood species. PS-1 defines the various speciesand classifies them into five groups, with group 1 representing the strongest and group 5 rep-
Structural Wood Design: A Practice-Oriented Approach Using the ASD Method. Abi Aghayere and Jason VigilCopyright © 2007 John Wiley & Sons, Inc.

184 � S T R U C T U R A L W O O D D E S I G N
FIGURE 6.1 Plywood orientation on framing members. FIGURE 6.2 Plywood grain orientation in cross section.
TABLE 6.1 Plywood Veneer Grades
Grade Description
N Intended for natural finish; free from knots and other defects; synthetic fillers permittedfor small defects
A Suitable for painting; free from knots and other defects; synthetic fillers permitted forsmall defects
B Slightly rough grain permitted; minor sanding and patching for up to 5% of panel area;small open defects permitted
C-plugged Improved C grade; knotholes limited to � in.1 1– –4 2
C Knotholes less than 1 in. in diameter permitted; knotholes of 1.5 in. permitted inlimited cases
D Knotholes less than 2 in. in diameter permitted; knotholes of 2.5 in. permitted inlimited cases
resenting the weakest. The term Structural I refers to plywood made from a group 1 species andthese panels are quite frequently specified by designers because of the certainty of the quality ofwood species from which the component plies of the plywood are derived. The grade of theplywood is a function of the quality of the veneer. In PS-1 there are several veneer grades,which are summarized in Table 6.1 in order of decreasing quality. Grades C and D are the mostcommonly used for structural applications. Grade C is the minimum grade required for exterioruse, and grade D is not permitted for exterior use. A plywood panel could have different veneergrades on each face. For example, the most common structural types of plywood are C–C (Cgrade on both outer plies) and C–D (C grade on the face, D grade on the back).
There are four main exposure categories for plywood: Exterior, Exposure 1, Exposure 2(Intermediate Glue), and Interior. This classification is based on the ability of the bond in theglue to resist moisture. The plies of Exterior plywood are glued with fully waterproof glue andare C grade or better. Exterior plywood should be used when the moisture content in serviceexceeds 18%, or when the panel is exposed permanently to the weather. The plies of Exposure1 plywood are glued with fully waterproof glue, but the veneer may be D grade. Exposure 1plywood is recommended for use when the moisture content in service is relatively high orwhen the panels experience prolonged exposure to the weather during construction. The pliesof Exposure 2 or Intermediate Glue (IMG) plywood are glued with an adhesive that has inter-mediate resistance to moisture. Exposure 2 plywood is recommended for protected applicationswhere the panel is not exposed continuously to high humidity. Interior plywood is recommendedfor permanently protected interior applications. The glue used for Interior plywood has a mod-erate resistance to moisture and can sustain only short periods of high humidity in service.
Section 2304.7.2 of the IBC [12] requires that roof sheathing be constructed with exteriorglue. For wall panels, exterior glue is to be used when the panel is exposed to the weather (seeIBC Section 2304.6.1). When the wall panels are on an exterior wall but not exposed, the gluecan be Exposure 1. Interior structural panels use Exposure 2 glue. Table 6.2 shows examples ofvarious designations that could be used to identify plywood. Each sheet of plywood is typicallystamped for identification. Sample grade stamps are shown in Figure 6.3.

R O O F A N D F L O O R S H E A T H I N G � 185
TABLE 6.2 Plywood Sheathing Grades
C–C EXT Exterior plywood with C-gradeveneer on the face, back, andcross-band plies; uses Exterior glue
Used for exterior exposedapplications (exposedpermanently to the weather)
C–C EXT STRUCT I Same as above but uses group 1wood species
Same as above
C–D INT Interior plywood with C-gradeveneer on the face plies; D-gradeveneer on the back and cross-band plies; uses Interior glue
Interior applications only
C–DX Same as C–D INT but uses Exteriorglue
Used for interior applicationsand exterior protectedapplications (e.g., roof ofcovered building)
C–D INT STRUCT I Same as C–D INT but uses onlygroup 1 wood species
Interior applications only
(b)(a) (d)(c)FIGURE 6.3 Plywoodgrade stamps.(Courtesy of APA–The EngineeredWood Association,Tacoma, WA.)
Span Rating
The span rating for floor and roof sheathing appears as two numbers separated by a sloped line(see Figure 6.3b and d ). The left-hand number or numerator indicates the maximum recom-mended spacing of supports in inches when the panel is used for roof sheathing spanning overthree or more supports with the grains perpendicular to the supports. The right-hand numberrepresents the maximum recommended spacing of supports in inches when the panel is used asfloor sheathing (subfloor).
The span rating for APA-rated STURD-I-FLOOR and APA-rated siding appears as a singlenumber (see Figure 6.3a and c). APA-rated STURD-I-FLOOR is intended for single-floorapplications (such as carpet and pad) and are typically manufactured with span ratings of 16, 20,24, 32, and 48 in. The span ratings for APA-rated STURD-I-FLOOR are valid when the panelspans over three or more supports with the grains perpendicular to the supports. APA-ratedsiding is typically manufactured with span ratings of 16 and 24 in. The span rating for APA-rated siding is valid when the panel is oriented parallel or perpendicular to the supports, providedthat blocking is used on the unsupported edges.
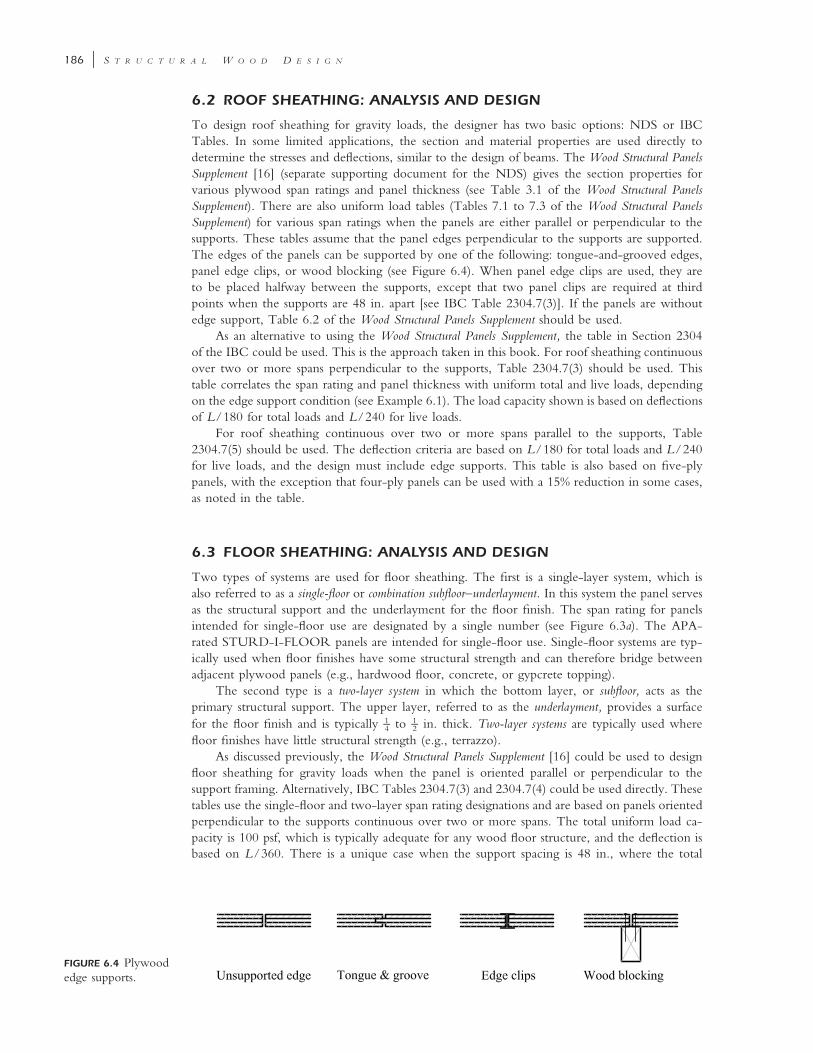
186 � S T R U C T U R A L W O O D D E S I G N
FIGURE 6.4 Plywoodedge supports.
6.2 ROOF SHEATHING: ANALYSIS AND DESIGN
To design roof sheathing for gravity loads, the designer has two basic options: NDS or IBCTables. In some limited applications, the section and material properties are used directly todetermine the stresses and deflections, similar to the design of beams. The Wood Structural PanelsSupplement [16] (separate supporting document for the NDS) gives the section properties forvarious plywood span ratings and panel thickness (see Table 3.1 of the Wood Structural PanelsSupplement). There are also uniform load tables (Tables 7.1 to 7.3 of the Wood Structural PanelsSupplement) for various span ratings when the panels are either parallel or perpendicular to thesupports. These tables assume that the panel edges perpendicular to the supports are supported.The edges of the panels can be supported by one of the following: tongue-and-grooved edges,panel edge clips, or wood blocking (see Figure 6.4). When panel edge clips are used, they areto be placed halfway between the supports, except that two panel clips are required at thirdpoints when the supports are 48 in. apart [see IBC Table 2304.7(3)]. If the panels are withoutedge support, Table 6.2 of the Wood Structural Panels Supplement should be used.
As an alternative to using the Wood Structural Panels Supplement, the table in Section 2304of the IBC could be used. This is the approach taken in this book. For roof sheathing continuousover two or more spans perpendicular to the supports, Table 2304.7(3) should be used. Thistable correlates the span rating and panel thickness with uniform total and live loads, dependingon the edge support condition (see Example 6.1). The load capacity shown is based on deflectionsof L/180 for total loads and L/240 for live loads.
For roof sheathing continuous over two or more spans parallel to the supports, Table2304.7(5) should be used. The deflection criteria are based on L/180 for total loads and L/240for live loads, and the design must include edge supports. This table is also based on five-plypanels, with the exception that four-ply panels can be used with a 15% reduction in some cases,as noted in the table.
6.3 FLOOR SHEATHING: ANALYSIS AND DESIGN
Two types of systems are used for floor sheathing. The first is a single-layer system, which isalso referred to as a single-floor or combination subfloor–underlayment. In this system the panel servesas the structural support and the underlayment for the floor finish. The span rating for panelsintended for single-floor use are designated by a single number (see Figure 6.3a). The APA-rated STURD-I-FLOOR panels are intended for single-floor use. Single-floor systems are typ-ically used when floor finishes have some structural strength and can therefore bridge betweenadjacent plywood panels (e.g., hardwood floor, concrete, or gypcrete topping).
The second type is a two-layer system in which the bottom layer, or subfloor, acts as theprimary structural support. The upper layer, referred to as the underlayment, provides a surfacefor the floor finish and is typically to in. thick. Two-layer systems are typically used where1 1– –4 2
floor finishes have little structural strength (e.g., terrazzo).As discussed previously, the Wood Structural Panels Supplement [16] could be used to design
floor sheathing for gravity loads when the panel is oriented parallel or perpendicular to thesupport framing. Alternatively, IBC Tables 2304.7(3) and 2304.7(4) could be used directly. Thesetables use the single-floor and two-layer span rating designations and are based on panels orientedperpendicular to the supports continuous over two or more spans. The total uniform load ca-pacity is 100 psf, which is typically adequate for any wood floor structure, and the deflection isbased on L/360. There is a unique case when the support spacing is 48 in., where the total

R O O F A N D F L O O R S H E A T H I N G � 187
EXAMPLE 6.1
Roof and Floor Sheathing Under Gravity Loads
For the framing plan shown in Figure 6.5 design (a) the roof and (b) the floor sheathing for gravity loads. Thevertical loads are as follows:
roof dead load � 20 psf (includes mechanical/electrical and framing)
roof snow load � 40 psf (on a horizontal plane)
floor dead load � 20 psf (includes mechanical/electrical and framing)
floor live load � 40 psf
FIGURE 6.5 Roof and floor framing plans.
Solution:(a) Roof sheathing. The total dead load on the sheathing would exclude the weight of the mechanical and
electrical fixtures and the framing. For this problem, that weight will be assumed to be 10 psf. Therefore, thedead load on the plywood sheathing is
DL � 20 psf � 10 psf � 10 psfsheathing
Snow load � 40 psf
Total load � 50 psf
The span of the plywood sheathing is 24 in. (spacing of framing).Enter IBC 2000 Table 2304.7(3) under the ‘‘Roof ’’ section and look for plywood with a maximum span
greater than or equal to the span required (i.e., 24 in.). From this table, the following is selected:
Span rating � 24/16
-in.-thick C–DX plywood (recall that roof panels have exterior glue)7––16
Edges without support
Allowable total load � 50 psf � 50 psf applied OK
Allowable live load � 40 psf � 40 psf applied OK
Use -in.-thick C–DX plywood with a span rating of 24/16 and unsupported edges. Note that a -in.-7 1–– –16 2
thick panel could also have been selected, but it is more economical to select the smaller panel for the same
uniform load capacity is reduced to 65 psf. When using these tables, the panels are required tohave edge support (see Figure 6.4) unless one of the following is provided: -in.-thick under-1–4layment with the panel edges staggered over the subfloor, 1 in. of lightweight concrete topping1–2over the subfloor, or if the floor finish is -in. wood strips.3–4
188 � S T R U C T U R A L W O O D D E S I G N
span rating. Since the span rating is the same with or without edge support, it is more economical to selecta system without edge supports. Note also that the selection of a 24/0-rated panel would not be adequatesince the total and live load capacities are 40 and 30 psf, respectively, which is less than the loads applied.
(b) Floor sheathing. The floor joists are spaced at 24 in. o.c. Similar to the roof sheathing solution, thetotal dead load on the sheathing would exclude the weight of the mechanical and electrical fixtures and theframing. Assuming that weight to be 10 psf, the dead load on the plywood sheathing is
DL � 20 psf � 10 psf � 10 psfsheathing
Live load � 40 psf
Total load � 50 psf
Two types of floor systems are available.
1. Two-layer floor system [Use IBC Table 2304.7(3)]. To design a two-layer system, enter the last column ofIBC 2000 Table 2304.7(3) and look for a row with a plywood span greater than or equal to 24 in. Fromthe table, the following is selected:
Span rating � 48/24.
C–D plywood in. thick.23––32
Allowable total load (see footnote in Table 2304.7(3)) � 100 psf � 50 psf OK
According to footnote (d) in IBC Table 2304.7(3), edge support is required unless one of the following isprovided: -in.-thick underlayment with the panel edges staggered over the subfloor, 1 in. of lightweight1 1– –4 2
concrete topping over the subfloor, or a floor finish of -in. wood strips.3–42. Single-layer floor system [either IBC Table 2304.7(3) or 2304.7(4)]. Using IBC Table 2304.7(3) to find a
panel with a maximum span greater than or equal to the span required (i.e., 24 in.), the following is se-lected:
Span rating � 24.C-D plywood 23 in./32 thick.
Allowable total load (see footnote in Table 2304.7(3)) � 100 psf � 50 psf OK
Alternatively, the following is selected from IBC Table 2304.7(4):
Assuming group 1 species plywood ⇒ -in.-thick C–D plywood3–4Assuming group 2 or 3 species plywood ⇒ -in.-thick C–D plywood7–8Assuming group 4 species plywood ⇒ 1-in.-thick C–D plywood
Allowable total load (see footnote in Table 2304.7(4)) � 100 psf � 50 psf
Similar to the two-layer system, edge supports are required unless one of the following is provided: -in.-thick1–4underlayment with the panel edges staggered over the subfloor, 1 in. of lightweight concrete topping over the1–2subfloor, or a floor finish of -in. wood strips.3–4
Extended Use of the IBC Tables for Gravity Loads on Sheathing
To extend the use of IBC Tables 2304.7(3) and 2304.7(4) beyond the loads and span combi-nations given in the table, the following allowable total and live load equations could be usedassuming moment equivalence:
2LmaxW � W� �aTL TLLa
2LmaxW � W� �aLL LLLa

R O O F A N D F L O O R S H E A T H I N G � 189
EXAMPLE 6.2
Extended Use of the IBC Tables for Gravity Loads on Sheathing
(a) Given a -in.-thick C–DX plywood (edges unsupported) with a span rating 24/16, determine the7––16
allowable total load and allowable live load if it is used as a roof sheathing with a span of 20 in.(b) Repeat part (a) assuming that the plywood is used as floor sheathing (two-layer system) with a span of 12
in.
Solution:(a) Roof sheathing. From IBC Table 2304.7(3), the following is obtained for 24/16 roof sheathing (edges
unsupported):
L � 24 in. (maximum span of the plywood when used as a roof sheathing)max
W � 50 psfTL
W � 40 psfLL
The actual span of the plywood sheathing, La � 20 in. The adjusted allowable total and live loads are calculatedas follows:
2 2L 24maxW � W � (50) � 72 psf (adjusted total load capacity)� � � �aTL TLL 20a2 2L 24maxW � W � (40) � 57 psf (adjusted live-load capacity)� � � �aLL LLL 20a
(b) Floor sheathing. From IBC Table 2304.7(3), the following is obtained for 24/16 floor sheathing:
L � 16 in. (maximum span of the plywood when used as a floor sheathing)max
L � 12 in.a
W � 100 psf (see footnote for tabulated total load capacity)TL
The actual span of the plywood sheathing, La � 16 in. The adjusted allowable total load is calculated as follows:2 2L 16maxW � W � (100) � 178 psf (adjusted total load capacity)� � � �aTL TLL 12a
where WaTL � adjusted total load capacity, psfWaLL � adjusted live load capacity, psfWTL � total load capacity corresponding to the span rating, psfWLL � live load capacity corresponding to the span rating, psfLmax � maximum allowable span (span rating), in.
La � actual span (joist spacing), in.
6.4 PANEL ATTACHMENT
The Wood Structural Panels Supplement [16] gives the minimum nailing requirements for roof andfloor sheathing. Note that greater nailing requirements may be required, based on the panelstrength as a diaphragm (see Section 6.5). In addition to nailing, the panels can be glued to thesupports, which reduces squeaking due to the plywood slipping on the supports, and it also helpsin the control of floor vibrations (see Section 4.7). A summary of the nailing requirements isshown in Table 6.3. Nails at the intermediate supports are typically referred to as field nailing.Nails at the edges could be along a main framing member and at the blocking, if blocking isprovided. Fasteners should be spaced at least in. from the panel edges (see IBC Section3–82305.1.2.1).
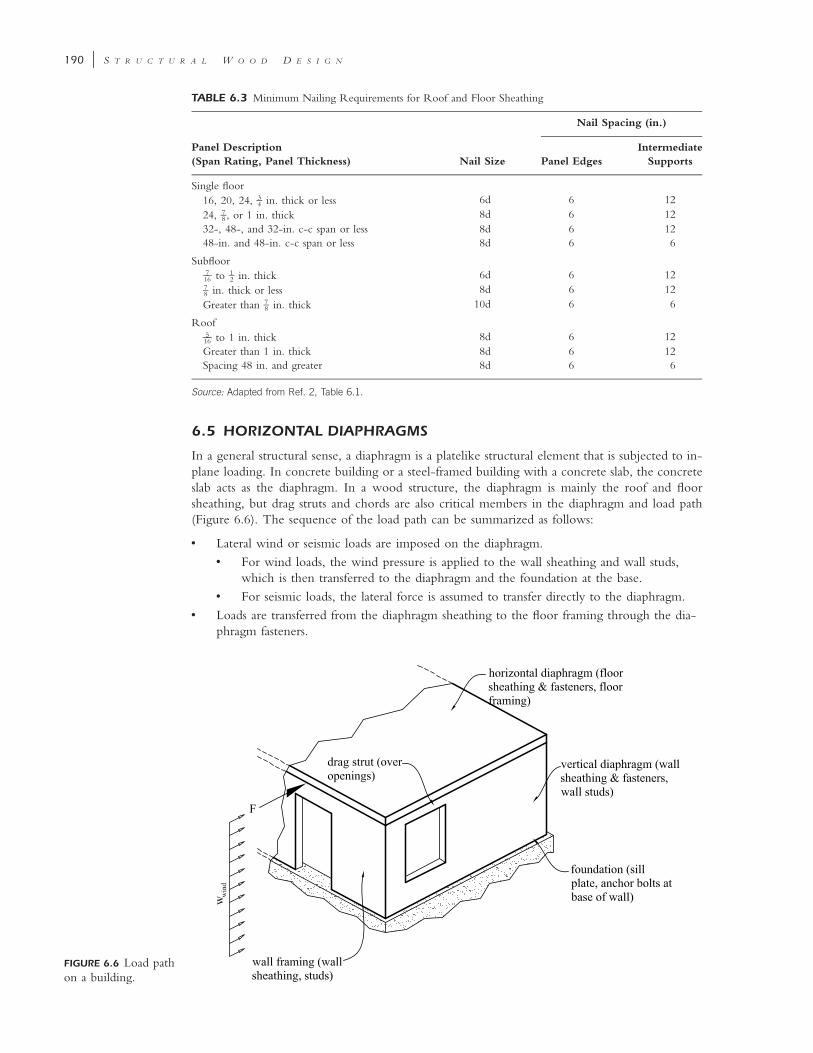
190 � S T R U C T U R A L W O O D D E S I G N
TABLE 6.3 Minimum Nailing Requirements for Roof and Floor Sheathing
Panel Description(Span Rating, Panel Thickness) Nail Size
Nail Spacing (in.)
Panel EdgesIntermediate
Supports
Single floor16, 20, 24, in. thick or less3–4 6d 6 1224, , or 1 in. thick7–8 8d 6 1232-, 48-, and 32-in. c-c span or less 8d 6 1248-in. and 48-in. c-c span or less 8d 6 6
Subfloorto in. thick7 1–– –16 2 6d 6 12
in. thick or less7–8 8d 6 12Greater than in. thick7–8 10d 6 6
Roofto 1 in. thick5––16 8d 6 12
Greater than 1 in. thick 8d 6 12Spacing 48 in. and greater 8d 6 6
Source: Adapted from Ref. 2, Table 6.1.
FIGURE 6.6 Load pathon a building.
6.5 HORIZONTAL DIAPHRAGMS
In a general structural sense, a diaphragm is a platelike structural element that is subjected to in-plane loading. In concrete building or a steel-framed building with a concrete slab, the concreteslab acts as the diaphragm. In a wood structure, the diaphragm is mainly the roof and floorsheathing, but drag struts and chords are also critical members in the diaphragm and load path(Figure 6.6). The sequence of the load path can be summarized as follows:
• Lateral wind or seismic loads are imposed on the diaphragm.• For wind loads, the wind pressure is applied to the wall sheathing and wall studs,
which is then transferred to the diaphragm and the foundation at the base.• For seismic loads, the lateral force is assumed to transfer directly to the diaphragm.
• Loads are transferred from the diaphragm sheathing to the floor framing through the dia-phragm fasteners.

R O O F A N D F L O O R S H E A T H I N G � 191
FIGURE 6-7 Beamaction of adiaphragm.
• Loads are transferred from the framing to the drag struts (where drag struts are not pres-ent, the loads are transferred directly to the shear walls).
• Loads are transferred from the drag struts to the shear walls (vertical diaphragms).• Loads are transferred from wall sheathing to the wall framing through the shearwall fas-
teners.• Loads are transferred from the wall framing to the sill plate.• Loads are transferred from the sill plate to the anchor bolts.• Loads are transferred from the anchor bolts to the foundation.
The design of each of these elements and connections is necessary to maintain a continuousload path to the foundation. Each of these items is covered later in the book.
The diaphragm can be modeled as a beam with simple supports at the shear wall locations.This beam consists of a web, which resists the shear (sheathing), flanges that resist the tensionand compression forces resulting from a moment couple (chords), and supports that transfer theload to the shear walls (drag struts or collectors). Figure 6.7 illustrates the beam action of thediaphragm.
In a typical wood-framed structure, the shear force is resolved into a unit shear across thediaphragm. The unit shear can be defined as
V� �d b
where �d � unit shear in the diaphragm, lb/ftV � shear force (�wL/2 at supports), lbb � width of the diaphragm parallel to the lateral force (distance between the chords),
ftL � length of the diaphragm perpendicular to the lateral force (distance between the
shear walls), ft
The shear force V transferred to the shear walls is distributed uniformly in a similar manner.The unit shear in the shear walls can be defined as
V� �w �Lw
where �w � unit shear in the shear walls along the diaphragm support line, lb/ftV � total shear force along the diaphragm support line, lb
� Lw � summation of the shear wall lengths along diaphragm support line, ft
The top plates in the walls act as the chords and drag struts. The chords are orientedperpendicular to the lateral load and carry the bending moment in the diaphragm. The chordforce can be defined as follows:

192 � S T R U C T U R A L W O O D D E S I G N
MT � C �
b
where T � maximum tension chord force, lbC � maximum compression chord force, lbM � maximum diaphragm moment � wL2/8, ft-lb
The drag struts or collectors are structural elements that are parallel to the lateral load andthey help to drag or collect the diaphragm shears to the shear walls across door and windowopenings and at reentrant corners of buildings, and thus prevent stress concentrations at the endsof the shear walls. The total force in the drag strut can be defined as
F � � Lds d ds
where Fds � total force in the drag strut, lb�d � unit shear in the diaphragm, lb/ftLds � length of the drag strut, ft
It should be noted that the total force Fds can either be entirely a tension or compressionforce, or it can be distributed as a tension force at one end of the drag strut and a compressionforce at the other end. The total force is distributed in this latter manner when the drag strut islocated between two shear walls and is due to the combined ‘‘pushing’’ and ‘‘pulling’’ of eachshear wall. See Example 6.3 for further explanation of the calculation of drag strut forces.
Horizontal Diaphragm Strength
In the course of a building design, the floor and roof sheathing thicknesses are usually sized forgravity loads prior to calculating lateral loads. For most cases this is typically economical sincethe panel thickness is not the most critical factor in the strength of the diaphragm. The limitingfactor is usually the capacity of the nails or staples that fasten the sheathing to the framingmembers. In general, there is a direct relationship between the amount of fasteners and the shearstrength of the diaphragm.
There are two basic types of diaphragms: blocked and unblocked (see Figure 6.12). A blockeddiaphragm is one in which the sheathing is fastened to a wood framing member under all fourpanel edges as well as to the intermediate supports. An unblocked diaphragm is fastened only attwo panel edges and at the intermediate supports. It is usually more economical to design anunblocked diaphragm because of the added field labor required to provide blocking.
With reference to Table 6.3, the minimum nailing requirements are the same for blockedand unblocked diaphragms. However, decreasing the fastener spacing at the panel edges canincrease the diaphragm capacity. IBC Table 2306.3.1 lists the shear capacities for various dia-phragm types. Several diaphragm configurations and loading conditions are also identified in thistable (load cases 1 through 6). The loading direction and sheathing orientation will define whichload case to use (see Figure 6.13).
It should be noted that the diaphragm shear strength values shown in IBC Table 2306.3.1could be increased by 40% for wind design (IBC Section 2306.3.2). The reason for this increaseis due to the historically good performance of wood diaphragms during high-wind events. Seis-mic loads should be converted to service-level design values before entering IBC Table 2306.3.1.
The diaphragm shear strength values shown in the table are based on framing members ofDouglas fir-larch or southern pine. For staples in framing members of other species, multiplythe following specific gravity adjustment factors by the tabulated allowable unit shear for structuralI grade, regardless of the plywood grade specified.
0.82 for staples when G � 0.42SGAF � �0.65 for staples when G � 0.42
For nails in framing members of other species, multiply the following specific gravity ad-justment factor by the tabulated unit shear for the actual grade of plywood specified.
SGAF � 1 � (0.5 � G) � 1.0 for nails

R O O F A N D F L O O R S H E A T H I N G � 193
EXAMPLE 6.3
Horizontal Diaphragm Forces
Based on the floor plan and diaphragm loading due to wind shown in Figure 6.8, calculate (a) the force in thediaphragm chords, (b) the unit shear in the diaphragm, (c) the unit shear in the shear walls, and (d) the dragstrut forces.
FIGURE 6.8 Example floor plan and diaphragm loading.
Solution: The diaphragm can be modeled as a simple span beam, as shown in Figure 6.9.
FIGURE 6.9 Example diaphragm loading.
(a) Force in the diaphragm chords:
2 2wL (150)(80)M � � � 120,000 ft-lb
8 8
M 120,000T � C � � � 4000 lbCG AD b 30
Note: Since the lateral wind load can act in the reverse direction, chords AD and CG would have to bedesigned for both tension and compression loads.
(b) Unit shear in the diaphragm:
wL (150)(80)V � � � 6000 lbmax 2 2

194 � S T R U C T U R A L W O O D D E S I G N
V 6000� � � � 200 lb/ft (maximum unit shear)d b 30
The variation in unit shear can be shown as in Figure 6.10.
FIGURE 6.10 Variation in unit shear across adiaphragm.
(c) Unit shear in the shear walls. Along line ABC:
V 6000� � � � 300 lb/ftw � L 20w
Along line DEFG:
V 6000� � � � 300 lb/ftw � L 10 � 10w
(d) Drag strut forces. The total force in each drag strut is
F � F � � L � (200)(10) � 2000 lbCB EF d ds
To determine the maximum drag strut force, the variation in diaphragm and shear wall unit shears has to beplotted as shown in Figure 6.11. Therefore, the maximum drag strut forces are
F � 2000 lb (tension or compression)CB
F � 1000 lb (tension or compression)EF
The maximum drag strut force can also be determined by using the free body diagrams in Figure 6.11.Equilibrium of forces in the free body diagrams yield the same results as was obtained using the unit sheardiagram. Note that the total force in drag strut CB is 2000 lb and can either be tension or compression.

R O O F A N D F L O O R S H E A T H I N G � 195
FIGURE 6.11 Unit shears, combined unit shears, and drag strut force diagrams.
FIGURE 6.12 Blockedand unblockeddiaphragms.

196 � S T R U C T U R A L W O O D D E S I G N
FIGURE 6.13
Diaphragm loadcases.
FIGURE 6.14 Diaphragm aspect ratios. FIGURE 6.15 Flexible diaphragm versus shear wall deflection.
where SGAF � specific gravity adjustment factorG � specific gravity of wood (NDS Table 11.3.2A)
The code limits the aspect ratio of horizontal diaphragms. When all of the panel edges aresupported and fastened, the maximum ratio of the diaphragm length to the width (L/b), (seeFigure 6.14) is limited to 4. For unblocked diaphragms, the ratio is limited to 3 (IBC Section2305.2.3). The distribution of lateral forces to the shear walls in a building is dependent on therigidity of the horizontal diaphragm, and the diaphragm rigidity can be classified as flexible orrigid based on the ratio of diaphragm lateral deflection to the shear wall lateral deflection. Forthe design of wood-framed buildings, it is common in practice to assume a flexible diaphragm,and this assumption has been confirmed by other authors [11–14]. IBC 2006 permits woodstructural panels to be classified as flexible diaphragms provided they have no more than 11–2inches of non-structural topping. Furthermore, the simplified analysis procedure for seismic loadspresented in Chapter 2 assumes a flexible diaphragm (see IBC Section 1613.6 and ASCE 7Section 12.3). This procedure is permitted for wood-framed structures that are three stories andless in height, which is the category that most wood structures fall into.

R O O F A N D F L O O R S H E A T H I N G � 197
FIGURE 6.16 Rigid diaphragm with eccentric lateral load. FIGURE 6.17 Rigid diaphragm in an open-front structure.
For a flexible diaphragm, the distribution of lateral seismic forces is based on the plantributary widths or areas of each shear wall. For wind loads, the tributary area of the shear wallsassociated with the vertical exterior wall surfaces perpendicular to the wind direction are used.With reference to the flexible diaphragm shown in Figure 6.15, the lateral force is distributedequally to each shear wall, even though one wall is longer than the other. Since the lateral forceto each shear wall is equal, a shorter wall will have a larger lateral deflection. In this case, thediaphragm is assumed to be flexible enough to absorb this unbalanced shear wall deflection.
For a rigid diaphragm, a torsional moment is developed and must be considered in thedesign of shear walls. This moment develops when the centroid of the lateral load is eccentricto the center of rigidity of the shear walls. One approximate method for resisting this torsionalmoment is a couple in the shear walls oriented perpendicular to the lateral load. This is shownin Figure 6.16, where the center of rigidity of the transverse shear walls does not coincide withthe centroid of the lateral load. This results in a torsional moment that is resolved by forces inthe longitudinal walls as shown.
In some cases a rigid diaphragm is necessary, such as an open-front structure. IBC Section2305.2.5 limits the aspect ratios of rigid diaphragms in open-front structures. The length of thediaphragm normal to the opening cannot exceed 25 ft, and the length-to-width ratio cannotexceed 1.0 for single-story structures and 0.67 for structures taller than one story (see Figure6.17).
The approach taken in this book is to assume a flexible diaphragm. However, the reader isencouraged to examine various diaphragm types to confirm this assumption. One approach is toanalyze the diaphragm as both flexible and rigid, and use the larger forces for design.
Openings in Horizontal Diaphragms
Floor openings such as for stairs, elevators, or mechanical chases, and roof openings for skylights,may occur in a wood structure and must be considered in the design of the horizontal diaphragm.As with any break in structural continuity, proper attention should be given to the design anddetailing of these diaphragms due to the localized stress increases that occur, and it is recom-mended that drag struts be provided along the edges of the opening. The ASCE 7 load speci-fication classifies a building with area of diaphragm opening greater than 50% of the totaldiaphragm area as having plan structural irregularity for the purposes of seismic load calculations(ASCE 7 Section 12.3). Most wood buildings have diaphragm openings that are much smaller

198 � S T R U C T U R A L W O O D D E S I G N
FIGURE 6.18 Opening in a diaphragm.
�
�
��
�
� �
FIGURE 6.19 Unit shear in a flexible diaphragm with anopening.
than 50%, and thus can be classified as regular. Consider the diaphragm loading and shear diagramshown in Figure 6.18.
Where, the shear forces are
(150 plf )(80 ft)V � � 6000 lb1 2
40 ft � 10 ftV � (6000 lb) � 4500 lb� �2 40 ft
40 ft � 14 ftV � (6000 lb) � 3900 lb� �3 40 ft
Note that the total shear along each side of the opening must be distributed over a reducedlength of diaphragm that excludes the opening. For a flexible diaphragm, the fastener layout mayhave to be modified to achieve the required shear capacity on each side of the opening. For arigid diaphragm, the increased forces in the chords due to the diaphragm opening have to betransferred into the diaphragm, and this will lead to an increase in the number of fasteners usedto connect the diaphragm to the chords. A unit shear diagram can be constructed as shown inFigure 6.19.

R O O F A N D F L O O R S H E A T H I N G � 199
The unit shears are
6000 lb� � � 200 plf1 30 ft
4500 lb� � � 150 plf2a 30 ft
4500 lb� � � 205 plf2b (30 ft � 8 ft opening)
3900 lb� � � 130 plf3a 30 ft
3900 lb� � � 178 plf3b (30 ft � 8 ft opening)
These unit shear values would now be compared to IBC Table 2306.3.1 to select an appropriatefastener layout for the flexible diaphragm case.
For a rigid diaphragm, the unit shear diagram in the transverse direction remains as shownin Figure 6.19. However, there is a torsional moment that is developed in each diaphragm panelon each side of the opening. This torsional moment can be resolved into a couple of forcesalong the panel edges that are perpendicular to the lateral load (see Figure 6.20). In the figure
V � total force along left side of panelL
11 ft� (3900 lb) � 1950 lb
11 ft � 11 ft
V � total force along right side of panelR
11 ft� (4500 lb) � 2250 lb
11 ft � 11 ft
The total force on the diaphragm along each side of the diaphragm opening is proportional tothe length of the diaphragm beyond the opening and parallel to the lateral load.
v � unit shear along left side of panelL
1950 lb� � 178 plf
11 ft
v � unit shear along right side of panelR
2250 lb� � 205 plf
11 ft
Considering the equilibrium of panel B and summing moments about point A yields
4 ft� M � (75 plf )(4 ft) � (V )(11 ft) � (2250 lb)(4 ft) � 0� �A 02
Therefore,
V � 764 lb (total force to be added to the chords)0

200 � S T R U C T U R A L W O O D D E S I G N
FIGURE 6.20 Unit shear in a rigid diaphragm with anopening.
FIGURE 6.21 Double and triple top plates.
The unit shear in the diaphragm due to this additional force is
764 lbv � � 191 plf0 4�
This value of 191 plf for the unit shear values along the panel sides would now be comparedto IBC Table 2306.3.1 to select an appropriate fastener layout.
Chords and Drag Struts
The chords and drag struts are the top plates in horizontal diaphragms. The chords are perpen-dicular to the direction of the lateral loads, while the drag struts are parallel to the lateral load.The drag struts are used to ensure continuity of the lateral load path in a diaphragm, and thechords act as the tension and compression flanges of the horizontal diaphragm as it bends in-plane due to the lateral loads. These top plates are usually not continuous; that is, they have tobe spliced because of length limitations. Staggered splices are normally used (Figure 6.21) andthe plates are commonly nailed together in the field.
For nailed or bolted double top plates, only one member is effective to resist the axialtension loads because of the splice. However, for double top plates connected with splice plates,both members will be effective in resisting the axial tension forces. For large chord or drag strutforces, more than two plates may be required. For a triple-top plate system, only two membersare effective in resisting the axial tension loads.
The chords and drag struts must be designed for the worst-case tension and compressionloads. Typically, the tension load controls because the tension strength is generally less thancompression strength. Furthermore, the tension force cannot be transferred across a splice,whereas the compression force can be transferred by end bearing. The ASCE 7 load standardrequires that certain structural elements, such as drag struts, be designed for special seismic forcesEm, but light-framed construction, which includes wood buildings, are exempt from this re-quirement.

R O O F A N D F L O O R S H E A T H I N G � 201
EXAMPLE 6.4
Design of Horizontal Diaphragm Elements
Design the roof diaphragm of the building shown in Figure 6.22 for a lateral wind load of 20 psf. The floor-to-floor height of the building is 10 ft, and the height from the roof datum or level to the peak of the roof truss is6 ft. Assume hem-fir for all wood framing and that normal temperature and moisture conditions apply.
FIGURE 6.22 Roof and floor plan.
Roof dead load � 20 psf
Roof snow load � 40 psf (on a horizontal plane)
Floor dead load � 20 psf
Floor live load � 40 psf
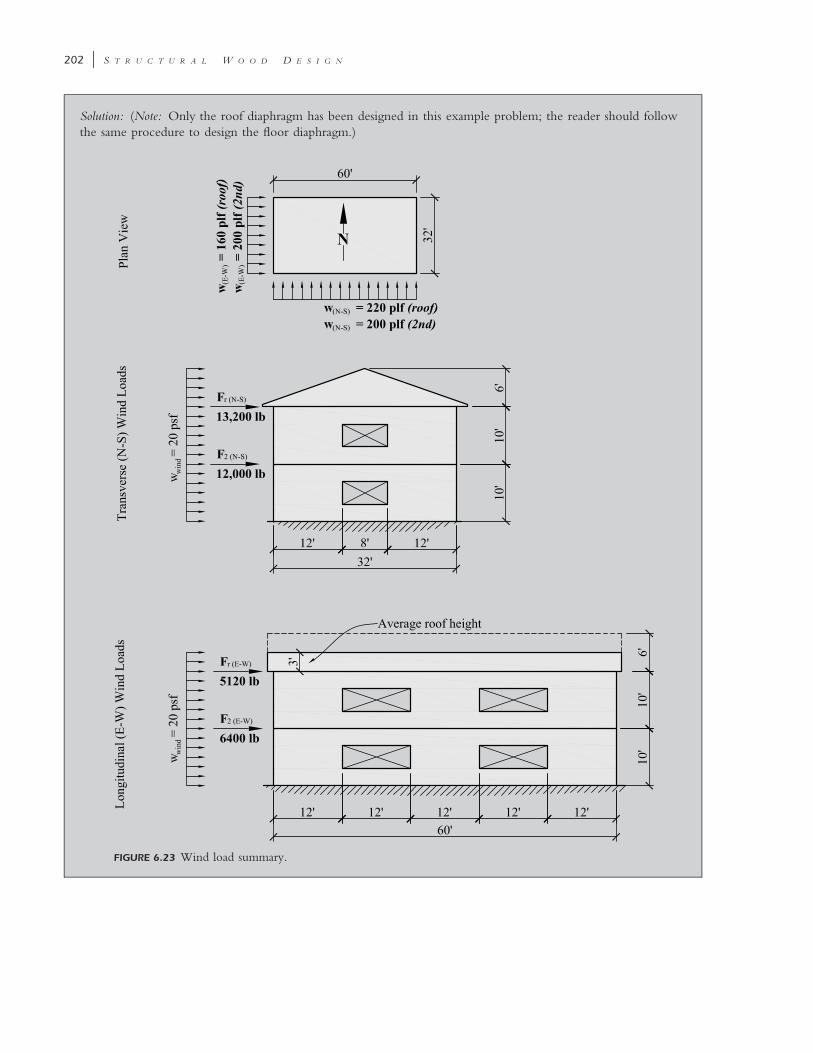
202 � S T R U C T U R A L W O O D D E S I G N
Solution: (Note: Only the roof diaphragm has been designed in this example problem; the reader should followthe same procedure to design the floor diaphragm.)
FIGURE 6.23 Wind load summary.

R O O F A N D F L O O R S H E A T H I N G � 203
First calculate the wind loads (see Figure 6.23). In the N–S direction the uniformly distributed lateral loads inthe horizontal diaphragm are
10 ftroof lateral load w � (20 psf ) 6 ft � � 220 lb/ft� �r 2
10 ft 10 ftsecond-floor lateral load w � (20 psf ) � � 200 lb/ft� �2 2 2
total lateral force at the roof level F � (220 plf )(60 ft) � 13,200 lbroof
total lateral force at the second-floor level F � (200 plf )(60 ft) � 12,000 lb2nd
In the E–W direction the uniformly distributed lateral loads in the horizontal diaphragm are
6 ft 10 ftroof lateral load w � (20 psf ) � � 160 lb/ft� �r 2 2
10 ft 10 ftsecond-floor lateral load w � (20 psf ) � � 200 lb/ft� �2 2 2
total lateral force at the roof level F � (160 plf )(32 ft) � 5120 lbroof
total lateral force at the second-floor level F � (200 plf )(32 ft) � 6400 lb2nd
Roof Diaphragm DesignIn designing the roof diaphragm for lateral loads, we consider the horizontal projection of the roof; thus, theroof slope or pitch is not a factor in designing for lateral loads (Figure 6.24). Check the diaphragm aspect ratio:
60 ft� 1.88 � 3 OK
32 ft
FIGURE 6.24 Free-body diagram of diaphragm:
Note: IBC Table 2305.2.3 requires that the diaphragm aspect be less than 4 if blocking is provided, and 3 ifblocking is omitted. Since the aspect ratio is less than 3 for this example, we can proceed with the design withor without blocking.
N–S direction. The lateral load wr is perpendicular to continuous panel joints and perpendicular tounblocked panel edges; therefore, use load case 1 from Figure 6.13 (or IBC Table 2306.3.1):
w L (220)(60)N–Smaximum horizontal shear (reaction) V � � � 6600 lbN–S 2 2
2 2w L (220)(60)N–Smaximum moment M � � � 99,000 ft-lbN–S 8 8

204 � S T R U C T U R A L W O O D D E S I G N
The maximum unit shear in the diaphragm is
V� � (note that the overhangs are excluded)d b
6600� � 206.3 lb/ft � 207 lb/ft
32 ft
Note: The exact value of 206.3 lb/ft has to be used when calculating the drag strut forces to retainaccuracy in the calculations.
For load case 1 with �d � 207 lb/ft and assuming an unblocked diaphragm, the following is obtained fromIBC 2000 Table 2306.3.1 (Figure 6.25):
-in.-thick C–DX plywood, Structural I.3–88d common nails.Nails spaced at 6 in. (supported edges) and 12 in. (intermediate framing; see footnote b).�allowable � 240 lb/ft.
FIGURE 6.25 Partial view of IBC Table 2306.3.1 (N–S direction). (Adapted from Ref. 3.)
The values above are valid only if the framing is Douglas fir-larch or southern pine. Since hem-fir woodspecies is specified, the value obtained from the table must be adjusted as follows:
SGAF � 1 � (0.5 � G) � 1.0 for nails G � 0.43 (NDS Table 11.3.2A)
� 1 � (0.5 � 0.43) � 0.93
Adjusted allowable shear:Note: Section 2306.3.1 of the IBC allows a 40% increase in the allowable shear value, therefore:
� � 1.4(0.93)(240 lb/ft) � 312 lb/ft � � � 207 lb/ft OKallowable d

R O O F A N D F L O O R S H E A T H I N G � 205
However, by inspection of IBC Table 2304.7(3), the minimum panel thickness is at least in. for roof framing3–8members spaced 24 in. Therefore, it would be necessary to select a -in. panel for gravity loads.3–8
E–W direction. The lateral load wr is parallel to continuous panel joints and parallel to unblocked paneledges; therefore, use load case 3 from Figure 6.13 (or IBC Table 2306.3.1):
w L (160)(32)E–Wmaximum horizontal shear (reaction) V � � � 2560 lbE–W 2 2
2 2w L (160)(32)E–Wmaximum moment M � � � 20,480 ft-lbE–W 8 8
The maximum unit shear in the diaphragm is
V� �d b
2560� � 42.7 lb/ft � 43 lb/ft
60 ft
Note: The exact value of 42.7 lb/ft has to be used when calculating the drag strut forces to retain accuracyin the calculations.
FIGURE 6.26 Partial view of IBC Table 2306.3.1 (E–W direction). (Adapted from Ref. 3.)
For load case 3 with �d � 43 lb/ft and assuming an unblocked diaphragm, the following is obtained fromIBC 2000 Table 2306.3.1 (Figure 6.26):
-in.-thick C–DX plywood, Structural I.3–88d common nails.Nails spaced at 6 in. (supported edges)and 12 in. (intermediate framing; see footnote b).�allowable � 180 lb/ft.

206 � S T R U C T U R A L W O O D D E S I G N
Adjusted allowable shear (using SGAF � 0.93 from the previous part and using the 40% increase allowed bythe code):
� � (0.93)(1.4)(180 lb/ft) � 234 lb/ft � � � 43 lb/ft OKallowable d
The allowable shear is much greater than the actual shear, but the -in. panel was the minimum required for3–8the N–S direction.
Chord forces (Figure 6.27). In the N–S direction, A and B are chord members. The axial forces in chordmembers A and B are
M (99,000 ft-lb)N–ST � C � � � 3100 lb tension or compressionb 32 ftN–S
FIGURE 6.27 Diaphragm chords.
FIGURE 6.28 Unit shear and drag strut force diagrams,N–S direction.

R O O F A N D F L O O R S H E A T H I N G � 207
where bN–S is the distance between chords A and B.In the E–W direction, C and D are chord members. The axial forces in chord members C and D are
M (20,480 ft-lb)E–WT � C � � � 342 lb tension or compressionb 60 ftE–W
where bE–W is the distance between chords C and D.
Drag Struts. In the N–S direction, C and D are drag struts. The unit shear applied in the horizontaldiaphragm in the N–S direction is �d � 206.3 lb/ft. The unit shear in the N–S shear walls is
V 6,600 lbN–S� � � � 275 lb/ftw � L 12 ft � 12 ftw
Note: In drawing the unit shears diagram (Figure 6.28), the horizontal diaphragm unit shears are plotted aspositive and the shear wall unit shears are plotted as negative. The combined unit shears are a summation of theunit shear in the diaphragm and the unit shear in the walls. The drag strut force diagram is obtained bysumming the area under the combined unit shear diagram.
For N–S wind, the maximum drag strut force in C and D is the largest force in the drag strut forcediagram which is 825 lb (tension or compression). In the E–W direction, A and B are drag struts. The unitshear applied in the horizontal diaphragm in the E–W direction is �d � 42.7 lb/ft. The unit shear in the E–Wshear walls is
V 2560 lbE–W� � � 71.1 lb/ftw � L 12 ft � 12 ft � 12 ftw
Following the same procedure as that used in the construction of N–S unit shear, combined unit shear and dragstrut force diagrams are shown in Figure 6.29.
FIGURE 6.29 Unit shear and drag strut force diagrams, E–W direction.

208 � S T R U C T U R A L W O O D D E S I G N
For E–W wind, the maximum drag strut force in A and B is the largest force in the drag strut forcediagram which is 342 lb (tension or compression).
The chord and drag strut forces are summarized in Table 6.4. The maximum force (tension andcompression) for which the top plates should be designed is 3100 lb.
TABLE 6.4 Summary of Chord and Drag Strut Forces (lb), Example 6.4
Side
N–S Wind
ChordDragStrut
E–W Wind
ChordDragStrut
A 3100 — — 342
B 3100 — — 342
C — 825 342 —
D — 825 342 —
Design of top plates. Try double 2 � 6 top plates (same size as the wall studs given). As a result of thesplicing of the double plates, only one 2 � 6 plate is effective in resisting the tension loads, whereas both 2 �6 members are effective in resisting the axial compression force in the top plates (Figure 6.30).
FIGURE 6-30 Top plate splice detail.
Design for tension. The maximum applied tension force Tmax � 3100 lb (see the summary of chord/dragstrut forces). For the stress grade, assume hem-fir stud grade. Since a 2 � 6 is dimension lumber, use NDS-STable 4A for design values. From the table the following design stress values are obtained:
F � 400 psit
C (wind) � 1.6D
C � 1.0M
C � 1.0t
C (F ) � 1.0F t
C � 1.0 (assumed)i
2A � 8.25 in (for one 2 � 6)g
The allowable tension stress
F� � F C C C C Ct t D M t F i
� (400)(1.6)(1.0)(1.0)(1.0)(1.0) � 640 psi
The allowable tension force in the top plates

R O O F A N D F L O O R S H E A T H I N G � 209
2T � F�A � (640 psi)(8.25 in ) � 5280 lb � T � 3100 lb OKallowable t g applied
Design for compression. The top plate is fully braced about both axes of bending. It is braced by the stud wallfor y–y or weak-axis bending, and it is braced by the roof or floor diaphragm for x–x or strong-axis bending,Therefore, the column stability factor CP � 1.0. The maximum applied compression force, Pmax � 3100 lb (seethe summary of chord/drag strut forces). For the stress grade, assume hem-fir stud grade. Since a 2 � 6 isdimension lumber, use NDSS Table 4A for design values. From the table the following design stress values areobtained:
F � 800 psic
C (wind) � 1.6D
C � 1.0M
C � 1.0t
C (F ) � 1.0F c
C � 1.0 (assumed)i
C � 1.0P
2A � 16.5 in (for two 2 � 6’s)g
The allowable compression stress is
F� � F C C C C C Cc c D M t F i P
� (800)(1.6)(1.0)(1.0)(1.0)(1.0)(1.0) � 1280 psi
The allowable compression force in the top plates is
2P � F�A � (1280 psi)(16.5 in ) � 21,120 lb � P � 3100 lb OKallowable c g applied
Use two 2 � 6’s hem-fir stud grade for the top plates.
Note: See Chapter 9 for design of the lap splice connection.
EXAMPLE 6.5
Design of a Horizontal Diaphragm with Partial Wood Blocking
Considering the diaphragm loading shown in Fiugre 6.31, determine the extent for which wood blocking isrequired assuming the floor framing is similar to that shown for Example 6.4.
Solution: For load case 1 and assuming a blocked diaphragm, the following is obtained from IBC Table2306.3.1:
-in.-thick C–DX plywood, Structural I.3–88d common nails.2� blocking required.Nails spaced at 6 in. (all edges)and 12 in. (intermediate framing, see footnote b)Base �allowable � 270 lb/ft.

210 � S T R U C T U R A L W O O D D E S I G N
SGAF � 0.93 (from Example 6.4). The adjusted allowable shear
� � (0.93)(270 lb/ft)(1.40) � 351 lb/ft � � � 338 lb/ft OKallowable d
Extent of wood blocking. Wood blocking is provided only in the zones where the unblocked diaphragmallowable unit shear is less than the unit shear applied. The zone on the shear diagram in which the unit shearis less than the unblocked diaphragm allowable unit shear (i.e., 312 lb/ft calculated in Example 6-4) isdetermined using similar triangles (Figure 6.31).
FIGURE 6.31 Building plan and shear force diagram.
338 lb/ft 312 lb/ft� x � 2.31 ft, say 4 ft (since joist spacing is 24 inches)
30 ft 30 ft � x
Therefore, the horizontal diaphragm needs to be blocked in the N–S direction only in the zones within thefirst 2 ft from the shear walls (hatched area in Figure 6.31).
Thus far, we have considered only buildings with shear walls along the exterior faces only,which results in single-span simply supported horizontal diaphragms. When a building becomestoo long with respect to its width, the diaphragm aspect ratio may exceed the 4�1 maximumallowed by the IBC, in which case interior shear walls will be required. With interior shearwalls, the horizontal diaphragms are considered as separate simply supported diaphragms that spanbetween the shear walls. We now consider an example building with both interior and exteriorshear walls.

R O O F A N D F L O O R S H E A T H I N G � 211
EXAMPLE 6.6
Horizontal Diaphragms with Interior and Exterior Shear Walls
Determine the forces in the chords and drag struts and the diaphragm unit shears at the roof level for a buildingwith the roof plan shown in Figure 6.32. Consider only the N–S wind loads given.
FIGURE 6.32 Building plan.
Solution:
Diaphragm D1. For the N–S wind, A and B are chords; E and F are drag struts.
2 2w L (200)(50)D1Maximum moment M � � � 62,500 ft-lbD1 8 8
The axial tension and compression force in chords A and B is
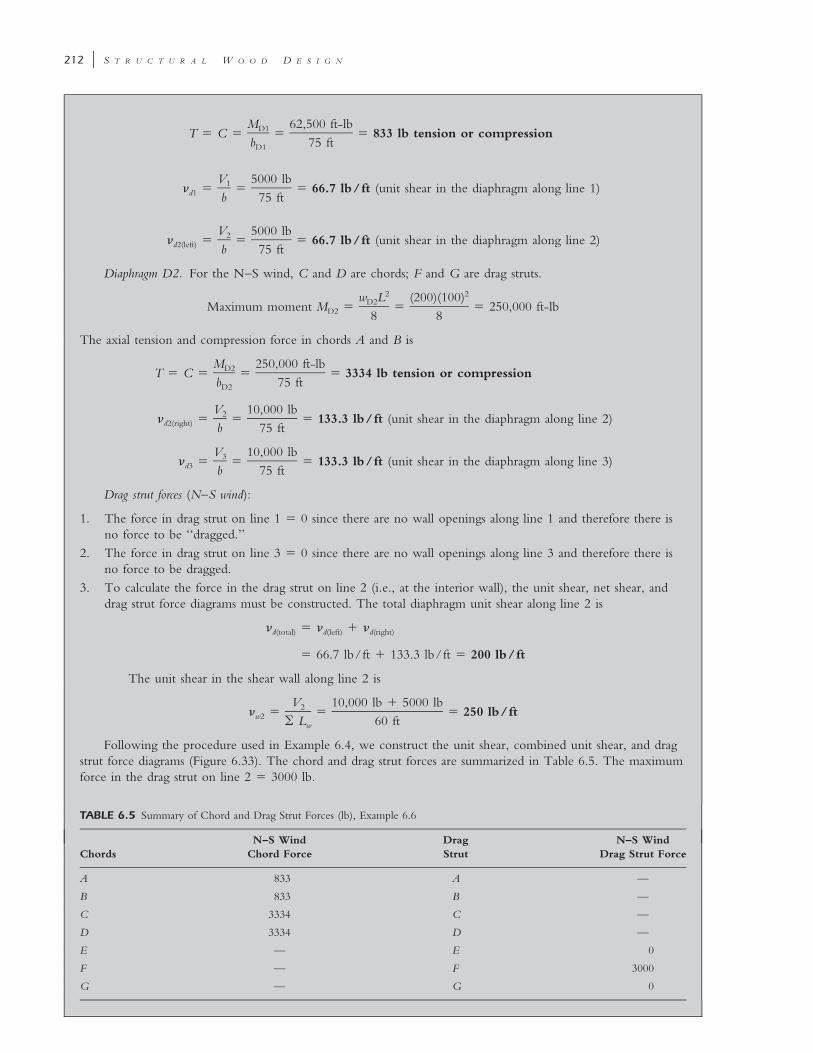
212 � S T R U C T U R A L W O O D D E S I G N
M 62,500 ft-lbD1T � C � � � 833 lb tension or compressionb 75 ftD1
V 5000 lb1� � � � 66.7 lb/ft (unit shear in the diaphragm along line 1)d1 b 75 ft
V 5000 lb2� � � � 66.7 lb/ft (unit shear in the diaphragm along line 2)d2(left) b 75 ft
Diaphragm D2. For the N–S wind, C and D are chords; F and G are drag struts.
2 2w L (200)(100)D2Maximum moment M � � � 250,000 ft-lbD2 8 8
The axial tension and compression force in chords A and B is
M 250,000 ft-lbD2T � C � � � 3334 lb tension or compressionb 75 ftD2
V 10,000 lb2� � � � 133.3 lb/ft (unit shear in the diaphragm along line 2)d2(right) b 75 ft
V 10,000 lb3� � � � 133.3 lb/ft (unit shear in the diaphragm along line 3)d3 b 75 ft
Drag strut forces (N–S wind):
1. The force in drag strut on line 1 � 0 since there are no wall openings along line 1 and therefore there isno force to be ‘‘dragged.’’
2. The force in drag strut on line 3 � 0 since there are no wall openings along line 3 and therefore there isno force to be dragged.
3. To calculate the force in the drag strut on line 2 (i.e., at the interior wall), the unit shear, net shear, anddrag strut force diagrams must be constructed. The total diaphragm unit shear along line 2 is
� � � � �d(total) d(left) d(right)
� 66.7 lb/ft � 133.3 lb/ft � 200 lb/ft
The unit shear in the shear wall along line 2 is
V 10,000 lb � 5000 lb2� � � � 250 lb/ftw2 � L 60 ftw
Following the procedure used in Example 6.4, we construct the unit shear, combined unit shear, and dragstrut force diagrams (Figure 6.33). The chord and drag strut forces are summarized in Table 6.5. The maximumforce in the drag strut on line 2 � 3000 lb.
TABLE 6.5 Summary of Chord and Drag Strut Forces (lb), Example 6.6
ChordsN–S Wind
Chord ForceDragStrut
N–S WindDrag Strut Force
A 833 A —
B 833 B —
C 3334 C —
D 3334 D —
E — E 0
F — F 3000
G — G 0

R O O F A N D F L O O R S H E A T H I N G � 213
The axial forces shown above can be tension or compression. The maximum force for which the top platesshould be designed is 3334 lb, tension or compression.
FIGURE 6.33 Unit shear and drag strut force diagrams.
(a) (b)
FIGURE 6.34 Bendingaction ofnonrectangulardiaphragms: (a)without drag struts;(b) with drag struts.
Nonrectangular Diaphragms
The examples presented thus far have generally assumed rectangular diaphragms. In practice itis common to encounter several types of nonrectangular diaphragms. Although there are count-less possibilities, some design considerations of nonrectangular diaphragms are summarized inFigure 6.34. The aim is to avoid the noncompatibility of the lateral deflections in nonrectangulardiaphragms by using drag struts and collectors. The drag struts effectively convert a nonrectan-gular diaphragm into several rectangular diaphragm segments, thus ensuring the compatibility ofthe lateral deflections of the various diaphragm segments.

214 � S T R U C T U R A L W O O D D E S I G N
REFERENCES
1. ANSI/AF&PA, (2001), Allowable Stress Design Manual for Engineered Wood Construction, AmericanForest & Paper Association, Washington, DC.
2. ANSI/AF&PA, (2005), National Design Specification Supplement: Design Values for Wood Construc-tion, American Forest & Paper Association, Washington, DC.
3. APA (2002), Construction and Industrial Plywood, PS 1-95, APA—The Engineered Wood Asso-ciation, Tacoma, WA.
4. APA (2001), APA Quality Assurance Policies for Structural-Use Panels Qualified to PRP-108, APA—The Engineered Wood Association, Tacoma, WA.
5. APA (2002), Performance Standard for Wood-Based Structural-Use Panels, PS 2-92, APA—The En-gineered Wood Association, Tacoma, WA.
6. APA (2001), Engineered Wood Construction Guide, APA—The Engineered Wood Association,Tacoma, WA.
7. APA (2004), Diaphragms and Shear Walls: Design/Construction Guide, APA—The EngineeredWood Association, Tacoma, WA.
8. APA (1998), Plywood Design Specification, APA—The Engineered Wood Association, Tacoma,WA.
9. ATC (1981), Guidelines for the Design of Horizontal Diaphragms, ATC-7, Applied TechnologyCouncil, Redwood City, CA.
10. Faherty, Keith F., and Williamson, Thomas G. (1989), Wood Engineering and Construction,McGraw-Hill, New York.
11. Halperin, Don A., and Bible, G. Thomas (1994), Principles of Timber Design for Architects andBuilders, Wiley, New York.
12. ICC (2006), International Building Code, International Code Council, Washington, DC.13. Stalnaker, Judith J., and Harris, Earnest C. (1997), Structural Design in Wood, Chapman & Hall,
London.14. Breyer, Donald et al. (2003), Design of Wood Structures—ASD, 5th ed., McGraw-Hill, New York.15. Tarpy, Thomas S., Thomas, David J., and Soltis, Lawrence A. (1985), Continuous timber dia-
phragms, J. Struct. Div. ASCE 111(5):992–1002.16. ANSI/American Forest & Paper Association, (2001), Wood Structural Panels Supplement, AF&PA,
Washington, DC.
PROBLEMS
6.1 For a total roof load of 60 psf on 2� framing members at 24 in. o.c., determine an appro-priate plywood thickness and span rating assuming panels with edge support and panelsoriented perpendicular to the framing. Specify the minimum fasteners and spacing.
6.2 Repeat Problem 6.1 for panels oriented parallel to the supports.6.3 For a total floor load of 75 psf on 2� floor framing at 24 in. o.c., determine an appropriate
plywood thickness and span rating assuming panels with edge support and panels orientedperpendicular to the framing. Specify the minimum fasteners and spacing.
6.4 A one-story building is shown in Figure 6.35. The roof panels are -in.-thick CD–X with15––32
a span rating of 32/16. The wind load is 25 psf. Assume that the diaphragm is unblockedand that the framing members are spruce-pine-fir. Determine the following for the transversedirection:(a) Unit shear in the diaphragms(b) Required fasteners(c) Maximum chord forces(d) Maximum drag strut forces (construct unit shear, net shear, and drag strut force dia-
grams)6.5 Repeat Problem 6.4 for the longitudinal direction.

R O O F A N D F L O O R S H E A T H I N G � 215
FIGURE 6.35

216
c h a p t e r s e v e n
VERTICAL DIAPHRAGMS UNDER
LATERAL LOADS (SHEAR WALLS )
7.1 INTRODUCTION
The design of vertical diaphragms or shear walls is one of the most critical elements in wood-framed structures. The lateral forces due to wind or seismic loads are transmitted from thehorizontal diaphragm to the shear walls, which then transfer these loads to the foundation. Themost common sheathing materials used are either plywood or gypsum wallboard (GWB).
The lateral load distribution to vertical diaphragms or shear walls is a function of the relativerigidity of the horizontal roof and floor diaphragms. Horizontal diaphragms can be classified asflexible or rigid, and most wood buildings can be assumed to have flexible diaphragms. Therefore,lateral wind loads are distributed to the shear walls based on the tributary area of the shear wallrelative to the vertical wall surface on which the wind acts, while seismic loads are distributedbased on the plan tributary area of the shear walls.
The capacity of a plywood shear wall is greater than that of a shear wall with GWB,especially when comparing their resistance to seismic loads. A typical wood-framed structure hasplywood sheathing on the exterior walls only, with the remaining interior walls sheathed withGWB. If a building design requires the use of plywood sheathing on the interior walls, theplywood is typically covered with GWB for aesthetic purposes, so the designer must considerthe economic impact of using interior plywood shear walls versus strengthening the exteriorplywood shear walls.
Wall sheathing must also act to transfer the horizontal wind load to the wall studs on theexterior walls. IBC Section 1607.13 does require that interior walls be adequate to resist a lateralload of 5 psf, but this lateral pressure is typically small enough not to affect the design of theinterior wall sheathing or studs.
Wall Sheathing Types
Although several types of wall sheathing are available for use in shear walls, in this book wefocus on plywood sheathing only. There are two common types of plywood wall sheathing; thefirst is exposed plywood panel siding (e.g., APA 303–rated siding). These panels are manufacturedwith various surface textures and perform a dual purpose as a structural panel as well as beingthe exterior surface of the building. Several proprietary products are available that are recognizedby the IBC for use as shear walls. Exposed plywood siding can either be fastened directly towall studs or over a layer of - or -in.-thick GWB to meet fire rating requirements. IBC Table1 5– –2 8
2308.9.3(2) specifies the minimum thickness for exposed plywood as in. for studs spaced 163–8in. o.c. and in. for studs spaced 24 in. o.c.1–2
The second type is wood structural panel wall sheathing. This is commonly used on exteriorwalls applied directly to the wall framing with a finish material applied to the plywood. IBCTable 2308.9.3(3) specifies the minimum thickness for plywood not exposed to the weather.
Structural Wood Design: A Practice-Oriented Approach Using the ASD Method. Abi Aghayere and Jason VigilCopyright © 2007 John Wiley & Sons, Inc.

V E R T I C A L D I A P H R A G M S U N D E R L A T E R A L L O A D S ( S H E A R W A L L S ) � 217
FIGURE 7.1 Wall sidinggrade stamp. (Courtesyof APA–The EngineeredWood Association,Tacoma, WA.)
The span rating for wall panels is usually indicated by one number, either 16 or 24 in.(see Figure 7.1). This number refers to the maximum wall stud spacing. Panels rated for wallsheathing are performance tested, with the short direction spanning across the supports (i.e.,the weaker direction); therefore, the wall panels can be placed either horizontally or vertically.Loads normal to the wall panels typically do not control the thickness of the sheathing, ratherthe unit shear in the wall panels due to lateral loads will usually determine the panel thickness.
Plywood as a Shear Wall
When lateral loads act parallel to the face of the wall, the plywood wall sheathing acts as ashear wall. Shear walls are the main elements used to resist lateral loads due to wind andearthquake in wood-framed buildings. They act as vertical cantilevers that are consideredfixed at the ground level (see Figure 7.2).
The shear wall diaphragm (i.e., the plywood) resists the shear, while the shear wall chords(i.e., the vertical members at the ends of the shear wall) resist the moments caused by thelateral forces; this moment creates a tension and compression force couple in the shear wallchords. IBC Section 2305.1.2.1 specifies that all of the plywood panel edges be fastened toa framing member, which may require blocking between the wall studs, depending on thewall sheathing orientation. The same code section also specifies that the plywood be attachedto the framing members with fasteners spaced not less than in. from a panel edge, a3–8minimum of 6 in. o.c. along the panel edges and 12 in. o.c. in the field—that is, along theintermediate framing members (Figure 7.3). It is recommended that the location of the nailsfrom the edge of the stud framing should be about the same as the distance of the nail from thepanel edge. Table 6-1 from the Wood Structural Panels Supplement [15] indicates that the minimumnail size should be 6d for wood panels in. and thinner and 8d nails for thicker panels.1–2
The capacity of a shear wall to resist lateral loads is a function of several items; the plywoodthickness, fastener size, and fastener layout. The lateral load capacity of wood shear wall panelsis largely controlled by the load capacity of the fasteners. The plywood itself will rarely fail inshear because of the relatively high shear strength of the wall sheathing compared to the fastenercapacity. The failure mode for shear walls includes one or more of the following scenarios:
1. Edge tearing of the diaphragm as the nails bear against it.
2. The pull-through of the nails from the wall sheathing or failure of the nails in bending,leaving the panels laterally unsupported, and thus making the panels susceptible to buck-ling.
3. Longitudinal splitting failure of the wood framing especially for larger nail sizes.
The capacities of several combinations of plywood thickness and fasteners are listed in IBC Table2306.4.1 (see Figures 7.15 and 7.17). It is important to note that the shear capacities listed inthis table can be increased by 40% when designing for wind loads (IBC Section 2306.4.1) becausethe shear capacities in IBC Tables 2306.3.1 and 2306.4.1 were derived based on a safety factorof 2.8, whereas the ASCE 7 wind loads are based on a safety factor of 2.0. [8]. These shearcapacities apply to plywood fastened to one side of the studs. For plywood fastened to both sidesof the studs, the shear capacity is doubled if the sheathing material and fasteners are the same oneach side. When the shear capacity is not equal on both sides, the total capacity is the larger ofeither twice the smaller capacity, or the capacity of the stronger side.
In some cases, such as in exterior walls, plywood is applied on the exterior face and gypsumwall board (GWB) is applied on the interior face. While the GWB and fasteners have somecapacity to act as a shear wall to resist lateral loads (see Ref. 9), it is usually not recommendedthat GWB and plywood be used in combination as a shear wall since the response modificationfactor R is much greater for wood than for GWB (see ASCE 7 Table 12.2.1). The R value isindirectly proportional to the seismic load. However, IBC Section 2305.3.8 does permit directsummation of the shear capacities for wood panels used in combination with GWB for resistingwind loads only. This is not permitted for seismic loads. So for the same building, the allowable

218 � S T R U C T U R A L W O O D D E S I G N
FIGURE 7.2 Shear wall as a vertical cantilever.
FIGURE 7.3 Typicalminimum fasteningfor wall panels.

V E R T I C A L D I A P H R A G M S U N D E R L A T E R A L L O A D S ( S H E A R W A L L S ) � 219
shear capacity of a wall could be much smaller for seismic design than for wind design giventhe discussion above and the 40% increase allowed for wind design. This difference in shearcapacities for wind and seismic design is illustrated in Example 7.3.
Hold-down anchors are used to resist uplift tension, and sill anchors (or anchor rods) areused to resist sliding. Both are usually anchored into the concrete foundation. IBC Sections2308.3.3 and 2308.6 specify the minimum spacing and dimensions for the anchor rods.
The load path for wind is as follows: Wind acts perpendicular to wall surfaces, resulting invertical bending of these walls. The lateral reaction from the vertical bending of the walls is thentransmitted to the diaphragms above and below the walls. The roof and floor diaphragms thentransfer the lateral reactions to the vertical lateral force–resisting systems (i.e., the vertical dia-phragms or shear walls), and the shear walls transfer the lateral loads safely to the ground orfoundation.
For seismic loads, the ground motion results in the back-and-forth lateral displacement ofthe base of the building, causing a shear force at the base of the building. This base displacementcauses lateral displacements of the diaphragms in the direction opposite to the base displace-ment. These lateral displacements result in equivalent lateral forces at the various diaphragmlevels of the building. The equivalent lateral forces are then transmitted through the roof andfloor diaphragms to the vertical lateral force–resisting systems (i.e., the vertical diaphragms orshear walls), and the shear walls transfer the lateral loads safely to the ground or foundation(Figure 7.4).
7.2 SHEAR WALL ANALYSIS
There are three methods given in the IBC for shear wall analysis (IBC Section 2305.3):
1. Segmented approach. The full height segments between window and door openings are as-sumed to be the only walls resisting lateral loads; thus, the stiffness contribution of thewalls above and below the window or door openings is neglected. In this approach thehold-down anchors are located at the ends of each wall segment. The shear wall forcescalculated using this approach are usually the largest of the three approaches. This is themethod adopted in this book and is the most commonly used method in practice.
2. Perforated shear wall approach. All the walls, including those above and below window anddoor openings, are assumed to contribute to the lateral load-carrying capacity of the shearwalls. In this approach, the hold-down anchors are located at the extreme ends of theoverall shear wall; thus, each shear wall line will typically have only two hold-down an-chors. The shear wall forces calculated using this approach are usually smaller than thosecalculated using the first method, but the edges of the wall openings must be reinforcedto transfer the lateral forces. This method is sometimes used in buildings where the lengthand number of shear walls are limited.
3. Force transfer method. The walls are assumed to behave as a coupled shear wall system. Inthis case, the hold-down anchors are also located at the extreme ends of the entire shearwall; thus, each shear wall line will typically have only two hold-down anchors. To en-sure coupled shear wall action, horizontal straps or ties would have to be added to tie thewall segments below and above the window and door openings to the wall segments onboth sides of the opening. The shear wall forces calculated using this approach are usuallythe smallest of the three methods.
Shear Wall Aspect Ratios
Several IBC aspect ratio requirements pertain to shearwalls. IBC Section 2305.3.4 states that theheight-to-width aspect ratio must be less than 3.5 to resist wind loads and less than 2.0 to resistseismic loads. However, Table 2305.3.4 indicates that the aspect ratio can be increased to 3.5

220 � S T R U C T U R A L W O O D D E S I G N
FIGURE 7.4 Typicalload path for lateralloads.
FIGURE 7.5 Shearwall aspect ratios.
for seismic loads provided the allowable shear obtained from IBC Table 2306.4.1 is multipliedby 2w/h, where w is the length of the shear wall and h is the height of the shear wall (Figure7.5).
Multistory Shear Wall Aspect RatioWhen calculating the shear wall aspect ratio in accordance with IBC requirements, the value
used for H is the cumulative height from the base of the wall in question to the roof. Althoughthe wall layout for most multistory wood-framed buildings is virtually the same for each floor(and thus shear wall lengths are the same for each floor), Figure 7.7 indicates the most economicaluse of shear walls for a typical wall elevation.
Shear Wall Overturning Analysis
To analyze a shear wall for the various load effects, a free-body diagram must first be drawn.Shown in Figure 7.8 is a typical shear wall along the exterior wall of a building with tributarylateral and gravity loads applied. From Figure 7.8,

V E R T I C A L D I A P H R A G M S U N D E R L A T E R A L L O A D S ( S H E A R W A L L S ) � 221
EXAMPLE 7.1
Definition of a Shear Wall
Determine which wall panels can be used as a shear wall in the building elevation shown in Figure 7.6.
FIGURE 7.6 Shear wall aspect ratios.
Solution:
h 12 ftWall 1: � � 6 � 3.5
w 2 ft
Therefore, wall 1 does not meet code for both wind and seismic designs, and will be neglected for shear action.
h 12 ftWall 2: � � 2.4 � 3.5
w 5 ft
Therefore, wall 2 meets code for wind loads and also meets code for seismic loads provided that the allowableunit shear from IBC Table 2306.4.1 is multiplied by 2w/h � (2)(5 ft)/12 ft, or 0.83.
h 12 ftWall 3: � � 4 � 3.5
w 3 ft
Therefore, wall 3 does not meet code for both wind and seismic designs, and will be neglected for shear action.
h 12 ftWall 4: � � 2 � 3.5
w 6 ft
Therefore, wall 4 meets code for both wind and seismic designs.Use Wall 2 and Wall 4 only to resist lateral loads.
w � length of the shear wallLH(1) � length of the header (left side)LH(2) � length of the header (right side)
H1 � first-floor heightH2 � second-floor height
Froof � force applied to the shear wall at the roof level (either wind or seismic)F2nd � force applied to the shear wall at the second floor (either wind or seismic)
W2nd � self-weight of the shear wall at the second floorW1st � self-weight of the shear wall at the first floorR roof � force due to uniform load on the shear wall at the roof
� wroofwR2nd � force due to uniform load on the shear wall at the second floor

222 � S T R U C T U R A L W O O D D E S I G N
FIGURE 7.7
Multistory shear wallaspect ratios.
FIGURE 7.8 Loads to a typical shear wall.

V E R T I C A L D I A P H R A G M S U N D E R L A T E R A L L O A D S ( S H E A R W A L L S ) � 223
FIGURE 7.9 Loads and reactions to a typical shear wall.
� w2ndwProof � force due to uniform load on the header at the roof
� w L w Lroof H1 roof H2or2 2
P2nd � force due to uniform load on the header at the second floor� w L w L2nd H1 2nd H2or
2 2
The uniform loads are resolved into resultant forces to simplify the overturning analysis.The uniform loads along the wall (i.e., the load from the roof or floor framing and the self-weight of the wall) act at the centroid of the wall, or at a distance of w/2 from the end of theshear wall.
The lateral wind or seismic loads acting on the shear wall can act in either direction. If thereactions from the left and right headers are equal, the overturning analysis has to be performedwith the lateral load in only one direction. If the header reactions are not equal, the overturninganalysis must be performed with the lateral applied in both directions, as will be shown later.
The loads that act on the roof level that result in the applied forces R roof and Proof can besome combination of dead, roof live, snow, or wind loads, depending on the governing loadcombination. Similarly, the loads that act on the second floor that result in the applied forcesR2nd and P2nd can be some combination of dead and floor live loads. Figure 7.8 is somewhatgeneric but is typical for most shear walls. It is important to note that it is possible to have othergravity loads acting on the shear wall (such as a header from another beam framing perpendicularinto the shear wall). These loads must also be accounted for in the overturning analysis.
The free-body diagram shown is specific for a two-story structure; however, it can be seenby inspection that this analysis can be used for a building with any number of stories. Forsimplicity, a two-story example is used here. The overturning analysis must also be performedat each level for multistory structures. This will require another isolated free-body diagram foreach level, as shown in Figure 7.9 for the two-story structure. From Figure 7.9
T1 and C1 � shear wall tension chord and compression chord forces at the ground floorlevel
T2 and C2 � shear wall tension chord and compression chord forces at the second floor
Note: For calculating the T1 and T2 chord forces, the full dead loads on the shearwall are used, whereas for C1 and C2 chord forces, only the tributary gravity loadsapply; therefore, only the gravity loads in the compression chords are used.

224 � S T R U C T U R A L W O O D D E S I G N
V1 � base shear at the ground level (� Froof � F2nd)V2 � base shear at the second floor (� Froof )
The lateral forces in this example are shown acting in one direction to show the resulting tensionand compression chord forces.
The overturning moment can be calculated at each level as follows. At the second floorsumming moments about point C or D yields
OM � F H (7.1)2 roof 2
At the ground level, summing moments about point A or B yields
OM � [F (H � H )] � (F H ) (7.2)1 roof 2 1 2nd 1
The gravity loads prevent the shear wall from overturning or toppling over by creating aresisting moment that opposes the overturning moment. The magnitude of this resisting momentis the summation of moments about the same point that the overturning occurs. The appliedloads in the overturning analysis are to be in accordance with the code-required load combi-nations, which are shown below for reference.
1. D � F (IBC Equation 16-8)2. D � H � F � L � T (IBC Equation 16-9)3. D � H � F � (L or S or R) (IBC Equation 16-10)r
4. D � H � F � 0.75(L � T ) � 0.75 (L or S or R) (IBC Equation 16-11)r
5. D � H � F � (W or 0.7E ) (IBC Equation 16-12)6. D � H � F � 0.75(W or 0.7E ) � 0.75L � 0.75(L or S or R) (IBC Equation 16-13)r
7. 0.6D � W � H (IBC Equation 16-14)8. 0.6D � 0.7E � H (IBC Equation 16-15)
It can be seen by inspection that the first four combinations are eliminated for shear wallanalysis and design since they do not include any lateral load terms. It can also be seen byinspection that the combination D � H � F � 0.75(W or 0.7E ) � 0.75L � 0.75(Lr or S orR) will produce the worst-case compression chord force, and the combinations 0.6D � W �H or 0.6D � 0.7E � H will produce the worst-case tension chord forces. Since these combi-nations all include either wind or seismic loads, the load duration factor for the member designswill be CD � 1.6. For simplicity, the following terms will not be considered since they do nottypically apply to shear walls: H (earth pressure), F (fluid pressure), and T (temperature andshrinkage change).
Shear Wall Chord Forces: Tension Case
The controlling load combination for the tension chord will be either 0.6D � W or 0.6D �0.7E. These combinations are used for the tension case since the goal is to maximize the valuein the tension chord to determine what the worst-case value is, and this is done by having theleast amount of gravity load present in the model. The only gravity load effect present that resistsoverturning for the tension case is the dead load. Given that the dead load is multiplied by a0.6 term, it is implied that there is a factor of safety of 1.67 (or 1/0.6) against overturning.
When calculating the maximum tension chord force (either T1 or T2 in Figures 7.8 and7.9), the point at which to sum moments must first be determined. For the tension case, thefollowing rules apply:
1. When the header reactions are equal, the summation of moments can be taken about anypoint (e.g., A or B at the base, or point C or D at the second level in Figure 7.8 or 7.9).
2. When the header reactions are not equal, the summation of moments should be takenabout a point that lies on the same vertical line as the larger header reaction.

V E R T I C A L D I A P H R A G M S U N D E R L A T E R A L L O A D S ( S H E A R W A L L S ) � 225
When the header reactions are not equal, it should be observed that the gravity load isminimized (and thus the tension chord force is maximized) when the summation of momentsis taken about a point under the larger header reaction.
Wind Load CombinationKnowing that the governing load combination for wind loads is 0.6D � W, the value T1
or T2 can be calculated from the free-body diagram in accordance with the following equilibriumequations by summing moments about the compression chord.
OM � 0.6RM � (T w) � 02 D2 2
Solving for T2 yields
OM � 0.6RM2 D2T � (7.3)2 w
where OM � overturning moment at the second level [see equation (7.1)]2
RM � summation of the dead load resisting moments at the second levelD2
Similarly, an equation for T1 can also be developed:
OM � 0.6RM1 D1T � (7.4)1 w
Seismic Load CombinationThe governing load combination for seismic loads is 0.6D � 0.7E. Section 12.4.2 of ASCE
7 defines the term E as follows:
E � �Q � 0.2S D or E � �Q � 0.2S DE DS E DS
where � � redundancy coefficient (see Section 12.3.4 of ASCE 7)
Note: When using the simplified procedure to calculate seismic loads, � � 1.0 forseismic design categories A, B, and C. For seismic design categories D, E, and F,the reader is referred to Section 12.3.4 of ASCE 7.
QE � horizontal effect of the seismic loadsSDS � design spectral response acceleration (see Section 11.4.4 of ASCE 7)
D � dead load
By inspection it can be seen that the equation E � �QE � 0.2SDSD will govern for the designof the shear wall tension chord since the dead load effect is minimized, while E � �QE �0.2SDSD will govern for the design of the compression chord.
The value of � can either be 1.0 or 1.3 and the value of SDS can vary from 0.1 in low-seismic hazard areas to over 3.0 in a high-seismic hazard areas.
For the tension chord, E � �QE � 0.2SDSD
Substituting this in the governing load combination (0.6D � 0.7E ) yields
0.6D � 0.7(�Q � 0.2S D) � (0.6 � 0.14S )D � 0.7�Q governing load combinationE DS DS E
The value T1 or T2 can now be determined for the seismic load case as follows:
(0.7�)OM � (0.6 � 0.14S )RM2 DS D2T � (7.5)2 w
(0.7�)OM � (0.6 � 0.14S )RM1 DS D1T � (7.6)1 wNote: If T1 or T2 � 0, this implies no uplift on tension chord
� 0, this implies uplift on tension chord

226 � S T R U C T U R A L W O O D D E S I G N
Shear Wall Chord Forces: Compression Case
The controlling load combination for the compression chord is D � 0.75(W or 0.7E ) � 0.75L� 0.75(Lr or S or R). The code allows the effects from two or more transient loads to bereduced by a factor of 0.75. Therefore, the governing load combination can be rewritten asfollows:
D � 0.75[W � L � (L or S or R)] for the wind load caser
D � 0.75[0.7E � L � (L or S or R)] for the seismic load caser
The term that accounts for the rain load effect R is ignored in this example since it typicallydoes not control for most wood buildings. Also, the larger of the roof live load Lr and the snowload S should be used in the overturning analysis.
The general equations for determining the worst-case compression chord force can be de-veloped similar to the equations developed earlier for the tension chord. The equations developedfor the compression case will have to include an expanded form of the resisting moment RMterm to include both a dead load and transient load term since different numerical coefficientswill apply to each term. Recall that the tension case involved only dead-load effects, whereasthe compression case will include other gravity load effects since the goal is to maximize thecompression chord force. It should be recalled that only the tributary gravity loads on the com-pression chord are used to calculate the compression chord forces.
When calculating the maximum compression chord force (either C1 or C2 in Figures 7.8and 7.9), the point about which to sum moments must first be determined. For the compressioncase, the following rules apply:
1. When the header reactions are equal, the summation of moments can be taken about anypoint (e.g., A or B at the base, or point C or D at the second level in Figure 7.8 or 7.9).
2. When the header reactions are not equal, the summation of moments should be takenabout a point that lies on the same vertical line as the smaller header reaction.
When the header reactions are not equal, it should be observed that the gravity load ismaximized (and thus the compression chord force is maximized) when the summation of mo-ments is about a point under the smaller header reaction.
Wind Load CombinationThe value of C1 or C2 can be calculated from the free-body diagram in accordance with
the following equilibrium equations by summing moments about the tension chord at each level:
0.75OM � RM � 0.75RM � C w � 02 D2 T2 2
Solving for C2 yields
0.75OM � RM � 0.75RM2 D2 T2C � (7.7)2 w
where OM2 � overturning moment at the second level [see equation (7.1)]RMD2 � summation of the tributary dead load resisting moments at the second levelRMT2 � summation of the tributary transient load resisting moments at the second level
Similarly, an equation for C1 can also be developed by summing moments about point A:
0.75OM � RM � 0.75RM1 D1 T1C � (7.8)1 w
Seismic Load CombinationFrom the seismic load effect for the tension case, we can write
E � �Q � 0.2S DE DS
Combining this with the governing load combination yields
(1.0 � 0.105SDS)D � 0.75[0.7�QE � L � (Lr or S or R)]
or

V E R T I C A L D I A P H R A G M S U N D E R L A T E R A L L O A D S ( S H E A R W A L L S ) � 227
(1.0 � 0.105SDS)D � 0.525�QE � 0.75L � 0.75(Lr or S or R) governing load combination
The value of C1 or C2 for the seismic case can now be calculated as follows:
0.525�OM � (1.0 � 0.105S )RM � 0.75RM2 DS D2 T2C � (7.9)2 w
0.525�OM � (1.0 � 0.105S )RM � 0.75RM1 DS D1 T1C � (7.10)1 w
where OM1 and OM2 � overturning moment caused by the horizontal seismic force, QE
In calculating the resisting moments (RMD1, RMD2, RMT1, RMT2) in equations (7.7) to (7.10),it should be noted that the full P loads or header reactions (see Figure 7.10) and the tributaryR and W (i.e., distributed loads) loads should be used since the compression chords only supportdistributed gravity loads that are tributary to it, in addition to the concentrated header reactionsor P loads. The tributary width of the compression chord is one-half of the stud spacing. Thus,
1–R( � stud spacing)2R �trib w
1–W( � stud spacing)2W �trib w
Recall that R and W are the total loads on the whole shear wall, while the terms R trib and Wtrib
represent the amount of gravity load that is tributary to the compression chords. Since theseloads are located at the compression chord (i.e., at the end of the wall), the moment arm relativeto the tension chord for the terms R trib and Wtrib is equal to the length of the wall w and shouldbe used accordingly in the resisting moment (RMD1, RMD2, RMT1, RMT2) calculations. Theresisting moment about the tension chord for the R trib and Wtrib terms can be written as follows:
1–R � ( � stud spacing)2 1–RM(R ) � � w � R( � stud spacing)trib 2w
1–W � ( � stud spacing)2 1–RM(W ) � � w � W � ( � stud spacing)trib 2w
7.3 SHEAR WALL DESIGN PROCEDURE
The procedure for designing shear walls is as follows:
1. Calculate the lateral forces at each level (wind and seismic loads) and the gravity loadsthat act on the shear wall. Draw free-body diagrams similar to those shown in Figures 7.8and 7.9.
2. Design the shear wall for the unit shear in the shear wall at each level. Give the fullspecification for the shear wall as follows:(a) Plywood grade and thickness(b) Nail size and penetration(c) Nail spacing (at edges and field)
Recall that blocking is required at all panel edges.3. Calculate the shear wall chord forces (T1, T2, C1, C2, etc.). Design the chords for these
forces. Recall that the weak axis of the wall studs are braced by the wall sheathing, andthe unbraced length of the chord for bending about the strong axis is equivalent to thefloor-to-floor height.
4. Design the connections:(a) Hold-down anchors to resist T1 or T2
(b) Sill anchors to resist the base shear V1
(c) Between the horizontal and vertical diaphragms to ensure a continuous load path

228 � S T R U C T U R A L W O O D D E S I G N
EXAMPLE 7.2
Design of Shear Walls
Design shear walls SW1 and SW2 for the two-story building shown in Figure 7.10 considering wind loadsonly. Assume a floor-to-floor height of 10 ft. Hem-fir lumber framing is used and assume a lateral wind load of20 psf. See Figures 7.11 and 7.12 for additional information.
FIGURE 7.10 Building plan.

V E R T I C A L D I A P H R A G M S U N D E R L A T E R A L L O A D S ( S H E A R W A L L S ) � 229
FIGURE 7.11 Longitudinal elevation.
FIGURE 7.12 Transverse elevation.

230 � S T R U C T U R A L W O O D D E S I G N
Solution:East–West wind:
6 ft 10 ftF � (20 psf ) � (32 ft) � 5120 lb� �r (E–W) 2 2
10 ft 10 ftF � (20 psf ) � (32 ft) � 6400 lb� �2(E–W) 2 2
These values represent the total force at each level. They will have to be distributed to each shear wall in theE–W direction.
North–South wind:
10 ftF � (20 psf ) 6 ft � (60 ft) � 13,200 lb� �r (N–S) 2
10 ft 10 ftF � (20 psf ) � (60 ft) � 12,000 lb� �2(N–S) 2 2
These values represent the total force at each level. They will have to be distributed to each shear wall in theN–S direction.
Lateral loads on the E–W shear wall (SW1). Research has shown that wood diaphragms are typically classifiedas flexible diaphragms (see further discussion in Chapter 6 and Ref. 13); thus, the amount of lateral load on anyindividual shear wall is proportional to the tributary area of the shear wall in question. For this example, thelateral load on SW1 is proportional to the length of the wall relative to the other east–west shear walls. Wemust first check that SW1 meets the aspect ratio requirements in IBC Section 2305.3.3:
h� 3.5 (2.0 for seismic loads)
w
10 ft � 10 ft� 1.67 � 2.0
12 ft
Therefore, SW1 meets aspect ratio requirements. There are six shear walls, each 12 ft long, in the E–Wdirection, so the lateral load to SW1 at each level is
length of SW1F � Fr r(E–W)� all shear wall lengths
12 ft� (5120)
(6)(12 ft)
� 854 lb
length of SW1F � F2 2(E–W)� all shear wall lengths
12 ft� (6400)
(6)(12 ft)
� 1067 lb
Gravity loads on the E–W shear wall (SW1). At the roof level:

V E R T I C A L D I A P H R A G M S U N D E R L A T E R A L L O A D S ( S H E A R W A L L S ) � 231
Direct load on wall:
32 ft (12 ft) � 4320 lbR � (20 psf ) � 2 ft� �D 2(TW � overhang) (wall length)
32 ftR � (40 psf ) � 2 ft (12 ft) � 8640 lb� �S 2
W � (10 psf )(10 ft) (12 ft) � 1200 lbD
(wall height)(wall length)
Reaction from headers (both ends equal):
32 ft 12 ftP � (20 psf ) � 2 ft� � � �D � 2160 lb2 2
(half of header length)
32 ft 12 ftP � (40 psf ) � 2 ft � 4320 lb� �� �S 2 2
At the second floor:
Direct load on wall:
16 ftR � (20 psf ) (12 ft) � 1920 lbD � �2(TW) (wall length)
16 ftR � (40 psf ) (12 ft) � 3840 lb� �L 2
W � (10 psf )(10 ft) (12 ft) � 1200 lbD
(wall height)(wall length)
Reaction from headers (both ends equal):
16 ft 12 ftP � (20 psf ) � 960 lb� � � �D 2 2
(half of header length)
16 ft 12 ftP � (40 psf ) � 1920 lb� �� �L 2 2
See Figure 7.13.Lateral loads on the N–S shear wall (SW2). The lateral load on SW2 is proportional to the length of the wall
relative to the other N–S shear walls. We must first check that SW2 meets the aspect ratio requirements in IBCSection 2305.3.3:

232 � S T R U C T U R A L W O O D D E S I G N
FIGURE 7.13 Free-body diagram of SW1.
h� 3.5 (2.0 for seismic loads)
w
10 ft � 10 ft� 1.67 � 2.0
12 ft
Therefore, SW2 meets aspect ratio requirements. There are four shear walls, each 12 ft long, in the N–Sdirection, so the lateral load to SW2 at each level is
length of SW2F � Fr r(N–S)� all shear wall lengths
12 ft� (13,200)
(4)(12 ft)
� 3300 lb
length of SW2F � F2 2(N–S)� of all shear wall lengths
12 ft� (12,000)
(4)(12 ft)
� 3000 lb

V E R T I C A L D I A P H R A G M S U N D E R L A T E R A L L O A D S ( S H E A R W A L L S ) � 233
Gravity loads on the E–W shear wall (SW2). At the roof level:
Direct load on wall:
2 ftR � (20 psf ) (12 ft) � 240 lbD � �2(truss spacing)(wall length)
2 ftR � (40 psf ) (12 ft) � 480 lb� �S 2
W � (10 psf )(10 ft) (12 ft) � 1200 lbD
(wall height)(wall length)
Reaction from left hand header (P(1)):
8 ft2 ftP � 20 psf � � � 80 lb� �D 22
truss spacing
2 ft 8 ftP � 40 psf � � � 160 lb� �S 2 2
truss spacing
Reaction from right hand header (P(2)): Since there is no header on the right hand side of SW2,
P � 0D
P � 0S
At the second floor:
Direct load on wall:
2 ftR � (20 psf ) (12 ft) � 240 lbD � �2(joist spacing)(wall length)
2 ftR � (40 psf ) (12 ft) � 480 lb� �L 2
W � (10 psf )(10 ft) (12 ft) � 1200 lbD
(wall height)(wall length)
Reaction from left end header:
(trib. width) (half of girder length)
(16 ft/2 � 16 ft/2) (15 ft/2) 2Tributary area of header reaction � � 60 ft2
2P � (20 psf )(60 ft ) � 1200 lbD1
2P � (40 psf )(60 ft ) � 2400 lbL1
Reaction from right end header: There is no header on the right end; therefore,
P � 0D2
P � 0L2

234 � S T R U C T U R A L W O O D D E S I G N
See Figure 7.14.
FIGURE 7.14 Free-body diagram of SW2.
Design of wall sheathing for SW1. Unit shears:
F 854 lbr� � � � 72 lb/ft2 wall length 12 ft
F � F (854 lb � 1067 lb)r 2� � � � 160 lb/ft1 wall length 12 ft
The shear wall–fastening pattern could be different for each level, but both values are relatively low enoughsuch that a minimum plywood thickness and fastening pattern will be required. Plywood in. thick is selected3–8as a minimum practical size to allow flexibility in architectural finishes [cf. IBC Tables 2308.9.3(2) and2308.9.3(3)]. From IBC Table 2306.4.1 (see Figure 7.15), select -in.-thick Structural I CD–X, 8d nails at 6 in.3–8o.c. (panel edges) and 12 in. o.c. (panel field), minimum penetration � in., blocking required. �cap � 2303–18
plf.

V E R T I C A L D I A P H R A G M S U N D E R L A T E R A L L O A D S ( S H E A R W A L L S ) � 235
FIGURE 7.15 Partial view of IBC Table 2306.4.1 (SW1). (Adapted from Ref. 8.)
This value is valid only for wall framing with Douglas fir-larch or southern pine. For wall framing withother wood species, the values must be reduced in accordance with footnote (a). From NDS Table 11.3.2A, thespecific gravity of hem-fir wood species is
� � 0.43hem-fir
Adjusted shear capacity. The specific gravity adjustment factor from footnote (a) of IBC Table 2306.4.1 isgiven as
SGAF � 1 � (0.5 � G)
SGAF � 1 � (0.5 � 0.43) � 0.93hem-fir
� � (230 plf )(0.93) � 213 plfcap
Applying the 40% increase in capacity (per IBC Section 2306.4.1 for wind loads only) gives us
� � (213 plf )(1.4) � 299 plfcap
Comparing the actual with the allowable values, we have
� � 160 plf � � � 299 plf OK1 cap
Tension chord force, SW1. Isolating the upper level of the shear wall, and solving for T2 from the free-bodydiagram by summing moments about point D (Figure 7.16) yields
OM � (854 lb)(10 ft) � 8540 ft-lb2
12 ftRM � [(2160)(12)] � (4320 � 1200) � 59,040 ft-lb� � ��D2 2
OM � 0.6RM2 D2T � [from equation (7-3)]2 w
(8540) � (0.6)(59,040)� � �2240 lb (the minus sign indicates no net uplift)
12 ft

236 � S T R U C T U R A L W O O D D E S I G N
FIGURE 7.16 Tension chord force, SW1.
By referring back to Figure 7.13 for the complete loads, the maximum chord force at the ground level can bedetermined by summing moments about point B:
OM � [(854)(10 ft � 10 ft)] � [(1067)(10 ft)] � 27,750 ft-lb1
12 ftRM � [(2160 � 960)(12 ft)] � (4320 � 1920 � 1200 � 1200) � 89,280 ft-lb� � ��D1 2
OM � 0.6RM1 D1T � [from equation (7-4)]1 w
(27,750) � (0.6)(89,280)T � � �2152 lb (the minus sign indicates no net uplift)1 12 ft
Compression chord force, SW1. Referring back to Figure 7.16, and solving for C2 from the free-body diagramby summing moments about point C, and accounting for the R and W loads that are tributary to thecompression chord (stud spacing is 16 in. or 1.33 ft; see Figure 7.10):
1.33 ftRM � [(4320)(12 ft)] � (8640) � 57,600 ft-lb� � ��T2 2
OM � 8540 ft-lb (from tension chord force calculations)2
1.33 ftRM � [(2160)(12 ft)] � (4320 � 1200) � 29,600 ft-lb� � ��D2 2
0.75OM � RM � 0.75RM2 D2 T2C � [from equation (7.7)]2 w
(0.75)(8540) � 29,600 � (0.75)(57,600)� � 6601 lb
12 ft

V E R T I C A L D I A P H R A G M S U N D E R L A T E R A L L O A D S ( S H E A R W A L L S ) � 237
By referring back to Figure 7.13 for the complete loads, the maximum chord force at the ground level C1
can be determined by summing moments about point A:
1.33 ftRM � [(4320 � 1920)(12 ft)] � (8640 � 3840) � 83,200 ft-lb� � ��T1 2
OM � 27,750 ft-lb (from tension chord force calculations)1
RM � [(2160 � 960)(12 ft)]D1
1.33 ft� (4320 � 1920 � 1200 � 1200) � 43,200 ft-lb� � ��2
0.75OM � RM � 0.75RM1 D1 T1C � [from equation (7.8)]1 w
(0.75)(27,750) � 43,200 � (0.75)(83,200)� � 10,535 lb
12 ft
Design of wall sheathing for SW2. Unit shears:
F 3300 lbr� � � � 275 lb/ft2 wall length 12 ft
F � F 3300 lb � 3000 lbr 2� � � � 525 lb/ft1 wall length 12 ft
The shear wall–fastening pattern could be different for each level, but for simplicity only the unit shear in theground floor is considered.
From IBC Table 2306.4.1 (see Figure 7.17), select 15/32-in.-thick Structural I CD–X, 8d nails at 4 in.o.c. (panel edges) and 12 in. o.c. (panel field), minimum penetration � in., blocking required. �cap � 4303–18
plf.This value is valid only for wall framing with Douglas fir-larch or southern pine because IBC Table
2306.4.1 is based on these species of wood. From the previous SW1 wall sheathing design, we obtained thespecific gravity adjustment factor, SGAF, for hem-fir wood species as 0.93. Therefore,
FIGURE 7.17 Partial view of IBC Table 2306.4.1 (SW2). (Adapted from Ref. 8.)

238 � S T R U C T U R A L W O O D D E S I G N
� � (430 plf )(0.93) � 399 plfcap
Applying the 40% increase in capacity (per IBC Section 2306.4.1) yields
� � (399 plf )(1.4) � 559 plfcap
Comparing the actual with the allowable values, we have
� � 525 plf � � � 559 plf OK1 cap
Tension Chord Force, SW2. Isolating the upper level of the shear wall and solving for T2 from the free-bodydiagram by summing moments about point C (Figure 7.18) yields
FIGURE 7.18 Tension chord force, SW2.
OM � (3300)(10 ft ) � 33,000 ft-lb2
12 ftRM � (240 � 1200) � 8640 ft-lb� � ��D2 2
OM � 0.6RM2 D2T � [from equation (7-3)]2 w
(33,000) � (0.6)(8640)� � 2318 lb (net uplift)
12 ft
By referring back to Figure 7.14 for the complete loads, the maximum chord force in wall SW2 at the groundlevel can be determined by taking a summation of moments about point A (since gravity loads are minimized;see Section 7.2):
OM � [(3300)(10 ft � 10 ft)] � [(3000)(10 ft)] � 96,000 ft-lb1
12 ftRM � (240 � 240 � 1200 � 1200) � 17,280 ft-lb� � ��D1 2
OM � 0.6RM1 D1T � [from equation (7.4)]1 w
(96,000) � (0.6)(17,280)� � 7136 lb (net uplift)
12 ft

V E R T I C A L D I A P H R A G M S U N D E R L A T E R A L L O A D S ( S H E A R W A L L S ) � 239
Compression chord force, SW2. Referring back to Figure 7.18, and solving for C2 from the free-body diagramby summing moments about point D (yields higher forces than summing moments about C ) and accounting forthe R and W loads that are tributary to the compression chord (stud spacing is 16 in. or 1.33 ft; see Figure7.10); we obtain
1.33 ftRM � (480) � 160(12 ft) � 2240 ft-lb� � ��T2 2
OM � 33,000 ft-lb (from tension chord force calculations)2
1.33 ftRM � (240 � 1200) � 80(12 ft) � 1920 ft-lb� � ��D2 2
0.75OM � RM � 0.75RM2 D2 T2C � [from equation (7.7)]2 w
(0.75)(33,000) � 1920 � (0.75)(2240)� � 2363 lb
12 ft
By referring back to Figure 7.14 for the complete loads, the maximum chord force at the ground level canbe determined by taking a summation of moments about point B (since the compression chord force ismaximized):
1.33 ftRM � [(2400 � 160)(12 ft)] � (480 � 480) � 31,360 ft-lb� � ��T1 2
OM � 96,000 ft-lb (from tension chord force calculations)1
1.33 ftRM � [(1200 � 80)(12 ft)] � (240 � 240 � 1200 � 1200) � 17,280 ft-lb� � ��D1 2
0.75OM � RM � 0.75RM1 D1 T1C � [from equation (7.8)]1 w
(0.75)(96,000) � 17,280 � (0.75)(31,360)� � 9400 lb
12 ft
TABLE 7.1 Summary of Shear Wall Chord Design (lb), Example 7.2
Level 2
V2 T2 C2
Ground Level
V1 T1 C1
SW1 854 �2,240a 6,601 1,921 �2,152a 10,535SW2 3,300 2,318 2,363 6,300 7,136 9,400
aA negative value actually indicates net compressive force; theoretically, hold-down anchors would not be required.
The shear wall chord design is summarized in Table 7.1. The chord members can now be designed for theworst-case tension and compression forces (see examples in Chapter 8).
Connection design. A connection between the upper shear wall and the lower shear wall to resist the netuplift at the second floor is required. From the chord design,
T � 2318 lb2max

240 � S T R U C T U R A L W O O D D E S I G N
A steel strap is selected to span across the floor framing and tie the upper shear wall chord to the lower shearwall chord (Figure 7.19). A preengineered connector could be selected from a manufacturer’s catalog (using aload duration factor of 1.6 or 160%), which is common in practice. A design example using a steel strap isprovided in Chapter 9.
FIGURE 7.19 Hold-downstrap.
A connection between the lower shear wall and the foundation to resist the net uplift at the ground floor isrequired. From the chord design, T1max � 7136 lb. A preengineered connector (Figure 7.20) and the requiredembedment into the concrete foundation could be selected from a manufacturer’s catalog (using a load durationfactor of 1.6 or 160%), which is common in practice. The actual design of the hold-down anchor andembedment involves principles of steel and concrete design which is beyond the scope of this book. It shouldbe noted that steel anchors loaded in tension should be deformed or hooked (i.e., not smooth) in order toengage the concrete properly.
FIGURE 7.20 Hold-down anchor types.
The uplift connectors are typically provided at both ends of the shear wall since the lateral loads can act inthe reverse direction. The tension chord members need to be checked for stresses due to the tension chordforce, T1 and T2, in addition to the bending moment (T1e and T2e) resulting from the eccentricity e of thehold-down anchors (see Figure 7.21). Use the net area of the chord member to account for the bolt holesrequired for the hold-down or tie-down anchors.
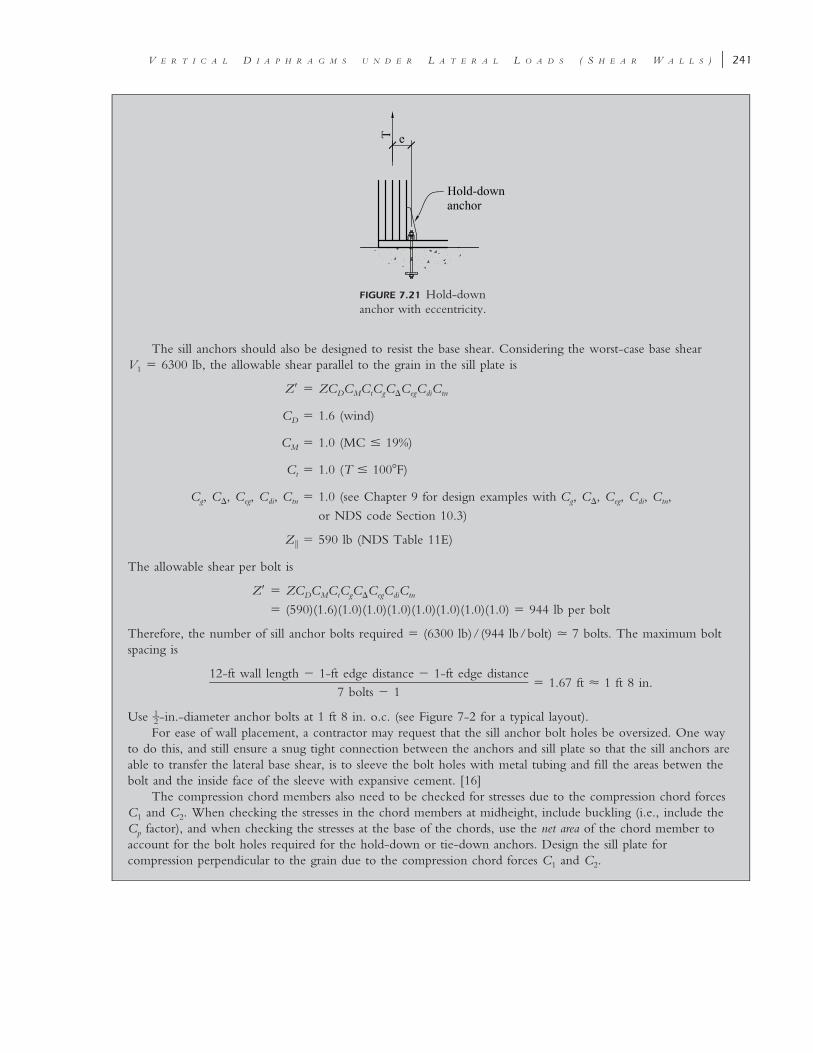
V E R T I C A L D I A P H R A G M S U N D E R L A T E R A L L O A D S ( S H E A R W A L L S ) � 241
FIGURE 7.21 Hold-downanchor with eccentricity.
The sill anchors should also be designed to resist the base shear. Considering the worst-case base shearV1 � 6300 lb, the allowable shear parallel to the grain in the sill plate is
Z� � ZC C C C C C C CD M t g � eg di tn
C � 1.6 (wind)D
C � 1.0 (MC � 19%)M
C � 1.0 (T � 100�F)t
C , C , C , C , C � 1.0 (see Chapter 9 for design examples with C , C , C , C , C ,g � eg di tn g � eg di tn
or NDS code Section 10.3)
Z � 590 lb (NDS Table 11E)�
The allowable shear per bolt is
Z� � ZC C C C C C C CD M t g � eg di tn
� (590)(1.6)(1.0)(1.0)(1.0)(1.0)(1.0)(1.0)(1.0) � 944 lb per bolt
Therefore, the number of sill anchor bolts required � (6300 lb)/(944 lb/bolt) � 7 bolts. The maximum boltspacing is
12-ft wall length � 1-ft edge distance � 1-ft edge distance� 1.67 ft 1 ft 8 in.
7 bolts � 1
Use -in.-diameter anchor bolts at 1 ft 8 in. o.c. (see Figure 7-2 for a typical layout).1–2For ease of wall placement, a contractor may request that the sill anchor bolt holes be oversized. One way
to do this, and still ensure a snug tight connection between the anchors and sill plate so that the sill anchors areable to transfer the lateral base shear, is to sleeve the bolt holes with metal tubing and fill the areas betwen thebolt and the inside face of the sleeve with expansive cement. [16]
The compression chord members also need to be checked for stresses due to the compression chord forcesC1 and C2. When checking the stresses in the chord members at midheight, include buckling (i.e., include theCp factor), and when checking the stresses at the base of the chords, use the net area of the chord member toaccount for the bolt holes required for the hold-down or tie-down anchors. Design the sill plate forcompression perpendicular to the grain due to the compression chord forces C1 and C2.

242 � S T R U C T U R A L W O O D D E S I G N
EXAMPLE 7.3
Difference in Shear Wall Capacity for Wind and Seismic Design
A 3-ft-long � 8-ft-tall shear wall panel has the following design parameters:
-in. plywood sheathing with 8d nails at 4 in. o.c. [edge nailing (EN)] and 12 in. o.c. [field nailing (FN)]3–8on the outside face.
in. Gypsum wall board (GWB) on the inside face of the wall. The GWB is unblocked and fastened per1–2IBC Table 2306.4.5 with an allowable unit shear capacity of 100 plf.
Determine the allowable unit shear capacity of the shear wall panel for both wind and seismic designs.
Solution: Wall aspect ratio � 8 ft/3 ft � 2.67.
� 3.5 OK for wind design� 2.0 Not OK for seismic design unless the allowable unit shear from IBC Table 2306.4.1 is multiplied
by 2w/h
Allowable unit shear for -in. plywood (8d nails at 4 in. EN; 12 in. o.c. FN) � 320 plf (IBC Table 2306.4.1).3–8The allowable unit shear of GWB � 100 plf (IBC Table 2306.4.5).
Wind design:
• IBC Section 2306.4.1 allows a 40% increase in the unit shear capacities from IBC Table 2306.4.1.• IBC Section 2305.3.9 allows the addition of the unit shear capacity of walls of dissimilar materials when
designing for wind loads.
Total allowable unit shear of wall � (1.40)(320 plf ) � 100 plf � 548 plf
Seismic design:
• Addition of unit shear capacities of dissimilar materials is not allowed by the IBC for seismic design.Consequently, only the plywood sheathing will be considered since it has the higher shear capacity.
• Since the aspect ratio of 2.67 exceeds 2.0, the unit shear capacity from IBC Table 2306.4.1 must bemultiplied by 2w/h.
(2)(3 ft)Total allowable unit shear of wall � (320 plf ) � 240 plf
(8 ft)
Note: From the results above, the allowable unit shear for the shear wall panel is more than twice as highfor wind design as it is for seismic design. Although the wind load may have been the controlling load for thisbuilding, the shear capacity under seismic loads is quite low compared to the capacity under wind loads whichindicates that checking this building and shear wall panel for seismic loads is also necessary. This example pointsto the need to compare not only the wind and seismic loads but also the respective shear capacities of the shearwall under both loading conditions. The importance of this difference in shear wall capacities has beenhighlighted in Ref. 14.
7.4 COMBINED SHEAR AND UPLIFT IN WALL SHEATHING
In high wind areas of the country, several hold-down anchors may be required between floorsto resist the uplift due to wind loads, and this can often lead to increased cost and there mayalso be nailing interference because of the relatively large number of fasteners that may berequired for these anchor devices. In lieu of providing hold-down straps between floors (seeFigure 7.19) to resist uplift loads, the exterior sheathing can be fastened in such a way to createa vertical plywood panel splice across the floor to transfer the uplift force. Figure 7.22 illustratestwo possible details that can be used for this condition. In both cases, nails are added to resistthe uplift force in addition to the nails required for shear.
The detail shown in Figure 7.22a should be used where the rim joist is sawn lumber or anylumber that is susceptible to shrinkage. The exterior sheathing is pre-engineered and is generally

V E R T I C A L D I A P H R A G M S U N D E R L A T E R A L L O A D S ( S H E A R W A L L S ) � 243
EXAMPLE 7.4
Combined Shear and Uplift in a Shear Wall
A -inch exterior shear wall panel is subjected to a uniform uplift of 375 plf. The wall framing is 2x6 studs at3–816 in. o.c. and the lumber is Hem-Fir No. 2. The floor framing is pre-engineered I-joists. Determine if thepanel is adequate for combined shear and uplift and determine an appropriate nailing pattern if the exteriorsheathing is used as a lap splice assuming that the splice detail shown in Figure 7.22 is used. Assume normaltemperature and moisture conditions.
dry when it is installed, whereas sawn lumber will have some water content at the time ofinstallation and will shrink over time. The exterior sheathing and plywood shim should have aclear distance of about � at the ends to allow for shrinkage. The shim should also be made from1–2the same material and have the same thickness and orientation as the exterior sheathing. Fur-thermore, the plywood shim acts to transfer the tension force since sawn lumber has very littlecapacity when loaded perpendicular to the grain. When an OSB or plywood rim joist is used,then a shim is not required since these products are not susceptible to shrinkage and havesufficient tension capacity when loaded in this manner.
The detail shown in Figure 7.22b should be used when the rim joist is a pre-engineered I-joist or LVL since shrinkage in sawn lumber would likely cause the exterior sheathing to bucklein this case.
Using the exterior sheathing to support both uplift and in-plane shear creates a situationwhere the sheathing and fasteners are subjected to combined loading. However, the shear ca-pacity of a shear wall is controlled by the fasteners such that it is generally difficult to add enoughfasteners so that the sheathing fails. Therefore, the design approach taken here will be two-fold:limit the tension in the sheathing due to uplift to a reasonably low value and add fasteners toresist the uplift in addition to the fasteners required for lateral shear.
The American Plywood Association (APA) [17] recommends that the uplift on the sheathingshould not exceed 1,000 plf for inch panels and 1,500 plf for inch panels and larger. These3 7– ––8 16
values are approximated from the tensile capacity of the panels using the Wood Structural PanelsSupplement [15] or the Panel Design Specification [5] as follows:
From Table 3.2—Wood Structural Panels Supplement (or Table 4A of the Panel DesignSpecification):
3–F A � 600 plf ( for inch panels)t 8
7––F A � 990 plf ( for inch panels)t 16
These values are applicable to panels installed horizontally, that is panels which have theirlong direction perpendicular to the wall studs. When the long axis of the panel is orientedparallel to the wall studs, the allowable tension is much higher, so a conservative (horizontal)orientation has been assumed for the panels. Applying a load duration factor of CD � 1.6 to thedesign tension values above yields allowable uplift load on plywood panels as
3–F A � (1.6)(600 plf ) � 960 plf ( for inch panels)t 8
7––F A � (1.6)(990 plf ) � 1584 plf ( for inch panels)t 16
These values are reasonably close to the APA [16] recommended values of 1,000 plf and1,500 plf for inch and -inch panels, respectively. Panels thicker than inch are limited to3 7 7– –– ––8 16 16
1,500 plf for uplift. It should be noted that these uplift limits are generally conservative for mostwood framed buildings.
For the fasteners, the extra nails should be uniformly distributed to each wall stud or intothe rim joist as shown in Figure 7.22. The design of fasteners is covered in greater detail inChapter 8, but a brief overview of the fastener design is illustrated in the following example toshow the full scope of the design requirements of a plywood vertical lap splice.

244 � S T R U C T U R A L W O O D D E S I G N
Solution:The maximum recommended uplift is 1,000 plf for a -inch panel which is greater than the applied uplift of3–8375 plf, so the panel is adequate in combined shear and uplift.
The allowable tension in the studs needs to be checked. From NDS Table 4A, the following is obtainedfor 2x6 Hem-Fir No. 2 studs:
F � 525 psit
C � 1.6 (wind loads)D
C � 1.0i
C � 1.3F2A � 8.25 in.
F� � F C C C C Ct t D M t F i
� 525 � 1.6 � 1.0 � 1.0 � 1.3 � 1.0 � 1092 psi2T � F�A � (1092 psi)(8.25 in. ) � 9009 lb.max t
Using a stud spacing of 16 in., the uplift force on each stud is:
16 in.(375 plf ) � 500 lb � T � 9009 lb.� � max12
Therefore, the studs are adequate to resist the uplift force.For the fasteners, 8d common nails will be assumed. From NDS Table 11Q using ts � inch (i.e.3–8
plywood thickness), the allowable shear per nail is Z � 66 lb. Applying the load duration factor, which is theonly adjustment factor that applies in this case per NDS Table 10.3.1, yields:
Z� � ZCD � (66 lb)(1.6) � 105 lb/nail
Using a tension force of 500 lb per stud, the required number of fasteners per stud is:
500� 4.73 5 nails each side of the splice
105
From NDS Table L4: The length, L and the diameter of 8d common nails is,
L � 2.5 in.D � 0.131 in.
FIGURE 7.22 Uplift detail using exterior sheathing.

V E R T I C A L D I A P H R A G M S U N D E R L A T E R A L L O A D S ( S H E A R W A L L S ) � 245
Minimum spacing (see Table 8-1 and Table 8-2):
end distance � 15D � 1.96 in. ⇒ 2.0 in.
edge distance � 2.5D � 0.33 in. ⇒ 0.75 in. provided, centered in stud
center-center spacing � 15D � 1.96 in. ⇒ 2.0 in.
minimum p � 10D � 1.31 in. ⇒ approx. 2 in. provided
From Figure 7-22b, 5 nails would be required into each stud above and below the floor framing. Thesenails would be in addition to the nails required for shear.
REFERENCES
1. ANSI/AF&PA, (2001), Allowable Stress Design Manual for Engineered Wood Construction, AmericanForest & Paper Association, Washington, DC.
2. ANSI/AF&PA, (2005), National Design Specification Supplement: Design Values for Wood Construc-tion, American Forest and Paper Association, Washington, DC.
3. APA (2001), Engineered Wood Construction Guide, APA—The Engineered Wood Association,Tacoma, WA.
4. APA (2004), Diaphragms and Shear Walls: Design/Construction Guide, APA—The EngineeredWood Association, Tacoma, WA.
5. APA (1998), Plywood Design Specification, APA—The Engineered Wood Association, Tacoma,WA.
6. ASCE (2005), Minimum Design Loads for Buildings and Other Structures, ASCE-7, American Societyof Civil Engineers, Reston, VA.
7. GA (1996), Shear Values for Screw Application of Gypsum Board on Walls, GA-229-96, GypsumAssociation, Washington, DC.
8. ICC (2006), International Building Code, International Codes Council, Falls Church, VA.9. Faherty, Keith F., and Williamson, Thomas G. (1989), Wood Engineering and Construction,
McGraw-Hill, New York.10. Halperin, Don A., and Bible, G. Thomas (1994), Principles of Timber Design for Architects and
Builders, Wiley, New York.11. Stalnaker, Judith J., and Harris, Earnest C. (1997), Structural Design in Wood, Chapman & Hall,
London.12. Breyer, Donald et al. (2003), Design of Wood Structures—ASD, 5th Ed., McGraw-Hill, New York.13. Tarpy, Thomas S., Thomas, David J., and Soltis, Lawrence A. (1985), Continuous timber dia-
phragms, J. Struct. Div. ASCE 111(5): 992–1002.14. Beebe, Karyn (2006), Enhanced lateral design with wood structural panels, Struct. Eng., March.15. ANSI/American Forest & Paper Association, (2001), Wood Structural Panels Supplement, AF&PA,
Washington, DC.16. Knight, Brian (2006), High Rise Wood Frame Construction—Cornerstone Condominiums,
STRUCTURE, pp. 68–70, June.17. APA—The Engineered Wood Association (2005), Using Wood Structural Panels for Combined
Uplift and Shear Resistance, Tacoma, WA.
PROBLEMS
7.1 For the building plan shown in Figure 7.23 and based on the following given information:Wall framing is 2 � 6 at 16 in. o.c., hem-fir, Select Structural.Normal temperature and moisture conditions apply.Roof dead load � 15 psf, wall dead load � 10 psf, snow load Pf � 40 psf.
Floor-to-roof height � 18 ft.Consider loads in the N–S direction only.
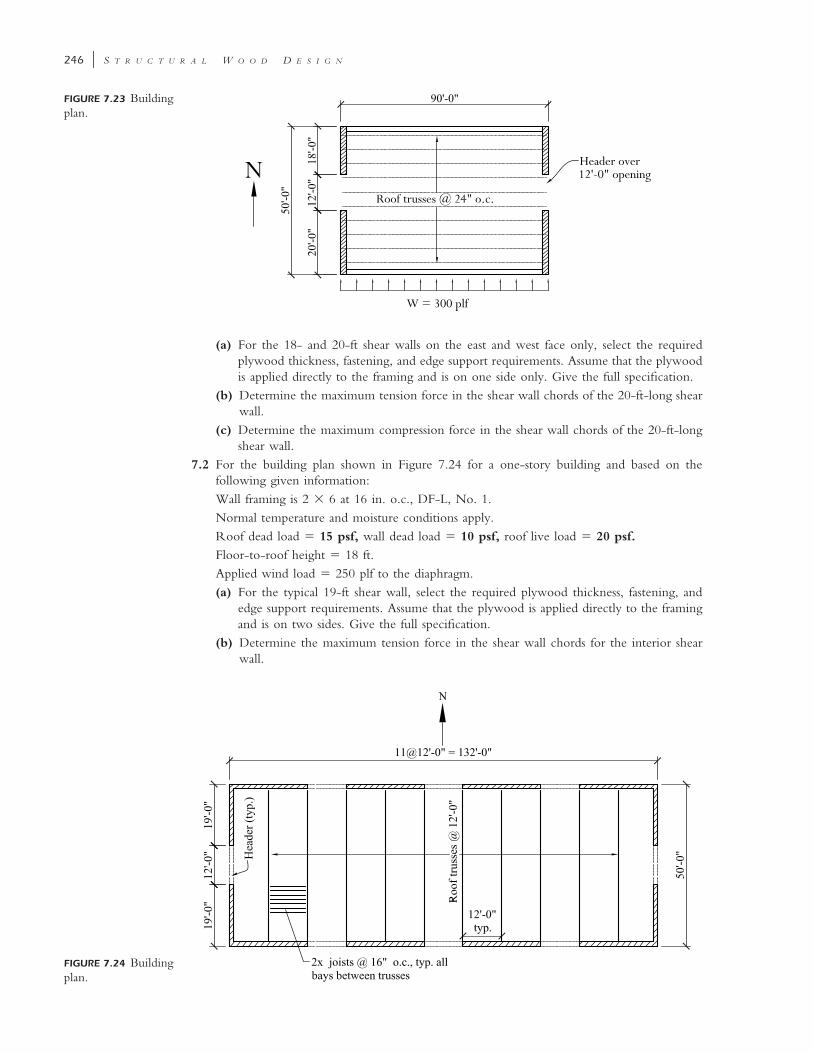
246 � S T R U C T U R A L W O O D D E S I G N
FIGURE 7.23 Buildingplan.
FIGURE 7.24 Buildingplan.
(a) For the 18- and 20-ft shear walls on the east and west face only, select the requiredplywood thickness, fastening, and edge support requirements. Assume that the plywoodis applied directly to the framing and is on one side only. Give the full specification.
(b) Determine the maximum tension force in the shear wall chords of the 20-ft-long shearwall.
(c) Determine the maximum compression force in the shear wall chords of the 20-ft-longshear wall.
7.2 For the building plan shown in Figure 7.24 for a one-story building and based on thefollowing given information:Wall framing is 2 � 6 at 16 in. o.c., DF-L, No. 1.Normal temperature and moisture conditions apply.Roof dead load � 15 psf, wall dead load � 10 psf, roof live load � 20 psf.
Floor-to-roof height � 18 ft.Applied wind load � 250 plf to the diaphragm.(a) For the typical 19-ft shear wall, select the required plywood thickness, fastening, and
edge support requirements. Assume that the plywood is applied directly to the framingand is on two sides. Give the full specification.
(b) Determine the maximum tension force in the shear wall chords for the interior shearwall.

V E R T I C A L D I A P H R A G M S U N D E R L A T E R A L L O A D S ( S H E A R W A L L S ) � 247
(c) Determine the maximum compression force in the shear wall chords for the interiorshear wall.
(d) Select an appropriate anchor rod layout to resist the lateral loads applied.7.3 Determine the allowable unit shear capacity for a shear wall panel under both wind and
seismic loads assuming the following design parameters: exterior face of wall: -in. plywood15––32
with 8d nails at 4 in. o.c. (EN); 12 in. o.c. (FN) interior face of wall; GWB with allowableunit shear of 175 plf.
7.4 Determine the allowable unit shear capacity for a shear wall panel under both wind andseismic loads assuming the following design parameters: exterior face of wall: -in. plywood15––32
with 8d nails at 4 in. o.c. (EN); 12 in. o.c. (FN) interior face of wall: -in. plywood with3–88d nails at 4 in. o.c. (EN); 6 in. o.c. (FN).
7.5 Design a plywood lap splice between floors using sawn lumber with 2 � 6 wall studs at 16in. o.c. and in. wall sheathing for a net uplift of 600 plf. Stud spacing is 16 in., and7––16
lumber is DF-L No. 1. Sketch your design.

248
c h a p t e r e i g h t
CONNECTIONS
8.1 INTRODUCTION
Connections within any structure are usually very small relative to the supported members butthey are a very critical component in the load path. Beams and other major structural membersare only as strong as their connectors. In practice, the design of connections is oftentimes over-looked and is thus delegated by default to either someone preparing shop drawings or to thebuilder in the field. Although this process typically results in a structure with adequate connec-tions, proper attention to the design and detailing of connections can help limit the amount offield-related problems.
In practice, the designer has three basic options for connections:
1. Use a preengineered connector. Several proprietary products are available, and each manufac-turer usually makes available a catalog detailing each connector with a corresponding loadcapacity. The manufacturer usually also indicates the required placement of nails, screws,or bolts required for each connector. This is the least costly option from a design stand-point and is often the preferred method from the builder’s standpoint.
2. Use the design equations in the NDS code. This can be a tedious process that is best carriedout with the aid of a computer software. This method requires adequate detailing to en-sure that the connectors are placed properly in the field.
3. Use the connector capacity tables in the NDS code. Several tables are provided in the NDScode for various connectors and conditions and are based on the equations in the NDScode. Occasionally, conservative assumptions must be made for loading conditions notcontained in the tables, but they are not as tedious as using the equations directly.
Several types of connectors are available, but the following connector types will be coveredin this book since they are the most commonly used: (1) bolts (Table L1), (2) lag screws (TableL2), (3) wood screws (Table L3), and (4) nails (Table L4). The tables indicated are found in theappendix of the NDS code [7]. These tables list the various dimensional characteristics of eachconnector type. Bolts have the highest strength but require the most labor. Conversely, nailsgenerally have the lowest strength but require the least labor and equipment. Figure 8.1 illustrateseach of these connector types.
Bolts are greater than in. in diameter and are installed completely through the connected1–4members through predilled holes that are at least in. greater in diameter than the bolt, but1––32
less than in. (NDS code Section 11.1.2.2). Bolts are not permitted to be forcibly driven.1––16
Lag screws are greater than in. in diameter and are installed into a wood member. Lag1–4screws typically have a threaded and a smooth portion (see Figure 8.12). The NDS code givesthe required diameter of clearance holes and lead holes for installing lag screws to prevent splittingof the wood member during construction (NDS code Section 11.1.3.2). The clearance hole is thearea around the unthreaded shank and should have the same diameter and length as the un-threaded shank. The lead hole is the area around the threaded portion of the shank. The diameterof the lead hole is generally smaller than the diameter of the shank, depending on the specificgravity of the wood.
Structural Wood Design: A Practice-Oriented Approach Using the ASD Method. Abi Aghayere and Jason VigilCopyright © 2007 John Wiley & Sons, Inc.
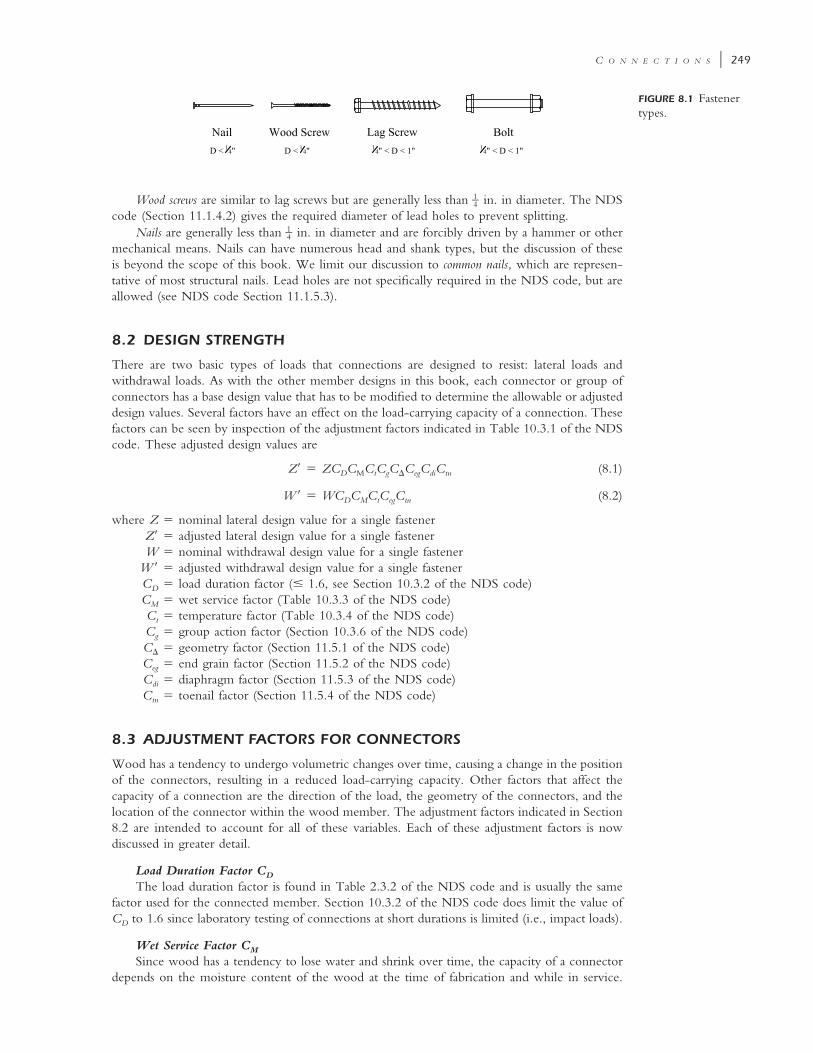
C O N N E C T I O N S � 249
FIGURE 8.1 Fastenertypes.
Wood screws are similar to lag screws but are generally less than in. in diameter. The NDS1–4code (Section 11.1.4.2) gives the required diameter of lead holes to prevent splitting.
Nails are generally less than in. in diameter and are forcibly driven by a hammer or other1–4mechanical means. Nails can have numerous head and shank types, but the discussion of theseis beyond the scope of this book. We limit our discussion to common nails, which are represen-tative of most structural nails. Lead holes are not specifically required in the NDS code, but areallowed (see NDS code Section 11.1.5.3).
8.2 DESIGN STRENGTH
There are two basic types of loads that connections are designed to resist: lateral loads andwithdrawal loads. As with the other member designs in this book, each connector or group ofconnectors has a base design value that has to be modified to determine the allowable or adjusteddesign values. Several factors have an effect on the load-carrying capacity of a connection. Thesefactors can be seen by inspection of the adjustment factors indicated in Table 10.3.1 of the NDScode. These adjusted design values are
Z� � ZC C C C C C C C (8.1)D M t g � eg di tn
W� � WC C C C C (8.2)D M t eg tn
where Z � nominal lateral design value for a single fastenerZ� � adjusted lateral design value for a single fastenerW � nominal withdrawal design value for a single fastener
W� � adjusted withdrawal design value for a single fastenerCD � load duration factor (� 1.6, see Section 10.3.2 of the NDS code)CM � wet service factor (Table 10.3.3 of the NDS code)Ct � temperature factor (Table 10.3.4 of the NDS code)Cg � group action factor (Section 10.3.6 of the NDS code)C� � geometry factor (Section 11.5.1 of the NDS code)Ceg � end grain factor (Section 11.5.2 of the NDS code)Cdi � diaphragm factor (Section 11.5.3 of the NDS code)Ctn � toenail factor (Section 11.5.4 of the NDS code)
8.3 ADJUSTMENT FACTORS FOR CONNECTORS
Wood has a tendency to undergo volumetric changes over time, causing a change in the positionof the connectors, resulting in a reduced load-carrying capacity. Other factors that affect thecapacity of a connection are the direction of the load, the geometry of the connectors, and thelocation of the connector within the wood member. The adjustment factors indicated in Section8.2 are intended to account for all of these variables. Each of these adjustment factors is nowdiscussed in greater detail.
Load Duration Factor CD
The load duration factor is found in Table 2.3.2 of the NDS code and is usually the samefactor used for the connected member. Section 10.3.2 of the NDS code does limit the value ofCD to 1.6 since laboratory testing of connections at short durations is limited (i.e., impact loads).
Wet Service Factor CM
Since wood has a tendency to lose water and shrink over time, the capacity of a connectordepends on the moisture content of the wood at the time of fabrication and while in service.

250 � S T R U C T U R A L W O O D D E S I G N
Wood that is dry, or wood with a moisture content below 19% does not result in a reducedconnection capacity and CM � 1.0. For wood with a moisture content greater than 19% eitherat the time of fabrication or while in service, refer to Table 10.3.3 of the NDS code for the CM
factor.
Temperature Factor Ct
While the temperature range for most wood-framed buildings is such that the connectioncapacity does not have to be reduced, Table 10.3.4 of the NDS code gives the values for Ct forvarious temperature ranges.
Group Action Factor Cg
When a series of fasteners aligned in a row are loaded, the load distribution to each fasteneris not equal. The group action factor accounts for this condition. The group action factor doesnot apply to smaller-diameter fasteners (D � in.). Note that a row is defined as a group of1–4fasteners aligned and loaded parallel to the grain. The value of Cg is defined in Section 10.3.6of the NDS code as follows (NDS code Equation 10.3–1):
2nm(1 � m ) 1 � REAC � (8.3)g n 2nn[(1 � R m )(1 � m) � 1 � m )] 1 � mEA
where n � number of fasteners in a row
�REA the lesser of (8.4)E A E As s m morE A E Am m s s
(see Figure 8.10 for main and side member description)Em � modulus of elasticity of the main member, psiEs � modulus of elasticity of the side member, psi
Am � gross cross-sectional area of the main member, in2
As � sum of the gross cross sectional areas of the side member, in2
m � u � (8.5)2�u � 1
u � 1 � � (8.6)s 1 1
�� �2 E A E Am m s s
s � center-to-center spacing between adjacent fasteners in a row� � load/slip modulus for a connection, lb/in. (8.7)
� 180,000D1.5 for dowel-type fasteners in wood-to-wood connections� 270,000D1.5 for dowel-type fasteners in wood-to-metal connections
D � diameter of fastener, in.
It can be seen by inspection that the group action factor is a function of the number offasteners, the stiffness of the main and side members, the spacing of the fasteners, the slip modulus,and the diameter of the fasteners. It can also be seen that the equation is rather tedious. TheNDS code does give the value of Cg for various connection geometries in Tables 10.3.6Athrough 10.3.6D. Example 8.1 illustrates that use of the tables as a reasonable alternative to usingthe equation for most cases.
FIGURE 8.2 Splitting due to inadequate fastenerspacing.
Geometry Factor C�
Connectors with inadequate spacing have a tendency to split (seeFigure 8.2); thus, to maximize the load-carrying capacity of a connec-tion, the designer must consider the geometry of the connection. Thegeometry factor applies to all connectors greater than in. in diameter1–4and is a function of the following: edge distance, end distance, center-to-center spacing, and row spacing. For connectors with D � in.,1–4C� � 1.0, but minimum spacing requirements must be met. For con-nectors with D � in., the NDS code indicates that the spacing ‘‘shall1–4be sufficient to prevent splitting of the wood’’ (see Sections 11.1.4.7and 11.1.5.6 of the NDS code). Although this is too vague for any
direct application, there is sufficient guidance given in the NDS commentary (C11.1.4.7 andC11.1.5.6) relative to the spacing requirements for small-diameter connectors, as summarized in

C O N N E C T I O N S � 251
TABLE 8.1 Recommended Minimum Spacing Requirements for Connectors with D � in.1–4
Type of Loadinga
Minimum Spacing for Connection Configuration:
Wood SideMemberWithout
Prebored Holes
Wood SideMember with
Prebored Holesor Steel Side
Plates WithoutPrebored Holes
Steel Side Plateswith Prebored
Holes
End distance � to grain, tension 15D 10D 5D� to grain, compression 10D 5D 3D
Edge distance Any 2.5D 2.5D 2.5D
Center-to-centerspacing(pitch)
� to grain� to grain
15D10D
10D5D
5D2.5D
Row spacing(gage)
StaggeredIn-line
2.5D5D
2.5D3D
2.5D2.5D
a � � parallel to the grain� � perpendicular to the grain
Table 8.1. It can be seen from the table that having prebored holes reduces the spacing required,because the prebored hole reduces the possibility of splitting when the fastener is installed.
There is also a required minimum penetration into the main member for screws and nailsthat must be met (NDS code Section 11.1), as well as a required minimum penetration to achievethe full design value. The design value for a connector that has a penetration depth less than thefull design penetration is multiplied by p/8D for lag screws and p/10D for wood screws ornails. The minimum penetration allowed by the NDS code is 4D for lag screws and 6D forwood screws and nails (see Table 8.2).
For larger-diameter connectors (D � in.), there are two options for spacing:1–4
1. Meet the base spacing requirements for the full design value of the connector; for thiscase, C� � 1.0.
2. Provide a reduced spacing that is less than the base spacing required for the maximumdesign value, but greater than the code minimum. For this case,
spacing providedC �� base spacing for maximum design value
The NDS code provides values for both the base spacing and minimum spacing for allof the following parameters: edge distance, end distance, center-to-center spacing, and rowspacing. There is a unique value for C� for each of these four spacing requirements. TheC� used for design is the smallest value obtained from these unique values. Table 8.3 sum-marizes the base spacing and minimum spacing requirements for larger-diameter connectors.
End Grain Factor Ceg
When fasteners are oriented parallel to the grain of a wood member, the connection capacityis reduced. This is the case when fasteners are inserted into the end grain of a member (seeFigure 8.3). For withdrawal loads W, lag screws have an end grain factor of Ceg � 0.75. Woodscrews and nails have virtually no capacity in withdrawal when loaded in the end grain of amember and thus are not permitted. For lateral loads Z, both nails and screws are adjusted byCeg � 0.67.
Diaphragm Factor Cdi
The capacity of a wood diaphragm is a function of the connector type and spacing and iscovered in Chapter 6. The capacity of a diaphragm can be found in other references (such asIBC Table 2306.3.1); however, there may be conditions where the diaphragm capacity has to

252 � S T R U C T U R A L W O O D D E S I G N
TABLE 8.2 Minimum Penetration Values for VariousConnectors
Connector pmin (reduced) pmin (full)
Lag screws 4D 8D
Wood screws 6D 10D
Nails 6D 10D
TABLE 8.3 Minimum Spacing Requirements for Connectors with D � in.a1–4
Type of Loading
Minimum Spacing
Reduced Full (Base)
End distance � to grain 2D 4D� to grain, compression 2D 4D� to grain, tension (softwood) 3.5D 7D� to grain, tension (hardwood) 2.5D 5D
Edge distance � to grain, l/D � 6 N/A 1.5D� to grain, l/D � 6 N/A 1.5D or row span1–2
(whichever is greater)� to grain, loaded edge N/A 4D� to grain, unloaded edge N/A 1.5D
Center-to-center spacing � to grain 3D 4D� to grain N/A 3D
Row spacing � to grain N/A 1.5D� to grain, l/D � 2 N/A 2.5D� to grain, 2 � l/D � 6 N/A (5l � 10D) /8� to grain, l/D � 6 N/A 5D
l /D (bolt slenderness) is the smaller of lm /D or ls /D.lm � length of the fastener in wood main member.ls � total length of fastener in wood side member(s).D � diameter of the fastener.l � length of the fastener.
FIGURE 8.3 End grain loading. FIGURE 8.4 Toenail connection geometry.
be calculated directly. For this case the capacity of the connectors is multiplied by Cdi � 1.1.This factor applies only to wood panels attached to framing members. It does not apply to otherconnectors in the load path, such as drag struts or chords.
Toenail Factor Ctn
Section 11.1.5.4 of the NDS code gives the geometric configuration of a toenail connection(see Figure 8.4). This is the optimal configuration to prevent the side member from splittingvertically. Toenail connections are typically used where the loads are minimal, such as a beamto sill plate, stud to sill plate, or blocking to a beam (see Figure 8.5). For toenailed connectionsloaded in withdrawal (W ), Ctn � 0.67. Note that the wet service factor CM for toenailed con-nections loaded in withdrawal does not apply. For lateral loads (Z), Ctn � 0.83.

C O N N E C T I O N S � 253
FIGURE 8.5 Typicaltoenail connections.
EXAMPLE 8.1
Group Action Factor—Wood-to-Wood Connection
With reference to Figure 8.6, determine the group action factor Cg. Verify the results from the appropriateNDS table.
FIGURE 8.6 Group action factor: wood to wood.
Solution: From Equation 8.3:
2nm(1 � m ) 1 � REAC �g n 2nn[(1 � R m )(1 � m) � 1 � m )] 1 � mEA
For the case at hand,
E A E As s m mR � the lesser of or � 1.0EA E A E Am m s s
1.5 1.5� � 180,000D � (180,000)(0.5 ) � 63,640 (see Section 8.3)
s 1 1u � 1 � � �� �2 E A E Am m s s
4 in. 1 1� 1 � (63,640) � � 1.022� �� �6 62 (1.4 � 10 )(8.25) (1.4 � 10 )(8.25)
2m � u � �u � 1
2� (1.022) � �(1.022) � 1 � 0.811
n � 4 (number of fasteners in a row)
Then
(2)(4)(0.811)(1 � 0.811 ) 1 � 1.0C � � 0.979� �� �g 4 (2)(4)(4)[(1 � (1.0)(0.811) )(1 � 0.811) � 1 � (0.811) ] 1 � 0.811
From NDS Table 10.3.6A with As/Am � 1.0 and As � 8.25 in2, Cg � 0.94. This table is conservative forvalues of D less than 1 in., so the calculated value is consistent with the value obtained from the table. It is alsowithin 5%, so the use of the NDS table for design is appropriate.

254 � S T R U C T U R A L W O O D D E S I G N
EXAMPLE 8.2
Group Action Factor—Wood-to-Steel Connection
With reference to Figure 8.7, determine the group action factor Cg. Verify the results from the appropriateNDS table.
FIGURE 8.7 Group action factor: wood to steel.
Solution: From Equation 8.3:
2nm(1 � m ) 1 � REAC �g n 2nn[(1 � R m )(1 � m) � 1 � m ] 1 � mEA
For the case at hand,
E A E As s m mR � the lesser of orEA E A E Am m s s
(30)(0.25 � 4) (1.4)(13.75)� � 1.56 or � 0.642
(1.4)(13.75) (30)(0.25 � 4)
1.5 1.5� � 270,000D � (270,000)(1 ) � 270,000 (see Section 8.3)
s 1 1u � 1 � � �� �2 E A E Am m s s
4 in. 1 1� 1 � (270,000) � � 1.046� �� �6 62 (1.4 � 10 )(13.75) (30 � 10 )(0.25 � 4)
2m � u � �u � 1
2� (1.046) � �(1.046) � 1 � 0.739
n � 4 (number of fasteners in a row)
Then
(2)(4)(0.739)(1 � 0.739 ) 1 � 0.642C � � 0.912g 4 (2)(4)(4)[(1 � (0.642)(0.739) )(1 � 0.739) � 1 � 0.739 ] 1 � 0.739
From NDS Table 10.3.6C with Am/As � 13.75 and Am � 13.75 in2, Cg � 0.91 (by interpolation), thusverifying the value from the equation.
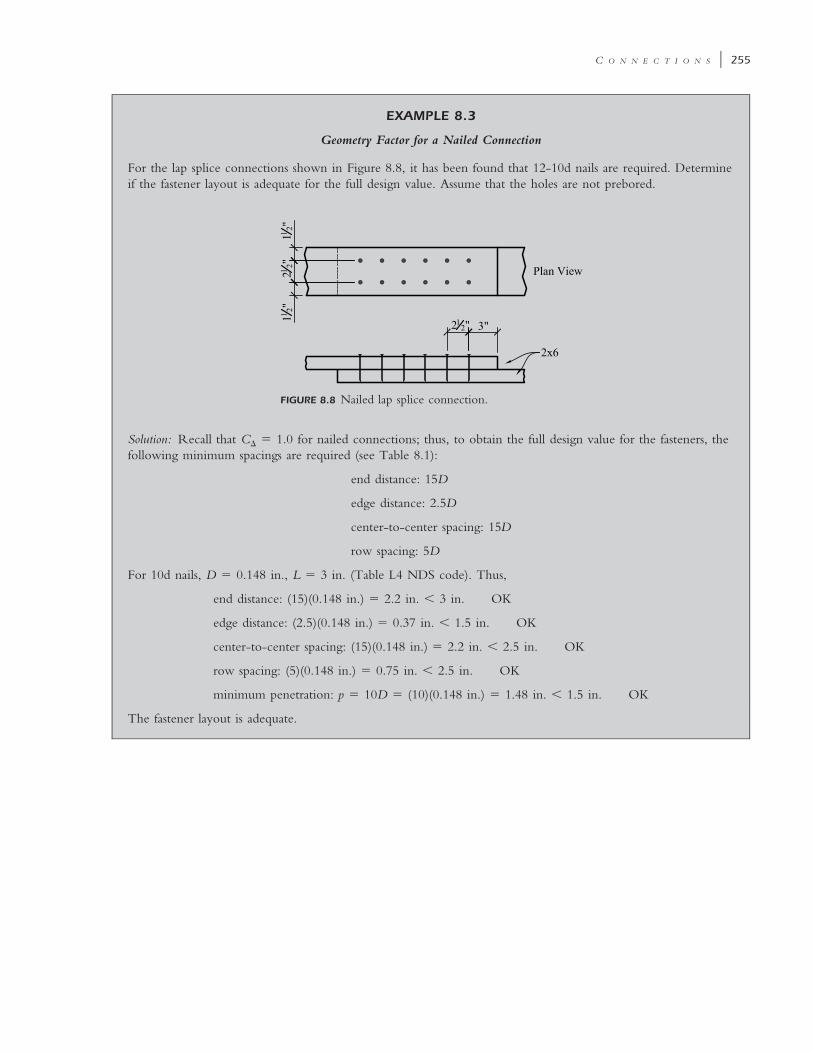
C O N N E C T I O N S � 255
EXAMPLE 8.3
Geometry Factor for a Nailed Connection
For the lap splice connections shown in Figure 8.8, it has been found that 12-10d nails are required. Determineif the fastener layout is adequate for the full design value. Assume that the holes are not prebored.
FIGURE 8.8 Nailed lap splice connection.
Solution: Recall that C� � 1.0 for nailed connections; thus, to obtain the full design value for the fasteners, thefollowing minimum spacings are required (see Table 8.1):
end distance: 15D
edge distance: 2.5D
center-to-center spacing: 15D
row spacing: 5D
For 10d nails, D � 0.148 in., L � 3 in. (Table L4 NDS code). Thus,
end distance: (15)(0.148 in.) � 2.2 in. � 3 in. OK
edge distance: (2.5)(0.148 in.) � 0.37 in. � 1.5 in. OK
center-to-center spacing: (15)(0.148 in.) � 2.2 in. � 2.5 in. OK
row spacing: (5)(0.148 in.) � 0.75 in. � 2.5 in. OK
minimum penetration: p � 10D � (10)(0.148 in.) � 1.48 in. � 1.5 in. OK
The fastener layout is adequate.

256 � S T R U C T U R A L W O O D D E S I G N
EXAMPLE 8.4
Geometry Factor for a Bolted Connection
For the lap splice connections shown in Figure 8.9, determine the geometry factor for the connection shown.The lumber is Douglas fir-larch.
FIGURE 8.9 Bolted lap splice connection.
Solution: l/D � smaller of:
l 1.5m � � 2D 0.75
l 1.5s � � 2 (same result; use l/D � 2)D 0.75
The following distances are provided:
end distance: 4 in.
edge distance: 1.5 in.
center-to-center spacing: 2.5 in.
row spacing: 2.5 in.
The following minimum spacings are required (see Table 8.3):
Minimum Full
End distance 3.5D 7D
Edge distance N/A 1.5D
Center-to-center spacing 3D 4D
Row spacing N/A 1.5D
thus:
Minimum Full
End distance (3.5)(0.75 in.) � 2.63 in. to (7)(0.75 in.) � 5.25 in.
Edge distance N/A (1.5)(0.75 in.) � 1.13 in.
Center-to-center spacing (3)(0.75 in.) � 2.25 in. to (4)(0.75 in.) � 3 in.
Row spacing N/A (1.5)(0.75 in.) � 1.13 in.

C O N N E C T I O N S � 257
By inspection, the spacings provided are all greater than the minimum value required. For the parameters thatdo not have a minimum value, the full or base spacing must be provided. The geometry factor must now becalculated for the other distance parameters:
spacing providedC � (8.8)� base spacing
end distance: C � 4 in./5.25 in. � 0.76�
edge distance: C � 1.0 (full or base spacing must be provided)�
center-to-center spacing: C � 2.5 in./3 in. � 0.83�
row spacing: C � 1.0 (full or base spacing must be provided)�
The lowest value for C� controls; therefore, C� � 0.76.
8.4 BASE DESIGN VALUES: LATERALLY LOADED CONNECTORS
In Section 11.3 of the NDS code, a yield limit model is presented to determine the nominal lateraldesign value for a single fastener, Z, based on the following assumptions:
1. The faces of the connected members are in contact.2. The load acts perpendicular to the axis of the dowel or fastener.3. Edge distance, end distance, center-to-center spacing, and row spacing requirements are
met (either base values or minimum values).4. The minimum fastener penetration requirement is met.
The nominal lateral design value Z using the yield limit model is a function of the followingfactors:
• The mode of failure (see Figure 8.10)• The diameter of the fastener, D• The bearing length of the fastener, l• The wood species (i.e., specific gravity G)• The direction of loading relative to the grain orientation, �
• The yield strength of the fastener in bending, Fyb
• The dowel bearing strength, Fe
There are four basic modes of failure for connectors and the analysis of each mode leads toa corresponding set of equations for determining the design load capacity. Figure 8.10 illustrateseach of these modes in single and double shear.
1. Mode I is a bearing failure such that the connector crushes the wood member it is incontact with. This failure can occur in either the main member (mode Im) or in the sidemember (mode Is).
2. Mode II is a failure such that the connector pivots within the wood members (i.e., thefastener does not yield). There is localized crushing of the wood fibers at the faces of thewood members. This type of failure occurs only in single shear connections.
3. Mode III is a combined failure of the connector such that a plastic hinge forms in theconnector in conjunction with a bearing failure in either the main member (mode IIIm)or in the side member (mode IIIs). This type of failure occurs only in single shear con-nections.
4. Mode IV is a failure of the connector such that two plastic hinges form (one in each shearplane), with limited localized crushing of the wood fibers near the shear plane(s).

258 � S T R U C T U R A L W O O D D E S I G N
FIGURE 8.10
Connector failuremodes. (Adaptedfrom Ref. 7, FigureI1. Courtesy of theAmerican Forest &Paper Association,Washington, DC.)
Since the failure is either crushing of the wood or yielding of the fastener, the dowel bearingstrength Fe and the yield strength of the fastener Fyb are the most critical factors in determiningZ. The dowel bearing strength is a function of the fastener diameter, the wood species, and thedirection of the loading. Values for Fe are calculated as follows:
1 1.84–For D � in.: F � 16,600G (psi) (8.9)4 e
1–For D � in.: F � 11,200G (psi) (8.10)4 e�
1.456100G1–For D � in.: F � (psi) (8.11)4 e� �D
where D � fastener diameter, in.G � specific gravity of wood (Table 11.3.2A NDS code)

C O N N E C T I O N S � 259
TABLE 8.4 Yield Strength in Bending of Various Fasteners
Fastener Type Diameter (in.) Fyb (psi)
Bolt, lag screw D � 0.375 45,000
Common, box, orsinker nail; lag screw;wood screw (low- tomedium-carbon steel)
0.344 � D � 0.3750.273 � D � 0.3440.236 � D � 0.2730.177 � D � 0.2360.142 � D � 0.1770.099 � D � 0.142
45,00060,00070,00080,00090,000
100,000
FIGURE 8.11 Fastenersloaded at variousangles to the grain.
Values for Fe are given for various dowel sizes and wood species in the NDS Table 11.3.2.It can be seen that load direction relative to the grain of the wood is not a factor for small-diameter fasteners (less than in.). For larger-diameter fasteners, the dowel bearing strength is1–4constant when loaded parallel to the grain but decreases as the fastener size increases when loadedperpendicular to the grain. The dowel bearing strength is also directly proportional to the densityof the wood.
The yield strength of the fastener in bending, Fyb, is determined from tests performed inaccordance with ASTM F1575 (small-diameter fasteners) and ASTM F606 (large-diameter fas-teners). When published data are not available for a specific fastener, the designer should contactthe manufacturer to determine the fastener yield strength. Typical values for Fyb are given inTable I1 of the NDS code, which is summarized in Table 8.4.
When fasteners are loaded at an angle to the grain (see Figure 8.11), the Hankinson formulashall be used to determine the dowel bearing strength:
F Fe� e�F � (8.12)e� 2 2F sin � � F cos �e� e�
When connections are made with steel side plates, Section I.2 of the NDS code explains thatthe nominal bearing strength of steel is 2.4Fu for hot-rolled steel and 2.2Fu for cold-formed steel.Applying a load duration factor of 1.6, the dowel bearing strength on the steel is as follows:
F � 1.5F (hot-rolled steel)e u
F � 1.375F (cold-formed steel)e u
where Fu � ultimate tensile strength� 58,000 psi for ASTM A36 steel, in. and thicker1–4� 45,000 psi, 3 gage and thinner ASTM A653, grade 33

260 � S T R U C T U R A L W O O D D E S I G N
When fasteners are embedded in concrete, such as anchor bolts for a sill plate (see Chapter9), the dowel bearing strength can be assumed to be 7500 psi for concrete with a compressivestrength of at least � 2500 psi. Table 11E of the NDS code gives lateral design values Z forf�cvarious wood species and bolt sizes. Note that this table assumes a minimum embedment of 6in. into the concrete. Having discussed the controlling factors in determining the lateral designvalue Z for a single fastener, we can now look at the equations to calculate Z. Each connectionmust be analyzed for each failure mode (see Figure 8.10). The NDS code gives a yield limitequation to determine Z, each corresponding to a specific mode of failure. The smallest valuedetermined from these equations is the controlling value to use for design. The equations are asfollows:
Yield Mode Single Shear Double Shear
Im
Dl Fm emZ �Rd
(8.13)Dl Fm emZ �
Rd
Is
Dl Fs esZ �Rd
(8.14)2Dl Fs esZ �
Rd
IIk Dl F1 s esZ �
Rd
(8.15)
IIIm
k Dl F2 m emZ �(1 � 2R )Re d
IIIs
k Dl F3 s emZ �(2 � R )Re d
(8.16)2k Dl F3 s emZ �
(2 � R )Re d
IV2D 2F Fem ybZ � �R 3(1 � R )d e
(8.17)22D 2F Fem ybZ � �R 3(1 � R )d e
where k1 �(8.18)
2 2 2 3�R � 2R (1 � R � R ) � R R � R (1 � R )e e t t t e e t
(1 � R )e
k2 � �1 � (8.19)22F (1 � 2R )Dyb e2(1 � R ) �e 2� 3F lem m
k3 � �1 � (8.20)22(1 � R ) 2F (2 � R )De yb e� 2� R 3F le em s
D � diameter of connector, in.Fyb � dowel bending strength, psi (see NDS code Table I1)Rd � reduction term (NDS code, Table 11.3.1B or see Table 8.5)K� � 1 � (0.25)(�/90)
Re �Fem
Fes
Rt �lmls
lm � main member dowel length, in.ls � side member dowel length, in.
Fem � main member dowel bearing strength, psiFes � side member dowel bearing strength, psi

C O N N E C T I O N S � 261
TABLE 8.5 Reduction Factor, Rd
Fastener Size(in.) Yield Mode Rd
0.25 � D � 1 Im, Is 4K�
II 3.6K�
IIIm, IIIs, IV 3.2K�
0.17 � D � 0.25 Im, Is, II, IIIm, IIIs, IV 10D � 0.5
D � 0.17 Im, Is, II, IIIm, IIIs, IV 2.2
Fem or Fes � Fe for D � in.1–4� or for applied loads either parallel or perpendicular to the grainF Fe � e�
� for applied loads at an angle to the grainFe �
� 87,000 psi for ASTM A36 steel side plates (1.5 Fu)� 61,850 psi ASTM A653, grade 33 steel side plates (1.375 Fu)� 7500 psi (fastener embedded into concrete)
For lag screws, the diameter D is typically taken as the root diameter Dr or the reducedbody diameter at the threads (see Figure 8.12). Section 11.3.4 of the NDS code stipulates that
FIGURE 8.12 Elements of a lag screw.
the main member dowel length lm does not include thelength of the tapered tip when the penetration depth intothe main member is less than 10D. When the penetration isgreater than 10D, then lm would include the length of thetapered tip.
As an alternative to solving for Z using the yield limitequations for lag screws, Tables 11J and 11K are providedin the NDS code. These tables are for lag screws in singleshear (wood-to-wood or wood-to-steel) since lag screws arenot typically loaded in double shear. The values in this tableare valid when the penetration into the main member is atleast 8D. When the penetration is such that 4D � p � 8D,the value for Z in Tables 11J or 11K is adjusted by p/8D.Note that NDS Tables 11A through 11J uses the followingnotations:
ZII � lateral design shear strength of a fastener in single shear with the side memberloaded parallel to the grain and the main member loaded parallel to the grain
Z� � Lateral design shear strength of a fastener in single shear with the side memberloaded perpendicular to the grain and the main member loaded perpendicular to the grain
Zm� � Lateral design shear strength of a fastener in single shear with the side memberloaded parallel to the grain and the main member loaded perpendicular to the grainZs� � Lateral design shear strength of a fastener in single shear with the side memberloaded perpendicular to grain and the main member loaded parallel to the grain
The following examples illustrate the calculation of Z for various loading conditions.

262 � S T R U C T U R A L W O O D D E S I G N
EXAMPLE 8.5
Laterally Loaded Nail, Single Shear
For the connection shown in Figure 8.13, determine the nominal lateral design value Z and compare the resultsfrom the appropriate table in the NDS code. Lumber is spruce-pine-fir for the main and side members.
FIGURE 8.13 Laterally loaded nail.
Solution:
G � 0.42 (NDS code Table 11.3.2A)
D � 0.131 in. (NDS code Table L4)
l � 2.5 in. (NDS code Table L4)
F � 100,000 psi (Table 8.4)yb
1.84F � F � 16,600Gem es
1.84� (16,600)(0.42) � 3364 psi (agrees with Table 11.3.2 of the NDS code)
F 3364emR � � � 1.0e F 3364es
l 2.5 in. � 1.5 in.mR � � � 0.667t l 1.5 in.s
R � 2.2d
2 2 2 3�R � 2R (1 � R � R ) � R R � R (1 � R )e e t t t e e tk �1 1 � Re
2 2 2 3�1 � (2)(1) [1 � 0.667 � (0.667) ] � (0.667) (1) � (1)(1 � 0.667)� � 0.357
1 � 1
22F (1 � 2R )Dyb ek � �1 � 2(1 � R ) �2 e 2� 3F lem m
2(2)(100,000)[1 � (2)(1)](0.131)� �1 � (2)(1 � 1) � � 1.242� (3)(3364)(1)
22(1 � R ) 2F (2 � R )De yb ek � �1 � �3 2� R 3F le em s
22(1 � 1) (2)(100,000)(2 � 1)(0.131)� �1 � � � 1.112� (1) (3)(3364)(1.5)
Calculate Z for each mode of failure.

C O N N E C T I O N S � 263
Mode Im:
Dl F (0.131)(1)(3364)m emZ � � � 200 lbR 2.2d
Mode Is:
Dl F (0.131)(1.5)(3364)s esZ � � � 300 lbR 2.2d
Mode II:
k l F (0.357)(0.131)(1.5)(3364)1 s esZ � � � 107 lbR 2.2d
Mode IIIm:
k Dl F (1.24)(0.131)(1)(3364)2 m emZ � � � 82 lb(1 � 2R )R [1 � (2)(1)](2.2)e d
Mode IIIs:
k Dl F (1.11)(0.131)(1.5)(3364)3 s emZ � � � 111 lb(2 � R )R (2 � 1)(2.2)e d
Mode IV:
2 2D 2F F (0.131) (2)(3364)(100,000)em ybZ � � � 82 lb� �R 3(1 � R ) 2.2 3(1 � 1)d e
The lowest value was 82 lb (modes IIIm and IV) therefore, Z � 82 lb, which agrees with Table 11N ofthe NDS code.
EXAMPLE 8.6
Laterally Loaded Bolt, Double Shear
For the connection shown in Figure 8.14, determine the nominal lateral design value Z� and compare theresults from the appropriate table in the NDS code. Lumber is hem-fir for the main member, and the steelplates are in. A36.1–4
FIGURE 8.14 Laterally loaded bolt.

264 � S T R U C T U R A L W O O D D E S I G N
Solution:
G � 0.43 (NDS code, Table 11.3.2A)
D � 0.625 in.
l � 2.5 in. (3� main member)m
F � 45,000 psi (Table 8.4)yb
1.45 1.456100G (6100)(0.43)F � F � �em e� �D �0.625
� 2269 psi (agrees with Table 11.3.2 of the NDS code)
F � 87,000 (A36 side plates)es
F 2269emR � � � 0.026e F 87,000es
l 2.5 in.mR � � � 10t l 0.25 in.s
� � 90�
K � 1 � (0.25)(�/90) � 1 � (0.25)(90/90) � 1.25�
22(1 � R ) 2F (2 � R )De yb ek � �1 � �3 2� R 3F le em s
2(2)(1 � 0.026) (2)(45,000)(2 � 0.026)(0.625)� �1 � � � 14.72� 0.026 (3)(2269)(0.25)
Calculate Z for each mode of failure.
Mode Im (Rd � 4K�):
Dl F (0.625)(2.5)(2269)m emZ � � � 709 lbR (4)(1.25)d
Mode Is (Rd � 4K�):
2Dl F (2)(0.625)(0.25)(87,000)s esZ � � � 5437 lbR (4)(1.25)d
Mode II: Not applicable
Mode IIIm: Not applicable
Mode IIIs (Rd � 3.2K�):
2k Dl F (2)(14.7)(0.625)(0.25)(2269)3 s emZ � � � 1285 lb(2 � R )R (2 � 0.026)(3.2)(1.25)e d
Mode IV:
2 22F F2D (2)(0.625) (2)(2269)(45,000)em ybZ � � � 1591 lb� �R 3(1 � R ) (3.2)(1.25) 3(1 � 0.026)d e
The lowest value was 709 lb (mode Im); therefore, Z� � 709 lb, which agrees with Table 11G of theNDS code.

C O N N E C T I O N S � 265
EXAMPLE 8.7
Laterally Loaded Lag Screw Perpendicular to the Grain
A -in. lag screw is connected to a Douglas fir-larch column perpendicular to the grain with a 10-gage side3–8plate (ASTM A653 grade 33) (Figure 8.15). Determine the nominal lateral design value Z, and compare theresults from the appropriate table in the NDS code. Assume that the penetration into the main member is atleast 10D.
FIGURE 8.15 Laterally loaded lagscrew.
Solution:
G � 0.50 (NDS code Table 11.3.2A)
D � 0.375 in.
D � 0.265 in. (Table L2)r
l � 10D � (10)(0.265) � 2.65 in.m
l � 0.134 in. (10 gage)s
F � 45,000 psi (Table 8.4)yb
1.45 1.456100G (6100)(0.50)F � F � � � 3646 psiem e� �D �0.375
F � 61,850 psi (ASTM A653, grade 33)es
F 3646emR � � � 0.059e F 61,850es
l 2.65 in.mR � � � 19.78t l 0.134 in.s
� � 90�
K � 1 � 0.25(�/90) � 1 � 0.25(90/90) � 1.25�
2 2 2 3�R � 2R (1 � R � R ) � R R � R (1 � R )e e t t t e e tk �1 1 � Re
2 2 2 3�0.059 � (2)(0.059) [1 � 19.78 � (19.78) ] � (19.78) (0.059) � (0.059)(1 � 19.78)�
1 � 0.059
� 0.480

266 � S T R U C T U R A L W O O D D E S I G N
22F (1 � 2R )Dyb ek � �1 � 2(1 � R ) �2 e 2� 3F lem m
2(2)(45,000)[1 � (2)(0.059)](0.265)� �1 � 2(1 � 0.059) � � 0.4872� (3)(3646)(2.65)
22F (2 � R )D2(1 � R ) yb eek � �1 � �3 2� R 3F le em s
22(1 � 0.059) (2)(45,000)(2 � 0.059)(0.265)� �1 � � � 9.112� 0.059 (3)(3646)(0.134)
Calculate Z for each mode of failure.
Mode Im (Rd � 4K�):
Dl F (0.265)(2.65)(3646)m emZ � � � 512 lbR (4)(1.25)d
Mode Is (Rd � 4K�):
Dl F (0.265)(0.134)(61,850)s esZ � � � 439 lbR (4)(1.25)d
Mode II (Rd � 3.6K�):
k Dl F (0.480)(0.265)(0.134)(61,850)1 s esZ � � � 234 lbR (3.6)(1.25)d
Mode IIIm (Rd � 3.2K�):
k Dl F (0.487)(0.265)(2.65)(3646)2 m emZ � � � 279 lb(1 � 2R )R (1 � (2)(0.059)(3.2)(1.25)e d
Mode IIIs (Rd � 3.2K�):
k Dl F (9.11)(0.265)(0.134)(3646)3 s emZ � � � 143 lb(2 � R )R (2 � 0.059)(3.2)(1.25)e d
Mode IV (Rd � 3.2K�):
2 2D 2F F (0.265) (2)(3646)(45,000)em ybZ � � � 178 lb� �R 3(1 � R ) (3.2)(1.25) 3(1 � 0.059)d e
The lowest value was 143 lb (mode IIIs); therefore, Z� � 143 lb, which agrees with Table 11K of theNDS code (Z� � 140 lb).

C O N N E C T I O N S � 267
EXAMPLE 8.8
Knee Brace Connection
For the knee brace connection shown in Figure 8.16, design the connectors assuming 16d common nails. Thewood species is spruce-pine-fir and is exposed to the weather. Loads are due to lateral wind.
FIGURE 8.16 Knee brace connection.
Solution: From NDS Table L-4: D � 0.162 in., L � 3 in. Minimum distances (from Table 8.1):1–2
end distance: 15D
edge distance: 2.5D
center-to-center spacing: 15D
row spacing: 5D
Thus
end distance: (15)(0.162 in.) � 2.43 in.
edge distance: (2.5)(0.162 in.) � 0.405 in.
center-to-center spacing: (15)(0.162 in.) � 2.43 in.
row spacing: (5)(0.162 in.) � 0.81 in.
minimum penetration: p � 10D � (10)(0.162 in.) � 1.62 in.
From NDS Table 11N, Z � 120 lb. From NDS Table 10.3.3, CM � 0.7. All other C factors � 1.0.
Z� � ZC C C C C C C CD M t g � eg di tn
� (120)(1.6)(0.7)(1.0)(1.0)(1.0)(1.0)(1.0)(1.0) � 134 lb

268 � S T R U C T U R A L W O O D D E S I G N
The number of nails required
1000N � � 7.5 nails � 8 nailsreq’d 134
Use 4-16d nails on each side of the splice. See Figure 8.17.
FIGURE 8.17 Nailed knee brace connectiondetail.
8.5 BASE DESIGN VALUES: CONNECTORS LOADED IN WITHDRAWAL
In withdrawal loading a fastener has a load applied parallel to its length such that the load stressesthe fastener in tension and tends to pull the fastener out of the main member in which it isembedded. From a practical standpoint, wood screws and lag screws are the preferred connectorfor withdrawal loading because the threads create a more positive connection to the wood. Lagscrews are permitted to be installed on either the side grain or the end grain when loaded inwithdrawal. Recall that the end grain factor applies for lag screws loaded in withdrawal (Ceg �0.75). Wood screws and nails are not permitted to be loaded in withdrawal from the end grainof wood.
Section 11.2 of the NDS code gives the withdrawal design values W for various connectorsas follows:
3 / 2 3 / 41800G D (lag screws)2W � 2850G D (wood screws) 5 / 21380G D (nails) (8.23)
(8.22)(8.21)
where W � withdrawal design value, lb (per inch of penetration)G � specific gravity (see NDS code Table 11.3.2A)D � fastener diameter, in.
The value for W calculated from the equations above represents the withdrawal design value perinch of penetration into the main member, per fastener. NDS code Tables 11.2A, 11.2B, and11.2C give tabulated values for W. The fastener could also fail by yielding in tension and shouldbe checked for this condition, but wood connections are not usually controlled by the fastenerstrength in pure tension.
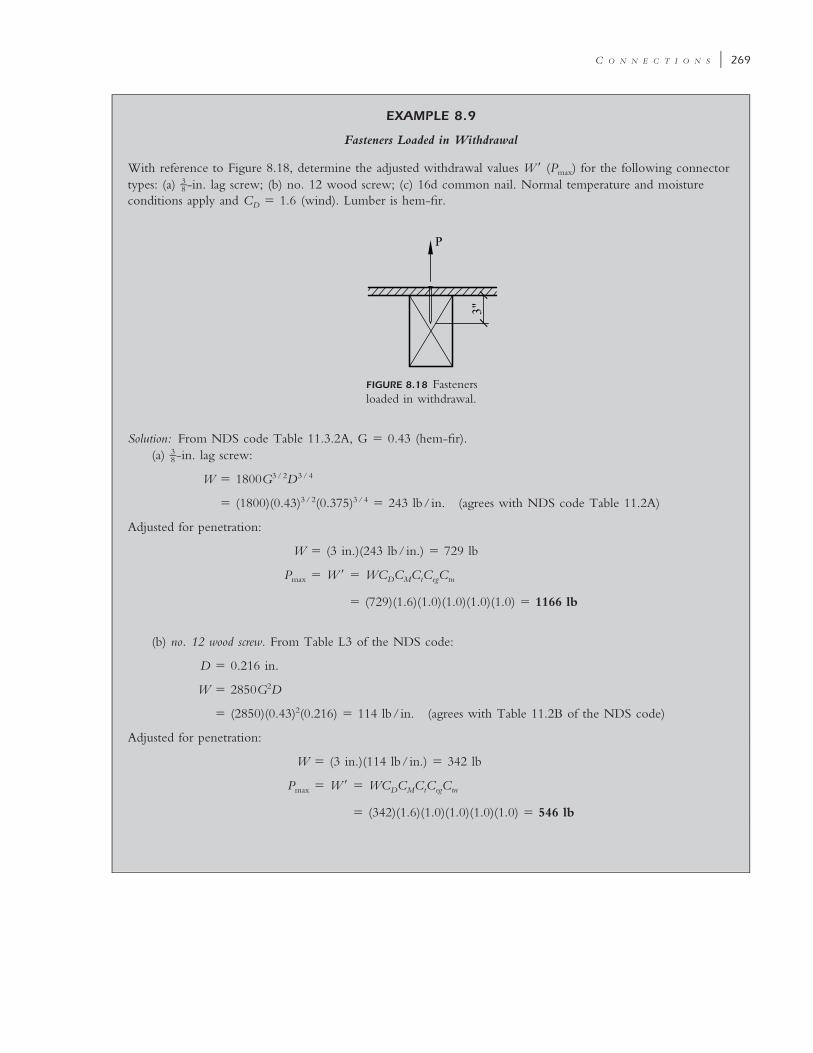
C O N N E C T I O N S � 269
EXAMPLE 8.9
Fasteners Loaded in Withdrawal
With reference to Figure 8.18, determine the adjusted withdrawal values W� (Pmax) for the following connectortypes: (a) -in. lag screw; (b) no. 12 wood screw; (c) 16d common nail. Normal temperature and moisture3–8conditions apply and CD � 1.6 (wind). Lumber is hem-fir.
FIGURE 8.18 Fastenersloaded in withdrawal.
Solution: From NDS code Table 11.3.2A, G � 0.43 (hem-fir).(a) -in. lag screw:3–8
3 / 2 3 / 4W � 1800G D
3 / 2 3 / 4� (1800)(0.43) (0.375) � 243 lb/in. (agrees with NDS code Table 11.2A)
Adjusted for penetration:
W � (3 in.)(243 lb/in.) � 729 lb
P � W� � WC C C C Cmax D M t eg tn
� (729)(1.6)(1.0)(1.0)(1.0)(1.0) � 1166 lb
(b) no. 12 wood screw. From Table L3 of the NDS code:
D � 0.216 in.
2W � 2850G D
2� (2850)(0.43) (0.216) � 114 lb/in. (agrees with Table 11.2B of the NDS code)
Adjusted for penetration:
W � (3 in.)(114 lb/in.) � 342 lb
P � W� � WC C C C Cmax D M t eg tn
� (342)(1.6)(1.0)(1.0)(1.0)(1.0) � 546 lb

270 � S T R U C T U R A L W O O D D E S I G N
(c) 16d common nail. From Table L3 of the NDS code:
D � 0.162 in.
5 / 2W � 1380G D
5 / 2� (1380)(0.43) (0.162) � 27 lb/in. (agrees with Table 11.2C of the NDS code)
Adjusted for penetration:
W � (3 in.)(27 lb/in.) � 81 lb
P � W� � WC C C C Cmax D M t eg tn
� (81)(1.6)(1.0)(1.0)(1.0)(1.0) � 130 lb
FIGURE 8.19
Combined lateral andwithdrawal loading.
8.6 COMBINED LATERAL AND WITHDRAWAL LOADS
With reference to Figure 8.19, there are conditions in which connectors are subjected to lateraland withdrawal load simultaneously. For this case, the NDS code specifies the following inter-action equations for combined loading:
W�pZ�for lag screws or wood screws2 2W�p cos � � Z� sin �
Z� ��W�pZ� for nails
W�p cos� � Z� sin�(8.25)
(8.24)
where �Z�� adjusted resulting design value under combined loadingW� � adjusted withdrawal design value
p � length of penetration into the main member, in.Z� � adjusted lateral design value� � angle between the wood surface and the direction of load applied
The value would then be compared to the resultant load P shown in Figure 8.19.Z��

C O N N E C T I O N S � 271
EXAMPLE 8.10
Fastener Loaded by Lateral and Withdrawal Loads
A connection similar to that shown in Figure 8.19 requires a no. 14 wood screws under combined lateral andwithdrawal loads. Determine Pmax when � � 30� and a penetration, p � 1.5 in. Lumber is hem-fir. The sideplate is 10 gage (ASTM A653 grade 33) and the loads are D � S. Assume that normal temperature andmoisture conditions apply.
Solution:
D � 0.242 in. (NDS code Table L3)
W � 127 lb/in. (NDS code Table 11.2B)
Z � 160 lb (NDS code Table 11N)
p � 1.5 in. (greater than 6D but less than 10D)
Therefore,
Z � (160 lb)(p/10D) � (160)[1.5/(10)(0.242)] � 99 lb
W� � WC C C C CD M t eg tn
� (127)(1.15)(1.0)(1.0)(1.0)(1.0) � 146 lb
1–C � 1.0 (D � in.)g 4
C� � 1.0, but minimum spacing must be provided for D � in.1–4
From Table 8.1, required spacings (assume no prebored holes):
end distance: 10D
edge distance: 2.5D
center-to-center spacing: 10D
row spacing: 3D
Therefore,
end distance: (10)(0.242 in.) � 2.42 in.
edge distance: (2.5)(0.242 in.) � 0.605 in.
center-to-center spacing: (10)(0.242 in.) � 2.42 in.
row spacing: (3)(0.242 in.) � 0.726 in.
Z� � ZC C C C C C C CD M t g � eg di tn
� (99)(1.15)(1.0)(1.0)(1.0)(1.0)(1.0)(1.0)(1.0) � 113 lb
W�pZ� (146)(1.5)(113)Z� � � � 128 lb� 2 2 2 2W�p cos � � Z� sin � (146)(1.5) cos 30 � (113) sin 30
Pmax � 128 lb

272 � S T R U C T U R A L W O O D D E S I G N
EXAMPLE 8.11
Diaphragm Fastener Loaded by Lateral and Withdrawal Loads
For the diaphragm connection shown in Figure 8.20, determine the capacity of the 10d toenail for (a) lateralloads and (b) withdrawal loads. Loads are due to wind and normal temperature and moisture conditions apply.The lumber is DF-L.
FIGURE 8.20 Diaphragmconnection detail.
Solution:
D � 0.148 in. (NDS code Table L3)
L � 3 in. (NDS code Table L3)
(L/3)p � 3 in. � � 1.84 in. � 10d � 1.48 in. OK
6530
(a) From NDS Table 11N, Z � 118 lb (side member thickness � 1.5 in.):
Z� � ZC C C C C C C CD M t g � eg di tn
C � 1.6 (wind)D
C � 1.1 (NDS code Section 11.5.3)di
C � 0.83 (NDS code Section 11.5.4.2)tn
All other C factors � 1.0.
Z� � (118)(1.6)(1.0)(1.0)(1.0)(1.0)(1.0)(1.1)(0.83) � 172 lb
(b) From NDS Table 11.2C, W � 36 lb/in. (G � 0.50, see NDS Table 11.3.2A); p � 1.73 in. from part(a); therefore,
W � (36 lb/in.)(1.73 in.) � 62 lb
W� � WC C C C CD M t eg tn
C � 1.6 (wind)D
C � 0.67 (NDS Section 11.5.4.1)tn
All other C factors � 1.0 (CM � 1.0 for toenail connections; see NDS code Section 11.5.4).
W� � (62)(1.6)(1.0)(1.0)(1.0)(0.67) � 66 lb
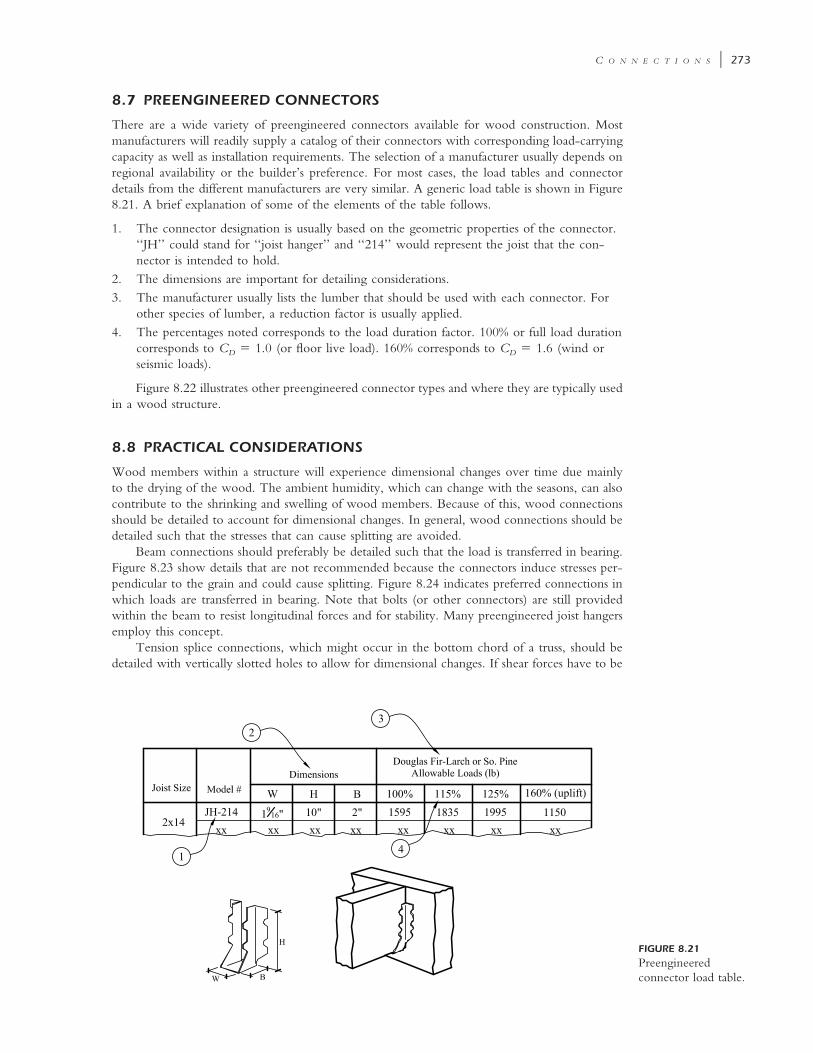
C O N N E C T I O N S � 273
FIGURE 8.21
Preengineeredconnector load table.
8.7 PREENGINEERED CONNECTORS
There are a wide variety of preengineered connectors available for wood construction. Mostmanufacturers will readily supply a catalog of their connectors with corresponding load-carryingcapacity as well as installation requirements. The selection of a manufacturer usually depends onregional availability or the builder’s preference. For most cases, the load tables and connectordetails from the different manufacturers are very similar. A generic load table is shown in Figure8.21. A brief explanation of some of the elements of the table follows.
1. The connector designation is usually based on the geometric properties of the connector.‘‘JH’’ could stand for ‘‘joist hanger’’ and ‘‘214’’ would represent the joist that the con-nector is intended to hold.
2. The dimensions are important for detailing considerations.3. The manufacturer usually lists the lumber that should be used with each connector. For
other species of lumber, a reduction factor is usually applied.4. The percentages noted corresponds to the load duration factor. 100% or full load duration
corresponds to CD � 1.0 (or floor live load). 160% corresponds to CD � 1.6 (wind orseismic loads).
Figure 8.22 illustrates other preengineered connector types and where they are typically usedin a wood structure.
8.8 PRACTICAL CONSIDERATIONS
Wood members within a structure will experience dimensional changes over time due mainlyto the drying of the wood. The ambient humidity, which can change with the seasons, can alsocontribute to the shrinking and swelling of wood members. Because of this, wood connectionsshould be detailed to account for dimensional changes. In general, wood connections should bedetailed such that the stresses that can cause splitting are avoided.
Beam connections should preferably be detailed such that the load is transferred in bearing.Figure 8.23 show details that are not recommended because the connectors induce stresses per-pendicular to the grain and could cause splitting. Figure 8.24 indicates preferred connections inwhich loads are transferred in bearing. Note that bolts (or other connectors) are still providedwithin the beam to resist longitudinal forces and for stability. Many preengineered joist hangersemploy this concept.
Tension splice connections, which might occur in the bottom chord of a truss, should bedetailed with vertically slotted holes to allow for dimensional changes. If shear forces have to be

274 � S T R U C T U R A L W O O D D E S I G N
FIGURE 8.22
Preengineeredconnector types.
FIGURE 8.23
Nonpreferred beamconnections.
FIGURE 8.24
Preferred beamconnections.

C O N N E C T I O N S � 275
FIGURE 8.25
Preferred tensionsplice details.
FIGURE 8.26
Preferred andnonpreferred trussconnection details.
FIGURE 8.27
Nonpreferred basedetails.
FIGURE 8.28
Preferred base details.
transferred across the splice, a combination of slotted and round holes can be used. Figure 8.25shows preferred tension splice details.
Truss connections should be detailed such that the member centerlines intersect at a com-mon work point (Figure 8.26). This will ensure that the axial loads in the truss members do notinduce shear and bending stresses in the members.
Base connections for wall studs and posts should be kept sufficiently high above the concretefoundation to avoid moisture that can cause decay. Figure 8.27 indicates base connections that
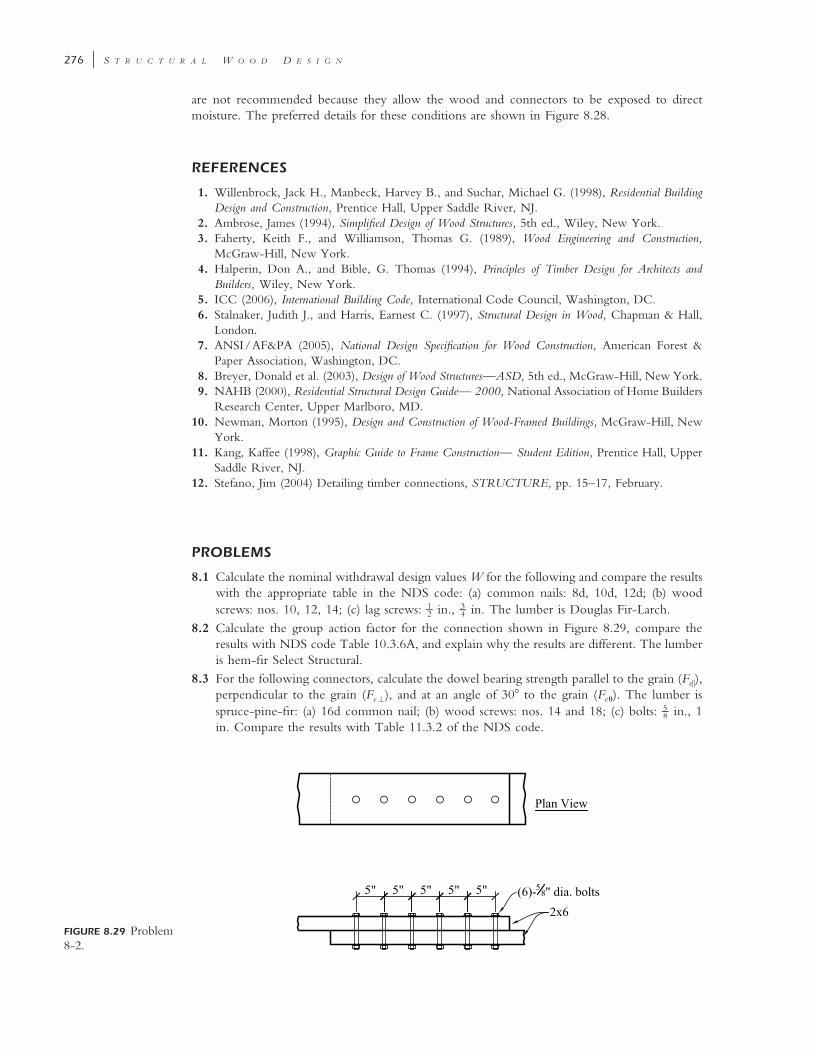
276 � S T R U C T U R A L W O O D D E S I G N
FIGURE 8.29 Problem8-2.
are not recommended because they allow the wood and connectors to be exposed to directmoisture. The preferred details for these conditions are shown in Figure 8.28.
REFERENCES
1. Willenbrock, Jack H., Manbeck, Harvey B., and Suchar, Michael G. (1998), Residential BuildingDesign and Construction, Prentice Hall, Upper Saddle River, NJ.
2. Ambrose, James (1994), Simplified Design of Wood Structures, 5th ed., Wiley, New York.3. Faherty, Keith F., and Williamson, Thomas G. (1989), Wood Engineering and Construction,
McGraw-Hill, New York.4. Halperin, Don A., and Bible, G. Thomas (1994), Principles of Timber Design for Architects and
Builders, Wiley, New York.5. ICC (2006), International Building Code, International Code Council, Washington, DC.6. Stalnaker, Judith J., and Harris, Earnest C. (1997), Structural Design in Wood, Chapman & Hall,
London.7. ANSI/AF&PA (2005), National Design Specification for Wood Construction, American Forest &
Paper Association, Washington, DC.8. Breyer, Donald et al. (2003), Design of Wood Structures—ASD, 5th ed., McGraw-Hill, New York.9. NAHB (2000), Residential Structural Design Guide— 2000, National Association of Home Builders
Research Center, Upper Marlboro, MD.10. Newman, Morton (1995), Design and Construction of Wood-Framed Buildings, McGraw-Hill, New
York.11. Kang, Kaffee (1998), Graphic Guide to Frame Construction— Student Edition, Prentice Hall, Upper
Saddle River, NJ.12. Stefano, Jim (2004) Detailing timber connections, STRUCTURE, pp. 15–17, February.
PROBLEMS
8.1 Calculate the nominal withdrawal design values W for the following and compare the resultswith the appropriate table in the NDS code: (a) common nails: 8d, 10d, 12d; (b) woodscrews: nos. 10, 12, 14; (c) lag screws: in., in. The lumber is Douglas Fir-Larch.1 3– –2 4
8.2 Calculate the group action factor for the connection shown in Figure 8.29, compare theresults with NDS code Table 10.3.6A, and explain why the results are different. The lumberis hem-fir Select Structural.
8.3 For the following connectors, calculate the dowel bearing strength parallel to the grain (Fe�),perpendicular to the grain (Fe �), and at an angle of 30� to the grain (Fe�). The lumber isspruce-pine-fir: (a) 16d common nail; (b) wood screws: nos. 14 and 18; (c) bolts: in., 15–8in. Compare the results with Table 11.3.2 of the NDS code.

C O N N E C T I O N S � 277
FIGURE 8.30 Problem 8-4. FIGURE 8.31 Problem 8.5.
8.4 Using the yield limit equations, determine the nominal lateral design value Z for the con-nection shown in Figure 8.30. Compare the results with the appropriate table in the NDScode. The lumber is Douglas fir-larch.
8.5 For the sill plate connection shown in Figure 8.31, calculate the design shear capacity Z�parallel to the grain. The concrete strength is � 3000 psi and the lumber is spruce-pine-f �cfir. Loads are dues to seismic (E), and normal temperature and moisture conditions apply.
8.6 Design a 2 � 6 lap splice connection using (a) wood screws and (b) bolts. The load appliedis 1800 lb due to wind. The lumber is southern pine.

278
c h a p t e r n i n e
BUILDING DES IGN CASE STUDY
9.1 INTRODUCTION
The design of a simple wood building structure (see Figure 9.1) is presented in this chapter tohelp the reader tie together the various structural concepts presented in earlier chapters. Thisdesign case study building is a wood-framed office building located in Rochester, New York.It consists of roof trusses, plywood roof sheathing, stud walls with plywood sheathing, plywoodfloor sheathing, floor joists, a glulam floor girder, wood columns supporting the floor beam, andstairs leading from the ground floor to the second floor. The plan dimensions of the buildingare 30 ft � 48 ft and the floor-to-floor height is 12 ft. The exterior walls have -in. gypsum5–8wall board on the inside and -in. wood shingle on plywood sheathing on the outside. The5–8ceiling is -in. gypsum wall board and the second floor is finished with -in.-thick hardwood5 7– –8 8
flooring. The roofing is asphalt shingles. Spruce-pine-fir wood species is specified for all sawn-lumber members and Hem-Fir for the glulam girder. The design aids presented in Appendix Bare used for selection of the ground-floor column, exterior wall stud, and the floor joists. Notethat for any given project, the designer should verify what species and grade of lumber andsheathing are available where the building is to be constructed.
Checklist of Items to Be DesignedThe following is a checklist of all the items to be designed for this case study building.
Sheathing for Floor, Roof, and Walls Initially, select the roof and floor sheathing grade,minimum thickness, span rating, and edge support requirements for gravity loads based on theIBC tables. The plywood grade and thickness obtained for the gravity load condition shouldthen be checked to determine if it is adequate to resist the lateral loads when the roof and floorsheathing act as horizontal diaphragms.
Roof Truss The truss is designed for the case of dead load plus snow load, and structuralanalysis software is used to analyze the roof truss for the member forces. The computer resultscan be verified using a hand calculation method such as the method of sections or the methodof joints.
Stud Walls All the IBC load cases have to be considered and 2 � 6 studs are assumed.
Floor Joist, Glulam Floor Girder, and Columns The critical load case is dead load plusfloor live load.
Roof Diaphragm Select the nailing and edge support requirements. Calculate the chord anddrag strut forces and design the roof diaphragm chord and drag strut (i.e., the top plates).
Floor Diaphragm Select the nailing and edge support requirements. Calculate the chord anddrag strut forces and design the floor diaphragm chord and drag strut (i.e., the top plates).
Structural Wood Design: A Practice-Oriented Approach Using the ASD Method. Abi Aghayere and Jason VigilCopyright © 2007 John Wiley & Sons, Inc.

B U I L D I N G D E S I G N C A S E S T U D Y � 279
(a)
FIGURE 9.1 Casestudy building: (a)roof plan; (b) secondfloor plan; (c) groundfloor plan; (d )possible roof trussprofiles.
Shear Walls Analyze and design the most critical panel in each direction, checking the tensionand compression chords; indicate whether hold-down devices are needed, and specify the verticaldiaphragm nailing requirements.
Lintel/Headers Design lintels and headers at door and window openings for gravity loadsfrom above (i.e., dead plus snow loads for lintels/headers below the roof, and dead plus floorlive load for lintels below the second floor).
9.2 GRAVITY LOADS
In this section we calculate the roof dead and live loads, the floor dead and live loads, and thewall dead load (i.e., the self-weight of the wall).
Roof Dead LoadTo calculate the roof dead load, we assume roof trusses spaced at 2 ft o.c., plywood roof
sheathing, asphalt shingle roofing, and -in. gypsum wall board ceiling. Other dead loads that5–8will be included are the weight of mechanical and electrical fixtures, insulation and possiblereroofing, assuming that the existing roof will be left in place during the reroofing operation.The dead loads are obtained as follows using the dead load tables in Appendix A:

280 � S T R U C T U R A L W O O D D E S I G N
(b) (c)
(d)
FIGURE 9.1 (Continued )

B U I L D I N G D E S I G N C A S E S T U D Y � 281
Roofing ( in. asphalt shingles)5––16 � 2.5 psf
Reroofing (i.e., future added roof ) � 2.5 psf (assumed)
-in. plywood sheathing (� 0.4 psf/ in. � .3)3 1– –8 8 � 1.2 psf
Framing (truss span � 30 ft; see Appendix A) � 5.0 psf
1 in. fiber glass insulation (supported by the bottom chord) � 1.1 psf
-in. gypsum ceiling attached to the truss bottom chord5–8(5 psf/ in � in)5–8
� 3.2 psf
Mechanical and electrical (supported off the bottom chord) � 5.0 psf
Total roof dead load Droof � 20.5 psf of sloped roof area
The dead load supported by the roof truss bottom chord includes the insulation, the gypsumceiling, and the mechanical and electrical loads. Therefore, the total dead load on the bottomchord is 9.3 psf of horizontal plan area, while the dead load supported by the truss top chord is11.2 psf. Note that the load on the top chord is in psf of sloped roof area and must be convertedto psf of horizontal plan area before combining it with the loads on the truss.
The total roof dead load in psf of the horizontal plan area is given as
15.8 ftw (top chord) � (11.2 psf ) � 12 psf� �DL 15 ft
w (bottom chord) � 10 psfDL
It should be noted that for calculating the roof wind uplift load, the dead load must not beoverestimated because it is not conservative to do so. For example, the 2.5 psf reroofing deadload should not be considered for this case since reroofing is a future event and may not bethere for quite a number of years. Therefore, for uplift load calculations, only the dead loadsthat are likely to be on the structure during a wind event should be used to calculate the netuplift wind pressure. For this building, the applicable roof dead load is calculated as
15.8 ftw (for uplift calculations only) � (11.2 psf � 2.5 psf ) � 9.3 psf � 18.5 psf� �DL 15 ft
Roof Live LoadThe snow load S and roof live load Lr acting on the roof of this building will now be
calculated.
Roof Live Load Lr From Section 2.4, since F � 4, the roof slope factor is obtained as R2 �1.0.
The tributary area of the roof truss � 2 ft � 30 ft � 60 ft2 � 200 ft2; therefore, R1 �1.0.The roof live load on the truss Lr � 20R1R2 � (20)(1.0)(1.0) � 20 psf.12 psf � Lr � 20 psf OKThe tributary roof area for a typical exterior stud � (2 ft)(30 ft/2) � 30 ft2 � 200 ft2;therefore, R1 � 1.0.The roof live load on the exterior wall stud Lr � 20R1R2 � (20)(1.0)(1.0) � 20 psf.12 psf � Lr � 20 psf OK
Snow Load The roof slope (4-in-12) implies that tan � � 4/12; therefore, � � 18.43�. UsingFigure 1608.2 from the New York State version of the IBC, we obtain the ground snow loadPg for Rochester, New York to be 50 psf. The reader should note that for this building location,the national snow map in IBC Figure 1608.2 or ASCE 7 Figure 7-1 shows a ground snow loadvalue of 40 psf, but the New York State snow map indicates a ground snow load value of 50psf. This higher value will be used for the design of this building.

282 � S T R U C T U R A L W O O D D E S I G N
Assuming a ‘‘partially’’ exposed roof and a building site with terrain category C, we obtainthe exposure coefficient Ce � 1.0 (ASCE 7 Table 7-2).
The thermal factor for a heated building Ct � 1.0 (ASCE 7 Table 7-3).The importance factor I � 1.0 (IBC Table 1604.5).The slope factor Cs � 1.0 (ASCE Figure 7-2 with roof slope � � 18.43� and a warmroof ).The flat roof snow load Pf � 0.7CeCtIPg � (0.7)(1.0)(1.0)(1.0)(50) � 35 psf.Thus, the design roof snow load, S � Ps � CsPf � (1.0)(35) � 35 psf.
The design total load in psf of the horizontal plan area is obtained using the IBC load combinations(in Section 2.1). Where downward wind loads on the roof are not critical (this will be checkedlater), as is often the case, the controlling load combination, with the deal load modified toaccount for the roof slope, is given by Equation 2.1 as
L1w � D � (L or S or R) psf of the horizontal plan areaTL rL2
Since the roof live load Lr (20 psf ) is less that the design snow load S (35 psf ), the snow loadis more critical and will be used in calculating the total roof load.
L � sloped length of roof truss top chord � 15.8 ft1
L � horizontal projected length of roof truss top chord � 15 ft2
The total load on the top chord and bottom chords of the roof truss will be calculated separately.
w (top chord) � 12 psf � 35 psfTL
� 47 psf of the horizontal plan area
w (bottom chord) � 10 psf of the horizontal plan area (this is from the ceiling load only)TL
The total load on the roof truss wTL � 47 � 10 � 57 psf of the horizontal plan area.The tributary width for a typical interior truss � 2 ft.The total load in pounds per horizontal linear foot (lb/ft) on the roof truss is given as
w (lb/ft) � w (psf )(tributary width)TL TL
� (57 psf )(2 ft) � 114 lb/ft
The maximum shear force in the roof truss is
L 30 ft2V � w � (114) � 1710 lb� �max TL 2 2
The total load in pounds per horizontal linear foot (lb/ft) on the top chord and bottom chordsare calculated as
w (top chord) � 47 psf � 2 ft � 94 lb/ftTL
w (bottom chord) � 10 psf � 2 ft � 20 lb/ftTL
Floor Dead LoadFloor covering/finishes � 4.0 psf
(assume -in. hardwood)7–8
1-in. plywood sheathing (0.4 psf/ in. � 8)1–8 � 3.2 psf
Framing (assume 2 � 14 at 12 in. o.c.) � 4.4 psf
-in. gypsum ceiling (� 5 psf/ in. � in.)5 5– –8 8 � 3.2 psf
Mechanical and electrical � 5.0 psf
B U I L D I N G D E S I G N C A S E S T U D Y � 283
Partitions (assumed) � 20.0 psf
Total floor dead load Dfloor � 40 psf
Note that the minimum value allowed for partitions per IBC Section 1607.5 or ASCE 7 Section4.2.2 is 15 psf.
Floor Live LoadWe neglect floor live-load reduction for this design example. It should be noted that for
light-framed wood structures, the effect of floor live-load reduction is usually minimal. For officebuildings, the floor live load L � 50 psf (load is higher in corridor areas). The live-load reductionfactor for the various structural elements of this building will be determined in the design sectionsfor these structural elements.
Without live load reduction, the total floor load (in psf ) obtained using the IBC loadcombinations (Section 2.1) is
w � D � L � 40 � 50 � 90 psfTL
Wall Dead Loadin. plywood (exterior face of wall)1–2 � 1.6 psf
Stud wall framing (assume 2 � 6 studs at 2 ft o.c.) � 0.9 psf
Wood shingles � 3.0 psf
gypsum wallboard (interior face of wall)5–8 � 3.2 psf
1 in. fiberglass insulation � 1.1 psf
Total wall dead load Droof � 10 psf of vertical surface area
9.3 SEISMIC LATERAL LOADS
The lateral seismic loads on the building will now be calculated. The solution presented herewill be in accordance with ASCE 7-05 Section 12.14, which is a simplified analysis procedure.This procedure is permitted for wood-framed structures that are three stories and less in height.
Given:
Floor dead load � 40 psf (partitions included)
Roof dead load � 22.0 psf
Wall dead load � 10.0 psf (exterior walls)
Snow load P � 35 psfs
Site class � D (ASCE 7 Section 20.1)
importance I � 1.0 (ASCE 7 Table 11.5-1)e
S � 0.25% (ASCE Figure 22.1)S
S � 0.07% (ASCE 7 Figure 22.1)1
R � 6.5 (ASCE 7 Table 12.14-1)
F � 1.1 for two-story building (ASCE 7 Section 12.14.8.1)
Calculate W for each level (see Table 9.1). W is the seismic weight tributary to each level;it includes the weight of the floor structure, the weight of the walls, and the weight of a portionof the snow load. Where the flat roof snow load Pf is greater than 30 psf, 20% of the flat roofsnow load is included in the tributary seismic weight at the roof level (ASCE 7 12.7.2).

284 � S T R U C T U R A L W O O D D E S I G N
TABLE 9.1 Self-Weight of Each Level
Level Area (ft2)Tributary Height
(ft)
Weight
Floor Exterior Walls Wtotal
Roof 30 ft � 48 ft� 1440 ft2
(12 ft /2) � (5 ft /2)� 8.5 ft (short)
(12 ft /2) � 6 ft(long)
(1440 ft2)[22 psf� (0.2 � 35 psf )]� 41.8 kips
[(8.5 ft)(10 psf )(2)(30 ft)]� [(6 ft)(10 psf )(2)(48 ft)]� 10.9 kips
41.8 kips � 10.9 kips� 52.7 kips
Secondfloor
30 ft � 48 ft� 1440 ft2
(12 ft /2) � (12 ft /2)� 12 ft
(1440 ft2)(40 psf )� 57.6 kips
(12 ft)(10 psf )(2)(30 ft � 48 ft)� 18.8 kips
57.6 kips � 18.8 kips� 76.4 kips
Total weight � 52.7 kips � 76.4 kips � 129.1 kips
Seismic variables:
F � 1.6 (ASCE 7 Table 11.4-1)a
F � 2.4 (ASCE 7 Table 11.4-2)v
S � F S � (1.6)(0.25) � 0.40 (ASCE 7 Equation 11.4-1)MS a S
S � F S � (2.4)(0.07) � 0.168 (ASCE 7 Equation 11.4-2)M1 v 1
2 2– –S � S � ( )(0.40) � 0.267 (ASCE 7 Equation 11.4-3)DS 3 MS 3
2 2– –S � S � ( )(0.168) � 0.112 (ASCE 7 Equation 11.4-4)D1 3 M1 3
Base shear:
FS WDSV � (ASCE 7 Equation 12.14-11)R
(1.1)(0.267)(129.1)� � 5.84 kips
6.5
Force at each level:
FS WDS xF � (ASCE 7 Equations 12.14-11 and 12.14-12)x R
(1.1)(0.267)(52.7)F � � 2.38 kipsR 6.5
(1.1)(0.267)(76.4)F � � 3.46 kips2 6.5
These values will be used later for the analysis and design of the diaphragm and shear walls. Theseismic loads are summarized in Figure 9.2.
9.4 WIND LOADS
The wind loads on the building will now be calculated. For simplicity, the overhangs are ne-glected for this example.

B U I L D I N G D E S I G N C A S E S T U D Y � 285
FIGURE 9.2 Summaryof seismic loads.
Given:
V � 90 mph
I � 1.0w
Mean roof height � 12 ft � 12 ft � (5 ft/2) � 26.5 ft
Exposure � C (assumed)
4�1� � tan � 18.4�
12
From ASCE 7 Figure 6-2 and with reference to Figure 9.3, the following base wind pressuresare obtained:
Wind pressures on MWFRS (Transverse):
Zone A � 17.8 psf
Zone B � �4.7 psf (use 0 psf per ASCE 7 Figure 6.2)
Zone C � 11.9 psf
Zone D � �2.6 psf (use 0 psf per ASCE 7 Figure 6.2)
Zone E � �15.4 psf
Zone F � �10.7 psf
Zone G � �10.7 psf
Zone H � �8.1 psf

286 � S T R U C T U R A L W O O D D E S I G N
FIGURE 9.3 Wind loads on MWFRS. (Adapted from Ref. 5, Figure 1609.6.2.1.)
Wind pressures on MWFRS (Longitudinal):
Zone A � 12.8 psf
Zone C � 8.5 psf
Zone E � �15.4 psf
Zone F � �8.8 psf
Zone G � �10.7 psf
Zone H � �6.8 psf
Note: Zones A and C are horizontal wind pressures on vertical walls, B and D are horizontalwind pressures on the sloped roof, and E through G are vertical wind pressures on the roof.
For the MWFRS, the end zone width � 2a (per ASCE 7 Figure 6-2), where
a � 0.1 � least horizontal dimension of building
� 0.4 � mean roof height of the building and
� 0.04 � least horizontal dimension of building
� 3 ft
Therefore, a � (0.1)(30 ft) � 3 ft (governs)
� (0.4)(26.5 ft) � 10.6 ft
� (0.04)(30 ft) � 1.2 ft
� 3 ft
a � 3 ft
Average horizontal wind pressures:Transverse:
(17.8 psf )(2)(3 ft) � [(11.9 psf )(48 ft � (2)(3 ft)]q � � 12.64 psfavg 48 ft

B U I L D I N G D E S I G N C A S E S T U D Y � 287
TABLE 9.2 Transverse and Longitudinal Winds, MWFRS
Level Elevation
Exposure/HeightCoefficient atMean Roof
Height, � (ASCE 7Figure 6-2 byinterpolation)
AverageHorizontal
WindPressure,
qavg
Design Horizontal WindPressure, �Iwqavg
Total Unfactored Wind Load onthe Building at Each Level
Transverse Wind
Roof 24 ft 1.37 12.64 psf (1.37)(1.0)(12.64) � 17.3 psf (17.3 psf ) (12 ft /2)(48 ft)� 5.0 kips
Second floor 12 ft 1.37 12.64 psf (1.37)(1.0)(12.64) � 17.3 psf (17.3 psf )(12 ft /2 � 12 ft/2)(48 ft)� 10.0 kips
Base shear � 5.0 � 10.0 � 15.0 kips
Longitudinal Wind
Roof 26.5 ft 1.37 9.36 psf (1.37)(1.0)(9.36) � 12.9 psf (12.9 psf )(12 ft /2 � 5 ft/2)(30 ft)� 3.3 kips
Seocnd floor 12 ft 1.37 9.36 psf (1.37)(1.0)(9.36) � 12.9 psf (12.9 psf )(12 ft /2 � 12 ft/2)(30 ft)� 4.7 kips
Base shear � 3.3 � 4.7 � 8.0 kips
Note: mean roof height � 26.5 ft
Longitudinal:
(12.8 psf )(2)(3 ft) � [(8.5 psf )(30 ft � (2)(3 ft)]q � � 9.36 psfavg 30 ft
The average horizontal pressures must now be modified for height and exposure. Thehorizontal forces on the MWFRS are given in Table 9.2.
The vertical pressures (i.e., zones E through G) must now be modified for height andexposure (havg � 26.5 ft). The average uplift pressures on the roof are calculated by multiplyingthe adjusted wind pressures in each area by the corresponding roof area and summing up allthese forces and dividing by the total roof area (see Figure 9.3). The vertical forces on theMWFRS are given in Table 9.3.
These uplift forces will need a load path from the roof to the foundation. The truss hold-down anchors were designed earlier for higher wind forces using components and cladding. Theuplift forces shown in Table 9.3 can conservatively be added to the tension forces in the shearwall chords, which will be designed in a later section. Based on the shear wall layout, there area total of ten shear walls (each 8 ft long) with hold-down anchors and chords at each end ofthe wall yielding a total of twenty shearwall chords and hold-down anchors. Therefore, the upliftload due to wind on each anchor and shearwall chord is:
14,200 lbU � � 710 lb
20 chords
All of the adjusted wind pressures on the MWFRS are summarized in Figure 9.4.
9.5 COMPONENTS AND CLADDING WIND PRESSURES
The tabulated components and cladding (C&C) wind pressures on projected vertical and hori-zontal surface areas of the building are obtained below for each zone from ASCE 7 Figure 6-3,

288 � S T R U C T U R A L W O O D D E S I G N
TABLE 9.3 Average Uplift Pressures, MWFRS
Direction
Exposure/HeightCoefficient atMean Roof
Height, � (ASCE 7Figure 6-2) Total Vertical Wind Force
Average UpliftPressure, qu
Transverse 1.37 (15.4 psf � 10.7 psf )(2)(3 ft)(15 ft)� (10.7 psf � 8.1 psf )[48 ft �(2)(3 ft)](15 ft) � 14.2 kips
� 9.9 psf14,200
(30 ft)(48 ft)
Longitudinal 1.37 (15.4 psf � 8.8 psf )(2)(3 ft)(24 ft)� (10.7 psf � 6.8 psf)[30 ft � (2)(3 ft)](24 ft) � 13.6 kips
� 9.5 psf13,600
(30 ft)(48 ft)
FIGURE 9.4 Adjustedwind loads onMWFRS.

B U I L D I N G D E S I G N C A S E S T U D Y � 289
based on a 90-mph wind speed, a roof slope of 18.43�, and the effective wind area Ae (see Tables9.4 to 9.6).
Typical exterior wall stud:
Floor-to-floor height � 12 ft
Spacing of stud � 2 ft
1 1– –Effective width per ASCE 7 Section 6-2 � span � ( )(12 ft) � 4 ft3 3
2Effective wind area A � (4 ft)(12 ft) � 48 fte
Typical roof truss:
Main span � 30 ft
Spacing of trusses � 2 ft
1 1– –Effective width of truss per ASCE 7 Section 6-2 � span � ( )(30 ft) � 10 ft3 3
2Effective wind area A � (10 ft)(30 ft) � 300 fte
Roof overhang length � 2 ft
1 1– –Effective width of roof overhang per ASCE 7 Section 6-2 � span � ( )(2 ft) � 0.67 ft3 3
2Effective wind area A � (0.67 ft)(2 ft) � 1.34 fte
The components and cladding (C&C) wind pressures below are obtained from ASCE 7 Table6-3, and will be used later for the design of the exterior wall stud and the design of the rooftruss hold-down strap anchors. The roof has a pitch of 4-in-12 which yields a roof slope of18.4�.
For C&C, the end zone width � a per ASCE 7 Figure 6-3, where
a � 0.1 � least horizontal dimension of building � (0.1)(30 ft) � 3 ft
� 0.4 � mean roof height of the building � (0.4)(26.5 ft) � 10.6 ft
� 3 ft
Therefore, the end zone width a � 3 ft.
Exposure classification � C (assumed)
Mean roof height � 26.5 ft
Linearly interpolating from ASCE 7 Figure 6-3, the height/exposure adjustment coefficient �is calculated as shown in Table 9.5.
The mean roof height has been calculated previously to be 26.5 ft. The correspondingheight/exposure adjustment factor, � is calculated by linear interpolation of ASCE 7 Table 6-3to be 1.37.
Importance factor I � 1.0w
The design C&C wind pressures are obtained by multiplying the tabulated C&C wind pressuresabove by the height/exposure adjustment factor and the importance factor.
Since the stud spacing is 2 ft and the edge zone width is 3 ft, the ground-floor and secondfloor studs located 2 ft from any corner of the building will be subjected to the maximumhorizontal design wind suction of 22.6 psf and a pressure of 17.8 psf.
From the applicable gable roof plan (7� � � � 45�) in ASCE 7 Figure 6-3, the total winduplift pressures on the roof are as shown in Figure 9.5. These values are used to calculate the

290 � S T R U C T U R A L W O O D D E S I G N
TABLE 9.4 Horizontal and Vertical Wind Pressures,Components and Cladding (psf )
ZonePositivePressure
NegativePressure or
Suction
Horizontal Pressures on Wall a
Wall interior zone 4 13.0 �14.3
Wall end zone 5 13.0 �16.5
Vertical Pressures on Roof b
Roof interior zone 1 5.9 �12.1
Roof end zone 2 5.9 �17.0
Roof corner zone 3 5.9 �26.9
Vertical Pressures on a 2-ft Roof Overhang c
Roof end zone 2 �27.2
Roof corner zone 3 �45.7
a Horizontal wind pressures for longitudinal as well as transversewind. The effective wind area Ae calculated � 50 ft2.b Positive pressure indicates downward wind loads and negativepressure indicates upward wind load that causes uplift. The effectivewind area Ae calculated is 300 ft2. (Use the tabulated pressures forAe � 100 ft2.)c The effective wind area calculated for the roof truss overhang isless than 10 ft2. From ASCE 7 Figure 6-3, the roof overhang is inzone 2 for the interior zone roof trusses and in zone 3 for the endzone roof trusses (see Figure 9.5).
TABLE 9.5 Design Horizontal and Vertical Wind Pressures, �IwPnet30, Components and Cladding (psf )
Horizontal Pressures on Ground Floor and Second Floor Walls a
Zone Positive PressureNegative Pressure or
Suction
Wall interior zone 4 (1.37)(1.0)(13.0) � 17.8 (1.37)(1.0)(�14.3) � �19.6
Wall end zone 5 (1.37)(1.0)(13.0) � 17.8 (1.37)(1.0)(�16.5) � �22.6
Vertical Pressures on Roof b
Positive Pressure Negative PressureNet Uplift Pressure
(psf )
Roof interior zone 1 (1.37)(1.0)(5.9) � 8.1 � 10Use 10 psf minimum
(1.37)(1.0)(�12.1) � �16.6 0.6(18.5 psf ) � 16.6 psf� �5.5 psf
Roof end zone 2 (1.37)(1.0)(5.9) � 8.1 � 10Use 10 psf minimum
(1.37)(1.0)(�17.0) � �23.3 0.6(18.5 psf ) � 23.3 psf� �12.2 psf
Roof corner zone 3 (1.37)(1.0)(5.9) � 8.1 � 10Use 10 psf minimum
(1.37)(1.0)(�26.9) � �36.9 0.6(18.5 psf ) � 36.9 psf� �25.8 psf
Vertical Pressures on 2-ft Roof Overhang b
Roof end zone 2ov (1.37)(1.0)(�27.2) � �37.3 0.6(18.5 psf ) � 37.3 psf� �26.2 psf
Roof corner zone 3ov (1.37)(1.0)(�45.7) � �62.6 0.6(18.5 psf ) � 62.6 psf� �51.5 psf
a Horizontal wind pressures for longitudinal as well as transverse wind.b Positive pressure indicates downward wind loads, and negative pressure indicates upward wind load that causes uplift.Net uplift wind pressures on the roof are calculated above using the dead load of 18.5 psf which is the total roof deadload excluding the weight of the reroofing as calculated in Section 9.2
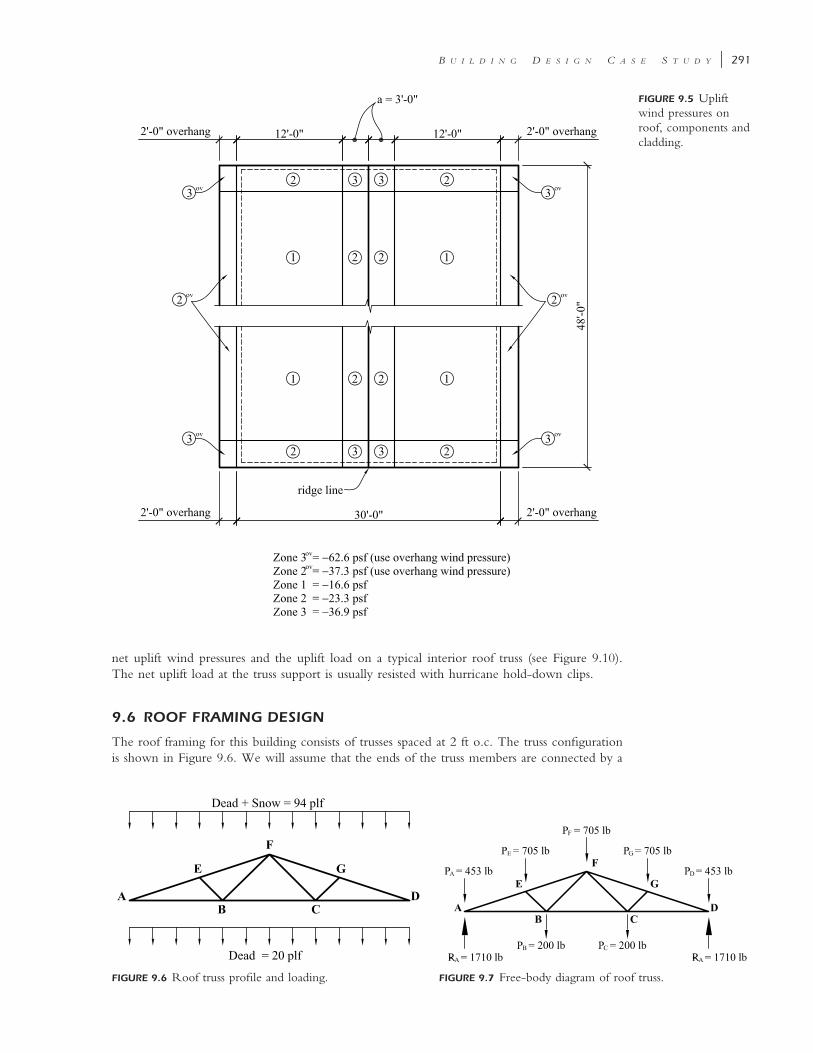
B U I L D I N G D E S I G N C A S E S T U D Y � 291
FIGURE 9.5 Upliftwind pressures onroof, components andcladding.
FIGURE 9.6 Roof truss profile and loading. FIGURE 9.7 Free-body diagram of roof truss.
net uplift wind pressures and the uplift load on a typical interior roof truss (see Figure 9.10).The net uplift load at the truss support is usually resisted with hurricane hold-down clips.
9.6 ROOF FRAMING DESIGN
The roof framing for this building consists of trusses spaced at 2 ft o.c. The truss configurationis shown in Figure 9.6. We will assume that the ends of the truss members are connected by a

292 � S T R U C T U R A L W O O D D E S I G N
toothed plate or nailed plywood gusset plate; therefore, there is no reduction in the gross area.The span of the roof truss center to center of the exterior wall supports is 30 ft less the studwall thickness. If we assume 2 � 6 studs, the actual center-to-center span of the roof truss willbe 29.54 ft (i.e., 30 ft � 5.5 in./12). However, for simplicity, we will assume a span of 30 ftin the analysis and design of the roof truss, and this will not significantly affect or alter the trussdesign because of the very small difference (less than 2%) between the actual span and the 30-ft span used in our design.
Analysis of a Roof Truss
The total roof load of 57 psf was calculated in section 9.2 without consideration of the downwardwind load acting on the roof. We will now determine if this downward wind load in combi-nation with other loads is critical for this building.
The calculated roof dead and snow loads from Section 9.2 and the calculated downwardwind load from Section 9.5 are as follows;
D � 22 psf
S � 35 psf
W � 10 psf (downwards)
Using the normalized load method presented in Chapter 3 and using the applicable load com-binations from Section 2.1 yields
D � S � 22 � 35 � 57 psf; (D � S )/C � 57/1.15 � 49.6 psf (governs)D
D � W � 22 � 10 � 32 psf, (D � W )/C � 32/1.6 � 20 psfD
D � 0.75W � 0.75S � 22 � 0.75(10 � 35) � 56 psf,
(D � 0.75W � 0.75S )/C � 56/1.6 � 35 psfD
Therefore, the D � S combination is more critical than the wind load combinations as originallyassumed. We will now proceed to design the roof truss members for the total load of 57 psfwith a CD of 1.15.
The concentrated gravity loads at the top and bottom chord joints of the roof truss (Figure9.7) are calculated as follows, using the uniformly distributed total loads of 94 lb/ft and 20 lb/ft obtained in Section 9.2 for the truss top and bottom chords, respectively.
Top chord—roof dead load � snow load:
P (top) � (7.5 ft/2)(94 lb/ft) � 353 lbA
P � (7.5 ft/2 � 7.5 ft/2)(94 lb/ft) � 705 lbE
P � (7.5 ft/2 � 7.5 ft/2)(94 lb/ft) � 705 lbF
P � (7.5 ft/2 � 7.5 ft/2)(94 lb/ft) � 705 lbG
P (top) � P (top) � 353 lbD A
Bottom chord—dead load only, due to ceiling (there is no live load on the bottom chord ofthis truss):
P (bottom) � (10 ft/2)(20 lb/ft) � 100 lbA
P � (10 ft/2 � 10 ft/2)(20 lb/ft) � 200 lbC
P � (10 ft/2 � 10 ft/2)(20 lb/ft) � 200 lbC
P (bottom) � (10 ft/2)(20 lb/ft) � 100 lbD
The truss is then analyzed using the method of joints or computer structural analysis softwareto obtain the member forces as follows (C � compression and T � tension).

B U I L D I N G D E S I G N C A S E S T U D Y � 293
Top chord members:
AE � GD � 3980 lb (C)
EF � FG � 3420 lb (C)
Bottom chord members:
AB � CD � 3770 lb (T)
BC � 2520 lb (T)
Web members:
EB � GC � 750 lb (C)
FC � BF � 1030 lb (T)
In addition to the axial forces on the top chord and bottom chord members, there arebending loads of 94 and 20 lb/ft on the top and bottom chords, respectively. These loads willbe considered in the design of the top and bottom chord members of the roof truss.
Design of Truss Web Tension Members
1. The maximum tension force in the web tension members from the structural analysisabove is 1030 lb.
2. Assume member size: Try a 2 � 4, which is dimension lumber. Use NDS-S Table 4A.From NDS-S Table 1B, the gross area Ag for a 2 � 4 � 5.25 in2. The wood species(spruce-pine-fir) to be used is specified in the design brief; we assume a No. 3 stressgrade.
3. From NDS-S Table 4A (SPF No. 3), we obtain the tabulated design tension stress andthe adjustment factors as follows: Design tension stress Ft � 250 psi. Adjustment or Cfactors:
C � 1.15 (the C value for the shortest-duration load in the load combinationD D
is used, i.e., snow load; see Section 3.1)
C � 1.0 (normal temperature conditions)t
C � 1.0 (dry service, since the truss members are protected from weather)M
C (F ) � 1.5F t
Using the NDS applicability table (Tables 3.1), the allowable tension stress is given as
F� � F C C C C Ct t D M t F i
� (250)(1.15)(1.0)(1.0)(1.5)(1.0) � 431.3 psi
Since toothed plate or nailed plywood gusset plate connections are assumed, the net areawill be equal to the gross area since there are no bolt holes that will lead to a reductionin the gross area.
2A � A � 5.25 inn g
4. Applied tension stress
T 1030 lbf � � � 197 psi � F� � 431.3 psi OKt t2A 5.25 inn
A 2 � 4 SPF No. 3 is adequate for the truss web tension member.
Design of Truss Web Compression Members
Since a 2 � 4 member was selected for the truss web tension member, we assume a 2 � 4 trialsize for the web compression member. As determined for the web tension member, the 2 � 4

294 � S T R U C T U R A L W O O D D E S I G N
is dimension lumber, for which NDS-S Table 4A is applicable. From the table the stress ad-justment or C factors are
C � 1.0 (normal moisture conditions)M
C � 1.0 (normal temperature conditions)t
C � 1.15 (the C value for the shortest-duration load in the load combinationD D
is used, i.e., snow load; see Section 3.1)
C (F ) � 1.15F c
C � 1.0 (no incisions are specified in the wood for pressure treatment)i
From NDS-S Table 4C, the tabulated design stresses are obtained as follows:
F � 650 psi (compression stress parallel to the grain)c
6E � 1.2 � 10 psi (reference modulus of elasticity)
6E � 0.44 � 10 psi (buckling modulus of elasticity)min
The member dimensions are dx � 3.5 in. and dy � 1.5 in.The member length � � 3.54 ft.2 2�(2.5 ft) � (2.5 ft)The cross-sectional area Ag � 5.25 in2.
The effective length factor Ke is assumed to be 1.0 (see Section 5.4); therefore, the slendernessratios about the x–x and y–y axes are given as
l (1.0)(3.54 ft � 12)e � � 12.1 � 50 OKd 3.5 in.x
l (1.0)(3.54 ft � 12)e � � 28.3 (governs) � 50 OKd 1.5 in.y
Using the applicability table (Table 3.1), the allowable modulus of elasticity for buckling cal-culations is given as
E� � E C C Cmin min M t i
6 6� (0.44 � 10 )(1.0)(1.0)(1.0) � 0.44 � 10 psi
c � 0.8 (sawn lumber)
The Euler critical buckling stress is calculated as
60.822E� (0.822)(0.44 � 10 )minF � � � 452 psicE 2 2(l /d ) (28.3)e
F* � F C C C C Cc c D M t F i
� (650)(1.15)(1.0)(1.0)(1.15)(1.0) � 860 psi
F 452 psicE � � 0.526F* 860 psic
From equation (5.21), the column stability factor is calculated as
21 � 0.526 1 � 0.526 0.526C � � � � 0.452� �P �(2)(0.8) (2)(0.8) 0.8

B U I L D I N G D E S I G N C A S E S T U D Y � 295
The allowable compression stress
F� � F*C � (860)(0.452) � 389 psic c P
The applied compression stress
F 750 lbf � � � 143 psi � F� � 389 psit c2A 5.25 ing
A 2 � 4 SPF No. 3 is adequate for the truss web compression member.
Design of Truss Bottom Chord Members
The bottom chord members are subjected to combined axial tension plus bending caused by the
FIGURE 9.8 Free-bodydiagram of member AB.
uniformly distributed load of 20 lb/ft from the insulation, ceiling, and mechanical andelectrical equipment loads. The most critical bottom chord member is member AB orCD, and the forces in this member include an axial tension force of 3770 lb (caused bydead load plus snow load) combined with a uniformly distributed dead load of 20 lb/ft, as shown in Figure 9.8.
Selection of a Trial Member SizeAssume 2 � 6 SPF No. 2 sawn lumber. The gross cross-sectional area and the
section modulus can be obtained from NDS-S Table 1B as follows:
2A � 8.25 ing
3S � 7.563 inxx
The length of this member � 10 ft. Since the trial member is dimension lumber, NDS-S Table4A is applicable. From the table we obtain the tabulated design stresses and stress adjustmentfactors.
F � 875 psi (tabulated bending stress)b
F � 450 psi (tabulated tension stress)t
C (F ) � 1.3 (size adjustment factor for bending stress)F b
C (F )� 1.3 (size adjustment factor for tension stress)F t
C � 1.15 (for design check with snow load)D
C � 0.9 (for design check with dead load only)D
C � 1.0 (assuming lateral buckling is prevented by the ceiling and bridging)L
C � 1.15 (all three repetitive member requirements are met;r
see Section 3.1)
C � 1.0 (there are no incisions specified in the wood for pressure treatment)i
Design Check 1:
The applied tension force T � 3770 lb (caused by dead load � snow load).The net area An � Ag (toothed plated or nailed plywood plate connection assumed) �8.25 in2.From equation (5.4), the applied tension stress at the supports,
T 3770 lbf � � � 457 psit 2A 8.25 inn
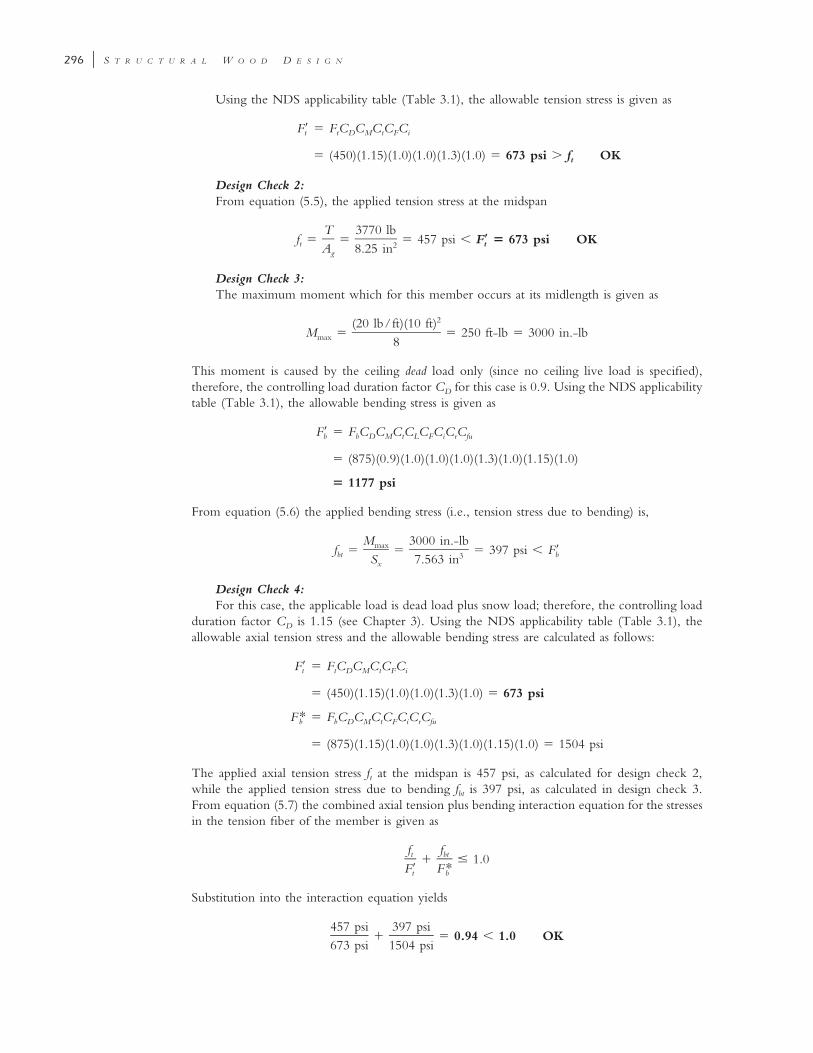
296 � S T R U C T U R A L W O O D D E S I G N
Using the NDS applicability table (Table 3.1), the allowable tension stress is given as
F� � F C C C C Ct t D M t F i
� (450)(1.15)(1.0)(1.0)(1.3)(1.0) � 673 psi � f OKt
Design Check 2:From equation (5.5), the applied tension stress at the midspan
T 3770 lbf � � � 457 psi � F� � 673 psi OKt t2A 8.25 ing
Design Check 3:The maximum moment which for this member occurs at its midlength is given as
2(20 lb/ft)(10 ft)M � � 250 ft-lb � 3000 in.-lbmax 8
This moment is caused by the ceiling dead load only (since no ceiling live load is specified),therefore, the controlling load duration factor CD for this case is 0.9. Using the NDS applicabilitytable (Table 3.1), the allowable bending stress is given as
F� � F C C C C C C C Cb b D M t L F i r fu
� (875)(0.9)(1.0)(1.0)(1.0)(1.3)(1.0)(1.15)(1.0)
� 1177 psi
From equation (5.6) the applied bending stress (i.e., tension stress due to bending) is,
M 3000 in.-lbmaxf � � � 397 psi � F�bt b3S 7.563 inx
Design Check 4:For this case, the applicable load is dead load plus snow load; therefore, the controlling load
duration factor CD is 1.15 (see Chapter 3). Using the NDS applicability table (Table 3.1), theallowable axial tension stress and the allowable bending stress are calculated as follows:
F� � F C C C C Ct t D M t F i
� (450)(1.15)(1.0)(1.0)(1.3)(1.0) � 673 psi
F* � F C C C C C C Cb b D M t F i r fu
� (875)(1.15)(1.0)(1.0)(1.3)(1.0)(1.15)(1.0) � 1504 psi
The applied axial tension stress ft at the midspan is 457 psi, as calculated for design check 2,while the applied tension stress due to bending fbt is 397 psi, as calculated in design check 3.From equation (5.7) the combined axial tension plus bending interaction equation for the stressesin the tension fiber of the member is given as
f ft bt� � 1.0F� F*t b
Substitution into the interaction equation yields
457 psi 397 psi� � 0.94 � 1.0 OK
673 psi 1504 psi

B U I L D I N G D E S I G N C A S E S T U D Y � 297
Design Check 5:The applied compression stress due to bending is
M 3000 in.-lbmaxf � � � 397 psi (� f since this is a rectangular cross section)bc bt3S 7.563 inx
It should be noted that fbc and fbt are equal for this problem because the wood member isrectangular in cross section. The load duration factor for this case CD � 1.15 (combined dead� snow loads). Using the NDS applicability table (Table 3.1), the allowable compression stressdue to bending is
F� � F C C C C C C Cb b D M t L F i r
� (875)(1.15)(1.0)(1.0)(1.0)(1.3)(1.0)(1.15) � 1504 psi
From equation (5.10) the interaction equation for this design check is given as
f � fbc t � 1.0F�b
Substituting in the interaction equation yields
397 psi � 457 psi� �0.04 � 1.0 OK
1504 psi
From all of the steps above, we find that all the five design checks are satisfied; therefore, use a2 � 6 SPF No. 2 for the bottom chord.
Design of Truss Top Chord Members
The top chord members are subjected to combined axial compression plus bending caused by
FIGURE 9.9 Load on truss topchord.
the uniformly distributed dead load and snow load of 94 lb/ft. The most critical topchord member is member AE or GD, and the forces in this member include an axialcompression force of 3980 lb combined with a uniformly load of 94 lb/ft, as shownin Figure 9.9.
Selection of a Trial Member SizeAssume 2 � 6 SPF sawn lumber. The design aids in Appendix B are utilized to
design this member. The length of this member � � 7.91 ft.2 2�(7.5 ft) � (2.5 ft)It should be noted that for each design check, the controlling load duration factorvalue will correspond to the CD value of the shortest-duration load in the load com-bination for that design case. Thus, the CD value for the various design cases may vary.The reader will find that design check 4 will govern, and therefore the design aids inAppendix B can conservatively be used to select an appropriate member.
Design Check 1: Compression on Net AreaThis condition occurs at the ends (i.e., supports) of the member. For this load case, the axial
load P is caused by dead load plus snow load (D � S ); therefore, the load duration factor CD
from Chapter 3 is 1.15. The worst-case axial load for this case is P � 3980 lb.
Design Check 2: Compression on Gross AreaThis condition occurs at the midspan of the member. The axial load P for this load case is
also caused by dead load plus snow load (D � S ); therefore, the load duration factor CD fromChapter 3 is 1.15. The worst-case axial load for this case is P � 3980 lb.
Design Check 3: Bending OnlyThis condition occurs at the point of maximum moment (i.e., at the midspan of the member),
and the moment is caused by the uniformly distributed gravity load on the top chord (member

298 � S T R U C T U R A L W O O D D E S I G N
TABLE 9.7 Summary of Truss Member Sizes and StressGrades
Truss MemberMember Size and
Stress Grade
Top chord 2 � 6 SPF Select Structural
Bottom chord 2 � 6 SPF No. 2a
Web members 2 � 4 SPF No. 3
a For simplicity and to avoid construction errors, it may be prudentto use the same size and stress grade for the top and bottom chords.In that case, 2 � 6 SPF Select Structural would be used for thebottom chord as well as the top chord.
AE ), and since this load is dead load plus snow load, the controlling load duration factor (seeChapter 3) is 1.15.
The horizontal span of the sloped member, AE � 7.5 ft.The maximum moment in member AD
2w LD�SM �max 8
2(94 lb/ft)(7.5 ft)� � 661 ft-lb
8
Design Check 4: Bending plus Axial Compression ForceThis condition occurs at the midspan of the member. For this load case, the loads causing
the combined stresses are dead load plus snow load (D � S ); therefore, the controlling loadduration factor CD is 1.15. It should be noted that because the load duration factor CD for thiscombined load case is the same as for load cases 2 and 3, the parameters to be used in thecombined stress interaction equation can be obtained from design checks 2 and 3. The readeris cautioned to be aware that the CD value for all four design checks are not necessarily alwaysequal and has to be determined for each case.
The loads for this case are
P � 3980 lb
M � 661 ft-lb
By inspection, the loads from this case will control. From Figure B.43, the axial load capacityat a moment of 661 ft-lb is approximately 4000 lb. Note that the load duration factor used inFigure B.43 is CD � 1.0, so the use of this design aid is somewhat conservative, but appropriate.Therefore, use a 2 � 6 SPF Select Structural for the top chord.
The truss member sizes and stress grades are summarized in Table 9.7.Gable and hip roofs must not only be designed for the balanced snow loads discussed in
Chapter 2, and used to design the roof truss in this section, but the unbalanced snow loadsprescribed in the ASCE 7 load standard must also be considered in design, because often times,these unbalanced loads might lead to higher stresses in the truss members compared to the stressesdue to the balanced snow load. In our building design case study, the applied stresses due tounbalanced snow load are smaller that those due to the balanced snow load except in the trussweb members where there was approximately a 20% increase in stress due to unbalanced snowloads. However, since the applied stress in the actual web members selected were only about50% of the allowable stress, the roof truss members in this building design case study would stillbe adequate to support the unbalanced snow loads. The reader should refer to Sections 7.6though 7.9 of ASCE 7 for a full discussion of unbalanced snow load, snow drift loads and slidingsnow loads.

B U I L D I N G D E S I G N C A S E S T U D Y � 299
(a)
FIGURE 9.10a Netwind uplift pressureson a typical interiorroof truss.
(b)
FIGURE 9.10b Roof truss uplift connector.
Net Uplift Load on a Roof Truss
The net uplift load on a typical interior zone roof truss is calculated using the design uplift windpressures calculated in Table 9.5. This uplift load will be used to determine the size of the rooftruss hold-down straps or hurricane clips. Using Table 9.5, Figures 9.5 and 9.10a, the total netuplift load at the typical interior roof truss supports is 310 lb. The roof truss hold-down strapwill be designed to resist this net uplift force of 310 lb. A hurricane tie down anchor HT-1 isadequate to resist this force and has an allowable uplift resistance of 390 lb with a load durationfactor of 1.6 as indicated in the generic connector selection table shown in Table 9.10b.
9.7 SECOND-FLOOR FRAMING DESIGN
In this section the typical sawn-lumber floor joist and typical glulam girder are designed (Figure9.11). It is assumed that the floor joist will be simply supported and supported off the face of

300 � S T R U C T U R A L W O O D D E S I G N
FIGURE 9.11 Second-floor framing plan. FIGURE 9.12 Free-body diagram of a typical floor joist.
the glulam girder with joist hangers. To illustrate the use of the design aids presented in AppendixB, the floor joist will be designed using the design aids.
Design of a Typical Floor Joist
Joist span � 15 ft (the actual center-to-center span of the joist will be slightly less than this).From Section 9.2 the dead load was calculated as 40 psf and the floor live load is 50 psf. Thetotal floor load (in psf ) using the IBC load combinations (See Section 2.1) is
w � D � L � 40 � 50 � 90 psfTL
2 2Tributary area of typical floor joist � (2 ft)(15 ft) � 30 ft � 150 ft
From Section 2.4,
2A � tributary area � 30 ft and K � 2 (interior beam)T LL
2 2 2K A � (2)(30 ft ) � 60 ft � 400 ftLL T
Therefore, live load reduction is not permitted.The tributary width (TW) of a typical floor joist � 2 ft. The total uniform load on the
joist that will be used to design the joist for bending, shear, and bearing is

B U I L D I N G D E S I G N C A S E S T U D Y � 301
w � (D � L)(TW ) � (40 psf � 50 psf )(2ft) � 180 lb/ftTL
Using the free-body diagram of the typical floor joist (Figure 9.12), the load effects are calculatedas follows:
w L (180 lb/ft)(15 ft)TLmaximum shear V � � � 1350 lbmax 2 2
maximum reaction R � 1350 lbmax
2 2w L (180 lb/ft)(15 ft)TLmaximum moment M � � � 5063 ft-lb � 60,756 in.-lbmax 8 8
Using Figure B.8, the allowable uniform load for a 2 � 14 SPF No. 1/No. 2 is approximately120 plf. Therefore, use two 2 � 14’s at 24 in. o.c. since the total load carrying capacity is (2)(120plf ) � 240 plf, which is greater than the applied load of 180 plf.
The required adjustment factors for the floor joists are:
load duration C � 1.0 (dead load plus live load)D
moisture factor C � 1.0 (dry service conditions assumed)M
temperature factor C � 1.0 (normal temperature conditions apply)t
bearing factor C � 1.0b
Check of Bearing Stress (Compression Stress Perpendicular to the Grain)
Maximum reaction at the support R1 � 1350 lb.Thickness of two 2 � 14 sawn-lumber joists b � (2) � (1.5 in) � 3 in.The allowable bearing stress or compression stress parallel to grain is
F� � F C C C � (425)(1)(1)(1) � 425 psic� c� M t b
From equation (4.9) the minimum required bearing length lb is
R 1350 lb1l � � � 1.1 in.b,req’d bF (3.0 in.)(425 psi)c�
The floor joists will be connected to the floor girder using face-mounted joist hangers withthe top of the joists at the same level as the top of the girders (see Figure 4.6b). The readershould select from one of the proprietary wood connector catalogs a joist hanger that meets thefollowing requirements:
• The bearing length provided by the joist hanger should be at least in.1–18
• The joist hanger should have enough width to accommodate the two 2 � 14 floor joists.• The joist hanger must have a capacity of at least 1350 lb using a load duration factor of
100% (i.e., CD � 1 for dead load � floor live load).
Use two 2 � 14’s at 24 in. o.c. SPF No. 1/No. 2 for the floor joists.
Design of a Glulam Floor Girder
This glulam girder could be designed as continuous over several supports, which will result ina smaller member compared to simply supported girders. However, hauling a 48-ft-long girderto the building site and maneuvering a beam that long on site may present problems for thecontractor. Alternatively, the glulam girder could be delivered to the site in two 24-ft-longpieces, thus indicating two two-span continuous girders. However, to give the contractor wideflexibility in choosing the best way to install this girder, we design the girders as four simplysupported members with 12-ft spans. This assumption will result in a larger member than if asingle 48-ft-long girder continuous over several supports was used. It is assumed that the floor

302 � S T R U C T U R A L W O O D D E S I G N
FIGURE 9.13 Free-body diagram ofgirder G1.
joists are supported on the face of the girder with face-mounted joist hangers; thus, the top ofthe glulam girder will be at the same elevation as the top of the floor joists. Assume that thegirder self-weight � 15 lb/ft (this will be checked later). As calculated in Section 9.2, the deadand live loads are as follows:
dead load D � 40 psf
floor live load L � 50 psf
15 ft 15 fttributary width (TW) of girder � � � 15 ft
2 2
2tributary area (TA) of girder G1 � (15 ft)(12 ft) � 180 ft
From Section 2.4,
2A � tributary area � 180 ft and K � 2 (interior girder)T LL
2 2 2K A � (2)(180 ft ) � 360 ft � 400 ftLL T
Therefore, live-load reduction is not permitted.The total uniform load on the girder that will be used to design for bending, shear, and
bearing is obtained below using the dead load, the live load, and the assumed self-weight of thegirder, which will be checked later.
w � (D � L)(tributary width) � girder self-weightTL
� (40 psf � 50 psf )(15 ft) � 15 lb/ft � 1365 lb/ft
Using the free-body diagram of the girder (Figure 9.13), the load effects are calculated as follows:
w L (1365 lb/ft)(12 ft)TLmaximum shear V � � � 8190 lbmax 2 2
maximum reaction R � 8190 lbmax
2 2w L (1365 lb/ft)(12 ft)TLmaximum moment M � � � 24,570 ft-lb � 294,840 in.-lbmax 8 8
The following loads will be used for calculating the joist deflections:
uniform dead load w � (40 psf )(15 ft) � 15 lb/ft � 615 lb/ft � 51.3 lb/in.DL
uniform live load w � (50 psf )(15 ft) � 750 lb/ft � 62.5 lb/in.LL
Note that if a four-span continuous girder had been assumed for this design, the maximummoment would have been 21,052 ft-lb [i.e., (0.1071)(1365 lb/ft)(12 ft)(12 ft)], a 17% reduction.The maximum shear would have been 9943 lb [i.e., (0.607)(1365 lb/ft)(12 ft)]. With a two-span continuous girder, the maximum moment would have been 24,570 ft-lb [i.e., (0.125)(1365lb/ft)(12 ft)(12 ft)], which is the same maximum moment calculated for a simply supportedgirder. The maximum shear would have been 10,238 lb [i.e., (0.625)(1365 lb/ft)(12 ft)].

B U I L D I N G D E S I G N C A S E S T U D Y � 303
We will now proceed with the design following the steps described in Section 4.1.
Check of Bending Stress (Girders)
1. Summary of load effects (the self-weight of the girder was assumed, but this will bechecked later in the design process):
maximum shear V � 8190 lbmax
maximum reaction R � 8190 lbmax
maximum moment M � 294,840 in.-lbmax
uniform dead load w � 51.3 lb/in.DL
uniform live load w � 62.5 lb/in.LL
2. For a glulam used primarily in bending, use NDS-S Table 5A–Expanded.3. Using NDS-S Table 5A–Expanded, assume a 24F–E11 HF/HF glulam, therefore, ��Fbx
2400 psi. Assume initially that � � 2400 psi. From equation (4.1) the required� �F� Fbx bx
approximate section modulus of the member is given as
M 294,840 in.-lbmax 3S � � � 122.9 inxx, req’d F 2400 psib, NDS-S
4. From NDS-S Table 1C (for western species glulam), the possible trial sizes that satisfy thesection modulus requirement of step 3 are
SIZE
(in.)b
(in.)d
(in.)Sxx
(in3)A
(in2)Ix
(in4)
� 181–22 2.5 18 135 45 1215
�1 1– –3 168 2 3.125 16.5 141.8 51.56 1170
� 151–32 3.5 15 131.3 52.5 984.4
Although the � 18 in. member has the least area, it is prudent in this case to1–22
limit the depth of the girder because we will be using the bottom edge of the girder toprovide lateral support to the columns since these girders are supported on top of thecolumns. To ensure this lateral support, the difference between the joist depth and thegirder depth should be kept to a minimum.
Try � in.1 1– –3 168 2
b � 3.125 in. and d � 16.5 in.
3 3S provided � 141.8 in � 122.9 in OKxx
2A provided � 51.56 in
4I provided � 1170 inxx
5. The NDS-S Table 5A–Expanded tabulated stresses are
�F � 2400 psibx
F � 215 psivxx
F � 500 psic�xx, tension lam
6E � 1.8 � 10 psix
6E � 1.5 � 10 psiy
6E � 0.78 � 10 psiy,min

304 � S T R U C T U R A L W O O D D E S I G N
TABLE 9.8 Stress Adjustment or C Factors for Glulam Floor Girders
Adjustment Factor Symbol Value Rationale for the Value Chosen
Beam stability factor CL 0.986 See calculation
Volume factor CV 1.0 See calculation
Curvature factor Cc 1.0 Glulam girder is straight
Flat use factor Cfu 1.0 Glulam is bending about its strong x–x axis
Moisture or wet service factor CM 1.0 Equilibrium moisture content is � 16%
Load duration factor CD 1.0 The largest CD value in the load combination of deadload plus snow load (i.e., D � L)
Temperature factor Ct 1.0 Insulated building; therefore, normal temperatureconditions apply
Bearing stress factor Cb 1.0Cb � for lb � 6 in.
l � 0.375b
lb� 1.0 for lb � 6 in.� 1.0 for bearings at the ends of a member
(see Section 3.1)
(Ey,min, not Ex,min, is required for lateral buckling of the girder about the weak axis.) Theadjustment or C factors are given in Table 9.8.
From the adjustment factor applicability table for glulams (Table 3.2), we obtain theallowable bending stress of the glulam girder with CV and CL equal to 1.0 as
� �F* � F C C C C C � (2400)(1.0)(1.0)(1.0)(1.0)(1.0) � 2400 psibx bx D M t fu c
The allowable pure bending modulus of elasticity and the bending stability modulus ofE�xelasticity are calculated asE�y,min
6 6E� � E C C � (1.8 � 10 )(1.0)(1.0) � 1.8 � 10 psix x M t
6 6E� � E C C � (0.78 � 10 )(1.0)(1.0) � 0.78 � 10 psiy,min y,min M t
Calculating the Beam Stability Factor CL
From equation (3.2) the beam stability factor is now calculated: The unsupported length ofthe compression edge of the beam or distance between points of lateral support preventingrotation and/or lateral displacement of the compression edge of the beam is
l � 2 ft � 24 in. (i.e., the distance between lateral supports provided by the joists)u
l 24 in.u � � 1.45d 16.5 in.
We have previously assumed a uniformly loaded girder; therefore, using the lu/d value, theeffective length of the beam of the beam is obtained from Table 3.9 (or NDS Code Table 3.3.3)as
l � 2.06l � (2.06)(24 in.) � 50 in.e u
l d (50)(16.5 in.)eR � � � 9.2 � 50 OKB 2 2� �b (3.125 in.)
61.20E� (1.20)(0.78 � 10 )minF � � � 11,058 psibE 2 2R (9.2)B
F 11,058 psibE � � 4.61F* 2400 psib
From equation (3.2), the beam stability factor is calculated as

B U I L D I N G D E S I G N C A S E S T U D Y � 305
21 � F /F* 1 � F /F* F /F*bE b bE b bE bC � � �� �L �1.9 1.9 0.95
21 � 4.61 (1 � 4.61) 4.61� � � � 0.986� ��1.9 1.9 0.95
Calculating the Volume Factor CV
L � length of beam in feet between points of zero moment � 12 ft(conservatively, assume that L � span of beam)
d � depth of beam � 16.5 in.
b � width of beam, in. (� 10.75 in.) � 3.125 in.
x � 10 (for western species glulam)
From equation (3.3),
1 / x 1 / x 1 / x 1 / x21 12 5.125 1291.5C � �� � � � � � � �V L d b bdL
1 / 101291.5� � 1.08 � 1.0� �(3.125 in.)(16.5 in.)(12 ft)
Therefore, CV is 1.0.The smaller of CV and CL will govern and is used in the allowable bending stress calculation.
Since CL � 0.986 � CV � 1.0, use CL � 0.0.986.Using Table 3.2 (i.e., adjustment factor applicability table for glulam), we obtain the allow-
able bending stress as
F� � F C C C C C (C or C ) � F*(C or C ) � (2400)(0.986) � 2366.4 psib b D M t F r L V b L V
6. Using equation (4.10), the actual applied bending stress is
M 294,840 lb-in.maxf � � � 2079.3 psi � F� � 2366.4 psi OKb b3S 141.8 inxx
Check of Shear StressVmax � 8190 lb. The beam cross-sectional area A � 51.56 in2. The applied shear stress in
the beam at the centerline of the girder support is
1.5V (1.5)(8190 lb)f � � � 238.3 psiv 2A 51.56 in
Using the adjustment factor applicability table for glulam (Table 3.2), we obtain the allowableshear stress as
F� � F C C C � (215)(1)(1)(1) � 215 psi � f N.G.v v D M t v
Recalculate the shear stress at a distance d from the face of the column support, assuming an 8� 8 column at this stage (Figure 9.14). Therefore,
(6 ft) � [(7.5 in./2)/12] � (16.5 in./12)V� � (8190 lb) � 5887 lb
6 ft
Recalculating the shear stress at a distance of d from the face of support yields
1.5V� (1.5)(5887 lb)f� � � � 171.3 psi � F� OKv v2A 51.56 in

306 � S T R U C T U R A L W O O D D E S I G N
FIGURE 9.14 Shearforce diagram of aglulam girder.
TABLE 9.9 Floor Girder Deflection Limits
Deflection Deflection Limit
Live-load deflection �LL L (12 ft)(12)� � 0.4 in.
360 360
Incremental long-term deflection due to dead load plus live load(including creep effects),
�TL � k�DL � �LL
L (12 ft)(12)� � 0.6 in.
240 240
Check of Deflection (see Table 9.9)The allowable pure bending modulus of elasticity for strong (i.e., x–x)-axis bending of the
girder was calculated previously:
6 6E� � E C C � (1.8 � 10 )(1.0)(1.0) � 1.8 � 10 psix x M t
The moment of inertia about the strong axis Ixx � 1170 in4.The uniform dead load is wDL � 51.3 lb/in.The uniform live load is wLL � 62.5 lb/in.
The dead-load deflection is
4 45wL (5)(51.3 lb/in.)(12 ft � 12)� � � � 0.14 in.DL 6 4384EI (384)(1.8 � 10 psi)(1170 in )
The live-load deflection is
4 45wL (5)(62.5 lb/in.)(12 ft � 12) L� � � � 0.17 in. � � 0.4 in. OKLL 6 4384EI (384)(1.8 � 10 psi)(1170 in ) 360
Since seasoned wood in dry service conditions is assumed to be used in this building, the creepfactor k � 0.5. The total incremental dead plus floor live-load deflection is
� � k� � �TL DL LL
L� (0.5)(0.14 in.) � 0.17 in. � 0.24 in. � � 0.6 in. OK
240
Check of Bearing Stress (Compression Stress Perpendicular to the Grain)
Maximum reaction at the support R1 � 8190 lb.
Width of � in. glulam girder, b � 3.125 in.1 1– –3 168 2
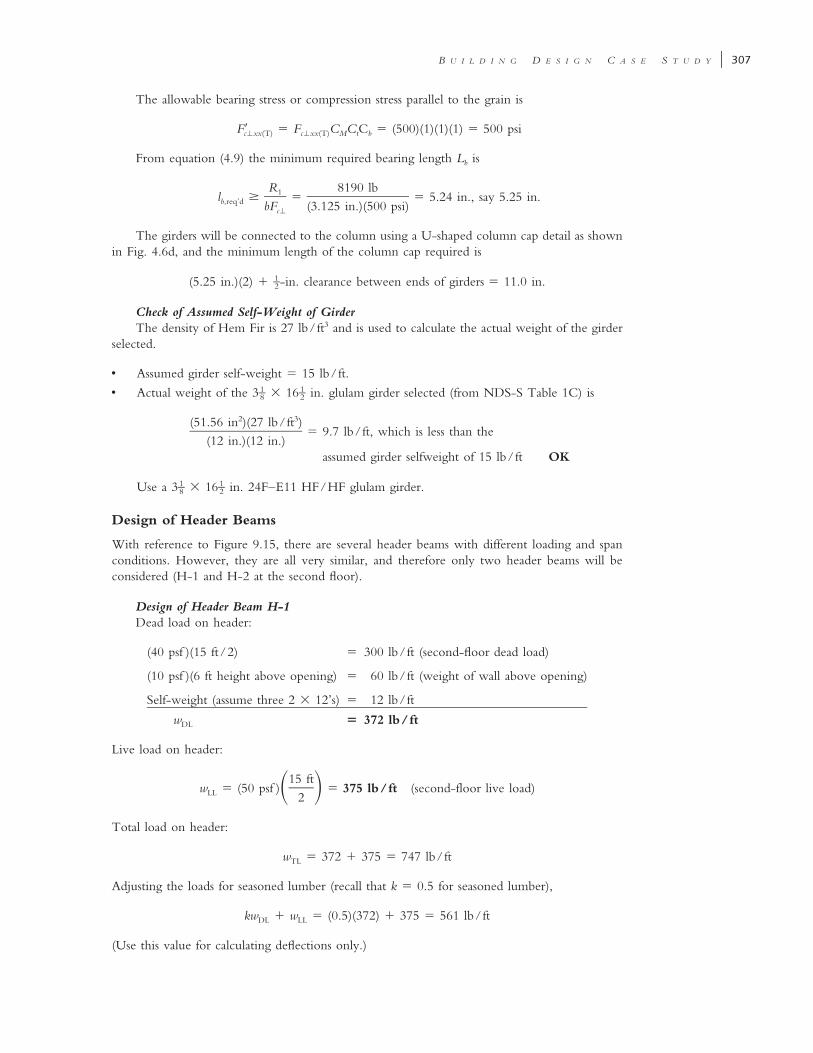
B U I L D I N G D E S I G N C A S E S T U D Y � 307
The allowable bearing stress or compression stress parallel to the grain is
F� � F C C C � (500)(1)(1)(1) � 500 psic�xx(T) c�xx(T) M t b
From equation (4.9) the minimum required bearing length Lb is
R 8190 lb1l � � � 5.24 in., say 5.25 in.b,req’d bF (3.125 in.)(500 psi)c�
The girders will be connected to the column using a U-shaped column cap detail as shownin Fig. 4.6d, and the minimum length of the column cap required is
1–(5.25 in.)(2) � -in. clearance between ends of girders � 11.0 in.2
Check of Assumed Self-Weight of GirderThe density of Hem Fir is 27 lb/ft3 and is used to calculate the actual weight of the girder
selected.
• Assumed girder self-weight � 15 lb/ft.
• Actual weight of the � in. glulam girder selected (from NDS-S Table 1C) is1 1– –3 168 2
2 3(51.56 in )(27 lb/ft )� 9.7 lb/ft, which is less than the
(12 in.)(12 in.)assumed girder selfweight of 15 lb/ft OK
Use a � in. 24F–E11 HF/HF glulam girder.1 1– –3 168 2
Design of Header Beams
With reference to Figure 9.15, there are several header beams with different loading and spanconditions. However, they are all very similar, and therefore only two header beams will beconsidered (H-1 and H-2 at the second floor).
Design of Header Beam H-1Dead load on header:
(40 psf )(15 ft/2) � 300 lb/ft (second-floor dead load)
(10 psf )(6 ft height above opening) � 60 lb/ft (weight of wall above opening)
Self-weight (assume three 2 � 12’s) � 12 lb/ft
wDL � 372 lb/ft
Live load on header:
15 ftw � (50 psf ) � 375 lb/ft (second-floor live load)� �LL 2
Total load on header:
w � 372 � 375 � 747 lb/ftTL
Adjusting the loads for seasoned lumber (recall that k � 0.5 for seasoned lumber),
kw � w � (0.5)(372) � 375 � 561 lb/ftDL LL
(Use this value for calculating deflections only.)

308 � S T R U C T U R A L W O O D D E S I G N
FIGURE 9.15 Headerbeam layout.
2 2w L (747)(8)TLmaximum moment M � � � 5976 ft-lb8 8
w L (747)(8)TLmaximum shear and reaction V � � � 2988 lbTL 2 2
Bending:
F� � F C C C C C C C Cb b D M t L F fu i r
C (DL � LL) � 1.0D
C � 1.0M
C � 1.0t
C (F ) � 1.0F b
C � 1.0fu
C � 1.0i
C � 1.0r
From NDS Table 4A (spruce-pine-fir, No. 1/No. 2)

B U I L D I N G D E S I G N C A S E S T U D Y � 309
F � 875 psib
F � 135 psiv
F � 425 psic�
6E � 1.4 � 10 psi
6E � 0.51 � 10 psimin
Since the beam is unbraced laterally for its full length, the beam stability factor CL will have tobe calculated. See Chapter 3 for the CL equations. For three 2 � 12’s:
d � 11.25 in.
b � (3)(1.5 in.) � 4.5 in.
2 2A � (3)(16.88 in ) � 50.63 in
3 3S � (3)(31.64 in ) � 94.92 inx
4 4I � (3)(178 in ) � 534 inx
l � 8 ft � 96 in. (span of header)u
l 96 in.u � � 8.53d 11.25 in.
l � 1.63l � 3d (Table 3.9 or NDS Table 3.3.3)e u
� (1.63)(96 in.) � (3)(11.25 in.) � 191 in.
l deR � � 50 (NDS Equation 3.3-5)B 2�b
(191)(11.25)� � 10.3 � 50 OK2� (4.5)
6 6E� � E C C C � (0.51 � 10 )(1.0)(1.0)(1.0) � 0.51 � 10min min M t i
61.20E (1.20)(0.51 � 10 )minF � � � 5768 psibE 2 2R (10.3)B
F*� F C C C C C C C � (875)(1.0)(1.0)(1.0)(1.0)(1.0)(1.0)(1.0) � 875 psib b D M t F fu i r
21 � F /F* 1 � F /F* F /F*be b be b be bC � � � (NDS Equation 3.3-6)� �L �1.9 1.9 0.95
21 � 5768/875 1 � 5768/875 5768/875� � � � 0.991� ��1.9 1.9 0.95
The allowable bending stress
F� � F*C � (875)(0.991) � 867 psib b L
The bending stress applied
M (5976)(12)f � � � 756 psi � F� OKb bS 94.92x

310 � S T R U C T U R A L W O O D D E S I G N
FIGURE 9.16 Header (H-1) bearing. FIGURE 9.17 Header (H-2) section.
Shear. The allowable shear stress
F� � F C C C C � (135)(1.0)(1.0)(1.0)(1.0) � 135 psiv v D M t i
The shear stress applied
1.5V 2988f � � � 88.6 psi � F� OKv vA 50.63
Bearing. The allowable bearing stress perpendicular to the grain is
F� � F C C C � (425)(1.0)(1.0)(1.0) � 425 psic� c� M t i
The required bearing length
Rl �b,req’d F bc�
2988� � 1.6 in.
(425)(4.5)
The headers will bear directly on two jack studs (see Figure 9.16).Deflection. The total load deflection (including creep effects) is
6 6E� � EC C C � (1.4 � 10 )(1.0)(1.0)(1.0) � 1.4 � 10M t i
4 45wL (5)(561/12)(96) L 96� � � � 0.07 in. � � � 0.4 in. OKkDL�LL 6385EI (384)(1.4 � 10 )(534) 240 240
The live-load deflection is
4 45wL (5)(375/12)(96) L 96� � � � 0.046 in. � � � 0.27 in. OKLL 6385EI (384)(1.4 � 10 )(534) 360 360
Use three 2 � 12’s for header H-1, bear on two 2 � 6 jack studs.
Design of Header Beam H-2Header beam H-2 has a 16 -in.-deep girder framing into it. For practical framing consid-1–2
erations, the header should be at least as deep as the girder. For this example, a preengineeredheader beam will be selected with the following assumed properties:
F � 2600 psib
F � 285 psiv
E � 1900 ksiF � 750 psic�

B U I L D I N G D E S I G N C A S E S T U D Y � 311
For this example, three 1 � 16 in. LVL headers will be assumed. The design will show that3–4one header would be adequate, but it is practical to use at least three members in a 2 � 6 studwall so that a ‘‘void’’ is not created above the opening (Figure 9.17).
Section properties:
d � 16 in.
b � (3)(1.75 in.) � 5.25 in.
2A � (3)(1.75)(16) � 84 in
2 2bd (1.75)(16) 3S � (3) � (3) � 224 inx 6 6
3 3bd (1.75)(16) 4I � (3) � (3) � 1792 inx 12 12
Loads on header:
12 ft 12 ftP � (40 psf ) (15 ft) � 15 plf � 3690 lb� � � �D 2 2
12 ftP � (50 psf ) (15 ft) � 4500 lb� �L 2
P � 3690 � 4500 � 8190 lbT
PL (8190)(8)Maximum moment M � � � 16,380 ft-lb
4 4P 8190
Maximum shear and reaction V � � 4095 lbTL 2 2
The bending stress applied is
M (16,380)(12)f � � � 878 psi � 2600 psi OKb S 224x
The shear stress applied is
1.5V (1.5)(4095)f � � � 74 psi � F� � 285 psi OKv vA 84
The required bearing length is
Rl �b,req’d F bc�
4095� � 1.04 in.
(750)(5.25)
The headers will bear directly on at least one jack stud.Deflection. Since the dead load is more than one-half of the live load, the L/240 criteria
will control. Therefore,
3 3PL (8190)(96) L 96� � � � 0.05 in. � � � 0.4 in. OKDL�LL 648EI (48)(1.9 � 10 )(1792) 240 240
Use three 1 � 16 in. LVLs for header H-2, bear on one 2 � 6 jack stud.3–4
9.8 DESIGN OF A TYPICAL GROUND-FLOOR COLUMN
It is assumed that the ground-floor column in this building will be a wood column instead ofthe steel pipe column that is frequently used in residential structures. However, the wood column

312 � S T R U C T U R A L W O O D D E S I G N
FIGURE 9.18 Columnbase support detail.
base should be protected from moisture at the slab-on-grade/footing level using a column basedetail similar to that shown in Figure 9.18.
Determining the Column Axial LoadWe recall that this is a two-story building, but the roof tributary area for this column is
zero since the column supports only the second floor.
2Tributary area of typical interior column � (15 ft)(12 ft) � 180 ft
From Chapter 2,
2A � tributary area � 180 ft (only the second floor live loadT
is reducible for this column)K � 4 (interior column)LL
KLL AT � (4)(180 ft2) � 720 ft2 � 400 ft2.Floor live load L � 50 psf � 100 psf.Floor occupancy is not assembly occupancy.
Since all the conditions above are satisfied, live-load reduction is permitted.The governing IBC load combination from Chapter 2 for calculating the column axial loads
is D � 0.75L � 0.75(Lr or S or R). The reduced or design floor live loads for the second andthird floors are calculated using Table 9.10
Using the loads calculated in Section 9.2, the column axial loads are calculated using Table9.11. Therefore, the ground-floor column will be designed for a cumulative maximum axialcompression load P � 14.5 kips.
It should be noted that the column load calculated above assumes simply supported glulamgirders. However, if the contractor chooses to use two 24-ft-long pieces for the girder, thusindicating two two-span continuous girders, the interior column load would be amplified dueto the girder continuity effect. For a two-span continuous girder, this will result in a 25% increasein the second-floor load on the column. Therefore, the revised axial load on the column willbe
P � (1.25)(14.5) � 18.1 kips
Using Figure B.17, the allowable axial load at an unbraced length of 10.5 ft is approximately25.0 kips with a load duration factor of 1.0. Therefore, use a 8 � 8 SPF No. 2 Column. Thereader should note that the load capacity of a 6 � 6 column is approximately 11 kips and wouldnot be adequate.
9.9 DESIGN OF A TYPICAL EXTERIOR WALL STUD
The typical exterior wall stud is subjected to combined concentric axial compression load plusbending due to the wind loads acting perpendicular to the face of the exterior wall. The ground-

B U I L D I N G D E S I G N C A S E S T U D Y � 313
TABLE 9.10 Reduced or Design Floor Live-Load Calculation Table
MemberLevels
Supported
Summationof FloorTributaryArea, AT KLL
UnreducedFloor Liveload, L0
Live-LoadReduction Factor,0.25 � 15/�K ALL T
Design Floor LiveLoad, L
Second-floorcolumn (i.e.,column belowroof )
Roof only Floor live-loadreduction notapplicable toroofs!
— — — 35 psf (snow load)
Ground-floorcolumn (i.e.,column belowthe secondfloor)
One floor� roof
One floor �180 ft2 �180 ft2
4 KLLAT � 720 ft2 �400 ft2; therefore,live load reductionallowed
50 psf 0.25 � 15/�(4)(180)� 0.809
(0.809)(50) � 40.5 psf� 0.50L0 � 25 psf
floor exterior wall stud, which is the more critically loaded than the second-floor stud, is designedin this section. The size obtained is also used for the second-floor stud.
Determining the Gravity and Lateral Loads Acting on a Typical Wall StudFloor-to-floor height � 12 ft
Tributary width of wall stud � 2 ft
Tributary area per stud at the roof level � (30 ft/2 � 2 ft truss overhang) � (2 ft)2� 34 ft
2Tributary area per stud at the second-floor level � (15 ft/2) � (2 ft) � 15 ft
From Chapter 2,
2A � floor tributary area � 15 ft (only the second-floor live loadT
is reducible for this stud)
K � 2 (exterior column)LL
2 2 2K A � (2)(15 ft ) � 30 ft � 400 ftLL T
Therefore, floor live-load reduction is not permitted for this stud.From Section 9.2, the gravity loads have been calculated as follows:
roof dead load D � 22 psf
roof snow load S � 35 psf
roof live load L � 20 psf � S; therefore, the snow load controlsr
second-floor dead load D � 40 psf
second-floor live load L � 50 psf
second-floor wall self-weight � 10 psf
ground-floor wall self-weight � 10 psf
The lateral or horizontal wind pressure W acting perpendicular to the face of the exterior wallrepresents the components and cladding wall pressures calculated in Section 9.5 as W � 22.6psf.
Gravity loads. The total dead load on the ground-floor studs is

314
TAB
LE9
.11
Col
umn
Load
Sum
mat
ion
Tab
le(W
ithFl
oor
Live
-Loa
dR
educ
tion)
Lev
el
Tri
buta
ryA
rea,
TA
(ft2 )
Dea
dLoad
,D
(psf
)
Liv
eLoad
,L
0(S
or
Lr
or
Ron
the
Roof)
(psf
)
Des
ign
Liv
eLoad
Roof:
Sor
Lr
or
RFlo
or:
L(p
sf)
Unfa
ctore
dT
ota
lLoad
atEac
hLev
el,
ws1
Roof:
DFlo
or:
D�
L(p
sf)
Unfa
ctore
dT
ota
lLoad
atEac
hLev
el,
ws2
Roof:
D�
0.75
SFlo
or:
D�
0.75
L(p
sf)
Unfa
ctore
dC
olu
mn
Axi
alLoad
atEac
hLev
el,
P�
(TA
)(w
s1)
or
(TA
)(w
s2)
(kip
s)
Cum
ula
tive
Unfa
ctore
dA
xial
Load
,
PD
�L
(kip
s)
Cum
ula
tive
Unfa
ctore
dA
xial
Load
,
PD
�0.
75L
�0.
75S
(kip
s)
Max
imum
Cum
ula
tive
Unfa
ctore
dA
xial
Load
,
P(k
ips)
Roo
f0
2235
3522
48.3
00
00
Seco
ndflo
or18
040
5040
.580
.570
.414
.5or
12.7
14.5
12.7
14.5

B U I L D I N G D E S I G N C A S E S T U D Y � 315
FIGURE 9.19 Studwall section and planview.
P � P � P � PD D(roof ) D(2nd floor) D(wall)
2 2� (22 psf )(34 ft ) � (40 psf )(15 ft )
� (10 psf )(2-ft stud spacing)(12-ft wall height)
� 1588 lb
The total snow load on the ground-floor studs is
2P � (35 psf )(34 ft ) � 1190 lbS
The total floor live load on the ground-floor studs is
2P � (50 psf )(15 ft ) � 750 lbL
Lateral loads. The wind load acts perpendicular to the face of the stud wall, causing bendingof the stud about the x–x (strong) axis (see Figure 9.19). The lateral wind load wwind � (22.6psf )(2-ft tributary width) � 45.2 plf. The maximum moment in the exterior wall stud due towind load is calculated using the 12-ft floor-to-floor height (conservative for the ground-floorstuds on the east and west face of the building) as
2wLM �w 8
2(45.2 lb/ft)(12)� � 814 ft-lb
8
The most critical axial load combination and the most critical combined axial and bendingload combination are determined using the normalized load method outlined in Chapter 3. Theaxial load P in the wall stud will be caused by the gravity loads D, L, and S, while the bendingload and moment will be caused by the lateral wind load W. The applicable nonzero loads andload effect in the load combinations are
D � 1588 lb
L � 750 lb
S � 1190 lb
W � 814 ft-lb

316 � S T R U C T U R A L W O O D D E S I G N
TABLE 9.12 Applicable and Governing Load Combinations
Load CombinationAxial Load, P
(lb)Moment, M
(ft-lb) CD
Normalized Loadand Moment
P/CD M/CD
D 1588 0 0.9 1764 0
D � L 1588 � 750 � 2338 0 1.0 2388 0
D � S 1588 � 1190 � 2778 0 1.15 2416 0
D � 0.75L � 0.75S 1588 � (0.75)(750 � 1190) � 3043 0 1.15 2646 0
D � 0.75W � 0.75L � 0.75S 1588 � (0.75)(750 � 1190) � 3043 (0.75)(814) � 611 1.6 1902 382
0.6D � W (0.6)(1588) � 953 814 1.6 596 509
We can separate the load cases in Table 9.12 into two types of loads: pure axial load casesand combined load cases. Since not all the loads on this wall stud are pure axial loads only orbending loads only, the normalized load method discussed in Chapter 3 can then only be usedto determine the most critical pure axial load case, not the most critical combined load case.The most critical combined axial plus bending load case would have to be determined by carryingout the design (or analysis) for all the combined load cases, with some of the load cases eliminatedby inspection.
Pure axial load case. For the pure axial load cases, the load combination with the highestnormalized load P/CD from the table above is
D � 0.75(L � S ) P � 3043 lb with C � 1.15D
Combined load case. For the combined load cases, the load combinations with the highestnormalized load P/CD and normalized moment M/CD from Table 9.12 are
D � 0.75(L � S � W ) P � 3043 lb M � 611 ft-lb C � 1.6D
or
0.6D � W P � 953 lb M � 814 ft-lb C � 1.6D
By inspection, it would appear as if the load combination D � 0.75(L � S � W ) will controlfor the combined load case, but this should be verified through analysis, and therefore, both ofthese combined load cases will have to be investigated. The figures in Appendix B will beutilized. A 2 � 6 wall stud will be assumed and SPF lumber will be used.
For the pure axial load case, the applied axial load is P � 3043 lb. Using Figure B.44, theallowable axial load capacity is 4400 lb at an unbraced length of 12 ft with no applied moment.Note that the load duration factor for this design aid is 1.0, so the use of this design aid isconservative since the actual load duration is 1.15. Note also that the lumber here is 2 � 6, SPFNo. 1/No. 2.
For the first combined load case, the applied axial load is P � 3043 lb and the appliedmoment is M � 611 ft-lb. Using Figure B.27 (CD � 1.6), the allowable axial load capacity isapproximately 2900 lb at an unbraced length of 12 ft with an applied moment of 611 ft-lbwhich is very close to the applied axial load of 3043 lb. Therefore, the stud is deemed to beadequate since the length of the stud is actually less than 12 ft. Note here that the lumberassumed is 2 � 6, SPF Select Structural. The reader should verify that the use of SPF No. 1/No. 2 is not adequate.
For the second combined load case, the applied axial load is P � 953 lb and the appliedmoment is M � 814 ft-lb. Using Figure B.27 (CD � 1.6), the allowable axial load capacity isapproximately 2400 lb at an unbraced length of 12 ft with an applied moment of 814 ft-lb.Note that the lumber assumed is 2 � 6, SPF Select Structural.
Therefore, use 2 � 6 at 24 in. o.c. SPF Select Structural wall studs.

B U I L D I N G D E S I G N C A S E S T U D Y � 317
9.10 DESIGN OF ROOF AND FLOOR SHEATHING
Gravity Loads
Roof SheathingFrom the floor load calculations in Section 9.2, the total loads acting on the roof sheathing
are as follows:
Asphalt shingles � 2.5 psf
Reroofing � 2.5 psf
Plywood sheathing � 1.2 psf
Dead load on sheathing, Dsheathing � 6.2 psf
Snowload, S � 35 psf
The total gravity load to roof sheathing � 6.2 � 35 � 41.2 psf. Assuming a roof truss spacingof 24 in., the following is selected from IBC Table 2304.7(3):
-in. CD–X. (minimum thickness)7––16
Strength axis perpendicular to the supports.Span rating � 24/16.Edge support not required (may be required for diaphragm strength).Total load capacity � 50 psf � 41.2 psf, so OK.Live load capacity � 40 psf � 35 psf, so OK.
Floor SheathingFrom the floor load calculations in Section 9.2, the total loads acting on the floor sheathing
alone are as follows:
Floor covering � 4.0 psf
Plywood sheathing � 3.2 psf
Partitions � 20.0 psf
DLsheathing � 27.2 psf
LL � 50 psf
The total gravity load to floor sheathing � 27.2 � 50 � 77.2 psf. Assuming that the floorframing is spaced at 24 in. o.c., the following is selected from IBC Table 2304.7(3) or 2304.7(4):
-in. Structural I sheathing. (minimum thickness)3–4Note that Table 2304.7(4) indicates that a plywood panel with veneers made from Group1 wood species (i.e., Structural I) must be used if in. plywood thickness is specied. On3–4the other hand, Table 2304.7(3) does not indicate the specie of wood used for theveneer.Strength axis perpendicular to the supports.Span rating � 24 in.Tongue-and-grooved joints.Total load capacity � 100 psf � 77.2 psf, so OK.
Lateral Loads
Based on the lateral wind and seismic loads calculated in Sections 9.4 and 9.5, the loads to thefloor and roof diaphragms (Figure 9.20) are as summarized in Table 9.13. By inspection, windloads will govern the diaphragm design in the transverse direction, and seismic loads will governthe longitudinal direction (recall that the allowable shear values can be increased by 40% for
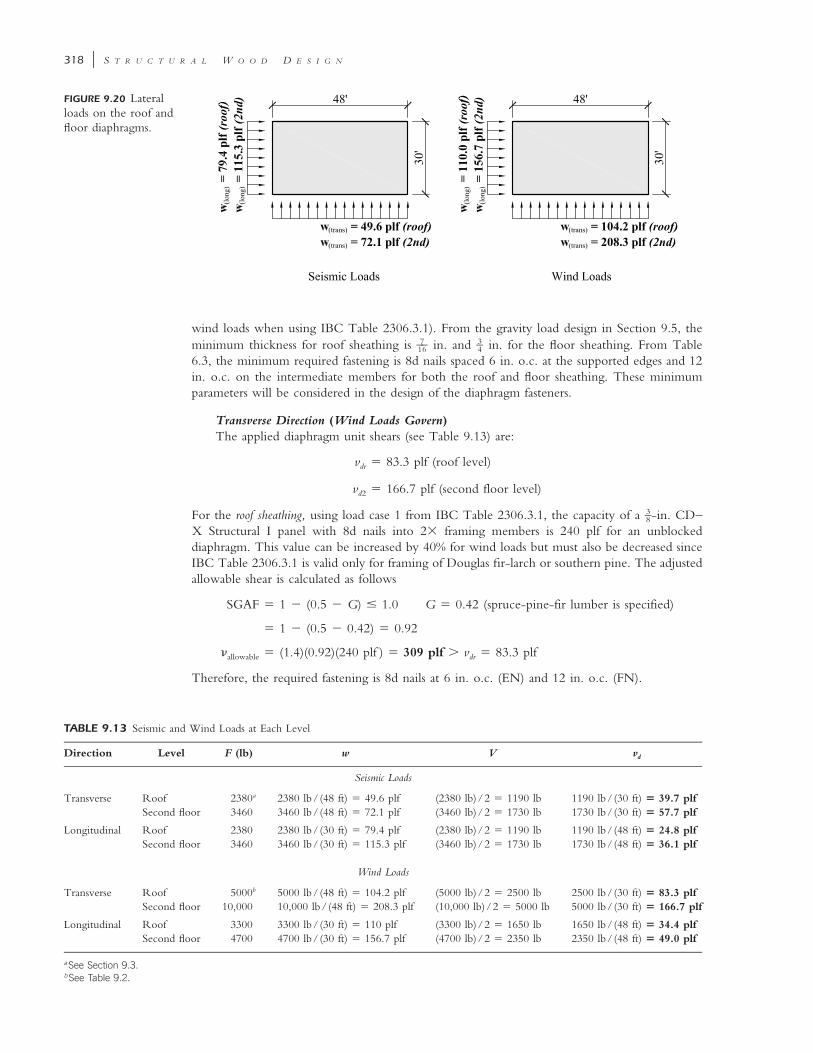
318 � S T R U C T U R A L W O O D D E S I G N
FIGURE 9.20 Lateralloads on the roof andfloor diaphragms.
TABLE 9.13 Seismic and Wind Loads at Each Level
Direction Level F (lb) w V vd
Seismic Loads
Transverse Roof 2380a 2380 lb/ (48 ft) � 49.6 plf (2380 lb)/2 � 1190 lb 1190 lb/ (30 ft) � 39.7 plfSecond floor 3460 3460 lb/ (48 ft) � 72.1 plf (3460 lb)/2 � 1730 lb 1730 lb/ (30 ft) � 57.7 plf
Longitudinal Roof 2380 2380 lb/ (30 ft) � 79.4 plf (2380 lb)/2 � 1190 lb 1190 lb/ (48 ft) � 24.8 plfSecond floor 3460 3460 lb/ (30 ft) � 115.3 plf (3460 lb)/2 � 1730 lb 1730 lb/ (48 ft) � 36.1 plf
Wind Loads
Transverse Roof 5000b 5000 lb/ (48 ft) � 104.2 plf (5000 lb)/2 � 2500 lb 2500 lb/ (30 ft) � 83.3 plfSecond floor 10,000 10,000 lb/ (48 ft) � 208.3 plf (10,000 lb)/2 � 5000 lb 5000 lb/ (30 ft) � 166.7 plf
Longitudinal Roof 3300 3300 lb/ (30 ft) � 110 plf (3300 lb)/2 � 1650 lb 1650 lb/ (48 ft) � 34.4 plfSecond floor 4700 4700 lb/ (30 ft) � 156.7 plf (4700 lb)/2 � 2350 lb 2350 lb/ (48 ft) � 49.0 plf
a See Section 9.3.b See Table 9.2.
wind loads when using IBC Table 2306.3.1). From the gravity load design in Section 9.5, theminimum thickness for roof sheathing is in. and in. for the floor sheathing. From Table7 3–– –16 4
6.3, the minimum required fastening is 8d nails spaced 6 in. o.c. at the supported edges and 12in. o.c. on the intermediate members for both the roof and floor sheathing. These minimumparameters will be considered in the design of the diaphragm fasteners.
Transverse Direction (Wind Loads Govern)The applied diaphragm unit shears (see Table 9.13) are:
v � 83.3 plf (roof level)dr
v � 166.7 plf (second floor level)d2
For the roof sheathing, using load case 1 from IBC Table 2306.3.1, the capacity of a -in. CD–3–8X Structural I panel with 8d nails into 2� framing members is 240 plf for an unblockeddiaphragm. This value can be increased by 40% for wind loads but must also be decreased sinceIBC Table 2306.3.1 is valid only for framing of Douglas fir-larch or southern pine. The adjustedallowable shear is calculated as follows
SGAF � 1 � (0.5 � G) � 1.0 G � 0.42 (spruce-pine-fir lumber is specified)
� 1 � (0.5 � 0.42) � 0.92
� � (1.4)(0.92)(240 plf ) � 309 plf � v � 83.3 plfallowable dr
Therefore, the required fastening is 8d nails at 6 in. o.c. (EN) and 12 in. o.c. (FN).
B U I L D I N G D E S I G N C A S E S T U D Y � 319
For the floor sheathing, using load case 1 from IBC Table 2306.3.1, the capacity of a -in.15––32
CD–X Structural I panel with 10d nails into 2� framing members is 285 plf for an unblockeddiaphragm. Adjusting this value for wind loads and spruce-pine-fir lumber yields
� � (1.4)(0.92)(285 plf ) � 367 plf � v � 166.7 plfallowable dr
Note here that a comparison was made with -in. panels, which is conservative when a -in.15 3–– –32 4
panel is used. Also, the minimum fastener penetration is 1 in. (from IBC Table 2306.3.1). Since1–2the length of an 10d nail is 3 in. (from NDS Table L4), the actual penetration is greater thanthe required penetration (3 in. � in. � 2 in. � 1 in.). The required fastening is 10d nails3 1 1– – –4 4 2
at 6 in. on centers edge nailing (EN) and 12 in. on centers fielding nailing (FN).
Longitudinal Direction (Seismic Loads Govern)The applied diaphragm unit shears (See Table 9.13) are:
v � 24.8 plf (roof level)dr
v � 36.1 plf (second floor level)d2
By inspection, the diaphragm shear in the transverse direction is much greater than the diaphragmshear in the longitudinal direction. Since the diaphragm design did not require blocking in thetransverse direction, it would be economical to select a diaphragm design that did not includeblocking for the longitudinal direction.
For the roof sheathing, using load case 3 from IBC Table 2306.3.1, the capacity of a -in.3–8panel with 8d nails into 2� framing members is 180 plf for an unblocked diaphragm. Adjustingthis value for spruce-pine-fir lumber yields
� � (0.92)(180 plf ) � 165 plf � v � 24.8 plfallowable dr
Therefore, the specified fastening used for the transverse direction is also adequate for the lon-gitudinal direction.
For the floor sheathing, using load case 3 from IBC Table 2306.3.1, the capacity of a -in.15––32
panel with 10d nails into 2� framing members is 215 plf for an unblocked diaphragm. Adjustingthis value for spruce-pine-fir lumber yields
� � (0.92)(215 plf ) � 197 plf � v � 36.1 plfallowable dr
Therefore, the specified fastening used for the transverse direction is also adequate for the lon-gitudinal direction.
The attachment of the horizontal diaphragm to the shear walls requires consideration. Avariety of diaphragm-to-shear wall connections are possible (see Figure 9.21 for typical details).The most efficient connection would be one where the horizontal wood panels meet the verticalpanels (Figure 9.21), where the boundary nails in the horizontal diaphragm transfer loads directlyto the boundary nails in the vertical diaphragm. Other connection types often require moreanalysis and fasteners.
9.11 DESIGN OF WALL SHEATHING FOR LATERAL LOADS
From IBC Table 2308.9.3(3), a -in. panel with a minimum of four plies and a span rating of7––16
wall-24 is adequate to resist a wind pressure perpendicular to the face of the wall sheathing. Thispanel can be oriented either parallel or perpendicular to the wall studs and allows the buildersome latitude in selecting the most economical layout. Table 6-1 of the Wood Structural PanelsSupplement indicates that the minimum fastening is 6d nails spaced 6 in. o.c. at the supportededges and 12 in. o.c. in the field of the plywood panel. These minimum parameters will beconsidered in the design of the shear wall fasteners.
The aspect ratio of the available shear walls must be calculated. The shortest available walllength is 8 ft and the total height of the walls is 24 ft. Therefore,
h 24 ft� � 3.0 � 3.5 OK for wind loads
w 8 ft
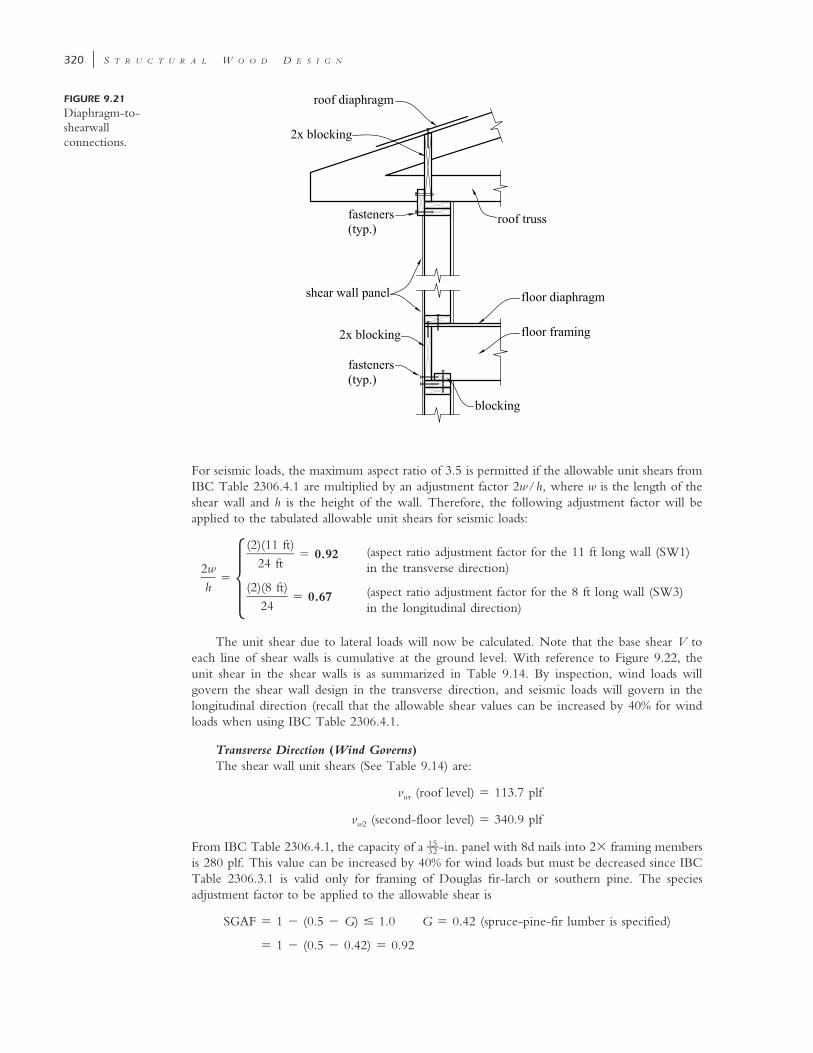
320 � S T R U C T U R A L W O O D D E S I G N
FIGURE 9.21
Diaphragm-to-shearwallconnections.
For seismic loads, the maximum aspect ratio of 3.5 is permitted if the allowable unit shears fromIBC Table 2306.4.1 are multiplied by an adjustment factor 2w/h, where w is the length of theshear wall and h is the height of the wall. Therefore, the following adjustment factor will beapplied to the tabulated allowable unit shears for seismic loads:
�2wh � 0.92
(2)(11 ft)24 ft
� 0.67(2)(8 ft)
24
(aspect ratio adjustment factor for the 11 ft long wall (SW1)in the transverse direction)
(aspect ratio adjustment factor for the 8 ft long wall (SW3)in the longitudinal direction)
The unit shear due to lateral loads will now be calculated. Note that the base shear V toeach line of shear walls is cumulative at the ground level. With reference to Figure 9.22, theunit shear in the shear walls is as summarized in Table 9.14. By inspection, wind loads willgovern the shear wall design in the transverse direction, and seismic loads will govern in thelongitudinal direction (recall that the allowable shear values can be increased by 40% for windloads when using IBC Table 2306.4.1.
Transverse Direction (Wind Governs)The shear wall unit shears (See Table 9.14) are:
v (roof level) � 113.7 plfwr
v (second-floor level) � 340.9 plfw2
From IBC Table 2306.4.1, the capacity of a -in. panel with 8d nails into 2� framing members15––32
is 280 plf. This value can be increased by 40% for wind loads but must be decreased since IBCTable 2306.3.1 is valid only for framing of Douglas fir-larch or southern pine. The speciesadjustment factor to be applied to the allowable shear is
SGAF � 1 � (0.5 � G) � 1.0 G � 0.42 (spruce-pine-fir lumber is specified)
� 1 � (0.5 � 0.42) � 0.92

B U I L D I N G D E S I G N C A S E S T U D Y � 321
FIGURE 9.22 Lateralloads on the shearwalls.
TABLE 9.14 Summary of Shear Wall Unit Shears
Direction Load Level
V (lb)(from
Section 9.22)vw �
V
� Lw
vw
(for Drag Struts)
Transverse Seismic Roof 1190 (1190 lb)/ (11 ft � 11 ft)� 54.1 plf
54.1 plf
Second floor 1730 (1190 � 1730 lb)/ (11 ft � 11 ft)� 132.8 plf
(1730 lb)/ (11 ft � 11 ft)� 78.7 plf
Wind Roof 2500 (2500 lb)/ (11 ft � 11 ft)� 113.7 plf
113.7 plf
Second floor 5000 (2500 � 5000 lb)/ (11 ft � 11 ft)� 340.9 plf
(5000 lb)/ (11 ft � 11 ft)� 227.3 plf
Longitudinal Seismic Roof 1190 (1190 lb)/ (12 ft � 8 ft � 12 ft)� 37.2 plf
37.2 plf
Second floor 1730 (1190 � 1730 lb)/ (12 ft � 8 ft � 12 ft)� 91.3 plf
(1730 lb)/ (12 ft � 8 ft � 12 ft)� 54.1 plf
Wind Roof 1650 (1650 lb)/ (12 ft � 8 ft � 12 ft)� 51.6 plf
51.6 plf
Second floor 2350 (1650 lb � 2350 lb)/ (12 ft � 8 ft � 12 ft)� 125 plf
(2350 lb)/ (12 ft � 8 ft � 12 ft)� 73.4 plf

322 � S T R U C T U R A L W O O D D E S I G N
The adjusted allowable unit shear is
� � (1.4)(0.92)(280 plf ) � 361 plf � v � 113.7 plfallowable (wind) wr
� v � 340.9 plf OKw2
Therefore, the required fastening for the shear walls between the second floor and the roof andbetween the ground floor and the second floor is 8d nails at 6 in. on centers edge nailing (EN)and 12 in. on centers field nailing (FN).
Longitudinal Direction (Seismic Governs)The shear wall unit shears are:
V (roof level) � 37.2 plfEr
V (second-floor level) � 91.3 plfE2
The -in. panel with 8d nails will be the minimum required for these walls; therefore, the base15––32
capacity of the shear walls remains at 280 plf. Adjusting this value for spruce-pine-fir lumberand applying the aspect ratio adjustment factor 0.67 for 8-ft long wall which is applicable forseismic loads only yields
� � (0.92)(0.67)(280 plf ) � 171 plf � v � 37.2 plfallowable (seismic) Er
� v � 91.3 plfE2
Therefore, the fastening specified for the shear wall in the transverse direction is adequate forthe shear walls in the longitudinal direction. Note that the 40% increase in allowable unit shearsapplies only to wind design but not to seismic design. It should be noted that though the unitshears due to longitudinal wind were higher than those due to seismic loads (see Table 9.14),the seismic loads still govern. Compare the seismic unit shears to the corresponding wind loadvalues and including the 40% increase in capacity for wind loads yields,
� � (0.92)(280 plf )(1.40) � 361 plfallowable (wind)
�� � � 51.6 plfwr
� � 125 plfw2
9.12 OVERTURNING ANALYSIS OF SHEAR WALLS: SHEAR WALLCHORD FORCES
The shear walls (Figure 9.23) will now be analyzed for overturning. Through this analysis, themaximum compression and tension forces in the shear wall chords will be calculated. The firststep will be to calculate the lateral and gravity loads to each shear wall. The lateral load to eachshear wall is summarized in Tables 9.15 and 9.16.
The gravity loads to each shear wall will now be calculated. Recall the following fromSection 9.2:
roof dead load � 22 psf
roof snow load � 35 psf
floor dead load � 40 psf
floor live load � 50 psf
wall dead load � 10 psf
The calculation of gravity loads on shear walls is covered in Chapter 7. The summary of theloads on walls SW1, SW2, and SW3 are shown in Figures 9.24, 9.25, and 9.26.

B U I L D I N G D E S I G N C A S E S T U D Y � 323
FIGURE 9.23 Shearwall layout.
TABLE 9.15 Summary of Lateral Forces on a Building
Direction Load LevelF (lb)
(from Figures 9.2 and 9.4)
Transverse Seismic Roof 2380Second floor 3460
Wind Roof 5000Second floor 10,000
Longitudinal Seismic Roof 2380Second floor 3460
Wind Roof 3300Second floor 4700
TABLE 9.16 Lateral Forces on Each Shear Wall
Wall Load LevelF (lb)
(from Figures 9.2 and 9.4)Fw � (Lwn)
F
� Lw
SW1 Seismic Roof 2380(11 ft) � 595 lb
(2380 lb)
(4)(11 ft)Second floor 3460
(11 ft) � 865 lb(3460 lb)
(4)(11 ft)Wind Roof 5000
(11 ft) � 1250 lb(5000 lb)
(4)(11 ft)Second floor 10,000
(11 ft) � 2500 lb(10,000 lb)
(4)(11 ft)
SW2 Seismic Roof 2380(12 ft) � 447 lb
(2380 lb)
(4)(12 ft) � (2)(8 ft)Second floor 3460
(12 ft) � 649 lb(3460 lb)
(4)(12 ft) � (2)(8 ft)Wind Roof 3300
(12 ft) � 619 lb(3300 lb)
(4)(12 ft) � (2)(8 ft)Second floor 4700
(12 ft) � 882 lb(4700 lb)
(4)(12 ft) � (2)(8 ft)
SW3 Seismic Roof 2380(8 ft) � 298 lb
(2380 lb)
(4)(12 ft) � (2)(8 ft)Second floor 3460
(8 ft) � 433 lb(3460 lb)
(4)(12 ft) � (2)(8 ft)Wind Roof 3300
(8 ft) � 413 lb(3300 lb)
(4)(12 ft) � (2)(8 ft)Second floor 4700
(8 ft) � 588 lb(4700 lb)
(4)(12 ft) � (2)(8 ft)

324 � S T R U C T U R A L W O O D D E S I G N
FIGURE 9.24 Free-body diagram ofshear wall SW1.
FIGURE 9.25 Free-body diagram ofshear wall SW2.
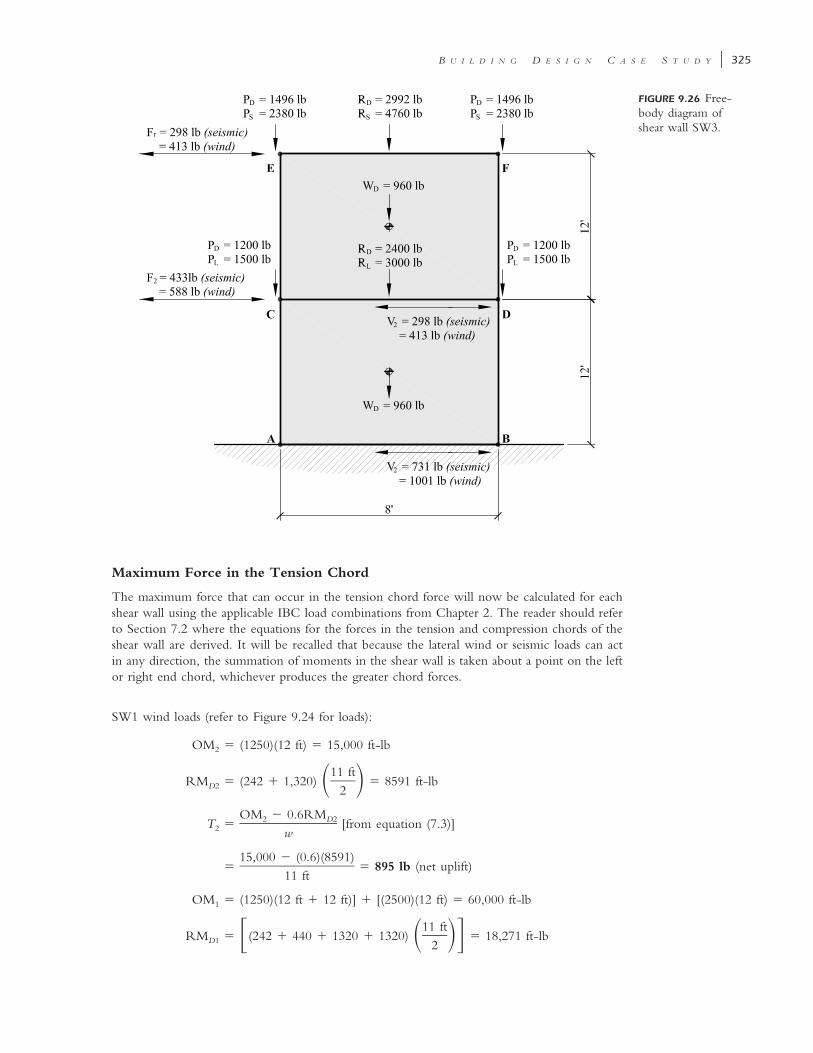
B U I L D I N G D E S I G N C A S E S T U D Y � 325
FIGURE 9.26 Free-body diagram ofshear wall SW3.
Maximum Force in the Tension Chord
The maximum force that can occur in the tension chord force will now be calculated for eachshear wall using the applicable IBC load combinations from Chapter 2. The reader should referto Section 7.2 where the equations for the forces in the tension and compression chords of theshear wall are derived. It will be recalled that because the lateral wind or seismic loads can actin any direction, the summation of moments in the shear wall is taken about a point on the leftor right end chord, whichever produces the greater chord forces.
SW1 wind loads (refer to Figure 9.24 for loads):
OM � (1250)(12 ft) � 15,000 ft-lb2
11 ftRM � (242 � 1,320) � 8591 ft-lb� �D2 2
OM � 0.6RM2 D2T � [from equation (7.3)]2 w
15,000 � (0.6)(8591)� � 895 lb (net uplift)
11 ft
OM � (1250)(12 ft � 12 ft)] � [(2500)(12 ft) � 60,000 ft-lb1
11 ftRM � (242 � 440 � 1320 � 1320) � 18,271 ft-lb� � ��D1 2

326 � S T R U C T U R A L W O O D D E S I G N
OM � 0.6RM1 D1T � [from equation (7.4)]1 w
60,000 � (0.6)(18,271)� � 4458 lb (net uplift)
11 ft
SW1 seismic loads (refer to Figure 9.24 for loads): � 1.0 and SD5 � 0.267
OM � (595)(12 ft) � 7140 ft-lb2
0.7OM � 0.56RM2 D2T � [from equation (7.5)]2 w
(0.7)(7140) � (0.56)(8591)� � 17 lb (net uplift)
11 ft
OM � [(595)(12 ft � 12 ft)] � [(865)(12 ft)] � 24,660 ft-lb1
0.7OM � 0.56RM1 D1T � [from equation (7.6)]1 w
(0.7)(24,660) � (0.56)(18,271)� � 639 lb
11 ft
SW2 wind loads (refer to Figure 9.25 for loads):
OM � (619)(12 ft) � 7428 ft-lb2
12 ftRM � (4488 � 1440) � 35,568 ft-lb� �D2 2
OM � 0.6RM2 D2T � [from equation (7.3)]2 w
7428 � (0.6)(35,568)� � �1159 lb (minus sign indicates no net uplift)
12 ft
OM � (619)(12 ft � 12 ft) � (882)(12 ft) � 25,440 ft-lb1
12 ftRM � (4488 � 3600 � 1440 � 1440) � 65,808 ft-lb� � ��D1 2
OM � 0.6RM1 D1T � [from equation (7.4)]1 w
25,440 � (0.6)(65,808)� � �1170 lb (minus sign indicates no net uplift)
12 ft
SW2 seismic loads (refer to Figure 9.25 for loads): � 1.0 and SD5 � 0.267
OM � (447)(12 ft) � 5364 ft-lb2
0.7OM � 0.56RM2 D2T � [from equation (7.5)]2 w
(0.7)(5364) � (0.56)(35,568)� � �1346 lb (minus sign indicates no net uplift)
12 ft

B U I L D I N G D E S I G N C A S E S T U D Y � 327
OM � (447)(12 ft � 12 ft)] � (649)(12 ft) � 18,516 ft-lb1
0.7OM � 0.56RM1 D1T � [from equation (7.6)]1 w
(0.7)(18,516) � (0.56)(65,808)� � �1991 lb (minus sign indicates no net uplift)
12 ft
SW3 wind loads (refer to Figure 9.26 for loads):
OM � (413)(12 ft) � 4956 ft-lb2
8 ftRM � [(1496)(8 ft)] � (2992 � 960) � 27,776 ft-lb� � ��D2 2
OM � 0.6RM2 D2T � [from equation (7.3)]2 w
4956 � (0.6)(27,776)� � �1463 lb (minus sign indicates no net uplift)
8 ft
OM � (413)(12 ft � 12 ft) � (588)(12 ft) � 16,968 ft-lb1
8 ftRM � [(1496 � 1200)(8 ft)] � (2992 � 2400 � 960 � 960) � 50,816 ft-lb� � ��D1 2
OM � 0.6RM1 D1T � [from equation (7.4)]1 w
(16,968) � (0.6)(50,816)� � �1690 lb (minus sign indicates no net uplift)
8 ft
SW3 seismic loads (refer to Figure 9.26 for loads):
� 1.0 and S � 0.267D5
OM � (298)(12 ft) � 3576 ft-lb2
0.7OM � 0.56RM2 D2T � [from equation (7.5)]2 w
(0.7)(3576) � (0.56)(27,776)� � �1631 lb (minus sign indicates no net uplift)
8 ft
OM � (298)(12 ft � 12 ft) � (433)(12 ft) � 12,348 ft-lb1
0.7OM � 0.56RM1 D1T � [from equation (7.6)]1 w
(0.7)(12,348) � (0.56)(50,816)� � �2476 lb (minus sign indicates no net uplift)
8 ft
Maximum Force in Compression Chord
The maximum compression chord force will now be calculated for each shear wall using theapplicable load combinations from Chapter 2. Recall that in calculating the resisting moments(RMD1, RMD2, RMT1, RMT2) in equations (7.7) to (7.10), it should be noted that the full Ploads or header reactions (see Figure 7.8) and the tributary R and W (i.e., distributed) loadsshould be used since the compression chords only support distributed gravity loads that aretributary to it in addition to the concentrated header reactions or P loads (see Section 7.2 forfurther discussion).

328 � S T R U C T U R A L W O O D D E S I G N
SW1 wind loads (refer to Figure 9.24 for loads):
OM � 15,000 ft-lb (from tension chord force calculations)2
2 ftRM �(385) � 140(11 ft) � 1925 ft-lb� �T2 2
2 ftRM � (242 � 1320) � 88(11 ft) � 2530 ft-lb� �D2 2
0.75OM � RM � 0.75RM2 D2 T2C � [from equation (7.7)]2 w
(0.75)(15,000) � (2530) � (0.75)(1925)� � 1384 lb
11 ft
OM � 60,000 ft-lb (from tension chord force calculations)1
2 ftRM � [(2,250 � 140)(11 ft)] � (385 � 550) � 27,225 ft-lb� � ��T1 2
2 ftRM � [(1800 � 88)(11 ft)] � (242 � 440 � 1320 � 1320) � 24,090 ft-lb� � ��D1 2
0.75OM � RM � 0.75RM1 D1 T1C � [from equation (7.8)]1 w
(0.75)(60,000) � (24,090) � (0.75)(27,225)� � 8137 lb
11 ft
SW1 seismic loads (refer to Figure 9.24 for loads):
� 1.0 and S � 0.267D5
OM � 7140 ft-lb (from tension chord force calculations)2
RM � 1925 ft-lb (from wind loads)T2
RM � 2530 ft-lb (from wind loads)D2
0.525OM � 1.03RM � 0.75RM2 D2 T2C � [from equation (7.9)]2 w
(0.525)(7140) � (1.03)(2530) � (0.75)(1925)� � 975 lb
8 ft
OM � 24,660 ft-lb (from tension chord force calculations)1
RM � 27,225 ft-lb (from wind loads)T1
RM � 24,090 ft-lb (from wind loads)D1
0.525OM � 1.03RM � 0.75RM1 D1 T1C � [from equation (7.10)]1 w
(0.525)(24,660) � (1.03)(24,090) � (0.75)(27,225)� � 7272 lb
8 ft

B U I L D I N G D E S I G N C A S E S T U D Y � 329
SW2 wind loads (refer to Figure 9.25 for loads):
OM � 7428 ft-lb (from tension chord force calculations)2
2 ftRM � (2380)(12 ft) � (7140) � 35,700 ft-lb� � ��T2 2
2 ftRM � (1496)(12 ft) � (4488 � 1440) � 23,880 ft-lb� � ��D2 2
0.75OM � RM � 0.75RM2 D2 T2C � [from equation (7.7)]2 w
(0.75)(7428) � (23,880) � (0.75)(35,700)� � 4686 lb
12 ft
OM � 25,440 ft-lb (from tension chord force calculations)1
2 ftRM � [(2380 � 1500)(12 ft)] � (7140 � 4500) � 58,200 ft-lb� � ��T1 2
2 ftRM � [(1496 � 1200)(12 ft)] � (4488 � 3600 � 1440 � 1440)� � ��D1 2
� 43,320 ft-lb
(0.75OM � RM � 0.75RM )1 D1 T1C � [from equation (7.8)]1 w
(0.75)(25,440) � (43,320) � (0.75)(58,200)� � 8838 lb
12 ft
SW2 seismic loads (refer to Figure 9.25 for loads):
� 1.0 and S � 0.267D5
OM � 5364 ft-lb (from tension chord force calculations)2
RM � 35,700 ft-lb (from wind loads)T2
RM � 23,880 ft-lb (from wind loads)D2
0.525OM � 1.03RM � 0.75RM2 D2 T2C � [from equation (7.9)]2 w
(0.525)(5364) � (1.03)(23,880) � (0.75)(35,700)� � 4516 lb
12
OM � 18,516 ft-lb (from tension chord force calculations)1
RM � 58,200 ft-lb (from wind loads)T1
RM � 43,320 ft-lb (from wind loads)D1
0.525OM � 1.03RM � 0.75RM1 D1 T1C � [from equation (7.10)]1 w
(0.525)(18,516) � (1.03)(43,320) � (0.75)(58,200)� � 8166 lb
12 ft

330 � S T R U C T U R A L W O O D D E S I G N
SW3 wind loads (refer to Figure 9.26 for loads):
OM � 4956 ft-lb (from tension chord force calculations)2
2 ftRM � (2380)(8 ft) � (4760) � 23,800 ft-lb� � ��T2 2
2 ftRM � (1496)(8 ft) � (2992 � 960) � 15,920 ft-lb� � ��D2 2
0.75OM � RM � 0.75RM2 D2 T2C � [from equation (7.7)]2 w
(0.75)(4956) � (15,920) � (0.75)(23,800)� � 4686 lb
8 ft
OM � 16,968 ft-lb (from tension chord force calculations)1
2 ftRM � [(2380 � 1500)(8 ft)] � (4760 � 3000) � 38,800 ft-lb� � ��T1 2
2 ftRM � [(1496 � 1200)(8 ft)] � (2992 � 2400 � 960 � 960) � 28,880 ft-lb� � ��D1 2
(0.75OM � RM � 0.75RM )1 D1 T1C � [from equation (7.8)]1 w
(0.75)(16,968) � (28,880) � (0.75)(38,800)� � 8838 lb
8 ft
SW3 seismic loads (refer to Figure 9.26 for loads):
� 1.0 and S � 0.267D5
OM � 3576 ft-lb (from tension chord force calculations)2
RM � 23,800 ft-lb (from wind loads)T2
RM � 15,920 ft-lb (from wind loads)D2
0.525OM � 1.03RM � 0.75RM2 D2 T2C � [from equation (7.9)]2 w
(0.525)(3576) � (1.03)(15,920) � (0.75)(23,800)� � 4516 lb
8 ft
OM � 12,348 ft-lb (from tension chord force calculations)1
RM � 38,800 ft-lb (from wind loads)T1
RM � 28,880 ft-lb (from wind loads)D1
0.525OM � 1.03RM � 0.75RM1 D1 T1C � [from equation (7.10)]1 w
(0.525)(12,348) � (1.03)(28,880) � (0.75)(38,800)� � 8166 lb
8 ft
The shear wall design forces are summarized in Table 9.17.

B U I L D I N G D E S I G N C A S E S T U D Y � 331
TABLE 9.17 Summary of Shear Wall Chord Design Forcesa (lb)
Load Wall
Level 2
V2 T2 C2
Ground Level
V1 T1 C1
Seismic SW1 595 17 975 1460 639 7272SW2 447 �1346 4516 1096 �1991 8166SW3 298 �1631 4516 731 �2476 8166
Wind SW1 1250 895 1384 3750 4458 8137SW2 619 �1159 4686 1501 �1170 8838SW3 413 �1463 4686 1001 �1690 8838
a A negative value for T1 and T2 forces actually indicates net a compressive force; hold-down anchors would theoretically,not be required. Bold values indicate controlling values that will be used for design. Note that the value of the wind upliftforce of 710 lb in the shearwall chords calculated in Section 9.4 must be added to the net tension forces due to overturningfrom wind obtain the net uplift force on the MWFRS (see Section 9.4). For wall SW1 at the ground floor level, the totalnet uplift force, T1 will become 5168 lb (i.e., 4458 lb � 710 lb).
TABLE 9.18 Seismic and Wind Loads on Horizontal Diaphragm Chords
Direction Levelw (plf )
(from Figure 9.20)L
(ft)b
(ft)
M �2wL
8(ft-lb)
Fdc �M
b(lb)
Seismic Loads
Transverse Roof 49.6 48 30 (49.6)(482)/8 � 14,285 14,285/30 � 477Second floor 72.1 48 30 (72.1)(482)/8 � 20,765 20,765/30 � 693
Longitudinal Roof 79.4 30 48 (79.4)(302)/8 � 8933 8933/48 � 187Second floor 115.3 30 48 (115.3)(302)/8 � 12,972 12,972/48 � 271
Wind Loads
Transverse Roof 104.2 48 30 (104.2)(482)/8 � 30,010 30,010/30 � 1001Second floor 208.3 48 30 (208.3)(482)/8 � 59,990 59,990/30 � 2000
Longitudinal Roof 110 30 48 (110)(302)/8 � 12,375 12,375/48 � 258Second floor 156.7 30 48 (156.7)(302)/8 � 17,629 17,629/48 � 367
9.13 FORCES IN HORIZONTAL DIAPHRAGM CHORDS, DRAG STRUTS,AND LAP SPLICES
With reference to Figure 9.20, the diaphragm chord forces are summarized in Table 9.18. Withreference to Figures 9.27 and 9.28, the drag strut forces are as summarized in Table 9.19.
Design of Chords, Struts, and Splices
The maximum force in the chord and drag struts is a diaphragm chord force of 2000 lb (seeTable 9.18). It is common practice to use the maximum force in the design of all chords andlap splices.
Design for TensionThe maximum applied tension force, Tapplied � 2000 lb. For stress grade, assume spruce-
pine-fir Stud grade. Since a 2 � 6 is dimension lumber, use NDS-S Table 4A. From the tablewe obtain the design stress values:

332 � S T R U C T U R A L W O O D D E S I G N
(a) (b)
FIGURE 9.27 Unit shear, net shear, and drag strut forces (transverse wind): (a) roof; (b) second floor.
F � 350 psit
C (wind) � 1.6D
C � 1.0M
C � 1.0t
C (F ) � 1.0F t
2A � 8.25 in (only one 2 � 6 is effective in tension)g
The allowable tension stress is

B U I L D I N G D E S I G N C A S E S T U D Y � 333
(a)
FIGURE 9.28
Unit shear, net shear,and drag strut forces(longitudinal wind):(a) roof; (b) secondfloor.
F� � F C C C C Ct t D M t F i
� (350)(1.6)(1)(1)(1)(1) � 560 psi
The allowable tension force in the top plates is
2T � F�A � (560 psi)(8.25 in ) � 4620 lb � T � 2000 lb OKallowable t g applied
Design for CompressionThe top plate is fully braced about both axes of bending. It is braced by the stud wall for
y–y or weak-axis bending, and it is braced by the roof or floor diaphragm for x–x or strong-axis bending, Therefore, the column stability factor CP � 1.0. The maximum applied com-pression force Pmax � 2000 lb. For stress grade, assume spruce-pine-fir Stud grade. Since a 2 �6 is dimension lumber, use NDS-S Table 4A for design values. From the table the followingdesign stress values are obtained:

334 � S T R U C T U R A L W O O D D E S I G N
FIGURE
9.28 (Continued )
(b)
TABLE 9.19 Seismic and Wind Loads on Drag Struts
Direction Levelvd (plf )
(from Table 9.13)vw (plf )
(from Table 9.14)
Net Shear,(plf )
Vw � Vd
Fds
(lb)
Seismic Loads
Transverse Roof 39.7 54.1 14.4 159Second floor 57.7 78.7 21.0 231
Longitudinal Roof 24.8 37.2 12.4 149Second floor 36.1 54.1 18.0 216
Wind Loads
Transverse Roof 83.3 113.7 30.4 335Second floor 166.7 227.3 60.6 667
Longitudinal Roof 34.4 51.6 17.2 207Second floor 49.0 73.4 24.4 293

B U I L D I N G D E S I G N C A S E S T U D Y � 335
F � 725 psic
C (wind) � 1.6D
C � 1.0M
C � 1.0t
C (F ) � 1.0F c
C � 1.0 (assumed)i
C � 1.0P
2A � 16.5 in (for two 2 � 6’s)g
The allowable compression stress is
F� � F C C C C C Cc c D M t F i P
� (725)(1.6)(1.0)(1.0)(1.0)(1.0)(1.0) � 1160 psi
The allowable compression force in the top plates is
2P � F�A � (1160 psi)(16.5 in ) � 19,140 lb � P � 2000 lb OKallowable c g applied
Lap SpliceThe IBC recommended minimum length of a top plate lap splice is 4 ft. If the length of a
lap splice length is more than twice the Code minimum length of 4 ft (i.e. 8 ft or more), thenailed or bolted connection each side of the splice can be designed for one-half of the full chordforce for double top plates and one-third of the full chord force for triple top plates. For lap splicelengths less than 8 ft, the splice is designed for the full chord or drag strut force. The IBCrequires a minimum of 8–16d nails each side of a splice connection.
We will design both nailed and bolted lap splices.(a) Using a nailed connection and assuming a lap splice length of 6 ft, we will design theconnection for the full chord force. The maximum applied tension or compression load on thetop plate splice T � 2000 lb. Try 16d common nails.
1–L � 3 (length of nail)2
D � 0.162 in. (diameter of nail)
Minimum spacing (see Table 8.1):
end distance � 15D � 2.43 in. ⇒ 2.5 in.
edge distance � 2.5D � 0.41 in. ⇒ 0.5 in.
center-to-center spacing � 15D � 2.43 in. ⇒ 2.5 in.
row spacing � 5D � 0.81 in. ⇒ 1 in.
Allowable lateral resistance per nail:
Z� � ZC C C C C C C CD M t g � eg di tn
C � 1.6 (wind)D
C � 1.0 (MC � 19%)M
C � 1.0 (T � 100�F)t
C , C , C , C , C � 1.0g � eg di tn
The tabulated single shear value for 16d nail (spruce pine-fir framing), Z � (120 lb)(p/10D).

336 � S T R U C T U R A L W O O D D E S I G N
FIGURE 9.29 Nailedlap splice detail.
Z � (120)[1.5 in./(10 � 0.162)] � 111 lb (see NDS Code Table 11N and footnote 3)
The allowable shear per nail is
Z� � ZC C C C C C C CD M t g � eg di tn
� (111)(1.6)(1)(1)(1)(1)(1)(1)(1) � 177 lb per nail
T 2000 lbNo. of nails req’d � � � 11.3 ⇒ 12 nails
Z� 177 lb
Using a 6 ft 0 in. lap splice length and two rows of nails (which gives 6 nails per row), andassuming a center to center spacing of 3 inches, we obtain
minimum nail penetration P � 6D � 6(0.162) � 0.972 in. OK
Use twelve 16d nails in two rows each side of the splice (Figure 9.29).(b) Bolted Lap SpliceNailed lap splices are more commonly used for top plates, but as an alternate, we will design abolted lap splice in this section. Assuming a lap splice length of 6 ft, which is less than twice theCode minimum lap splice length of 4 ft, therefore, the lap splice connection must be designedfor the full chord force. The maximum applied tension or compression force on the top platesplice (see Tables 9.18 and 9.19) is
T � 2000 lb
Assume in. diameter thru-bolts5–8The length of the fastener is given as
L � 1.5 in. (side member) � 1.5 in. (main member) � 3 in.
The minimum bolt spacing to achieve a geometry factor C� of 1.0 are as follow:

B U I L D I N G D E S I G N C A S E S T U D Y � 337
5–end distance � 7D � (7)( in.) � 4.38 in. ⇒ 4.5 in.8
edge distance: For L/D � 3/0.625 � 4.8 � 6,
� 1.5D � 0.94 in.
center-to-center spacing � 4D � 2.5 in.
row spacing � 1.5D � 0.94 in.
Allowable lateral load per bolt, Z� � ZCDCMCtCgC�CegCdiCtn
where CD � 1.6 (wind)CM � 1.0 (MC � 19%)Ct � 1.0 (T � 100� F)
C�, Ceg, Cdi, Ctn � 1.0
Cg: As � Am � (1.5 in.) � (5.5 in.) � 8.25 in.2 ⇒ As/Am � 1.0
Assume number of fasteners in a row � 3 (this will be verified later)
Entering NDS Code Table 10.3.6A with As/Am of 1.0, As of 8.25 in2, and 3 bolts in a row,the group factor, Cg can be obtained by linear interpolation as
0.99 � 0.97 2 2C � 0.97 � (8.25 in. � 5 in. )� �g 2 212 in. � 5 in.
� 0.98
Since the lateral load is parallel to the grain in both the side and main members,
Z � Z � 510 lb per bolt (See NDS Code Table 11A)�
Z� � Z C C C C C C C C� D M t g � eg di tn
� 510 � 1.6 � 1 � 1 � 0.98 � 1 � 1 � 1 � 1 � 799 lb per bolt
Number of bolts required to resist the axial force in the top plate splice is,
� T/Z� � 2000/799 � 2.5 � 3 bolts
Since the number of bolts required above is less than or equal to the number of bolts initiallyassumed in calculating Cg, this implies that the Cg value obtained above is conservative, and the3 bolts in a row initially assumed is adequate.
It should noted, however, that if the calculated number of bolts required had been greaterthan the number of bolts initially assumed, the Cg value would have had to be recalculated usingthe newly calculated required number of bolts; and the process is repeated until the number ofbolts required in the current cycle is less than or equal to the number of bolts used in the previouscycle.
Therefore, use 3 – in. diameter bolts in a single row each side of the lap splice5–8
Hold-Down Anchors
From Table 9.17 the maximum uplift at the second floor was 895 lb due to windloads. At theground level, the maximum tension was 4458 lb also due to wind loads. Adding the 710 lbfrom the uplift on the MWFRS (see Section 9.4), the total net uplift forces become 1605 lband 5168 lb at the second floor and ground level, respectively. Although both connectors aretypically selected from a variety of preengineered products, the connector at the second floorwill be designed.
Hold-Down StrapAssuming an 18-gage ASTM A653 grade 33 strap and 10d common nails, determine the
strap length and nail layout.

338 � S T R U C T U R A L W O O D D E S I G N
FIGURE 9.30 Hold-down strap detail.
L � 3 in. (length of nail)
D � 0.148 in. (diameter of nail)
Minimum spacing (see Table 8.1):
end distance � 15D � 2.22 in. ⇒ 2.5 in.
edge distance � 2.5D � 0.37 in. ⇒ 0.5 in. (0.75 in. provided)
center-to-center spacing � 15D � 2.22 in. ⇒ 2.5 in.
row spacing not applicable since there is only one row of nails
minimum p � 10D � 1.48 in. (approx. 3 in. provided)
From NDS Table 11P, the nominal lateral design value is Z � 99 lb. The allowable shear pernail
Z� � ZC C C C C C C CD M t g � eg di tn
� (99)(1.6)(1)(1)(1)(1)(1)(1)(1) � 158.4 lb per nail
T 1605 lbNo. of nails req’d � � � 10.2 ⇒ 6 nails each side
Z� 158.4 lb
(a steel strap will be provided on both sides of the studs to avoid eccentric loading).The required length of strap
L � (2)[(2.5 in. end dist.) � (5 spaces)(2.5 in.) � (2.5 in. end dist.)]min
� (18 in. floor structure) � 53 in.
See Figure 9.30 for strap detail.
Hold-down AnchorA generic anchor selection table is shown in Figure 9-31. Comparing the maximum tensionload of 4088 lb., the hold-down anchor HD4 is selected. With Spruce-Pine-Fir lumber and aload duration factor of 1.6 (160%), the capacity of this connector is 5200 lb. Note that this hold-down connector will be required at each end of the shear wall since the lateral loads can act ineither direction. The effect of eccentricity on this connection will be discussed in a later sectionwhen the chords are designed.
Sill Anchors
From Table 9.17 the maximum shear at the ground level is 3750 lb shear wall SW1. The anchorbolts will now be designed.
Assuming -in. anchor bolts embedded 7 in. into concrete with a minimum 28-day strength1–2of 2500 psi, the allowable shear in the anchor bolts parallel to the grain of the sill plate

B U I L D I N G D E S I G N C A S E S T U D Y � 339
FIGURE 9.31 Hold-down anchor detail.
Z� � ZC C C C C C C CD M t g � eg di tn
C � 1.6 (wind or seismic)D
C � 1.0 (MC � 19%)M
C � 1.0 (T � 100� F)t
C , C , C , C , C � 1.0g � eg di tn
Since the base shear is parallel to the grain of the sill plate; use
Z � 590 lb (NDS Table 11E)�
Minimum spacing (see Table 8.3):
end distance � 7D � 3.5 in.
edge distance � 1.5D � 0.75 in.
center-center-spacing � 4D � 2.0 in.
row spacing is not applicable here since there is only one row of bolts.
These distances will be maintained in the detailing; therefore, C� � 1.0.The allowable shear per bolt
Z� � ZC C C C C C C CD M t g � eg di tn
� (590)(1.6)(1)(1)(1)(1)(1)(1)(1) � 944 lb per bolt
⇒ number of sill anchor bolts required � 3750 lb/944 lb � 3.97 � 4 bolts
Maximum bolt spacing � (11 ft wall length � 1 ft edge distance � 1 ft edge distance)/(4 bolts� 1) � 3 ft 0 in. This is less than the maximum spacing of 6 ft 0 in. permitted by the code.
Use -in.-diameter anchor bolts at 3 ft 0 in. o.c. See Figure 9.32.1–2
9.14 SHEAR WALL CHORD DESIGN
The shear wall chords will now be designed. From Table 9.17 the maximum uplift at the groundlevel is 5168 lb and the maximum compression is 8838 lb. In addition to designing the shearwall chords for the maximum tension and compression loads, a connector needs to be providedto transfer the uplift load to the foundation. It is common practice to select a preengineeredconnector to resist this load (see Figure 9.33 various hold-down anchors).
Note that if the connector is one-sided such that the load path is eccentric to the shear wallchord, the chord must be designed to resist the tension load plus the bending moment inducedby the eccentric load (see Figure 9.34) using the methods discussed in Chapter 5. If the hold-down connector requires bolts through the chords, the net area of the chord should be used in

340 � S T R U C T U R A L W O O D D E S I G N
FIGURE 9.32 Anchorbolt details.
the design. For this example, a hold-down anchor with a single anchor bolt placed 1.25 in. fromthe face of the inner stud and two -in. bolts through the chords was selected. Two 2 � 61–2chords will be assumed. Note that multiple chords need to be nailed or bolted together inaccordance with NDS Section 15.3.3 (nailed) or 15.3.4 (bolted).
The following data will be used for the design of the shear wall chords:
C (wind) � 1.6D
C � 1.0M
C � 1.0t
C (F ,F ) � 1.3F t b
C (F ) � 1.1F c
C � 1.15 (for the tension case)fu
C � 1.0i
C � 1.0r
From NDS Table 4A (spruce-pine-fir, select structural):
F � 1250 psib
F � 700 psit
F � 1400 psic
6E � 0.55 � 10 psimin
For two 2 � 6’s:
d � 5.5 in.
b � (2)(1.5 in.) � 3 in.
2 2A � (2)(8.25 in ) � 16.5 ing
1 1 2– –A � A � A � (16.5) � (2)(1.5 in.)( in. � in.) � 14.6 inn g holes 2 8
3 3S � (3)(31.64 in ) � 94.92 iny
L � 12 ft � 144 in. (floor-to-floor height)u
Design for CompressionCheck the slenderness ratio:
l (1.0)(144 in.)e � � 26.1 � 50 OK (from Section 5.4, where l � K l )e e ud 5.5 in.
Column stability factor CP:

B U I L D I N G D E S I G N C A S E S T U D Y � 341
FIGURE 9.33 Hold-down anchor types.
FIGURE 9.34
Eccentric hold-downanchor.
c � 0.8 (sawn lumber)
K � 1.0 (Section 5.4)f
6 6E� � E C C C � (0.55 � 10 )(1.0)(1.0)(1.0) � 0.55 � 10min min M t i
60.822E� (0.822)(0.55 � 10 )minF � � � 659 psicE 2l /d (26.1)e
F* � F C C C C Cc c D M t F i
� (1400)(1.6)(1.0)(1.0)(1.0)(1.0)(1.1)(1.0) � 2464 psi
21 � F /F* 1 � F /F* F /F*cE c cE c cE cC � K � � [equation (5.21)]� � � �P f �2c 2c 2c
21 � 659/2464 1 � 659/2464 659/2464� (1.0) � � � 0.250� � � ��(2)(0.8) (2)(0.8) 0.8
Check compression loads:
F� � F*C � (2464 psi)(0.250) � 616 psic c P
2F�A � (616 psi)(16.5 in ) � 10,164 lb � 8838 lb (OK at midheight)c gP � allow 2F*A � (2464 psi)(14.6 in ) � 35,974 lb � 8838 lb (OK at base)c n
Design for TensionThe total tension force of 5168 lb (i.e., 4458 lb � 710 lb) is applied eccentrically to the
shear wall chords. The applied bending moment is

342
TAB
LE9
.20
Shea
rW
all
and
Hol
d-do
wn
Sche
dule
Mar
kH
eigh
t(f
t)Len
gth
(ft)
Unit
Shea
r(lb
/ft
)
Shea
rW
all
Chord
s
Com
pre
ssio
nForc
e(lb)
Ten
sion,
Hold
-Dow
n(lb)
Ply
wood
thic
knes
san
dN
ailing
Sid
esLev
elH
old
-Dow
nC
onnec
tor
Hold
-dow
nA
nch
or
Bolt
Em
bed
men
t
Sill
Anch
ors
Bolts
SW1
1211
114
/34
12-
2�
62-
2�
613
84/
8137
895
/44
58(1
605
/51
68)7
�St
r.-1
C-D
X,
15 –– 328d
nails
@6�
o.c.
ated
ges,
12�
o.c.
Fiel
d
1 1Se
cond
flr
Gro
und
floor
18ga
.-53
�st
rap,
(12)
-10d
nails
HD
47�
�di
a.@
1 – 23�
-0�
o.c.
SW2
1212
51.6
/12
52-
2�
62-
2�
646
86/
8838
No
Upl
ift�
Str.
-1C
-DX
,1
5 –– 328d
nails
@6�
o.c.
ated
ges,
12�
o.c.
Fiel
d
1 1
Seco
ndflr
Gro
und
floor
18ga
.-53
�st
rap,
(12)
-10d
nails
HD
17�
�di
a.@
1 – 23�
-0�
o.c.
SW3
128
51.6
/12
52-
2�
62-
2�
646
86/
8838
No
Upl
ift�
Str.
-1C
-DX
,1
5 –– 328d
nails
@6�
o.c.
ated
ges,
12�
o.c.
Fiel
d�
Str.
-1C
-DX
,1
5 –– 328d
nails
@6�
o.c.
ated
ges,
12�
o.c.
Fiel
d
1 1
Seco
ndflr
Gro
und
floor
18ga
.-53
�st
rap,
(12)
-10d
nails
HD
17�
�di
a.@
1 – 23�
-0�
o.c.
Not
es:
1.A
llpl
ywoo
dpa
nele
dges
shal
lbe
bloc
ked
with
2�w
ood
bloc
king
.2.
All
plyw
ood
pane
lssh
alle
xten
dfr
ombo
ttom
ofso
leor
sill
plat
eto
top
ofth
eto
ppl
ates
.3.
Whe
reov
ersi
zed
bolt
hole
sin
the
sill
plat
ear
ene
eded
for
ease
ofpl
acem
ent
ofth
esi
llan
chor
s,sl
eeve
the
bolt
hole
sw
ithm
etal
slee
ves
and
fill
the
gaps
betw
een
the
bolts
and
the
insi
defa
ceof
the
slee
vew
ithex
pans
ive
cem
ent
toen
sure
snug
tight
cond
ition
.4.
Ply
woo
dpa
nels
shal
lhav
ea
min
imum
span
ratin
gof
.24 –– 16
5.Lo
cate
edge
nails
atan
edge
dist
ance
ofno
tle
ssth
an�
from
pena
ledg
esan
dat
equa
ldis
tanc
efr
omth
epa
nele
dges
and
the
edge
ofth
ew
ood
fram
ing.
3 – 8
6.A
llsh
ear
wal
lanc
hor
bolts
shal
lhav
ea
min
imum
embe
dmen
tof
7in
ches
into
the
conc
rete
foun
datio
nw
all.
7.16
05lb
and
5168
lbU
plift
forc
esin
clud
e71
0lb
forc
edu
eto
win
dup
lift.

B U I L D I N G D E S I G N C A S E S T U D Y � 343
FIGURE 9.35 Groundfloor plan.
M � Te � (5168)(1.5 in. � 1.25 in.) � 14,212 in.-lb
The allowable stresses are
F� � F C C C C Ct t D M t F i
� (700)(1.6)(1.0)(1.0)(1.0)(1.0)(1.3)(1.0) � 1456 psi
F� � F C C C C C C Cb b D M t F fu i r
� (1250)(1.6)(1.0)(1.0)(1.3)(1.15)(1.0)(1.0) � 2990 psi
The actual stresses are
T 5168f � � � 354 psit A 14.6n
2b dnetS �y 6
The width of the chords is reduced by the presence of the bolts that connect the hold-downanchors to the chord member.

344 � S T R U C T U R A L W O O D D E S I G N
FIGURE 9.36 Secondfloor framing plan.
1 1– –b � 5.5 in. � ( in. � in.) � 4.88 in. (effective width of chords)net 2 8
d � (2)(1.5 in.) � 3 in.
2(4.88)(3 in.) 3S � � 7.31 iny 6
M 14,212f � � � 1944 psib S 7.31y
Check the combined stresses:
f ft b� � 1.0F� F�t b
354 1944� � 0.89 � 1.0 OK for combined stresses
1456 2990
Two 2 � 6 chords are structurally adequate for the worst-case loading conditions. The otherchords could be designed, but it is common practice to provide the same chords and hold-downanchors at the ends of all shear walls for buildings of this size.
9.15 CONSTRUCTION DOCUMENTS
In a typical wood building project, the construction documents would include the structural,mechanical, electrical and architectural drawings as well as the construction specifications that

B U I L D I N G D E S I G N C A S E S T U D Y � 345
FIGURE 9.37 Roofframing plan.
FIGURE 9.38 Rooftruss members.
would enable the builder construct the building. For the building design case study, the drawingsshown in Figures 9.35 through 9.38 is representative of what would typically be shown on aconstruction set of structural drawings.
REFERENCES
1. ICC (2006), International Building Code, International Code Council, Washington, DC.2. ASCE (2005), Minimum Design Loads for Buildings and Other Structures, American Society of Civil
Engineers, Reston, VA.

346 � S T R U C T U R A L W O O D D E S I G N
3. NAHB (2000), Residential Structural Design Guide—2000, National Association of Home BuildersResearch Center.
4. Cohen, Albert H. (2002), Introduction to Structural Design: A Beginner’s Guide to Gravity Loads andResidential Wood Structural Design, AHC, Edmonds, WA.
5. ICC (2003), International Building Code, International Code Council, Washington, DC.

347
a p p e n d i x A
WEIGHTS OF BUILDING MATERIALS
WOOD FRAMING
Weights shown are for Douglas fir-larch, G � 0.50, which is conservative for most structures.
NominalSize
Weight (psf ) for Spacing:
12 in. o.c 16 in. o.c. 19.2 in. o.c. 24 in. o.c.
2 � 4 1.2 0.9 0.8 0.6
2 � 6 1.8 1.4 1.2 0.9
2 � 8 2.4 1.8 1.5 1.2
2 � 10 3.1 2.3 1.9 1.5
2 � 12 3.7 2.8 2.3 1.9
2 � 14 4.4 3.3 2.7 2.2
2 � 16 5.0 3.8 3.1 2.5
3 � 4 1.9 1.5 1.2 1.0
3 � 6 3.0 2.3 1.9 1.5
3 � 8 4.0 3.0 2.5 2.0
3 � 10 5.1 3.8 3.2 2.6
3 � 12 6.1 4.6 3.9 3.1
3 � 14 7.2 5.4 4.5 3.6
3 � 16 8.3 6.2 5.2 4.2
4 � 4 2.7 2.0 1.7 1.4
4 � 6 4.2 3.2 2.7 2.1
4 � 8 5.5 4.2 3.5 2.8
4 � 10 7.1 5.3 4.4 3.6
4 � 12 8.6 6.4 5.4 4.3
4 � 14 10.1 7.6 6.3 5.1
4 � 16 11.6 8.7 7.3 5.8
Structural Wood Design: A Practice-Oriented Approach Using the ASD Method. Abi Aghayere and Jason VigilCopyright © 2007 John Wiley & Sons, Inc.

348 � S T R U C T U R A L W O O D D E S I G N
PREENGINEERED FRAMING
Roof Trusses
Span(ft.)
Weight (psf ofhorizontal plan area)
30 5.0
35 5.5
40 6.0
50 6.5
60 7.5
80 8.5
100 9.5
120 10.5
150 11.5
Floor Joists (I-Joists and Open Web)
Depth(in.)
Weight (psf ofhorizontal plan area)
1–92 2.57–118 3.5
14 4.0
16 4.5
18 5.0
20 5.5
24 6.0
26 6.3
28 6.6
30 7.0

A P P E N D I X A � 349
OTHER MATERIALS
Weight (psf )
SheathingPlywood (per -in. thickness)1–8 0.4Gypsum sheathing (per 1-in. thickness) 5.0Lumber sheathing (per 1-in. thickness) 2.5
Floors and floor finishesAsphalt mastic (per 1-in. thickness) 12.0Ceramic or quarry tile ( -in. thickness)3–4 10.0Concrete fill (per 1-in. thickness) 12.0Gypsum fill (per 1-in. thickness) 6.0Hardwood flooring ( -in. thickness)7–8 4.0Linoleum or asphalt tile (per -in. thickness)1–4 1.0Slate (per 1-in. thickness) 15.0Softwood ( -in. thickness)3–4 2.5Terrazzo (per 1-in. thickness) 13.0Vinyl tile ( -in. thickness)1–8 1.4
RoofsCopper or tin 1.0Felt
3-ply ready roofing 1.53-ply with gravel 5.55-ply 2.55-ply with gravel 6.5
Insulation (per 1-in. thickness)Cellular glass 0.7Expanded polystyrene 0.2Fiberboard 1.5Fibrous glass 1.1Loose 0.5Perlite 0.8Rigid 1.5Urethane foam with skin 0.5
Metal deck 3.0Roll roofing 1.0Shingles
Asphalt ( -in.)1–4 2.0Clay tile 12.0Clay tile with mortar 22.0Slate ( -in.)1–4 10.0Wood 3.0
CeilingsAcoustical fiber tile 1.0Channel-suspended system
Steel 2.0Wood furring 2.0
Plaster on wood lath 8.0
Walls and partitionsBrick (4-in. nominal thickness) 40Glass (per 1-in. thickness) 15Glass block (4-in. thickness) 18Glazed tile 18Plaster 8.0Stone (4-in. thickness) 55Stucco ( -in. thickness)7–8 10.0Vinyl siding 1.0Windows (glass, frame, sash) 8.0Wood paneling 2.5

350
a p p e n d i x B
DESIGN AIDS
NOTES ON DESIGN AIDS
Allowable Uniform Loads on Floor Joists
The allowable uniform load is calculated with respect to joist length for common 2� lumbersizes and wood species. The repetitive member factor applies and normal load duration wasassumed. Joists were analyzed for bending and deflection (creep factor k � 1.0). Shear is typicallynot a controlling factor and was not used; consequently, the allowable uniform load usually doesnot exceed 300 plf in the charts. For practical reasons, joist lengths exceeding 30 ft were notconsidered. Furthermore, joists in the deflection-controlled region should be investigated forvibration.
Allowable Axial Loads on Columns
The allowable axial load is calculated with respect to the unbraced length for common squarecolumn sizes (4 � 4 through 10 � 10) using common wood species. Normal load duration wasassumed. Values for southern pine in wet service conditions were included since southern pineis commonly used in exterior applications (such as wood-framed decks).
Combined Axial and Bending Loads on Wall Studs
A unity curve is plotted in accordance with NDS Equation 3.9.2 for wall studs supporting verticalgravity loads and lateral wind loads. The repetitive member factor applies and a load durationfactor of CD � 1.6 was assumed. The weak axis is assumed to be fully braced by wall sheathing.
Structural Wood Design: A Practice-Oriented Approach Using the ASD Method. Abi Aghayere and Jason VigilCopyright © 2007 John Wiley & Sons, Inc.

A P P E N D I X B � 351
FIGURE B.1 Allowable uniform loads on floor joists (DF-L, Sel. Str.).
FIGURE B.2 Allowable uniform loads on floor joists (DF-L, No. 1).

352 � S T R U C T U R A L W O O D D E S I G N
FIGURE B.3 Allowable uniform loads on floor joists (DF-L, No. 2).
FIGURE B.4 Allowable uniform loads on floor joists (hem-fir, Sel. Str.).

A P P E N D I X B � 353
FIGURE B.5 Allowable uniform loads on floor joists (hem-fir, No. 1).
FIGURE B.6 Allowable uniform loads on floor joists (hem-fir, No. 2).

354 � S T R U C T U R A L W O O D D E S I G N
FIGURE B.7 Allowable uniform loads on floor joists (spruce-pine-fir, Sel. Str.).
FIGURE B.8 Allowable uniform loads on floor joists (spruce-pine-fir, No. 1/No. 2).

A P P E N D I X B � 355
FIGURE B.9 Allowableaxial loads oncolumns (DF-L, Sel.Str.).

356 � S T R U C T U R A L W O O D D E S I G N
FIGURE B.10
Allowable axial loadson columns (DF-L,No. 1).

A P P E N D I X B � 357
FIGURE B.11 Allowable axial loads on columns (DF-L, No. 2).
FIGURE B.12 Allowable axial loads on columns (hem-fir, Sel. Str.).

358 � S T R U C T U R A L W O O D D E S I G N
FIGURE B.13 Allowable axial loads on columns (hem-fir, No. 1).
FIGURE B.14 Allowable axial loads on columns (hem-fir, No. 2).

A P P E N D I X B � 359
FIGURE B.15 Allowable axial loads on columns (spruce-pine-fir, Sel. Str.).
FIGURE B.16 Allowable axial loads on columns (spruce-pine-fir, No. 1).

360 � S T R U C T U R A L W O O D D E S I G N
FIGURE B.17
Allowable axial loadson columns (spruce-pine-fir, No. 2).
FIGURE B.18
Allowable axial loadson columns (southernpine, Sel. Str.).

A P P E N D I X B � 361
FIGURE B.19
Allowable axial loadson columns (southernpine, No. 1).
FIGURE B.20
Allowable axial loadson columns (southernpine, No. 2).

362 � S T R U C T U R A L W O O D D E S I G N
FIGURE B.21
Combined axial andbending loads on 2� 6 wall studs (DF-L, Sel. Str.,CD � 1.6).

A P P E N D I X B � 363
FIGURE B.22
Combined axial andbending loads on 2� 6 wall studs (DF-L, No. 1, CD � 1.6).

364 � S T R U C T U R A L W O O D D E S I G N
FIGURE B.23
Combined axial andbending loads on 2� 6 wall studs (DF-L, No. 2, CD � 1.6).
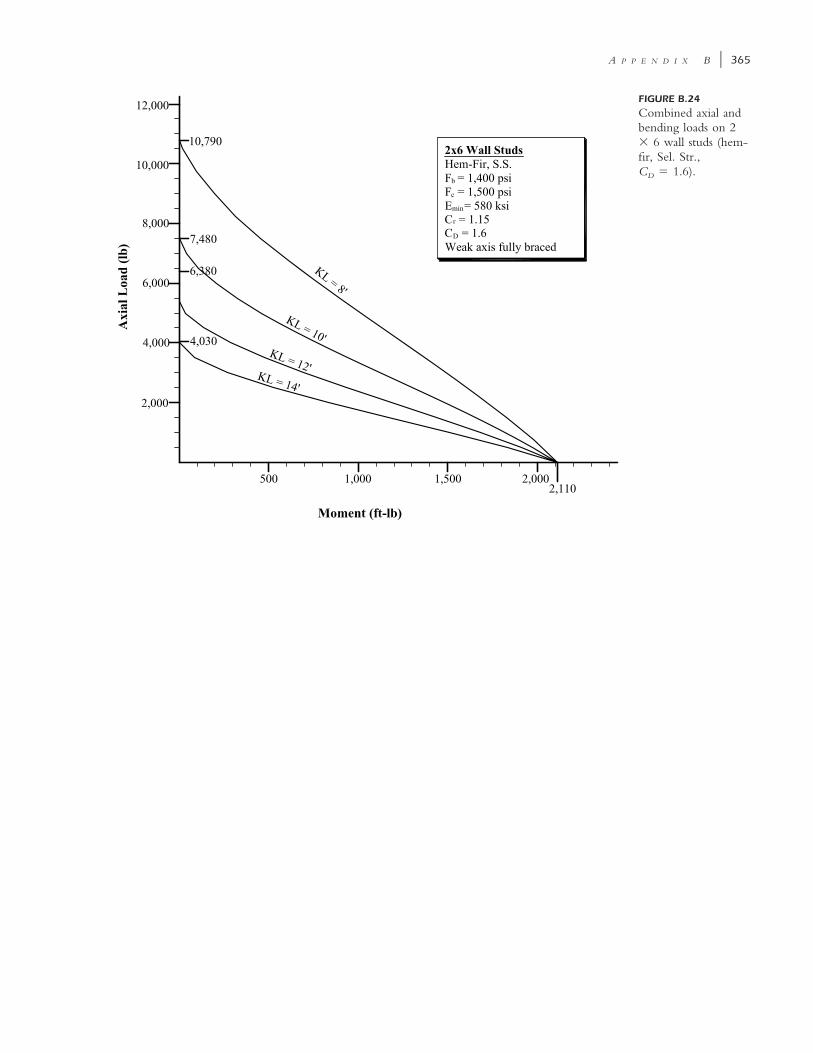
A P P E N D I X B � 365
FIGURE B.24
Combined axial andbending loads on 2� 6 wall studs (hem-fir, Sel. Str.,CD � 1.6).

366 � S T R U C T U R A L W O O D D E S I G N
FIGURE B.25
Combined axial andbending loads on 2� 6 wall studs (hem-fir, No. 1,CD � 1.6).

A P P E N D I X B � 367
FIGURE B.26
Combined axial andbending loads on 2� 6 wall studs (hem-fir, No. 2,CD � 1.6).

368 � S T R U C T U R A L W O O D D E S I G N
FIGURE B.27
Combined axial andbending loads on 2� 6 wall studs(spruce-pine-fir, Sel.Str., CD � 1.6).

A P P E N D I X B � 369
FIGURE B.28
Combined axial andbending loads on 2� 6 wall studs(spruce-pine-fir, No.1/No. 2, CD � 1.6).
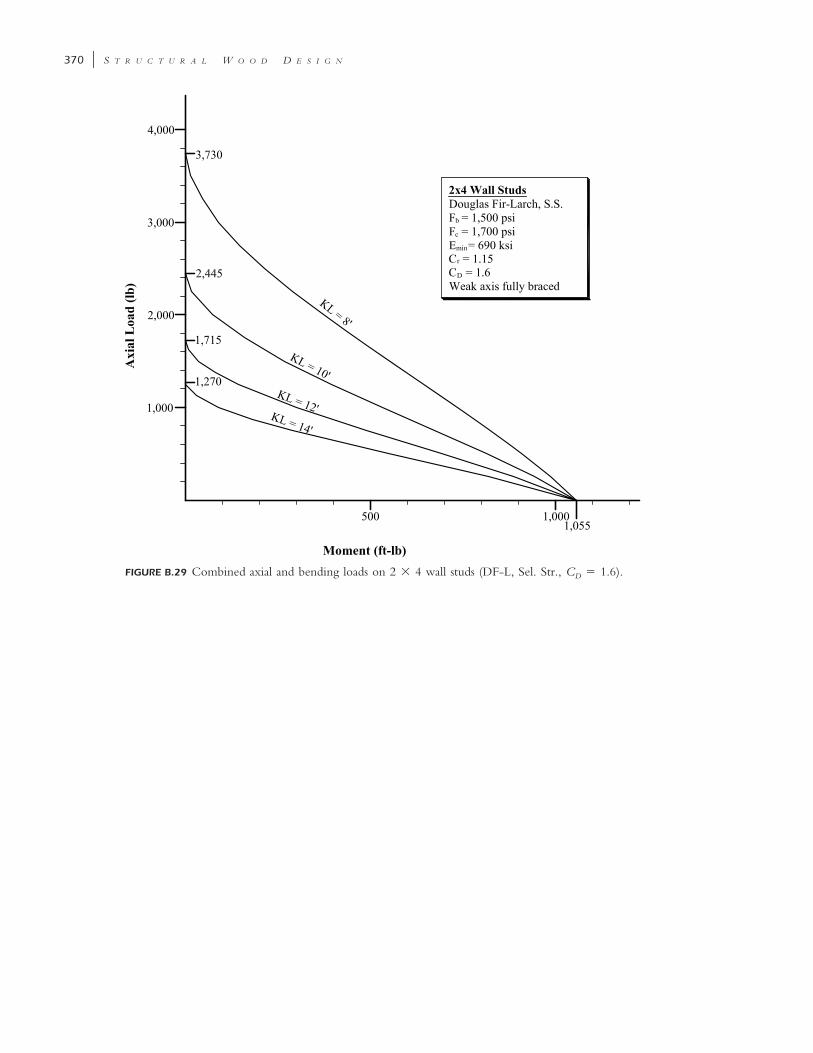
370 � S T R U C T U R A L W O O D D E S I G N
FIGURE B.29 Combined axial and bending loads on 2 � 4 wall studs (DF-L, Sel. Str., CD � 1.6).

A P P E N D I X B � 371
FIGURE B.30
Combined axial andbending loads on 2� 4 wall studs (DF-L, No. 1, CD � 1.6).
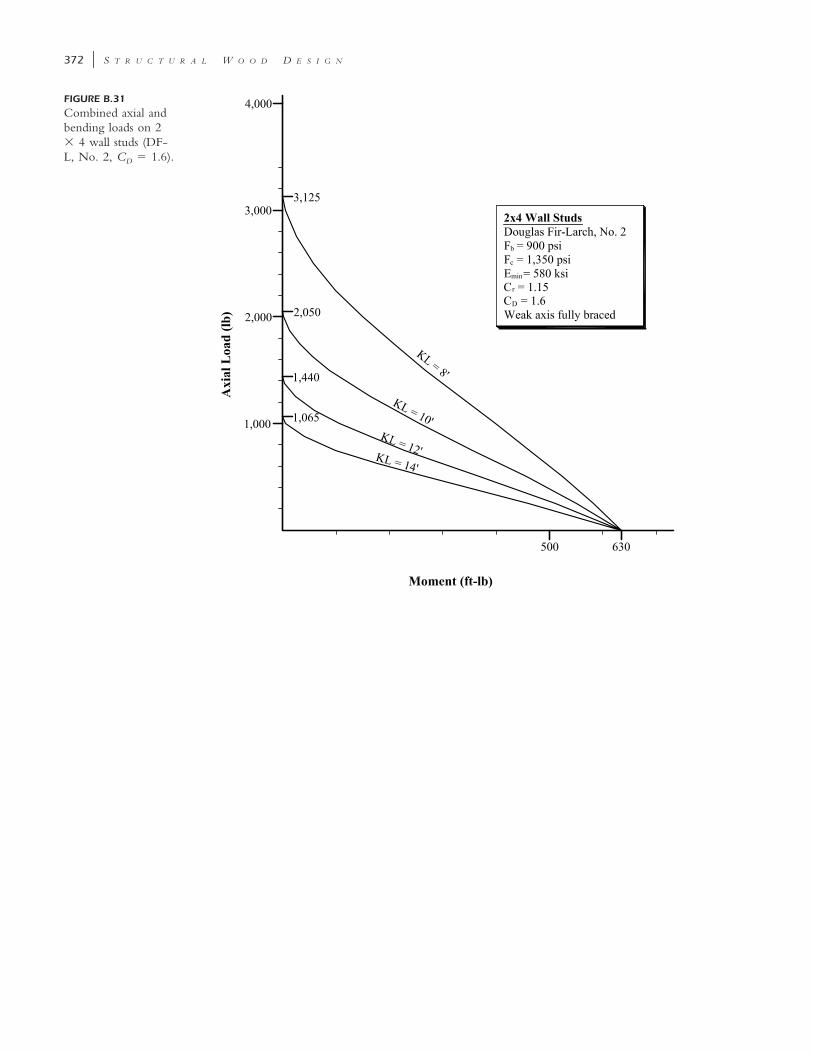
372 � S T R U C T U R A L W O O D D E S I G N
FIGURE B.31
Combined axial andbending loads on 2� 4 wall studs (DF-L, No. 2, CD � 1.6).

A P P E N D I X B � 373
FIGURE B.32
Combined axial andbending loads on 2� 4 wall studs (hem-fir, Sel. Str.,CD � 1.6).

374 � S T R U C T U R A L W O O D D E S I G N
FIGURE B.33
Combined axial andbending loads on 2� 4 wall studs (hem-fir, No. 1,CD � 1.6).

A P P E N D I X B � 375
FIGURE B.34
Combined axial andbending loads on 2� 4 wall studs (hem-fir, No. 2,CD � 1.6).

376 � S T R U C T U R A L W O O D D E S I G N
FIGURE B.35
Combined axial andbending loads on 2� 4 wall studs(spruce-pine-fir, Sel.Str., CD � 1.6).
FIGURE B.36
Combined axial andbending loads on 2� 4 wall studs(spruce-pine-fir, No.1/No. 2, CD � 1.6).

A P P E N D I X B � 377
FIGURE B.37
Combined axial andbending loads on 2� 6 wall studs (DF-L, Sel. Str.,CD � 1.0).

378 � S T R U C T U R A L W O O D D E S I G N
FIGURE B.38
Combined axial andbending loads on 2� 6 wall studs (DF-L, No. 1, CD � 1.0).

A P P E N D I X B � 379
FIGURE B.39
Combined axial andbending loads on 2� 6 wall studs (DF-L, No. 2, CD � 1.0).

380 � S T R U C T U R A L W O O D D E S I G N
FIGURE B.40
Combined axial andbending loads on 2� 6 wall studs (hem-fir, Sel. Str.,CD � 1.0).

A P P E N D I X B � 381
FIGURE B.41
Combined axial andbending loads on 2� 6 wall studs (hem-fir, No. 1,CD � 1.0).
FIGURE B.42
Combined axial andbending loads on 2� 6 wall studs (hem-fir, No. 2,CD � 1.0).

382 � S T R U C T U R A L W O O D D E S I G N
FIGURE B.43
Combined axial andbending loads on 2� 6 wall studs(spruce-pine-fir, Sel.Str., CD � 1.0).
FIGURE B.44
Combined axial andbending loads on 2� 6 wall studs(spruce-pine-fir, No.1/No. 2, CD � 1.0).

A P P E N D I X B � 383
FIGURE B.45
Combined axial andbending loads on 2� 4 wall studs (DF-L, Sel. Str.,CD � 1.0).

384 � S T R U C T U R A L W O O D D E S I G N
FIGURE B.46
Combined axial andbending loads on 2� 4 wall studs (DF-L, No. 1, CD � 1.0).

A P P E N D I X B � 385
FIGURE B.47
Combined axial andbending loads on 2� 4 wall studs (DF-L, No. 2, CD � 1.0).

386 � S T R U C T U R A L W O O D D E S I G N
FIGURE B.48
Combined axial andbending loads on 2� 4 wall studs (hem-fir, Sel. Str.,CD � 1.0).

A P P E N D I X B � 387
FIGURE B.49
Combined axial andbending loads on 2� 4 wall studs (hem-fir, No. 1,CD � 1.0).

388 � S T R U C T U R A L W O O D D E S I G N
FIGURE B.50
Combined axial andbending loads on 2� 4 wall studs (hem-fir, No. 2,CD � 1.0).
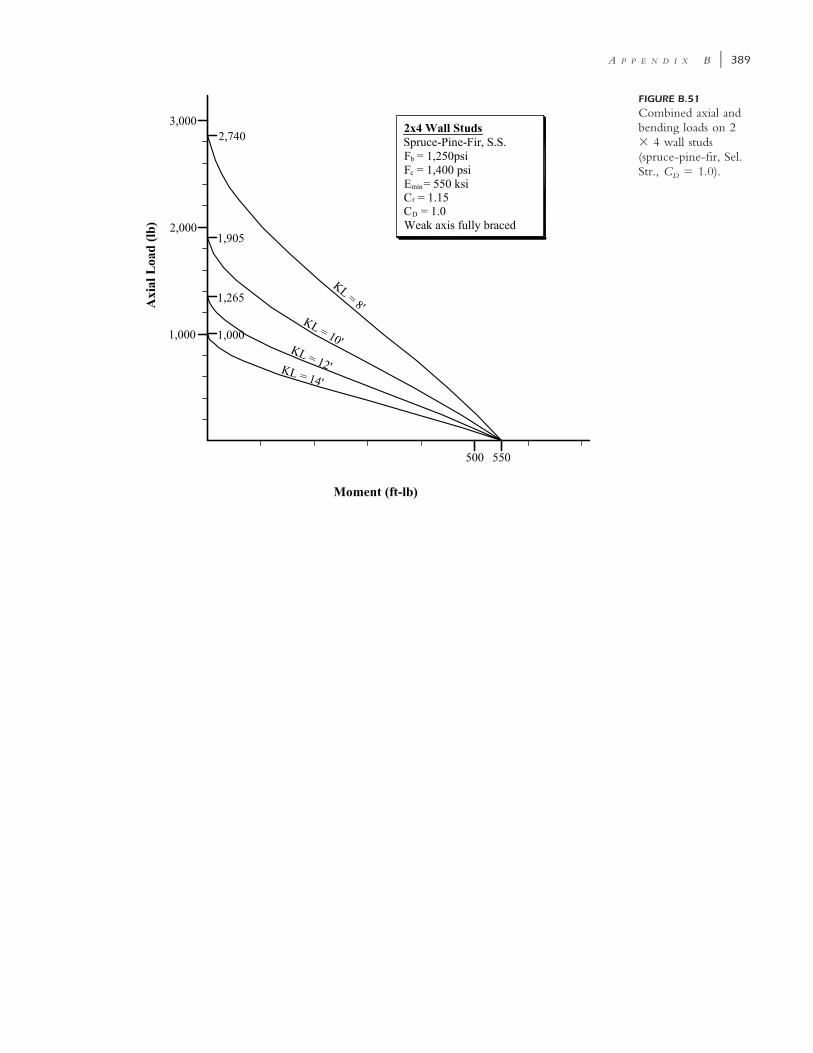
A P P E N D I X B � 389
FIGURE B.51
Combined axial andbending loads on 2� 4 wall studs(spruce-pine-fir, Sel.Str., CD � 1.0).

390 � S T R U C T U R A L W O O D D E S I G N
FIGURE B.52
bined axial andbending loads on 2� 4 wall studs(spruce-pine-fir, No.1/No. 2, CD � 1.0).

391
INDEX
AAdjustment factors
connections, 249–251glulam, 58–66sawn lumber, 58–66
Allowable stress design (ASD), 57Allowable stresses, design example, 60, 70–
77Anchor bolts
design example, 240–241, 338–342uplift, 338
Annual rings, 12Axes, in wood, 15–17Axial loads
compression, see Columnstension, see Tension members
BBalloon-type construction, 2Base shear
winds loads, 49–50, 287seismic loads, 52–53, 283–284
Beam stability factor, CL, 62–63design examples, 102, 109, 304, 309
Beam-columns, see Combined stressesBeams and stringers (B&S), 14Beams
bearing stress, see Bearing stressbending and compression, see Combined
stressesbending and tension, see Combined
stressesbending stress
adjustment factors, 58–66beam stability factor, CL, 62–63curvature factor, Cc, 65flat use factor, Cfu, 62, 118incising factor, Ci, 62lateral stability, 8, 62–63, 117–118load duration factor, CD, 59–60
notches, 116, 118–119, 122repetitive member factor, Cr, 61size factor, CF, 61temperature factor, Ct, 62volume factor, CV, 64weak axis, 62wet service factor, CM, 61
bridging, 4, 8camber, 42, 84, 111cantilever, 7, 64, 84creep, 14, 39, 83, 84deflection, 39–42effective length, 63–64flatwise loading, 62, 114flitch beam, 128–131header, 126–127, 307lateral bracing, 117–118modulus of elasticity
E, 66Emin, 66
notching, 116, 121, 122shear stress, 82–83
adjustment factors, 58notches, 118–119, 122
size factor, CF, 61slenderness ratio, RB, 63stringer, 28, 31, 113–116unbraced length, 63–66vibrations, 84, 128–142
Bearing area factor, Cb, 65Bearing length, 65, 85Bearing stress, 65–69
angle to the grain, 122–125parallel to grain (end grain), 122perpendicular to grain, 65–69, 85, 99
Bending stress, see Beams, bending stressBlocking
beams, 4, 8, 253diaphragms, 185–187, 192, 209–210shearwalls, 217–218
Structural Wood Design: A Practice-Oriented Approach Using the ASD Method. Abi Aghayere and Jason VigilCopyright © 2007 John Wiley & Sons, Inc.

392 � I N D E X
Board measure (board foot), 19–20Bolted connections
adjustment factors, 249–252angle to the grain, 260bending yield strength, 258–259bolt slenderness, 252design example
anchor bolts, 240–241, 338–342double shear, 263single shear, 253, 255, 257wood-to-steel, 254wood-to-wood, 253, 256
double shear, 259, 263dowel bearing strength, 253, 258–261geometry factor, C�, 250–251, 256, 257group action factor, Cg, 250, 254, 255load duration factor, CD, 249penetration, 251–252shrinkage, 249, 273single shear, 254, 255, 257spacing requirements, 250–252temperature factor, Ct, 250typical connections, 273–275wet service factor, CM, 249yield limit equations, 252–253, 260
Bottom plates, 3, 8Bound water, 11–13Buckling stiffness factor, CT, 65Building codes, 1, 20–22Built-up members
beams, 6columns, 153, 157, 159–165
CCamber, see Beams, camberCantilever beams, see Beams, cantileverCell structure, 11–13Cellulose, 11, 19Checks, 15Chords
diaphragms, see Diaphragms, chordsshearwalls, see Shearwalls, chords
Clearwood tests, 58Collar tie, 3, 8–11Collector, see Drag strutColumn stability factor, CP, 64, 157–159Columns
adjustment factors, 58bending, see Combined stressesbracing, 158–159buckling, 158–159buckling stiffness factor, CT, 65built-up, 157, 159, 161–165column stability factor, CP, 64, 158, 159design examples, 160–164, 311–314
shearwall chord, 339–344
eccentricity, 178effective length factor, 64, 153–158euler formula, 153slenderness ratio, 157–158
Combined stressesbending and compression, 162–166, 167–
170, 171–178bending and tension, 151–153, 154–157biaxial bending, 166interaction equation, 152, 166
Common nails, 249Compression parallel to grain, see ColumnsCompression perpendicular to grain, 11,
16–18, 69adjustment factorsbearing area factor, Cb, 65temperature factor, Ct, 62wet service factor, CM, 61
Connectionsbolts, see Bolted connectionshold-down, 218–219, 240, 337–341hurricane, 299–300joist hangers, 273lag screws, see Lag screw connectionsnails, see Nail connectionsnon-preferred, 274–275penetration, 251–252pre-engineered, 270preferred, 274–275spacing requirements, 250–252strap, 240–241, 338wood screws, see Wood screw
connectionswithdrawal, see Withdrawal connectionsyield limit, see Yield limit equations
Continuous load path, 189–191, 219–220Creep, see Beams, creepCripple stud, 6–7Curvature factor, Cc, 65
DDead loads, 25–28, 347–349Decay, 12, 15Decking, 14, 61–63, 118–120
design example, 119–121layup patterns, 118
Defects, 12–13, 15–18Deflection, 39–42Density of wood, 19, 347Design aids, 350Detailing of connections, 273–275Diaphragm factor, Cdi, 249–251Diaphragms
anchorage, 189–190, 192aspect ratio, 196–197beam action, 183, 190–191, 193–194,
213

I N D E X � 393
blocked, 187, 192, 195–196, 209chords, 189–193, 200
lap splice connection, 208–209, 254–257, 331, 335–337
drag strut, 189–195flexible, 196–198load cases, 192–196nail, 187, 192open front structure, 197openings, 197–199proportions, 196–197rigid, 196–200shear diagram, 191, 194, 198, 210, 211shear strength, 192, 204, 205unblocked, 192, 195–196, 210unit shear, 190–195, 198
Dimension lumber, 14Dowel bearing strength, 253, 258–261Drag strut, 189–195, 200, 213
force calculation, 192, 194, 208, 212, 331force diagram, 195, 206, 207, 213, 332–
334Dressed lumber, 14Dry (moisture content), 11, 13–15, 19Duration of load, see Load duration factor
EEccentric loading, 165, 167Edge distance, 250–252Effective length
beams, 63–64columns, 64, 153–158
Embedmentanchor rods, 240, 260connections, see Connections, penetration
End distance, 250–252End grain factor, Ceg, 249, 251, 253End grain loading, 249, 251, 252, 268End joints–glulam, 67Equilibrium moisture content, 13, 18Euler critical buckling stress
beams, 63columns, 153
Exclusion value (5 percent), 58, 158
FFabricated wood components
i-joists, 3, 84, 117laminated veneer lumber (LVL), 5, 124,
243, 311parallel strand lumber (PSL), 5, 124open web trusses, 6
Factor of safety, 57, 66, 158, 224Fiber saturation point, 13, 18Finger joints, 67Flat use factor, Cfu, 62, 118
Flexible diaphragms, see DiaphragmsFlitch beam, 128–131Floor live load, 7, 25, 26, 38Floor sheathing, 185–190, 317–319Free water, 11, 13Fungi, 15
GGeometry factor, C�, 249–250, 256Glued laminated timber (Glulam)
adjustment factors, 58–66volume factor, Cv, 64
appearance grades, 67axial combinations, 67–69bending combinations, 67–69camber, 42, 84, 111combination symbols, 67–69compression zone in tension, 69design examples, 73–75, 92–96, 106–
112, 301–307fabrication
edge joints, 67end joints, 67glue, 61, 66–68mixed species, 66–68moisture content, 13
grades, 67laminations
compression, 69E-rated, 67tension, 69thickness, 66visually graded, 67
Grade stampsawn lumber, 15, 18sheathing, 184–185, 216–217
Grading, 15–18Grading agencies, 17–18Grain orientation, 11–17, 59Green lumber, 13, 20Group action factor, Cg, 249–250
design examples, 254, 255Growth rings, 11–12
HHankinson formula, 123, 258, 259Hardwood, 11, 12Header, 4, 6
design examples, 126–127, 307Heartwood, 11, 12Hip rafter, 5Hold-down anchors, 219, 240–241, 299–
300, 337–338, 340–343Hold-down straps, 240, 337–338Holes, in beams, see Beams, notchesHorizontal diaphragms, see Diaphragms

394 � I N D E X
Horizontal plane, 27–29, 36Horizontal shear, 82Horizontal thrust, 3, 9, 28–30
II-joist, 84, 117
design example (vibrations), 138Incising factor, Ci, 62In-grade testing, 58Interaction equation, see Combined stresses
JJack rafters, 3, 5Jack stud, 6, 7Joist
double or triple joists, 3, 4header and trimmer joists, 4in-line joists, 3, 4lapped joists, 3, 4rim joist, 4
KKiln-dried, 13, 66King stud, 6, 7Knee brace, 267, 268Knots, 15, 58
LLag screws
adjustment factors, 249–252bending yield strength, 258–259combined shear and withdrawal, 258, 270dimensions, 261design examples, 265, 269, 271Hankinson formula, 258penetration, 251–252spacing requirements, 250–252withdrawal, 249, 268, 269wood-to-metal, 265, 271wood-to-wood, 269yield modes, 252–253, 260
Laminated veneer lumber (LVL), 5, 126,243, 311
Laminationsglulam, 66–69plywood, 183–184
Lap splice (top plates), 208, 256, 257, 335–337
Lap splice (plywood), 242–245Lateral loads, 42–53
seismic, 45, 52–53, 283–284wind, 43–45, 46–51, 284–293
Lateral stability (bending), 8, 62–63, 117–118
Let-in bracing, 10Lignin, 11, 16, 82
Load and resistance factor design (LRFD),57
Load combinations, 25–26, 42, 60, 69, 75–77
Load duration factor, CD, 14, 58–60, 249connections, 249load combinations, 60, 69, 75–77values, 60
Load/slip modulus, �, 134–135Loads
combinations, 25–26, 42, 60, 69, 75–77dead loads, 25–28, 347–349duration, 14, 58–60, 249floor live load, 7, 25, 26, 38floor live load reduction, 35–39load path, 189–191, 219–220partitions, 26, 27roof, 25, 27–28, 30–32, 34seismic, 45, 283–284snow, 25–30, 32–38tributary areas, 28–33tributary width, 28–33wind, 43–45, 284–293
Lumberadjustment factors, 58allowable stresses, 57beams & stringers (B&S), 14classification, 13–16decking, 14, 61–63, 118–120defects, 12–13, 15–18density, 19, 347dimension lumber, 14dry, 11, 13–15, 19grade, 15–18green, 13, 20growth characteristics, 11–12machine evaluated (MEL), 18machine stress rated (MSR), 18moisture content, 11, 13–15, 19posts & timbers (P&T), 5, 14seasoned, 13, 18, 39shrinkage, 13–16, 18–22size classification, 14stress grades, 17, 18, 22, 118visually graded, 15, 17, 18
MMachine evaluated lumber (MEL), 18Machine stress rated (MSR), 18Modulus of elasticity, E, 66
adjustment factors, 58Emin, 66exclusion value, 58, 158
Moisture contenteffects
connections, 249–250

I N D E X � 395
creep (deflection), see Beams, creeplumber size, 11, 13–15, 19
equilibrium moisture content, 13, 18fiber saturation, 13, 18green, 13, 20seasoned, 13, 18wet service factor, CM, 61, 249
Moment magnification, see P-delta effects
NNail connections
adjustment factors, 249–252bending yield strength, 258–259design example
hold-down strap, 337–338knee brace, 267lap splice, 335–336plywood lap splice, 243toenail, 212wood-to-wood, 255, 262, 267
dowel bearing strength, 253, 258–261penetration, 251–252prebored holes, 251sheathing
diaphragms, 187, 192minimum nailing, 187, 217–218shearwalls, 217–218
splitting, 250–251toenail, 252–253, 272withdrawal, 249, 252, 268, 270yield limit equations, 252–253, 260yield modes, 259
Natural frequency, 128, 132NDS Code, 1NDS Supplement (NDS-S), 1Net area, 146–148Normalized load method, 69, 75–77Notching, see Beams, notches
OOrientation of wood grain, 11–17, 59Oriented strand board (OSB), 9, 11, 183Overturning, 10, 11, 220, 223–227, 322–
331
PP-delta effects, 162Parallel strand lumber (PSL), 5, 124Parallel to grain, see Orientation of wood
grainPerpendicular to grain, see Orientation of
wood grainPenetration, 251–252Platform construction, 2Plywood
axis orientation, 183–184, 188
blocking, 185–187, 192, 209–210cross-laminations, 183–184diaphragms, see Diaphragmsedge support, 183, 185–187exposure categories, 184exterior, 184–185floor sheathing, 183, 185–190glue, 184–185, 187grade, 183–185interior, 184–185product Standard, 183roof sheathing, 183–190shearwalls, see Shearwallsspan rating, 185–186species groups, 183–185tongue-and-groove, 186veneer, 183–185wall sheathing, 183–184, 216–217
Posts & timbers (P&T), 5, 14Purlins, 9, 106
RRacking, 10Rafter framing, 3–5Repetitive member factor, Cr
Resisting moment, 224–227Ridge beam, 3–5Ridge board, 3–4, 9Rigid diaphragm, 197–200Roof sheathing, see PlywoodRough sawn lumber, 14Row spacing, 250–252R, seismic factor, 52, 217
SSapwood, 11, 12Sawn lumber, see LumberScarf joint, 67Seasoned lumber, 13, 18, 39
air drying, 13kiln-drying, 13, 66
Section properties, 14Seismic loads, see LoadsShakes, 15Shear
beams, see Beamsconnections, see Connections
Shearwallsanchorage, 218–219, 240–241, 338–342aspect ratio, 219–221blocking, 217–218chords, 217, 218, 223–227, 235–241,
322, 325–331, 339–344drywall (GWB), 216–217, 242hold-downs, 219, 240–241, 299–300,
337–338, 340–343

396 � I N D E X
Shearwalls (continued )nailing requirements, 217–218overturning, 10, 11, 220, 223–227, 322–
331perforated, 219segmented, 219unit shear, 219, 234, 237, 242, 320–322,
332–334uplift (combined with shear), 242–244
Sheathing, see PlywoodShrinkage, 13–16, 18–22
calculation, 13, 19–21checking, 15
Sill plates, 2, 3, 7Size classification, see Lumber, size
classificationSize factor, CF, 61Slenderness ratio
beam, RB, 63column, 157–158
Slip modulus (vibrations), 134–135Snow load, 25–30, 32–38Spacing requirements (fasteners), 250–252Species, 12–13, 19, 183–185Split, 15, 19, 248–252Stress adjustment factors, see Adjustment
factorsStress grades, see Lumber, stress gradesStringer, see Beams, stringerStrut, see Drag strutStuds, see Wall studs
TTemperature factor, Ct, 62, 250Tension connections, 275Tension members
adjustment factors, 58, 145–146, 147–151
bending plus tension, see Combinedstresses
net area, 146–148Tension perpendicular to grain, 16, 17Toenail, see Nail connections, toenailToenail factor, Ctn, 252–253Tongue-and-grooved, 14, 118, 135, 186Top plates, 2, 7, 208, 256, 257, 335–337Torsion of horizontal diaphragms, 197–200Tributary area, 28–34Tributary width, 28–34Trusses
bridging, 180design examples, 149–150, 154–157,
167–170, 291–300
profiles, 6Two-layer floor system, 186, 189, 190
UUnbalanced live loads, 7, 298, 32, 35Unbraced length
beams, 63–66columns, 153, 157–159
Underlayment, 186, 189Unit shear
diaphragms, see Diaphragms, unit shearshearwalls, see Shearwall, unit shear
Uplift connectorroof, 299, 300wall, 240–241, 338
VValley rafter, 3–5Veneer, 183–185Vibrations, 131–142
design examples, 137–142Visually graded lumber, see LumberVolume factor, CV, 64
WWall sheathing, see Plywood, wall sheathingWall studs, 2, 3, 6, 7, 171–178, 312–316
cripple, 6–7jack, 6–7king, 6–7
Wane, 15Warping, 13–15Wet service factor, CM, 61, 249Wind loads, 43–45, 46–51, 284–293
components and cladding, 43–45, 287–291
Withdrawal connectionslag screws, 249, 268, 269nails, 249, 252, 268, 270wood screws, 249, 268, 269, 270
Wood axes, see Axes, woodWood screws
bending yield strength, 258–259design examples, 265–266, 269, 271dowel bearing strength, 253, 258–261penetration, 251–252prebored holes, 251withdrawal, 249, 268, 269, 270yield limit equations, 252–253, 260yield modes, 259
Wood structures, types, 1
YYield limit equations, 257–260