Structural study of human growth hormone-releasing factor fragment (1–29) by vibrational...
10
Pergamon Spectrochimica Acta, Vol. 51A, No. 5, pp. 929-938, 1995 Copyright (~ 1995 ElsevierScienceLtd Printed in Great Britain. All rights reserved 0584-8539(94)01315-6 0584-8539/95 $9.50 + 0.00 Structural study of human growth hormone-releasing factor fragment (1-29) by vibrational spectroscopy P. CARMONA,t M. MOLINA and A. LASAGABASTER Instituto de Optica (CSIC), Serrano 121, 28006 Madrid, Spain (Received 5 October 1994; in final form 31 October 1994; accepted 2 November 1994) Abstract--The conformationalstructure of fragment 1-29 of human growth hormone releasing factor, hGHRF (1-29), in aqueous solution and in the solid state is investigated by infrared and Raman spectroscopy. The polypeptide backbone is found to be unordered in the solid state. However, the spectra of the peptide prepared as 5% (w/w) aqueous solutions show that approximately 28% of the peptide is involved in intermolecular fl- sheet aggregation. The remainder of the peptide exists largely as disordered and fl-sheet conformationswith a small portion of a-helices. Tyrosine residues are found to be exposed to the solvent. The secondarystructures are quantitatively examined through infrared spectroscopy, the conformational percentages being near those obtained by HONDA et al. [Biopolymers 31,869 (1991)] using circular dichroism. The fast hydrogen/deuterium exchange in peptide groups and the absence of any NMR sign indicative of ordered structure [G. M. CLORE et al., J. Molec. Biol. 191, 553 (1986)] support that the solution conformations of the non-aggregated peptide interconvert in dynamicequilibrium. Some physiologicaladvantages that may derive from this conformational flexibility are also discussed INTRODUCTION A HOST of biologically important peptides composed of 10-50 amino acids play very specific roles as hormones, cofactors, signals for membrane translocation and the like. Among them, human growth hormone-releasing factor (hGHRF) has recently been shown to stimulate feeding when given centrally [1]. hGHRF is a polypeptide consisting of 44 amino acid residues, the active core of which seems to reside in the N-terminal region. Particularly, the fragment between Tyr ~ and Arg zg, hGHRF (1-29), possesses almost full activity of hGHRF in vivo and in vitro [2]. Early calculations [3] suggested that linear peptides would adopt random structures in water solution. Conformational energy calculations [3] indicated that, given the expected conformational heterogeneity of a linear polypeptide chain, the majority of the chain would adopt extended structures in solution, with q~ and v 2 dihedral angles in the fl-region of the Ramachandran plot. However, the S-peptide, the N-terminal 20 residues of ribonuclease exhibits a circular dichroism spectrum indicative of a small population of helix in the monomeric peptide under some conditions [4]. Thus, the discovery that peptide fragments of proteins in aqueous solution do, in many cases, exhibit confor- mational preferences for recognizable structures is of great significance to get insights into the earliest events of protein folding [5]. Despite the considerable physiological interest in this peptide, no structural study using vibrational spectroscopy has been so far carried out. Fourier transform infrared spectroscopy (FFIR) and Raman spectroscopy have become recognized as valuable tools for the examination of polypeptide and protein conformations in aqueous solutions and in the solid state. The reliability and wide applicability of both techniques have resulted in a greatly expanded use of them in studies of secondary structures. Here we present a Raman and FTIR spectroscopic study of the structure of the hGHRF fragment between Tyr ~ and Arg z9 in aqueous solution and in the solid state. Aqueous solution spectra were measured H20 and D20 and analysed by resolution-enhancement techniques and established spectrum-structure correlations. The structural information obtained by analysing the vibrational spectra is reported and discussed in comparison with data obtained by other spectroscopic techniques. t Author to whom correspondence should be addressed. 929
Transcript of Structural study of human growth hormone-releasing factor fragment (1–29) by vibrational...
Pergamon Spectrochimica Acta, Vol. 51A, No. 5, pp. 929-938, 1995
Copyright (~ 1995 Elsevier Science Ltd Printed in Great Britain. All rights reserved
0584-8539(94)01315-6 0584-8539/95 $9.50 + 0.00
Structural study of human growth hormone-releasing factor fragment (1-29) by vibrational spectroscopy
P. CARMONA,t M. MOLINA and A. LASAGABASTER Instituto de Optica (CSIC), Serrano 121, 28006 Madrid, Spain
(Received 5 October 1994; in final form 31 October 1994; accepted 2 November 1994)
Abstract--The conformational structure of fragment 1-29 of human growth hormone releasing factor, hGHRF (1-29), in aqueous solution and in the solid state is investigated by infrared and Raman spectroscopy. The polypeptide backbone is found to be unordered in the solid state. However, the spectra of the peptide prepared as 5% (w/w) aqueous solutions show that approximately 28% of the peptide is involved in intermolecular fl- sheet aggregation. The remainder of the peptide exists largely as disordered and fl-sheet conformations with a small portion of a-helices. Tyrosine residues are found to be exposed to the solvent. The secondary structures are quantitatively examined through infrared spectroscopy, the conformational percentages being near those obtained by HONDA et al. [Biopolymers 31,869 (1991)] using circular dichroism. The fast hydrogen/deuterium exchange in peptide groups and the absence of any NMR sign indicative of ordered structure [G. M. CLORE et al., J. Molec. Biol. 191, 553 (1986)] support that the solution conformations of the non-aggregated peptide interconvert in dynamic equilibrium. Some physiological advantages that may derive from this conformational flexibility are also discussed
INTRODUCTION
A HOST of biologically important peptides composed of 10-50 amino acids play very specific roles as hormones, cofactors, signals for membrane translocation and the like. Among them, human growth hormone-releasing factor (hGHRF) has recently been shown to stimulate feeding when given centrally [1]. h G H R F is a polypeptide consisting of 44 amino acid residues, the active core of which seems to reside in the N-terminal region. Particularly, the fragment between Tyr ~ and Arg zg, h G H R F (1-29), possesses almost full activity of h G H R F in v i v o and in vi tro [2].
Early calculations [3] suggested that linear peptides would adopt random structures in water solution. Conformational energy calculations [3] indicated that, given the expected conformational heterogeneity of a linear polypeptide chain, the majority of the chain would adopt extended structures in solution, with q~ and v 2 dihedral angles in the fl-region of the Ramachandran plot. However, the S-peptide, the N-terminal 20 residues of ribonuclease exhibits a circular dichroism spectrum indicative of a small population of helix in the monomeric peptide under some conditions [4]. Thus, the discovery that peptide fragments of proteins in aqueous solution do, in many cases, exhibit confor- mational preferences for recognizable structures is of great significance to get insights into the earliest events of protein folding [5].
Despite the considerable physiological interest in this peptide, no structural study using vibrational spectroscopy has been so far carried out. Fourier transform infrared spectroscopy (FFIR) and Raman spectroscopy have become recognized as valuable tools for the examination of polypeptide and protein conformations in aqueous solutions and in the solid state. The reliability and wide applicability of both techniques have resulted in a greatly expanded use of them in studies of secondary structures. Here we present a Raman and FTIR spectroscopic study of the structure of the h G H R F fragment between Tyr ~ and Arg z9 in aqueous solution and in the solid state. Aqueous solution spectra were measured H20 and D20 and analysed by resolution-enhancement techniques and established spectrum-structure correlations. The structural information obtained by analysing the vibrational spectra is reported and discussed in comparison with data obtained by other spectroscopic techniques.
t Author to whom correspondence should be addressed.
929
930 P. CARMONA et al.
EXPERIMENTAL
Materials
The fragment of hGHRF corresponding to amino acid positions 1-29, hGHRF (1-29), was obtained from Bachem (U.K.) Ltd with peptide purity greater than 97%. For infrared and Raman spectroscopy the peptide was prepared as 5% (w/w) aqueous solution in 10 mM sodium cacodylate buffer at pH (pD) 7.0.
Infrared spectroscopy
Infrared spectra were recorded by using a Perkin-Elmer 1725X FTIR spectrometer equipped with a TGS detector. Peptide and buffer solutions were placed in IR cells with CaF2 windows and Teflon spacers with a pathlength of 8 ~tm. For all samples 64 interferograms were collected and Fourier transformed to generate spectra with a resolution of 2 cm -~. For proper compensation of H20 and D20 absorption, the buffer solutions were placed in the same kind of cells and were measured using identical scanning parameters. The peptide spectra were obtained by subtracting the buffer spectra from those of the peptide solutions according to the procedure described by Dor~G et al. [6]. The spectrometer and sample chamber were purged with dry nitrogen. Spectra contributions from uncompensated water vapour bands were eliminated using a set of water vapour spectra measured under identical conditions at different time intervals after opening the sample chamber. The subtraction factor was varied until the second derivatives of the peptide spectra between 1800 and 1700 cm t were featureless. In this way artificial bands and/or incorrect band positions in the amide I and amide II regions of the peptide spectra were avoided.
Second derivative spectra were generated from the difference spectra by using the Perkin-Elmer DERIV routine. This utilizes the SAWTZKv--GOLAV derivative routine [7]. A 13-data-point (13 cm -l) window was selected.
Only the original amide I band contours have been subjected here to curve-fitting, as in the case of using resolution-enhanced band contours the final result will depend on the particular choice of parameters used to generate the resolution-enhanced spectra [8]. On the other hand, molecular dynamics studies have shown that a homogeneous component of line broadening (Lorentzian shape) can be assumed for vibrational relaxation, and accordingly spectra can be fitted with Lorentzian band profiles. In addition, we found that the difference spectra of hGHRF (1-29) can be fitted reasonably well by using an iterative non-linear regression program [9] and assuming that the amide I band components have the above-mentioned line shape. Initial band positions were taken directly from the second derivative spectra and no additional bands were added unless clearly resolved in the second-derivative spectra. Initial values for the peak heights and widths were estimated from the spectra. A non-sloping baseline was estimated from the spectra and was held constant. For the final fits, the heights, widths and positions of all bands were varied simultaneously. The relative integrated intensity of each band (i.e. the band area as a fraction of the total amide I area) was then calculated from the final fitted band heights and widths.
The IR cells used to record the solid state spectra at different relative humidities are of the same kind as those described previously [10, 11]. Film specimens of hGHRF(1-29) in the solid state were cast from aqueous solution. After being dried under vacuum for 2-3 h, the specimens were equilibrated over saturated salt solutions at the desired humidities. A 25 mm cylindrical cell was prepared to include a small reservoir, which contained the saturated salt solution. The peptide films were cast on one of the removable F2Ca windows and equilibrated for at least 2 h. After the spectra were recorded, the sample window was replaced by a F2Ca blank, and the spectra of the moist air were also recorded. These spectra were then subtracted from those of the specimens. These IR cells were also used for H/D exchange measurements in solid state films of the peptide. With this aim the procedure followed was similar to that of hydration at different relative humidities, but using pure D20 in the IR cell reservoir.
R a m a n spectroscopy
Raman spectra were obtained with a double grating spectrometer (Jobin-Yvon U-1000) excited by an Ar ion laser oscillating at 514.5 nm. The laser beam was passed through a narrow-band interference filter to remove the unwanted plasma lines and focused at the sample with 100- 250mW of radiant power. Spectral data were collected with photon-counting electronics, at intervals of 1.0 cm -1, generally with an integration time of 1.5 s and spectral slit width of 4 cm -~.
Structural study of hGHRF(1-29) 931
Each spectrum shown was derived from 3 to 10 scans, recorded consecutively and averaged using the software routines of Jobin-Yvon. Aqueous solutions and solid samples of the peptide were sealed in glass capillary tubes for Raman analysis. All Raman spectra were collected at the ambient temperature of the laser-illuminated capillary tube, i.e. 32°C. The spectrometer wave number drive was calibrated to within +0.5cm -~ with CCi4 as a primary standard and indene as a secondary standard. The reported Raman frequencies from signal-averaged spectra are believed accurate to + 1.0 cm- ~.
Circular dichroism
Spectra were acquired on a Jasco J-720 spectropolarimeter equipped with a micro-computer. Peptide solutions (10 -5 M) were placed on a 0.1 cm path length cylindrical quartz ceil.
RESULTS AND DISCUSSION
Assignment of component amide bands to secondary structures
Infrared and Raman spectroscopy have been shown to be powerful tools for studying the secondary structure of proteins and polypeptides [8, 11-14]. The correspondence between characteristic bands of proteins and the conformation of the polypeptide backbone is best understood for the amide I, II and III modes which involve vC=O, 6 C - H and vC-N vibrations. The frequencies of these vibrational modes depend on the nature of hydrogen bonding involving the C = O and N - H moieties, and therefore in turn the frequencies of these modes reflect the particular secondary structure adopted by the polypeptide chains.
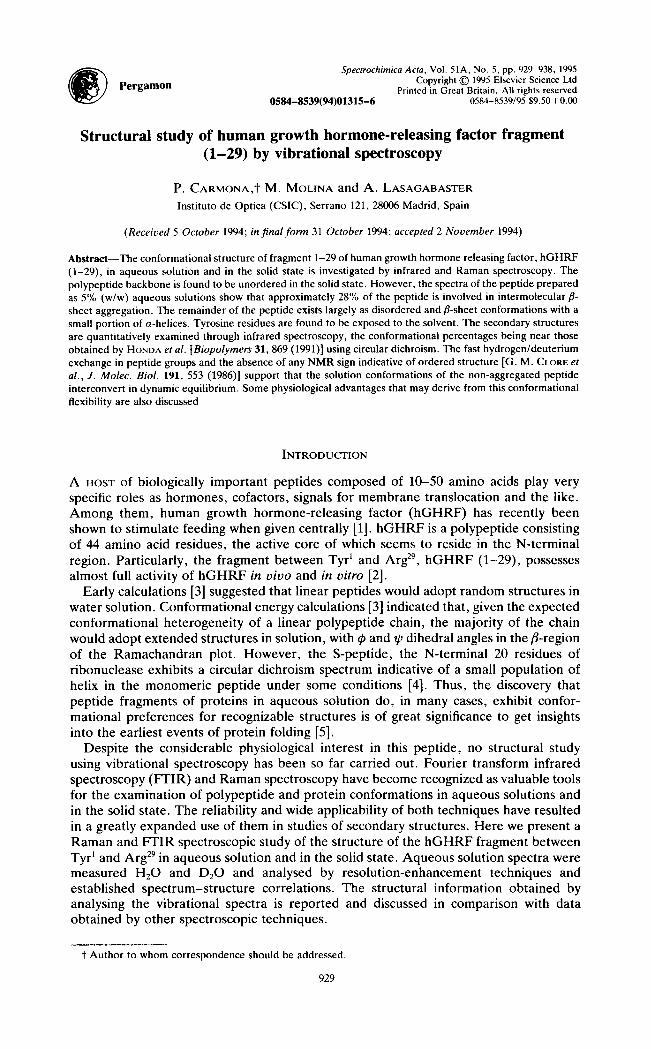
The infrared spectrum of an aqueous solution of hGHRF(1-29) is shown in Fig. 1 The spectrum of the conformation-sensitive amide I region between 1700 and 1600cm -1 exhibits three well defined absorption maxima at 1660, 1632 and 1615cm -t and a shoulder at 1652cm -1 which indicate that the amide I mode consists of various overlapping components. These component bands can be better visualized with the second-derivative spectrum which reveals in addition to the major bands described above another band at 1683 cm-1. Theoretical calculations for antiparallel fl-sheets predict an infrared-active component in the 1690-1675 cm -~ region, whereby the 1683 cm -1 band can be assigned to this polypeptide backbone structure [15]. This is the high frequency "in-phase" vibration predicted in model fl-sheet compounds. The bands at 1632 and 1615 cm -1 can be assigned to the "out-of-phase" low frequency components of two different fl-sheet structures, based on infrared spectroscopic data of other polypeptides and proteins [16, 17].
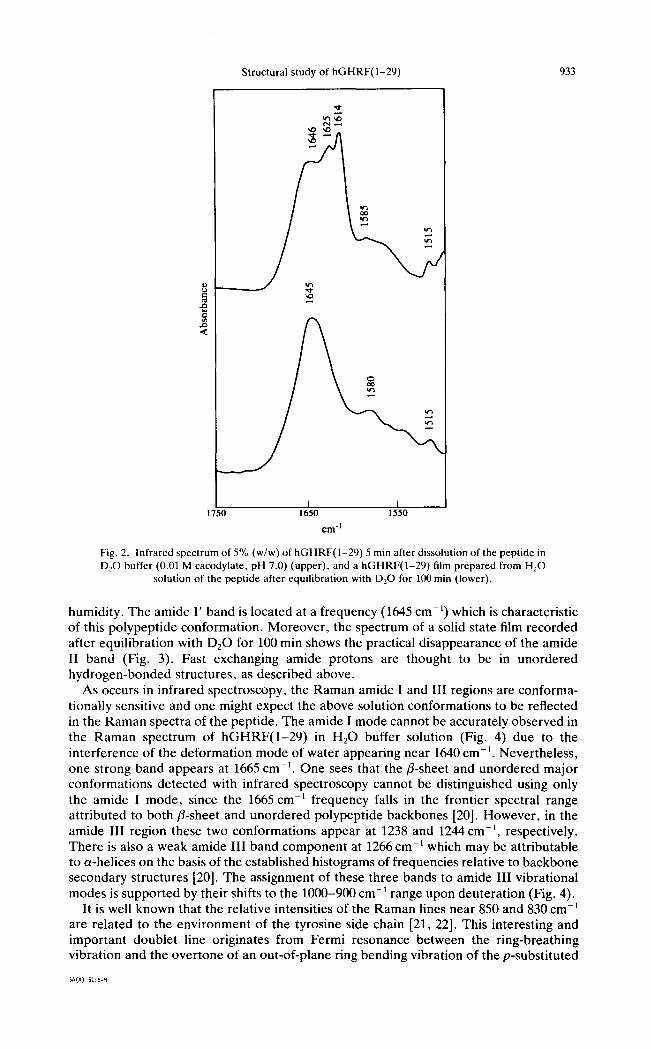
The comparative analysis of infrared spectral features of the peptide in H20 and DzO solutions allows a more detailed band assignment. Firstly, the bands assigned to helices and/3-sheet structures typically show only a small shift towards lower frequencies upon deuterat ion [18, 19], while bands arising from unordered structures may shift as much as 15 cm-l . Secondly, bands attributable to unordered structures should shift soon after dissolution in D20 due to the fast H / D exchange kinetics of these conformations, while the peak position of bands arising from a-helices and fl-sheets is expected to be stable for a much longer period of time. The 1660 cm-1 absorption maximum of hGHRF(1 -29 ) in H20 solution is shifted to 1646 cm-~ upon dissolution in D20 (Fig. 2). Thus, we assign the 1660cm -1 band of hGHRF(1 -29 ) in H20 buffer to unordered structures which typically exhibit large frequency shifts upon deuteration. Moreover, changes in this spectral domain were observed within 1 min after dissolution of the peptide in heavy water buffer. On the other hand, the 1652 cm -~ shoulder shifts to 1650 cm -1 in going from H20 to D20 solution, and is overlapped with the broad band centred around 1646cm -1 in the D20 buffer spectrum (Fig. 2). This shoulder can be attributed to a-helices, which exhibit a small amide I band shift upon deuteration [12, 18].
As described above, two absorption maxima are observed at 1632 and 1615 cm -1 for the amide I band in the 1640-1610 cm -1 region (Fig. 1) which may reflect differences in hydrogen bonding strength between fl-strands. However , the detailed correspondence
932 P. CARMONA et al.
t",l
I 1750 1650
I I 1550 1450 em-I
1350
Fig. 1. Infrared spectra of 5% (w/w) solution of hGHRF(1-29) in H20 buffer (0.0l M cacodylate, pH 7.0). Upper: difference spectrum; lower: second derivative spectrum.
between the various fl-bands and specific types of fl-structure (e.g. parallel, antiparallel, twisted) has not been established unequivocally so far. One approach to carry out the assignment of these bands also involves comparison of infrared spectra measured in H:O buffer (Fig. 1) with those measured in D20 buffer (Fig. 2). In fact, the 1632 cm -t amide I band component shifts fast to 1625 cm -] upon deuteration, while the 1615 cm -1 band remains practically at the same frequency. The residual infrared absorption in the amide II region of the peptide in heavy water solution is, then, attributable to the band near 1615 c m - t . This band is diagnostic for inter and/or intra peptide chain aggregation leading to fl-antiparallel pleated sheet structures. The 1615 cm- 1 position and band-width suggest fl-sheet structures with very strong hydrogen bonding interactions leading to irreversible aggregation of the peptide. The formation of peptide aggregates is also indicated by some turbidity of the peptide solutions. On the other hand, the fact that deuteration of hGHRF(1-29) results in a 7 cm -~ low-frequency shift of the 1632 cm -~ band reflects a pattern of hydrogen bonding or structure which is different from those of intermolecular fl-sheets absorbing near 1615cm -~. Bands around 1630cm-: in the infrared spectra of polypeptides and proteins have been proposed to represent short extended chains [12, 17] with ~ and ~0 backbone torsion angles in the fl-region of the Ramachandran plot. The assignment of the 1632 cm- ~ band to this polypeptide backbone structure is consistent with the behaviour of this band on deuteration. In fact, these extended peptide chains involve N-H "free" bonds whose protons are easily accessible to D20 solvent and are, hence, easily exchangeable with deuterium.
Deuterated hGHRF(1-29) in the solid state (Fig. 2) shows other spectral features indicating that the peptide has an unordered structure, which remains at any relative
Structural study of hGHRF(1-29) 933
<
I I 1750 1650 1550
cm-I
Fig. 2. Infrared spectrum of 5% (w/w) of hGHRF(1-29) 5 min after dissolution of the peptide in D20 buffer (0.01 M cacodylate, pH 7.0) (upper), and a hGHRF(1-29) film prepared from H20
solution of the peptide after equilibration with D20 for 100 min (lower).
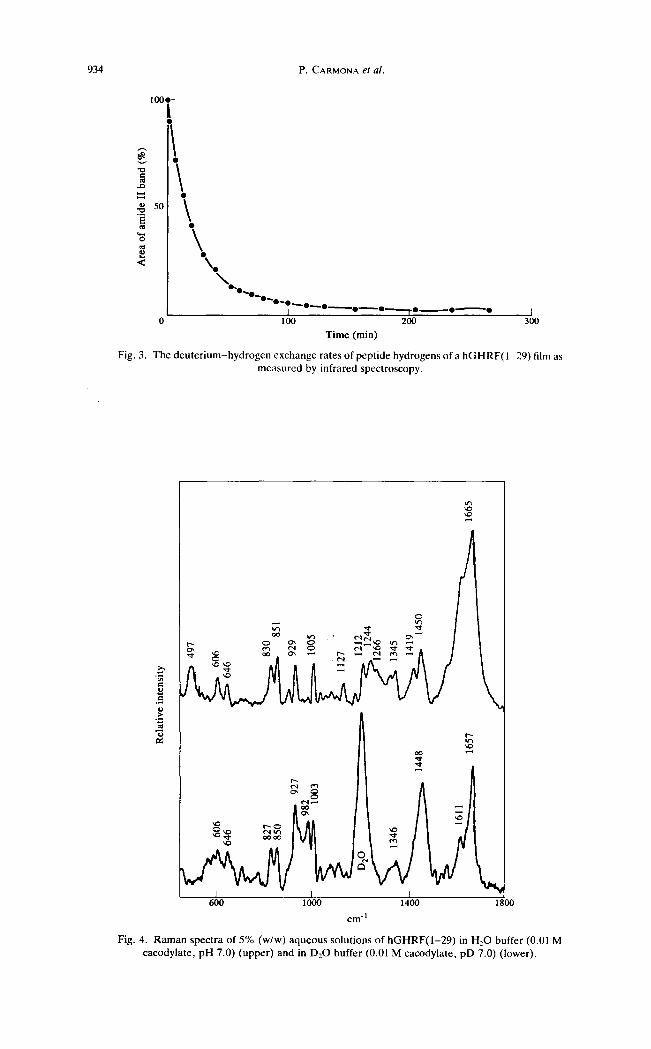
humidity. The amide I' band is located at a frequency (1645 cm-~) which is characteristic of this polypeptide conformation. Moreover , the spectrum of a solid state film recorded after equilibration with D20 for 100 min shows the practical disappearance of the amide II band (Fig. 3). Fast exchanging amide protons are thought to be in unordered hydrogen-bonded structures, as described above.
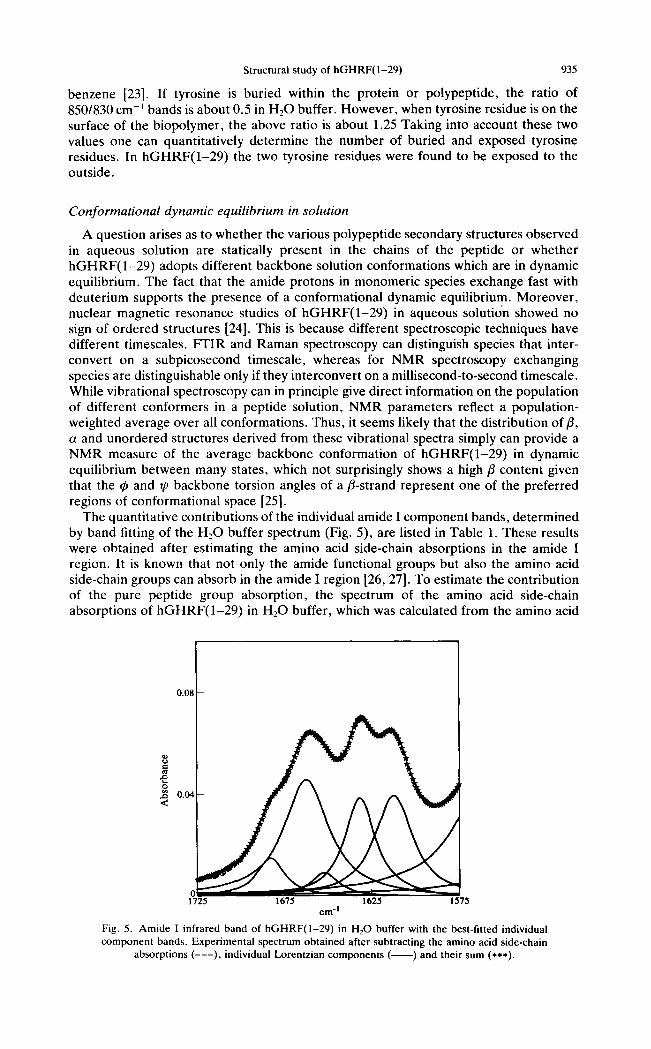
As occurs in infrared spectroscopy, the Raman amide I and III regions are conforma- tionally sensitive and one might expect the above solution conformations to be reflected in the Raman spectra of the peptide. The amide I mode cannot be accurately observed in the Raman spectrum of hGHRF(1-29) in H20 buffer solution (Fig. 4) due to the interference of the deformation mode of water appearing near 1640 cm- 1. Nevertheless, one strong band appears at 1665 cm -~. One sees that the fl-sheet and unordered major conformations detected with infrared spectroscopy cannot be distinguished using only the amide I mode, since the 1665 cm -l frequency falls in the frontier spectral range attributed to both fl-sheet and unordered polypeptide backbones [20]. However, in the amide III region these two conformations appear at 1238 and 1244 cm-l , respectively. There is also a weak amide I I I band component at 1266 cm-t which may be attributable to a-helices on the basis of the established histograms of frequencies relative to backbone secondary structures [20]. The assignment of these three bands to amide III vibrational modes is supported by their shifts to the 1000-900 cm- 1 range upon deuteration (Fig. 4).
It is well known that the relative intensities of the Raman lines near 850 and 830 cm- 1
are related to the environment of the tyrosine side chain [21, 22]. This interesting and important doublet line originates from Fermi resonance between the ring-breathing vibration and the overtone of an out-of-plane ring bending vibration of the p-substituted
SA(A) 51:5-M
934 P. CARMONA et al.
1 0 0 0 -
1
<
\ \ .
I o ~ o - . . - . . . . ~ e I 0 100 200 300
Time (rain)
- o ~ o
Fig. 3. The deuter ium-hydrogen exchange rates of peptide hydrogens of a hGHRF(1-29) film as measured by infrared spectroscopy.
o .=,
A
~o r.... ~
~o
600 1000 1400 1800
cm-1
Fig. 4. Raman spectra of 5% (w/w) aqueous solutions of hGHRF(1-29) in H20 buffer (0.01 M cacodylate, pH 7.0) (upper) and in D~O buffer (0.01 M cacodylate, pD 7.0) (lower).
Structural study of hGHRF(1-29) 935
benzene [23]. If tyrosine is buried within the protein or polypeptide, the ratio of 850/830 cm -1 bands is about 0.5 in H20 buffer. However, when tyrosine residue is on the surface of the biopolymer, the above ratio is about 1.25 Taking into account these two values one can quantitatively determine the number of buried and exposed tyrosine residues. In hGHRF(1-29) the two tyrosine residues were found to be exposed to the outside.
Conformational dynamic equilibrium in solution
A question arises as to whether the various polypeptide secondary structures observed in aqueous solution are statically present in the chains of the peptide or whether hGHRF(1-29) adopts different backbone solution conformations which are in dynamic equilibrium. The fact that the amide protons in monomeric species exchange fast with deuterium supports the presence of a conformational dynamic equilibriu m. Moreover, nuclear magnetic resonance studies of hGHRF(1-29) in aqueous solution showed no sign of ordered structures [24]. This is because different spectroscopic techniques have different timescales. FTIR and Raman spectroscopy can distinguish species that inter- convert on a subpicosecond timescale, whereas for NMR spectroscopy exchanging species are distinguishable only if they interconvert on a millisecond-to-second timescale. While vibrational spectroscopy can in principle give direct information on the population of different conformers in a peptide solution, NMR parameters reflect a population- weighted average over all conformations. Thus, it seems likely that the distribution of fl, a and unordered structures derived from these vibrational spectra simply can provide a NMR measure of the average backbone conformation of hGHRF(1-29) in dynamic equilibrium between many states, which not surprisingly shows a high 13 content given that the ~0 and ~0 backbone torsion angles of a fl-strand represent one of the preferred regions of conformational space [25].
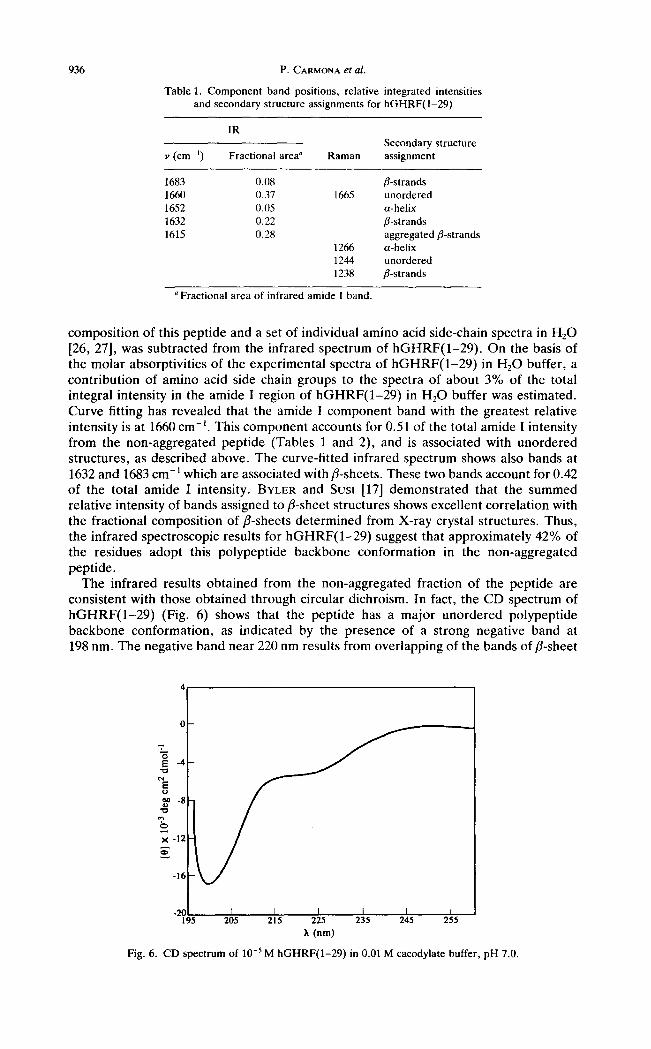
The quantitative contributions of the individual amide I component bands, determined by band fitting of the H20 buffer spectrum (Fig. 5), are listed in Table 1. These results were obtained after estimating the amino acid side-chain absorptions in the amide I region. It is known that not only the amide functional groups but also the amino acid side-chain groups can absorb in the amide I region [26, 27]. To estimate the contribution of the pure peptide group absorption, the spectrum of the amino acid side-chain absorptions of hGHRF(1-29) in H 2 0 buffer, which was calculated from the amino acid
0"081
1725 1675 1625 1575 c m °|
Fig. 5. Amide I infrared band of hGHRF(1-29) in H20 buffer with the best-fitted individual component bands. Experimental spectrum obtained after subtracting the amino acid side-chain
absorptions (---) , individual Lorentzian components ( ) and their sum (***).
936 P. CARMONA et al.
Table 1. Component band positions, relative and secondary structure assignments for
integrated intensities hGHRF(1-29)
I R Secondary structure
v (cm-i) Fractional area ~ Raman assignment
1683 0.08 fl-strands 1660 0.37 1665 unordered 1652 0.05 a-helix 1632 0.22 fl-strands 1615 0.28 aggregated fl-strands
1266 a-helix 1244 unordered 1238 fl-strands
a Fractional area of infrared amide I band.
composit ion of this peptide and a set of individual amino acid side-chain spectra in H20 [26, 27], was subtracted from the infrared spectrum of h G H R F ( 1 - 2 9 ) . On the basis of the molar absorptivities of the experimental spectra of h G H R F ( 1 - 2 9 ) in H20 buffer, a contribution of amino acid side chain groups to the spectra of about 3% of the total integral intensity in the amide I region of h G H R F ( 1 - 2 9 ) in H20 buffer was estimated. Curve fitting has revealed that the amide I component band with the greatest relative intensity is at 1660 cm -~. This component accounts for 0.51 of the total amide I intensity from the non-aggregated peptide (Tables 1 and 2), and is associated with unordered structures, as described above. The curve-fitted infrared spectrum shows also bands at 1632 and 1683 cm-~ which are associated with fl-sheets. These two bands account for 0.42 of the total amide I intensity. BYLER and Sust [17] demonstrated that the summed relative intensity of bands assigned to fl-sheet structures shows excellent correlation with the fractional composit ion of fl-sheets determined from X-ray crystal structures. Thus, the infrared spectroscopic results for h G H R F ( 1 - 2 9 ) suggest that approximately 42% of the residues adopt this polypeptide backbone conformation in the non-aggregated peptide.
The infrared results obtained f rom the non-aggregated fraction of the peptide are consistent with those obtained through circular dichroism. In fact, the CD spectrum of h G H R F ( 1 - 2 9 ) (Fig. 6) shows that the peptide has a major unordered polypeptide backbone conformation, as indicated by the presence of a strong negative band at 198 nm. The negative band near 220 nm results from overlapping of the bands of fl-sheet
"7
E -4
o ~ - S
x -12
-16
-2O I I I I I I 195 205 215 225 235 245 255
k (rim)
10- M hGHRF(1-29) in 0.01 M cacodylate buffer, pH 7.0. Fig. 6. CD spectrum of 5

Structural study of hGHRF(1-29)
Table 2. Fractional composition of secondary structure for the non-aggregated hGHRF(1-29) as estimated by
infrared spectroscopy
Secondary structure IR amide I band CD °
fl-strand 0.42 b 0.38 unordered 0.51 0.55 a-helix 0.07 0.07
CD results from Re. [28]. h Summed fractional areas of the 1683 and 1632 cm
bands.
937
conformation (=217 nm) and a-helices (~222 and 207 nm). A previous analysis of the CD spectra for secondary structure content using the CONTIN program [28] showed conformational percentages which are near those obtained here through infared spec- troscopy (Table 2).
CONCLUSIONS
The vibrational spectra of hGHRF(1-29) prove for the first time that the backbone of this peptide is unordered in the solid state. However, intermolecular fl-sheet aggregation was observed in the aqueous solutions used here. Curve fitting of the infrared spectra revealed that approximately 28% of the peptide is aggregated in 5% (w/w) aqueous solutions. The non-aggregated peptide does not exist in unique and ordered conforma- tion in aqueous solution, its spectra being those of a peptide with a significant amount of /3-structure (~42%) and a small helical content (~5%) . The various solution confor- mations interconvert in dynamic equilibrium, as supported by the fast hydrogen/ deuterium exchange of peptide groups. This can explain the results of a previous NMR study of this peptide [24], in the sense that ordered secondary structures were not detected due to the NMR timescale. Thus, our spectroscopic data indicate that the non- aggregated hGHRF(1 -29 ) exists as an ensemble of conformers in aqueous solution. Accordingly, and given that this peptide can undergo conformational changes on modification of the environment [24], this conformational flexibility may have several advantages. First, it may accelerate the h G H R F receptor recognition process by allowing more interactions to be explored; second, conformational changes in the receptor and h G H R F may be required once this peptide is bound in order to activate the biological response. Third, conformational flexibility of h G H R F may be important for its clearance from the circulation. Thus, the roles of conformation of the peptide in these processes may be varied, reflecting different ways of optimizing through evolution its overall usefulness.
Acknowledgements--Our thanks are due to the Direcci6n General de Investigaci6n Cientffica y T6cnica for financial support (PB90-0148).
REFERENCES
[1] F. J. Vaccarino, F. E. Bloom, J. Rivier, W. Vale and G. F. Koob, Nature (London) 314, 167 (1985). [2] V. A. Lance, W. A. Murphy, J. Sueira-Diaz and D. H. Coy, Biochem. Biophys. Res. Commun. 119,265
(1984). [3] D. A. Brant, W. G. Miller and P. J. Plory (1967) J. Molee. Biol. 23, 47 (1967). [4] J. E. Brown and W. A. Klee, Biochemistry 10, 470 (1971). [5] P. E. Wright, H. J. Dyson and R. A. Lerner, Biochemistry 27, 7167 (1988). [6] A. Dong, D. Huang and W. S. Caughey, Biochemistry 29, 3303 (1990). [7] A. Savitzky and M. J. E. Golay, Analyt. Chem. 36, 1627 (1964). [8] W. K. Surewicz and H. H. Mantsch, Biochim. Biophys. Acta 952, 115 (1988). [9] M. A. Raso, P. Tortajada, D. Escolar and F. Acci6n, Comput. Chem. 11, 125 (1987).
938 P. CARMONA et al.
[10] J. V. Garcia-Ramos and P. Carmona, Can. J. Chem. 59, 222 (1981). [11] P. Carmona, A. Lasagabaster and M. Molina, Biochim. Biophys. Acta, 1246, 128 (1995). [12] W. K. Surewicz, H. H. Mantsch and D. Chapman (1993) Biochemistry 32,389 (1993). [13] H. Vogel, Q. Rev. Biophys. 25, 433 (1992). [14] Y. Wang, R. PurreUo, T. Jordan and T. G. Spiro, J. Am. Chem. Soc. !13, 6359 (1991). [15] S. Krimm and J. Bandekar, Adv. Protein Chem. 38, 181 (1986). [16] A. Muga, W. K. Surewicz, P. T. T. Wong and H. H. Mantsch, Biochemistry 29, 2925 (1990). [17] D. M. Byler and H. Susi, Biopolymers 25, 469 (1986). [18] J. M. Olinger, D. H. Hill, R. J. Jakobson and R. S. Brody, Biochim. Biophys. Acta 869, 89 (1986). [19] P. W. Holloway and H. H. Mantsch, Biochemistry 28, 931 (1989). [20] A. T. Tu, Raman Spectroscopy in Biology: Principles and Applications. Wiley, New York (1982). [21] H. E. Van Wart and H. A. Scheraga, Proc. Natn. Acad. Sci. U.S.A. 74, 13 (1977). [22] N. T. Yu, B. H. Jo and D. C. O'Shea, Arch. Biochem. Biophys. 156, 71 (1973). [23] M. N. Siamwiza, R. C. Lord, M. C. Chen, T. Takamatsu, I. Harada, H. Matsuura and T. Shimanouchi,
Biochemistry 14, 4870 (1975). [24] G. M. Clore, S. R. Martin and A. M. Gronenborn, J. Molec. Biol. 191,553 (1986). [25] G. N. Ramachandran and V. Sasisekharan, Adv. Protein Chem. 23, 283 (1968). [26] S. Yu Venyaminov and N. N. Kalnin, Biopolymers 30, 1243 (1990). [27] S. Yu Venyaminov and N. N. Kalnin, Biopolymers 30, 1259 (1990). [28] S. Honda, S. Ohashi, H. Morii and H. Uedaira, Biopolymers 31,869 (1991).