Should Welding Be Used to Repair Structural Steel - CiteSeerX
Upload
khangminh22Category
view
5download
0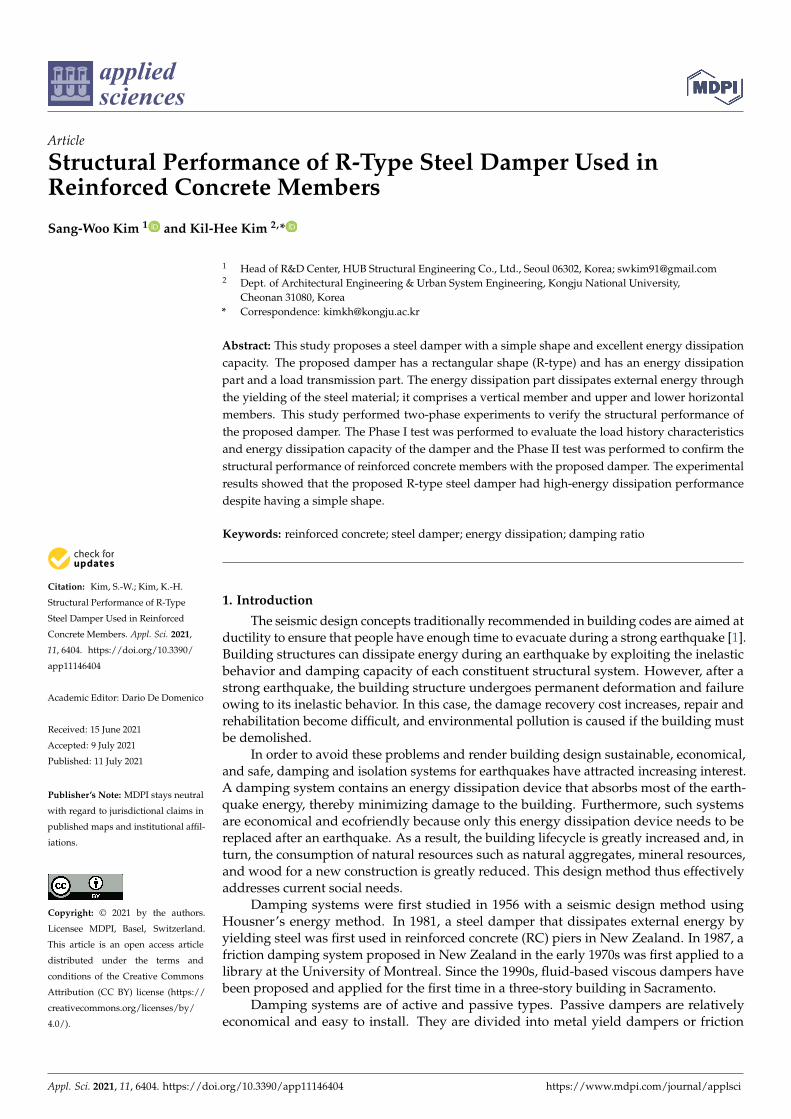
applied sciences
Article
Structural Performance of R-Type Steel Damper Used inReinforced Concrete Members
Sang-Woo Kim 1 and Kil-Hee Kim 2,*
�����������������
Citation: Kim, S.-W.; Kim, K.-H.
Structural Performance of R-Type
Steel Damper Used in Reinforced
Concrete Members. Appl. Sci. 2021,
11, 6404. https://doi.org/10.3390/
app11146404
Academic Editor: Dario De Domenico
Received: 15 June 2021
Accepted: 9 July 2021
Published: 11 July 2021
Publisher’s Note: MDPI stays neutral
with regard to jurisdictional claims in
published maps and institutional affil-
iations.
Copyright: © 2021 by the authors.
Licensee MDPI, Basel, Switzerland.
This article is an open access article
distributed under the terms and
conditions of the Creative Commons
Attribution (CC BY) license (https://
creativecommons.org/licenses/by/
4.0/).
1 Head of R&D Center, HUB Structural Engineering Co., Ltd., Seoul 06302, Korea; [email protected] Dept. of Architectural Engineering & Urban System Engineering, Kongju National University,
Cheonan 31080, Korea* Correspondence: [email protected]
Abstract: This study proposes a steel damper with a simple shape and excellent energy dissipationcapacity. The proposed damper has a rectangular shape (R-type) and has an energy dissipationpart and a load transmission part. The energy dissipation part dissipates external energy throughthe yielding of the steel material; it comprises a vertical member and upper and lower horizontalmembers. This study performed two-phase experiments to verify the structural performance ofthe proposed damper. The Phase I test was performed to evaluate the load history characteristicsand energy dissipation capacity of the damper and the Phase II test was performed to confirm thestructural performance of reinforced concrete members with the proposed damper. The experimentalresults showed that the proposed R-type steel damper had high-energy dissipation performancedespite having a simple shape.
Keywords: reinforced concrete; steel damper; energy dissipation; damping ratio
1. Introduction
The seismic design concepts traditionally recommended in building codes are aimed atductility to ensure that people have enough time to evacuate during a strong earthquake [1].Building structures can dissipate energy during an earthquake by exploiting the inelasticbehavior and damping capacity of each constituent structural system. However, after astrong earthquake, the building structure undergoes permanent deformation and failureowing to its inelastic behavior. In this case, the damage recovery cost increases, repair andrehabilitation become difficult, and environmental pollution is caused if the building mustbe demolished.
In order to avoid these problems and render building design sustainable, economical,and safe, damping and isolation systems for earthquakes have attracted increasing interest.A damping system contains an energy dissipation device that absorbs most of the earth-quake energy, thereby minimizing damage to the building. Furthermore, such systemsare economical and ecofriendly because only this energy dissipation device needs to bereplaced after an earthquake. As a result, the building lifecycle is greatly increased and, inturn, the consumption of natural resources such as natural aggregates, mineral resources,and wood for a new construction is greatly reduced. This design method thus effectivelyaddresses current social needs.
Damping systems were first studied in 1956 with a seismic design method usingHousner’s energy method. In 1981, a steel damper that dissipates external energy byyielding steel was first used in reinforced concrete (RC) piers in New Zealand. In 1987, afriction damping system proposed in New Zealand in the early 1970s was first applied to alibrary at the University of Montreal. Since the 1990s, fluid-based viscous dampers havebeen proposed and applied for the first time in a three-story building in Sacramento.
Damping systems are of active and passive types. Passive dampers are relativelyeconomical and easy to install. They are divided into metal yield dampers or friction
Appl. Sci. 2021, 11, 6404. https://doi.org/10.3390/app11146404 https://www.mdpi.com/journal/applsci
Appl. Sci. 2021, 11, 6404 2 of 14
dampers for which hysteresis characteristics depend on displacement and viscous dampersor viscoelastic dampers for which hysteresis characteristics depend on speed. In general,dampers that depend on displacement are mainly used for seismic design and thosethat depend on speed are mainly used for wind resistance design. Recently, remarkabledevelopments have been made in passive dampers that use the energy dissipation capacityof steel because they are relatively easy to manufacture and install and have excellentenergy dissipation capability. In particular, with environmental protection becoming a keyissue in the recent years, yield-type steel dampers are being increasingly used because theyare relatively less damaging to existing buildings during earthquakes and are, therefore,advantageous for building repair and rehabilitation.
Various types of steel dampers have been developed thus far. Whittaker et al. [2]and Shih and Sung [3] developed added damping and stiffness (ADAS) dampers andTsai et al. [4] developed triangular ADAS (TADAS) dampers. Lee et al. [5] developed asteel honeycomb damper. Nakashima [6], Foti et al. [7], and Choi and Abebe [8] developeda shear panel damper with low yield strength and evaluated its hysteresis characteristics.Di Sarno and Manfredi [9] performed an experimental study on the full-scale RC framesretrofitted with buckling-restrained braces. Teruna et al. [10,11] theoretically investigatedthe use of a steel damper for improving the seismic performance of RC frames and thenexperimentally determined the geometric shape of steel dampers.
Bagheri et al. [12], Jamkhaneh et al. [13], and Sravya and Manchalwar [14] developedU-shaped steel dampers in different forms. Lee and Kim [15] developed a box-shaped steelslit damper. Shen et al. [16] conducted theoretical and experimental studies on a transversesteel damper (TSD). Abebe et al. [17] performed finite element (FE) analysis to evaluate thehysteresis behavior of a circular hollow steel damper (CHSD) and verified its applicabilitythrough comparisons with experimental results. Naeem and Kim [18] developed a multi-slit damper (MSD) that connects weak and strong slit dampers. Qiu et al. [19] developeda damper using a shape memory alloy and steel and performed its FE analytical andexperimental evaluation.
Yield-type steel dampers are being studied continuously to improve their energydissipation capacity as well as to simplify their form to make their manufacturing processand installation easier. This study proposes a steel damper with a relatively simple shapeand excellent energy dissipation capacity. Experiments and FE analysis are performed onthis damper itself to verify its structural performance. Furthermore, the superiority of thisdamper is experimentally verified through evaluations of the performance of structuralmembers with this damper.
2. Experimental Program
This study involved two experimental phases to develop a steel damper with a simpleshape and excellent energy dissipation capacity that is easy to manufacture as well as toverify its performance. In the Phase I test, the performance of the proposed steel damperwas evaluated and, in the Phase II test, the performance of a structural member with thisdamper was verified.
2.1. Phase I Test Program2.1.1. Design of Phase I Test Specimens
As shown in Figure 1, two types of dampers were designed in this study. In orderto prevent eccentricity, four steel dampers were connected to the front and rear of eachspecimen. Tension tests of the steel used in the damper were performed according to ASTME8 [20]. As a result, the yield and tensile strengths were 245 and 420 MPa, respectively, andthe yield strain was 0.00147, as shown in Table 1.
Appl. Sci. 2021, 11, 6404 3 of 14
Appl. Sci. 2021, 11, x FOR PEER REVIEW 4 of 16
the damper and to dissipate energy. Figure 1 shows the dimensions and shape of this
damper.
(a) (b)
Figure 1. Steel damper used in specimens (unit: mm): (a) SD1; (b) SD2
Table 1. Mechanical properties of materials.
Steels Yield Strength
(MPa)
Tensile Strength
(MPa) Yield Strain
Elastic Modulus
(×105 MPa)
Steel damper 245 420 0.00147 1.67
D10 (stirrup) 461 600 0.00242 1.90
D10 (spiral) 554 607 0.00275 2.01
D19 520 662 0.00260 2.00
D22 518 672 0.00258 2.01
2.1.2. Test Setup and Loading Procedure
Figure 2 shows the test setup of the Phase I test specimen. The damper was bolted to
the T-shaped steel plate for load transmission located on the left and right sides. In turn,
this plate was bolted to each of the two L-shaped load frames. One of the L-shaped load
frames was fastened with a 2000 kN universal testing machine (UTM) on the top and the
other was fastened with the steel frame on the bottom. Rollers were installed in the upper
and lower parts where the L-shaped frame meets to apply a shear force to the specimen
in the vertical direction.
(a) (b)
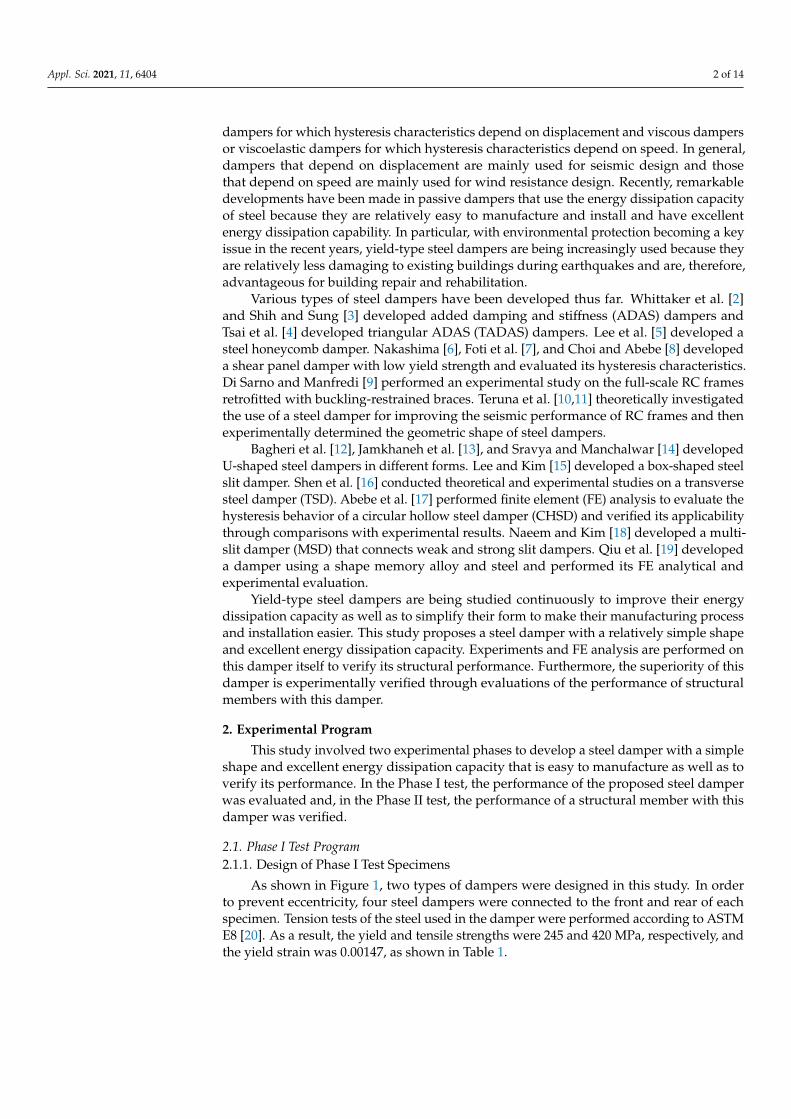
Figure 2. Test setup of Phase I test specimen (unit: mm): (a) overall view; (b) setting of LVDTs.
Four identical dampers were applied for each specimen to prevent eccentricity and
to evaluate the actual applicable load resistance performance. In order to measure the rel-
ative displacement of the specimens, a linear variable differential transformer (LVDT)
with a capacity of 50 mm was installed on both the front and the rear of the specimen, as
Figure 1. Steel damper used in specimens (unit: mm): (a) SD1; (b) SD2.
Table 1. Mechanical properties of materials.
Steels Yield Strength(MPa)
Tensile Strength(MPa) Yield Strain Elastic Modulus
(×105 MPa)
Steel damper 245 420 0.00147 1.67D10 (stirrup) 461 600 0.00242 1.90D10 (spiral) 554 607 0.00275 2.01
D19 520 662 0.00260 2.00D22 518 672 0.00258 2.01
As shown in Figure 1a, Specimen D1 comprises four angled U-shaped dampers. Thisspecimen was designed to compare the structural performance and characteristics of therectangular-type (R-type) steel damper proposed in this study. The steel damper used inthe experiment had an energy dissipation part and a load transmission part. The energydissipation part dissipates external energy through the yielding of the steel. It comprises avertical member and upper and lower horizontal members. The upper horizontal memberallows the vertical member to stably undergo plastic deformation through bending whiledissipating energy through plastic deformation. The lower horizontal member is directlyconnected to the load transfer plate to improve the load resistance capability of the damperand to dissipate energy. Figure 1 shows the dimensions and shape of this damper.
2.1.2. Test Setup and Loading Procedure
Figure 2 shows the test setup of the Phase I test specimen. The damper was bolted tothe T-shaped steel plate for load transmission located on the left and right sides. In turn,this plate was bolted to each of the two L-shaped load frames. One of the L-shaped loadframes was fastened with a 2000 kN universal testing machine (UTM) on the top and theother was fastened with the steel frame on the bottom. Rollers were installed in the upperand lower parts where the L-shaped frame meets to apply a shear force to the specimen inthe vertical direction.
Four identical dampers were applied for each specimen to prevent eccentricity andto evaluate the actual applicable load resistance performance. In order to measure therelative displacement of the specimens, a linear variable differential transformer (LVDT)with a capacity of 50 mm was installed on both the front and the rear of the specimen, asshown in Figure 2. A load was gradually applied to the specimens by the displacementcontrol method five times in both the positive and the negative directions up to the targetdisplacement of 15 mm.
Appl. Sci. 2021, 11, 6404 4 of 14
Appl. Sci. 2021, 11, x FOR PEER REVIEW 4 of 16
the damper and to dissipate energy. Figure 1 shows the dimensions and shape of this
damper.
(a) (b)
Figure 1. Steel damper used in specimens (unit: mm): (a) SD1; (b) SD2
Table 1. Mechanical properties of materials.
Steels Yield Strength
(MPa)
Tensile Strength
(MPa) Yield Strain
Elastic Modulus
(×105 MPa)
Steel damper 245 420 0.00147 1.67
D10 (stirrup) 461 600 0.00242 1.90
D10 (spiral) 554 607 0.00275 2.01
D19 520 662 0.00260 2.00
D22 518 672 0.00258 2.01
2.1.2. Test Setup and Loading Procedure
Figure 2 shows the test setup of the Phase I test specimen. The damper was bolted to
the T-shaped steel plate for load transmission located on the left and right sides. In turn,
this plate was bolted to each of the two L-shaped load frames. One of the L-shaped load
frames was fastened with a 2000 kN universal testing machine (UTM) on the top and the
other was fastened with the steel frame on the bottom. Rollers were installed in the upper
and lower parts where the L-shaped frame meets to apply a shear force to the specimen
in the vertical direction.
(a) (b)
Figure 2. Test setup of Phase I test specimen (unit: mm): (a) overall view; (b) setting of LVDTs.
Four identical dampers were applied for each specimen to prevent eccentricity and
to evaluate the actual applicable load resistance performance. In order to measure the rel-
ative displacement of the specimens, a linear variable differential transformer (LVDT)
with a capacity of 50 mm was installed on both the front and the rear of the specimen, as
Figure 2. Test setup of Phase I test specimen (unit: mm): (a) overall view; (b) setting of LVDTs.
2.2. Phase II Test Program2.2.1. Design of Phase II Specimens
In the Phase II test, the proposed R-type damper was applied to an RC member toevaluate its structural performance. The proposed damper can be applied in variousmanners wherever a passive vibration damper can be applied, for example, a wall type,a coupling beam connecting the shear wall, and a brace type, etc. In this study, an RCcoupling beam was selected as the structural member as it is relatively simple and can beused to verify the performance of the proposed damper. The coupling beam is a structuralmember that exists between the shear walls and is easily damaged by lateral load. Theexperimental results in this study can be applied to many places where shear force due tolateral load is transmitted to the damper as well as the coupling beams.
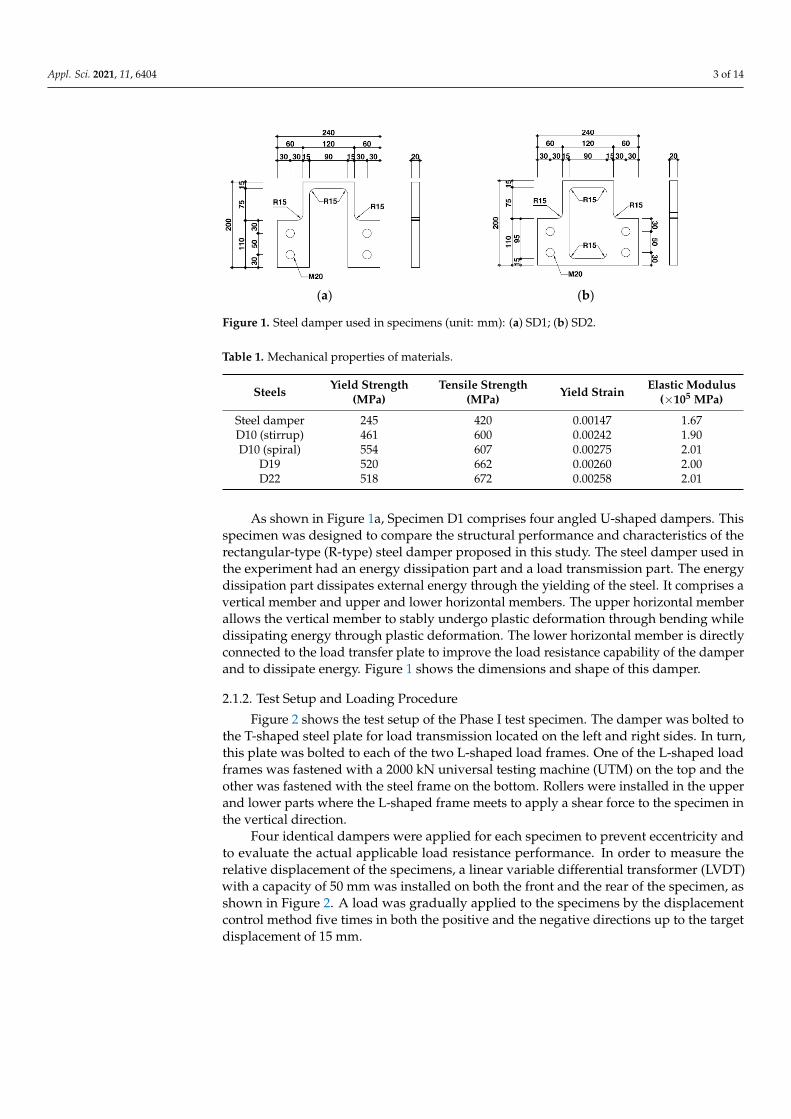
As shown in Figure 3, Specimens M1 and M2 without and with the proposed damper,respectively, were designed for the Phase II test. The specimens had stiff stubs at both endsto realize relatively high rigidity compared to that of the coupling beam because manyreinforcing bars are placed in the shear wall to withstand the lateral and axial forces. Thebeam of the specimen had a width, height, and length of 200 mm, 450 mm, and 1000 mm,respectively. Furthermore, the stub has a cross section of 400 × 850 mm2 and length of1200 mm.
Appl. Sci. 2021, 11, x FOR PEER REVIEW 5 of 16
shown in Figure 2. A load was gradually applied to the specimens by the displacement
control method five times in both the positive and the negative directions up to the target
displacement of 15 mm.
2.2. Phase II Test Program
2.2.1. Design of Phase II Specimens
In the Phase II test, the proposed R-type damper was applied to an RC member to
evaluate its structural performance. The proposed damper can be applied in various man-
ners wherever a passive vibration damper can be applied, for example, a wall type, a cou-
pling beam connecting the shear wall, and a brace type, etc. In this study, an RC coupling
beam was selected as the structural member as it is relatively simple and can be used to
verify the performance of the proposed damper. The coupling beam is a structural mem-
ber that exists between the shear walls and is easily damaged by lateral load. The experi-
mental results in this study can be applied to many places where shear force due to lateral
load is transmitted to the damper as well as the coupling beams.
As shown in Figure 3, Specimens M1 and M2 without and with the proposed damper,
respectively, were designed for the Phase II test. The specimens had stiff stubs at both
ends to realize relatively high rigidity compared to that of the coupling beam because
many reinforcing bars are placed in the shear wall to withstand the lateral and axial forces.
The beam of the specimen had a width, height, and length of 200 mm, 450 mm, and 1000
mm, respectively. Furthermore, the stub has a cross section of 400 × 850 mm2 and length
of 1200 mm.
(a) (b)
Figure 3. Details of Phase II test specimens (unit: mm): (a) M1; (b) M2.
A compression test revealed that the concrete used in the specimens had a strength
of 26.0 MPa and the damper was made of the same steel as that used in the Phase I test.
As shown in Figure 3, in Specimen M1, eight D19 (286.7 mm2 × 8 ea.) rebars were placed
in a section of the test region as the main reinforcement and the effective height of the
beam was 370 mm. The stirrup was designed to dominate the shear by placing D10 (71.3
mm2) rebars at 150 mm intervals.
In Specimen M2 with the proposed R-type steel dampers, the yielding of the damper
is designed to precede the flexural yielding of the specimen. In addition, four D22 (387.1
2700
1000
850
850
D10@150mm
D19
steel plate
steel pipe
(f 50mm)
1200
D25
D13
450 200
400
200
450 D22
D10
A A’
[A-A’]
2700
1000
850
850
steel damper
D22
steel plate
steel pipe
(f 50mm)
1200
D25
D13
450 200
400
D10@150mm
D22
D10
200
450
B B’
[B-B’]
Figure 3. Details of Phase II test specimens (unit: mm): (a) M1; (b) M2.
Appl. Sci. 2021, 11, 6404 5 of 14
A compression test revealed that the concrete used in the specimens had a strength of26.0 MPa and the damper was made of the same steel as that used in the Phase I test. Asshown in Figure 3, in Specimen M1, eight D19 (286.7 mm2 × 8 ea.) rebars were placed in asection of the test region as the main reinforcement and the effective height of the beamwas 370 mm. The stirrup was designed to dominate the shear by placing D10 (71.3 mm2)rebars at 150 mm intervals.
In Specimen M2 with the proposed R-type steel dampers, the yielding of the damperis designed to precede the flexural yielding of the specimen. In addition, four D22(387.1 mm2 × 4 ea.) steel bars were placed in the test region of specimen M2 as the mainreinforcing bars, reflecting the reduced factored-external load by installing dampers. TheT-shaped steel plate to which the damper is fastened and the main reinforcing bar werewelded together. In addition, for simplifying the construction, the stirrup was spirallyreinforced with D10 reinforcing bars at 150 mm intervals.
2.2.2. Test Setup and Loading Procedure
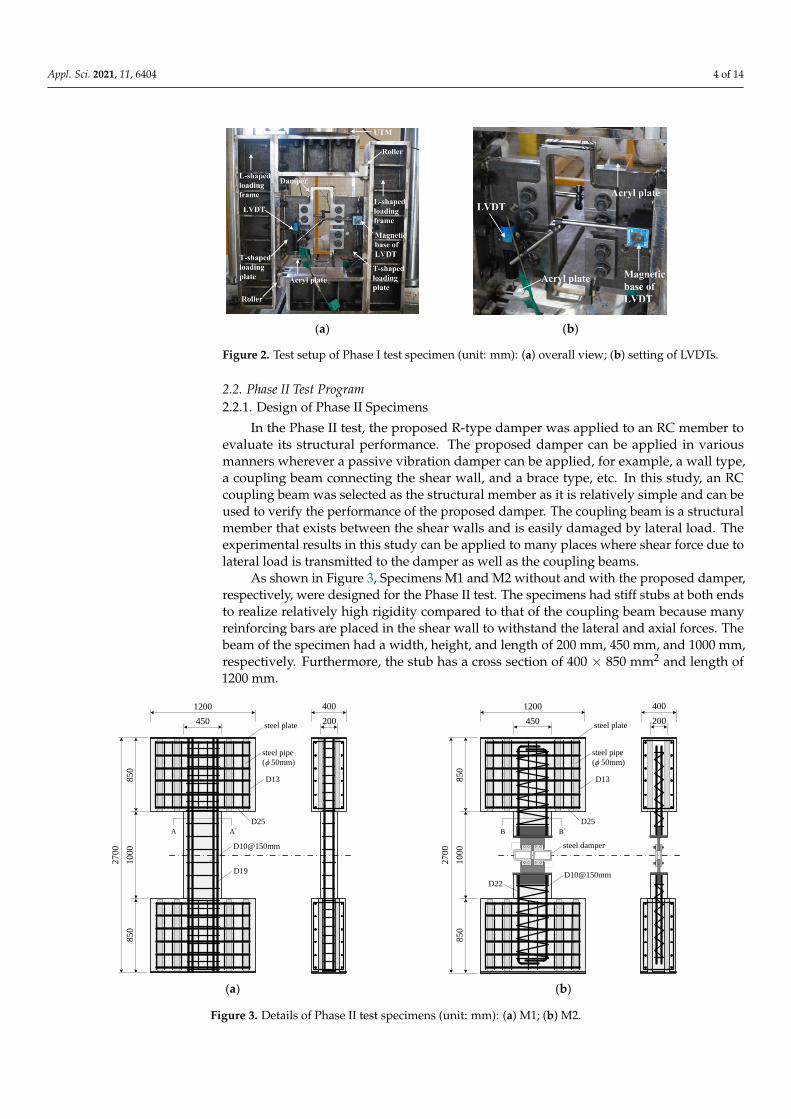
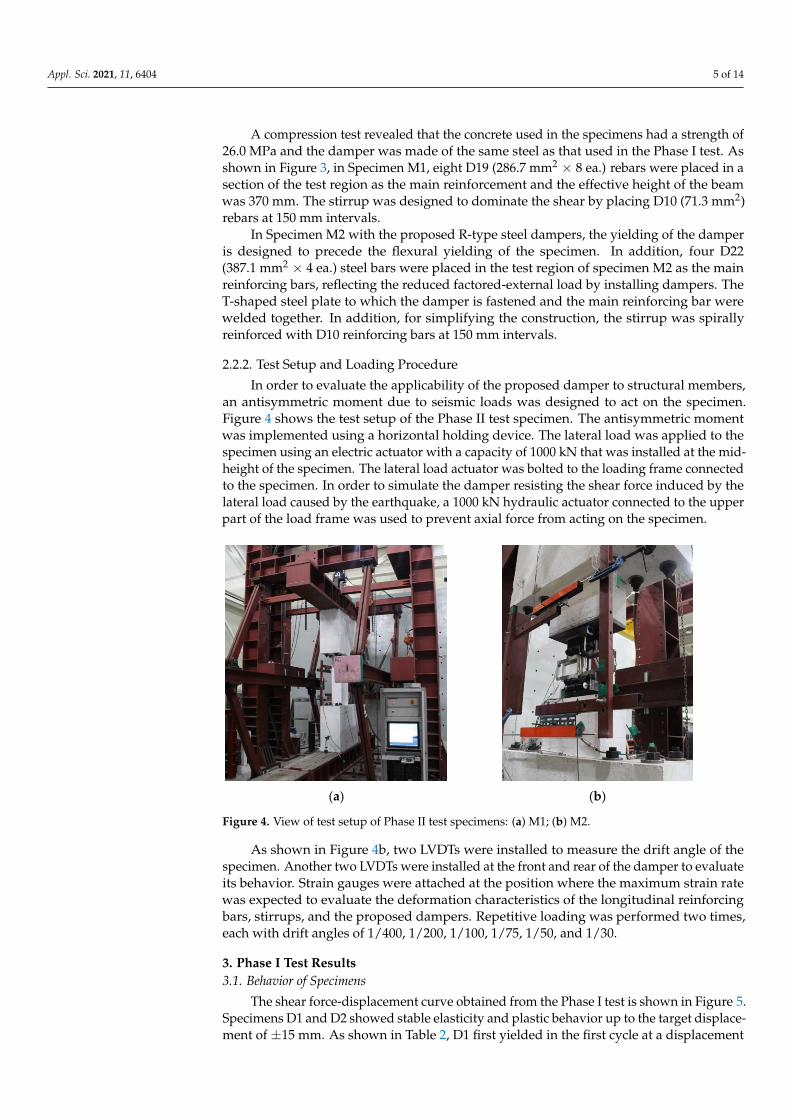
In order to evaluate the applicability of the proposed damper to structural members,an antisymmetric moment due to seismic loads was designed to act on the specimen.Figure 4 shows the test setup of the Phase II test specimen. The antisymmetric momentwas implemented using a horizontal holding device. The lateral load was applied to thespecimen using an electric actuator with a capacity of 1000 kN that was installed at the mid-height of the specimen. The lateral load actuator was bolted to the loading frame connectedto the specimen. In order to simulate the damper resisting the shear force induced by thelateral load caused by the earthquake, a 1000 kN hydraulic actuator connected to the upperpart of the load frame was used to prevent axial force from acting on the specimen.
Appl. Sci. 2021, 11, x FOR PEER REVIEW 6 of 16
mm2 × 4 ea.) steel bars were placed in the test region of specimen M2 as the main reinforc-
ing bars, reflecting the reduced factored-external load by installing dampers. The T-
shaped steel plate to which the damper is fastened and the main reinforcing bar were
welded together. In addition, for simplifying the construction, the stirrup was spirally
reinforced with D10 reinforcing bars at 150 mm intervals.
2.2.2. Test Setup and Loading Procedure
In order to evaluate the applicability of the proposed damper to structural members,
an antisymmetric moment due to seismic loads was designed to act on the specimen. Fig-
ure 4 shows the test setup of the Phase II test specimen. The antisymmetric moment was
implemented using a horizontal holding device. The lateral load was applied to the spec-
imen using an electric actuator with a capacity of 1000 kN that was installed at the mid-
height of the specimen. The lateral load actuator was bolted to the loading frame con-
nected to the specimen. In order to simulate the damper resisting the shear force induced
by the lateral load caused by the earthquake, a 1000 kN hydraulic actuator connected to
the upper part of the load frame was used to prevent axial force from acting on the speci-
men.
As shown in Figure 4b, two LVDTs were installed to measure the drift angle of the
specimen. Another two LVDTs were installed at the front and rear of the damper to eval-
uate its behavior. Strain gauges were attached at the position where the maximum strain
rate was expected to evaluate the deformation characteristics of the longitudinal reinforc-
ing bars, stirrups, and the proposed dampers. Repetitive loading was performed two
times, each with drift angles of 1/400, 1/200, 1/100, 1/75, 1/50, and 1/30.
(a) (b)
Figure 4. View of test setup of Phase II test specimens: (a) M1; (b) M2.
3. Phase I Test Results
3.1. Behavior of Specimens
The shear force-displacement curve obtained from the Phase I test is shown in Figure
5. Specimens D1 and D2 showed stable elasticity and plastic behavior up to the target
displacement of ±15 mm. As shown in Table 2, D1 first yielded in the first cycle at a dis-
placement of 1.85 mm and load of 18.1 kN. By contrast, D2, with an additional lower hor-
izontal member, first yielded in the first cycle at a displacement of 0.57 mm and a load of
36 kN. In other words, D2 had 6.4 times higher rigidity than D1 owing to the addition of
the lower horizontal member. This means that a damper with higher initial rigidity can
dissipate external energy more quickly when the external load is transmitted to the struc-
ture.
Figure 4. View of test setup of Phase II test specimens: (a) M1; (b) M2.
As shown in Figure 4b, two LVDTs were installed to measure the drift angle of thespecimen. Another two LVDTs were installed at the front and rear of the damper to evaluateits behavior. Strain gauges were attached at the position where the maximum strain ratewas expected to evaluate the deformation characteristics of the longitudinal reinforcingbars, stirrups, and the proposed dampers. Repetitive loading was performed two times,each with drift angles of 1/400, 1/200, 1/100, 1/75, 1/50, and 1/30.
3. Phase I Test Results3.1. Behavior of Specimens
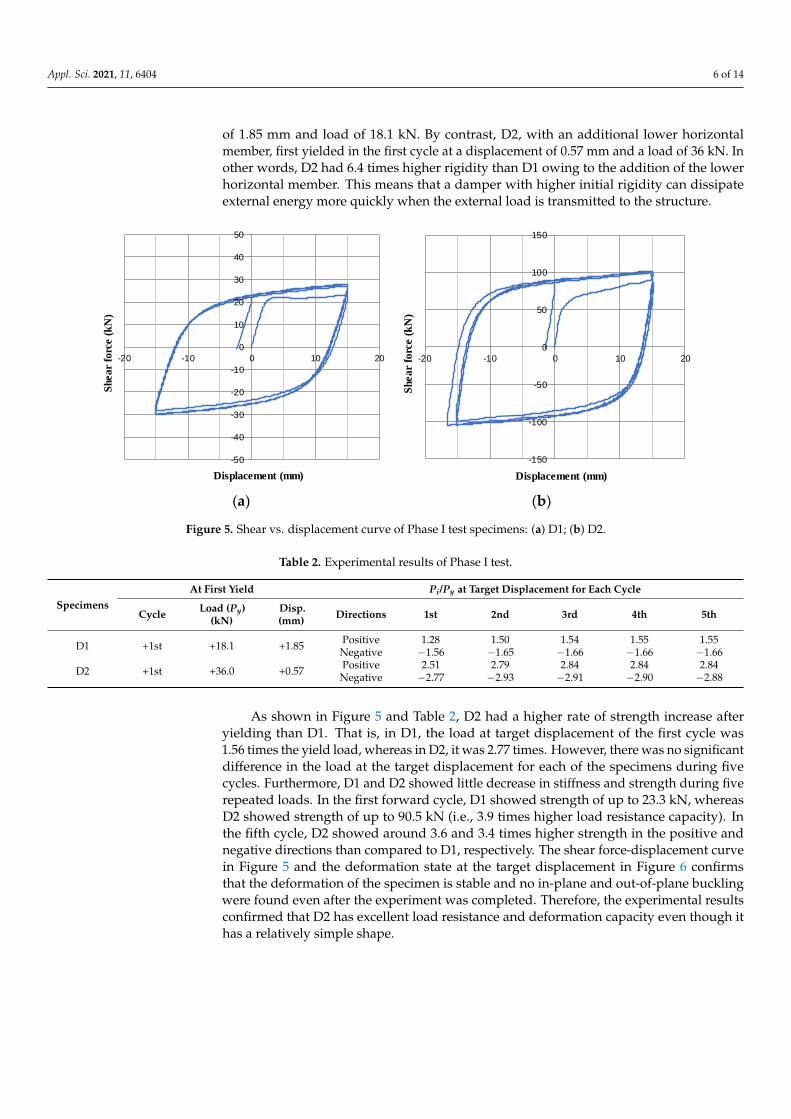
The shear force-displacement curve obtained from the Phase I test is shown in Figure 5.Specimens D1 and D2 showed stable elasticity and plastic behavior up to the target displace-ment of ±15 mm. As shown in Table 2, D1 first yielded in the first cycle at a displacement
Appl. Sci. 2021, 11, 6404 6 of 14
of 1.85 mm and load of 18.1 kN. By contrast, D2, with an additional lower horizontalmember, first yielded in the first cycle at a displacement of 0.57 mm and a load of 36 kN. Inother words, D2 had 6.4 times higher rigidity than D1 owing to the addition of the lowerhorizontal member. This means that a damper with higher initial rigidity can dissipateexternal energy more quickly when the external load is transmitted to the structure.
Appl. Sci. 2021, 11, x FOR PEER REVIEW 7 of 16
As shown in Figure 5 and Table 2, D2 had a higher rate of strength increase after
yielding than D1. That is, in D1, the load at target displacement of the first cycle was 1.56
times the yield load, whereas in D2, it was 2.77 times. However, there was no significant
difference in the load at the target displacement for each of the specimens during five
cycles. Furthermore, D1 and D2 showed little decrease in stiffness and strength during
five repeated loads. In the first forward cycle, D1 showed strength of up to 23.3 kN,
whereas D2 showed strength of up to 90.5 kN (i.e., 3.9 times higher load resistance capac-
ity). In the fifth cycle, D2 showed around 3.6 and 3.4 times higher strength in the positive
and negative directions than compared to D1, respectively. The shear force-displacement
curve in Figure 5 and the deformation state at the target displacement in Figure 6 confirms
that the deformation of the specimen is stable and no in-plane and out-of-plane buckling
were found even after the experiment was completed. Therefore, the experimental results
confirmed that D2 has excellent load resistance and deformation capacity even though it
has a relatively simple shape.
(a) (b)
Figure 5. Shear vs. displacement curve of Phase I test specimens: (a) D1; (b) D2.
(a) (b)
Figure 6. Deformation of Phase I test specimens at maximum displacement: (a) D1; (b) D2.
-50
-40
-30
-20
-10
0
10
20
30
40
50
-20 -10 0 10 20
Shea
r fo
rce (
kN
)
Displacement (mm)
-150
-100
-50
0
50
100
150
-20 -10 0 10 20
Sh
ea
r fo
rce
(k
N)
Displacement (mm)
Figure 5. Shear vs. displacement curve of Phase I test specimens: (a) D1; (b) D2.
Table 2. Experimental results of Phase I test.
SpecimensAt First Yield Pi/Py at Target Displacement for Each Cycle
Cycle Load (Py)(kN)
Disp.(mm) Directions 1st 2nd 3rd 4th 5th
D1 +1st +18.1 +1.85 PositiveNegative
1.28−1.56
1.50−1.65
1.54−1.66
1.55−1.66
1.55−1.66
D2 +1st +36.0 +0.57 PositiveNegative
2.51−2.77
2.79−2.93
2.84−2.91
2.84−2.90
2.84−2.88
As shown in Figure 5 and Table 2, D2 had a higher rate of strength increase afteryielding than D1. That is, in D1, the load at target displacement of the first cycle was1.56 times the yield load, whereas in D2, it was 2.77 times. However, there was no significantdifference in the load at the target displacement for each of the specimens during fivecycles. Furthermore, D1 and D2 showed little decrease in stiffness and strength during fiverepeated loads. In the first forward cycle, D1 showed strength of up to 23.3 kN, whereasD2 showed strength of up to 90.5 kN (i.e., 3.9 times higher load resistance capacity). Inthe fifth cycle, D2 showed around 3.6 and 3.4 times higher strength in the positive andnegative directions than compared to D1, respectively. The shear force-displacement curvein Figure 5 and the deformation state at the target displacement in Figure 6 confirmsthat the deformation of the specimen is stable and no in-plane and out-of-plane bucklingwere found even after the experiment was completed. Therefore, the experimental resultsconfirmed that D2 has excellent load resistance and deformation capacity even though ithas a relatively simple shape.
Appl. Sci. 2021, 11, 6404 7 of 14
Appl. Sci. 2021, 11, x FOR PEER REVIEW 7 of 16
As shown in Figure 5 and Table 2, D2 had a higher rate of strength increase after
yielding than D1. That is, in D1, the load at target displacement of the first cycle was 1.56
times the yield load, whereas in D2, it was 2.77 times. However, there was no significant
difference in the load at the target displacement for each of the specimens during five
cycles. Furthermore, D1 and D2 showed little decrease in stiffness and strength during
five repeated loads. In the first forward cycle, D1 showed strength of up to 23.3 kN,
whereas D2 showed strength of up to 90.5 kN (i.e., 3.9 times higher load resistance capac-
ity). In the fifth cycle, D2 showed around 3.6 and 3.4 times higher strength in the positive
and negative directions than compared to D1, respectively. The shear force-displacement
curve in Figure 5 and the deformation state at the target displacement in Figure 6 confirms
that the deformation of the specimen is stable and no in-plane and out-of-plane buckling
were found even after the experiment was completed. Therefore, the experimental results
confirmed that D2 has excellent load resistance and deformation capacity even though it
has a relatively simple shape.
(a) (b)
Figure 5. Shear vs. displacement curve of Phase I test specimens: (a) D1; (b) D2.
(a) (b)
Figure 6. Deformation of Phase I test specimens at maximum displacement: (a) D1; (b) D2.
-50
-40
-30
-20
-10
0
10
20
30
40
50
-20 -10 0 10 20
Shea
r fo
rce (
kN
)
Displacement (mm)
-150
-100
-50
0
50
100
150
-20 -10 0 10 20
Sh
ear
forc
e (
kN
)
Displacement (mm)
Figure 6. Deformation of Phase I test specimens at maximum displacement: (a) D1; (b) D2.
3.2. Strain Distribution
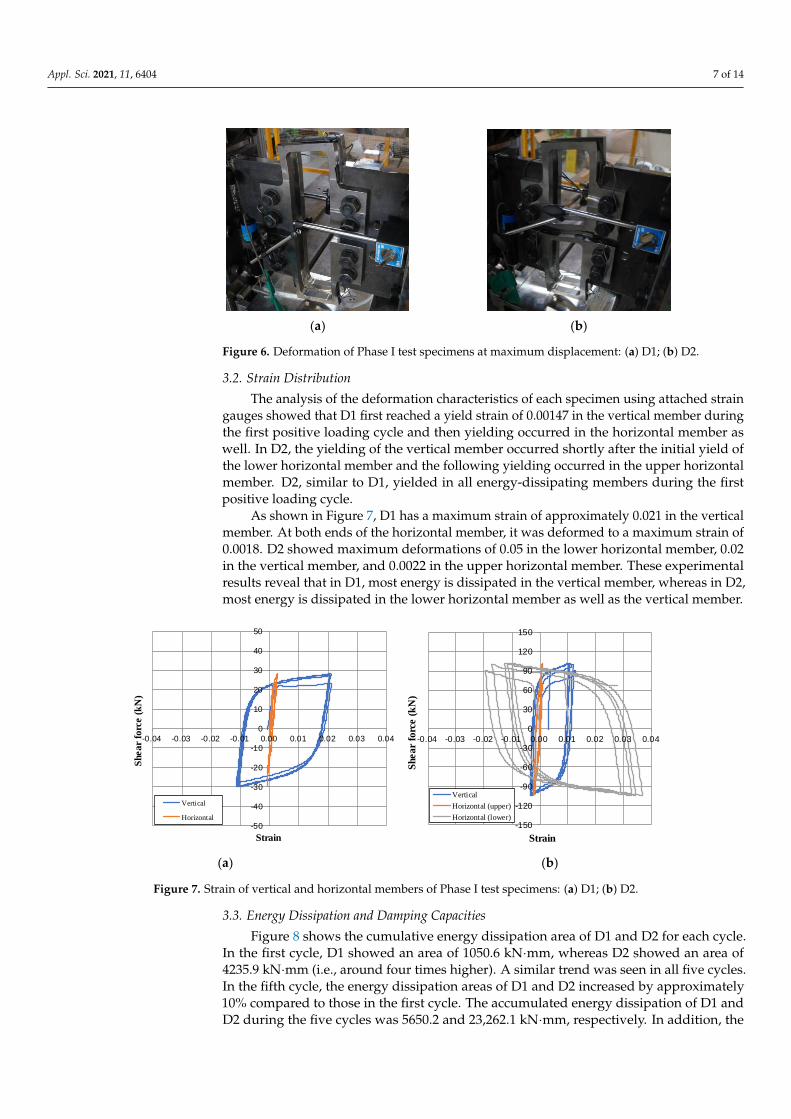
The analysis of the deformation characteristics of each specimen using attached straingauges showed that D1 first reached a yield strain of 0.00147 in the vertical member duringthe first positive loading cycle and then yielding occurred in the horizontal member aswell. In D2, the yielding of the vertical member occurred shortly after the initial yield ofthe lower horizontal member and the following yielding occurred in the upper horizontalmember. D2, similar to D1, yielded in all energy-dissipating members during the firstpositive loading cycle.
As shown in Figure 7, D1 has a maximum strain of approximately 0.021 in the verticalmember. At both ends of the horizontal member, it was deformed to a maximum strain of0.0018. D2 showed maximum deformations of 0.05 in the lower horizontal member, 0.02in the vertical member, and 0.0022 in the upper horizontal member. These experimentalresults reveal that in D1, most energy is dissipated in the vertical member, whereas in D2,most energy is dissipated in the lower horizontal member as well as the vertical member.
Appl. Sci. 2021, 11, x FOR PEER REVIEW 8 of 16
Table 2. Experimental results of Phase I test.
Specimens
At First Yield /i yP P at Target Displacement for Each Cycle
Cycle Load (
yP )
(kN)
Disp.
(mm) Directions 1st 2nd 3rd 4th 5th
D1 +1st +18.1 +1.85 Positive
Negative
1.28
−1.56
1.50
−1.65
1.54
−1.66
1.55
−1.66
1.55
−1.66
D2 +1st +36.0 +0.57 Positive
Negative
2.51
−2.77
2.79
−2.93
2.84
−2.91
2.84
−2.90
2.84
−2.88
3.2. Strain Distribution
The analysis of the deformation characteristics of each specimen using attached strain
gauges showed that D1 first reached a yield strain of 0.00147 in the vertical member dur-
ing the first positive loading cycle and then yielding occurred in the horizontal member
as well. In D2, the yielding of the vertical member occurred shortly after the initial yield
of the lower horizontal member and the following yielding occurred in the upper hori-
zontal member. D2, similar to D1, yielded in all energy-dissipating members during the
first positive loading cycle.
As shown in Figure 7, D1 has a maximum strain of approximately 0.021 in the vertical
member. At both ends of the horizontal member, it was deformed to a maximum strain of
0.0018. D2 showed maximum deformations of 0.05 in the lower horizontal member, 0.02
in the vertical member, and 0.0022 in the upper horizontal member. These experimental
results reveal that in D1, most energy is dissipated in the vertical member, whereas in D2,
most energy is dissipated in the lower horizontal member as well as the vertical member.
(a) (b)
Figure 7. Strain of vertical and horizontal members of Phase I test specimens: (a) D1; (b) D2.
3.3. Energy Dissipation and Damping Capacities
Figure 8 shows the cumulative energy dissipation area of D1 and D2 for each cycle.
In the first cycle, D1 showed an area of 1050.6 kN·mm, whereas D2 showed an area of
4235.9 kN·mm (i.e., around four times higher). A similar trend was seen in all five cycles.
In the fifth cycle, the energy dissipation areas of D1 and D2 increased by approximately
10% compared to those in the first cycle. The accumulated energy dissipation of D1 and
D2 during the five cycles was 5650.2 and 23,262.1 kN·mm, respectively. In addition, the
energy dissipation area did not decrease from the first to the fifth cycles in all specimens.
These experimental results confirmed that the proposed R-type steel damper has high
load resistance capability and very good energy dissipation capability.
-50
-40
-30
-20
-10
0
10
20
30
40
50
-0.04 -0.03 -0.02 -0.01 0.00 0.01 0.02 0.03 0.04
Sh
ear
forc
e (
kN
)
Strain
Vertical
Horizontal-150
-120
-90
-60
-30
0
30
60
90
120
150
-0.04 -0.03 -0.02 -0.01 0.00 0.01 0.02 0.03 0.04
Sh
ea
r fo
rce
(k
N)
Strain
Vertical
Horizontal (upper)
Horizontal (lower)
Figure 7. Strain of vertical and horizontal members of Phase I test specimens: (a) D1; (b) D2.
3.3. Energy Dissipation and Damping Capacities
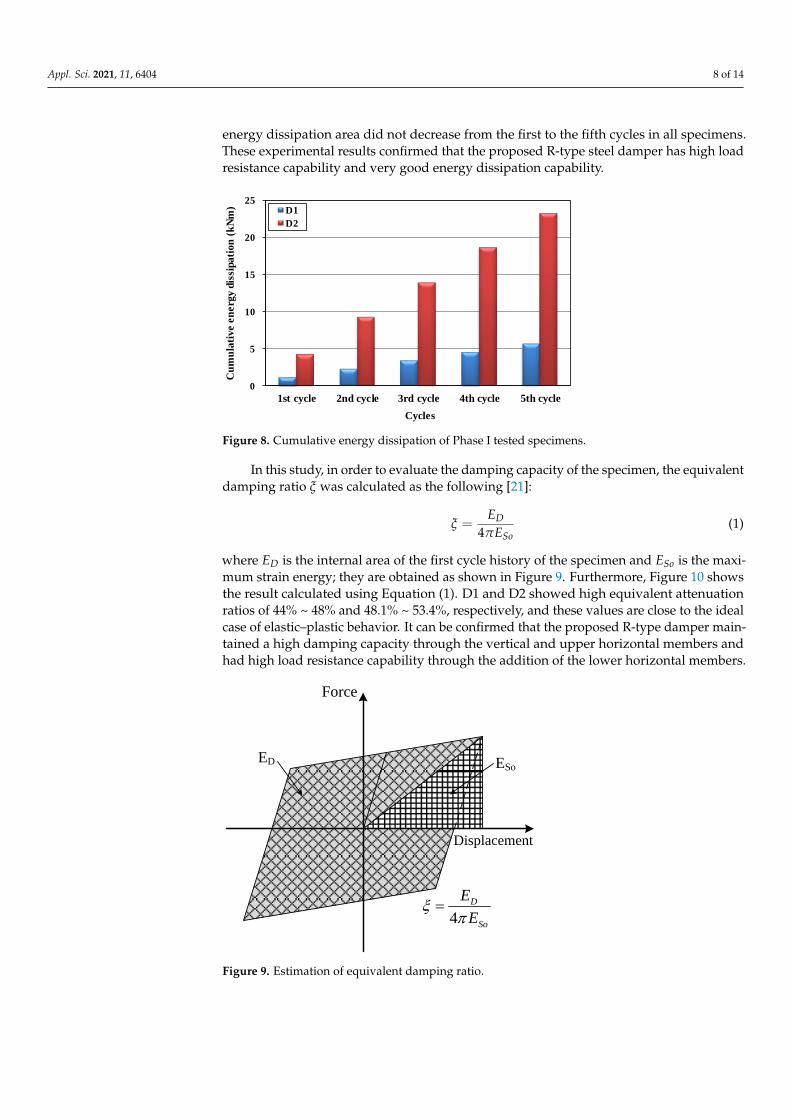
Figure 8 shows the cumulative energy dissipation area of D1 and D2 for each cycle.In the first cycle, D1 showed an area of 1050.6 kN·mm, whereas D2 showed an area of4235.9 kN·mm (i.e., around four times higher). A similar trend was seen in all five cycles.In the fifth cycle, the energy dissipation areas of D1 and D2 increased by approximately10% compared to those in the first cycle. The accumulated energy dissipation of D1 andD2 during the five cycles was 5650.2 and 23,262.1 kN·mm, respectively. In addition, the
Appl. Sci. 2021, 11, 6404 8 of 14
energy dissipation area did not decrease from the first to the fifth cycles in all specimens.These experimental results confirmed that the proposed R-type steel damper has high loadresistance capability and very good energy dissipation capability.
Appl. Sci. 2021, 11, x FOR PEER REVIEW 9 of 16
Figure 8. Cumulative energy dissipation of Phase I tested specimens.
In this study, in order to evaluate the damping capacity of the specimen, the equiva-
lent damping ratio was calculated as the following [21]:
4
D
So
E
E
= (1)
where DE is the internal area of the first cycle history of the specimen and SoE is the
maximum strain energy; they are obtained as shown in Figure 9. Furthermore, Figure 10
shows the result calculated using Equation (1). D1 and D2 showed high equivalent atten-
uation ratios of 44% ~ 48% and 48.1% ~ 53.4%, respectively, and these values are close to
the ideal case of elastic–plastic behavior. It can be confirmed that the proposed R-type
damper maintained a high damping capacity through the vertical and upper horizontal
members and had high load resistance capability through the addition of the lower hori-
zontal members.
Force
ED
Displacement
ESo
4
D
So
E
E
=
Figure 9. Estimation of equivalent damping ratio.
0
5
10
15
20
25
1st cycle 2nd cycle 3rd cycle 4th cycle 5th cycle
Cu
mu
lati
ve e
nerg
y d
issi
pa
tio
n (
kN
m)
Cycles
D1
D2
Figure 8. Cumulative energy dissipation of Phase I tested specimens.
In this study, in order to evaluate the damping capacity of the specimen, the equivalentdamping ratio ξ was calculated as the following [21]:
ξ =ED
4πESo(1)
where ED is the internal area of the first cycle history of the specimen and ESo is the maxi-mum strain energy; they are obtained as shown in Figure 9. Furthermore, Figure 10 showsthe result calculated using Equation (1). D1 and D2 showed high equivalent attenuationratios of 44% ~ 48% and 48.1% ~ 53.4%, respectively, and these values are close to the idealcase of elastic–plastic behavior. It can be confirmed that the proposed R-type damper main-tained a high damping capacity through the vertical and upper horizontal members andhad high load resistance capability through the addition of the lower horizontal members.
Appl. Sci. 2021, 11, x FOR PEER REVIEW 9 of 16
Figure 8. Cumulative energy dissipation of Phase I tested specimens.
In this study, in order to evaluate the damping capacity of the specimen, the equiva-
lent damping ratio was calculated as the following [21]:
4
D
So
E
E
= (1)
where DE is the internal area of the first cycle history of the specimen and SoE is the
maximum strain energy; they are obtained as shown in Figure 9. Furthermore, Figure 10
shows the result calculated using Equation (1). D1 and D2 showed high equivalent atten-
uation ratios of 44% ~ 48% and 48.1% ~ 53.4%, respectively, and these values are close to
the ideal case of elastic–plastic behavior. It can be confirmed that the proposed R-type
damper maintained a high damping capacity through the vertical and upper horizontal
members and had high load resistance capability through the addition of the lower hori-
zontal members.
Force
ED
Displacement
ESo
4
D
So
E
E
=
Figure 9. Estimation of equivalent damping ratio.
0
5
10
15
20
25
1st cycle 2nd cycle 3rd cycle 4th cycle 5th cycle
Cu
mu
lati
ve e
nerg
y d
issi
pa
tio
n (
kN
m)
Cycles
D1
D2
Figure 9. Estimation of equivalent damping ratio.
Appl. Sci. 2021, 11, 6404 9 of 14Appl. Sci. 2021, 11, x FOR PEER REVIEW 10 of 16
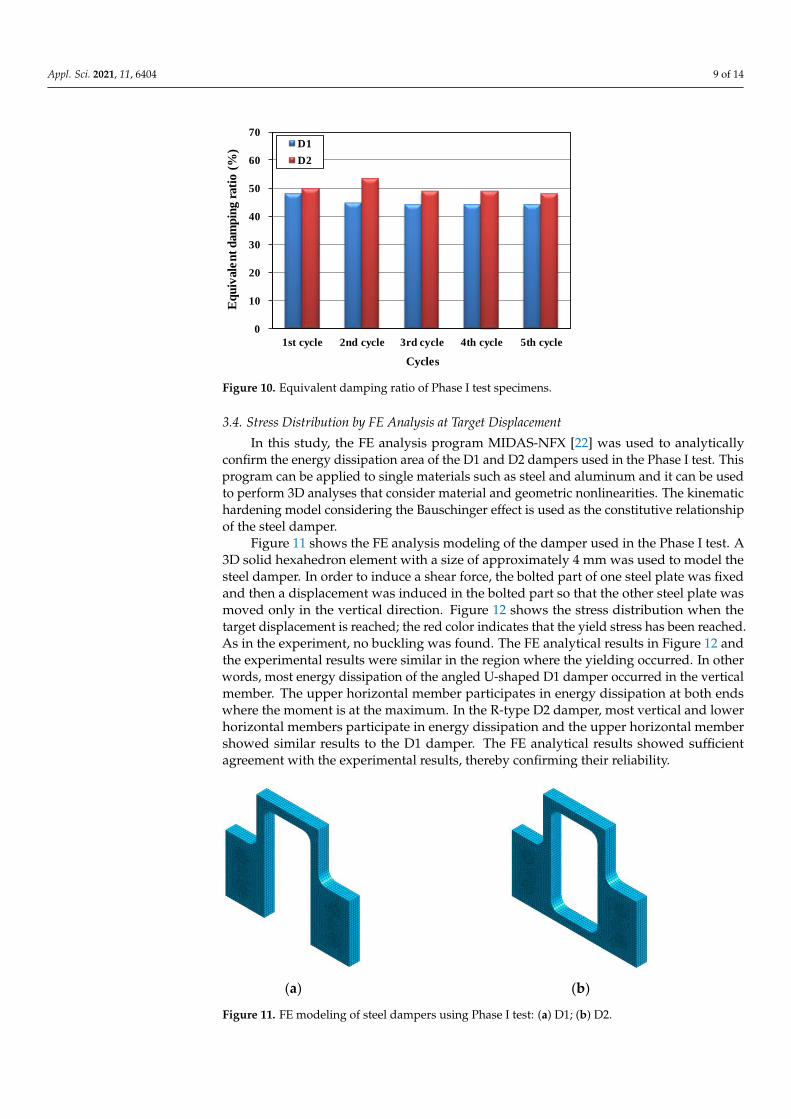
Figure 10. Equivalent damping ratio of Phase I test specimens.
3.4. Stress Distribution by FE Analysis at Target Displacement
In this study, the FE analysis program MIDAS-NFX [22] was used to analytically con-
firm the energy dissipation area of the D1 and D2 dampers used in the Phase I test. This
program can be applied to single materials such as steel and aluminum and it can be used
to perform 3D analyses that consider material and geometric nonlinearities. The kinematic
hardening model considering the Bauschinger effect is used as the constitutive relation-
ship of the steel damper.
Figure 11 shows the FE analysis modeling of the damper used in the Phase I test. A
3D solid hexahedron element with a size of approximately 4 mm was used to model the
steel damper. In order to induce a shear force, the bolted part of one steel plate was fixed
and then a displacement was induced in the bolted part so that the other steel plate was
moved only in the vertical direction. Figure 12 shows the stress distribution when the target
displacement is reached; the red color indicates that the yield stress has been reached. As in
the experiment, no buckling was found. The FE analytical results in Figure 12 and the ex-
perimental results were similar in the region where the yielding occurred. In other words,
most energy dissipation of the angled U-shaped D1 damper occurred in the vertical mem-
ber. The upper horizontal member participates in energy dissipation at both ends where
the moment is at the maximum. In the R-type D2 damper, most vertical and lower hori-
zontal members participate in energy dissipation and the upper horizontal member
showed similar results to the D1 damper. The FE analytical results showed sufficient
agreement with the experimental results, thereby confirming their reliability.
(a) (b)
Figure 11. FE modeling of steel dampers using Phase I test: (a) D1; (b) D2.
0
10
20
30
40
50
60
70
1st cycle 2nd cycle 3rd cycle 4th cycle 5th cycle
Eq
uiv
ale
nt
dam
pin
g r
ati
o (
%)
Cycles
D1
D2
Figure 10. Equivalent damping ratio of Phase I test specimens.
3.4. Stress Distribution by FE Analysis at Target Displacement
In this study, the FE analysis program MIDAS-NFX [22] was used to analyticallyconfirm the energy dissipation area of the D1 and D2 dampers used in the Phase I test. Thisprogram can be applied to single materials such as steel and aluminum and it can be usedto perform 3D analyses that consider material and geometric nonlinearities. The kinematichardening model considering the Bauschinger effect is used as the constitutive relationshipof the steel damper.
Figure 11 shows the FE analysis modeling of the damper used in the Phase I test. A3D solid hexahedron element with a size of approximately 4 mm was used to model thesteel damper. In order to induce a shear force, the bolted part of one steel plate was fixedand then a displacement was induced in the bolted part so that the other steel plate wasmoved only in the vertical direction. Figure 12 shows the stress distribution when thetarget displacement is reached; the red color indicates that the yield stress has been reached.As in the experiment, no buckling was found. The FE analytical results in Figure 12 andthe experimental results were similar in the region where the yielding occurred. In otherwords, most energy dissipation of the angled U-shaped D1 damper occurred in the verticalmember. The upper horizontal member participates in energy dissipation at both endswhere the moment is at the maximum. In the R-type D2 damper, most vertical and lowerhorizontal members participate in energy dissipation and the upper horizontal membershowed similar results to the D1 damper. The FE analytical results showed sufficientagreement with the experimental results, thereby confirming their reliability.
Appl. Sci. 2021, 11, x FOR PEER REVIEW 10 of 16
Figure 10. Equivalent damping ratio of Phase I test specimens.
3.4. Stress Distribution by FE Analysis at Target Displacement
In this study, the FE analysis program MIDAS-NFX [22] was used to analytically con-
firm the energy dissipation area of the D1 and D2 dampers used in the Phase I test. This
program can be applied to single materials such as steel and aluminum and it can be used
to perform 3D analyses that consider material and geometric nonlinearities. The kinematic
hardening model considering the Bauschinger effect is used as the constitutive relation-
ship of the steel damper.
Figure 11 shows the FE analysis modeling of the damper used in the Phase I test. A
3D solid hexahedron element with a size of approximately 4 mm was used to model the
steel damper. In order to induce a shear force, the bolted part of one steel plate was fixed
and then a displacement was induced in the bolted part so that the other steel plate was
moved only in the vertical direction. Figure 12 shows the stress distribution when the target
displacement is reached; the red color indicates that the yield stress has been reached. As in
the experiment, no buckling was found. The FE analytical results in Figure 12 and the ex-
perimental results were similar in the region where the yielding occurred. In other words,
most energy dissipation of the angled U-shaped D1 damper occurred in the vertical mem-
ber. The upper horizontal member participates in energy dissipation at both ends where
the moment is at the maximum. In the R-type D2 damper, most vertical and lower hori-
zontal members participate in energy dissipation and the upper horizontal member
showed similar results to the D1 damper. The FE analytical results showed sufficient
agreement with the experimental results, thereby confirming their reliability.
(a) (b)
Figure 11. FE modeling of steel dampers using Phase I test: (a) D1; (b) D2.
0
10
20
30
40
50
60
70
1st cycle 2nd cycle 3rd cycle 4th cycle 5th cycle
Eq
uiv
ale
nt
dam
pin
g r
ati
o (
%)
Cycles
D1
D2
Figure 11. FE modeling of steel dampers using Phase I test: (a) D1; (b) D2.
Appl. Sci. 2021, 11, 6404 10 of 14Appl. Sci. 2021, 11, x FOR PEER REVIEW 11 of 16
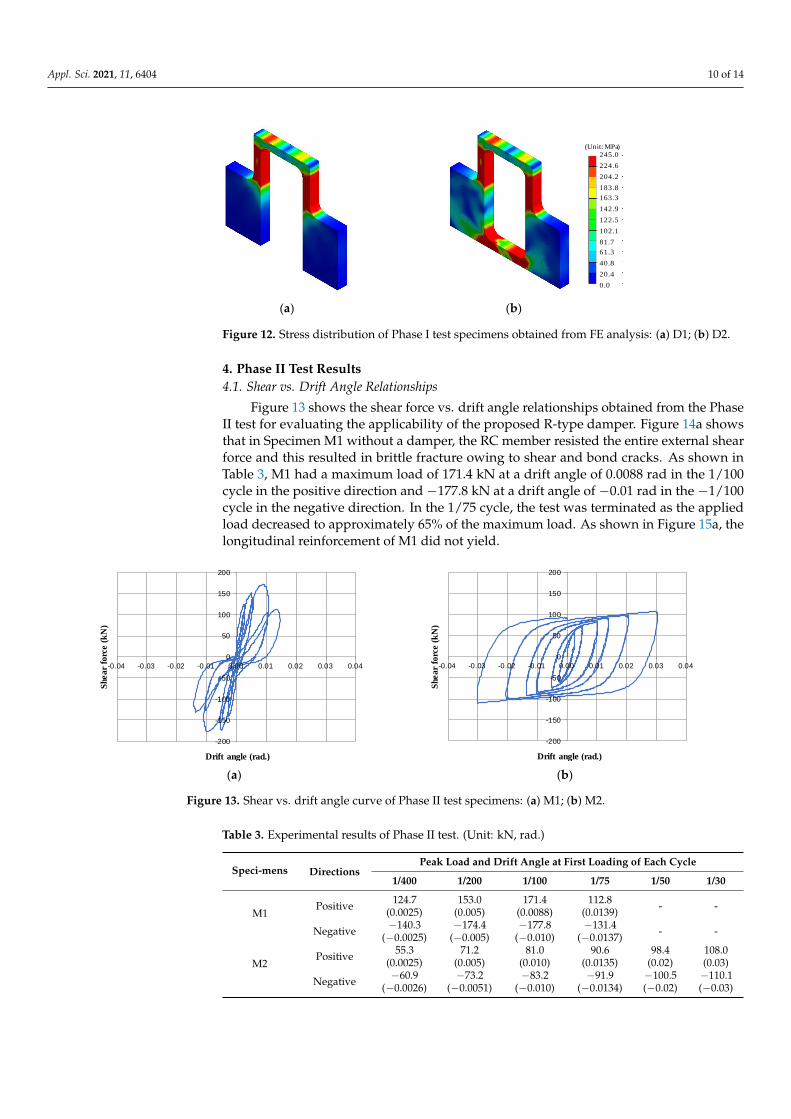
(a) (b)
Figure 12. Stress distribution of Phase I test specimens obtained from FE analysis: (a) D1; (b) D2.
4. Phase II Test Results
4.1. Shear vs. Drift Angle Relationships
Figure 13 shows the shear force vs. drift angle relationships obtained from the Phase
II test for evaluating the applicability of the proposed R-type damper. Figure 14a shows
that in Specimen M1 without a damper, the RC member resisted the entire external shear
force and this resulted in brittle fracture owing to shear and bond cracks. As shown in
Table 3, M1 had a maximum load of 171.4 kN at a drift angle of 0.0088 rad in the 1/100
cycle in the positive direction and −177.8 kN at a drift angle of −0.01 rad in the −1/100 cycle
in the negative direction. In the 1/75 cycle, the test was terminated as the applied load
decreased to approximately 65% of the maximum load. As shown in Figure 15a, the lon-
gitudinal reinforcement of M1 did not yield.
(a) (b)
Figure 13. Shear vs. drift angle curve of Phase II test specimens: (a) M1; (b) M2.
245.0
224.6
204.2
183.8
163.3
142.9
122.5
102.1
81.7
61.3
40.8
20.4
0.0
(Unit: MPa)
-200
-150
-100
-50
0
50
100
150
200
-0.04 -0.03 -0.02 -0.01 0.00 0.01 0.02 0.03 0.04
Sh
ea
r fo
rce
(k
N)
Drift angle (rad.)
-200
-150
-100
-50
0
50
100
150
200
-0.04 -0.03 -0.02 -0.01 0.00 0.01 0.02 0.03 0.04
Shea
r fo
rce (
kN
)
Drift angle (rad.)
Figure 12. Stress distribution of Phase I test specimens obtained from FE analysis: (a) D1; (b) D2.
4. Phase II Test Results4.1. Shear vs. Drift Angle Relationships
Figure 13 shows the shear force vs. drift angle relationships obtained from the PhaseII test for evaluating the applicability of the proposed R-type damper. Figure 14a showsthat in Specimen M1 without a damper, the RC member resisted the entire external shearforce and this resulted in brittle fracture owing to shear and bond cracks. As shown inTable 3, M1 had a maximum load of 171.4 kN at a drift angle of 0.0088 rad in the 1/100cycle in the positive direction and −177.8 kN at a drift angle of −0.01 rad in the −1/100cycle in the negative direction. In the 1/75 cycle, the test was terminated as the appliedload decreased to approximately 65% of the maximum load. As shown in Figure 15a, thelongitudinal reinforcement of M1 did not yield.
Appl. Sci. 2021, 11, x FOR PEER REVIEW 11 of 16
(a) (b)
Figure 12. Stress distribution of Phase I test specimens obtained from FE analysis: (a) D1; (b) D2.
4. Phase II Test Results
4.1. Shear vs. Drift Angle Relationships
Figure 13 shows the shear force vs. drift angle relationships obtained from the Phase
II test for evaluating the applicability of the proposed R-type damper. Figure 14a shows
that in Specimen M1 without a damper, the RC member resisted the entire external shear
force and this resulted in brittle fracture owing to shear and bond cracks. As shown in
Table 3, M1 had a maximum load of 171.4 kN at a drift angle of 0.0088 rad in the 1/100
cycle in the positive direction and −177.8 kN at a drift angle of −0.01 rad in the −1/100 cycle
in the negative direction. In the 1/75 cycle, the test was terminated as the applied load
decreased to approximately 65% of the maximum load. As shown in Figure 15a, the lon-
gitudinal reinforcement of M1 did not yield.
(a) (b)
Figure 13. Shear vs. drift angle curve of Phase II test specimens: (a) M1; (b) M2.
245.0
224.6
204.2
183.8
163.3
142.9
122.5
102.1
81.7
61.3
40.8
20.4
0.0
(Unit: MPa)
-200
-150
-100
-50
0
50
100
150
200
-0.04 -0.03 -0.02 -0.01 0.00 0.01 0.02 0.03 0.04
Sh
ea
r fo
rce
(k
N)
Drift angle (rad.)
-200
-150
-100
-50
0
50
100
150
200
-0.04 -0.03 -0.02 -0.01 0.00 0.01 0.02 0.03 0.04
Shea
r fo
rce (
kN
)
Drift angle (rad.)
Figure 13. Shear vs. drift angle curve of Phase II test specimens: (a) M1; (b) M2.
Table 3. Experimental results of Phase II test. (Unit: kN, rad.)
Speci-mens DirectionsPeak Load and Drift Angle at First Loading of Each Cycle
1/400 1/200 1/100 1/75 1/50 1/30
M1Positive 124.7
(0.0025)153.0
(0.005)171.4
(0.0088)112.8
(0.0139) - -
Negative −140.3(−0.0025)
−174.4(−0.005)
−177.8(−0.010)
−131.4(−0.0137) - -
M2Positive 55.3
(0.0025)71.2
(0.005)81.0
(0.010)90.6
(0.0135)98.4
(0.02)108.0(0.03)
Negative −60.9(−0.0026)
−73.2(−0.0051)
−83.2(−0.010)
−91.9(−0.0134)
−100.5(−0.02)
−110.1(−0.03)

Appl. Sci. 2021, 11, 6404 11 of 14Appl. Sci. 2021, 11, x FOR PEER REVIEW 12 of 16
(a) (b)
Figure 14. Crack pattern and deformation of Phase II test specimens: (a) M1; (b) M2.
Table 3. Experimental results of Phase II test. (Unit: kN, rad.)
Speci-
mens Directions
Peak Load and Drift Angle at First Loading of Each Cycle
1/400 1/200 1/100 1/75 1/50 1/30
M1
Positive 124.7
(0.0025)
153.0
(0.005)
171.4
(0.0088)
112.8
(0.0139) - -
Negative −140.3
(−0.0025)
−174.4
(−0.005)
−177.8
(−0.010)
−131.4
(−0.0137) - -
M2
Positive 55.3
(0.0025)
71.2
(0.005)
81.0
(0.010)
90.6
(0.0135)
98.4
(0.02)
108.0
(0.03)
Negative −60.9
(−0.0026)
−73.2
(−0.0051)
−83.2
(−0.010)
−91.9
(−0.0134)
−100.5
(−0.02)
−110.1
(−0.03)
(a) (b)
Figure 15. Strain of longitudinal reinforcement of tested specimens: (a) M1; (b) M2.
In Specimen M2 with the proposed R-type steel dampers, the yielding and energy
dissipation of the steel damper occurred before the RC member was damaged. Hardly
any cracks formed in the RC member and ductile behavior was observed for a drift angle
-200
-150
-100
-50
0
50
100
150
200
-0.003 -0.002 -0.001 0.000 0.001 0.002 0.003
Shea
r fo
rce (
kN
)
Strain
Yield strain Yield strain-200
-150
-100
-50
0
50
100
150
200
-0.003 -0.002 -0.001 0.000 0.001 0.002 0.003
Sh
ea
r fo
rce (
kN
)
Strain
Yield strain Yield strain
Figure 14. Crack pattern and deformation of Phase II test specimens: (a) M1; (b) M2.
Appl. Sci. 2021, 11, x FOR PEER REVIEW 12 of 16
(a) (b)
Figure 14. Crack pattern and deformation of Phase II test specimens: (a) M1; (b) M2.
Table 3. Experimental results of Phase II test. (Unit: kN, rad.)
Speci-
mens Directions
Peak Load and Drift Angle at First Loading of Each Cycle
1/400 1/200 1/100 1/75 1/50 1/30
M1
Positive 124.7
(0.0025)
153.0
(0.005)
171.4
(0.0088)
112.8
(0.0139) - -
Negative −140.3
(−0.0025)
−174.4
(−0.005)
−177.8
(−0.010)
−131.4
(−0.0137) - -
M2
Positive 55.3
(0.0025)
71.2
(0.005)
81.0
(0.010)
90.6
(0.0135)
98.4
(0.02)
108.0
(0.03)
Negative −60.9
(−0.0026)
−73.2
(−0.0051)
−83.2
(−0.010)
−91.9
(−0.0134)
−100.5
(−0.02)
−110.1
(−0.03)
(a) (b)
Figure 15. Strain of longitudinal reinforcement of tested specimens: (a) M1; (b) M2.
In Specimen M2 with the proposed R-type steel dampers, the yielding and energy
dissipation of the steel damper occurred before the RC member was damaged. Hardly
any cracks formed in the RC member and ductile behavior was observed for a drift angle
-200
-150
-100
-50
0
50
100
150
200
-0.003 -0.002 -0.001 0.000 0.001 0.002 0.003
Shea
r fo
rce (
kN
)
Strain
Yield strain Yield strain-200
-150
-100
-50
0
50
100
150
200
-0.003 -0.002 -0.001 0.000 0.001 0.002 0.003
Sh
ea
r fo
rce (
kN
)
Strain
Yield strain Yield strain
Figure 15. Strain of longitudinal reinforcement of tested specimens: (a) M1; (b) M2.
In Specimen M2 with the proposed R-type steel dampers, the yielding and energydissipation of the steel damper occurred before the RC member was damaged. Hardly anycracks formed in the RC member and ductile behavior was observed for a drift angle ofup to 3%. As shown in Figure 15b, the longitudinal reinforcement of M2 remained at astrain of at most 0.0006. The damper yielded in the first 1/400 cycle and the load and driftangle at that time were 52.1 kN and 0.002 rad, respectively. Initially, the vertical member ofthe steel damper yielded and, immediately after, the lower horizontal member of the steeldamper yielded at a drift angle of 0.0025 rad. The upper horizontal member of the steeldamper yielded in the 1/200 cycle and the load and drift angle at that time were 68.8 kNand 0.004 rad, respectively.
4.2. Crack Patterns and Failure Modes
As shown in Figure 14a, which is the view after M1 failure, the shear and bondcracks are more prominent than the flexural cracks. In M1, flexural and shear cracks wereobserved in the 1/400 cycle. As the drift angle increased further, the number and widthof shear cracks increased. Shear and bond cracks developed significantly with a load of
Appl. Sci. 2021, 11, 6404 12 of 14
171.4 kN at a drift angle of 0.0088 rad in the 1/100 cycle, resulting in brittle shear-bondfailure. This is because the short shear span ratio of the coupling beam is very vulnerableto shear and bond due to lateral forces such as earthquake loads.
Figure 14b shows the appearance at the maximum drift angle of M2 with the pro-posed R-type steel dampers. Hardly any cracks were observed in the test region and alldeformations were concentrated in the damper. These experimental results confirmed thatthe proposed damper performs very well when applied to a structural member.
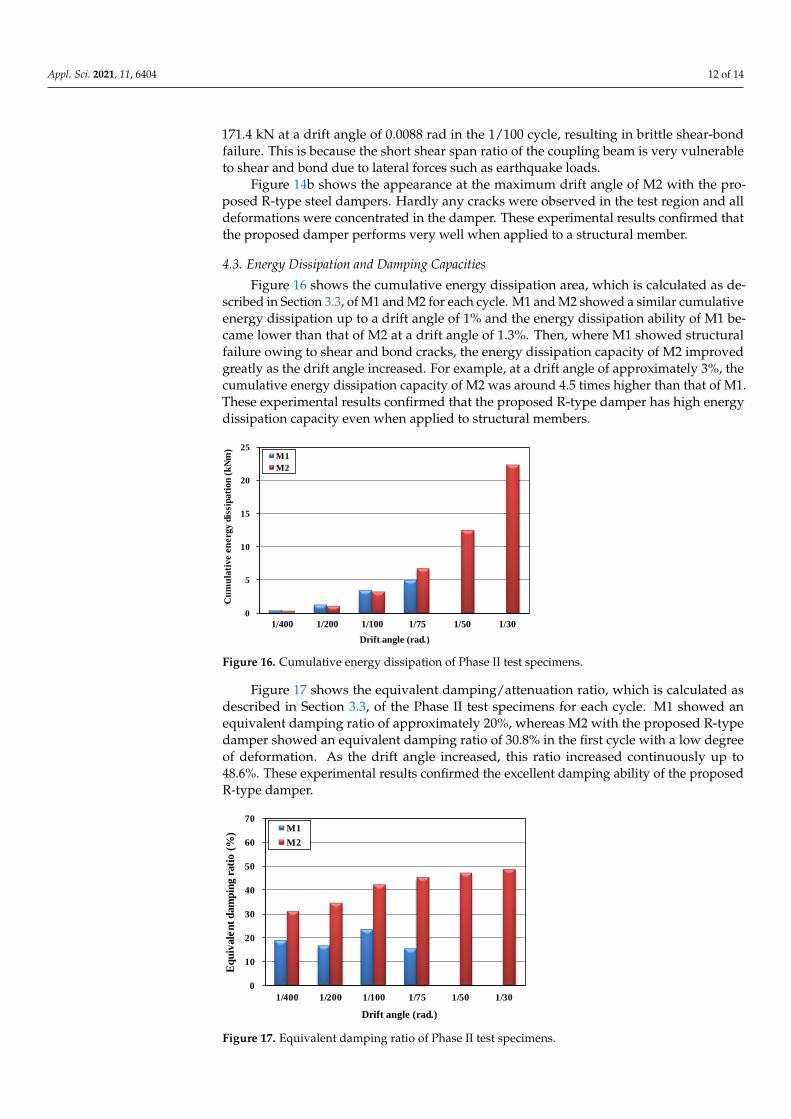
4.3. Energy Dissipation and Damping Capacities
Figure 16 shows the cumulative energy dissipation area, which is calculated as de-scribed in Section 3.3, of M1 and M2 for each cycle. M1 and M2 showed a similar cumulativeenergy dissipation up to a drift angle of 1% and the energy dissipation ability of M1 be-came lower than that of M2 at a drift angle of 1.3%. Then, where M1 showed structuralfailure owing to shear and bond cracks, the energy dissipation capacity of M2 improvedgreatly as the drift angle increased. For example, at a drift angle of approximately 3%, thecumulative energy dissipation capacity of M2 was around 4.5 times higher than that of M1.These experimental results confirmed that the proposed R-type damper has high energydissipation capacity even when applied to structural members.
Appl. Sci. 2021, 11, x FOR PEER REVIEW 13 of 16
of up to 3%. As shown in Figure 15b, the longitudinal reinforcement of M2 remained at a
strain of at most 0.0006. The damper yielded in the first 1/400 cycle and the load and drift
angle at that time were 52.1 kN and 0.002 rad, respectively. Initially, the vertical member
of the steel damper yielded and, immediately after, the lower horizontal member of the
steel damper yielded at a drift angle of 0.0025 rad. The upper horizontal member of the
steel damper yielded in the 1/200 cycle and the load and drift angle at that time were 68.8
kN and 0.004 rad, respectively.
4.2. Crack Patterns and Failure Modes
As shown in Figure 14a, which is the view after M1 failure, the shear and bond cracks
are more prominent than the flexural cracks. In M1, flexural and shear cracks were ob-
served in the 1/400 cycle. As the drift angle increased further, the number and width of
shear cracks increased. Shear and bond cracks developed significantly with a load of 171.4
kN at a drift angle of 0.0088 rad in the 1/100 cycle, resulting in brittle shear-bond failure.
This is because the short shear span ratio of the coupling beam is very vulnerable to shear
and bond due to lateral forces such as earthquake loads.
Figure 14b shows the appearance at the maximum drift angle of M2 with the pro-
posed R-type steel dampers. Hardly any cracks were observed in the test region and all
deformations were concentrated in the damper. These experimental results confirmed
that the proposed damper performs very well when applied to a structural member.
4.3. Energy Dissipation and Damping Capacities
Figure 16 shows the cumulative energy dissipation area, which is calculated as de-
scribed in Section 3.3, of M1 and M2 for each cycle. M1 and M2 showed a similar cumula-
tive energy dissipation up to a drift angle of 1% and the energy dissipation ability of M1
became lower than that of M2 at a drift angle of 1.3%. Then, where M1 showed structural
failure owing to shear and bond cracks, the energy dissipation capacity of M2 improved
greatly as the drift angle increased. For example, at a drift angle of approximately 3%, the
cumulative energy dissipation capacity of M2 was around 4.5 times higher than that of
M1. These experimental results confirmed that the proposed R-type damper has high en-
ergy dissipation capacity even when applied to structural members.
Figure 17 shows the equivalent damping/attenuation ratio, which is calculated as de-
scribed in Section 3.3, of the Phase II test specimens for each cycle. M1 showed an equiv-
alent damping ratio of approximately 20%, whereas M2 with the proposed R-type damper
showed an equivalent damping ratio of 30.8% in the first cycle with a low degree of de-
formation. As the drift angle increased, this ratio increased continuously up to 48.6%.
These experimental results confirmed the excellent damping ability of the proposed R-
type damper.
Figure 16. Cumulative energy dissipation of Phase II test specimens.
0
5
10
15
20
25
1/400 1/200 1/100 1/75 1/50 1/30
Cu
mu
lati
ve
en
erg
y d
issi
pati
on
(k
Nm
)
Drift angle (rad.)
M1
M2
Figure 16. Cumulative energy dissipation of Phase II test specimens.
Figure 17 shows the equivalent damping/attenuation ratio, which is calculated asdescribed in Section 3.3, of the Phase II test specimens for each cycle. M1 showed anequivalent damping ratio of approximately 20%, whereas M2 with the proposed R-typedamper showed an equivalent damping ratio of 30.8% in the first cycle with a low degreeof deformation. As the drift angle increased, this ratio increased continuously up to48.6%. These experimental results confirmed the excellent damping ability of the proposedR-type damper.
Appl. Sci. 2021, 11, x FOR PEER REVIEW 14 of 16
Figure 17. Equivalent damping ratio of Phase II test specimens.
5. Conclusions
In this study, an R-type steel damper with a simple shape and excellent load re-
sistance and energy dissipation capacities was proposed. A two-phase experimental study
and an analytical study using FE analysis program were conducted to evaluate its struc-
tural performance. In the Phase I test, shear force was applied directly to the damper. In
the Phase II test, the proposed damper was applied to an RC member to verify its struc-
tural performance. Based on the experimental and analytical studies, the following results
were obtained.
(1) The shape of the proposed damper is easy to manufacture and the number and cross-
sectional dimensions of the dampers can be changed freely according to the required
structural performance. Tests of the structural performance of the proposed damper
showed that the strength and stiffness were maintained without decreasing while a
repeated load was applied five times up to the target displacement. In addition, no
buckling was observed until the end of the experiment.
(2) In the proposed damper, the vertical and upper horizontal members are involved in
the ductile behavior and energy dissipation and the lower horizontal member is in-
volved in strength enhancement and energy dissipation. The experimental results of
the angled U-shaped steel damper showed that the strength and initial rigidity of the
proposed R-type steel damper were increased by around 3.5 and 6.4 times, respec-
tively.
(3) In the Phase I test, the energy dissipation capacity of the proposed damper did not
decrease during five repeated loads. In addition, the proposed damper showed an
equivalent damping ratio of up to 53.4%, indicating high damping capacity. Similar
characteristics were observed in the Phase II test. The Specimen M2 with the pro-
posed damper showed an equivalent damping ratio of up to 48.6%, indicating excel-
lent damping ability.
(4) The region in which energy is dissipated in the damper was similar in the FE analyt-
ical and experimental results. Most vertical and lower horizontal members of the pro-
posed damper yielded and showed high strain in the experiment. On the other hand,
the upper horizontal member yielded in some areas but contributed to the stable and
ductile behavior of the damper.
(5) In the Phase II test, an excellent energy dissipation capacity was measured. In the M1
specimen without the damper, excessive cracking and damage occurred because the
RC member resisted the external lateral load. By contrast, the M2 specimen with the
proposed R-type steel dampers showed ductile behavior without strength deteriora-
tion for a drift angle of up to 3% because the damper effectively dissipated the energy
of the external lateral load. Furthermore, hardly any cracks or damage were observed
0
10
20
30
40
50
60
70
1/400 1/200 1/100 1/75 1/50 1/30
Eq
uiv
ale
nt
dam
pin
g r
ati
o (
%)
Drift angle (rad.)
M1
M2
Figure 17. Equivalent damping ratio of Phase II test specimens.
Appl. Sci. 2021, 11, 6404 13 of 14
5. Conclusions
In this study, an R-type steel damper with a simple shape and excellent load resistanceand energy dissipation capacities was proposed. A two-phase experimental study andan analytical study using FE analysis program were conducted to evaluate its structuralperformance. In the Phase I test, shear force was applied directly to the damper. In thePhase II test, the proposed damper was applied to an RC member to verify its structuralperformance. Based on the experimental and analytical studies, the following resultswere obtained.
(1) The shape of the proposed damper is easy to manufacture and the number and cross-sectional dimensions of the dampers can be changed freely according to the requiredstructural performance. Tests of the structural performance of the proposed dampershowed that the strength and stiffness were maintained without decreasing while arepeated load was applied five times up to the target displacement. In addition, nobuckling was observed until the end of the experiment.
(2) In the proposed damper, the vertical and upper horizontal members are involvedin the ductile behavior and energy dissipation and the lower horizontal memberis involved in strength enhancement and energy dissipation. The experimentalresults of the angled U-shaped steel damper showed that the strength and initialrigidity of the proposed R-type steel damper were increased by around 3.5 and6.4 times, respectively.
(3) In the Phase I test, the energy dissipation capacity of the proposed damper did notdecrease during five repeated loads. In addition, the proposed damper showed anequivalent damping ratio of up to 53.4%, indicating high damping capacity. Similarcharacteristics were observed in the Phase II test. The Specimen M2 with the proposeddamper showed an equivalent damping ratio of up to 48.6%, indicating excellentdamping ability.
(4) The region in which energy is dissipated in the damper was similar in the FE ana-lytical and experimental results. Most vertical and lower horizontal members of theproposed damper yielded and showed high strain in the experiment. On the otherhand, the upper horizontal member yielded in some areas but contributed to thestable and ductile behavior of the damper.
(5) In the Phase II test, an excellent energy dissipation capacity was measured. In theM1 specimen without the damper, excessive cracking and damage occurred becausethe RC member resisted the external lateral load. By contrast, the M2 specimenwith the proposed R-type steel dampers showed ductile behavior without strengthdeterioration for a drift angle of up to 3% because the damper effectively dissipatedthe energy of the external lateral load. Furthermore, hardly any cracks or damagewere observed in the M2 specimen. Based on the experimental results, the proposedsteel damper can be applied excellently to structures as an energy dissipating device.
Author Contributions: S.-W.K. and K.-H.K. conceived and performed the experiments and ana-lyzed the data and wrote the paper. All authors have read and agreed to the published version ofthe manuscript.
Funding: This work was supported by the Priority Research Centers Program through the NationalResearch Foundation of Korea (NRF) founded by the Ministry of Education (2019R1A6A1A03032988);this research was supported by Basic Science Research Program through the National ResearchFoundation of Korea (NRF) founded by the Ministry of Education (2018R1A2B3001656).
Institutional Review Board Statement: Not applicable.
Informed Consent Statement: Not applicable.
Data Availability Statement: Not applicable.
Conflicts of Interest: The authors declare no conflict of interest.
Appl. Sci. 2021, 11, 6404 14 of 14
References1. Elnashai, A.S.; Disarno, L. Fundamentals of Earthquake Engineering; Wiley and Sons: Chichester, UK, 2008.2. Whittaker, A.S.; Bertero, V.V.; Thompson, C.L.; Alonso, L.J. Seismic testing of steel plate energy dissipation devices. Earthq. Spectra
1991, 7, 563–604. [CrossRef]3. Shih, M.H.; Sung, W.P. A model for hysteretic behavior of rhombic low yield strength steel added damping and stiffness. Comput.
Struct. 2005, 83, 895–908. [CrossRef]4. Tsai, K.-C.; Chen, H.-W.; Hong, C.-P.; Su, Y.-F. Design of Steel Triangular Plate Energy Absorbers for Seismic-Resistant Construction.
Earthq. Spectra 1993, 9, 505–528. [CrossRef]5. Lee, M.; Lee, J.; Kim, J. Seismic retrofit of structures using steel honeycomb dampers. Int. J. Steel Struct. 2017, 17, 215–229.
[CrossRef]6. Nakashima, M. Strain-Hardening Behavior of Shear Panels Made of Low-Yield Steel. I: Test. J. Struct. Eng. 1995, 121, 1742–1749.
[CrossRef]7. Foti, D.; Diaferio, M.; Nobile, R. Optimal design of a new seismic passive protection device made in aluminium and steel. Struct.
Eng. Mech. 2010, 35, 119–122. [CrossRef]8. Choi, J.; Abebe, D.Y. Hysteresis Characteristics of Shear Panel Damper Using SLY120. APCBEE Procedia 2014, 9, 370–375.
[CrossRef]9. Di Sarno, L.; Manfredi, G. Experimental tests on full-scale RC unretrofitted frame and retrofitted with buckling-restrained braces.
Earthq. Eng. Struct. Dyn. 2012, 41, 315–333. [CrossRef]10. Teruna, D.R.; Majid, T.A.; Budiono, B. The use of steel damper for enhancing the seismic performance of R/C frame with soft first
story. J. Civ. Eng. Res. 2014, 4, 191–202.11. Teruna, D.R.; Majid, T.A.; Budiono, B. Experimental Study of Hysteretic Steel Damper for Energy Dissipation Capacity. Adv. Civ.
Eng. 2015, 2015, 631726. [CrossRef]12. Bagheri, S.; Barghian, M.; Saieri, F.; Farzinfar, A. U-shaped metallic-yielding damper in building structures: Seismic behavior and
comparison with a friction damper. Structures 2015, 3, 163–171. [CrossRef]13. Jamkhaneh, M.E.; Ebrahimi, A.H.; Amiri, M.S. Experimental and Numerical Investigation of Steel Moment Resisting Frame with
U-Shaped Metallic Yielding Damper. Int. J. Steel Struct. 2018, 19, 806–818. [CrossRef]14. Sravya, J.S.; Manchalwar, A. Seismic isolation system using U-shaped steel damper. Int. J. Recent Technol. Eng. 2019, 8,
12336–12339.15. Lee, J.; Kim, J. Development of box-shaped steel slit dampers for seismic retrofit of building structures. Eng. Struct. 2017, 150,
934–946. [CrossRef]16. Shen, X.; Wang, X.; Ye, Q.; Ye, A. Seismic performance of Transverse Steel Damper seismic system for long span bridges. Eng.
Struct. 2017, 141, 14–28. [CrossRef]17. Abebe, D.Y.; Kim, J.W.; Gwak, G.; Choi, J.H. Low-Cycled Hysteresis Characteristics of Circular Hollow Steel Damper Subjected to
Inelastic Behavior. Int. J. Steel Struct. 2018, 19, 157–167. [CrossRef]18. Naeem, A.; Kim, J. Seismic performance evaluation of a multi-slit damper. Eng. Struct. 2019, 189, 332–346. [CrossRef]19. Qiu, C.; Wang, H.; Liu, J.; Qi, J.; Wang, Y. Experimental tests and finite element simulations of a new SMA-steel damper. Smart
Mater. Struct. 2020, 29, 035016. [CrossRef]20. Standard Test Methods for Tension Testing of Metallic Materials; ASTM E8/E8M-21; ASTM International: West Conshohocken, PA,
USA, 2021.21. Chopra, A.K. Dynamics of Structures, Theory and Applications to Earthquake Engineering, 5th ed.; Pearson Education: London, UK,
2017; 960p.22. Web Address of MIDAS-NFX. 2020. Available online: https://kor.midasuser.com/nfx/ (accessed on 11 July 2021).
Copyright © 2022 FDOKUMEN