Structural investigation of KxBa1−xGa2−xGe2+xO8 solid solutions using the X-ray Rietveld method
7
Structural investigation of K x Ba 1x Ga 2x Ge 2+x O 8 solid solutions using the X-ray Rietveld method Ni Qin a, , Marjeta Mac ˇek Krz ˇmanc a , Anton Meden b , Danilo Suvorov a a Advanced Materials Department, Joz ˇef Stefan Institute, Jamova 39, 1000 Ljubljana, Slovenia b Faculty of Chemistry and Chemical Technology, University of Ljubljana, As ˇkerc ˇeva 5, 1000 Ljubljana, Slovenia article info Article history: Received 6 October 2008 Received in revised form 4 March 2009 Accepted 10 March 2009 Available online 20 March 2009 Keywords: LTCC Synthetic feldspar Rietveld structure refinement Phase transition abstract The K x Ba 1x Ga 2x Ge 2+x O 8 (x ¼ 0.61.0) solid solutions undergo a structural phase transition that has a significant effect on their sintering behavior and their microwave dielectric properties. The crystal structures of both phases within the solid-solution region were determined by the Rietveld method using powder X-ray diffraction data. We found that the low-temperature-stable phase is isostructural with the pseudo-orthorhombic KGaGe 3 O 8 (space group P2 1 /a), while the high-temperature-stable phase has a typical monoclinic feldspar structure (space group C2/m). Due to the topological differences between the two structures, the T–O bonds within the tetrahedra must be partially recombined to make a new framework, which causes an endothermic effect during the P2 1 /a to C2/m phase transition. The correlation between the crystal structures, the microwave dielectric properties and the phase-transition behaviors were discussed in terms of the crystallographic features, the lattice parameters, and the strain-induced anisotropic peak-broadening. & 2009 Elsevier Inc. All rights reserved. 1. Introduction Feldspar is an important mineral that makes up a large proportion of the Earth’s crust and is a traditional ingredient in the manufacture of glass. However, recently a novel application of feldspar in low- temperature cofired-ceramic (LTCC) technology, based on its low softening temperature and low manufacturing costs, was reported [1,2]. It was found that the cofiring temperature of commercial LTCC pastes can be lowered to 800–850 1C by introducing a large amount of glass into the dielectric oxides. Unfortunately, however, the advantage of the glass additive is offset by deleterious influences, such as high dielectric losses and a low mechanical strength. In our research group we are currently investigating a material based on the gallogermanate-feldspar. Compared with commercially available materials for LTCC tapes, which are mainly based on aluminosilicate and borosilicate feldspars, the gallogermanate feldspars exhibit rapid crystallization along with more attractive properties, including a low sintering temperature (900 1C), a low permittivity (e r ¼ 57), small temperature coefficients (t f 20 ppm/1C) and, most importantly, a high quality factor (the maximum Q f exceeds 100,000 GHz at 13 GHz) [3,4]. In our previous work [3,4] on the K x Ba 1x Ga 2x Ge 2+x O 8 solid solutions, a reversible phase transition was observed at 840–990 1C depending on the composition (0.6pxp1) and the direction of the phase transition (Table 1). The low-temperature- stable phase (subsequently referred to as the ‘‘low phase’’) that was synthesized and sintered at temperatures below the phase- transition point exhibited a much higher Q f, a smaller e r and a similar t f compared with the high-temperature-stable phase (subsequently referred to as the ‘‘high phase’’). A crystallographic investigation of both phases should provide us with useful information about the correlation between the crystal structure and the microwave dielectric properties, as well as the abnormal aging effect of KGaGe 3 O 8 (corresponding to x ¼ 1), as described in Ref. [4]. Moreover, crystallographic information about K x Ba 1x Ga 2x Ge 2+x O 8 is also of great interest to the mineral-science commu- nity. The K x Ba 1x Ga 2x Ge 2+x O 8 solid solutions lie on the tie-line between KGaGe 3 O 8 and BaGa 2 Ge 2 O 8 . Neither of the end-members can be formed naturally because of the rarity of Ga in the Earth’s crust. So far, most of the investigations on feldspars have concentrated on natural minerals. In contrast, little is known about synthetic feldspars. It was for these reasons that we decided to analyze the crystal structures of K x Ba 1x Ga 2x Ge 2+x O 8 (0.6pxp1) solid solutions, with respect to the phase transition and LTCC applications, by a powder X-ray diffraction (XRD) method based on a Rietveld refinement. The correlation between the crystal structures, the microwave dielectric properties and the phase-transition behaviors were discussed in terms of the crystallographic features, the lattice parameters, and the strain-induced anisotropic peak-broadening (APB). 2. Experimental section Stoichiometric mixtures of reagent-grade powders of K 2 CO 3 (Alfa Aesar 99.997%, dried at 200 1C), BaCO 3 (Alfa Aesar 99.8%), ARTICLE IN PRESS Contents lists available at ScienceDirect journal homepage: www.elsevier.com/locate/jssc Journal of Solid State Chemistry 0022-4596/$ - see front matter & 2009 Elsevier Inc. All rights reserved. doi:10.1016/j.jssc.2009.03.004 Corresponding author. Fax: +386 1477 3875. E-mail address: [email protected] (N. Qin). Journal of Solid State Chemistry 182 (2009) 1666–1672
Transcript of Structural investigation of KxBa1−xGa2−xGe2+xO8 solid solutions using the X-ray Rietveld method
ARTICLE IN PRESS
Journal of Solid State Chemistry 182 (2009) 1666–1672
Contents lists available at ScienceDirect
Journal of Solid State Chemistry
0022-45
doi:10.1
� Corr
E-m
journal homepage: www.elsevier.com/locate/jssc
Structural investigation of KxBa1�xGa2�xGe2+xO8 solid solutions using theX-ray Rietveld method
Ni Qin a,�, Marjeta Macek Krzmanc a, Anton Meden b, Danilo Suvorov a
a Advanced Materials Department, Jozef Stefan Institute, Jamova 39, 1000 Ljubljana, Sloveniab Faculty of Chemistry and Chemical Technology, University of Ljubljana, Askerceva 5, 1000 Ljubljana, Slovenia
a r t i c l e i n f o
Article history:
Received 6 October 2008
Received in revised form
4 March 2009
Accepted 10 March 2009Available online 20 March 2009
Keywords:
LTCC
Synthetic feldspar
Rietveld structure refinement
Phase transition
96/$ - see front matter & 2009 Elsevier Inc. A
016/j.jssc.2009.03.004
esponding author. Fax: +386 1477 3875.
ail address: [email protected] (N. Qin).
a b s t r a c t
The KxBa1�xGa2�xGe2+xO8 (x ¼ 0.6�1.0) solid solutions undergo a structural phase transition that has a
significant effect on their sintering behavior and their microwave dielectric properties. The crystal
structures of both phases within the solid-solution region were determined by the Rietveld method
using powder X-ray diffraction data. We found that the low-temperature-stable phase is isostructural
with the pseudo-orthorhombic KGaGe3O8 (space group P21/a), while the high-temperature-stable phase
has a typical monoclinic feldspar structure (space group C2/m). Due to the topological differences
between the two structures, the T–O bonds within the tetrahedra must be partially recombined to make
a new framework, which causes an endothermic effect during the P21/a to C2/m phase transition. The
correlation between the crystal structures, the microwave dielectric properties and the phase-transition
behaviors were discussed in terms of the crystallographic features, the lattice parameters, and the
strain-induced anisotropic peak-broadening.
& 2009 Elsevier Inc. All rights reserved.
1. Introduction
Feldspar is an important mineral that makes up a large proportionof the Earth’s crust and is a traditional ingredient in the manufactureof glass. However, recently a novel application of feldspar in low-temperature cofired-ceramic (LTCC) technology, based on its lowsoftening temperature and low manufacturing costs, was reported[1,2]. It was found that the cofiring temperature of commercial LTCCpastes can be lowered to 800–850 1C by introducing a large amountof glass into the dielectric oxides. Unfortunately, however, theadvantage of the glass additive is offset by deleterious influences,such as high dielectric losses and a low mechanical strength. In ourresearch group we are currently investigating a material based on thegallogermanate-feldspar. Compared with commercially availablematerials for LTCC tapes, which are mainly based on aluminosilicateand borosilicate feldspars, the gallogermanate feldspars exhibit rapidcrystallization along with more attractive properties, including a lowsintering temperature (�900 1C), a low permittivity (er ¼ 5�7), smalltemperature coefficients (tf � �20 ppm/1C) and, most importantly, ahigh quality factor (the maximum Q� f exceeds 100,000 GHz at�13 GHz) [3,4].
In our previous work [3,4] on the KxBa1�xGa2�xGe2+xO8 solidsolutions, a reversible phase transition was observed at840–990 1C depending on the composition (0.6pxp1) and thedirection of the phase transition (Table 1). The low-temperature-stable phase (subsequently referred to as the ‘‘low phase’’) that
ll rights reserved.
was synthesized and sintered at temperatures below the phase-transition point exhibited a much higher Q� f, a smaller er
and a similar tf compared with the high-temperature-stable phase(subsequently referred to as the ‘‘high phase’’). A crystallographicinvestigation of both phases should provide us with usefulinformation about the correlation between the crystal structure andthe microwave dielectric properties, as well as the abnormal agingeffect of KGaGe3O8 (corresponding to x ¼ 1), as described in Ref. [4].
Moreover, crystallographic information about KxBa1�xGa2�x
Ge2+xO8 is also of great interest to the mineral-science commu-nity. The KxBa1�xGa2�xGe2+xO8 solid solutions lie on the tie-linebetween KGaGe3O8 and BaGa2Ge2O8. Neither of the end-memberscan be formed naturally because of the rarity of Ga in the Earth’scrust. So far, most of the investigations on feldspars haveconcentrated on natural minerals. In contrast, little is knownabout synthetic feldspars.
It was for these reasons that we decided to analyze the crystalstructures of KxBa1�xGa2�xGe2+xO8 (0.6pxp1) solid solutions, withrespect to the phase transition and LTCC applications, by a powderX-ray diffraction (XRD) method based on a Rietveld refinement. Thecorrelation between the crystal structures, the microwave dielectricproperties and the phase-transition behaviors were discussed interms of the crystallographic features, the lattice parameters, andthe strain-induced anisotropic peak-broadening (APB).
2. Experimental section
Stoichiometric mixtures of reagent-grade powders of K2CO3
(Alfa Aesar 99.997%, dried at 200 1C), BaCO3 (Alfa Aesar 99.8%),
ARTICLE IN PRESS
Table 2Lattice parameters and selected details of the structural refinement of the
KxBa1�xGa2�xGe2+xO8 solid solutions.
X 1 0.9 0.67 0.6 1 0.9
Space group P21/a P21/a P21/a P21/a C2/m C2/m
a (A) 9.4902 9.4684 9.4277 9.4172 8.8675 8.8613
b (A) 9.8943 9.8936 9.8927 9.8904 13.6401 13.6318
c (A) 8.7228 8.7319 8.7496 8.7536 7.4928 7.4921
b (1) 89.998 89.996 89.996 89.998 115.916 115.741
V (A3) 819.06 817.97 816.04 815.30 815.14 815.20
Z 4 4 4 4 4 4
POa Yes Yes Yes Yes No No
APBb No No No No Yes Yes
Rexp 1.18 1.28 1.21 1.22 1.18 1.24
Rwp 6.78 5.03 4.37 4.72 9.15 7.28
Rp 4.86 3.78 3.25 3.48 6.54 5.27
The square root of the residual variants are smaller than 1 at the last decimal place
and are therefore unpresented in the manuscript.a PO: SH correction for preferred orientation.b APB: SH correction for anisotropic peak-broadening.
Table 1The lowest temperature for the P21/a)C2/m transition to occur (TP-C), the
annealing temperature for the C2/m) P21/a transition to yield the fastest kinetics
(TC-P) and the melting point (Tm) of the KxBa1�xGa2�xGe2+xO8 solid solutions
(0.6pxp1).
Composition x TP-C (1C) TC-P (1C) Tm (1C)
1 900 840 1005
0.9 920 860 1056
0.67 980 900 1158
0.6 990 940 1170
N. Qin et al. / Journal of Solid State Chemistry 182 (2009) 1666–1672 1667
Ga2O3 (Alfa Aesar 99.99%) and GeO2 (Alfa Aesar 99.999%) werefired at 950–1020 1C to yield a high-phase regime. The low-phasepowders were obtained by prolonged annealing of the high phaseat 840–860 1C for up to 100 h. (Details of the kinetic study on thephase transition were reported previously in a related study [4].)The powders were ground with acetone in an agate mortar andfiltered with a 15mm mesh screen before drying at 200 1C.
The XRD data for the Rietveld refinement were collected atroom temperature in reflection y–2y geometry on an X’pert PROMPD diffractometer (PANalytical B.V., Almelo, the Netherlands)with an incident beam monochromator for pure CuKa1 radiation.Primary and secondary Soller slits of 0.02 rad, vertical mask of10 mm and variable divergence and antiscatter slits were used, sothat a constant area of 10�10 mm of sample was irradiatedthroughout the measurement. Full measuring range of a 128-channel linear multi-strip X’Celerator detector was applied to scanthe range from 51 to 1401 2y in steps of 0.0171 with an effectivetime per step of 2000 s. Total collection time was about 34 h.
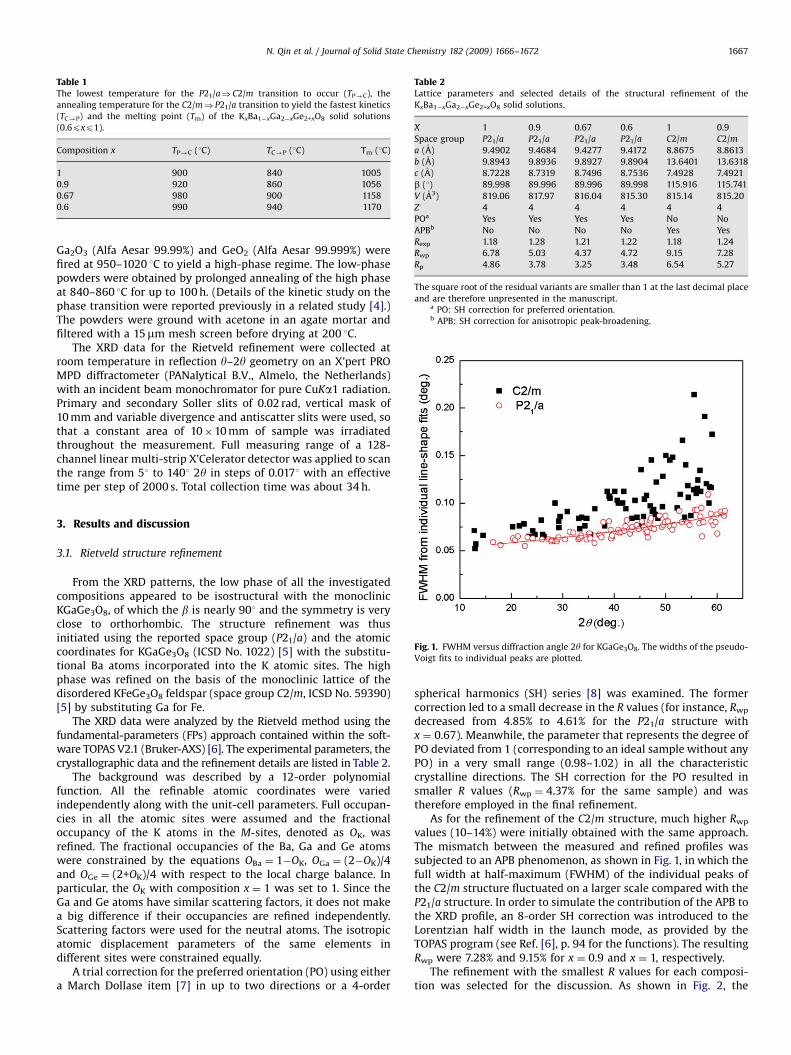
Fig. 1. FWHM versus diffraction angle 2y for KGaGe3O8. The widths of the pseudo-
Voigt fits to individual peaks are plotted.
3. Results and discussion
3.1. Rietveld structure refinement
From the XRD patterns, the low phase of all the investigatedcompositions appeared to be isostructural with the monoclinicKGaGe3O8, of which the b is nearly 901 and the symmetry is veryclose to orthorhombic. The structure refinement was thusinitiated using the reported space group (P21/a) and the atomiccoordinates for KGaGe3O8 (ICSD No. 1022) [5] with the substitu-tional Ba atoms incorporated into the K atomic sites. The highphase was refined on the basis of the monoclinic lattice of thedisordered KFeGe3O8 feldspar (space group C2/m, ICSD No. 59390)[5] by substituting Ga for Fe.
The XRD data were analyzed by the Rietveld method using thefundamental-parameters (FPs) approach contained within the soft-ware TOPAS V2.1 (Bruker-AXS) [6]. The experimental parameters, thecrystallographic data and the refinement details are listed in Table 2.
The background was described by a 12-order polynomialfunction. All the refinable atomic coordinates were variedindependently along with the unit-cell parameters. Full occupan-cies in all the atomic sites were assumed and the fractionaloccupancy of the K atoms in the M-sites, denoted as OK, wasrefined. The fractional occupancies of the Ba, Ga and Ge atomswere constrained by the equations OBa ¼ 1�OK, OGa ¼ (2�OK)/4and OGe ¼ (2+OK)/4 with respect to the local charge balance. Inparticular, the OK with composition x ¼ 1 was set to 1. Since theGa and Ge atoms have similar scattering factors, it does not makea big difference if their occupancies are refined independently.Scattering factors were used for the neutral atoms. The isotropicatomic displacement parameters of the same elements indifferent sites were constrained equally.
A trial correction for the preferred orientation (PO) using eithera March Dollase item [7] in up to two directions or a 4-order
spherical harmonics (SH) series [8] was examined. The formercorrection led to a small decrease in the R values (for instance, Rwp
decreased from 4.85% to 4.61% for the P21/a structure withx ¼ 0.67). Meanwhile, the parameter that represents the degree ofPO deviated from 1 (corresponding to an ideal sample without anyPO) in a very small range (0.98–1.02) in all the characteristiccrystalline directions. The SH correction for the PO resulted insmaller R values (Rwp ¼ 4.37% for the same sample) and wastherefore employed in the final refinement.
As for the refinement of the C2/m structure, much higher Rwp
values (10–14%) were initially obtained with the same approach.The mismatch between the measured and refined profiles wassubjected to an APB phenomenon, as shown in Fig. 1, in which thefull width at half-maximum (FWHM) of the individual peaks ofthe C2/m structure fluctuated on a larger scale compared with theP21/a structure. In order to simulate the contribution of the APB tothe XRD profile, an 8-order SH correction was introduced to theLorentzian half width in the launch mode, as provided by theTOPAS program (see Ref. [6], p. 94 for the functions). The resultingRwp were 7.28% and 9.15% for x ¼ 0.9 and x ¼ 1, respectively.
The refinement with the smallest R values for each composi-tion was selected for the discussion. As shown in Fig. 2, the
ARTICLE IN PRESS
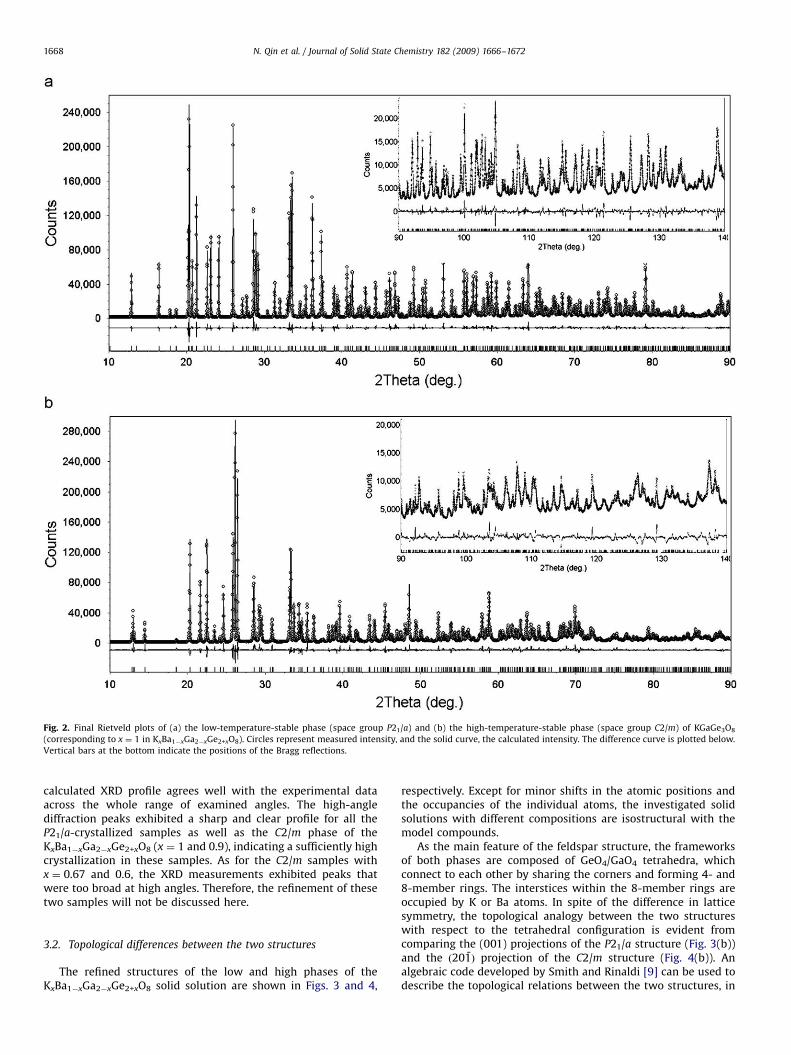
Fig. 2. Final Rietveld plots of (a) the low-temperature-stable phase (space group P21/a) and (b) the high-temperature-stable phase (space group C2/m) of KGaGe3O8
(corresponding to x ¼ 1 in KxBa1�xGa2�xGe2+xO8). Circles represent measured intensity, and the solid curve, the calculated intensity. The difference curve is plotted below.
Vertical bars at the bottom indicate the positions of the Bragg reflections.
N. Qin et al. / Journal of Solid State Chemistry 182 (2009) 1666–16721668
calculated XRD profile agrees well with the experimental dataacross the whole range of examined angles. The high-anglediffraction peaks exhibited a sharp and clear profile for all theP21/a-crystallized samples as well as the C2/m phase of theKxBa1�xGa2�xGe2+xO8 (x ¼ 1 and 0.9), indicating a sufficiently highcrystallization in these samples. As for the C2/m samples withx ¼ 0.67 and 0.6, the XRD measurements exhibited peaks thatwere too broad at high angles. Therefore, the refinement of thesetwo samples will not be discussed here.
3.2. Topological differences between the two structures
The refined structures of the low and high phases of theKxBa1�xGa2�xGe2+xO8 solid solution are shown in Figs. 3 and 4,
respectively. Except for minor shifts in the atomic positions andthe occupancies of the individual atoms, the investigated solidsolutions with different compositions are isostructural with themodel compounds.
As the main feature of the feldspar structure, the frameworksof both phases are composed of GeO4/GaO4 tetrahedra, whichconnect to each other by sharing the corners and forming 4- and8-member rings. The interstices within the 8-member rings areoccupied by K or Ba atoms. In spite of the difference in latticesymmetry, the topological analogy between the two structureswith respect to the tetrahedral configuration is evident fromcomparing the (001) projections of the P21/a structure (Fig. 3(b))and the ð201Þ projection of the C2/m structure (Fig. 4(b)). Analgebraic code developed by Smith and Rinaldi [9] can be used todescribe the topological relations between the two structures, in
ARTICLE IN PRESS
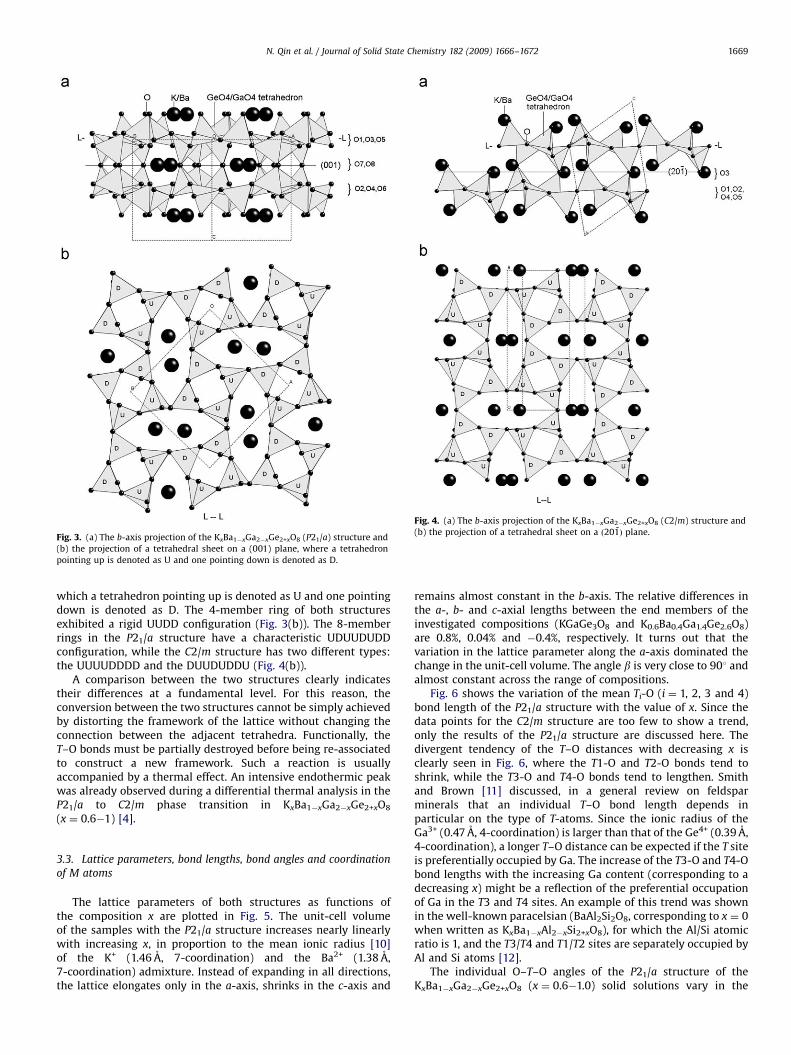
Fig. 3. (a) The b-axis projection of the KxBa1�xGa2�xGe2+xO8 (P21/a) structure and
(b) the projection of a tetrahedral sheet on a (001) plane, where a tetrahedron
pointing up is denoted as U and one pointing down is denoted as D.
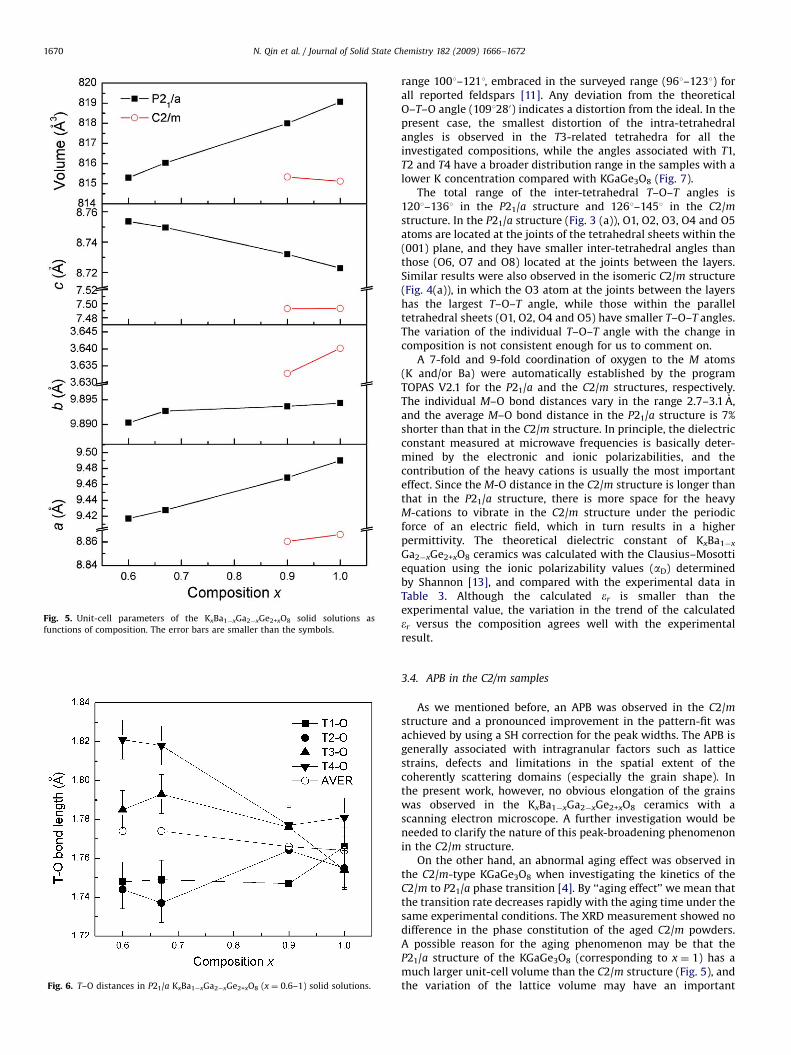
Fig. 4. (a) The b-axis projection of the KxBa1�xGa2�xGe2+xO8 (C2/m) structure and
(b) the projection of a tetrahedral sheet on a ð201Þ plane.
N. Qin et al. / Journal of Solid State Chemistry 182 (2009) 1666–1672 1669
which a tetrahedron pointing up is denoted as U and one pointingdown is denoted as D. The 4-member ring of both structuresexhibited a rigid UUDD configuration (Fig. 3(b)). The 8-memberrings in the P21/a structure have a characteristic UDUUDUDDconfiguration, while the C2/m structure has two different types:the UUUUDDDD and the DUUDUDDU (Fig. 4(b)).
A comparison between the two structures clearly indicatestheir differences at a fundamental level. For this reason, theconversion between the two structures cannot be simply achievedby distorting the framework of the lattice without changing theconnection between the adjacent tetrahedra. Functionally, theT–O bonds must be partially destroyed before being re-associatedto construct a new framework. Such a reaction is usuallyaccompanied by a thermal effect. An intensive endothermic peakwas already observed during a differential thermal analysis in theP21/a to C2/m phase transition in KxBa1�xGa2�xGe2+xO8
(x ¼ 0.6�1) [4].
3.3. Lattice parameters, bond lengths, bond angles and coordination
of M atoms
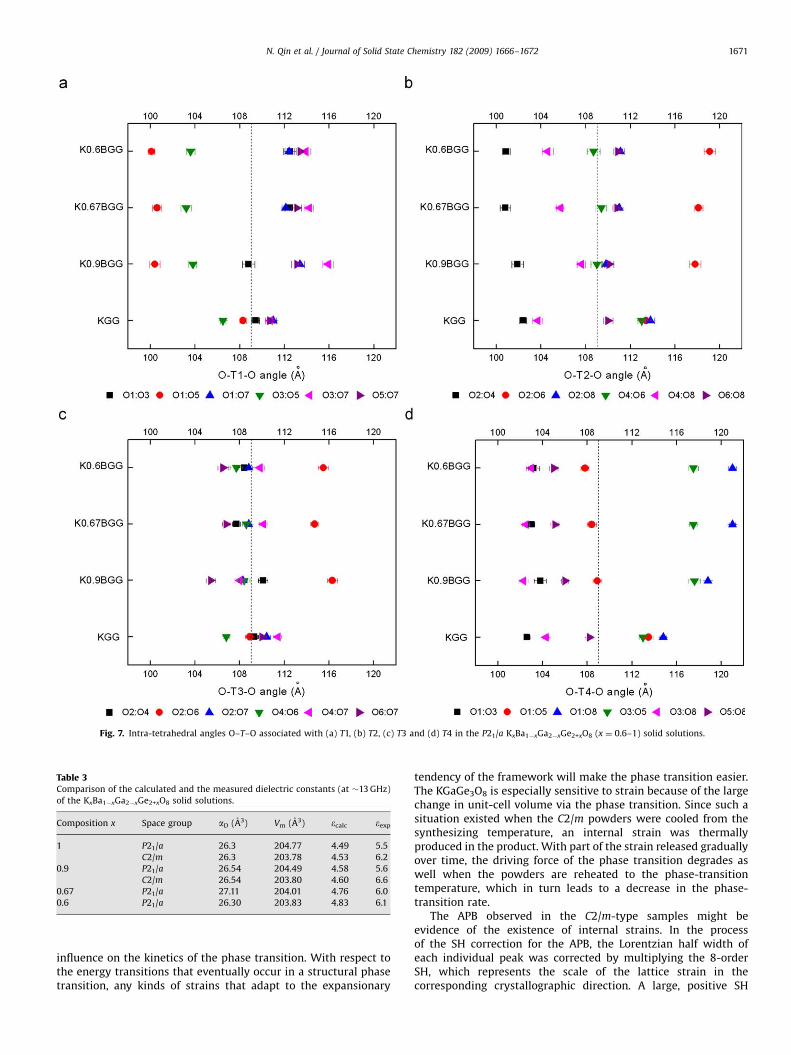
The lattice parameters of both structures as functions ofthe composition x are plotted in Fig. 5. The unit-cell volumeof the samples with the P21/a structure increases nearly linearlywith increasing x, in proportion to the mean ionic radius [10]of the K+ (1.46 A, 7-coordination) and the Ba2+ (1.38 A,7-coordination) admixture. Instead of expanding in all directions,the lattice elongates only in the a-axis, shrinks in the c-axis and
remains almost constant in the b-axis. The relative differences inthe a-, b- and c-axial lengths between the end members of theinvestigated compositions (KGaGe3O8 and K0.6Ba0.4Ga1.4Ge2.6O8)are 0.8%, 0.04% and �0.4%, respectively. It turns out that thevariation in the lattice parameter along the a-axis dominated thechange in the unit-cell volume. The angle b is very close to 901 andalmost constant across the range of compositions.
Fig. 6 shows the variation of the mean Ti-O (i ¼ 1, 2, 3 and 4)bond length of the P21/a structure with the value of x. Since thedata points for the C2/m structure are too few to show a trend,only the results of the P21/a structure are discussed here. Thedivergent tendency of the T–O distances with decreasing x isclearly seen in Fig. 6, where the T1-O and T2-O bonds tend toshrink, while the T3-O and T4-O bonds tend to lengthen. Smithand Brown [11] discussed, in a general review on feldsparminerals that an individual T–O bond length depends inparticular on the type of T-atoms. Since the ionic radius of theGa3+ (0.47 A, 4-coordination) is larger than that of the Ge4+ (0.39 A,4-coordination), a longer T–O distance can be expected if the T siteis preferentially occupied by Ga. The increase of the T3-O and T4-Obond lengths with the increasing Ga content (corresponding to adecreasing x) might be a reflection of the preferential occupationof Ga in the T3 and T4 sites. An example of this trend was shownin the well-known paracelsian (BaAl2Si2O8, corresponding to x ¼ 0when written as KxBa1�xAl2�xSi2+xO8), for which the Al/Si atomicratio is 1, and the T3/T4 and T1/T2 sites are separately occupied byAl and Si atoms [12].
The individual O–T–O angles of the P21/a structure of theKxBa1�xGa2�xGe2+xO8 (x ¼ 0.6�1.0) solid solutions vary in the
ARTICLE IN PRESS
Fig. 5. Unit-cell parameters of the KxBa1�xGa2�xGe2+xO8 solid solutions as
functions of composition. The error bars are smaller than the symbols.
Fig. 6. T–O distances in P21/a KxBa1�xGa2�xGe2+xO8 (x ¼ 0.6–1) solid solutions.
N. Qin et al. / Journal of Solid State Chemistry 182 (2009) 1666–16721670
range 1001–1211, embraced in the surveyed range (961–1231) forall reported feldspars [11]. Any deviation from the theoreticalO–T–O angle (1091280) indicates a distortion from the ideal. In thepresent case, the smallest distortion of the intra-tetrahedralangles is observed in the T3-related tetrahedra for all theinvestigated compositions, while the angles associated with T1,T2 and T4 have a broader distribution range in the samples with alower K concentration compared with KGaGe3O8 (Fig. 7).
The total range of the inter-tetrahedral T–O–T angles is1201–1361 in the P21/a structure and 1261–1451 in the C2/mstructure. In the P21/a structure (Fig. 3 (a)), O1, O2, O3, O4 and O5atoms are located at the joints of the tetrahedral sheets within the(001) plane, and they have smaller inter-tetrahedral angles thanthose (O6, O7 and O8) located at the joints between the layers.Similar results were also observed in the isomeric C2/m structure(Fig. 4(a)), in which the O3 atom at the joints between the layershas the largest T–O–T angle, while those within the paralleltetrahedral sheets (O1, O2, O4 and O5) have smaller T–O–T angles.The variation of the individual T–O–T angle with the change incomposition is not consistent enough for us to comment on.
A 7-fold and 9-fold coordination of oxygen to the M atoms(K and/or Ba) were automatically established by the programTOPAS V2.1 for the P21/a and the C2/m structures, respectively.The individual M–O bond distances vary in the range 2.7–3.1 A,and the average M–O bond distance in the P21/a structure is 7%shorter than that in the C2/m structure. In principle, the dielectricconstant measured at microwave frequencies is basically deter-mined by the electronic and ionic polarizabilities, and thecontribution of the heavy cations is usually the most importanteffect. Since the M-O distance in the C2/m structure is longer thanthat in the P21/a structure, there is more space for the heavyM-cations to vibrate in the C2/m structure under the periodicforce of an electric field, which in turn results in a higherpermittivity. The theoretical dielectric constant of KxBa1�x
Ga2�xGe2+xO8 ceramics was calculated with the Clausius–Mosottiequation using the ionic polarizability values (aD) determinedby Shannon [13], and compared with the experimental data inTable 3. Although the calculated er is smaller than theexperimental value, the variation in the trend of the calculateder versus the composition agrees well with the experimentalresult.
3.4. APB in the C2/m samples
As we mentioned before, an APB was observed in the C2/mstructure and a pronounced improvement in the pattern-fit wasachieved by using a SH correction for the peak widths. The APB isgenerally associated with intragranular factors such as latticestrains, defects and limitations in the spatial extent of thecoherently scattering domains (especially the grain shape). Inthe present work, however, no obvious elongation of the grainswas observed in the KxBa1�xGa2�xGe2+xO8 ceramics with ascanning electron microscope. A further investigation would beneeded to clarify the nature of this peak-broadening phenomenonin the C2/m structure.
On the other hand, an abnormal aging effect was observed inthe C2/m-type KGaGe3O8 when investigating the kinetics of theC2/m to P21/a phase transition [4]. By ‘‘aging effect’’ we mean thatthe transition rate decreases rapidly with the aging time under thesame experimental conditions. The XRD measurement showed nodifference in the phase constitution of the aged C2/m powders.A possible reason for the aging phenomenon may be that theP21/a structure of the KGaGe3O8 (corresponding to x ¼ 1) has amuch larger unit-cell volume than the C2/m structure (Fig. 5), andthe variation of the lattice volume may have an important
ARTICLE IN PRESS
Fig. 7. Intra-tetrahedral angles O–T–O associated with (a) T1, (b) T2, (c) T3 and (d) T4 in the P21/a KxBa1�xGa2�xGe2+xO8 (x ¼ 0.6–1) solid solutions.
Table 3Comparison of the calculated and the measured dielectric constants (at �13 GHz)
of the KxBa1�xGa2�xGe2+xO8 solid solutions.
Composition x Space group aD (A3) Vm (A3) ecalc eexp
1 P21/a 26.3 204.77 4.49 5.5
C2/m 26.3 203.78 4.53 6.2
0.9 P21/a 26.54 204.49 4.58 5.6
C2/m 26.54 203.80 4.60 6.6
0.67 P21/a 27.11 204.01 4.76 6.0
0.6 P21/a 26.30 203.83 4.83 6.1
N. Qin et al. / Journal of Solid State Chemistry 182 (2009) 1666–1672 1671
influence on the kinetics of the phase transition. With respect tothe energy transitions that eventually occur in a structural phasetransition, any kinds of strains that adapt to the expansionary
tendency of the framework will make the phase transition easier.The KGaGe3O8 is especially sensitive to strain because of the largechange in unit-cell volume via the phase transition. Since such asituation existed when the C2/m powders were cooled from thesynthesizing temperature, an internal strain was thermallyproduced in the product. With part of the strain released graduallyover time, the driving force of the phase transition degrades aswell when the powders are reheated to the phase-transitiontemperature, which in turn leads to a decrease in the phase-transition rate.
The APB observed in the C2/m-type samples might beevidence of the existence of internal strains. In the processof the SH correction for the APB, the Lorentzian half width ofeach individual peak was corrected by multiplying the 8-orderSH, which represents the scale of the lattice strain in thecorresponding crystallographic direction. A large, positive SH
ARTICLE IN PRESS
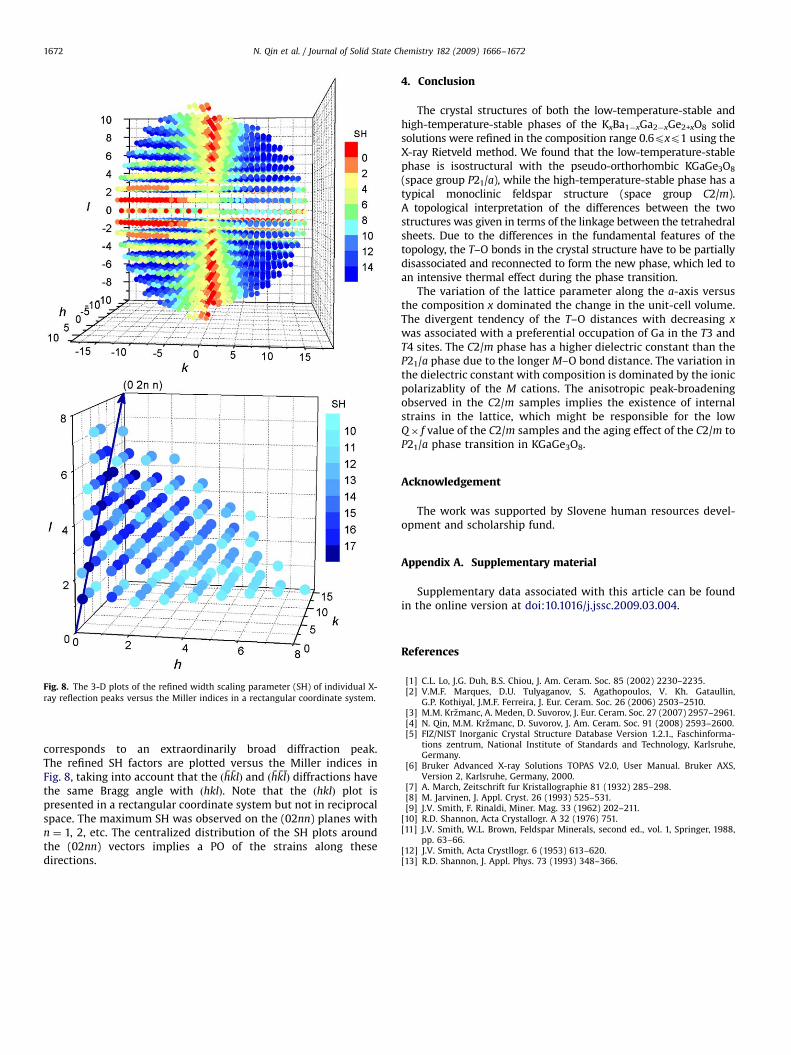
Fig. 8. The 3-D plots of the refined width scaling parameter (SH) of individual X-
ray reflection peaks versus the Miller indices in a rectangular coordinate system.
N. Qin et al. / Journal of Solid State Chemistry 182 (2009) 1666–16721672
corresponds to an extraordinarily broad diffraction peak.The refined SH factors are plotted versus the Miller indices inFig. 8, taking into account that the ðhklÞ and ðhklÞ diffractions havethe same Bragg angle with ðhklÞ. Note that the ðhklÞ plot ispresented in a rectangular coordinate system but not in reciprocalspace. The maximum SH was observed on the (02nn) planes withn ¼ 1, 2, etc. The centralized distribution of the SH plots aroundthe (02nn) vectors implies a PO of the strains along thesedirections.
4. Conclusion
The crystal structures of both the low-temperature-stable andhigh-temperature-stable phases of the KxBa1�xGa2�xGe2+xO8 solidsolutions were refined in the composition range 0.6pxp1 using theX-ray Rietveld method. We found that the low-temperature-stablephase is isostructural with the pseudo-orthorhombic KGaGe3O8
(space group P21/a), while the high-temperature-stable phase has atypical monoclinic feldspar structure (space group C2/m).A topological interpretation of the differences between the twostructures was given in terms of the linkage between the tetrahedralsheets. Due to the differences in the fundamental features of thetopology, the T–O bonds in the crystal structure have to be partiallydisassociated and reconnected to form the new phase, which led toan intensive thermal effect during the phase transition.
The variation of the lattice parameter along the a-axis versusthe composition x dominated the change in the unit-cell volume.The divergent tendency of the T–O distances with decreasing x
was associated with a preferential occupation of Ga in the T3 andT4 sites. The C2/m phase has a higher dielectric constant than theP21/a phase due to the longer M–O bond distance. The variation inthe dielectric constant with composition is dominated by the ionicpolarizablity of the M cations. The anisotropic peak-broadeningobserved in the C2/m samples implies the existence of internalstrains in the lattice, which might be responsible for the lowQ� f value of the C2/m samples and the aging effect of the C2/m toP21/a phase transition in KGaGe3O8.
Acknowledgement
The work was supported by Slovene human resources devel-opment and scholarship fund.
Appendix A. Supplementary material
Supplementary data associated with this article can be foundin the online version at doi:10.1016/j.jssc.2009.03.004.
References
[1] C.L. Lo, J.G. Duh, B.S. Chiou, J. Am. Ceram. Soc. 85 (2002) 2230–2235.[2] V.M.F. Marques, D.U. Tulyaganov, S. Agathopoulos, V. Kh. Gataullin,
G.P. Kothiyal, J.M.F. Ferreira, J. Eur. Ceram. Soc. 26 (2006) 2503–2510.[3] M.M. Krzmanc, A. Meden, D. Suvorov, J. Eur. Ceram. Soc. 27 (2007) 2957–2961.[4] N. Qin, M.M. Krzmanc, D. Suvorov, J. Am. Ceram. Soc. 91 (2008) 2593–2600.[5] FIZ/NIST Inorganic Crystal Structure Database Version 1.2.1., Faschinforma-
tions zentrum, National Institute of Standards and Technology, Karlsruhe,Germany.
[6] Bruker Advanced X-ray Solutions TOPAS V2.0, User Manual. Bruker AXS,Version 2, Karlsruhe, Germany, 2000.
[7] A. March, Zeitschrift fur Kristallographie 81 (1932) 285–298.[8] M. Jarvinen, J. Appl. Cryst. 26 (1993) 525–531.[9] J.V. Smith, F. Rinaldi, Miner. Mag. 33 (1962) 202–211.
[10] R.D. Shannon, Acta Crystallogr. A 32 (1976) 751.[11] J.V. Smith, W.L. Brown, Feldspar Minerals, second ed., vol. 1, Springer, 1988,
pp. 63–66.[12] J.V. Smith, Acta Crystllogr. 6 (1953) 613–620.[13] R.D. Shannon, J. Appl. Phys. 73 (1993) 348–366.