Structural Damage Detection Using LS-‐SVM Based on a New Combinational Kernel Function
21
1 Structural Damage Detection Using LSSVM Based on a New Combinational Kernel Function Abstract Detecting the structural damages and extending the life of structures can be achieved by utilizing smart materials, intelligent systems and Structural Health Monitoring (SHM). In this study, structural damage detection is performed using Least Square Support Vector Machines (LSSMVs) based on a new combinational kernel. Thin Plate Spline LittlewoodPaley Wavelet (TPSLPW) kernel function introduced in this paper is a novel combinational kernel function, which combines Thin Plate Spline Radial Basis Function (RBF) kernel with local characteristics and a modified LittlewoodPaley Wavelet kernel function with global characteristics. During the process of structural damage detection, a Social Harmony Search (SHS) algorithm optimizes the parameters of LSSVM and the TPSLPW kernel. The results obtained by this method are compared with LSSVM based on the other combinational and conventional kernels. These results show that the accuracy of damage detection based on LSSVM with TPSLPW kernel is higher than the other methods based on the conventional kernels under the same conditions. In comparison with other combinational kernels, LSSVM with TPSLPW kernel possesses a better dissemination and learning ability by incorporating the advantages of RBF kernel and wavelet kernel functions. Keywords: damage detection; combinational kernel; least square support vector machine; thin plate spline LittlewoodPaley wavelet; social harmony search algorithm 1 Introduction Civil structures are inevitable to suffer the environmental corrosion, longterm fatigue effects, natural disasters, and the damage accumulates during long service periods. Therefore, intelligent health monitoring and damage detection for structures have become an important area of research with viable applications 1,2 . Detection and prediction of the structural damages are necessary for the monitoring of structural health and preventing the structural failures. The structural damages are usually detected by the dynamic characteristics of the structure, such as frequencies, mode shapes and frequencydomain transfer function is an important method for structural damage detection. Recently, numerous advanced techniques and intelligent methods, such as digital filter technology 3 , wavelet transform (WT) analysis 4,5 , artificial neural networks (ANNs) 6 , support vector machine (SVM) 7,8 and particle swarm optimization (PSO) 9,10 have been introduced to detect the structure’s global and local damage information, and to optimize the SHM system. Despite the fact that the neural networks have many advantages, the traditional neural network approaches have limitations for a boarder applications in SHM, which given rise to models that can overfit to the training data. This limitation is usually due to the optimization algorithms used in ANNs for the selection of parameters and the statistical measures used to select the model. Recently, Support Vector Machine (SVM) based on VapnikChervonenkis (VC) theory and Structural Risk Minimization Principle has been presented 11 . This method promises to overcome the conditional neural networks shortcomings such as the local minimizing and inadequate statistical capabilities. The SVM is especially
Transcript of Structural Damage Detection Using LS-‐SVM Based on a New Combinational Kernel Function

1
Structural Damage Detection Using LS-‐SVM Based on a New Combinational
Kernel Function
Abstract
Detecting the structural damages and extending the life of structures can be achieved by utilizing smart materials, intelligent systems and Structural Health Monitoring (SHM). In this study, structural damage detection is performed using Least Square Support Vector Machines (LS-‐SMVs) based on a new combinational kernel. Thin Plate Spline Littlewood-‐Paley Wavelet (TPSLPW) kernel function introduced in this paper is a novel combinational kernel function, which combines Thin Plate Spline Radial Basis Function (RBF) kernel with local characteristics and a modified Littlewood-‐Paley Wavelet kernel function with global characteristics. During the process of structural damage detection, a Social Harmony Search (SHS) algorithm optimizes the parameters of LS-‐SVM and the TPSLPW kernel. The results obtained by this method are compared with LS-‐SVM based on the other combinational and conventional kernels. These results show that the accuracy of damage detection based on LS-‐SVM with TPSLPW kernel is higher than the other methods based on the conventional kernels under the same conditions. In comparison with other combinational kernels, LS-‐SVM with TPSLPW kernel possesses a better dissemination and learning ability by incorporating the advantages of RBF kernel and wavelet kernel functions.
Keywords: damage detection; combinational kernel; least square support vector machine; thin plate spline Littlewood-‐Paley wavelet; social harmony search algorithm
1-‐ Introduction
Civil structures are inevitable to suffer the environmental corrosion, long-‐term fatigue effects, natural disasters, and the damage accumulates during long service periods. Therefore, intelligent health monitoring and damage detection for structures have become an important area of research with viable applications 1,2. Detection and prediction of the structural damages are necessary for the monitoring of structural health and preventing the structural failures. The structural damages are usually detected by the dynamic characteristics of the structure, such as frequencies, mode shapes and frequency-‐domain transfer function is an important method for structural damage detection.
Recently, numerous advanced techniques and intelligent methods, such as digital filter technology3, wavelet transform (WT) analysis 4,5, artificial neural networks (ANNs)6, support vector machine (SVM)7,8 and particle swarm optimization (PSO)9,10 have been introduced to detect the structure’s global and local damage information, and to optimize the SHM system.
Despite the fact that the neural networks have many advantages, the traditional neural network approaches have limitations for a boarder applications in SHM, which given rise to models that can overfit to the training data. This limitation is usually due to the optimization algorithms used in ANNs for the selection of parameters and the statistical measures used to select the model. Recently, Support Vector Machine (SVM) based on Vapnik-‐Chervonenkis (VC) theory and Structural Risk Minimization Principle has been presented11. This method promises to overcome the conditional neural networks shortcomings such as the local minimizing and inadequate statistical capabilities. The SVM is especially

2
suited in the case of small size samples11. A recent thorough review of literature on this subject indicates that the research on damage detection based on SVM has become a rapidly growing area in structural health monitoring 7,8. The SVM is employed to enhance the speed and the accuracy of damage detection and realizing the smart systems for damage detection.
So far, the theoretical studies on SVM have focused on the following three aspects 12: (1) Improving the classical algorithms of SVM to enhance the calculation speed, (2) Studying the kernel functions of SVM, and (3) Predigesting the decision-‐making functions of SVM. The selection and the construction of kernel functions greatly influences the performance of SVM, and the limited theoretical and analytical work have been conducted in this regard. Therefore, one of the major challenges in the utilization of SVM is the choice of proper Kernel Functions13.
Song et al. 14 presented a ComKer kernel which combines the Gaussian RBF kernel with the linear kernel function. Xie 15 utilized a mixed kernel that combines RBF kernel and polynomial kernel for damage detection of smart composite laminated plates and the results demonstrated that the accuracy of damage detection based on LS-‐SVM with a mixed kernel is higher than those based on LS-‐SVM with RBF kernel under the same low-‐velocity impact loading.
Wavelet is a powerful technique in the applied mathematics, which has also been utilized extensively in structural health monitoring 16. When SVM is combined with wavelets, it becomes a robust classification tool. In the literature, wavelets are used either for feature extraction or for kernel formation of SVM. In the first case, wavelets are used to extract the features and the extracted features are used for classification17. But in the latter case, wavelets are incorporated as the kernels within SVM framework 18. For example, Khatibinia et al. 18 employed support vector machine (SVM) with a wavelet kernel for seismic reliability assessment of existing RC structures with consideration of soil–structure interaction effects in accordance with Performance-‐Based Design.
In this study, we construct a new combinational wavelet kernel using the multidimensional orthogonal modified Littlewood-‐Paley wavelet and thin plate spline radial basis function. The newly devised TPSLWP combinational kernel is employed for structural damage detection. Various levels of structural damage detection including the occurrence, location and severity of the damages are studied using computational analysis. Furthermore, Wavelet packet decomposition is applied to the structural response signals under ambient vibration and the feature vectors are obtained by feature extraction according to the wavelet energy spectrum. The feature vectors are employed for training and classification as the inputs of LS-‐SVM. The parameters of LS-‐SVM with the combinational kernel are optimized using a new version of harmony search algorithm that has been recently presented by Kaveh and Ahangaran 19 which is named Social Harmony Search (SHS) algorithm. Finally, the results are compared by applying other conventional kernels (single kernel function) and combinational kernels (mixed kernel functions) to the same system that were proposed by other researchers.
The present paper is organized as follows:
In Section 2, we describe the LS-‐SVM and the procedure of constructing a new kernel. SHS and Wavelet Packet Transform (WPT) are represented in Sections 3 and 4, respectively. Damage detection procedure is described in Section 5. Examples are studied in Section 6 and conclusions are presented in Section 7.
2-‐ Least Square Support Vector Machine and Constructing a New Combinational Kernel
3
As a new learning machine, support vector machine based on statistical learning theory consists of various types. Among these different versions, LS-‐SVM, with the advantages of simpler algorithm and faster operation speed, is widely applied in pattern recognition and nonlinear regression 20. The regression principle of LS-‐SVM can be explained as follows:
Suppose a sample set { 𝑥, 𝑦 ,𝑋 ∈ 𝑅!×! ,𝑌 ∈ 𝑅} and input sample matrix 𝑋 = [𝑥!; 𝑥!;… ; 𝑥!] in which 𝑥! is 𝑚 dimensional and 𝑌 = [𝑦!; 𝑦!;… ; 𝑦!] denotes the output sample column vector. For the regression problem, LS-‐SVM regression model in the primal weight space can be considered as the following form:
𝑦 𝑥 = 𝜔!𝜑 𝑥 + 𝑏 (1)
The optimization problem of the above model can be formulated as follows:
𝑀𝑖𝑛12𝜔 ! + 𝛾
12𝜉 !
S.t. 𝜑 𝑥 𝜔 + 𝑒𝑏 + 𝜉 = 𝑌
(2)
where 𝜑 . :𝑅! → 𝑅!! is the mapping to the high dimensional and potentially infinite dimensional feature space. The parameter 𝛾 > 0 denotes a real constant used to control the punishment degree for misclassification and 𝑒 denotes a column vector with elements equal to 1. Because 𝜔 becomes infinite dimensional, this primal problem cannot directly be solved. Therefore, let us proceed by constructing the following Lagrangian:
𝐿 𝜔, 𝑏, 𝜉,𝛼 =12𝜔 ! + 𝛾
12𝜉 ! − 𝛼!(𝜑 𝑥 𝜔 + 𝑒𝑏 + ξ − 𝑌) (3)
where 𝛼 is Lagrange multiplier. The conditions for optimality are given by:
𝜕𝐿𝜕𝜔
= 0,𝜕𝐿𝜕𝑏
= 0,𝜕𝐿𝜕𝜉
= 0,𝜕𝐿𝜕𝛼
= 0 (4)
After elimination of the variables 𝜔 and 𝜉, a linear Karush-‐Kuhn-‐Tucher (KKT) system with a set of n+1 dimensional linear equations can be obtained:
0 𝑒!𝑒 𝐾 + 𝐼/𝛾 = 𝑏
𝛼 = 0𝑌 (5)
where 𝐼 ∈ 𝑅!×! denotes a unit matrix, 𝛼 = [𝛼!;𝛼!;… ;𝛼!] and 𝐾 = 𝐾(𝑋,𝑋) = 𝜑 𝑥 𝜑 x! is the kernel matrix.
By solving the Eq. (5), the results of LS-‐SVM regression model becomes:
𝑦 𝑥 = 𝐾 𝑋,𝑋 𝛼 + 𝑏 (6)
Selection and construction of the kernel functions is a key issue, which greatly influences the performance of LS-‐SVM, and provides an important approach to expand LS-‐SVM from linear field to nonlinear field. The kernel functions of LS-‐SVM are Mercer functions which meet Mercer condition. Some widely used kernel functions used in LS-‐SVM are listed in the following:
Linear kernel: 𝐾 𝑥! , 𝑥! = 𝑥!!𝑥!

4
Polynomial kernel: 𝐾 𝑥! , 𝑥! = 𝑥!!𝑥! + 1!
Gaussian function kernel (Radial Basis Function (RBF)): 𝐾 𝑥! , 𝑥! = exp (− 𝑥! − 𝑥!!/2𝜎!)
Sigmoid kernel: K 𝑥! , 𝑥! = 𝑡𝑎𝑛ℎ 𝑥!!𝑥! + 𝑏
Thin Plate Spline (RBF): 𝐾 𝑥! , 𝑥! = 𝑥! − 𝑥!! ln 𝑥! − 𝑥!
where 𝑏, d, 𝜎 are kernel parameters and 𝜎 is the width parameter of Gaussian function. Additionally, following wavelet kernels have been presented in the recent literature:
Morlet wavelet function21: 𝐾 𝑥! , 𝑥! = !!cos 𝜔!
!!!!!!
exp (−0.5 !!!!!!!
)!!!!
Sinc wavelet function 22: 𝐾 𝑥! , 𝑥! = !"# (!
!!!!!! )
!(!!!!!! )
!!!!
Shannon wavelet function23: 𝐾 𝑥! , 𝑥! = 2𝑠𝑖𝑛𝑐 2(!!!!!!) − 𝑠𝑖𝑛𝑐(!!!!!
!)!
!!!
Littlewood-‐Paley wavelet function 24: 𝐾 𝑥! , 𝑥! =!"#!!
!!!!!!!
!!"#!!!!!!!!
!!!!!!!!
!!!!
where 𝑎 is the flexible coefficient of wavelet. The above kernel functions possess their respective traits, and have different effects on LS-‐SVM performance. Among the above kernel functions, RBF kernel is a local kernel function with a stronger learning ability but a weaker dissemination ability. Thin plate spline, Gaussian, Cubic, Distance and Quadratic functions are a number of RBF kernels that have been previously proposed in the literatures 25,26.
In this study, we use thin plate spline function as the RBF part of combinational kernel, because the previous analyses had shown that Thin Plate Spline and Gaussian function results in a high performance for scattered approximations 27. However, the accuracy of Gaussian function depends on the width parameter and yet there is no mathematical formulation to demonstrate the best strategy for choosing its optimal value. Hence, most applications of the Gaussian function use experimental tuning parameters or expensive optimization techniques to evaluate the optimum width parameter 28. While the thin plate spline function demonstrates a good agreement without requiring such additional parameters and that is also based on sound mathematical theories 29.
The wavelet has the property of time-‐frequency localization and is a powerful tool for arbitrary function approximation in 𝐿!(𝑅) space (quadratic continuous integral space), and hence the generalization ability of LS-‐SVM can be improved by using the wavelet as a kernel function 30.
Choosing an appropriate wavelet function as a wavelet kernel is a critical problem. One takes into account not only the wavelet function satisfying the Mercer's condition, but also the properties of the wavelet function. Littlewood-‐Paley (L-‐P) wavelet is the equivalent of Harmonic Wavelet , when the basis function is real 31. The modified L-‐P wavelet function is a type of orthonormal function which has useful practical properties in time-‐frequency local signal analysis and is well suited for band-‐scalar adjusting to detect the parameters with desired accuracy 31. Therefore, this superior wavelet function is
5
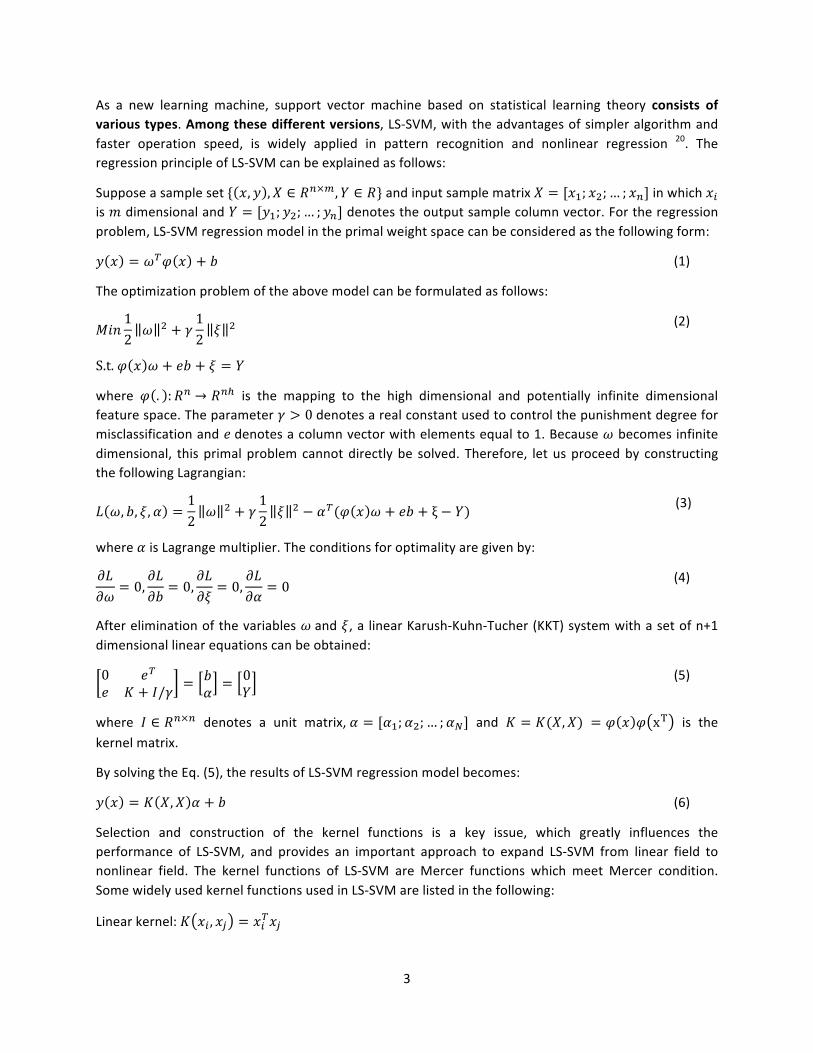
chosen as the wavelet part of combinational kernel. The modified L-‐P wavelet kernel function based on Reference 32 is defined as:
𝐾 𝑥! , 𝑥! =1
𝜋 𝑞 − 1
sin𝑞𝜋𝑥! − 𝑥!𝑎!
− sin𝜋𝑥! − 𝑥!𝑎!
𝜋𝑥! − 𝑥!𝑎!
!
!!!
(7)
where 𝑞 > 1 is a band-‐scalar and 𝑎! is the flexible coefficient of wavelet, 𝑎! > 0. Therefore, to absorb the advantages of the above two kernels, a novel combinational kernel function, namely the Thin Plate Spline Littlewood-‐Paley Wavelet (TPSLPW) is constructed by combining the above two kernel functions, as:
𝐾!"#$"% 𝑥, 𝑥! = 𝜌𝐾!!!" !"#$% !"#$%& 𝑥, 𝑥! + 1 − 𝜌 𝐾!!! !"#$%$& 𝑥, 𝑥,! (8)
𝐾!"#$"% 𝑥, 𝑥! = 𝜌 𝑥! − 𝑥!!ln 𝑥! − 𝑥! + 1 − 𝜌
1𝜋 𝑞 − 1
sin𝑞𝜋𝑥! − 𝑥!𝑎!
− sin𝜋𝑥! − 𝑥!𝑎!
𝜋𝑥! − 𝑥!𝑎!
!
!!!
(9)
According to the above linear superposition formula, it can be shown that the TPSLPW kernel is also a Mercer kernel. As LS-‐SVM cannot optimize the parameters of the kernels, it is difficult to determine 𝑛×𝑛 parameters 𝑎!. For the sake of simplicity, let 𝑎! = 𝑎 such that the above LS-‐SVM model has four parameters, namely, punishment coefficient 𝛾 > 0, flexible coefficient of wavelet 𝑎 > 0, band-‐scalar 𝑞 > 1 and 0 ≤ 𝜌 ≤ 1. These four (𝛾, 𝑎, 𝑞, 𝜌) parameters can be optimized by social harmony search (SHS) algorithm.
3-‐ Social Harmony Search (SHS) Algorithm
Based on the results obtained from the damage detection of structures, Harmony Search (HS) Algorithms can be applied to optimize the above combinational kernel LS-‐SVM and its parameters. HS algorithm is based on natural musical performance processes that occur when a musician searches for a better state of harmony, for instance, during jazz improvisation. The engineers seek for a global solution which is determined by an objective function, just like musicians seeking to find musically pleasing harmony as determined by an aesthetic 33. The optimization procedure of HS algorithm is described in the following steps:
Step 1: Initialize the algorithm parameters and optimization operators. HS algorithm includes a number of optimization operators, such as harmony memory (HM), harmony memory size (HMS), harmony memory considering rate (HMCR) and pitch adjusting rate (PAR). HMCR and PAR are fixed values with the range of 0.7–0.95 and 0.1–0.5, respectively. In HS algorithm, HM stores the feasible vectors, all of which are in the feasible space. The harmony memory size determines the number of vectors to be stored.
Step 2: Improvise a new harmony from HM. A new harmony vector is generated from the HM, based on memory considerations, pitch adjustments and randomization. Algorithm with a probability of (1-‐HMCR) applies random selection rule, and with the probability of HMCR applies harmony consideration rule, and with probability of HMCR × PAR applies pitch adjusting rule to improvise a new harmony.
6
In pitch adjusting section, algorithm adds 𝑏𝑤×𝜀 to the value that has been selected using memory considerations rule. Herein, 𝜀 is a random number from a uniform distribution with the range of [−1, 1], and 𝑏𝑤 is a fixed arbitrary distance bandwidth.
Step 3: Update HM. If new harmony vector is better than the worst harmony in the HM, judged in terms of the objective function value, the new harmony is included in the HM and the existing worst harmony is excluded from the HM.
Step 4: Repeat Steps 2 and 3 until the terminating criterion is satisfied; Otherwise, Steps 2 and 3 are repeated.
Although HS has proven its ability in finding near global regions within a reasonable time, it is comparatively inefficient in performing local search, because it uses fixed value for both PAR and 𝑏𝑤 and these parameters cannot be changed during the new improvisation. Hence, to eliminate the aforementioned drawback of the HS, some researchers such as References 34, 35, 36, 19 have recently presented new variants of the HS and the latter is termed social harmony search algorithm. The serious drawback of the HS algorithm arising from pitch adjustment section is that it makes the algorithm unable to make a good balance between diversification and intensification that are two important features of the meta-‐heuristics algorithms. Social harmony search uses the principles of normal distribution to increase the HS operation. This method applies the normal distribution to update the position of each design variable of a new harmony found by the first rule of the HS (memory consideration) in every stage, to attain rapidly the feasible solution space. Normal distribution works as a global search in early iterations and as a local search in final iterations to improve HS to quickly converge and find better solutions. It makes an efficient balance between diversification and intensification during the entire process of generating the algorithm feasible. The social HS adjusts the new harmony. Additionally, social HS simplifies the pitch adjusting rule because instead of using 𝑏𝑤 it uses the standard deviation of all values of the 𝑖 decision variables in the harmony memory and updates them in each generation. This advantage makes the algorithm to find the new harmony with more social influence using experiments of all the harmonies. This method assures that the HS algorithm achieves a good balance between diversification and intensification in the pitch adjustment rule.
4-‐ Wavelet Packet Transform (WPT)
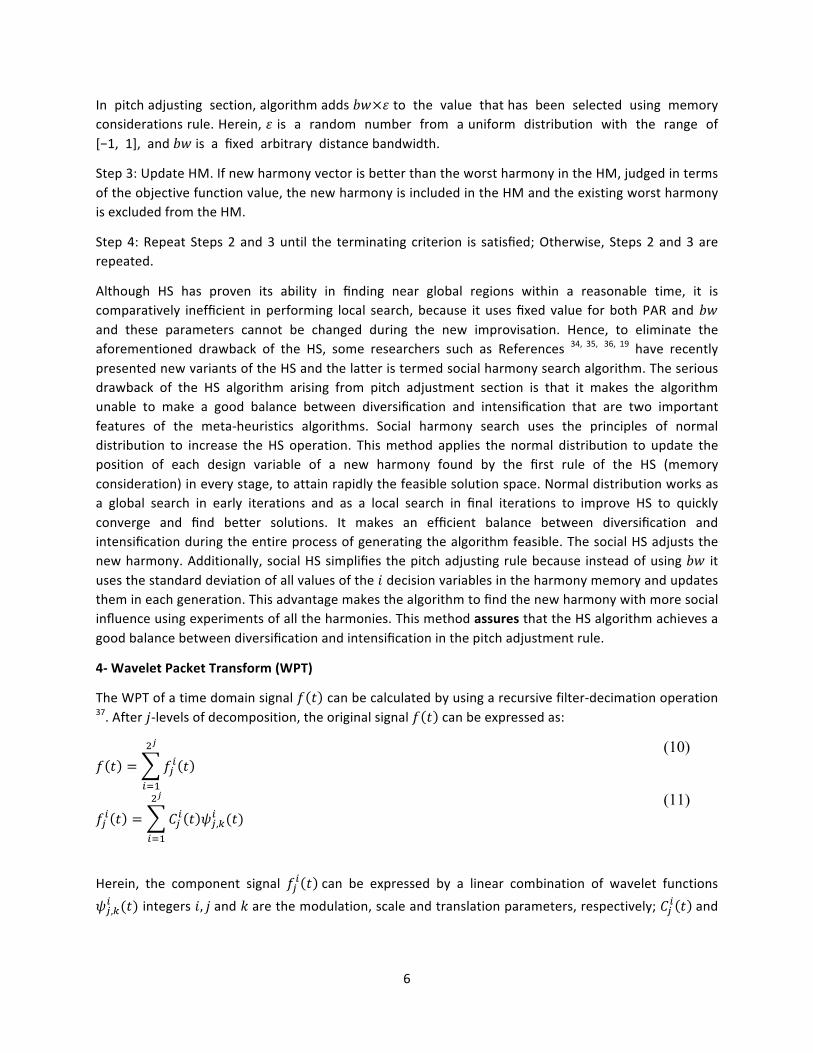
The WPT of a time domain signal 𝑓 𝑡 can be calculated by using a recursive filter-‐decimation operation 37. After 𝑗-‐levels of decomposition, the original signal 𝑓 𝑡 can be expressed as:
𝑓 𝑡 = 𝑓!! 𝑡!!
!!!
(10)
𝑓!! 𝑡 = 𝐶!! 𝑡 𝜓!,!! (𝑡)!!
!!!
(11)
Herein, the component signal 𝑓!! 𝑡 can be expressed by a linear combination of wavelet functions 𝜓!,!! (𝑡) integers 𝑖, 𝑗 and 𝑘 are the modulation, scale and translation parameters, respectively; 𝐶!! 𝑡 and

7
𝜓!,!! (𝑡) are defined as the wavelet packet coefficient and the wavelet packet function. The wavelet packet coefficients can be obtained from
𝐶!,!! = 𝑓 𝑡 𝜓!,!! 𝑡 𝑑𝑡!
!!
(12)
For the purpose of structural damage detection, frequency domain information tends to be more important and thus a high level of the WPT is often required to detect the minute changes in the signals. After WPT implementation, the energies of these decomposed component signals can be used for structural condition assessment. These component energies are defined as:
𝐸!! = 𝑓!! 𝑡 !𝑑𝑡!
!!
(13)
It can be shown that, when the mother wavelet is semi-‐orthogonal or orthogonal, the signal energy 𝐸! is the summation of the 𝑗-‐level component energies as follows 38:
𝐸! = 𝑓! 𝑡 𝑑𝑡 = 𝐸!!!!
!!!
!
!!
(14)
Generally, we use relative energy to indicate damage feature, so the relative energy 𝐸! in 𝑖-‐frequency band can be expressed as:
𝐸! =𝐸!!
𝐸!
(15)
5-‐Damage Detection Procedure
5.1-‐Extracting Data and Creating Input Vector
A data fusion technique can combine data from several information sources as well as information from relative data-‐bases to achieve a higher accuracy and more specific inferences than what could be achieved by a single source alone 39. Feature fusion is one kind of data fusion that integrates information from different sensors and obtains feature vectors 40. Since the LS-‐SVM is very suitable for feature fusion, a damage detection method is proposed herein based on feature fusion and LS-‐SVM model using the new combinational kernel.
1-‐ Battle–Lemarie is symmetric, the wavelet function is a band filter in the frequency domain, while the scale function is a low-‐pass filter. Therefore, the frequency bands of the above two functions are overlapped in certain degree, which shows a favorable orthogonal characteristic 41. In order to decompose analysis signals into different frequency bands and make each frequency band energy independent and irredundant, Battle-‐Lemarie is adopted as a basis wavelet package function in this paper. Several optional measuring nodes are selected and vibrant signals from these nodes are analyzed by using the WPT first.
2-‐ The level of wavelet packet decomposition is determined through a trial and error sensitivity analysis using both the healthy and the damaged structural models. The frequency band energy is calculated and normalized. The wavelet package relative energy of the signals from sensor 𝑠 is:

8
𝐸!! = {𝐸! ,𝑚 = 1,… ,𝑀} (16)
where 𝑠 = 1,2,… , 𝑆and 𝑝 are the acquiring numbers, 𝑝 = 1,2,3, . . . ,𝑃.
3-‐ The wavelet package relative energy (WPRE) 𝐸!! of the signals from the sensor 𝑠 is combined to obtain the fused feature vector:
𝐸! = 𝐸!!,𝐸!!,… ,𝐸!! (17)
5.2-‐Creating Fitness Function
By adopting the above combinational kernel, the tuning parameters (𝛾, 𝑎, 𝑞, 𝜌) of LS-‐SVM are optimized by SHS. In this study, the fitness function of SHS is developed based on LS-‐SVM training accuracy. The LS-‐SVM accuracy is obtained by evaluation of the test data classification using the trained model. By employing this fitness function, the LS-‐SVM parameters are optimized. SHS chooses the vector with the smallest fitness value after the termination conditions are satisfied. The fitness function of SHS is formed as follows:
𝐹 = 𝑚𝑒𝑎𝑛 𝑎𝑏𝑠𝑜𝑙𝑢𝑡𝑒 𝑒𝑟𝑟𝑜𝑟(𝑀𝐴𝐸) = 1𝑝0
𝑂𝑝 − 𝑂𝑝𝑝0𝑝=1 (18)
where 𝑂! denotes the LS-‐SVM actual outputs, 𝑂! denotes the desired outputs, and 𝑝! is the number of testing samples.
5.3-‐ Obtaining Optimal Parameters of LS-‐SVM
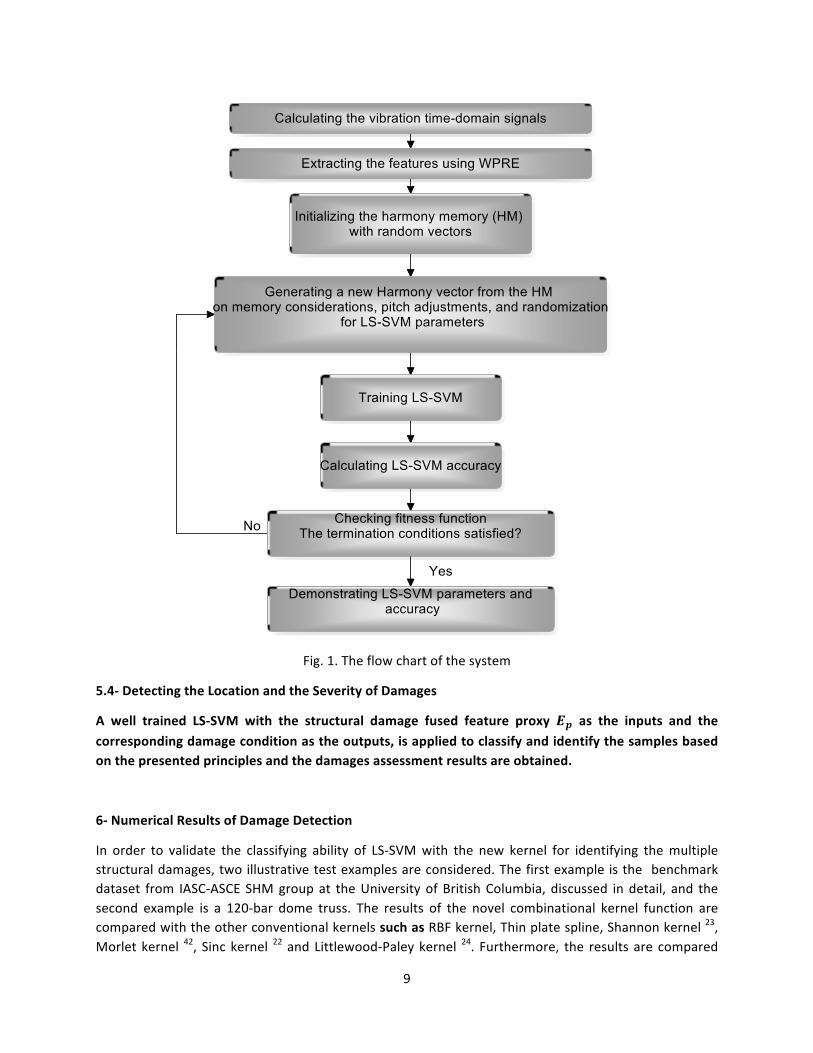
Fig. 1 presents the flowchart of SHS program for optimal selection of LS-‐SVM parameters. The best parameters are obtained and used to receive the required information, when the termination condition is satisfied.
9
Fig. 1. The flow chart of the system
5.4-‐ Detecting the Location and the Severity of Damages
A well trained LS-‐SVM with the structural damage fused feature proxy 𝑬𝒑 as the inputs and the corresponding damage condition as the outputs, is applied to classify and identify the samples based on the presented principles and the damages assessment results are obtained.
6-‐ Numerical Results of Damage Detection
In order to validate the classifying ability of LS-‐SVM with the new kernel for identifying the multiple structural damages, two illustrative test examples are considered. The first example is the benchmark dataset from IASC-‐ASCE SHM group at the University of British Columbia, discussed in detail, and the second example is a 120-‐bar dome truss. The results of the novel combinational kernel function are compared with the other conventional kernels such as RBF kernel, Thin plate spline, Shannon kernel 23, Morlet kernel 42, Sinc kernel 22 and Littlewood-‐Paley kernel 24. Furthermore, the results are compared

10
with other combinational kernels such as Gaussian RBF plus Sinc Wavelet kernel 43, Gaussian RBF plus Linear kernel 44 and Gaussian RBF plus Polynomial kernel 15.
6.1-‐ Benchmark Dataset from IASC-‐ASCE SHM Group
The four-‐story steel structure shown in Fig. 2 has 12 degrees of freedom (DOF). This structure has a plan of 2.5 m×2.5 m and a height of 3.6 m. The quarter-‐scale symmetrical model of the structure was studied in the Earthquake Engineering Research Laboratory at the University of British Columbia (UBC) 45.
The members are hot rolled grade 300 W steel with a nominal yield stress 300 MPa (42.6 kpsi). The excitation is low-‐level ambient wind loading at each floor in y-‐direction. To consider the uncertainty of environmental loads, the wind loading is modeled as filtered Gaussian white noise process passed through a sixth order low-‐pass Butterworth filter with a 100 Hz cutoff. Sensors are installed in each floor on the middle column of the sides; in total there are 16 sensors. Signals to be analyzed are the acceleration response gathered from each floor sensors on column 4 respectively, which are on nodes 13, 22,31 and 40 in Fig2(b). The sampling frequency is 100 Hz and the length of the data is 40000.
(a)
(b)
Fig. 2: Four-‐story structure of ASCE health monitoring benchmark studies: (a) Schematic drawing (b) distribution of node numbering and detection node in finite element model45
6.1.1-‐ Extracted Features
Battle–Lemarie as a basis function is employed to decompose the acceleration responses with 7 decomposition levels. All together, 128 frequency bands are generated, each with a width of 3.91 Hz. These component energies are sorted first according to their magnitudes, 95% of the WPRE is mainly distributed below 100 Hz frequency bands after calculating, which are both significant in value and sensitive to the damage occurred in the structure. Therefore, the first 16 component energies of WPT are selected as damage indices. Fig. 3 shows the measured vibration responses for different damage

11
conditions. The distribution maps of the WPRE about different damage conditions are shown in Fig. 4 and all cases are simulated in the y-‐direction. It can be seen from Fig. 4 that the distributions of WPRE are obviously different when detection nodes and damage conditions are different. Therefore, the WPRE is capable to serve as a feature vector to describe structural damage conditions.
(a)
(b)
(c)
(d)
Fig. 3. Measured vibration response:(a) 4 braces removed on the first floor (node 4), (b) 3 braces removed on the first and second floors (node 6), (c) 2 braces removed on 1,2,3 floors (node 8), (d) 1
brace removed on the 1,2,3,4 floors (node 2).
(a)
(b)
(c)
(d)
Fig. 4. Wavelet package relative energies: (a) 4 braces removed on the first floor (node 4), (b) 3 braces removed on the first and second floors (node 6), (c) 2 braces removed on 1,2,3 floors (node 8), (d) 1
brace removed on the 1,2,3,4 floors (node 2)
-‐10
0
10
0 0.5 1
Amplitu
de
Time(s)
-‐4 -‐2 0 2 4
0 0.5 1
Amplitu
de
Time(s)
-‐20
0
20
0 0.5 1 Amplitu
de
Time(s)
-‐5
0
5
0 0.5 1 Amplitu
de
Time(s)
0 0.5 1
1.5
1 3 5 7 9 11 13 15 17
Relaove en
ergy
Serial number of wavelet package
0 0.5 1
1.5
1 2 3 4 5 6 7 8 9 10 11 12 13 14 15 16 17
Relaove en
ergy
Serial number of wavelet package
0
1
2
1 2 3 4 5 6 7 8 9 10 11 12 13 14 15 16 17
Relaove en
ergy
Serial number of wavelet package
0
1
2
1 2 3 4 5 6 7 8 9 10 11 12 13 14 15 16 17
Relaove en
ergy
Serial number of wavelet package

12
6.1.2-‐Damage Occurrence and Damage Location
For damage detection by the proposed algorithm, we assume that the damages occurred by removing braces in y-‐direction. Relative calculation indicates that the damage of beams and the braces in x-‐direction has a low effect on the vibrational responses. Therefore, only the damage of braces in y-‐direction is considered in this study. Damage severity is described by removing 4 braces, 3 braces, 2 braces and 1 brace, respectively. Furthermore, it is assumed that the damages occurred on one, two, three and four floors of the structure. For example, when damage is restricted to one floor, we have four damage scenarios.
Therefore, all damage scenarios are:
(1) Damages in One floor: 4 ×4 =16
(2) Damages in two floors: 4 ×6 =24
(3) Damages in three floors: 4 ×4 =16
(4) Damages in four floors: 4 ×1 =4
With the above damages, in addition to the case of no damage, there are totally 61 damaged cases. Considering the effect of the environmental noise, different severity random Gaussian white noise is added to the acceleration responses of the above 61 damage cases. The ratios of the maximum root mean square (RMS) values between the noise and the signal for the 61 cases are 10%, 20% and 30%, respectively. They are named as the samples I to III where the samples I and II are used for training samples and samples III are employed for testing. Therefore, 183 samples are used in simulation of the damage identification, including 61 testing samples and 122 training samples. Signals are preprocessed in accordance with the previous section, then, the feature fusing with equation 17, and the fused feature as the input of LS-‐SVM. The output numerical value is the damaged case as mentioned before. We have 61 damage cases in this example. Tuning parameters of LS-‐SVM for each kernels are also optimized by SHS.
The SHS parameters are: number of iterations=5000, HMS=40, HMCR=0.9 and PAR=0.5. The results of damage location and damage severity by LS-‐SVM with TPSLPW kernel are compared to the other conventional kernels in Table 1. Ratio of correctly detected damage cases for the entire test data (61 cases) is defined as the damage detection accuracy (DDA).
Table 1: Performance of the proposed TPSLWP kernel in comparison with other conventional kernels
LS-‐SVM Kernel LS-‐SVM Parameters System error(MAE) DDA (%)
Gaussian RBF 𝛾 = 5.16,𝜎! = 18.28 10.12×10!! 90.16 %
Thin Plate Spline RBF
𝛾 = 5.54 10.12×10!! 90.16 %
Morlet Wavelet 𝛾 = 5.2, 𝑎 = 17.38 2.8×10!! 98.36%
Sinc Wavelet 𝛾 = 5, 𝑎 = 16.41 5.37×10!! 95.08 %
Shannon 𝛾 = 5, 𝑎 = 3.7 5.37×10!! 95.08 %

13
Wavelet Littlewood-‐
Paley Wavelet 𝛾 = 5.21, 𝑎 = 0.33 2.8×10!! 98.36%
TPSLPW 𝛾 = 5.15, 𝑎 = 0.33, 𝑞 = 2, 𝜌 = 0.52 0 100 %
The results show that the accuracy of damage detection based on LS-‐SVM with TPSLWP kernel is higher than those based on LS-‐SVM with the other conventional kernel functions (single kernel function) under the same conditions. Based on Table 1, L-‐P wavelet and Morlet wavelet function have the best single kernel function results, but the accuracy of damage detection based on LS-‐SVM with TPSLWP kernel is 1.64% higher than those based on LS-‐SVM with L-‐P kernel and Morlet Kernel. Furthermore, TPSLWP kernel predicts all the instances accurately. Also, the results show the effective performance of the combinational kernel function with a better learning and generalization ability. By using TPSLWP kernel function, the accuracy rate will be higher than the accuracy rate by employing a single kernel function constructed by LS-‐SVM.
Table 2 shows the DDA for LS-‐SVM with TPSLWP kernel in comparison with other combinational kernels proposed by other researchers.
Table 2. Performance of the proposed TPSLWP kernel in comparison with other combinational kernels
LS-‐SVM Kernel LS-‐SVM Parameters System error (MAE) DDA (%)
Gaussian RBF+ Polynomial
𝛾 = 5.21,𝜎! = 30.1, 𝑑 = 2 2.8×10!! 98.36 %
Gaussian RBF+ Linear
𝛾 = 5.1,𝜎! = 30.38 4.17×10!! 96.72 %
Gaussian RBF+ Sinc Wavelet
𝛾 = 5.4,𝜎! = 30.38, 𝑎 = 1.5 2.8×10!! 98.36%
TPSLWP 𝛾 = 5.15, 𝑎 = 0.33, 𝑞 = 2, 𝜌 = 0.52 0 100 %
Based on Table 2, Sinc-‐RBF kernel has the best combinational (mixed) kernel function results but the accuracy of damage detection based on LS-‐SVM with TPSLWP kernel is 1.64% higher than those based on LS-‐SVM with Sinc-‐RBF kernel.
RBF kernel is a local kernel function with a stronger learning ability but a weaker dissemination ability, in contrast, modified Littlewood-‐Paley wavelet function has horizontal floating and flexible orthonormal characteristics, it can build the orthonormal base of 𝐿!(𝑅) space, and by using this kernel function, we can approach almost any complicated functions in 𝐿!(𝑅) space. Thus, this combinational kernel function enhances the generalization ability of the LS-‐SVM. Therefore, in comparing with other combinational kernels, LS-‐SVM with TPSLPW kernel possesses a better dissemination and learning ability by incorporating the advantages of RBF kernel and wavelet kernel function.

14
6.2-‐ 120-‐bar Dome Truss
A 120-‐bar dome truss, shown in Fig. 5, was first presented in Reference 46 to obtain the optimal sizing and configuration variables.
Fig. 5. 120-‐bar dome truss 47
The diameter and the height of the dome are 31.78 m and 7 m, respectively. . The material is a seamless steel pipe with a modulus of elasticity of 30,450 ksi (210,000 MPa) and the material density is 0.288 lb/in3 (7971.810 kg/m3). The external diameter of the pipes is 0.2 m and the thickness is 0.006 m. The FE program OpenSees 48 is used for structural analysis under ambient vibration. The vibration is simulated by a discrete white noise in z-‐direction. The sampling interval is 0.05 s and the duration is 300 s. The dome is divided into four regions by its symmetry, which is shown in Fig. 5 with dotted lines and Roman
I II
III IV

15
letters. Nine vertical acceleration sensors are located on the structure, and the locations are shown by hollow circles in Fig. 5.
The four regions are considered independent in the damage detection scope, i.e. the sensor in each region has the most sensitivity to the damage in its own region and one LS-‐SVM could be established only considering the variances of the corresponding region. Therefore, only self-‐damage should be considered by the sensors in each region. The damaged elements are simulated by decreasing the Young’s modulus. The damage ratios of 5%, 10% and 15% are considered. Only region I is considered because the method and analysis for other regions are similar.
In region I we have one sensor on the middle joint and three sensors on the perimeter region. The damages are simulated for major elements, these amounts to 18 types of damage locations including two types of damages where damage occurs in two elements simultaneously. Therefore, all the training vertical acceleration response samples amount to 54. The model is subjected to ambient vibration and the vertical acceleration responses at the joints where sensors are placed are obtained. Considering the effect of the environmental noise, different types of random Gaussian white noise are added to the acceleration responses of the aforementioned 54 damage cases, the ratios of the maximum root mean square (RMS) values between the noise and the signal for the 54 cases are 10%, 20% and 30% , respectively. These are labeled as samples I–III. Samples I and II are employed for training and samples III is used for testing. That is, 162 samples are used in the simulation of damage identification, including 54 testing samples and 108 training samples.
All acceleration vibration signals are decomposed by a three-‐level wavelet packet, and the utilized wavelet type is the Battle–Lemarie basis function. Each signal is transformed into a set of eight-‐dimension feature vectors based on Section 5 and the fused feature vectors are created. The fused feature vectors are input vectors of LS-‐SVM. The output numerical value is the damaged case. We have 54 damaged cases in this example.
Table 3 shows the results for the detection of damage occurrence, damage location and damage severity for LS-‐SVM with TPSLPW kernel in comparison with other conventional kernels. The tuning parameters of LS-‐SVM for each kernel are optimized by SHS.
Table 3. Performance of the proposed TPSLWP kernel in comparison with the other conventional kernels
LS-‐SVM Kernel LS-‐SVM Parameters System error(MAE) DDA (%)
Gaussian RBF 𝛾 = 4.36,𝜎! = 18.38 13.12×10!! 87.03 %
Thin Plate Spline RBF
𝛾 = 4.54 12.07×10!! 88.88 %
Morlet Wavelet 𝛾 = 4.57, 𝑎 = 11.38 5.14×10!! 96.29%
Sinc Wavelet 𝛾 = 4, 𝑎 = 12.9 8.19×10!! 92.59%
Shannon Wavelet
𝛾 = 4.8, 𝑎 = 4 8.19×10!! 92.59 %
Littlewood-‐Paley Wavelet
𝛾 = 4.1, 𝑎 = 0.53 5.14×10!! 96.29%

16
TPSLPW 𝛾 = 4.12, 𝑎 = 0.53, 𝑞 = 2, 𝜌 = 0.44 1.02×10!! 98.14 %
Table 3 shows that the accuracy of the combinational kernel function proposed in this paper is higher than other kernels published in literature. Morlet kernel and L-‐P kernel classifies 52 instances perfectly, out of 54 testing instances, while TPSLWP kernel classifies 53 instances correctly. The combinational kernel exploits the advantages of both wavelet kernels and conventional kernels. However, accuracy is less than 100 % This may be due to the fact that sensors placement was not completely optimal, and this configuration decreased the sensitivity of acceleration responses to the various damage scenarios and hence, it is not possible to predict all the test instances accurately by this sensor placement.
Table 4 shows the DDA for LS-‐SVM with TPSLWP kernel in comparison with combinational kernels proposed by other researchers.
Table 4. Performance of the proposed TPSLWP kernel in comparison with other combinational kernels
LS-‐SVM Kernel LS-‐SVM Parameters System error(MAE) DDA (%)
Gaussian RBF+ Polynomial
𝛾 = 4.31,𝜎! = 24.1, 𝑑 = 3 5.14×10!! 96.29 %
Gaussian RBF+ Linear
𝛾 = 4.31,𝜎! = 23.38 5.14×10!! 96.29 %
Gaussian RBF+ Sinc Wavelet
𝛾 = 4.4,𝜎! = 20.38, 𝑎 = 1.43 1.02×10!! 98.14%
TPSLWP 𝛾 = 4.12, 𝑎 = 0.53, 𝑞 = 2, 𝜌 = 0.44 1.02×10!! 98.14 %
Based on Table 4, Sinc-‐RBF and TPSLWP kernels have the best combinational kernel function results. Because SHS algorithm is essentially a stochastic search algorithm, we ran the optimization algorithm several times and best results are presented in Table 4. In most of these runs, TPSLWP kernels have better results compared with Sinc-‐RBF kernel. In other words, the average results of several runs carried out by the proposed kernel are superior to those of Sinc-‐RBF kernel.
Moreover, the proposed approach can be used for multi-‐field data, which means this kernel function is not sensitive to the specific field data. TPSLWP kernel can widely combine the advantages of L-‐P wavelet and Thin Plate Spline RBF kernel, therefore, the better capability of generalization and predicting the best results can be achieved. However, as the number of kernel parameters is increased from 2 to 3, the TPSLWP kernel requires more searches in the model selection stage in comparison with the standard RBF and wavelet kernels.
7-‐ Conclusions and Discussion
In this study, in order to enhance the speed and the accuracy of LS-‐SVM for structural damage detection, a new combinational kernel using the multidimensional orthogonal modified Littlewood-‐Paley wavelet and thin plate spline radial basis function is proposed. The parameters of newly devised TPSLWP combinational kernel and LS-‐SVM are optimized by utilizing Social Harmony Search (SHS) algorithm.
17
In order to assess the performance of LS-‐SVM with the new kernel, damage detection of the four-‐story structure of ASCE health monitoring benchmark and a 120-‐bar dome truss is studied and discussed. Measured acceleration response signals of structures are first decomposed into the component signals using the WPT, then, the selected component energies are fused and used as the inputs to the LS-‐SVM models for various levels of damage assessment. Based on the numerical results, the following conclusions are resulted:
1-‐ The accuracy of damage detection based on LS-‐SVM with TPSLWP kernel is higher than those based on LS-‐SVM with other conventional kernel functions (single kernel function) under the same conditions. In this study, Littlewood-‐Paley wavelet function demonstrated the best single kernel function result and the accuracy of damage detection based on LS-‐SVM with TPSLWP kernel is higher than those based on LS-‐SVM with Littlewood-‐Paley kernel.
2-‐ The accuracy of damage detection with TPSLWP kernel is higher than the accuracy of other combinational kernel functions (mixed kernel function) under the same conditions. In this study, Sinc-‐RBF kernel demonstrated the best mixed kernel function results and the accuracy of damage detection based on LS-‐SVM with TPSLWP kernel is higher than those based on LS-‐SVM with Sinc-‐RBF kernel.
3-‐ LS-‐SVM with TPSLPW kernel possesses a better dissemination and learning ability by integrating the advantages of RBF kernel and wavelet kernel functions. Because of horizontal floating and flexible orthonormal character of the modified Littlewood-‐Paley wavelet function, it can build the orthonormal base of 𝐿!(𝑅) space. By using Littlewood-‐Paley kernel function, we can approach almost any complicated functions in 𝐿!(𝑅) space. Thus, the proposed combinational kernel function enhances the generalization ability of the LS-‐SVM.
4-‐ Wavelet transform has emerged as a powerful mathematical tool for capturing changes of structural characteristics/properties induced by damage. It provides an effective feature extraction procedure for compressing the data measured and obtaining useful information for damage assessment. The WPT-‐based component energies extracted appears to be good indicator that can reveal the health condition of structures.
5-‐ Selecting the optimal tuning parameters of LS-‐SVM and its kernel has a high influence on the system performance. The results show that the application of SHS algorithm for the selection of these parameters in damage detection procedure leads to a high performance and accuracy of LS-‐SVM model. Furthermore, there is no requirement to rely on the domain knowledge in order to fix the parameters. Therefore, by using SHS, TPSLWP kernel function can be applied in various fields, and is not sensitive to the data domain.
However, there are still some important details that need to be studied more thoroughly. Optimal selection of wavelet basis for different structural types and configurations needs to be addressed in order to assure the accuracy. Some problems such as optimal placement of sensors, damage location between the two symmetrical elements and the on-‐line, real-‐time damage monitoring for in-‐service structures based on the new kernel also need to be further studied.

18
References
1. Housner GW, Bergman LA, Caughey TK, Chassiakos AG, Claus RO, Masri SF, et al. Structural control: past, present, and future. J Eng Mech. 1997;123(9):897–971.
2. Fan W, Qiao P. Vibration-‐based damage identification methods: a review and comparative study. Struct Heal Monit. 2011;10(1):83–111.
3. Messina A. Detecting damage in beams through digital differentiator filters and continuous wavelet transforms. J Sound Vib. 2004;272(1):385–412.
4. Lee SG, Yun GJ, Shang S. Reference-‐free damage detection for truss bridge structures by continuous relative wavelet entropy method. Struct Heal Monit. 2014;:1475921714522845.
5. Hou Z, Noori M, Amand RS. Wavelet-‐based approach for structural damage detection. J Eng Mech. 2000;126(7):677–683.
6. Saadat S, Buckner GD, Noori MN. Structural system identification and damage detection using the intelligent parameter varying technique: an experimental study. Struct Heal Monit. 2007;6(3):231–243.
7. Khoa NLD, Zhang B, Wang Y, Chen F, Mustapha S. Robust dimensionality reduction and damage detection approaches in structural health monitoring. Struct Heal Monit. 2014;:1475921714532989.
8. Noori MN, Cao Y, Hou Z, Sharma S. Application of support vector machine for reliability assessment and sturctural health monitoring. Int J Eng Under Uncertain Hazards, Assess Mitig. 2010;2:89–98.
9. Shirazi MRN, Mollamahmoudi H, Seyedpoor SM. Structural damage identification using an adaptive multi-‐stage optimization method based on a modified particle swarm algorithm. J Optim Theory Appl. 2013;:1–11.
10. Torkzadeh P, Goodarzi Y, Salajegheh E. A two-‐stage damage detection method for large-‐scale structures by kinetic and modal strain energies using heuristic particle swarm optimization. Int J Optim Civ Eng. 2013;3(3):465–482.
11. Luts J, Molenberghs G, Verbeke G, Van Huffel S, Suykens JAK. A mixed effects least squares support vector machine model for classification of longitudinal data. Comput Stat Data Anal. 2012;56(3):611–628.
12. Shawe-‐Taylor J, Cristianini N. Kernel methods for pattern analysis. Cambridge university press; 2004.

19
13. Yeh C-‐Y, Huang C-‐W, Lee S-‐J. A multiple-‐kernel support vector regression approach for stock market price forecasting. Expert Syst Appl. 2011;38(3):2177–2186.
14. Song H, Ding Z, Guo C, Li Z, Xia H. Research on Combination Kernel Function of Support Vector Machine. 2008;:838–841.
15. Xie J. Kernel optimization of LS-‐SVM based on damage detection for smart structures [Internet]. In: 2009 2nd IEEE International Conference on Computer Science and Information Technology. IEEE; 2009 [cited 2012 Nov 7]. p. 406–409.
16. Hera, A., Hou, Z ,Noori MN. Wavelet-‐Based Techniques for Structural Health Monitoring. Health Assessment of Engineered Structures, World Scientific, Ed. Achintya Haldar, 2013. pp 179-‐199
17. Khatam H, Golafshani AA, Beheshti-‐Aval SB, Noori M. Harmonic class loading for damage identification in beams using wavelet analysis. Struct Heal Monit. 2007;6(1):67–80.
18. Khatibinia M, Javad Fadaee M, Salajegheh J, Salajegheh E. Seismic reliability assessment of RC structures including soil–structure interaction using wavelet weighted least squares support vector machine. Reliab Eng Syst Saf. 2013;110:22–33.
19. Kaveh A, Ahangaran M. Social harmony search algorithm for continuous optimization. Iran J Sci Technol. 2011;
20. Suykens JAK, Vandewalle J. Least squares support vector machine classifiers. Neural Process Lett. 1999;9(3):293–300.
21. Khatibinia M, Salajegheh E, Salajegheh J, Fadaee MJ. Reliability-‐based design optimization of reinforced concrete structures including soil–structure interaction using a discrete gravitational search algorithm and a proposed metamodel. Eng Optim. 2013;45(10):1147–1165.
22. George J, Kumaraswamy R. Sinc wavelet kernel for support vector machines. In: 8th National Conference on Technological Trends. 2007. p. 74–78.
23. Chen W-‐S, Yuen PC, Huang J, Lai J. Face classification based on shannon wavelet kernel and modified fisher criterion. In: Automatic Face and Gesture Recognition, 2006. FGR 2006. 7th International Conference on. IEEE; 2006. p. 467–474.
24. Wu F, Zhao Y. Least Square Littlewood-‐Paley Wavelet Support Vector Machine. Inf Control. 2005;34(5):604.
25. Cao Y, University NCS. Bayesian Based Structural Health Management and Reliability Analysis Techniques Utilizing Support Vector Machine [Internet]. North Carolina State University; 2007.
26. Engelbrecht AP. Computational intelligence: an introduction. Wiley. com; 2007.
27. Franke R. Scattered data interpolation: tests of some methods. Math Comput. 1982;38(157):181–200.

20
28. Samanta B, Al-‐Balushi KR, Al-‐Araimi S a. Artificial neural networks and support vector machines with genetic algorithm for bearing fault detection. Eng Appl Artif Intell [Internet]. 2003 Oct [cited 2012 Nov 5];16(7-‐8):657–665.
29. Durmus A, Boztosun I, Yasuk F. Comparative study of the multiquadric and thin-‐plate spline radial basis functions for the transient-‐convective diffusion problems. Int J Mod Phys C. 2006;17(08):1151–1169.
30. Yu Z, Cai Y. Least squares wavelet support vector machines for nonlinear system identification. In: Advances in Neural Networks–ISNN 2005. Springer; 2005. p. 436–441.
31. Chakraborty A, Basu B, Mitra M. Identification of modal parameters of a mdof system by modified L–P wavelet packets. J Sound Vib. 2006;295(3):827–837.
32. Xing Y, Wu X, Xu Z. Multiclass least squares wavelet support vector machines. In: Networking, Sensing and Control, 2008. ICNSC 2008. IEEE International Conference on. IEEE; 2008. p. 498–502.
33. Lee KS, Geem ZW. A new structural optimization method based on the harmony search algorithm. Comput Struct. 2004;82(9):781–798.
34. Mahdavi M, Fesanghary M, Damangir E. An improved harmony search algorithm for solving optimization problems. Appl Math Comput. 2007;188(2):1567–1579.
35. Taherinejad N. Highly reliable harmony search algorithm. In: Circuit Theory and Design, 2009. ECCTD 2009. European Conference on. IEEE; 2009. p. 818–822.
36. Geem ZW, Sim K-‐B. Parameter-‐setting-‐free harmony search algorithm. Appl Math Comput. 2010;217(8):3881–3889.
37. Yan R, Gao RX, Chen X. Wavelets for fault diagnosis of rotary machines: A review with applications. Signal Processing [Internet]. 2014;96:1–15.
38. Han J-‐G, Ren W-‐X, Sun Z-‐S. Wavelet packet based damage identification of beam structures. Int J Solids Struct. 2005;42(26):6610–6627.
39. Telmoudi A, Chakhar S. Data fusion application from evidential databases as a support for decision making. Inf Softw Technol. 2004;46(8):547–555.
40. Chen S-‐L, Jen YW. Data fusion neural network for tool condition monitoring in CNC milling machining. Int J Mach tools Manuf. 2000;40(3):381–400.
41. Mallat SG. A theory for multiresolution signal decomposition: the wavelet representation. Pattern Anal Mach Intell IEEE Trans. 1989;11(7):674–693.
42. Zhang L, Zhou W, Jiao L. Wavelet support vector machine. Syst Man, Cybern Part B Cybern IEEE Trans. 2004;34(1):34–39.

21
43. George J, Kumaraswamy R. A Hybrid Wavelet Kernel Construction for Support Vector Machine Classification. In: DMIN. 2008. p. 96–101.
44. Song H, Ding Z, Guo C, Li Z, Xia H. Research on combination kernel function of support vector machine. In: Computer Science and Software Engineering, 2008 International Conference on. IEEE; 2008. p. 838–841.
45. Johnson EA, Lam HF, Katafygiotis LS, Beck JL. Phase I IASC-‐ASCE structural health monitoring benchmark problem using simulated data. J Eng Mech. 2003;130(1):3–15.
46. Soh CK, Yang J. Fuzzy controlled genetic algorithm search for shape optimization. J Comput Civ Eng. 1996;10(2):143–150.
47. Kaveh a., Talatahari S. Particle swarm optimizer, ant colony strategy and harmony search scheme hybridized for optimization of truss structures. Comput Struct [Internet]. 2009 Mar [cited 2013 Apr 3];87(5-‐6):267–283.
48. Frank M, Christopher M, Pedro A, Allen HJ. OpenSees Laboratory [Internet]. 2013 Apr;Available from: http://nees.org/resources/572.