Structural characterization of gilsonite bitumen by advanced nuclear magnetic resonance spectroscopy...
69
1 Structural characterization of gilsonite bitumen by advanced nuclear 1 magnetic resonance spectroscopy and ultrahigh resolution mass 2 spectrometry revealing pyrrolic and aromatic rings substituted with 3 aliphatic chains 4 5 John R. Helms a , Xueqian Kong b , Elodie Salmon a , Klaus Schmidt-Rohr b , Patrick G. 6 Hatcher a , and Jingdong Mao a * 7 8 a. Old Dominion University, Department of Chemistry and Biochemistry, 4541 9 Hampton Blvd, Norfolk, VA, 23529 10 b. Iowa State University, Department of Chemistry, Gilman Hall, Ames, Iowa, 11 50011 12 13 14 15 Submitted to Organic Geochemistry 16 17 18 19 20 *Jingdong Mao, e-mail: [email protected]; phone: 00-1-757-683-6874; fax: 00-1-757- 21 683-4628 22 23
-
Upload
morningside -
Category
Documents
-
view
3 -
download
0
Transcript of Structural characterization of gilsonite bitumen by advanced nuclear magnetic resonance spectroscopy...

1
Structural characterization of gilsonite bitumen by advanced nuclear 1
magnetic resonance spectroscopy and ultrahigh resolution mass 2
spectrometry revealing pyrrolic and aromatic rings substituted with 3
aliphatic chains 4
5
John R. Helmsa, Xueqian Kongb, Elodie Salmona, Klaus Schmidt-Rohrb, Patrick G. 6
Hatchera, and Jingdong Maoa* 7
8
a. Old Dominion University, Department of Chemistry and Biochemistry, 4541 9
Hampton Blvd, Norfolk, VA, 23529 10
b. Iowa State University, Department of Chemistry, Gilman Hall, Ames, Iowa, 11
50011 12
13
14
15
Submitted to Organic Geochemistry 16
17
18
19
20
*Jingdong Mao, e-mail: [email protected]; phone: 00-1-757-683-6874; fax: 00-1-757-21
683-4628 22
23

2
24
Running Head: Characterization of Gilsonite Bitumen 25
26

3
ABSTRACT 27
Gilsonite, a naturally occurring asphaltite bitumen, consists of a complex 28
mixture of organic compounds. In the present study, advanced one and two 29
dimensional solid-state and solution 1H, 13C and 15N nuclear magnetic resonance 30
(NMR) and electro spray ionization Fourier transform ion cyclotron resonance mass 31
spectrometry (ESI-FT-ICR-MS) were employed to investigate its composition and 32
structure. 13C NMR yielded a carbon aromaticity of 27%. Aromatic moieties in 33
gilsonite were primarily single rings or small clusters of fused rings. Half of the 34
aromatic carbons of gilsonite can be accounted for by pyrroles. 15N cross 35
polarization/magic angle spinning (CP/MAS) NMR showed that most nitrogen in 36
gilsonite was pyrrolic. The aromatic rings were heavily substituted with alkyl 37
chains, as evidenced by 1H-13C correlation spectra. Advanced solid-state NMR 38
spectral editing techniques clearly identified specific functional groups such as 39
CCH3, CCH2, and C=CH2 (exomethylene). 1H-13C wideline separation (WISE) NMR 40
helped distinguish mobile and non-protonated alkyl carbons. FT-ICR-MS indicated 41
that ~75% of calculated formulae generated by ESI had some aliphatic character, 42
while up to 17% of formulae contained possible aromatic rings. Of the assigned 43
formulae, 99.8% contained at least one heteroatom (N, O or S), suggesting that 44
ionization by ESI was highly selective and therefore less reflective of the overall 45
chemical character of gilsonite than NMR spectroscopy. By combining the 46
information obtained from advanced NMR and ultrahigh resolution MS we propose 47
a structural model for gilsonite as a mixture of many pyrrolic and a few fused 48
aromatic rings highly substituted with and connected by mobile aliphatic chains. 49
50

4
Keywords: bitumen, asphalt, gilsonite, Green River Formation, solid-state NMR, 51
ESI-FT-ICR-MS 52
53

5
1. Introduction1 54
Bitumen refers to solid or liquid hydrocarbon deposits soluble in organic 55
solvents (Killops and Killops, 2005). Gilsonite is a naturally occurring bituminous 56
asphalt and formally classified as an asphaltite bitumen (Abraham, 1945). It occurs 57
primarily along the Colorado-Utah border and was found in the early 1860s in the 58
1 ABREVIATIONS AI – aromatic index AImod – modified aromatic index BC – black carbon CARS – condensed aromatic ring structures CP – cross polarization COSY – correlation spectroscopy (2D-NMR) CSA – chemical shift anisotropy DBE – Double bond equivalents DEPT – distortionless enhancement by polarization transfer DP – direct polarization DPEP – deoxyphylloerythroetioporphyrin EA – elemental analysis ESCA – electron spectroscopy for chemical applications (X-ray photoelectron spectroscopy or XPS) ESI – electrospray ionization FT – Fourier transform HETCOR – heteronuclear correlation (2D-NMR) HH-CP – Hartmann-Hahn cross polarization HMQC – heteronuclear multi-quantum correlation (2D-NMR) ICR – ion cyclotron resonance KMDA – Kendrick mass defect analysis LG-CP – Lee-Goldburg cross polarization MAS – magic angle spinning MS – mass spectrometry MREV-8 – Mansfield, Rhim, Elleman and Vaughn’s 8 pulse line narrowing sequence NMR – nuclear magnetic resonance spectroscopy NOM – natural organic matter ppm – parts per million units of frequency variation from a standard T1 – spin-lattice relaxation time TOCSY – total correlation spectroscopy (2D-NMR) TOSS – total sideband suppression TPPM – two-pulse phase modulated decoupling WISE – wideline separation nuclear magnetic resonance spectroscopy

6
Uinta Basin in northeastern Utah (Bell and Hunt, 1963). Gilsonite has been widely 59
used in mining and industry and sold all over the world. For example, it has been 60
used as an additive in oil drilling fluids and for oil well cementing and has a long 61
history of use as both a pigment and binding agent in paints, enamels and inks 62
(Tripp and White, 2006). Natural bitumens are also under investigation as 63
exploitable petroleum fuels (Meyer et al., 2007). Furthermore, gilsonite and other 64
natural bitumens are important intermediates and/or byproducts in the geological 65
formation of crude oils that can be analyzed to improve our understanding of 66
petroleum geochemistry (Bell and Hunt, 1963; Killops and Killops, 2005). 67
Despite the widespread industrial use and petrochemical potential of 68
gilsonite, its molecular structure has not been well characterized due to its 69
complexity and heterogeneity. Past studies have primarily focused on the 70
investigations of biomarkers such as petroporphyrins (Treibs, 1934; Treibs, 1936; 71
Sugihara and McGee, 1957; Corwin, 1959; Quirke and Maxwell, 1980; Quirke et al., 72
1980a; Quirke et al., 1980b; Hajibrahim et al., 1981; Gill et al., 1985), hopanes, 73
steranes and carotenoids (Ruble et al., 1994; Schoell et al., 1994). Quirke et al., 74
(1980) found that the aetio-type porphyrins and deoxyphylloerythroetioporphyrin 75
(DPEP) were products of reductive degradation of chlorophylls. The porphyrins 76
present in gilsonite were most likely formed from naturally occurring chlorophylls 77
through this degradation (Quirke and Maxwell, 1980; Quirke et al., 1980b; 78
Hajibrahim et al., 1981). Compound specific isotopic analysis of carotenoids 79
indicated a strong algal or cyanobacterial source for the diagenetic starting material 80
for gilsonite (Ruble et al., 1994; Schoell et al., 1994). Additionally, isotopic values for 81

7
hopanes and moretanes suggested the influence of mid-water bacteria and 82
potentially some methanotrophs (Schoell et al., 1994). 83
However, biomarkers such as the porphyrin-type compounds only account for 84
a minor fraction of gilsonite (Treibs, 1936). The remainder (bulk) of the gilsonite 85
consists of aliphatic and aromatic hydrocarbons with few olefinic groups, as 86
indicated by the iodine number (Baker et al., 1967; Quirke and Maxwell, 1980). Its 87
bulk chemical characteristics have been investigated using electron spectroscopy for 88
chemical applications (ESCA; usually referred to as X-ray photoelectron 89
spectroscopy or XPS), infrared spectroscopy, X-ray diffraction spectroscopy, and 1H 90
and 13C solution NMR analysis. ESCA provided verification of elemental analysis 91
results. ESCA also indicated that carbon was mainly present as aliphatic 92
hydrocarbons, that nitrogen-carbon bonding environments such as aliphatic and 93
aromatic amines as well as nitrogen heterocycles such as pyrrole were present, that 94
C-O bonding environments were present, and that a very small amount of sulfur 95
was present as organic sulfides or heterocycles such as thiophenes (Clark et al., 96
1983). Infrared spectroscopy showed that C-H (~88% of IR signal) and C-O (~10% of 97
IR signal) were the dominant vibrational modes present in gilsonite with acids and 98
esters each representing less than 1% of the vibrational signal (Clark et al., 1983). 99
Organic acids were present in gilsonite in trace amounts (Grantham and Douglas, 100
1977; Clark et al., 1983). 101
Yen et al. (1961) used X-ray diffraction to estimate the aromaticity of 102
gilsonite as well as several petroleum asphaltenes. They reported a much lower 103
aromaticity for gilsonite (~14%) than for petroleum asphaltenes (22-53%). However, 104
Bell and Hunt (1963) described gilsonite as “predominantly aromatic” based on 105

8
liquid chromatography, elemental analysis and infrared measurements. Wen et al. 106
(1978) report the aromaticity of gilsonite asphaltene, which is the pentane insoluble 107
– benzene soluble fraction, as 38% based on 1H solution NMR. Yet the perception of 108
gilsonite as a “predominantly aromatic substance” (North, 1985) persisted until 109
Clark et al. (1983) applied solution 1H and 13C NMR to gilsonite samples and 110
showed a variety of aliphatic carbon environments and a single broad aromatic 111
peak. They reported an aromatic carbon to aliphatic carbon ratio of 1:4 for a 112
gilsonite sample with limited atmospheric exposure, which was more in line with 113
the X-ray diffraction results (Yen et al., 1961) and the absence of a ‘shake-up 114
satellite’ peak, indicative of conjugated systems, in the ESCA spectrum (Clark et al., 115
1983). To resolve this controversy, reliable quantification of aromaticity is required. 116
Direct polarization 13C NMR, after a sufficiently long relaxation delay (Mao et al., 117
2000; Mao and Schmidt-Rohr, 2004a), provides accurate aromaticity values. 118
Gilsonite has often been described as containing condensed polyaromatic ‘sheets’ or 119
‘asphaltene sheets’ (Yen et al., 1961; Bell and Hunt, 1963; Wen et al., 1978; Yen, 120
2000) based on its high carbon content and its high refractive index, but little direct 121
evidence has supported this. Solid-state NMR can address this question by 122
estimating the size of clusters of fused aromatic rings, by long-range C-H dipolar 123
dephasing and quantification of the ring edge carbon fractions (Brewer et al., 2009; 124
Mao et al., 2010b). 125
The structural characterization of gilsonite is critical for understanding its 126
properties, its applications in industry, and its geological significance. Solid-state 127
NMR has been widely applied in the study of natural organic matter (NOM) such as 128
coal, oil shale, humic materials and peats (Hatcher et al., 1981; Dennis et al., 1982; 129

9
Mikinis et al., 1982; Hatcher et al., 1983; Wilson, 1987; Solum et al., 1989; 130
Anderson et al., 1992; Maciel et al., 1993; Wilson et al., 1993; Preston, 1996 ; Nanny 131
et al., 1997; Clifford et al., 1999; Hu et al., 2000; Conte et al., 2004; Smernik et al., 132
2006). Advanced NMR techniques, especially spectral editing techniques, have 133
increased the amount of information obtainable from NOM samples (Wu and Zilm, 134
1993; Wu et al., 1994; Hu et al., 2000; Keeler and Maciel, 2000). We have developed 135
and applied many new, advanced solid-state NMR techniques, especially spectral 136
editing (Schmidt-Rohr and Mao, 2002; Mao and Schmidt-Rohr, 2003), for the 137
investigations of NOM (Mao et al., 2007a; Mao et al., 2007c). While the broad and 138
heavily overlapped bands of complex NOM allow traditional 13C NMR to identify 139
only about 10 types of chemical groups, our spectral editing techniques, which 140
selectively retain peaks of certain types of functional groups, can identify more than 141
two dozen different moieties (Mao et al., 2007a; Mao et al., 2007c). Moreover, two-142
dimensional 1H-13C heteronuclear correlation (HETCOR) NMR is used to detect 143
proximities and connectivities of different functional groups. 15N CP/MAS NMR is 144
used to characterize forms of nitrogen in gilsonite and combined with recoupled 145
dipolar dephasing to determine which resonances are from N bonded to hydrogen. 146
Gilsonite is soluble in a range of organic solvents such as chloroform; 147
therefore we have also studied it by solution NMR techniques. Solution 13C NMR 148
spectra appear well resolved; however significant structural information is lost due 149
to low mobility of some components and thus short spin-spin relaxation times (T2). 150
Thus, advanced solid-state and solution NMR techniques provide complementary 151
structural information. 152

10
Mass spectrometry is used to determine the molecular weight of ionized 153
analytes. In organic chemistry, advanced solution NMR and mass spectrometry 154
data have been routinely collected to elucidate the structures of organic compounds. 155
However, this approach has not been frequently used to elucidate the structures of 156
natural organic matter in organic geochemistry. Despite the availability of high 157
resolution mass spectrometry for the analysis of fossil fuels for over two decades 158
(Comisarow and Marshall, 1974; Grigsby, 1989; Hsu et al., 1994; Amster, 1996; 159
Marshall et al., 1998), to date, there has been no detailed, comprehensive 160
characterization of gilsonite using Fourier transform ion cyclotron mass 161
spectrometry (FT-ICR-MS) reported in the literature. The high mass accuracy of 162
FT-ICR-MS makes it possible to differentiate ions in complex mixtures without 163
employing a separation method prior to infusion into the mass spectrometer(Klein 164
et al., 2006). 165
Mass separation is only carried out on charged particles (ions) and therefore 166
the quality of MS data strongly depends on the type of ionization used during 167
sample introduction. Electrospray ionization (ESI) coupled with FT-ICR-MS yields a 168
detailed mass spectrum of ionic organic molecules with highly accurate mass to 169
charge (m/z) determination. Positive ionization and negative ionization modes are 170
selective in favor of chemical moieties capable of bearing positive or negative formal 171
charges, respectively. As anticipated, positive ionization exhibits higher 172
selectivity/sensitivity for nitrogen containing molecules such as amines, amides and 173
nitrogen heterocycles as well as a small number of sodium adducts, while negative 174
ionization shows higher selectivity/sensitivity to acidic moieties such as fatty acids 175
and phenols. 176

11
Smith et al. (2008) used ESI-FT-ICR-MS to characterize heavy vacuum gas 177
oil distillation cuts from Athabasca bitumen and found that the technique could 178
rapidly and reproducibly analyze the polar fraction of petroleum distillates and 179
provide unique molecular formulae assigned to each peak. It has been shown that 180
chemically isolated petroporphyrins can be analyzed by ESI-MS (Van Berkel et al., 181
1993), however, it has not been determined whether they are effectively ionized by 182
ESI in the more complex matrix of un-altered bitumen. 183
It is the objective of this study to characterize the structure of gilsonite 184
bitumen by advanced NMR and FT-ICR-MS techniques. Based on the detailed data 185
provided by the two techniques, we propose a structural model for gilsonite. We 186
believe this is the most comprehensive chemical characterization to date of a fossil 187
fuel sample using a combination of advanced spectroscopic techniques. The protocol 188
used here can be applied to the study of other fossil fuels and related samples, 189
including their extracts, coals, kerogens, algaenans and other bitumens. Finally, the 190
core structures identified in preserved geological samples such as gilsonite will help 191
gain insights into potentially refractory components in nature. 192
193
2. Materials and methods 194
2.1. Geological setting 195
The sample of the bitumen, gilsonite, used in this study was collected in the 196
Uinta Basin near the town of Bonanza, Utah and was provided by Dr. Gary 197
Thompson at Rocky Mountain College, Montana. Uinta Basin covers an area of ca. 198
24,000 square kilometers (Osmond, 1964). Over 2200 m of lacustrine sediments, 199
primarily siliciclastic and carbonate, were deposited there between the late 200

12
Cretaceous and middle Eocene (Picard and High, 1968; Ruble et al., 1994). The 201
source beds of gilsonite were the calcareous oil shales of the Parachute Creek 202
Member (Mahogany Zone) of the Green River Formation, which are rich in organic 203
matter (Bell and Hunt, 1963). 204
205
2.2. NMR spectroscopy 206
Most solid-state NMR experiments, except several spectral editing techniques 207
and long-range dipolar dephasing, were performed on finely ground, but otherwise 208
unaltered gilsonite using a Bruker DSX spectrometer at 100 MHz for 13C, using 209
magic angle spinning (MAS) in a 7 mm double resonance probehead. The high-speed 210
quantitative direct polarization/magic angle spinning (DP/MAS) experiments were 211
run in a 4 mm double resonance probehead. Solid-state 15N cross 212
polarization/magic angle spinning (CP/MAS) and CP/MAS with recoupled dipolar 213
dephasing were performed at 40 MHz for 15N in a 7 mm double resonance 214
probehead. All the solution NMR experiments were conducted by dissolving 215
gilsonite in deuterated chloroform (CDCl3) in a 5 mm triple resonance probehead 216
using a Bruker DRX 400 spectrometer, with 1H and 13C experiments performed at 217
400 and 100 M Hz, respectively. The chemical shifts were calculated using ACD/lab 218
v.12.0. 219
220
2.2.1. Solid-state NMR 221
High-speed quantitative 13C direct polarization/magic angle spinning 222
(DP/MAS) NMR and high-speed quantitative 13C DP/MAS NMR with recoupled 223
dipolar dephasing provide quantitative structural information. These were run at a 224

13
spinning speed of 14 kHz. The 90º 13C pulse length was 4 ms. Recycle delays were 225
tested by the cross polarization/spin lattice relaxation time–total suppression of 226
sidebands (CP/T1-TOSS) technique to ensure that all carbon sites were fully relaxed 227
(Mao et al., 2000). The recycle delay was 150 s and 512 scans were collected. This 228
technique was fully described elsewhere (Mao and Schmidt-Rohr, 2003). In order to 229
highlight mobile aliphatic components, a 13C DP/MAS spectrum with a short recycle 230
delay of 1.5 s was also recorded, with 2000 scans. Recoupled dipolar dephasing for 231
13C DP/MAS NMR at a spinning speed of 14 kHz was employed to obtain 232
quantitative information on the non-protonated carbons and carbons of mobile 233
groups (Mao and Schmidt-Rohr, 2003). The dipolar dephasing time was 68 µs, the 234
recycle delay was 150 s, and 512 scans were collected. 235
Qualitative composition information was obtained with good sensitivity by 236
13C cross polarization/total sideband suppression (CP/TOSS) NMR experiments at a 237
spinning speed of 6.5 kHz and a cross polarization (CP) time of 1 ms, with a 1H 90º 238
pulse length of 4 µs and a 2 s recycle delay. The short recycle delay for CP methods 239
is predicated on the shorter 1H spin-latice relaxation time (compared to 13C) and 240
allows for many more scans to be completed within a given time-frame. Four pulse 241
total suppression of sidebands (TOSS) (Dixon, 1982) was employed before detection 242
and two pulse phase modulated (TPPM) decoupling was applied for optimum 243
resolution. One thousand scans were collected. The corresponding subspectrum with 244
signals of non-protonated carbons and mobile groups such as rotating CH3 was 245
obtained by 13C CP/TOSS combined with 40 µs dipolar dephasing. One thousand 246
scans were obtained with a 2 s recycle delay. 247

14
In order to separate the signals of anomeric carbons (O-C-O) from those of 248
aromatic carbons, both of which resonate between 90 and 120 ppm, the aromatic 249
carbon signals were selectively suppressed by a five pulse 13C chemical shift 250
anisotropy (CSA) filter with a CSA-filter time of 47 µs (Mao and Schmidt-Rohr, 251
2004b). One thousand scans were collected with a 2 s recycle delay. 252
The combined spectrum of immobile CH2 and CH groups was obtained with 253
good sensitivity in a simple spectral editing experiment. First, a 13C CP/TOSS 254
spectrum was recorded using a short CP time of 50 ms. It showed predominantly 255
protonated carbons in immobile segments, but residual peaks of quaternary carbons 256
resulted from two bond magnetization transfer. Second, a 13C CP/TOSS spectrum 257
was recorded using a short CP of 50 ms and 40 ms dipolar dephasing. It contained 258
only the residual signals of quaternary carbons or mobile segments (including CH3 259
groups with >50% efficiency). For both spectra, 2000 scans were collected using a 260
recycle delay of 1 s. The difference of the two spectra was the spectrum of immobile 261
CH2 and CH carbons, with a small CH3 contribution (Mao et al., 2007a). 262
Spectral editing of CH2 signals was achieved by selection of the three spin 263
coherence of CH2 groups, using a 13C 90º pulse and 1H 0º/180º pulses applied after 264
the first quarter of one rotation period with MREV-8 decoupling (Mao and Schmidt-265
Rohr, 2005). A total of 56,728 scans were collected at a 1 s recycle delay and the 266
spinning speed was 5.787 kHz. 267
For CH (methine) selection, a robust method based on C-H multiple quantum 268
coherence (Schmidt-Rohr and Mao, 2002) was used at 4 kHz MAS. CH group 269
multiple quantum coherence was not dephased by the spin-pair CH dipolar coupling 270
while CH2 coherence was dephased by dipolar coupling of the carbons to the two 271

15
protons. The first of a pair of recorded spectra contains signals of CH, as well as 272
residual quaternary carbon and CH3 peaks that were removed by taking the 273
difference with a second spectrum acquired with the same pulse sequence except for 274
additional 40 ms dipolar dephasing before detection. Each spectrum was based on 275
5888 scans with a 1 s recycle delay. 276
Two dimensional (2D) 1H-13C heteronuclear correlation (HETCOR) NMR 277
experiments (Mao and Schmidt-Rohr, 2006) were performed at a spinning speed of 278
6.5 kHz. The scale on which 1H-13C proximities were probed was chosen by the cross 279
polarization method and by 1H spin diffusion before cross polarization. Primarily 280
one bond 1H-13C connectivities were revealed by 0.1 ms of Lee-Goldburg cross 281
polarization (LG-CP), which suppressed 1H-1H spin diffusion during CP. A total of 282
512 scans were collected using a 1.4 s recycle delay. Prolonging LG-CP to 0.5 ms 283
allowed for mostly one and two bond 1H-13C connectivities. Scans (448) were 284
collected with a 0.8 s recycle delay. A 40 µs dipolar dephasing delay was inserted to 285
reveal proximities for non-protonated aromatic carbons to alkyl substituents (Mao 286
et al., 2007a). Scans (512) were accumulated with a 1.4 s recycle delay. The 287
correlations of the carbons to protons within a 4 Å radius were shown with standard 288
Hartmann-Hahn CP (HH-CP) of 0.5 ms, which allowed for some 1H spin diffusion. 289
Scans (192) were collected with a recycle delay of 1.4 s. We used 96 t1 increments of 290
5 µs. 291
Fused aromatic rings were identified by the large number of carbons located 292
far from the protons on the periphery of the structure. The signals of these carbons 293
were selected efficiently by a long-range recoupled C-H dipolar dephasing technique 294
(Mao and Schmidt-Rohr, 2003). In short, two 1H 180º pre-rotation period pulses 295

16
prevented magic angle spinning from averaging out weak CH dipolar couplings. 296
After 0.9 ms of recoupled dipolar dephasing time, the signals of most individual 297
aromatic rings were dephased while those of fused rings remained at the 95% level. 298
In order to detect non-protonated carbons with good relative efficiency, direct 299
polarization/total sideband suppression (DP/TOSS) as described above was used at 300
a spinning speed of 7 kHz. The “γ-integral” was employed to suppress sidebands up 301
to the fourth order (DeAzevedo et al., 2000). The 13C 90º and 180º pulse lengths were 302
4 µs and 8.1 µs, respectively. The details of this technique have been described 303
elsewhere (Mao and Schmidt-Rohr, 2003). For each gilsonite spectrum, the number 304
of scans and recycle delay were 1024 and 20 s, respectively. 305
Two-dimensional 1H-13C wide-line separation (WISE) NMR measurements 306
were performed with 13C decoupling during evolution (Schmidt-Rohr et al., 1992; 307
Tekely et al., 1993; Mao and Schmidt-Rohr, 2006). Two different CP times, 0.1 ms or 308
1 ms, were used. A dipolar dephasing delay of 40 µs was employed to selectively 309
observe signals of non-protonanted and mobile carbons. All WISE experiments used 310
512 scans per t1 increment and 0.5 s recycle delay, except the experiment with 0.1 311
ms CP and 40 µs dipolar dephasing whose number of scans was 2000. We used 96 t1 312
increments of 5 µs. 313
15N CP/MAS was conducted with a contact time of 1 ms and 0.5 s recycle 314
delay (256 scans). In order to observe non-protonated and mobile nitrogen 315
functional groups, 15N CP/MAS with a recoupled dipolar dephasing time of 291 µs 316
was performed. A total of 53,760 scans were recorded with a 0.5 s recycle delay. The 317
spinning speed was 6.5 kHz. 318
319

17
2.2.2. Solution NMR 320
1H NMR of gilsonite with Hahn echo was conducted with a 2 s recycle delay. 321
The interval t in the Hahn echo sequence (π/2 – t – π – t - detection) was varied for a 322
series of experiments. As t increased, the mobile components with long T2 relaxation 323
time survived, but immobile components with short T2 relaxation time were 324
dephased. Sixteen scans were recorded for each spectrum. Gradient enhanced 325
heteronuclear multi-quantum correlation (HMQC) NMR (Vuister et al., 1991) was 326
used to show direct 1H-13C J-couplings. Correlation spectroscopy (COSY) was used 327
to show 1H-1H interactions across three bonds (Aue et al., 1976). Total correlation 328
spectroscopy (TOCSY) NMR (Bax and Davis, 1985) was used to show correlation of 329
proton spins over a relatively long-range (multiple bonds) within a given spin 330
system. 331
332
2.3. Fourier Transform Ion Cyclotron Resonance Mass Spectrometry 333
Gilsonite was analyzed using electrospray ionization (ESI) in both positive 334
ionization and negative ionization modes on a 12 Tesla Bruker Apex-Qe mass 335
spectrometer. For positive ionization, the sample was dissolved in 1:1 336
tetrahydrofuran (THF):methanol (MeOH) with 0.1% trifluoroacetic acid (TFA) and 337
sodium chloride (NaCl). Sodium chloride has been routinely added prior to positive 338
ESI in order to broaden the ionizable fraction of NOM by allowing the formation of 339
sodium adducts in the ion source (Sleighter and Hatcher, 2007). For negative 340
ionization the sample was dissolved in 1:1 THF:MeOH with 0.1% ammonium 341
hydroxide (NH4OH). TFA and NH4OH were added as pH adjusting buffers and 342
were chosen because of their volatility. 343

18
Prior to both analyses the mass analyzer was calibrated using a mixture of 344
polyethylene glycols (PEG). Positive ionization mode mass spectra were calibrated 345
internally using a homologous series of aliphatic amines, while the negative 346
ionization mode was calibrated internally using a homologous series of fatty acids 347
(Sleighter et al., 2008). In both cases the internal calibrants were naturally 348
occurring components of the gilsonite. 349
Gilsonite is a complicated mixture of compounds and thus generates a very 350
complicated spectrum. ‘Data-mining’ techniques, as outlined by several previous 351
studies (Hsu et al., 1994; Hughey et al., 2001; Kujawinski, 2002; Kim et al., 2003; 352
Herniman et al., 2005; Hertkorn et al., 2006; Hockaday et al., 2006; Koch and 353
Dittmar, 2006; Sleighter and Hatcher, 2007), were therefore used to summarize the 354
mass spectral results. Kendrick mass defect analysis (KMDA) (Kendrick, 1963; 355
Grigsby, 1989) was used to identify prominent homologous series within each 356
spectrum to internally calibrate the exact m/z assignments. Once the spectra were 357
calibrated to within 1.0 ppm error (1ppm = 0.0001%), relatively straightforward 358
computational tools were used to obtain exact elemental formula assignments (C, H, 359
N, O, S, Na) for the majority of peaks in the spectrum (Kim et al., 2006). Elemental 360
atom ratios (e.g. O/C, H/C, N/C, etc.) were calculated for all of those peaks that were 361
assigned formulae. From these, we plotted each peak within van Krevelen space 362
(Kim et al., 2003), providing graphical representations that allow a fingerprint 363
characterization of the distribution of ions generated by ESI. Several chemical 364
indices were calculated, which indicate the likely structural character of the 365
molecules that can be inferred from their formulae. These indices include double 366
bond equivalents (DBE) (Hockaday et al., 2006; Koch and Dittmar, 2006), 367

19
€
DBE =1+C −O− S − 12H
(1) 368
condensed aromatic ring structures (CARS) (Hockaday et al., 2006), 369
€
CARS ≡ DBEC
> 0.7 (2)
370
aromatic index (AI) and modified AI (AImod) (Koch and Dittmar, 2006), 371
€
AI ≡ 1+C −O− S − 0.5HC −O− S −N − P
≥ 0.67; AImod ≡1+C − 0.5O− S − 0.5HC − 0.5O− S −N − P
≥ 0.5 (3)
372
aliphatics (Perdue, 1984), 373
€
aliphatics ≡ DBEC
< 0.3 (4)
374
and black carbon (BC) (Kim et al., 2004). 375
€
BC ≡ H /C < 0.8 and 0.3 <O /C > 0.6 (5) 376
Kendrick mass defect analysis (KMDA) was used to identify and enumerate 377
series of structural homologues and commonly observed repeating units within 378
structural compound classes. KMDA is based on the fact that ions within a 379
homologous series have the same difference between the nominal mass and 380
Kendrick mass. The Kendrick mass of the ion was calculated by multiplying the 381
measured mass of the ion by the quotient of the IUPAC mass and nominal mass of 382
the repeating unit (Kendrick, 1963; Grigsby, 1989; Hughey et al., 2001; Stenson et 383
al., 2003). It is important to note that since tandem MS was not used, FT-ICR-MS 384
did not distinguish between structural isomers (Stenson, 2008) and ESI showed 385
considerable selectivity during ionization; thus the chemical indices and KMD 386
series were used to simply constrain the contents of the sample and may have given 387
quantitatively misleading values or reflected isomeric overlap between compound 388
classes. 389

20
390
2.4. Elemental Analysis 391
Triplicate solid gilsonite samples were analyzed for weight percent carbon 392
and nitrogen using a Thermo-Finnegan Flash 1112 series elemental analyzer (EA). 393
The EA was calibrated for both carbon and nitrogen using nicotinamide. 394
395
3. Results 396
3.1. Quantitative 13C NMR spectra 397
Fig. 1a shows the 13C DP/MAS spectrum obtained at a spinning speed of 14 398
kHz, which provided quantitative structural information on the whole sample. 399
Similar to the NMR spectra of other post-diagenetic organic matter samples such as 400
kerogen (Werner-Zwanzinger et al., 2005; Smernik et al., 2006; Mao et al., 2010b), 401
the DP/MAS NMR spectrum of gilsonite has mainly two broad bands: the signals of 402
sp3 hybridized alkyl C from 5–60 ppm and the band of sp2 hybridized carbons such 403
as aromatics around 100–165 ppm. The O alkyls were almost undetectable, as 404
expected for heavily degraded geological samples. Fig. 1b shows the spectrum of 13C 405
DP/MAS with recoupled dipolar dephasing of 68 µs, providing quantitative 406
structural information on non-protonated carbons and carbons of mobile groups 407
such as CH3. Note that the highest peak of the sp2 hybridized aromatic band around 408
100–150 ppm of Fig. 1b did not match that of Fig. 1a: the former at 133 ppm was 409
primarily from non-protonated aromatic carbons and the latter at 128 ppm more 410
attributed to protonated aromatic carbons (see further discussion below). In the 411
alkyl C region, we observed two bands from mobile CCH3 around 17 and 22 ppm, 412
and one from mobile CCH2C groups around 31 ppm. Note that we have highlighted 413

21
the regions where resonances of aromatic C-O and non-protonated aromatic carbons 414
two bonds from O or N were present (Figs. 1a,b). 415
The assignments of signals and the corresponding percentages of different 416
functional groups are listed in Table 1. Specific assignments are difficult because 417
the bands were broad and overlapping; however the interpretation was assisted by 418
spectral editing as described below and in Table 1. 419
420
3.2. NMR spectral editing. 421
Fig. 2 shows a series of 13C CP/MAS NMR spectra acquired with suitably 422
designed radio frequency pulse sequences to selectively detect signals from specific 423
types of chemical groups. Fig. 2a is the 13C CP/TOSS spectrum, which shows 424
qualitative structural information and was used as the reference for the selected 425
sub-spectra (Figs. 2b-g). The corresponding 13C CP/TOSS spectrum after 40 µs of 426
dipolar dephasing (Fig. 2b) exhibited only signals of non-protonated carbons and 427
carbons of mobile groups, including rotating CH3 groups, which had a reduced C-H 428
dipolar coupling due to their fast motions. This spectrum provided similar 429
structural information as in Fig. 1b but with better sensitivity for some peaks. 430
Again, the highest peaks of the aromatic band in Figs. 2a,b did not align exactly. 431
Two bands from mobile CCH3 were observed around 17 and 22 ppm, and one from 432
mobile CCH2 groups around 31 ppm. Some non-protonated quaternary carbons 433
resonating around 40 ppm were also present. 434
The 13C CP/TOSS spectrum after a 13C CSA filter of 47 µs, which exhibited 435
only sp3 hybridized carbon signals, is displayed in Fig. 2c. This technique separates 436
signals of anomerics (O-C-O) from overlapping bands of aromatics (Mao et al., 437

22
2007a; Mao et al., 2007b; Mao et al., 2007c). No contribution from anomeric carbon 438
was observed for the gilsonite sample, indicating that sugar rings were 439
insignificant. Fig. 2c indicates that the 13C signals above 90 ppm all belonged to sp2 440
hybridized carbons. 441
Using a short CP time of 50 µs, primarily protonated carbons were selected; 442
but mobile CH2 and CH3 resonances were significantly suppressed because of their 443
low CP efficiencies (Fig. 2d). In order to suppress residual signals of carbons two 444
bonds from 1H, a spectrum after dipolar dephasing of 40 µs was also acquired. The 445
short CP spectrum subtracted by the spectrum with a double filter of short CP and 446
dipolar dephasing showed primarily immobile protonated carbons. Signals from the 447
CCH3 groups and mobile CCH2 groups were significantly suppressed. There was a 448
small signal from protonated aromatics or C=CH2 around 123 ppm. 449
Fig. 2e shows the CH2 only spectrum of gilsonite obtained by three spin 450
coherence selection (Mao and Schmidt-Rohr, 2005). CH2 contributed a small amount 451
of signal in the sp2 hybridized region, observed around 123 ppm; this band was 452
assigned to exomethylene –C=CH2. Exomethylene was previously identified in 453
natural resins (Anderson et al., 1992; Clifford et al., 1999). Significant CCH2C (non-454
polar alkyl) signals were dominant in this selective spectrum. Clearly, most of the 455
carbons that resonated in the alkyl region belonged to CCH2C groups. Fig. 2f shows 456
the CH only spectrum, acquired using dipolar distortionless enhancement by 457
polarization transfer (DEPT) (Schmidt-Rohr and Mao, 2002); small CCH and 458
aromatic CH signals were observed. Both bands were broad, indicating their wide 459
range of chemical environments. We have highlighted the ppm region where NCH 460
could resonate (Fig. 2f). 461
23
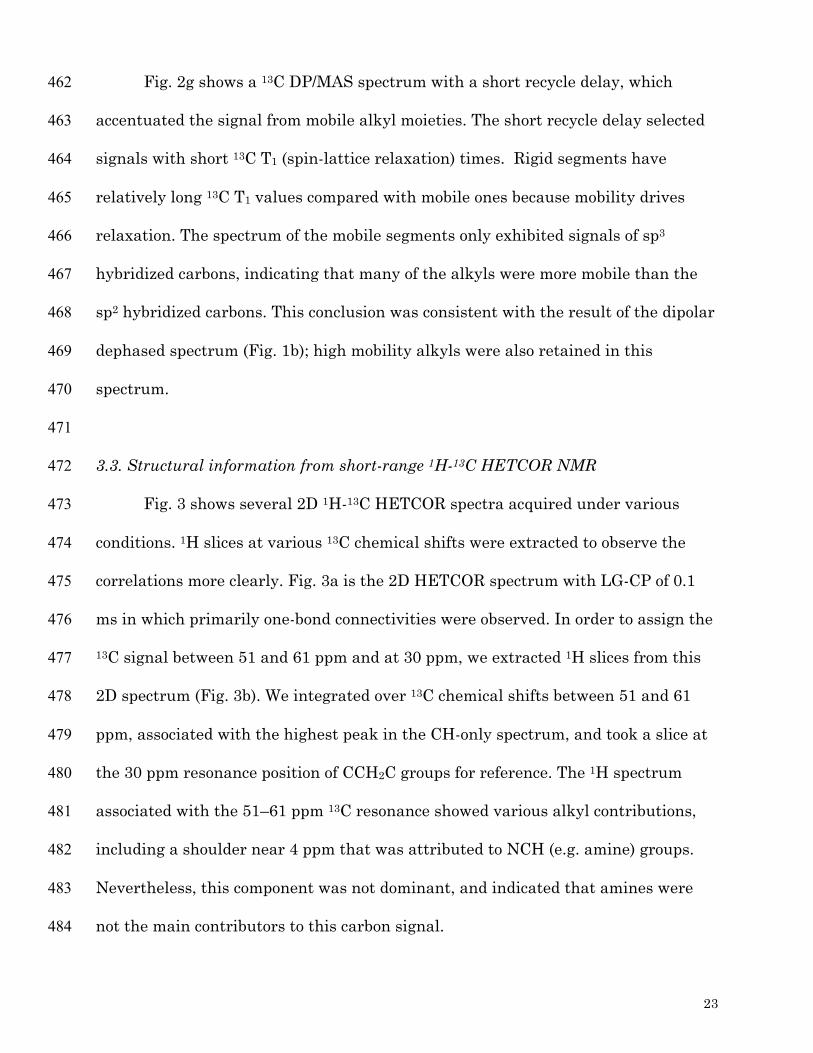
Fig. 2g shows a 13C DP/MAS spectrum with a short recycle delay, which 462
accentuated the signal from mobile alkyl moieties. The short recycle delay selected 463
signals with short 13C T1 (spin-lattice relaxation) times. Rigid segments have 464
relatively long 13C T1 values compared with mobile ones because mobility drives 465
relaxation. The spectrum of the mobile segments only exhibited signals of sp3 466
hybridized carbons, indicating that many of the alkyls were more mobile than the 467
sp2 hybridized carbons. This conclusion was consistent with the result of the dipolar 468
dephased spectrum (Fig. 1b); high mobility alkyls were also retained in this 469
spectrum. 470
471
3.3. Structural information from short-range 1H-13C HETCOR NMR 472
Fig. 3 shows several 2D 1H-13C HETCOR spectra acquired under various 473
conditions. 1H slices at various 13C chemical shifts were extracted to observe the 474
correlations more clearly. Fig. 3a is the 2D HETCOR spectrum with LG-CP of 0.1 475
ms in which primarily one-bond connectivities were observed. In order to assign the 476
13C signal between 51 and 61 ppm and at 30 ppm, we extracted 1H slices from this 477
2D spectrum (Fig. 3b). We integrated over 13C chemical shifts between 51 and 61 478
ppm, associated with the highest peak in the CH-only spectrum, and took a slice at 479
the 30 ppm resonance position of CCH2C groups for reference. The 1H spectrum 480
associated with the 51–61 ppm 13C resonance showed various alkyl contributions, 481
including a shoulder near 4 ppm that was attributed to NCH (e.g. amine) groups. 482
Nevertheless, this component was not dominant, and indicated that amines were 483
not the main contributors to this carbon signal. 484

24
In order to observe correlations between aromatics and alkyl residues, which 485
are separated by at least two bonds, we recorded a 2D HETCOR spectrum with a 486
longer 0.5 ms LGCP contact time (Fig. 3c). It mostly showed one and two bond 1H-487
13C connectivities, i.e. the peaks belonged to 13C and 1H nuclei within 0.25 nm of one 488
another. 1H-13C 2D HETCOR successfully offered better separation between two 489
types of aromatic moieties, namely (i) non-protonated aromatics bonded to alkyls at 490
1H chemical shift of 0.8–1.2 ppm and 13C chemical shift of 133 ppm, and (ii) 491
primarily protonated aromatics or aromatics closer to aromatic protons than alkyl 492
protons with a 1H chemical shift of 7.3 ppm and a 13C chemical shift of 123 ppm. 493
The assignment of the two types of aromatic signals was also based on spectral 494
editing results described above. 1H slices extracted at the alkyl 13C chemical shifts 495
of 17, 31 and 40 ppm showed correlations primarily with their own alkyl protons; 1H 496
slices extracted near the aromatic 13C chemical shifts of 127 and 135 ppm showed 497
correlations with alkyl protons, indicating that these were closely associated with 498
alkyl side chains (Fig. 3d). Fig. 3e displays the 2D HETCOR spectrum with 0.5 ms 499
LGCP and 40-µs dipolar dephasing, which provided spectra selectively of the non-500
protonated (or mobile carbons). The 1H spectrum associated with 13C chemical shifts 501
of 125–145 ppm (Fig. 3f) showed a dominant proton contribution from alkyl H, 502
rather than from aromatic H, indicating that these aromatics were highly 503
substituted. This was further confirmed by a 2D HETCOR spectrum with 0.5 ms 504
Hartmann-Hahn CP with an effective spin diffusion time of 0.125 ms (Fig. 3g); the 505
dominant proton contribution was also from alkyl H. Fig. 3h shows the proton cross 506
section between 115–142 ppm. Thus, by using 1H-13C 2D HETCOR NMR, we have 507
shown that the non-protonated aromatic carbon signal is largely from substituted 508

25
ring carbons connected to alkyls rather than from fused aromatic rings (the other 509
possible source of non-protonated signal). 510
511
3.4. Information on fused aromatic rings based on 1H-13C recoupled long-range 512
dipolar dephasing NMR 513
Fig. 4 shows the use of the 1H-13C recoupled long-range dipolar dephasing 514
technique (Mao and Schmidt-Rohr, 2003) to investigate the presence of fused ring 515
carbons in gilsonite. Fig. 4a shows a series of 13C direct polarization/total 516
suppression of sidebands (DP/TOSS) NMR spectra of gilsonite with increasing 517
recoupled dephasing times. In order to estimate the aromatic cluster size, we 518
compared the dephasing curve of gilsonite with published data of lignin (Brewer et 519
al., 2009), an immature kerogen (Mao et al., 2010a) and charcoal (Mao and Schmidt-520
Rohr, 2003), (Fig. 4b). The dephasing of gilsonite was faster than that of kerogen, 521
which has been estimated to contain an average of six rings per fused aromatic 522
structure, (Mao et al., 2010a) but slower than that of lignin, which contains mostly 523
single benzene rings. This indicated small clusters of ~4 fused aromatic rings in 524
gilsonite. Three and four ring structures in petroleum deposits have been attributed 525
to aromatization of diterpenoid, triterpenoid, sterol, hopane and similar moieties 526
(Killops and Killops, 2005). 527
528
3.5. 2D WISE NMR 529
1H-13C WISE NMR can identify mobile segments, in terms of motional 530
narrowing of 1H wideline spectra. In gilsonite, endgroups of alkyl chains are mobile. 531
WISE NMR helped distinguish mobile and non-protonated carbons, both of which 532
26
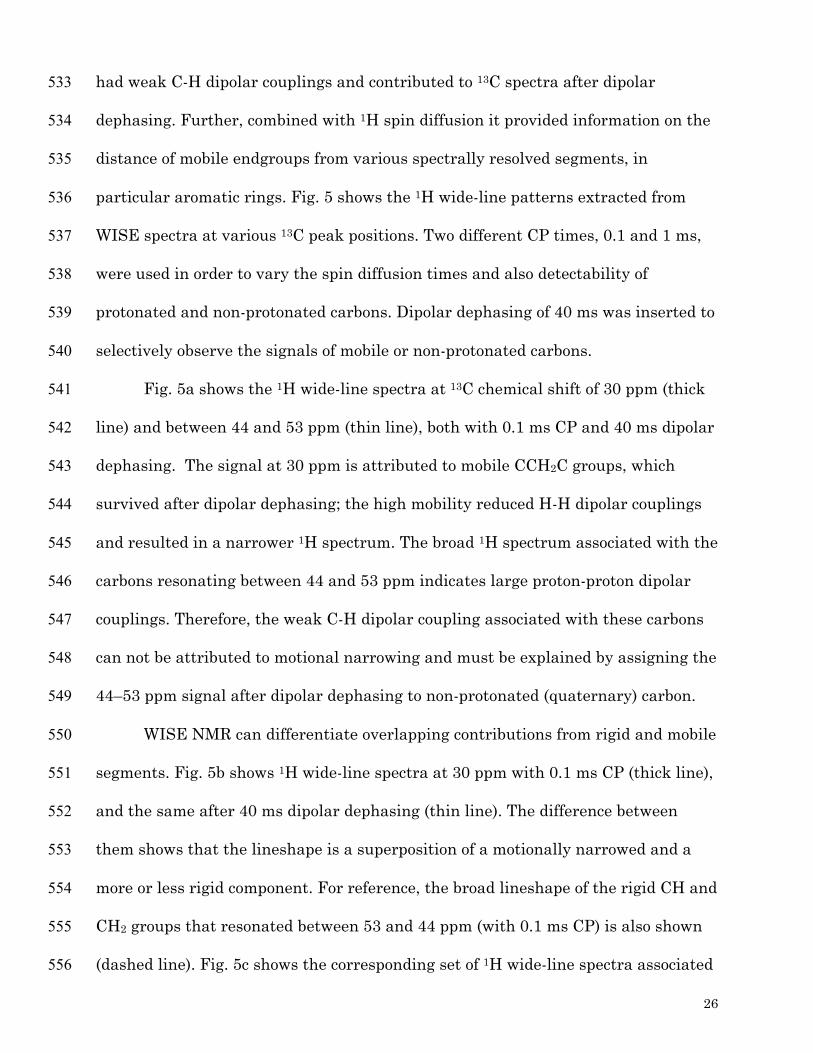
had weak C-H dipolar couplings and contributed to 13C spectra after dipolar 533
dephasing. Further, combined with 1H spin diffusion it provided information on the 534
distance of mobile endgroups from various spectrally resolved segments, in 535
particular aromatic rings. Fig. 5 shows the 1H wide-line patterns extracted from 536
WISE spectra at various 13C peak positions. Two different CP times, 0.1 and 1 ms, 537
were used in order to vary the spin diffusion times and also detectability of 538
protonated and non-protonated carbons. Dipolar dephasing of 40 ms was inserted to 539
selectively observe the signals of mobile or non-protonated carbons. 540
Fig. 5a shows the 1H wide-line spectra at 13C chemical shift of 30 ppm (thick 541
line) and between 44 and 53 ppm (thin line), both with 0.1 ms CP and 40 ms dipolar 542
dephasing. The signal at 30 ppm is attributed to mobile CCH2C groups, which 543
survived after dipolar dephasing; the high mobility reduced H-H dipolar couplings 544
and resulted in a narrower 1H spectrum. The broad 1H spectrum associated with the 545
carbons resonating between 44 and 53 ppm indicates large proton-proton dipolar 546
couplings. Therefore, the weak C-H dipolar coupling associated with these carbons 547
can not be attributed to motional narrowing and must be explained by assigning the 548
44–53 ppm signal after dipolar dephasing to non-protonated (quaternary) carbon. 549
WISE NMR can differentiate overlapping contributions from rigid and mobile 550
segments. Fig. 5b shows 1H wide-line spectra at 30 ppm with 0.1 ms CP (thick line), 551
and the same after 40 ms dipolar dephasing (thin line). The difference between 552
them shows that the lineshape is a superposition of a motionally narrowed and a 553
more or less rigid component. For reference, the broad lineshape of the rigid CH and 554
CH2 groups that resonated between 53 and 44 ppm (with 0.1 ms CP) is also shown 555
(dashed line). Fig. 5c shows the corresponding set of 1H wide-line spectra associated 556

27
with 13C signal at 39 ppm (thick line). Again, differences between the spectra 557
without (thick line) and with dipolar dephasing (thin line) prove that there is a 558
superposition of mobile and rigid components, but with a much smaller contribution 559
from the mobile segments. 560
Finally, Fig. 5d displays 1H wide-line spectra of carbons resonating around 561
140–123 ppm with 0.1 ms CP (thick line), 1 ms CP (thin line), and 1 ms CP and 40 562
ms dipolar dephasing (dashed line). The sharp peaks of mobile alkyl segments 563
became visible, though with low intensity, for the non-protonated aromatic carbons 564
at long cross polarization times of 1 ms. This shows that aromatic cores and mobile 565
alkyl segments are within approximately 2 nm of one another. 566
567
3.6. 15N NMR, with recoupled dipolar dephasing 568
Fig. 6a shows the 15N CP/MAS spectrum of gilsonite without dipolar 569
dephasing, while Fig. 6b shows the 15N CP/MAS spectrum of gilsonite with 291 µs 570
recoupled dipolar dephasing. The 15N CP/MAS spectrum shows only one broad band 571
ranging from 140–110 ppm (Fig. 6a). Protonated pyrrole N (three bonding partners) 572
in five membered rings resonates between 160 and 130 ppm in 15N spectra (Thorn 573
et al., 1996). No significant signals were detected in the 15N CP/MAS with recoupled 574
dipolar dephasing (Fig. 6b), indicating that all N forms are protonated, consistent 575
with pyrrolic N-H groups. Resonances of pyrrolic and amide N overlap heavily, but 576
based on the very low (<1 %) amide signal in the solid-state 13C NMR spectra, we 577
can attribute the majority of the signal observed here to pyrrolic N. 578
579
3.7. Solution NMR 580

28
Fig. 7 shows 1H NMR spectra of gilsonite after various T2 filter times ranging 581
from 0.2–60 ms. The interval t in the Hahn echo sequence (p/2 – t – π – t - detection) 582
was adjusted for each experiment. As τ increases, the signals of highly mobile 583
components with long T2 relaxation time will survive, but those of less mobile 584
components with short T2 relaxation time will dephase. Clearly, the sharp peaks at 585
~1.2 and 0.8 ppm belonged to highly mobile CH2 and CH3 end groups, respectively. 586
The broad components at around 2–3 ppm were assigned to CH2 or CH directly 587
attached to aromatic rings, which had reduced flexibility. The significant intensity 588
of this band (17% of all H) provides evidence of abundant alkyl-aromatic 589
connections. The resonances of NH and CH protons of the pyrrole and other 590
aromatic rings overlapped at around 7–8 ppm. The sharp peak at 7.3 ppm was due 591
to exchanged protons on the deuterated chloroform solvent. 592
The relative 1H NMR signal areas and assignments are listed in Table 2. We 593
also calculated the corresponding carbon signal areas. First, the signal intensity of 594
a CHn group was divided by n, the number of protons per carbon in the group. The 595
resulting numbers were then normalized to a total of 100% and finally corrected for 596
the fraction fnp of non-protonated carbons, which are invisible in 1H NMR but easily 597
determined by 13C NMR, by dividing each entry by (1+ fnp). The results are given in 598
the last column of Table 2. On the basis of these data and those of Table 1, the 599
carbon fractions listed in Table 3 were obtained. 600
Fig. 8 shows the alkyl portion of the 13C solution NMR spectrum of gilsonite, 601
which matched the spectrum published by Clark et al. (1983). We have been able to 602
assign the 10 highest peaks to three specific structures, namely unbranched chain 603
ends, chain segments with a methyl branch, and chain ends with two methyl 604

29
groups, see Fig. 8a-b. Comparison with the solid-state 13C NMR spectrum in Fig. 1 605
and the CH only spectrum in Fig. 2f indicates that a large fraction of the alkyl 606
signals were invisible in 13C solution NMR. For instance, the solid-state NMR 607
spectra showed significant intensity above 40 ppm, which was invisible in solution 608
NMR, probably due to large line widths that resulted from limited mobility. 609
We also recorded two-dimensional COSY and TOCSY 1H NMR as well as 610
HMQC 1H-13C NMR spectra (not shown). The 1H spectra confirmed that various 611
alkyl species are chemically bonded. However, the broad spectral components that 612
account for most of the total signals are not visible in these spectra, and alkyl-613
aromatic cross peaks were not seen in these spectra because the scalar couplings 614
between them are too weak. 615
616
3.8 Elemental analysis 617
The gilsonite sample contained 80.0 ± 0.7% carbon by weight, and 3.3 ± 0.1% 618
nitrogen by weight. For comparison, average values from previous studies (Bell and 619
Hunt, 1963; Clark et al., 1983; Jacob, 1989) are reported in Table 4. This table also 620
compiles elemental compositions calculated from NMR and MS. The NMR 621
elemental data were calculated from the fractions and CHNO compositions of the 622
functional groups in Table 3 (Mao et al., 2000). 623
624
3.9. FT-ICR-MS 625
Negative ionization mode ESI produced a spectrum (Fig. 9a) consisting of 626
1173 resolved peaks (m/z: 226–750), 617 of which were assigned unique molecular 627
formulae (C, H, N, O, S; error < 1 ppm). Positive ionization mode ESI generated a 628

30
spectrum (Fig. 9b) of 599 peaks, 375 of which were assigned unique molecular 629
formulae (C, H, N, O, S, Na; error < 1ppm). Ninety-four of the peaks with assigned 630
formulae (~10%) were present in both positive and negative ionization spectra, 631
indicating that the external and internal calibrations for positive and negative mode 632
are both successful and mutually compatible. The number average molecular weight 633
for the combined positive and negative mode spectra (with redundant peaks 634
removed) was 380 Da, while the peak intensity weighted average molecular weight 635
was 295 Da. 636
The large numbers of peaks observed for gilsonite (Fig. 9) complicated our 637
interpretation of the mass spectral data. However, we have summarized our data 638
and used some relatively simple visualization techniques to characterize the 639
sample. The van Krevelen plot in Fig. 10a was dominated by hydrocarbon peaks 640
(low O/C), lipids (H/C=1.7-2.25; O/C=0.02-0.18), and condensed hydrocarbons 641
(H/C<0.8; O/C<0.5), as well as a smaller number of peaks in the region associated 642
with lignins (H/C=0.8-1.75; O/C=0.2-0.65) (Kujawinski, 2002; Sleighter and 643
Hatcher, 2007). However, NMR results showed that lignins are not quantitatively 644
important constituents of gilsonite, suggesting that the peaks in this region are 645
isomers, were selectively ionized by ESI, or simply had similar H/C and O/C ratios 646
with quite different structures such as CRAM (Hertkorn et al., 2006). It is also 647
apparent from the low N/C ratios that very few peaks represented proteins, but 648
rather partially degraded proteins, degraded petroporphyrins or simply nitrogen 649
heterocycles, amides, or amines (Fig. 10b). 650
Both ESI modes were selective for substituted hydrocarbons. All of the 651
assigned formulae included at least one heteroatom. 99.8% contained N, O, or S, 652

31
while 0.2% were sodium-hydrocarbon adducts. The average (mode) formula included 653
2 heteroatoms (mean value = 3.4 heteroatoms, median value = 3, and no formulae 654
contained more than 14). There was a clear bias in favor of oxygen containing 655
moieties in the negative ionization mode (Table 4). When sorted by peak intensity 656
and number of oxygen atoms in the calculated formula (Fig. 11), we found that the 657
most populated group of peaks and the highest intensity peaks contained two 658
oxygen atoms and likely represented carboxylic acids, which were readily ionized by 659
ESI, but were quantitatively negligible in the sample according to NMR. This 660
suggests that intensity is not an accurate indicator of abundance within the sample, 661
because it is strongly impacted by variations in ionization efficiency. Table 4 662
compares the average bulk C, H, O, N, and S content of the gilsonite obtained from 663
elemental analysis and the average for all of the molecular formulae determined by 664
ESI-FT-ICR-MS (lists of formulae from positive and negative modes combined). 665
This shows that oxygen and sulfur were overrepresented in the ESI ionizable 666
fraction of the gilsonite relative to the bulk, while carbon, primarily due to the over 667
sampling of oxygen, was underrepresented and nitrogen and hydrogen were 668
reflective of the bulk in terms of abundance, but were probably biased toward 669
values typical of charged species. 670
No peaks were observed that were clearly identifiable as previously reported 671
petroporphyrins (Quirke and Maxwell, 1980; Hajibrahim et al., 1981; Gill et al., 672
1985; Clezy et al., 1989; Qian et al., 2008; McKenna et al., 2009). Porphyrins were 673
probably not efficiently ionized by ESI within the complex matrix of gilsonite. 674
Likewise, expanding the molecular formula calculations to include vanadium, 675
cobalt, magnesium, and nickel yielded no previously identified porphyrin molecules. 676

32
However, several ions were observed that had four or more nitrogen atoms, at least 677
20 carbon atoms and zero, one or two metal ion(s). These molecules likely represent 678
partially degraded porphyrins that have retained the tetrapyrrole metal binding 679
core of the original molecule. Most of the nitrogen containing molecules could be 680
accounted for by pyrrolic compounds with alkyl or olefinic side chains, however, 681
they were not readily distinguishable from amines by mass spectrometry alone and 682
may represent structural isomers or mixtures of isomers. 683
Possible lipid biomarkers identified within ESI-FT-ICR-MS spectra were 684
suggestive of both algae and cyanobacteria. A comprehensive suite of 685
polyunsaturated fatty acids including chloroplast fatty acids were identified, as well 686
as some saturated and mono-unsaturated fatty acids typical of bacteria and 687
cyanobacteria (Kenyon, 1972; Canuel et al., 1995). Other potential biomarker ions 688
found within the ICR-MS spectra included phylloquinone (vitamin K; C31H46O2), 689
brassicasterol (indicative of algae; C28H46O), and testosterone (indicates bacteria or 690
animals; C19H28O2). 691
Indices calculated based on the molecular formulae determined for the MS 692
peaks (Equations 1–5; Table 5) suggest that the predominant structural features of 693
ionized molecules present in gilsonite are aliphatic hydrocarbons. Nearly 56% of 694
formulae, representing more than 94% of the total peak intensity, satisfy the 695
definition of the aliphatic index. In fact, KMD analysis (Table 6) suggests that 75% 696
of resolved peaks were part of a CH2 series and therefore contained some aliphatic 697
character while slightly less than 60% were part of a CH series. The CH KMD 698
series could have included tertiary aliphatic carbons, as well as protonated aromatic 699
carbons. The percentage of peaks identified as containing aromatic rings was 700

33
between 7 and 18%, depending on whether the AI > 0.67 or the less conservative 701
AImod > 0.5 criterion was used. All 19 formulae identified as CARS (2.0%) also 702
satisfy the criterion for AImod > 0.5 and BC simultaneously. No formula indices were 703
identified for 34.5% of formulae. As previously mentioned, oxygen containing 704
compounds were heavily selected during negative mode ESI and therefore COO, 705
OCH2, H2O and O KMDA series make up a much larger fraction of the analytical 706
window than they represented as a fraction of the gilsonite sample. 707
708
4. Discussion 709
4.1. Composition from NMR, FT-ICR-MS, and elemental analysis 710
Tables 1–3 indicated that solid-state NMR provided non-destructive, 711
comprehensive, quantitative structural information on gilsonite whereas 1H 712
solution NMR had severe limitations. 13C solid-state NMR showed that 70% of 713
carbon nuclei in gilsonite were in alkyl groups and 27% in aromatics. By contrast, 714
1H solution NMR provided little useful aromaticity information, since most aromatic 715
carbons in this sample were not protonated. The aromatics also did not show up 716
well in solution 13C NMR spectra, due to their low mobility and resulting large line 717
widths. Standard 1H solution NMR could not determine the CH2 to CH ratio in 718
gilsonite, which was reliably estimated from solid-state NMR with spectral editing. 719
On the other hand, the 1H NMR spectrum gave the ratio of CH3 to CH2, which 720
cannot be obtained from solid-state NMR in gilsonite since many CH2 groups had 721
high mobilities similar to those of CH3 groups. The good agreement of elemental 722
composition between elemental analysis and atom ratios calculated from NMR data 723
confirms the reliability of NMR (Table 4). 724

34
Mass spectral data using ESI for gilsonite were less quantitative than solid-725
state NMR, but in many respects confirmed key NMR results. The aliphatic 726
chemical index accounted for 55% of assigned formulas or 94% of the total peak 727
intensity and 75% of assigned formulae were part of a CH2 homologous series. 728
While the C/H ratios from solid-state NMR and FT-ICR-MS were generally in 729
agreement with elemental analysis (Table 3), FT-ICR-MS analysis yields much 730
higher oxygen content (ca. 11%, see Table 3) than the 3–4% found by elemental 731
analysis. This has been attributed to the heavy bias of ESI-MS towards oxygenated 732
and other polar moieties (Klein et al., 2006). MS molecular formulae that contained 733
two oxygen atoms (probably carboxylic acids) dominated the negative mode ESI 734
spectrum. On a quantitative basis, solid-state NMR showed that aromatic C-O 735
accounted for most of the organically bound oxygen, which was only ~2.2% of C. 736
Both NMR and MS data showed that gilsonite was primarily aliphatic. Although 737
the MS data show that some organic acids are present, the NMR results show that 738
carboxylic carbons were extremely minor constituents of gilsonite (less than 0.5%), 739
highlighting the need for a more appropriate and representative ionization method 740
for quantitative characterization of this type of sample, but confirming the 741
conclusions of Klein et al (2006), who indicated that the polar fraction of petroleum 742
samples can be successfully characterized using ESI-FT-ICR-MS with no pre-743
infusion fractionation. 744
Despite the presence of mass spectral peaks with H/C and O/C ratios 745
typically associated with protein and lignin, we found no quantitative NMR 746
evidence for their being present in the sample. If protein were present in 13C NMR 747
detectable quantities, it would have shown a peak near 172 ppm due to N-C=O, 748

35
which was not observed. 15N NMR indicated that much of the organic nitrogen was 749
present as five membered pyrrolic rings. This was consistent with the molecular 750
formula assignments for nitrogen containing peaks. Chlorophylls and their anoxic 751
degradation products consist largely of macrocyclic moieties containing up to four 752
pyrrolic rings. Lignin has typically shown peaks indicating aromatic C-O near 155 753
ppm and OCH3 near 55 ppm in the 13C NMR spectrum, which were not observed in 754
our sample. The fact that nearly all of the FT-ICR-MS formulae in the three-755
dimensional van Krevelen diagram (Fig. 10b) fell along rays which intersect at (N/C 756
= ~0, O/C = ~0, H/C = ~2), suggested that gilsonite consisted largely of a complex 757
array of intermediates of multiple diagenetic/catagenetic processes with chemically 758
and structurally varied starting material (biomolecules) and a far less diverse end-759
point (primarily aliphatic hydrocarbons). 760
If we consider that elemental analysis was suggestive of the molecular 761
formula of some arbitrarily ‘average’ gilsonite molecule, we calculate a formula of 762
C40H61N1O1 with an additional sulfur in ~10% of molecules and an additional 763
oxygen in ~35% of molecules. This gives a DBE of approximately 9, suggesting that 764
no more than two aromatic ring structures are expected per molecule (Benzene 765
DBE=4). This also yields a molecular weight of ~571.5 Da, which is considerably 766
higher than the average MW determined by ESI-MS, but well below the molecular 767
weight reported in Dickie and Yen (1963) for gilsonite and other bitumens. 768
769
4.2. Pyrrole rings 770
Aromatic carbons in gilsonite were either part of five membered (pyrrole) or 771
"regular" six membered aromatic rings. Based on the C/N ratio and the aromatic 772

36
carbon fraction determined by quantitative 13C NMR, we determined an upper limit 773
to the abundance of pyrrole rings. There were 3.5 N per 100 C in gilsonite and for 774
each N in a pyrrole ring, there were four aromatic carbons. Thus, there were no 775
more than 3.5 x 4 = 14 pyrrole carbons per 100 C (14%). Given the 27% aromatic 776
fraction, at least 27–14 = 13% were non-pyrrolic aromatics. 777
The preceding analysis gave only an upper limit (14%) for the pyrrolic carbon 778
fraction. The fraction of carbons that were in fact pyrrolic was estimated based on 779
the signal of non-protonated C at < 133 ppm. Aromatic carbons resonated in this 780
range only if they were at a two-bond distance from N or O (and not bonded to O 781
themselves) (Bovey et al., 1988). Thus, the signal of non-protonated carbons at 782
<133 ppm (11%, shaded in Fig. 1b) was due to C substituted phenols and pyrroles. 783
There were two such carbons per heteroatom, and consequently the contributions 784
from phenols to the nonprotonated carbon signal at <130 ppm must have been twice 785
that of the aromatic C-O observed between 150 and 165 ppm (2.2%, shaded in Fig. 786
1a). Thus, the pyrrolic carbons two bonds from N accounted for approximately 11- 787
4.4% = 7% of all C. Therefore, the pyrrolic carbons accounted for 2 x 7% = 14% of all 788
C, and other aromatics for 27 - 14 = 13%. Further, 14% C in pyrrole rings 789
corresponded to 14/4 = 3.5 N per 100 C. This means that nearly all the N was in 790
pyrrole rings. 791
792
4.3. Highly substituted aromatic rings: refractory organic matter 793

37
The aromatic rings in gilsonite were highly substituted by alkyls. Three 794
independent lines of evidence supported this conclusion. First, quantitative 795
DP/MAS and DP/MAS results (Fig. 1; Table 1) indicated that 77% aromatics were 796
non-protonated and long-range dipolar dephasing data (Fig. 4) clearly showed that 797
the aromatics in gilsonite did not form large clusters of fused aromatic rings. 798
Solution and solid-state NMR agree that aromatic H only account for a small 799
fraction (~5%) of total protons, see Tables 1–3. Specifically, Fig. 1 showed only 800
minor signals from aromatic C-H two bonds from N, which typically resonate at < 801
115 ppm. This demonstrated that the carbons two bonds from N in the pyrrole ring 802
were mostly non-protonated and likely substituted by alkyl segments. Second, 1H-803
13C 2D HETCOR with 40 µs dipolar dephasing (Fig. 3) showed that the protons near 804
non-protonated aromatics were mostly in alkyl groups. Third, the broad band of 1H 805
solution NMR around 2–3 ppm could be attributed to CH2 or CH directly bonded to 806
aromatic rings, which accounted for 1/5 of all alkyl groups, providing further 807
evidence of abundant alkyl-aromatic connections. 808
Our previous studies of kerogen (Mao et al., 2010a) and coal (Mao et al., 809
2010b) indicated that most of the aromatics in these geologically preserved organic 810
matter samples are non-protonated and in moderately sized clusters of fused rings. 811
Coupled with the results in the present study, we hypothesize that non-protonated 812
aromatics, either in the form of fused rings or highly substituted rings, are 813
refractory components in nature. Furthermore, our study of a fulvic acid from 814
Antarctica showed that diagenesis resulted in a significant fraction of non-815
protonated carbons (Mao et al., 2007a), consistent with our hypothesis here. 816

38
Therefore, we propose that non-protonated carbons can be used as a humification 817
index. 818
819
4.4. Structural Model 820
Our results showed that gilsonite bitumen is composed of pyrrole and other 821
aromatic rings highly substituted with alkyl chains. The 1H solution NMR indicated 822
that approximately 14/71 = 20% of the alkyl groups (1 in 5) were bonded to aromatic 823
rings. If most alkyl chains link aromatic rings (Figs. 3 and 5), the linker between 824
the two rings consists of 2 x 5 = 10 alkyl carbons on average. Also, we concluded 825
that 14/27 or about 50% of all aromatic carbons were bonded to alkyl segments. If 826
we assume about 6 aromatic carbons per isolated ring or cluster to be typical, 50% 827
or 3 carbons were bonded to segments of 5 alkyl carbons, giving an average 828
"monomer" of 15 alkyl and 6 aromatic carbons, with alkyl CH3 : alkyl CH2 : alkyl 829
CH : aromatic C ratios of 3 : 11 : 1.5 : 6. The majority of organic oxygen in our 830
gilsonite sample was present as aromatic C-O with only traces of carboxyl and 831
carbonyl groups detected. 832
Based on the information obtained in this study, we have proposed a 833
structural model in which five-membered pyrrole rings and small clusters of fused 834
six-membered rings were connected to, and linked by, alkyl chains of an average 835
length of 10 carbons, see Fig. 12. Whether the pyrrole rings were linked to the fused 836
rings by alkyl chains was not clear from our data. Since pyrrole rings contain fewer 837
carbons than fused six membered aromatic rings, a larger number of pyrrole rings 838
was needed to match the number of carbons in the fused rings. The large fraction of 839
CH2 and small amount of CH groups showed that linear alkyl chains predominate. 840

39
Methyl end- and sidegroups were detected by solution 13C and 1H NMR (Fig. 8), and 841
the methyl branches could account for a large fraction of the observed alkyl CH 842
groups. 843
Clearly, not every molecule of gilsonite resembles the structure in Fig. 12, but 844
molecules exhibiting similar structural features must be very common. We reiterate 845
that gilsonite is a complicated mixture with a broad ranging continuum of 846
fragments with varying molecular weights. The model structure is depicted as a 847
polymeric structure because a significant number of the pyrrole and/or aromatic 848
subunits appear to be connected in an amorphous polymer or network structure. 849
Based on the molecular weight distribution reported here (Table 5 and 6) and 850
elsewhere, the degree of interconnection and the length of the connecting aliphatic 851
chains are probably highly variable. Macrocycles such as petroporphyrins and 852
refractory biomolecules represent a small fraction of the gilsonite. 853
854
4.5. Comparison with Literature 855
ESI-FT-ICR-MS detected a small number of peaks which were suggestive of 856
condensed hydrocarbons similar to earlier studies that suggested that gilsonite 857
contained significant quantities of condensed aromatics or so called asphaltene 858
sheets (Yen et al., 1961; Wen et al., 1978; Clark et al., 1983). However, 13C 859
DP/TOSS long-range dipolar dephasing curves (Fig. 4) indicated that gilsonite 860
contained primarily clusters of only a few fused aromatic rings, which showed that 861
large fused ring molecules such as asphaltene sheets were not present at NMR 862
detectable concentrations in gilsonite. This finding may invalidate much of the 863
conformational information reported previously (Yen et al., 1961) that assumed 864

40
asphaltene sheets were a major structural component of the mixture and indicates 865
the need for reinterpretation of the X-ray diffraction data (Yen et al., 1961). This 866
finding also differentiates gilsonite, and possibly other similar native bitumens, 867
structurally from process asphalts that are byproducts of the oil refinement process. 868
Our results do not rule out the existence of planar sheets in gilsonite, but suggest 869
they are a small fraction of the aromatics or are largely composed of nitrogen 870
containing macrocycles rather than carbonaceous condensed aromatics. 871
Earlier studies involving petroporphyrins in gilsonite suggest an anoxic and 872
therefore relatively rapid and comprehensive preservation of algal material prior to 873
burial and catagenesis as the origin of gilsonite (Quirke et al., 1980b; Ruble et al., 874
1994). Our results are consistent with this view. The presence of aromatic molecules 875
in gilsonite suggested that either (i) a more comprehensive suite of biomolecules 876
survived diagenesis than a typical algaenan (e.g. Botryococcus braunii), (ii) the 877
dominant species of algae present during sedimentation produced algaenan similar 878
to Chlorella marina, which was shown to yield aromatic hydrocarbons upon 879
pyrolysis (Derenne et al., 1996), or (iii) that the pyrrolic moieties within the 880
porphyrin core of algal pigments was efficiently preserved. It is not surprising that 881
we observed six membered aromatic rings since it has been commonly reported that 882
six membered aromatic rings have been preserved and/or produced during 883
diagenesis and catagenesis (North, 1985; Killops and Killops, 2005). Our results did 884
not indicate a significant contribution from lignin, preserved structural features of 885
which have been observed in coal samples (Behar and Hatcher, 1995). Earlier 886
studies have also suggested that gilsonite and other native bitumens experienced 887
relatively low temperature catagenesis based on the preservation of thermally labile 888

41
biomarkers (Eglinton et al., 1979). Our finding of extremely low abundance or 889
absence of condensed aromatics, which form during high temperature catagenesis 890
and charring, supported this as well. Exomethylene, which was detected and 891
identified by 13C NMR, has often been associated with cyclization and cross linking 892
reactions that occur during diagenesis and catagenesis and remove olefinic 893
character from biogenic resins (Clifford et al., 1999). 894
Possible environmental sources of pyrrole rings include degraded pigments 895
(Quirke and Maxwell, 1980; Quirke et al., 1980b; Hajibrahim et al., 1981; Leenheer, 896
2003; Leenheer, 2009) and Maillard reaction products from protein and 897
carbohydrate starting materials (Hodge, 1953; Hayase et al., 1989). The bulk 898
structure of gilsonite does not resemble that of modern chlorophylls or their 899
degradation products in plants or algae (Brown et al., 1984; Takamiya et al., 2000). 900
For chlorophylls, there are methyl or ethyl groups on the pyrrole rings, the CH3 of 901
which would have resonated at around 9 ppm for 13C (2 ppm for 1H) and 16 ppm for 902
13C (1.3 ppm for 1H), respectively. These signals were not observed in gilsonite. 903
While some chlorophyll products such as petroporphyrins may have been preserved 904
with the chlorin ring intact, our results suggest that the majority of the macrocycles 905
must have been opened (Leenheer, 2003) and most of the unsaturated bonds must 906
have been hydrogenated. It might be suggested that Maillard or other similar 907
biomolecular reaction products might have provided significant sources of pyrrole 908
rings in gilsonite; however, it was shown recently that the Maillard reaction 909
produces mostly non-protonated N (Fang and Schmidt-Rohr, 2009), while N in 910
gilsonite is mostly protonated. 911

42
Electrospray FT-ICR-MS provided an extensive database of molecular 912
formulae for polar constituents of gilsonite. ESI provided supporting evidence for 913
the NMR detected presence of primarily pyrrolic nitrogen compounds in gilsonite 914
and revealed several peaks that were likely structurally very similar to 915
petroporphyrins. Petroporphyrins, hydrocarbons, and other non-polar molecules 916
may be more readily ionizable by employing liquid injection field desorption 917
ionization (Smith et al., 2008), laser induced acoustic desorption (Pinkston et al., 918
2009), or atmospheric pressure photo-ionization (Purcell et al., 2007; Qian et al., 919
2008; McKenna et al., 2009) in place of ESI, and these modes of ionization should be 920
used in addition to ESI in the characterization studies of mostly hydrophobic 921
natural organic mixtures in the future. The lack of mass spectral differentiation 922
between structural isomers using FT-ICR-MS suggests that a physical or chemical 923
separation method such as extraction, reversed phase liquid chromatography, or gel 924
permeation chromatography would be useful prior to infusion into the mass 925
spectrometer. The need for further development of tandem MS methods that are 926
compatible with FT-ICR-MS (Sleighter, 2009) is similarly indicated. A more 927
representative mass spectral database would provide further insights into the 928
molecular formulae present in natural organic mixtures, would better complement 929
the NMR techniques demonstrated in this study, and would better facilitate the 930
proposal of model molecular structures. 931
The new structural information obtained using advanced NMR techniques, 932
especially the structural model proposed, represents a significant step forward in 933
the comprehensive chemical characterization of gilsonite bitumen. While the use of 934
ultrahigh resolution mass spectrometry is hampered somewhat by the selective 935

43
ionization of ESI, it is clear that the ability to accurately calculate molecular 936
formulae based on mass spectral data has extraordinary potential as an analytical 937
tool. 938
939

44
ACKNOWLEDGMENT: We would like to thank the National Science Foundation 940
(EAR-0843996) and the Donors of the Petroleum Research Fund, administered by 941
the American Chemical Society Grant 46373-G2 for financial support. We also 942
thank Dr. Gary G. Thompson for technical support and Dr. Rachel Sleighter for 943
assistance with FT-ICR-MS. Dr. Hussain Abdulla, Dr. Sylvie Derenne, and two 944
anonymous reviewers provided extremely helpful comments on this manuscript. 945
946
REFERENCES 947
Abraham, H., 1945. Asphalts and allied Substances. Van Nostrand, New York. 948 Amster, J.I., 1996. Fourier transform mass spectrometry. Journal of Mass Spectrometry 31, 949
1325-1337. 950 Anderson, K.B., Winans, R.E., Botto, R.E., 1992. The nature and fate of natural resins in the 951
geosphere-II. identification, classification and nomenclature of resinites. Organic 952 Geochemistry 18, 829-841. 953
Aue, W.P., Bartholdi, E., Ernst, R.R., 1976. Two dimensional spectroscopy application to 954 nuclear magnetic resonance. Journal of Chemical Physics 64, 2229-2246. 955
Baker, E.W., Yen, T.F., Dickie, J.P., Rhodes, R.E., Clark, L.F., 1967. Mass spectrometry of 956 porphyrins. II. Characterization of petroporphyrins. Journal of the American Chemical 957 Society 89, 3631-3639. 958
Bax, A., Davis, D.G., 1985. MLEV-17-Based Two-dimensional homonuclear magnetization 959 transfer spectroscopy. Journal of Magnetic Resonance 65(2), 355-360. 960
Behar, F., Hatcher, P.G., 1995. Artificial coalification of a fossilwood from brown coal by 961 confined system pyrolysis. Energy & Fuels 9, 984-994. 962
Bell, K.G., Hunt, J.M., 1963. Native bitumens associated with oil shales. In: L.A. Breger (Ed.), 963 Organic Geochemistry. Elsevier, Amsterdam. 964
Bovey, F.A., Jelinski, L., Mirau, P.A., 1988. Nuclear Magnetic Resonance Spectroscopy. 965 Academic Press, San Diego, CA. 966
Brewer, C.E., Schmidt-Rohr, K., Satrio, J.A., Brown, R.C., 2009. Characterization of biochar 967 from fast pyrolysis and gasification systems. Environmental Progress and Sustainable 968 Energy 28(3), 386-396. 969
Brown, C.E., Spenser, R.B., Burger, V.T., Katz, J.J., 1984. Cross-polarization/magic-angle 970 sample-spinning 13C NMR spectroscopic study of chlorophyll a in the solid state. 971 Proceedings of the National Academy of Sciences of the United States of America 81, 972 641-644. 973
Canuel, E.A., Cloern, J.E., Ringelberg, D.B., Guckert, J.B., Rau, G.H., 1995. Molecular and 974 isotopic tracers used to examine sources of organic matter and its incorporation into the 975 food webs of San Francisco Bay. Limnoogy and Oceanography 40(1), 67-81. 976
Clark, D., Wilson, R., Quirke, J.M.E., 1983. An evaluation of the potential of ESCA (electron 977 spectroscopy for chemical applications) (and other spectroscopic techniques) in the 978

45
surface and bulk characterisation of kerogens, brown coal and gilsonite. Chemical 979 Geology 39, 215-239. 980
Clezy, P.S., Fookes, C.J.R., Prashar, J.K., 1989. The chemistry of pyrrolic compounds LXI. 981 Petroporphyrins from the Julia Creek Oil Shale: Further evidense for the derivation of 982 aetiotype petroporphyrins from chlorophyll. Australian Journal of Chemistry 42, 775-983 786. 984
Clifford, D.J., Hatcher, P.G., Botto, R.E., Muntean, J.V., Anderson, K.B., 1999. The nature and 985 fate of natural resins in the geosphere IX. Structure and maturation similarities of soluble 986 and insoluble polylabdanoids isolated from tertiary class I resinites. Organic 987 Geochemistry 30, 635-650. 988
Comisarow, M.B., Marshall, A.G., 1974. Frequency-sweep fourier transform ion cyclotron 989 resonance spectroscopy. Chemical Physics Letters 26(4), 489-490. 990
Conte, P., Spaccini, R., Piccolo, A., 2004. State of the art of CPMAS 13C-NMR spectroscopy 991 applied to natural organic matter. Progress in Nuclear Magnetic Resonance Spectroscopy 992 44, 214-223. 993
Corwin, A.H., 1959. Petro porphyrins. Proceedings of the 5th World Petroleum Congress New 994 York 5(109). 995
DeAzevedo, E.R., Hu, W.-G., Bonagamba, T.J., Schmidt-Rohr, K., 2000. Principles of 996 centerband-only detection of exchange in solid-state nuclear magnetic resonance, and 997 extension to four-time centerband-only detection of exchange. Journal of Chemical 998 Physics 112(20), 8988-9001. 999
Dennis, l.W., Maciel, G.E., Hatcher, P.G., Simoneit, B.R.T., 1982. 13C nuclear magnetic 1000 resonance studies of kerogen fom Cretaceous black shales thermally altered by basaltic 1001 intrusions and laboratory simulations. Geochimica Et Cosmochimica Acta 46, 901-907. 1002
Derenne, S., Largeau, C., Berkaloff, C., 1996. First example of an algaenan yielding an aromatic-1003 rich pyrolysate. Possible geochemical implications on marine kerogen formation. Organic 1004 Geochemistry 24(6/7), 617-627. 1005
Dixon, W.T., 1982. Spinning-sideband-free and spinning-sideband-only NMR spectra in 1006 spinning samples. Journal of Chemical Physics 77, 1800-1809. 1007
Eglinton, G., Hajibrahim, S.K., Maxwell, J.R., Quirke, J.M.E., Shaw, G.T., Volkman, J.K., 1008 Wardroper, A.M.K., 1979. Lipids of aquatic sediments, recent and ancient. Transactions 1009 of the Royal Society 293(1400), 69-91. 1010
Fang, X., Schmidt-Rohr, K., 2009. Fate of the amino acid in glucose-glycine melanoidins 1011 investigated by solid-state nuclear magnetic resonance (NMR). Journal of Agricultural 1012 and Food Chemistry 57(22), 10701-10711. 1013
Gill, J.P., Evershed, R.P., Chicarelli, M.I., Wolff, G.A., Maxwell, J.R., Eglinton, G., 1985. 1014 Capillary gas chromatographic-mass spectrometric studies of the petroporphyrins of the 1015 gilsonite bitumen (Eocene, U.S.A). Journal of Chromatography 350, 37-62. 1016
Grantham, P.J., Douglas, A.G., 1977. Carboxylic acids in some Uinta Basin bitumens. In: R. 1017 Campos, and Goñi, J. (Ed.), Advances in Organic Geochemistry, pp. 193-207. Enadimsa, 1018 Madrid. 1019
Grigsby, R.D., 1989. Processing of high resolution mass spectral data by use of Kendrick masses 1020 in a rectangular array. In: T.R. Ashe, and Wood, K. V. (Ed.), Novel Techniques in Fossil 1021 Fuel Mass Spectrometry, pp. 172-193. American Society for Testing and Materials, 1022 Philidelphia. 1023
Hajibrahim, S.K., Quirke, J.M.E., Eglinton, G., 1981. Petroporphyrins V. Structurally-related 1024 porphyrin series in bituments, shales and petroleums - Evidence from HPLC and mass 1025 spectrometry. Chemical Geology 32, 173-188. 1026

46
Hatcher, P.G., Schnitzer, M., Dennis, L.W., Maciel, G.E., 1981. Aromaticity of humic 1027 substances in soils. Journal of the Soil Society of America 45, 1089-1094. 1028
Hatcher, P.G., Spiker, E.C., Szeverenyi, N.M., Maciel, G.E., 1983. Selective preservation and 1029 origin of petroleum-forming aquatic kerogen. Nature 305, 498-501. 1030
Hayase, F., Nagaraj, R.H., Miyata, S., Njoroge, F.G., Monnier, V.M., 1989. Aging of proteins: 1031 Immunological detection of a glucose-derived pyrrole formed during maillard reaction in 1032 vivo. Journal of Biological Chemistry 263(7), 3758-3764. 1033
Herniman, J.M., Langley, G.J., Bristow, T.W.T., O’Connor, G., 2005. The validation of exact 1034 mass measurements for small molecules using FT-ICRMS for improved confidence in 1035 the selection of elemental formulas. Journal of the American Society of Mass 1036 Spectrometry 16, 1100-1108. 1037
Hertkorn, N., Benner, R., Frommberger, M., Schmitt-Kopplin, P., Witt, M., Kaiser, K., Kettrup, 1038 A., Hedges, J.I., 2006. Characterization of a major refractory component of marine 1039 dissolved organic matter. Geochimica Et Cosmochimica Acta 70, 2990. 1040
Hockaday, W.C., Grannas, A.M., Kim, S., Hatcher, P.G., 2006. Direct molecular evidence for 1041 the degradation and mobility of black carbon in soils from ultrahigh-resolution mass 1042 spectral analysis of dissolved organic matter from a fire-impacted forest soil. Organic 1043 Geochemistry 37, 501-510. 1044
Hodge, J.E., 1953. Dehydrated foods: Chemistry of browning reactions in model systems. 1045 Journal of Agricultural and Food Chemistry 1, 928-943. 1046
Hsu, C.S., Llang, Z., Campanas, J.E., 1994. Hydrocarbon characterization by ultrahigh resolution 1047 Fourier transform ion cyclotron resonance mass spectrometry. Analytical Chemistry 66, 1048 850-855. 1049
Hu, J.Z., Harper, J.K., Taylor, C., Pugmire, R.J., Grant, D.M., 2000. Modified spectral editing 1050 methods for 13C CP/MAS experiments in solids. Journal of Magnetic Resonance 142, 1051 326-330. 1052
Hughey, C.A., Hendrickson, C.L., Rodgers, R.P., Marshall, A.G., 2001. Kendrick mass defect 1053 spectrum: a compact visualanalysis for ultrahigh-resolution broadband mass spectra. 1054 Analytical Chemistry 73, 4676-4681. 1055
Jacob, H., 1989. Classification, structure, genesis and practical importance of natural solid oil 1056 bitument ("migrabitumen"). International Journal of Coal Geology 11, 65-79. 1057
Keeler, C., Maciel, G.E., 2000. 13C NMR spectral editing of humic materials. Journal of 1058 Molecular Structure 550-551, 297-305. 1059
Kendrick, E., 1963. A mass scale based on CH2 = 14.0000 for high resolution mass spectrometry 1060 of organic compounds. Analytical Chemistry 35(13), 2146-2154. 1061
Kenyon, C.N., 1972. Fatty acid composition of unicellular strains of blue-green algae. Journal of 1062 Bacteriology 109(2), 827-834. 1063
Killops, S., Killops, V., 2005. Introduction to Organic Geochemistry. Blackwell Publishing, 1064 Boston, MA. 1065
Kim, S., Kaplan, L.A., Benner, R., Hatcher, P.G., 2004. Hydrogen-deficient molecules in natural 1066 riverine water samples evidence for the existence of black carbon in DOM. Marine 1067 Chemistry 92, 225-234. 1068
Kim, S., Kramer, R.W., Hatcher, P.G., 2003. Graphical method for analysis of ultrahigh-1069 resolution broadband mass spectra of natural organic matter, the van Krevelen diagram. 1070 Analytical Chemistry 75, 5336-5344. 1071
Kim, S., Rodgers, R.P., Marshal, A.G., 2006. Truly 'exact' mass: Elemental composition can be 1072 determined uniquely from molecular mass measurements at 0.1 mDa accuracy for 1073 molecules up to 500 Da. International Journal of Mass Spectrometry 251(2-3), 260-265. 1074

47
Klein, G.C., Angstrom, A., Rodgers, R.P., Marshal, A.G., 2006. Use of 1075 Saturates/Aromatics/Resins/Asphaltenes (SARA) fractionation to determine matrix 1076 effects in crude oil analysis by electrospray ionization Fourier transform ion cyclotron 1077 resonance mass spectrometry. Energy & Fuels 20, 668-672. 1078
Koch, B.P., Dittmar, T., 2006. From mass to structure: An aromaticity index for high-resolution 1079 mass data of natural organic matter. Rapid Communications in Mass Spectrometry 20, 1080 926-932. 1081
Kujawinski, E.B., 2002. Electrospray ionization Fourier transform ion cyclotron resonance mass 1082 spectrometry (ESI FT-ICR MS): Characterization of complex environmental mixtures. 1083 Environmental Forensics 3, 207-216. 1084
Leenheer, J.A., 2003. Comprehensive characterization of dissolved and colloidal organic matter 1085 in waters associated with groundwater recharge at the Orange County Water District, 1086 final report to the Orange County Water District, Fountain Valley, California,. U. S. 1087 Geological Survey, Washington D.C. 1088
Leenheer, J.A., 2009. Systematic approaches to comprehensive analyses of natural organic 1089 matter. Annals of Environmental Science 3, 1-130. 1090
Maciel, G.E., Bronniman, C.E., Ridenour, C.F., 1993. H-1-NMR spectroscopy - approaches for 1091 carbonaceous solids. Advances in chemistry Series 229, 27-44. 1092
Mao, J., Fang, X., Lan, Y., Schimmelmann, A., Mastalerz, M., Xu, L., Schmidt-Rohr, K., 2010a. 1093 Chemical and nanometer-scale structure of kerogen and its change during thermal 1094 maturation investigated by advanced solid-state 13C NMR spectroscopy Geochimica Et 1095 Cosmochimica Acta 74(7), 2110-2127. 1096
Mao, J.-D., Cory, R.M., McKnight, D.M., Schmidt-Rohr, K., 2007a. Characterization of a 1097 nitrogen-rich fulvic acid and its precursor algae from solid state NMR. Organic 1098 Geochemistry 38(8), 1277-1292. 1099
Mao, J.-D., Fang, X., Schmidt-Rohr, K., Carmo, A.M., Hundal, L.S., Thompson, M.L., 2007b. 1100 Molecular-scale heterogeneity of humic acid in particle-size fractions of two Iowa soils. 1101 Geoderma 140, 17-29. 1102
Mao, J.-D., Hu, W.-G., Schmidt-Rohr, K., Davies, G., Ghabbour, E.A., Xing, B., 2000. 1103 Quantitative characterization of humic substances by solid-state carbon-13 nuclear 1104 magnetic resonance. Journal of the Soil Science Society of America 64, 873-884. 1105
Mao, J.-D., Schimmelmann, A., Mastalerz, M., Hatcher, P.G., Li, Y., 2010b. Structural features 1106 of a bituminous coal and their changes during low-temperature oxidation and loss of 1107 volatiles investigated by advanced solid-state NMR spectroscopy. Energy & Fuels 24, 1108 2536-2544. 1109
Mao, J.-D., Schmidt-Rohr, K., 2003. Recoupled long-range C-H dipolar dephasing in solid-state 1110 NMR, and its use for selection of fused aromatic rings. Journal of Magnetic Resonance 1111 162(1), 217-227. 1112
Mao, J.-D., Schmidt-Rohr, K., 2004a. Accurate quantification of aromaticity and nonprotonated 1113 aromatic carbon fraction in natural organic matter by 13C solid-state nuclear magnetic 1114 resonance. Environmental Science and Technology 38(9), 2680-2684. 1115
Mao, J.-D., Schmidt-Rohr, K., 2004b. Separation of aromatic-carbon 13C NMR signals from di-1116 oxygen alkyl bands by a chemical-shift-anisotropy filter. Solid State Nuclear Magnetic 1117 Resonance 26, 36-45. 1118
Mao, J.-D., Schmidt-Rohr, K., 2005. Methylene spectral editing in solid-state 13C NMR by 1119 three-spin coherence selection. Journal of Magnetic Resonance 176(1), 1-6. 1120
Mao, J.-D., Schmidt-Rohr, K., 2006. Absence of mobile carbohydrate domains in dry humic 1121 substances proven by NMR, and implications for organic-contaminant sorption models. 1122 Environmental Science and Technology 40(6), 1751-1756. 1123

48
Mao, J.-D., Tremblay, L., Gagne, J.-P., Kohl, S., Rice, J., Schmidt-Rohr, K., 2007c. Humic acids 1124 from particulate organic matter in the Saguenay Fjord and the St. Lawrence Estuary 1125 investigated by advanced solid-state NMR. Geochimica Et Cosmochimica Acta 71(22), 1126 5483-5499. 1127
Marshall, A.G., Hendrickson, C.L., Jackson, G.S., 1998. Fourier transform ion cyclotron 1128 resonance mass spectrometry: A primer. Mass Spectrometry Reviews 17, 1-35. 1129
McKenna, A.M., Purcell, J.M., Rodgers, R.P., Marshall, A.G., 2009. Identification of vanadyl 1130 porphyrins in a heavy crude oil and raw asphaltene by atmospheric pressure 1131 photoionization Fourier transform ion cyclotron (FT-ICR) mass spectrometry. Energy & 1132 Fuels 23, 2122-2128. 1133
Meyer, R.F., Attanasi, E.D., Freeman, P.A., 2007. Heavy oil and natural bitumen resources in 1134 geological basins of the world (open form document No. 2007-1084), pp. 1-42. U.S. 1135 Geological Survey, Reston, VA. 1136
Mikinis, F.P., Smith, J.W., Maughan, E.K., Maciel, G.E., 1982. Nuclear magnetic resonance: a 1137 technique for direct evaluation of source-rock potential. American Association of 1138 Petroleum Geologists Bulletin 66, 1396-1401. 1139
Nanny, M.A., Minear, R.A., Leenheer, J.A., 1997. Nuclear Magnetic Resonance Spectroscopy in 1140 Environmental Chemistry, . In: Topics in Environmental Chemistry. Oxford University 1141 Press, New York. 1142
North, F.K., 1985. Petroleum Geology. Allen & Unwin, Boston. 1143 Osmond, J.C., 1964. Guidebook to the geology and mineral resources of the uinta basin. In: E.F. 1144
Sabatka (Ed.), 13th Annual Field Conference of the Intermountain Association of 1145 Petroleum Geologists, pp. 47-58. Intermountain Association of Petroleum Geologists. 1146
Perdue, E.M., 1984. Analytical constraints on the structural features of humic substances. 1147 Geochimica Et Cosmochimica Acta 48, 1435-1442. 1148
Picard, M.D., High, L.R., 1968. Sedimentary cycles in the Green River Formation (Eocene), 1149 Uinta Basin, Utah. Journal of Sedimentary Research 38, 378-383. 1150
Pinkston, D.S., Duan, P., Gallardo, V.A., Habicht, S.C., Tan, X., Qian, K., Gray, M., Mullen, K., 1151 Kenttamaa, H.I., 2009. Analysis of asphaltenes and asphaltene model compounds by 1152 laser-induced acoustic desorption/Fourier transfrom ion cyclotron resonance mass 1153 spectrometry. Energy & Fuels 23, 5564-5570. 1154
Preston, C.M., 1996 Appication of NMR to soil organic matter analysis: history and prospects. 1155 Soil Science 16, 144-166. 1156
Purcell, J.M., Hendrickson, C.L., Rodgers, R.P., Marshall, A.G., 2007. Atmospheric pressure 1157 photoionization proton transfer for complex organic mixtures investigated by Fourier 1158 transform ion cyclotron resonance mass spectrometry. Journal of the American Society of 1159 Mass Spectrometry 18(9), 1682-1689. 1160
Qian, K., Mennito, A.S., Edwards, K.E., Ferrughelli, D.T., 2008. Observation of vanadyl 1161 porphyrins and sulfer-containing vanadyl porphyrins in a petroleum asphaltene by 1162 atmospheric pressure photoionization Fourier transform ion cyclotron resonance mass 1163 spectrometry. Rapid Communications in Mass Spectrometry 22, 2153-2160. 1164
Quirke, J.M.E., Maxwell, J.R., 1980. Petrophyrins III. Characterisation of a C32 aetioporphyrin 1165 from gilsonite as the bis[porphyrinato-mercurcy(II) acetato]mercury(II) complex. Origin 1166 and significance. Tetrahedron 36, 3453-3456. 1167
Quirke, J.M.E., Maxwell, J.R., Eglinton, G., 1980a. Petrophyrins IV. Nuclear overhauser 1168 enhancement 1H NMR studies of deoxophylloerythroetio porphyrins from gilsonite. 1169 Tetrohedron Letters 21, 2987-2990. 1170
Quirke, J.M.E., Shaw, G.J., Soper, P.D., Maxwell, J.R., 1980b. Petroporphyrins II. The presence 1171 of porphyrins with extended alkyl substituents. Tetrahedron 36, 3261-3267. 1172

49
Ruble, T.E., Bakel, A.J., Philip, R.P., 1994. Compound specific isotopic variability in Uinta 1173 Basin native bitumens: paleoenviromental implications. Organic Geochemistry 21, 661-1174 671. 1175
Schmidt-Rohr, K., Clauss, J., Spiess, H.W., 1992. Correlation of structure, mobility, and 1176 morphological information in heterogeneous polymer materials by two-dimensional 1177 wideline-separation NMR spectroscopy. Macromolecules 25(12), 3273-3277. 1178
Schmidt-Rohr, K., Mao, J.-D., 2002. Efficient CH-group slection and identification in 13C solid-1179 state NMR by dipolar DEPT and 1H chemical-shift filtering. Journal of the American 1180 Chemical Society 124, 13938-13948. 1181
Schoell, M., Hwang, R.J., Carlson, R.M.K., Welton, J.E., 1994. Carbon isotopic composition of 1182 individual biomarkers in gilsonites. Organic Geochemistry 21, 673-683. 1183
Sleighter, R.L., 2009. Export of terrestrial dissolved organic matter along a river to ocean 1184 transect of the lower Chesapeake Bay investigated by advanced analytical techniques. In: 1185 Chemistry and Biochemistry PhD, pp. 241. Old Dominion University, Norfolk, VA. 1186
Sleighter, R.L., Hatcher, P.G., 2007. The application of electrospray ionization coupled to 1187 ultrahigh resolution mass spectrometry for the molecular characterization of natural 1188 organic matter. Journal of Mass Spectrometry 42, 559-574. 1189
Sleighter, R.L., McKee, G.A., Liu, Z., Hatcher, P.G., 2008. Naturally present fatty acids as 1190 internal calibrants for Fourier transform mass spectra of dissolved organic matter. 1191 Limology and Oceanography Methods 6, 246-253. 1192
Smernik, R.J., Schwark, L., Schmidt, M.W.I., 2006. Assessing the quantitative reliability of 1193 solid-state C-13 NMR spectra of kerogens across a gradient of thermal maturity. Solid 1194 State Nuclear Magnetic Resonance 29(4), 312-321. 1195
Smith, D.F., Rahimi, P., Teclemariam, A., Rodgers, R.P., Marshall, A.G., 2008. Characterization 1196 of athabasca bitumen heavy vacuum gas oil distillation cuts by negative/positive 1197 electrospray ionization and automated liquid injection field desorption ionization Fourier 1198 transform ion cyclotron resonance mass spectrometry. Energy & Fuels 22, 3118-3125. 1199
Solum, M.S., Pugmire, R.J., Grant, D.M., 1989. C-13 solid-state NMR of Argonne premium 1200 coals Energy & Fuels 3, 187-193 1201
Stenson, A.C., 2008. Reversed-phase chromatography fractionation tailored to mass spectral 1202 characterization of humic substances. Environmental Science and Technology 42, 2060-1203 2065. 1204
Stenson, A.C., Marshall, A.G., Cooper, W.T., 2003. Exact masses and chemical formulas of 1205 individual suwannee river fulvic acids from ultrahigh resolution electrospray ionization 1206 fourier transform ion cyclotron resonance mass spectra. Analytical Chemistry 75, 1275-1207 1284. 1208
Sugihara, J.M., McGee, L.R., 1957. Porphyrins in gilsonite. Journal of Organic Chemistry 22, 1209 795. 1210
Takamiya, K.-I., Tsuchiya, T., Ohta, H., 2000. Degradation pathway(s) of chlorophyll: what has 1211 gene cloning revealed? Trends in Plant Science 5(10), 426-431. 1212
Tekely, P., Palmas, P., Mutzenhardt, P., 1993. Elimination of hetero-nuclear dipolar interactions 1213 from carbon-13-detected proton spectra in wide-line separation nuclear magnetic 1214 resonance spectroscopy. Macromolecules 26, 7363-7365. 1215
Thorn, K.A., Goldenburg, W.S., Younger, S.J., Weber, E.J., 1996. Covalent binding of aniline to 1216 humic substances: Comparison of nucleophilic addition, enzyme-, and metal-catalyzed 1217 reactions by 15N NMR. In: J.S. Gaffney, N.A. Marley, S.B. Clark (Eds.), Humic and 1218 fulvic acids: Isolation, structure, and environmental role, pp. 299-326. American 1219 Chemical Society, Washington, DC. 1220

50
Treibs, A., 1934. Organic minerals III. Chlorophyll and hemin derivatives in bituminous rocks, 1221 petroleums, mineral waxes and asphalts. Origin of petroleum. Justus Liebigs Annalen der 1222 Chemie 510, 42-62. 1223
Treibs, A., 1936. Chlorophyll and hemin derivatives in organic mineral substances. Angewandte 1224 Chemie 49, 682-686. 1225
Tripp, B.T., White, E.R., 2006. Gilsonite. In: J.E. Kogel, Trivedi, N. C., Barker, J. M., and 1226 Krukowski, S. T. (Ed.), Industrial Minerals and Rocks: Commodities, Markets, and Uses, 1227 pp. 481-493. Society for Mining, Metallurgy, and Exploration, Littleton, CO. 1228
Van Berkel, G.J., Quinones, M.A., Quirke, J.M.E., 1993. Geoporphyrin analysis using 1229 electrospray ionization-mass spectrometry. Energy & Fuels 7, 411-419. 1230
Vuister, G.W., Boelens, R., Kaptein, R., 1991. Gradient-enhanced HMQC and HSQC 1231 spectroscopy - Applications to N-15-labeled MNT repressor. Journal of the American 1232 Chemical Society 113(25), 9688-9690. 1233
Wen, C.S., Chilingarian, G.V., Yen, T.F., 1978. Properties and structure of bitumens. In: G.V. 1234 Chilingarian, and Yen, T. F. (Ed.), Developments in Petroleum Science 7: Bitumens, 1235 Asphalts, and Tar Sands. Elsevier, Amsterdam. 1236
Werner-Zwanzinger, U., Lis, G., Mastalerz, M., Schimmelmann, A., 2005. Thermal maturity of 1237 type II kerogen from the New Albany Shale assessed by 13C CP/MAS NMR. Solid State 1238 Nuclear Magnetic Resonance 27, 140-148. 1239
Wilson, M.A., 1987. NMR Techniques and Applications in Geochemistry and Soil Chemistry. 1240 Pergamon Press, Oxford, U. K. 1241
Wilson, M.A., Hanna, J.V., Anderson, K.B., Botto, R.E., 1993. 1H CRAMPS NMR derived 1242 hydrogen distributions in various coal macerals. Organic Geochemistry 20(7), 985-999. 1243
Wu, X., Burns, S.T., Zilm, K.W., 1994. Spectral editing in CP/MAS NMR. Generating 1244 subspectra based on proton multiplicities. Journal of Magnetic Resonance 111, 29-36. 1245
Wu, X., Zilm, K.W., 1993. Complete spectral editing in CP/MAS NMR. Journal of Magnetic 1246 Resonance A 102. 1247
Yen, T.F., 2000. The realms and definitions of asphaltenes. In: T.F. Yen, and Chilingarian, G. V. 1248 (Ed.), Developments in Petroleum Science 40B: Asphaltenes and Asphalts, 2, pp. 7-27. 1249 Elsevier, Amsterdam. 1250
Yen, T.F., Erdman, J.G., Pollack, S.S., 1961. Investigation of the structure of petroleum 1251 asphaltenes by X-ray diffraction. Analytical Chemistry 33(11), 1587-1594. 1252
1253 1254
1255

51
FIGURE CAPTIONS 1256
Fig. 1. Quantitative spectra of (a) DP/MAS and (b) DP/MAS with 68 µs recoupled 1257
dipolar dephasing showing non-protonated carbons and mobile segments such as 1258
CH3. The resonances of aromatic C-O and of non-protonated aromatic C two bonds 1259
from O or N are highlighted. 1260
1261
Fig. 2. Spectral editing for identification of functional groups in 13C NMR. (a) 1262
CP/TOSS spectrum for reference. (b) Dipolar-dephased CP/TOSS spectrum showing 1263
non-protonated carbons and mobile segments such as CH3. (c) Selection of sp3-1264
hybridized carbon signals by a chemical shift anisotropy filter. (d) Selection of 1265
immobile CH and CH2 signals with residual CH3. (e) Signals of immobile CH2 1266
groups selected based on three-spin-coherence. (f) CH-only spectrum (by dipolar 1267
DEPT), and (g) DP spectrum with a short, 1.5 s, recycle delay. 1268
1269
Fig. 3. 1H-13C 2D HETCOR spectra of (a) with LG-CP of 0.1 ms whose extracted 1270
proton slices between 51–61 ppm and at 30 ppm are listed in (b); (c) with LG-CP of 1271
0.5 ms and its extracted proton slices at 17, 31, 40, 127, and 135 ppm in (d); (e) with 1272
LG-CP of 0.5 ms and dipolar dephasing of 40 µs and extracted proton slices between 1273
125–145 ppm in (f); and (g) with HHCP of 0.5 ms and its slices between 115–142 1274
ppm in (h). 1275
1276
Fig. 4. (a) Series of DP/TOSS spectra after recoupled dipolar dephasing of the 1277
indicated durations of gilsonite. (b) Corresponding long-range dipolar dephasing 1278

52
curves for non-protonated aromatic carbons in gilsonite, integrated between 108 1279
and 145 ppm. S/S0 refers to the aromatic signal from the dipolar dephased 1280
spectrum as a fraction of the signal in the reference spectrum. Data for wood 1281
charcoal and lignin (Mao and Schmidt-Rohr, 2003) are shown for reference. Filled 1282
diamonds: gilsonite; open hexagons: wood char; and open squares: lignin. 1283
1284
Fig. 5. 1H wideline spectra extracted from 2D 1H-13C wideline separation (WISE) 1285
NMR at 13C chemical shift of (a) 53–44 ppm (thin line) and 30 ppm (thick line), both 1286
with 0.1 ms CP and 40 µs dipolar dephasing delay; (b) 30 ppm (thick line) and 44–53 1287
ppm (dashed line) with 0.1 ms CP, and 30 ppm with 0.1 ms CP and 40 µs dipolar 1288
dephasing delay (thin line; same data as that in (a) but with less line broadening); 1289
(c) 39 ppm (thick line) and ~44–53 ppm (dashed line) with 0.1 ms CP, and 39 ppm 1290
with 0.1 ms CP and 40 µs dipolar dephasing delay (thin line); and (d) ~140–123 1291
ppm, acquired under the conditions of 0.1 ms CP (thick line), 1 ms CP (thin line), 1292
and 1 ms CP combined with 40 µs dipolar dephasing delay (dashed line). 1293
1294
Fig. 6. 15N CP/MAS spectra (a) without dipolar dephasing and (b) with 291 µs 1295
recoupled 1H-15N dipolar dephasing, which suppresses the signals of protonated 1296
nitrogen. 1297
1298
Fig. 7. 1H spectra with various T2 filter times ranging from 0.2–60 ms. The sharp 1299
peak at 7.3 ppm was caused by proton exchange with the solvent, deuterated 1300
chloroform. 1301

53
1302
Fig. 8. (a) Alkyl region of the 13C solution NMR spectrum of gilsonite. 1303
Assignments of the ten highest peaks to three structures, shown in (b), are 1304
indicated above the spectrum. The chemical shifts for these structures were 1305
calculated using the ACD Lab v.12.0 software. 1306
1307
Fig. 9. (a) Positive and (b) negative electrospray ionization FT-ICR mass spectra for 1308
gilsonite. Inset spectra have y-axis scales enhanced by one order of magnitude. 1309
1310
Fig. 10. (a) Van Krevelen diagram and (b) 3-D van Krevelen diagram for formula 1311
assignments from positive (black) and negative (gray) electrospray ionization. 1312
1313
Fig. 11. Incidence of heteroatoms expressed as (a) percentage of formulae 1314
containing a given number of heteroatoms (O, S, and N), and (b) percentage of total 1315
peak intensity represented by formulae with a given number of heteroatoms. 1316
1317
Fig. 12. Model of the main components of gilsonite, based on the data obtained 1318
here. A typical "monomer unit" containing one aromatic ring and 21 carbons in 1319
total is outlined by the dashed ellipse. 1320
1321

54
TABLES. 1322
Table 1 1323 Quantitative integration results from 13C DP/MAS, 13C DP/MAS with recoupled 1324 dipolar dephasing and spectral editing. 1325
Integration range (ppm)
Predominant Structural Moieties
DP/MAS Refined using DP dipolar dephasing and spectral editing
5-27 CH3 +CH2 25%
27-60
Alkyl CH2 and CH
45% 38% CH2
6.2% CH (CH selection) 1.1% CQuaternary (dipolar dephasing)
60-100 Alkyl OC 0.3% Non-protonated C (dipolar dephasing)
100-165 Aromatic +
alkene
29%
19% non-protonated aromatic C-C (dipolar dephasing) 5.7% aromatic CH
2.3% exomethylene =CH2 2.2% (150-165 ppm) aromatic C-O
165-185
Amides, carboxylic
acids, esters (N/O-C=O)
0.8% Non-protonated C (dipolar dephasing)
185-220 Ketones,
aldehydes, quinines (C=O)
0 Non-protonated C (dipolar dephasing)
1326

55
1327
Table 2 1328 Signal intensities in solution 1H NMR, and corresponding carbon fractions, given 1329 the fraction of non-protonated carbons from 13C NMR. 1330
ppm Functional Group
1H NMR
Intensity
Corresponding
C Fraction
0-1 Alkyl CH3 26% 13%
1-2 Alkyl CH1.8 52% 43%
2-5 CH1.8 bonded to aryl 17% 14%
6-9 Aromatic CH + NH 4.5% 7%
-- Non-protonated C -- 23%
1331
1332
Table 3 1333 Functional group quantification from combined NMR data of Tables 1 and 2. 1334
Functional Group C Percentage
NMR
Alkyl CH3 13%
Alkyl CH2 50%
Alkyl CH 7%
=CH2 2%
Aromatic CH 6%
Aromatic C-C
(non-protonated) 19%
Aromatic C-O 2.2%
NC=O 1%
1335
1336

56
Table 4 1337 Comparison of elemental analysis with average molecular formulas determined 1338 from NMR and electrospray Fourier transform ion cyclotron mass spectra (ESI-FT-1339 ICR-MS). Carbon and nitrogen were measured using a Thermo-Finnegan Flash 1340 1112 series elemental analyzer. N/A: Not measured. 1341
Elemental Analysis*
Solid-State NMR
ESI-FT-ICR-MS
number weighted
ESI-FT-ICR-MS
intensity weighted
*Carbon wt. % 80 (84.0) 83% 73.77 74.46
*Hydrogen wt. %
(10.67) 11% 9.43 12.01
*Nitrogen wt. %
3.3 (2.40) ≥ 3% 3.18 0.33
*Sulfur wt. % (0.50) N/A 2.47 0.99
*Oxygen wt. % (3.74) 3.2% 11.14 12.19
*H/C atomic ratio
(1.51) 1.49 1.53 1.92
*Values in parentheses are averages based on literature values (Bell and Hunt, 1342 1963; Clark et al., 1983; Jacob, 1989). 1343 1344
1345
1346

57
Table 5 1347 Summary of peaks conforming to 5 formula indices: condensed aromatic ring 1348 structures (CARS), aromatic index (AI), aliphatic, and black carbon. 1349
CARS
(Hockaday et
al., 2006)
AI>0.67 (Koch and
Dittmar, 2006)
Modified AI>0.5 (Koch and
Dittmar, 2006)
Aliphatic (Perdue, 1984)
Black Carbon (Kim et al.,
2004)
No. of Peaks 19 66 161 518 82
% of Peaks 2.0% 7.1% 17.3% 55.6% 8.8%
% Peak Height 0.2% 0.5% 1.4% 94.0% 0.6%
Number ave. MW 479 410 398 397 423
Height Ave. MW 370 384 369 293 391
1350

58
Table 6 1351 Homologous series identified by Kendrick mass defect analysis (KMDA). 1352
CH2 CH OCH2 COO H2 H2O O
# of series 125 188 139 62 157 150 162
# of peaks in series
702 555 330 126 610 343 395
As % of total peaks
74.84 59.17 35.18 13.43 65.03 36.57 42.11
# of series with >4 peaks
52 29 4 0 54 0 3
Average # of peaks per series
5 2 2 2 3 2 2
1353
1354
1355
1356
1357
1358

59
FIGURES 1359
1360

60
1361
1362
1363
1364

61
1365

62
1366
1367
1368
1369
1370
1371
1372
1373
1374

63
1375
1376
1377
1378

64
1379

65
1380
1381
1382
1383
1384
1385
1386

66
1387
1388
Fig. 9. Helms et al. 1389
1390
1391
1392

67
1393
Fig. 10. Helms et al. 1394
1395
1396
1397
1398
1399
1400

68
1401
Fig. 11. Helms et al. 1402
1403
1404
1405

69
1406