Structural assessment of minor axis steel joints using photoelasticity and finite elements
13
Journal of Constructional Steel Research 65 (2009) 466–478 www.elsevier.com/locate/jcsr Structural assessment of minor axis steel joints using photoelasticity and finite elements Luciano R.O. de Lima a,* , Jos´ e L. de F. Freire b , Pedro C.G. da S. Vellasco a , Sebasti˜ ao A.L. de Andrade c , Jos´ e G.S. da Silva d a Structural Engineering Department, UERJ - State University of Rio de Janeiro, Brazil b Mechanical Engineering Department, PUC-Rio - Pontifical Catholic University of Rio de Janeiro, Brazil c Civil Engineering Department, PUC-Rio - Pontifical Catholic University of Rio de Janeiro, Brazil d Mechanical Engineering Department, UERJ - State University of Rio de Janeiro, Brazil Received 13 August 2007; accepted 31 January 2008 Abstract Traditionally, the steel portal frame design assumes that beam-to-column joints are rigid or pinned. However, it is largely recognized that the great majority of joints do not exhibit such idealized behaviour transmitting bending moments with non-negligible rotations. These joints are called semi-rigid and their design should be performed according to their actual structural behaviour. When minor axis beam-to-column joints are considered, the adopted design process generally assumes a flexible response although this is not true for the great majority of structural joints. Minor axis joints present a distinct behaviour that differentiates them from major axis joints. In fact, the absence of transverse stiffeners implies that the column web must resist all the tensile and compressive forces arising from the beam flanges in bending, akin to a plate supported on its vertical sides. In order to evaluate this component’s behaviour, this paper presents a comparison between results obtained from a finite element model analysis and experiments. The experimental programme was based on the use of reflection photoelasticity techniques to determine the column web stress and strain distribution present in minor axis semi-rigid joints. This technique, although widely used for determining stress and strain distributions in other applications, was first used in this investigation to determine the semi-rigid joints structural response. c 2008 Elsevier Ltd. All rights reserved. Keywords: Structural steel joints; Minor axis semi-rigid joints; Finite element modelling; Photoelasticity 1. Introduction Traditionally, the steel portal frame design assumes that beam-to-column joints are rigid or pinned. Rigid joints, where no relative rotations occur between the connected members, transfer not only substantial bending moments, but also shear and axial forces. On the other extreme, pinned joints are characterized by almost free rotation movement between the connected elements thus preventing the transmission of bending moments [1,2]. Despite these facts, it is largely recognized that the great majority of joints do not exhibit such idealized behaviour. In fact, the great majority of joints transfer bending moments with non-negligible rotations. These joints are called semi- rigid, and their design should be performed according to their * Corresponding author. Tel.: +55 21 25877537; fax: +55 21 25877537. E-mail address: [email protected] (L.R.O. de Lima). actual structural behaviour. This is explained by the fact that in semi-rigid frames the internal force distributions, lateral displacement magnitudes and collapse modes are functions of the joint flexibility. To estimate the actual behaviour of such joints, extensive research studies have been carried out over the last few years [1–5], leading to code specifications that enable the determination of the moment rotation characteristics of major axis beam-to-column joints, beam-to-beam joints and column bases, as stated in the Eurocode 3, Part 1.8 [6]. When minor axis beam-to-column joints are considered, the adopted design process generally assumes a flexible response, although this is not true for the great majority of structural joints. Given that no code provisions currently exist for semi- rigid minor axis joints, a mechanical model was developed [5], in accordance with the principles of Eurocode 3, Part 1.8 [6], to determine the joint’s structural behaviour. This particular mechanical model will be fully described in the next section 0143-974X/$ - see front matter c 2008 Elsevier Ltd. All rights reserved. doi:10.1016/j.jcsr.2008.01.030
Transcript of Structural assessment of minor axis steel joints using photoelasticity and finite elements
Journal of Constructional Steel Research 65 (2009) 466–478www.elsevier.com/locate/jcsr
Structural assessment of minor axis steel joints using photoelasticityand finite elements
Luciano R.O. de Limaa,∗, Jose L. de F. Freireb, Pedro C.G. da S. Vellascoa,Sebastiao A.L. de Andradec, Jose G.S. da Silvad
a Structural Engineering Department, UERJ - State University of Rio de Janeiro, Brazilb Mechanical Engineering Department, PUC-Rio - Pontifical Catholic University of Rio de Janeiro, Brazil
c Civil Engineering Department, PUC-Rio - Pontifical Catholic University of Rio de Janeiro, Brazild Mechanical Engineering Department, UERJ - State University of Rio de Janeiro, Brazil
Received 13 August 2007; accepted 31 January 2008
Abstract
Traditionally, the steel portal frame design assumes that beam-to-column joints are rigid or pinned. However, it is largely recognized that thegreat majority of joints do not exhibit such idealized behaviour transmitting bending moments with non-negligible rotations. These joints arecalled semi-rigid and their design should be performed according to their actual structural behaviour. When minor axis beam-to-column joints areconsidered, the adopted design process generally assumes a flexible response although this is not true for the great majority of structural joints.Minor axis joints present a distinct behaviour that differentiates them from major axis joints. In fact, the absence of transverse stiffeners impliesthat the column web must resist all the tensile and compressive forces arising from the beam flanges in bending, akin to a plate supported on itsvertical sides. In order to evaluate this component’s behaviour, this paper presents a comparison between results obtained from a finite elementmodel analysis and experiments. The experimental programme was based on the use of reflection photoelasticity techniques to determine thecolumn web stress and strain distribution present in minor axis semi-rigid joints. This technique, although widely used for determining stress andstrain distributions in other applications, was first used in this investigation to determine the semi-rigid joints structural response.c© 2008 Elsevier Ltd. All rights reserved.
Keywords: Structural steel joints; Minor axis semi-rigid joints; Finite element modelling; Photoelasticity
1. Introduction
Traditionally, the steel portal frame design assumes thatbeam-to-column joints are rigid or pinned. Rigid joints, whereno relative rotations occur between the connected members,transfer not only substantial bending moments, but also shearand axial forces. On the other extreme, pinned joints arecharacterized by almost free rotation movement between theconnected elements thus preventing the transmission of bendingmoments [1,2].
Despite these facts, it is largely recognized that the greatmajority of joints do not exhibit such idealized behaviour. Infact, the great majority of joints transfer bending momentswith non-negligible rotations. These joints are called semi-rigid, and their design should be performed according to their
∗ Corresponding author. Tel.: +55 21 25877537; fax: +55 21 25877537.E-mail address: [email protected] (L.R.O. de Lima).
0143-974X/$ - see front matter c© 2008 Elsevier Ltd. All rights reserved.doi:10.1016/j.jcsr.2008.01.030
actual structural behaviour. This is explained by the fact thatin semi-rigid frames the internal force distributions, lateraldisplacement magnitudes and collapse modes are functions ofthe joint flexibility. To estimate the actual behaviour of suchjoints, extensive research studies have been carried out overthe last few years [1–5], leading to code specifications thatenable the determination of the moment rotation characteristicsof major axis beam-to-column joints, beam-to-beam joints andcolumn bases, as stated in the Eurocode 3, Part 1.8 [6].
When minor axis beam-to-column joints are considered, theadopted design process generally assumes a flexible response,although this is not true for the great majority of structuraljoints. Given that no code provisions currently exist for semi-rigid minor axis joints, a mechanical model was developed [5],in accordance with the principles of Eurocode 3, Part 1.8 [6],to determine the joint’s structural behaviour. This particularmechanical model will be fully described in the next section

L.R.O. de Lima et al. / Journal of Constructional Steel Research 65 (2009) 466–478 467
Fig. 1. Minor axis steel joint mechanical model.
of this paper to clarify its application to characterise the minoraxis beam-to-column joints behaviour.
In this kind of joint (Fig. 1), the global response iscontrolled by the column web in the bending component,due to the absence of vertical stiffeners. This fact impliesthat the column web must resist the tensile and compressivepatch forces arising from the beam flanges in bending. Variousexperimental techniques may be used to evaluate its behaviour.In order to evaluate this component’s response, this paperpresents results obtained from experiments made by applyingphotoelasticity technique to minor axis beam-to-column joints.This is followed by the description of finite element simulationsof this complex structural problem. The comparison betweenthe numerical and experimental results enabled a consistentevaluation of the effective width, a key factor in determiningthis component’s behaviour that is fundamental to the jointdesign. It is also important to observe that this was the firsttime that reflection photoelasticity experiments were used tocharacterize the structural response of minor axis beam-to-column joints.
2. Minor axis beam-to-column joints
The behaviour of beam-to-column joints can be evaluatedwith the aid of the component method, largely adopted inresearch investigations and recently incorporated in Eurocode3 [6] by means of a mechanical model based on association ofsprings in series and/or parallel, Fig. 1. From the theoreticalpoint of view, it can be applied to any kind of joint,provided that the basic sources of strength and deformation areproperly identified and modelled [3]. These sources, commonlydenoted as joint components (springs in the mechanical model),represent a specific part of a joint that, dependent on the type ofloading, contributes to one or more of its structural properties.A typical mechanical model for a minor axis beam-to-columnjoint, composed of double web angles and two transversestiffeners welded to the column web, is illustrated in Fig. 1. Therelevant components (together with its numbering sequenceadopted in the Eurocode 3) are: (6) web angle in bending,(7) beam flange and web in compression, (8) beam web intension, (10) bolts in tension, (11) bolts in shear, (12) beamweb, beam flange, web angle and seat angle in bearing, and (21)column web in bending. In general, each of these components is
characterised by a non-linear force-deformation curve, althoughsimpler idealisations are possible whenever only the resistanceor the initial stiffness of the joint is required.
Minor axis joints present a distinct structural behaviourdifferent from that of major axis joints. In fact, the absenceof vertical stiffeners implies that the column web must resistthe tensile and compressive patch forces arising from the beamflanges in bending. This additional source of deformation isrepresented by the new component (21) and it is still not presentin Eurocode 3 [6].
According to Lima et al. [1] and Neves et al. [20], theevaluation of this component is directly related to the columnweb effective width (beff,1) presented in Fig. 2(a). The loadedregion, delimited by dimensions b and c in Fig. 2(a), containsthe effective width used in the column web in bendingcomponent. The effective width evaluation can be made withthe aid of Eq. (1). However, due to the stiffener presence,this effective width (beff,2) should be re-evaluated with Eq.(2)-Fig. 2(b). It is important to observe that this componentbehaviour is not yet considered in the Eurocode 3 [6]. Thispaper presents reflection photoelasticity experiments that werelater compared to FEM simulations. With these results inhand, it was possible to evaluate the actual value of theeffective width to be considered in the component behaviour.The experimental programme was made in the Structures andMaterials Laboratory of the Pontifical Catholic University ofRio de Janeiro, Brazil. One of the most significant contributionsof the test was the use of a reflection photoelasticity platelocated at the column web. More details about this techniquewill be presented in the following sections.
beff,1 = c + (L − b) · tgθ, (1)
where:
b and c are the loaded region width and height;
L is the distance between the column flanges;
θ is the angle depicted in Fig. 2(a).
beff,2 = c + (L − b) · tgθ − 2 · ts, (2)
where:
ts is the stiffener thickness.
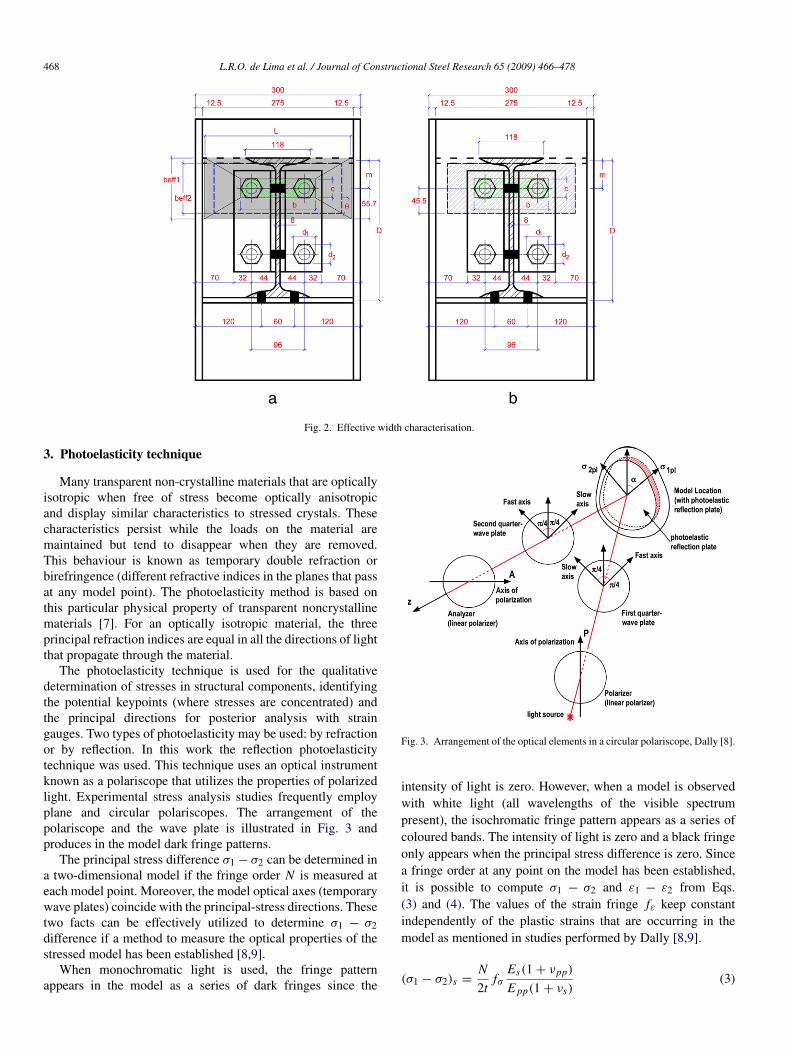
468 L.R.O. de Lima et al. / Journal of Constructional Steel Research 65 (2009) 466–478
Fig. 2. Effective width characterisation.
3. Photoelasticity technique
Many transparent non-crystalline materials that are opticallyisotropic when free of stress become optically anisotropicand display similar characteristics to stressed crystals. Thesecharacteristics persist while the loads on the material aremaintained but tend to disappear when they are removed.This behaviour is known as temporary double refraction orbirefringence (different refractive indices in the planes that passat any model point). The photoelasticity method is based onthis particular physical property of transparent noncrystallinematerials [7]. For an optically isotropic material, the threeprincipal refraction indices are equal in all the directions of lightthat propagate through the material.
The photoelasticity technique is used for the qualitativedetermination of stresses in structural components, identifyingthe potential keypoints (where stresses are concentrated) andthe principal directions for posterior analysis with straingauges. Two types of photoelasticity may be used: by refractionor by reflection. In this work the reflection photoelasticitytechnique was used. This technique uses an optical instrumentknown as a polariscope that utilizes the properties of polarizedlight. Experimental stress analysis studies frequently employplane and circular polariscopes. The arrangement of thepolariscope and the wave plate is illustrated in Fig. 3 andproduces in the model dark fringe patterns.
The principal stress difference σ1 − σ2 can be determined ina two-dimensional model if the fringe order N is measured ateach model point. Moreover, the model optical axes (temporarywave plates) coincide with the principal-stress directions. Thesetwo facts can be effectively utilized to determine σ1 − σ2difference if a method to measure the optical properties of thestressed model has been established [8,9].
When monochromatic light is used, the fringe patternappears in the model as a series of dark fringes since the
Fig. 3. Arrangement of the optical elements in a circular polariscope, Dally [8].
intensity of light is zero. However, when a model is observedwith white light (all wavelengths of the visible spectrumpresent), the isochromatic fringe pattern appears as a series ofcoloured bands. The intensity of light is zero and a black fringeonly appears when the principal stress difference is zero. Sincea fringe order at any point on the model has been established,it is possible to compute σ1 − σ2 and ε1 − ε2 from Eqs.(3) and (4). The values of the strain fringe fε keep constantindependently of the plastic strains that are occurring in themodel as mentioned in studies performed by Dally [8,9].
(σ1 − σ2)s =N
2tfσ
Es(1+ νpp)
E pp(1+ νs)(3)
L.R.O. de Lima et al. / Journal of Constructional Steel Research 65 (2009) 466–478 469
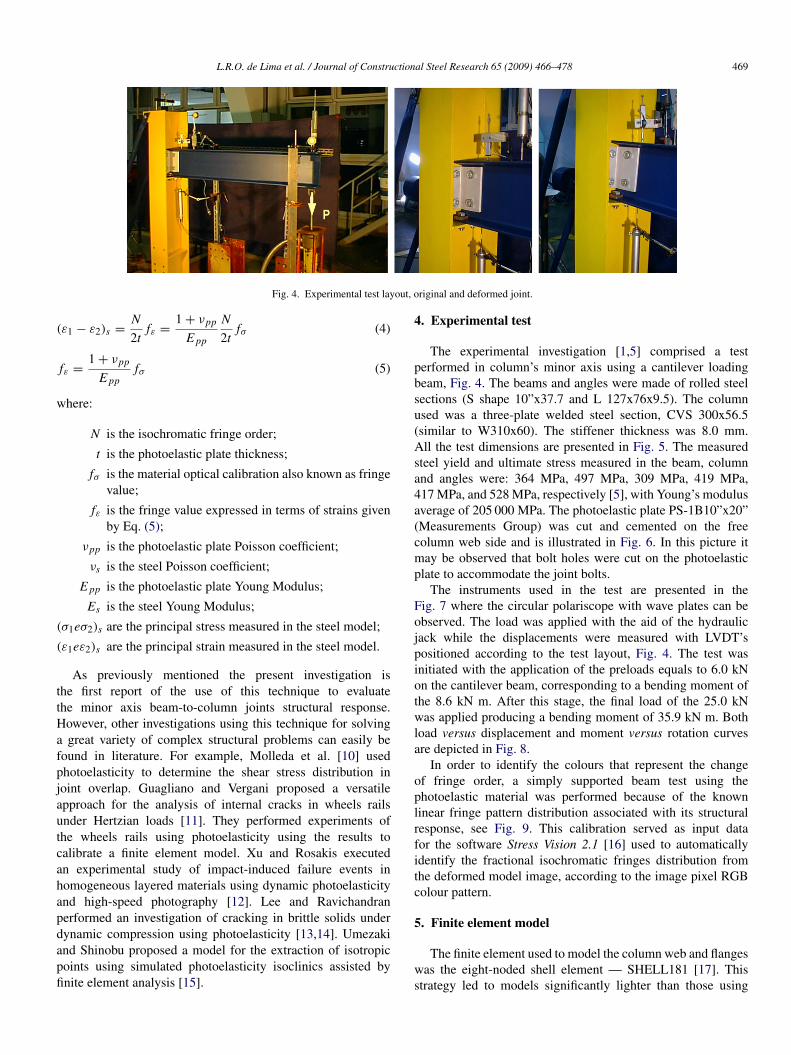
Fig. 4. Experimental test layout, original and deformed joint.
(ε1 − ε2)s =N
2tfε =
1+ νpp
E pp
N
2tfσ (4)
fε =1+ νpp
E ppfσ (5)
where:
N is the isochromatic fringe order;
t is the photoelastic plate thickness;
fσ is the material optical calibration also known as fringevalue;
fε is the fringe value expressed in terms of strains givenby Eq. (5);
νpp is the photoelastic plate Poisson coefficient;
νs is the steel Poisson coefficient;
E pp is the photoelastic plate Young Modulus;
Es is the steel Young Modulus;
(σ1eσ2)s are the principal stress measured in the steel model;
(ε1eε2)s are the principal strain measured in the steel model.
As previously mentioned the present investigation isthe first report of the use of this technique to evaluatethe minor axis beam-to-column joints structural response.However, other investigations using this technique for solvinga great variety of complex structural problems can easily befound in literature. For example, Molleda et al. [10] usedphotoelasticity to determine the shear stress distribution injoint overlap. Guagliano and Vergani proposed a versatileapproach for the analysis of internal cracks in wheels railsunder Hertzian loads [11]. They performed experiments ofthe wheels rails using photoelasticity using the results tocalibrate a finite element model. Xu and Rosakis executedan experimental study of impact-induced failure events inhomogeneous layered materials using dynamic photoelasticityand high-speed photography [12]. Lee and Ravichandranperformed an investigation of cracking in brittle solids underdynamic compression using photoelasticity [13,14]. Umezakiand Shinobu proposed a model for the extraction of isotropicpoints using simulated photoelasticity isoclinics assisted byfinite element analysis [15].
4. Experimental test
The experimental investigation [1,5] comprised a testperformed in column’s minor axis using a cantilever loadingbeam, Fig. 4. The beams and angles were made of rolled steelsections (S shape 10”x37.7 and L 127x76x9.5). The columnused was a three-plate welded steel section, CVS 300x56.5(similar to W310x60). The stiffener thickness was 8.0 mm.All the test dimensions are presented in Fig. 5. The measuredsteel yield and ultimate stress measured in the beam, columnand angles were: 364 MPa, 497 MPa, 309 MPa, 419 MPa,417 MPa, and 528 MPa, respectively [5], with Young’s modulusaverage of 205 000 MPa. The photoelastic plate PS-1B10”x20”(Measurements Group) was cut and cemented on the freecolumn web side and is illustrated in Fig. 6. In this picture itmay be observed that bolt holes were cut on the photoelasticplate to accommodate the joint bolts.
The instruments used in the test are presented in theFig. 7 where the circular polariscope with wave plates can beobserved. The load was applied with the aid of the hydraulicjack while the displacements were measured with LVDT’spositioned according to the test layout, Fig. 4. The test wasinitiated with the application of the preloads equals to 6.0 kNon the cantilever beam, corresponding to a bending moment ofthe 8.6 kN m. After this stage, the final load of the 25.0 kNwas applied producing a bending moment of 35.9 kN m. Bothload versus displacement and moment versus rotation curvesare depicted in Fig. 8.
In order to identify the colours that represent the changeof fringe order, a simply supported beam test using thephotoelastic material was performed because of the knownlinear fringe pattern distribution associated with its structuralresponse, see Fig. 9. This calibration served as input datafor the software Stress Vision 2.1 [16] used to automaticallyidentify the fractional isochromatic fringes distribution fromthe deformed model image, according to the image pixel RGBcolour pattern.
5. Finite element model
The finite element used to model the column web and flangeswas the eight-noded shell element — SHELL181 [17]. Thisstrategy led to models significantly lighter than those using

470 L.R.O. de Lima et al. / Journal of Constructional Steel Research 65 (2009) 466–478
Fig. 5. Minor axis beam-to-column joint layout.
Fig. 6. Photoelastic plate dimensions.
Fig. 7. Minor axis beam-to-column joint layout.
solid elements and may cope with the relevant deformations:bending and membrane, as stated by Neves and Gomes, [18,19]. The column flanges were considered coupled to thecommon nodes of the column web. The adopted finite elementprogram, ANSYS, enables the material and geometric non-linearity to be taken into account. The finite element mesh
used to model the tested column is represented in Fig. 10.The boundary conditions were: all base nodes fixed in zdirection, one base node full fixed and another, in oppositeside, fixed in y and z directions. The load was appliedthrough prescribed displacements in the position of the fourcolumn web bolts. The material non-linearity was considered
L.R.O. de Lima et al. / Journal of Constructional Steel Research 65 (2009) 466–478 471
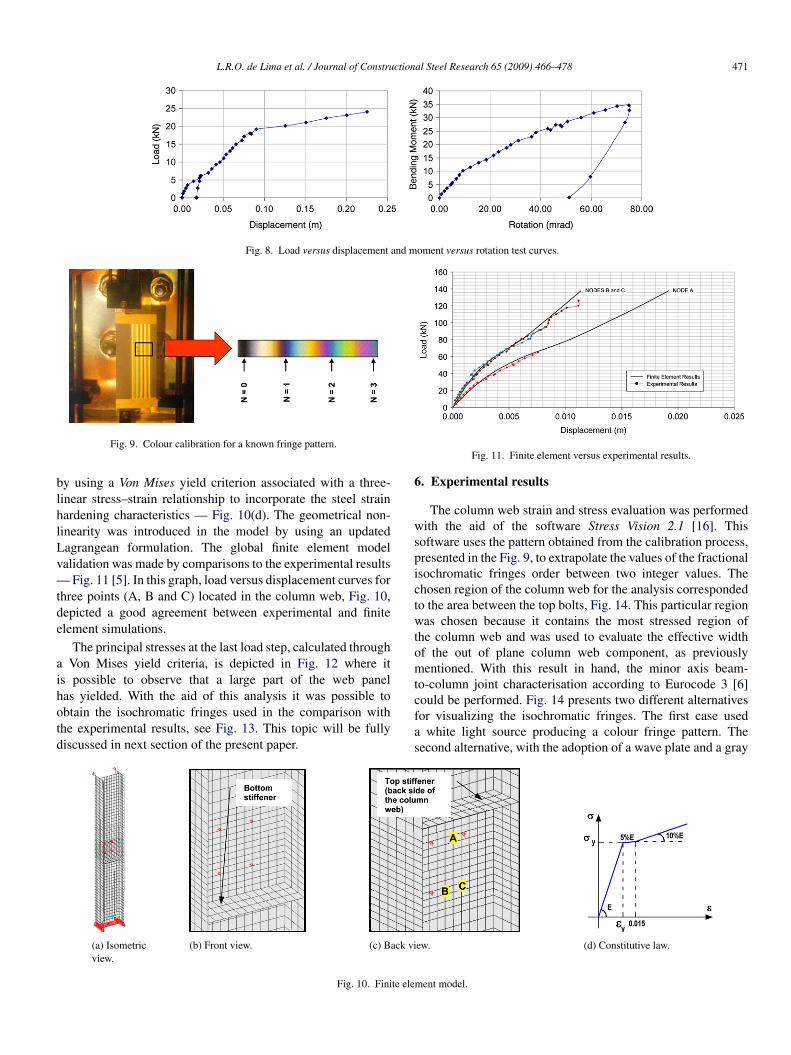
Fig. 8. Load versus displacement and moment versus rotation test curves.
Fig. 9. Colour calibration for a known fringe pattern.
by using a Von Mises yield criterion associated with a three-linear stress–strain relationship to incorporate the steel strainhardening characteristics — Fig. 10(d). The geometrical non-linearity was introduced in the model by using an updatedLagrangean formulation. The global finite element modelvalidation was made by comparisons to the experimental results— Fig. 11 [5]. In this graph, load versus displacement curves forthree points (A, B and C) located in the column web, Fig. 10,depicted a good agreement between experimental and finiteelement simulations.
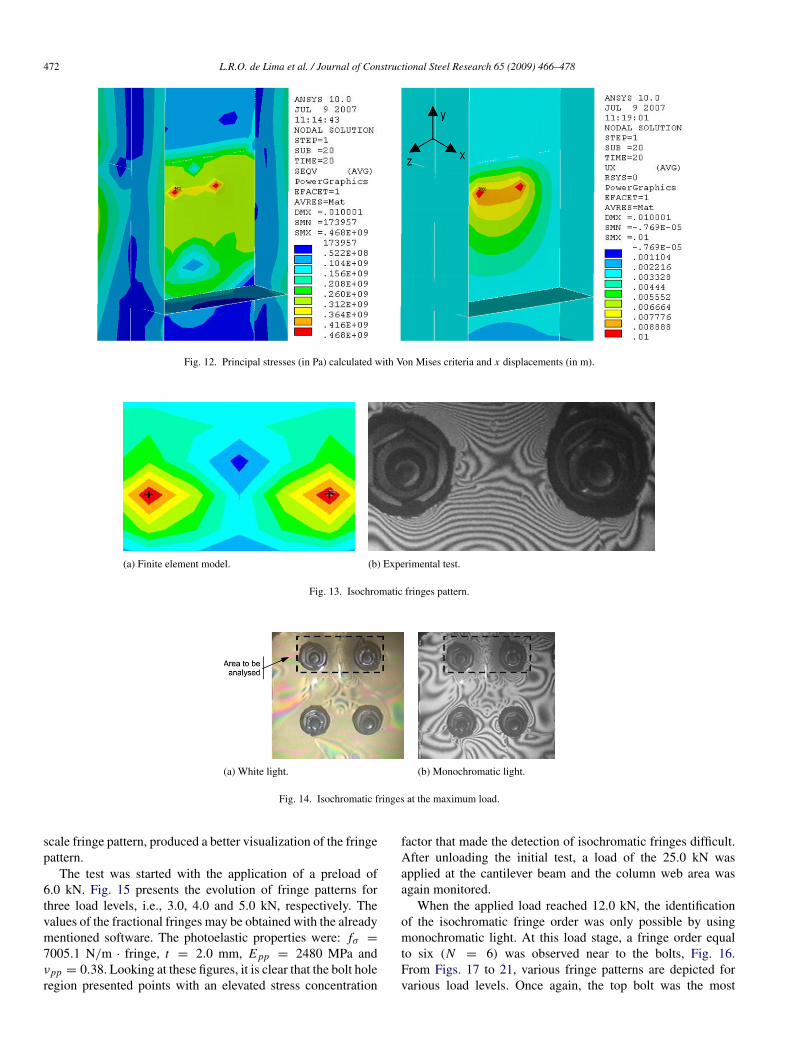
The principal stresses at the last load step, calculated througha Von Mises yield criteria, is depicted in Fig. 12 where itis possible to observe that a large part of the web panelhas yielded. With the aid of this analysis it was possible toobtain the isochromatic fringes used in the comparison withthe experimental results, see Fig. 13. This topic will be fullydiscussed in next section of the present paper.
Fig. 11. Finite element versus experimental results.
6. Experimental results
The column web strain and stress evaluation was performedwith the aid of the software Stress Vision 2.1 [16]. Thissoftware uses the pattern obtained from the calibration process,presented in the Fig. 9, to extrapolate the values of the fractionalisochromatic fringes order between two integer values. Thechosen region of the column web for the analysis correspondedto the area between the top bolts, Fig. 14. This particular regionwas chosen because it contains the most stressed region ofthe column web and was used to evaluate the effective widthof the out of plane column web component, as previouslymentioned. With this result in hand, the minor axis beam-to-column joint characterisation according to Eurocode 3 [6]could be performed. Fig. 14 presents two different alternativesfor visualizing the isochromatic fringes. The first case useda white light source producing a colour fringe pattern. Thesecond alternative, with the adoption of a wave plate and a gray
(a) Isometricview.
(b) Front view. (c) Back view. (d) Constitutive law.
Fig. 10. Finite element model.
472 L.R.O. de Lima et al. / Journal of Constructional Steel Research 65 (2009) 466–478
Fig. 12. Principal stresses (in Pa) calculated with Von Mises criteria and x displacements (in m).
(a) Finite element model. (b) Experimental test.
Fig. 13. Isochromatic fringes pattern.
(a) White light. (b) Monochromatic light.
Fig. 14. Isochromatic fringes at the maximum load.
scale fringe pattern, produced a better visualization of the fringepattern.
The test was started with the application of a preload of6.0 kN. Fig. 15 presents the evolution of fringe patterns forthree load levels, i.e., 3.0, 4.0 and 5.0 kN, respectively. Thevalues of the fractional fringes may be obtained with the alreadymentioned software. The photoelastic properties were: fσ =7005.1 N/m · fringe, t = 2.0 mm, E pp = 2480 MPa andνpp = 0.38. Looking at these figures, it is clear that the bolt holeregion presented points with an elevated stress concentration
factor that made the detection of isochromatic fringes difficult.After unloading the initial test, a load of the 25.0 kN wasapplied at the cantilever beam and the column web area wasagain monitored.
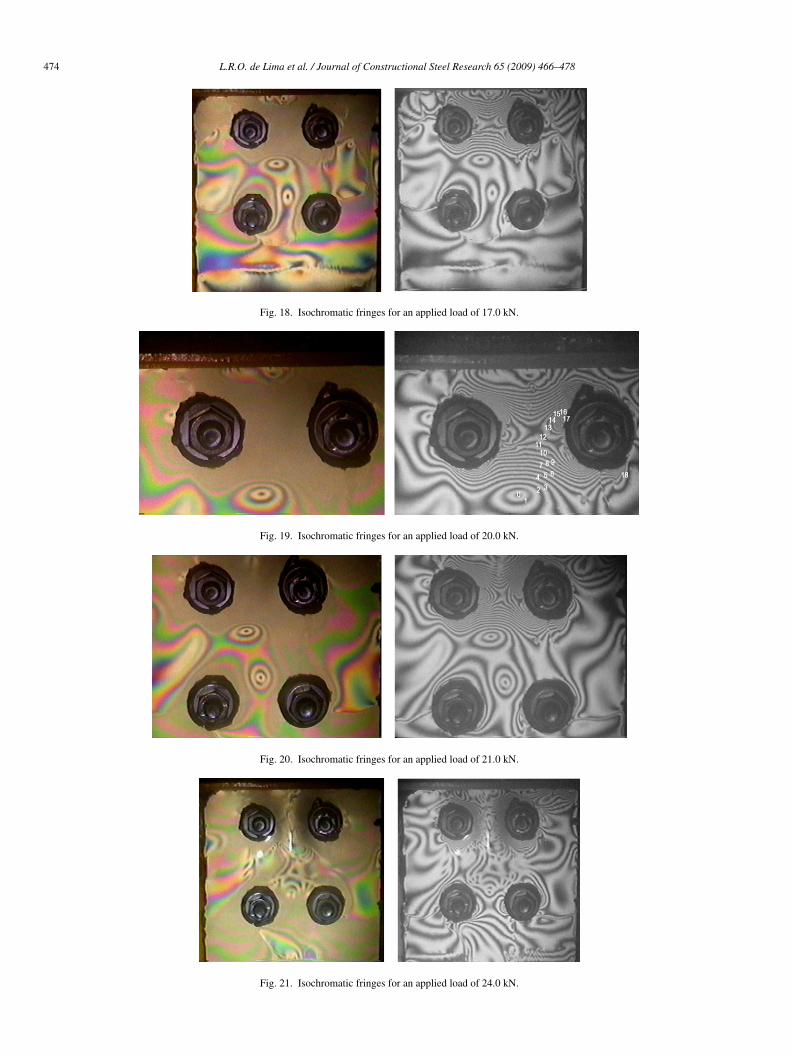
When the applied load reached 12.0 kN, the identificationof the isochromatic fringe order was only possible by usingmonochromatic light. At this load stage, a fringe order equalto six (N = 6) was observed near to the bolts, Fig. 16.From Figs. 17 to 21, various fringe patterns are depicted forvarious load levels. Once again, the top bolt was the most
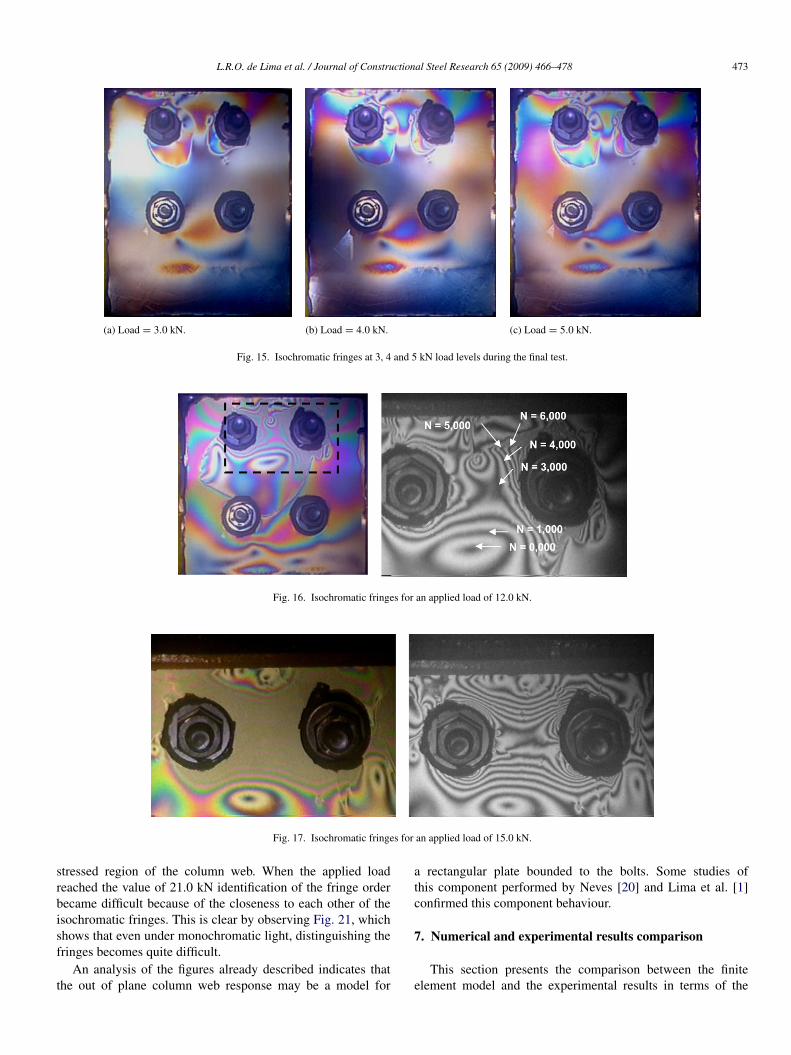
L.R.O. de Lima et al. / Journal of Constructional Steel Research 65 (2009) 466–478 473
(a) Load = 3.0 kN. (b) Load = 4.0 kN. (c) Load = 5.0 kN.
Fig. 15. Isochromatic fringes at 3, 4 and 5 kN load levels during the final test.
Fig. 16. Isochromatic fringes for an applied load of 12.0 kN.
Fig. 17. Isochromatic fringes for an applied load of 15.0 kN.
stressed region of the column web. When the applied loadreached the value of 21.0 kN identification of the fringe orderbecame difficult because of the closeness to each other of theisochromatic fringes. This is clear by observing Fig. 21, whichshows that even under monochromatic light, distinguishing thefringes becomes quite difficult.
An analysis of the figures already described indicates thatthe out of plane column web response may be a model for
a rectangular plate bounded to the bolts. Some studies ofthis component performed by Neves [20] and Lima et al. [1]confirmed this component behaviour.
7. Numerical and experimental results comparison
This section presents the comparison between the finiteelement model and the experimental results in terms of the
474 L.R.O. de Lima et al. / Journal of Constructional Steel Research 65 (2009) 466–478
Fig. 18. Isochromatic fringes for an applied load of 17.0 kN.
Fig. 19. Isochromatic fringes for an applied load of 20.0 kN.
Fig. 20. Isochromatic fringes for an applied load of 21.0 kN.
Fig. 21. Isochromatic fringes for an applied load of 24.0 kN.
L.R.O. de Lima et al. / Journal of Constructional Steel Research 65 (2009) 466–478 475
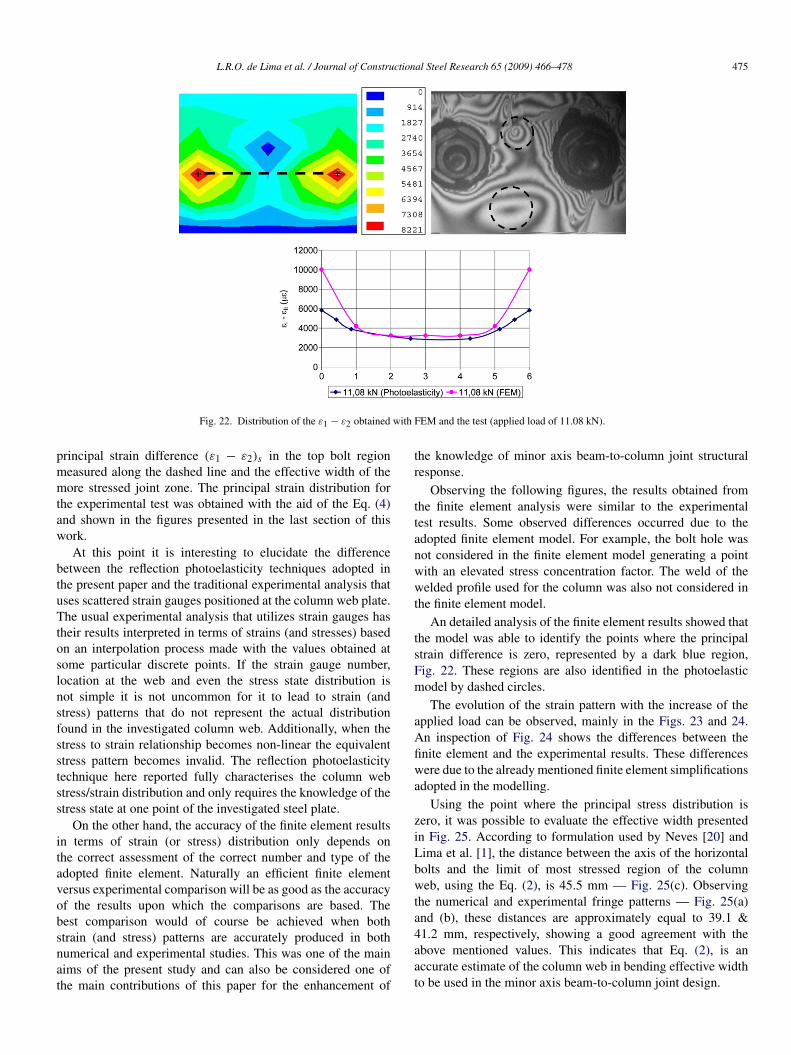
Fig. 22. Distribution of the ε1 − ε2 obtained with FEM and the test (applied load of 11.08 kN).
principal strain difference (ε1 − ε2)s in the top bolt regionmeasured along the dashed line and the effective width of themore stressed joint zone. The principal strain distribution forthe experimental test was obtained with the aid of the Eq. (4)and shown in the figures presented in the last section of thiswork.
At this point it is interesting to elucidate the differencebetween the reflection photoelasticity techniques adopted inthe present paper and the traditional experimental analysis thatuses scattered strain gauges positioned at the column web plate.The usual experimental analysis that utilizes strain gauges hastheir results interpreted in terms of strains (and stresses) basedon an interpolation process made with the values obtained atsome particular discrete points. If the strain gauge number,location at the web and even the stress state distribution isnot simple it is not uncommon for it to lead to strain (andstress) patterns that do not represent the actual distributionfound in the investigated column web. Additionally, when thestress to strain relationship becomes non-linear the equivalentstress pattern becomes invalid. The reflection photoelasticitytechnique here reported fully characterises the column webstress/strain distribution and only requires the knowledge of thestress state at one point of the investigated steel plate.
On the other hand, the accuracy of the finite element resultsin terms of strain (or stress) distribution only depends onthe correct assessment of the correct number and type of theadopted finite element. Naturally an efficient finite elementversus experimental comparison will be as good as the accuracyof the results upon which the comparisons are based. Thebest comparison would of course be achieved when bothstrain (and stress) patterns are accurately produced in bothnumerical and experimental studies. This was one of the mainaims of the present study and can also be considered one ofthe main contributions of this paper for the enhancement of
the knowledge of minor axis beam-to-column joint structuralresponse.
Observing the following figures, the results obtained fromthe finite element analysis were similar to the experimentaltest results. Some observed differences occurred due to theadopted finite element model. For example, the bolt hole wasnot considered in the finite element model generating a pointwith an elevated stress concentration factor. The weld of thewelded profile used for the column was also not considered inthe finite element model.
An detailed analysis of the finite element results showed thatthe model was able to identify the points where the principalstrain difference is zero, represented by a dark blue region,Fig. 22. These regions are also identified in the photoelasticmodel by dashed circles.
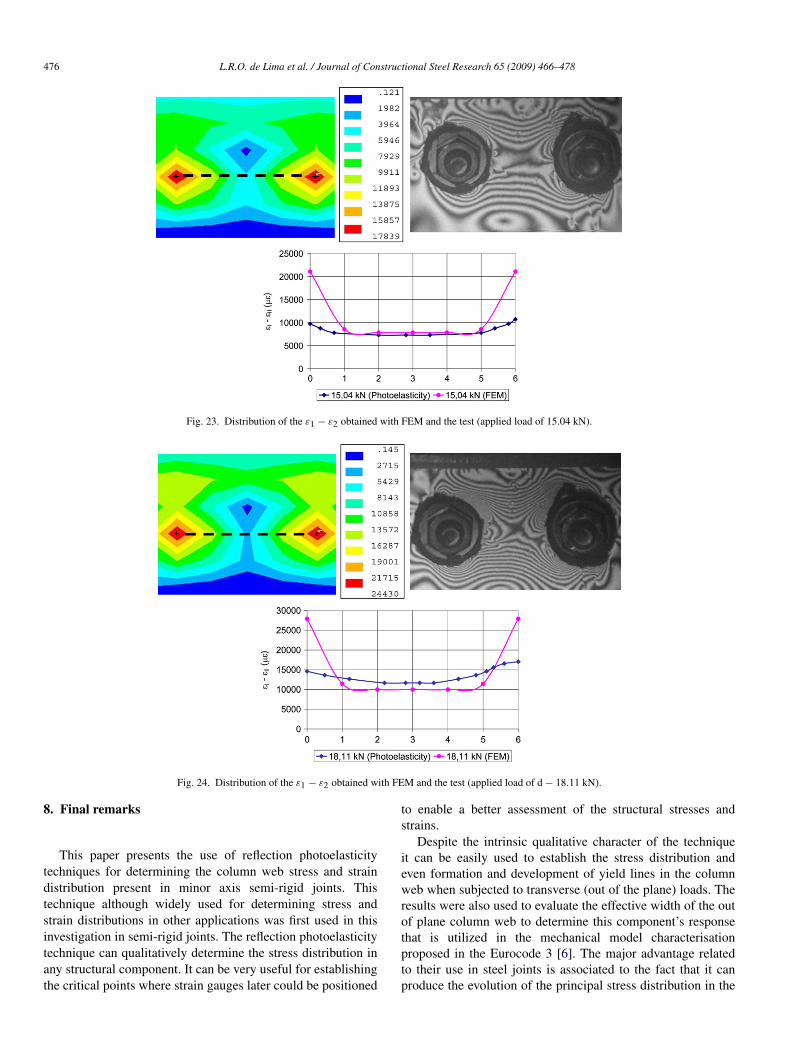
The evolution of the strain pattern with the increase of theapplied load can be observed, mainly in the Figs. 23 and 24.An inspection of Fig. 24 shows the differences between thefinite element and the experimental results. These differenceswere due to the already mentioned finite element simplificationsadopted in the modelling.
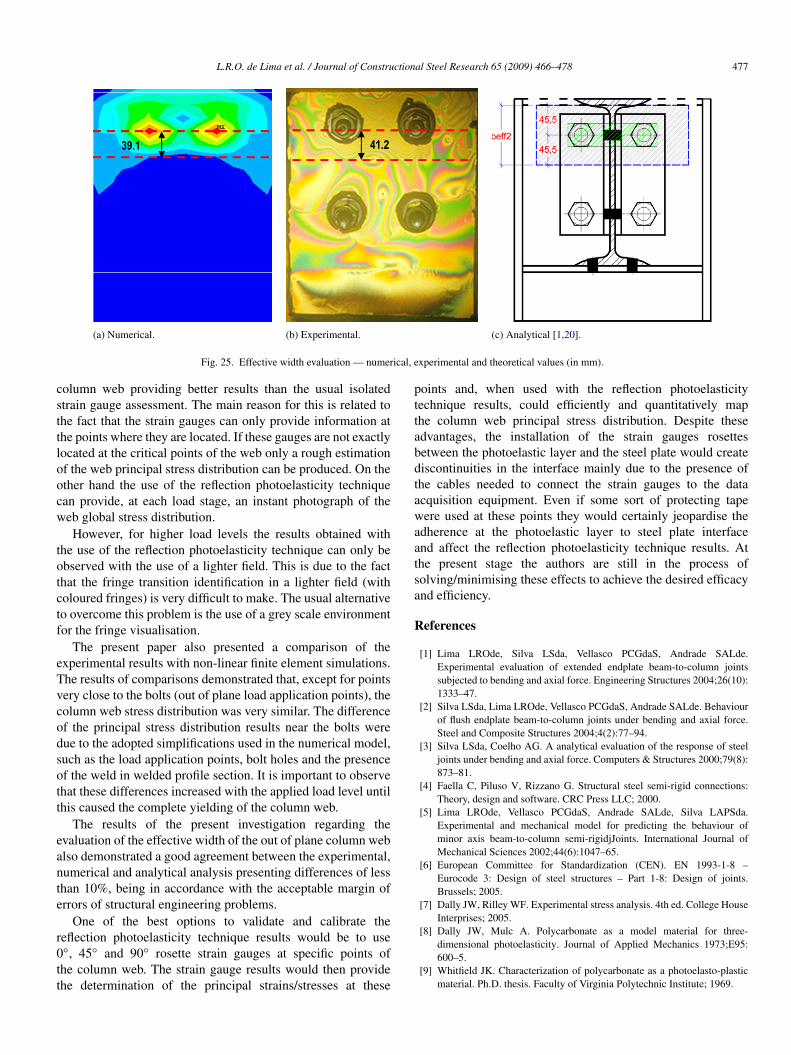
Using the point where the principal stress distribution iszero, it was possible to evaluate the effective width presentedin Fig. 25. According to formulation used by Neves [20] andLima et al. [1], the distance between the axis of the horizontalbolts and the limit of most stressed region of the columnweb, using the Eq. (2), is 45.5 mm — Fig. 25(c). Observingthe numerical and experimental fringe patterns — Fig. 25(a)and (b), these distances are approximately equal to 39.1 &41.2 mm, respectively, showing a good agreement with theabove mentioned values. This indicates that Eq. (2), is anaccurate estimate of the column web in bending effective widthto be used in the minor axis beam-to-column joint design.
476 L.R.O. de Lima et al. / Journal of Constructional Steel Research 65 (2009) 466–478
Fig. 23. Distribution of the ε1 − ε2 obtained with FEM and the test (applied load of 15.04 kN).
Fig. 24. Distribution of the ε1 − ε2 obtained with FEM and the test (applied load of d− 18.11 kN).
8. Final remarks
This paper presents the use of reflection photoelasticitytechniques for determining the column web stress and straindistribution present in minor axis semi-rigid joints. Thistechnique although widely used for determining stress andstrain distributions in other applications was first used in thisinvestigation in semi-rigid joints. The reflection photoelasticitytechnique can qualitatively determine the stress distribution inany structural component. It can be very useful for establishingthe critical points where strain gauges later could be positioned
to enable a better assessment of the structural stresses andstrains.
Despite the intrinsic qualitative character of the techniqueit can be easily used to establish the stress distribution andeven formation and development of yield lines in the columnweb when subjected to transverse (out of the plane) loads. Theresults were also used to evaluate the effective width of the outof plane column web to determine this component’s responsethat is utilized in the mechanical model characterisationproposed in the Eurocode 3 [6]. The major advantage relatedto their use in steel joints is associated to the fact that it canproduce the evolution of the principal stress distribution in the
L.R.O. de Lima et al. / Journal of Constructional Steel Research 65 (2009) 466–478 477
(a) Numerical. (b) Experimental. (c) Analytical [1,20].
Fig. 25. Effective width evaluation — numerical, experimental and theoretical values (in mm).
column web providing better results than the usual isolatedstrain gauge assessment. The main reason for this is related tothe fact that the strain gauges can only provide information atthe points where they are located. If these gauges are not exactlylocated at the critical points of the web only a rough estimationof the web principal stress distribution can be produced. On theother hand the use of the reflection photoelasticity techniquecan provide, at each load stage, an instant photograph of theweb global stress distribution.
However, for higher load levels the results obtained withthe use of the reflection photoelasticity technique can only beobserved with the use of a lighter field. This is due to the factthat the fringe transition identification in a lighter field (withcoloured fringes) is very difficult to make. The usual alternativeto overcome this problem is the use of a grey scale environmentfor the fringe visualisation.
The present paper also presented a comparison of theexperimental results with non-linear finite element simulations.The results of comparisons demonstrated that, except for pointsvery close to the bolts (out of plane load application points), thecolumn web stress distribution was very similar. The differenceof the principal stress distribution results near the bolts weredue to the adopted simplifications used in the numerical model,such as the load application points, bolt holes and the presenceof the weld in welded profile section. It is important to observethat these differences increased with the applied load level untilthis caused the complete yielding of the column web.
The results of the present investigation regarding theevaluation of the effective width of the out of plane column webalso demonstrated a good agreement between the experimental,numerical and analytical analysis presenting differences of lessthan 10%, being in accordance with the acceptable margin oferrors of structural engineering problems.
One of the best options to validate and calibrate thereflection photoelasticity technique results would be to use0◦, 45◦ and 90◦ rosette strain gauges at specific points ofthe column web. The strain gauge results would then providethe determination of the principal strains/stresses at these
points and, when used with the reflection photoelasticitytechnique results, could efficiently and quantitatively mapthe column web principal stress distribution. Despite theseadvantages, the installation of the strain gauges rosettesbetween the photoelastic layer and the steel plate would creatediscontinuities in the interface mainly due to the presence ofthe cables needed to connect the strain gauges to the dataacquisition equipment. Even if some sort of protecting tapewere used at these points they would certainly jeopardise theadherence at the photoelastic layer to steel plate interfaceand affect the reflection photoelasticity technique results. Atthe present stage the authors are still in the process ofsolving/minimising these effects to achieve the desired efficacyand efficiency.
References
[1] Lima LROde, Silva LSda, Vellasco PCGdaS, Andrade SALde.Experimental evaluation of extended endplate beam-to-column jointssubjected to bending and axial force. Engineering Structures 2004;26(10):1333–47.
[2] Silva LSda, Lima LROde, Vellasco PCGdaS, Andrade SALde. Behaviourof flush endplate beam-to-column joints under bending and axial force.Steel and Composite Structures 2004;4(2):77–94.
[3] Silva LSda, Coelho AG. A analytical evaluation of the response of steeljoints under bending and axial force. Computers & Structures 2000;79(8):873–81.
[4] Faella C, Piluso V, Rizzano G. Structural steel semi-rigid connections:Theory, design and software. CRC Press LLC; 2000.
[5] Lima LROde, Vellasco PCGdaS, Andrade SALde, Silva LAPSda.Experimental and mechanical model for predicting the behaviour ofminor axis beam-to-column semi-rigidjJoints. International Journal ofMechanical Sciences 2002;44(6):1047–65.
[6] European Committee for Standardization (CEN). EN 1993-1-8 –Eurocode 3: Design of steel structures – Part 1-8: Design of joints.Brussels; 2005.
[7] Dally JW, Rilley WF. Experimental stress analysis. 4th ed. College HouseInterprises; 2005.
[8] Dally JW, Mulc A. Polycarbonate as a model material for three-dimensional photoelasticity. Journal of Applied Mechanics 1973;E95:600–5.
[9] Whitfield JK. Characterization of polycarbonate as a photoelasto-plasticmaterial. Ph.D. thesis. Faculty of Virginia Polytechnic Institute; 1969.
478 L.R.O. de Lima et al. / Journal of Constructional Steel Research 65 (2009) 466–478
[10] Molleda F, Mora J, Molleda FJ, Carrillo EJ, Mora E, Fonseca MaP, et al.Stress distribution and fractography of soft soldered single and double lapjoints. Materials Characterization 2005;56(2):102–6.
[11] Guagliano M, Vergani L. Experimental and numerical analysis of sub-surface cracks in railway wheels. Engineering Fracture Mechanics 2005;72(2):255–69.
[12] Xu LR, Rosakis AJ. An experimental study of impact-induced failureevents in homogeneous layered materials using dynamic photoelasticityand high-speed photography. Optics and Lasers in Engineering 2003;40(4):263–88.
[13] Lee S, Ravichandran G. An investigation of cracking in brittle solidsunder dynamic compression using photoelasticity. Optics and Lasers inEngineering 2003;40(4):341–52.
[14] Lee S, Ravichandran G. Crack initiation in brittle solids under multiaxialcompression. Engineering Fracture Mechanics 2003;70(13):1645–58.
[15] Umezaki E, Terauchi S. Extraction of isotropic points using simulatedisoclinics obtained by photoelasticity-assisted finite element analysis.Optics and Lasers in Engineering 2002;38(1–2):71–85.
[16] Lavrador MB, Cristina A. Stress Vision 2.1 — Detector of photoelasticityfringe orders. Laboratory of Photomechanics at Pontifical UniversityCatolic of Rio de Janeiro, PUC-Rio; 1999.
[17] ANSYS R©, Release 10.0, ANSYS - Inc. Theory Reference; 2005.[18] Neves LC, Gomes F. Guidelines for a numerical modelling of beam-to-
column minor-axis joints. In: Kuldeep S. Virdi, editor. COST C1 Report ofW.G. 6 — Numerical simulation. European Commision, Brussels. 1999.p. 48–60.
[19] Neves LC, Gomes F. Semi-rigid behaviour of beam-to-column minor-axis joints. In: Eth-Honggerberg, Zurich, Switzerland. In: Proceedings ofthe IABSE international colloquium on semi-rigid structural connections,Istambul (Turkey); 1996.
[20] Neves LFdaC, Silva LAPSda, Vellasco PCGdaS. Experimental behaviourof end plate I-beam to concrete-filled rectangular hollow section columnjoints. International Journal of Applied Mechanics and Engineering 2004;9(1):63–80.