Stronger Youth and Smarter Communities: An Analysis of Oregon’s Investment in Runaway and Homeless...
60
Pacific University CommonKnowledge All CAS Faculty Scholarship Faculty Scholarship (CAS) 5-1-2009 Stronger Youth and Smarter Communities: An Analysis of Oregon’s Investment in Runaway and Homeless Youth Programs Katherine Cahn Portland State University Don Schweitzer Pacific University, Ally Jamieson Portland State University Hannah Slevin Pacific University Center for Improvement of Child and Family Services, Portland State University is Original Research is brought to you for free and open access by the Faculty Scholarship (CAS) at CommonKnowledge. It has been accepted for inclusion in All CAS Faculty Scholarship by an authorized administrator of CommonKnowledge. For more information, please contact gilmani@pacificu.edu. Recommended Citation Center for Improvement of Child and Family Services. (2009). Stronger Youth and Smarter Communities: An Analysis of Oregon’s Investment in Runaway and Homeless Youth Programs. Portland, OR: Portland State University.
Transcript of Stronger Youth and Smarter Communities: An Analysis of Oregon’s Investment in Runaway and Homeless...

Pacific UniversityCommonKnowledge
All CAS Faculty Scholarship Faculty Scholarship (CAS)
5-1-2009
Stronger Youth and Smarter Communities: AnAnalysis of Oregon’s Investment in Runaway andHomeless Youth ProgramsKatherine CahnPortland State University
Don SchweitzerPacific University,
Ally JamiesonPortland State University
Hannah SlevinPacific University
Center for Improvement of Child and Family Services, Portland State University
This Original Research is brought to you for free and open access by the Faculty Scholarship (CAS) at CommonKnowledge. It has been accepted forinclusion in All CAS Faculty Scholarship by an authorized administrator of CommonKnowledge. For more information, please [email protected].
Recommended CitationCenter for Improvement of Child and Family Services. (2009). Stronger Youth and Smarter Communities: An Analysis of Oregon’sInvestment in Runaway and Homeless Youth Programs. Portland, OR: Portland State University.

Stronger Youth and Smarter Communities: An Analysis of Oregon’sInvestment in Runaway and Homeless Youth Programs
DescriptionThe Oregon Runaway and Homeless Workgroup estimates that 24,000 unaccompanied youth experiencehomelessness each year in Oregon. National studies indicate that most of these youth run away due to familyconflict or abuse, while others are kicked out of their home or "thrown away‟.
Oregon is home to innovative runaway and homeless youth services, but these rely heavily on federal fundsand are available primarily in the I-5 corridor. Youth in rural areas, or smaller towns unable to access federalfunds, are at risk.
In 2007 the Oregon State Legislature appropriated $1 million to the 2007-2009 budget of the OregonCommission on Children and Families (OCCF) to enhance, expand, or develop services and supports forpreviously un-served runaway and/or homeless youth. While 20 counties requested over $4 million inassistance in response to the initial request for proposals, the funding allocated has enabled OCCF to “rollout” services in 8 counties. Through a leveraged federal grant, Portland State University's Center forImprovement of Child and Family Services provided evaluation on some of the short-term the outcomes ofthis investment.
DisciplinesArts and Humanities | Social Policy | Social Welfare
RightsTerms of use for work posted in CommonKnowledge.
This original research is available at CommonKnowledge: http://commons.pacificu.edu/casfac/13

Stronger Youth and Smarter
Communities An Analysis of Oregon’s Investment in Runaway and Homeless Youth Programs May 2009
Center for Improvement of Child and Family Services
Prepared By:
Katharine Cahn, PhD Portland State University
Don Schweitzer, MSW Portland State University
Ally Jamieson, MSW Portland State University
Hannah Slevin Pacific University

2 Stronger Youth and Smarter Communities
P a g e | 2
This Page Intentionally Blank
Analysis of Oregon‟s Runaway and Homeless Youth Programs 3
Table of Contents
Executive Summary ......................................................................................................... 5
Runaway & Homeless Youth Definitions ......................................................................... 9
Numbers of Runaway and Homeless Youth ................................................................... 13
National Numbers .............................................................................................. 13
Oregon Numbers ................................................................................................ 14
Impact of Running Away and Homelessness on Youth ................................................... 17
The Costs of NOT Intervening ............................................................................ 18
Runaway and Homeless Youth Needs ........................................................................... 25
Oregon Runaway and Homeless Youth Policy ............................................................... 29
Funding ............................................................................................................. 29
Oregon Runaway and Homeless Youth Policy Development ............................. 30
Oregon‟s New Runaway and Homeless Youth Policy ........................................ 32
Program Outcomes ....................................................................................................... 37
Implementation Analysis ............................................................................................... 39
Methodology .................................................................................................... 39
Analyses ............................................................................................................ 39
Findings ............................................................................................................. 39
System Improvement ......................................................................................... 43
Barriers to Program Implementation .................................................................. 47
Benefits of Collaboration ................................................................................... 49
Recommendations to the way Programs are Implemented ................................. 50
Advice to Others ............................................................................................... 50
Limitations .......................................................................................................... 51
Outcome Survey ........................................................................................................... 53
Discussion .......................................................................................................... 55
Need for Future Research .............................................................................................. 57

4 Stronger Youth and Smarter Communities
P a g e | 4
This Page Intentionally Blank

Analysis of Oregon‟s Runaway and Homeless Youth Programs 5
EXECUTIVE SUMMARY
Problem
The Oregon Runaway and Homeless Workgroup estimates that 24,000 unaccompanied youth
experience homelessness each year in Oregon. National studies indicate that most of these youth
run away due to family conflict or abuse, while others are kicked out of their home or „thrown
away‟. Research shows that without supportive services these youth are at much greater risk of:
Sexual victimization
Prostitution
Physical abuse
Physical illness
Suicide
Substance abuse
Gang involvement
Ending up in the adult chronic homelessness population
Death
Oregon is home to innovative runaway and homeless youth services, but these rely heavily on
federal funds and are available primarily in the I-5 corridor. Youth in rural areas, or smaller
towns unable to access federal funds, are at risk.
Legislative Investment
In 2007 the Oregon State Legislature appropriated $1 million to the 2007-2009 budget of the
Oregon Commission on Children and Families (OCCF) to enhance, expand, or develop services
and supports for previously un-served runaway and/or homeless youth. While 20 counties
requested over $4 million in assistance in response to the initial request for proposals, the funding
allocated has enabled OCCF to “roll out” services in 8 counties. Through a leveraged federal
grant, Portland State University‟s Center for Improvement of Child and Family Services provided
evaluation on some of the short-term the outcomes of this investment.
Findings
Researchers found that the funds invested yielded results for Oregon‟s runaway and homeless
youth at a low per-youth cost compared to the risk of non-intervention. In addition, researchers
found benefits to communities in terms of more efficient use of limited resources.

6 Stronger Youth and Smarter Communities
P a g e | 6
Runaway and homeless youth Services are cost effective
Total number of youth served from Apr-Dec 2008: 1,829
Estimated number served from initial startup thru June 2009: 3,047
Estimated number that will be served in 2009-2011 biennium: 4,877
Cost per youth for 2007-2009 biennium: $210
Estimated cost per youth for 2009-2011 biennium: $131
Research indicates that costs of NOT providing services to high risk youth range from $470,000 -
$3 million per youth. Local cost-benefit analyses show that $1 invested in runaway and homeless
youth provides over $4 in savings.
Youth are safe and learning new skills
Examples include;
Benton County
From Apr-Dec 2008, 86% of youth served exited to a safe and stable living
circumstance.
Deschutes County
From July- Sep 2008, 100% of youth served exited the program to safe and stable
housing
From July – Dec 2008, 86% of youth who participated in educational training
demonstrate academic progress and re-engagement in the education process
Lincoln County
100% of youth served from July – Dec 2008 are now in a stable living situation
Washington County
84% of youth who participated in shelter care from Jan – Dec 2008 receive safe
exits transitioning to a living situation that is stable and safe
86% of youth who participated in skill building groups from Jan – Dec 2008
report increased resistance and resiliency skills

Analysis of Oregon‟s Runaway and Homeless Youth Programs 7
Communities are working smarter
Programs utilizing these investments developed extensive community partnerships and
collaborations that brought new community members to the table to address the needs of this
vulnerable population. New and/or expanded partnerships were with:
Individuals and community members
Local businesses
The faith community
Existing social services:
State agencies: DHS, Juvenile Departments, etc.
Existing youth serving agencies
Schools
Youth
It would seem likely that other Oregon communities, given the opportunity, would be able to
replicate similar models of services and community collaboration. Training and technical
assistance from OCCF appears available and experienced to support such an expansion.
Family and youth are reconciling
Many of the runaway and homeless youth Rollout Programs provide family counseling or
mediation to resolve the conflict that led to the youth requiring services. Initial analysis of an
outcome survey, developed to capture this, among other changes in behavior, offers strong
evidence that these interventions worked. Youth from a shelter program reported a significant
improvement in their experience of family support six weeks after the program. There is a strong
body of research that says youth who experience their families as supportive are much less likely
to engage in delinquency, substance abuse, or other risky behaviors. This was is a good
investment.
Recommendation
Research shows that every youth kept in school and off the street saves the state much more
costly interventions in the future such as those associated with substance abuse treatment,
incarceration, and, among others, the costs associated with adult chronic homelessness. In light of
this and other findings in this report, it would seem prudent to continue investments in the
current programs and based on continued and expanded resources, replicate the services and
supports in other counties. Such investments would afford other Oregon communities the
opportunity to build collaborative mechanisms and thereby increasing the efficiency of their
services to runaway and homeless youth. Such an investment will assure that youth in every
community have the chance to become healthy young adults capable of giving back to their
communities and families.

8 Stronger Youth and Smarter Communities
P a g e | 8
This Page Intentionally Blank

Analysis of Oregon‟s Runaway and Homeless Youth Programs 9
RUNAWAY & HOMELESS YOUTH DEFINITIONS
In the course of describing the social problem of runaway and homeless youth (RHY), it is
useful to understand the definitions and types of the various subgroups of the RHY population.
Such definitions often appear to overlap, leading to confusion among communities, policy
makers, and researchers1,2
. The purpose of this section is to provide clarity and a common
understanding.
To begin, the term runaway and homeless youth does not include those homeless youth
who are members of an intact, homeless family unit. The Runaway and Homeless Youth Act, the
sole piece of Federal legislation pertaining specifically to the issue, defines this population as
“individuals under age 18 who are unable to live in a safe environment with a relative and lack
safe alternative living arrangements, as well as individuals ages 18 to 21 without shelter”3.
However, there are various definitions of the runaway and homeless youth population that
emphasize other characteristics. One report states the term homeless youth is often used to
describe youth between the ages of 12 and 24 and includes youth who have been thrown out of
their homes, are unaccompanied, have run away from home and are “street youth and systems
youth”4.
Other researchers say that the key defining criteria of a homeless youth is that he or she is
unable to secure appropriate stable housing and is “without the supervision of a guardian or
other primary caretaker”5. The Office of Juvenile Justice and Delinquency Prevention (OJJDP) of
the U.S. Department of Justice differentiate between runaway and thrownaway youth as
follows6:
Runaway youth
A child leaves home without permission and stays away overnight.
A child 14 years old or younger (or older and mentally incompetent) who is away
from home chooses not to come home when expected to and stays away overnight.
A child 15 years old or older who is away from home chooses not to come home and
stays away two nights.
Thrownaway youth

10 Stronger Youth and Smarter Communities
P a g e | 10
A child is asked or told to leave home by a parent or other household adult, no
adequate alternative care is arranged for the child by a household adult, and the child
is out of the household overnight.
A child who is away from home is prevented from returning home by a parent or
other household adult, no adequate alternative care is arranged for the child by a
household adult, and the child is out of the household overnight.
Still other research adds additional designation to meet the threshold of homeless youth,
“Homeless youth are unaccompanied youth between the ages of 16 and 21 who cannot safely
live with a relative and have no safe alternative living situation”7. Yet another definition from the
National Coalition for the Homeless states, “Homeless youth are individuals under the age of
eighteen who lack parental, foster, or institutional care. These youth are sometimes referred to as
„unaccompanied‟ youth”8.
Age can be a particular challenge and often results in barriers to services for these youth.
Researchers, service providers, and advocacy organizations view youth developmentally, often
including youth up to the age of 21, and in some cases 24, in services, though policy makers and
federal and state policy frequently see “youth” from a chronological perspective that ends earlier.
While essentially every Federal Department has some type of program that could provide
assistance to RHY, the varying definitions and department missions result in a disjointed system,
often split between adult services and youth services (that often compete for the funding to serve
18-24 year olds). This system is rife with gaps through which the vast majority of RHY fall.
Additionally, because RHY are, by the legal definition, both “youth” (17 and younger) and
“adults” (18-24), systems struggle to provide services that can effectively meet the broad range of
their developmental needs. In advocating for changes in the juvenile justice system, Columbia
Law Professor Elizabeth Scott and renowned psychologist Laurence Steinberg describe how
challenging this can be when they state, “Adolescence and adulthood are not tidy developmental
categories; the transition to adulthood is a gradual process”. They go on to describe how a youth
may have fully developed psychologically by age 15 or 16 (“…logical reasoning and information
processing capacities…”), their psychosocial capacities (“…impulse control, future orientation,
[and] resistance to peer influence…”) might not fully develop until age 24 or 259.

Analysis of Oregon‟s Runaway and Homeless Youth Programs 11
Further complicating this issue are the varying pathways by which youth become runaway
and homeless youth. Youth run away from families due to conflict for a variety of issues (e.g.
rejection because of sexual activity, pregnancy, GLBT, etc.), sexual abuse, physical abuse, neglect
and other forms of maltreatment. Additionally, youth may be thrown out of their homes or left
behind when a family moves out of state. Youth may also enter the ranks of runaways by
running away from foster care placements or end up homeless after aging out of the child
welfare system. They may also become homeless upon release from other systems of care such as
residential treatment or the juvenile justice system.
This confusion over definitions, varying characteristics used to describe RHY (i.e.
runaway, thrownaway, homeless), combined with disagreements around age, which system is
best suited to serve older youth (18-24), and the lack of an agreed upon protocol for counting
RHY create a strenuous and exasperating environment for developing useful policy, effective
interventions, and meaningful research.
1 Sanchez, R.P., Waller, M.W., & Greene, J.M. (2006). Who runs? A demographic profile of runaway youth in the
United States. Journal of Adolescent Health. 39. 778-781.
2 Fernandes, A.L. (2007). Runaway and Homeless Youth: Demographics, Programs, and Emerging Issues, No.
RL33785, Congressional Research Service.
3 Ibid.
4 Moore, J. (2006). Unaccompanied and Homeless Youth: Review of Literature 1995-2005. National Center for
Homeless Education. p 2. Retrieved on May 29, 2008 from website: www.serve.org/nche
5 Haber, M. G., & Toro, P. A. (2004). Homelessness among families, children, and adolescents: An ecological-
developmental perspective. Clinical Child and Family Psychology Review, 7(3), 123-164.
6 Hammer, H., Findelhor, D., Sedlak, A.J. (October 2002). Runaway/thrownaway children: National estimates and
characteristics. National Incidence Studies of Missing, Abducted, Runaway, and Thrownaway Children (NISMART).
Retrieved on October 21, 2008 from http://www.ncjrs.gov/html/ojjdp/nismart/04/
7 Bass-Rubenstein, D. (2008). Youth at risk. Encyclopedia of Social Work. Terry Mizrahi and Larry E. Davis.
Encyclopedia of Social Work: (e-reference edition). Oxford University Press. Retrieved on 7 March 2009
http://www.oxford-naswsocialwork.com/entry?entry=t203.e421
8 National Alliance to End Homelessness (NAEH) (n.d.). Policy Focus Area: Youth. Retrieved on October 21, 2008
from http://www.endhomelessness.org/section/policy/focusareas/youth
9 Scott, E.S. & Steinberg, L. (2008). Rethinking Juvenile Justice. Harvard University Press. Cambridge, MA.

12 Stronger Youth and Smarter Communities
P a g e | 12
This Page Intentionally Blank

Analysis of Oregon‟s Runaway and Homeless Youth Programs 13
NUMBERS OF RUNAWAY AND HOMELESS YOUTH
Several key issues impact the ability to accurately gauge the scope of the RHY issue. It is
unclear how many incidents of running away go unreported, there are challenges associated with
finding runaways and homeless youth, older runaways and homeless youth (18-24) are generally
excluded from census attempts, available data is generally from youth who are in programs, and
the social stigma attached to running away inhibit youth from self-identifying1.
National Numbers
Because this population tends to be “hidden in plain sight”, due in large part to the
challenges of definitions as well as the difficulties in locating and counting, the exact number of
runaway and homeless youth is difficult to obtain2. Another challenge in getting an accurate
count is the transitory nature of the youth‟s situation, which can often be for short-term periods
out-of-home, repeated several times over several years. Their reluctance to interact with census
counters for fear of being taken into state custody or forced to return to the family from which
they ran is another barrier. A recent report to Congress acknowledges this difficulty and adds,
“Determining the number…is further complicated by the lack of a standardized methodology for
counting”3. Because of this, estimates of runaway and homeless youth vary widely. One such
estimate places the number of runaway and homeless youth at 1 million each year4. However,
according to the National Collaboration for Youth, the total for 2005 was as high as 1.6 million
in the United States5. Additionally, the Office of Juvenile Justice and Delinquency Prevention of
the U.S. Department of Justice estimated 1,682,900 children experienced homelessness or
running away from home in 20026. A report to Congress stated that “1.7 million youth under
age 18 left home or were asked to leave home in 1999… Of these youth, 68% were between the
ages of 15 and 17”7. The magnitude of these numbers is better understood when compared with
that of entire U.S. foster care system, which works with approximately 500,000 children each
year 8. This growing number is of particular concern for communities across the nation due to the
significant risks these youth face, including depression, suicide, sexual and physical abuse from
strangers and peers, substance abuse, and medical illness9.

14 Stronger Youth and Smarter Communities
P a g e | 14
Additionally national studies continue to report high incidence of youth homelessness
among the general population. Research indicates rates of running away for all adolescents vary
from 5 to 14 percent of the youth population with a more conservative rate of 5 to 7 percent
listed most frequently10,11,12,13
. This indicates that somewhere between 1 and 2.8 million
adolescents experience homelessness each year and, consequently, does not include youth ages
18-24.
Oregon Numbers
In their report to the Interim Committee on Health and Human Services of the Oregon
Legislature, the Oregon Runaway and Homeless Workgroup (ORHWG) stated that 24,000
unaccompanied youth experience homelessness each year in Oregon14. This report represents the
first time there has been an attempt to define the scope of the RHY problem in Oregon.
Concurrently, in their report titled Oregon‟s Homeless Youth, the Oregon chapter of the League
of Women Voters (LWV) asserted that “In 2004-2005, 1,622 unaccompanied homeless youth
were enrolled in Oregon‟s schools”15, and according to the Oregon Department of Education,
that number had increased by 73 percent to 2,802 for the 07-08 school year16.
The 2005-2007 estimates from the Census Bureau record Oregon as having
approximately 243,607 youth ages 13-17, which, according to the National Alliance to End
Homelessness, is the most common age range for running away. Using the above estimates of
prevalence, we find that approximately 12,180 to 17,052 youth run away from home each year
in Oregon. It is important to note this rate does not include those youth who have been forced
to leave their homes. It is important to note this number does not include 11 and 12 year olds,
who are included in funding criteria. Additionally, the National Health Care for the Homeless
Council estimated there are between 750,000 – 2 million homeless each year ages 18-2417, or
2.55-6.79% of the entire US population of that age group. According to the 2005-2007
estimates from the U.S. Census Bureau, Oregon had 340,936 young adults ages 18-24. Using the
above estimates of 2.55-6.69%, this would result in an annual incidence of homelessness for this
age group of 8,694 – 23,150. Drawing on all estimates, it is estimated that each year in Oregon
somewhere between 20,500 – 40,000 youth runaway, are thrownaway, abandoned, or
otherwise become homeless.

Analysis of Oregon‟s Runaway and Homeless Youth Programs 15
1 Bass-Rubenstein, D. (2008). Youth at risk. Encyclopedia of Social Work. Terry Mizrahi and Larry E. Davis.
Encyclopedia of Social Work: (e-reference edition). Oxford University Press. Retrieved on 7 March 2009
http://www.oxford-naswsocialwork.com/entry?entry=t203.e421
2 Fernandes, A.L. (2007). Runaway and Homeless Youth: Demographics, Programs, and Emerging Issues, No.
RL33785, Congressional Research Service.
3 Ibid. p.4
4 Thompson, S. J., Safyer, A. W., & Pollio, D. E. (2001). Differences and predictors of family reunification among
subgroups of runaway youths using shelter services. Social Work Research, 25(3), 163-172.
5 National Collaboration for Youth. (2006). Runaway and Homeless Youth Act Programs-Fact Sheet. Retrieved
October 15, 2006 from http://www.nassembly.org/nydic/policy/breifs/documents/06CollabRHYA.pdf
6 National Crime Justice Reference Service (October, 2002). National Incidence Studies of Missing, Abducted,
Runaway, and Throwaway Children (NISMART). Retrieved on November 7, 2008 from
http://www.ncjrs.gov/html/ojjdp/nismart/04/ns2.html
7 Fernandes, A.L. (2007). Runaway and Homeless Youth: Demographics, Programs, and Emerging Issues, No.
RL33785, Congressional Research Service. p 6.
8 U.S. Department of Health and Human Services (USDHHS) (2007). Promising Strategies to End Youth Homelessness:
Report to Congress. Retrieved on October 21, 2008 from
http://www.acf.hhs.gov/programs/fysb/content/docs/reporttocongress_youthhomelessness.pdf
9 National Child Traumatic Stress Network (2005). Facts on Trauma and Homeless Children.
http://www.nctsnet.org/nctsn_assets/pdfs/promising_practices/Facts_on_Trauma_and_Homeless_Children.pdf
10 Cheung, C. K., Liu, S. C., & Lee, T. Y. (2005). Parents, teachers, and peers and early adolescent runaway in Hong
Kong. Adolescence, 40(158), 403-424.
11 Haber, M. G., & Toro, P. A. (2004). Homelessness among families, children, and adolescents: An ecological-
developmental perspective. Clinical Child and Family Psychology Review, 7(3), 123-164.
12 National Alliance to End Homelessness (NAEH) (2007). Fact Checker: Accurate Statistics on Homelessness. Retrieved
on October 21, 2008 from
http://www.endhomelessness.org/files/1659_file_10606_NAEH_YouthHomelessness_4_.pdf
13 Sanchez, R.P., Waller, M.W., & Greene, J.M. (2006). Who runs? A demographic profile of runaway youth in the
United States. Journal of Adolescent Health. 39. 778-781.
14 Oregon Runaway and Homeless Work Group (ORHWG) (2005). From Out of the Shadows: Shedding Light on
Oregon‟s Runaway and homeless Youth. Report to the Interim Committee on Health and Human Services February
2005
15 League of Women Voters of Oregon Educational Fund (LWV). (2006). Oregon‟s Homeless Youth. p 9. Retrieved on
May 16, 2008 from http://www.lwvrv.org/pdf_docs/homeless-youth%202006.pdf
16 Oregon Department of Education (2008). Superintendent‟s Update #272. Retrieved on December 3, 2008 from
http://www.ode.state.or.us/news/announcements/announcement.aspx?=4084

16 Stronger Youth and Smarter Communities
P a g e | 16
17 National Health Care for the Homeless Council (2004). Homeless Young Adults Ages 18-24: Examining Service
Delivery Adaptations. Retrieved on March 16, 2009 from
http://www.nhchc.org/Publications/101905YoungHomelessAdults.pdf

Analysis of Oregon‟s Runaway and Homeless Youth Programs 17
IMPACT OF RUNNING AWAY AND HOMELESSNESS ON YOUTH
Nationally, 36-50 percent of runaways stated they ran away from home to escape
abuse1,2,3
. However, the reality is in all likelihood the “cycle of abuse they experienced at home
will continue on the streets”4. While running away from home can be a desperate call for help, it
dramatically increases the risk of youth being victimized, both physically and sexually, by either
friends or strangers5,6,7
. Because runaway youth find themselves lacking skills and resources
necessary to fully engage in employment, “they often are forced into prostitution, drug dealing,
and other criminal behavior to survive”8.
Studies demonstrate profound risks to youth when they are homeless and living on the
streets. Being a runaway youth is associated with increased risks of substance abuse9,10,11
, a
decrease in emotional health and coping skills leading to increased rates of suicide attempts121314
,
higher rates of pregnancy15, higher rates of mortality than their counterparts in the general
population16, and the younger they are when they first runaway, the more likely they are to
become involved in gangs17. Furthermore, studies list higher rates of, “sexually transmitted
infections, uncontrolled asthma, tuberculosis, and skin disorders” among homeless youth as an
additional risk18.
The National Crime Justice Reference Service of the U.S. Office of Juvenile Justice and
Delinquency Prevention recognized that whether or not a youth ran to a location known to
them where they are provided with safety or are roaming the unknown streets of an urban city
made an important difference as to what level of risk the youth was being exposed to. Table 1
provides a description of many of the levels of risk19.

18 Stronger Youth and Smarter Communities
P a g e | 18
Table 1: Estimates of Potentially Endangered Runaway/Thrownaway Youth
Characteristic of Episode Estimate
Percent
(n = 1,682,900)
Child had been physically or sexually abused at home in the year prior to the
episode or was afraid of abuse upon return 350,400 21
Child was substance dependent 317,800 19
Child was 13 years old or younger 305,300 18
Child was in the company of someone known to be abusing drugs 302,100 18
Child was using hard drugs 292,000 17
Child spent time in a place where criminal activity was known to occur 256,900 12
Child engaged in criminal activity during the course of the episode 197,400 11
Child was with a violent person 125,400 7
Child had previously attempted suicide 70,500 4
Child who was enrolled in school at the time of the episode missed at least 5
days of school 70,500 4
Child was physically assaulted or someone attempted to physically assault
child during the course of the episode 69,100 4
Note: The individual estimates and percents do not sum to the total because youth were counted in each category that
applied.
Today, after decades of media stories, documentation, and research on the issues of
runaway youth population (though woefully understudied), most advocates see running away as
a behavior resulting from complex systems issues. Abuse, neglect and other forms of child
maltreatment, along with issues surrounding the effects of generational poverty, are seen as
precursors to running away from home. This information is beginning to help society see the
runaway not as a criminal but as a child victim of an unhealthy environment in need of
intervention20
.
The Costs of NOT Intervening
Aside from the personal losses experienced by a child who does not fully engage in our
society, there are direct monetary consequences to communities as well. The chief financial costs
associated with homeless youth are loss of wages and productivity due to dropping out of high
school, involvement in the justice system, and costs associated with chronic homelessness.
Education and Employment
Research has long shown the connection between dropping out of high school and
juvenile delinquency. Barriers to education for runaway and homeless youth result in an
increased school drop-out rate, especially for those whose return home is not facilitated quickly.

Analysis of Oregon‟s Runaway and Homeless Youth Programs 19
Some estimates report drop-out rates as high as a 75 percent for runaway youth. An incomplete
education not only limits employment opportunities, but limits expected wage earnings as well
which can perpetuate generational poverty. According to Mark Cohen, Professor of Economics at
Vanderbilt University, costs associated with dropping out of school include lost wages and
productivity, loss of fringe benefits, and “nonmarket” losses (i.e. education benefits individuals
through improved social connections and improves communities through technology
development and other types of knowledge formation). Cohen uses losses in these areas to
estimate a cost of $470,000 to $750,000. This would amount to $606,000 to $966,000 when
converted to 2007 dollars21.
Criminal Justice
Cohen describes a juvenile career criminal as one who begins his/her criminal career as an
adolescent and carries it into adulthood. A career criminal, as defined by Cohen commits 1 to 4
crimes per year for 6 years and will spend approximately 8 years in jail for a total of 14 years of
costs. In calculating the associated costs, Cohen takes into account the cost to the victim, the
system (i.e. investigation, arrest, adjudication, etc.), incarceration, and the average time served.
Additionally, he calculates the opportunity costs of the offender‟s timei (i.e. lost wages while
incarcerated). Combined, the range for costs are $1.5 million to $1.8 million, or, converted to
2007 dollars, $1.9 million to $2.3 million22
.
Substance Use and Abuse
As with crime, substance abuse negatively impacts the user, their family, friends, and the
community around them. For his cost calculation, Cohen makes the assumption that time for
drug use begins at age 15 and lasts until age 60, with heavy drug use lasting roughly 14 years. To
determine costs, Cohen takes into account lost labor productivity, treatment expenses, medical
expenses (both emergencies and routine), risk of death, drug-related crimes, arrests, and third-
party risks and costs such as those associated with children of drug abusing parents. Running
assumptions and estimates though his equation, Cohen estimates the lifetime costs of a heavy
i Cohen estimates legitimate earnings of $7,542 (1997 dollars) per year, which, when multiplied by the years of
incarceration equals approximately $60,000. This would convert to $77,000 in 2007 dollars.

20 Stronger Youth and Smarter Communities
P a g e | 20
drug user will range from $483,000 to $1.26 million or, $622,000 to $1.6 million in 2007
dollars23
.
Notes on Cost Estimates
There are two key notes that should be considered when using these cost estimates. The
first is that many assumptions and hypothesis went into developing the equations for these
calculations. Therefore, according to Cohen, the costs should be used “as order of magnitude
estimates”. Secondly, money invested in programs that will help prevent these costly behaviors is
based on future benefits, perhaps as far out as 20 years or more. Therefore the costs should be
discounted by approximately 2% to take this into account. Similar to Cohen‟s, Table 2 lists all the
costs along with the 2% discount24
.
Table 2: Summary of the Monetary Value of Saving a High-Risk Youth
Total Cost Present Value
(2% discount rate)
Career criminal $1.9 - $2.3 million $1.7 - $1.9 million
Heavy Drug User $622,000 - $1.6 million $477,000 - $1.25 million
High School Dropout $606,000 - $966,000 $313,000 - $500,000
Less duplication* ($364,690 - $1.0 million)
($284,000 - $781,000)
Total $2.8 - $3.9 million $2.2 - $3.0 million
Numbers may not add due to rounding. All costs are in 2007 dollars.
*E.g., crimes committed by heavy drug users
In a report titled The Economic Benefits of Helping Homeless Youth, Dr. Kristina Smock
studied the cost benefits of providing services to runaway and homeless youth in the Portland,
OR area. She noted, “Youth homelessness costs the general public millions of dollars each year as
a result of homeless youth cycling in and out of the juvenile justice system, incarceration,
emergency room medical care, foster care placement, and school system costs associated with
delayed learning and inter-school movement.”25
Yet found that if supports and services are
provided to these youth, “they are resilient and able to make lasting changes… are able to find
permanent homes… are able to get and keep good jobs… [and] choose and maintain health and
well-being.”26
Table 3 below, taken from the report, illustrates her findings27
;

Analysis of Oregon‟s Runaway and Homeless Youth Programs 21
Table 3: Summary of Cost Benefit Analysis28
Program Area Program Cost Cost Savings Benefit Ratio
Prevention and early intervention $195,203 $984,672 $5.04 saved for every $1 spent
Engaging homeless youth and moving
them toward stability $448,277 $3,197,020 $7.13 saved for every $1 spent
Getting homeless youth off the streets $783,680 $584,2238 $7.45 saved for every $1 spent
Fostering self-sufficiency through
education and training $759,121 $1,374,702 $1.81 saved for every $1 spent
Total* $276,4541 $11,398,632 $4.12 saved for every $1 spent
*Program costs total includes all expenditures of New Avenues For Youth, including administration and fund raising.
Chronic Homelessness
The federal government‟s definition of chronic homelessness includes homeless individuals
with a disabling condition (substance use disorder, serious mental illness, developmental
disability, or chronic physical illness or disability) who have been homeless either 1) continuously
for one whole year, or 2) four or more times in the past three years. Federal, State and local
governments, and communities understand the need to end chronic homelessness. Many
communities and states have been developing 10 Year Plans to End Homeless in an effort to do
so. Yet to affectively accomplish this, it is critical that plans include a recognized source of the
chronic homeless population; runaway and homeless youth.
In one of the only studies to look at the association between running away as an
adolescent and chronic homelessness, leading homeless researcher Martha Burt found that 51
percent of 18 and 19 year old homeless individuals had run away from home, 38 percent of 20
to 24 year olds, and 32 percent of homeless individuals 25 years old and older. She also iterates
that chronic homelessness creates a costly burden for communities and states. They use more
social services, more shelter beds, and stay in programs for longer periods of time29
. Additional
research on the adult homeless population reflects increased utilization of emergency rooms and
hospitalizations compared to low-income, housed populations. Research further shows that for
those chronically homeless with serious mental illnesses, approximately 20-25 percent of the
adult homeless population, the average annual costs of inpatient care was $32,605 to $25,010
(1996 dollars)30
. National studies in multiple communities have shown that when formerly
homeless people or people who are at risk of homelessness move into supportive housing, they
experience individual improvements and communities save money. The 10 Year Plan to End

22 Stronger Youth and Smarter Communities
P a g e | 22
Homelessness from Portland, Oregon reports the following savings have been observed with
improved supports to the chronically homeless:
• 58% reduction in Emergency Room visits
• 85% reduction in emergency detox services
• 50% decrease in incarceration rate
• 50% increase in earned income
• 40% rise in rate of employment when employment services are provided
• More than 80% stay housed for at least one year
Clearly, investing in services that will reduce the numbers of the adult chronic homeless,
and the subsequent costs associated, will benefit not only runaway and homeless youth, but
communities as well.
1 National Runaway Switchboard (2006). 2005 Call Statistics. Retrieved October 15, 2006 from
http://www.nrscrisisline.org/news_events/call_stats.html
2 Rew, L. (2008). Caring for and connecting with homeless adolescents. Family & Community Health, 31(1), S42-S51.
3 Stiffman, A. R. (1989). Physical and Sexual Abuse in Runaway Youths. Child Abuse and Neglect: The International
Journal, 13(3), 417.
4 Tyler, K. A., Whitbeck, L. B., Hoyt, D. R., & Cauce, A. M. (2004). Risk Factors for Sexual Victimization Among Male
and Female Homeless and Runaway Youth. Journal of Interpersonal Violence, 19(5), 503.
5 Fisher, D. G., & et al. (1995). Sexual and Drug-Taking Experiences Reported by Runaway Youth. Journal of Alcohol
and Drug Education, 40(2), 88.
6 Rew, L. (2008). Caring for and connecting with homeless adolescents. Family & Community Health, 31(1), S42-S51.
7 Tyler, K. A., Whitbeck, L. B., Hoyt, D. R., & Cauce, A. M. (2004). Risk Factors for Sexual Victimization Among Male
and Female Homeless and Runaway Youth. Journal of Interpersonal Violence, 19(5), 503
8 Thompson, S. J., Safyer, A. W., & Pollio, D. E. (2001). Differences and predictors of family reunification among
subgroups of runaway youths using shelter services. Social Work Research, 25(3), 163-172.
9 Fisher, D. G., & et al. (1995). Sexual and Drug-Taking Experiences Reported by Runaway Youth. Journal of Alcohol
and Drug Education, 40(2), 88.
10 Thompson, S. J., Zittel-Palamara, K. M., & Forehand, G. (2005). Risk factors for cigarette, alcohol, and marijuana use
among runaway youth utilizing two services sectors. Journal of Child & Adolescent Substance Abuse, 15(1), 17-36.

Analysis of Oregon‟s Runaway and Homeless Youth Programs 23
11 Yoder, K. A., Whitbeck, L. B., & Hoyt, D. R. (2003). Gang Involvement and Membership among Homeless and
Runaway Youth. Youth & Society, 34(4), 441.
12 Ibid
13 Stiffman, A. R. (1989a). Suicide Attempts in Runaway Youths. Suicide and Life-Threatening Behavior, 19(2), 147.
14 Rew, L. (2008). Caring for and connecting with homeless adolescents. Family & Community Health, 31(1), S42-S51.
15 Ibid
16 Roy, E., Haley, N., Leclerc, P., Sochanski, B., Boudreau, J. F., & Boivin, J. F. (2004). Mortality in a cohort of street
youth in Montreal. Jama-Journal of the American Medical Association, 292(5), 569-574.
17 Yoder, K. A., Whitbeck, L. B., & Hoyt, D. R. (2003). Gang Involvement and Membership among Homeless and
Runaway Youth. Youth & Society, 34(4), 441.
18 Rew, L. (2008). Caring for and connecting with homeless adolescents. Family & Community Health, 31(1), p S45
19 Hammer, H., Findelhor, D., Sedlak, A.J. (October 2002). Runaway/thrownaway children: National estimates and
characteristics. National Incidence Studies of Missing, Abducted, Runaway, and Thrownaway Children (NISMART).
Retrieved on October 21, 2008 from http://www.ncjrs.gov/html/ojjdp/nismart/04/
20 Whitbeck, L., Hoyt, D., Yoder, K., Cauce, A., Paradise, M., (2001). Deviant behavior and victimization among
homeless and runaway adolescents. Journal of Interpersonal Violence. 16 (11), 1175-1204.
21 Cohen, M. A. (1998). The monetary value of saving a high-risk youth. Journal of Quantitative Criminology, 14(1), 5-
33.
22 Ibid
23 Ibid
24 Ibid
25 New Avenues for Youth (2007). The Economic Benefits of Helping Homeless Youth. p 3. Retrieved on March 16,
2009 from www.newavenues.org/files/NewAvenues_Cost_Benefit_Study.pdf
26 Ibid
27 New Avenues for Youth (2007). The Economic Benefits of Helping Homeless Youth. p 4. Retrieved on March 16,
2009 from www.newavenues.org/files/NewAvenues_Cost_Benefit_Study.pdf
28 Ibid
29 Burt, M., Aron, L.Y., Lee, E. & Valente, J. (2001). Helping America's Homeless: Emergency Shelter or Affordable
Housing. Washington D.C.: The Urban Institute Press.
30 Rosenheck, R. (2000). Cost-effectiveness of services for mentally ill homeless people: the application of research to
policy and practice. The American Journal of Psychiatry, 157(10), 1563-1570.

24 Stronger Youth and Smarter Communities
P a g e | 24
This Page Intentionally Blank

Analysis of Oregon‟s Runaway and Homeless Youth Programs 25
RUNAWAY AND HOMELESS YOUTH NEEDS
The League of Women Voters of Oregon Education Fund published a report (2006) that
examined RHY demographics, service delivery, barriers to services, and youth needs. This report
utilized multiple interviews with runaway and homeless youth throughout the state of Oregon
though public forums held in 2005. These forums identified what kinds of services work well for
youth and which service approaches should be avoided. The most common statements made by
youth centered on the importance of having one relationship with an adult role model for the
provision of advocacy, mentoring, and guidance. Research supports this finding and has an
extensive history of showing the importance for youth to have a supportive relationship with
one or more stable adult role models1,2,3,4
.
Additional needs for youth are related to experiences associated with gender, race,
economic status, school, and/or neighborhood contexts5. One important difference between the
relationships adolescents have with their peers versus adults is the difference in power dynamics.
There often exists a hierarchical relationship between adolescents and adults, which can create
problems in an adult shelter, while peer friendships are considered more equal and shared6.
Because RHY programs work to engage youth in their communities through service learning,
youth are afforded the opportunity to build healthy peer relationships.
In addition to the importance of relationships, during the LWV forums (2006) youth
indicated categories of services they find most helpful. With no particular hierarchy noted, these
services consisted of the following7:
Mental health treatment
Substance abuse treatment
Life skills training
Wraparound services
Food programs
Case management
Youth‟s commitment to some case management

26 Stronger Youth and Smarter Communities
P a g e | 26
Voluntary participation in programs
Non-judgmental service providers
Friendly, trusting professionals
Job-skill development
Consistent rules and structure
Family mediation
Affordable housing
These “helpful” services, as identified by the youth, are consistent with what RHY
providers stated in the report as important in providing effective interventions and support to
RHY. This report also indicated that young people tended to turn away from services that had
the following characteristics:
Living with rigid rules
Living with a homeless adult
Preaching and condescending approaches
Scare tactics
Having treatment forced on them
For RHY policies to be effective there must be a commitment to understanding the
developmental needs as well as the more tangible needs of this vulnerable population.
1 Bowlby, J. (1969). Attachment and Loss: Vol. 1 Attachment. New York: Basic Books
2 Ainsworth, M.D.S., Blehar, M.C., Waters, E., Wall, S. (1978). Patterns of attachment: A psychological study of the
Strange Situation. Hillsdale, NJ: Erlbaum
3 Main, M. (1996). Introduction to the special section on attachment and psychopathology: 2. Overview of the field of
attachment. Journal of Consulting and Clinical Psychology, 64, 237-243.
4 Siegel, D. (1999). The Developing Mind: How relationships and the brain interact to shape who we are. New York:
The Guilford Press.
5 Giordano, P.C. (2003). Relationships in adolescence. Annual Review of Sociology. 29. 257-281.

Analysis of Oregon‟s Runaway and Homeless Youth Programs 27
6 Buhl, M.B., Noah, P. (2005). Relations with Parents and Friends During Adolescence and Early Adulthood. Marriage
and Family Review, 36 (3/4), 31-51
7 League of Women Voters of Oregon Educational Fund (LWV). (2006). Oregon‟s Homeless Youth. Retrieved on May
16, 2008 from http://www.lwvrv.org/pdf_docs/homeless-youth%202006.pdf

28 Stronger Youth and Smarter Communities
P a g e | 28
This Page Intentionally Blank

Analysis of Oregon‟s Runaway and Homeless Youth Programs 29
OREGON RUNAWAY AND HOMELESS YOUTH POLICY
Funding
Federal funding, though disconnected and far from comprehensive, is available for
runaway and homeless youth services in Oregon. The primary federally funded services (i.e.,
street outreach, basic center drop-in, & transitional living programs) have traditionally been
located in urban centers/metropolitan statistical areas (MSAs) along the I-5 corridor (see Figure 1)
with core funding allocated through the Runaway & Homeless Youth Act (RHYA) with oversight
by the Family and Youth Services Bureau (FYSB).
A secondary source of Federal funding for RHY comes from the Oregon Department of
Education (ODE) through the McKinney-Vento
Act. Each year the ODE receives $600,000 to
provide assistance to all homeless students,
which includes homeless youth who are
members of a homeless family. According to a
report published by the League of Women
Voters, approximately 3 out of every 4 dollars
are allocated to school districts as sub-grants to
use how they feel best for the homeless youth
in their communities, with the remaining
dollars used to monitor programs throughout
the state1.
A third resource for homeless youth over the age of 18 is eligibility to receive Section 8
rental assistance through funds from the U.S. Department of Housing and Urban Development
(HUD). Additionally, McKinney-Vento provides funds for emergency shelters, temporary
transitional housing, and long-term residence programs for unaccompanied homeless youth over
the age of 182.
Figure 1: Counties with Federally Funded RHY Programs

30 Stronger Youth and Smarter Communities
P a g e | 30
These Federal dollars pass directly to local communities though Community Development
Block Grants, local Housing Authorities, and community homeless providers. While such
programs may assist older youth, those younger than 18 years old are prevented from utilizing
these services. Additionally, all ages of homeless youth are inclined to refuse services from adult
shelter providers as they tend to cater to the severely mentally ill3 and, depending on where the
youth is seeking housing, waiting lists in Oregon for a Section 8 Housing Voucher vary from 3-6
months in Marion County4 to 18-24 months in Portland
5.
Although access is difficult, runaway and homeless youth may be eligible for food stamps
from a supplemental assistance program through Oregon‟s Department of Human Services (DHS)
and may enroll in the Oregon Health Plan (OHP) if they are pregnant, are a parent, or are
determined to have a disability. For youth under age 18, shelter is technically available in the
form of foster homes, community shelters, and/or residential treatment facilities6. However, with
an already overburdened foster care system, policies that prevent underage youth from utilizing
adult community shelters, and under equipped residential facilities, the streets are often identified
by youth as their best option.
Oregon Runaway and Homeless Youth Policy Development
Lack of sufficient funding for systematic and comprehensive planning to decrease
homelessness has resulted in what many advocates consider insufficient services for Oregon‟s
runaway and homeless youth7. Because of the lack of sufficient services for RHY, in 2005 the
Oregon State Legislature designated the Oregon Commission on Children and Families (OCCF) as
the working group responsible for creating state policies that would serve the State‟s runaway
and homeless youth population. Up until the creation of this working group, no state
department had been responsible for managing efforts to problem-solve how programs could
best serve this population8.
In this same year, Oregon House Bill 2202 confirmed what RHY advocates in Oregon
had known for decades: the state was severely deficient in developing a systematic plan to
expand resources and strategies with intent to reduce the number of youth affected by
homelessness or family issues resulting in youth running away from home9. House Bill 2202 also

Analysis of Oregon‟s Runaway and Homeless Youth Programs 31
created the Runaway and Homeless Youth Subcommittee of Oregon Partners for Children and
Families to address the needs of the estimated number of 24,000 runaway and homeless youth
residing in Oregon each year10. Members of the subcommittee set out to collect data through
public forums and individual interviews with RHY providers, community advocates, and youth
themselves on how each county in Oregon addressed the needs of RHY. Their investigation
sought to identify gaps in services as well as existing barriers to local communities trying to
provide services to RHY11.
In 2007, this subcommittee presented its findings to the Oregon State Legislature. In a
detailed report, the subcommittee stated that rural communities contend with the challenge of
not having adequate infrastructures in place to care for even one runaway or homeless youth.
While urban communities had infrastructures in place to provide shelter and resources, they often
did not have space, resources, or adequate services such as dental, medical, or substance abuse
and mental health treatment12.
At forums held throughout Oregon in 2005, youth described three primary needs that, if
met, would help them transition from the streets into a stable living environment. The first need
was for attachment. Youth expressed their need for, “one person to be in a meaningful
relationship with as an advocate and guide as they move through systems, programs, and life”13.
Youth also expressed a strong desire for supports that are interlinked and easily accessible. Youth
stated they were more likely to utilize supports that are accessible without having to travel long
distances for different service components. Finally, youth expressed the need for “basic needs
such as food and shelter; then health care, case management and mentoring” throughout the
state of Oregon14.
The outcome to information obtained from these forums was the development of policy
and planning recommendations by the subcommittee. The integration of community-based
resources with state resources was advised when possible, as well as development of local policies
that would support families in crisis, provide youth with access to services, and enhance
community supports. Additional recommendations included the examination of barriers for
youth exiting state systems, the establishment of long term goals to better understand and

32 Stronger Youth and Smarter Communities
P a g e | 32
address causes of youth homelessness, and the development of local coordination plans to
comprehensively address youth needs, resources available and needed supports.
Advocates recommended that community providers adapt program service delivery based
on these findings and advance research towards examining barriers youth are confronted with in
transitioning into adulthood. Advocates also expressed that more funding was needed for
agencies to carry out adequate services for RHY15.
Oregon’s New Runaway and Homeless Youth Policy
Oregon House Bill 2202 acknowledged that Oregon lacked a “comprehensive policy for
systematically addressing the issues and needs of runaway and homeless youth and their
families”16. The bill went on to acknowledge that communities are severely limited in options for
serving runaways and their families and that, “significant gaps exist in the availability and
coordination of services for runaway and homeless youth.”17
During the 2007 Oregon legislative session, and building upon work of House Bill 2202,
$1 million was allocated to the Oregon Commission on Children and Families (OCCF) budget. In
accordance with previous research-based findings, reported recommendations, and additional
input from community leaders, the Runaway and Homeless Youth Initiative Request for Proposal
(RFP), drafted by OCCF, sought to recruit applications from all counties, in partnership with local
community providers of RHY services, throughout the state of Oregon. The target populations
identified for services are classified as youth ages 11-17 at high risk for being separated from their
families, have been abandoned, have run away, and/or are experiencing homelessness.
The RFP stipulated applicants must provide two or more of the 18 below listed
“commonly accepted service elements for runaway and homeless youth” in order to be
considered for funding.
Outreach
Basic Needs (food/clothing)
Emergency Shelter (less than 160 days)
Long Term Shelter (greater than 160 days)

Analysis of Oregon‟s Runaway and Homeless Youth Programs 33
Family Reunification
Case Management/Advocacy
Drop-In Center
Recreation and Support Groups
Medical/Dental Services
Transitional Housing
Skills Training
Independent Living
Alcohol and Other Drug Counseling
Mental Health
Education
Employment
Permanent Housing
Follow-up and Aftercare Services
All eligible applicants to the RFP were required to demonstrate results pertaining to
youths‟ connectivity to resources, continuity of education, and increased safety. Additionally,
applicants are required to show evidence of results in the two of the following four listed areas of
service activity:
Expansion of community partnerships
Increased diversity of community partnerships
Decreased gaps in service delivery systems
Increased ability of the community to respond to the need
The proposal requirements consisted of:
Development or improvement of homeless and runaway youth services and supports
Creation of or building upon existing partnerships
Identification of services and supports to homeless and runaway youth as a priority

34 Stronger Youth and Smarter Communities
P a g e | 34
Accepted applicants received funds from a $900,000ii pool. Funds were required to be
used for developing and enhancing services, and not used as supplemental funds, capital
development, or “new planning activities” (OCCF, 2007). Additionally, all applicants were to
provide a funding match of 10 percent, which could be obtained from cash, in-kind donations,
and existing resources.
This funding resulted in eight Rollout
Sites being established in a range of
counties throughout Oregon (see Figure 2
and Table 4). Because this funding is
expected to be increased in future
legislative sessions, it is important to
establish and collect uniform outcome
measures that will determine the
effectiveness of these new RHY services.
Combined with identifying barriers and
supports around implementation, this
work will assist future new sites as they
begin to serve runaway and homeless youth.
ii This is the biennium amount. $100, 000 of the original $1 million was designated for administration, oversight, and
technical assistance.
Figure 2: Counties with Oregon Funded RHY Programs

Analysis of Oregon‟s Runaway and Homeless Youth Programs 35
Table 4: Runaway and Homeless Initiative Rollout Sites 2007-0918
Benton County
Program Title: Benton County Partnership
Primary Partner: Jackson Street Youth
Shelter
Focus/Program Elements: Service
integration, centralization, and coordination through Outreach Worker and Case Manage
Lane County
Program Title: Rural lane County
Runaway and Homeless Youth
Initiative
Primary Partner: Looking Glass Youth
& Family Services
Focus/Program Elements: Building a
rural service delivery model with case
managers in each of three rural
communities, connectivity between
service and shelter providers,
McKinney Vento school staff, and
ESDs
Marion County
Program Title: Marion County
Runaway and Homeless Youth
Service Continuum
Primary Partners: Northwest Human
Services, Mid-Willamette Community
Action Agency and Neighbor-to-
Neighbor
Focus/Program Elements: Multi-
disciplinary access for youth reported
as runaways and intensive outreach,
case coordination, and family based
interventions for all identified youth
Deschutes County
Program Title: Deschutes County
Runaway and Homeless Youth
Initiative
Primary Partner: Cascade Youth &
Family Center (JBarJ)
Focus/Program Elements: Loft drop-in
and emergency shelter-expansion of
transitional housing
Lincoln County
Program Title: Lincoln County
Coalition for Runaway and Homeless
Youth
Primary Partner: Community Services
Consortium and Lincoln County
School District
Focus/Program Elements: Drop-In
Centers in four community locations
and expansion of service
coordination, advocacy, and referral
with out-stationed youth as workers
Washington County
Program Title: Project Home Safe
Primary Partners: Boys and Girls Aid
Society and First Congregational
United Church of Christ
Focus/Program Elements:
Connections to resources and
continuity of education through
outreach, case management, and
service coordination, bringing
stability to the “front end‟ of
Washington County‟s RHY
Continuum.
Douglas County
Program Title: Douglas County Youth
Coalition Drop-in Center Program
Primary Partner: Homeless Youth
Coalition
Focus/Program Elements: Drop In-
Center w/advocacy, wrap around,
basic needs, connectivity to
education, independent living skill
development, and counseling
Malheur County
Program Title: S.E.A.S.O.N. -- Safety
Education Advocacy and Support
Network
Primary Partner: Harvest House
Ministries
Focus/Program Elements: Outreach
to youth identified as runaway in the
county‟s two largest communities,
Ontario and Nyssa, with very short-
term and limited long-term shelter
and services.

36 Stronger Youth and Smarter Communities
P a g e | 36
1 League of Women Voters of Oregon Educational Fund (LWV). (2006). Oregon‟s Homeless Youth. Retrieved on May
16, 2008 from http://www.lwvrv.org/pdf_docs/homeless-youth%202006.pdf
2 U.S. Department of Housing and Urban Development. (2006). Shelter Plus Care Program. Retrieved on November
25, 2006, from http://www.hud.gov/offices/cpd/homeless/programs/splusc/index.cfm
3 League of Women Voters of Oregon Educational Fund (LWV). (2006). Oregon‟s Homeless Youth. Retrieved on May
16, 2008 from http://www.lwvrv.org/pdf_docs/homeless-youth%202006.pdf
4 Marion County Oregon. (2007). Housing Choice Voucher: Section 8 Program. Retrieved on November 8, 2008 from
http://www.co.marion.or.us/HA/section8.htm.
5 Housing Authority of Portland (HAP) (n.d.). Section 8 Rental Assistance Program. Retrieved on November 8, 2008
from http://www.hapdx.org/resident/sc8intro.html.
6 League of Women Voters of Oregon Educational Fund (LWV). (2006). Oregon‟s Homeless Youth. Retrieved on May
16, 2008 from http://www.lwvrv.org/pdf_docs/homeless-youth%202006.pdf
7 Ibid
8 Oregon Commission on Child & Families, Oregon Partners for Children & Families (2007). Oregon Runaway and
Homeless Youth Initiative: HB 2202 Report to Legislature and Governor. Salem, Oregon.
9 Ibid
10 Ibid
11 Oregon Runaway and Homeless Work Group (2005). From Out of the Shadows: Shedding Light on Oregon‟s
Runaway and homeless Youth. Report to the Interim Committee on Health and Human Services February 2005
12 Oregon Commission on Child & Families, Oregon Partners for Children & Families (2007). Oregon Runaway and
Homeless Youth Initiative: HB 2202 Report to Legislature and Governor. Salem, Oregon.
13 League of Women Voters of Oregon Educational Fund (LWV). (2006). Oregon‟s Homeless Youth. Retrieved on May
16, 2008 from http://www.lwvrv.org/pdf_docs/homeless-youth%202006.pdf
14 Ibid., p 18
15 Ibid
16 Oregon House Bill 2202, 73
rd Oregon Legislative Assembly, Regular Session Retrieved on December 9, 2008 from
http://www.leg.state.or.us/05reg/pdfmeas/hb2200.dir/hb2202.intro.pdf.
17 Ibid
18 Oregon Commission on Children and Families (2009). Runaway and Homeless Youth. Retrieved on April 28, 2009
from http://www.oregon.gov/OCCF/Documents/Agency_Performance/RHY_2009.pdf

Analysis of Oregon‟s Runaway and Homeless Youth Programs 37
PROGRAM OUTCOMES
As part of their agreement to
accept funds, programs provide
various levels of demographic data to
OCCF about the youth being served in
their programs. In regards to age, data
is submitted in groups (i.e., 13-15 years
old, 16-18 years old, etc.). The graph
to side reflects the distribution of
youth served by
these programs.
Gender was also
collected on RHY
(see pie chart)
reflecting an
alignment with
national data
suggesting slightly
more females (54
percent) present in
RHY programs. Race
and ethnicity was
also collected from
youth (see graph).
Data indicates the
largest race served by these programs
was White-Caucasian (61.5 percent)
with Hispanic/Latino (15.6 percent) and
18160
513
802
188 148
0
200
400
600
800
1000
6-8 yrs old 9-12 yrs old
13-15 yrs old
16-18 yrs old
> 19 yrs old
Missing
RHY Served by Age
46%
54%
1%
RHY Served by Gender
Female
Male
Missing
0.55% 0.44% 0.66% 1.64% 2.68%
15.58%
61.51%
16.95%
0%10%20%30%40%50%60%70%
RHY Served by Race/Ethnicity

38 Stronger Youth and Smarter Communities
P a g e | 38
Black or African American (2.7 percent) making up the largest groups of race served.
Disproportionality and Disparity among children of color has long been recognized by
researchers, service providers, and policymakers in various other systems (e.g., child welfare,
juvenile justice, etc.). Disproportionality refers to the overrepresentation of a particular
race/ethnicity in a system when compared to that race/ethnicity in the general population. To
determine the extent of disproportionality, an index (DI) is calculated to determine the presence
and magnitude of disproportionality using the following;
𝐷𝐼 = % 𝑜𝑓 𝑟𝑎𝑐𝑒 𝑖𝑛 𝑐𝑎𝑟𝑒
% 𝑜𝑓 𝑟𝑎𝑐𝑒 𝑖𝑛 𝑔𝑒𝑛𝑒𝑟𝑎𝑙 𝑝𝑜𝑝𝑢𝑙𝑎𝑡𝑖𝑜𝑛
A DI greater than 1.0 represents disproportionality is present, less than 1.0 indicates the absence
of disproportionality. For youth served in RHY programs, Hispanic/Latino (1.47) and Black or
African American (1.34) indicated moderate levels of disproportionality, while Native Hawaiian –
Pacific Islander (5.47) all indicated a large level of disproportionality.
Disparity refers to the overrepresentation of a particular race/ethnicity compared to the
dominate race in care. Again, an index was calculated using the following;
𝐷𝑖𝑠𝑝𝑎𝑟𝑖𝑡𝑦 𝐼𝑛𝑑𝑒𝑥 = 𝐷𝐼 𝑜𝑓 𝑜𝑣𝑒𝑟𝑟𝑒𝑝𝑟𝑒𝑠𝑒𝑛𝑡𝑒𝑑 𝑟𝑎𝑐𝑒
𝐷𝐼 𝑜𝑓 𝑑𝑜𝑚𝑖𝑛𝑎𝑡𝑒 𝑟𝑎𝑐𝑒
As with the DI, a Disparity Index greater than 1.0 represents the presence and magnitude of
disparity, while an index less than 1.0 indicates the absence of disparity. For youth served in RHY
programs the index indicated the presence of disparity for the same three groups as above;
Hispanic/Latino (1.97), Black or African American (1.75) and Native Hawaiian – Pacific Islander
(7.154). Just as disproportionality and disparity have been identified as concerns for child
welfare in Oregon, these findings suggest those same issues are present in this population of
youth.

Analysis of Oregon‟s Runaway and Homeless Youth Programs 39
IMPLEMENTATION ANALYSIS
Methodology
For this portion of the project, an implementation analysis was conducted with all eight
Rollout Sites. The goal was to determine to what extent the policy had been implemented,
identify any barriers to implementation that could assist future Rollout Sites, and determine to
what extent system development had occurred. To accomplish this three professionals associated
with each Rollout Site were recruited for interviews. To be eligible, individuals were required to
have extensive experience with the planning and implementation of the new RHY program. An
interview guide was developed to ask questions around policy implementation. Participants were
contacted and a time was scheduled for a phone interview. Each interview took approximately
30 minutes to complete.
Analyses
Data obtained through qualitative interviews with three community professionals who
had experience in starting programs were cross-analyzed, employing inter-rater reliability
methods and using content analysis. Each team member individually analyzed all interviews.
Once completed, team members shared developed categories and, through discussion, created a
list of categories and themes.
Findings
Safety
Every program interviewed conveyed safety of the youth as their top priority. As
described earlier in this report, RHY are at extraordinarily high risk for a multitude of negative
outcomes. Programs appeared to be aware of these risks and developed programs that addressed
safety consistent with their community‟s goals and capabilities.
Outreach
The first stage of working with RHY, and consistent with research, is outreach. Programs
devised outreach services to locate RHY and begin the process of relationship building, the goal

40 Stronger Youth and Smarter Communities
P a g e | 40
being to entice youth off the streets and reengage them back into the community. Outreach was
conducted using a variety of methods which included teams of staff engaging youth in areas
where they congregated (e.g., skate parks, malls, etc.), starting/expanding drop-in centers
(considered stationary outreach), and program staff extending their presence in local schools
while working closely with school staff. Some programs developed websites, such as MySpace,
where local RHY could see descriptions of available services. Other programs were able to use
funding to place staff into their county‟s‟ rural communities, providing a service nonexistent prior
to this funding.
Research shows that there are barriers for RHY accessing services on their own. Outreach
is an effective intervention to overcome such obstacles. To help minimize service barriers, many
of the county programs brought services to the youth. Outreach often included program staff
going into the schools to assist youth with filling out paperwork for benefits/services. One
program‟s website included a “how to” section for benefits. Other services brought to youth
included case management, mental health and substance use/abuse treatment, medical and dental
services, crisis counseling, dual diagnosis support, support for developmental needs, and access to
computers for information and referral.
Emergency/Crisis Services
Basic needs services were provided to youth in all counties. These included day-to-day
items such as clothing, socks and food, as well as health related services such as medical, dental,
and more intensive services such as mental health and drug & alcohol treatment. For some youth,
a bus ticket back home was provided. All counties provided some level of crisis intervention
service, whether that was making a report to DHS for child abuse, neglect or maltreatment, or
working with families in crisis to prevent a runaway event from occurring.
Housing
Youth entering a program via outreach, self-referred to the agency, or who were referred
by a community agency/member, were provided some level of safe housing. Housing options
varied and depended on the capacity of the community. One example of housing included a
Host Home Model, where families in the community provided short-term shelter for youth until

Analysis of Oregon‟s Runaway and Homeless Youth Programs 41
program staff could work with the youth‟s family to facilitate a return home or find more
suitable long-term housing. Some counties had agencies that provided shelter or partnered with
an emergency shelter in the community. Other counties partnered with their local community
such as the Juvenile Departments, Department of Human Services (DHS) or other non-profit such
as the Boys and Girls Club, to find temporary and safe housing. Programs assessed each youth‟s
individual situation and worked to help the youth find the most appropriate placement for
longer term housing whether that was the youth‟s family of origin, extended family, or long-term
transitional living programs.
Safe Exits
County RHY programs all focused on “safe exits” for youth leaving their programs. To
facilitate this, and consistent with research on best practices, all programs focused their first step
on reunifying youth with their families. One program stated that a key to a successful and safe
exit was to work with the youth to develop “realistic transition plans”. This was to ensure the
youth would not fall between gaps in services once they left the program‟s care. Programs
provided a number of services to help facilitate family reunification, which included education to
families on issues specific to adolescences and family mediation to assist with reconciling conflict
between the youth and their family (one program stated they offered as many as 6 mediations
per family). Additional family services included assistance to the family and youth in developing a
contract to help improve
communications, provision
of weekly meetings with
the family and youth to
ensure the crisis was not
reemerging and mediate
new conflict, provide
family support workers,
offer family counseling for
more severe issues, and a
variety of other services to
216
512
912
0100200300400500600700800900
1000
Total # of youth who achieved this outcome
thru Dec 2008
Estimated total # of youth who will achieve this
outcome from startup thru Jun 2009
Estimated total # of youth who will achieve this outcome 2009-2011
Number of Youth Exiting Program to Safe/Stable Housing

42 Stronger Youth and Smarter Communities
P a g e | 42
help rebuild the relationship between the youth and their family. If families refused to engage in
the process, programs referred the case to DHS.
Independent Living Skills
To assist the youth in attaining healthier lifestyles, many programs provided social skills
training in the areas of conflict resolution, anger management, nutrition and problem solving
techniques. For older youth and when appropriate, programs assisted with apartment
applications, job hunting skills, cooking and money management skills.
Connectivity to Resources
To facilitate connectivity to resources, as recommended by research, case management
was the foundation of the services provided by programs. Through case management, runaway
and homeless youth were connected to services they often already qualified for but, due to
barriers, had been unable to access (such as identification cards, which youth are required to have
in order to obtain most other services/benefits and the DHS self-sufficiency program).
Case managers worked with youth to identify new resources and help youth connect to
community services, such as medical, dental, mental health and drug & alcohol treatment. One
program created a policy to perform intakes over the phone in order to help youth access
benefits/services without having to travel across the county. This is one example of a program
reducing barriers to case management through an agency policy. Another program developed a
relationship with the local DHS office so they would allow youth to fax applications. This greatly
expedited the process. Case managers also connected RHY to other youth-serving agencies, such
as Boys and Girls Club, as well as connecting youth with community mentors. Additionally, the
relationships formed between case managers and the McKinney-Vento Homeless School Liaisons
appears to be instrumental in reengaging RHY into education.
Continuity of Education
Runaway and homeless youth face a number of barriers to education. The National Law
Center on Homelessness and Poverty lists enrollment requirements, high mobility of youth, lack
of transportation, lack of school supplies, and poor health as some of the leading obstacles for

Analysis of Oregon‟s Runaway and Homeless Youth Programs 43
runaway and homeless
youth in terms of staying
connected or
reconnecting with
school. The Homeless
School Liaison, funded
by the federal
McKinney-Vento Act, is
a key member in every
school district in Oregon
to facilitate runaway and
homeless youth staying in, or reenrolling in, school. All county RHY programs reported working
especially close with these individuals to help youth get back into school and stay in school.
Many programs also assisted youth in acquiring General Education Diplomas (GED).
Programs provided educational tutoring (both within their agency and out in the community)
and collaborated with schools to obtain textbooks, get homework assignments, and obtain
missing work. Additionally, programs provided school supplies and study guides for help in
earning a GED and scoring well on the SAT. One program started a “Homework Club” to
encourage RHY to continue with their studies, even in this time of crisis. Programs worked closely
with school counselors to identify youth who may be homeless and still in the school, or who
were at risk of homelessness or running away. Several programs reported having staff within the
schools helped to identify crisis earlier and afforded staff time to work with youth, possibly
preventing running away and/or leaving school.
System Improvement
Expand Partnerships
County programs described creating and/or developing partnerships with state agencies
such as the Oregon Department of Human Services (DHS), Homeless School liaisons, local
Juvenile Departments, Oregon Department of Labor, as well as an increased and improved
128
238
387
050
100150200250300350400450
Total # of youth who achieved this outcome thru
Dec 2008
Estimated total # of youth who will achieve this
outcome from startup thru Jun 2009
Estimated total # of youth who will achieve this outcome 2009-2011
Number of YouthExhibiting Acedemic Progress/Re-engagement in School
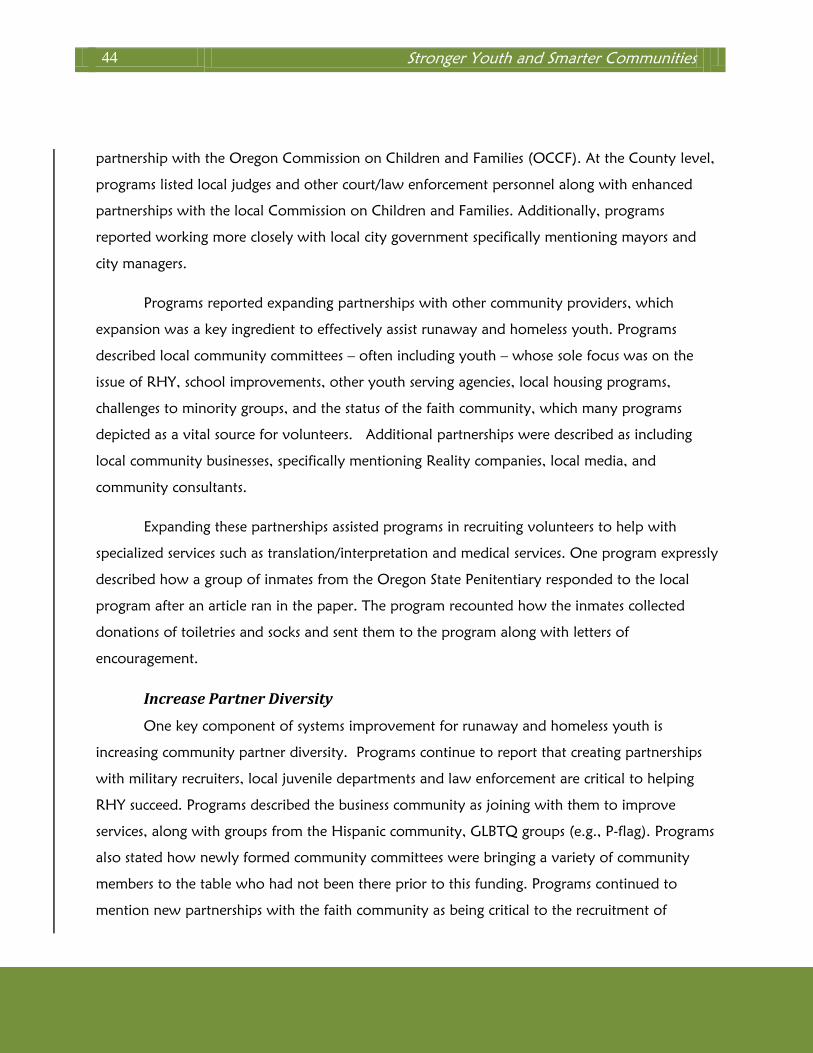
44 Stronger Youth and Smarter Communities
P a g e | 44
partnership with the Oregon Commission on Children and Families (OCCF). At the County level,
programs listed local judges and other court/law enforcement personnel along with enhanced
partnerships with the local Commission on Children and Families. Additionally, programs
reported working more closely with local city government specifically mentioning mayors and
city managers.
Programs reported expanding partnerships with other community providers, which
expansion was a key ingredient to effectively assist runaway and homeless youth. Programs
described local community committees – often including youth – whose sole focus was on the
issue of RHY, school improvements, other youth serving agencies, local housing programs,
challenges to minority groups, and the status of the faith community, which many programs
depicted as a vital source for volunteers. Additional partnerships were described as including
local community businesses, specifically mentioning Reality companies, local media, and
community consultants.
Expanding these partnerships assisted programs in recruiting volunteers to help with
specialized services such as translation/interpretation and medical services. One program expressly
described how a group of inmates from the Oregon State Penitentiary responded to the local
program after an article ran in the paper. The program recounted how the inmates collected
donations of toiletries and socks and sent them to the program along with letters of
encouragement.
Increase Partner Diversity
One key component of systems improvement for runaway and homeless youth is
increasing community partner diversity. Programs continue to report that creating partnerships
with military recruiters, local juvenile departments and law enforcement are critical to helping
RHY succeed. Programs described the business community as joining with them to improve
services, along with groups from the Hispanic community, GLBTQ groups (e.g., P-flag). Programs
also stated how newly formed community committees were bringing a variety of community
members to the table who had not been there prior to this funding. Programs continued to
mention new partnerships with the faith community as being critical to the recruitment of

Analysis of Oregon‟s Runaway and Homeless Youth Programs 45
assistance, such as faith-based counselors and other volunteers, specifically mentioning how new
speaking opportunities at local churches were afforded to them. Programs also described new
assistance from service providers in the community, such as alcohol and drug counselors, mental
health professionals, and medical and dental providers. Yet, according to programs, a key
improvement to partner diversity was that of programs who hired RHY to assist with outreach of
other RHY.
Decrease gaps in service delivery
Gaps in services for RHY are well recorded in research and reports. Decreasing these gaps,
making it harder for a youth to slip between the cracks, was an additional goal of this funding.
Programs described how they could now facilitate benefits and services for youth with
relationships they developed from this funding. Specific services mentioned included connections
to DHS‟s self-sufficiency and food stamps program. Programs reported how their relationship to
DHS was critical, not only in working with youth, but in assisting the families of youth. One
program described how they were able to now intervene and extend deadlines so families would
not have to redo DHS paperwork. Programs also described how they were now being invited to
state planning sessions and participating in creating housing continuums for youth aging out of
foster care.
Other programs described how the relationship with the local juvenile department and
police departments had developed into sharing resources and runaway reports being sent directly
to the homeless coordinator. System improvements included the ability of several programs to
serve youth in outlying, rural communities by being afforded the opportunity to go into the
schools. Again, this often helped to prevent a youth from running away or at least helped in
keeping youth connected to education.
Programs additionally described how the new funding resulted in service gap reduction in
the following ways;
Youth are now hearing about the services and coming in for services
Outreach to RHY was nonexistent before funding

46 Stronger Youth and Smarter Communities
P a g e | 46
Faith community providing services through volunteers
Services are now more comprehensive
Ability to assess needs of youth and direct to appropriate services
There were no after school programs, no shelter services, and no drop-in services prior to
funding
Minimizes duplication of services
Medical nurses provide services at drop-in clinic
Outreach van provides services to youth not served
Single point of contact for the community
Improved information and referral process
Utilizing youth and volunteers to continually assess needs of population.
Increased agency involvement looking to streamline resources for youth
Community roundtable communicates resources
Minimizing barriers
Youth don‟t have to be in shelter to receive case management services
Increase Community Response to the Need
An additional goal of this funding was to increase the community‟s response to the needs
of RHY. Programs described how newly developed partnerships had heightened awareness of the
needs of RHY, specifically mentioning partnerships with federally funded Runaway and Homeless
Youth programs for housing, DHS for benefits and programs, Juvenile Departments and law
enforcement for better coordination around runaway reports, and Homeless School Liaisons to
increase the school‟s response to the issue. Partnerships with the school liaisons also assisted
schools to reconnect with youth who had dropped out.
Programs also described their community increasing its response to the needs of RHY with
volunteers who taught independent living skills, tutored youth, or became host families for RHY.
They mentioned how previously described community committees specifically addressed the
needs of RHY, brought resources to the table, and identified gaps in services and ways for the
community to responds to those gaps. Participating programs expressed a belief that the funding

Analysis of Oregon‟s Runaway and Homeless Youth Programs 47
helped improve staff credibility in the community. The faith community was mentioned as
instrumental in expanding social activities for RHY to participate in, as well as dinners for youth.
Faith groups also provided a steady base of volunteers, materials, and financial support. Stronger
community coalitions were described as resulting in a single point of contact for RHY and the
community, providing more efficient and effective services, as well as the development of basic
needs provisions, such as medical, dental, mental health and A&D treatment.
Barriers to Program Implementation
Participants were asked a question pertaining to barriers they experienced during start-up
program implementation. Five themes were identified as being barriers to program
implementation.
Funding
Obtaining funding from city, county, state, and federal agencies is labor intensive for
small, start-up programs. Different funding streams impose different mandates and administrative
requirements. This makes navigation through individual systems, once funding is granted,
challenging to programs unaware of those differences. One respondent indicated that if a
program meets requirements for county funding, they don‟t necessarily meet requirements for
city and state funding streams. Because of this, allocation of funds can be delayed until
documentation is aligned with each requirement imposed by each funder.
Bureaucratic
Similar to funding stream challenges are bureaucratic barriers. Interviewed participants
discussed complexities associated with varying levels of government in relation to differences in
protocols and procedures between public agencies. Start-up programs require extra support to
understand the nuances of different procedures in order to obtain funding to proceed with
program implementation. Interviewees also indicated that the rigidity of rules and procedures in
public agencies (the very definition of bureaucracy) can pose barriers to start-up programs.
One participant described a five month delay in funding allocation as a result of time
required to learn bureaucratic nuances. They indicated it was important to know who the right

48 Stronger Youth and Smarter Communities
P a g e | 48
public official was to talk to, but difficult to know who that person was due to the amount of
misinformation that occurred through multiple phone transfers by public agency personnel.
Staff Experience
Interview participant themes also pointed towards the importance of staff experience in
starting a program. Staff experienced with government protocols and procedures have a higher
likelihood of being able to navigate through the appropriate system requirements that have to be
met in order for a program to begin. Without such experience, time is spent learning the system
and program funding can be delayed for extended periods of time. But experience with formal
systems is not the only predictor of success. Staff with experience collaborating with community
partners also seemed to be important for the effective implementation of this policy.
Partner Agreements
Low levels of specificity in partner agreements increase barriers confronting start-up
agencies. If contracts are vague in language or unclear about program expectations, agencies
struggle to understand and follow details of program implementation requirements. Questions
about which agency is supposed to provide which service to which client could lead to friction
between partners and increase barriers to implementation.
History of Collaboration
Rural communities are less likely to have experience collaborating with formal community
supports because there might not be any funded resources to collaborate with. This can be a
barrier for rural start-up programs because they are alone in their efforts to serve the runaway
and homeless youth population in need. Consequently, they might not have sufficient resources
for RHY being served and struggle to identify existing resources due to rural isolation. However,
some rural communities are able to participate in state-wide collaborations that provide insight
into how to obtain services that are currently unavailable in rural communities. Rural
communities can be very creative in establishing informal collaboration however (see
„community partners‟).

Analysis of Oregon‟s Runaway and Homeless Youth Programs 49
Urban communities have an improved capacity to form formal collaborations due to the
increased availability of resources found in urban environments. With experience participating in
and forming collaborations, agencies are better equipped to address barriers based on
collaborative feedback, support, and sharing of resources. However, as one interviewee pointed
out, it is important to note that the type (i.e., beneficial, challenging, etc.) of relationship partners
have had in the past can also impact implementation.
Benefits of Collaboration
The second question asked of participants pertained to identifying the benefits of working
collaboratively with others agencies/organizations. Two key themes were identified from the
data.
Program Improvement
Statewide collaborations have the capacity to offer individual service providers
information about how other programs serve similar populations and are able to learn what is
working and why. Participation in collaborative efforts can inform programs of how to improve
service delivery and efficient integration of additional community resources.
Inclusive Collaborations
In order for benefits to be found in collaborations it is necessary for all members to be
included in the collaborative group, contribute to attainment of collaborative objectives, and
participate in the process to address all member concerns or requests. Successful collaborations
utilize everyone‟s voice to address presenting issues challenging to all or some members. If a
member of a collaborative team feels unwelcomed or judged, they are not likely to contribute to
collaboration efforts and may stop coming to meetings altogether. Additionally, because
collaborations typically offer expertise from multiple leaders, inclusivity enables collaborative
efforts to obtain information and resources that might not otherwise be found in their
community.

50 Stronger Youth and Smarter Communities
P a g e | 50
Recommendations to the way programs are implemented
The third interview question asked participants for ideas on how collaborations and/or
implementation better could be improved upon. Two themes were identified.
Community Support
In order for start-up programs to succeed, it is important the communities they reside in
support program objectives. Integration of services is often necessary for populations with needs
that extend beyond services provided by any one agency. Community support enables available
community resources to be utilized, provides reassurance to consumers that options for services
exists, and enables start-up programs to focus on key programmatic areas of focus without
distractions of service needs unable to be addressed by the program.
Client Driven Programs
Sometimes programs are presented with barriers in service delivery due to insufficient
information pertaining to client needs. Agencies that are client-driven experience a reduction in
this barrier due to access to, and utilization of, client feedback and insight for improvement. By
contributing to program sustainability through improved services, consumer voice influences
positive outcomes of program goals. Additionally, clients can assist programs in identifying
current and changing needs pertinent to the population being served and assist with
development of innovative service strategies.
Advice to others
The fourth question asked what advice the participant might offer a program or
community partnership that was embarking on this type of work. One major theme emerged
from the data.
Healthy Collaborations
Healthy collaborations recruit consumer voice and membership, as well as community
leaders, in fields serving populations impacted by proposed policies. On-going maintenance of
collaboration efforts is crucial to sustained success. Healthy collaborations are inclusive, a safe
place for all views to be heard, and provide on-going support in the form of resources, collective

Analysis of Oregon‟s Runaway and Homeless Youth Programs 51
brainstorming to address challenges, and the sharing of success stories. Collaborations are
intended to provide members with information that will benefit collaborative objectives and the
communities they serve.
Limitations
It is difficult to provide a thorough and reliable policy analysis with input from such a
small sample comprised of one group of administrators involved in systems of care. This report
can only provide data that is reflective of the perspective of an administrator with experience
starting programs. Without input from consumers and the varying levels of employment
positions associated with start-up programs for runaway and homeless youth, policy analysis is
void of perspectives that provide rich insight to barriers confronting start-up programs.
An additional limitation for this project is that associated with acquiring a “snapshot” of
what is really happening. There is every possibility that if this information were used to assist new
programs, we would uncover entirely divergent findings. Yet, the information we have obtained
in completing this project has provided a wealth of knowledge and insight researchers may not
have otherwise acquired.
A further limitation was the interview guide created for the participants. Patton (2002)
describes the various ways in which personal bias of the researcher can impact participant
responses. Because we wished to obtain specific information concerning barriers to policy
implementation, we may have inadvertently biased the responses by preparing an interview
guide beforehand. However, because separate members of the research team were interviewing
separate participants, we felt it was important to develop questions so that answers would be
grouped together based on the question.
Additionally, the convenience sample and the size of the sample were further limitations.
Although this type of sampling was “fast and convenient” (Patton, 2002), it limits us on the
extent of the findings generalizability. Because there may be specific barriers associated with
bureaucracies our project missed, it would have been preferred to have had the ability to
interview individuals who have had more relevant experience working with public agencies.
52 Stronger Youth and Smarter Communities
P a g e | 52
However, because identifying barriers to implementation was only one aspect of this project, we
felt this sampling strategy was appropriate.
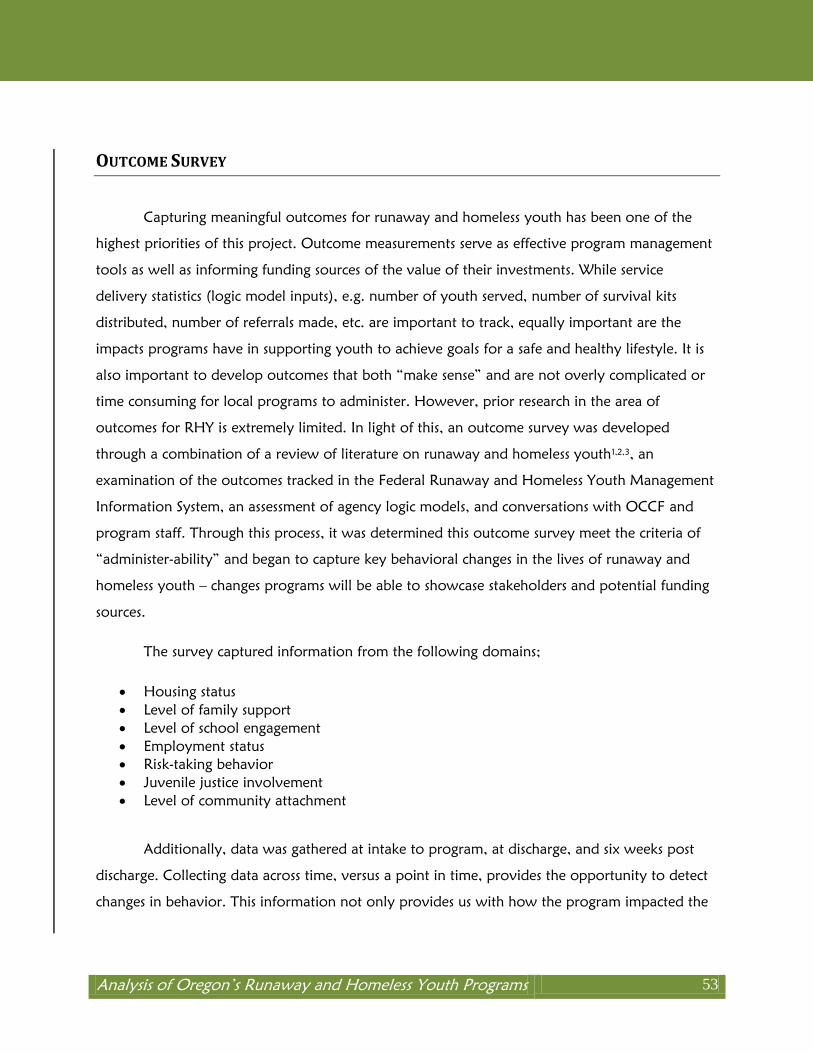
Analysis of Oregon‟s Runaway and Homeless Youth Programs 53
OUTCOME SURVEY
Capturing meaningful outcomes for runaway and homeless youth has been one of the
highest priorities of this project. Outcome measurements serve as effective program management
tools as well as informing funding sources of the value of their investments. While service
delivery statistics (logic model inputs), e.g. number of youth served, number of survival kits
distributed, number of referrals made, etc. are important to track, equally important are the
impacts programs have in supporting youth to achieve goals for a safe and healthy lifestyle. It is
also important to develop outcomes that both “make sense” and are not overly complicated or
time consuming for local programs to administer. However, prior research in the area of
outcomes for RHY is extremely limited. In light of this, an outcome survey was developed
through a combination of a review of literature on runaway and homeless youth1,2,3
, an
examination of the outcomes tracked in the Federal Runaway and Homeless Youth Management
Information System, an assessment of agency logic models, and conversations with OCCF and
program staff. Through this process, it was determined this outcome survey meet the criteria of
“administer-ability” and began to capture key behavioral changes in the lives of runaway and
homeless youth – changes programs will be able to showcase stakeholders and potential funding
sources.
The survey captured information from the following domains;
Housing status
Level of family support
Level of school engagement
Employment status
Risk-taking behavior
Juvenile justice involvement
Level of community attachment
Additionally, data was gathered at intake to program, at discharge, and six weeks post
discharge. Collecting data across time, versus a point in time, provides the opportunity to detect
changes in behavior. This information not only provides us with how the program impacted the
54 Stronger Youth and Smarter Communities
P a g e | 54
youth, but provides key indices to programs that can be used for program improvement. Because
this data is gathered over time, levels required for statistical analysis are only now being met.
Analysis was conducted on the RHY data from Benton County (a shelter program), which had
been able to obtain all three time points of data. The following are the findings from that
analysis.
Confirming previous other research, the majority of youth (72.9 percent) experienced
some level of family conflict occurred prior to entering shelter, with the remainder arriving from
a detention center (8.3 percent), homeless – on the streets (6.3 percent), living with relatives (4.2
percent), a residential drug and alcohol treatment program (4.2 percent), or living with friends
(2.1 percent). Although some youth reported having graduated from high school (6.3 percent)
or had obtained a General Education Degree (GED) (2.1 percent), a large proportion of youth
(39.6 percent) were not enrolled in public education or an alternative education program upon
entering shelter.
In the area of risk behavior, 46.7 percent of males and 53.3 percent of females had been
sexually active in the six weeks prior to entering the program. Almost 27 percent of 13-15 year
olds were sexually active, which is over 4 times higher than the rate of all 8th graders in Benton
County (6.6 percentiii). More than 73 percent of 16 & 17 year olds were sexually active, reflecting
a rate 3.4 times higher than all 11th graders in Benton County (21.3 percent
iv). This indicates the
need to work with high risk youth to prevent hazards such as sexually transmitted diseases,
pregnancy, and HIV/AIDS, all of which costs communities large amounts of money if such
education is withheld.
Youth were asked to rate their perception of family support at entrance to the program
(T1), at discharge from the program (T2), and six weeks post discharge (T3) on a scale of 1-10. A
paired sample t-test was conducted to evaluate the impact of RHY services with youth and family
on youths‟ perception of family support. Analysis indicates there was an increase in youths‟
iii
For this survey, youth were asked if they had been sexually active over the past 6 weeks. The Oregon Healthy
Teens Study asked if youth had been sexually active over the past 3 months.
iv For this survey, youth were asked if they had been sexually active over the past 6 weeks. The Oregon Healthy
Teens Study asked if youth had been sexually active over the past 3 months.

Analysis of Oregon‟s Runaway and Homeless Youth Programs 55
perception of their family support approaching significance from T1 to T2 with a moderate effect,
a statistically significant improvement from T2-T3 with a moderate effect, and overall statistically
significant improvement from T1-T3 with a large effectv (see Table 5 below for statistics).
Table 5: Statistics
Time Mean Std. Deviation t df Sig. Eta2
T1 – T2 -.3170 1.3228 -1.643 46 .107 .06
T2 – T3 -.7900 2.2949 -2.177 39 .036 .11
T1 – T3 -1.1125 2.4820 -2.835 39 .007 .17
Discussion
Aside from abuse and neglect, research suggests family conflict is the chief reason youth
run away from home4. Therefore, working to resolve that conflict not only assists youth in
exiting to a safe home when they leave the program, but will then positively impact the
likelihood of the youth staying home and potentially promoting the adoption of additional
healthy behaviors and a rejection of risk taking activities. In a review of federal studies on
effective family intervention programs designed to prevent adolescent delinquency, University of
Utah researchers Karol Kumpfer and Rose Alvarado state, “a positive family environment…is the
major reason youth do not engage in delinquent or unhealthy behaviors.”5 Additionally, in their
study on the effects of parental monitoring and support (two distinct constructs) on risk
behaviors, researchers Jennifer Parker and Mark Benson found the parental support was
associated with a reduction in every risk factor they assessed. Furthermore, they stated that,
“Adolescents who perceived their parents as supportive were more likely to have less
delinquency, school misconduct, drug, and alcohol abuse.”6 Moreover, the national research
center Child Trends find these positive attributes persist even for families considered low-income.7
The findings from this analysis suggest services provided by this RHY provider, which includes
working with both youth and families to ameliorate the conflict that resulted in the youth leaving
home, can positively impact youth‟s perception of family support, which is the first step in
acquiring the positive outcomes other studies suggest.
v Cohen’s (1988) guidelines for magnitude of effect (Eta
2); .01=small, .06=moderate, and .14 and above = large.

56 Stronger Youth and Smarter Communities
P a g e | 56
The scientific literature suggests that youth who access this type of shelter program are
often first-time runners who still have some level of emotional attachment to their families. The
high incidence of youth in the study whose prior living arrangement was their family (72.9
percent) helps explain the success of this particular program with their clientele. It further implies,
as the literature does, youth who have engaged with the street culture rarely utilize this level of
service and require directed interventions such as street outreach programs or drop-in centers.
Additionally, this is a promising example of outcomes tracking. Because there are no
evidenced-based-practices for working specifically with runaway and homeless youth, the ability
to capture meaningful outcomes associated with program services is critical. The RHY Rollout
Sites provide an array of services (e.g., shelters, host homes, case management only, street
outreach only, etc). As such, tailored adjustments to the survey are required. However, because
of the work done to date, the foundation has been established to gather similar outcomes over
time for all Rollout Sites which receive ongoing investment.
1 Thompson, S.J., Pollio, D.E., & Bitner, L. (2000). Outcomes for Adolescents Using Runaway and Homeless Youth
Services. Journal of Behavior in the Social Environment. 3(1), 79-97.
2 Thompson, S.J., Pollio, D.E., Constantine, J., Reid, D. & Nebbitt, V. (2002). Short-term Outcomes for Youth
Receiving Runaway and Homeless Shelter Services. Social Work Practice. 12(5), 589-603.
3 Pollio, D.E., Thompson, S.J., Tobias, L., Reid, D., & Spitznagel, E. (2006). Longitudinal Outcomes for Youth Receiving
Runaway/Homeless Shelter Services. Journal of Youth and Adolescence. 35(5), 859-866.
4 National Alliance to End Homelessness (NAEH) (2007). Fact Checker: Accurate Statistics on Homelessness. Retrieved
on October 21, 2008 from
http://www.endhomelessness.org/files/1659_file_10606_NAEH_YouthHomelessness_4_.pdf.
5Kumpfer, K.L. & Alvarado, R. (2003). Family-strengthening approaches for the prevention of youth problem
behaviors. American Psychologist. 58(6/7), p 457.
6 Parker, J.S. & Benson, M.J. (2004). Parent-adolescent relations and adolescent functioning: Self-esteem, substance
abuse, and delinquency. Adolescence. 39(155), p 527
7 Moore, K.A., Whitney, C., & Kinukawa, A. (2009). Exploring the links between family strengths and adolescent
outcomes. Child Trends Research Brief. Publication #2009-20.

Analysis of Oregon‟s Runaway and Homeless Youth Programs 57
NEED FOR FUTURE RESEARCH
Combined with Federal funding, the current investments made by the state of Oregon in
runaway and homeless youth has made great strides in building a statewide system of care for
these vulnerable youth (see Figure 3). Yet there are 12 more counties who have identified services
for these youth as a need and 12 counties who submitted proposals for Oregon funding but were
not funded because of the limited
money.
Moreover, the literature is
missing the answers to key questions
about this population. Questions such
as, how many youth are associated
with each of the above types of RHY?
Is there a predominate group that
makes up the overall RHY population?
Which practices are most effective for
each type of youth? Certainly, much
more work needs to be done to fully
understand this population.
Figure 3: Current RHY System of Care

P a g e | 58
Please direct any questions to:
Don Schweitzer
Portland State University
Center for Improvement of Child & Family Services
PO Box 750
Portland, OR 97207
Phone: 503-725-8079
Email: [email protected]