Stress-optical properties of poly(oxypropylene) networks
14
Stress-optical Properties of Poly( oxypropylene) Networks ANTHONY L. ANDRADY, Research Triangle Institute, P.O. Box 12194, Research Triangle Park, North Carolina 27709, MIGUEL A. LLORENTE, Departamento de Quimica General Y Macromokculus, Universidad a Distancia (UNED), 28040 Madrid, Spain, and ENRIQUE SAIZ, Bepartanento de Quimica Fisicu, Uniuersidad de Alcala de Henares, Madrid, Spain Synopsis Strain birefringence of poly(oxypropy1ene) was studied using several poly(oxypropy1ene) model networks of different crosslink densities. Most of the measurements were carried out in elonga- tion, in both the unswollen and the swollen states, over the temperature range 10-70°C. The optical configuration parameter was found to be Aa = (4.33 k 0.09) X lWZ4 cm" a t 25°C with a very small temperature coefficient. Theoretical calculations based on rotational isomeric state theory were employed to interpret the experimental data. The results indicate the intermolecular correlations to be low for this polymer, and, contrary to other systems, the stress-optical coefficient C decreased with increasing average molecular weight between crosslink. This fact was attributed to the end-group effect introduced by the crosslinking agent. INTRODUCTION The rotational isomeric state theory' affords a convenient and useful means of interpretation of configuration-dependent properties of polymers. The theory, which is based on a simple macromolecular model that assumes each skeletal bond to occur in one of a small number of discrete rotational states, has been successfully employed' in the estimation of characteristic ratio, the mean-square dipole moment of macromolecules, and other important macro- molecular parameters. However, in the case of the stress-optical behavior of crosslinked polymers, the values predicted on the basis of the rotational isomeric state theory differ by as much as an order of magnitude"' from the experimental values. The discrepancy is usually attributed to the intermolecular correlations in the amorphous state that seem to drastically increase the bond (and group) polarizabilities, thereby invalidating the assumption of additivity of these contributions. Recently, much attention has been paid to stress-optical studies of asym- metric polymer chains where somewhat better agreement between theory and experiment has been obtained.6-10 Apparently, the intermolecular correlations are less important in these systems, particularly in cases where the side groups are bulky and anisotropic, causing the birefringence of the polymer to be negative. Therefore, experimental studies on asymmetric chain polymers are of special interest. Journal of Polymer Science: Part B: Polymer Physics, Vol. 25, 1935- 1948 (1987) Q 1987 John Wiley & Sons, Inc. CCC 0098- 1273/87/091934- 14$O4.W
-
Upload
independent -
Category
Documents
-
view
4 -
download
0
Transcript of Stress-optical properties of poly(oxypropylene) networks

Stress-optical Properties of Poly( oxypropylene) Networks
ANTHONY L. ANDRADY, Research Triangle Institute, P.O. Box 12194, Research Triangle Park, North Carolina 27709,
MIGUEL A. LLORENTE, Departamento de Quimica General Y Macromokculus, Universidad a Distancia (UNED), 28040 Madrid,
Spain, and ENRIQUE SAIZ, Bepartanento de Quimica Fisicu, Uniuersidad de Alcala de Henares, Madrid, Spain
Synopsis
Strain birefringence of poly(oxypropy1ene) was studied using several poly(oxypropy1ene) model networks of different crosslink densities. Most of the measurements were carried out in elonga- tion, in both the unswollen and the swollen states, over the temperature range 10-70°C. The optical configuration parameter was found to be A a = (4.33 k 0.09) X lWZ4 cm" a t 25°C with a very small temperature coefficient. Theoretical calculations based on rotational isomeric state theory were employed to interpret the experimental data. The results indicate the intermolecular correlations to be low for this polymer, and, contrary to other systems, the stress-optical coefficient C decreased with increasing average molecular weight between crosslink. This fact was attributed to the end-group effect introduced by the crosslinking agent.
INTRODUCTION
The rotational isomeric state theory' affords a convenient and useful means of interpretation of configuration-dependent properties of polymers. The theory, which is based on a simple macromolecular model that assumes each skeletal bond to occur in one of a small number of discrete rotational states, has been successfully employed' in the estimation of characteristic ratio, the mean-square dipole moment of macromolecules, and other important macro- molecular parameters.
However, in the case of the stress-optical behavior of crosslinked polymers, the values predicted on the basis of the rotational isomeric state theory differ by as much as an order of magnitude"' from the experimental values. The discrepancy is usually attributed to the intermolecular correlations in the amorphous state that seem to drastically increase the bond (and group) polarizabilities, thereby invalidating the assumption of additivity of these contributions.
Recently, much attention has been paid to stress-optical studies of asym- metric polymer chains where somewhat better agreement between theory and experiment has been obtained.6-10 Apparently, the intermolecular correlations are less important in these systems, particularly in cases where the side groups are bulky and anisotropic, causing the birefringence of the polymer to be negative. Therefore, experimental studies on asymmetric chain polymers are of special interest.
Journal of Polymer Science: Part B: Polymer Physics, Vol. 25, 1935- 1948 (1987) Q 1987 John Wiley & Sons, Inc. CCC 0098- 1273/87/091934- 14$O4.W
1936 ANDRADY, LLORENTE, SAIZ
Poly(oxypropy1ene) (POP) is a particularly suitable polymer for the pur- pose. The polymer diol can be easily crosslinked through i t s terminal hydroxyl groups using a suitable triisocyanate crosslinking agent to obtain a well- defined model network."*12 Moreover, the POP chains, in common with other polyoxide chains, show a decisive preference for the gauche conformation over the trans, about the bonds
Abe et al.'" investigated the conformational energies of poly(oxypropy1ene) and used their results to interpret experimental data on the characteristic ratio, (rp)Jnlp, and dipole moment ratio, (p2)/nm2.
The present work extends the previous studies on configurational properties of poly(oxypropy1ene) to stress-optical behavior of amorphous POP networks in order to better understand the effects of intermolecular correlations upon the stress-optical properties of the polymer.
The crosslinking agent used in the study results in enhanced polarizability and anisotropy of the network chain ends relative to that of repeat unit segments. Any contributions by chain ends on the observed stress-optical properties of the crosslinked polymer is expected to be readily observable in such a system. The study is expected to result in better understanding of the causes of discrepancies often encountered between theory and experimental data in studies of stress-optical properties.
EXPERIMENTAL
Materials
The networks investigated in this work were similar to those used by one of us (Andrady) in other types of studies."' l4 The poly(oxypropy1ene) diols prepared by a nonstereospecific base-catalyzed reaction were obtained from Union Carbide Corporation. The hydroxyl terminated POP chains were cross- linked into trifunctional networks with tris(p-isocyanoatophenyl) thio- phosphate (Desmodur RF") obtained from Mobay. The use of this crosslink- ing agent allows the samples to be cured at ambient temperature, minimizing any side reactions, and model networks virtually free of defects can be prepared." The characteristics of the networks studied are given in Table I, and their elastic behavior is reported elsewhere.15 Most networks (R series) were synthesized by stoichiometrically end linking the linear polymers, and the average molecular weight between crosslinks, M,, was taken to be that of the parent polymer. For other networks (M series) that were obtained by mixing chains of different molecular weights, M,. is the corresponding average value. The refractive indices were measured as a function of temperature using an Abbe refractometer (ATAGO model 1.111) in the temperature range 10-50°C.
Two diluents, reagent-grade decalin and a POP oligomer of low molecular weight (POF'700), were used in the experiments on swollen samples. Density of

STRESS-OPTICAL PROPERTIES 1937
'I'AB1.E I Characteristics of the I'oly(oxypropylene) Polymers and 'I'heir Model Networks
Ilensity at Polymer 2 5 ' ~ (g/cm,') n" Network IM, nc
POEOO 1.0015 1.4573-
POPIO00 1.0010 1.4579-
I'OP2(XXl 0.9999 1.4.W-
POPR(XK) 0.9993 1.4592-
3.745 x I W 4 T
3.709 x 10- 4T
3.665 x 10 T
3 . w x 1 0 - 4 ~
- mixture" -
mixture" - mixture" -
H-2 725 -
K-3 I025 -
Ft-4 2o(K) 1.4~61- 3.060 x 1 0 4T
3.370 x 10 4T
3.310 x 10 4T
11-5 3000 1.4796-
M-l 730 1.5170-
M-2 740 M-3 I23
-
- - l r
" Index of refraction of the polymer (T in Y). "Average molecular weight between crosslinks. 'Index of refraction of the network (T in "C).
Mixture composition:
~ o ~ y m e r .Vn Molar fraction for 425 725 1025 2000 3OOo
M-l 0.52 0.26 0.14 0.06 0.02 M-2 0.32 0.51 0.12 0.04 0.01 M-3 0.81 0.19
decalin ( p = 0.896 g/cm3 at 20°C) and index of refraction (n = 1.4832-4.714 x 10⁻⁴T, with T in "C) were taken from the literature.''*'"
Apparatus and Experimental Procedure
The experimental technique used was previously fully described elsewhere."' Two kinds of experiments were performed. Measurements a t constant temper- ature (25°C) were carried out on all the networks listed in Table I in order to determine the influence of the degree of crosslinking on the stress-optical behavior. Those a t constant length were made only on the networks of higher average molecular weight between crosslinks (Networks R-4 and R-5) in the temperature range of 10-70°C.
EXPERIMENTAL RESULTS
Thermoelastic Results
Thermoelastic data were obtained in the usual manner by measuring the elastic force as a function of temperature at a given extension of the sample. Only networks R-4 and R-5, selected because of their higher extensibilities, were used for these measurements. Typical results are shown in Figure 1 for the network R-5 ( M , = 3000). The experimental data points were linear, and

1938
5.a
I- \
* ! C I - 4.8
4.6
4.4
4.2
ANDRADY, LLORENTE, SAIZ
I I I
a-1 M
1.297
?- I 379
0 20 40 60 80 T , 'C
Fig. 1 . Thennoelastic data for unswollen H-5 POP network. The open and solid symbols show results obtained upon decreasing and increasing the temperature, respectively. Each line is labeled with the elongation at 25°C. 1' units are kg em-*.
complete reversibility was observed in the range of temperatures investigated. The lines drawn through the points were obtained by least-squares analysis. Two parameters can be calculated from the slopes of these lines: the fraction of the force that is energetic in origin and the temperature coefficient of the unperturbed chain dimensions.' These quantities are related by the well-known equation"
where f is the elastic force, a is the elongation ratio (a = L/L , ) , and is the thermal expansion coefficient of the sample, taken as 0.75 x deg-' for the present calculations. The values thus obtained are given in the third and fourth columns of Table 11. Differences between results for the two networks are small enough to be attributed to experimental error. The average value of d ln(r2),/dT = (0.29 f 0.11) X deg-' obtained suggests that the chains are somewhat syndi~tactic.'~

STRESS-OPTICAL PROPERTIES 1939
TABLE I1 "hernoelastic and Birefringence Results for Unswollen POP Samples
103(d ln(r~)/cf7')c -107(dAn/$T)d 10n(dAa/$T)e Network a' f , / l (deg- ) (ern3 deg- I )
H-4 1.139 0.04 0.13 7.55 2.10 1.190 0.08 0.25 6.89 2..30 1.238 0.12 0.39 8.21 2.40 1.289 0.06 0.19 7.92 1.10
0.08 f 0.03' 0.24 ? 0.11' 7.64 + 0.57' 1.98 ? 0.60'
R-5 1.203 0.10 0.31 1.297 0.14 0.46 1.343 0.10 0.33 1.379 0.04 0.12 1.412 0.04 0.14 1.280 0.10 0.32 1.406 0.10 0.33 1.426 0.10 0.31 1.527 0.13 0.4 1 1.568 0.13 0.40
0.10 f 0.03' 0x3 f 0.11'
6.69 6.77 6.04 6.04 5.60 7.30 7.34 6.91 7.07 7.37
6.84 f 0.69'
0.69 1 .w 1.02 0.20 0.53 0.69 0.78 0.90 1.15 0.83
0.76 f 0.26'
a Elongation ratio. bFraction of the force that is energetic in origin. 'Temperature coefficient of the unperturbed dimensions.
Temperature coefficient of the strain birefringence. Temperature coefficient of the optical configuration parameter.
'Average value.
3.0
C a 0,
m
2.0
1.0
I 1
P
0.0 0.5 1.0 1.5 f , N. mm-2
Fig. 2. Dependence of the birefringence on the true stress a t 25°C for all the POP networks. The slope of each line is the stress-optical coefficient C. (0) network 11-5, (A) network It-4, (0) network R-3, (v) network H-2, (0) network M-I, (0) network M-2, (A) network M-3.
1940 ANDRADY, LLORENTE, SAIZ
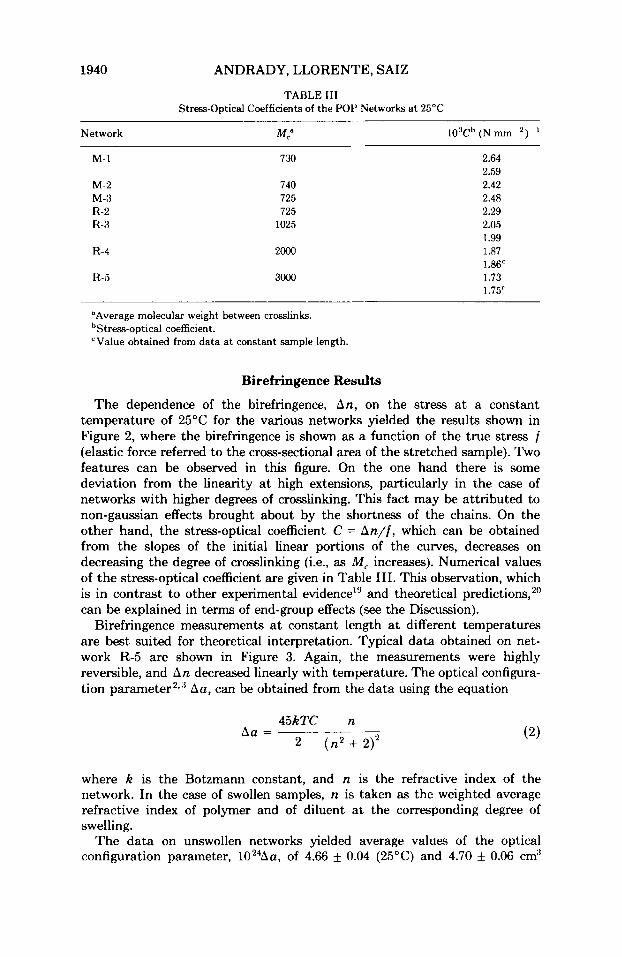
TABLE 111 Stress-Optical Coefficients of the POP Networks at 26°C
Network M," 10:'Ch (N mm-')-'
M-1
M-2 M-3 R-2 R-3
R-4
730
740 725 725
1025
2000
3000
2.64 2.59 2.42 2.48 2.29 2.05 I .99 1.87 1.86' 1.73 1.76'
"Average molecular weight between crosslinks. "Stress-optical coefficient. 'Value obtained from data at constant sample length.
Birefringence Results
The dependence of the birefringence, An, on the stress at a constant temperature of 25°C for the various networks yielded the results shown in Figure 2, where the birefringence is shown as a function of the true stress f (elastic force referred to the cross-sectional area of the stretched sample). Two features can be observed in this figure. On the one hand there is some deviation from the linearity at high extensions, particularly in the case of networks with higher degrees of crosslinking. This fact may be attributed to non-gaussian effects brought about by the shortness of the chains. On the other hand, the stress-optical coefficient C = A n / / , which can be obtained from the slopes of the initial linear portions of the curves, decreases on decreasing the degree of crosslinking (i.e., as M , increases). Numerical values of the stress-optical coefficient are given in Table 111. This observation, which is in contrast to other experimental eviden~e '~ and theoretical predictions,2" can be explained in terms of end-group effects (see the Discussion).
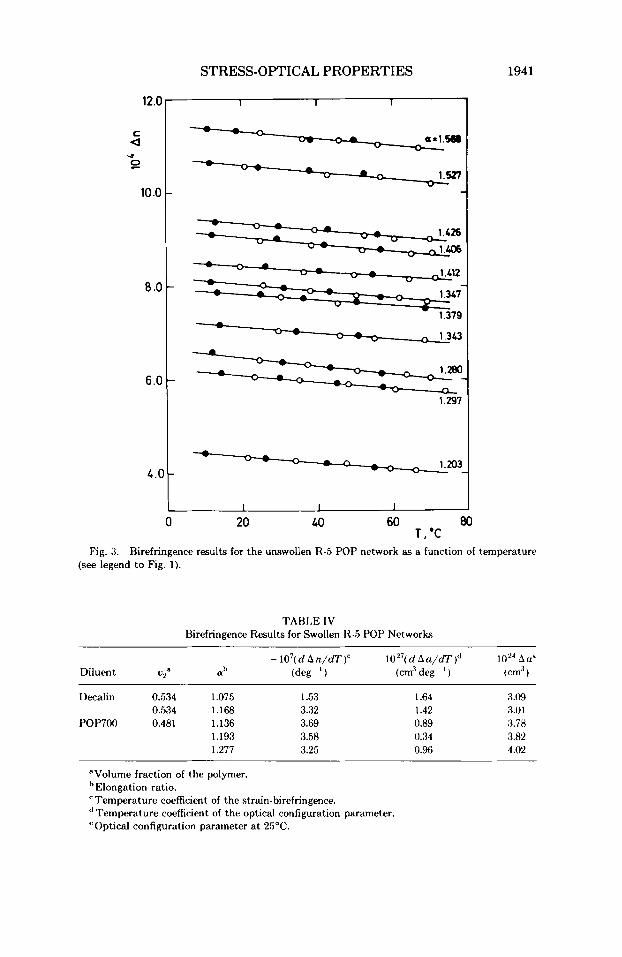
Birefringence measurements a t constant length at different temperatures are best suited for theoretical interpretation. Typical data obtained on net- work R-5 are shown in Figure 3. Again, the measurements were highly reversible, and An decreased linearly with temperature. The optical configura- tion parameter2''' Aa, can be obtained from the data using the equation
where k is the Botzmann constant, and n is the refractive index of the network. In the case of swollen samples, n is taken as the weighted average refractive index of polymer and of diluent a t the corresponding degree of swelling.
The data on unswollen network.. yielded average values of the optical configuration parameter, 1024Au, of 4.66 f 0.04 (25OC) and 4.70 5 0.06 om3
12.0
c a P
-r
10 .o
8 .O
6.0
4.0
0
STRESS-OPTICAL PROPERTIES
1 1 1
c - - 1 u - w e 1.412
- 1341
1379
u -
u - Y - -
I I I
20 LO 60 80 T,'C
1941
Fig. 3. Birefringence results for the unswollen R-5 POP network as a function of temperature (see legend to Fig. 1).
TAH1.E IV Birefringence Results for Swollen It3 POP Networks
- lo7( d A n/dT )' lo2'( d h a/dT )d hue Diluent uza a h (deg ' 1 (cm3 deg ' ) ( cm" )
Ilecalin 0.534 1.075 1.53 0.534 1.168 3.32
POP700 0.481 1.136 3.69 1.193 3.58 1.277 3.25
I .64 3.09 1.42 3.01 0.89 : u x 0.34 3.82 0.96 4.02
"Volume fraction of the polymer.
'Temperature coefficient of the strain-birefringence.
"Optical configuration parameter at 25%
Elongation ratio.
Temperature coefficient of the optical configuration parameter.

1942 ANDRADY, LLORENTE, SAIZ
Fig. 4. A segment of the isotactic POP chain shown in its planar a l l - b - ~ n ~ conformation.
(50°C) for network R-4 and 4.33 f 0.09 crn3 (25°C) and 4.36 i- 0.09 cm3 (50°C) for network R-5. The variation of this parameter with temperature was generally found to be quite small (see Table 11).
Birefi-ingence measurements were also carried out on several swollen sam- ples, and the related data are given in Table IV. As is well known, swelling the networks usually reduces the birefringence to some extent. The drastic reduc- tion of sample extensibility on swelling, however, makes such measurements difficult. For instance, a large error is involved in d ln(r2),/dT, since the correction term in eq. (1) [/3T/(a3 - l)] is very large. Also, in the case of decalin there is some evaporation of diluent during the course of the experi- ment. In any event, the data on swollen samples shows a significant reduction in the optical-configuration parameter (as much as A a = 3.05 X and 3.87 x cm3 for samples swollen with decalin and POP700, respectively) a t 25°C.
THEORETICAL ANALYSIS
Geometry
Figure 4 represents a segment of the isotactic POP chain shown in its planar all-trans conformation. The geometrical parameters used in the present calcu- lations were taken from Abe et al.I3 Bond lengths of 1.43 and 1.53, respec- tively, were assigned to bonds C-0 and C-C. value^"*^'-^^ of 110 and 111.5" were used for bond angles CCO and COC. Rotational isomers ( t , g, g - ) for bonds associated with the R configuration at the tertiary carbons were placed at 0", f 120" for C-C bonds; 0", i- 100" for 0-C bonds; and - 20", 120°, - 100" for C-0 bonds. The sign of these angles should be changed for S stereochemical arrangements.
Statistical Weight Matrices
Three different statistical weight matrices are needed for each stereo- chemical configuration of the repeating unit. The matrices for units having R configuration a t the tertiary carbon (see Fig. 4) are given by"'
a
1 a w

STRESS-OPTICAL PROPERTIES 1943
The corresponding statistical weight matrices for S units may easily be derived from those for R by interchanging second and third rows and columns.'* l3
The values of conformational energies used in the present calculations are those summarized as "set I" in Ref. 13, namely, E , = -0.30, Es = 0.35, E , = 1.30, and E, = 0.40, all in kcal/mol. Each statistical weight was as- sumed to be a single Boltzmann exponential of its corresponding energy.
Anisotropic Part of the Polarizability Tensor
We represent by Bi the contribution to the anisotropic part of the polariza- bility tensor of the whole chain, B, due to skeletal bond i (joining skeletal atoms i - 1 and i) and the groups attached to the i - 1 atom. On this basis, three different contributions are needed. The treatment of the CH, groups appearing in B i + l is simplified if a fictitious C-H bond is added in the direction of the 0-CH, skeletal bond (bond i), thus transforming the CH, into a spherically symmetrical CH, group; this fictitious C-H bond can be removed when formulating the tensor for the 0-C skeletal bond. With this consideration, and disregarding the small distortions from tetrahedral geome- try a t the CH, groups, the three required tensors may be written as
A . ai = am- - aCH
where T and T' represent the transformation matrices required to bring the coordinate systems attached to the lateral CH and CCH, bonds into coinci- dence with the reference frame associated with skeletal bond C-0 (bond i + 2 in Fig. 4). These matrices are fuly described elsewhere.24
All the d, tensors appearing in the right hand side of eqs. (4) represent contributions owing to either a single bond or a group having cylindrical symmetry over a single bond. Thus, all these tensors can be formulated as B, = Aa, J , with J = diag(2/3, - 1/3, - 1/3). The required values of the optical parameters Aa, are reported in the literature25 as Aacc = 0.95, AacH = 0.21, and Aaco = 0.58, all in units of cm3.
Substitution of these numerical values of the optical parameters together with the T and T' matrices and the geometry described above yields the following eq. (4):
B, = diag(0.246, - 0.123,0.123)
B i + l = diag(0.492, -0.246, -0.246)
0.173 -0.147 -0.143
-0.143 0.204 0.127 -0.147 -0.300 0.2041
all in units of 10 - 24 an3.

1944 ANDRADY, LLORENTE, SAIZ
\ \ \
x ' 1
\ N I H
Fig. 5. End group used in the calculations. The anisotropic part of the polarizability tensor of this group is written in the coordinates system shown here, with the z axis completing a right-handed frame.
The corresponding tensors for an S unit may be obtained from those of R (shown above) by reversing the signs of the elements of third row and third column. Since this transformation leaves the elements of the main diagonal unchanged, neither d, nor d,+, are affected by the stereochemical arrange- ment on the tertiary carbon. Only the elements 13, 23, 31, and 32 of d C t 2 change sign from R to S configurations.
For the purpose of calculations, the chain was generated as X-(CH,-CHCH,-O-),CH,-X.
Some of the calculations were performed taking X = H as end groups; in these cases the tensors for the end groups were de = 0, since the ends, being complete symmetrical CH, groups, are respectively included in the first 12~- (representing a CH,-C group) and in the last d, (representing a 0-CH, group) tensors of the chain. However, the majority of the calculations were carried out using N-phenyl carbamate as end groups; the structure of this group (shown in Fig. 5) is quite similar to that portion (approximately one-third) of the crosslinking agent molecule associated with each network chain. Using values reported in the literature24*26'27 for the optical parameters, the 8, tensor for this group, referred to in the coordinate system shown in Figure 5, can be written as
(6) 1.386 0.738 0
- 3.327 in units of cm'.
Calculations
Standard methods of matrix multiplication'.2R were used to compute the averages ( rT&r) and ( rTr)o of chains having different degrees of polymeriza- tion x and fraction of mem diads W,. The optical configuration parameter Aa was then calculated as'-3~28
n
‘“E 1.05 *u ?O % 1.00 a 0.95
0.8 0
0.75
0.70
0.6 5
STRESS-OPTICAL PROPERTIES
1 I
1945
0 0.2 0.4 0.6 0.8 1.0 W,
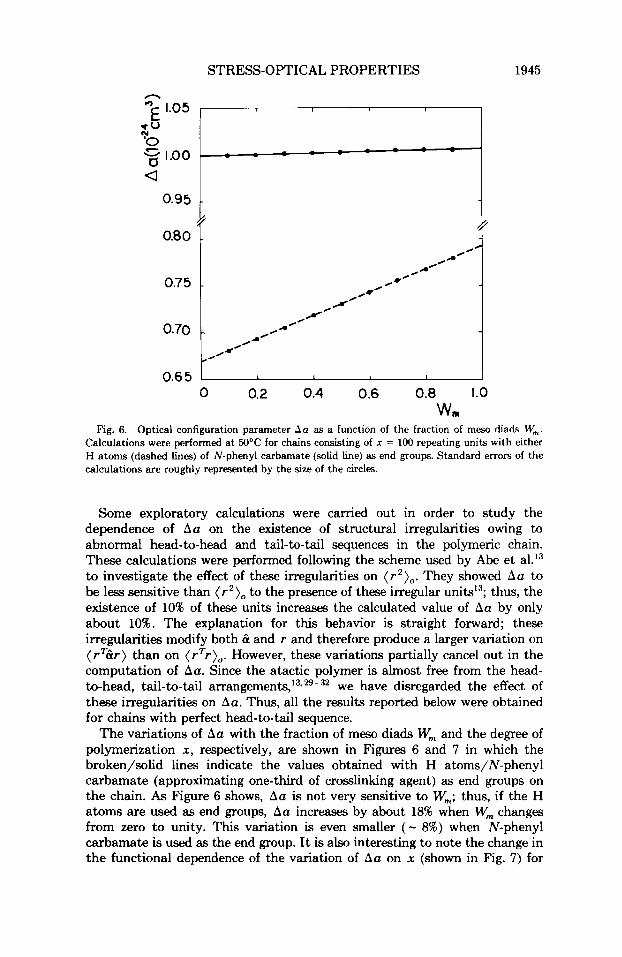
Fig. 6. Optical configuration parameter Au as a function of the fraction of m w diads W,. Calculations were performed at 50°C for chains consisting of x = 100 repeating units with either H atoms (dashed lines) of N-phenyl carbamate (solid line) as end groups. Standard errors of the calculations are roughly represented by the size of the circles.
Some exploratory calculations were carried out in order to study the dependence of Au on the existence of structural irregularities owing to abnormal head-to-head and tail-to-tail sequences in the polymeric chain. These calculations were performed following the scheme used by Abe et al.13 to investigate the effect of these irregularities on ( r2 ) , . They showed ha to be less sensitive than ( r ’ ) , to the presence of these irregular unitsI3; thus, the existence of 10% of these units increases the calculated value of Au by only about 10%. The explanation for this behavior is straight forward; these irregularities modify both B and r and therefore produce a larger variation on (rTBr) than on (rTr)o. However, these variations partially cancel out in the computation of Au. Since the atactic polymer is almost free from the head- to-head, tail-to-tail arrangement^,'^^^-^' we have disregarded the effect of these irregularities on Aa. Thus, all the results reported below were obtained for chains with perfect head-to-tail sequence.
The variations of Au with the fraction of meso diads W, and the degree of polymerization x , respectively, are shown in Figures 6 and 7 in which the broken/solid lines indicate the values obtained with H atoms/N-phenyl carbamate (approximating one-third of crosslinking agent) as end groups on the chain. As Figure 6 shows, Aa is not very sensitive to W,; thus, if the H atoms are used as end groups, Aa increases by about 18% when W, changes from zero to unity. This variation is even smaller ( - 8%) when N-phenyl carbamate is used as the end group. It is also interesting to note the change in the functional dependence of the variation of Aa on x (shown in Fig. 7) for

1946
T 3.0 0
‘;b
a G U
2 .o
1.0
0
ANDRADY, LLORENTE, SAIZ
I I I I
10 30 50 70 90 X
Fig. 7. Optical configuration parameter Aa as a function of the degree of polymerization x; see the legend for Figure 6 for details. The results obtained using N-phenyl carbamate are almost insensitive to the fraction of meso &ads W,.
different end groups used in the calculation. The qualitative explanation of these results is rather simple. The simplest case to consider is that where chain ends are H atoms. The chain ends then contain no strongly polarizable groups that could lead to severe cancellations or reinforcements of their anisotropies depending on their relative orientation. Instead, the value of & for the whole chain is small (the calculated value of Aa is also small) and not very sensitive to the relative orientation of the groups. Therefore, i t is little affected by W, and, moreover, reaches an asymptotic limit a t very low values of x so that the ratio ( rT&r)/( rTr),, is almost independent of the degree of polymerization. When the end groups are N-phenyl carbamates, the strongest contributions to B come from these end groups and therefore are independent of the chain, thus Aa is even less sensitive to W, than in the previous case; moreover, the effect of these groups becomes smaller with increasing chain length. Thus, as x increases, Aa decreases sharply and tends to reach the values obtained with H end groups as the anisotropy of the carbamate end groups becomes negligible compared with that of the chain.
In view of the results shown in Figure 7, we conclude that the marked decrease of A a with increasing x might be due to the effect of the end groups introduced in the chain by the crosslinking agent. Thus, the effect of end groups is readily apparent only a t relatively low chain lengths. In the case of long chain polymers, the discrepancies between the theory and experimental data cannot therefore be accounted for on the basis of end group effects.
A comparison of the results shown in Figure 7 with the experimental data indicates the theoretical values of Aa to be approximately one-third of that

STRESS-OPTICAL PROPERTIES 1947
obtained experimentally. Swelling of the network decreases the experimental values of Aa, bringing them closer to the theoretical results, although the effect is relatively small. Moreover, due to the particular insensitivity of Aa to the chain characteristics, it is difficult to obtain agreement between the theory and experiment by means of any reasonable modification of the parameters used in the calculation. For instance, among the conformational energies, changes in the value of E, results in the largest variations in Aa. Yet, the very unlikely value of E, = +10 kcal/mol would be required to raise the calculated Au into agreement with the experimental result. A direct conse- quence of this insensitivity of Au to the conformational energies is the very low value of its theoretical temperature coefficient; thus, the computation of Au at several temperatures in the range 50 f 10" yielded identical values within the standard error of the calculations. We therefore conclude that the theoretical value of the temperature coefficient of Au is approximately zero in contrast to the experimental measurements that suggest a positive (although small and therefore inaccurate) value.
The theoretical value of ha is sensitive to the values of the optical parameters AacH and Aaco and, to a much lesser extent, to the Aacc value used in the calculation. A unit increase in the value of Au is produced by either a decrease of 0.6 units in AacFl, an increase of 0.6 units in haco, or an increase of 37 units in Aacc. However, values of these parameters are well established and have been used in the calculation of several optical properties of many compounds. The uncertainties of their reported values are approxi- mately fO.O1 units.
The existence of intermolecular correlations in the amorphous solid has to be invoked to explain the difference between the theoretical and experimental results of the optical configuration parameter ha. However, it is interesting that the theory predicts the correct variation of Aa with x and that the difference between theoretical and experimental values of ha is smaller than in the case of symmetric c h a i r ~ s ~ - " ~ although larger than in other asymmetric
Thus, the present data seem to support the qualitative conclu- sion'O that these correlations are small in chains having asymmetric centers separated by two skeletal bonds8-10, larger if these centers are separated by more than two skeletal bonds= as in the present case, and even larger for symmetric chain^.^-^*^
References 1. P. J. Flory, Stahstmzf Mecizanrcs of Cham Molecules, Wiley lnterscience, New York, 1969. 2. J. E. Mark, and P. J. Flory, J . Am. Chem. Soc., 87, 1415 (1966). 3. M. H. Liberman, Y. Abe, and P. J. Flory, Macromolecules, 5, 550 (1972). 4. M. H. Iiberman, L. C. Debolt, and P. d. FLory, J . Polym. Sct. Polym. Phys. Ed., 12, 187
5. M. A. Llorente, J. E. Mark, and E. Saiz, J . Pofym. Sct. Pofym. I'hys. Ed., 21. 1173 (1983). 6. E. Riande. ,I. Guman , M. P. Tarazona, and E. Sai7, J . Pofym. Scr. I'olym. Phys. Ed., 22,
7. E. Riande, and J. Cuzmw, J . Polym. Scr. Polym. Phys. Ed., 23, 1235 (1985). 8. E. Saiz, E. Riande, and J. E. Mark, Macromolecules, 17, 899 (1984). 9. E. Hiande, E. Saiz, and J. E. Mark, J . Polym. Scr. Pofym. Phys. Ed., 22, 863 (1984).
(1974).
917 (1984); J . Polym. Scr. Polym. Phys. Ed., 23, 1031 (1985).
10. M. A. Llorente, I . F. Pierola, and E. Saiz, Macromlecules, 18, 2663 (1985). 11. P. H. Sung and J. E. Mark, J . Polym. Scr. Polym. Phys. Ed., 19, .507 (1981).
1948 ANDRADY, LLORENTE, SAIZ
12. A. L. Andrady, and M. D. Sefcik, J. Polym. Sci. I’olym. Phys. Ed., 21, 2453 (1983). 13. A. Abe. T. Hirano, and T. Tsuruta, Macromolecules, 12, 1092 (1979). 14. A. L. Andrady, and M. D. Sefcik, J . Polym. Scc. Polym. I’hys. Ed., 22, 237 (1984). 15. A. L. Andrady, and M. A. Llorente, J . Polym. Sci. Polym. Phys. Ed., 25, 195 (1987). 16. Handbook of Chemistry and Physics, 58th ed.. CRC Press, h a Raton, FI, 1977. 17. J. E. Mark, and M. A. Llorente, Polym. J. (Tokyo), 13, 543 (1981). 18. J. E. Mark, Macromol. Reu., 11, 135 (1976). 19. R. S. Stein, 13. J. Farris, S. Kumar, and V. Soni, Elaqtnmers and Rubber Eht i c i t y , Am.
20. L. R. G. Treloar, The Physics of Rubber Elasticity, 3rd ed., Clarendon Press, Oxford, 1975. 21. M. Cesari, G. Perego, W. Marconi, Makromof. Chem., 41, 194 (1966). 22. P. H. Kasai, and It. ,I. Myers, J. Chem. I’hys., 30, 1096 (1959). 23. U. Hlukis, P. H. Kasai, It. J. Myers, J . Chem. I’hys., 38, 2753 (1963). 24. U. W. Suter, and P. J. Flory, J. Chem. Soc., Faraday Trans., 2 , 1521 (1977). 25. G. I). Patterson, and P. J. Flory, J. Chem. Soc., Faraday Trans., 2, 1098 (1972); ibuf., 68,
26. R. J. W. LeFevre, Reu. Pure Appf. Chem., 20, 57 (1970). 27. A. Lopez Pineiro, M. P. Tarazona, and E. Saiz. J. Chim. Phys., 80, 529 (19M). 28. P. J. Flory, Macromolecules, 7 , 381 (1974). 29. N. Oguni, S. Swatanabe, M. Maki, and H. Tani, Macromokcufes, 6, 195 (1973). 30. T. Uryu, H. Shimazu, and K. Matsuzaki, J . Polym. Sci. Polym. Lett Ed., 11, 275 (1973). 31. C. C. Price, R. Spector, and A. L. Turnulo, J. Polym. Sci. Part A-I, 5, 407 (1967). 32. N. Oguni, K. Lee, and H. Tani, Macromolecules, 5, 819 (1972). 33. E. Saiz, M. P. Tarazona, E. Riande, and .J. Guzman, J. Pofym. Sci. I’olym. Phys. Ed., 22,
Chem. Soc. Symposium Series No. 193, 1982, Chap. 24.
111; (1972).
2165 (1984).
Received May 12, 1986 Accepted March 20, 1987