Streptococcus pneumoniae and after Immunization with Positive Marginal Zone B Cells before...
12
DNA Microarray Gene Expression Profile of Marginal Zone versus Follicular B Cells and Idiotype Positive Marginal Zone B Cells before and after Immunization with Streptococcus pneumoniae 1 Nicholas W. Kin, 2 * Dianna M. Crawford, 2,3† Jiabin Liu, 4† Timothy W. Behrens, 5† and John F. Kearney 6 * Marginal zone (MZ) B cells play an important role in the clearance of blood-borne bacterial infections via rapid T-independent IgM responses. We have previously demonstrated that MZ B cells respond rapidly and robustly to bacterial particulates. To determine the MZ-specific genes that are expressed to allow for this response, MZ and follicular (FO) B cells were sort purified and analyzed via DNA microarray analysis. We identified 181 genes that were significantly different between the two B cell populations. Ninety-nine genes were more highly expressed in MZ B cells while 82 genes were more highly expressed in FO B cells. To further understand the molecular mechanisms by which MZ B cells respond so rapidly to bacterial challenge, Id-positive and -negative MZ B cells were sort purified before (0 h) or after (1 h) i.v. immunization with heat-killed Streptococcus pneumoniae, R36A, and analyzed via DNA microarray analysis. We identified genes specifically up-regulated or down-regulated at 1 h following immunization in the Id-positive MZ B cells. These results give insight into the gene expression pattern in resting MZ vs FO B cells and the specific regulation of gene expression in Ag-specific MZ B cells following interaction with Ag. The Journal of Immu- nology, 2008, 180: 6663– 6674. M ature B lymphocytes play an integral role in the adap- tive immune response via Ag presentation and Ab se- cretion. The mature splenic B cell population is di- vided into the marginal zone (MZ) 7 and follicular (FO) B cell subsets based on anatomical location, cellular surface molecules, and functional immune responses (reviewed in Ref. 1). MZ B cells respond primarily to T-independent Ags and are proposed to bridge the gap between the rapid Ag nonspecific response and the delayed Ag-specific response. FO B cells respond primarily to T- dependent Ags and are responsible for the generation of long-term memory. However, the exact molecular mechanism by which each subset of B cells function is not fully understood. MZ B cells are primarily nonrecirculating, located at the outer limit of the white pulp region, and characterized by the expression of IgM high IgD low CD1d CD21 high CD23 low . The MZ B cell reper- toire is enriched with B cells expressing germline-encoded BCRs (2– 4), some of which have a low level of self-reactivity. Following activation, MZ B cells increase B7-1 and B7-2 expression, develop into plasmablasts more readily, and are more sensitive to LPS stimulation than their FO counterparts (5, 6). In addition to rapid production of IgM Ab, MZ B cells also possess the ability to cap- ture and shuttle Ag to follicular dendritic cells (7) as well as to efficiently activate naive T cells directly (8), suggesting a potential role for MZ B cells in T cell-dependent Ab responses also. In addition to anatomical location and cellular functions, MZ and FO B cells differentially express a number of cell surface molecules. We have previously shown that CD9, a member of the tetraspanin family, is expressed by the MZ and B1 B cell populations but not by FO B cells (9). Additionally, we identified Fc receptor homo- logue 3 (FcRH3) as a potentially immunoregulatory molecule ex- pressed by MZ and B1 cells, but not by FO B cells (10). Recently, the scavenger receptor CD36 was identified as a marker predom- inantly expressed by MZ B cells (11). Taken together, it is clear that MZ B cells fill a specific niche in the splenic environment through unique expression and regulation of specific genes. The development of DNA microarray technology has allowed for the rapid analysis of genome-wide gene expression profiles. Using this technology, we set out to identify differentially regu- lated genes between FO and MZ B cells as well as the genes specifically up-regulated or down-regulated following activation. DNA microarray analysis of FACS-sorted resting MZ and FO B cells from MD4 mice revealed 181 genes that are differentially expressed in the resting B cell populations. Ninety-nine genes were more highly expressed in MZ B cells while 82 genes were more highly expressed in FO B cells. In addition, a comparative DNA microarray analysis of FACS-sorted MZ Id-positive and *Department of Microbiology, University of Alabama at Birmingham, Birmingham, AL 35294; and † Center for Immunology, Department of Medicine, University of Minnesota, Minneapolis, MN 55455 Received for publication January 25, 2008. Accepted for publication March 11, 2008. The costs of publication of this article were defrayed in part by the payment of page charges. This article must therefore be hereby marked advertisement in accordance with 18 U.S.C. Section 1734 solely to indicate this fact. 1 This work was supported by research funds from the National Institutes of Health Grant AI14782. N.W.K. is a recipient of a Training Grant Postdoctoral Fellowship Award from National Institutes of Health Grant T32 AI7051. 2 N.W.K. and D.M.C. contributed equally to this work. 3 Current address: Amgen, Inc., Thousand Oaks, CA 91320. 4 Current address: Department of Anesthesia, Pennsylvania State College of Medi- cine, Milton S. Hershey Medical Center, Hershey, PA 17033. 5 Current address: Genentech, Inc., San Francisco, CA 94080. 6 Address correspondence and reprint requests to Dr. John F. Kearney, 410 Shelby Biomedical Research Building, 1825 University Boulevard, Birmingham, AL 35294. E-mail address: [email protected] 7 Abbreviations used in this paper: MZ, marginal zone; B6, C57BL/6; FO, follicular; S1P 1, 3, or 4 , sphingosine-1-phosphate receptor type 1, 3, or 4; RGS, regulator of G protein; Tg, transgenic. Copyright © 2008 by The American Association of Immunologists, Inc. 0022-1767/08/$2.00 The Journal of Immunology www.jimmunol.org
Transcript of Streptococcus pneumoniae and after Immunization with Positive Marginal Zone B Cells before...
DNA Microarray Gene Expression Profile of Marginal Zoneversus Follicular B Cells and Idiotype Positive MarginalZone B Cells before and after Immunization withStreptococcus pneumoniae1
Nicholas W. Kin,2* Dianna M. Crawford,2,3† Jiabin Liu,4† Timothy W. Behrens,5†
and John F. Kearney6*
Marginal zone (MZ) B cells play an important role in the clearance of blood-borne bacterial infections via rapid T-independentIgM responses. We have previously demonstrated that MZ B cells respond rapidly and robustly to bacterial particulates. Todetermine the MZ-specific genes that are expressed to allow for this response, MZ and follicular (FO) B cells were sort purifiedand analyzed via DNA microarray analysis. We identified 181 genes that were significantly different between the two B cellpopulations. Ninety-nine genes were more highly expressed in MZ B cells while 82 genes were more highly expressed in FO B cells.To further understand the molecular mechanisms by which MZ B cells respond so rapidly to bacterial challenge, Id-positive and-negative MZ B cells were sort purified before (0 h) or after (1 h) i.v. immunization with heat-killed Streptococcus pneumoniae,R36A, and analyzed via DNA microarray analysis. We identified genes specifically up-regulated or down-regulated at 1 h followingimmunization in the Id-positive MZ B cells. These results give insight into the gene expression pattern in resting MZ vs FO B cellsand the specific regulation of gene expression in Ag-specific MZ B cells following interaction with Ag. The Journal of Immu-nology, 2008, 180: 6663–6674.
M ature B lymphocytes play an integral role in the adap-tive immune response via Ag presentation and Ab se-cretion. The mature splenic B cell population is di-
vided into the marginal zone (MZ)7 and follicular (FO) B cellsubsets based on anatomical location, cellular surface molecules,and functional immune responses (reviewed in Ref. 1). MZ B cellsrespond primarily to T-independent Ags and are proposed tobridge the gap between the rapid Ag nonspecific response and thedelayed Ag-specific response. FO B cells respond primarily to T-dependent Ags and are responsible for the generation of long-termmemory. However, the exact molecular mechanism by which eachsubset of B cells function is not fully understood.
MZ B cells are primarily nonrecirculating, located at the outerlimit of the white pulp region, and characterized by the expressionof IgMhighIgDlowCD1d�CD21highCD23low. The MZ B cell reper-toire is enriched with B cells expressing germline-encoded BCRs(2–4), some of which have a low level of self-reactivity. Followingactivation, MZ B cells increase B7-1 and B7-2 expression, developinto plasmablasts more readily, and are more sensitive to LPSstimulation than their FO counterparts (5, 6). In addition to rapidproduction of IgM Ab, MZ B cells also possess the ability to cap-ture and shuttle Ag to follicular dendritic cells (7) as well as toefficiently activate naive T cells directly (8), suggesting a potentialrole for MZ B cells in T cell-dependent Ab responses also. Inaddition to anatomical location and cellular functions, MZ and FOB cells differentially express a number of cell surface molecules.We have previously shown that CD9, a member of the tetraspaninfamily, is expressed by the MZ and B1 B cell populations but notby FO B cells (9). Additionally, we identified Fc receptor homo-logue 3 (FcRH3) as a potentially immunoregulatory molecule ex-pressed by MZ and B1 cells, but not by FO B cells (10). Recently,the scavenger receptor CD36 was identified as a marker predom-inantly expressed by MZ B cells (11). Taken together, it is clearthat MZ B cells fill a specific niche in the splenic environmentthrough unique expression and regulation of specific genes.
The development of DNA microarray technology has allowedfor the rapid analysis of genome-wide gene expression profiles.Using this technology, we set out to identify differentially regu-lated genes between FO and MZ B cells as well as the genesspecifically up-regulated or down-regulated following activation.DNA microarray analysis of FACS-sorted resting MZ and FO Bcells from MD4 mice revealed 181 genes that are differentiallyexpressed in the resting B cell populations. Ninety-nine geneswere more highly expressed in MZ B cells while 82 genes weremore highly expressed in FO B cells. In addition, a comparativeDNA microarray analysis of FACS-sorted MZ Id-positive and
*Department of Microbiology, University of Alabama at Birmingham, Birmingham,AL 35294; and †Center for Immunology, Department of Medicine, University ofMinnesota, Minneapolis, MN 55455
Received for publication January 25, 2008. Accepted for publication March 11, 2008.
The costs of publication of this article were defrayed in part by the payment of pagecharges. This article must therefore be hereby marked advertisement in accordancewith 18 U.S.C. Section 1734 solely to indicate this fact.1 This work was supported by research funds from the National Institutes of HealthGrant AI14782. N.W.K. is a recipient of a Training Grant Postdoctoral FellowshipAward from National Institutes of Health Grant T32 AI7051.2 N.W.K. and D.M.C. contributed equally to this work.3 Current address: Amgen, Inc., Thousand Oaks, CA 91320.4 Current address: Department of Anesthesia, Pennsylvania State College of Medi-cine, Milton S. Hershey Medical Center, Hershey, PA 17033.5 Current address: Genentech, Inc., San Francisco, CA 94080.6 Address correspondence and reprint requests to Dr. John F. Kearney, 410 ShelbyBiomedical Research Building, 1825 University Boulevard, Birmingham, AL 35294.E-mail address: [email protected] Abbreviations used in this paper: MZ, marginal zone; B6, C57BL/6; FO, follicular;S1P1, 3, or 4, sphingosine-1-phosphate receptor type 1, 3, or 4; RGS, regulator of Gprotein; Tg, transgenic.
Copyright © 2008 by The American Association of Immunologists, Inc. 0022-1767/08/$2.00
The Journal of Immunology
www.jimmunol.org

-negative B cells at 0 and 1 h following i.v. immunization withheat-killed Streptococcus pneumoniae, R36A, revealed genesspecifically up-regulated or down-regulated following activa-tion. These results give new insight into the differences betweenMZ and FO B cells and reveal new candidate genes and path-ways to study.
Materials and MethodsAnimals
SWR/J and C3H/HeJ samples were kindly provided by T. Waldschmidt(University of Iowa, Iowa City, IA) and were from mice housed at theUniversity of Iowa in specific pathogen-free conditions. MD4 anti-HELconventional transgenic (Tg) mice were originally obtained from Dr. C.
FIGURE 1. Expression profile of differentiallyexpressed genes between FO and MZ B cells. DNAmicroarray analysis identified 181 genes that weresignificantly different in sort-purified FO vs MZ Bcells from MD4 transgenic mice (B6 background).The identified transcripts have a fold change of �2and p � 0.02 by t test. The differentially expressedgenes were grouped into various functional catego-ries as follows: motility/adhesion (A), immune re-sponse (B), apoptosis (C), and proliferation (D).Shown are normalized expression values greaterthan (yellow), near (black), or less than (blue) themean of that gene. Each column represents one in-dependent sample of sort-purified FO or MZ B cells.Genes or transcripts are represented in rows. Clus-tering of the genes was unsupervised.
6664 MZ AND FO � CELL GENE EXPRESSION PROFILE
Goodnow (Australian National University, Canberra, Australia) (12). MD4transgenic mice are on a C57BL/6 (B6) background. M167 Tg mice havebeen described previously (13). The IL-10/Thy1.1 reporter mice were gen-erously provided by C. Weaver (University of Alabama at Birmingham,Birmingham, AL) as described previously (14). IL-10/Thy1.1 mice werecrossed with M167 Tg mice. All mice were bred and housed within thepathogen-free facility at the University of Alabama at Birmingham andused at 6–8 wk of age according to approved animal protocols.
DNA microarray analysis
Microarray analysis was performed as described previously (15). Briefly,total RNA was isolated from sort-purified cell populations using anRNeasy Mini kit with on-column Dnase digestion (Qiagen) and, in accor-dance with expression analysis technical instructions from Affymetrix,cDNA was synthesized. cRNA was synthesized with BioArray high-yieldtranscript labeling kit (Enzo). Labeled cRNA (�15 �g) was chemicallyfragmented for 35 min. at 94°C. Affymetrix MG U74Av2 oligonucleotideGeneChips (Affymetrix) were probed, hybridized, stained, washed, andscanned according to the manufacturer’s protocol at the University of Min-
nesota Biomedical Genomics Center facility (Minneapolis, MN). Eachsort-purified cell population was processed independently as true biologicalreplicates.
Flow cytometry and cell sorting
FACS analysis was performed as described previously (16). Briefly, totalsplenocytes were collected, RBCs were lysed with ammonium chloride,and the splenocytes were stained with different combinations of the fol-lowing Abs: fluorescein (FITC)-, PE-, or allophycocyanin-conjugated anti-mouse CD21, CD23, Thy1.1, CD19 (eBioscience), goat anti-human regu-lator of G protein signaling (RGS) 10 (RGS10; Santa Cruz Biotechnology),goat anti-mouse D6 �-chemokine receptor, and rabbit anti-human Sharp2/Stra13 (Abcam). All anti-human Abs cross-react with mouse targets. Forintracellular FACS analysis, cells were then washed, fixed, and permeabil-ized using the Cytofix/Cytoperm (BD Biosciences) kit according to man-ufacturer’s directions. All samples were analyzed using a FACSCaliburflow cytometer or FACSAria cell sorter (BD Biosciences). The data wereanalyzed using FlowJo software (Tree Star, Inc.).
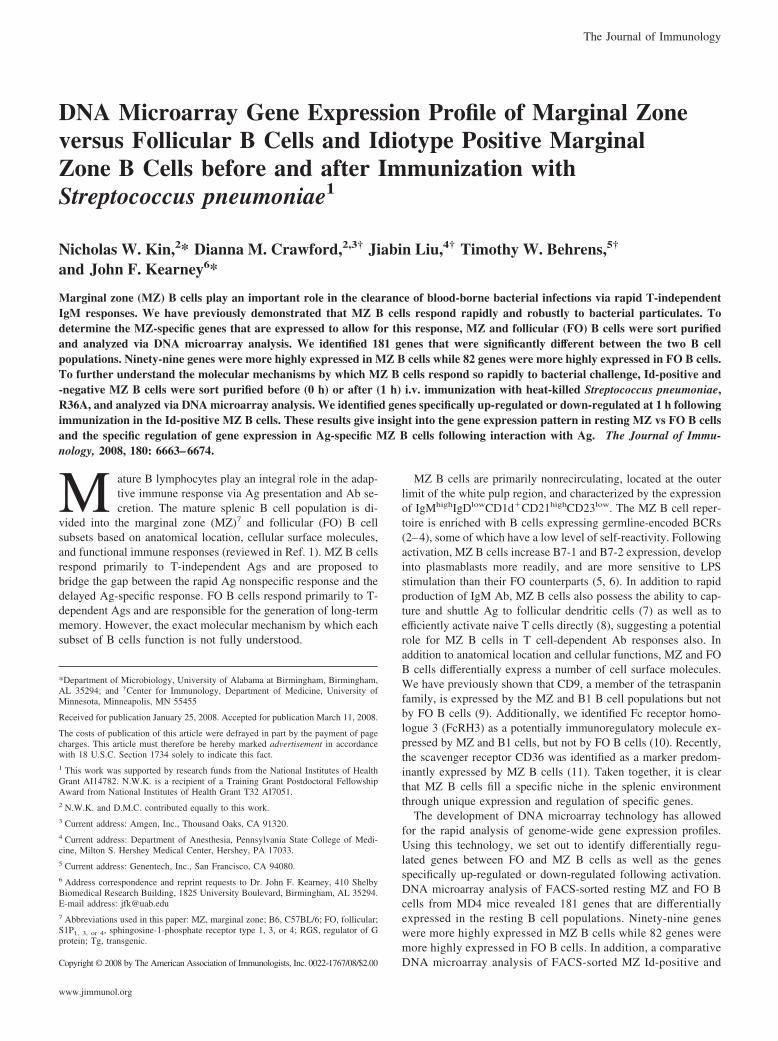
FIGURE 2. Expression profile of differentially ex-pressed genes between FO and MZ B cells. DNA mi-croarray analysis identified 181 genes that were signif-icantly different in sort-purified FO vs MZ B cells fromMD4 Tg mice (B6 background). The identified tran-scripts have a fold change of �2 and p � 0.02 by t test.The differentially expressed genes were grouped intovarious functional categories as follows: transcriptionfactors (A) and signal transduction (B). Shown are nor-malized expression values greater than (yellow), near(black), or less than (blue) the mean of that gene. Eachcolumn represents one independent sample of sorted FOor MZ B cells. Genes or transcripts are represented inrows. Clustering of the genes was unsupervised.
6665The Journal of Immunology

Table I. Genes differentially expressed between FO and MZ B cells in B6, SWR, and C3H mouse strains
AffymetrixIdentifier Gene Symbol Gene Title
Relative Expression Relative Expression Relative Expression
B6 FO B6 MZFold Difference
(MZ/FO) SWR FO SWR MZFold Difference
(MZ/FO) C3H FO C3H MZFold Difference
(MZ/FO)
93430_at Cmkor1 Chemokine orphan receptor 1 78 4369 56.0 12 2081 178.5 107 3147 29.397967_at Plxnd1 Plexin D1 70 3800 54.4 70 107 1.5 44 50 1.1102910_at Abcb1a ATP-binding cassette, sub-family B
(MDR/TAP)48 953 19.8 28 716 25.3 52 596 11.6
92217_s_at Gp49 Glycoprotein 49 A/B 161 2762 17.2 559 2146 3.8 582 2470 4.2101587_at Ephx1 Epoxide hydrolase 1, microsomal 235 3410 14.5 3682 4366 1.2 4074 4099 1.0100325_at Gp49 Glycoprotein 49 A/B 394 5124 13.0 716 4134 5.8 1009 4883 4.896865_at Marcks Myristoylated alanine rich protein
kinase C substrate1183 14871 12.6 952 3840 4.0 1085 5057 4.7
97105_at C230027N18Rik RIKEN cDNA C230027N18 gene 269 3142 11.7 564 2822 5.0 417 2519 6.0101923_at Pla2g7 Phospholipase A2, group VII 284 2408 8.5 24 669 28.2 89 1230 13.9160495_at Ahr Aryl-hydrocarbon receptor 31 249 8.0 461 1477 3.2 737 2594 3.593411_at Sema7a Semaphorin 7A 788 6214 7.9 1038 4241 4.1 826 2926 3.5102722_g_at IgG3 Ig �-3 heavy chain precursor 310 2436 7.9 829 1541 1.9 1281 2699 2.1100912_at Dph5 DPH5 homolog (S. cerevisiae) 1229 9553 7.8 687 3390 4.9 954 4768 5.098309_at Ccbp2 Chemokine binding protein 2 481 3549 7.4 85 895 10.5 343 526 1.597487_at Serpine2 Serine (or cysteine) peptidase
inhibitor219 1377 6.3 148 747 5.1 203 1708 8.4
103422_at CD1d CD1d antigen 1999 12449 6.2 1339 8025 6.0 2393 5418 2.3161058_f_at R74862 Expressed sequence R74862 52 313 6.1 17 131 7.8 79 184 2.392356_at Ptpn22 Protein tyrosine phosphatase,
nonreceptor type 221775 10160 5.7 4668 13103 2.8 7670 20357 2.7
95462_at Bzw2 Basic leucine zipper and W2domains 2
1482 8442 5.7 1678 4786 2.9 3611 17670 4.9
95661_at CD9 CD9 antigen 480 2677 5.6 127 2212 17.4 550 2737 5.0104701_at Bhlhd2 Basic helix-loop-helix domain
containing272 1490 5.5 5828 8002 1.4 5729 6426 1.1
160629_at Res10 Regulator of G-protein signaling 10 450 2368 5.3 135 1234 9.2 419 838 2.097740_at Dusp16 Dual specificity phosphatase 16 787 4075 5.2 1214 3889 3.2 1173 4992 4.3102924_at Dtx1 Deltex 1 homolog (Drosophila) 7962 39206 4.9 9975 29520 3.0 7015 31023 4.493101_s_at Nedd4 Neural precursor cell expressed 660 3176 4.8 480 1244 2.6 645 1626 2.593195_at Mfhas1 Malignant fibrous histiocytoma
amplified sequence1143 5462 4.8 2857 2424 0.8 3446 3592 1.0
101584_at Rsu1 Ras suppressor protein 1 2028 9591 4.7 2007 4411 2.2 1809 7286 4.0102721_at IgG3 Ig �-3 heavy chain precursor 812 3415 4.2 1344 1948 1.4 1766 2882 1.698433_at Bid BH3 interacting domain death agonist 1622 6473 4.0 689 1926 2.8 495 1277 2.6101516_at CD59a CD59a antigen 527 2091 4.0 410 1617 3.9 533 1817 3.4102644_at Mdfic MyoD family inhibitor domain
containing784 3083 3.9 533 1751 3.3 1426 2847 2.0
99071_at Mpeg 1 Macrophage expressed gene 1 2402 8938 3.7 491 1982 4.0 1743 5743 3.3160487_at Myl4 Myosin, light polypeptide 4 942 3407 3.6 2627 6593 2.5 2335 6783 2.9102223_at Ppl Periplakin 1294 4673 3.6 1482 2177 1.5 1404 2906 2.196283_at Itm2C integral membrane protein 2C 1458 5254 3.6 881 1943 2.2 1073 3249 3.0161765_f_at Res10 Regulator of G-protein signaling 10 535 1792 3.4 365 963 2.6 290 733 2.594958_at 1110013L07Rik RIKEN cDNA 1110013LC7 gene 486 1575 3.2 220 548 2.5 129 336 2.6101897_g_at CD1d CD1d antigen 5039 16158 3.2 2039 6961 3.4 3129 7065 2.3102289_r_at CD21 Complement receptor 2 931 2964 3.2 2116 4053 1.9 1348 3034 2.397460_at Ube2r2 Ubiquitin-conjugating enzyme E2R 2 9117 28949 3.2 5367 13029 2.4 10403 17285 1.7102914_s_at Bcl2a1 B cell leukemia/lymphoma 2 related
protein A13284 10193 3.1 15571 28095 1.8 22037 32334 1.5
95084_f_at Grhpr Glyoxylate reductase/hydroxypyruvatereductase
2362 7175 3.0 1612 3071 1.9 1565 2941 1.9
160711_at Decr1 2,4-Dienoyl CoA reductase 1,mitochondrial
187 553 3.0 267 270 1.0 201 437 2.2
100397_at DAP12 TYRO protein tyrosine kinase bindingprotein
4658 13714 2.9 751 2767 3.7 2109 3985 1.9
96735_at Stard10 START domain containing 10 2538 7449 2.9 2026 2932 1.4 1349 1734 1.392587_at Fdx1 Ferredoxin 1 1631 4714 2.9 1510 2957 2.0 2305 3744 1.6104298_at 2310044G17Rik RIKEN cDNA 2310044G17 gene 1290 3689 2.9 1797 2292 1.3 1320 4032 3.1104299_at Zdhhc14 Zinc finger, DHHC domain
containing 141176 3359 2.9 328 651 2.0 794 1865 2.4
160941_at Pde8a Phosphodiesterase 8A 383 1085 2.8 690 1016 1.5 414 1013 2.498822_at Gip2 Interferon, �-inducible protein 1381 3885 2.8 1335 2609 2.0 1244 3258 2.698033_at 1100001H23Rik RIKEN cDNA 1100001H23 gene 4159 11695 2.8 4474 7701 1.7 6414 9391 1.594186_at Traf1 TNFR-associated factor 1 1612 4530 2.8 1740 4258 2.4 1538 4368 2.8160069_at Gmnn Geminin 422 1174 2.8 376 323 0.9 229 445 1.995758_at Scd2 Stearoyl-coenzyme A desaturase 2 4483 12233 2.7 1094 2501 2.3 703 1147 1.6100880_at 9830147J24Rik RIKEN cDNA 9830147J24 gene 1271 3463 2.7 733 951 1.3 676 1657 2.592850_at Rrbp1 Ribosome binding protein 1 2821 7681 2.7 3262 6051 1.9 2147 5191 2.493013_at Id2 Inhibitor of DNA binding 2 2417 6577 2.7 2786 11282 4.0 6513 15250 2.393261_at lgmn Legumain 2555 6932 2.7 1582 3143 2.0 1838 2832 1.593833_s_at Hist1h2bc Histone 1, H2bc 773 2093 2.7 617 697 1.1 1189 536 0.596688_at Tmem77 Transmembrane protein 77 728 1935 2.7 320 860 2.7 572 1211 2.1160762_at Abr Active BCR-related gene 706 1845 2.6 736 2020 2.7 620 1084 1.7161788_f_at SlP1 Sphingolipid G protein-coupled
receptor 1565 1476 2.6 1332 747 0.6 936 562 0.6
93483_at Hck Hemopoietic cell kinase 5919 15436 2.6 2869 9495 3.3 2498 6070 2.494995_at A030007L17Rik RIKEN cDNA A030007L17 gene 848 2186 2.6 926 734 0.8 1184 817 0.792925_at Cebpb CCAAT/enhancer binding protein
(C/EBP), beta1911 4882 2.6 12638 12321 1.0 20455 13386 0.7
100516_at Chka Choline kinase � 874 2195 2.5 1728 1646 1.0 880 728 0.8104712_at Myc Myelocytomatosis oncogene 906 2242 2.5 4293 11096 2.6 4967 12611 2.592352_at SlP3 Sphingolipid G protein-coupled
receptor 31522 3765 2.5 1223 1791 1.5 1370 2343 1.7
98931_at Gns Glucosamine (N-acetyl)-6-sulfatase 2595 6366 2.5 3560 4612 1.3 2685 4575 1.7102410_at Hs3st1 Heparan sulfate (glucosamine)
3-O-sulfotransferase575 1392 2.4 510 2503 4.9 9768 14854 1.5
(Table continues)
6666 MZ AND FO � CELL GENE EXPRESSION PROFILE
Western blot analysis
Western blot analysis was performed as described previously (17). Briefly,following B cell isolation the cells were lysed, total protein was quantitatedusing a protein quantitation assay (Bio-Rad), and then protein samples(5–20 �g) were resolved by electrophoresis on 10% polyacrylamide gels(Bio-Rad), transferred to Immobilon-P polyvinylidene difluoride mem-branes (Millipore), probed with goat anti-human RGS10, anti-actin (SantaCruz Biotechnology), or goat anti-mouse D6 �-chemokine receptor (Ab-cam), detected with HRP-labeled anti-mouse, goat, and rabbit Abs (SantaCruz Biotechnology), and developed with the LumiGLO detection kit (CellSignaling).
RNA isolation and PCR
Total RNA was isolated from �5 � 105 sort-purified MZ B cells usingTRIzol reagent (Invitrogen) following the manufacturer’s directions.RT-PCR was performed using the Omniscript RT kit (Qiagen) follow-ing the manufacturer’s directions. The following gene-specific primerswere used to amplify the cDNA obtained from the RT kit using FisherTaq and PCR products were resolved using a 1% agarose gel and vi-sualized using ethidium bromide. Primers used were as follows: �-ac-tin, 5�-TACAGCTTCACCACCACAGC-3� (forward) and 5�-AAGGAAGGCTGGAAAAGAGC-3� (reverse); D6, 5�-CTTCCAGCTGAACCTTCTGG-3� (forward) and 5�-CGAGTGCAGAAACAAGGTGA-3�(reverse); RGS10, 5�-GCCTTAAGAGCACAGCCAAG-3� (forward)and 5�-CTTTTCCTGCATCTGCTTCC-3� (reverse); Thy1.1, 5�-ACCAAAACCTTCGCCTGGACTG-3� (forward) and 5�-TCCTTGGGGTCTTCTACCTTTCTC-3� (reverse); IL-10, 5�-CATGGGTCTTGGGAAGAGAA-3� (forward) and 5�-CATTCCCAGAGGAATTGCAT-3�(reverse); Stra13, 5�-GGATTTGCCCACATGTACC-3� (forward) and5�-TCAATGCTTTCACGTGCTTC-3� (reverse). The annealing temper-ature for all primers was 60°C.
Data processing
Expressionist Pro 1.0 (GeneData) was used to generate relative expres-sion values for each transcript using the MAS 5.0 algorithm, defaultsettings, and a scaling factor of 1500 to control for minor cross-chipdifferences in hybridization intensities. GeneData Expressionist and Mi-crosoft Excel were used for statistical analysis. Hierarchical clusteringanalysis was performed using Cluster and visualized in TreeView, asdescribed previously (18).
Statistics
Data with three or more groups were analyzed by a one-way ANOVA andstatistical significance was determined by p � 0.05. Data with two groupswere analyzed by a two-tailed paired t test and statistical significance wasdetermined by a p � 0.02.
ResultsDNA microarray analysis of resting MZ and FO B cells
The mature splenic B cell population is divided into MZ and FOB cells based on anatomical location, cellular surface moleculeexpression, and functional immune responses (reviewed in Ref.1). DNA microarray analysis was used to determine differences
in gene expression profiles between MZ and FO B cell popu-lations. Splenocytes from B6 MD4 Tg mice were sort purifiedto obtain paired MZ (B220�CD21highCD23low) and FO (B220�
CD21intCD23�, where “int” is “intermediate”) B cell samples.Postsort analysis revealed �95% purity of each B cell popula-tion (data not shown). MD4 mice carry a heavy and a light chaintransgene specific for hen egg lysozyme Ag (12) and were usedbecause �90% of their B cells express the transgenic BCR,thereby potentially reducing the variability due to a polyclonalrepertoire. Gene expression was assessed in three replicates ofeach B cell population the using Affymetrix U74A mouseGeneChip microarray representing �11,000 transcripts. Ex-pression levels were quantified using GeneData ExpressionistPro 1.0 software and the data from each array were analyzed toidentify the genes that were differentially expressed between theMZ and FO B cell populations. Differential expression was de-fined as a mean fold change of �2 and p � 0.02 by Student’st test.
Based on this definition, we identified 181 transcripts differen-tially expressed between the two populations. Ninety-nine tran-scripts (�55% of total) were more highly expressed in MZ B cellsrelative to FO B cells, whereas 82 transcripts (�45% of total) weremore highly expressed in FO B cells relative to MZ B cells. Tobetter visualize the data, each expression value was divided bythe mean expression of all six samples of that transcript andconverted into log2 space. The data were then analyzed by un-supervised hierarchical clustering as described previously (18).The data showed tight clustering of the three replicates of eachcell type with a coefficient of correlation between any two rep-licate samples �0.98. The 181 gene transcripts identified weregrouped into the following broad functional classifications: mo-tility/adhesion (Fig. 1A), immune response (Fig. 1B), apoptosis(Fig. 1C), proliferation (Fig. 1D), transcription factors (Fig.2A), signal transduction (Fig. 2B), metabolism (data notshown), or miscellaneous (data not shown). All 181 genes arelisted in Table I.
Identification of strain-specific differences in gene expressionbetween resting FO and MZ B cells.
To determine whether any strain-specific differences exist be-tween MZ and FO B cell gene expression profiles, we expandedour gene expression analysis to include two additional mousestrains, C3H/HeJ (C3H) and SWR/J (SWR). C3H mice have anenlarged MZ B cell population relative to B6 mice while SWRmice have a smaller MZ B cell population relative to B6 mice(data not shown). The 181 transcripts found to be significantly
Table I. (Continued)
AffymetrixIdentifier Gene Symbol Gene Title
Relative Expression Relative Expression Relative Expression
B6 FO B6 MZFold Difference
(MZ/FO) SWR FO SWR MZFold Difference
(MZ/FO) C3H FO C3H MZFold Difference
(MZ/FO)
97949_at Fg12 Fibrinogen-like protein 2 314 752 2.4 126 541 4.3 234 1144 4.9101495_at CD81 CD81 antigen 8639 20584 2.4 5250 7579 1.4 5062 8355 1.798092_at Plac8 Placenta-specific 8 56686 134293 2.4 37938 75591 2.0 29999 77352 2.698417_at Mx1 Myxovirus (influenza virus)
resistance 1260 608 2.3 190 309 1.6 104 206 2.0
103459_at Slc39a6 Solute carrier family 39 (metal iontransporter)
862 2007 2.3 1337 2067 1.5 971 1825 1.9
95358_at Pip5k2a Phosphatidylinositol-4-phosphate5-kinase
4119 9541 2.3 2763 5125 1.9 3479 6084 1.7
93084_at Slc25a4 Solute carrier family 25 (ademinetranslocator)
4789 11081 2.3 3596 5997 1.7 6120 7659 1.3
102217_at Gprk5 G protein-coupled receptorkinase 5
772 1784 2.3 450 1351 3.0 601 668 1.1
6667The Journal of Immunology
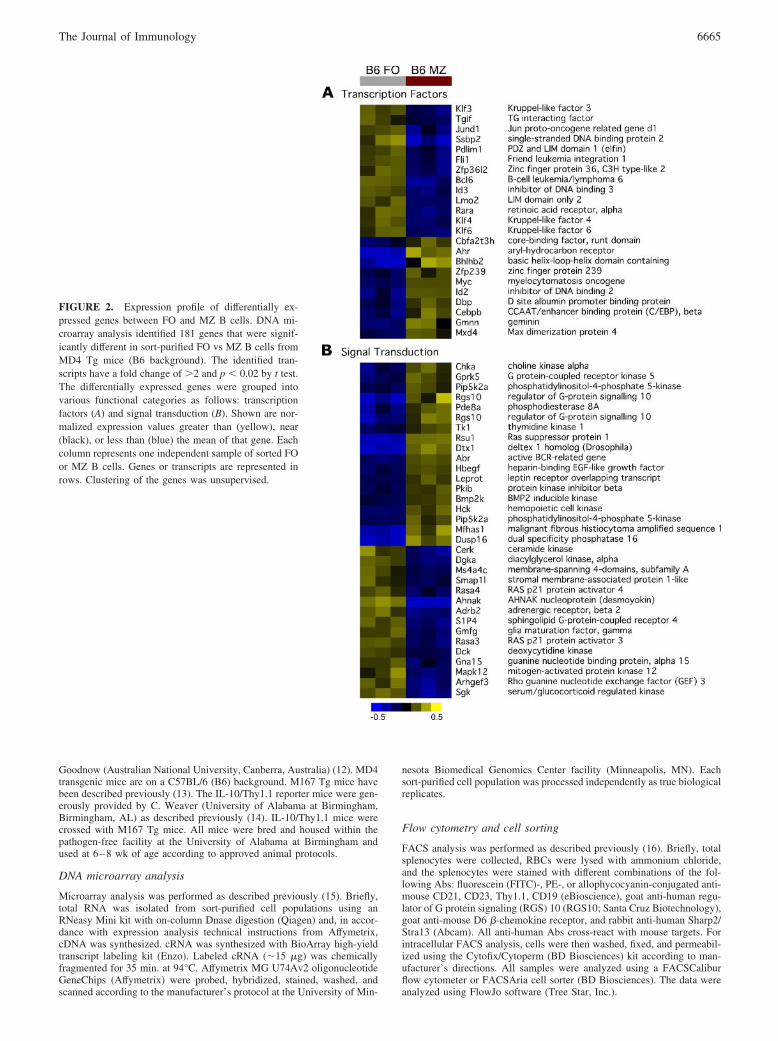
different between FO and MZ B cells were analyzed for theirexpression levels in C3H and SWR mice, respectively. Al-though the absolute signal intensities varied across strains (Ta-ble I), the fold changes between MZ and FO B cell gene ex-pression were comparable (Fig. 3A). We identified 29 genes(�16% of total) that appeared to have different expression pro-
files between FO and MZ B cells in the C3H and SWR strainsrelative to the B6 strain (Fig. 3B and Table II). These strain-specific differences might reflect changes in genes regulatingMZ B cell size, strain-specific functional differences, or poly-morphisms that influence probe hybridization but have no func-tional consequences.
FIGURE 3. Identification of strain-specificdifferences in gene expression profiles betweenFO and MZ B cells. Gene expression profile ofsplenic FO and MZ B cells from B6, SWR, andC3H mice. The profile includes 181 gene tran-scripts with a fold change of �2 and p � 0.02 byt test. A, Hierarchical analysis of 152 genes withconsistent regulation across the three mousestrains. B, Hierarchical analysis of 29 genes withstrain-specific differences in MZ vs FO gene ex-pression profiles. Shown are normalized expres-sion values greater than (yellow), near (black),or less than (blue) the mean of that strain. Eachcolumn represents one sample of sorted FO orMZ B cells. Genes or transcripts are representedin rows. Clustering of genes was unsupervised.
6668 MZ AND FO � CELL GENE EXPRESSION PROFILE

D6 �-chemokine receptor and RGS10 are more highlyexpressed in MZ than in FO B cells
MZ B cells provide a rapid response to blood-borne bacterial par-ticulates, in part because of their localization in the spleen. Forexample, blood-borne Ags accumulate within the splenic MZ asearly as 30 min following i.v. immunization (8), giving an oppor-tunity for MZ B cells to sample blood and respond rapidly to anAg. A number of factors have been shown to play a role in MZ B
cell localization within the splenic microenvironment includingsphingosine-1-phosphate receptor type 1 (S1P1) (19) and thepresence of MZ macrophages (20) and integrins (21). In addi-tion, in vivo injection of pertussis toxin disrupts MZ localiza-tion, suggesting the involvement of G protein-coupled recep-tor(s) (22). The current microarray data identified a number ofmolecules that are potentially involved in the migration, local-ization, and/or retention of MZ B cells in the splenic MZ. Two
FIGURE 4. MZ B cells express higher levels of D6and RGS10 relative to FO B cells. Resting splenic MZand FO B cells were sort purified and total RNA andprotein were isolated. Resting MZ B cells expresshigher mRNA (A) and protein (B) levels of D6 andRGS10 as determined by RT-PCR and Western blot-ting, respectively. Total splenocytes were isolated andanalyzed via FLOW cytometry. The expression levelsof D6 isotype (0.3%), MZ B cell (88.8%), and FO B cell(11.8%) (C) and RGS10 isotype (0.2%), MZ B cell(82.1%), and FO B cell (1.1%) (D) are displayed ashistogram plots.
Table II. Genes differentially expressed between FO and MZ B cells from B6, SWR, and C3H strains of mice
AffymetrixIdentifier
GeneSymbol Gene Title
Relative Expression Relative Expression Relative Expression
B6 FO B6 MZFold Difference
(MZ/FO) SWR FO SWR MZFold Difference
(MZ/FO) C3H FO C3H MZFold Difference
(MZ/FO)
93195_at Mfhas1 Malignant fibrous histiocytoma-amplifiedsequence
1143 5462 4.8 2857 2424 0.85 3446 3592 1.04
160069_at Gmnn Geminin 422 1174 2.8 376 323 0.86 229 445 1.9493833_s_at Hist1h2bc Histone 1, H2bc 773 2093 2.7 617 697 1.13 1189 536 0.45161788_f_at S1P1 Sphingolipid G protein-coupled
receptor 1565 1476 2.6 1332 747 0.56 936 562 0.60
94995_at RIKEN cDNA A030007L17 gene 848 2186 2.6 926 734 0.79 1184 817 0.6992925_at Cebpb CCAAT/enhancer binding protein
(C/EBP), �
1911 4882 2.6 12638 12321 0.97 20455 13386 0.65
100516_at Chka Choline kinase � 874 2195 2.5 1728 1646 0.95 880 728 0.83160841_at Dbp D site albumin promoter binding protein 239 540 2.3 226 129 0.57 293 336 1.15102104_f_at Est 2147 4844 2.3 1411 2614 1.85 1284 1133 0.8899024_at Mxd4 Max dimerization protein 4 5977 12958 2.2 6053 6769 1.12 6873 6672 0.9795387_f_at Sema4b Semaphorin 4B 8465 17775 2.1 4483 3837 0.86 4046 4411 1.09103460_at Ddit4 DNA damage-inducible transcript 4 3274 6711 2.0 1631 1280 0.78 1275 3062 2.40100573_f_at Gpi1 Glucose phosphate isomerase 1 1410 2889 2.0 3126 1986 0.64 1911 2109 1.1098868_at Bcl2 B cell leukemia/lymphoma 2 1203 2437 2.0 1411 1261 0.89 1030 833 0.8194431_at St6gal1 �-Galactoside �-2,6-ialyltransferase 1 1562 331 4.7 922 410 2.25 850 872 0.98103504_at Ssbp2 Single-stranded DNA binding protein 2 1538 335 4.6 85 224 0.38 496 182 2.7298918_at Txndc5 Thioredoxin domain containing 5 5318 1447 3.7 745 893 0.83 3928 1955 2.01104523_at Lrrc8c Leucine rich repeat containing 8 family,
member C1533 483 3.2 905 1098 0.82 970 693 1.40
97890_at Sgk Serum/glucocorticoid regulated kinase 1107 351 3.2 1857 1923 0.97 1674 717 2.3393193_at Adrb2 Adrenergic receptor, �2 5831 1961 3.0 8025 9318 0.86 3784 5394 0.7098083_at Klf6 Kruppel-like factor 6 4002 1522 2.6 14189 19034 0.75 18319 14977 1.2299622_at Klf4 Kruppel-like factor 4 697 278 2.5 10472 25698 0.41 18855 23655 0.80102892_at Kcnab2 Potassium voltage-gated channel 2707 1133 2.4 2525 2350 1.07 1751 1970 0.89100554_at Pdlim1 PDZ and LIM domain 1 (elfin) 2352 1009 2.3 443 336 1.32 147 243 0.6197203_at Marcksl1 MARCKS-like 1 2027 900 2.3 5719 7047 0.81 5684 6025 0.9494753_at Gna15 Guanine nucleotide binding protein, �15 689 315 2.2 51 136 0.37 84 136 0.6198335_at Rece1 Replication factor C1 2339 1104 2.1 1421 1647 0.86 1758 1339 1.31101502_at Tgif TG interacting factor 2690 1292 2.1 27576 36312 0.76 23520 24132 0.97100576_at Pafah1b3 Platelet-activating factor acetylhydrolase 3106 1545 2.0 1069 1280 0.84 1627 988 1.65
6669The Journal of Immunology

proteins more highly expressed in MZ B cells relative to FO Bcells were the D6 �-chemokine receptor and the RGS10 regu-lator of G protein signaling protein. To confirm that these twoproteins are indeed more highly expressed in MZ B cells, rest-ing splenic MZ and FO B cells were sort purified and analyzed
for the level of D6 and RGS10 mRNA (Fig. 4A) and protein(Fig. 4, B–D) by RT-PCR, Western blotting, and FACS, respec-tively. Thus, resting MZ B cells express D6 and RGS10 athigher levels than FO B cells with the potential to be involvedin MZ B cell localization.
FIGURE 5. Regulated genes in Id� MZ B cells after activation. MZ Id� (Ag�) and Id� (Ag�) B cells were isolated from M167 Tg mice at 0 and 1 hafter i.v. immunization with heat killed S. pneumoniae R36A. DNA microarray analysis identified genes that were significantly up-regulated and down-regulated in the Id� MZ B cells 1 h after activation. The genes specifically regulated in the Id� MZ B cells were grouped into various functional categoriesas follows: chemokines (A), chemokine receptors (B), cytokines (C), and cytokine receptors (D). Shown are normalized expression values greater than(yellow), near (black), or less than (blue) the mean of that gene. Each column represents one independent sample. Genes or transcripts are represented inrows. Clustering of the genes was unsupervised.
6670 MZ AND FO � CELL GENE EXPRESSION PROFILE

Gene expression profile of MZ Id� B cells before and afterstimulation
In addition to the differential phenotypes of resting FO and MZ Bcells, MZ B cells respond very differently to Ag than FO B cells.Following activation with Ag, MZ B cells increase B7-1 and B7-2expression, develop into plasmablasts more readily, and are moresensitive to LPS stimulation than their FO counterparts (5, 6).Along with the rapid production of IgM Ab, MZ B cells also pos-sess the ability to efficiently activate naive T cells (8). However,the genes that are rapidly up-regulated and down-regulated in MZB cells following activation with Ag have not been fully charac-terized. To determine the gene expression profile of Ag (Id)-pos-itive MZ B cells before and after activation, M167 Tg mice wereimmunized i.v. with heat-killed S. pneumoniae, R36A, and Id�
and Id� MZ B cells were sort purified at 0 and 1 h followingimmunization. The samples were analyzed via DNA microarrayanalysis as described for the resting MZ vs FO B cell microarrayabove. The gene transcripts identified to significantly increase ordecrease were grouped into the following broad functional classi-fications: chemokines (Fig. 5A), chemokine receptors (Fig. 5B),cytokines (Fig. 5C), cytokine receptors (Fig. 5B), apoptosis (Fig.6A), and immune cell markers (Fig. 6B).
We focused on the Ag responsive Id� MZ B cells and the genesthat were regulated following i.v. immunization with R36A. TheId� MZ B cell gene expression profile exhibited an activated phe-notype at 1 h post-immunization, as would be predicted. The Id�
MZ B cells rapidly down-regulated proapoptotic genes such asmultiple caspase proteins, annexin A4, and programmed cell deathproteins while concurrently up-regulating anti-apoptotic genessuch as Bcl-like proteins. MZ B cells also up-regulated a numberof cytokine genes including IL-10, IL-6, TGF-�, and IL-1� whiledown-regulating many cytokine receptors. Chemokine ligandssuch as CXCL10, CXCL2, CCL3, CXCL5, and CCL4 were up-regulated while chemokine receptors were either up-regulated(CCR7) or down-regulated (D6, CCR5, and RDC-1). In addition,we cross-referenced the 99 transcripts that were more highly ex-pressed in the MZ B cells relative to FO B cells with the expres-sion profile in the Id� MZ B cells 1 h after activation to determinewhether any significant changes occurred (Table III). Six of the 99genes (6%) more highly expressed in MZ B cells were up-regu-lated after activation in the MZ Id� B cells while 17 of the 99genes (17%) were down-regulated. Taken together, these resultssuggest that Id� MZ B cells have a unique gene expression profilefollowing i.v. immunization with R36A.
Id� MZ B cells up-regulate IL-10 and Stra13 in response toR36A immunization
A number of interesting genes were identified by DNA microarrayanalysis on sort-purified MZ Id� and Id� B cells at 0 and 1 hfollowing i.v. immunization with R36A. Two of these genes thatwarranted further investigation were IL-10 and Stra13.
IL-10 is an immunoregulatory cytokine that plays a role in neg-atively regulating inflammatory immune responses, and B cellshave been shown to secrete IL-10 (23). To confirm whether Id�
MZ B cells are activated to secrete IL-10 in response to R36A, wecrossed the M167 heavy chain Ig Tg mouse with an IL-10/Thy1.1reporter mouse in which all IL-10� cells were Thy1.1� (14), im-munized with R36A, and analyzed isolated Id� MZ B cells for the
FIGURE 6. Regulated genes in Id� MZ B cells after activation. MZId� (Ag�) and Id� (Ag�) B cells were isolated from M167 Tg mice at0 and 1 h after i.v. immunization with heat killed S. pneumoniae R36A.DNA microarray analysis identified genes that were significantlyup-regulated and down-regulated in the Id� MZ B cells 1 h afteractivation. The genes specifically regulated in the Id� MZ B cellswere grouped into various functional categories as follows: apoptosis(A) and immune cell markers (B). Shown are normalized expressionvalues greater than (yellow), near (black), or less than (blue) the mean
of that gene. Each column represents one independent sample. Genes ortranscripts are represented in rows. Clustering of the genes wasunsupervised.
6671The Journal of Immunology

presence of IL-10 and Thy1.1 mRNA (Fig. 7A) and the Thy1.1reporter protein (Fig. 7B). As expected, IL-10 and Thy1.1 mRNAincreased only in the Id� MZ B cells following immunization withR36A. The difference in degree of induction between IL-10 andThy1.1 is most likely due to the copy number of the Thy1.1 trans-gene, which is estimated to be at least 12 copies (14). Stra13 is abasic helix-loop-helix domain-containing class B2 protein that isthought to be a negative regulator of B cells (24). To confirm thatStra13 is up-regulated following activation of MZ B cells, MZ Id�
B cells were isolated before and after immunization with R36Aand analyzed for the level of Stra13 mRNA (Fig. 7A). As expected,Stra13 mRNA increased only in the Id� MZ B cells followingimmunization with R36A. Thus, the DNA microarray analysis ofId� and Id� MZ B cells at 0 and 1 h following immunization withR36A identified multiple genes of interest that were rapidly up-regulated or down-regulated after activation, including IL-10 andStra13.
DiscussionPrevious data studying FO and MZ B cells have shown that theseB cell subsets differ based on their anatomical location in thespleen, cellular surface molecule expression, and effector functions(reviewed in Ref. 1). We set out to identify new genes and path-ways that are differentially expressed between FO and MZ B cellsand those that were specifically up-regulated or down-regulatedwithin each subset following activation. DNA microarray allowsfor a high throughput analysis of genomic expression differencesbetween two sample populations. This approach identified 181genes differentially expressed between resting MZ and FO B cells.Ninety-nine genes were more highly expressed in MZ B cellswhile 82 genes were more highly expressed in FO B cells. Inaddition, DNA microarray analysis of MZ Id� and Id� B cells
FIGURE 7. IL-10 and Stra13 are increased following R36A immuniza-tion. M167 Tg mice were crossed with an IL-10/Thy1.1 reporter mouse andimmunized i.v. with R36A. MZ Id� B cells were sort purified at 0, 1, and4 h after immunization and total RNA was isolated. A, RT-PCR was per-formed using gene-specific primers for IL-10, Thy1.1, Stra13, and actin. B,The expression level of Thy1.1 was determined via FACS analysis ongated MZ Id� B cells at 24 h following R36A immunization. MZ Id� Bcells were �5% (PBS) and 20% (R36A) positive for Thy1.1, respectively.
Table III. Genes more highly expressed in MZ B cells relative to FO B cells and specifically regulated in MZ Id� B cells following activation
AffymetrixIdentifier Gene Symbol Gene Title
Relative Expression Relative Expression
B6 FO B6 MZFold Difference
(MZ/FO) MZ Id� (0 h) MZ Id� (1 h)Fold Difference
(1 h/0 h)
95462_at Bzw2 Basic leucine zipper and W2domains 2
1482 8442 5.7 3855 13947 3.6
92217_s_at Gp49 Glycoprotein 49 A/B 161 2762 17.2 2530 13563 5.4100325_at Gp49 Glycoprotein 49 A/B 394 5124 13.0 2530 13563 5.493013_at Id2 Inhibitor of DNA binding 2 2417 6577 2.7 9220 46793 5.195661_at CD9 CD9 antigen 480 2677 5.6 8265 16347 2.0104701_at Bhlhb2 Basic helix-loop-helix domain
containing272 1490 5.5 6307 22934 3.6
102914_s_at Bcl2a1 B cell leukemia/lymphoma 2 relatedprotein A1
3284 10193 3.1 30696 152568 5.0
161788_f_at S1P1 Sphingolipid G-protein-coupledreceptor 1
565 1476 2.6 129 18 0.14
97740_at Dusp16 Dual specificity phosphatase 16 787 4075 5.2 312 9 0.0393101_s_at Nedd4 Neural precursor cell expressed 660 3176 4.8 3668 565 0.1599071_at Mpeg1 Macrophage expressed gene 1 2402 8938 3.7 55 13 0.2495758_at Scd2 Stearoyl-Coenzyme A desaturase 2 4483 12233 2.7 6858 821 0.12160711_at Decr1 2,4-dienoyl CoA reductase 1,
mitochondrial187 553 3.0 670 364 0.54
160069_at Gmnn Geminin 422 1174 2.8 905 216 0.24102410_at Hs3st1 Heparan sulfate (glucosamine)
3-O-sulfotransferase575 1392 2.4 2749 254 0.09
97949_at Fgl2 Fibrinogen-like protein 2 314 752 2.4 570 242 0.4298417_at Mx1 myxovirus (influenza virus)
resistance 1260 608 2.3 428 233 0.54
160841_at Dbp D site albumin promoter bindingprotein
239 540 2.3 516 121 0.23
95387_f_at Sema4b Semaphorin 4B 8465 17775 2.1 1495 271 0.1898026_g_at Evi2a Ecotropic viral integration site 2a 3528 7178 2.0 618 271 0.4493430_at Cmkor1 Chemokine orphan receptor 1 78 4369 56.0 8291 1092 0.13160495_at Ahr Aryl-hydrocarbon receptor 31 249 8.0 735 404 0.5598309_at Ccbp2 Chemokine binding protein 2 481 3549 7.4 3011 310 0.10103422_at CD1d CD1d antigen 1999 12449 6.2 22540 4484 0.20
6672 MZ AND FO � CELL GENE EXPRESSION PROFILE

before (0 h) and after (1 h) R36A immunization revealed manynew genes and pathways specifically regulated in the MZ Id� Bcells. These findings further our understanding of MZ and FO Bcell biology while at the same time identifying new candidategenes and pathways to study.
The MZ vs FO B cell microarray used cells that were isolated bygating on B220 and then sorted based on surface expression pat-terns of CD21highCD23low for MZ B cells and CD21lowCD23high
for FO B cells. As expected, our DNA microarray results showedhigher mRNA expression of CD21 and lower expression of CD23in MZ B cells relative to FO B cells. MZ B cells are known toexpress surface CD9 and CD1d whereas FO B cells express littleto no CD9 and CD1d (9, 25). Similarly, our microarray resultsshowed a higher expression of CD9 and CD1d on MZ B cellsrelative to FO B cells. Furthermore, S1P1 and S1P3 were previ-ously shown to be expressed at higher levels on MZ B cells rel-ative to FO B cells, while S1P4 was expressed higher on FO B cells(19). Our data were again consistent with what has been shown inthe literature, showing higher expression of S1P1 and S1P3 on MZB cells and higher expression of S1P4 on FO B cells. Taken to-gether, it appears that our DNA microarray data agree with whathas been shown in the literature with respect to known phenotypicdifferences between MZ and FO B cells, suggesting that our sortedB cell populations were pure and our DNA microarray method ofanalysis is valid.
One interesting gene more highly expressed in MZ B cells rel-ative to FO B cells was RGS10. RGS10 has been previously con-firmed to be specifically expressed in MZ B cells (mRNA) as wellas plasma cells (26). RGS10 attenuates signaling pathways viaincreased GTPase activity to specific G � subunits (27). Phosphor-ylation by protein kinase A induces its localization to the nucleus(28). Recently, RGS10�/� mice were reported that exhibited se-vere osteopetrosis and impaired osteoclast differentiation resultingfrom the loss of [Ca2�]i oscillation regulation (29), although noimmune characterization was reported. Although RGS10 was morehighly expressed in resting MZ B cells relative to FO B cells,RGS10 mRNA was not found to be regulated following activationin MZ Id� B cells. However, because chemokine receptors are Gprotein coupled, a protein that regulates their signaling capacitymight play an important role in localization, maintenance, or mi-gration of MZ B cells. For example, RGS1, RGS3, and RGS4introduction into B cell lines dramatically alters chemokine-in-duced cell migration (30–32). Taken together, MZ B cell-specificexpression of RGS10 potentially plays a role in regulating theability to respond to chemokine signals and might play a role inMZ B cell localization.
An additional gene more highly expressed in MZ B cells wasD6. D6 is proposed to be a decoy chemokine receptor that has theability to bind, internalize, and degrade chemokine ligands througha �-arrestin-dependent mechanism, a function termed chemokinescavenging (33–36). Interestingly, our results show that D6 ismore highly expressed in resting MZ B cells relative to FO B cellsand that D6 is rapidly down-regulated (10-fold) following activa-tion. Given its proposed property of a chemokine sink and the factthat D6 has not been shown to signal intracellularly, the potentialexists that D6 expression on the surface of MZ B cells is involvedin keeping them properly localized within the splenic microenvi-ronment. Rapid down-regulation of D6 after activation potentiallyenhances the migration of MZ B cells to the T:B cell border. D6expression has been reported in B cells previously (37), althoughthe differential expression in B cell subsets was not investigated.Thus, D6 appears to be an interesting candidate gene potentiallyinvolved in MZ B cell localization, maintenance, and/or migration.
Our second DNA microarray experiment was aimed at identi-fying genes that were specifically up-regulated or down-regulatedfollowing activation. Using the M167 Tg mouse, we sort purifiedMZ Id� and Id� B cells at 0 and 1 h after i.v. immunization withR36A. S1P1 transcripts were rapidly down-regulated (7.0-fold)following activation only in the Id� MZ B cells, which is in agree-ment with the findings of Cyster and colleagues (19). S1P1 hasbeen shown to play a role in the migration of MZ B cells to the T:Bborder following activation. In addition, the MZ B cell-specificmarker, CD9, was increased 2.0-fold following activation, consis-tent with our previous findings (9). Of additional interest, only theMZ Id� and not the MZ Id� B cells rapidly increased antiapoptoticgenes and decreased proapoptotic genes, a phenotype consistentwith cellular activation. This shows a remarkable degree of Agspecificity in that virtually no concurrent increases were detectedin the MZ Id� and Id� B cell populations at 1 h. Our microarrayresults appear to agree with a number of well studied genes alreadypublished in the literature with respect to MZ B cells, indicatingthat both our cell sort and microarray analyses are accurate. Con-sequently, further analysis and weight can be given to the othergenes found to be regulated following immunization.
One interesting gene identified by microarray analysis to be spe-cifically increased only in the Id� MZ B cells was IL-10. Inter-estingly, MZ B cells have been suggested as playing an immuno-regulatory role through secretion of IL-10 (38). IL-10 is animmunoregulatory cytokine that plays an important role in nega-tively regulating inflammatory immune responses. A variety ofcells are capable of producing IL-10, including Th2, regulatory T(Treg), B-1, and MZ B cells (39). The effects of IL-10 are mainlyimmunosuppressive but also depend on which cell type is beingaffected by IL-10. In experimental autoimmune encephalitis, anexperimental model of multiple sclerosis, one study suggested thatB cells regulate regulatory T cells via B7 and IL-10 to suppressautoimmune inflammation (40). Besides the immunosuppressiverole of IL-10, it has been suggested to play a role in B cell Abproduction. The addition of IL-10 to human B cell cultures is re-ported to increase class switch recombination and the productionof IgA and IgG (41–43). However, the specific B cell subset, itslocation in the spleen before and after stimulation, and the signalsrequired to produce IL-10 are not fully understood.
Stra13 was another interesting gene that was rapidly up-regu-lated following activation. Stra13 is a basic helix-loop-helix do-main-containing class B2 protein that is thought to be a negativeregulator of B cells (24). Stra13�/� mice develop autoimmunedisease characterized by the accumulation of spontaneously acti-vated T and B cells, circulating autoantibodies, infiltration of T andB cells into several organs, and immune complex deposition inglomeruli (44). Stra13 transgenic mice show impaired develop-ment of T and B cells, with the expansion of progenitor B and Tcells most strongly affected (45). Of interest, Stra13 is develop-mentally regulated in B cells and decreases after activation in ger-minal center B cells (45). Our results in Id� MZ B cells show thatStra13 increases after activation, although the functional relevanceof this regulation is currently unknown.
The goal of this study was twofold: to identify genes that weredifferentially expressed between resting FO and MZ B cells and toidentify genes that were specifically regulated in MZ Id� B cellsfollowing activation. The results generated give a genome-widelook at the genes differentially expressed in FO and MZ B cellsthat potentially account for their differences in localization andfunction. Furthermore, the second microarray gave a comparativesnapshot at 1 h of the gene expression profiles between Ag-specificvs nonspecific MZ B cells. One major problem with DNA mi-croarray analysis is that many of the genes reported have not been
6673The Journal of Immunology

studied, making conclusions difficult. However, a multitude of datais presented here with respect to FO and MZ B cell biology thatwill facilitate identification of new genes and pathways to explore.
AcknowledgmentWe gratefully acknowledge Dr. Casey Weaver (University of Alabama atBirmingham) for generously sharing the Thy1.1/IL-10 reporter mice.
DisclosuresThe authors have no financial conflict of interest.
References1. Martin, F., and J. F. Kearney. 2002. Marginal-zone B cells. Nat. Rev. Immunol.
2: 323–335.2. Dammers, P. M., A. Visser, E. R. Popa, P. Nieuwenhuis, and F. G. Kroese. 2000.
Most marginal zone B cells in rat express germline encoded Ig VH genes and areligand selected. J. Immunol. 165: 6156–6169.
3. Bendelac, A., M. Bonneville, and J. F. Kearney. 2001. Autoreactivity by design:innate B and T lymphocytes. Nat. Rev. Immunol. 1: 177–186.
4. Kearney, J. F. 2005. Innate-like B cells. Springer Semin. Immunopathol. 26:377–383.
5. Oliver, A. M., F. Martin, G. L. Gartland, R. H. Carter, and J. F. Kearney. 1997.Marginal zone B cells exhibit unique activation, proliferative and immunoglob-ulin secretory responses. Eur. J. Immunol. 27: 2366–2374.
6. Oliver, A. M., F. Martin, and J. F. Kearney. 1999. IgMhighCD21high lymphocytesenriched in the splenic marginal zone generate effector cells more rapidly than thebulk of follicular B cells. J. Immunol. 162: 7198–7207.
7. Cinamon, G., M. A. Zachariah, O. M. Lam, F. W. Foss, Jr., and J. G. Cyster.2008. Follicular shuttling of marginal zone B cells facilitates antigen transport.Nat. Immunol. 9: 54–62.
8. Attanavanich, K., and J. F. Kearney. 2004. Marginal zone, but not follicular Bcells, are potent activators of naive CD4 T cells. J. Immunol. 172: 803–811.
9. Won, W. J., and J. F. Kearney. 2002. CD9 is a unique marker for marginal zoneB cells, B1 cells, and plasma cells in mice. J. Immunol. 168: 5605–5611.
10. Won, W. J., J. B. Foote, M. R. Odom, J. Pan, J. F. Kearney, and R. S. Davis.2006. Fc receptor homolog 3 is a novel immunoregulatory marker of marginalzone and B1 B cells. J. Immunol. 177: 6815–6823.
11. Won, W. J., M. F. Bachmann, and J. F. Kearney. 2008. CD36 is differentiallyexpressed on B cell subsets during development and in responses to antigen.J. Immunol. 180: 230–237.
12. Goodnow, C. C., J. Crosbie, S. Adelstein, T. B. Lavoie, S. J. Smith-Gill,R. A. Brink, H. Pritchard-Briscoe, J. S. Wotherspoon, R. H. Loblay, K. Raphael,et al. 1988. Altered immunoglobulin expression and functional silencing of self-reactive B lymphocytes in transgenic mice. Nature 334: 676–682.
13. Storb, U., C. Pinkert, B. Arp, P. Engler, K. Gollahon, J. Manz, W. Brady, andR. L. Brinster. 1986. Transgenic mice with � and � genes encoding antiphos-phorylcholine antibodies. J. Exp. Med. 164: 627–641.
14. Maynard, C. L., L. E. Harrington, K. M. Janowski, J. R. Oliver, C. L. Zindl,A. Y. Rudensky, and C. T. Weaver. 2007. Regulatory T cells expressing inter-leukin 10 develop from Foxp3� and Foxp3� precursor cells in the absence ofinterleukin 10. Nat. Immunol. 8: 931–941.
15. Liu, J., G. Karypis, K. L. Hippen, A. L. Vegoe, P. Ruiz, G. S. Gilkeson, andT. W. Behrens. 2006. Genomic view of systemic autoimmunity in MRLlpr mice.Genes Immun. 7: 156–168.
16. Kin, N. W., and V. M. Sanders. 2007. CD86 regulates IgG1 production via aCD19-dependent mechanism. J. Immunol. 179: 1516–1523.
17. Kin, N. W., and V. M. Sanders. 2006. CD86 stimulation on a B cell activates thephosphatidylinositol 3-kinase/Akt and phospholipase C �2/protein kinase C ��signaling pathways. J. Immunol. 176: 6727–6735.
18. Eisen, M. B., P. T. Spellman, P. O. Brown, and D. Botstein. 1998. Cluster anal-ysis and display of genome-wide expression patterns. Proc. Natl. Acad. Sci. USA95: 14863–14868.
19. Cinamon, G., M. Matloubian, M. J. Lesneski, Y. Xu, C. Low, T. Lu, R. L. Proia,and J. G. Cyster. 2004. Sphingosine 1-phosphate receptor 1 promotes B celllocalization in the splenic marginal zone. Nat. Immunol. 5: 713–720.
20. Karlsson, M. C., R. Guinamard, S. Bolland, M. Sankala, R. M. Steinman, andJ. V. Ravetch. 2003. Macrophages control the retention and trafficking of B lym-phocytes in the splenic marginal zone. J. Exp. Med. 198: 333–340.
21. Lu, T. T., and J. G. Cyster. 2002. Integrin-mediated long-term B cell retention inthe splenic marginal zone. Science 297: 409–412.
22. Guinamard, R., M. Okigaki, J. Schlessinger, and J. V. Ravetch. 2000. Absence ofmarginal zone B cells in Pyk-2-deficient mice defines their role in the humoralresponse. Nat. Immunol. 1: 31–36.
23. Fillatreau, S., C. H. Sweenie, M. J. McGeachy, D. Gray, and S. M. Anderton.2002. B cells regulate autoimmunity by provision of IL-10. Nat. Immunol. 3:944–950.
24. Seimiya, M., R. Bahar, Y. Wang, K. Kawamura, Y. Tada, S. Okada, M. Hatano,T. Tokuhisa, H. Saisho, T. Watanabe, et al. 2002. Clast5/Stra13 is a negativeregulator of B lymphocyte activation. Biochem. Biophys. Res. Commun. 292:121–127.
25. Roark, J. H., S. H. Park, J. Jayawardena, U. Kavita, M. Shannon, andA. Bendelac. 1998. CD1.1 expression by mouse antigen-presenting cells andmarginal zone B cells. J. Immunol. 160: 3121–3127.
26. Haller, C., S. Fillatreau, R. Hoffmann, and F. Agenes. 2002. Structure, chromo-somal localization, and expression of the mouse regulator of G-protein signal-ing10 gene (mRGS10). Gene 297: 39–49.
27. Hunt, T. W., T. A. Fields, P. J. Casey, and E. G. Peralta. 1996. RGS10 is aselective activator of G � i GTPase activity. Nature 383: 175–177.
28. Burgon, P. G., W. L. Lee, A. B. Nixon, E. G. Peralta, and P. J. Casey. 2001.Phosphorylation and nuclear translocation of a regulator of G protein signaling(RGS10). J. Biol. Chem. 276: 32828–32834.
29. Yang, S., and Y. P. Li. 2007. RGS10-null mutation impairs osteoclast differen-tiation resulting from the loss of [Ca2�]i oscillation regulation. Genes Dev. 21:1803–1816.
30. Bowman, E. P., J. J. Campbell, K. M. Druey, A. Scheschonka, J. H. Kehrl, andE. C. Butcher. 1998. Regulation of chemotactic and proadhesive responses tochemoattractant receptors by RGS (regulator of G-protein signaling) familymembers. J. Biol. Chem. 273: 28040–28048.
31. Moratz, C., V. H. Kang, K. M. Druey, C. S. Shi, A. Scheschonka, P. M. Murphy,T. Kozasa, and J. H. Kehrl. 2000. Regulator of G protein signaling 1 (RGS1)markedly impairs Gi � signaling responses of B lymphocytes. J. Immunol. 164:1829–1838.
32. Reif, K., and J. G. Cyster. 2000. RGS molecule expression in murine B lympho-cytes and ability to down-regulate chemotaxis to lymphoid chemokines. J. Im-munol. 164: 4720–4729.
33. Nibbs, R. J., S. M. Wylie, I. B. Pragnell, and G. J. Graham. 1997. Cloning andcharacterization of a novel murine � chemokine receptor, D6: comparison tothree other related macrophage inflammatory protein-1� receptors, CCR-1,CCR-3, and CCR-5. J. Biol. Chem. 272: 12495–12504.
34. Fra, A. M., M. Locati, K. Otero, M. Sironi, P. Signorelli, M. L. Massardi,M. Gobbi, A. Vecchi, S. Sozzani, and A. Mantovani. 2003. Cutting edge: scav-enging of inflammatory CC chemokines by the promiscuous putatively silentchemokine receptor D6. J. Immunol. 170: 2279–2282.
35. Galliera, E., V. R. Jala, J. O. Trent, R. Bonecchi, P. Signorelli, R. J. Lefkowitz,A. Mantovani, M. Locati, and B. Haribabu. 2004. �-Arrestin-dependent consti-tutive internalization of the human chemokine decoy receptor D6. J. Biol. Chem.279: 25590–25597.
36. Weber, M., E. Blair, C. V. Simpson, M. O’Hara, P. E. Blackburn, A. Rot,G. J. Graham, and R. J. Nibbs. 2004. The chemokine receptor D6 constitutivelytraffics to and from the cell surface to internalize and degrade chemokines. Mol.Biol. Cell 15: 2492–2508.
37. McKimmie, C. S., and G. J. Graham. 2006. Leucocyte expression of the chemo-kine scavenger D6. Biochem. Soc. Trans. 34: 1002–1004.
38. Lenert, P., R. Brummel, E. H. Field, and R. F. Ashman. 2005. TLR-9 activationof marginal zone B cells in lupus mice regulates immunity through increasedIL-10 production. J Clin. Immunol. 25: 29–40.
39. Lund, F. E., B. A. Garvy, T. D. Randall, and D. P. Harris. 2005. Regulatory rolesfor cytokine-producing B cells in infection and autoimmune disease. Curr DirAutoimmun 8: 25–54.
40. Mann, M. K., K. Maresz, L. P. Shriver, Y. Tan, and B. N. Dittel. 2007. B cellregulation of CD4�CD25� T regulatory cells and IL-10 via B7 is essential forrecovery from experimental autoimmune encephalomyelitis. J. Immunol. 178:3447–3456.
41. Malisan, F., F. Briere, J. M. Bridon, N. Harindranath, F. C. Mills, E. E. Max,J. Banchereau, and H. Martinez-Valdez. 1996. Interleukin-10 induces immuno-globulin G isotype switch recombination in human CD40-activated naive B lym-phocytes. J. Exp. Med. 183: 937–947.
42. Briere, F., C. Servet-Delprat, J. M. Bridon, J. M. Saint-Remy, and J. Banchereau.1994. Human interleukin 10 induces naive surface immunoglobulin D� (sIgD�)B cells to secrete IgG1 and IgG3. J. Exp. Med. 179: 757–762.
43. Fujieda, S., A. Saxon, and K. Zhang. 1996. Direct evidence that � 1 and � 3switching in human B cells is interleukin-10 dependent. Mol. Immunol. 33:1335–1343.
44. Sun, H., B. Lu, R. Q. Li, R. A. Flavell, and R. Taneja. 2001. Defective T cellactivation and autoimmune disorder in Stra13-deficient mice. Nat. Immunol. 2:1040–1047.
45. Seimiya, M., A. Wada, K. Kawamura, A. Sakamoto, Y. Ohkubo, S. Okada,M. Hatano, T. Tokuhisa, T. Watanabe, H. Saisho, et al. 2004. Impaired lympho-cyte development and function in Clast5/Stra13/DEC1-transgenic mice. Eur.J. Immunol. 34: 1322–1332.
6674 MZ AND FO � CELL GENE EXPRESSION PROFILE