

Strengthening of air quality monitoring, modelling and plans ...
320
ED 14240 | Issue B2 | Date 22/09/2021 Strengthening of air quality monitoring, modelling and plans under the Ambient Air Quality Directives Phase 1 Technical Annex – Survey Responses Service Request 9 under Framework Contract ENV.C.3/FRA/2017/0012 ______________________________________________________________ European Commission - DG Environment ENV.C.3/FRA/2017/0012
-
Upload
khangminh22 -
Category
Documents
-
view
1 -
download
0
Transcript of Strengthening of air quality monitoring, modelling and plans ...
ED 14240 | Issue B2 | Date 22/09/2021
Strengthening of air quality monitoring,
modelling and plans under the Ambient Air
Quality Directives
Phase 1 Technical Annex – Survey
Responses Service Request 9 under Framework Contract ENV.C.3/FRA/2017/0012
______________________________________________________________
European Commission - DG Environment
ENV.C.3/FRA/2017/0012
Strengthening of air quality monitoring, modelling and plans under the Ambient Air Quality Directives Ref: ED14240 | Phase 1 Technical Annex | Issue number B2 | Date 22/09/21
ii
Customer:
European Commission - DG Environment
Contact Jo Green, Ricardo, Gemini Building, Fermi Avenue Didcot OX11 0RA United Kingdom.
t: +44 (0)1235 75 3480 e: [email protected]
Customer reference:
ENV.C.3/FRA/2017/0012
Confidentiality, copyright and reproduction:
This document was prepared for DG Environment. The information herein is confidential and shall not be divulged to a third party without the prior permission of Ricardo Nederland B.V.
Ricardo plc, its affiliates and subsidiaries and their respective officers, employees or agents are, individually and collectively, referred to in this clause as the ‘Ricardo Group’. The Ricardo Group assumes no responsibility and shall not be liable to any person for any loss, damage or expense caused by reliance on the information or advice in this document or howsoever provided, unless that person has signed a contract with the relevant Ricardo Group entity for the provision of this information or advice and in that case any responsibility or liability is exclusively on the terms and conditions set out in that contract.
Ricardo Nederland B.V. and Ricardo-AEA are trading names of the Ricardo Group of entities.
Services are provided by members of the Ricardo Group.
© 2017 Ricardo Nederland B.V. All rights reserved. No parts of this publication may be reproduced
distributed, modified and / or made public in any
form whatsoever, including printed photostatic
and microfilm, stored in a retrieval system,
without prior permission in writing from the
publisher.
Author:
Keith Vincent, James Southgate, Matthieu
Pommier, Honor Puciato, Beth Conlan, Jo
Green (Ricardo), Leonor Tarrason, Nuria
Castell Balaguer (NILU); Stijn Janssen, Peter
Viaene (VITO); Irati Artola, Pavla Cihlarova
(Trinomics)
Approved by:
Joanne Green
Signed
Date:
22nd September 2021
Ref: ED14240

Strengthening of air quality monitoring, modelling and plans under the Ambient Air Quality Directives Ref: ED14240 | Phase 1 Technical Annex | Issue number B2 | Date 22/09/21
iii
Strengthening of air quality monitoring, modelling and plans under the Ambient Air Quality Directives Ref: ED14240 | Phase 1 Technical Annex | Issue number B2 | Date 22/09/21
iv
Contents 1 Introduction ........................................................................................................ 6
2 Survey headline results .................................................................................... 8
2.1 Respondents profile ................................................................................................................ 8
2.2 Stakeholder willingness to participate in follow up consultation activities ............................ 18
3 Air quality monitoring ..................................................................................... 21
3.1 Respondent Analysis ............................................................................................................ 21
3.2 Air quality zones and assessment regimes (Q2) .................................................................. 22
3.2.1 Current situation ................................................................................................................ 22
3.2.2 Identified needs for guidance and revision ....................................................................... 26
3.2.3 Main messages ................................................................................................................. 39
3.3 Micro- and macro-scale siting of sampling points (Q3) ......................................................... 41
3.3.1 Current situation ................................................................................................................ 41
3.3.2 Identified needs for guidance and revision ....................................................................... 46
3.3.3 Main messages ................................................................................................................. 62
3.4 Representativeness and continuity of monitoring for exceedance and exposure calculations
(Q4) 64
3.4.1 Current situation ................................................................................................................ 64
3.4.2 Identified needs for guidance and revision ....................................................................... 71
3.4.3 Main messages ................................................................................................................. 89
3.5 Monitoring other air pollutants or parameters (Q5) ............................................................... 90
3.5.1 Current situation ................................................................................................................ 90
3.5.2 Identified needs for guidance and revision ....................................................................... 96
3.5.3 Main messages ............................................................................................................... 104
4 Air quality modelling ..................................................................................... 105
4.1 Respondent analysis ........................................................................................................... 105
4.2 Enhanced air quality assessment methods (Q6) ................................................................ 109
4.2.1 Current situation .............................................................................................................. 109
4.2.2 Identified needs for guidance and revision ..................................................................... 118
4.2.3 Main messages ............................................................................................................... 119
4.3 Enhanced role of air quality modelling (Q7) ........................................................................ 120
4.3.1 Current situation .............................................................................................................. 120
4.3.2 Identified needs for guidance and revision ..................................................................... 133
4.3.3 Main messages ............................................................................................................... 136
4.4 Improving quality of air quality modelling (Q8) .................................................................... 137
4.4.1 Current situation .............................................................................................................. 137
4.4.2 Identified needs for guidance and revision ..................................................................... 151
4.4.3 Main messages ............................................................................................................... 159
5 Air quality plans ............................................................................................. 160
Strengthening of air quality monitoring, modelling and plans under the Ambient Air Quality Directives Ref: ED14240 | Phase 1 Technical Annex | Issue number B2 | Date 22/09/21
v
5.1 Respondent Analysis .......................................................................................................... 160
5.2 Improving air quality plans (Q9) .......................................................................................... 161
5.2.1 Current situation .............................................................................................................. 161
5.2.2 Identified needs for guidance and revision ..................................................................... 170
5.2.3 Main messages ............................................................................................................... 176
5.3 Role of modelling to support air quality plans (Q10) ........................................................... 177
5.3.1 Current situation .............................................................................................................. 177
5.3.2 Identified needs for guidance and revision ..................................................................... 182
5.3.3 Main messages ............................................................................................................... 185
5.4 Air quality plan development process and engagement (Q11) ........................................... 187
5.4.1 Current situation .............................................................................................................. 187
5.4.2 Identified needs for guidance and revision ..................................................................... 205
5.4.3 Main messages ............................................................................................................... 215
5.5 Ex-ante impact assessments, costs and effectiveness of air quality plans (Q12) .............. 216
5.5.1 Current situation .............................................................................................................. 216
5.5.2 Identified needs for guidance and revision ..................................................................... 232
5.5.3 Main messages ............................................................................................................... 240
5.6 Ex-post assessments of impacts and costs of air quality plans (Q13)................................ 241
5.6.1 Current situation .............................................................................................................. 242
5.6.2 Identified needs for guidance and revision ..................................................................... 258
5.6.3 Main messages ............................................................................................................... 265
6 General questions ......................................................................................... 267
6.1 Administrative Burden (Q1) ................................................................................................. 267
6.1.1 Current situation .............................................................................................................. 267
6.1.2 Identified needs for guidance and revision ..................................................................... 275
6.1.3 Main messages ............................................................................................................... 281
6.2 Public access to air quality data (Q14) ............................................................................... 283
6.2.1 Current situation .............................................................................................................. 284
6.2.2 Identified needs for guidance and revision ..................................................................... 292
6.2.3 Main messages ............................................................................................................... 295
6.3 External factors (Q15) ......................................................................................................... 296
6.3.1 Current situation .............................................................................................................. 297
6.3.2 Identified needs for guidance and revision ..................................................................... 305
Strengthening of air quality monitoring, modelling and plans under the Ambient Air Quality Directives Ref: ED14240 | Phase 1 Technical Annex | Issue number B2 | Date 22/09/21
6
1 Introduction This document is a technical annex designed to accompany the Phase 1 report for project
“Strengthening of air quality monitoring, modelling and plans under the Ambient Air Quality Directives”,
with specific contract number 070201/2020/835866/SFRA/ENV.C.3, which is service request 9 under
Framework Contract number ENV.C.3/FRA/2017/0012. Phase 1 of the contract was focused on fact-
finding, mapping and analysis of information. The main objectives of this first phase were to identify key
issues and possible solutions for the difficulties encountered by the Member States in implementation
of the provisions related to air quality monitoring, modelling and air quality plans. The main tasks were
a literature review, a targeted online survey and interviews/focus groups with key stakeholders. The
results from these data gathering exercises were then analysed to determine current practices, gaps in
guidance, legislation, knowledge, and initial options for solving these gaps. This technical annex serves
to present an in-depth review of the online survey results.
The online survey ‘Strengthening of air quality monitoring, modelling and plans under the Ambient Air
Quality Directives (AAQDs)’, published via EU Survey, was open from the 1st of February 2021 until the
1st of March 2021. It was a comprehensive survey aiming to explore current practices and potential
improvements to the air quality provisions on monitoring, modelling, air quality plans. In addition, the
survey also explored the cross-cutting issues of administrative burden and provision of information to
the public. The survey contained questions around different aspects of air quality monitoring, modelling
and plans as well as around general issues concerning administrative burden and provision of
information to the public. The following table illustrates the topics and questions that the Terms of
Reference (ToR) of this service request required us to analyse, which have guided the design of the
survey.
Table 1-1 Topics covered within the contract as proposed by the Terms of Reference
Topic Guiding questions
[Q1 General] Administrative burden
What scope is there to reduce the administrative burden and improve the efficiency of air quality assessments, thus addressing the instances with scope for simplification and burden reduction potential as identified in the Fitness Check? What specific changes to the AAQDs, and to the related Implementing Decision on Reporting, could reduce the administrative burden and costs?
[Q2 General] Air quality assessment regimes
How do Member States establish, review and update air quality zoning, applicable assessment regimes, as well as classification of zones in relation to lower and upper assessment thresholds
for the different pollutants covered by the AAQDs?
What scope is there to make this more transparent, especially in air quality zones with a limited number of monitoring stations?
[Q3 Monitoring] Micro- and macro-scale siting of sampling points
How do Member States ensure adequate monitoring in areas within zones and agglomerations where the highest concentrations occur, especially around, close to or downwind from key point sources? Are there significant assessment gaps related to industrial sources, and how can they be reduced?
[Q4 Monitoring] Representativeness and continuity of monitoring for exceedance and exposure calculations
How do Member States ensure adequate monitoring to reliably assess average exposure indicators (for fine particulate matter: PM2.5)? How can the representativeness of sampling points and continuity of monitoring be ensured for particulate matter in line with Annex V of Directive 2008/50/EC – and would aligned requirements improve the assessment of other air pollutants with exceedances?
[Q5 Monitoring] Monitoring other air pollutants or parameters
Are Member States monitoring the concentration levels of air pollutants not covered by the
AAQDs, such as ultrafine particles, black carbon, ammonia, methane and non-methane
volatile compounds?
If so, how, where, against which data quality objectives – and what is the scope to harmonise this?
[Q6 Monitoring & modelling] Enhanced air quality assessment methods
What role do complementary assessment methods (i.e. modelling, indicative measurements, objective estimation, satellite measurements and low-cost sensors) play in the air quality assessment regimes applied in different Member States? Is there a need for more guidance?
Strengthening of air quality monitoring, modelling and plans under the Ambient Air Quality Directives Ref: ED14240 | Phase 1 Technical Annex | Issue number B2 | Date 22/09/21
7
[Q7 Modelling] Enhanced role of air quality modelling
What role does modelling play in the air quality assessment regimes applied in different Member States? How are key parameters related to exceedance estimated (i.e surface area, length of road, resident population, ecosystem area affected by exceedances)? Is there a need for guidance and for further harmonisation?
[Q8 Modelling] Improving quality of air quality modelling
Where air quality modelling is used in air quality assessment regimes, which modelling quality objectives are applied? Is there a need for, and scope to specify these further? Is more comprehensive guidance on the use of modelling (for example on fitness-for purpose, on, on modelling data quality objectives) needed and, if so, what should such guidance cover?
[Q9 Planning] Improving air quality plans
How do competent authorities in Member States fulfil the requirements for an air quality plan as per Annex XV of Directive 2008/50/EC? Which elements are considered essential to ensure an effective air quality plan? Are there elements considered as less essential? Are key elements missing in the requirements?
[Q10 Modelling & planning] Role of modelling to support air quality plans
Where air quality modelling is used to support plans (e.g. in relation to source apportionment, ex-ante estimates of effects), which approaches are applied? Is there a need for more guidance on the use of such approaches and, if so, what should such guidance cover? Is there a need for, and scope to specify quality objectives (or benchmarks) for these approaches?
[Q11 Planning] Air quality plan development process and engagement
Who are the main actors and stakeholders during the process of setting up an air quality plan in different Member States, and to what extent have those actors and stakeholder control and enforcement powers to ensure implementation? What further requirements would be effective?
[Q12 Planning] Ex-ante impact assessments, costs and effectiveness of air quality plans
How do competent authorities in Member States estimate the improvements in air quality expected due to air quality plans? To what extent are air quality plans supported by cost estimates and if they are, what role do these estimates have in securing funding for measures? Is there scope for further requirements in relation to ex-ante impacts and cost estimates to increase effectiveness of air quality plans?
[Q13 Planning] Ex-post assessments of impacts and costs of air quality plans
Do competent authorities in Member States monitor and evaluate the effects and costs of air quality plans during and after their implementation? If so, to what extent do such evaluations consider the effects of plans on air quality improvements as well as their effects beyond air quality? Is there scope for further requirements in relation to ex-post assessment of impacts and costs to increase effectiveness of air quality plans?
[Q14 General] Public access to air quality data
How do competent authorities in Member States communicate with the public on and involve them in air quality matters, and specifically: how do they provide access to air quality data? How is the public informed about long and short term health risks (e.g. for people with existing respiratory or cardiovascular conditions) of air pollution? Have Member States a catalogue of health warnings on different AAQ exposure scenarios? Which user-friendly tools for public access to air quality and health risks information and monitoring (for example, smartphone apps and/or social media dedicated pages) have Member States developed? Is there need for good practice guidance?
[Q15 General] External factors
How do Member State deal with external factors worsening the air quality on their territory (e.g. natural sources of air pollution, geomorphology, transboundary air pollution)?
Within each of the 15 headline questions were up to 23 sub questions. These consisted of mainly multiple-choice questions but provided ample opportunity for qualitative comments to complement them. The questions were designed with two distinctly different objectives in mind. Firstly, to establish current practices or the current situation with regard to implementation of the
AAQDs, and secondly to identify needs for guidance and/or revision of the AAQDs.
In addition, the survey included ‘Respondent identification’ as well as ‘Closing’ questions aimed at
identifying respondents and checking on interest for further consultation respectively. As part of the
identification questions stakeholders were able to state their area(s) of expertise (monitoring / modelling
/ air quality plans / general) which would determine the questions they would be requested to answer.
Several questions were also conditional, meaning that they would only show up for stakeholders that
had provided a certain answer to the preceding question.
The survey consisted of mainly multiple-choice questions but provided ample opportunity for qualitative
comments to complement them.
Strengthening of air quality monitoring, modelling and plans under the Ambient Air Quality Directives Ref: ED14240 | Phase 1 Technical Annex | Issue number B2 | Date 22/09/21
8
The survey was disseminated to individual experts in the networks of the project team and more
importantly, by engaging with air quality networks such as the following, who were kindly requested to
share the survey with their members:
- Ambient Air Quality Expert Group
- FAIRMODE
- AQUILA
- EUROCITIES
- EIONET
- CEN/TC 264/WG 44 on source apportionment
- CEN/TC 264/WG 43 on Modelling Quality Objectives
- Network co-ordinator of CLARS (Charging, Low Emission Zones, other Access Regulation
Schemes)
- ClairCity (Citizen-led air quality and carbon reduction in cities)
- IPR -e reporting pilot community
This annex presents first the overall headline results as to who responded and then presents the
responses by questions grouped into the following topics:
1) Air quality monitoring
a) [Q2 General] Air quality assessment regimes
b) [Q3 Monitoring] Micro- and macro-scale siting of sampling points
c) [Q4 Monitoring] Representativeness and continuity of monitoring for exceedance and exposure
calculations
d) [Q5 Monitoring] Monitoring other air pollutants or parameters
2) Air quality modelling
a) [Q6 Monitoring & modelling] Enhanced air quality assessment methods
b) [Q7 Modelling] Enhanced role of air quality modelling
c) [Q8 Modelling] Improving quality of air quality modelling
d) [Q10 Modelling & planning] Role of modelling to support air quality plans
3) Air quality plans
a) [Q9 Planning] Improving air quality plans
b) [Q11 Planning] Air quality plan development process and engagement
c) [Q12 Planning] Ex-ante impact assessments, costs and effectiveness of air quality plans
d) [Q13 Planning] Ex-post assessments of impacts and costs of air quality plans
4) General questions
a) [Q1 General] Administrative burden
b) [Q14 General] Public access to air quality data
c) [Q15 General] External factors
The sub section titles mirror the questions presented in the online survey which is provided as a
standalone document with this document.
2 Survey headline results
2.1 Respondents profile
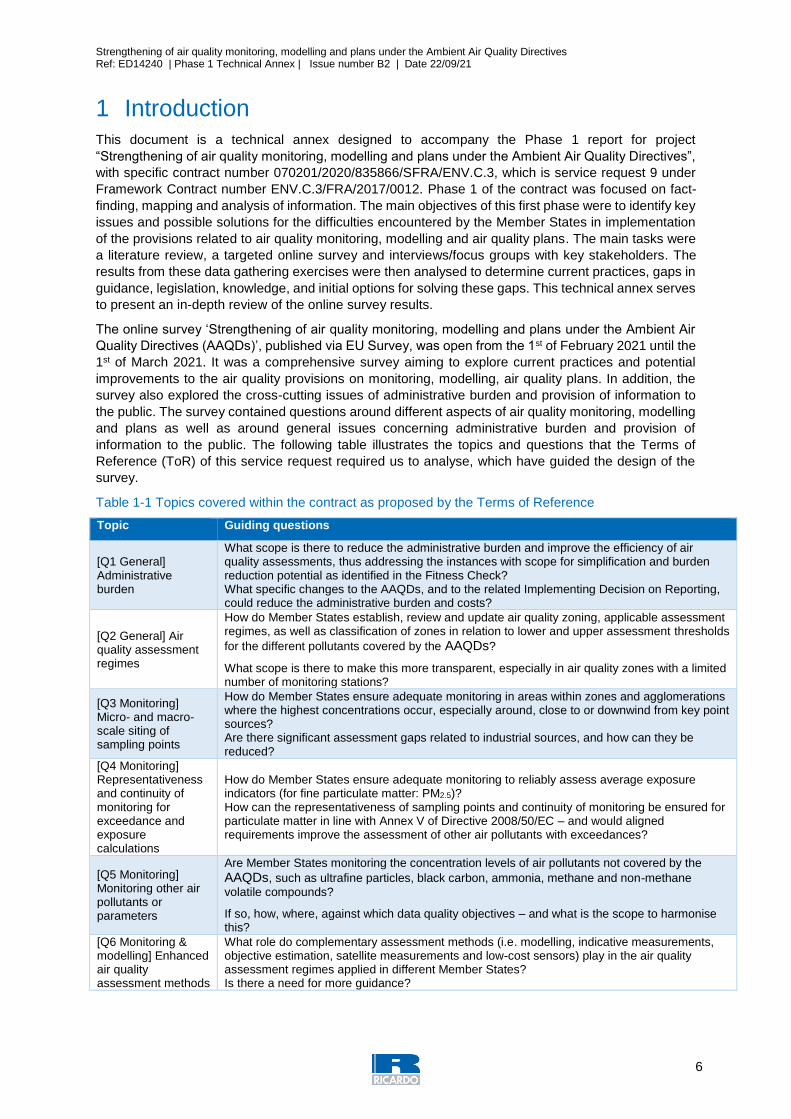
A total of 107 stakeholders responded to the online survey. Respondents covered 23 out of the 27 EU
countries. For Slovenia, Romania, Greece and Cyprus no responses were obtained. Germany, Sweden
and Italy submitted the largest number of responses. Relatively speaking, Belgium, the Netherlands
and Hungary also provided a good number of responses. For several countries (11) just one response
was received. The ‘other’ responses corresponded to Norway (7) and environmental NGOs / EU
umbrella organisations working across several EU member states.
Strengthening of air quality monitoring, modelling and plans under the Ambient Air Quality Directives Ref: ED14240 | Phase 1 Technical Annex | Issue number B2 | Date 22/09/21
9
Figure 2-1 Number of responses per country
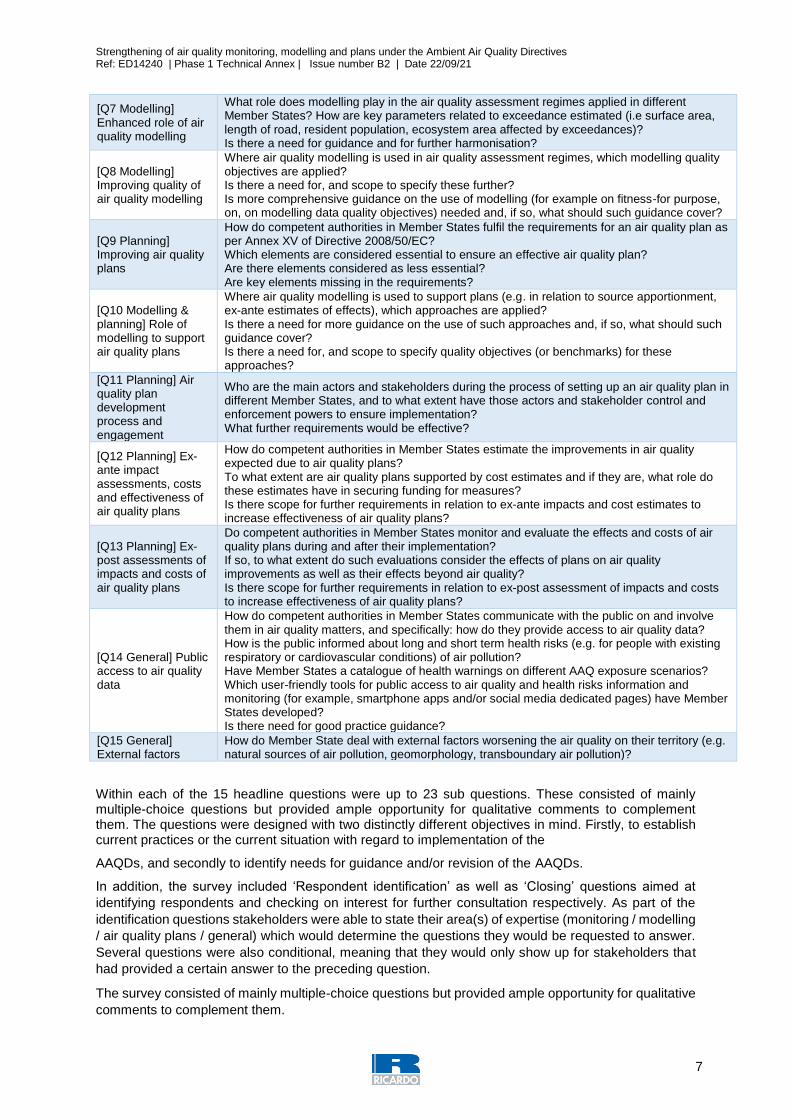
The four areas or topics covered by the survey received a relatively even number of responses. The air
quality monitoring related questions received most of the responses (69) while the general questions
regarding administrative burden obtained the least (49).
Figure 2-2 Number of responses per topic
Strengthening of air quality monitoring, modelling and plans under the Ambient Air Quality Directives Ref: ED14240 | Phase 1 Technical Annex | Issue number B2 | Date 22/09/21
10
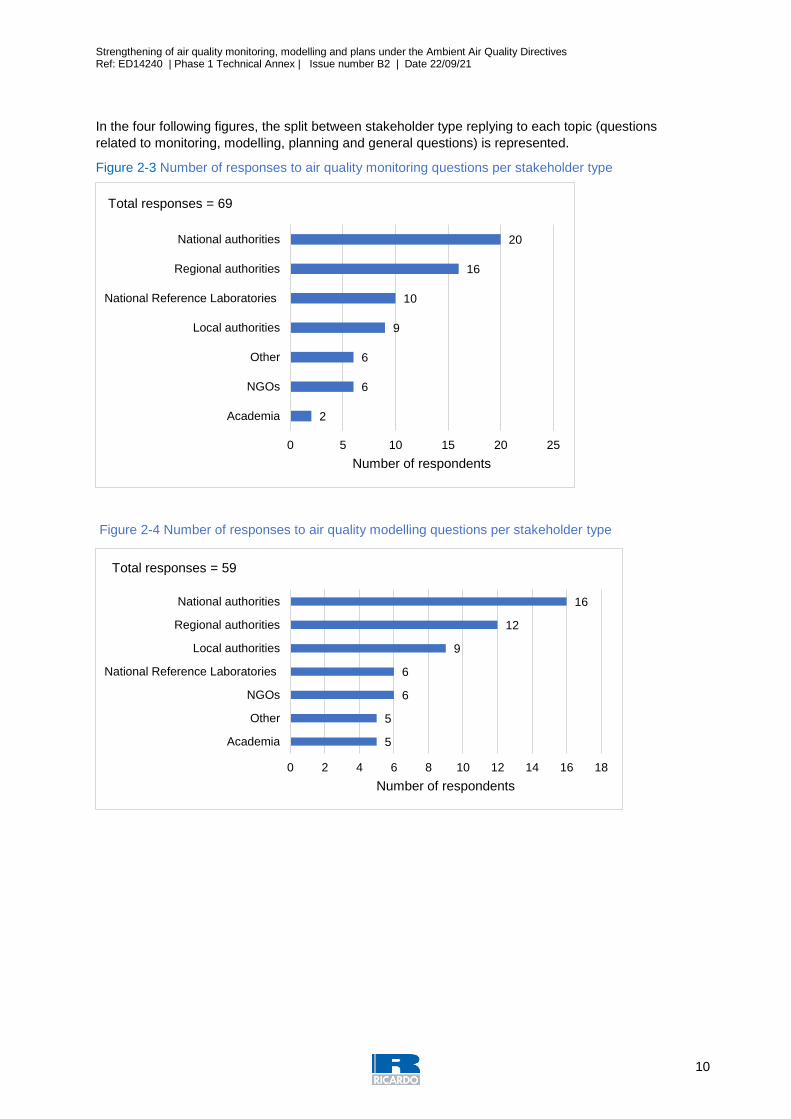
In the four following figures, the split between stakeholder type replying to each topic (questions
related to monitoring, modelling, planning and general questions) is represented.
Figure 2-3 Number of responses to air quality monitoring questions per stakeholder type
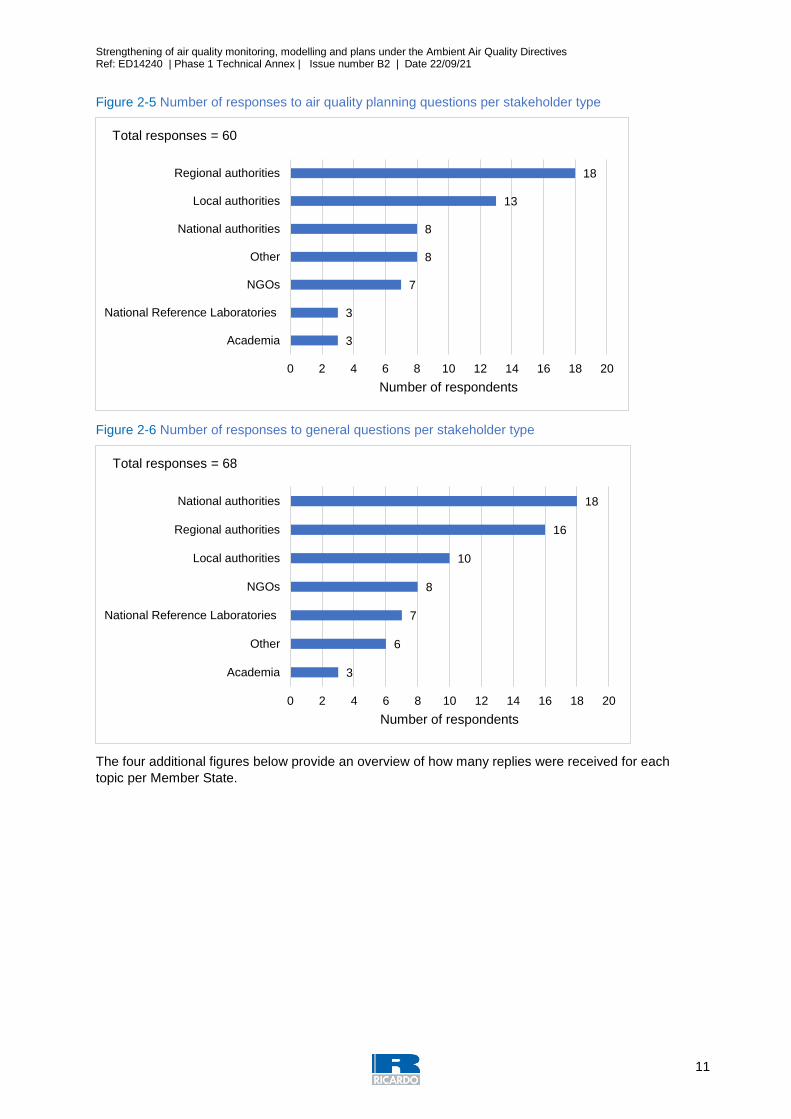
Figure 2-4 Number of responses to air quality modelling questions per stakeholder type
2
6
6
9
10
16
20
0 5 10 15 20 25
Academia
NGOs
Other
Local authorities
National Reference Laboratories
Regional authorities
National authorities
Number of respondents
Total responses = 69
5
5
6
6
9
12
16
0 2 4 6 8 10 12 14 16 18
Academia
Other
NGOs
National Reference Laboratories
Local authorities
Regional authorities
National authorities
Number of respondents
Total responses = 59
Strengthening of air quality monitoring, modelling and plans under the Ambient Air Quality Directives Ref: ED14240 | Phase 1 Technical Annex | Issue number B2 | Date 22/09/21
11
Figure 2-5 Number of responses to air quality planning questions per stakeholder type
Figure 2-6 Number of responses to general questions per stakeholder type
The four additional figures below provide an overview of how many replies were received for each
topic per Member State.
3
3
7
8
8
13
18
0 2 4 6 8 10 12 14 16 18 20
Academia
National Reference Laboratories
NGOs
Other
National authorities
Local authorities
Regional authorities
Number of respondents
Total responses = 60
3
6
7
8
10
16
18
0 2 4 6 8 10 12 14 16 18 20
Academia
Other
National Reference Laboratories
NGOs
Local authorities
Regional authorities
National authorities
Number of respondents
Total responses = 68
Strengthening of air quality monitoring, modelling and plans under the Ambient Air Quality Directives Ref: ED14240 | Phase 1 Technical Annex | Issue number B2 | Date 22/09/21
12
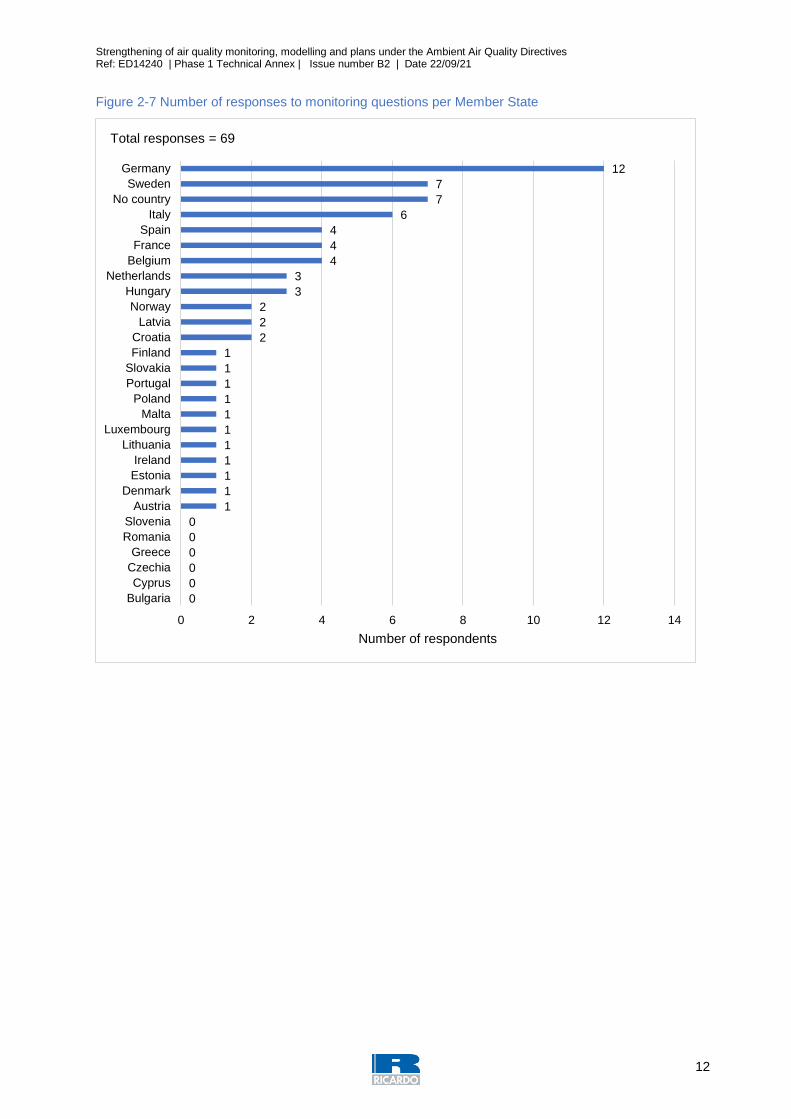
Figure 2-7 Number of responses to monitoring questions per Member State
0
0
0
0
0
0
1
1
1
1
1
1
1
1
1
1
1
2
2
2
3
3
4
4
4
6
7
7
12
0 2 4 6 8 10 12 14
Bulgaria
Cyprus
Czechia
Greece
Romania
Slovenia
Austria
Denmark
Estonia
Ireland
Lithuania
Luxembourg
Malta
Poland
Portugal
Slovakia
Finland
Croatia
Latvia
Norway
Hungary
Netherlands
Belgium
France
Spain
Italy
No country
Sweden
Germany
Number of respondents
Total responses = 69
Strengthening of air quality monitoring, modelling and plans under the Ambient Air Quality Directives Ref: ED14240 | Phase 1 Technical Annex | Issue number B2 | Date 22/09/21
13
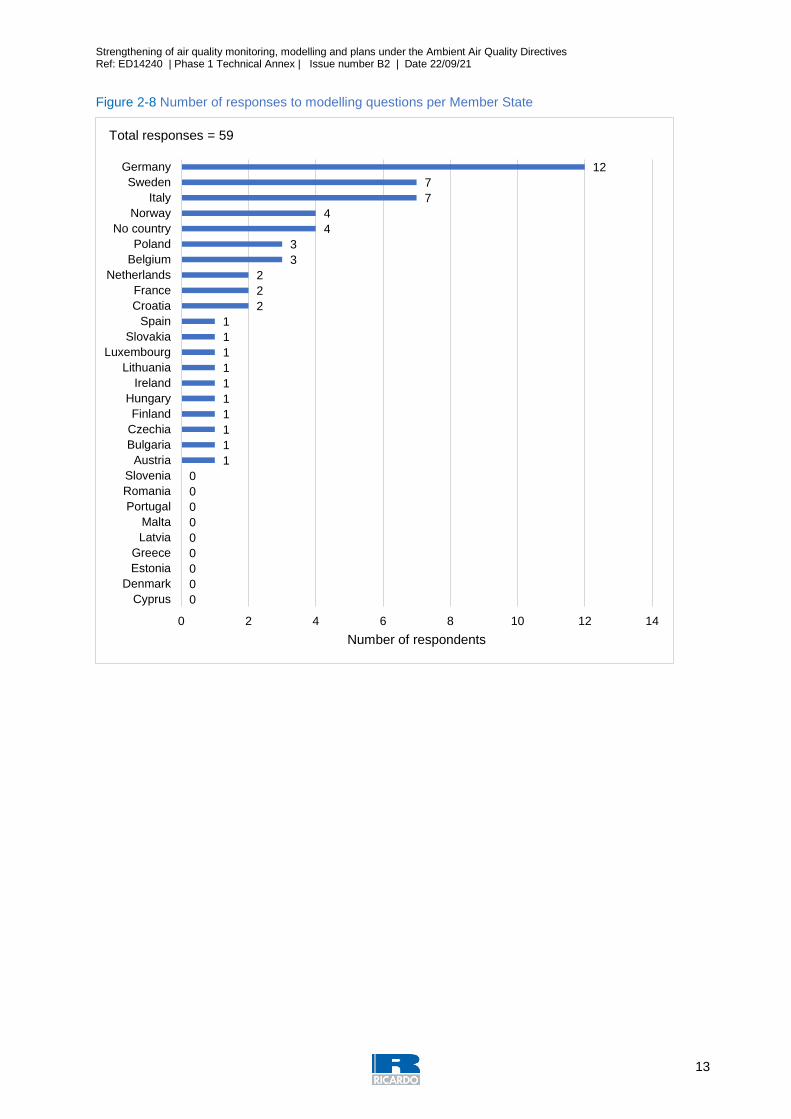
Figure 2-8 Number of responses to modelling questions per Member State
0
0
0
0
0
0
0
0
0
1
1
1
1
1
1
1
1
1
1
2
2
2
3
3
4
4
7
7
12
0 2 4 6 8 10 12 14
Cyprus
Denmark
Estonia
Greece
Latvia
Malta
Portugal
Romania
Slovenia
Austria
Bulgaria
Czechia
Finland
Hungary
Ireland
Lithuania
Luxembourg
Slovakia
Spain
Croatia
France
Netherlands
Belgium
Poland
No country
Norway
Italy
Sweden
Germany
Number of respondents
Total responses = 59
Strengthening of air quality monitoring, modelling and plans under the Ambient Air Quality Directives Ref: ED14240 | Phase 1 Technical Annex | Issue number B2 | Date 22/09/21
14
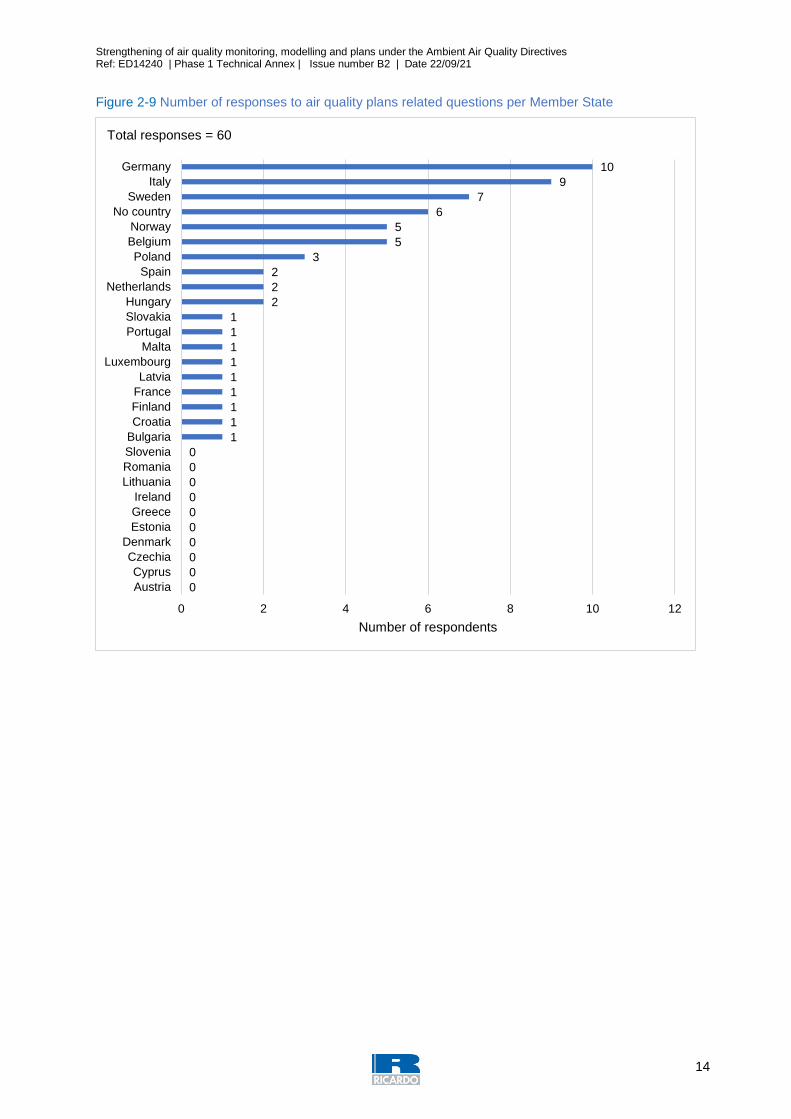
Figure 2-9 Number of responses to air quality plans related questions per Member State
0
0
0
0
0
0
0
0
0
0
1
1
1
1
1
1
1
1
1
2
2
2
3
5
5
6
7
9
10
0 2 4 6 8 10 12
Austria
Cyprus
Czechia
Denmark
Estonia
Greece
Ireland
Lithuania
Romania
Slovenia
Bulgaria
Croatia
Finland
France
Latvia
Luxembourg
Malta
Portugal
Slovakia
Hungary
Netherlands
Spain
Poland
Belgium
Norway
No country
Sweden
Italy
Germany
Number of respondents
Total responses = 60
Strengthening of air quality monitoring, modelling and plans under the Ambient Air Quality Directives Ref: ED14240 | Phase 1 Technical Annex | Issue number B2 | Date 22/09/21
15
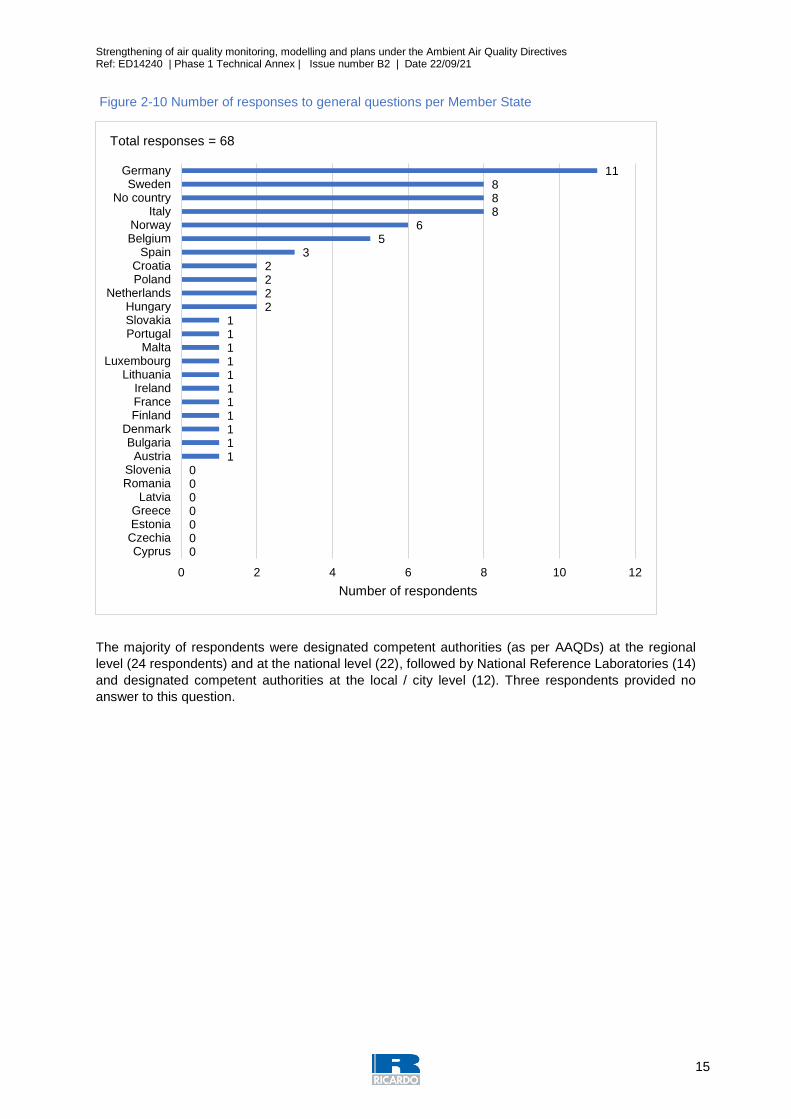
Figure 2-10 Number of responses to general questions per Member State
The majority of respondents were designated competent authorities (as per AAQDs) at the regional
level (24 respondents) and at the national level (22), followed by National Reference Laboratories (14)
and designated competent authorities at the local / city level (12). Three respondents provided no
answer to this question.
0000000
11111111111
2222
35
6888
11
0 2 4 6 8 10 12
CyprusCzechiaEstoniaGreece
LatviaRomaniaSlovenia
AustriaBulgaria
DenmarkFinlandFranceIreland
LithuaniaLuxembourg
MaltaPortugalSlovakiaHungary
NetherlandsPolandCroatia
SpainBelgiumNorway
ItalyNo country
SwedenGermany
Number of respondents
Total responses = 68
Strengthening of air quality monitoring, modelling and plans under the Ambient Air Quality Directives Ref: ED14240 | Phase 1 Technical Annex | Issue number B2 | Date 22/09/21
16
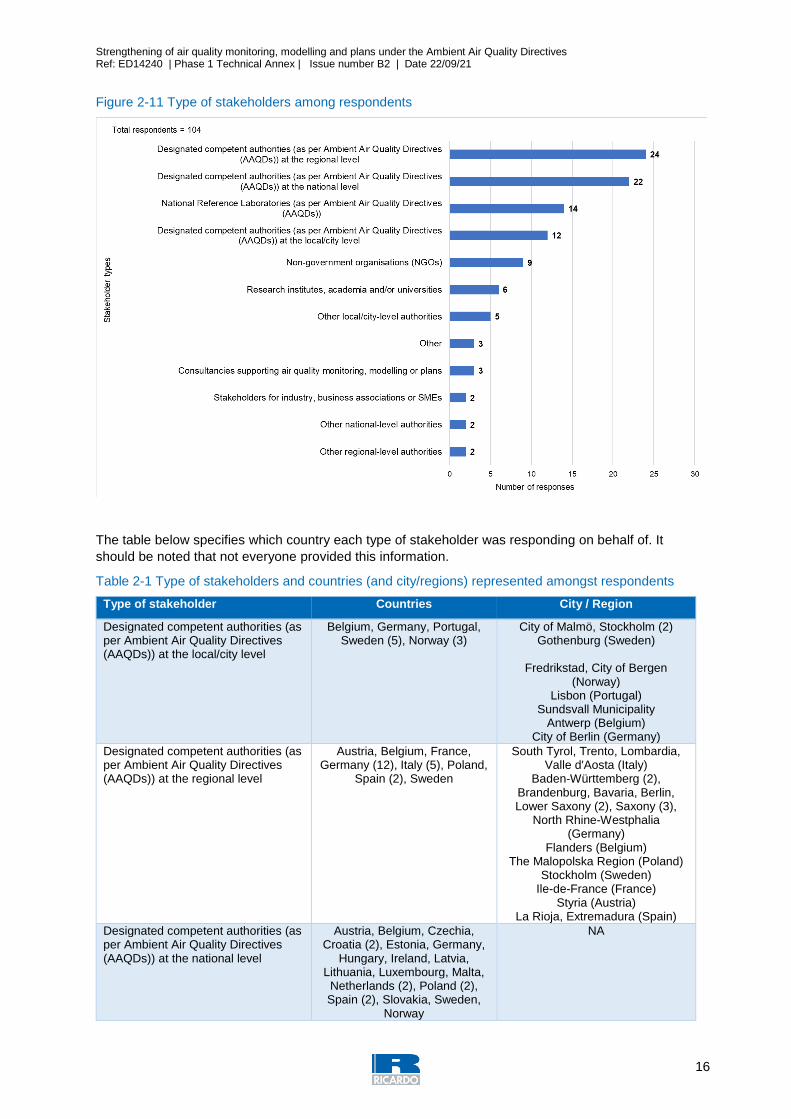
Figure 2-11 Type of stakeholders among respondents
The table below specifies which country each type of stakeholder was responding on behalf of. It
should be noted that not everyone provided this information.
Table 2-1 Type of stakeholders and countries (and city/regions) represented amongst respondents
Type of stakeholder Countries City / Region
Designated competent authorities (as per Ambient Air Quality Directives (AAQDs)) at the local/city level
Belgium, Germany, Portugal, Sweden (5), Norway (3)
City of Malmö, Stockholm (2) Gothenburg (Sweden)
Fredrikstad, City of Bergen
(Norway) Lisbon (Portugal)
Sundsvall Municipality Antwerp (Belgium)
City of Berlin (Germany)
Designated competent authorities (as per Ambient Air Quality Directives (AAQDs)) at the regional level
Austria, Belgium, France, Germany (12), Italy (5), Poland,
Spain (2), Sweden
South Tyrol, Trento, Lombardia, Valle d'Aosta (Italy)
Baden-Württemberg (2), Brandenburg, Bavaria, Berlin, Lower Saxony (2), Saxony (3),
North Rhine-Westphalia (Germany)
Flanders (Belgium) The Malopolska Region (Poland)
Stockholm (Sweden) Ile-de-France (France)
Styria (Austria) La Rioja, Extremadura (Spain)
Designated competent authorities (as per Ambient Air Quality Directives (AAQDs)) at the national level
Austria, Belgium, Czechia, Croatia (2), Estonia, Germany,
Hungary, Ireland, Latvia, Lithuania, Luxembourg, Malta,
Netherlands (2), Poland (2), Spain (2), Slovakia, Sweden,
Norway
NA

Strengthening of air quality monitoring, modelling and plans under the Ambient Air Quality Directives Ref: ED14240 | Phase 1 Technical Annex | Issue number B2 | Date 22/09/21
17
Other local/city-level authorities Hungary, Italy, Latvia, Sweden, Norway
Drammen (Norway), City of Milan (Italy), Budapest (Hungary), Riga
(Latvia)
Other regional-level authorities Germany, Sweden Västra Götaland (Sweden), North Rhine-Westphalia
(Germany)
Other national-level authorities Croatia, Sweden NA
National Reference Laboratories (as per Ambient Air Quality Directives (AAQDs))
Belgium, Croatia, Denmark, France (2), Germany, Italy (2), Netherlands (3), Sweden (2),
Norway
NA
Consultancies supporting air quality monitoring, modelling or plans
Finland, Italy, Poland NA
Research institutes, academia and/or universities
Bulgaria, Italy, Sweden, Norway NA
Non-government organisations (NGOs)
Belgium (2), France, Germany, Hungary, Italy
NA
Stakeholders for industry, business associations or SMEs
Belgium (2) NA
Other Hungary (2) NA
Several survey respondents (61) belonged to a specific air quality expert network or group with
several (15) of the respondents being part of more than one network.
Figure 2-12. Respondents by expert networks
17
19
25
29
40
0 5 10 15 20 25 30 35 40 45
CAMS - Copernicus Atmosphere MonitoringService
IPR TECHNICAL GROUP – Implementing Provisions on Reporting
AQUILA - Network of National Air QualityReference Laboratories
EIONET - European Environment Information andObservation Network
FAIRMODE - Forum for Air quality Modelling
Number of respondents
Ne
two
rks
Total respondents = 61
Strengthening of air quality monitoring, modelling and plans under the Ambient Air Quality Directives Ref: ED14240 | Phase 1 Technical Annex | Issue number B2 | Date 22/09/21
18
Most respondents (90) indicated the sector that they are active in. The majority of respondents (36) belong to the public administration sector or the professional / scientific sphere (27).
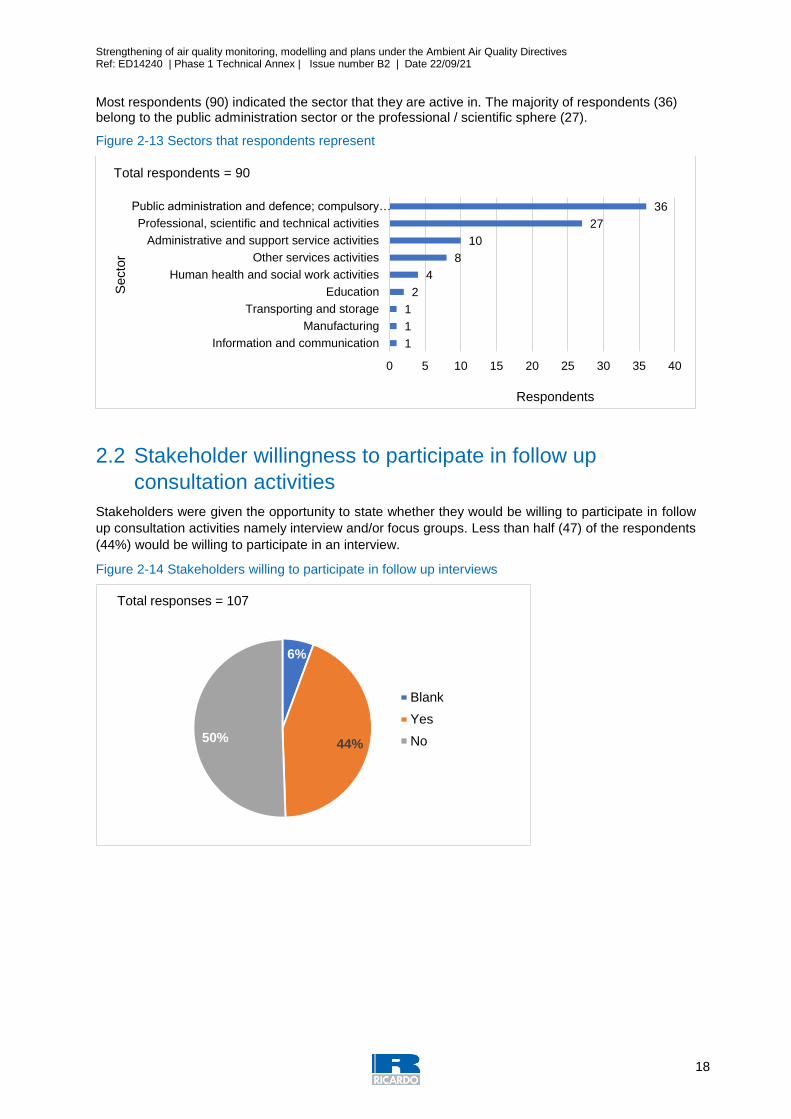
Figure 2-13 Sectors that respondents represent
2.2 Stakeholder willingness to participate in follow up
consultation activities
Stakeholders were given the opportunity to state whether they would be willing to participate in follow
up consultation activities namely interview and/or focus groups. Less than half (47) of the respondents
(44%) would be willing to participate in an interview.
Figure 2-14 Stakeholders willing to participate in follow up interviews
1
1
1
2
4
8
10
27
36
0 5 10 15 20 25 30 35 40
Information and communication
Manufacturing
Transporting and storage
Education
Human health and social work activities
Other services activities
Administrative and support service activities
Professional, scientific and technical activities
Public administration and defence; compulsory…
Respondents
Secto
r
Total respondents = 90
6%
44%50%
Total responses = 107
Blank
Yes
No
Strengthening of air quality monitoring, modelling and plans under the Ambient Air Quality Directives Ref: ED14240 | Phase 1 Technical Annex | Issue number B2 | Date 22/09/21
19
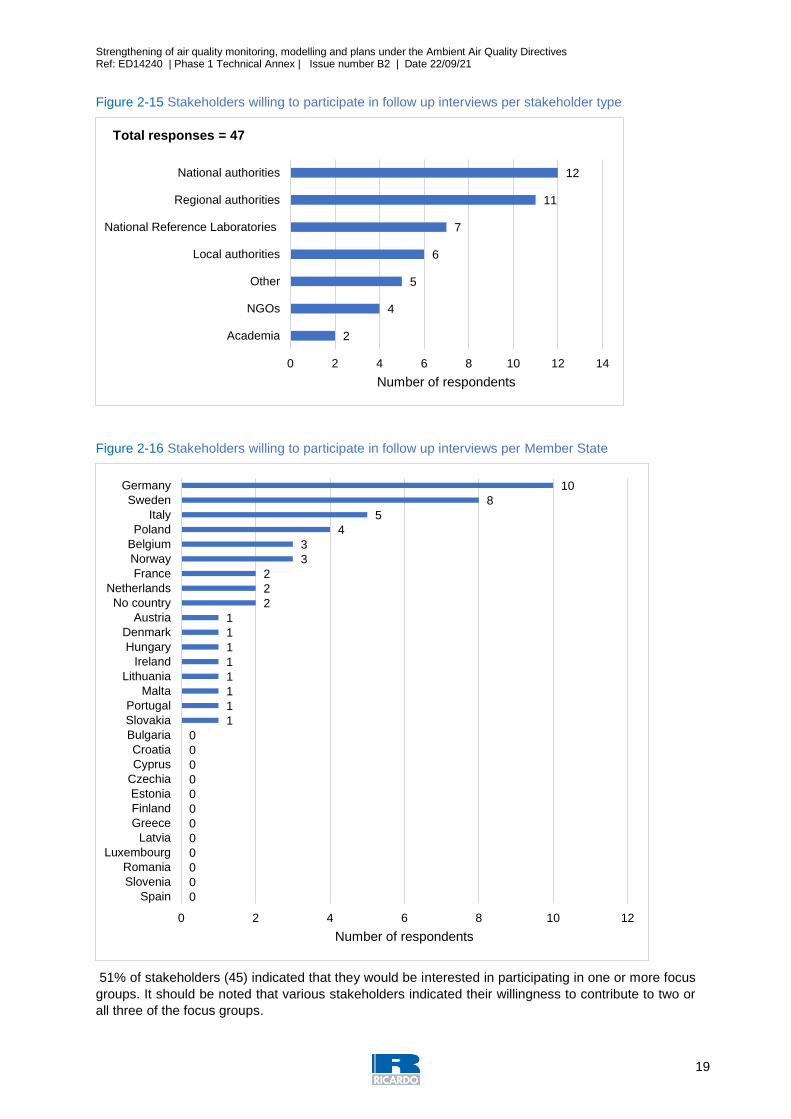
Figure 2-15 Stakeholders willing to participate in follow up interviews per stakeholder type
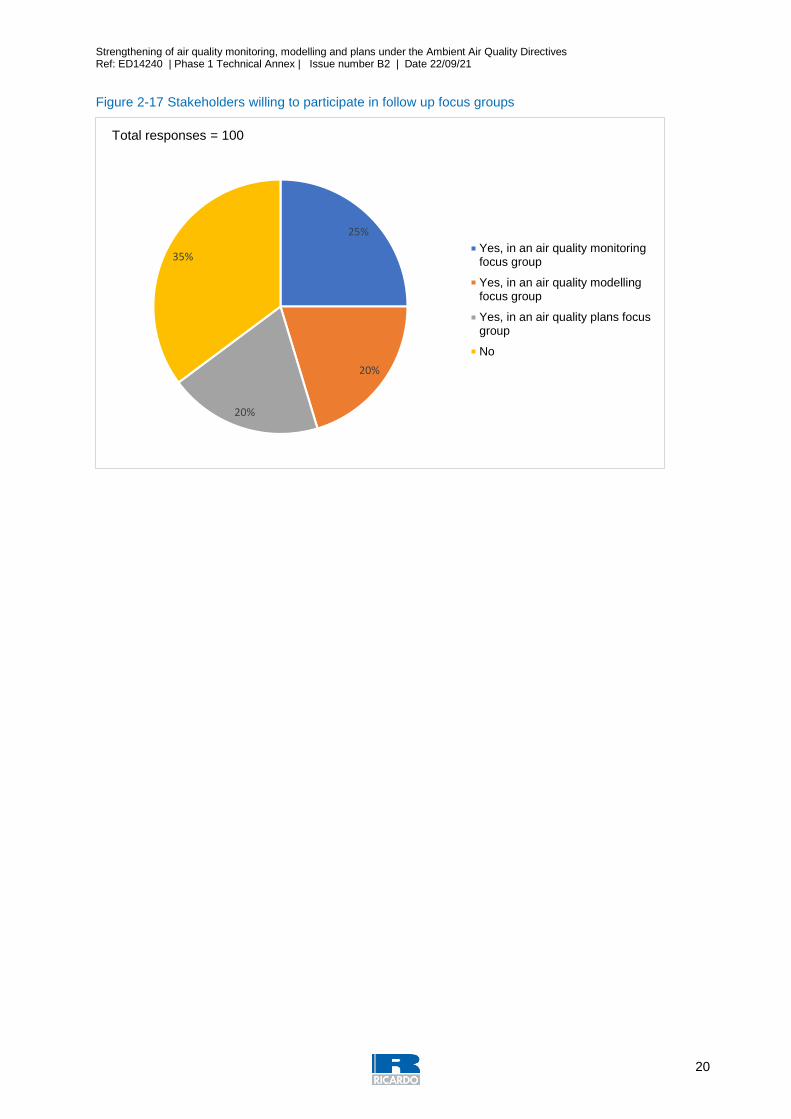
Figure 2-16 Stakeholders willing to participate in follow up interviews per Member State
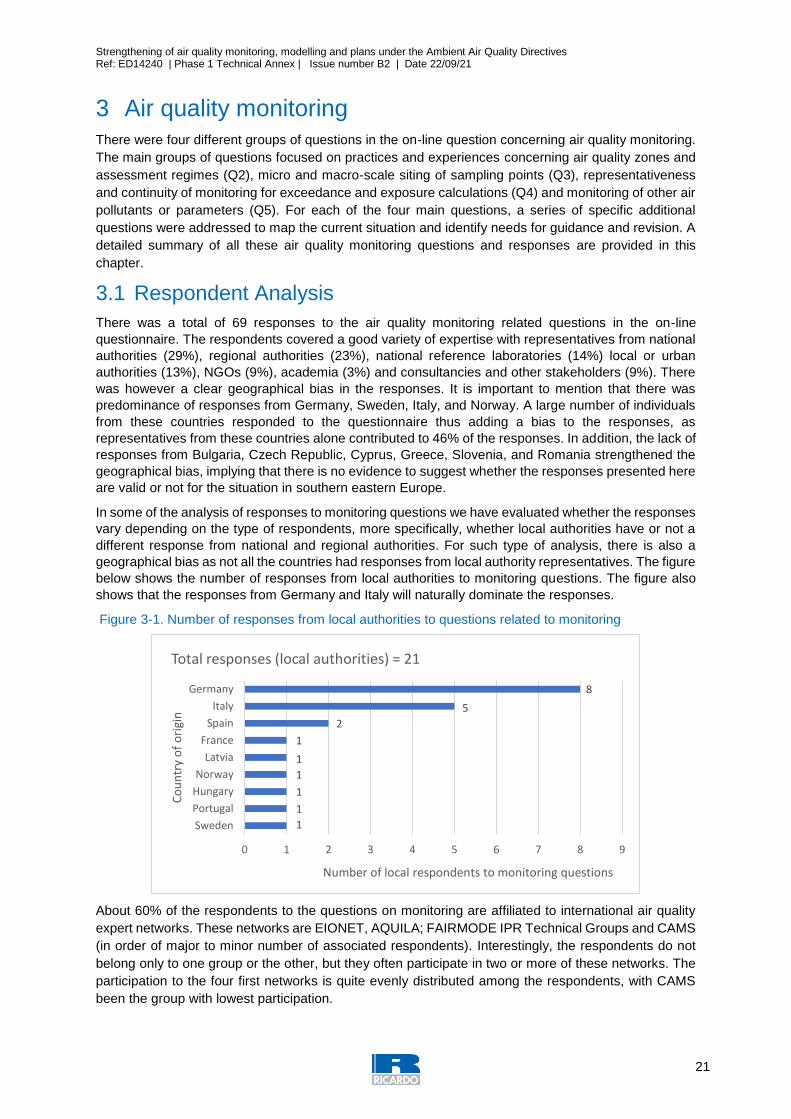
51% of stakeholders (45) indicated that they would be interested in participating in one or more focus
groups. It should be noted that various stakeholders indicated their willingness to contribute to two or
all three of the focus groups.
2
4
5
6
7
11
12
0 2 4 6 8 10 12 14
Academia
NGOs
Other
Local authorities
National Reference Laboratories
Regional authorities
National authorities
Number of respondents
Total responses = 47
0
0
0
0
0
0
0
0
0
0
0
0
1
1
1
1
1
1
1
1
2
2
2
3
3
4
5
8
10
0 2 4 6 8 10 12
Spain
Slovenia
Romania
Luxembourg
Latvia
Greece
Finland
Estonia
Czechia
Cyprus
Croatia
Bulgaria
Slovakia
Portugal
Malta
Lithuania
Ireland
Hungary
Denmark
Austria
No country
Netherlands
France
Norway
Belgium
Poland
Italy
Sweden
Germany
Number of respondents
Strengthening of air quality monitoring, modelling and plans under the Ambient Air Quality Directives Ref: ED14240 | Phase 1 Technical Annex | Issue number B2 | Date 22/09/21
20
Figure 2-17 Stakeholders willing to participate in follow up focus groups
25%
20%
20%
35%
Total responses = 100
Yes, in an air quality monitoringfocus group
Yes, in an air quality modellingfocus group
Yes, in an air quality plans focusgroup
No
Strengthening of air quality monitoring, modelling and plans under the Ambient Air Quality Directives Ref: ED14240 | Phase 1 Technical Annex | Issue number B2 | Date 22/09/21
21
3 Air quality monitoring There were four different groups of questions in the on-line question concerning air quality monitoring.
The main groups of questions focused on practices and experiences concerning air quality zones and
assessment regimes (Q2), micro and macro-scale siting of sampling points (Q3), representativeness
and continuity of monitoring for exceedance and exposure calculations (Q4) and monitoring of other air
pollutants or parameters (Q5). For each of the four main questions, a series of specific additional
questions were addressed to map the current situation and identify needs for guidance and revision. A
detailed summary of all these air quality monitoring questions and responses are provided in this
chapter.
3.1 Respondent Analysis
There was a total of 69 responses to the air quality monitoring related questions in the on-line
questionnaire. The respondents covered a good variety of expertise with representatives from national
authorities (29%), regional authorities (23%), national reference laboratories (14%) local or urban
authorities (13%), NGOs (9%), academia (3%) and consultancies and other stakeholders (9%). There
was however a clear geographical bias in the responses. It is important to mention that there was
predominance of responses from Germany, Sweden, Italy, and Norway. A large number of individuals
from these countries responded to the questionnaire thus adding a bias to the responses, as
representatives from these countries alone contributed to 46% of the responses. In addition, the lack of
responses from Bulgaria, Czech Republic, Cyprus, Greece, Slovenia, and Romania strengthened the
geographical bias, implying that there is no evidence to suggest whether the responses presented here
are valid or not for the situation in southern eastern Europe.
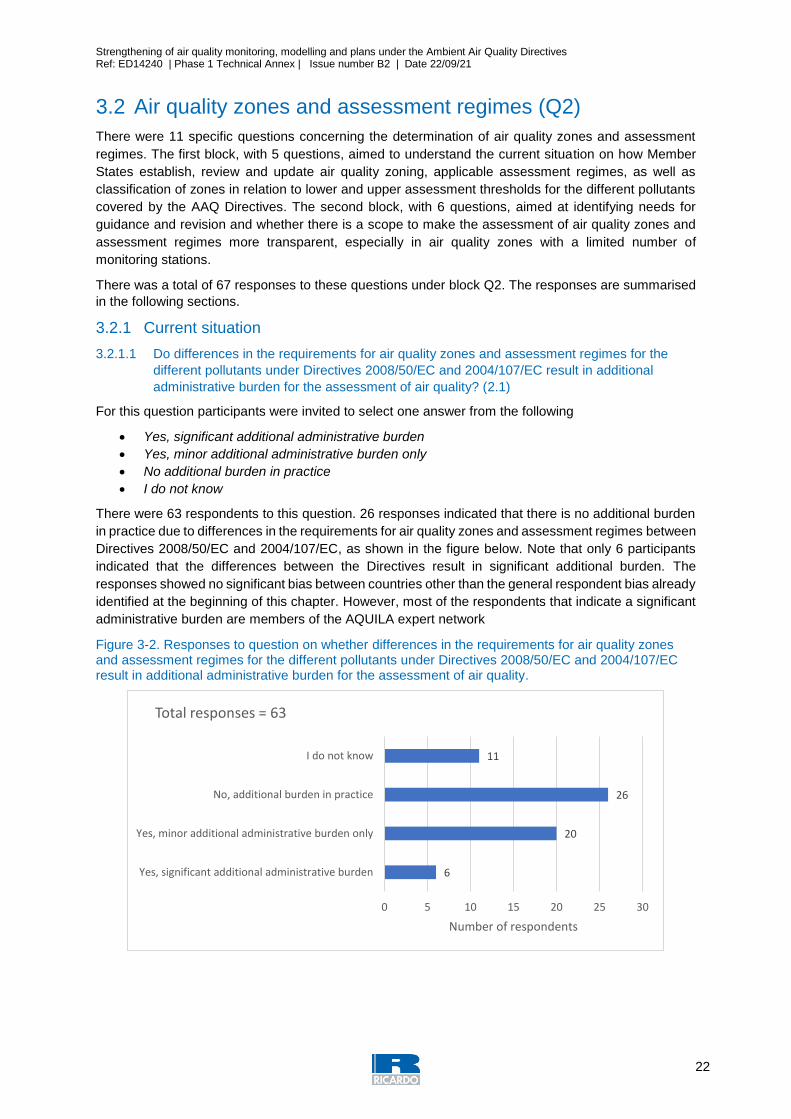
In some of the analysis of responses to monitoring questions we have evaluated whether the responses
vary depending on the type of respondents, more specifically, whether local authorities have or not a
different response from national and regional authorities. For such type of analysis, there is also a
geographical bias as not all the countries had responses from local authority representatives. The figure
below shows the number of responses from local authorities to monitoring questions. The figure also
shows that the responses from Germany and Italy will naturally dominate the responses.
Figure 3-1. Number of responses from local authorities to questions related to monitoring
About 60% of the respondents to the questions on monitoring are affiliated to international air quality
expert networks. These networks are EIONET, AQUILA; FAIRMODE IPR Technical Groups and CAMS
(in order of major to minor number of associated respondents). Interestingly, the respondents do not
belong only to one group or the other, but they often participate in two or more of these networks. The
participation to the four first networks is quite evenly distributed among the respondents, with CAMS
been the group with lowest participation.
1
1
1
1
1
1
2
5
8
0 1 2 3 4 5 6 7 8 9
Sweden
Portugal
Hungary
Norway
Latvia
France
Spain
Italy
Germany
Number of local respondents to monitoring questions
Co
un
try
of
ori
gin
Total responses (local authorities) = 21
Strengthening of air quality monitoring, modelling and plans under the Ambient Air Quality Directives Ref: ED14240 | Phase 1 Technical Annex | Issue number B2 | Date 22/09/21
22
3.2 Air quality zones and assessment regimes (Q2)
There were 11 specific questions concerning the determination of air quality zones and assessment
regimes. The first block, with 5 questions, aimed to understand the current situation on how Member
States establish, review and update air quality zoning, applicable assessment regimes, as well as
classification of zones in relation to lower and upper assessment thresholds for the different pollutants
covered by the AAQ Directives. The second block, with 6 questions, aimed at identifying needs for
guidance and revision and whether there is a scope to make the assessment of air quality zones and
assessment regimes more transparent, especially in air quality zones with a limited number of
monitoring stations.
There was a total of 67 responses to these questions under block Q2. The responses are summarised
in the following sections.
3.2.1 Current situation
3.2.1.1 Do differences in the requirements for air quality zones and assessment regimes for the
different pollutants under Directives 2008/50/EC and 2004/107/EC result in additional
administrative burden for the assessment of air quality? (2.1)
For this question participants were invited to select one answer from the following
Yes, significant additional administrative burden
Yes, minor additional administrative burden only
No additional burden in practice
I do not know
There were 63 respondents to this question. 26 responses indicated that there is no additional burden
in practice due to differences in the requirements for air quality zones and assessment regimes between
Directives 2008/50/EC and 2004/107/EC, as shown in the figure below. Note that only 6 participants
indicated that the differences between the Directives result in significant additional burden. The
responses showed no significant bias between countries other than the general respondent bias already
identified at the beginning of this chapter. However, most of the respondents that indicate a significant
administrative burden are members of the AQUILA expert network
Figure 3-2. Responses to question on whether differences in the requirements for air quality zones and assessment regimes for the different pollutants under Directives 2008/50/EC and 2004/107/EC result in additional administrative burden for the assessment of air quality.
6
20
26
11
0 5 10 15 20 25 30
Yes, significant additional administrative burden
Yes, minor additional administrative burden only
No, additional burden in practice
I do not know
Number of respondents
Total responses = 63
Strengthening of air quality monitoring, modelling and plans under the Ambient Air Quality Directives Ref: ED14240 | Phase 1 Technical Annex | Issue number B2 | Date 22/09/21
23
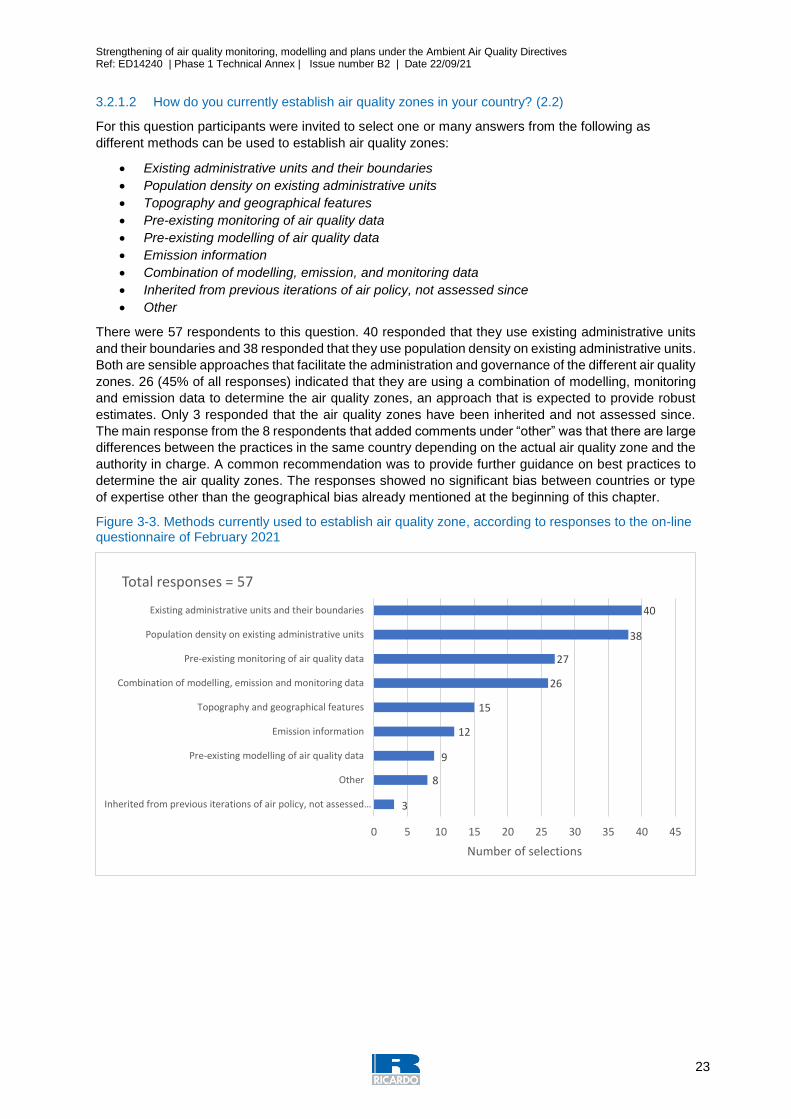
3.2.1.2 How do you currently establish air quality zones in your country? (2.2)
For this question participants were invited to select one or many answers from the following as
different methods can be used to establish air quality zones:
Existing administrative units and their boundaries
Population density on existing administrative units
Topography and geographical features
Pre-existing monitoring of air quality data
Pre-existing modelling of air quality data
Emission information
Combination of modelling, emission, and monitoring data
Inherited from previous iterations of air policy, not assessed since
Other
There were 57 respondents to this question. 40 responded that they use existing administrative units
and their boundaries and 38 responded that they use population density on existing administrative units.
Both are sensible approaches that facilitate the administration and governance of the different air quality
zones. 26 (45% of all responses) indicated that they are using a combination of modelling, monitoring
and emission data to determine the air quality zones, an approach that is expected to provide robust
estimates. Only 3 responded that the air quality zones have been inherited and not assessed since.
The main response from the 8 respondents that added comments under “other” was that there are large
differences between the practices in the same country depending on the actual air quality zone and the
authority in charge. A common recommendation was to provide further guidance on best practices to
determine the air quality zones. The responses showed no significant bias between countries or type
of expertise other than the geographical bias already mentioned at the beginning of this chapter.
Figure 3-3. Methods currently used to establish air quality zone, according to responses to the on-line questionnaire of February 2021
3
8
9
12
15
26
27
38
40
0 5 10 15 20 25 30 35 40 45
Inherited from previous iterations of air policy, not assessed…
Other
Pre-existing modelling of air quality data
Emission information
Topography and geographical features
Combination of modelling, emission and monitoring data
Pre-existing monitoring of air quality data
Population density on existing administrative units
Existing administrative units and their boundaries
Number of selections
Total responses = 57
Strengthening of air quality monitoring, modelling and plans under the Ambient Air Quality Directives Ref: ED14240 | Phase 1 Technical Annex | Issue number B2 | Date 22/09/21
24
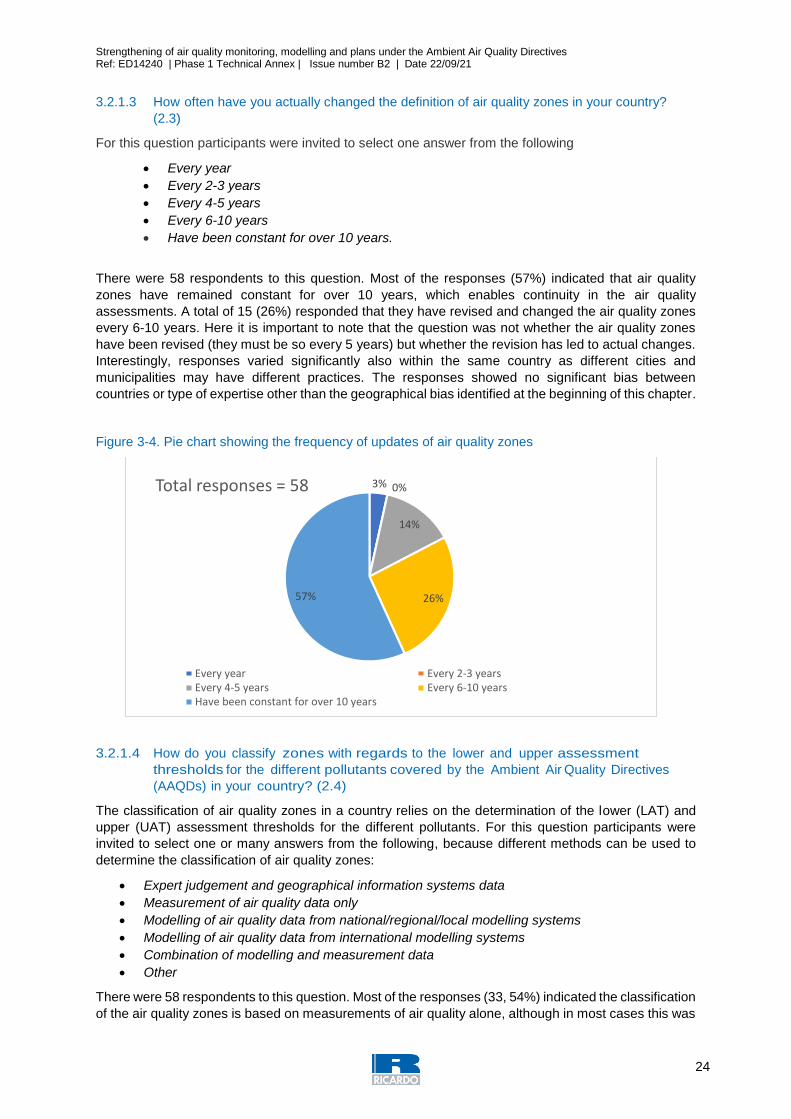
3.2.1.3 How often have you actually changed the definition of air quality zones in your country?
(2.3)
For this question participants were invited to select one answer from the following
Every year
Every 2-3 years
Every 4-5 years
Every 6-10 years
Have been constant for over 10 years.
There were 58 respondents to this question. Most of the responses (57%) indicated that air quality
zones have remained constant for over 10 years, which enables continuity in the air quality
assessments. A total of 15 (26%) responded that they have revised and changed the air quality zones
every 6-10 years. Here it is important to note that the question was not whether the air quality zones
have been revised (they must be so every 5 years) but whether the revision has led to actual changes.
Interestingly, responses varied significantly also within the same country as different cities and
municipalities may have different practices. The responses showed no significant bias between
countries or type of expertise other than the geographical bias identified at the beginning of this chapter.
Figure 3-4. Pie chart showing the frequency of updates of air quality zones
3.2.1.4 How do you classify zones with regards to the lower and upper assessment
thresholds for the different pollutants covered by the Ambient Air Quality Directives
(AAQDs) in your country? (2.4)
The classification of air quality zones in a country relies on the determination of the lower (LAT) and
upper (UAT) assessment thresholds for the different pollutants. For this question participants were
invited to select one or many answers from the following, because different methods can be used to
determine the classification of air quality zones:
Expert judgement and geographical information systems data
Measurement of air quality data only
Modelling of air quality data from national/regional/local modelling systems
Modelling of air quality data from international modelling systems
Combination of modelling and measurement data
Other
There were 58 respondents to this question. Most of the responses (33, 54%) indicated the classification
of the air quality zones is based on measurements of air quality alone, although in most cases this was
3% 0%
14%
26%57%
Total responses = 58
Every year Every 2-3 yearsEvery 4-5 years Every 6-10 yearsHave been constant for over 10 years
Strengthening of air quality monitoring, modelling and plans under the Ambient Air Quality Directives Ref: ED14240 | Phase 1 Technical Annex | Issue number B2 | Date 22/09/21
25
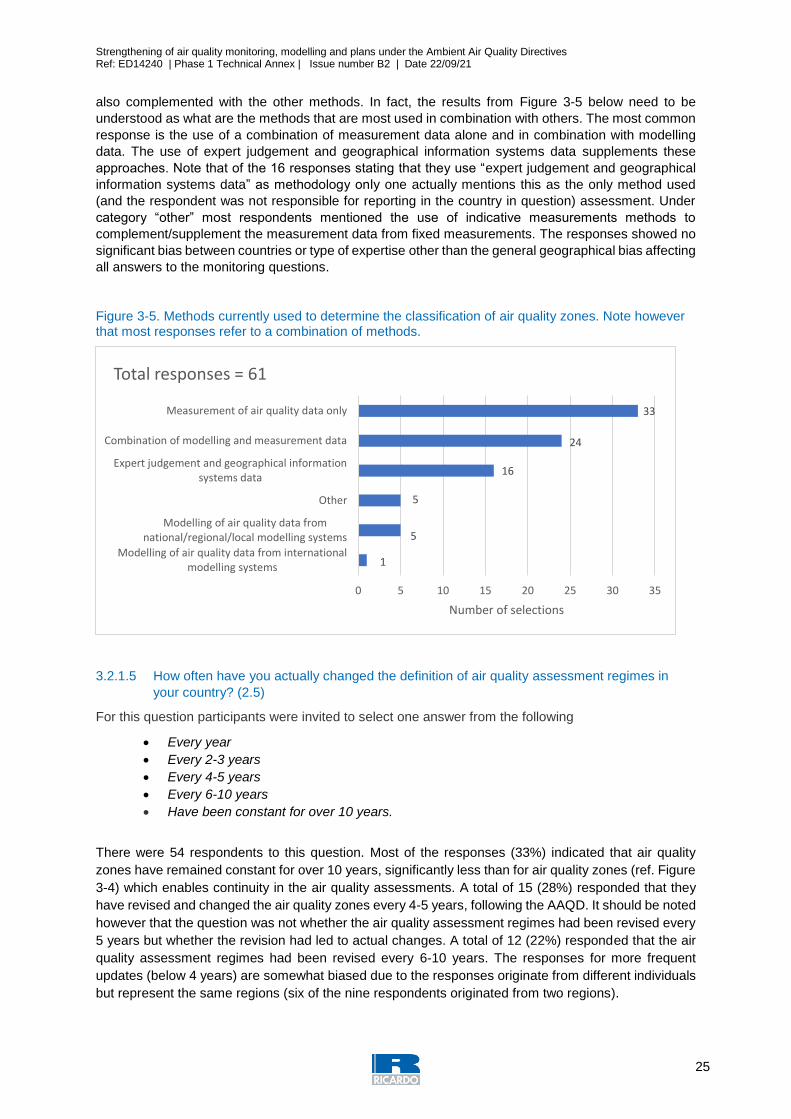
also complemented with the other methods. In fact, the results from Figure 3-5 below need to be
understood as what are the methods that are most used in combination with others. The most common
response is the use of a combination of measurement data alone and in combination with modelling
data. The use of expert judgement and geographical information systems data supplements these
approaches. Note that of the 16 responses stating that they use “expert judgement and geographical
information systems data” as methodology only one actually mentions this as the only method used
(and the respondent was not responsible for reporting in the country in question) assessment. Under
category “other” most respondents mentioned the use of indicative measurements methods to
complement/supplement the measurement data from fixed measurements. The responses showed no
significant bias between countries or type of expertise other than the general geographical bias affecting
all answers to the monitoring questions.
Figure 3-5. Methods currently used to determine the classification of air quality zones. Note however that most responses refer to a combination of methods.
3.2.1.5 How often have you actually changed the definition of air quality assessment regimes in
your country? (2.5)
For this question participants were invited to select one answer from the following
Every year
Every 2-3 years
Every 4-5 years
Every 6-10 years
Have been constant for over 10 years.
There were 54 respondents to this question. Most of the responses (33%) indicated that air quality
zones have remained constant for over 10 years, significantly less than for air quality zones (ref. Figure
3-4) which enables continuity in the air quality assessments. A total of 15 (28%) responded that they
have revised and changed the air quality zones every 4-5 years, following the AAQD. It should be noted
however that the question was not whether the air quality assessment regimes had been revised every
5 years but whether the revision had led to actual changes. A total of 12 (22%) responded that the air
quality assessment regimes had been revised every 6-10 years. The responses for more frequent
updates (below 4 years) are somewhat biased due to the responses originate from different individuals
but represent the same regions (six of the nine respondents originated from two regions).
1
5
5
16
24
33
0 5 10 15 20 25 30 35
Modelling of air quality data from internationalmodelling systems
Modelling of air quality data fromnational/regional/local modelling systems
Other
Expert judgement and geographical informationsystems data
Combination of modelling and measurement data
Measurement of air quality data only
Number of selections
Total responses = 61
Strengthening of air quality monitoring, modelling and plans under the Ambient Air Quality Directives Ref: ED14240 | Phase 1 Technical Annex | Issue number B2 | Date 22/09/21
26
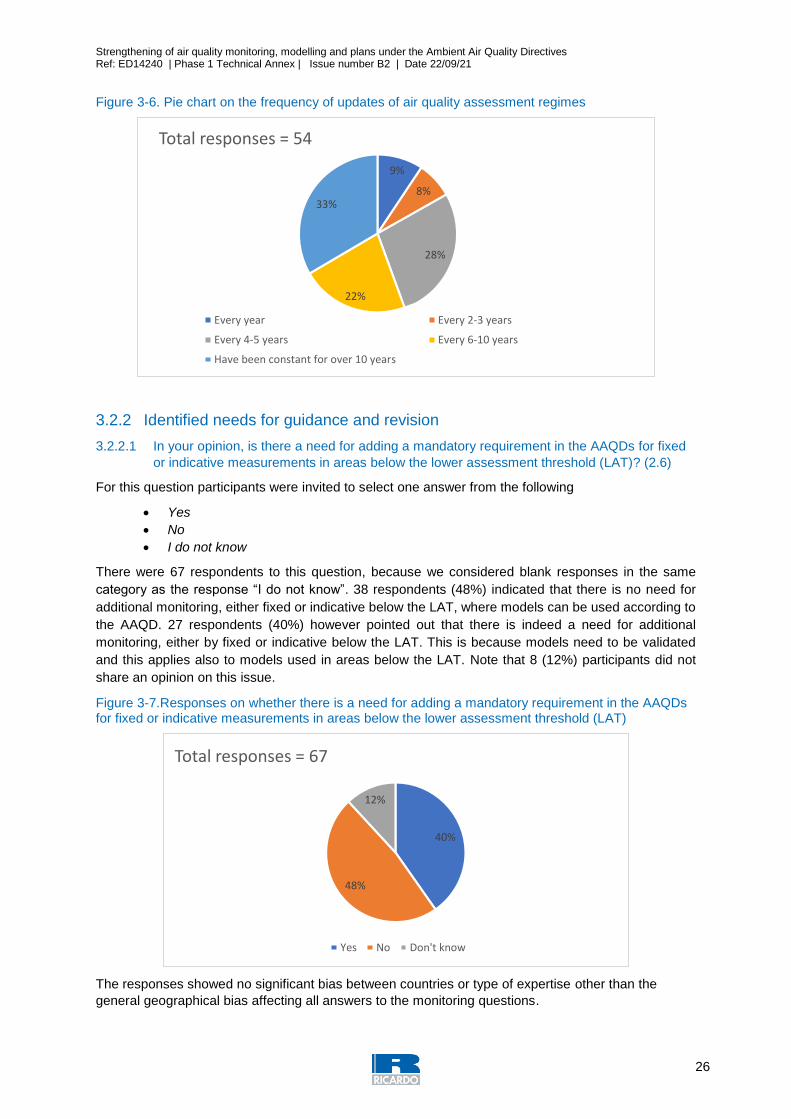
Figure 3-6. Pie chart on the frequency of updates of air quality assessment regimes
3.2.2 Identified needs for guidance and revision
3.2.2.1 In your opinion, is there a need for adding a mandatory requirement in the AAQDs for fixed
or indicative measurements in areas below the lower assessment threshold (LAT)? (2.6)
For this question participants were invited to select one answer from the following
Yes
No
I do not know
There were 67 respondents to this question, because we considered blank responses in the same
category as the response “I do not know”. 38 respondents (48%) indicated that there is no need for
additional monitoring, either fixed or indicative below the LAT, where models can be used according to
the AAQD. 27 respondents (40%) however pointed out that there is indeed a need for additional
monitoring, either by fixed or indicative below the LAT. This is because models need to be validated
and this applies also to models used in areas below the LAT. Note that 8 (12%) participants did not
share an opinion on this issue.
Figure 3-7.Responses on whether there is a need for adding a mandatory requirement in the AAQDs for fixed or indicative measurements in areas below the lower assessment threshold (LAT)
The responses showed no significant bias between countries or type of expertise other than the
general geographical bias affecting all answers to the monitoring questions.
9%
8%
28%
22%
33%
Total responses = 54
Every year Every 2-3 years
Every 4-5 years Every 6-10 years
Have been constant for over 10 years
40%
48%
12%
Total responses = 67
Yes No Don't know
Strengthening of air quality monitoring, modelling and plans under the Ambient Air Quality Directives Ref: ED14240 | Phase 1 Technical Annex | Issue number B2 | Date 22/09/21
27
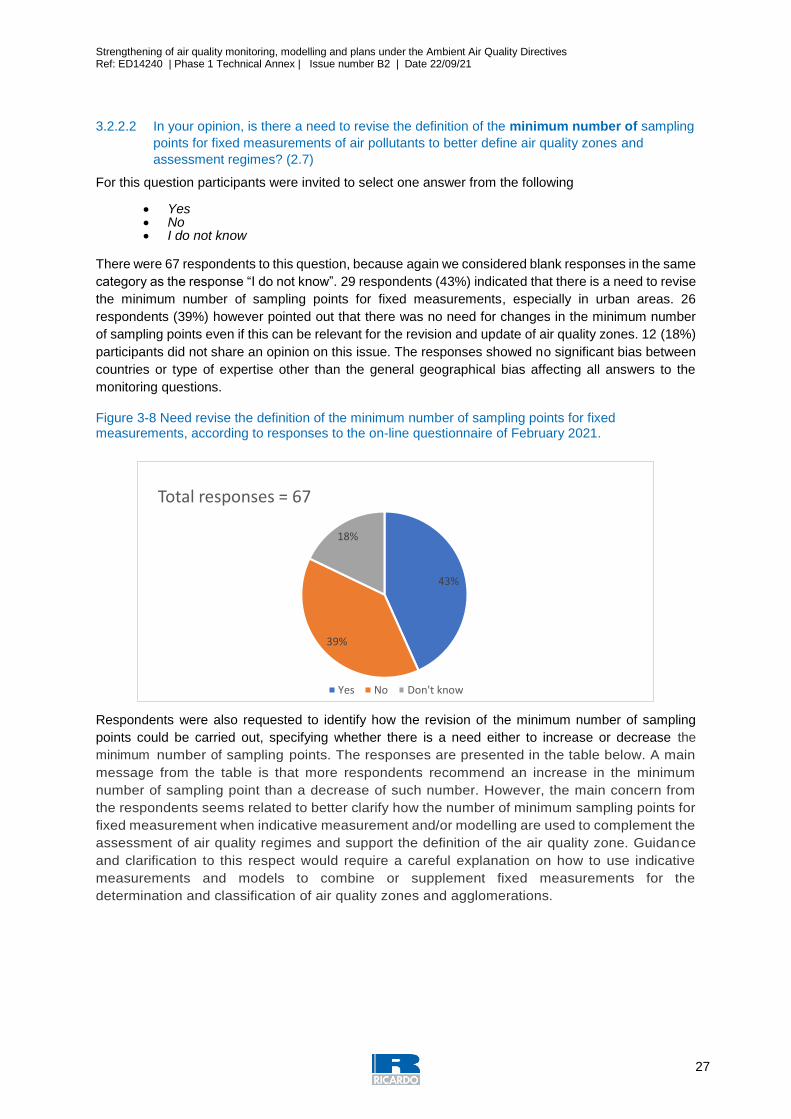
3.2.2.2 In your opinion, is there a need to revise the definition of the minimum number of sampling
points for fixed measurements of air pollutants to better define air quality zones and
assessment regimes? (2.7)
For this question participants were invited to select one answer from the following
Yes No I do not know
There were 67 respondents to this question, because again we considered blank responses in the same
category as the response “I do not know”. 29 respondents (43%) indicated that there is a need to revise
the minimum number of sampling points for fixed measurements, especially in urban areas. 26
respondents (39%) however pointed out that there was no need for changes in the minimum number
of sampling points even if this can be relevant for the revision and update of air quality zones. 12 (18%)
participants did not share an opinion on this issue. The responses showed no significant bias between
countries or type of expertise other than the general geographical bias affecting all answers to the
monitoring questions.
Figure 3-8 Need revise the definition of the minimum number of sampling points for fixed measurements, according to responses to the on-line questionnaire of February 2021.
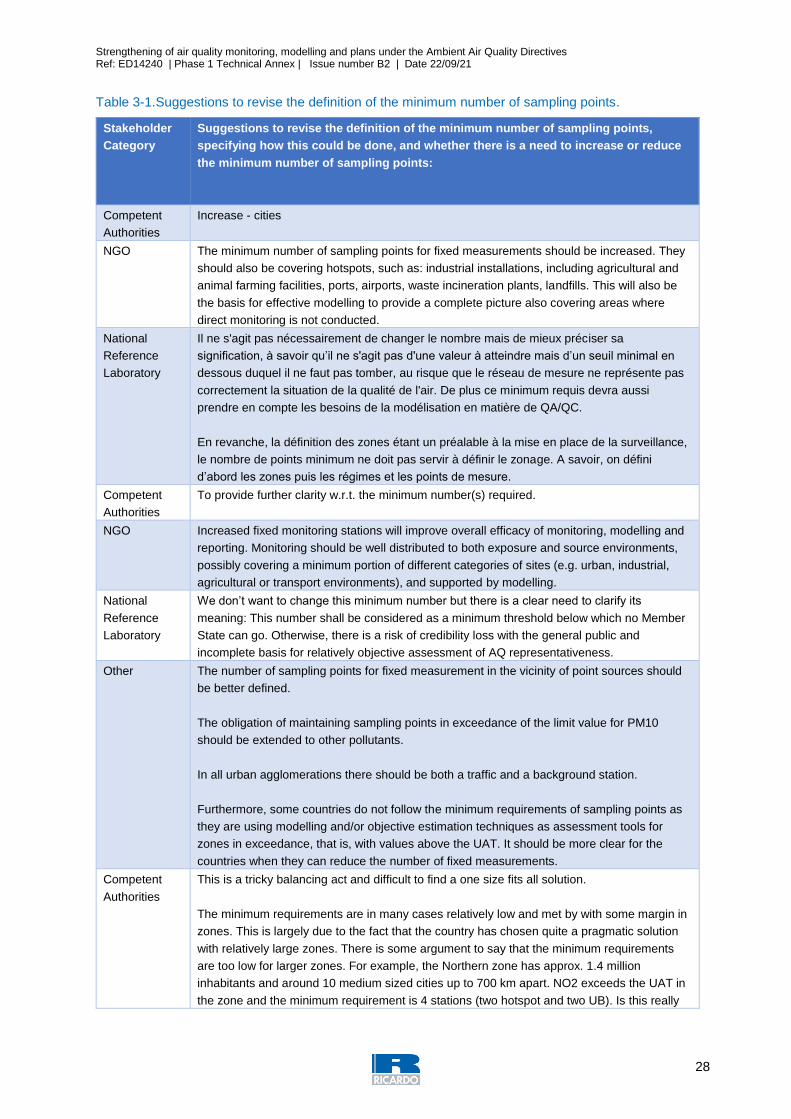
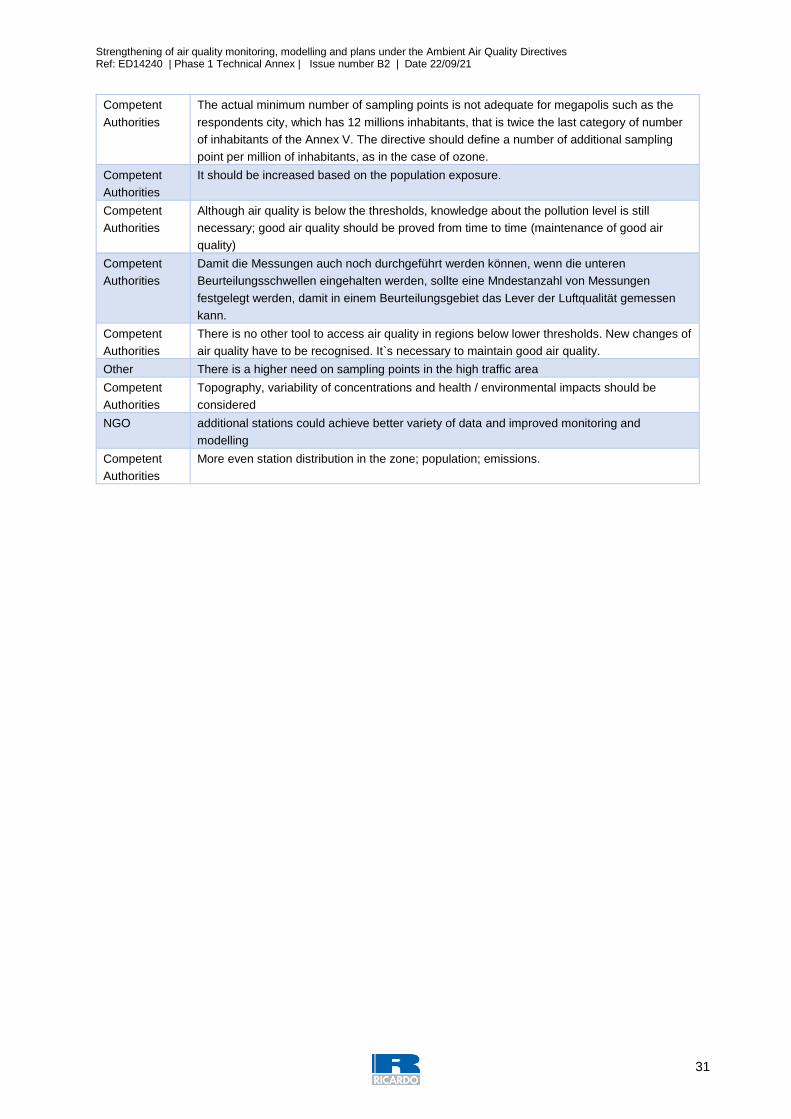
Respondents were also requested to identify how the revision of the minimum number of sampling
points could be carried out, specifying whether there is a need either to increase or decrease the
minimum number of sampling points. The responses are presented in the table below. A main
message from the table is that more respondents recommend an increase in the minimum
number of sampling point than a decrease of such number. However, the main concern from
the respondents seems related to better clarify how the number of minimum sampling points for
fixed measurement when indicative measurement and/or modelling are used to complement the
assessment of air quality regimes and support the definition of the air quality zone. Guidance
and clarification to this respect would require a careful explanation on how to use indicative
measurements and models to combine or supplement fixed measurements for the
determination and classification of air quality zones and agglomerations.
43%
39%
18%
Total responses = 67
Yes No Don't know
Strengthening of air quality monitoring, modelling and plans under the Ambient Air Quality Directives Ref: ED14240 | Phase 1 Technical Annex | Issue number B2 | Date 22/09/21
28
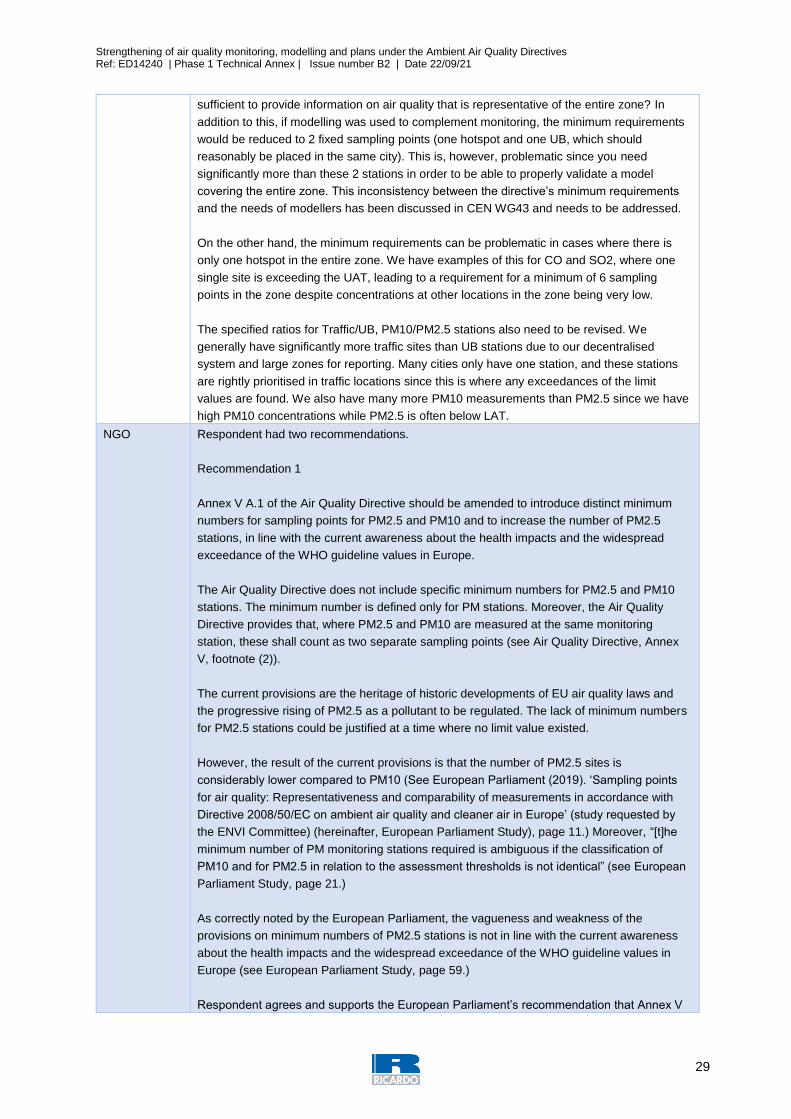
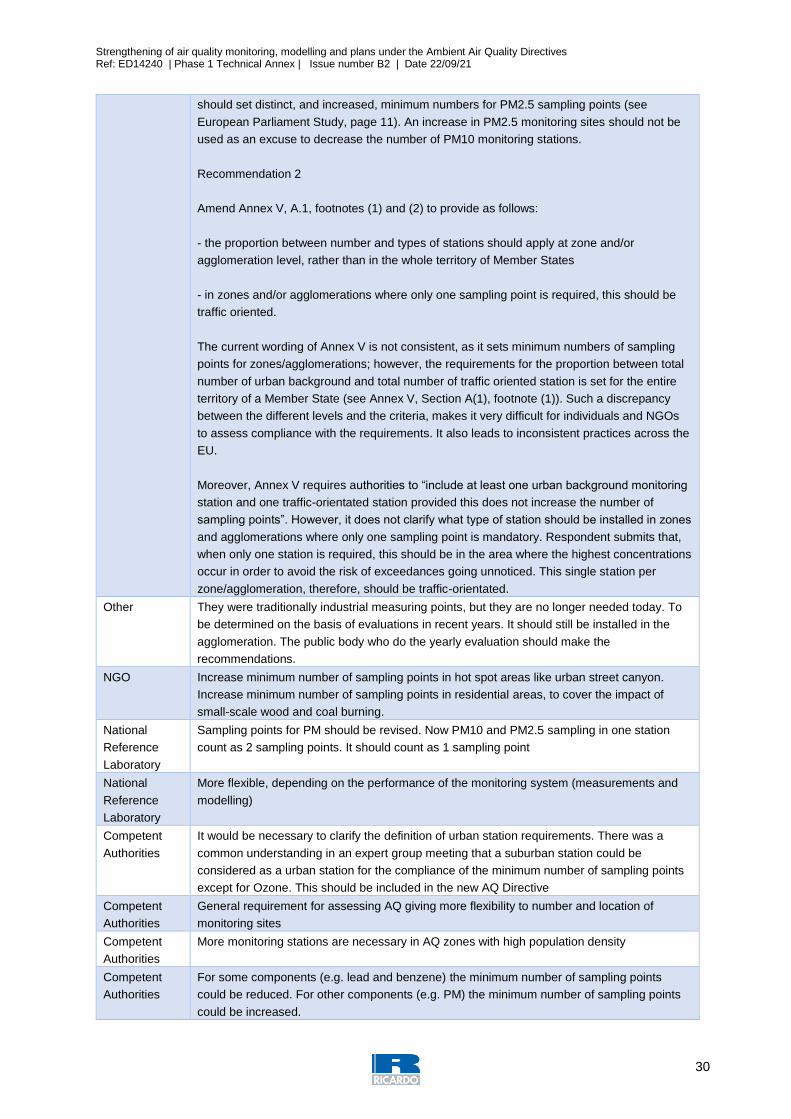
Table 3-1.Suggestions to revise the definition of the minimum number of sampling points.
Stakeholder
Category
Suggestions to revise the definition of the minimum number of sampling points,
specifying how this could be done, and whether there is a need to increase or reduce
the minimum number of sampling points:
Competent
Authorities
Increase - cities
NGO The minimum number of sampling points for fixed measurements should be increased. They
should also be covering hotspots, such as: industrial installations, including agricultural and
animal farming facilities, ports, airports, waste incineration plants, landfills. This will also be
the basis for effective modelling to provide a complete picture also covering areas where
direct monitoring is not conducted.
National
Reference
Laboratory
Il ne s'agit pas nécessairement de changer le nombre mais de mieux préciser sa
signification, à savoir qu’il ne s'agit pas d'une valeur à atteindre mais d’un seuil minimal en
dessous duquel il ne faut pas tomber, au risque que le réseau de mesure ne représente pas
correctement la situation de la qualité de l'air. De plus ce minimum requis devra aussi
prendre en compte les besoins de la modélisation en matière de QA/QC.
En revanche, la définition des zones étant un préalable à la mise en place de la surveillance,
le nombre de points minimum ne doit pas servir à définir le zonage. A savoir, on défini
d’abord les zones puis les régimes et les points de mesure.
Competent
Authorities
To provide further clarity w.r.t. the minimum number(s) required.
NGO Increased fixed monitoring stations will improve overall efficacy of monitoring, modelling and
reporting. Monitoring should be well distributed to both exposure and source environments,
possibly covering a minimum portion of different categories of sites (e.g. urban, industrial,
agricultural or transport environments), and supported by modelling.
National
Reference
Laboratory
We don’t want to change this minimum number but there is a clear need to clarify its
meaning: This number shall be considered as a minimum threshold below which no Member
State can go. Otherwise, there is a risk of credibility loss with the general public and
incomplete basis for relatively objective assessment of AQ representativeness.
Other The number of sampling points for fixed measurement in the vicinity of point sources should
be better defined.
The obligation of maintaining sampling points in exceedance of the limit value for PM10
should be extended to other pollutants.
In all urban agglomerations there should be both a traffic and a background station.
Furthermore, some countries do not follow the minimum requirements of sampling points as
they are using modelling and/or objective estimation techniques as assessment tools for
zones in exceedance, that is, with values above the UAT. It should be more clear for the
countries when they can reduce the number of fixed measurements.
Competent
Authorities
This is a tricky balancing act and difficult to find a one size fits all solution.
The minimum requirements are in many cases relatively low and met by with some margin in
zones. This is largely due to the fact that the country has chosen quite a pragmatic solution
with relatively large zones. There is some argument to say that the minimum requirements
are too low for larger zones. For example, the Northern zone has approx. 1.4 million
inhabitants and around 10 medium sized cities up to 700 km apart. NO2 exceeds the UAT in
the zone and the minimum requirement is 4 stations (two hotspot and two UB). Is this really
Strengthening of air quality monitoring, modelling and plans under the Ambient Air Quality Directives Ref: ED14240 | Phase 1 Technical Annex | Issue number B2 | Date 22/09/21
29
sufficient to provide information on air quality that is representative of the entire zone? In
addition to this, if modelling was used to complement monitoring, the minimum requirements
would be reduced to 2 fixed sampling points (one hotspot and one UB, which should
reasonably be placed in the same city). This is, however, problematic since you need
significantly more than these 2 stations in order to be able to properly validate a model
covering the entire zone. This inconsistency between the directive’s minimum requirements
and the needs of modellers has been discussed in CEN WG43 and needs to be addressed.
On the other hand, the minimum requirements can be problematic in cases where there is
only one hotspot in the entire zone. We have examples of this for CO and SO2, where one
single site is exceeding the UAT, leading to a requirement for a minimum of 6 sampling
points in the zone despite concentrations at other locations in the zone being very low.
The specified ratios for Traffic/UB, PM10/PM2.5 stations also need to be revised. We
generally have significantly more traffic sites than UB stations due to our decentralised
system and large zones for reporting. Many cities only have one station, and these stations
are rightly prioritised in traffic locations since this is where any exceedances of the limit
values are found. We also have many more PM10 measurements than PM2.5 since we have
high PM10 concentrations while PM2.5 is often below LAT.
NGO Respondent had two recommendations.
Recommendation 1
Annex V A.1 of the Air Quality Directive should be amended to introduce distinct minimum
numbers for sampling points for PM2.5 and PM10 and to increase the number of PM2.5
stations, in line with the current awareness about the health impacts and the widespread
exceedance of the WHO guideline values in Europe.
The Air Quality Directive does not include specific minimum numbers for PM2.5 and PM10
stations. The minimum number is defined only for PM stations. Moreover, the Air Quality
Directive provides that, where PM2.5 and PM10 are measured at the same monitoring
station, these shall count as two separate sampling points (see Air Quality Directive, Annex
V, footnote (2)).
The current provisions are the heritage of historic developments of EU air quality laws and
the progressive rising of PM2.5 as a pollutant to be regulated. The lack of minimum numbers
for PM2.5 stations could be justified at a time where no limit value existed.
However, the result of the current provisions is that the number of PM2.5 sites is
considerably lower compared to PM10 (See European Parliament (2019). ‘Sampling points
for air quality: Representativeness and comparability of measurements in accordance with
Directive 2008/50/EC on ambient air quality and cleaner air in Europe’ (study requested by
the ENVI Committee) (hereinafter, European Parliament Study), page 11.) Moreover, “[t]he
minimum number of PM monitoring stations required is ambiguous if the classification of
PM10 and for PM2.5 in relation to the assessment thresholds is not identical” (see European
Parliament Study, page 21.)
As correctly noted by the European Parliament, the vagueness and weakness of the
provisions on minimum numbers of PM2.5 stations is not in line with the current awareness
about the health impacts and the widespread exceedance of the WHO guideline values in
Europe (see European Parliament Study, page 59.)
Respondent agrees and supports the European Parliament’s recommendation that Annex V
Strengthening of air quality monitoring, modelling and plans under the Ambient Air Quality Directives Ref: ED14240 | Phase 1 Technical Annex | Issue number B2 | Date 22/09/21
30
should set distinct, and increased, minimum numbers for PM2.5 sampling points (see
European Parliament Study, page 11). An increase in PM2.5 monitoring sites should not be
used as an excuse to decrease the number of PM10 monitoring stations.
Recommendation 2
Amend Annex V, A.1, footnotes (1) and (2) to provide as follows:
- the proportion between number and types of stations should apply at zone and/or
agglomeration level, rather than in the whole territory of Member States
- in zones and/or agglomerations where only one sampling point is required, this should be
traffic oriented.
The current wording of Annex V is not consistent, as it sets minimum numbers of sampling
points for zones/agglomerations; however, the requirements for the proportion between total
number of urban background and total number of traffic oriented station is set for the entire
territory of a Member State (see Annex V, Section A(1), footnote (1)). Such a discrepancy
between the different levels and the criteria, makes it very difficult for individuals and NGOs
to assess compliance with the requirements. It also leads to inconsistent practices across the
EU.
Moreover, Annex V requires authorities to “include at least one urban background monitoring
station and one traffic-orientated station provided this does not increase the number of
sampling points”. However, it does not clarify what type of station should be installed in zones
and agglomerations where only one sampling point is mandatory. Respondent submits that,
when only one station is required, this should be in the area where the highest concentrations
occur in order to avoid the risk of exceedances going unnoticed. This single station per
zone/agglomeration, therefore, should be traffic-orientated.
Other They were traditionally industrial measuring points, but they are no longer needed today. To
be determined on the basis of evaluations in recent years. It should still be installed in the
agglomeration. The public body who do the yearly evaluation should make the
recommendations.
NGO Increase minimum number of sampling points in hot spot areas like urban street canyon.
Increase minimum number of sampling points in residential areas, to cover the impact of
small-scale wood and coal burning.
National
Reference
Laboratory
Sampling points for PM should be revised. Now PM10 and PM2.5 sampling in one station
count as 2 sampling points. It should count as 1 sampling point
National
Reference
Laboratory
More flexible, depending on the performance of the monitoring system (measurements and
modelling)
Competent
Authorities
It would be necessary to clarify the definition of urban station requirements. There was a
common understanding in an expert group meeting that a suburban station could be
considered as a urban station for the compliance of the minimum number of sampling points
except for Ozone. This should be included in the new AQ Directive
Competent
Authorities
General requirement for assessing AQ giving more flexibility to number and location of
monitoring sites
Competent
Authorities
More monitoring stations are necessary in AQ zones with high population density
Competent
Authorities
For some components (e.g. lead and benzene) the minimum number of sampling points
could be reduced. For other components (e.g. PM) the minimum number of sampling points
could be increased.
Strengthening of air quality monitoring, modelling and plans under the Ambient Air Quality Directives Ref: ED14240 | Phase 1 Technical Annex | Issue number B2 | Date 22/09/21
31
Competent
Authorities
The actual minimum number of sampling points is not adequate for megapolis such as the
respondents city, which has 12 millions inhabitants, that is twice the last category of number
of inhabitants of the Annex V. The directive should define a number of additional sampling
point per million of inhabitants, as in the case of ozone.
Competent
Authorities
It should be increased based on the population exposure.
Competent
Authorities
Although air quality is below the thresholds, knowledge about the pollution level is still
necessary; good air quality should be proved from time to time (maintenance of good air
quality)
Competent
Authorities
Damit die Messungen auch noch durchgeführt werden können, wenn die unteren
Beurteilungsschwellen eingehalten werden, sollte eine Mndestanzahl von Messungen
festgelegt werden, damit in einem Beurteilungsgebiet das Lever der Luftqualität gemessen
kann.
Competent
Authorities
There is no other tool to access air quality in regions below lower thresholds. New changes of
air quality have to be recognised. It`s necessary to maintain good air quality.
Other There is a higher need on sampling points in the high traffic area
Competent
Authorities
Topography, variability of concentrations and health / environmental impacts should be
considered
NGO additional stations could achieve better variety of data and improved monitoring and
modelling
Competent
Authorities
More even station distribution in the zone; population; emissions.

Strengthening of air quality monitoring, modelling and plans under the Ambient Air Quality Directives Ref: ED14240 | Phase 1 Technical Annex | Issue number B2 | Date 22/09/21
32
3.2.2.3 In your opinion, is there a need to better define the requirements for the use of fixed
measurements versus indicative measurements to establish assessment regimes in relation
to lower and upper assessment thresholds? (2.8)
For this question participants were invited to select one answer from the following
Yes
No
I do not know
There were 67 respondents to this question, because again we considered blank responses in the same
category as the response “I do not know”. 33 respondents (49%) indicated that there is no need to
revise define the requirements for the use of fixed measurements versus indicative measurements in
order to establish the lower and upper assessment thresholds. These threshold values, both LAT and
UAT, are essential to the definition of assessment regimes and the classification of air quality zones
that are the basis for all air quality management applications. Still, only 21 respondents (31%) pointed
out that there was a need for further clarification on the use of indicative vs fixed measurements for the
establishment of assessment regimes.13 (20%) participants did not share an opinion on this issue. The
respondents showed a significant bias on type of expertise: those that answered yes and requested
further clarification had a larger significantly larger representation of national reference laboratories than
those that answered no.
Figure 3-9 Need revise define the requirements for the use of fixed measurements versus indicative measurements to establish assessment regimes, according to responses to the on-line questionnaire of February 2021.
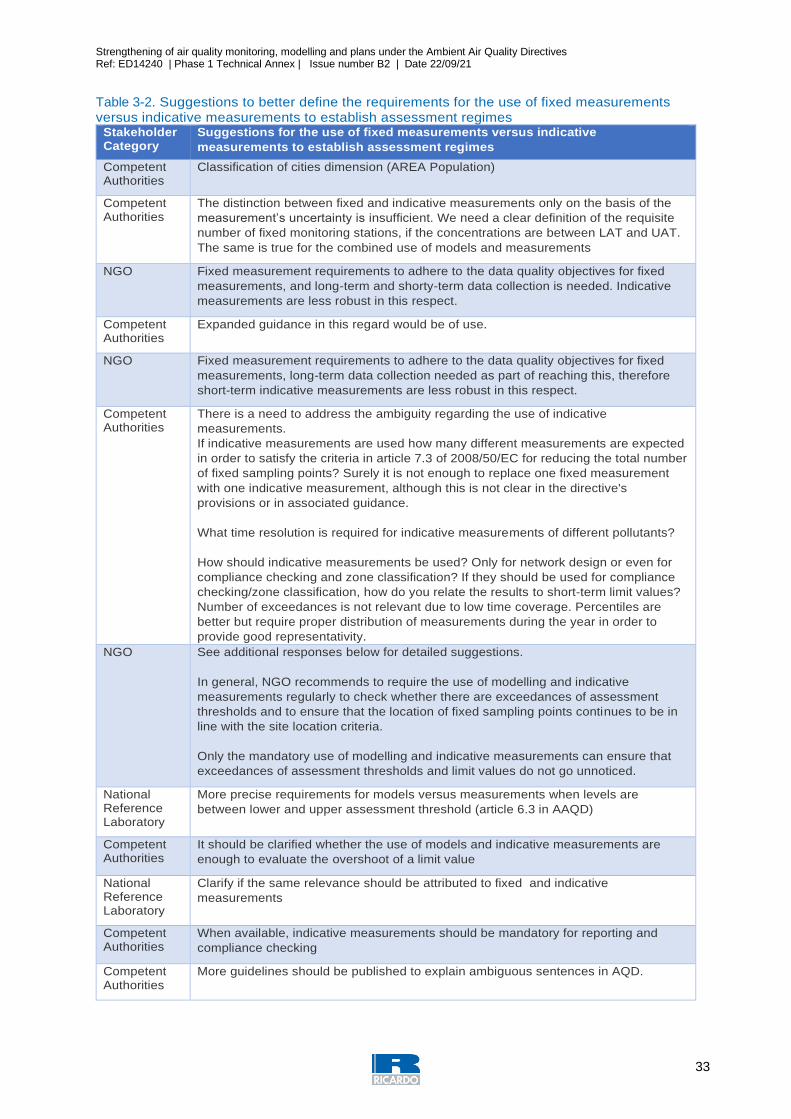
The responses from the group that required further guidance on the determination and classification of
air quality zones based on fixed and indicative measurements are presented in the table below. The
main message from the table is the need for guidance on the quality (data quality objectives)
requirements on indicative measurements and explanations on how these should be used also in
combination with models to supplement fixed measurements in different air quality applications. The
requested guidance could specify how to use these indicative measurements (and models) for
different air quality management applications and with respect to different threshold zones:
under the LAT, between LAT and UAT and above the UAT.
31%
49%
20%
Total responses = 67
Yes No Don't know
Strengthening of air quality monitoring, modelling and plans under the Ambient Air Quality Directives Ref: ED14240 | Phase 1 Technical Annex | Issue number B2 | Date 22/09/21
33
Table 3-2. Suggestions to better define the requirements for the use of fixed measurements versus indicative measurements to establish assessment regimes
Stakeholder Category
Suggestions for the use of fixed measurements versus indicative
measurements to establish assessment regimes
Competent Authorities
Classification of cities dimension (AREA Population)
Competent Authorities
The distinction between fixed and indicative measurements only on the basis of the
measurement’s uncertainty is insufficient. We need a clear definition of the requisite
number of fixed monitoring stations, if the concentrations are between LAT and UAT.
The same is true for the combined use of models and measurements
NGO Fixed measurement requirements to adhere to the data quality objectives for fixed
measurements, and long-term and shorty-term data collection is needed. Indicative
measurements are less robust in this respect.
Competent Authorities
Expanded guidance in this regard would be of use.
NGO Fixed measurement requirements to adhere to the data quality objectives for fixed
measurements, long-term data collection needed as part of reaching this, therefore
short-term indicative measurements are less robust in this respect.
Competent Authorities
There is a need to address the ambiguity regarding the use of indicative
measurements.
If indicative measurements are used how many different measurements are expected
in order to satisfy the criteria in article 7.3 of 2008/50/EC for reducing the total number
of fixed sampling points? Surely it is not enough to replace one fixed measurement
with one indicative measurement, although this is not clear in the directive's
provisions or in associated guidance.
What time resolution is required for indicative measurements of different pollutants?
How should indicative measurements be used? Only for network design or even for
compliance checking and zone classification? If they should be used for compliance
checking/zone classification, how do you relate the results to short-term limit values?
Number of exceedances is not relevant due to low time coverage. Percentiles are
better but require proper distribution of measurements during the year in order to
provide good representativity.
NGO See additional responses below for detailed suggestions.
In general, NGO recommends to require the use of modelling and indicative
measurements regularly to check whether there are exceedances of assessment
thresholds and to ensure that the location of fixed sampling points continues to be in
line with the site location criteria.
Only the mandatory use of modelling and indicative measurements can ensure that
exceedances of assessment thresholds and limit values do not go unnoticed.
National Reference Laboratory
More precise requirements for models versus measurements when levels are
between lower and upper assessment threshold (article 6.3 in AAQD)
Competent Authorities
It should be clarified whether the use of models and indicative measurements are
enough to evaluate the overshoot of a limit value
National Reference Laboratory
Clarify if the same relevance should be attributed to fixed and indicative
measurements
Competent Authorities
When available, indicative measurements should be mandatory for reporting and
compliance checking
Competent Authorities
More guidelines should be published to explain ambiguous sentences in AQD.
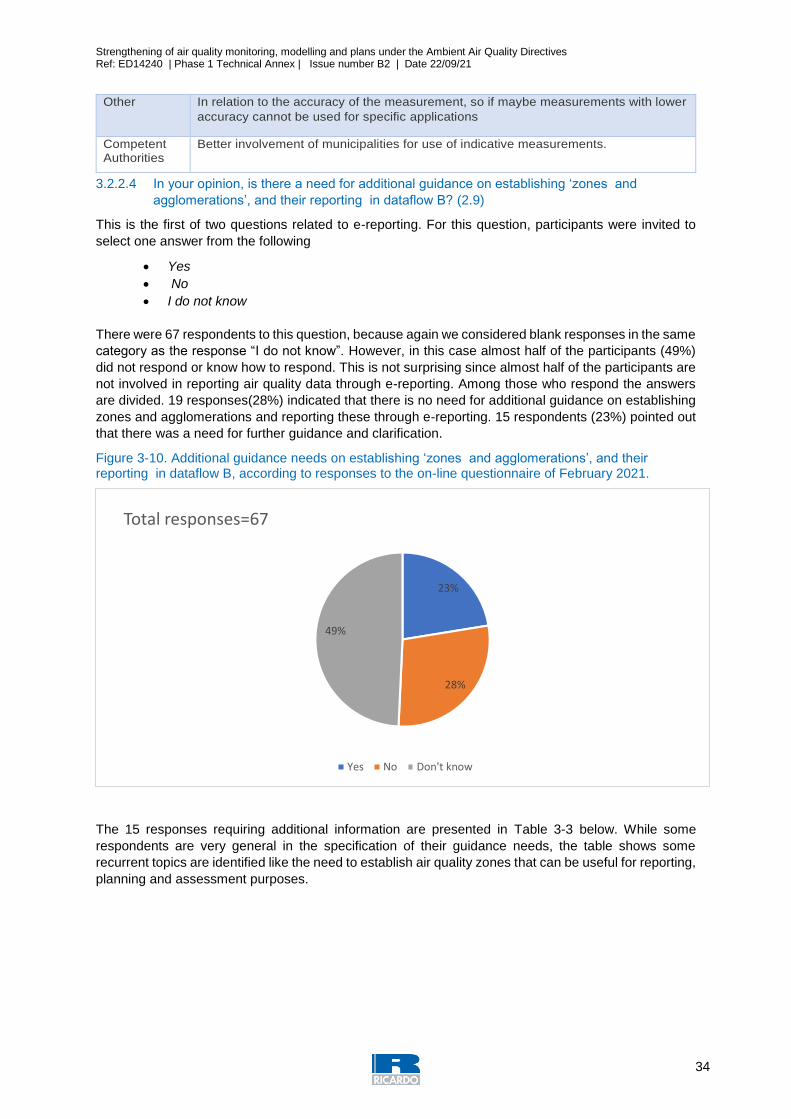
Strengthening of air quality monitoring, modelling and plans under the Ambient Air Quality Directives Ref: ED14240 | Phase 1 Technical Annex | Issue number B2 | Date 22/09/21
34
Other In relation to the accuracy of the measurement, so if maybe measurements with lower
accuracy cannot be used for specific applications
Competent Authorities
Better involvement of municipalities for use of indicative measurements.
3.2.2.4 In your opinion, is there a need for additional guidance on establishing ‘zones and
agglomerations’, and their reporting in dataflow B? (2.9)
This is the first of two questions related to e-reporting. For this question, participants were invited to
select one answer from the following
Yes
No
I do not know
There were 67 respondents to this question, because again we considered blank responses in the same
category as the response “I do not know”. However, in this case almost half of the participants (49%)
did not respond or know how to respond. This is not surprising since almost half of the participants are
not involved in reporting air quality data through e-reporting. Among those who respond the answers
are divided. 19 responses(28%) indicated that there is no need for additional guidance on establishing
zones and agglomerations and reporting these through e-reporting. 15 respondents (23%) pointed out
that there was a need for further guidance and clarification.
Figure 3-10. Additional guidance needs on establishing ‘zones and agglomerations’, and their reporting in dataflow B, according to responses to the on-line questionnaire of February 2021.
The 15 responses requiring additional information are presented in Table 3-3 below. While some
respondents are very general in the specification of their guidance needs, the table shows some
recurrent topics are identified like the need to establish air quality zones that can be useful for reporting,
planning and assessment purposes.
23%
28%
49%
Total responses=67
Yes No Don't know
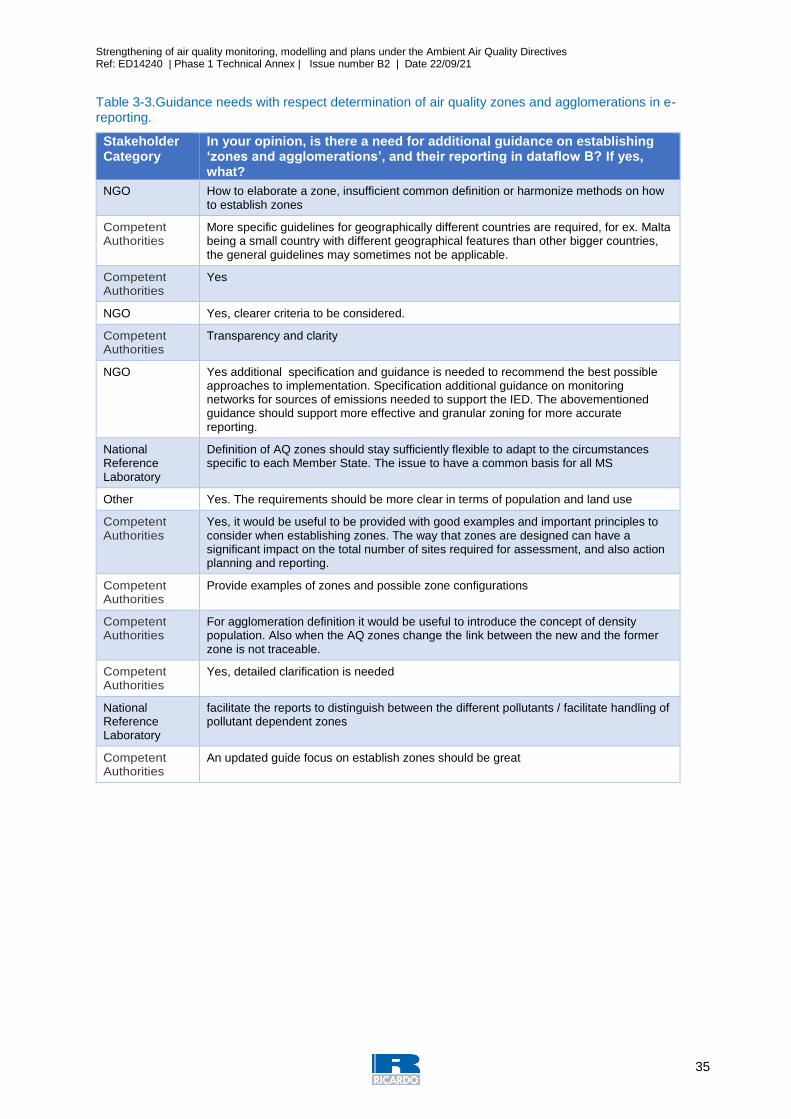
Strengthening of air quality monitoring, modelling and plans under the Ambient Air Quality Directives Ref: ED14240 | Phase 1 Technical Annex | Issue number B2 | Date 22/09/21
35
Table 3-3.Guidance needs with respect determination of air quality zones and agglomerations in e-reporting.
Stakeholder Category
In your opinion, is there a need for additional guidance on establishing ‘zones and agglomerations’, and their reporting in dataflow B? If yes, what?
NGO How to elaborate a zone, insufficient common definition or harmonize methods on how to establish zones
Competent Authorities
More specific guidelines for geographically different countries are required, for ex. Malta being a small country with different geographical features than other bigger countries, the general guidelines may sometimes not be applicable.
Competent Authorities
Yes
NGO Yes, clearer criteria to be considered.
Competent Authorities
Transparency and clarity
NGO Yes additional specification and guidance is needed to recommend the best possible approaches to implementation. Specification additional guidance on monitoring networks for sources of emissions needed to support the IED. The abovementioned guidance should support more effective and granular zoning for more accurate reporting.
National Reference Laboratory
Definition of AQ zones should stay sufficiently flexible to adapt to the circumstances specific to each Member State. The issue to have a common basis for all MS
Other Yes. The requirements should be more clear in terms of population and land use
Competent Authorities
Yes, it would be useful to be provided with good examples and important principles to consider when establishing zones. The way that zones are designed can have a significant impact on the total number of sites required for assessment, and also action planning and reporting.
Competent Authorities
Provide examples of zones and possible zone configurations
Competent Authorities
For agglomeration definition it would be useful to introduce the concept of density population. Also when the AQ zones change the link between the new and the former zone is not traceable.
Competent Authorities
Yes, detailed clarification is needed
National Reference Laboratory
facilitate the reports to distinguish between the different pollutants / facilitate handling of pollutant dependent zones
Competent Authorities
An updated guide focus on establish zones should be great
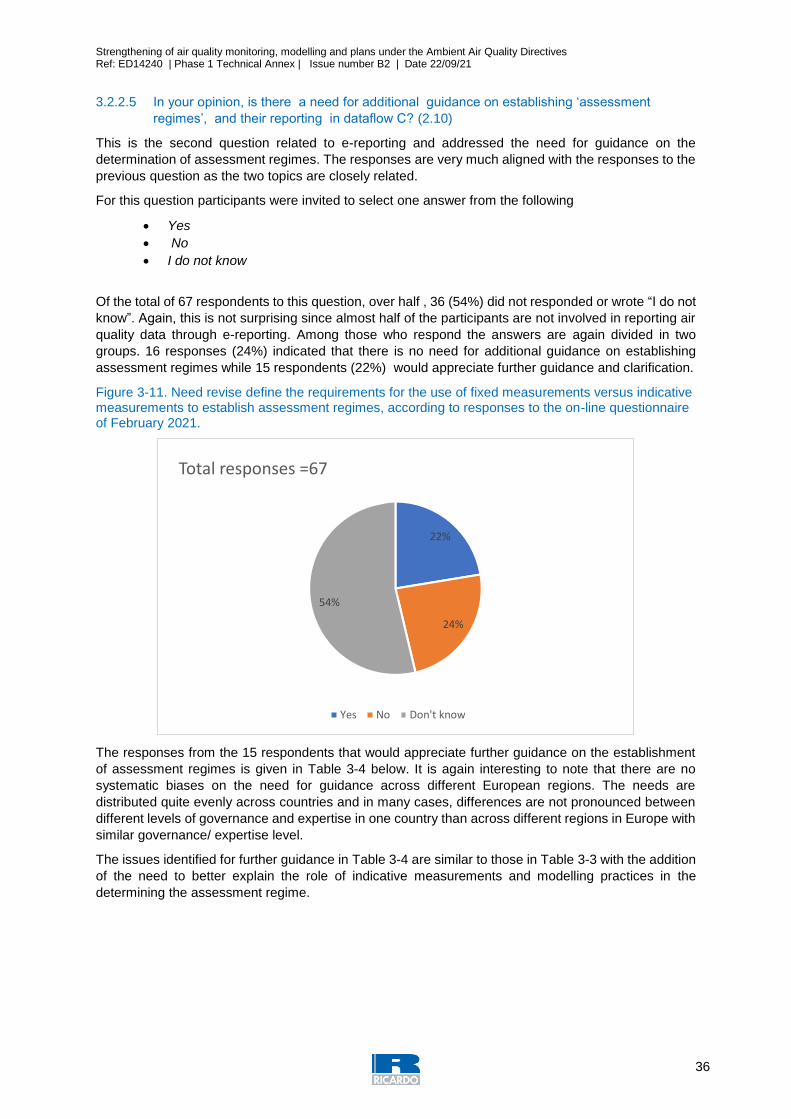
Strengthening of air quality monitoring, modelling and plans under the Ambient Air Quality Directives Ref: ED14240 | Phase 1 Technical Annex | Issue number B2 | Date 22/09/21
36
3.2.2.5 In your opinion, is there a need for additional guidance on establishing ‘assessment
regimes’, and their reporting in dataflow C? (2.10)
This is the second question related to e-reporting and addressed the need for guidance on the
determination of assessment regimes. The responses are very much aligned with the responses to the
previous question as the two topics are closely related.
For this question participants were invited to select one answer from the following
Yes
No
I do not know
Of the total of 67 respondents to this question, over half , 36 (54%) did not responded or wrote “I do not
know”. Again, this is not surprising since almost half of the participants are not involved in reporting air
quality data through e-reporting. Among those who respond the answers are again divided in two
groups. 16 responses (24%) indicated that there is no need for additional guidance on establishing
assessment regimes while 15 respondents (22%) would appreciate further guidance and clarification.
Figure 3-11. Need revise define the requirements for the use of fixed measurements versus indicative measurements to establish assessment regimes, according to responses to the on-line questionnaire of February 2021.
The responses from the 15 respondents that would appreciate further guidance on the establishment
of assessment regimes is given in Table 3-4 below. It is again interesting to note that there are no
systematic biases on the need for guidance across different European regions. The needs are
distributed quite evenly across countries and in many cases, differences are not pronounced between
different levels of governance and expertise in one country than across different regions in Europe with
similar governance/ expertise level.
The issues identified for further guidance in Table 3-4 are similar to those in Table 3-3 with the addition
of the need to better explain the role of indicative measurements and modelling practices in the
determining the assessment regime.
22%
24%
54%
Total responses =67
Yes No Don't know

Strengthening of air quality monitoring, modelling and plans under the Ambient Air Quality Directives Ref: ED14240 | Phase 1 Technical Annex | Issue number B2 | Date 22/09/21
37
Table 3-4. Guidance needs with respect determination of assessment regimes in e-reporting as provided in the responses to the on-line questionnaire
Stakeholder Category
In your opinion, is there a need for additional guidance on establishing ‘assessment regimes’, and their reporting in dataflow C? If yes, what?
NGO What are the role of the indicatives measures
Competent Authorities
More specific guidelines for geographically different countries are required, for ex. Malta being a small country with different geographical features than other bigger countries, the general guidelines may sometimes not be applicable.
Competent Authorities
Yes
NGO Yes, the effectiveness of air quality monitoring networks should be regularly assessed and info reported to the European Commission.
Competent Authorities
Transparency and clarity
National Reference Laboratory
Oui. Besoin de clarification sur les types de site à prendre en compte selon le type de zone ; en particulier le statut des sites industriels (influence des sources ponctuelles) n’est pas clair.
Competent Authorities
Yes, general expanded guidance would be welcome.
NGO Major industrial sources of emissions should be made a core part of MS assessment regimes under the AAQ Directive. Additionally, more effective guidance on the effectiveness of stations and other tools is needed to ensure consistent high-quality monitoring is taking place.
National Reference Laboratory
The additional guidance should clarify the type(s) of sites to take into account according to the type of zone. In particular, industrial sites status (case of punctual sources) is not so clear.
Other The current "Guidance on Assessment under the EU Air Quality Directives", referred to in the guidance document "Member States' and European Commission's Common Understanding of the Commission Implementing Decision" is a very old document issued before the implementation of the Directive 2008/50/EC The possibility of using modes instead of monitoring for assessment is not clear enough
Competent Authorities
Yes, good examples for network/assessment regime design and their regular review would be very useful. The criteria in article 7.3 of 2008/50/EC for reducing the total number of sampling points where fixed measurements are supplemented by modelling and/or indicative measurements are particularly difficult to interpret and need to be clarified in the directive and/or in guidance. How to use results from “supplementary assessment methods” for classifying zones (and for compliance checking in dataflow G) also needs to be clarified.
NGO The use of models and indicative measurements is particularly important to assess the exceedance of lower or higher assessment thresholds. Currently, this assessment in many parts of the EU relies principally on measured concentrations. The use of indicative measurements/modelling is only facultative. This legislative framework leads to a very high risk of “false negatives”. In areas where the assessment thresholds are not exceeded, the monitoring network is usually very limited and not adequate to provide a full picture of spatial distribution of pollution. Only the mandatory use of modelling and indicative measurements can ensure that exceedances of assessment thresholds and limit values do not go unnoticed. Respondent recommends amending Annex II, Section B, to require competent authorities to carry out modelling studies and indicative measurements regularly (at least once every year) to check whether exceedances of the assessment thresholds occur.
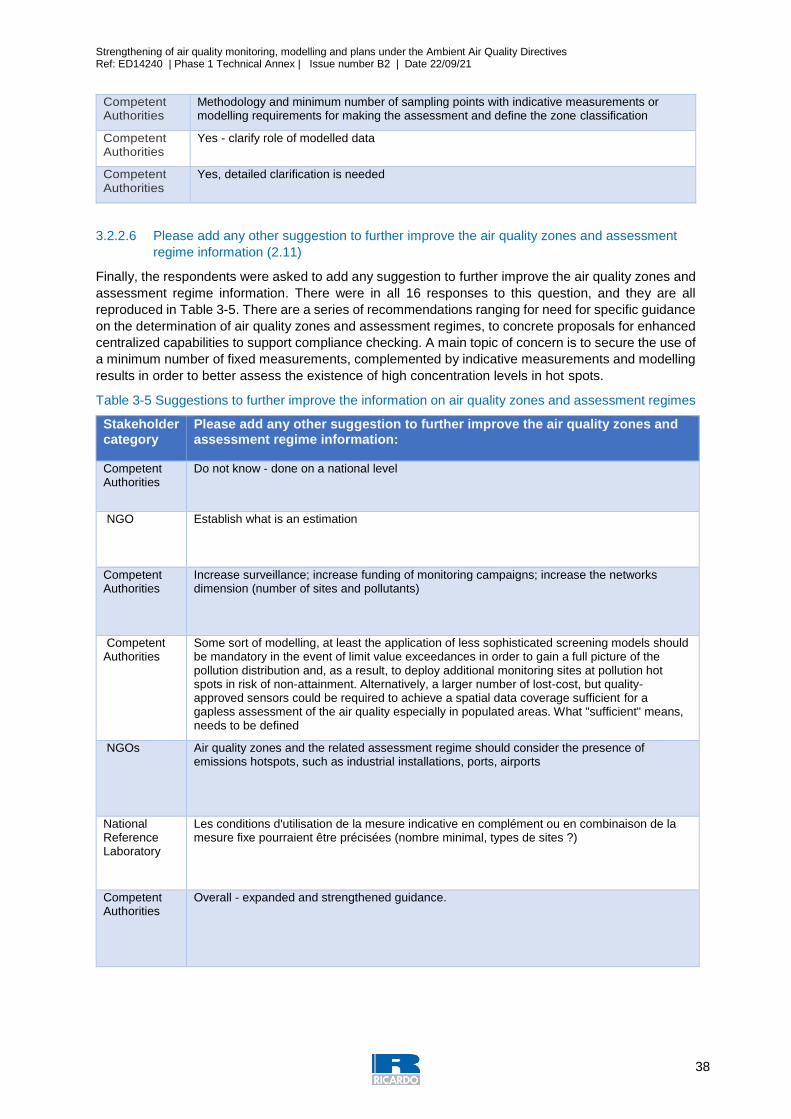
Strengthening of air quality monitoring, modelling and plans under the Ambient Air Quality Directives Ref: ED14240 | Phase 1 Technical Annex | Issue number B2 | Date 22/09/21
38
Competent Authorities
Methodology and minimum number of sampling points with indicative measurements or modelling requirements for making the assessment and define the zone classification
Competent Authorities
Yes - clarify role of modelled data
Competent Authorities
Yes, detailed clarification is needed
3.2.2.6 Please add any other suggestion to further improve the air quality zones and assessment
regime information (2.11)
Finally, the respondents were asked to add any suggestion to further improve the air quality zones and
assessment regime information. There were in all 16 responses to this question, and they are all
reproduced in Table 3-5. There are a series of recommendations ranging for need for specific guidance
on the determination of air quality zones and assessment regimes, to concrete proposals for enhanced
centralized capabilities to support compliance checking. A main topic of concern is to secure the use of
a minimum number of fixed measurements, complemented by indicative measurements and modelling
results in order to better assess the existence of high concentration levels in hot spots.
Table 3-5 Suggestions to further improve the information on air quality zones and assessment regimes
Stakeholder category
Please add any other suggestion to further improve the air quality zones and assessment regime information:
Competent Authorities
Do not know - done on a national level
NGO Establish what is an estimation
Competent Authorities
Increase surveillance; increase funding of monitoring campaigns; increase the networks dimension (number of sites and pollutants)
Competent Authorities
Some sort of modelling, at least the application of less sophisticated screening models should be mandatory in the event of limit value exceedances in order to gain a full picture of the pollution distribution and, as a result, to deploy additional monitoring sites at pollution hot spots in risk of non-attainment. Alternatively, a larger number of lost-cost, but quality-approved sensors could be required to achieve a spatial data coverage sufficient for a gapless assessment of the air quality especially in populated areas. What "sufficient" means, needs to be defined
NGOs Air quality zones and the related assessment regime should consider the presence of emissions hotspots, such as industrial installations, ports, airports
National Reference Laboratory
Les conditions d'utilisation de la mesure indicative en complément ou en combinaison de la mesure fixe pourraient être précisées (nombre minimal, types de sites ?)
Competent Authorities
Overall - expanded and strengthened guidance.
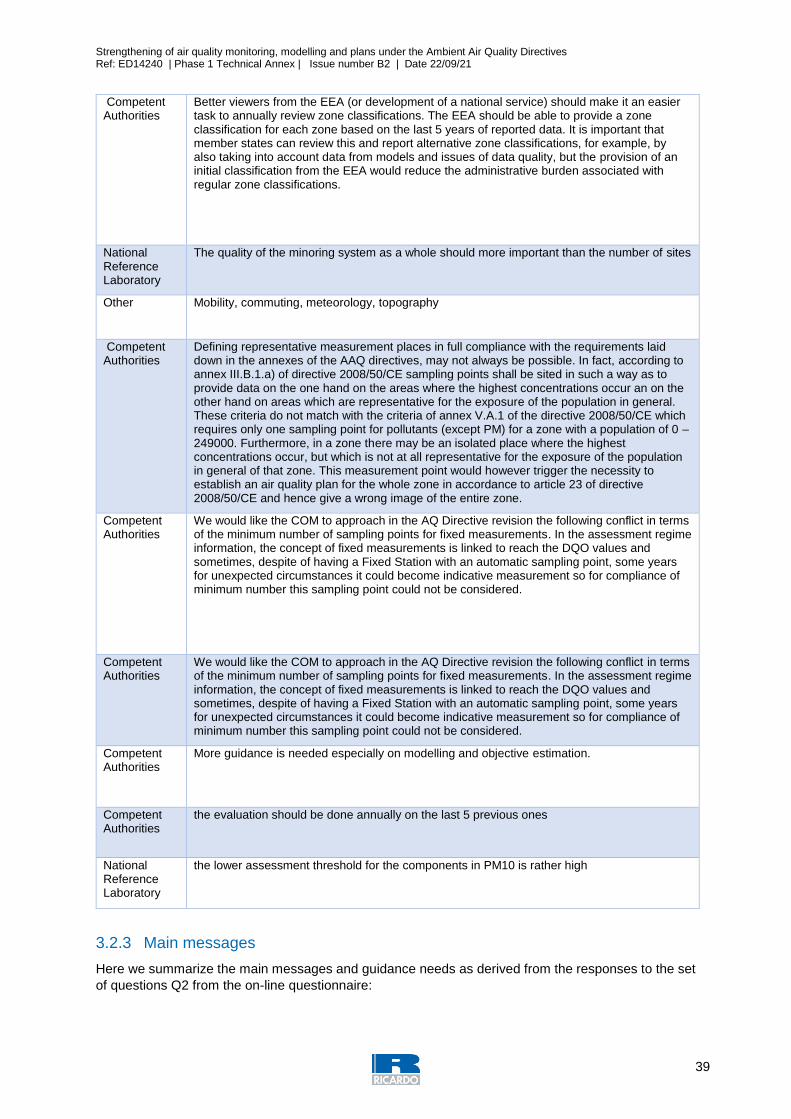
Strengthening of air quality monitoring, modelling and plans under the Ambient Air Quality Directives Ref: ED14240 | Phase 1 Technical Annex | Issue number B2 | Date 22/09/21
39
Competent Authorities
Better viewers from the EEA (or development of a national service) should make it an easier task to annually review zone classifications. The EEA should be able to provide a zone classification for each zone based on the last 5 years of reported data. It is important that member states can review this and report alternative zone classifications, for example, by also taking into account data from models and issues of data quality, but the provision of an initial classification from the EEA would reduce the administrative burden associated with regular zone classifications.
National Reference Laboratory
The quality of the minoring system as a whole should more important than the number of sites
Other Mobility, commuting, meteorology, topography
Competent Authorities
Defining representative measurement places in full compliance with the requirements laid down in the annexes of the AAQ directives, may not always be possible. In fact, according to annex III.B.1.a) of directive 2008/50/CE sampling points shall be sited in such a way as to provide data on the one hand on the areas where the highest concentrations occur an on the other hand on areas which are representative for the exposure of the population in general. These criteria do not match with the criteria of annex V.A.1 of the directive 2008/50/CE which requires only one sampling point for pollutants (except PM) for a zone with a population of 0 – 249000. Furthermore, in a zone there may be an isolated place where the highest concentrations occur, but which is not at all representative for the exposure of the population in general of that zone. This measurement point would however trigger the necessity to establish an air quality plan for the whole zone in accordance to article 23 of directive 2008/50/CE and hence give a wrong image of the entire zone.
Competent Authorities
We would like the COM to approach in the AQ Directive revision the following conflict in terms of the minimum number of sampling points for fixed measurements. In the assessment regime information, the concept of fixed measurements is linked to reach the DQO values and sometimes, despite of having a Fixed Station with an automatic sampling point, some years for unexpected circumstances it could become indicative measurement so for compliance of minimum number this sampling point could not be considered.
Competent Authorities
More guidance is needed especially on modelling and objective estimation.
Competent Authorities
the evaluation should be done annually on the last 5 previous ones
National Reference Laboratory
the lower assessment threshold for the components in PM10 is rather high
3.2.3 Main messages
Here we summarize the main messages and guidance needs as derived from the responses to the set
of questions Q2 from the on-line questionnaire:

Strengthening of air quality monitoring, modelling and plans under the Ambient Air Quality Directives Ref: ED14240 | Phase 1 Technical Annex | Issue number B2 | Date 22/09/21
40
There is a need to revise the definition of air quality zones so that these may be applied for all
air quality management purposes, such as assessments, exceedances to limit values
identification of hot spots and exposure estimates.
There is a need to define and clarify the role of supplementary indicative measurements and
models for the determination and classification of air quality zones.
There is a need to develop a set of rules regarding the use of indicative measurements (also
low cost-sensors) in different threshold assessment zones for different air quality management
purposes, both alone and in combination with other methods
There is a need for better explanation on the requirements on models so that these can be
used for different air quality management purposes, and a set of rules on how to use models,
both alone and in combination with other methods .
There is a need to explain better what the role of industrial sampling points is and how to include
these type of sampling points in air quality management purposes. (This issue is also further
elaborated in Section 3.3)
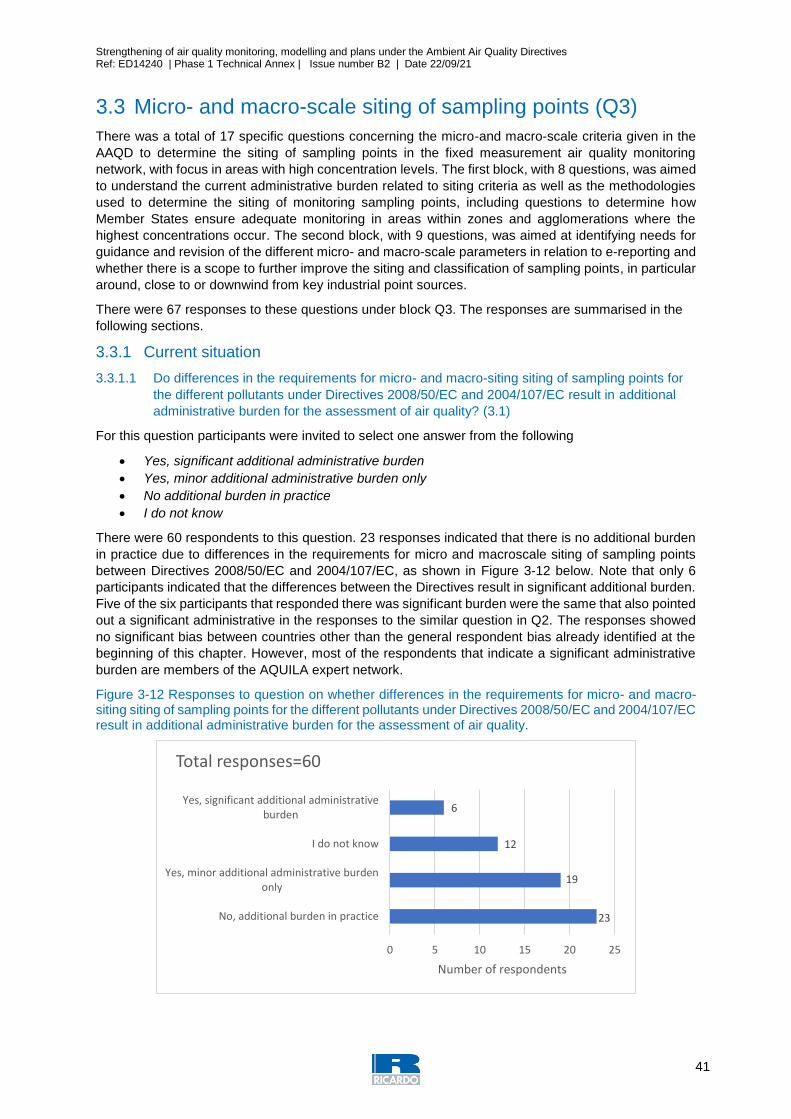
Strengthening of air quality monitoring, modelling and plans under the Ambient Air Quality Directives Ref: ED14240 | Phase 1 Technical Annex | Issue number B2 | Date 22/09/21
41
3.3 Micro- and macro-scale siting of sampling points (Q3)
There was a total of 17 specific questions concerning the micro-and macro-scale criteria given in the
AAQD to determine the siting of sampling points in the fixed measurement air quality monitoring
network, with focus in areas with high concentration levels. The first block, with 8 questions, was aimed
to understand the current administrative burden related to siting criteria as well as the methodologies
used to determine the siting of monitoring sampling points, including questions to determine how
Member States ensure adequate monitoring in areas within zones and agglomerations where the
highest concentrations occur. The second block, with 9 questions, was aimed at identifying needs for
guidance and revision of the different micro- and macro-scale parameters in relation to e-reporting and
whether there is a scope to further improve the siting and classification of sampling points, in particular
around, close to or downwind from key industrial point sources.
There were 67 responses to these questions under block Q3. The responses are summarised in the
following sections.
3.3.1 Current situation
3.3.1.1 Do differences in the requirements for micro- and macro-siting siting of sampling points for
the different pollutants under Directives 2008/50/EC and 2004/107/EC result in additional
administrative burden for the assessment of air quality? (3.1)
For this question participants were invited to select one answer from the following
Yes, significant additional administrative burden
Yes, minor additional administrative burden only
No additional burden in practice
I do not know
There were 60 respondents to this question. 23 responses indicated that there is no additional burden
in practice due to differences in the requirements for micro and macroscale siting of sampling points
between Directives 2008/50/EC and 2004/107/EC, as shown in Figure 3-12 below. Note that only 6
participants indicated that the differences between the Directives result in significant additional burden.
Five of the six participants that responded there was significant burden were the same that also pointed
out a significant administrative in the responses to the similar question in Q2. The responses showed
no significant bias between countries other than the general respondent bias already identified at the
beginning of this chapter. However, most of the respondents that indicate a significant administrative
burden are members of the AQUILA expert network.
Figure 3-12 Responses to question on whether differences in the requirements for micro- and macro-siting siting of sampling points for the different pollutants under Directives 2008/50/EC and 2004/107/EC result in additional administrative burden for the assessment of air quality.
23
19
12
6
0 5 10 15 20 25
No, additional burden in practice
Yes, minor additional administrative burdenonly
I do not know
Yes, significant additional administrativeburden
Number of respondents
Total responses=60
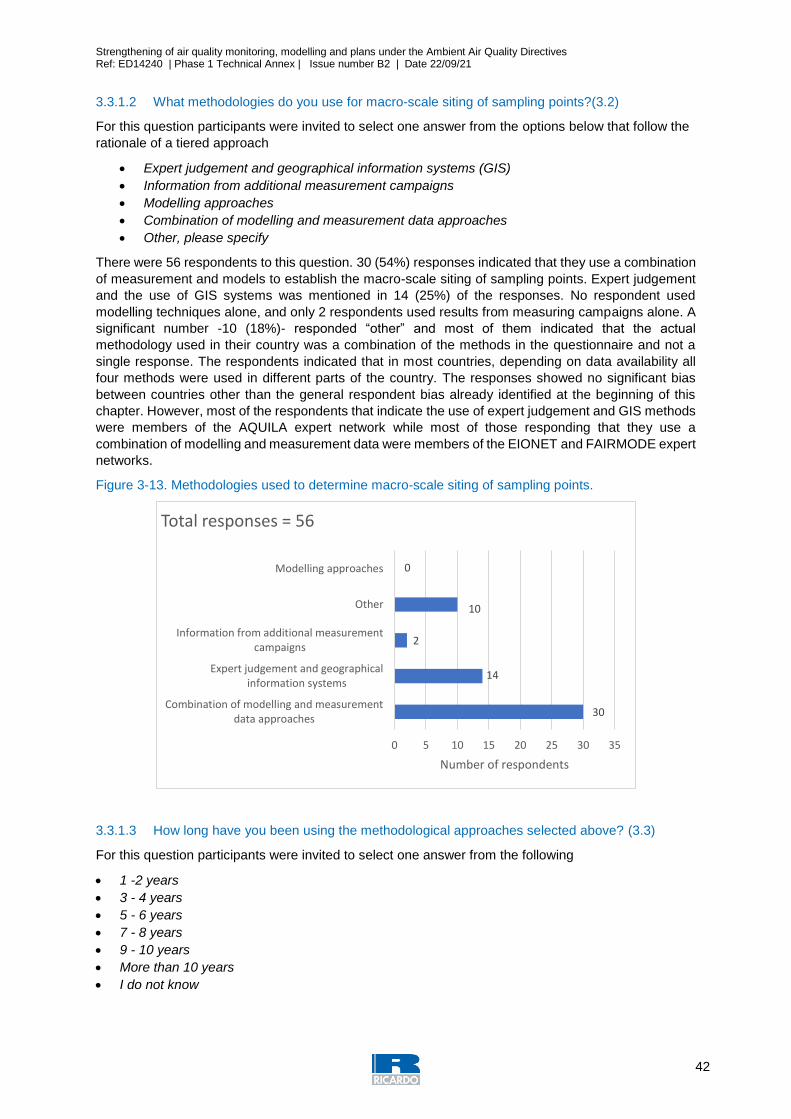
Strengthening of air quality monitoring, modelling and plans under the Ambient Air Quality Directives Ref: ED14240 | Phase 1 Technical Annex | Issue number B2 | Date 22/09/21
42
3.3.1.2 What methodologies do you use for macro-scale siting of sampling points?(3.2)
For this question participants were invited to select one answer from the options below that follow the
rationale of a tiered approach
Expert judgement and geographical information systems (GIS)
Information from additional measurement campaigns
Modelling approaches
Combination of modelling and measurement data approaches
Other, please specify
There were 56 respondents to this question. 30 (54%) responses indicated that they use a combination
of measurement and models to establish the macro-scale siting of sampling points. Expert judgement
and the use of GIS systems was mentioned in 14 (25%) of the responses. No respondent used
modelling techniques alone, and only 2 respondents used results from measuring campaigns alone. A
significant number -10 (18%)- responded “other” and most of them indicated that the actual
methodology used in their country was a combination of the methods in the questionnaire and not a
single response. The respondents indicated that in most countries, depending on data availability all
four methods were used in different parts of the country. The responses showed no significant bias
between countries other than the general respondent bias already identified at the beginning of this
chapter. However, most of the respondents that indicate the use of expert judgement and GIS methods
were members of the AQUILA expert network while most of those responding that they use a
combination of modelling and measurement data were members of the EIONET and FAIRMODE expert
networks.
Figure 3-13. Methodologies used to determine macro-scale siting of sampling points.
3.3.1.3 How long have you been using the methodological approaches selected above? (3.3)
For this question participants were invited to select one answer from the following
1 -2 years
3 - 4 years
5 - 6 years
7 - 8 years
9 - 10 years
More than 10 years
I do not know
30
14
2
10
0
0 5 10 15 20 25 30 35
Combination of modelling and measurementdata approaches
Expert judgement and geographicalinformation systems
Information from additional measurementcampaigns
Other
Modelling approaches
Number of respondents
Total responses = 56
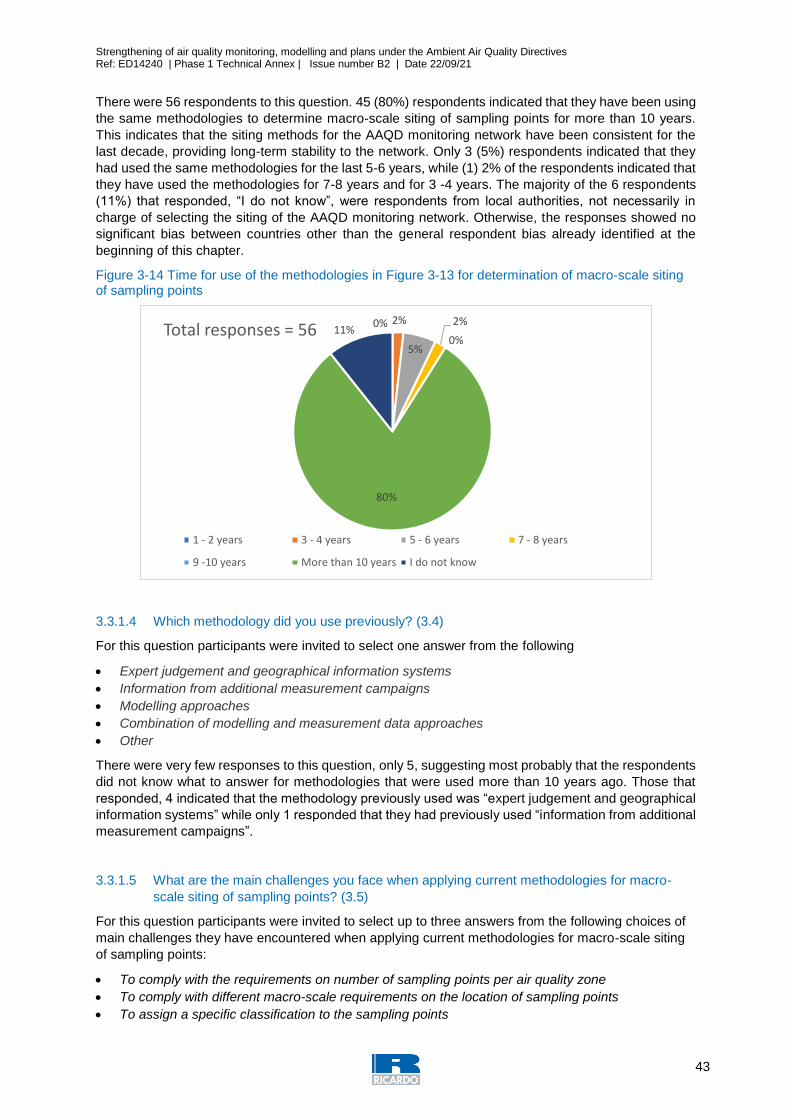
Strengthening of air quality monitoring, modelling and plans under the Ambient Air Quality Directives Ref: ED14240 | Phase 1 Technical Annex | Issue number B2 | Date 22/09/21
43
There were 56 respondents to this question. 45 (80%) respondents indicated that they have been using
the same methodologies to determine macro-scale siting of sampling points for more than 10 years.
This indicates that the siting methods for the AAQD monitoring network have been consistent for the
last decade, providing long-term stability to the network. Only 3 (5%) respondents indicated that they
had used the same methodologies for the last 5-6 years, while (1) 2% of the respondents indicated that
they have used the methodologies for 7-8 years and for 3 -4 years. The majority of the 6 respondents
(11%) that responded, “I do not know”, were respondents from local authorities, not necessarily in
charge of selecting the siting of the AAQD monitoring network. Otherwise, the responses showed no
significant bias between countries other than the general respondent bias already identified at the
beginning of this chapter.
Figure 3-14 Time for use of the methodologies in Figure 3-13 for determination of macro-scale siting of sampling points
3.3.1.4 Which methodology did you use previously? (3.4)
For this question participants were invited to select one answer from the following
Expert judgement and geographical information systems
Information from additional measurement campaigns
Modelling approaches
Combination of modelling and measurement data approaches
Other
There were very few responses to this question, only 5, suggesting most probably that the respondents
did not know what to answer for methodologies that were used more than 10 years ago. Those that
responded, 4 indicated that the methodology previously used was “expert judgement and geographical
information systems” while only 1 responded that they had previously used “information from additional
measurement campaigns”.
3.3.1.5 What are the main challenges you face when applying current methodologies for macro-
scale siting of sampling points? (3.5)
For this question participants were invited to select up to three answers from the following choices of
main challenges they have encountered when applying current methodologies for macro-scale siting
of sampling points:
To comply with the requirements on number of sampling points per air quality zone
To comply with different macro-scale requirements on the location of sampling points
To assign a specific classification to the sampling points
0% 2%
5%
2%
0%
80%
11%Total responses = 56
1 - 2 years 3 - 4 years 5 - 6 years 7 - 8 years
9 -10 years More than 10 years I do not know
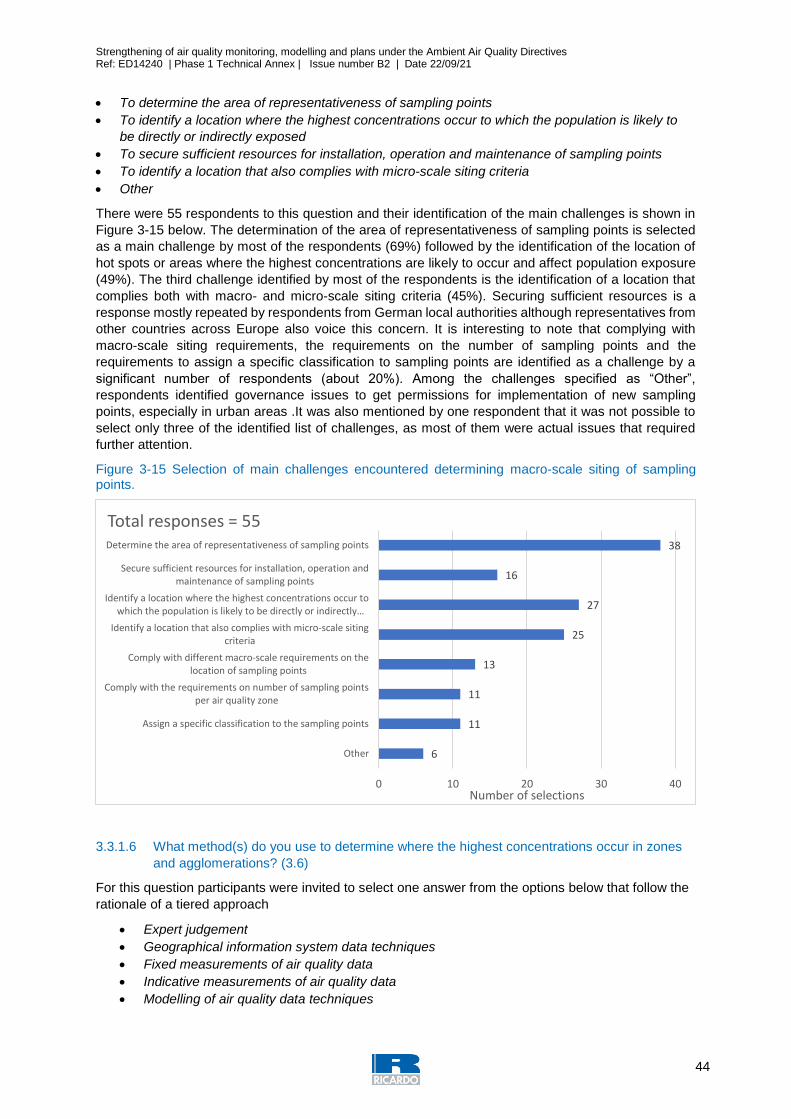
Strengthening of air quality monitoring, modelling and plans under the Ambient Air Quality Directives Ref: ED14240 | Phase 1 Technical Annex | Issue number B2 | Date 22/09/21
44
To determine the area of representativeness of sampling points
To identify a location where the highest concentrations occur to which the population is likely to
be directly or indirectly exposed
To secure sufficient resources for installation, operation and maintenance of sampling points
To identify a location that also complies with micro-scale siting criteria
Other
There were 55 respondents to this question and their identification of the main challenges is shown in
Figure 3-15 below. The determination of the area of representativeness of sampling points is selected
as a main challenge by most of the respondents (69%) followed by the identification of the location of
hot spots or areas where the highest concentrations are likely to occur and affect population exposure
(49%). The third challenge identified by most of the respondents is the identification of a location that
complies both with macro- and micro-scale siting criteria (45%). Securing sufficient resources is a
response mostly repeated by respondents from German local authorities although representatives from
other countries across Europe also voice this concern. It is interesting to note that complying with
macro-scale siting requirements, the requirements on the number of sampling points and the
requirements to assign a specific classification to sampling points are identified as a challenge by a
significant number of respondents (about 20%). Among the challenges specified as “Other”,
respondents identified governance issues to get permissions for implementation of new sampling
points, especially in urban areas .It was also mentioned by one respondent that it was not possible to
select only three of the identified list of challenges, as most of them were actual issues that required
further attention.
Figure 3-15 Selection of main challenges encountered determining macro-scale siting of sampling points.
3.3.1.6 What method(s) do you use to determine where the highest concentrations occur in zones
and agglomerations? (3.6)
For this question participants were invited to select one answer from the options below that follow the
rationale of a tiered approach
Expert judgement
Geographical information system data techniques
Fixed measurements of air quality data
Indicative measurements of air quality data
Modelling of air quality data techniques
6
11
11
13
25
27
16
38
0 10 20 30 40
Other
Assign a specific classification to the sampling points
Comply with the requirements on number of sampling pointsper air quality zone
Comply with different macro-scale requirements on thelocation of sampling points
Identify a location that also complies with micro-scale sitingcriteria
Identify a location where the highest concentrations occur towhich the population is likely to be directly or indirectly…
Secure sufficient resources for installation, operation andmaintenance of sampling points
Determine the area of representativeness of sampling points
Number of selections
Total responses = 55
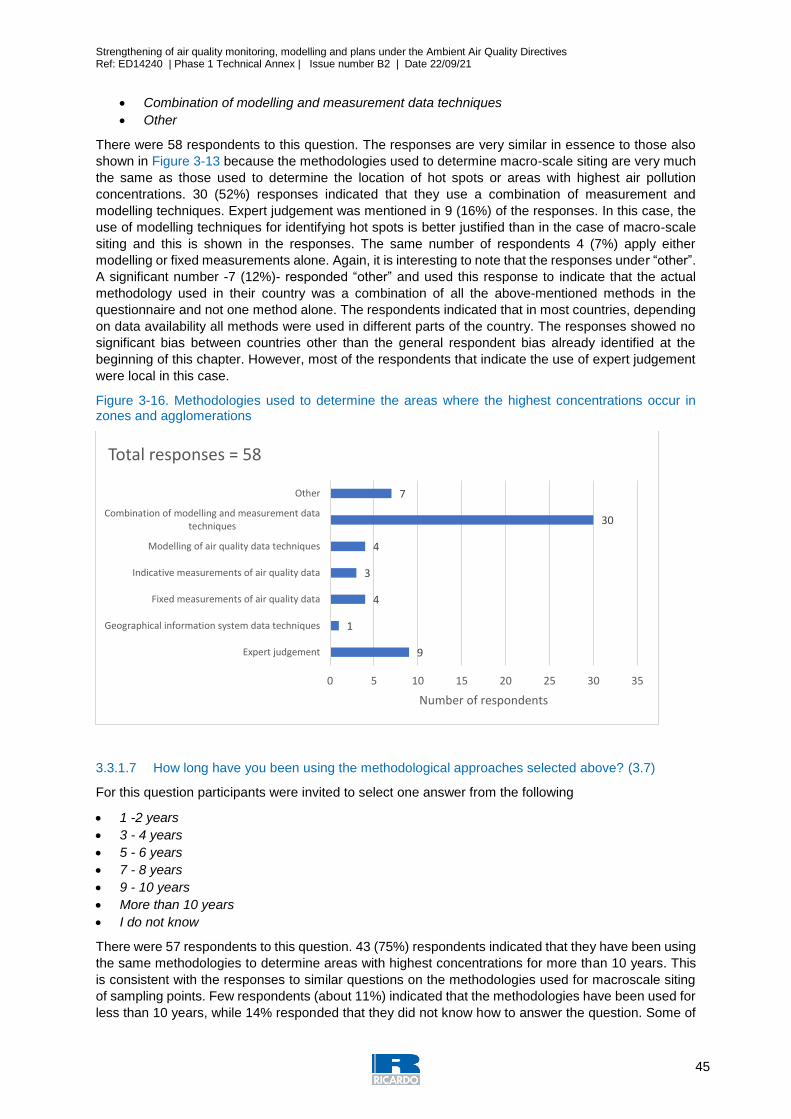
Strengthening of air quality monitoring, modelling and plans under the Ambient Air Quality Directives Ref: ED14240 | Phase 1 Technical Annex | Issue number B2 | Date 22/09/21
45
Combination of modelling and measurement data techniques
Other
There were 58 respondents to this question. The responses are very similar in essence to those also
shown in Figure 3-13 because the methodologies used to determine macro-scale siting are very much
the same as those used to determine the location of hot spots or areas with highest air pollution
concentrations. 30 (52%) responses indicated that they use a combination of measurement and
modelling techniques. Expert judgement was mentioned in 9 (16%) of the responses. In this case, the
use of modelling techniques for identifying hot spots is better justified than in the case of macro-scale
siting and this is shown in the responses. The same number of respondents 4 (7%) apply either
modelling or fixed measurements alone. Again, it is interesting to note that the responses under “other”.
A significant number -7 (12%)- responded “other” and used this response to indicate that the actual
methodology used in their country was a combination of all the above-mentioned methods in the
questionnaire and not one method alone. The respondents indicated that in most countries, depending
on data availability all methods were used in different parts of the country. The responses showed no
significant bias between countries other than the general respondent bias already identified at the
beginning of this chapter. However, most of the respondents that indicate the use of expert judgement
were local in this case.
Figure 3-16. Methodologies used to determine the areas where the highest concentrations occur in zones and agglomerations
3.3.1.7 How long have you been using the methodological approaches selected above? (3.7)
For this question participants were invited to select one answer from the following
1 -2 years
3 - 4 years
5 - 6 years
7 - 8 years
9 - 10 years
More than 10 years
I do not know
There were 57 respondents to this question. 43 (75%) respondents indicated that they have been using
the same methodologies to determine areas with highest concentrations for more than 10 years. This
is consistent with the responses to similar questions on the methodologies used for macroscale siting
of sampling points. Few respondents (about 11%) indicated that the methodologies have been used for
less than 10 years, while 14% responded that they did not know how to answer the question. Some of
9
1
4
3
4
30
7
0 5 10 15 20 25 30 35
Expert judgement
Geographical information system data techniques
Fixed measurements of air quality data
Indicative measurements of air quality data
Modelling of air quality data techniques
Combination of modelling and measurement datatechniques
Other
Number of respondents
Total responses = 58
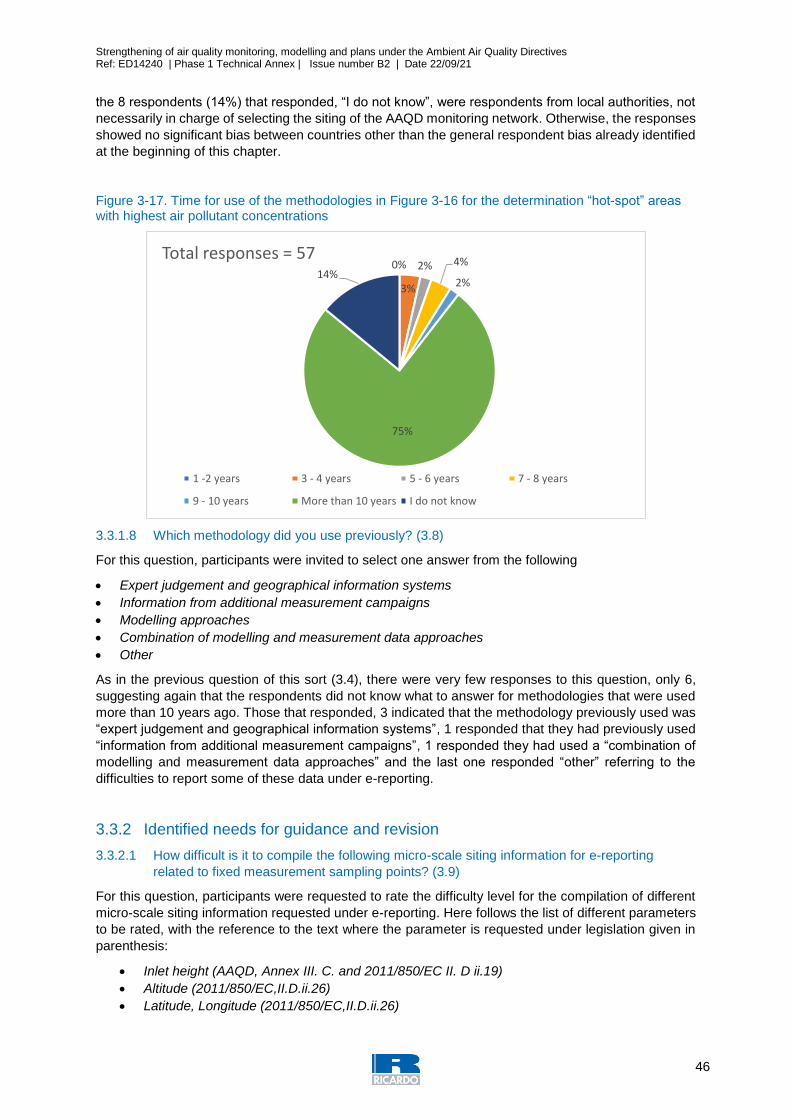
Strengthening of air quality monitoring, modelling and plans under the Ambient Air Quality Directives Ref: ED14240 | Phase 1 Technical Annex | Issue number B2 | Date 22/09/21
46
the 8 respondents (14%) that responded, “I do not know”, were respondents from local authorities, not
necessarily in charge of selecting the siting of the AAQD monitoring network. Otherwise, the responses
showed no significant bias between countries other than the general respondent bias already identified
at the beginning of this chapter.
Figure 3-17. Time for use of the methodologies in Figure 3-16 for the determination “hot-spot” areas with highest air pollutant concentrations
3.3.1.8 Which methodology did you use previously? (3.8)
For this question, participants were invited to select one answer from the following
Expert judgement and geographical information systems
Information from additional measurement campaigns
Modelling approaches
Combination of modelling and measurement data approaches
Other
As in the previous question of this sort (3.4), there were very few responses to this question, only 6,
suggesting again that the respondents did not know what to answer for methodologies that were used
more than 10 years ago. Those that responded, 3 indicated that the methodology previously used was
“expert judgement and geographical information systems”, 1 responded that they had previously used
“information from additional measurement campaigns”, 1 responded they had used a “combination of
modelling and measurement data approaches” and the last one responded “other” referring to the
difficulties to report some of these data under e-reporting.
3.3.2 Identified needs for guidance and revision
3.3.2.1 How difficult is it to compile the following micro-scale siting information for e-reporting
related to fixed measurement sampling points? (3.9)
For this question, participants were requested to rate the difficulty level for the compilation of different
micro-scale siting information requested under e-reporting. Here follows the list of different parameters
to be rated, with the reference to the text where the parameter is requested under legislation given in
parenthesis:
Inlet height (AAQD, Annex III. C. and 2011/850/EC II. D ii.19)
Altitude (2011/850/EC,II.D.ii.26)
Latitude, Longitude (2011/850/EC,II.D.ii.26)
0%
3%
2% 4%
2%
75%
14%
Total responses = 57
1 -2 years 3 - 4 years 5 - 6 years 7 - 8 years
9 - 10 years More than 10 years I do not know
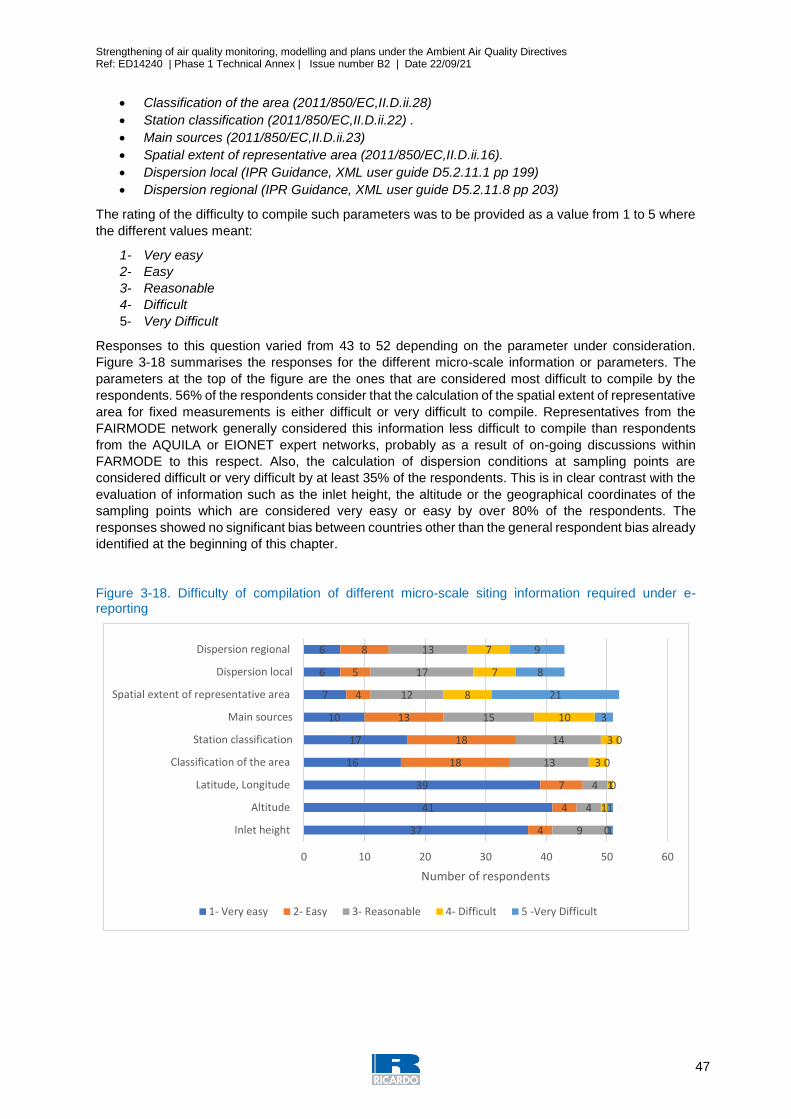
Strengthening of air quality monitoring, modelling and plans under the Ambient Air Quality Directives Ref: ED14240 | Phase 1 Technical Annex | Issue number B2 | Date 22/09/21
47
Classification of the area (2011/850/EC,II.D.ii.28)
Station classification (2011/850/EC,II.D.ii.22) .
Main sources (2011/850/EC,II.D.ii.23)
Spatial extent of representative area (2011/850/EC,II.D.ii.16).
Dispersion local (IPR Guidance, XML user guide D5.2.11.1 pp 199)
Dispersion regional (IPR Guidance, XML user guide D5.2.11.8 pp 203)
The rating of the difficulty to compile such parameters was to be provided as a value from 1 to 5 where
the different values meant:
1- Very easy
2- Easy
3- Reasonable
4- Difficult
5- Very Difficult
Responses to this question varied from 43 to 52 depending on the parameter under consideration.
Figure 3-18 summarises the responses for the different micro-scale information or parameters. The
parameters at the top of the figure are the ones that are considered most difficult to compile by the
respondents. 56% of the respondents consider that the calculation of the spatial extent of representative
area for fixed measurements is either difficult or very difficult to compile. Representatives from the
FAIRMODE network generally considered this information less difficult to compile than respondents
from the AQUILA or EIONET expert networks, probably as a result of on-going discussions within
FARMODE to this respect. Also, the calculation of dispersion conditions at sampling points are
considered difficult or very difficult by at least 35% of the respondents. This is in clear contrast with the
evaluation of information such as the inlet height, the altitude or the geographical coordinates of the
sampling points which are considered very easy or easy by over 80% of the respondents. The
responses showed no significant bias between countries other than the general respondent bias already
identified at the beginning of this chapter.
Figure 3-18. Difficulty of compilation of different micro-scale siting information required under e-reporting
37
41
39
16
17
10
7
6
6
4
4
7
18
18
13
4
5
8
9
4
4
13
14
15
12
17
13
0
1
1
3
3
10
8
7
7
1
1
0
0
0
3
21
8
9
0 10 20 30 40 50 60
Inlet height
Altitude
Latitude, Longitude
Classification of the area
Station classification
Main sources
Spatial extent of representative area
Dispersion local
Dispersion regional
Number of respondents
1- Very easy 2- Easy 3- Reasonable 4- Difficult 5 -Very Difficult
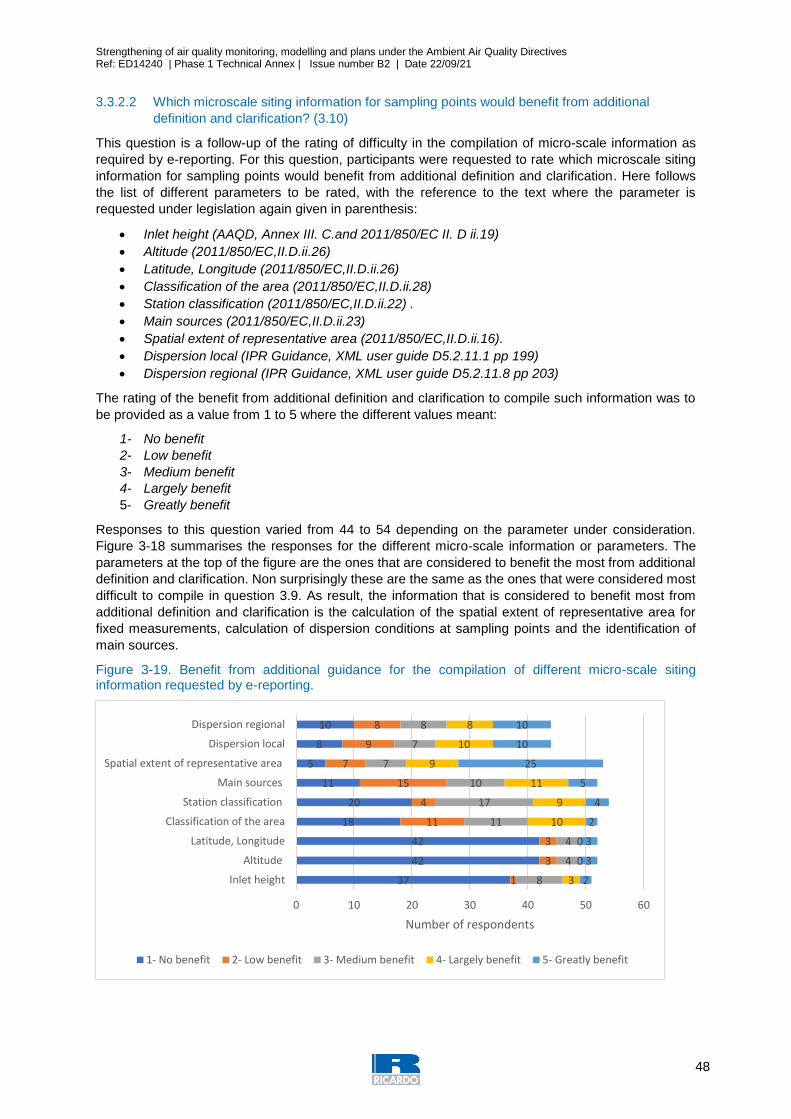
Strengthening of air quality monitoring, modelling and plans under the Ambient Air Quality Directives Ref: ED14240 | Phase 1 Technical Annex | Issue number B2 | Date 22/09/21
48
3.3.2.2 Which microscale siting information for sampling points would benefit from additional
definition and clarification? (3.10)
This question is a follow-up of the rating of difficulty in the compilation of micro-scale information as
required by e-reporting. For this question, participants were requested to rate which microscale siting
information for sampling points would benefit from additional definition and clarification. Here follows
the list of different parameters to be rated, with the reference to the text where the parameter is
requested under legislation again given in parenthesis:
Inlet height (AAQD, Annex III. C.and 2011/850/EC II. D ii.19)
Altitude (2011/850/EC,II.D.ii.26)
Latitude, Longitude (2011/850/EC,II.D.ii.26)
Classification of the area (2011/850/EC,II.D.ii.28)
Station classification (2011/850/EC,II.D.ii.22) .
Main sources (2011/850/EC,II.D.ii.23)
Spatial extent of representative area (2011/850/EC,II.D.ii.16).
Dispersion local (IPR Guidance, XML user guide D5.2.11.1 pp 199)
Dispersion regional (IPR Guidance, XML user guide D5.2.11.8 pp 203)
The rating of the benefit from additional definition and clarification to compile such information was to
be provided as a value from 1 to 5 where the different values meant:
1- No benefit
2- Low benefit
3- Medium benefit
4- Largely benefit
5- Greatly benefit
Responses to this question varied from 44 to 54 depending on the parameter under consideration.
Figure 3-18 summarises the responses for the different micro-scale information or parameters. The
parameters at the top of the figure are the ones that are considered to benefit the most from additional
definition and clarification. Non surprisingly these are the same as the ones that were considered most
difficult to compile in question 3.9. As result, the information that is considered to benefit most from
additional definition and clarification is the calculation of the spatial extent of representative area for
fixed measurements, calculation of dispersion conditions at sampling points and the identification of
main sources.
Figure 3-19. Benefit from additional guidance for the compilation of different micro-scale siting information requested by e-reporting.
37
42
42
18
20
11
5
8
10
1
3
3
11
4
15
7
9
8
8
4
4
11
17
10
7
7
8
3
0
0
10
9
11
9
10
8
2
3
3
2
4
5
25
10
10
0 10 20 30 40 50 60
Inlet height
Altitude
Latitude, Longitude
Classification of the area
Station classification
Main sources
Spatial extent of representative area
Dispersion local
Dispersion regional
Number of respondents
1- No benefit 2- Low benefit 3- Medium benefit 4- Largely benefit 5- Greatly benefit
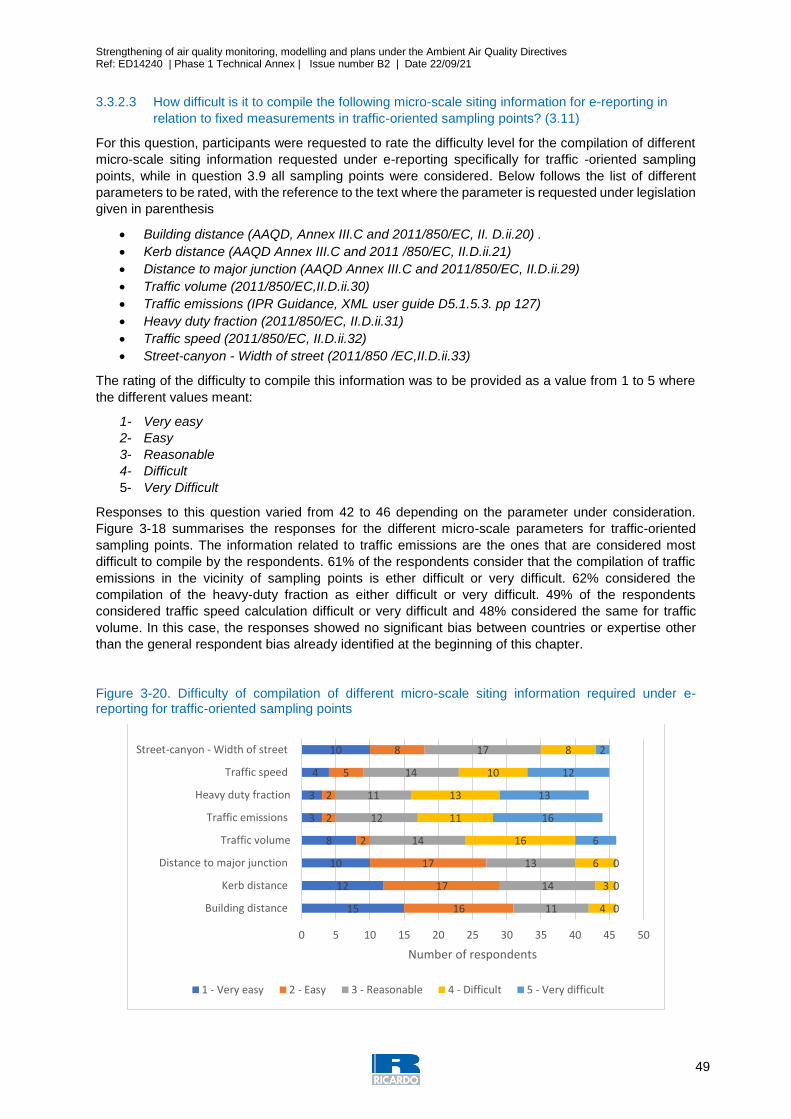
Strengthening of air quality monitoring, modelling and plans under the Ambient Air Quality Directives Ref: ED14240 | Phase 1 Technical Annex | Issue number B2 | Date 22/09/21
49
3.3.2.3 How difficult is it to compile the following micro-scale siting information for e-reporting in
relation to fixed measurements in traffic-oriented sampling points? (3.11)
For this question, participants were requested to rate the difficulty level for the compilation of different
micro-scale siting information requested under e-reporting specifically for traffic -oriented sampling
points, while in question 3.9 all sampling points were considered. Below follows the list of different
parameters to be rated, with the reference to the text where the parameter is requested under legislation
given in parenthesis
Building distance (AAQD, Annex III.C and 2011/850/EC, II. D.ii.20) .
Kerb distance (AAQD Annex III.C and 2011 /850/EC, II.D.ii.21)
Distance to major junction (AAQD Annex III.C and 2011/850/EC, II.D.ii.29)
Traffic volume (2011/850/EC,II.D.ii.30)
Traffic emissions (IPR Guidance, XML user guide D5.1.5.3. pp 127)
Heavy duty fraction (2011/850/EC, II.D.ii.31)
Traffic speed (2011/850/EC, II.D.ii.32)
Street-canyon - Width of street (2011/850 /EC,II.D.ii.33)
The rating of the difficulty to compile this information was to be provided as a value from 1 to 5 where
the different values meant:
1- Very easy
2- Easy
3- Reasonable
4- Difficult
5- Very Difficult
Responses to this question varied from 42 to 46 depending on the parameter under consideration.
Figure 3-18 summarises the responses for the different micro-scale parameters for traffic-oriented
sampling points. The information related to traffic emissions are the ones that are considered most
difficult to compile by the respondents. 61% of the respondents consider that the compilation of traffic
emissions in the vicinity of sampling points is ether difficult or very difficult. 62% considered the
compilation of the heavy-duty fraction as either difficult or very difficult. 49% of the respondents
considered traffic speed calculation difficult or very difficult and 48% considered the same for traffic
volume. In this case, the responses showed no significant bias between countries or expertise other
than the general respondent bias already identified at the beginning of this chapter.
Figure 3-20. Difficulty of compilation of different micro-scale siting information required under e-reporting for traffic-oriented sampling points
15
12
10
8
3
3
4
10
16
17
17
2
2
2
5
8
11
14
13
14
12
11
14
17
4
3
6
16
11
13
10
8
0
0
0
6
16
13
12
2
0 5 10 15 20 25 30 35 40 45 50
Building distance
Kerb distance
Distance to major junction
Traffic volume
Traffic emissions
Heavy duty fraction
Traffic speed
Street-canyon - Width of street
Number of respondents
1 - Very easy 2 - Easy 3 - Reasonable 4 - Difficult 5 - Very difficult
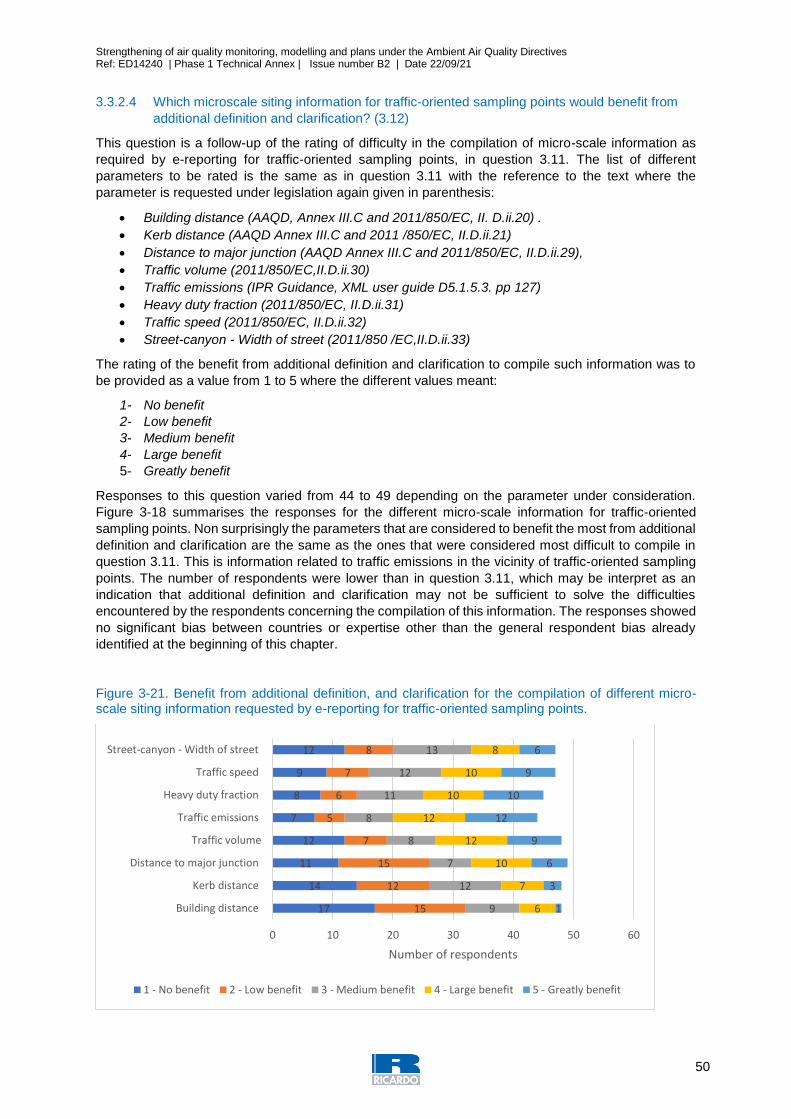
Strengthening of air quality monitoring, modelling and plans under the Ambient Air Quality Directives Ref: ED14240 | Phase 1 Technical Annex | Issue number B2 | Date 22/09/21
50
3.3.2.4 Which microscale siting information for traffic-oriented sampling points would benefit from
additional definition and clarification? (3.12)
This question is a follow-up of the rating of difficulty in the compilation of micro-scale information as
required by e-reporting for traffic-oriented sampling points, in question 3.11. The list of different
parameters to be rated is the same as in question 3.11 with the reference to the text where the
parameter is requested under legislation again given in parenthesis:
Building distance (AAQD, Annex III.C and 2011/850/EC, II. D.ii.20) .
Kerb distance (AAQD Annex III.C and 2011 /850/EC, II.D.ii.21)
Distance to major junction (AAQD Annex III.C and 2011/850/EC, II.D.ii.29),
Traffic volume (2011/850/EC,II.D.ii.30)
Traffic emissions (IPR Guidance, XML user guide D5.1.5.3. pp 127)
Heavy duty fraction (2011/850/EC, II.D.ii.31)
Traffic speed (2011/850/EC, II.D.ii.32)
Street-canyon - Width of street (2011/850 /EC,II.D.ii.33)
The rating of the benefit from additional definition and clarification to compile such information was to
be provided as a value from 1 to 5 where the different values meant:
1- No benefit
2- Low benefit
3- Medium benefit
4- Large benefit
5- Greatly benefit
Responses to this question varied from 44 to 49 depending on the parameter under consideration.
Figure 3-18 summarises the responses for the different micro-scale information for traffic-oriented
sampling points. Non surprisingly the parameters that are considered to benefit the most from additional
definition and clarification are the same as the ones that were considered most difficult to compile in
question 3.11. This is information related to traffic emissions in the vicinity of traffic-oriented sampling
points. The number of respondents were lower than in question 3.11, which may be interpret as an
indication that additional definition and clarification may not be sufficient to solve the difficulties
encountered by the respondents concerning the compilation of this information. The responses showed
no significant bias between countries or expertise other than the general respondent bias already
identified at the beginning of this chapter.
Figure 3-21. Benefit from additional definition, and clarification for the compilation of different micro-scale siting information requested by e-reporting for traffic-oriented sampling points.
17
14
11
12
7
8
9
12
15
12
15
7
5
6
7
8
9
12
7
8
8
11
12
13
6
7
10
12
12
10
10
8
1
3
6
9
12
10
9
6
0 10 20 30 40 50 60
Building distance
Kerb distance
Distance to major junction
Traffic volume
Traffic emissions
Heavy duty fraction
Traffic speed
Street-canyon - Width of street
Number of respondents
1 - No benefit 2 - Low benefit 3 - Medium benefit 4 - Large benefit 5 - Greatly benefit
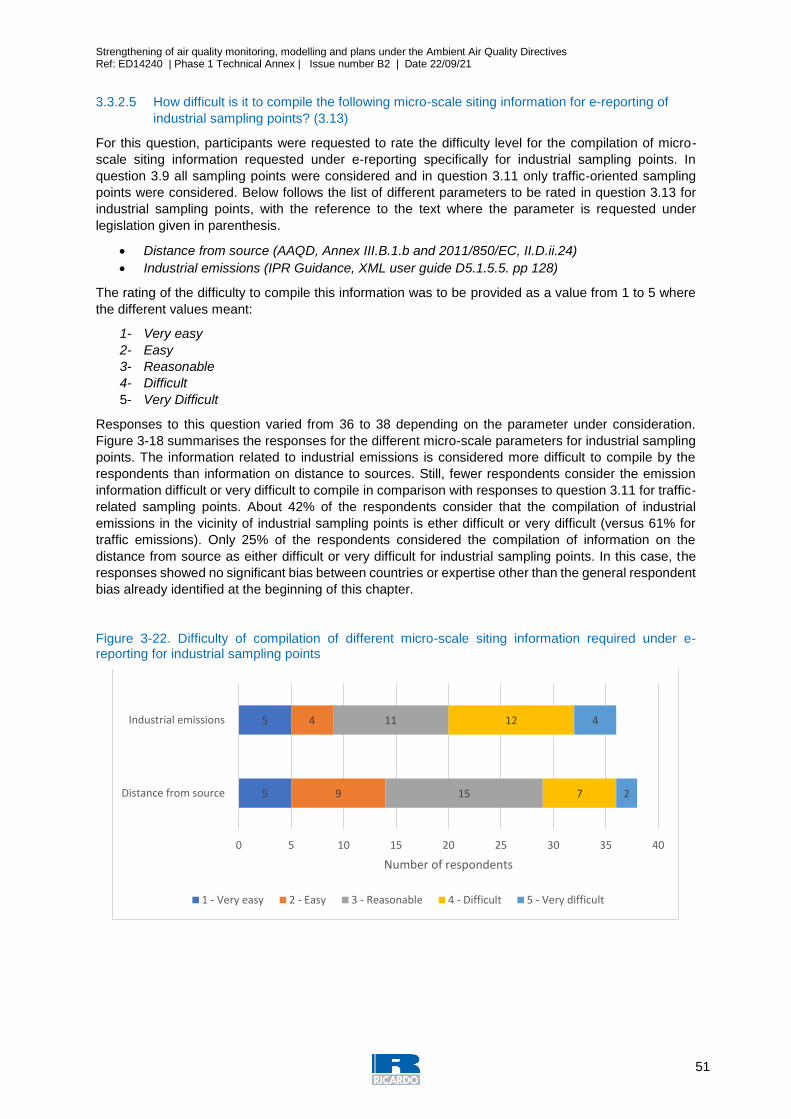
Strengthening of air quality monitoring, modelling and plans under the Ambient Air Quality Directives Ref: ED14240 | Phase 1 Technical Annex | Issue number B2 | Date 22/09/21
51
3.3.2.5 How difficult is it to compile the following micro-scale siting information for e-reporting of
industrial sampling points? (3.13)
For this question, participants were requested to rate the difficulty level for the compilation of micro-
scale siting information requested under e-reporting specifically for industrial sampling points. In
question 3.9 all sampling points were considered and in question 3.11 only traffic-oriented sampling
points were considered. Below follows the list of different parameters to be rated in question 3.13 for
industrial sampling points, with the reference to the text where the parameter is requested under
legislation given in parenthesis.
Distance from source (AAQD, Annex III.B.1.b and 2011/850/EC, II.D.ii.24)
Industrial emissions (IPR Guidance, XML user guide D5.1.5.5. pp 128)
The rating of the difficulty to compile this information was to be provided as a value from 1 to 5 where
the different values meant:
1- Very easy
2- Easy
3- Reasonable
4- Difficult
5- Very Difficult
Responses to this question varied from 36 to 38 depending on the parameter under consideration.
Figure 3-18 summarises the responses for the different micro-scale parameters for industrial sampling
points. The information related to industrial emissions is considered more difficult to compile by the
respondents than information on distance to sources. Still, fewer respondents consider the emission
information difficult or very difficult to compile in comparison with responses to question 3.11 for traffic-
related sampling points. About 42% of the respondents consider that the compilation of industrial
emissions in the vicinity of industrial sampling points is ether difficult or very difficult (versus 61% for
traffic emissions). Only 25% of the respondents considered the compilation of information on the
distance from source as either difficult or very difficult for industrial sampling points. In this case, the
responses showed no significant bias between countries or expertise other than the general respondent
bias already identified at the beginning of this chapter.
Figure 3-22. Difficulty of compilation of different micro-scale siting information required under e-reporting for industrial sampling points
5
5
9
4
15
11
7
12
2
4
0 5 10 15 20 25 30 35 40
Distance from source
Industrial emissions
Number of respondents
1 - Very easy 2 - Easy 3 - Reasonable 4 - Difficult 5 - Very difficult
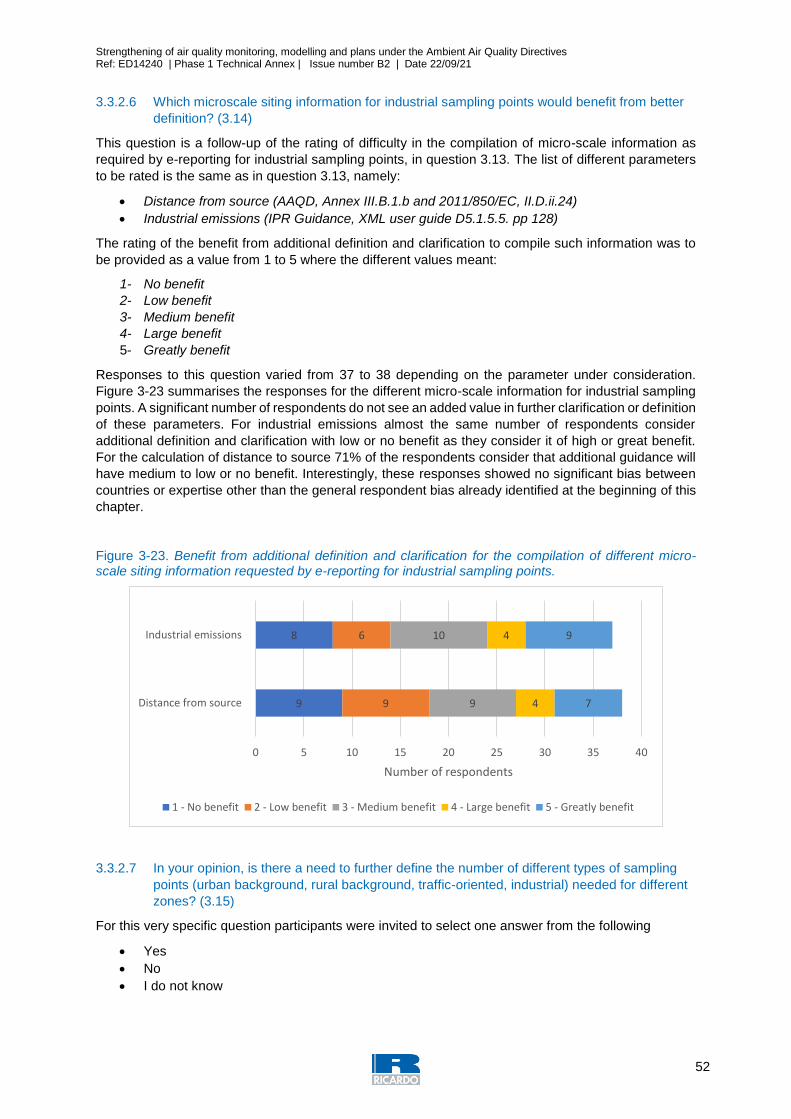
Strengthening of air quality monitoring, modelling and plans under the Ambient Air Quality Directives Ref: ED14240 | Phase 1 Technical Annex | Issue number B2 | Date 22/09/21
52
3.3.2.6 Which microscale siting information for industrial sampling points would benefit from better
definition? (3.14)
This question is a follow-up of the rating of difficulty in the compilation of micro-scale information as
required by e-reporting for industrial sampling points, in question 3.13. The list of different parameters
to be rated is the same as in question 3.13, namely:
Distance from source (AAQD, Annex III.B.1.b and 2011/850/EC, II.D.ii.24)
Industrial emissions (IPR Guidance, XML user guide D5.1.5.5. pp 128)
The rating of the benefit from additional definition and clarification to compile such information was to
be provided as a value from 1 to 5 where the different values meant:
1- No benefit
2- Low benefit
3- Medium benefit
4- Large benefit
5- Greatly benefit
Responses to this question varied from 37 to 38 depending on the parameter under consideration.
Figure 3-23 summarises the responses for the different micro-scale information for industrial sampling
points. A significant number of respondents do not see an added value in further clarification or definition
of these parameters. For industrial emissions almost the same number of respondents consider
additional definition and clarification with low or no benefit as they consider it of high or great benefit.
For the calculation of distance to source 71% of the respondents consider that additional guidance will
have medium to low or no benefit. Interestingly, these responses showed no significant bias between
countries or expertise other than the general respondent bias already identified at the beginning of this
chapter.
Figure 3-23. Benefit from additional definition and clarification for the compilation of different micro-scale siting information requested by e-reporting for industrial sampling points.
3.3.2.7 In your opinion, is there a need to further define the number of different types of sampling
points (urban background, rural background, traffic-oriented, industrial) needed for different
zones? (3.15)
For this very specific question participants were invited to select one answer from the following
Yes
No
I do not know
9
8
9
6
9
10
4
4
7
9
0 5 10 15 20 25 30 35 40
Distance from source
Industrial emissions
Number of respondents
1 - No benefit 2 - Low benefit 3 - Medium benefit 4 - Large benefit 5 - Greatly benefit
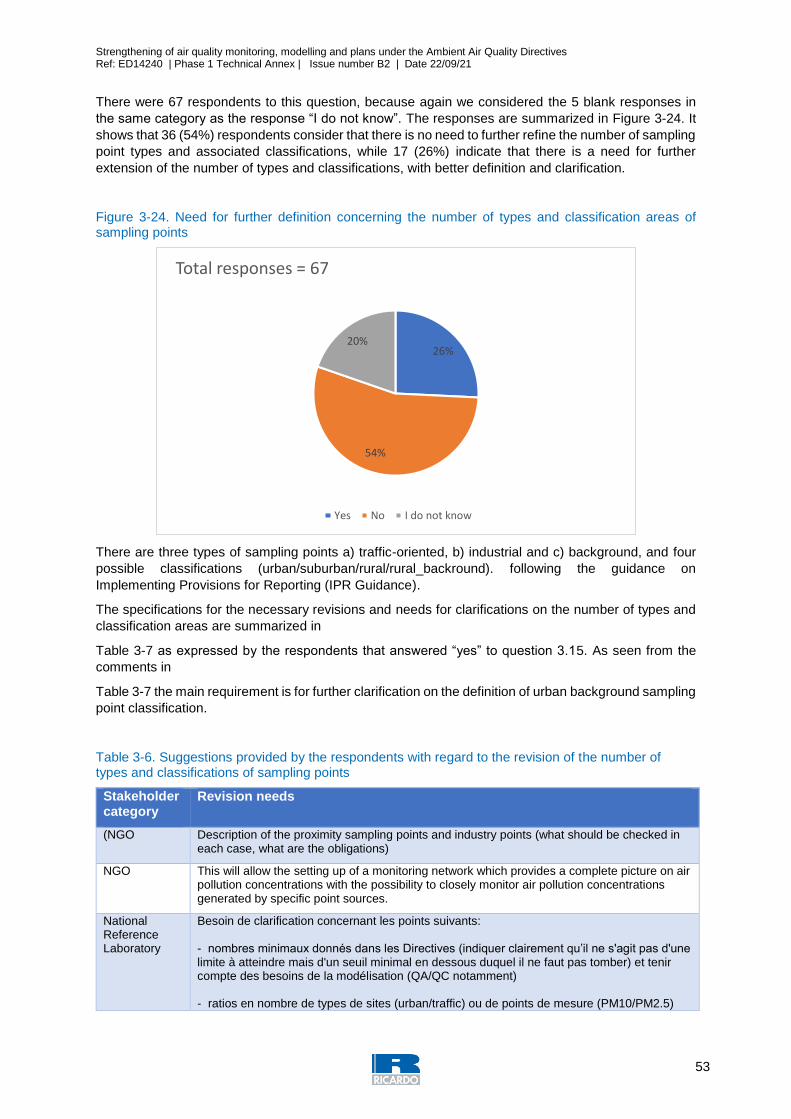
Strengthening of air quality monitoring, modelling and plans under the Ambient Air Quality Directives Ref: ED14240 | Phase 1 Technical Annex | Issue number B2 | Date 22/09/21
53
There were 67 respondents to this question, because again we considered the 5 blank responses in
the same category as the response “I do not know”. The responses are summarized in Figure 3-24. It
shows that 36 (54%) respondents consider that there is no need to further refine the number of sampling
point types and associated classifications, while 17 (26%) indicate that there is a need for further
extension of the number of types and classifications, with better definition and clarification.
Figure 3-24. Need for further definition concerning the number of types and classification areas of sampling points
There are three types of sampling points a) traffic-oriented, b) industrial and c) background, and four
possible classifications (urban/suburban/rural/rural_backround). following the guidance on
Implementing Provisions for Reporting (IPR Guidance).
The specifications for the necessary revisions and needs for clarifications on the number of types and
classification areas are summarized in
Table 3-7 as expressed by the respondents that answered “yes” to question 3.15. As seen from the
comments in
Table 3-7 the main requirement is for further clarification on the definition of urban background sampling
point classification.
Table 3-6. Suggestions provided by the respondents with regard to the revision of the number of types and classifications of sampling points
Stakeholder category
Revision needs
(NGO Description of the proximity sampling points and industry points (what should be checked in each case, what are the obligations)
NGO This will allow the setting up of a monitoring network which provides a complete picture on air pollution concentrations with the possibility to closely monitor air pollution concentrations generated by specific point sources.
National Reference Laboratory
Besoin de clarification concernant les points suivants: - nombres minimaux donnés dans les Directives (indiquer clairement qu’il ne s'agit pas d'une limite à atteindre mais d'un seuil minimal en dessous duquel il ne faut pas tomber) et tenir compte des besoins de la modélisation (QA/QC notamment) - ratios en nombre de types de sites (urban/traffic) ou de points de mesure (PM10/PM2.5)
26%
54%
20%
Total responses = 67
Yes No I do not know

Strengthening of air quality monitoring, modelling and plans under the Ambient Air Quality Directives Ref: ED14240 | Phase 1 Technical Annex | Issue number B2 | Date 22/09/21
54
qui sont contraignants (notes 1 & 2 après le tableau de l’annexe V.A.1). En outre le calcul de ces ratios n’est pas clair (prise ou non en compte des sites périurbains par exemple? n'inclure que les sites des zones > UAT ?) - statut des sites industriels - nombre minimum de points spécifiques à la surveillance de l’O3 végétation (minimum confondu pour la santé et la végétation actuellement)
Competent Authorities
Expanded classification guidance would be of merit.
(NGO See previous comments on importance of coverage of both source and exposure environments to better inform corrective policies to ensure good AQ.
National Reference Laboratory
The need is more on clarification concerning - current number mentioned in directives (this number shall be considered as a minimum threshold below which no Member State can go. Otherwise there is a risk of credibility loss with the general public and incomplete basis for relatively objective assessment of AQ representativeness. Besides it should take account of modelling) - ratios in number of type of sites (urban/traffic) or in sampling points (PM10/PM2.5) which are quite constraining in terms of necessary means to deploy (notes 1 & 2 after table of Annex V.A.1. in AQD 2008/50/EC). In addition, we still don’t know if periurban sites can be considered in the calculation. - status of industrial sites -minimum number of sampling points dedicated to impact of ozone on vegetation (current text consider human health & vegetation together)
(NGO Annex V is not consistent, as it sets minimum numbers of sampling points for zones/agglomerations; however, the requirements for the proportion between total number of urban background and total number of traffic oriented station is set for the entire territory of a Member State (see Annex V, Section A(1), footnote (1)). Such a discrepancy between the different levels and the criteria, makes it very difficult to assess compliance with the requirements. It also leads to inconsistent practices across the EU. Moreover, Annex V requires authorities to “include at least one urban background monitoring station and one traffic-orientated station provided this does not increase the number of sampling points”. However, it does not clarify what type of station should be installed in zones and agglomerations where only one sampling point is mandatory. Respondent submits that, when only one station is required, this should be in the area where the highest concentrations occur in order to avoid the risk of exceedances going unnoticed. This single station per zone/agglomeration, therefore, should be traffic-orientated. The legal framework on the ration between number and type of stations is further weakened by the extremely wide discretion of authorities in classifying a station as “traffic” or “background” (see further answers below). Respondent recommends to amend Annex V, A.1, footnotes (1) and (2) to provide as follows: - the proportion between number and types of stations should apply at zone and/or agglomeration level, rather than in the whole territory of Member States - in zones and/or agglomerations where only one sampling point is required, this should be traffic oriented.
Competent Authorities
Share of traffic an urban/suburban for each zone
National Reference Laboratory
Almost no requirements in directive 2008/50/EG for sample points near industrial sources
Competent Authorities
The number of urban traffic and background stations cannot differ with a factor 2 (current AAQD). More weight should be given to the proportion of urban background stations.
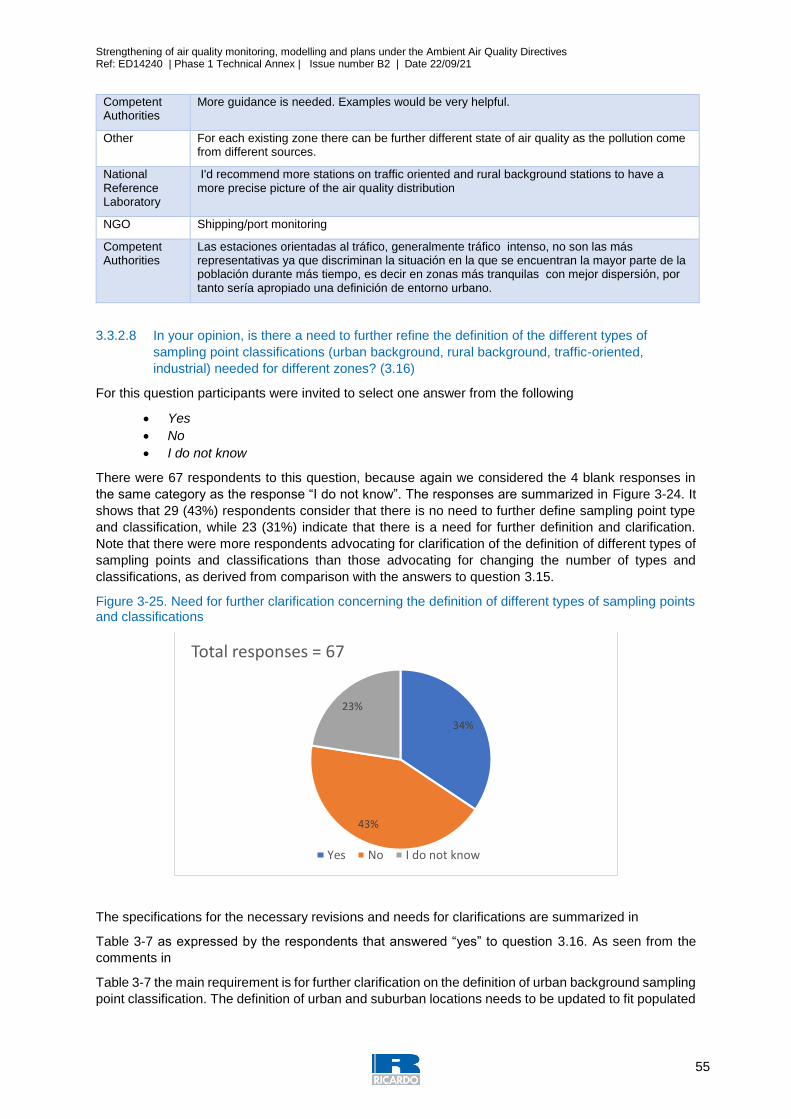
Strengthening of air quality monitoring, modelling and plans under the Ambient Air Quality Directives Ref: ED14240 | Phase 1 Technical Annex | Issue number B2 | Date 22/09/21
55
Competent Authorities
More guidance is needed. Examples would be very helpful.
Other For each existing zone there can be further different state of air quality as the pollution come from different sources.
National Reference Laboratory
I'd recommend more stations on traffic oriented and rural background stations to have a more precise picture of the air quality distribution
NGO Shipping/port monitoring
Competent Authorities
Las estaciones orientadas al tráfico, generalmente tráfico intenso, no son las más representativas ya que discriminan la situación en la que se encuentran la mayor parte de la población durante más tiempo, es decir en zonas más tranquilas con mejor dispersión, por tanto sería apropiado una definición de entorno urbano.
3.3.2.8 In your opinion, is there a need to further refine the definition of the different types of
sampling point classifications (urban background, rural background, traffic-oriented,
industrial) needed for different zones? (3.16)
For this question participants were invited to select one answer from the following
Yes
No
I do not know
There were 67 respondents to this question, because again we considered the 4 blank responses in
the same category as the response “I do not know”. The responses are summarized in Figure 3-24. It
shows that 29 (43%) respondents consider that there is no need to further define sampling point type
and classification, while 23 (31%) indicate that there is a need for further definition and clarification.
Note that there were more respondents advocating for clarification of the definition of different types of
sampling points and classifications than those advocating for changing the number of types and
classifications, as derived from comparison with the answers to question 3.15.
Figure 3-25. Need for further clarification concerning the definition of different types of sampling points and classifications
The specifications for the necessary revisions and needs for clarifications are summarized in
Table 3-7 as expressed by the respondents that answered “yes” to question 3.16. As seen from the
comments in
Table 3-7 the main requirement is for further clarification on the definition of urban background sampling
point classification. The definition of urban and suburban locations needs to be updated to fit populated
34%
43%
23%
Total responses = 67
Yes No I do not know
Strengthening of air quality monitoring, modelling and plans under the Ambient Air Quality Directives Ref: ED14240 | Phase 1 Technical Annex | Issue number B2 | Date 22/09/21
56
areas of different sizes and to be linked to the need to identify the areas with maximum concentrations
or hot spots. There were different proposals on how to define and clarify the type and classification of
sampling points. In many cases the two concepts “sampling point type” and “sampling point area
classification” seemed to be inter- exchanged. There were recommendations to link the sampling point
area classification with urban soil classification systems for consistency across Europe and also to
increase the number of sampling point types to include more sources such as agricultural, airports and
ports.
Table 3-7. Proposed revisions on the definition of sampling point types and classifications from the respondents to the on-line questionnaire
Stakeholder category
Revision needs
NGO Better establish the obligations on proximity sampling points
Competent Authorities
Urban soil classification (urban forest, green areas, building areas, airport, river ...
NGO Yes, new categories could be created (e.g. agricultural stations, airport stations, port stations)
National Reference Laboratory
La notion de site "urbain de fond” n’est pas claire dans la Directive : inclut-elle ou non les sites périurbains de fond? Les sites "trafic" peuvent-ils inclure des sites ruraux sous influence du trafic ? Ou s'agit-il uniquement de sites urbains ou périurbains?
Competent Authorities
Expanded guidance giving more detailed definitions would be of merit.
National Reference Laboratory
Concept of « urban background site » is not clear. Does it include “periurban background sites” or not ?
Competent Authorities
We believe that macro-scale criteria are more important than micro-scale. There has been an issue in our country with questions as to whether our roof-top UB stations are compliant with the directive's requirements due to issues with the micro-scale criteria on inlet height. This was addressed in the latest revision of the directive's annexes, but there should be a focus on ensuring that UB stations really meet the objective of being representative of the exposure of the general population rather than simply finding a location that meets the micro-scale criteria. More guidance on finding and ensuring relevant UB stations is required. As stated in other answers to this questionnaire we also see a need to review provisions regarding required ratios (Traffic/UB and PM10/PM2.5) for sampling points and for the assessment of ozone. We have also revised our national legislation and guidance regarding assessment around point sources/industrial locations. This was, however, a difficult task due to a lack of guidance and provision of good examples from the Commission regarding assessment in accordance with the directive's requirements.
NGO The Air Quality Directive does not contain clear definitions of the different station types and area classifications. It is possible to find the relevant definitions in non-legislative documents (IPR Guidance and EIONET vocabulary). Members of the public and local authorities often are not aware that such non-binding guidance exists. Moreover, there are some inconsistencies between the IPR Guidance and the EIONET vocabulary regarding the definitions of station type. In particular: - the definition of “traffic” stations in the IPR Guidance is shorter and more vague than the one provided by the EIONET Vocabulary - the IPR Guidance does not clarify expressly that “traffic” and “industrial” stations shall be “in a location that should represent the highest concentrations to which the population are exposed to within the zone”. Apart from such inconsistencies, the definitions provided are too vague and leave a grey zone between different types of stations. Possible sampling locations in zones go from one
Strengthening of air quality monitoring, modelling and plans under the Ambient Air Quality Directives Ref: ED14240 | Phase 1 Technical Annex | Issue number B2 | Date 22/09/21
57
extreme (for instance, roads where the highest concentrations of traffic-related pollution occur) to the other (for instance, sub-urban areas, not dominated by any single source type, where levels are representative of the average exposure of the general population). In between, there are many areas where pollution may be dominated by a single source and levels of pollution may be higher than background, but not the highest in the zone. “Traffic” and “industrial” seem to be at one end of the spectrum, as they should represent the highest concentrations within the zone (See EIONET Vocabulary). However, it is not clear if “background” stations are a wide residual category (that would include all areas where pollution is lower than at the traffic or industrial hot-spots) or a narrowly-defined type. In particular, according to the first sentence of the IPR Guidance’s definition, “background” stations seem to be a residual category that includes “[a]ny location [which] is neither to be classified as ‘traffic’ or ‘industrial’”. However, other requirements narrow down the scope of the definition, by adding that background stations should (a) be representative of the average exposure of the general population within the type of area under assessment; (b) be representative of a wider area of at least several square kilometres; (c) not be dominated by a single source type (e.g. traffic). To add further confusion, the definition adds an exception, according to which “background” stations may be dominated by a single source if that source type is typical within the area under assessment. Such lack of clarity leaves it to competent authorities to decide, almost arbitrarily, whether to classify a station as “traffic” or “background”. For example, competent authorities in Brussels use several distinctions in the type of monitoring stations in the region. Traffic-oriented stations are divided as follows: “Urban with low influence from traffic”, “Urban with moderate influence from traffic”, “Urban with strong influence from traffic”, and “Urban with very strong influence from traffic”. Even if some sampling points have similar characteristics, some of them are classified as “traffic” stations (e.g. 41R001 and 41WOL1) and others as “background” (e.g. 41B004 and 41B006). This results in lack of consistency within single zones (e.g. Brussels). It also undermines the possibility to compare levels between cities and Member States. This lack of clarity makes it also very difficult to verify whether Member States are complying with the minimum requirements regarding ratio between “traffic” and “background” stations set under Annex V, footnote (1). In order to comply with this ratio, authorities can qualify a station falling in the grey zone as “traffic” or “background”, depending on their needs. The best way to distinguish between “traffic” and “background” station would be to clarify that “traffic” station must be placed in hot-spots, while “background” stations are a residual category, for all other locations in a zone. This approach would avoid the risk of leaving a grey zone of locations that do not fall under any definition. Consideration should be given to introducing a specific category of monitoring sites to be installed in hotspots for PM pollution. In most cities, the dominant source of primary PM emissions is domestic heating, rather than traffic. Authorities should be required to map zones and agglomerations, to identify the areas where the highest concentrations of PM are likely to occur. To this purpose, competent authorities should rely on source apportionment and data collected at existing PM sampling points about chemical composition. We recommend to insert clear and consistent definitions of station types (“traffic”, “industrial” and “background”) and area classifications (“urban”, “suburban” and “rural”) in the Air Quality Directive. Such definitions could be included in Annex III or Annex V.
Competent Authorities
It is needed clarification about difference between urban and suburban, maybe linked with the density of population
Competent Authorities
Difficulty to define a rural background in Alpine Valleys, especially when crossed by important traffic ways
Competent Authorities
Agricultural background
National Reference Laboratory
Addition of industrial area (besides urban, suburban, rural) for e.g. port of Antwerp
Competent Authorities
More clarification needed for urban background and traffic-oriented monitoring stations
Strengthening of air quality monitoring, modelling and plans under the Ambient Air Quality Directives Ref: ED14240 | Phase 1 Technical Annex | Issue number B2 | Date 22/09/21
58
Competent Authorities
It is needed a clarification about the difference between urban and suburban, maybe linked with the density of population
Other Agricultural background
Competent authorities
We need clearer boundaries for the different type of sampling points. For example the difference of urban and suburban.
Other For each existing zone there can be further different state of air quality as the pollution come from different sources.
Competent Authorities
Better clarification urban/suburban background
Other For a more precise description of measured 'picture' of the air quality distribution
Competent Authorities
Quantitative criteria
Competent Authorities
El entorno urbano y los puntos orientados al tráfico deben de diferenciar más su finalidad y ámbito de aplicación.
3.3.2.9 In your opinion, is there a need for additional guidance on establishing ‘assessment
methods on sampling points’, and their reporting in dataflow D? If yes, what? (3.17)
The respondents were asked to identify in free text any need for additional guidance on establishing
assessment methods on sampling points, and their reporting in dataflow D. There were 31 respondents
to this question. Over half of the respondents, 17 (55%) considered that there was no need for additional
guidance while 14 (45%) answered that they needed extra guidance. The response from those needed
guidance is compiled in Table 3-8 below. Note that there is no significant bias in the responses between
countries or expertise other than the general respondent bias already identified at the beginning of this
chapter. There is a large variability in the level of detail of the responses, and also in the topics identified.
However, the topics identified are the same as have been raised through previous responses under
question 3.16
Table 3-8. Needs for additional guidance on establishing assessment methods for sampling points
Stakeholder category
In your opinion, is there a need for additional guidance on establishing ‘assessment methods on sampling points’, and their reporting in dataflow D? If yes, what?
Competent Authorities
Guidance needed for specific requirements about microscale siting
NGO Yes, exceedances should be more clearly highlighted; an the link to the geographical location of the monitoring station should be provided.
National Reference Laboratory
Oui. Besoin de recommandations sur les mesures utilisées comme estimation objective (la Directive ne contient aucun critère qualité en matière de couverture temporelle, taux de saisie, répartition des mesures sur l’année).
Competent Authorities
Yes, more detailed guidance would be of merit.
National Reference Laboratory
We need recommendations on measurements to be considered as « objective estimation ». AQD doesn’t mention any quality criteria in terms of time coverage, data capture, distribution of measurements throughout the year. In terms of communication, an uncertainty of ± 100% is difficult for the general public to understand
Competent Authorities
Yes. We have raised these issues before within the AQUILA expert group. We see significant potential to improve guidance and harmonisation of reporting around issues such as measurement methods and equipment, uncertainties, detection limits, representativeness of monitoring stations and documentation on QA/QC, traceability and equivalence.
NGO Yes. One aspect where additional guidance is needed is about Documentation and review of site selection. As underlined by the CJEU in Case C-723/17 Craeynest (para. 51), it is essential that authorities prepare comprehensive documentation that includes evidence supporting the choice of the location of all monitoring sites. The site documentation is essential to allow oversight on whether the network design is
Strengthening of air quality monitoring, modelling and plans under the Ambient Air Quality Directives Ref: ED14240 | Phase 1 Technical Annex | Issue number B2 | Date 22/09/21
59
adequate to measure both hotspots and general exposure. It is equally important that authorities regularly re-assess the network design. However, according to respondent’s experience, authorities have implemented this obligation to a very limited extent. If it does exist, such documentation is very sparse and does not contain any information on how the network has been designed. Such documentation is not proactively published by authorities. See also European Parliament Study, page 9: “with the exception of Germany, no documentation is available showing if the traffic-orientated monitoring stations cover the areas with the highest concentration per zone. Furthermore, none of the analysed Member States have prepared documentation showing if monitoring sites reflect the general population exposure.” Section D of Annex III should be amended in order to include better guidance on how authorities should pre-assess and re-assess the network design and how they should document the site selection. As regards pre-assessment and re-assessment, Annex III, Section D, should lay out expressly the steps that competent authorities must follow in designing (and re-assessing) the network. Modelling and other complementary measurements play a key role in assessing the spatial distribution of pollution levels and designing the network. The Directive should require authorities to use models and indicative measurements to assess the spatial distribution of levels of pollution in zones and agglomerations. The site documentation should then include a section to explain how authorities have taken into consideration the results of such pre-assessment/re-assessment of spatial distribution in order to select the location of fixed sampling points, including reasons to explain: - the selection of locations representative of the highest levels of pollution in the zone or agglomeration - the selection of locations representative of the general exposure of population - any deviation from the microscale siting criteria and the likely impact on measured levels, including a possible correction factor to take into account under- or over-estimation of pollution levels. Finally, the site documentation should include an adequate and timed plan for regular re-assessment of the network design. Annex III, Section D, already provides that the documentation shall be updated and reviewed at least every 5 years, to ensure that selection criteria, network design and monitoring site locations remain valid and optimal over time. In addition to such provision, authorities should be obliged to carry out more frequent modelling and indicative studies. In Respondent’s view, it is reasonable to require authorities to model spatial distribution of pollutants and carry out indicative measurement campaigns of short duration at locations likely to be typical of the highest pollution levels at regular intervals (at least yearly). Whenever the results of the modelling and/or indicative measurements detect flaws in the monitoring network (for instance, because there is no fixed monitoring station in the area of modelled maximum levels), this should trigger an obligation to review the network design within a maximum deadline. Annex III, Section D, should also be amended to require expressly authorities to proactively make the site documentation available to the public. Consideration should also be given to the opportunity of carrying out public consultations during the network design procedures and allow inclusion of data collected through citizen science measurement campaigns. We recommend to Amend III, Section D, in order to include better guidance on the process to be followed to design monitoring networks. In particular, Annex III should include requirements on the following: - compulsory use of models and indicative measurements to pre-assess and re-assess the spatial distribution of levels of pollution in zones and agglomerations - obligation to give reasons and include evidence to support the network design
Strengthening of air quality monitoring, modelling and plans under the Ambient Air Quality Directives Ref: ED14240 | Phase 1 Technical Annex | Issue number B2 | Date 22/09/21
60
- obligation to prepare and describe in the site documentation adequate and timed plans for regular re-assessment of the network design - obligation to correct the network design within a maximum deadline, when results of modelling or indicative measurements detect flaws in the monitoring network. Annex III, Section D, should also require expressly authorities to proactively make the site documentation available to the public and to carry out public consultations during the network design procedures.
NGO Mandatory modelling for the selection of sampling points to ensure hot spots are covered
Competent Authorities
We would like the COM to approach in the AQ Directive revision the following conflict in terms of the minimum number of sampling points for fixed measurements. In the assessment regime information, the concept of fixed measurements is linked to reach the DQO values and sometimes, despite of having a Fixed Station with an automatic sampling point, some years for unexpected circumstances it could become indicative measurement so for compliance of minimum number this sampling point could not be considered.
Competent Authorities
It is important to revise the reference methods for example to evaluate the possibility of including the automatic measurement for PM as a reference method as many regional networks are installing this equipment because these analyzers provide UTD data. Also, it is necessary some guidance about several concepts equivalent demonstration and uncertainty.
National Reference Laboratory
Reduce the information required, focus on essential information
Competent Authorities
Guidance on "establishing areas where highest concentrations occur" and "exposure general population"
NGO Maybe addition of port stations
Competent Authorities
Si, no resulta coherente evaluar la situación de la calidad del aire de entornos urbanos únicamente teniendo en cuenta las mediciones de los puntos de muestreo orientados orientados al tráfico. Hay que tener en cuenta la representividad de cada estación.
3.3.2.10 Please add any other suggestion on how to further improve the siting and classification of
sampling points (3.18)
There were 11 responses to this final question to question block 3 on the siting and classification of
sampling points. The final set of comments from the respondents did not generally add any new
elements but effectively summarised some of their previous views and comments. These are provided
in the Table below for completeness, compiled and reproduced in their original form and full integrity.
Table 3-9 Additional suggestions to further improve the siting and classification of sampling points
Stakeholder category
Please add any other suggestion on how to further improve the siting and classification of sampling points (3.18)
Competent Authorities
Specific information about junctions
Competent authorities
Comments as above in question 3.17.
National Reference Laboratory
See above in question 3.17 ;-)
Competent Authorities
One key issue that needs addressing is the discrepancy between where limit values apply and where AQ should be assessed. For example, do the limit values apply at junctions or in micro-environments? This is unclear in the current directive. Questions on where limit values apply can have major implications for city planning. Clearer
Strengthening of air quality monitoring, modelling and plans under the Ambient Air Quality Directives Ref: ED14240 | Phase 1 Technical Annex | Issue number B2 | Date 22/09/21
61
provisions and guidance/common understanding is needed on this issue. There is also a case to review the micro-scale criteria on distance from the kerbside. Some municipalities place the stations at kerbside, some at the back of the kerb, while others are placed some meters away from the kerb. This can have a very significant impact on concentrations and there is a good case for implementing more stringent criteria to ensure comparable results. At the very least, more guidance should be provided on optimal placement, allowing for some variation for practical reasons. Where there is significant variation, how do we take account of the fact that some fixed measurements will show lower concentrations than other placed closer to the kerb? Modelling, indicative measurements and/or measurement campaigns can be part of the solution to such issues. We are encouraged by recent efforts by the Commission and expert groups FAIRMODE and AQUILA, looking more closely into issues on siting and classification of sampling points. This work needs to be continued to ensure improved guidance and more systematic reviews and feedback on current approaches.
NGO It would be important to provide more guidance and clearer provisions on macro and microscale siting criteria in Annex III AQD. Macroscale criteria Two aspects that could be improved. (1) Many authorities claim that exceedances of limit values at roadside locations are not relevant, as people do not spend there a significant period of time. We suggest deleting from Annex III, B.1.(a) the following sentence “to which the population is likely to be directly or indirectly exposed for a period which is significant in relation to the averaging period of the limit value(s)”. This sentence is not needed, given that Annex III, A.2, already clarifies that compliance with limit values shall not be assessed at “any locations situated within areas where members of the public do not have access and there is no fixed habitation” or “on the carriageway of roads; and on the central reservations of roads except where there is normally pedestrian access to the central reservation.” (2) Provide additional guidance on how to determine the representativeness of sampling points. Microscale siting criteria The Commission should review the microscale siting criteria to identify where the margin of discretion is not justified under a technical point of view. If so, the AQD should be amended to offer clearer guidance and improve comparability of data from different MS and cities. For instance, Directive 99/30/EC required authorities to locate inlets of traffic-oriented samplers for NO2 at no more than 5 meters from the kerbside. Under the Air Quality Directive 2008/50/EC, this criteria has been increased to 10 meters. Considering NO2 measurements exhibit high spatial variability, this increased discretion has led in some cases to “artificial” drops in measured levels, simply by moving a station further away from the kerbside. The Commission should also consider amendments to the criteria that “traffic-orientated sampling probes shall be at least 25 m from the edge of major junctions”. According to a recent review of monitoring stations across Europe, positioning an air quality station closer than 25 m to the edge of a major junction has no significant effect on measured levels of pollutants. In some situations, better ventilation at junctions causes comparably lower concentrations at the junction itself than in other parts of the road segment (See European Parliament Study, page 30 and Annex C.) The Directive should clarify that this criteria is only relevant when the particular location at a major junction would lead to measuring “very small micro-environments” that are not representative of levels along that road segment. In this regard, a link should be made between the microscale siting criteria and the representativeness requirement under the macroscale criteria.
Strengthening of air quality monitoring, modelling and plans under the Ambient Air Quality Directives Ref: ED14240 | Phase 1 Technical Annex | Issue number B2 | Date 22/09/21
62
Rather than the distance from junctions, there are other characteristics of traffic stations that significantly influence measured levels and representativeness. Such characteristics relate to the traffic volume and the local dispersion conditions, depending on the width and the type of street and the structure of buildings around the monitoring site. In order to ensure the objective of measuring the highest concentrations in the zone, the AQD should require authorities to locate traffic stations in street canyons. Moreover, unlike Section B, the guidance for microscale criteria in Section C applies only “in so far as is practicable”. Section C provides that “Any deviation from the criteria listed in this Section shall be fully documented through the procedures described in Section D”. However, Annex III does not clarify whether deviations affect the validity of data collected. Annex III should expressly clarify that deviations do not allow authorities to ignore the data collected from such sampling points. Deviations can lead to either underestimating or overestimating concentration levels. For instance, the impact of locating a monitoring station at a major junction may result in lower measured concentrations (because of better ventilation). Therefore, authorities should be obliged to describe in the site selection documentation not only the reasons for any deviations, but also the estimated impact on concentrations measured, along with a potential corrector factor.
NGO More information for traffic-related monitoring stations in the case of representativeness of 100 meters. Some authorities interpret this to mean that limit value exceedances are acceptable as long as the road section is less than 100 meter long. People living in streets where there are only 95 metres between two intersections often have to accept that the limit values are exceeded.
National Reference Laboratory
A sampling point's surroundings may change for shorter or longer periods, e.g. due to construction work. The Directives should give guidance on how to handle this with regards to the classification of the station/sampling point in relation to predominant emission sources. E.g., should the classification of the sampling point be kept unchanged for the duration of the deviating emission source or should it be reclassified and then classified back when the deviation is over. A typical deviating period would be a few months to 2-3 years.
Competent Authorities
A distinction should be made between major junctions and squares. The siting of monitoring points should be allowed on squares, which represent an important public exposure situation in big cities.
Competent Authorities
Clarification regarding 2008/50/EC, Annex III, B, 1a; What does it mean "...directly or indirectly..." and what does it mean?: "...significant.."
National Reference Laboratory
Less definitions, more examples for use in practice
Competent Authorities
Analysis of the impact of deviations from microscale siting criteria
3.3.3 Main messages
The evaluation of responses to the 17 specific questions in block Q3 (concerning the micro-and macro-
scale criteria given in the AAQD to determine the siting of sampling points in the fixed measurement air
quality monitoring network, with focus in areas with high concentration levels) helped us identify four
main messages for further technical consideration.
A key issue concerning macroscale siting of sampling points is representativeness
There is a generalised need for guidance on what methodologies are to be used to assess
sampling points representativeness. The role of additional indicative measurements and
modelling results to determine sampling point representativeness needs to be explained and
clarified also in the AAQDs.
Burden from IPR decision and e-reporting requirements. The requirements associated with
the e-reporting of information on the macro and micro-scale siting of sampling points are
considered to contribute significantly to the administrative burden of reporting. Some of the
Strengthening of air quality monitoring, modelling and plans under the Ambient Air Quality Directives Ref: ED14240 | Phase 1 Technical Annex | Issue number B2 | Date 22/09/21
63
requested parameters, especially those related to emission characterisation are difficult to
compile and the justification for their request is not always understood. There is a need to
simplify the requirements of the reporting and better justify the need for those parameters that
are to be reported.
The role of industrial sampling points needs for clarification of the role of industrial sampling
points and whether these are to be linked to point sources. It is also not clear how industrial
sampling points are to be linked to the purpose to establish hotspots for population exposure.
It is expected that existing gaps in industrial sampling points are related to this lack of
clarification. It is suggested to include a minimum number of industrial sampling points to avoid
assessment gaps around these types of sources, an issue already identified under Q2 and that
will be further discussed in Q4.
The urban/suburban sampling point classification. The definition of urban and suburban
locations needs to be updated to fit populated areas of different sizes and to be linked to the
need to identify the areas with maximum concentrations or hot spots. The use of additional
indicative measurements and modelled data to help in the sampling point classification with
respect to areas needs to be considered. This issue is closely related to the need to revise the
methodologies to be used to define air quality zones and to identify areas with maximum
exposure to air pollutants. It affects both ozone and all other pollutants in Annex III.
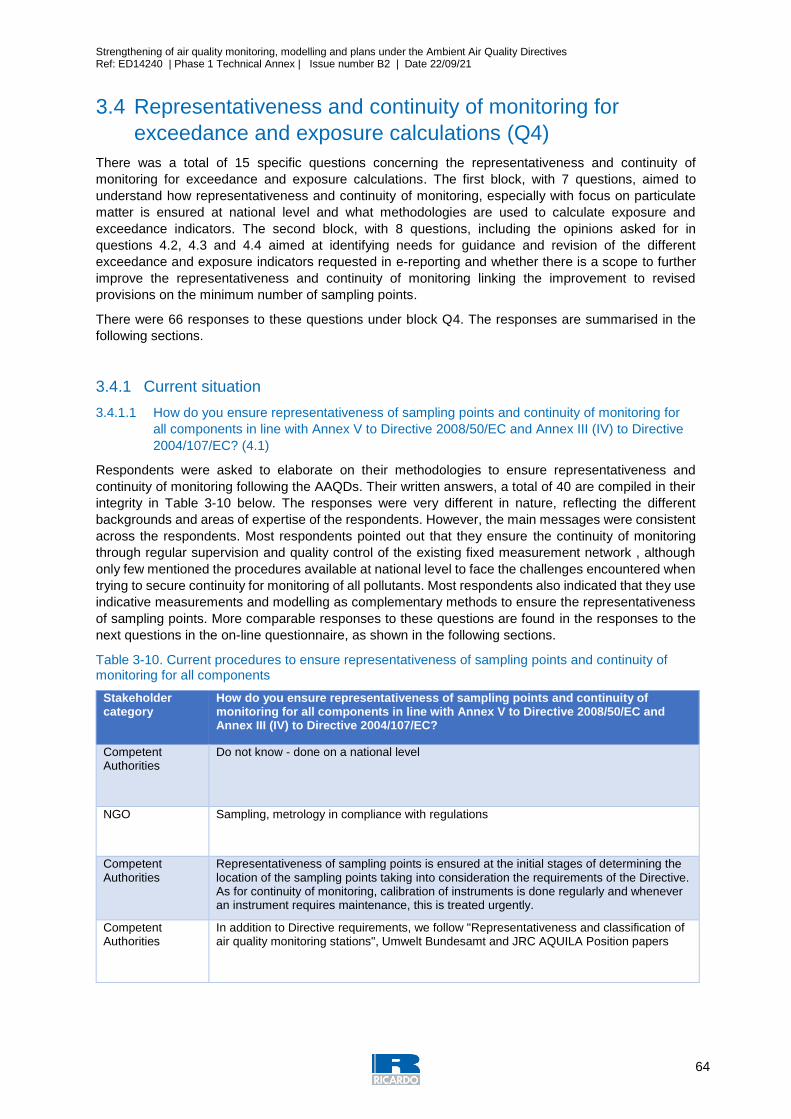
Strengthening of air quality monitoring, modelling and plans under the Ambient Air Quality Directives Ref: ED14240 | Phase 1 Technical Annex | Issue number B2 | Date 22/09/21
64
3.4 Representativeness and continuity of monitoring for
exceedance and exposure calculations (Q4)
There was a total of 15 specific questions concerning the representativeness and continuity of
monitoring for exceedance and exposure calculations. The first block, with 7 questions, aimed to
understand how representativeness and continuity of monitoring, especially with focus on particulate
matter is ensured at national level and what methodologies are used to calculate exposure and
exceedance indicators. The second block, with 8 questions, including the opinions asked for in
questions 4.2, 4.3 and 4.4 aimed at identifying needs for guidance and revision of the different
exceedance and exposure indicators requested in e-reporting and whether there is a scope to further
improve the representativeness and continuity of monitoring linking the improvement to revised
provisions on the minimum number of sampling points.
There were 66 responses to these questions under block Q4. The responses are summarised in the
following sections.
3.4.1 Current situation
3.4.1.1 How do you ensure representativeness of sampling points and continuity of monitoring for
all components in line with Annex V to Directive 2008/50/EC and Annex III (IV) to Directive
2004/107/EC? (4.1)
Respondents were asked to elaborate on their methodologies to ensure representativeness and
continuity of monitoring following the AAQDs. Their written answers, a total of 40 are compiled in their
integrity in Table 3-10 below. The responses were very different in nature, reflecting the different
backgrounds and areas of expertise of the respondents. However, the main messages were consistent
across the respondents. Most respondents pointed out that they ensure the continuity of monitoring
through regular supervision and quality control of the existing fixed measurement network , although
only few mentioned the procedures available at national level to face the challenges encountered when
trying to secure continuity for monitoring of all pollutants. Most respondents also indicated that they use
indicative measurements and modelling as complementary methods to ensure the representativeness
of sampling points. More comparable responses to these questions are found in the responses to the
next questions in the on-line questionnaire, as shown in the following sections.
Table 3-10. Current procedures to ensure representativeness of sampling points and continuity of monitoring for all components
Stakeholder category
How do you ensure representativeness of sampling points and continuity of monitoring for all components in line with Annex V to Directive 2008/50/EC and Annex III (IV) to Directive 2004/107/EC?
Competent Authorities
Do not know - done on a national level
NGO Sampling, metrology in compliance with regulations
Competent Authorities
Representativeness of sampling points is ensured at the initial stages of determining the location of the sampling points taking into consideration the requirements of the Directive. As for continuity of monitoring, calibration of instruments is done regularly and whenever an instrument requires maintenance, this is treated urgently.
Competent Authorities
In addition to Directive requirements, we follow "Representativeness and classification of air quality monitoring stations", Umwelt Bundesamt and JRC AQUILA Position papers
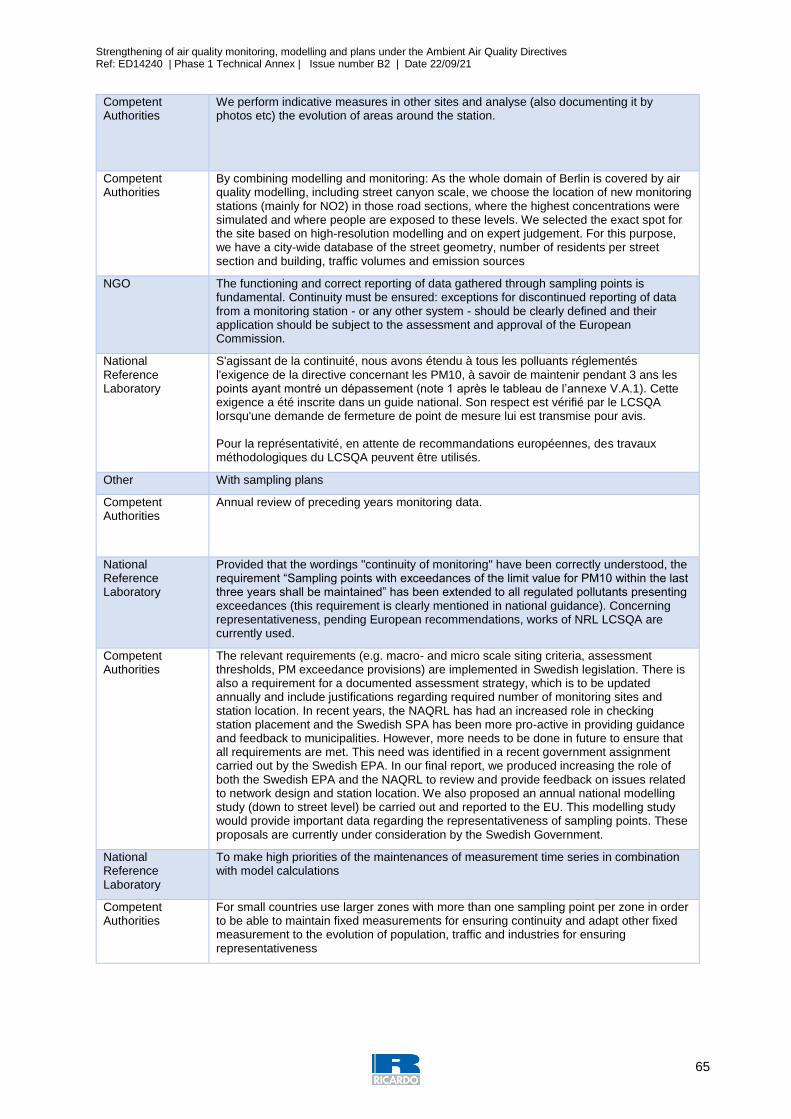
Strengthening of air quality monitoring, modelling and plans under the Ambient Air Quality Directives Ref: ED14240 | Phase 1 Technical Annex | Issue number B2 | Date 22/09/21
65
Competent Authorities
We perform indicative measures in other sites and analyse (also documenting it by photos etc) the evolution of areas around the station.
Competent Authorities
By combining modelling and monitoring: As the whole domain of Berlin is covered by air quality modelling, including street canyon scale, we choose the location of new monitoring stations (mainly for NO2) in those road sections, where the highest concentrations were simulated and where people are exposed to these levels. We selected the exact spot for the site based on high-resolution modelling and on expert judgement. For this purpose, we have a city-wide database of the street geometry, number of residents per street section and building, traffic volumes and emission sources
NGO The functioning and correct reporting of data gathered through sampling points is fundamental. Continuity must be ensured: exceptions for discontinued reporting of data from a monitoring station - or any other system - should be clearly defined and their application should be subject to the assessment and approval of the European Commission.
National Reference Laboratory
S'agissant de la continuité, nous avons étendu à tous les polluants réglementés l'exigence de la directive concernant les PM10, à savoir de maintenir pendant 3 ans les points ayant montré un dépassement (note 1 après le tableau de l’annexe V.A.1). Cette exigence a été inscrite dans un guide national. Son respect est vérifié par le LCSQA lorsqu'une demande de fermeture de point de mesure lui est transmise pour avis. Pour la représentativité, en attente de recommandations européennes, des travaux méthodologiques du LCSQA peuvent être utilisés.
Other With sampling plans
Competent Authorities
Annual review of preceding years monitoring data.
National Reference Laboratory
Provided that the wordings "continuity of monitoring" have been correctly understood, the requirement “Sampling points with exceedances of the limit value for PM10 within the last three years shall be maintained” has been extended to all regulated pollutants presenting exceedances (this requirement is clearly mentioned in national guidance). Concerning representativeness, pending European recommendations, works of NRL LCSQA are currently used.
Competent Authorities
The relevant requirements (e.g. macro- and micro scale siting criteria, assessment thresholds, PM exceedance provisions) are implemented in Swedish legislation. There is also a requirement for a documented assessment strategy, which is to be updated annually and include justifications regarding required number of monitoring sites and station location. In recent years, the NAQRL has had an increased role in checking station placement and the Swedish SPA has been more pro-active in providing guidance and feedback to municipalities. However, more needs to be done in future to ensure that all requirements are met. This need was identified in a recent government assignment carried out by the Swedish EPA. In our final report, we produced increasing the role of both the Swedish EPA and the NAQRL to review and provide feedback on issues related to network design and station location. We also proposed an annual national modelling study (down to street level) be carried out and reported to the EU. This modelling study would provide important data regarding the representativeness of sampling points. These proposals are currently under consideration by the Swedish Government.
National Reference Laboratory
To make high priorities of the maintenances of measurement time series in combination with model calculations
Competent Authorities
For small countries use larger zones with more than one sampling point per zone in order to be able to maintain fixed measurements for ensuring continuity and adapt other fixed measurement to the evolution of population, traffic and industries for ensuring representativeness
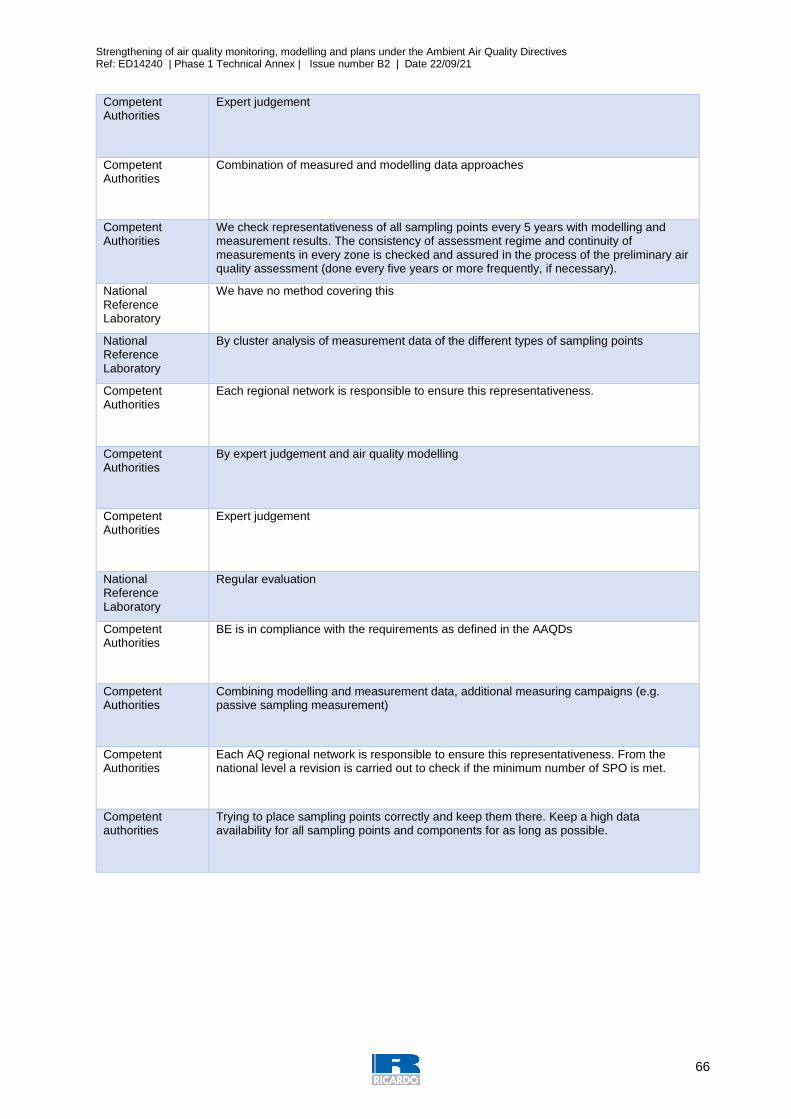
Strengthening of air quality monitoring, modelling and plans under the Ambient Air Quality Directives Ref: ED14240 | Phase 1 Technical Annex | Issue number B2 | Date 22/09/21
66
Competent Authorities
Expert judgement
Competent Authorities
Combination of measured and modelling data approaches
Competent Authorities
We check representativeness of all sampling points every 5 years with modelling and measurement results. The consistency of assessment regime and continuity of measurements in every zone is checked and assured in the process of the preliminary air quality assessment (done every five years or more frequently, if necessary).
National Reference Laboratory
We have no method covering this
National Reference Laboratory
By cluster analysis of measurement data of the different types of sampling points
Competent Authorities
Each regional network is responsible to ensure this representativeness.
Competent Authorities
By expert judgement and air quality modelling
Competent Authorities
Expert judgement
National Reference Laboratory
Regular evaluation
Competent Authorities
BE is in compliance with the requirements as defined in the AAQDs
Competent Authorities
Combining modelling and measurement data, additional measuring campaigns (e.g. passive sampling measurement)
Competent Authorities
Each AQ regional network is responsible to ensure this representativeness. From the national level a revision is carried out to check if the minimum number of SPO is met.
Competent authorities
Trying to place sampling points correctly and keep them there. Keep a high data availability for all sampling points and components for as long as possible.
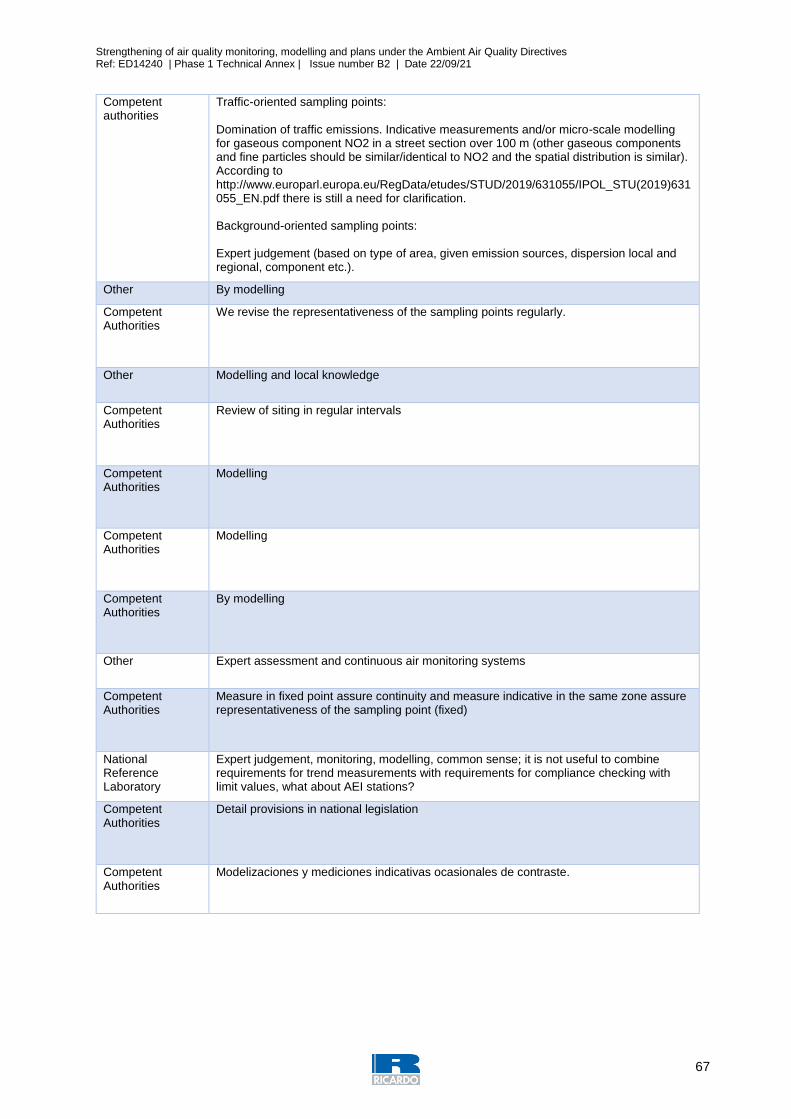
Strengthening of air quality monitoring, modelling and plans under the Ambient Air Quality Directives Ref: ED14240 | Phase 1 Technical Annex | Issue number B2 | Date 22/09/21
67
Competent authorities
Traffic-oriented sampling points: Domination of traffic emissions. Indicative measurements and/or micro-scale modelling for gaseous component NO2 in a street section over 100 m (other gaseous components and fine particles should be similar/identical to NO2 and the spatial distribution is similar). According to http://www.europarl.europa.eu/RegData/etudes/STUD/2019/631055/IPOL_STU(2019)631055_EN.pdf there is still a need for clarification. Background-oriented sampling points: Expert judgement (based on type of area, given emission sources, dispersion local and regional, component etc.).
Other By modelling
Competent Authorities
We revise the representativeness of the sampling points regularly.
Other Modelling and local knowledge
Competent Authorities
Review of siting in regular intervals
Competent Authorities
Modelling
Competent Authorities
Modelling
Competent Authorities
By modelling
Other Expert assessment and continuous air monitoring systems
Competent Authorities
Measure in fixed point assure continuity and measure indicative in the same zone assure representativeness of the sampling point (fixed)
National Reference Laboratory
Expert judgement, monitoring, modelling, common sense; it is not useful to combine requirements for trend measurements with requirements for compliance checking with limit values, what about AEI stations?
Competent Authorities
Detail provisions in national legislation
Competent Authorities
Modelizaciones y mediciones indicativas ocasionales de contraste.
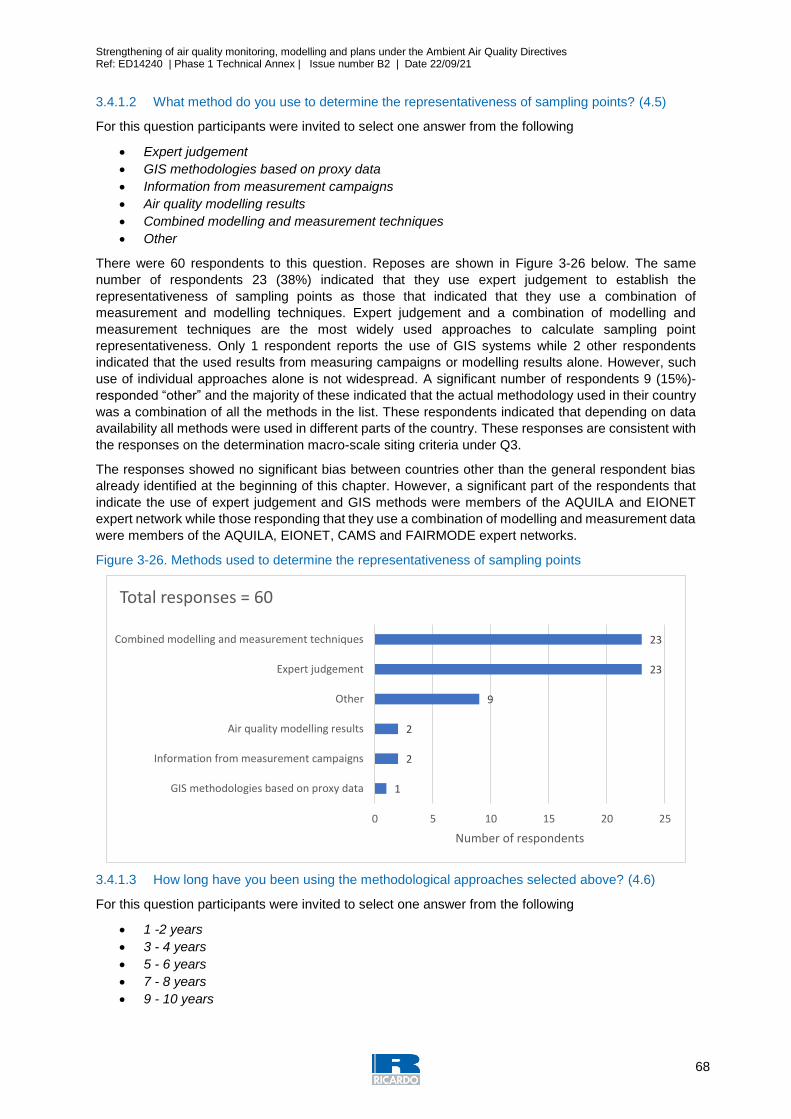
Strengthening of air quality monitoring, modelling and plans under the Ambient Air Quality Directives Ref: ED14240 | Phase 1 Technical Annex | Issue number B2 | Date 22/09/21
68
3.4.1.2 What method do you use to determine the representativeness of sampling points? (4.5)
For this question participants were invited to select one answer from the following
Expert judgement
GIS methodologies based on proxy data
Information from measurement campaigns
Air quality modelling results
Combined modelling and measurement techniques
Other
There were 60 respondents to this question. Reposes are shown in Figure 3-26 below. The same
number of respondents 23 (38%) indicated that they use expert judgement to establish the
representativeness of sampling points as those that indicated that they use a combination of
measurement and modelling techniques. Expert judgement and a combination of modelling and
measurement techniques are the most widely used approaches to calculate sampling point
representativeness. Only 1 respondent reports the use of GIS systems while 2 other respondents
indicated that the used results from measuring campaigns or modelling results alone. However, such
use of individual approaches alone is not widespread. A significant number of respondents 9 (15%)-
responded “other” and the majority of these indicated that the actual methodology used in their country
was a combination of all the methods in the list. These respondents indicated that depending on data
availability all methods were used in different parts of the country. These responses are consistent with
the responses on the determination macro-scale siting criteria under Q3.
The responses showed no significant bias between countries other than the general respondent bias
already identified at the beginning of this chapter. However, a significant part of the respondents that
indicate the use of expert judgement and GIS methods were members of the AQUILA and EIONET
expert network while those responding that they use a combination of modelling and measurement data
were members of the AQUILA, EIONET, CAMS and FAIRMODE expert networks.
Figure 3-26. Methods used to determine the representativeness of sampling points
3.4.1.3 How long have you been using the methodological approaches selected above? (4.6)
For this question participants were invited to select one answer from the following
1 -2 years
3 - 4 years
5 - 6 years
7 - 8 years
9 - 10 years
1
2
2
9
23
23
0 5 10 15 20 25
GIS methodologies based on proxy data
Information from measurement campaigns
Air quality modelling results
Other
Expert judgement
Combined modelling and measurement techniques
Number of respondents
Total responses = 60
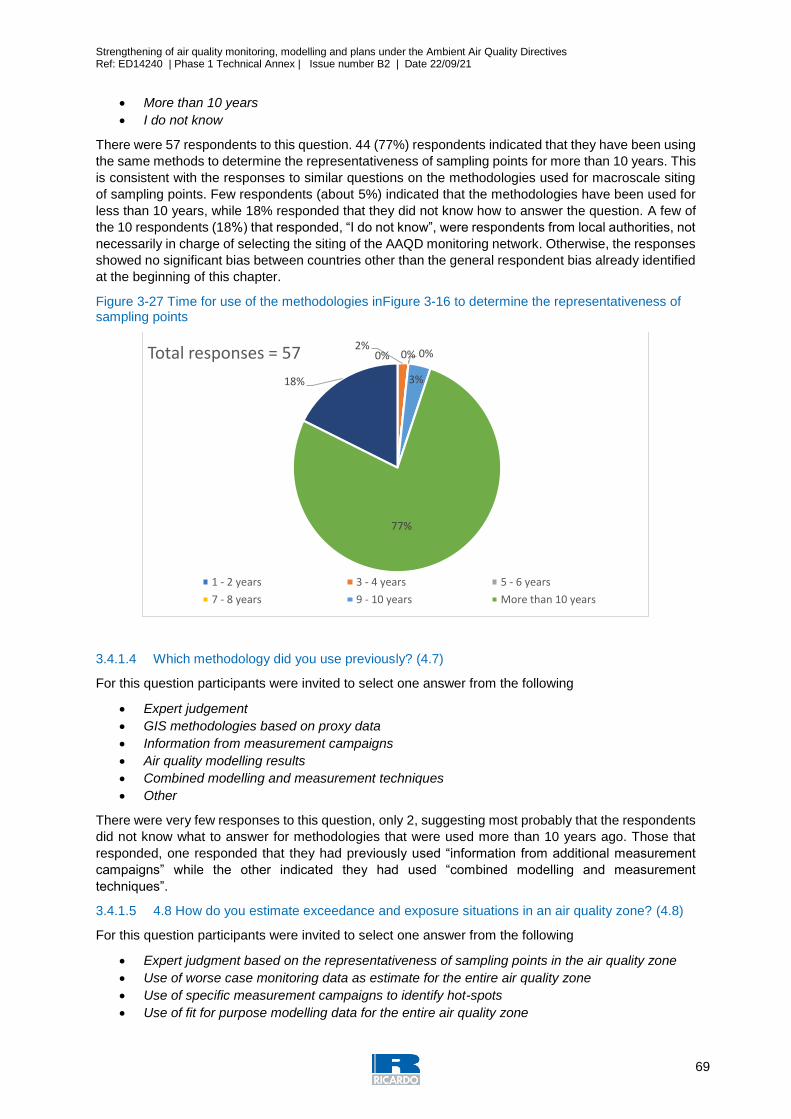
Strengthening of air quality monitoring, modelling and plans under the Ambient Air Quality Directives Ref: ED14240 | Phase 1 Technical Annex | Issue number B2 | Date 22/09/21
69
More than 10 years
I do not know
There were 57 respondents to this question. 44 (77%) respondents indicated that they have been using
the same methods to determine the representativeness of sampling points for more than 10 years. This
is consistent with the responses to similar questions on the methodologies used for macroscale siting
of sampling points. Few respondents (about 5%) indicated that the methodologies have been used for
less than 10 years, while 18% responded that they did not know how to answer the question. A few of
the 10 respondents (18%) that responded, “I do not know”, were respondents from local authorities, not
necessarily in charge of selecting the siting of the AAQD monitoring network. Otherwise, the responses
showed no significant bias between countries other than the general respondent bias already identified
at the beginning of this chapter.
Figure 3-27 Time for use of the methodologies inFigure 3-16 to determine the representativeness of sampling points
3.4.1.4 Which methodology did you use previously? (4.7)
For this question participants were invited to select one answer from the following
Expert judgement
GIS methodologies based on proxy data
Information from measurement campaigns
Air quality modelling results
Combined modelling and measurement techniques
Other
There were very few responses to this question, only 2, suggesting most probably that the respondents
did not know what to answer for methodologies that were used more than 10 years ago. Those that
responded, one responded that they had previously used “information from additional measurement
campaigns” while the other indicated they had used “combined modelling and measurement
techniques”.
3.4.1.5 4.8 How do you estimate exceedance and exposure situations in an air quality zone? (4.8)
For this question participants were invited to select one answer from the following
Expert judgment based on the representativeness of sampling points in the air quality zone
Use of worse case monitoring data as estimate for the entire air quality zone
Use of specific measurement campaigns to identify hot-spots
Use of fit for purpose modelling data for the entire air quality zone
0%2%
0%0%
3%
77%
18%
Total responses = 57
1 - 2 years 3 - 4 years 5 - 6 years
7 - 8 years 9 - 10 years More than 10 years
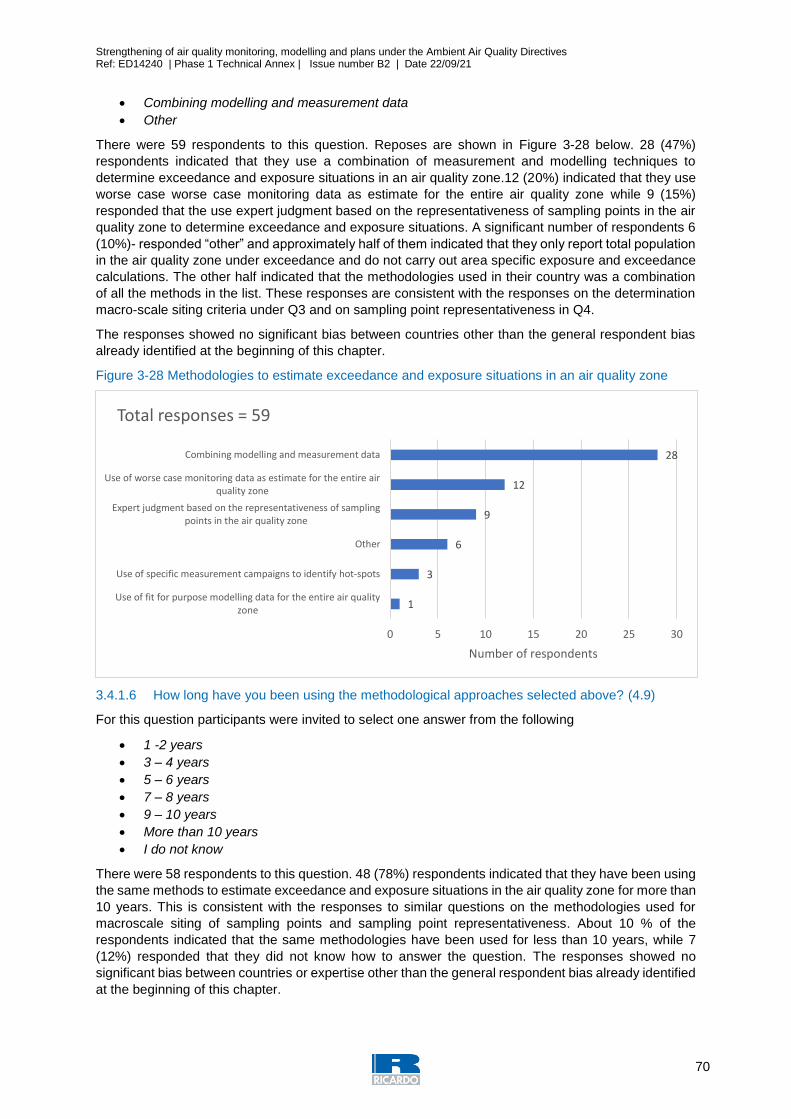
Strengthening of air quality monitoring, modelling and plans under the Ambient Air Quality Directives Ref: ED14240 | Phase 1 Technical Annex | Issue number B2 | Date 22/09/21
70
Combining modelling and measurement data
Other
There were 59 respondents to this question. Reposes are shown in Figure 3-28 below. 28 (47%)
respondents indicated that they use a combination of measurement and modelling techniques to
determine exceedance and exposure situations in an air quality zone.12 (20%) indicated that they use
worse case worse case monitoring data as estimate for the entire air quality zone while 9 (15%)
responded that the use expert judgment based on the representativeness of sampling points in the air
quality zone to determine exceedance and exposure situations. A significant number of respondents 6
(10%)- responded “other” and approximately half of them indicated that they only report total population
in the air quality zone under exceedance and do not carry out area specific exposure and exceedance
calculations. The other half indicated that the methodologies used in their country was a combination
of all the methods in the list. These responses are consistent with the responses on the determination
macro-scale siting criteria under Q3 and on sampling point representativeness in Q4.
The responses showed no significant bias between countries other than the general respondent bias
already identified at the beginning of this chapter.
Figure 3-28 Methodologies to estimate exceedance and exposure situations in an air quality zone
3.4.1.6 How long have you been using the methodological approaches selected above? (4.9)
For this question participants were invited to select one answer from the following
1 -2 years
3 – 4 years
5 – 6 years
7 – 8 years
9 – 10 years
More than 10 years
I do not know
There were 58 respondents to this question. 48 (78%) respondents indicated that they have been using
the same methods to estimate exceedance and exposure situations in the air quality zone for more than
10 years. This is consistent with the responses to similar questions on the methodologies used for
macroscale siting of sampling points and sampling point representativeness. About 10 % of the
respondents indicated that the same methodologies have been used for less than 10 years, while 7
(12%) responded that they did not know how to answer the question. The responses showed no
significant bias between countries or expertise other than the general respondent bias already identified
at the beginning of this chapter.
1
3
6
9
12
28
0 5 10 15 20 25 30
Use of fit for purpose modelling data for the entire air qualityzone
Use of specific measurement campaigns to identify hot-spots
Other
Expert judgment based on the representativeness of samplingpoints in the air quality zone
Use of worse case monitoring data as estimate for the entire airquality zone
Combining modelling and measurement data
Number of respondents
Total responses = 59

Strengthening of air quality monitoring, modelling and plans under the Ambient Air Quality Directives Ref: ED14240 | Phase 1 Technical Annex | Issue number B2 | Date 22/09/21
71
Figure 3-29. Time for use of the methodologies in Figure 3-16 to determine the exceedance and exposure situations within an air quality zone
3.4.1.7 Which methodology did you use previously? (4.10)
For this question participants were invited to select one answer from the following
Expert judgment based on the representativeness of sampling points in the air quality zone
Use of worse case monitoring data as estimate for the entire air quality zone
Use of specific measurement campaigns to identify hot-spots
Use of fit for purpose modelling data for the entire air quality zone
Combining modelling and measurement data
Other
There were very few responses to this question, only 6. However, the responses show an interesting
evolution. Five of the respondents are currently used a combination of modelling and measurement
data for the exceedance and exposure calculations and they all report that these were recently adopted.
The method that was used before was the “use of worse case monitoring data as estimate for the entire
air quality zone”. The last respondent has currently adopted the “use of worse case monitoring data”
from an undefined methodology previously used.
3.4.2 Identified needs for guidance and revision
3.4.2.1 In your opinion, is there a need to revise the minimum number of sampling point
requirements in Annex V of the 2008/50/EC and Annex III (IV) to Directive 2004/107/EC?
(4.2)
For this specific question participants were invited to select one answer from the following
Yes
No
I do not know
There were 66 respondents to this question, because we have considered that the 5 blank responses
are in the same category as the 11 responses stating, “I do not know”. In all about 24% of the
respondents to monitoring questions did not express any opinion on this issue. The responses are
summarized in Figure 3-30. The figure shows that 26 (40%) respondents consider that there is no need
to revise the minimum number of sampling points, while 24 (36%) indicate that there is a need for further
revision. The responses showed no significant bias between countries or expertise other than the
general respondent bias already identified at the beginning of this chapter.
3%3%
0%2%
2%
78%
12%Total responses = 58
1 -2 years 3 - 4 years 5 - 6 years
7 - 8 years 9 -10 years More than 10 years
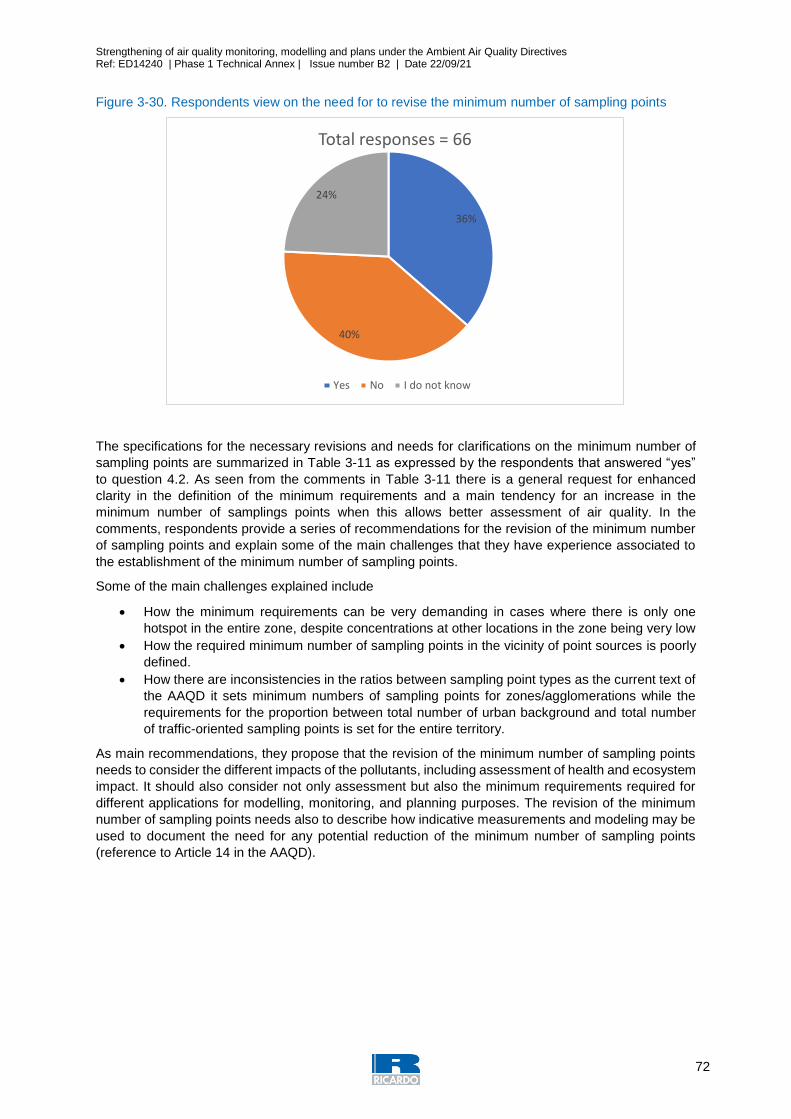
Strengthening of air quality monitoring, modelling and plans under the Ambient Air Quality Directives Ref: ED14240 | Phase 1 Technical Annex | Issue number B2 | Date 22/09/21
72
Figure 3-30. Respondents view on the need for to revise the minimum number of sampling points
The specifications for the necessary revisions and needs for clarifications on the minimum number of
sampling points are summarized in Table 3-11 as expressed by the respondents that answered “yes”
to question 4.2. As seen from the comments in Table 3-11 there is a general request for enhanced
clarity in the definition of the minimum requirements and a main tendency for an increase in the
minimum number of samplings points when this allows better assessment of air quality. In the
comments, respondents provide a series of recommendations for the revision of the minimum number
of sampling points and explain some of the main challenges that they have experience associated to
the establishment of the minimum number of sampling points.
Some of the main challenges explained include
How the minimum requirements can be very demanding in cases where there is only one
hotspot in the entire zone, despite concentrations at other locations in the zone being very low
How the required minimum number of sampling points in the vicinity of point sources is poorly
defined.
How there are inconsistencies in the ratios between sampling point types as the current text of
the AAQD it sets minimum numbers of sampling points for zones/agglomerations while the
requirements for the proportion between total number of urban background and total number
of traffic-oriented sampling points is set for the entire territory.
As main recommendations, they propose that the revision of the minimum number of sampling points
needs to consider the different impacts of the pollutants, including assessment of health and ecosystem
impact. It should also consider not only assessment but also the minimum requirements required for
different applications for modelling, monitoring, and planning purposes. The revision of the minimum
number of sampling points needs also to describe how indicative measurements and modeling may be
used to document the need for any potential reduction of the minimum number of sampling points
(reference to Article 14 in the AAQD).
36%
40%
24%
Total responses = 66
Yes No I do not know
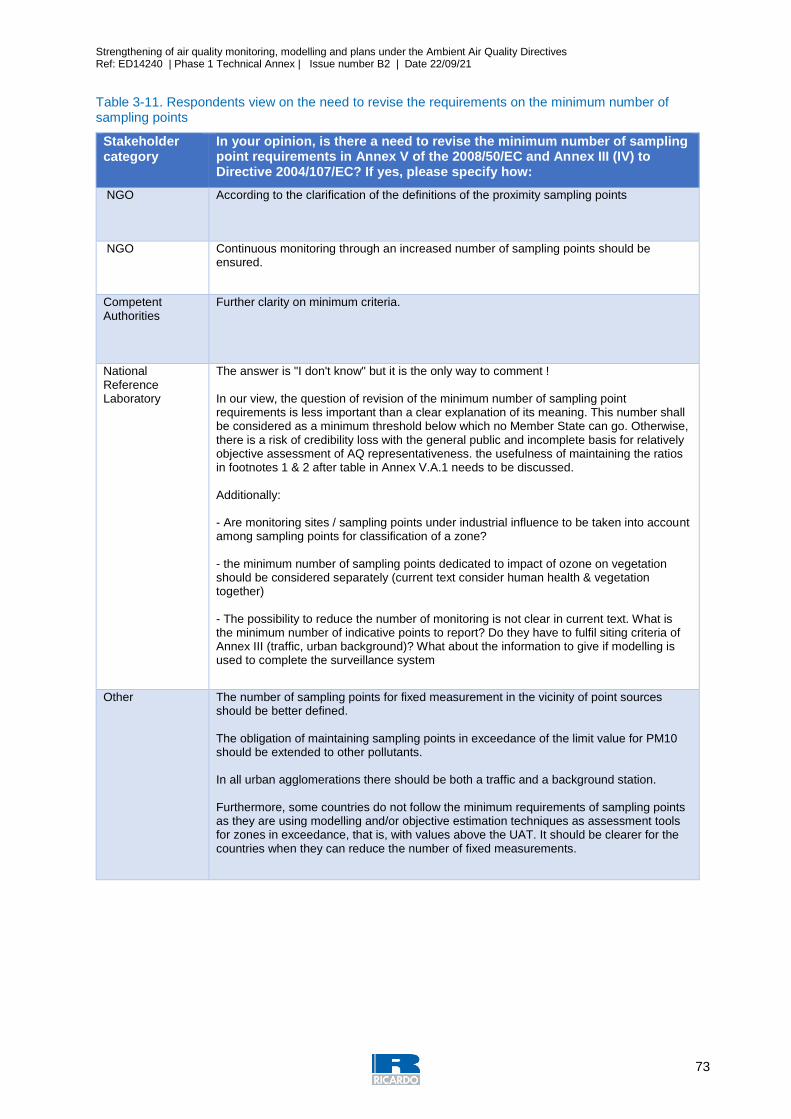
Strengthening of air quality monitoring, modelling and plans under the Ambient Air Quality Directives Ref: ED14240 | Phase 1 Technical Annex | Issue number B2 | Date 22/09/21
73
Table 3-11. Respondents view on the need to revise the requirements on the minimum number of sampling points
Stakeholder category
In your opinion, is there a need to revise the minimum number of sampling point requirements in Annex V of the 2008/50/EC and Annex III (IV) to Directive 2004/107/EC? If yes, please specify how:
NGO According to the clarification of the definitions of the proximity sampling points
NGO Continuous monitoring through an increased number of sampling points should be ensured.
Competent Authorities
Further clarity on minimum criteria.
National Reference Laboratory
The answer is "I don't know" but it is the only way to comment ! In our view, the question of revision of the minimum number of sampling point requirements is less important than a clear explanation of its meaning. This number shall be considered as a minimum threshold below which no Member State can go. Otherwise, there is a risk of credibility loss with the general public and incomplete basis for relatively objective assessment of AQ representativeness. the usefulness of maintaining the ratios in footnotes 1 & 2 after table in Annex V.A.1 needs to be discussed. Additionally: - Are monitoring sites / sampling points under industrial influence to be taken into account among sampling points for classification of a zone? - the minimum number of sampling points dedicated to impact of ozone on vegetation should be considered separately (current text consider human health & vegetation together) - The possibility to reduce the number of monitoring is not clear in current text. What is the minimum number of indicative points to report? Do they have to fulfil siting criteria of Annex III (traffic, urban background)? What about the information to give if modelling is used to complete the surveillance system
Other The number of sampling points for fixed measurement in the vicinity of point sources should be better defined. The obligation of maintaining sampling points in exceedance of the limit value for PM10 should be extended to other pollutants. In all urban agglomerations there should be both a traffic and a background station. Furthermore, some countries do not follow the minimum requirements of sampling points as they are using modelling and/or objective estimation techniques as assessment tools for zones in exceedance, that is, with values above the UAT. It should be clearer for the countries when they can reduce the number of fixed measurements.
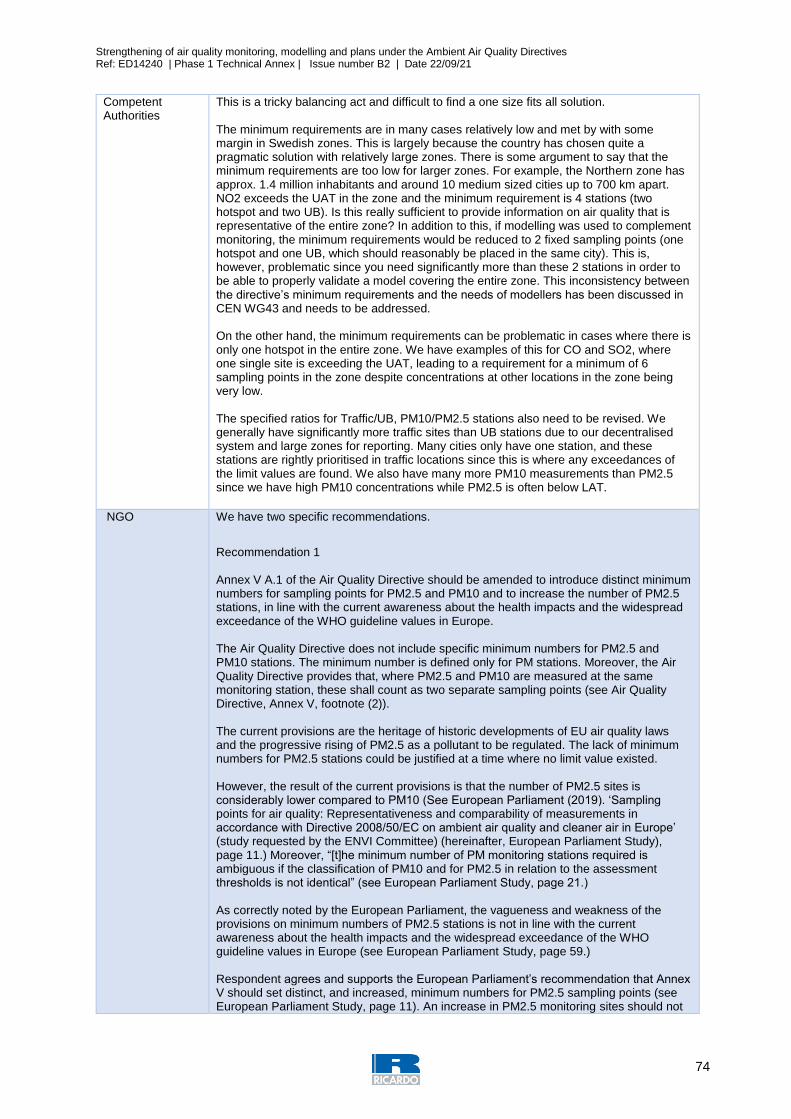
Strengthening of air quality monitoring, modelling and plans under the Ambient Air Quality Directives Ref: ED14240 | Phase 1 Technical Annex | Issue number B2 | Date 22/09/21
74
Competent Authorities
This is a tricky balancing act and difficult to find a one size fits all solution. The minimum requirements are in many cases relatively low and met by with some margin in Swedish zones. This is largely because the country has chosen quite a pragmatic solution with relatively large zones. There is some argument to say that the minimum requirements are too low for larger zones. For example, the Northern zone has approx. 1.4 million inhabitants and around 10 medium sized cities up to 700 km apart. NO2 exceeds the UAT in the zone and the minimum requirement is 4 stations (two hotspot and two UB). Is this really sufficient to provide information on air quality that is representative of the entire zone? In addition to this, if modelling was used to complement monitoring, the minimum requirements would be reduced to 2 fixed sampling points (one hotspot and one UB, which should reasonably be placed in the same city). This is, however, problematic since you need significantly more than these 2 stations in order to be able to properly validate a model covering the entire zone. This inconsistency between the directive’s minimum requirements and the needs of modellers has been discussed in CEN WG43 and needs to be addressed. On the other hand, the minimum requirements can be problematic in cases where there is only one hotspot in the entire zone. We have examples of this for CO and SO2, where one single site is exceeding the UAT, leading to a requirement for a minimum of 6 sampling points in the zone despite concentrations at other locations in the zone being very low. The specified ratios for Traffic/UB, PM10/PM2.5 stations also need to be revised. We generally have significantly more traffic sites than UB stations due to our decentralised system and large zones for reporting. Many cities only have one station, and these stations are rightly prioritised in traffic locations since this is where any exceedances of the limit values are found. We also have many more PM10 measurements than PM2.5 since we have high PM10 concentrations while PM2.5 is often below LAT.
NGO We have two specific recommendations.
Recommendation 1 Annex V A.1 of the Air Quality Directive should be amended to introduce distinct minimum numbers for sampling points for PM2.5 and PM10 and to increase the number of PM2.5 stations, in line with the current awareness about the health impacts and the widespread exceedance of the WHO guideline values in Europe. The Air Quality Directive does not include specific minimum numbers for PM2.5 and PM10 stations. The minimum number is defined only for PM stations. Moreover, the Air Quality Directive provides that, where PM2.5 and PM10 are measured at the same monitoring station, these shall count as two separate sampling points (see Air Quality Directive, Annex V, footnote (2)). The current provisions are the heritage of historic developments of EU air quality laws and the progressive rising of PM2.5 as a pollutant to be regulated. The lack of minimum numbers for PM2.5 stations could be justified at a time where no limit value existed. However, the result of the current provisions is that the number of PM2.5 sites is considerably lower compared to PM10 (See European Parliament (2019). ‘Sampling points for air quality: Representativeness and comparability of measurements in accordance with Directive 2008/50/EC on ambient air quality and cleaner air in Europe’ (study requested by the ENVI Committee) (hereinafter, European Parliament Study), page 11.) Moreover, “[t]he minimum number of PM monitoring stations required is ambiguous if the classification of PM10 and for PM2.5 in relation to the assessment thresholds is not identical” (see European Parliament Study, page 21.) As correctly noted by the European Parliament, the vagueness and weakness of the provisions on minimum numbers of PM2.5 stations is not in line with the current awareness about the health impacts and the widespread exceedance of the WHO guideline values in Europe (see European Parliament Study, page 59.) Respondent agrees and supports the European Parliament’s recommendation that Annex V should set distinct, and increased, minimum numbers for PM2.5 sampling points (see European Parliament Study, page 11). An increase in PM2.5 monitoring sites should not
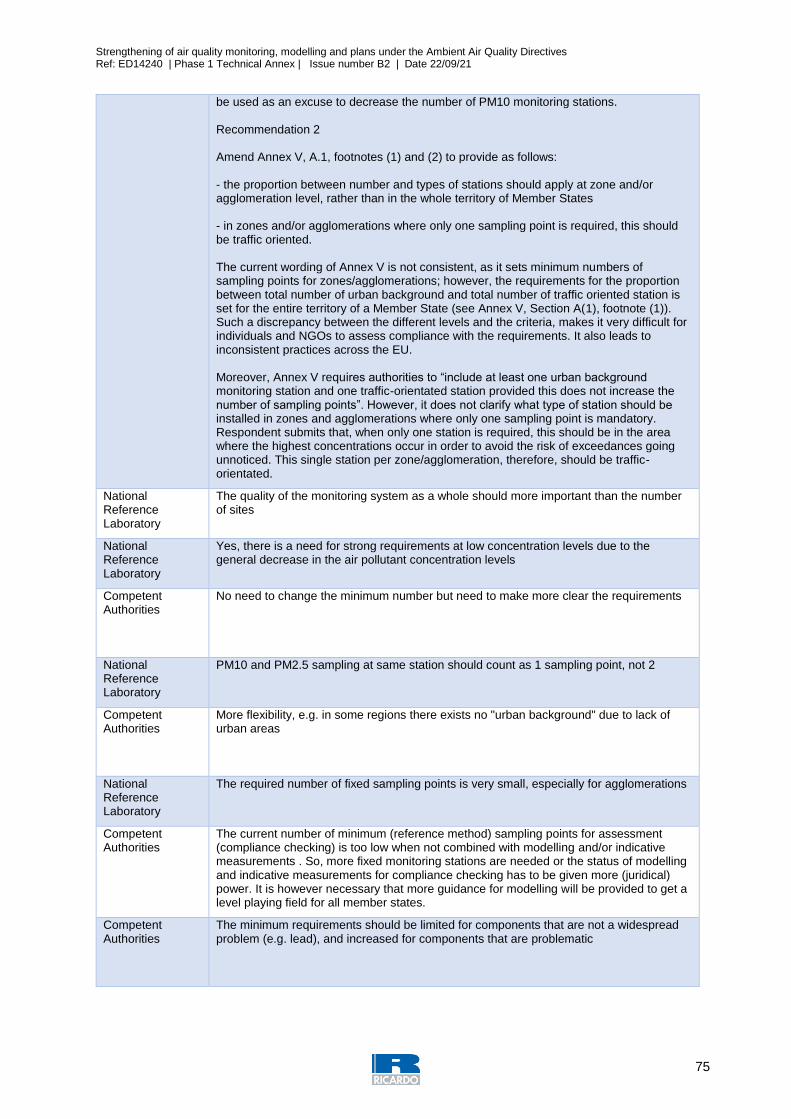
Strengthening of air quality monitoring, modelling and plans under the Ambient Air Quality Directives Ref: ED14240 | Phase 1 Technical Annex | Issue number B2 | Date 22/09/21
75
be used as an excuse to decrease the number of PM10 monitoring stations. Recommendation 2 Amend Annex V, A.1, footnotes (1) and (2) to provide as follows: - the proportion between number and types of stations should apply at zone and/or agglomeration level, rather than in the whole territory of Member States - in zones and/or agglomerations where only one sampling point is required, this should be traffic oriented. The current wording of Annex V is not consistent, as it sets minimum numbers of sampling points for zones/agglomerations; however, the requirements for the proportion between total number of urban background and total number of traffic oriented station is set for the entire territory of a Member State (see Annex V, Section A(1), footnote (1)). Such a discrepancy between the different levels and the criteria, makes it very difficult for individuals and NGOs to assess compliance with the requirements. It also leads to inconsistent practices across the EU. Moreover, Annex V requires authorities to “include at least one urban background monitoring station and one traffic-orientated station provided this does not increase the number of sampling points”. However, it does not clarify what type of station should be installed in zones and agglomerations where only one sampling point is mandatory. Respondent submits that, when only one station is required, this should be in the area where the highest concentrations occur in order to avoid the risk of exceedances going unnoticed. This single station per zone/agglomeration, therefore, should be traffic-orientated.
National Reference Laboratory
The quality of the monitoring system as a whole should more important than the number of sites
National Reference Laboratory
Yes, there is a need for strong requirements at low concentration levels due to the general decrease in the air pollutant concentration levels
Competent Authorities
No need to change the minimum number but need to make more clear the requirements
National Reference Laboratory
PM10 and PM2.5 sampling at same station should count as 1 sampling point, not 2
Competent Authorities
More flexibility, e.g. in some regions there exists no "urban background" due to lack of urban areas
National Reference Laboratory
The required number of fixed sampling points is very small, especially for agglomerations
Competent Authorities
The current number of minimum (reference method) sampling points for assessment (compliance checking) is too low when not combined with modelling and/or indicative measurements . So, more fixed monitoring stations are needed or the status of modelling and indicative measurements for compliance checking has to be given more (juridical) power. It is however necessary that more guidance for modelling will be provided to get a level playing field for all member states.
Competent Authorities
The minimum requirements should be limited for components that are not a widespread problem (e.g. lead), and increased for components that are problematic
Strengthening of air quality monitoring, modelling and plans under the Ambient Air Quality Directives Ref: ED14240 | Phase 1 Technical Annex | Issue number B2 | Date 22/09/21
76
Competent Authorities
Could be a higher minimum requirement.
Competent Authorities
The actual minimum number of sampling points is not adequate for megapoles such as the respondents city, which has 12 millions inhabitants, that is twice the last category of number of inhabitants of the Annex V. The directive should define a number of additional sampling point per million of inhabitants, as in the case of ozone.
Competent Authorities
Also good air quality should be proved from time to time (maintainment of good air quality - detection of changes)
Competent Authorities
Festschreibung von Messungen auch bei niedriger Schadstoffbelastung
Competent Authorities
For accessing air quality in regions below lower threshold
Competent Authorities
Topography, variability of concentrations and health / environmental impacts should be considered
NGO If agglomerate is too large the monitoring points end up being insufficient in large urban areas that are included in much larger agglomerate (e.g. Milan agglomerate arrives to cover Como...)
3.4.2.2 In your opinion, is there a need to revise the minimum number of sampling point
requirements for PM10 and PM2.5 to ensure the continuity of monitoring for particulate
matter in Annex V of the 2008/50/EC? (4.3)
For this specific question participants were invited to select one answer from the following
Yes
No
I do not know
There were 66 respondents to this question, because we have considered that the 4 blank responses
are in the same category as the 7 responses stating, “I do not know”. In all about 17% of the respondents
to monitoring questions did not express any opinion on this issue. The responses are summarized in
Figure 3-30. The figure shows that 30 (45%) respondents consider that there is a need to revise the
minimum number of sampling points for particulate matter as a way to ensure continuity of monitoring,
while 25 (38%) indicate that there is no need for further revision. The responses showed no significant
bias between countries or expertise other than the general respondent bias already identified at the
beginning of this chapter.
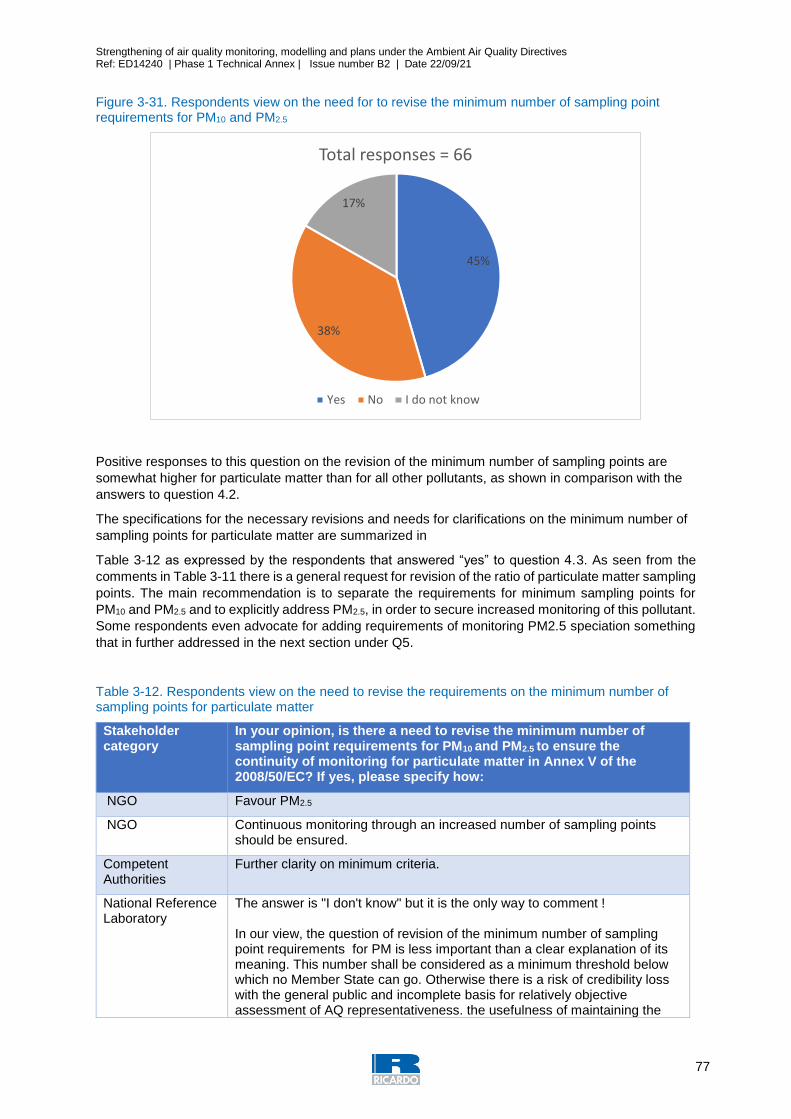
Strengthening of air quality monitoring, modelling and plans under the Ambient Air Quality Directives Ref: ED14240 | Phase 1 Technical Annex | Issue number B2 | Date 22/09/21
77
Figure 3-31. Respondents view on the need for to revise the minimum number of sampling point requirements for PM10 and PM2.5
Positive responses to this question on the revision of the minimum number of sampling points are
somewhat higher for particulate matter than for all other pollutants, as shown in comparison with the
answers to question 4.2.
The specifications for the necessary revisions and needs for clarifications on the minimum number of
sampling points for particulate matter are summarized in
Table 3-12 as expressed by the respondents that answered “yes” to question 4.3. As seen from the
comments in Table 3-11 there is a general request for revision of the ratio of particulate matter sampling
points. The main recommendation is to separate the requirements for minimum sampling points for
PM10 and PM2.5 and to explicitly address PM2.5, in order to secure increased monitoring of this pollutant.
Some respondents even advocate for adding requirements of monitoring PM2.5 speciation something
that in further addressed in the next section under Q5.
Table 3-12. Respondents view on the need to revise the requirements on the minimum number of sampling points for particulate matter
Stakeholder category
In your opinion, is there a need to revise the minimum number of sampling point requirements for PM10 and PM2.5 to ensure the continuity of monitoring for particulate matter in Annex V of the 2008/50/EC? If yes, please specify how:
NGO Favour PM2.5
NGO Continuous monitoring through an increased number of sampling points should be ensured.
Competent Authorities
Further clarity on minimum criteria.
National Reference Laboratory
The answer is "I don't know" but it is the only way to comment ! In our view, the question of revision of the minimum number of sampling point requirements for PM is less important than a clear explanation of its meaning. This number shall be considered as a minimum threshold below which no Member State can go. Otherwise there is a risk of credibility loss with the general public and incomplete basis for relatively objective assessment of AQ representativeness. the usefulness of maintaining the
45%
38%
17%
Total responses = 66
Yes No I do not know
Strengthening of air quality monitoring, modelling and plans under the Ambient Air Quality Directives Ref: ED14240 | Phase 1 Technical Annex | Issue number B2 | Date 22/09/21
78
ratios in footnotes 1 & 2 after table in Annex V.A.1 needs to be discussed. From a technical point of view, it should be taken into account the fact that some automated measuring systems measure PM10 and PM2.5 simultaneously
Other In the cases where only one sampling point is required, PM2.5 should be prioritized
Competent Authorities
Yes, this should be simplified by addressing PM10 and PM2.5 separately. It is, however, important to ensure sufficient monitoring of PM2.5 in member states, but this should be done by strengthening the assessment thresholds for PM2.5 rather than the current approach with a required ratio between PM10 and PM2.5.
NGO See previous answer. We believe it is particularly important to set minimum numbers (and increase) sampling points for PM2.5.
National Reference Laboratory
The quality of the minoring system as a whole should more important than the number of sites
National Reference Laboratory
Yes, there is a need for strong requirements at low concentration levels due to the general decrease in the air pollutant concentration levels
Other Population density.
Competent Authorities
No need to change the minimum number but need to make more clear the requirements
NGOs More sampling points needed in residential areas to cover emission from household heating. However, focus of particulate matter measurements needs to be changed to sampling of black carbon and ultrafine particles.
Competent Authorities
There is no further need of a special number of sampling points of PM2.5 in dependence of sampling points of PM10
National Reference Laboratory
PM10 and PM2.5 sampling at same station should not count as 2 sampling points. It should be required to measure both size fractions when sampling of particulate matter is required
National Reference Laboratory
Separate demands for the minimum number of PM10 and PM2.5 (rather than the sum of both and requirement of the ratio between 0.5 and 2.0)
Competent Authorities
Certain "super sites" should be kept fixed not depending on the concentration level
National Reference Laboratory
See comment above for question 4.2
Competent authorities
See comments earlier + Monitoring PM2.5 and PM10 at the same location should be considered as one monitoring stations instead of two.
Competent Authorities
Especially road dust problems are very local. One measurement is not necessarily representative of other locations in the zone.
Competent authorities
Same as above in question 4.2.
Competent Authorities
A minimum number of sites should be considered separately for PM10 and PM2.5 instead of a common number for PM, because the actual minimum number and ratio are not sufficient to properly validate both PM10 and PM2.5 modelling outputs.
Competent Authorities
Also good air quality should be proved from time to time (maintainment of good air quality - detection of changes)
Competent Authorities
Festschreibung von Messungen auch bei niedriger Schadstoffbelastung
Strengthening of air quality monitoring, modelling and plans under the Ambient Air Quality Directives Ref: ED14240 | Phase 1 Technical Annex | Issue number B2 | Date 22/09/21
79
Competent Authorities
For accessing air quality in regions below lower threshold
Competent Authorities
Increase of PM2.5 and constituents
NGO Especially it must be clarified that traffic points cannot be (exclusively ) in LEZ because this will completely bias the data that are communicated under the data sharing program with the EC and EEA. This has been so for more than 10 years in Milano for PM10 (2007-2018) and it still is for PM2.5 (2007 - 2021...) We are not protected and we a betrayed by our own EPAs... ARPA Lombardia - same for metals PAH etc..
Competent Authorities
La caracterización de las partículas PM10 en zonas rurales ha mostrado tener una composición inerte importante, frente a una baja concentración de PM 2,5. Se debería por tanto revisar la coherencia de mantener una alta densidad de puntos de muestreo en entornos rurales.
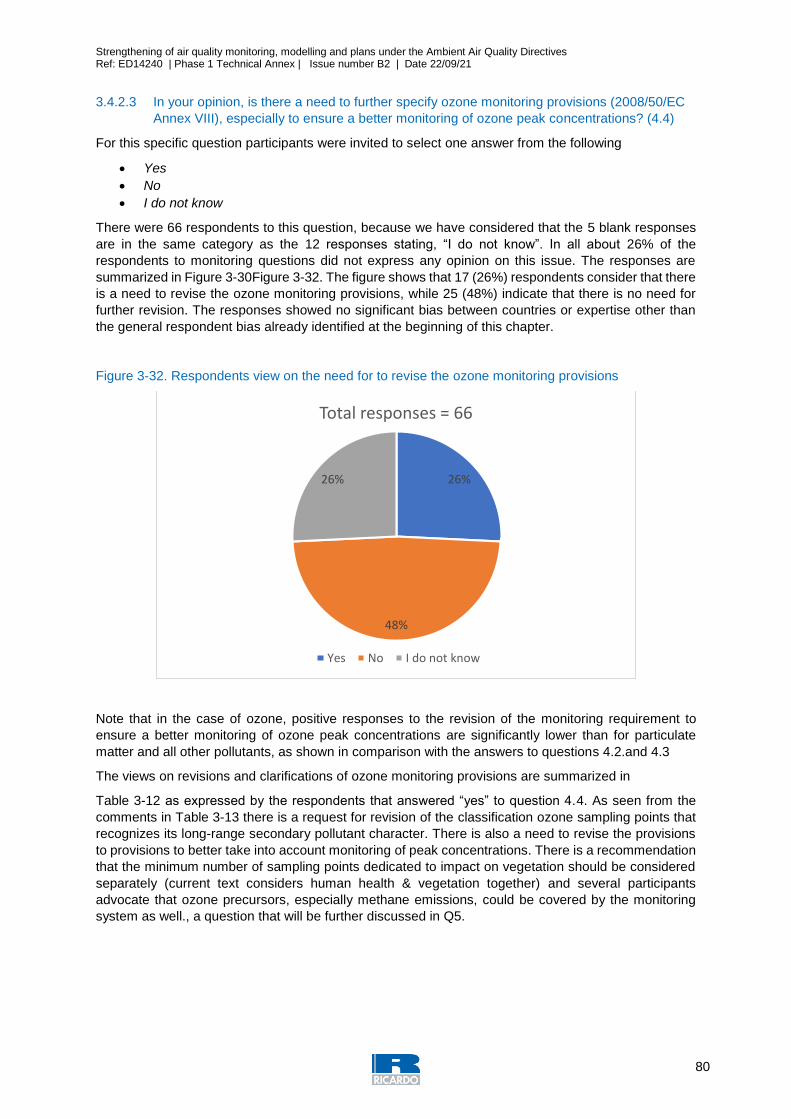
Strengthening of air quality monitoring, modelling and plans under the Ambient Air Quality Directives Ref: ED14240 | Phase 1 Technical Annex | Issue number B2 | Date 22/09/21
80
3.4.2.3 In your opinion, is there a need to further specify ozone monitoring provisions (2008/50/EC
Annex VIII), especially to ensure a better monitoring of ozone peak concentrations? (4.4)
For this specific question participants were invited to select one answer from the following
Yes
No
I do not know
There were 66 respondents to this question, because we have considered that the 5 blank responses
are in the same category as the 12 responses stating, “I do not know”. In all about 26% of the
respondents to monitoring questions did not express any opinion on this issue. The responses are
summarized in Figure 3-30Figure 3-32. The figure shows that 17 (26%) respondents consider that there
is a need to revise the ozone monitoring provisions, while 25 (48%) indicate that there is no need for
further revision. The responses showed no significant bias between countries or expertise other than
the general respondent bias already identified at the beginning of this chapter.
Figure 3-32. Respondents view on the need for to revise the ozone monitoring provisions
Note that in the case of ozone, positive responses to the revision of the monitoring requirement to
ensure a better monitoring of ozone peak concentrations are significantly lower than for particulate
matter and all other pollutants, as shown in comparison with the answers to questions 4.2.and 4.3
The views on revisions and clarifications of ozone monitoring provisions are summarized in
Table 3-12 as expressed by the respondents that answered “yes” to question 4.4. As seen from the
comments in Table 3-13 there is a request for revision of the classification ozone sampling points that
recognizes its long-range secondary pollutant character. There is also a need to revise the provisions
to provisions to better take into account monitoring of peak concentrations. There is a recommendation
that the minimum number of sampling points dedicated to impact on vegetation should be considered
separately (current text considers human health & vegetation together) and several participants
advocate that ozone precursors, especially methane emissions, could be covered by the monitoring
system as well., a question that will be further discussed in Q5.
26%
48%
26%
Total responses = 66
Yes No I do not know
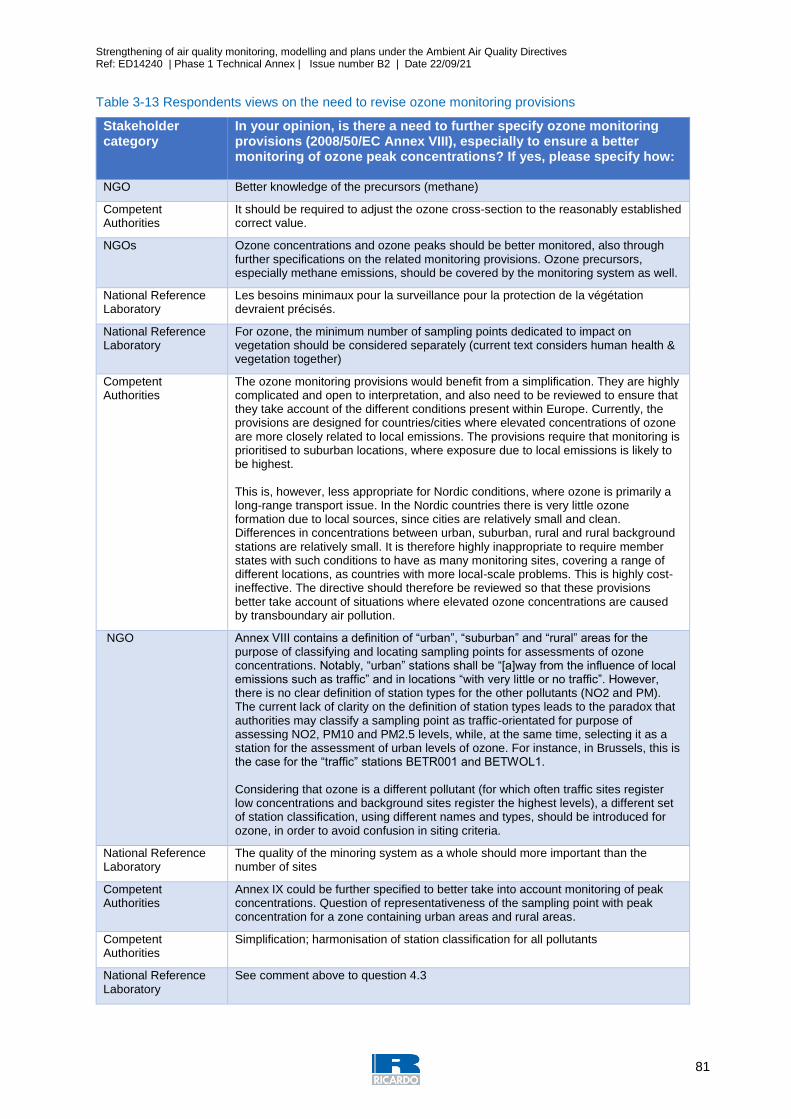
Strengthening of air quality monitoring, modelling and plans under the Ambient Air Quality Directives Ref: ED14240 | Phase 1 Technical Annex | Issue number B2 | Date 22/09/21
81
Table 3-13 Respondents views on the need to revise ozone monitoring provisions
Stakeholder category
In your opinion, is there a need to further specify ozone monitoring provisions (2008/50/EC Annex VIII), especially to ensure a better monitoring of ozone peak concentrations? If yes, please specify how:
NGO Better knowledge of the precursors (methane)
Competent Authorities
It should be required to adjust the ozone cross-section to the reasonably established correct value.
NGOs Ozone concentrations and ozone peaks should be better monitored, also through further specifications on the related monitoring provisions. Ozone precursors, especially methane emissions, should be covered by the monitoring system as well.
National Reference Laboratory
Les besoins minimaux pour la surveillance pour la protection de la végétation devraient précisés.
National Reference Laboratory
For ozone, the minimum number of sampling points dedicated to impact on vegetation should be considered separately (current text considers human health & vegetation together)
Competent Authorities
The ozone monitoring provisions would benefit from a simplification. They are highly complicated and open to interpretation, and also need to be reviewed to ensure that they take account of the different conditions present within Europe. Currently, the provisions are designed for countries/cities where elevated concentrations of ozone are more closely related to local emissions. The provisions require that monitoring is prioritised to suburban locations, where exposure due to local emissions is likely to be highest. This is, however, less appropriate for Nordic conditions, where ozone is primarily a long-range transport issue. In the Nordic countries there is very little ozone formation due to local sources, since cities are relatively small and clean. Differences in concentrations between urban, suburban, rural and rural background stations are relatively small. It is therefore highly inappropriate to require member states with such conditions to have as many monitoring sites, covering a range of different locations, as countries with more local-scale problems. This is highly cost-ineffective. The directive should therefore be reviewed so that these provisions better take account of situations where elevated ozone concentrations are caused by transboundary air pollution.
NGO Annex VIII contains a definition of “urban”, “suburban” and “rural” areas for the purpose of classifying and locating sampling points for assessments of ozone concentrations. Notably, “urban” stations shall be “[a]way from the influence of local emissions such as traffic” and in locations “with very little or no traffic”. However, there is no clear definition of station types for the other pollutants (NO2 and PM). The current lack of clarity on the definition of station types leads to the paradox that authorities may classify a sampling point as traffic-orientated for purpose of assessing NO2, PM10 and PM2.5 levels, while, at the same time, selecting it as a station for the assessment of urban levels of ozone. For instance, in Brussels, this is the case for the “traffic” stations BETR001 and BETWOL1. Considering that ozone is a different pollutant (for which often traffic sites register low concentrations and background sites register the highest levels), a different set of station classification, using different names and types, should be introduced for ozone, in order to avoid confusion in siting criteria.
National Reference Laboratory
The quality of the minoring system as a whole should more important than the number of sites
Competent Authorities
Annex IX could be further specified to better take into account monitoring of peak concentrations. Question of representativeness of the sampling point with peak concentration for a zone containing urban areas and rural areas.
Competent Authorities
Simplification; harmonisation of station classification for all pollutants
National Reference Laboratory
See comment above to question 4.3

Strengthening of air quality monitoring, modelling and plans under the Ambient Air Quality Directives Ref: ED14240 | Phase 1 Technical Annex | Issue number B2 | Date 22/09/21
82
Competent Authorities
See comments earlier + ozone monitoring at urban background locations simultaneously with NOx (NO+NO2) remains important
Other Also add ozone measurements on all stations (especially traffic oriented), it may not build a representation for huge areas, but streets with high traffic should be measured nevertheless and to study the very local processes
Competent Authorities
Quantitative criteria should be provided
3.4.2.4 In your opinion, what is the relationship between monitoring average exposure of the
general population and monitoring the highest concentrations to which the population is or
can be exposed? (4.11)
For this question, the participants were invited to write their comments as free text. There were 37
responses to this question. These responses were compiled in their integrity and are presented in Table
3-14 below.
Table 3-14 Respondents views on the relationship between monitoring average exposure and monitoring highest concentration in areas where population is exposed
Stakeholder category
In your opinion, what is the relationship between monitoring average exposure of the general population and monitoring the highest concentrations to which the population is or can be exposed?
Competent Authorities
In Malmö: 12 ug/m3 NO2 mean and 29 ug/m3 max. Both have to be estimated by dispersion modelling and population data. The results show important trends caused by measures to improve emissions and AQ.
NGO No evidence, maybe I don't understand the question
Competent Authorities
Monitoring of the highest concentration would involve monitoring at pollution hotspots, whilst the average exposure can be determined from a combination of monitoring at different types of sites. The relationship between these two is important to determine the level of risk the population is exposed to. Additionally, average exposure concentrations, generally, have a chronic affect on human health, whilst the highest concentrations will often lead to acute health affects.
Competent Authorities
They have different effects on human health and ecosystems, thus both are important so we can react accordingly
Competent Authorities
It is important to evaluate the average exposure but also the peaks to which the general population is exposed for a period comparable with the limits (not the absolute peaks but peaks to whom people are exposed for a significant period (let say one hour a day or in any case a period related to limits and WHO guidelines)
Competent Authorities
I'm not quite sure what the question aims at. Given the existing health risk below the air quality limit values we should complement the current hot spot approach (i.e. that compliance and the emerging control measures strongly focus on a few measurements) with a requirement for (further) reducing the general exposure of the urban population. The current focus of measures on a few non-compliant hot spots (e.g. Diesel bans in a few single roads) did not lead to a wider reduction of the pollution levels. On the contrary: Vehicle traffic and resulting emissions were shifted to neighbouring, initially less polluted roads, with little or no net benefit in terms of less exposure of the urban population to harmful pollution levels. The population exposure could be represented by a defined set of urban background measurements and/or modelling results, covering the most populated parts of a city. The respective air quality objective could be defined as a percentage reduction of the spatially averaged (potentially population weighted) concentration, i.e. like an urban AEI, which needs to be reduced in all larger agglomerations within a given time frame (10 years).
NGO Information on exposure to peaks and information on average exposure must be considered complementary.
National Reference Laboratory
"Monitoring average exposure" renvoie plutôt aux sites de fond, "monitoring the highest concentrations" renvoie plutôt aux sites sous influence du trafic ou de sources spécifiques.
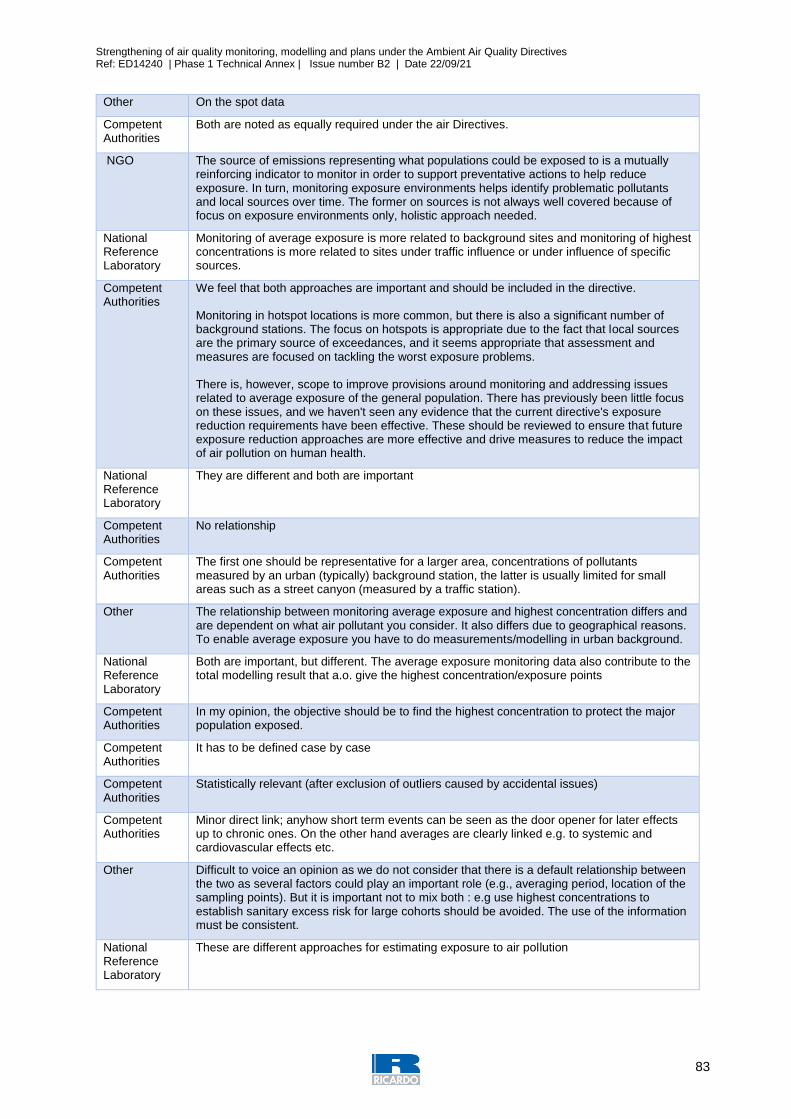
Strengthening of air quality monitoring, modelling and plans under the Ambient Air Quality Directives Ref: ED14240 | Phase 1 Technical Annex | Issue number B2 | Date 22/09/21
83
Other On the spot data
Competent Authorities
Both are noted as equally required under the air Directives.
NGO The source of emissions representing what populations could be exposed to is a mutually reinforcing indicator to monitor in order to support preventative actions to help reduce exposure. In turn, monitoring exposure environments helps identify problematic pollutants and local sources over time. The former on sources is not always well covered because of focus on exposure environments only, holistic approach needed.
National Reference Laboratory
Monitoring of average exposure is more related to background sites and monitoring of highest concentrations is more related to sites under traffic influence or under influence of specific sources.
Competent Authorities
We feel that both approaches are important and should be included in the directive. Monitoring in hotspot locations is more common, but there is also a significant number of background stations. The focus on hotspots is appropriate due to the fact that local sources are the primary source of exceedances, and it seems appropriate that assessment and measures are focused on tackling the worst exposure problems. There is, however, scope to improve provisions around monitoring and addressing issues related to average exposure of the general population. There has previously been little focus on these issues, and we haven't seen any evidence that the current directive's exposure reduction requirements have been effective. These should be reviewed to ensure that future exposure reduction approaches are more effective and drive measures to reduce the impact of air pollution on human health.
National Reference Laboratory
They are different and both are important
Competent Authorities
No relationship
Competent Authorities
The first one should be representative for a larger area, concentrations of pollutants measured by an urban (typically) background station, the latter is usually limited for small areas such as a street canyon (measured by a traffic station).
Other The relationship between monitoring average exposure and highest concentration differs and are dependent on what air pollutant you consider. It also differs due to geographical reasons. To enable average exposure you have to do measurements/modelling in urban background.
National Reference Laboratory
Both are important, but different. The average exposure monitoring data also contribute to the total modelling result that a.o. give the highest concentration/exposure points
Competent Authorities
In my opinion, the objective should be to find the highest concentration to protect the major population exposed.
Competent Authorities
It has to be defined case by case
Competent Authorities
Statistically relevant (after exclusion of outliers caused by accidental issues)
Competent Authorities
Minor direct link; anyhow short term events can be seen as the door opener for later effects up to chronic ones. On the other hand averages are clearly linked e.g. to systemic and cardiovascular effects etc.
Other Difficult to voice an opinion as we do not consider that there is a default relationship between the two as several factors could play an important role (e.g., averaging period, location of the sampling points). But it is important not to mix both : e.g use highest concentrations to establish sanitary excess risk for large cohorts should be avoided. The use of the information must be consistent.
National Reference Laboratory
These are different approaches for estimating exposure to air pollution

Strengthening of air quality monitoring, modelling and plans under the Ambient Air Quality Directives Ref: ED14240 | Phase 1 Technical Annex | Issue number B2 | Date 22/09/21
84
Competent Authorities
There is no relationship: exposure of the general population should be based on urban background monitoring and/or high spatial resolution monitoring. The highest concentration measured in an air quality zone is not representative for the exposure of the general population. Monitoring the highest concentration is necessary for compliance checking.
Competent Authorities
Monitoring the highest concentrations considers the worst case exposure but neglects the average exposure of the general population
Competent Authorities
They are both important, looking at the hot spots and the levels in the background. Current regulations today favor measuring at hot spots. The limit values also favor combating the air pollution levels at hot spots, rather than the concentrations to wich the population is exposed, e.g. in residential areas.
Competent Authorities
Both are different indicators of exposure. For most people the average exposure applies. To ensure highest security for the complete population (each person), searching for and monitoring the highest concentrations are needed. The monitoring of the highest concentration in the air quality zone ensures that limit values are not exceeded in the zone.
Other Depending on the components
Competent Authorities
Highest concentrations are short term effects, average exposure is longterm. Average exposure is more appropriate to predict health effects.
Other The generation population is not being at the area where the pollution concentration is high or highest
Competent Authorities
Monitoring the highest concentrations protects the sensitive population
Competent Authorities
The average exposure index is not usable to develop measures for better air quality.
Other Exposure requires the simultaneous occurrence of two events: a pollutant concentration at a particular place and time, and the presence of a person at that place and time
National Reference Laboratory
Depends on agglomeration zone
Competent Authorities
Dependent on pollutant: large variability of concentration levels for NO2, BaP. Small variability for PM2.5
Competent Authorities
Monitor the highest concentration should be more important than currently is
3.4.2.5 How easy do you consider it is to calculate the attainment of the exceedance and exposure
situation for the following indicators? (4.12)
For this question, participants were requested to rate the difficulty level of calculating several indicators
to characterise the attainment of exceedance and exposure situations as requested under e-reporting.
Below follows the list of different exceedance and exposure indicators to be rated :
Area of the exceedance situation
Road length in exceedance
Total resident population in the exceedance area
Ecosystem Area Exposed
The rating of the difficulty to calculate these indicators was to be provided as a value from 1 to 5
where the different values meant:
1. Very easy
2. Easy
3. Reasonable
4. Difficult
5. Very Difficult
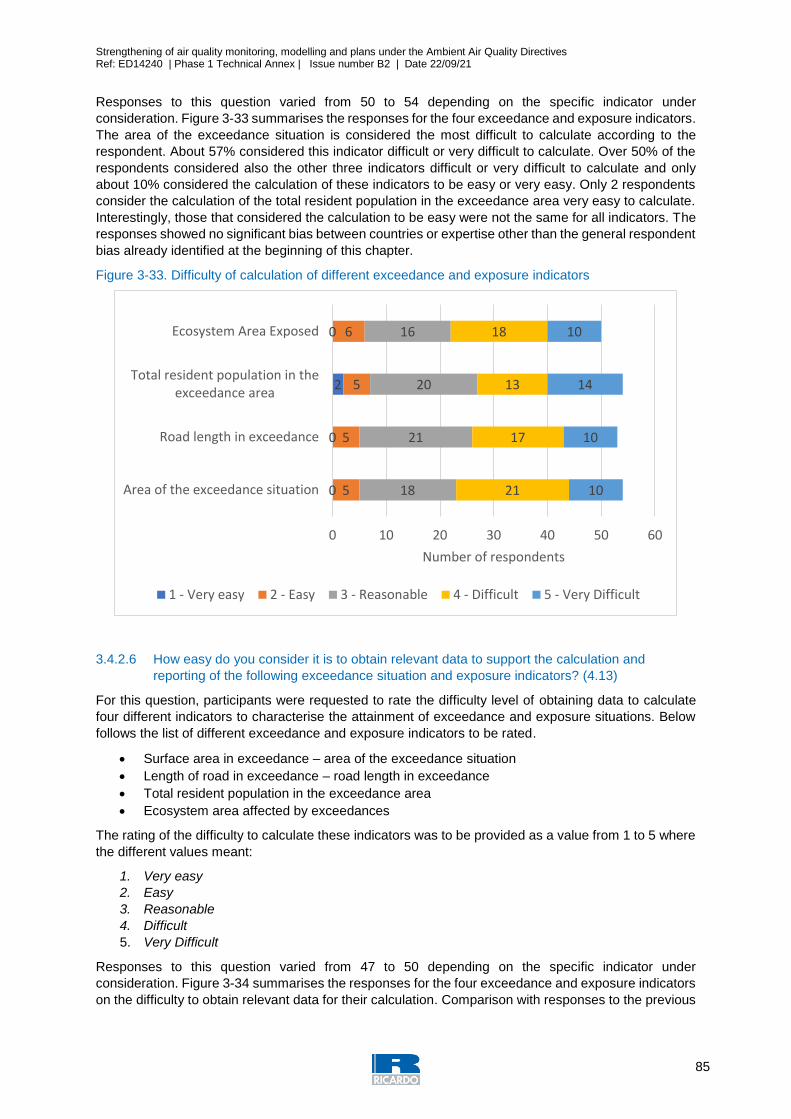
Strengthening of air quality monitoring, modelling and plans under the Ambient Air Quality Directives Ref: ED14240 | Phase 1 Technical Annex | Issue number B2 | Date 22/09/21
85
Responses to this question varied from 50 to 54 depending on the specific indicator under
consideration. Figure 3-33 summarises the responses for the four exceedance and exposure indicators.
The area of the exceedance situation is considered the most difficult to calculate according to the
respondent. About 57% considered this indicator difficult or very difficult to calculate. Over 50% of the
respondents considered also the other three indicators difficult or very difficult to calculate and only
about 10% considered the calculation of these indicators to be easy or very easy. Only 2 respondents
consider the calculation of the total resident population in the exceedance area very easy to calculate.
Interestingly, those that considered the calculation to be easy were not the same for all indicators. The
responses showed no significant bias between countries or expertise other than the general respondent
bias already identified at the beginning of this chapter.
Figure 3-33. Difficulty of calculation of different exceedance and exposure indicators
3.4.2.6 How easy do you consider it is to obtain relevant data to support the calculation and
reporting of the following exceedance situation and exposure indicators? (4.13)
For this question, participants were requested to rate the difficulty level of obtaining data to calculate
four different indicators to characterise the attainment of exceedance and exposure situations. Below
follows the list of different exceedance and exposure indicators to be rated.
Surface area in exceedance – area of the exceedance situation
Length of road in exceedance – road length in exceedance
Total resident population in the exceedance area
Ecosystem area affected by exceedances
The rating of the difficulty to calculate these indicators was to be provided as a value from 1 to 5 where
the different values meant:
1. Very easy
2. Easy
3. Reasonable
4. Difficult
5. Very Difficult
Responses to this question varied from 47 to 50 depending on the specific indicator under
consideration. Figure 3-34 summarises the responses for the four exceedance and exposure indicators
on the difficulty to obtain relevant data for their calculation. Comparison with responses to the previous
0
0
2
0
5
5
5
6
18
21
20
16
21
17
13
18
10
10
14
10
0 10 20 30 40 50 60
Area of the exceedance situation
Road length in exceedance
Total resident population in theexceedance area
Ecosystem Area Exposed
Number of respondents
1 - Very easy 2 - Easy 3 - Reasonable 4 - Difficult 5 - Very Difficult
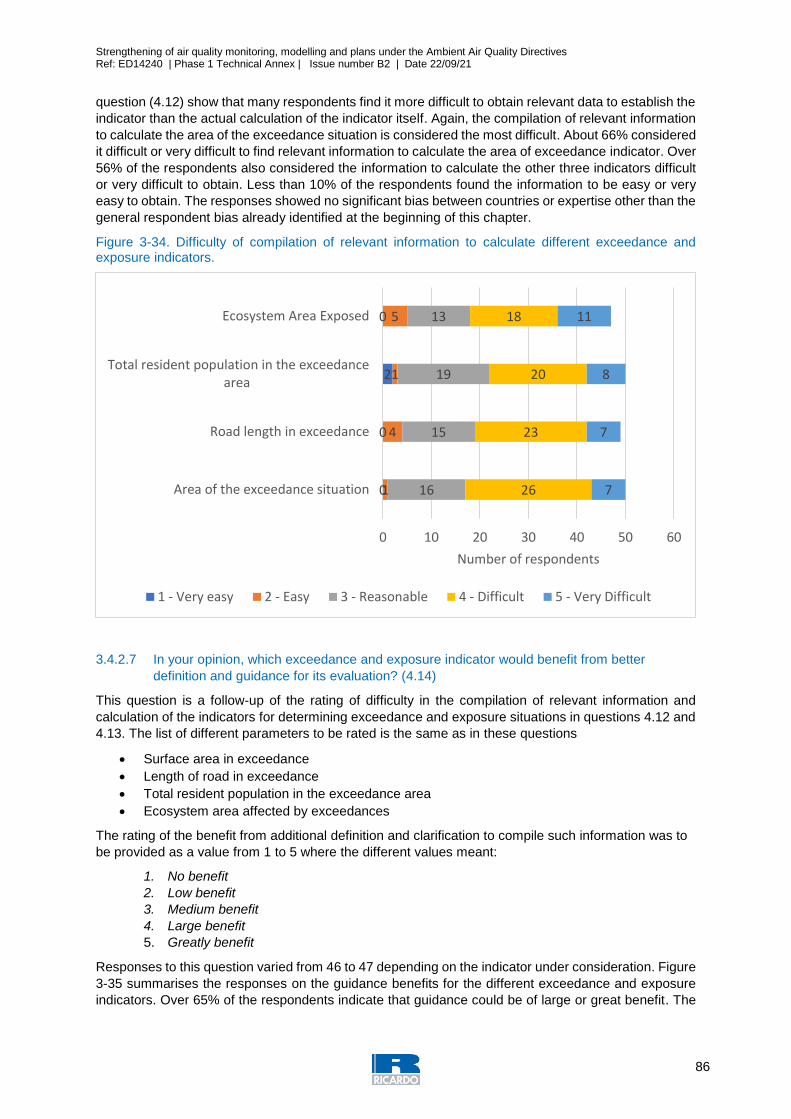
Strengthening of air quality monitoring, modelling and plans under the Ambient Air Quality Directives Ref: ED14240 | Phase 1 Technical Annex | Issue number B2 | Date 22/09/21
86
question (4.12) show that many respondents find it more difficult to obtain relevant data to establish the
indicator than the actual calculation of the indicator itself. Again, the compilation of relevant information
to calculate the area of the exceedance situation is considered the most difficult. About 66% considered
it difficult or very difficult to find relevant information to calculate the area of exceedance indicator. Over
56% of the respondents also considered the information to calculate the other three indicators difficult
or very difficult to obtain. Less than 10% of the respondents found the information to be easy or very
easy to obtain. The responses showed no significant bias between countries or expertise other than the
general respondent bias already identified at the beginning of this chapter.
Figure 3-34. Difficulty of compilation of relevant information to calculate different exceedance and exposure indicators.
3.4.2.7 In your opinion, which exceedance and exposure indicator would benefit from better
definition and guidance for its evaluation? (4.14)
This question is a follow-up of the rating of difficulty in the compilation of relevant information and
calculation of the indicators for determining exceedance and exposure situations in questions 4.12 and
4.13. The list of different parameters to be rated is the same as in these questions
Surface area in exceedance
Length of road in exceedance
Total resident population in the exceedance area
Ecosystem area affected by exceedances
The rating of the benefit from additional definition and clarification to compile such information was to
be provided as a value from 1 to 5 where the different values meant:
1. No benefit
2. Low benefit
3. Medium benefit
4. Large benefit
5. Greatly benefit
Responses to this question varied from 46 to 47 depending on the indicator under consideration. Figure
3-35 summarises the responses on the guidance benefits for the different exceedance and exposure
indicators. Over 65% of the respondents indicate that guidance could be of large or great benefit. The
0
0
2
0
1
4
1
5
16
15
19
13
26
23
20
18
7
7
8
11
0 10 20 30 40 50 60
Area of the exceedance situation
Road length in exceedance
Total resident population in the exceedancearea
Ecosystem Area Exposed
Number of respondents
1 - Very easy 2 - Easy 3 - Reasonable 4 - Difficult 5 - Very Difficult
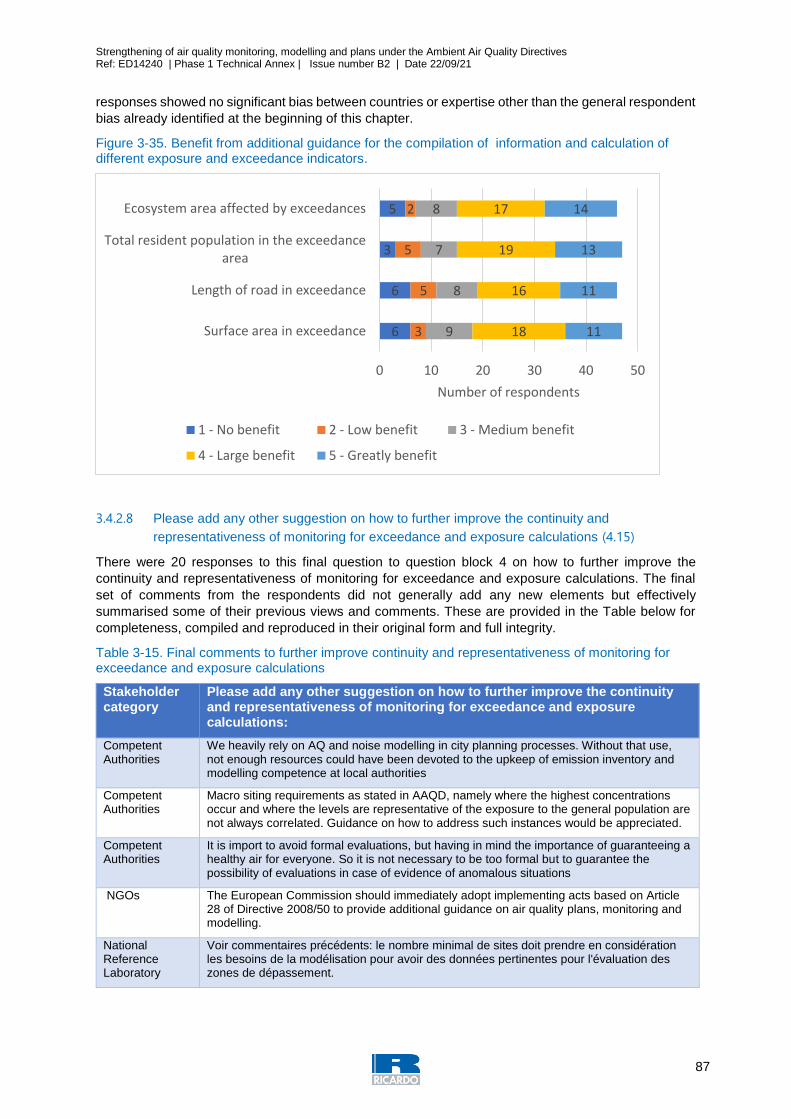
Strengthening of air quality monitoring, modelling and plans under the Ambient Air Quality Directives Ref: ED14240 | Phase 1 Technical Annex | Issue number B2 | Date 22/09/21
87
responses showed no significant bias between countries or expertise other than the general respondent
bias already identified at the beginning of this chapter.
Figure 3-35. Benefit from additional guidance for the compilation of information and calculation of different exposure and exceedance indicators.
3.4.2.8 Please add any other suggestion on how to further improve the continuity and
representativeness of monitoring for exceedance and exposure calculations (4.15)
There were 20 responses to this final question to question block 4 on how to further improve the
continuity and representativeness of monitoring for exceedance and exposure calculations. The final
set of comments from the respondents did not generally add any new elements but effectively
summarised some of their previous views and comments. These are provided in the Table below for
completeness, compiled and reproduced in their original form and full integrity.
Table 3-15. Final comments to further improve continuity and representativeness of monitoring for exceedance and exposure calculations
Stakeholder category
Please add any other suggestion on how to further improve the continuity and representativeness of monitoring for exceedance and exposure calculations:
Competent Authorities
We heavily rely on AQ and noise modelling in city planning processes. Without that use, not enough resources could have been devoted to the upkeep of emission inventory and modelling competence at local authorities
Competent Authorities
Macro siting requirements as stated in AAQD, namely where the highest concentrations occur and where the levels are representative of the exposure to the general population are not always correlated. Guidance on how to address such instances would be appreciated.
Competent Authorities
It is import to avoid formal evaluations, but having in mind the importance of guaranteeing a healthy air for everyone. So it is not necessary to be too formal but to guarantee the possibility of evaluations in case of evidence of anomalous situations
NGOs The European Commission should immediately adopt implementing acts based on Article 28 of Directive 2008/50 to provide additional guidance on air quality plans, monitoring and modelling.
National Reference Laboratory
Voir commentaires précédents: le nombre minimal de sites doit prendre en considération les besoins de la modélisation pour avoir des données pertinentes pour l'évaluation des zones de dépassement.
6
6
3
5
3
5
5
2
9
8
7
8
18
16
19
17
11
11
13
14
0 10 20 30 40 50
Surface area in exceedance
Length of road in exceedance
Total resident population in the exceedancearea
Ecosystem area affected by exceedances
Number of respondents
1 - No benefit 2 - Low benefit 3 - Medium benefit
4 - Large benefit 5 - Greatly benefit

Strengthening of air quality monitoring, modelling and plans under the Ambient Air Quality Directives Ref: ED14240 | Phase 1 Technical Annex | Issue number B2 | Date 22/09/21
88
Competent Authorities
Further definition and guidance in this area would be of merit.
National Reference Laboratory
There is a clear need of clarification concerning road sectors to consider in order to estimate the road lengths: is it a “local area” around the monitoring site or the entire road network in the zone to consider? If we want to enhance uniformity among Member States, the list of ecosystem types and vegetation zone types should be precised
Other Better guidance on how to calculate the representativeness of monitoring stations. For the exposure calculations, there should be a common methodology used for all countries so that it is possible to compare the results.
Competent Authorities
The increased use of modelling, preferably together with measurement campaigns, is key to this. Modelling, together with measurement campaigns, is the best way to assess the representativeness of monitoring locations and identify any issues that need addressing. Modelling also provides key supplementary information regarding the extent of exceedances and population exposure. Modelling should therefore have a more defined role in the development and periodic review of assessment regimes. Issues regarding siting criteria and representativeness of monitoring sites were clearly identified during the recent fitness check. Improved guidance and a better system for evaluating practical implementation of the directive's provisions should be developed to address these issues ensure more effective and consistent implementation across the EU.
NGO The requirement in Annex V, A.1, footnote (1) on continuity of measurements should be amended, so as to apply to all pollutants (including NO2 and PM2.5), rather than only PM10. Currently, Annex V, A.1, footnote (1) requires continuity of monitoring only for PM as follows: “Sampling points with exceedances of the limit value for PM10 within the last three years shall be maintained, unless a relocation is necessary owing to special circumstances, in particular spatial development.” It is not clear the reason why there is not a similar requirement of continuity for other pollutants. Considering that there have been various instances in which authorities have been able to achieve compliance with NO2 limit values by relocating sampling points that had registered exceedances, the provision should apply to all pollutants (including NO2 and PM2.5), rather than only PM10.
National Reference Laboratory
The Directives should set requirements for how to
Competent Authorities
Creation of Guidances; better explanations of used terms in vocabulary;
National Reference Laboratory
Clarify how exceedance at traffic stations should be translated to the 'resident population in exceedance area'
Competent Authorities
Area of exceedance calculations are difficult when taking into account the exceptions (e.g. central reservation of roads). The difficulty to calculate exposure strongly depends on the spatial resolution of the used models. The indicators mentioned above can only be calculated using modelling. It's almost impossible to estimate these indicators using only monitoring data. The "length of road in exceedance" indicator is in our opinion not useful.
Competent Authorities
Exact definition of representativeness
Competent Authorities
The directive is very clear on the assessment on exceedance on monitoring stations, which shouldn’t be assess on situations where the public cannot access. But, it doesn't explain how to address this question with modelling. For example, if we follow the same reasoning, the roads and the areas with an exceedance but no population exposed shouldn't be counted in the surface area or in the length of road in exceedance.
Strengthening of air quality monitoring, modelling and plans under the Ambient Air Quality Directives Ref: ED14240 | Phase 1 Technical Annex | Issue number B2 | Date 22/09/21
89
-The directive should also be more precise on how to include the modelling uncertainties in the assessment of the population exposed. For example, the directive could define a threshold below which the number of inhabitants exposed is not significant regarding the total number of inhabitants.
Other Common Excel
Other GIS based DALY or QUALY or life lost years
National Reference Laboratory
Focus on the relevant information e.g. the exposure indicator; exposure maps could be useful, but they are not required at the moment. At present: too many details required, which cannot be provided, not helping to get the full picture, in general: the present approach is not practical and not leading to comparable results in the EU
Competent Authorities
Guidance material to facility and harmonize calculation of exceedance and exposure indicators
3.4.3 Main messages
The evaluation of responses to the 15 specific questions in block Q4 concerning the representativeness
and continuity of monitoring for exceedance and exposure calculations helped us identify the following
main messages for further technical consideration.
Revision of the minimum number of sampling points. A possible mean to secure the
continuity and representativeness of the monitoring network is provide a minimum number of
sampling points for the different components. The responses have provided valuable insight on
the main challenges encountered by Member States with respect to the minimum number of
sampling points and provided recommendations for a possible revision. A possible revision of
the minimum number of sampling points could considered different air quality management
practices, including exceedance and exposure calculations as well as modelling validation
purposes. The revision of the minimum number of sampling points needs also to describe how
indicative measurements and modeling may be used to document the need for any potential
reduction of the minimum number of sampling points (reference to Article 14 in the AAQD).
Revision of the ratios and proportions between sampling points. This concerns particularly
PM2.5 because there is currently no independent minimum number of sampling points for PM2.5.
The main recommendation is to separate the requirements for minimum sampling points for
PM10 and PM2.5 and to explicitly address PM2.5, in order to secure increased monitoring of this
pollutant. Some respondents even advocate for adding requirements of monitoring PM2.5
speciation something that in further addressed in the next section under Q5. The respondents
are recommended to revise the specified ratios for Traffic/UB sampling points, which in some
cases provides a bias in the network to prioritise traffic locations and have few urban
background sampling points.
Need for guidance on the calculation of exceedance and exposure indicators Most
respondents will find a clear benefit to have access to extended guidance on how to find
relevant information for the calculation of exposure and exceedance calculations, in addition to
explanation on where such indicators are to apply.
Revision of parameters/ indicators of exposure in e-reporting. It is not clear what is the
relevance of certain requested under the IPR, in particular for the length of the road .
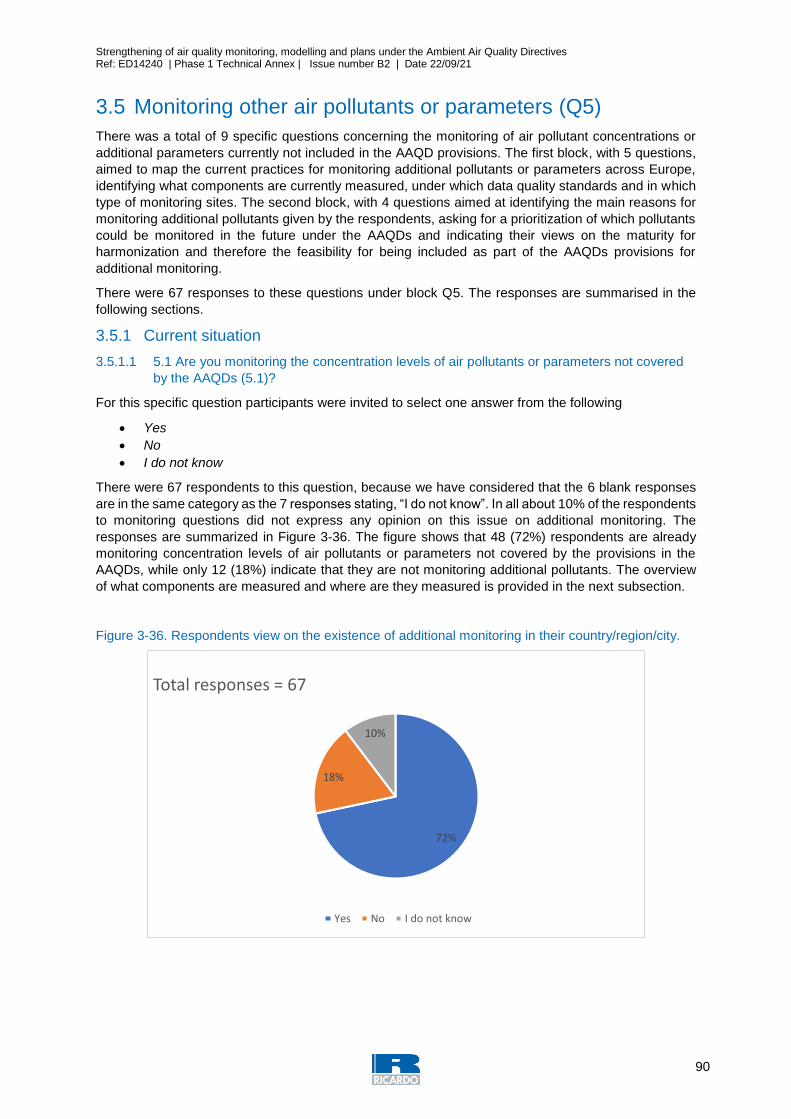
Strengthening of air quality monitoring, modelling and plans under the Ambient Air Quality Directives Ref: ED14240 | Phase 1 Technical Annex | Issue number B2 | Date 22/09/21
90
3.5 Monitoring other air pollutants or parameters (Q5)
There was a total of 9 specific questions concerning the monitoring of air pollutant concentrations or
additional parameters currently not included in the AAQD provisions. The first block, with 5 questions,
aimed to map the current practices for monitoring additional pollutants or parameters across Europe,
identifying what components are currently measured, under which data quality standards and in which
type of monitoring sites. The second block, with 4 questions aimed at identifying the main reasons for
monitoring additional pollutants given by the respondents, asking for a prioritization of which pollutants
could be monitored in the future under the AAQDs and indicating their views on the maturity for
harmonization and therefore the feasibility for being included as part of the AAQDs provisions for
additional monitoring.
There were 67 responses to these questions under block Q5. The responses are summarised in the
following sections.
3.5.1 Current situation
3.5.1.1 5.1 Are you monitoring the concentration levels of air pollutants or parameters not covered
by the AAQDs (5.1)?
For this specific question participants were invited to select one answer from the following
Yes
No
I do not know
There were 67 respondents to this question, because we have considered that the 6 blank responses
are in the same category as the 7 responses stating, “I do not know”. In all about 10% of the respondents
to monitoring questions did not express any opinion on this issue on additional monitoring. The
responses are summarized in Figure 3-36. The figure shows that 48 (72%) respondents are already
monitoring concentration levels of air pollutants or parameters not covered by the provisions in the
AAQDs, while only 12 (18%) indicate that they are not monitoring additional pollutants. The overview
of what components are measured and where are they measured is provided in the next subsection.
Figure 3-36. Respondents view on the existence of additional monitoring in their country/region/city.
72%
18%
10%
Total responses = 67
Yes No I do not know
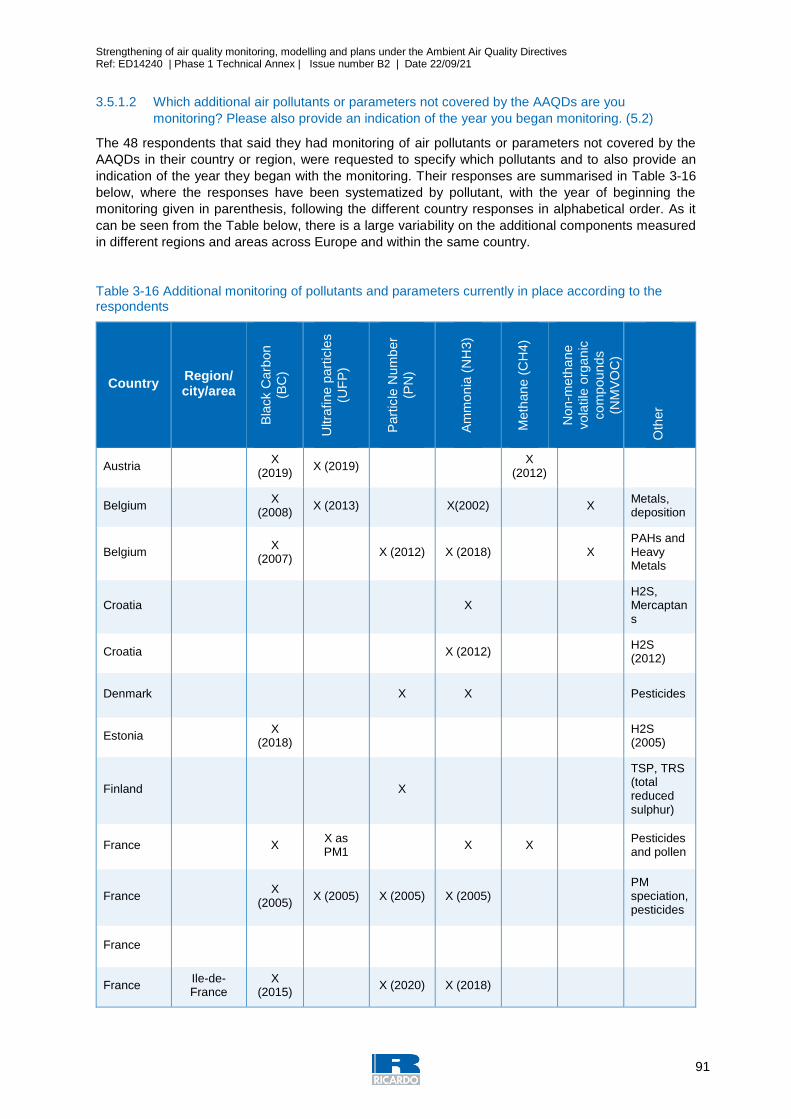
Strengthening of air quality monitoring, modelling and plans under the Ambient Air Quality Directives Ref: ED14240 | Phase 1 Technical Annex | Issue number B2 | Date 22/09/21
91
3.5.1.2 Which additional air pollutants or parameters not covered by the AAQDs are you
monitoring? Please also provide an indication of the year you began monitoring. (5.2)
The 48 respondents that said they had monitoring of air pollutants or parameters not covered by the
AAQDs in their country or region, were requested to specify which pollutants and to also provide an
indication of the year they began with the monitoring. Their responses are summarised in Table 3-16
below, where the responses have been systematized by pollutant, with the year of beginning the
monitoring given in parenthesis, following the different country responses in alphabetical order. As it
can be seen from the Table below, there is a large variability on the additional components measured
in different regions and areas across Europe and within the same country.
Table 3-16 Additional monitoring of pollutants and parameters currently in place according to the respondents
Country Region/ city/area
Bla
ck C
arb
on
(BC
)
Ultra
fine p
art
icle
s
(UF
P)
Part
icle
Num
ber
(PN
)
Am
mon
ia (
NH
3)
Meth
ane (
CH
4)
Non-m
eth
ane
vola
tile
org
anic
com
pou
nds
(NM
VO
C)
Oth
er
Austria X
(2019) X (2019) X
(2012)
Belgium X
(2008) X (2013) X(2002) X
Metals, deposition
Belgium X
(2007) X (2012) X (2018) X
PAHs and Heavy Metals
Croatia X H2S, Mercaptans
Croatia X (2012) H2S (2012)
Denmark X X Pesticides
Estonia X
(2018) H2S
(2005)
Finland X
TSP, TRS (total reduced sulphur)
France X X as PM1
X X Pesticides and pollen
France X
(2005) X (2005) X (2005) X (2005)
PM speciation, pesticides
France
France Ile-de-France
X (2015)
X (2020) X (2018)
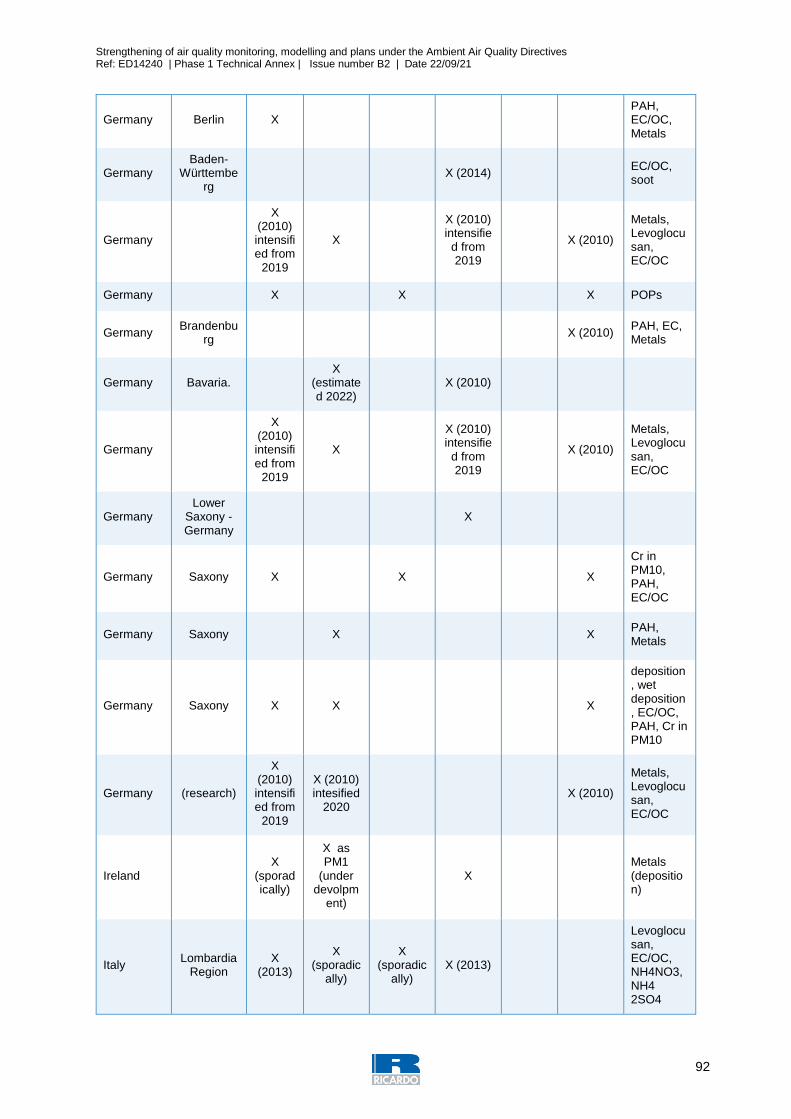
Strengthening of air quality monitoring, modelling and plans under the Ambient Air Quality Directives Ref: ED14240 | Phase 1 Technical Annex | Issue number B2 | Date 22/09/21
92
Germany Berlin X PAH, EC/OC, Metals
Germany Baden-
Württemberg
X (2014) EC/OC, soot
Germany
X (2010) intensified from
2019
X
X (2010) intensified from 2019
X (2010)
Metals, Levoglocusan, EC/OC
Germany X X X POPs
Germany Brandenbu
rg X (2010)
PAH, EC, Metals
Germany Bavaria. X
(estimated 2022)
X (2010)
Germany
X (2010) intensified from
2019
X
X (2010) intensified from 2019
X (2010)
Metals, Levoglocusan, EC/OC
Germany Lower
Saxony - Germany
X
Germany Saxony X X X
Cr in PM10, PAH, EC/OC
Germany Saxony X X PAH, Metals
Germany Saxony X X X
deposition, wet deposition, EC/OC, PAH, Cr in PM10
Germany (research)
X (2010) intensified from
2019
X (2010) intesified
2020
X (2010)
Metals, Levoglocusan, EC/OC
Ireland X
(sporadically)
X as PM1
(under devolpm
ent)
X Metals (deposition)
Italy Lombardia
Region X
(2013)
X (sporadic
ally)
X (sporadic
ally) X (2013)
Levoglocusan, EC/OC, NH4NO3, NH4 2SO4
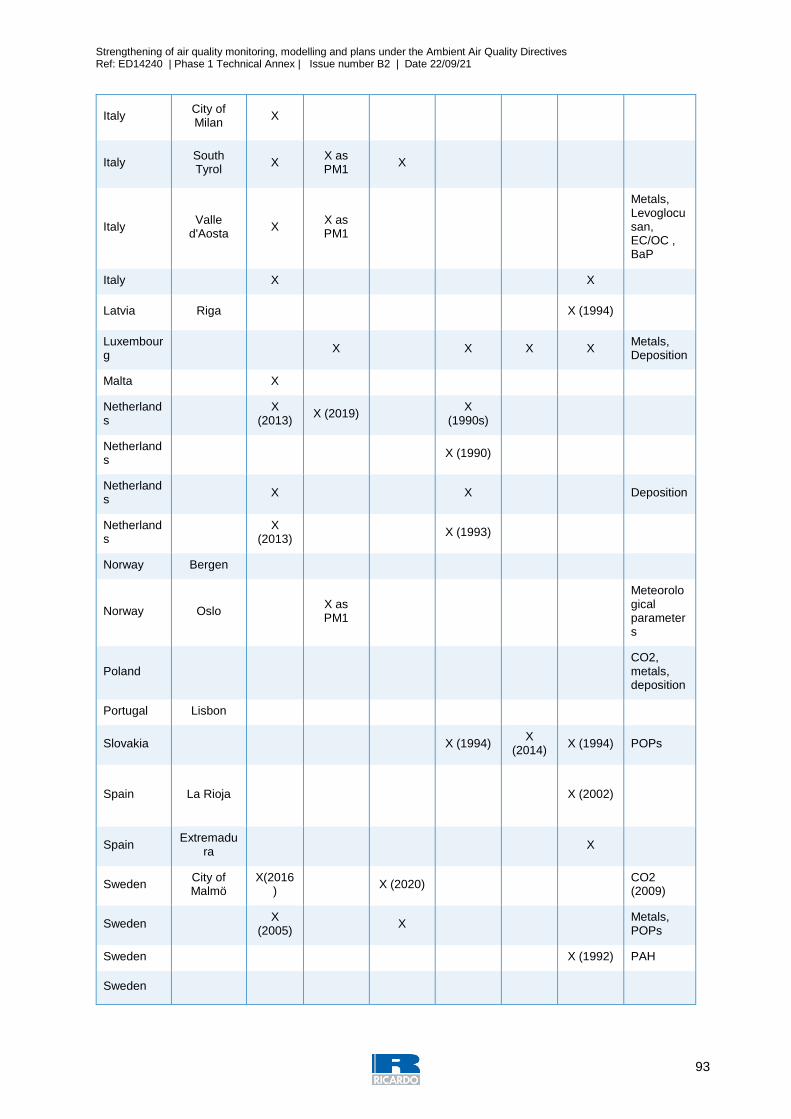
Strengthening of air quality monitoring, modelling and plans under the Ambient Air Quality Directives Ref: ED14240 | Phase 1 Technical Annex | Issue number B2 | Date 22/09/21
93
Italy City of Milan
X
Italy South Tyrol
X X as PM1
X
Italy Valle
d'Aosta X
X as PM1
Metals, Levoglocusan, EC/OC , BaP
Italy X X
Latvia Riga X (1994)
Luxembourg
X X X X Metals, Deposition
Malta X
Netherlands
X
(2013) X (2019) X
(1990s)
Netherlands
X (1990)
Netherlands
X X Deposition
Netherlands
X
(2013) X (1993)
Norway Bergen
Norway Oslo X as PM1
Meteorological parameters
Poland CO2, metals, deposition
Portugal Lisbon
Slovakia X (1994) X
(2014) X (1994) POPs
Spain La Rioja X (2002)
Spain Extremadu
ra X
Sweden City of Malmö
X(2016)
X (2020) CO2 (2009)
Sweden X
(2005) X Metals,
POPs
Sweden X (1992) PAH
Sweden
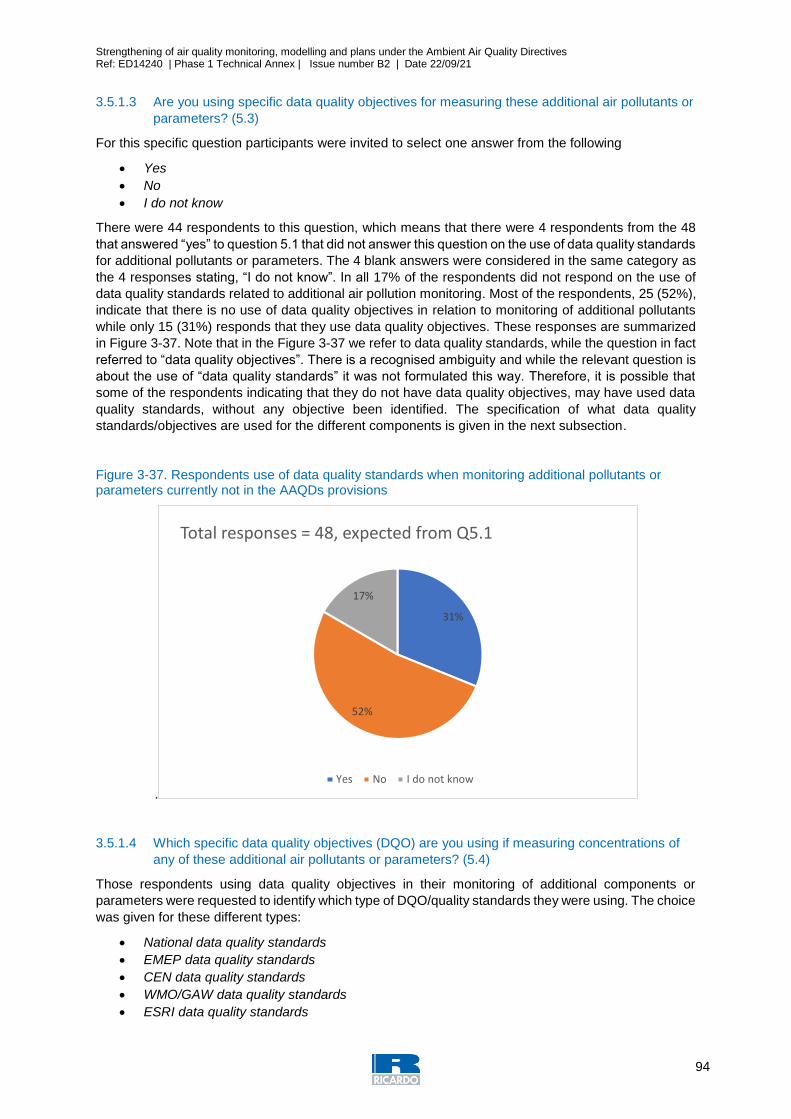
Strengthening of air quality monitoring, modelling and plans under the Ambient Air Quality Directives Ref: ED14240 | Phase 1 Technical Annex | Issue number B2 | Date 22/09/21
94
3.5.1.3 Are you using specific data quality objectives for measuring these additional air pollutants or
parameters? (5.3)
For this specific question participants were invited to select one answer from the following
Yes
No
I do not know
There were 44 respondents to this question, which means that there were 4 respondents from the 48
that answered “yes” to question 5.1 that did not answer this question on the use of data quality standards
for additional pollutants or parameters. The 4 blank answers were considered in the same category as
the 4 responses stating, “I do not know”. In all 17% of the respondents did not respond on the use of
data quality standards related to additional air pollution monitoring. Most of the respondents, 25 (52%),
indicate that there is no use of data quality objectives in relation to monitoring of additional pollutants
while only 15 (31%) responds that they use data quality objectives. These responses are summarized
in Figure 3-37. Note that in the Figure 3-37 we refer to data quality standards, while the question in fact
referred to “data quality objectives”. There is a recognised ambiguity and while the relevant question is
about the use of “data quality standards” it was not formulated this way. Therefore, it is possible that
some of the respondents indicating that they do not have data quality objectives, may have used data
quality standards, without any objective been identified. The specification of what data quality
standards/objectives are used for the different components is given in the next subsection.
Figure 3-37. Respondents use of data quality standards when monitoring additional pollutants or parameters currently not in the AAQDs provisions
.
3.5.1.4 Which specific data quality objectives (DQO) are you using if measuring concentrations of
any of these additional air pollutants or parameters? (5.4)
Those respondents using data quality objectives in their monitoring of additional components or
parameters were requested to identify which type of DQO/quality standards they were using. The choice
was given for these different types:
National data quality standards
EMEP data quality standards
CEN data quality standards
WMO/GAW data quality standards
ESRI data quality standards
31%
52%
17%
Total responses = 48, expected from Q5.1
Yes No I do not know
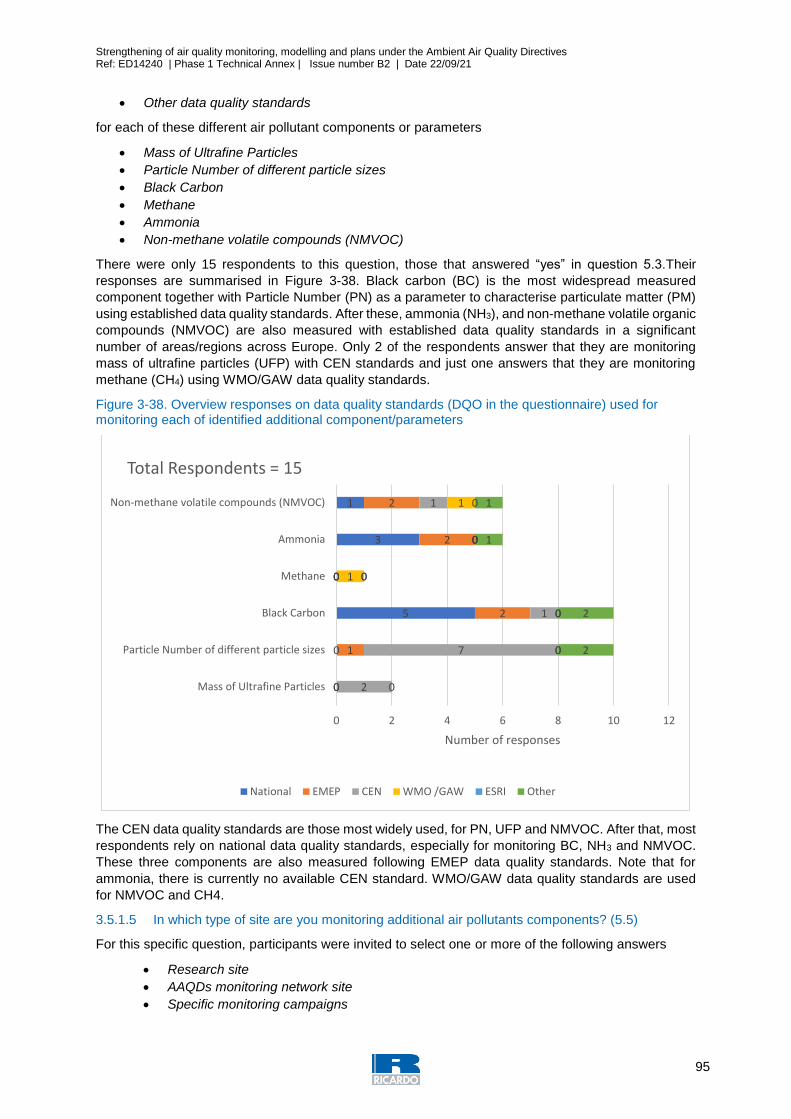
Strengthening of air quality monitoring, modelling and plans under the Ambient Air Quality Directives Ref: ED14240 | Phase 1 Technical Annex | Issue number B2 | Date 22/09/21
95
Other data quality standards
for each of these different air pollutant components or parameters
Mass of Ultrafine Particles
Particle Number of different particle sizes
Black Carbon
Methane
Ammonia
Non-methane volatile compounds (NMVOC)
There were only 15 respondents to this question, those that answered “yes” in question 5.3.Their
responses are summarised in Figure 3-38. Black carbon (BC) is the most widespread measured
component together with Particle Number (PN) as a parameter to characterise particulate matter (PM)
using established data quality standards. After these, ammonia (NH3), and non-methane volatile organic
compounds (NMVOC) are also measured with established data quality standards in a significant
number of areas/regions across Europe. Only 2 of the respondents answer that they are monitoring
mass of ultrafine particles (UFP) with CEN standards and just one answers that they are monitoring
methane (CH4) using WMO/GAW data quality standards.
Figure 3-38. Overview responses on data quality standards (DQO in the questionnaire) used for monitoring each of identified additional component/parameters
The CEN data quality standards are those most widely used, for PN, UFP and NMVOC. After that, most
respondents rely on national data quality standards, especially for monitoring BC, NH3 and NMVOC.
These three components are also measured following EMEP data quality standards. Note that for
ammonia, there is currently no available CEN standard. WMO/GAW data quality standards are used
for NMVOC and CH4.
3.5.1.5 In which type of site are you monitoring additional air pollutants components? (5.5)
For this specific question, participants were invited to select one or more of the following answers
Research site
AAQDs monitoring network site
Specific monitoring campaigns
0
0
5
0
3
1
0
1
2
0
2
2
2
7
1
0
0
1
0
0
0
1
0
1
0
0
0
0
0
2
2
0
1
1
0 2 4 6 8 10 12
Mass of Ultrafine Particles
Particle Number of different particle sizes
Black Carbon
Methane
Ammonia
Non-methane volatile compounds (NMVOC)
Number of responses
Total Respondents = 15
National EMEP CEN WMO /GAW ESRI Other
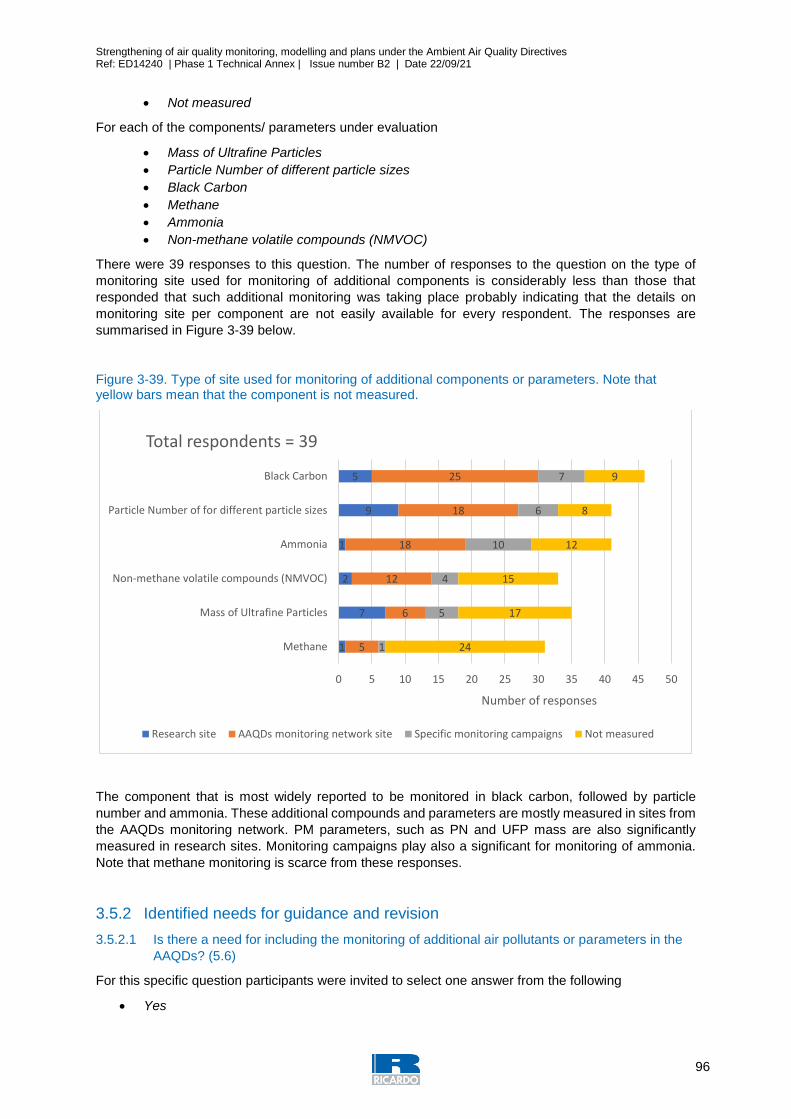
Strengthening of air quality monitoring, modelling and plans under the Ambient Air Quality Directives Ref: ED14240 | Phase 1 Technical Annex | Issue number B2 | Date 22/09/21
96
Not measured
For each of the components/ parameters under evaluation
Mass of Ultrafine Particles
Particle Number of different particle sizes
Black Carbon
Methane
Ammonia
Non-methane volatile compounds (NMVOC)
There were 39 responses to this question. The number of responses to the question on the type of
monitoring site used for monitoring of additional components is considerably less than those that
responded that such additional monitoring was taking place probably indicating that the details on
monitoring site per component are not easily available for every respondent. The responses are
summarised in Figure 3-39 below.
Figure 3-39. Type of site used for monitoring of additional components or parameters. Note that yellow bars mean that the component is not measured.
The component that is most widely reported to be monitored in black carbon, followed by particle
number and ammonia. These additional compounds and parameters are mostly measured in sites from
the AAQDs monitoring network. PM parameters, such as PN and UFP mass are also significantly
measured in research sites. Monitoring campaigns play also a significant for monitoring of ammonia.
Note that methane monitoring is scarce from these responses.
3.5.2 Identified needs for guidance and revision
3.5.2.1 Is there a need for including the monitoring of additional air pollutants or parameters in the
AAQDs? (5.6)
For this specific question participants were invited to select one answer from the following
Yes
1
7
2
1
9
5
5
6
12
18
18
25
1
5
4
10
6
7
24
17
15
12
8
9
0 5 10 15 20 25 30 35 40 45 50
Methane
Mass of Ultrafine Particles
Non-methane volatile compounds (NMVOC)
Ammonia
Particle Number of for different particle sizes
Black Carbon
Number of responses
Total respondents = 39
Research site AAQDs monitoring network site Specific monitoring campaigns Not measured
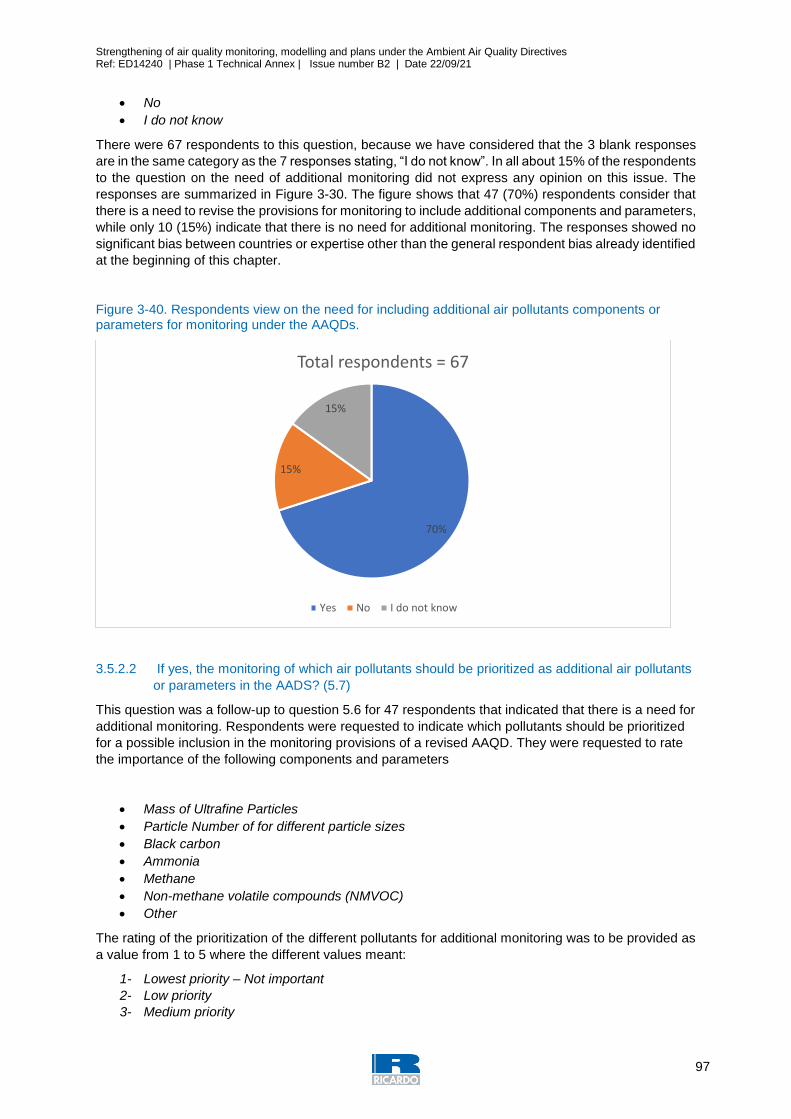
Strengthening of air quality monitoring, modelling and plans under the Ambient Air Quality Directives Ref: ED14240 | Phase 1 Technical Annex | Issue number B2 | Date 22/09/21
97
No
I do not know
There were 67 respondents to this question, because we have considered that the 3 blank responses
are in the same category as the 7 responses stating, “I do not know”. In all about 15% of the respondents
to the question on the need of additional monitoring did not express any opinion on this issue. The
responses are summarized in Figure 3-30. The figure shows that 47 (70%) respondents consider that
there is a need to revise the provisions for monitoring to include additional components and parameters,
while only 10 (15%) indicate that there is no need for additional monitoring. The responses showed no
significant bias between countries or expertise other than the general respondent bias already identified
at the beginning of this chapter.
Figure 3-40. Respondents view on the need for including additional air pollutants components or parameters for monitoring under the AAQDs.
3.5.2.2 If yes, the monitoring of which air pollutants should be prioritized as additional air pollutants
or parameters in the AADS? (5.7)
This question was a follow-up to question 5.6 for 47 respondents that indicated that there is a need for
additional monitoring. Respondents were requested to indicate which pollutants should be prioritized
for a possible inclusion in the monitoring provisions of a revised AAQD. They were requested to rate
the importance of the following components and parameters
Mass of Ultrafine Particles
Particle Number of for different particle sizes
Black carbon
Ammonia
Methane
Non-methane volatile compounds (NMVOC)
Other
The rating of the prioritization of the different pollutants for additional monitoring was to be provided as
a value from 1 to 5 where the different values meant:
1- Lowest priority – Not important
2- Low priority
3- Medium priority
70%
15%
15%
Total respondents = 67
Yes No I do not know
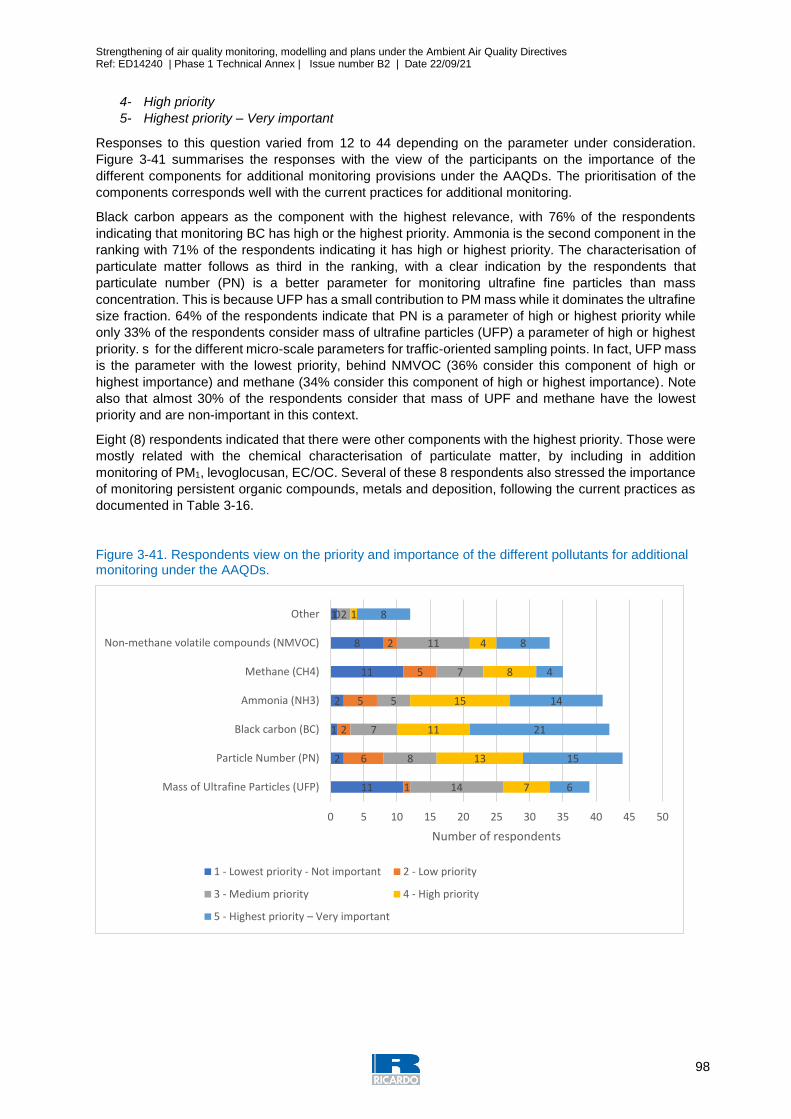
Strengthening of air quality monitoring, modelling and plans under the Ambient Air Quality Directives Ref: ED14240 | Phase 1 Technical Annex | Issue number B2 | Date 22/09/21
98
4- High priority
5- Highest priority – Very important
Responses to this question varied from 12 to 44 depending on the parameter under consideration.
Figure 3-41 summarises the responses with the view of the participants on the importance of the
different components for additional monitoring provisions under the AAQDs. The prioritisation of the
components corresponds well with the current practices for additional monitoring.
Black carbon appears as the component with the highest relevance, with 76% of the respondents
indicating that monitoring BC has high or the highest priority. Ammonia is the second component in the
ranking with 71% of the respondents indicating it has high or highest priority. The characterisation of
particulate matter follows as third in the ranking, with a clear indication by the respondents that
particulate number (PN) is a better parameter for monitoring ultrafine fine particles than mass
concentration. This is because UFP has a small contribution to PM mass while it dominates the ultrafine
size fraction. 64% of the respondents indicate that PN is a parameter of high or highest priority while
only 33% of the respondents consider mass of ultrafine particles (UFP) a parameter of high or highest
priority. s for the different micro-scale parameters for traffic-oriented sampling points. In fact, UFP mass
is the parameter with the lowest priority, behind NMVOC (36% consider this component of high or
highest importance) and methane (34% consider this component of high or highest importance). Note
also that almost 30% of the respondents consider that mass of UPF and methane have the lowest
priority and are non-important in this context.
Eight (8) respondents indicated that there were other components with the highest priority. Those were
mostly related with the chemical characterisation of particulate matter, by including in addition
monitoring of PM1, levoglocusan, EC/OC. Several of these 8 respondents also stressed the importance
of monitoring persistent organic compounds, metals and deposition, following the current practices as
documented in Table 3-16.
Figure 3-41. Respondents view on the priority and importance of the different pollutants for additional monitoring under the AAQDs.
11
2
1
2
11
8
1
1
6
2
5
5
2
0
14
8
7
5
7
11
2
7
13
11
15
8
4
1
6
15
21
14
4
8
8
0 5 10 15 20 25 30 35 40 45 50
Mass of Ultrafine Particles (UFP)
Particle Number (PN)
Black carbon (BC)
Ammonia (NH3)
Methane (CH4)
Non-methane volatile compounds (NMVOC)
Other
Number of respondents
1 - Lowest priority - Not important 2 - Low priority
3 - Medium priority 4 - High priority
5 - Highest priority – Very important
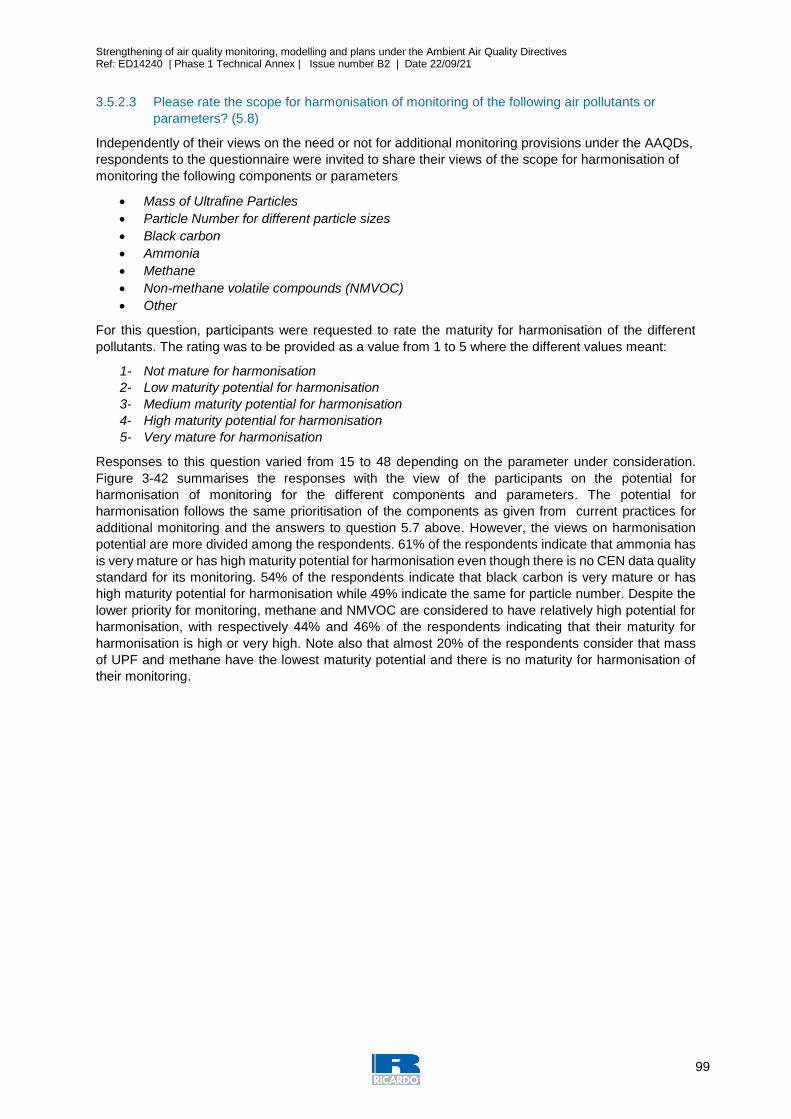
Strengthening of air quality monitoring, modelling and plans under the Ambient Air Quality Directives Ref: ED14240 | Phase 1 Technical Annex | Issue number B2 | Date 22/09/21
99
3.5.2.3 Please rate the scope for harmonisation of monitoring of the following air pollutants or
parameters? (5.8)
Independently of their views on the need or not for additional monitoring provisions under the AAQDs,
respondents to the questionnaire were invited to share their views of the scope for harmonisation of
monitoring the following components or parameters
Mass of Ultrafine Particles
Particle Number for different particle sizes
Black carbon
Ammonia
Methane
Non-methane volatile compounds (NMVOC)
Other
For this question, participants were requested to rate the maturity for harmonisation of the different
pollutants. The rating was to be provided as a value from 1 to 5 where the different values meant:
1- Not mature for harmonisation
2- Low maturity potential for harmonisation
3- Medium maturity potential for harmonisation
4- High maturity potential for harmonisation
5- Very mature for harmonisation
Responses to this question varied from 15 to 48 depending on the parameter under consideration.
Figure 3-42 summarises the responses with the view of the participants on the potential for
harmonisation of monitoring for the different components and parameters. The potential for
harmonisation follows the same prioritisation of the components as given from current practices for
additional monitoring and the answers to question 5.7 above. However, the views on harmonisation
potential are more divided among the respondents. 61% of the respondents indicate that ammonia has
is very mature or has high maturity potential for harmonisation even though there is no CEN data quality
standard for its monitoring. 54% of the respondents indicate that black carbon is very mature or has
high maturity potential for harmonisation while 49% indicate the same for particle number. Despite the
lower priority for monitoring, methane and NMVOC are considered to have relatively high potential for
harmonisation, with respectively 44% and 46% of the respondents indicating that their maturity for
harmonisation is high or very high. Note also that almost 20% of the respondents consider that mass
of UPF and methane have the lowest maturity potential and there is no maturity for harmonisation of
their monitoring.
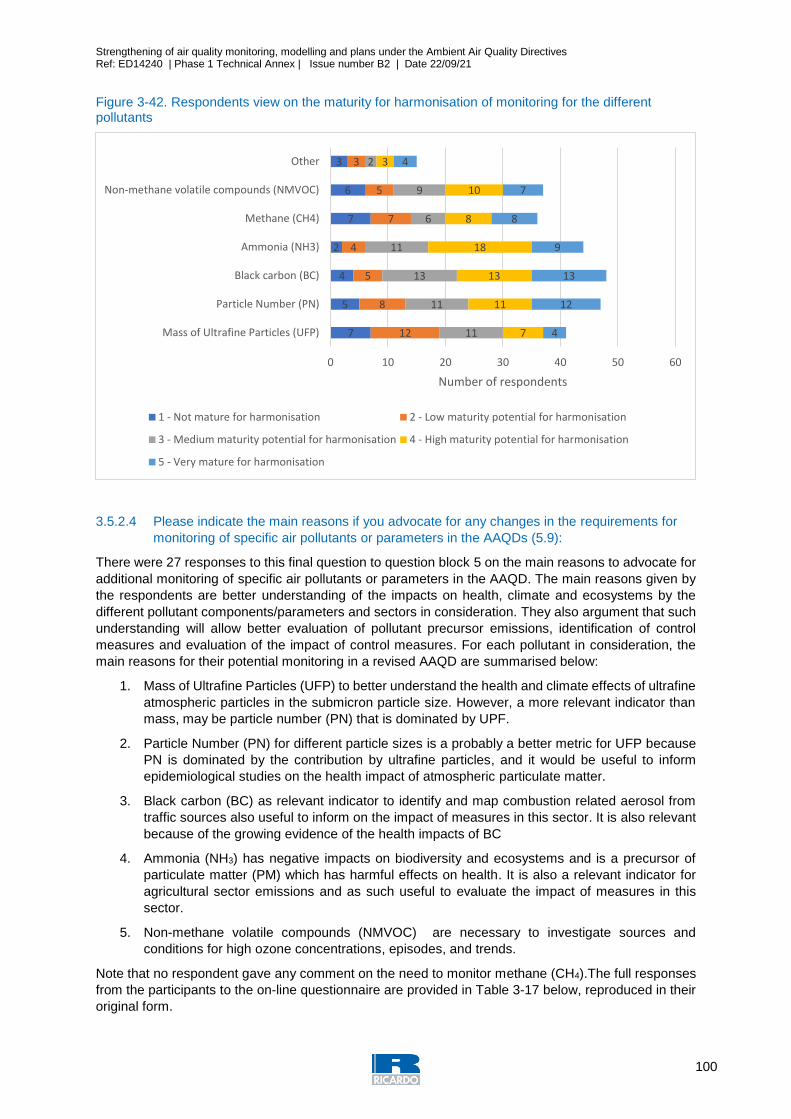
Strengthening of air quality monitoring, modelling and plans under the Ambient Air Quality Directives Ref: ED14240 | Phase 1 Technical Annex | Issue number B2 | Date 22/09/21
100
Figure 3-42. Respondents view on the maturity for harmonisation of monitoring for the different pollutants
3.5.2.4 Please indicate the main reasons if you advocate for any changes in the requirements for
monitoring of specific air pollutants or parameters in the AAQDs (5.9):
There were 27 responses to this final question to question block 5 on the main reasons to advocate for
additional monitoring of specific air pollutants or parameters in the AAQD. The main reasons given by
the respondents are better understanding of the impacts on health, climate and ecosystems by the
different pollutant components/parameters and sectors in consideration. They also argument that such
understanding will allow better evaluation of pollutant precursor emissions, identification of control
measures and evaluation of the impact of control measures. For each pollutant in consideration, the
main reasons for their potential monitoring in a revised AAQD are summarised below:
1. Mass of Ultrafine Particles (UFP) to better understand the health and climate effects of ultrafine
atmospheric particles in the submicron particle size. However, a more relevant indicator than
mass, may be particle number (PN) that is dominated by UPF.
2. Particle Number (PN) for different particle sizes is a probably a better metric for UFP because
PN is dominated by the contribution by ultrafine particles, and it would be useful to inform
epidemiological studies on the health impact of atmospheric particulate matter.
3. Black carbon (BC) as relevant indicator to identify and map combustion related aerosol from
traffic sources also useful to inform on the impact of measures in this sector. It is also relevant
because of the growing evidence of the health impacts of BC
4. Ammonia (NH3) has negative impacts on biodiversity and ecosystems and is a precursor of
particulate matter (PM) which has harmful effects on health. It is also a relevant indicator for
agricultural sector emissions and as such useful to evaluate the impact of measures in this
sector.
5. Non-methane volatile compounds (NMVOC) are necessary to investigate sources and
conditions for high ozone concentrations, episodes, and trends.
Note that no respondent gave any comment on the need to monitor methane (CH4).The full responses
from the participants to the on-line questionnaire are provided in Table 3-17 below, reproduced in their
original form.
7
5
4
2
7
6
3
12
8
5
4
7
5
3
11
11
13
11
6
9
2
7
11
13
18
8
10
3
4
12
13
9
8
7
4
0 10 20 30 40 50 60
Mass of Ultrafine Particles (UFP)
Particle Number (PN)
Black carbon (BC)
Ammonia (NH3)
Methane (CH4)
Non-methane volatile compounds (NMVOC)
Other
Number of respondents
1 - Not mature for harmonisation 2 - Low maturity potential for harmonisation
3 - Medium maturity potential for harmonisation 4 - High maturity potential for harmonisation
5 - Very mature for harmonisation
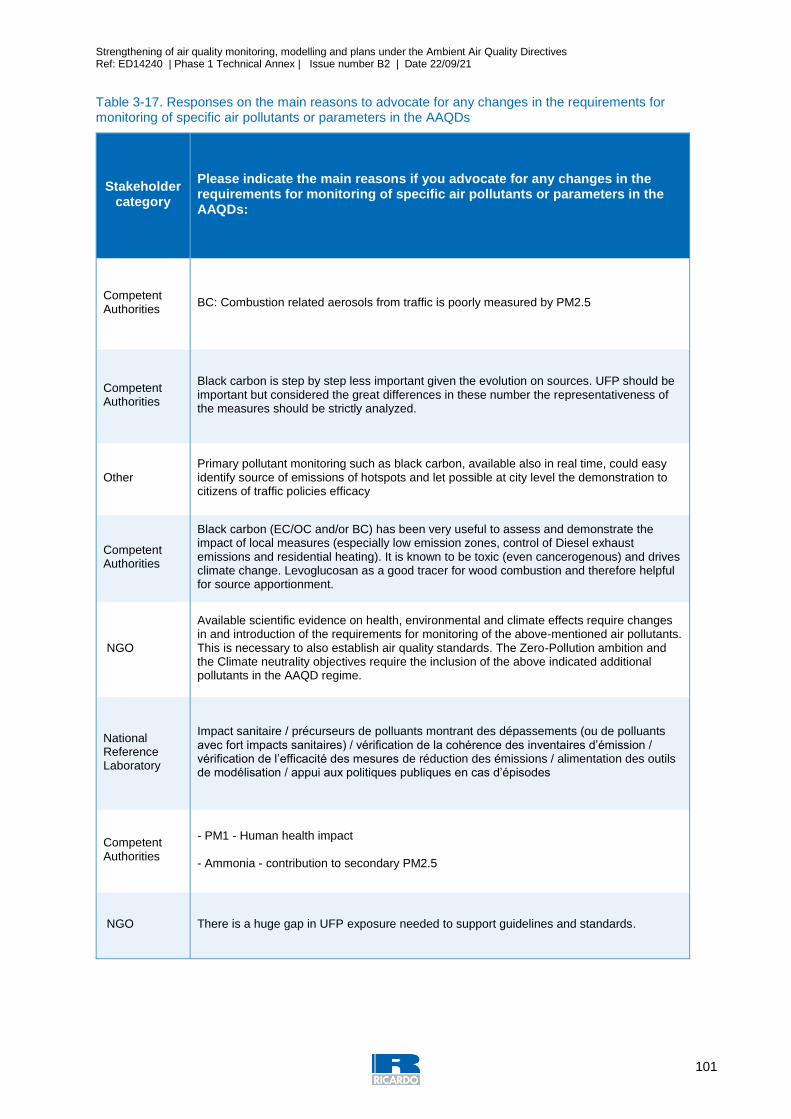
Strengthening of air quality monitoring, modelling and plans under the Ambient Air Quality Directives Ref: ED14240 | Phase 1 Technical Annex | Issue number B2 | Date 22/09/21
101
Table 3-17. Responses on the main reasons to advocate for any changes in the requirements for monitoring of specific air pollutants or parameters in the AAQDs
Stakeholder category
Please indicate the main reasons if you advocate for any changes in the requirements for monitoring of specific air pollutants or parameters in the AAQDs:
Competent Authorities
BC: Combustion related aerosols from traffic is poorly measured by PM2.5
Competent Authorities
Black carbon is step by step less important given the evolution on sources. UFP should be important but considered the great differences in these number the representativeness of the measures should be strictly analyzed.
Other Primary pollutant monitoring such as black carbon, available also in real time, could easy identify source of emissions of hotspots and let possible at city level the demonstration to citizens of traffic policies efficacy
Competent Authorities
Black carbon (EC/OC and/or BC) has been very useful to assess and demonstrate the impact of local measures (especially low emission zones, control of Diesel exhaust emissions and residential heating). It is known to be toxic (even cancerogenous) and drives climate change. Levoglucosan as a good tracer for wood combustion and therefore helpful for source apportionment.
NGO
Available scientific evidence on health, environmental and climate effects require changes in and introduction of the requirements for monitoring of the above-mentioned air pollutants. This is necessary to also establish air quality standards. The Zero-Pollution ambition and the Climate neutrality objectives require the inclusion of the above indicated additional pollutants in the AAQD regime.
National Reference Laboratory
Impact sanitaire / précurseurs de polluants montrant des dépassements (ou de polluants avec fort impacts sanitaires) / vérification de la cohérence des inventaires d’émission / vérification de l’efficacité des mesures de réduction des émissions / alimentation des outils de modélisation / appui aux politiques publiques en cas d’épisodes
Competent Authorities
- PM1 - Human health impact - Ammonia - contribution to secondary PM2.5
NGO There is a huge gap in UFP exposure needed to support guidelines and standards.
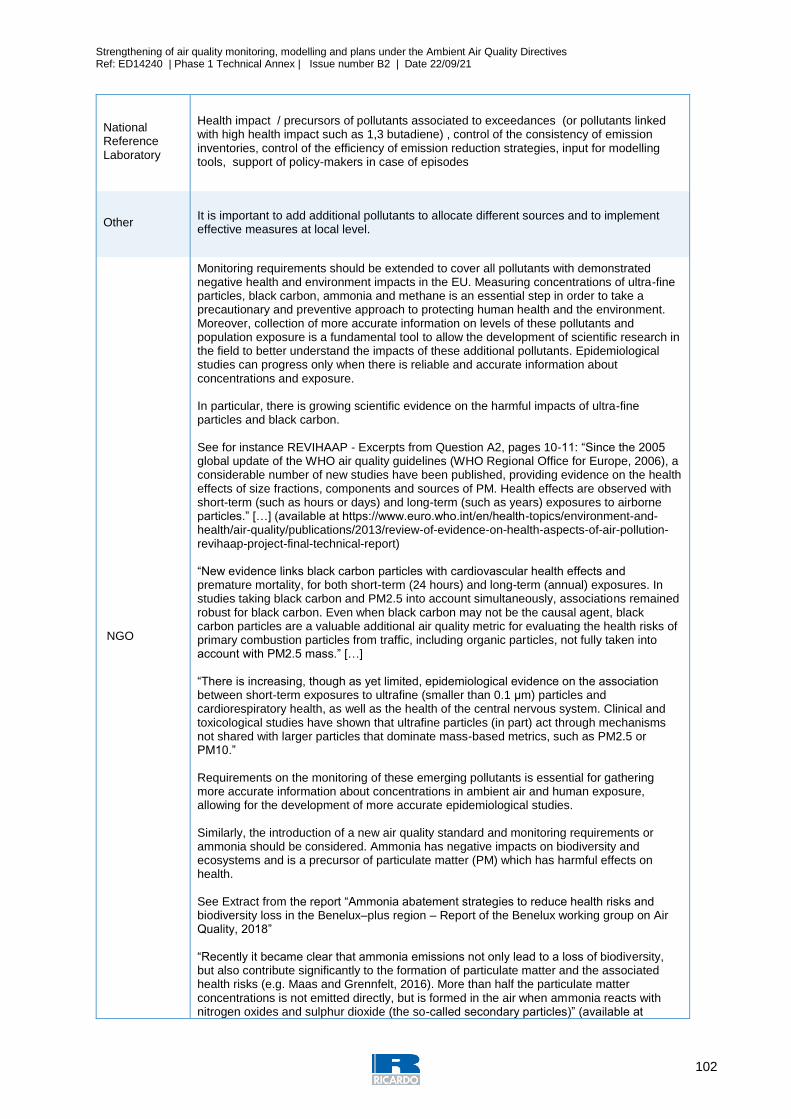
Strengthening of air quality monitoring, modelling and plans under the Ambient Air Quality Directives Ref: ED14240 | Phase 1 Technical Annex | Issue number B2 | Date 22/09/21
102
National Reference Laboratory
Health impact / precursors of pollutants associated to exceedances (or pollutants linked with high health impact such as 1,3 butadiene) , control of the consistency of emission inventories, control of the efficiency of emission reduction strategies, input for modelling tools, support of policy-makers in case of episodes
Other It is important to add additional pollutants to allocate different sources and to implement effective measures at local level.
NGO
Monitoring requirements should be extended to cover all pollutants with demonstrated negative health and environment impacts in the EU. Measuring concentrations of ultra-fine particles, black carbon, ammonia and methane is an essential step in order to take a precautionary and preventive approach to protecting human health and the environment. Moreover, collection of more accurate information on levels of these pollutants and population exposure is a fundamental tool to allow the development of scientific research in the field to better understand the impacts of these additional pollutants. Epidemiological studies can progress only when there is reliable and accurate information about concentrations and exposure. In particular, there is growing scientific evidence on the harmful impacts of ultra-fine particles and black carbon. See for instance REVIHAAP - Excerpts from Question A2, pages 10-11: “Since the 2005 global update of the WHO air quality guidelines (WHO Regional Office for Europe, 2006), a considerable number of new studies have been published, providing evidence on the health effects of size fractions, components and sources of PM. Health effects are observed with short-term (such as hours or days) and long-term (such as years) exposures to airborne particles.” […] (available at https://www.euro.who.int/en/health-topics/environment-and-health/air-quality/publications/2013/review-of-evidence-on-health-aspects-of-air-pollution-revihaap-project-final-technical-report) “New evidence links black carbon particles with cardiovascular health effects and premature mortality, for both short-term (24 hours) and long-term (annual) exposures. In studies taking black carbon and PM2.5 into account simultaneously, associations remained robust for black carbon. Even when black carbon may not be the causal agent, black carbon particles are a valuable additional air quality metric for evaluating the health risks of primary combustion particles from traffic, including organic particles, not fully taken into account with PM2.5 mass.” […] “There is increasing, though as yet limited, epidemiological evidence on the association between short-term exposures to ultrafine (smaller than 0.1 μm) particles and cardiorespiratory health, as well as the health of the central nervous system. Clinical and toxicological studies have shown that ultrafine particles (in part) act through mechanisms not shared with larger particles that dominate mass-based metrics, such as PM2.5 or PM10.” Requirements on the monitoring of these emerging pollutants is essential for gathering more accurate information about concentrations in ambient air and human exposure, allowing for the development of more accurate epidemiological studies. Similarly, the introduction of a new air quality standard and monitoring requirements or ammonia should be considered. Ammonia has negative impacts on biodiversity and ecosystems and is a precursor of particulate matter (PM) which has harmful effects on health. See Extract from the report “Ammonia abatement strategies to reduce health risks and biodiversity loss in the Benelux–plus region – Report of the Benelux working group on Air Quality, 2018” “Recently it became clear that ammonia emissions not only lead to a loss of biodiversity, but also contribute significantly to the formation of particulate matter and the associated health risks (e.g. Maas and Grennfelt, 2016). More than half the particulate matter concentrations is not emitted directly, but is formed in the air when ammonia reacts with nitrogen oxides and sulphur dioxide (the so-called secondary particles)” (available at
Strengthening of air quality monitoring, modelling and plans under the Ambient Air Quality Directives Ref: ED14240 | Phase 1 Technical Annex | Issue number B2 | Date 22/09/21
103
https://www.benelux.int/files/4815/2835/5618/Ammonia_report_Benelux_Air_Working_group_03042018.pdf)
National Reference Laboratory
NH3->nitrogen deposition
National Reference Laboratory
The specified parameters are relevant for public health
National Reference Laboratory
All parameters mentioned contribute to, or are part of, particulate matter. PM is a major contributor to health effects.
Competent Authorities
Ultrafine particles should be monitored in order to provide sufficient data for epidemiological studies, particle numbers will help to calculate additional PM mass fractions (e.g. PM1), ammonia as indicator for agricultural
National Reference Laboratory
In addition to PM, BC and particle number are relevant parameters for human health. Ammonia is an important precursor for PM and contributes strongly to eutrophying atmospheric deposition in many member states
Competent Authorities
Black Carbon and UFP are better traffic related parameters than total mass PM2.5 or 10
Competent Authorities
According to the Norwegian Institute of Public Health, there is a better correlation of health effects relating to black carbon than with PM2.5
Competent Authorities
Fine particles - highest health impact
Competent Authorities
BC and ultrafine particles data are highly needed for sanitary studies and monitoring should be harmonized.
Other Ultrafine particles should be monitored in order to provide sufficient data for epidemiological studies, particle numbers will help to calculate additional PM mass fractions (e.g. PM1), ammonia as indicator for agricultural
Other They will improve information for health impact assessments and also underpin the air quality plans
Competent Authorities
Gain more knowledge of ozone precursors and health impact of particle number concentrations
Strengthening of air quality monitoring, modelling and plans under the Ambient Air Quality Directives Ref: ED14240 | Phase 1 Technical Annex | Issue number B2 | Date 22/09/21
104
Competent Authorities
Need to investigate sources and conditions for high ozone concentrations (NMVOC, OC), importance for human health (UFP, black carbon, EC); general assessment of air quality development (deposition, wet dep.,; importance for water quality (PAH)
National Reference Laboratory
Ultrafine particles should be monitored in order to provide sufficient data for epidemiological studies, particle numbers will help to calculate additional PM mass fractions (e.g. PM1), BC/EC relevant for traffic and climate, ammonia as indicator for agricultural/traffic contribution to PM mass.
Competent Authorities
Health impact, knowledge gaps, further support to understand ozone episodes and trends (e.g. biogenic NMVOC)
Competent Authorities
Lack of information.
3.5.3 Main messages
Reponses to the questions under block 5 indicate that there is significant additional monitoring
in countries, although not all use harmonised data quality standards (DQO)
Particle number, black carbon and ammonia are considered the additional pollutants with higher
priority to be included as additional monitoring components and parameters in a potential
revision of the AAQDs
These are also the pollutants with considered higher maturity for harmonisation of monitoring
practices. It should be noted however that there is no CEN standard for ammonia and that the
use CEN standards in the current monitoring of additional pollutants and components is still
relatively low
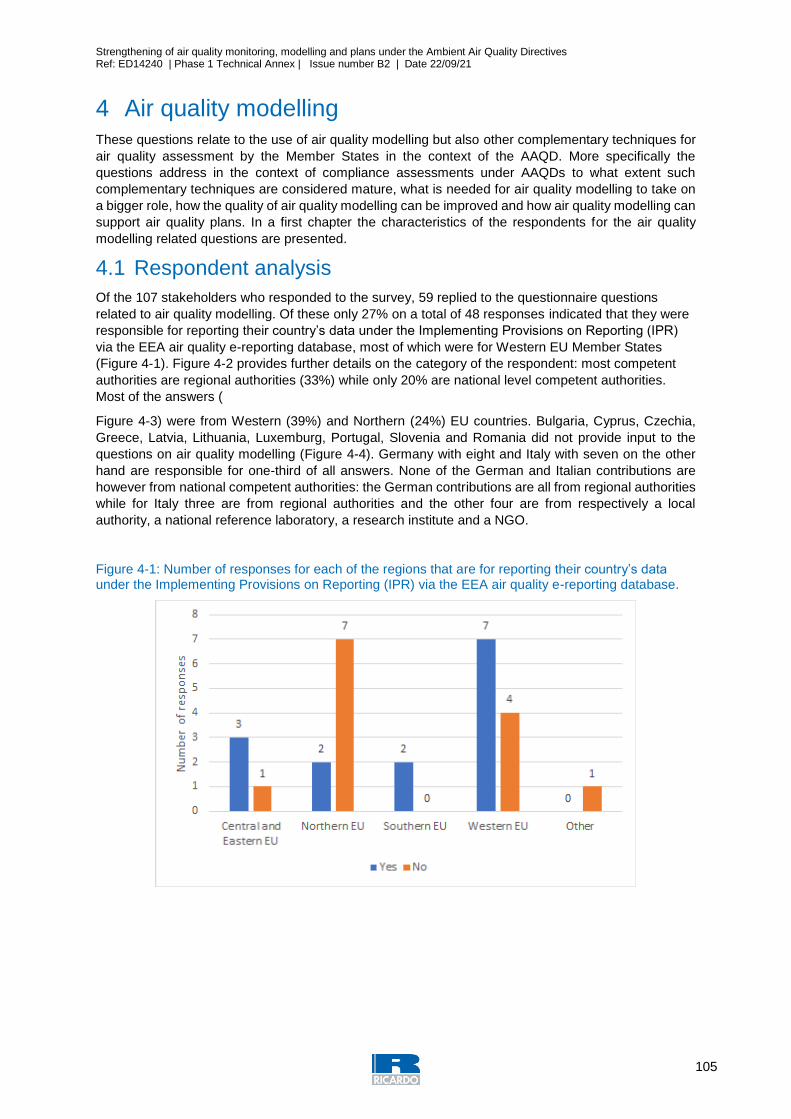
Strengthening of air quality monitoring, modelling and plans under the Ambient Air Quality Directives Ref: ED14240 | Phase 1 Technical Annex | Issue number B2 | Date 22/09/21
105
4 Air quality modelling These questions relate to the use of air quality modelling but also other complementary techniques for
air quality assessment by the Member States in the context of the AAQD. More specifically the
questions address in the context of compliance assessments under AAQDs to what extent such
complementary techniques are considered mature, what is needed for air quality modelling to take on
a bigger role, how the quality of air quality modelling can be improved and how air quality modelling can
support air quality plans. In a first chapter the characteristics of the respondents for the air quality
modelling related questions are presented.
4.1 Respondent analysis
Of the 107 stakeholders who responded to the survey, 59 replied to the questionnaire questions
related to air quality modelling. Of these only 27% on a total of 48 responses indicated that they were
responsible for reporting their country’s data under the Implementing Provisions on Reporting (IPR)
via the EEA air quality e-reporting database, most of which were for Western EU Member States
(Figure 4-1). Figure 4-2 provides further details on the category of the respondent: most competent
authorities are regional authorities (33%) while only 20% are national level competent authorities.
Most of the answers (
Figure 4-3) were from Western (39%) and Northern (24%) EU countries. Bulgaria, Cyprus, Czechia,
Greece, Latvia, Lithuania, Luxemburg, Portugal, Slovenia and Romania did not provide input to the
questions on air quality modelling (Figure 4-4). Germany with eight and Italy with seven on the other
hand are responsible for one-third of all answers. None of the German and Italian contributions are
however from national competent authorities: the German contributions are all from regional authorities
while for Italy three are from regional authorities and the other four are from respectively a local
authority, a national reference laboratory, a research institute and a NGO.
Figure 4-1: Number of responses for each of the regions that are for reporting their country’s data under the Implementing Provisions on Reporting (IPR) via the EEA air quality e-reporting database.
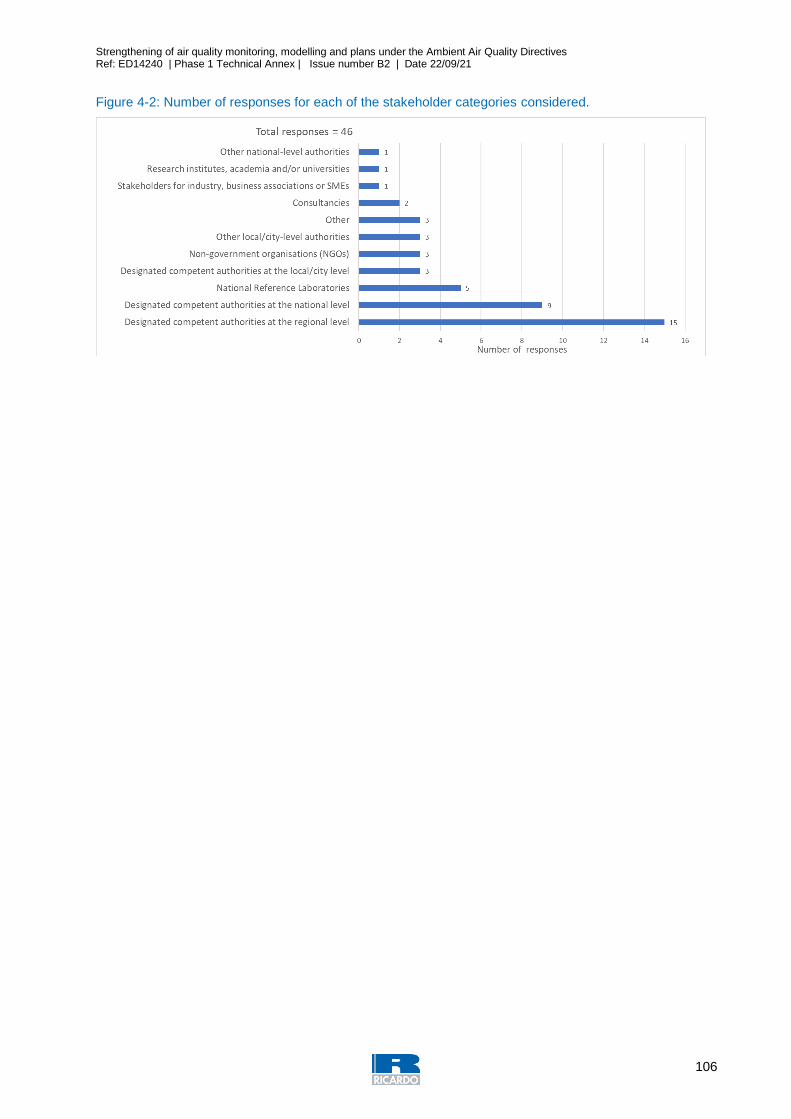
Strengthening of air quality monitoring, modelling and plans under the Ambient Air Quality Directives Ref: ED14240 | Phase 1 Technical Annex | Issue number B2 | Date 22/09/21
106
Figure 4-2: Number of responses for each of the stakeholder categories considered.
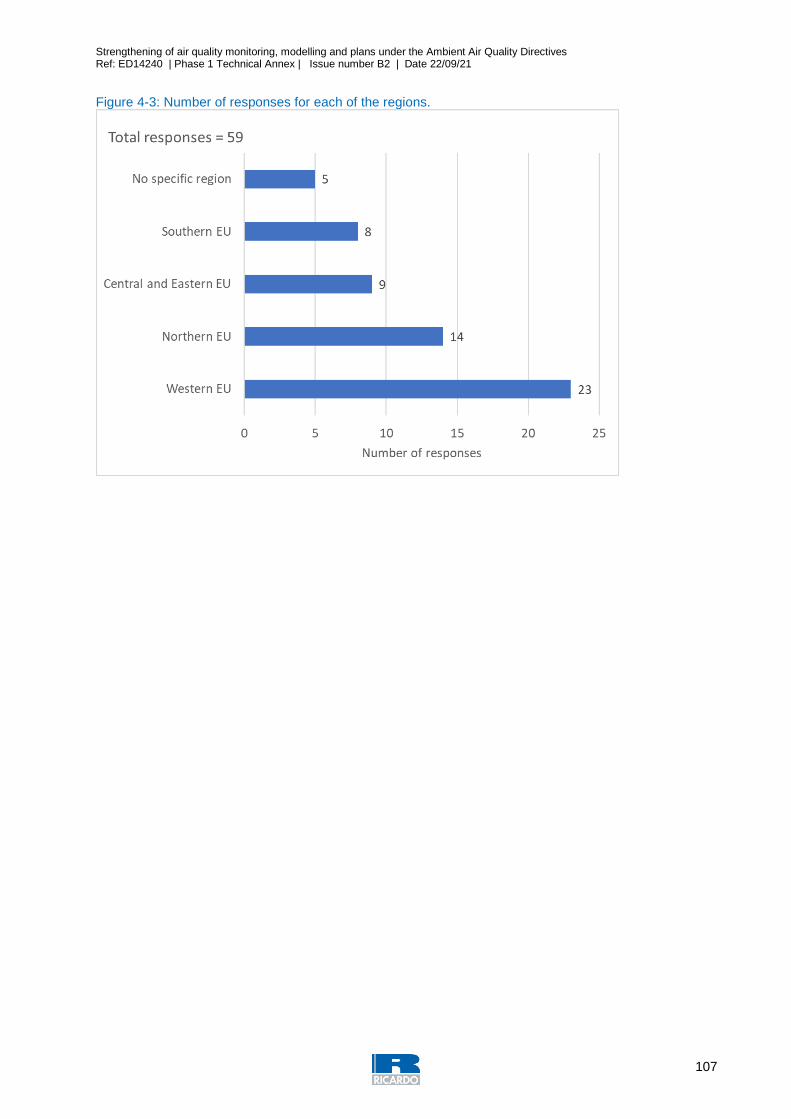
Strengthening of air quality monitoring, modelling and plans under the Ambient Air Quality Directives Ref: ED14240 | Phase 1 Technical Annex | Issue number B2 | Date 22/09/21
107
Figure 4-3: Number of responses for each of the regions.
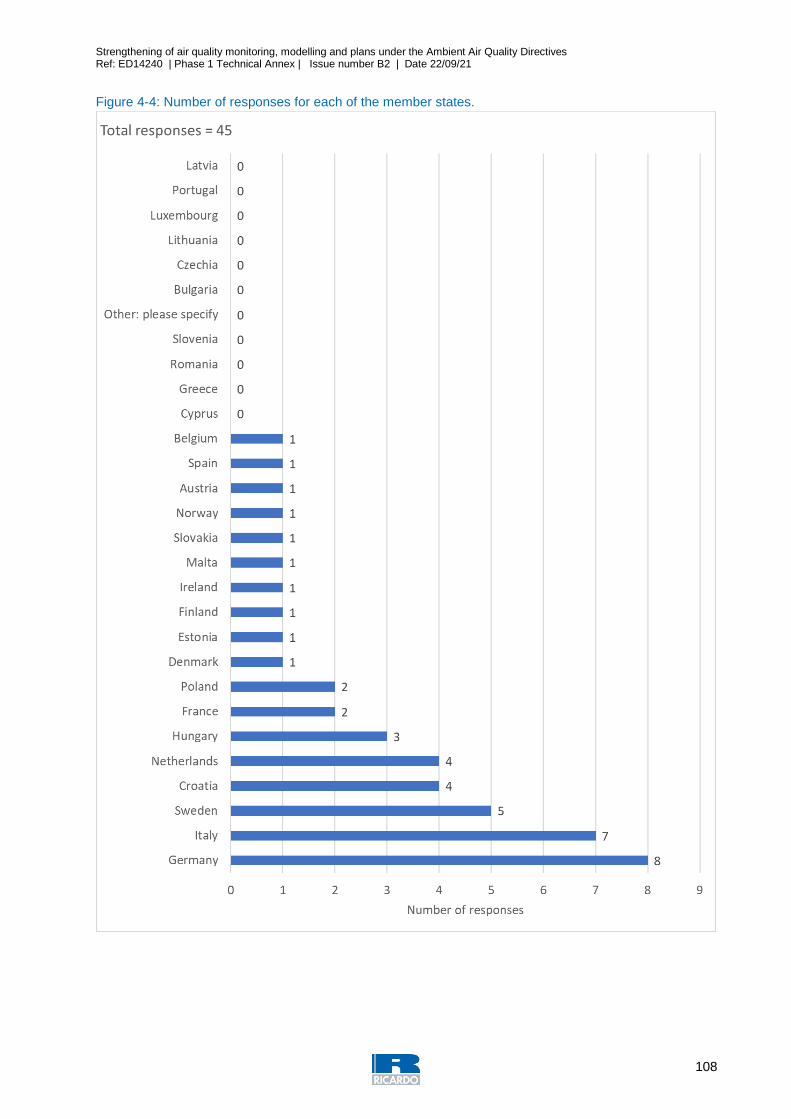
Strengthening of air quality monitoring, modelling and plans under the Ambient Air Quality Directives Ref: ED14240 | Phase 1 Technical Annex | Issue number B2 | Date 22/09/21
108
Figure 4-4: Number of responses for each of the member states.
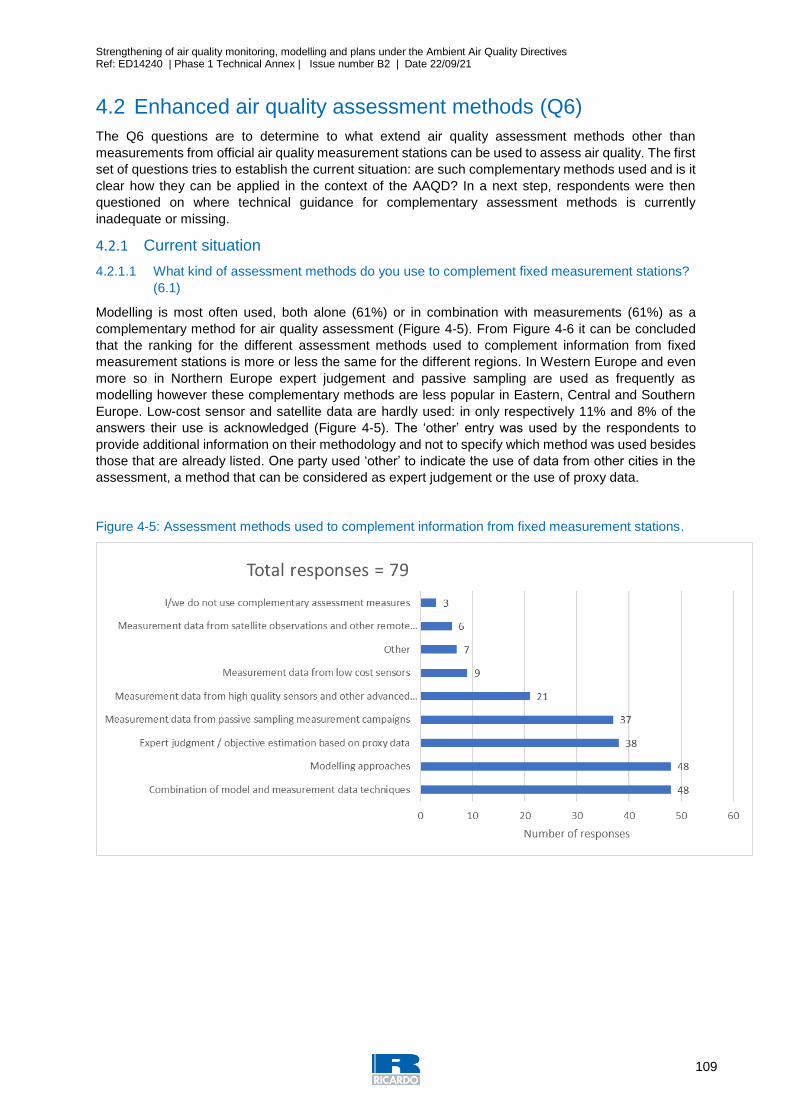
Strengthening of air quality monitoring, modelling and plans under the Ambient Air Quality Directives Ref: ED14240 | Phase 1 Technical Annex | Issue number B2 | Date 22/09/21
109
4.2 Enhanced air quality assessment methods (Q6)
The Q6 questions are to determine to what extend air quality assessment methods other than
measurements from official air quality measurement stations can be used to assess air quality. The first
set of questions tries to establish the current situation: are such complementary methods used and is it
clear how they can be applied in the context of the AAQD? In a next step, respondents were then
questioned on where technical guidance for complementary assessment methods is currently
inadequate or missing.
4.2.1 Current situation
4.2.1.1 What kind of assessment methods do you use to complement fixed measurement stations?
(6.1)
Modelling is most often used, both alone (61%) or in combination with measurements (61%) as a
complementary method for air quality assessment (Figure 4-5). From Figure 4-6 it can be concluded
that the ranking for the different assessment methods used to complement information from fixed
measurement stations is more or less the same for the different regions. In Western Europe and even
more so in Northern Europe expert judgement and passive sampling are used as frequently as
modelling however these complementary methods are less popular in Eastern, Central and Southern
Europe. Low-cost sensor and satellite data are hardly used: in only respectively 11% and 8% of the
answers their use is acknowledged (Figure 4-5). The ‘other’ entry was used by the respondents to
provide additional information on their methodology and not to specify which method was used besides
those that are already listed. One party used ‘other’ to indicate the use of data from other cities in the
assessment, a method that can be considered as expert judgement or the use of proxy data.
Figure 4-5: Assessment methods used to complement information from fixed measurement stations.

Strengthening of air quality monitoring, modelling and plans under the Ambient Air Quality Directives Ref: ED14240 | Phase 1 Technical Annex | Issue number B2 | Date 22/09/21
110
Figure 4-6: Assessment methods used to complement fixed measurement stations in the different regions.
4.2.1.2 Is it clear how to technically apply these complementary methods for air quality assessment
purposes (how to convert data or observations to relevant concentrations)? (6.2)
83% of respondents feel confident that they can technically apply air quality modelling techniques
(Figure 4-7). Also, when combining models with measurements (78%), using passive sampler results
(75%) or expert judgement/proxy data (55%) most respondents are confident that they know how to
apply these complementary methods for air quality assessment. This is however not the case for
satellite observations and low-cost sensors where respectively 33% and 46% indicate that it’s unclear
how to apply these methods for air quality assessment.
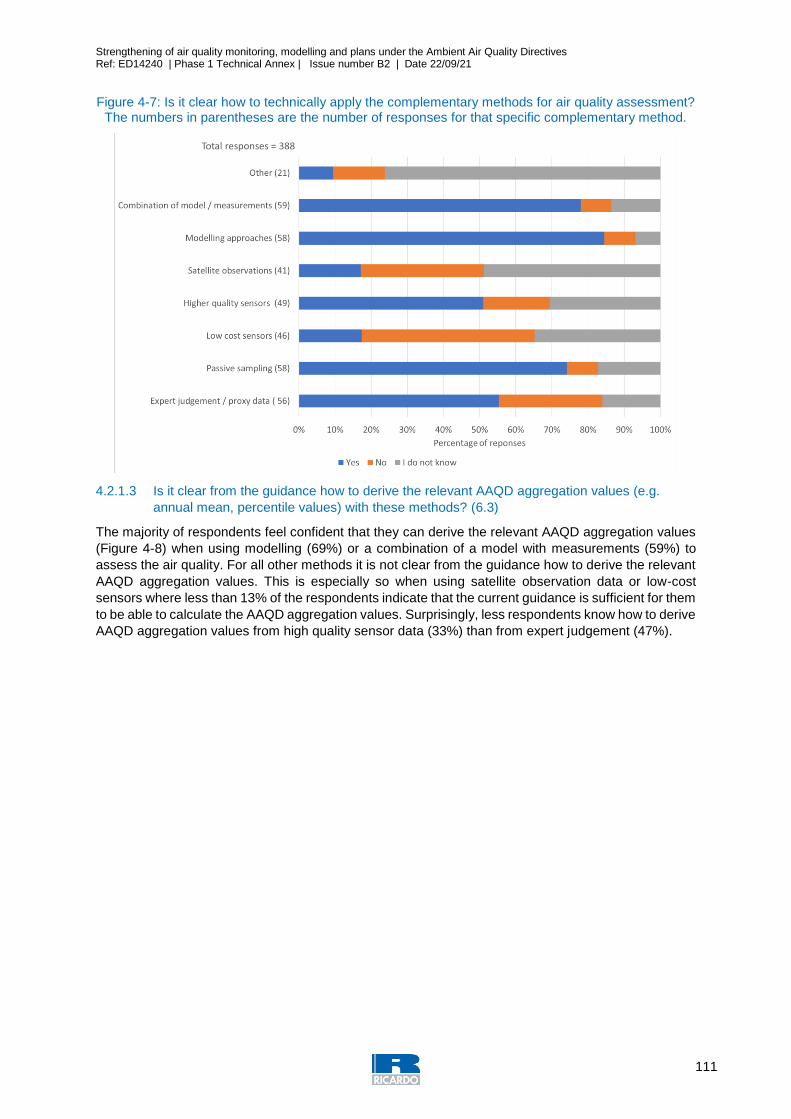
Strengthening of air quality monitoring, modelling and plans under the Ambient Air Quality Directives Ref: ED14240 | Phase 1 Technical Annex | Issue number B2 | Date 22/09/21
111
Figure 4-7: Is it clear how to technically apply the complementary methods for air quality assessment? The numbers in parentheses are the number of responses for that specific complementary method.
4.2.1.3 Is it clear from the guidance how to derive the relevant AAQD aggregation values (e.g.
annual mean, percentile values) with these methods? (6.3)
The majority of respondents feel confident that they can derive the relevant AAQD aggregation values
(Figure 4-8) when using modelling (69%) or a combination of a model with measurements (59%) to
assess the air quality. For all other methods it is not clear from the guidance how to derive the relevant
AAQD aggregation values. This is especially so when using satellite observation data or low-cost
sensors where less than 13% of the respondents indicate that the current guidance is sufficient for them
to be able to calculate the AAQD aggregation values. Surprisingly, less respondents know how to derive
AAQD aggregation values from high quality sensor data (33%) than from expert judgement (47%).
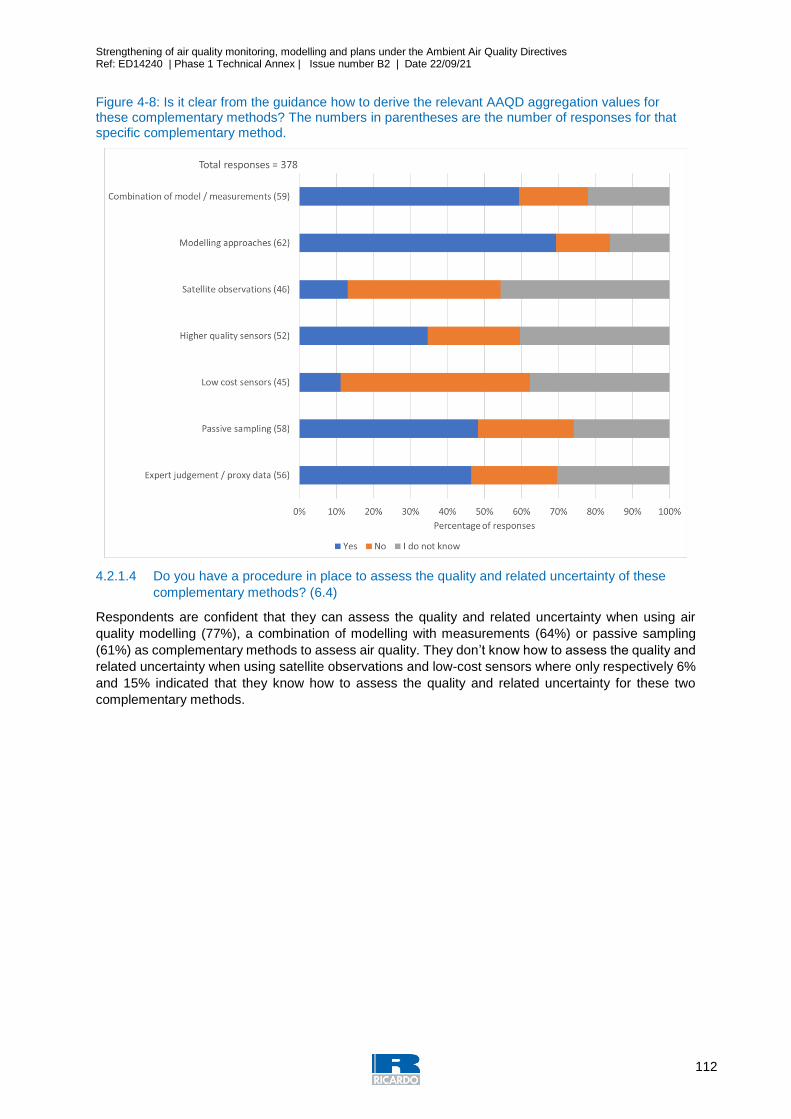
Strengthening of air quality monitoring, modelling and plans under the Ambient Air Quality Directives Ref: ED14240 | Phase 1 Technical Annex | Issue number B2 | Date 22/09/21
112
Figure 4-8: Is it clear from the guidance how to derive the relevant AAQD aggregation values for these complementary methods? The numbers in parentheses are the number of responses for that specific complementary method.
4.2.1.4 Do you have a procedure in place to assess the quality and related uncertainty of these
complementary methods? (6.4)
Respondents are confident that they can assess the quality and related uncertainty when using air
quality modelling (77%), a combination of modelling with measurements (64%) or passive sampling
(61%) as complementary methods to assess air quality. They don’t know how to assess the quality and
related uncertainty when using satellite observations and low-cost sensors where only respectively 6%
and 15% indicated that they know how to assess the quality and related uncertainty for these two
complementary methods.
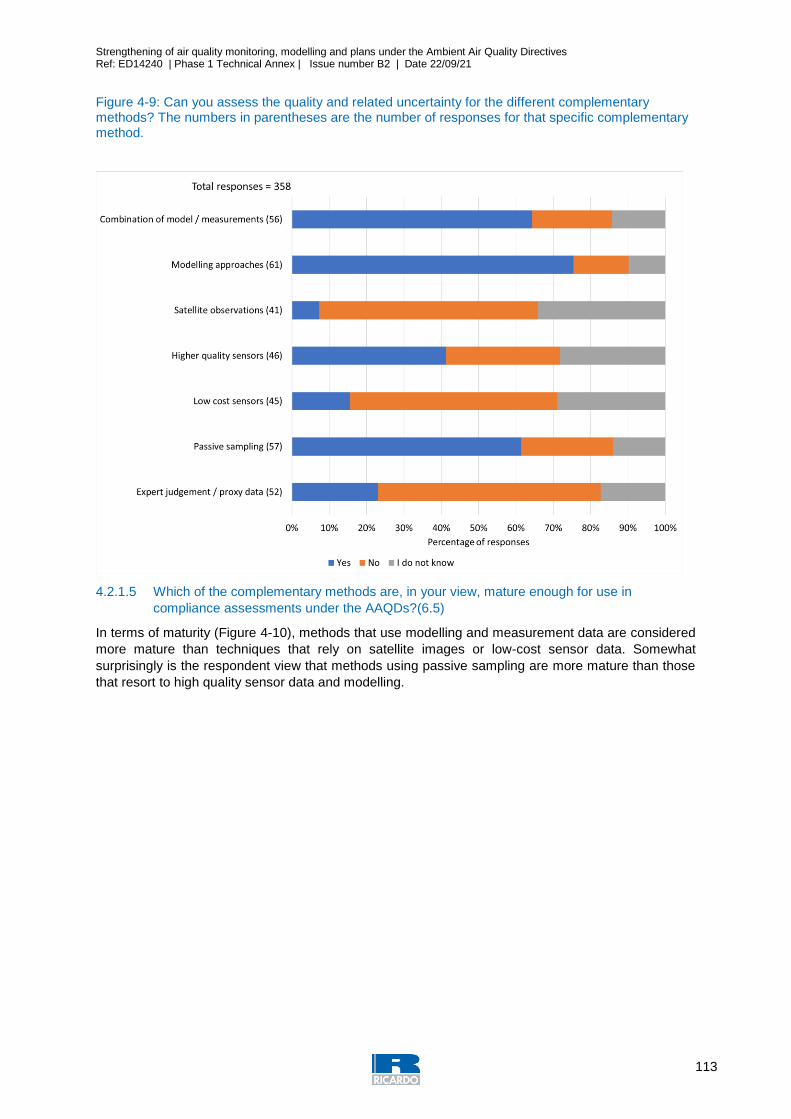
Strengthening of air quality monitoring, modelling and plans under the Ambient Air Quality Directives Ref: ED14240 | Phase 1 Technical Annex | Issue number B2 | Date 22/09/21
113
Figure 4-9: Can you assess the quality and related uncertainty for the different complementary methods? The numbers in parentheses are the number of responses for that specific complementary method.
4.2.1.5 Which of the complementary methods are, in your view, mature enough for use in
compliance assessments under the AAQDs?(6.5)
In terms of maturity (Figure 4-10), methods that use modelling and measurement data are considered
more mature than techniques that rely on satellite images or low-cost sensor data. Somewhat
surprisingly is the respondent view that methods using passive sampling are more mature than those
that resort to high quality sensor data and modelling.
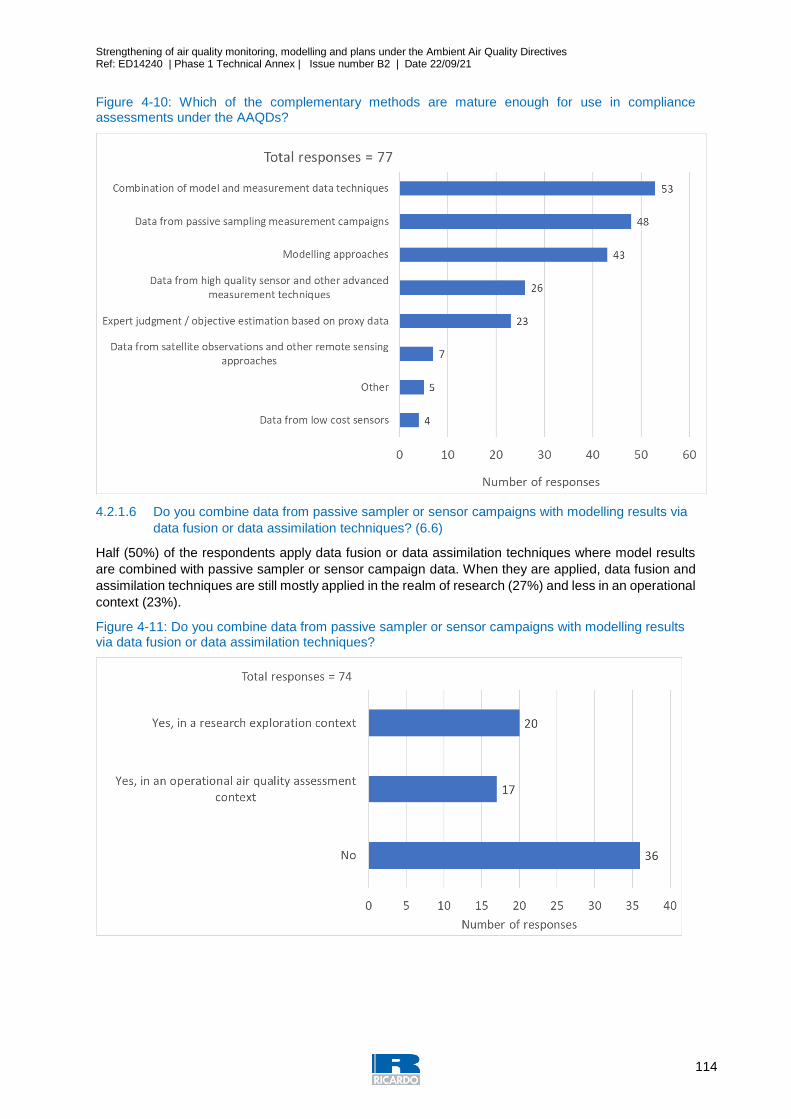
Strengthening of air quality monitoring, modelling and plans under the Ambient Air Quality Directives Ref: ED14240 | Phase 1 Technical Annex | Issue number B2 | Date 22/09/21
114
Figure 4-10: Which of the complementary methods are mature enough for use in compliance assessments under the AAQDs?
4.2.1.6 Do you combine data from passive sampler or sensor campaigns with modelling results via
data fusion or data assimilation techniques? (6.6)
Half (50%) of the respondents apply data fusion or data assimilation techniques where model results
are combined with passive sampler or sensor campaign data. When they are applied, data fusion and
assimilation techniques are still mostly applied in the realm of research (27%) and less in an operational
context (23%).
Figure 4-11: Do you combine data from passive sampler or sensor campaigns with modelling results via data fusion or data assimilation techniques?
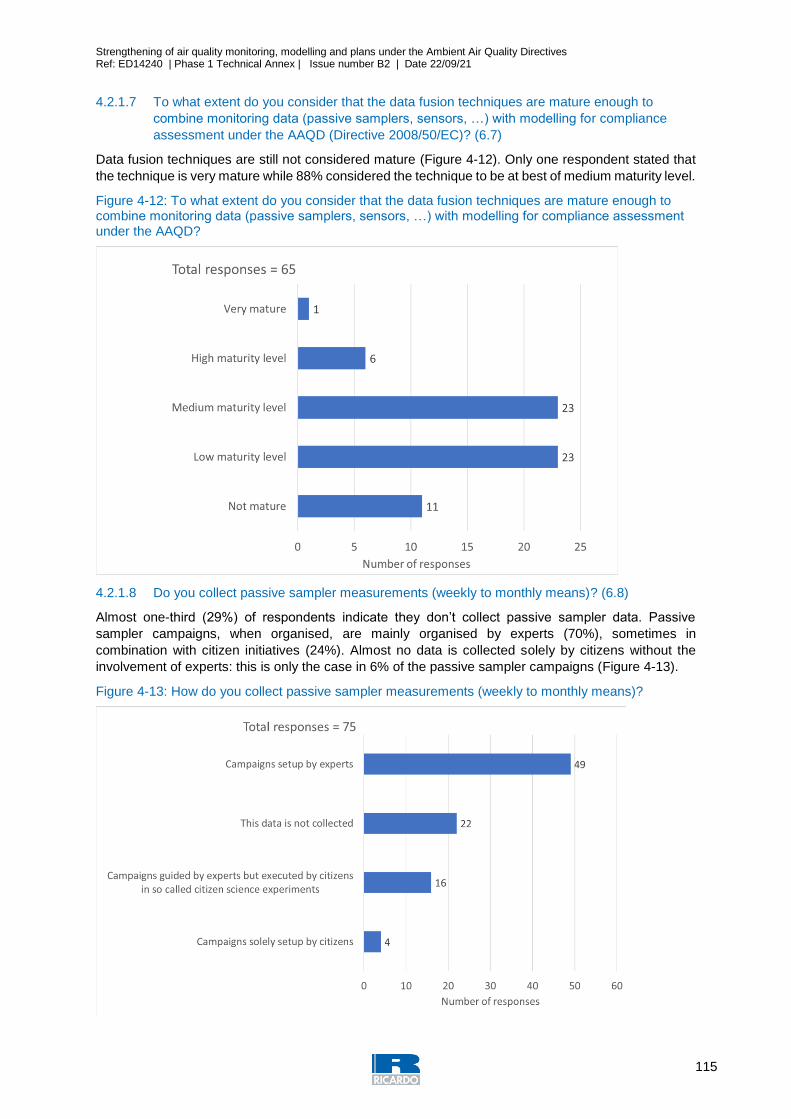
Strengthening of air quality monitoring, modelling and plans under the Ambient Air Quality Directives Ref: ED14240 | Phase 1 Technical Annex | Issue number B2 | Date 22/09/21
115
4.2.1.7 To what extent do you consider that the data fusion techniques are mature enough to
combine monitoring data (passive samplers, sensors, …) with modelling for compliance
assessment under the AAQD (Directive 2008/50/EC)? (6.7)
Data fusion techniques are still not considered mature (Figure 4-12). Only one respondent stated that
the technique is very mature while 88% considered the technique to be at best of medium maturity level.
Figure 4-12: To what extent do you consider that the data fusion techniques are mature enough to combine monitoring data (passive samplers, sensors, …) with modelling for compliance assessment under the AAQD?
4.2.1.8 Do you collect passive sampler measurements (weekly to monthly means)? (6.8)
Almost one-third (29%) of respondents indicate they don’t collect passive sampler data. Passive
sampler campaigns, when organised, are mainly organised by experts (70%), sometimes in
combination with citizen initiatives (24%). Almost no data is collected solely by citizens without the
involvement of experts: this is only the case in 6% of the passive sampler campaigns (Figure 4-13).
Figure 4-13: How do you collect passive sampler measurements (weekly to monthly means)?
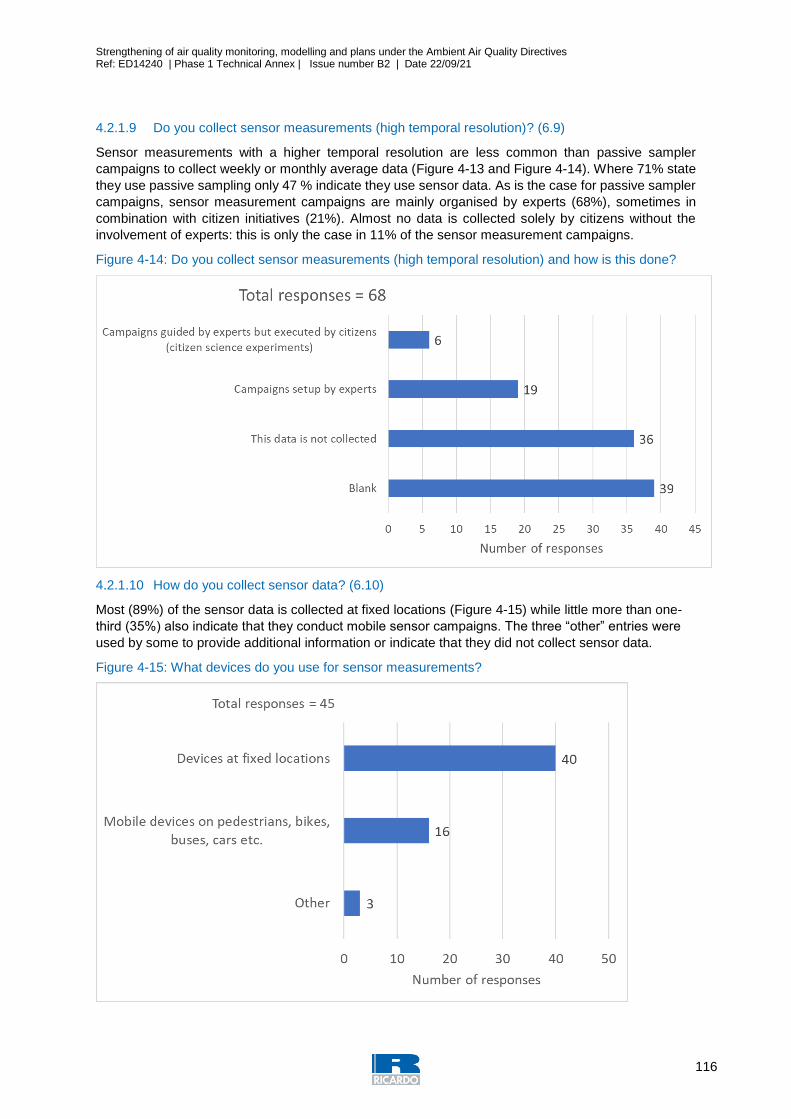
Strengthening of air quality monitoring, modelling and plans under the Ambient Air Quality Directives Ref: ED14240 | Phase 1 Technical Annex | Issue number B2 | Date 22/09/21
116
4.2.1.9 Do you collect sensor measurements (high temporal resolution)? (6.9)
Sensor measurements with a higher temporal resolution are less common than passive sampler
campaigns to collect weekly or monthly average data (Figure 4-13 and Figure 4-14). Where 71% state
they use passive sampling only 47 % indicate they use sensor data. As is the case for passive sampler
campaigns, sensor measurement campaigns are mainly organised by experts (68%), sometimes in
combination with citizen initiatives (21%). Almost no data is collected solely by citizens without the
involvement of experts: this is only the case in 11% of the sensor measurement campaigns.
Figure 4-14: Do you collect sensor measurements (high temporal resolution) and how is this done?
4.2.1.10 How do you collect sensor data? (6.10)
Most (89%) of the sensor data is collected at fixed locations (Figure 4-15) while little more than one-
third (35%) also indicate that they conduct mobile sensor campaigns. The three “other” entries were
used by some to provide additional information or indicate that they did not collect sensor data.
Figure 4-15: What devices do you use for sensor measurements?
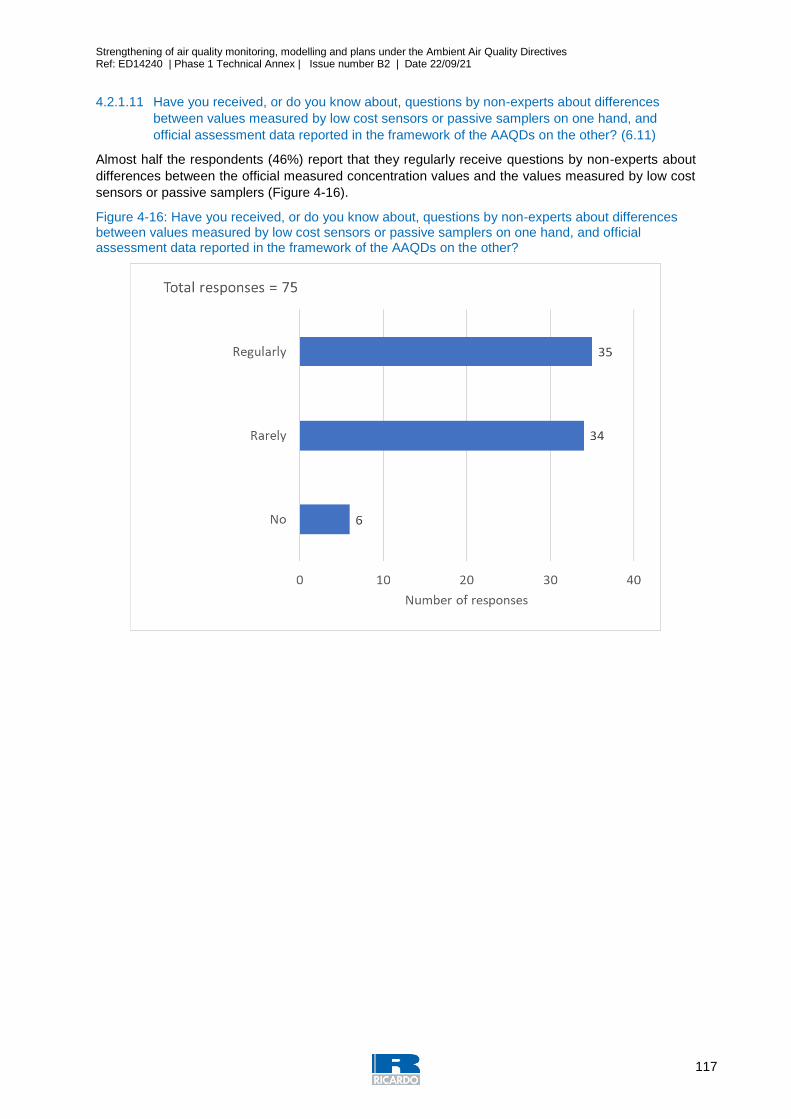
Strengthening of air quality monitoring, modelling and plans under the Ambient Air Quality Directives Ref: ED14240 | Phase 1 Technical Annex | Issue number B2 | Date 22/09/21
117
4.2.1.11 Have you received, or do you know about, questions by non-experts about differences
between values measured by low cost sensors or passive samplers on one hand, and
official assessment data reported in the framework of the AAQDs on the other? (6.11)
Almost half the respondents (46%) report that they regularly receive questions by non-experts about
differences between the official measured concentration values and the values measured by low cost
sensors or passive samplers (Figure 4-16).
Figure 4-16: Have you received, or do you know about, questions by non-experts about differences between values measured by low cost sensors or passive samplers on one hand, and official assessment data reported in the framework of the AAQDs on the other?
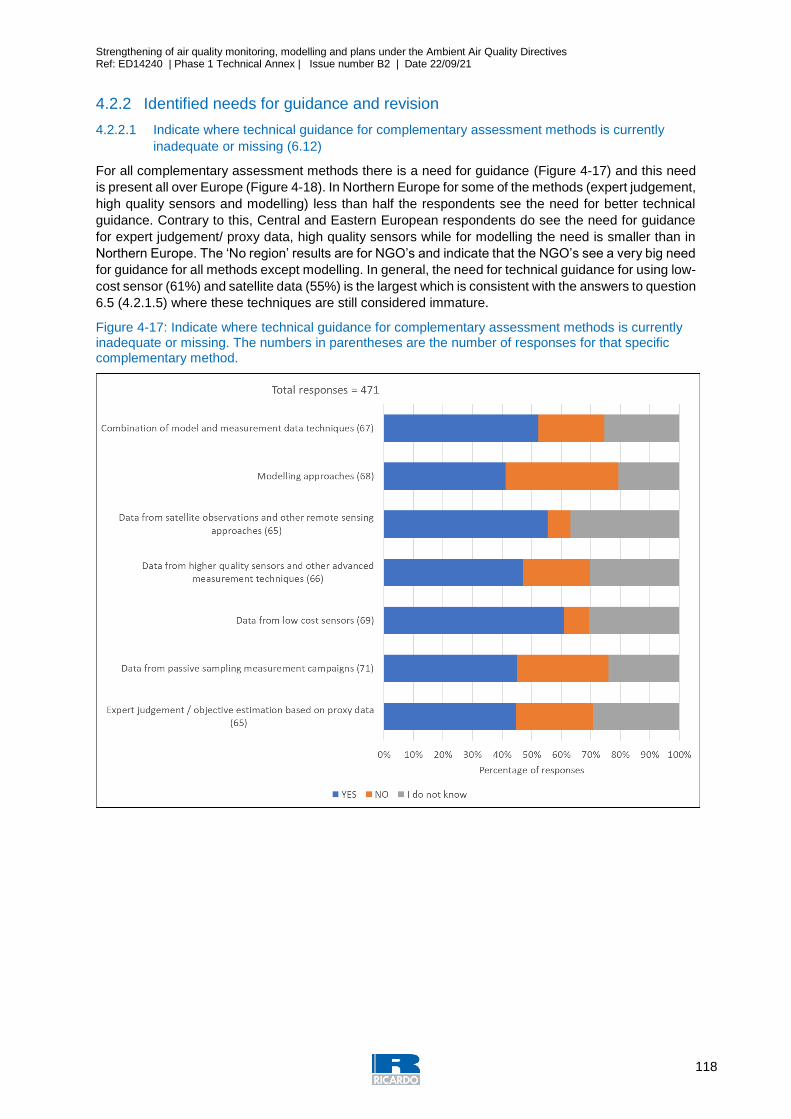
Strengthening of air quality monitoring, modelling and plans under the Ambient Air Quality Directives Ref: ED14240 | Phase 1 Technical Annex | Issue number B2 | Date 22/09/21
118
4.2.2 Identified needs for guidance and revision
4.2.2.1 Indicate where technical guidance for complementary assessment methods is currently
inadequate or missing (6.12)
For all complementary assessment methods there is a need for guidance (Figure 4-17) and this need
is present all over Europe (Figure 4-18). In Northern Europe for some of the methods (expert judgement,
high quality sensors and modelling) less than half the respondents see the need for better technical
guidance. Contrary to this, Central and Eastern European respondents do see the need for guidance
for expert judgement/ proxy data, high quality sensors while for modelling the need is smaller than in
Northern Europe. The ‘No region’ results are for NGO’s and indicate that the NGO’s see a very big need
for guidance for all methods except modelling. In general, the need for technical guidance for using low-
cost sensor (61%) and satellite data (55%) is the largest which is consistent with the answers to question
6.5 (4.2.1.5) where these techniques are still considered immature.
Figure 4-17: Indicate where technical guidance for complementary assessment methods is currently inadequate or missing. The numbers in parentheses are the number of responses for that specific complementary method.
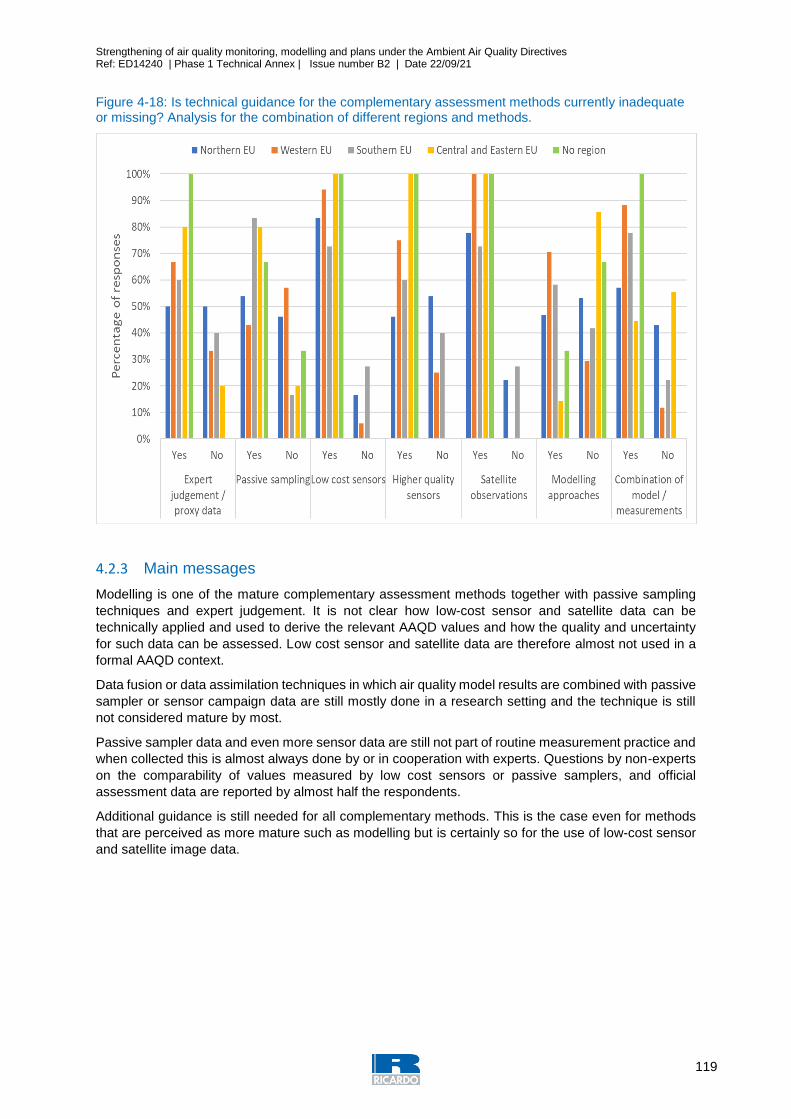
Strengthening of air quality monitoring, modelling and plans under the Ambient Air Quality Directives Ref: ED14240 | Phase 1 Technical Annex | Issue number B2 | Date 22/09/21
119
Figure 4-18: Is technical guidance for the complementary assessment methods currently inadequate or missing? Analysis for the combination of different regions and methods.
4.2.3 Main messages
Modelling is one of the mature complementary assessment methods together with passive sampling
techniques and expert judgement. It is not clear how low-cost sensor and satellite data can be
technically applied and used to derive the relevant AAQD values and how the quality and uncertainty
for such data can be assessed. Low cost sensor and satellite data are therefore almost not used in a
formal AAQD context.
Data fusion or data assimilation techniques in which air quality model results are combined with passive
sampler or sensor campaign data are still mostly done in a research setting and the technique is still
not considered mature by most.
Passive sampler data and even more sensor data are still not part of routine measurement practice and
when collected this is almost always done by or in cooperation with experts. Questions by non-experts
on the comparability of values measured by low cost sensors or passive samplers, and official
assessment data are reported by almost half the respondents.
Additional guidance is still needed for all complementary methods. This is the case even for methods
that are perceived as more mature such as modelling but is certainly so for the use of low-cost sensor
and satellite image data.
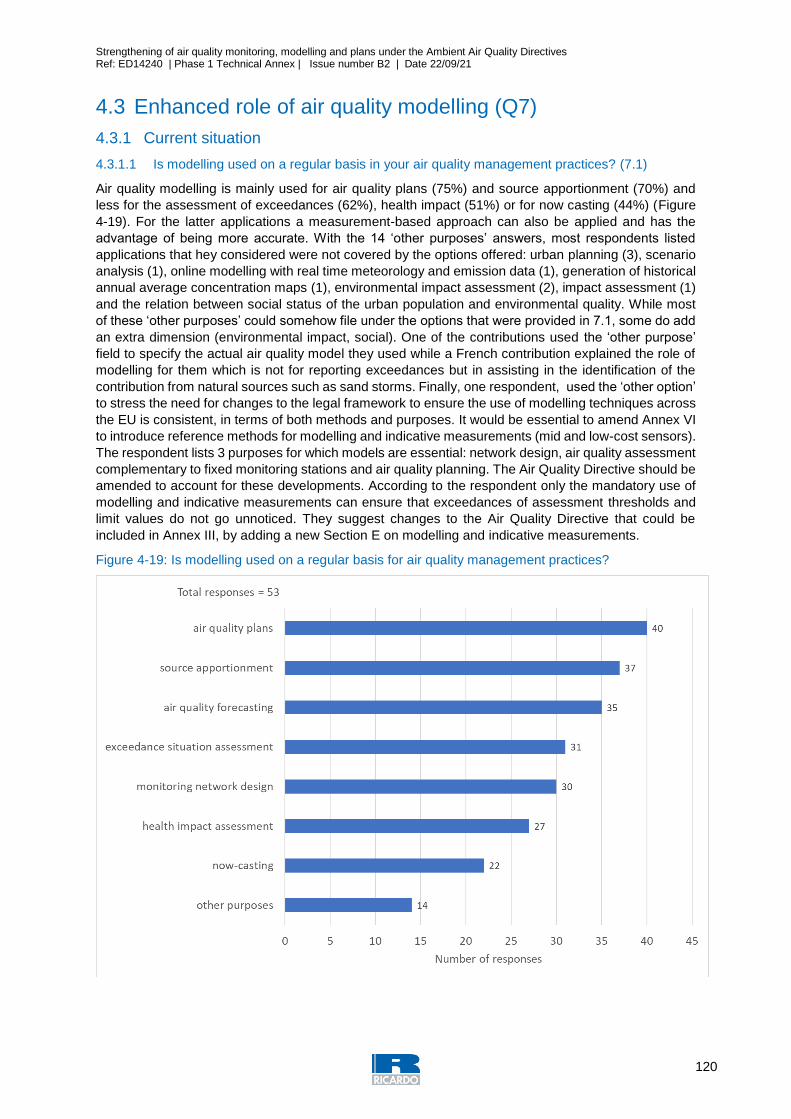
Strengthening of air quality monitoring, modelling and plans under the Ambient Air Quality Directives Ref: ED14240 | Phase 1 Technical Annex | Issue number B2 | Date 22/09/21
120
4.3 Enhanced role of air quality modelling (Q7)
4.3.1 Current situation
4.3.1.1 Is modelling used on a regular basis in your air quality management practices? (7.1)
Air quality modelling is mainly used for air quality plans (75%) and source apportionment (70%) and
less for the assessment of exceedances (62%), health impact (51%) or for now casting (44%) (Figure
4-19). For the latter applications a measurement-based approach can also be applied and has the
advantage of being more accurate. With the 14 ‘other purposes’ answers, most respondents listed
applications that hey considered were not covered by the options offered: urban planning (3), scenario
analysis (1), online modelling with real time meteorology and emission data (1), generation of historical
annual average concentration maps (1), environmental impact assessment (2), impact assessment (1)
and the relation between social status of the urban population and environmental quality. While most
of these ‘other purposes’ could somehow file under the options that were provided in 7.1, some do add
an extra dimension (environmental impact, social). One of the contributions used the ‘other purpose’
field to specify the actual air quality model they used while a French contribution explained the role of
modelling for them which is not for reporting exceedances but in assisting in the identification of the
contribution from natural sources such as sand storms. Finally, one respondent, used the ‘other option’
to stress the need for changes to the legal framework to ensure the use of modelling techniques across
the EU is consistent, in terms of both methods and purposes. It would be essential to amend Annex VI
to introduce reference methods for modelling and indicative measurements (mid and low-cost sensors).
The respondent lists 3 purposes for which models are essential: network design, air quality assessment
complementary to fixed monitoring stations and air quality planning. The Air Quality Directive should be
amended to account for these developments. According to the respondent only the mandatory use of
modelling and indicative measurements can ensure that exceedances of assessment thresholds and
limit values do not go unnoticed. They suggest changes to the Air Quality Directive that could be
included in Annex III, by adding a new Section E on modelling and indicative measurements.
Figure 4-19: Is modelling used on a regular basis for air quality management practices?
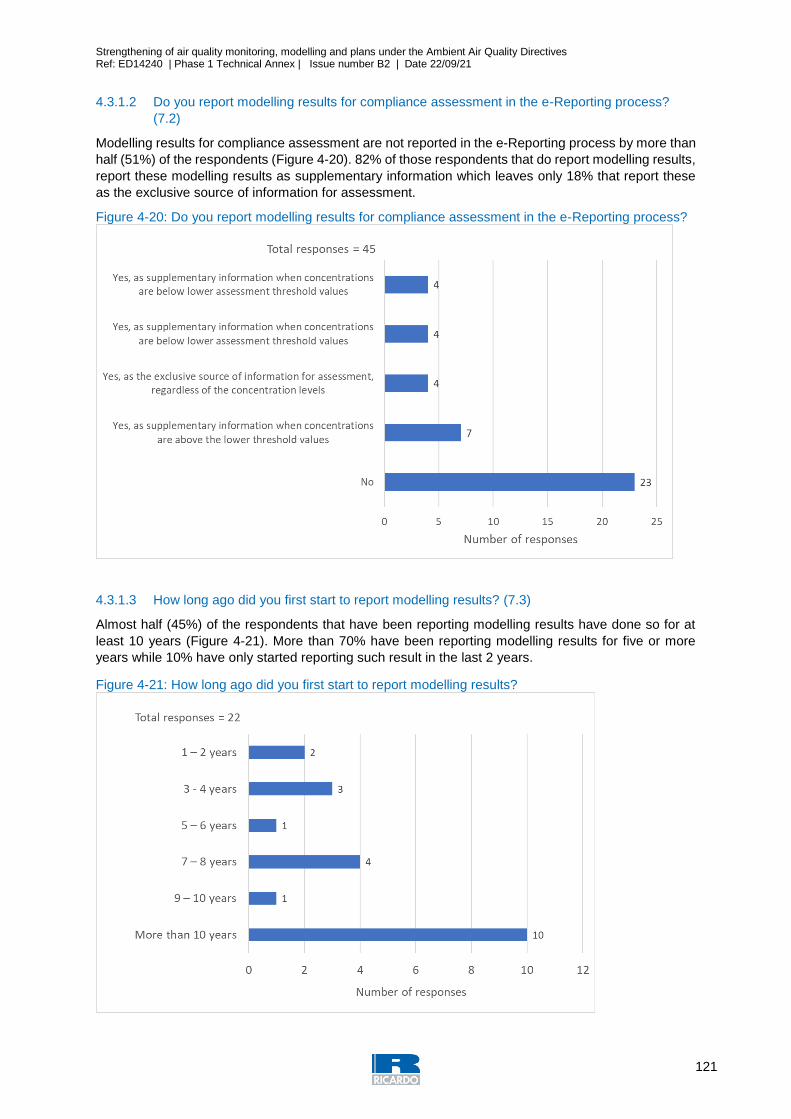
Strengthening of air quality monitoring, modelling and plans under the Ambient Air Quality Directives Ref: ED14240 | Phase 1 Technical Annex | Issue number B2 | Date 22/09/21
121
4.3.1.2 Do you report modelling results for compliance assessment in the e-Reporting process?
(7.2)
Modelling results for compliance assessment are not reported in the e-Reporting process by more than
half (51%) of the respondents (Figure 4-20). 82% of those respondents that do report modelling results,
report these modelling results as supplementary information which leaves only 18% that report these
as the exclusive source of information for assessment.
Figure 4-20: Do you report modelling results for compliance assessment in the e-Reporting process?
4.3.1.3 How long ago did you first start to report modelling results? (7.3)
Almost half (45%) of the respondents that have been reporting modelling results have done so for at
least 10 years (Figure 4-21). More than 70% have been reporting modelling results for five or more
years while 10% have only started reporting such result in the last 2 years.
Figure 4-21: How long ago did you first start to report modelling results?
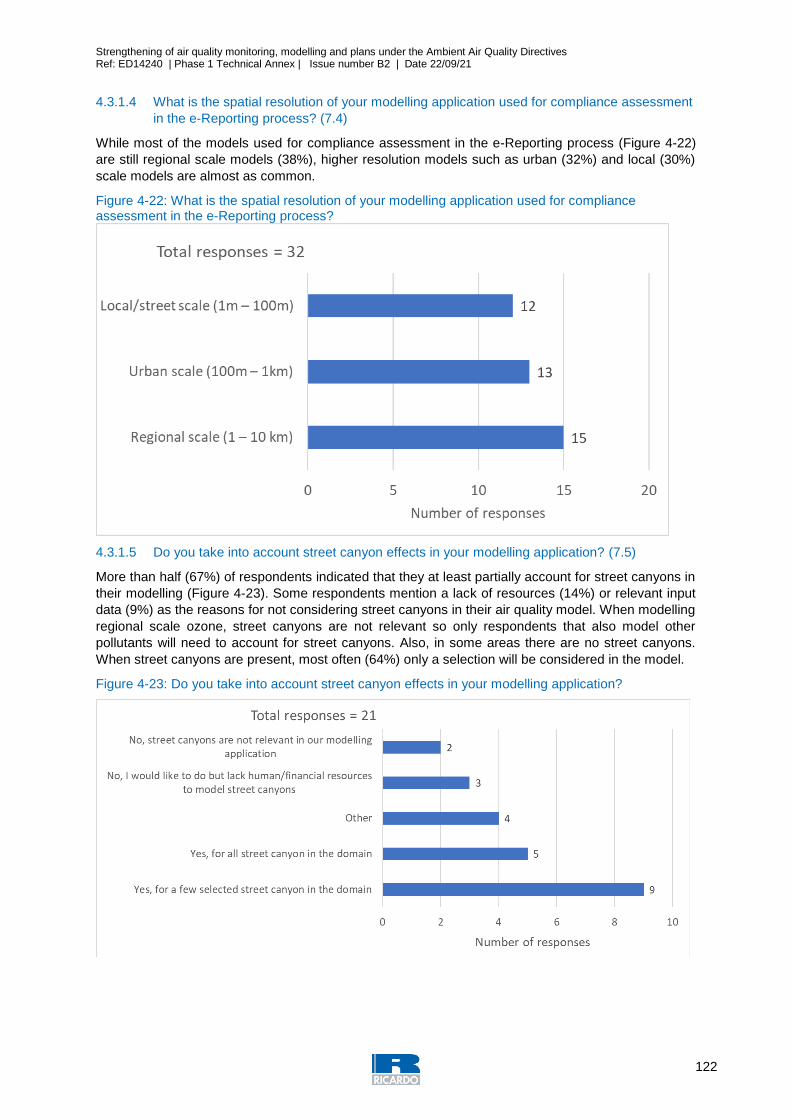
Strengthening of air quality monitoring, modelling and plans under the Ambient Air Quality Directives Ref: ED14240 | Phase 1 Technical Annex | Issue number B2 | Date 22/09/21
122
4.3.1.4 What is the spatial resolution of your modelling application used for compliance assessment
in the e-Reporting process? (7.4)
While most of the models used for compliance assessment in the e-Reporting process (Figure 4-22)
are still regional scale models (38%), higher resolution models such as urban (32%) and local (30%)
scale models are almost as common.
Figure 4-22: What is the spatial resolution of your modelling application used for compliance assessment in the e-Reporting process?
4.3.1.5 Do you take into account street canyon effects in your modelling application? (7.5)
More than half (67%) of respondents indicated that they at least partially account for street canyons in
their modelling (Figure 4-23). Some respondents mention a lack of resources (14%) or relevant input
data (9%) as the reasons for not considering street canyons in their air quality model. When modelling
regional scale ozone, street canyons are not relevant so only respondents that also model other
pollutants will need to account for street canyons. Also, in some areas there are no street canyons.
When street canyons are present, most often (64%) only a selection will be considered in the model.
Figure 4-23: Do you take into account street canyon effects in your modelling application?
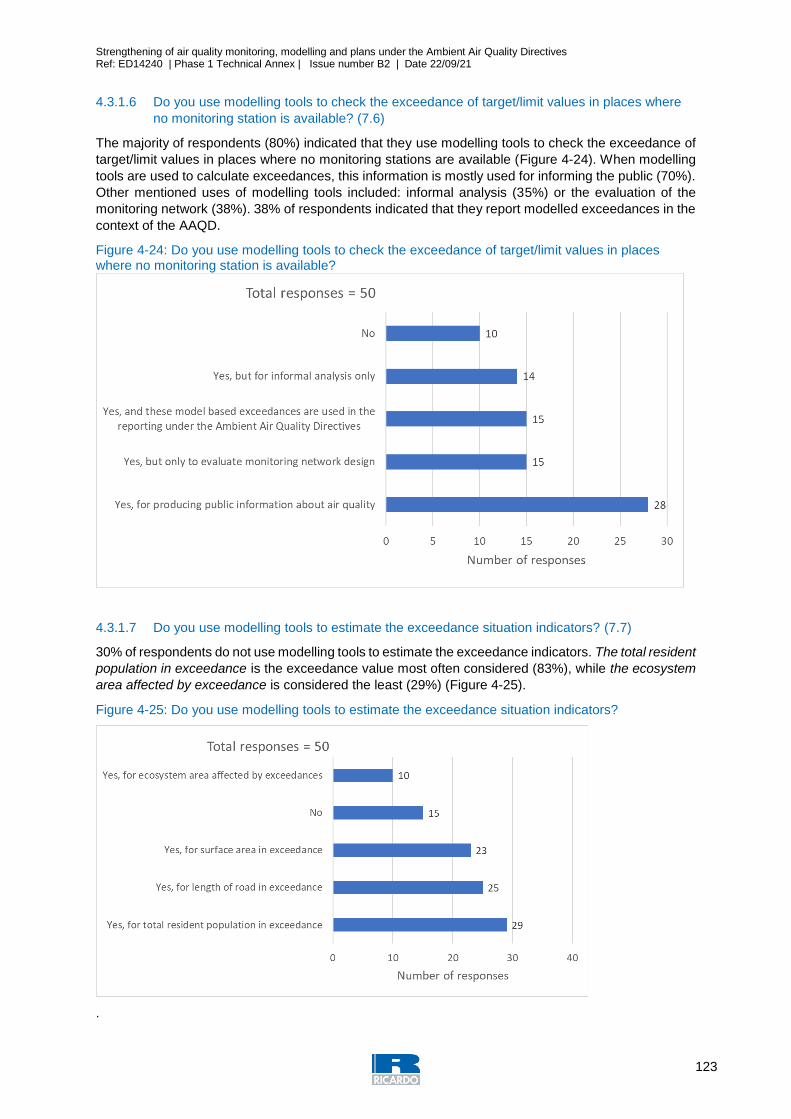
Strengthening of air quality monitoring, modelling and plans under the Ambient Air Quality Directives Ref: ED14240 | Phase 1 Technical Annex | Issue number B2 | Date 22/09/21
123
4.3.1.6 Do you use modelling tools to check the exceedance of target/limit values in places where
no monitoring station is available? (7.6)
The majority of respondents (80%) indicated that they use modelling tools to check the exceedance of
target/limit values in places where no monitoring stations are available (Figure 4-24). When modelling
tools are used to calculate exceedances, this information is mostly used for informing the public (70%).
Other mentioned uses of modelling tools included: informal analysis (35%) or the evaluation of the
monitoring network (38%). 38% of respondents indicated that they report modelled exceedances in the
context of the AAQD.
Figure 4-24: Do you use modelling tools to check the exceedance of target/limit values in places where no monitoring station is available?
4.3.1.7 Do you use modelling tools to estimate the exceedance situation indicators? (7.7)
30% of respondents do not use modelling tools to estimate the exceedance indicators. The total resident
population in exceedance is the exceedance value most often considered (83%), while the ecosystem
area affected by exceedance is considered the least (29%) (Figure 4-25).
Figure 4-25: Do you use modelling tools to estimate the exceedance situation indicators?
.
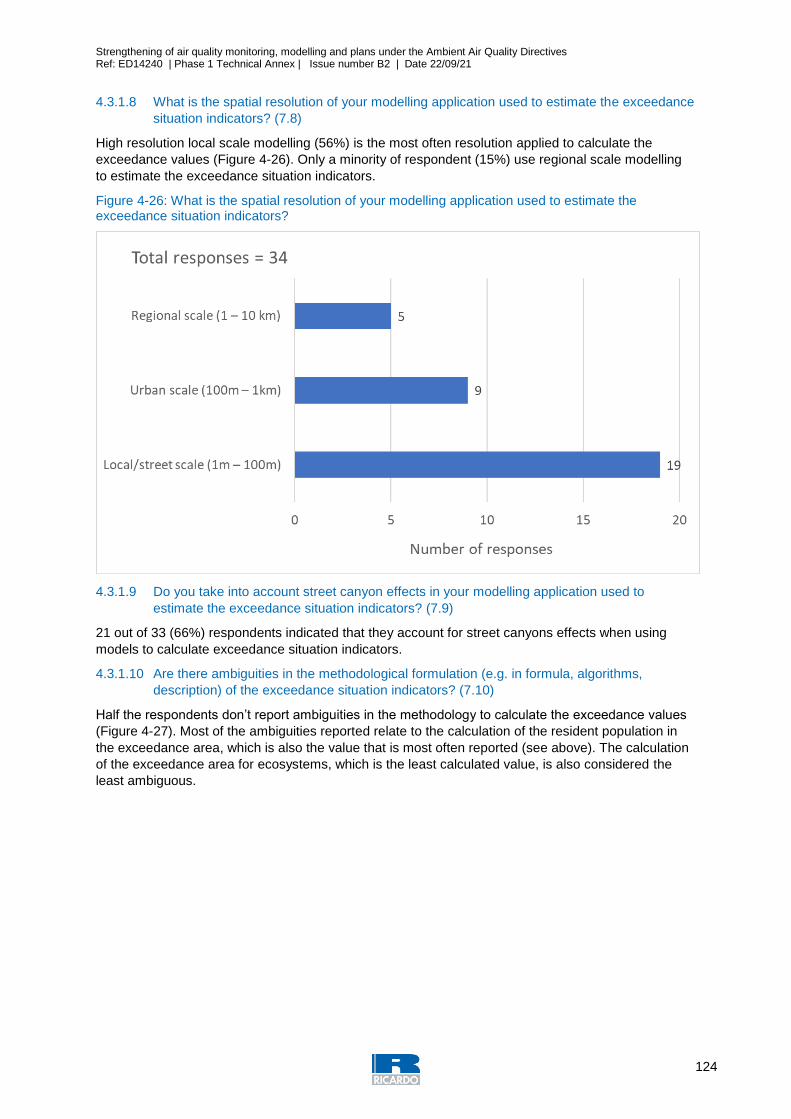
Strengthening of air quality monitoring, modelling and plans under the Ambient Air Quality Directives Ref: ED14240 | Phase 1 Technical Annex | Issue number B2 | Date 22/09/21
124
4.3.1.8 What is the spatial resolution of your modelling application used to estimate the exceedance
situation indicators? (7.8)
High resolution local scale modelling (56%) is the most often resolution applied to calculate the
exceedance values (Figure 4-26). Only a minority of respondent (15%) use regional scale modelling
to estimate the exceedance situation indicators.
Figure 4-26: What is the spatial resolution of your modelling application used to estimate the exceedance situation indicators?
4.3.1.9 Do you take into account street canyon effects in your modelling application used to
estimate the exceedance situation indicators? (7.9)
21 out of 33 (66%) respondents indicated that they account for street canyons effects when using
models to calculate exceedance situation indicators.
4.3.1.10 Are there ambiguities in the methodological formulation (e.g. in formula, algorithms,
description) of the exceedance situation indicators? (7.10)
Half the respondents don’t report ambiguities in the methodology to calculate the exceedance values
(Figure 4-27). Most of the ambiguities reported relate to the calculation of the resident population in
the exceedance area, which is also the value that is most often reported (see above). The calculation
of the exceedance area for ecosystems, which is the least calculated value, is also considered the
least ambiguous.
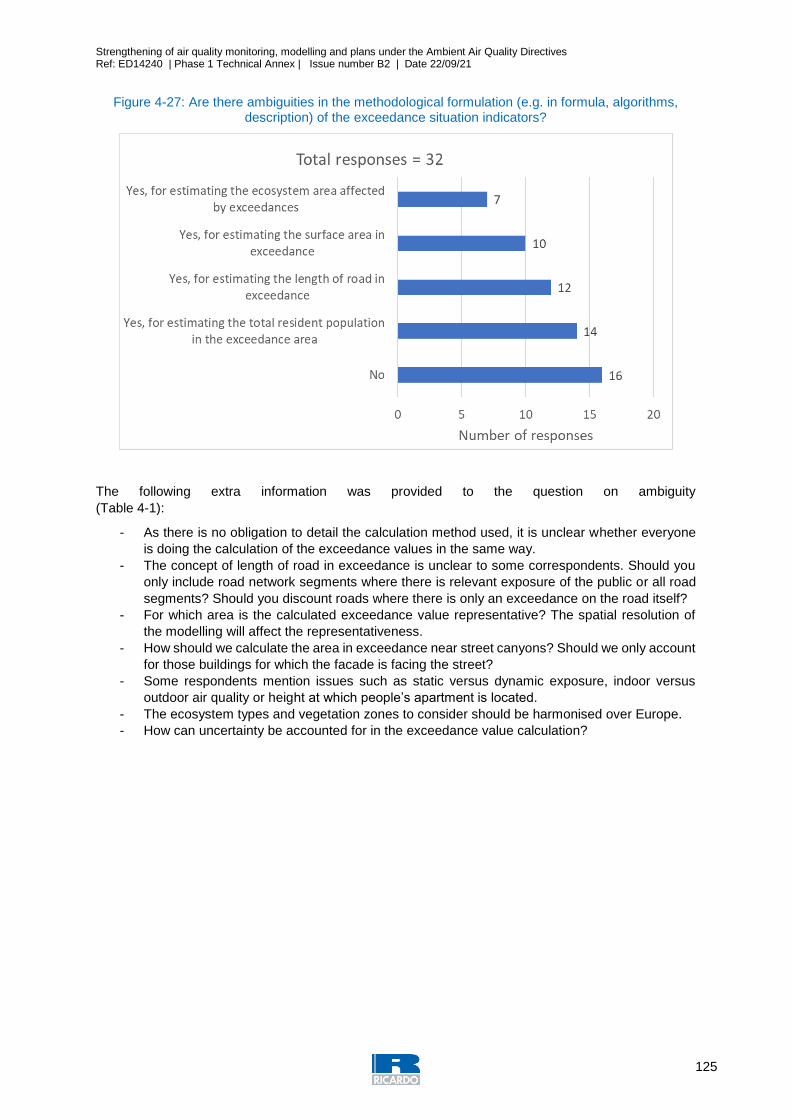
Strengthening of air quality monitoring, modelling and plans under the Ambient Air Quality Directives Ref: ED14240 | Phase 1 Technical Annex | Issue number B2 | Date 22/09/21
125
Figure 4-27: Are there ambiguities in the methodological formulation (e.g. in formula, algorithms, description) of the exceedance situation indicators?
The following extra information was provided to the question on ambiguity
(Table 4-1):
- As there is no obligation to detail the calculation method used, it is unclear whether everyone
is doing the calculation of the exceedance values in the same way.
- The concept of length of road in exceedance is unclear to some correspondents. Should you
only include road network segments where there is relevant exposure of the public or all road
segments? Should you discount roads where there is only an exceedance on the road itself?
- For which area is the calculated exceedance value representative? The spatial resolution of
the modelling will affect the representativeness.
- How should we calculate the area in exceedance near street canyons? Should we only account
for those buildings for which the facade is facing the street?
- Some respondents mention issues such as static versus dynamic exposure, indoor versus
outdoor air quality or height at which people’s apartment is located.
- The ecosystem types and vegetation zones to consider should be harmonised over Europe.
- How can uncertainty be accounted for in the exceedance value calculation?
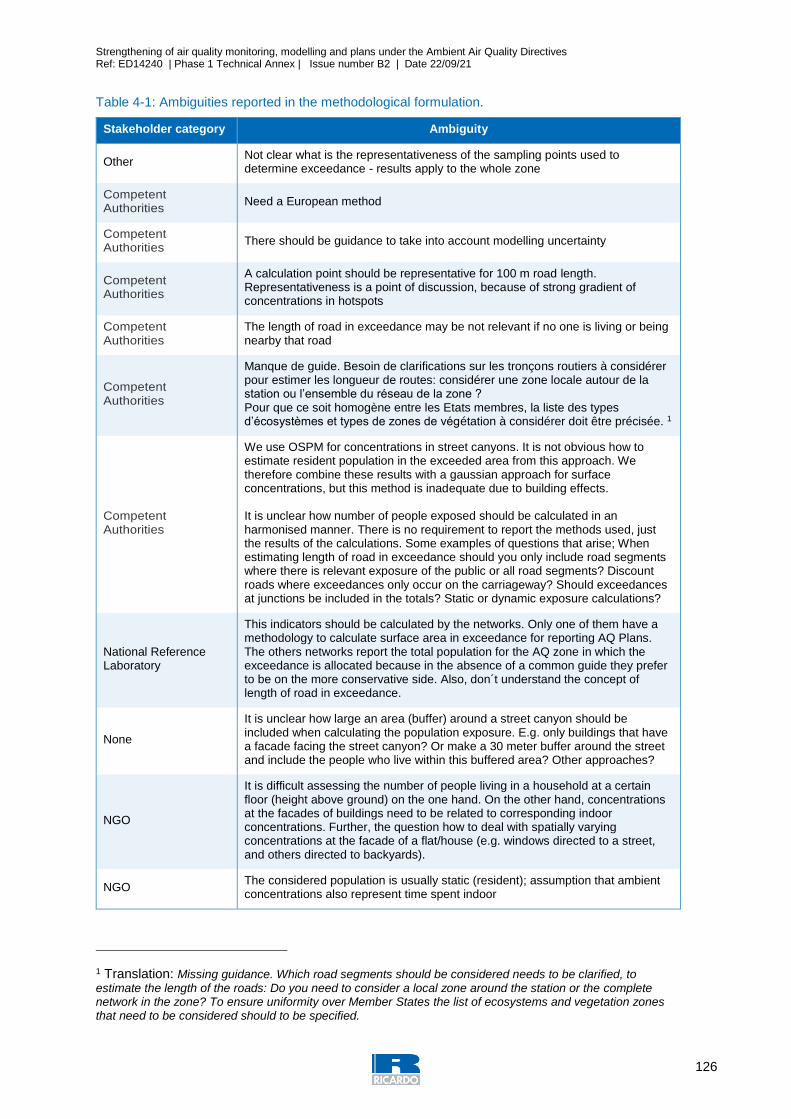
Strengthening of air quality monitoring, modelling and plans under the Ambient Air Quality Directives Ref: ED14240 | Phase 1 Technical Annex | Issue number B2 | Date 22/09/21
126
Table 4-1: Ambiguities reported in the methodological formulation.
Stakeholder category Ambiguity
Other Not clear what is the representativeness of the sampling points used to determine exceedance - results apply to the whole zone
Competent Authorities
Need a European method
Competent Authorities
There should be guidance to take into account modelling uncertainty
Competent Authorities
A calculation point should be representative for 100 m road length. Representativeness is a point of discussion, because of strong gradient of concentrations in hotspots
Competent Authorities
The length of road in exceedance may be not relevant if no one is living or being nearby that road
Competent Authorities
Manque de guide. Besoin de clarifications sur les tronçons routiers à considérer pour estimer les longueur de routes: considérer une zone locale autour de la station ou l’ensemble du réseau de la zone ? Pour que ce soit homogène entre les Etats membres, la liste des types d’écosystèmes et types de zones de végétation à considérer doit être précisée. 1
Competent Authorities
We use OSPM for concentrations in street canyons. It is not obvious how to estimate resident population in the exceeded area from this approach. We therefore combine these results with a gaussian approach for surface concentrations, but this method is inadequate due to building effects. It is unclear how number of people exposed should be calculated in an harmonised manner. There is no requirement to report the methods used, just the results of the calculations. Some examples of questions that arise; When estimating length of road in exceedance should you only include road segments where there is relevant exposure of the public or all road segments? Discount roads where exceedances only occur on the carriageway? Should exceedances at junctions be included in the totals? Static or dynamic exposure calculations?
National Reference Laboratory
This indicators should be calculated by the networks. Only one of them have a methodology to calculate surface area in exceedance for reporting AQ Plans. The others networks report the total population for the AQ zone in which the exceedance is allocated because in the absence of a common guide they prefer to be on the more conservative side. Also, don´t understand the concept of length of road in exceedance.
None
It is unclear how large an area (buffer) around a street canyon should be included when calculating the population exposure. E.g. only buildings that have a facade facing the street canyon? Or make a 30 meter buffer around the street and include the people who live within this buffered area? Other approaches?
NGO
It is difficult assessing the number of people living in a household at a certain floor (height above ground) on the one hand. On the other hand, concentrations at the facades of buildings need to be related to corresponding indoor concentrations. Further, the question how to deal with spatially varying concentrations at the facade of a flat/house (e.g. windows directed to a street, and others directed to backyards).
NGO The considered population is usually static (resident); assumption that ambient concentrations also represent time spent indoor
1 Translation: Missing guidance. Which road segments should be considered needs to be clarified, to estimate the length of the roads: Do you need to consider a local zone around the station or the complete network in the zone? To ensure uniformity over Member States the list of ecosystems and vegetation zones that need to be considered should to be specified.
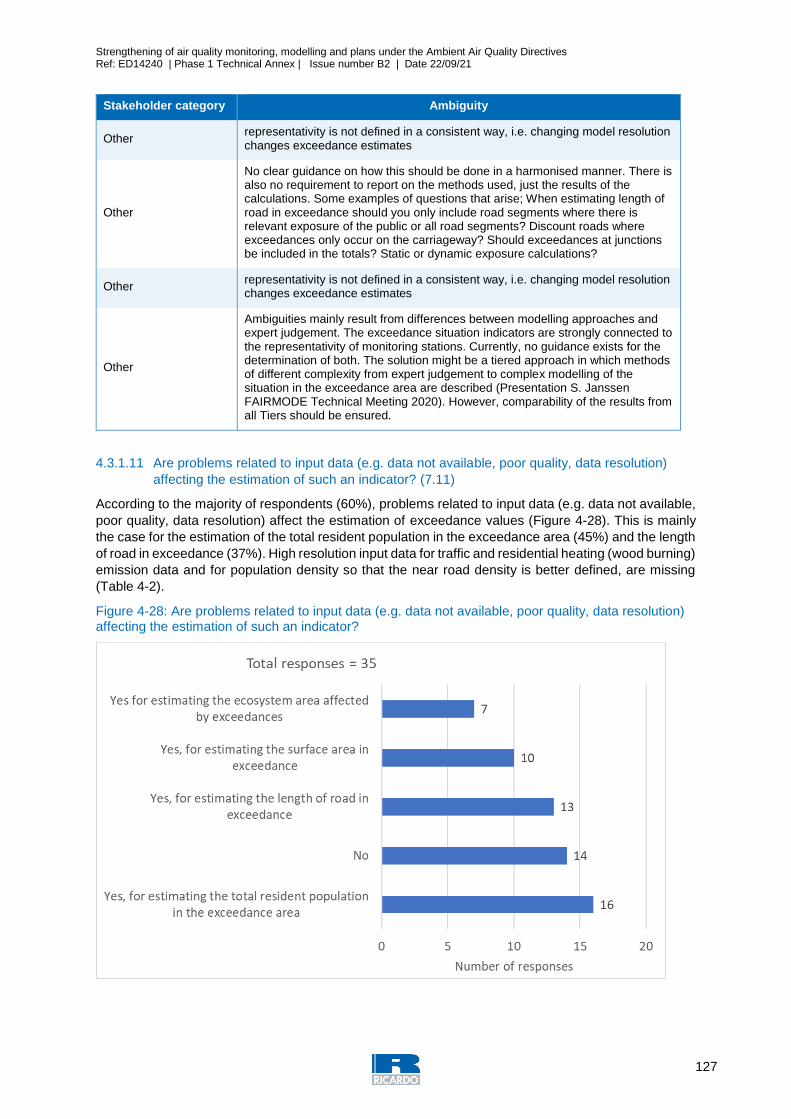
Strengthening of air quality monitoring, modelling and plans under the Ambient Air Quality Directives Ref: ED14240 | Phase 1 Technical Annex | Issue number B2 | Date 22/09/21
127
Stakeholder category Ambiguity
Other representativity is not defined in a consistent way, i.e. changing model resolution changes exceedance estimates
Other
No clear guidance on how this should be done in a harmonised manner. There is also no requirement to report on the methods used, just the results of the calculations. Some examples of questions that arise; When estimating length of road in exceedance should you only include road segments where there is relevant exposure of the public or all road segments? Discount roads where exceedances only occur on the carriageway? Should exceedances at junctions be included in the totals? Static or dynamic exposure calculations?
Other representativity is not defined in a consistent way, i.e. changing model resolution changes exceedance estimates
Other
Ambiguities mainly result from differences between modelling approaches and expert judgement. The exceedance situation indicators are strongly connected to the representativity of monitoring stations. Currently, no guidance exists for the determination of both. The solution might be a tiered approach in which methods of different complexity from expert judgement to complex modelling of the situation in the exceedance area are described (Presentation S. Janssen FAIRMODE Technical Meeting 2020). However, comparability of the results from all Tiers should be ensured.
4.3.1.11 Are problems related to input data (e.g. data not available, poor quality, data resolution)
affecting the estimation of such an indicator? (7.11)
According to the majority of respondents (60%), problems related to input data (e.g. data not available,
poor quality, data resolution) affect the estimation of exceedance values (Figure 4-28). This is mainly
the case for the estimation of the total resident population in the exceedance area (45%) and the length
of road in exceedance (37%). High resolution input data for traffic and residential heating (wood burning)
emission data and for population density so that the near road density is better defined, are missing
(Table 4-2).
Figure 4-28: Are problems related to input data (e.g. data not available, poor quality, data resolution) affecting the estimation of such an indicator?
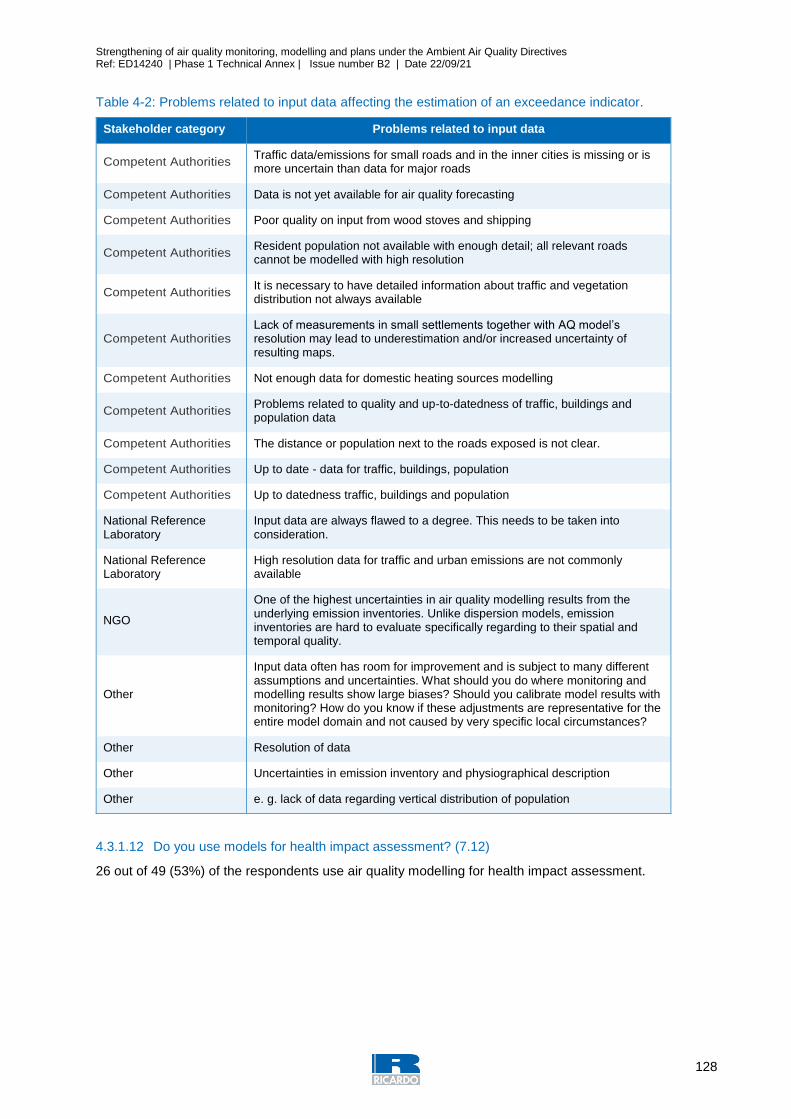
Strengthening of air quality monitoring, modelling and plans under the Ambient Air Quality Directives Ref: ED14240 | Phase 1 Technical Annex | Issue number B2 | Date 22/09/21
128
Table 4-2: Problems related to input data affecting the estimation of an exceedance indicator.
Stakeholder category Problems related to input data
Competent Authorities Traffic data/emissions for small roads and in the inner cities is missing or is more uncertain than data for major roads
Competent Authorities Data is not yet available for air quality forecasting
Competent Authorities Poor quality on input from wood stoves and shipping
Competent Authorities Resident population not available with enough detail; all relevant roads cannot be modelled with high resolution
Competent Authorities It is necessary to have detailed information about traffic and vegetation distribution not always available
Competent Authorities Lack of measurements in small settlements together with AQ model’s resolution may lead to underestimation and/or increased uncertainty of resulting maps.
Competent Authorities Not enough data for domestic heating sources modelling
Competent Authorities Problems related to quality and up-to-datedness of traffic, buildings and population data
Competent Authorities The distance or population next to the roads exposed is not clear.
Competent Authorities Up to date - data for traffic, buildings, population
Competent Authorities Up to datedness traffic, buildings and population
National Reference Laboratory
Input data are always flawed to a degree. This needs to be taken into consideration.
National Reference Laboratory
High resolution data for traffic and urban emissions are not commonly available
NGO
One of the highest uncertainties in air quality modelling results from the underlying emission inventories. Unlike dispersion models, emission inventories are hard to evaluate specifically regarding to their spatial and temporal quality.
Other
Input data often has room for improvement and is subject to many different assumptions and uncertainties. What should you do where monitoring and modelling results show large biases? Should you calibrate model results with monitoring? How do you know if these adjustments are representative for the entire model domain and not caused by very specific local circumstances?
Other Resolution of data
Other Uncertainties in emission inventory and physiographical description
Other e. g. lack of data regarding vertical distribution of population
4.3.1.12 Do you use models for health impact assessment? (7.12)
26 out of 49 (53%) of the respondents use air quality modelling for health impact assessment.
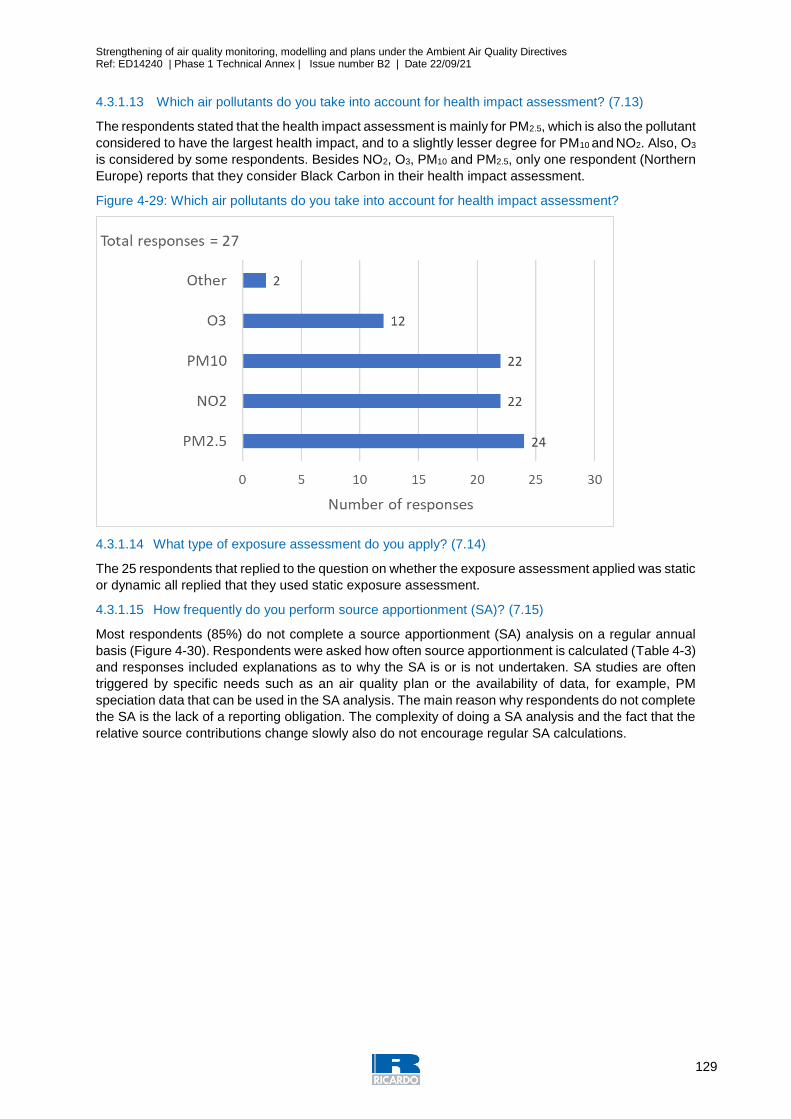
Strengthening of air quality monitoring, modelling and plans under the Ambient Air Quality Directives Ref: ED14240 | Phase 1 Technical Annex | Issue number B2 | Date 22/09/21
129
4.3.1.13 Which air pollutants do you take into account for health impact assessment? (7.13)
The respondents stated that the health impact assessment is mainly for PM2.5, which is also the pollutant
considered to have the largest health impact, and to a slightly lesser degree for PM10 and NO2. Also, O3
is considered by some respondents. Besides NO2, O3, PM10 and PM2.5, only one respondent (Northern
Europe) reports that they consider Black Carbon in their health impact assessment.
Figure 4-29: Which air pollutants do you take into account for health impact assessment?
4.3.1.14 What type of exposure assessment do you apply? (7.14)
The 25 respondents that replied to the question on whether the exposure assessment applied was static
or dynamic all replied that they used static exposure assessment.
4.3.1.15 How frequently do you perform source apportionment (SA)? (7.15)
Most respondents (85%) do not complete a source apportionment (SA) analysis on a regular annual
basis (Figure 4-30). Respondents were asked how often source apportionment is calculated (Table 4-3)
and responses included explanations as to why the SA is or is not undertaken. SA studies are often
triggered by specific needs such as an air quality plan or the availability of data, for example, PM
speciation data that can be used in the SA analysis. The main reason why respondents do not complete
the SA is the lack of a reporting obligation. The complexity of doing a SA analysis and the fact that the
relative source contributions change slowly also do not encourage regular SA calculations.
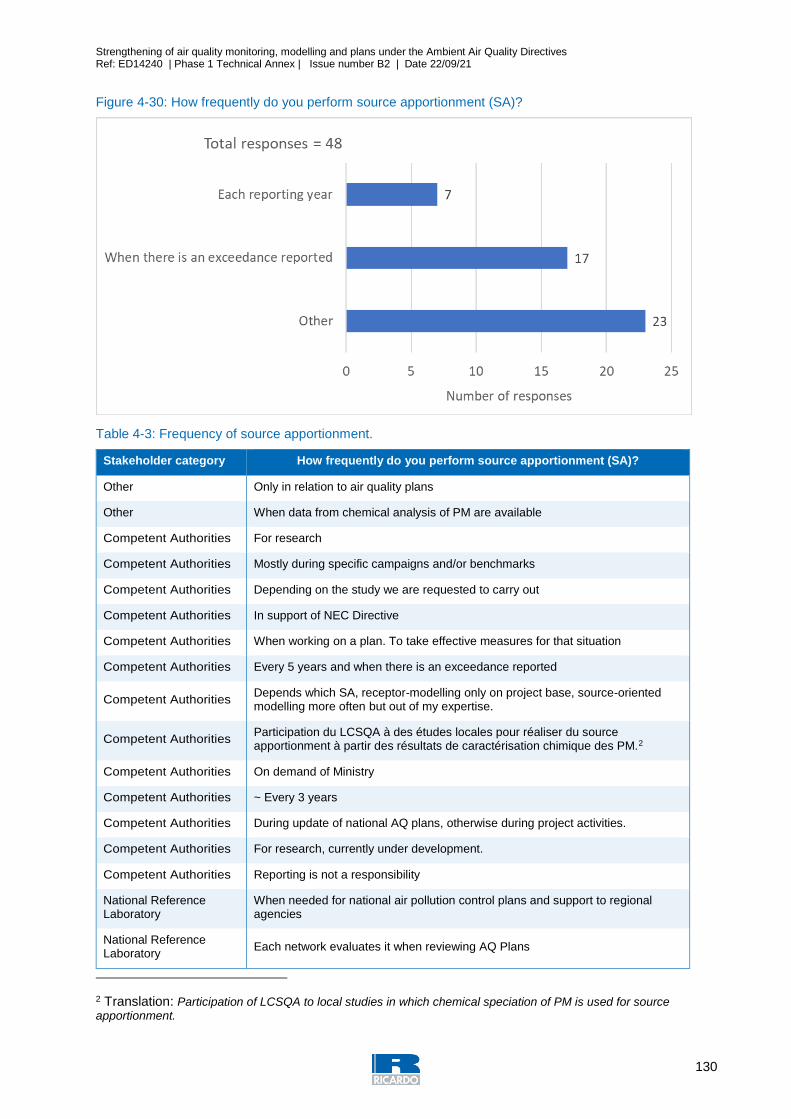
Strengthening of air quality monitoring, modelling and plans under the Ambient Air Quality Directives Ref: ED14240 | Phase 1 Technical Annex | Issue number B2 | Date 22/09/21
130
Figure 4-30: How frequently do you perform source apportionment (SA)?
Table 4-3: Frequency of source apportionment.
Stakeholder category How frequently do you perform source apportionment (SA)?
Other Only in relation to air quality plans
Other When data from chemical analysis of PM are available
Competent Authorities For research
Competent Authorities Mostly during specific campaigns and/or benchmarks
Competent Authorities Depending on the study we are requested to carry out
Competent Authorities In support of NEC Directive
Competent Authorities When working on a plan. To take effective measures for that situation
Competent Authorities Every 5 years and when there is an exceedance reported
Competent Authorities Depends which SA, receptor-modelling only on project base, source-oriented modelling more often but out of my expertise.
Competent Authorities Participation du LCSQA à des études locales pour réaliser du source apportionment à partir des résultats de caractérisation chimique des PM.2
Competent Authorities On demand of Ministry
Competent Authorities ~ Every 3 years
Competent Authorities During update of national AQ plans, otherwise during project activities.
Competent Authorities For research, currently under development.
Competent Authorities Reporting is not a responsibility
National Reference Laboratory
When needed for national air pollution control plans and support to regional agencies
National Reference Laboratory
Each network evaluates it when reviewing AQ Plans
2 Translation: Participation of LCSQA to local studies in which chemical speciation of PM is used for source apportionment.
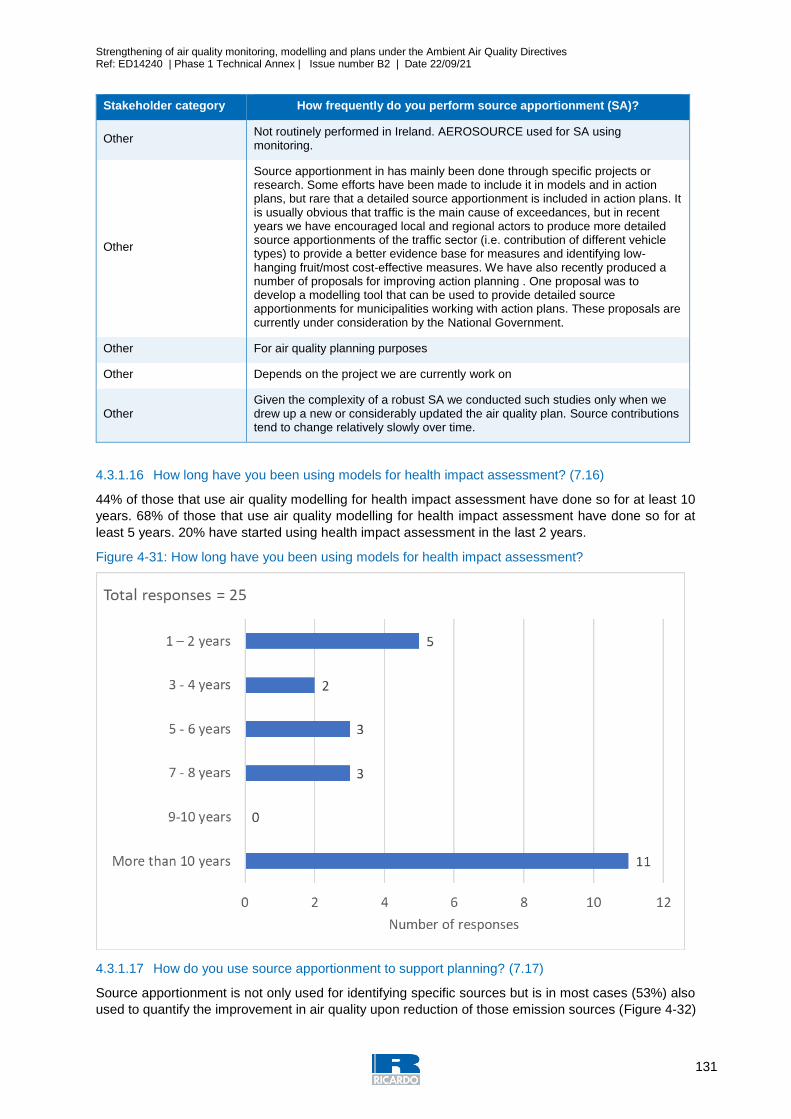
Strengthening of air quality monitoring, modelling and plans under the Ambient Air Quality Directives Ref: ED14240 | Phase 1 Technical Annex | Issue number B2 | Date 22/09/21
131
Stakeholder category How frequently do you perform source apportionment (SA)?
Other Not routinely performed in Ireland. AEROSOURCE used for SA using monitoring.
Other
Source apportionment in has mainly been done through specific projects or research. Some efforts have been made to include it in models and in action plans, but rare that a detailed source apportionment is included in action plans. It is usually obvious that traffic is the main cause of exceedances, but in recent years we have encouraged local and regional actors to produce more detailed source apportionments of the traffic sector (i.e. contribution of different vehicle types) to provide a better evidence base for measures and identifying low-hanging fruit/most cost-effective measures. We have also recently produced a number of proposals for improving action planning . One proposal was to develop a modelling tool that can be used to provide detailed source apportionments for municipalities working with action plans. These proposals are currently under consideration by the National Government.
Other For air quality planning purposes
Other Depends on the project we are currently work on
Other Given the complexity of a robust SA we conducted such studies only when we drew up a new or considerably updated the air quality plan. Source contributions tend to change relatively slowly over time.
4.3.1.16 How long have you been using models for health impact assessment? (7.16)
44% of those that use air quality modelling for health impact assessment have done so for at least 10
years. 68% of those that use air quality modelling for health impact assessment have done so for at
least 5 years. 20% have started using health impact assessment in the last 2 years.
Figure 4-31: How long have you been using models for health impact assessment?
4.3.1.17 How do you use source apportionment to support planning? (7.17)
Source apportionment is not only used for identifying specific sources but is in most cases (53%) also
used to quantify the improvement in air quality upon reduction of those emission sources (Figure 4-32)
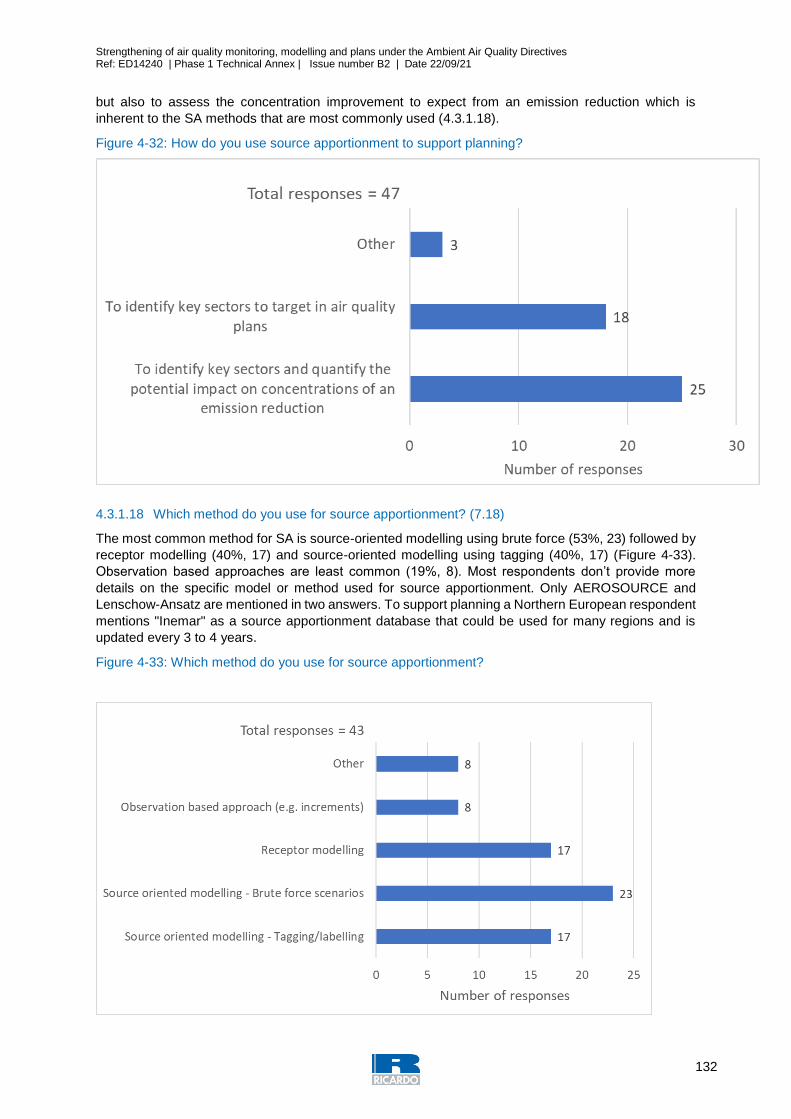
Strengthening of air quality monitoring, modelling and plans under the Ambient Air Quality Directives Ref: ED14240 | Phase 1 Technical Annex | Issue number B2 | Date 22/09/21
132
but also to assess the concentration improvement to expect from an emission reduction which is
inherent to the SA methods that are most commonly used (4.3.1.18).
Figure 4-32: How do you use source apportionment to support planning?
4.3.1.18 Which method do you use for source apportionment? (7.18)
The most common method for SA is source-oriented modelling using brute force (53%, 23) followed by
receptor modelling (40%, 17) and source-oriented modelling using tagging (40%, 17) (Figure 4-33).
Observation based approaches are least common (19%, 8). Most respondents don’t provide more
details on the specific model or method used for source apportionment. Only AEROSOURCE and
Lenschow-Ansatz are mentioned in two answers. To support planning a Northern European respondent
mentions "Inemar" as a source apportionment database that could be used for many regions and is
updated every 3 to 4 years.
Figure 4-33: Which method do you use for source apportionment?
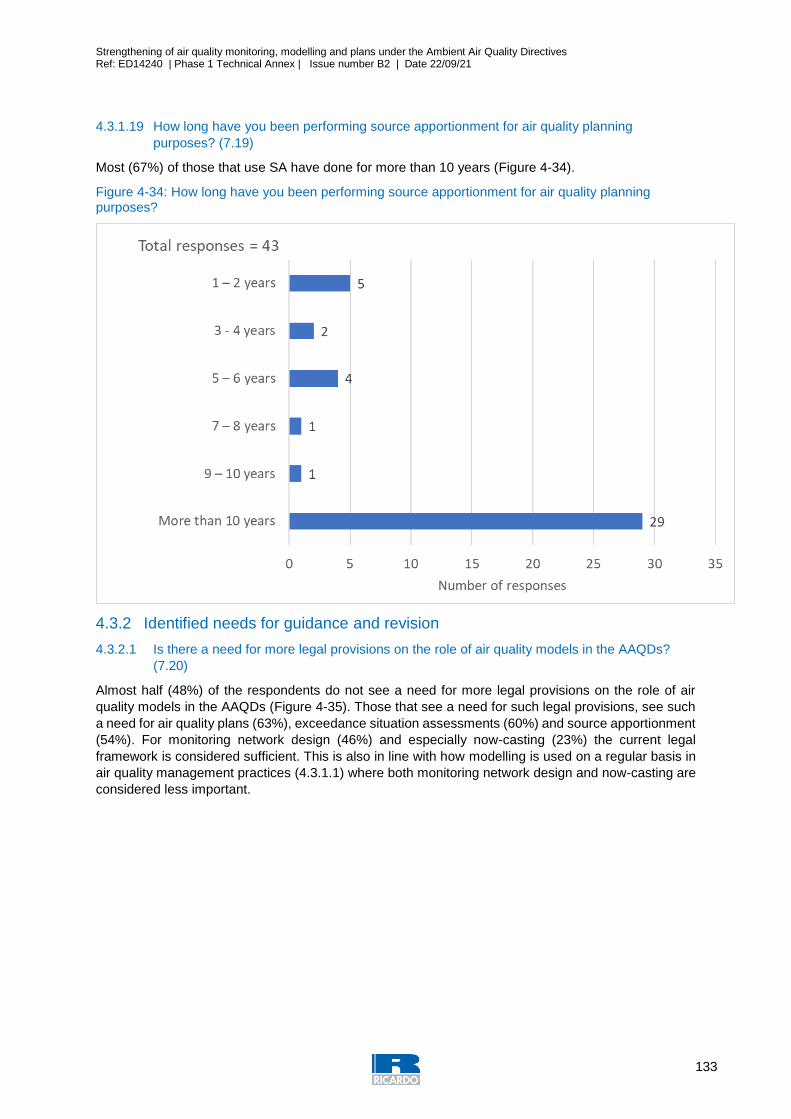
Strengthening of air quality monitoring, modelling and plans under the Ambient Air Quality Directives Ref: ED14240 | Phase 1 Technical Annex | Issue number B2 | Date 22/09/21
133
4.3.1.19 How long have you been performing source apportionment for air quality planning
purposes? (7.19)
Most (67%) of those that use SA have done for more than 10 years (Figure 4-34).
Figure 4-34: How long have you been performing source apportionment for air quality planning purposes?
4.3.2 Identified needs for guidance and revision
4.3.2.1 Is there a need for more legal provisions on the role of air quality models in the AAQDs?
(7.20)
Almost half (48%) of the respondents do not see a need for more legal provisions on the role of air
quality models in the AAQDs (Figure 4-35). Those that see a need for such legal provisions, see such
a need for air quality plans (63%), exceedance situation assessments (60%) and source apportionment
(54%). For monitoring network design (46%) and especially now-casting (23%) the current legal
framework is considered sufficient. This is also in line with how modelling is used on a regular basis in
air quality management practices (4.3.1.1) where both monitoring network design and now-casting are
considered less important.
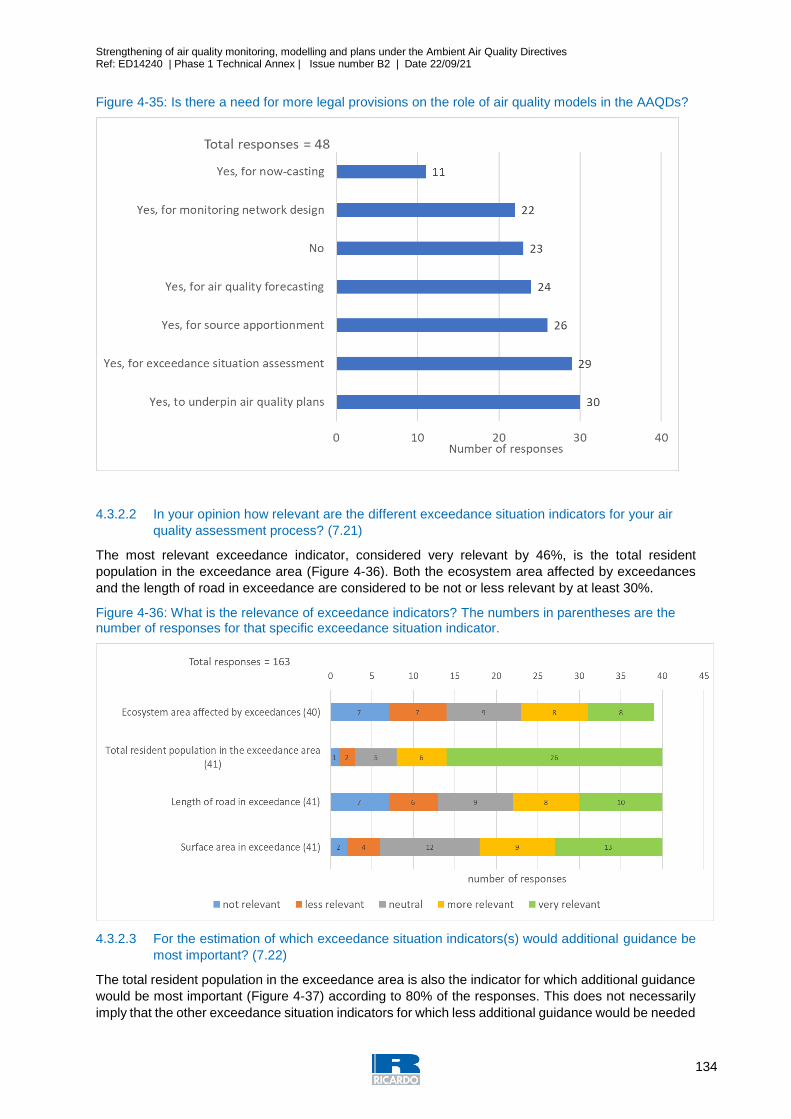
Strengthening of air quality monitoring, modelling and plans under the Ambient Air Quality Directives Ref: ED14240 | Phase 1 Technical Annex | Issue number B2 | Date 22/09/21
134
Figure 4-35: Is there a need for more legal provisions on the role of air quality models in the AAQDs?
4.3.2.2 In your opinion how relevant are the different exceedance situation indicators for your air
quality assessment process? (7.21)
The most relevant exceedance indicator, considered very relevant by 46%, is the total resident
population in the exceedance area (Figure 4-36). Both the ecosystem area affected by exceedances
and the length of road in exceedance are considered to be not or less relevant by at least 30%.
Figure 4-36: What is the relevance of exceedance indicators? The numbers in parentheses are the number of responses for that specific exceedance situation indicator.
4.3.2.3 For the estimation of which exceedance situation indicators(s) would additional guidance be
most important? (7.22)
The total resident population in the exceedance area is also the indicator for which additional guidance
would be most important (Figure 4-37) according to 80% of the responses. This does not necessarily
imply that the other exceedance situation indicators for which less additional guidance would be needed
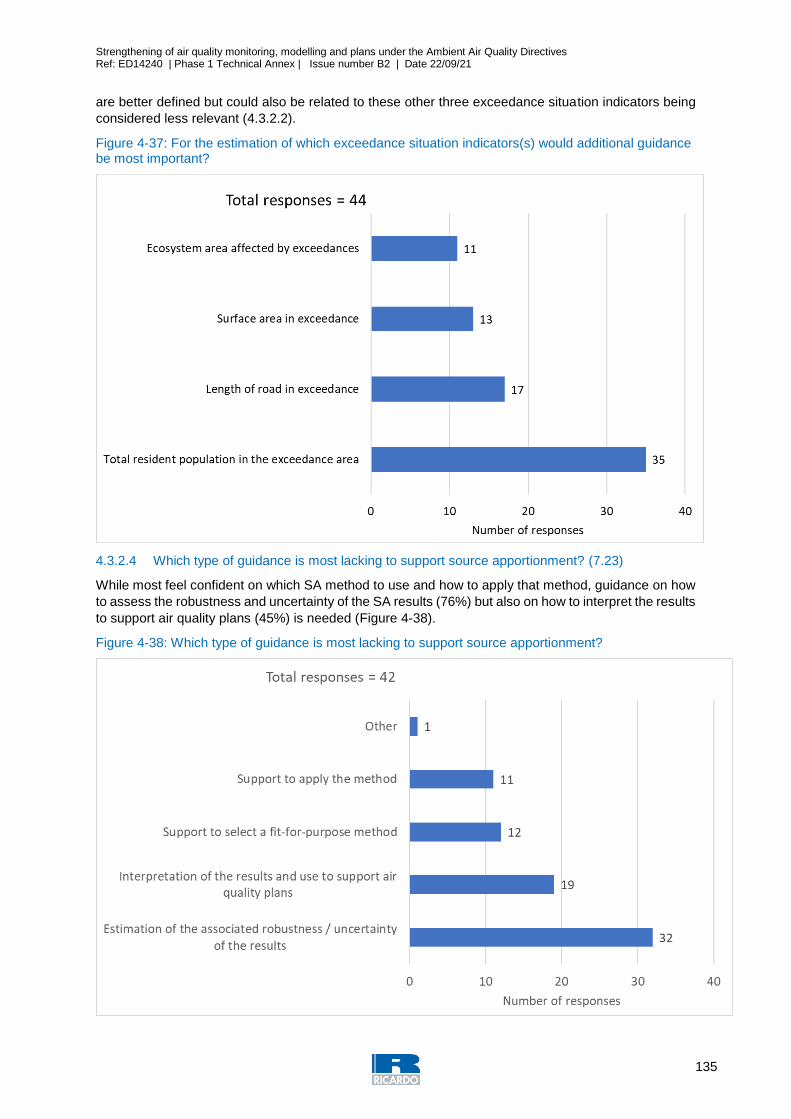
Strengthening of air quality monitoring, modelling and plans under the Ambient Air Quality Directives Ref: ED14240 | Phase 1 Technical Annex | Issue number B2 | Date 22/09/21
135
are better defined but could also be related to these other three exceedance situation indicators being
considered less relevant (4.3.2.2).
Figure 4-37: For the estimation of which exceedance situation indicators(s) would additional guidance be most important?
4.3.2.4 Which type of guidance is most lacking to support source apportionment? (7.23)
While most feel confident on which SA method to use and how to apply that method, guidance on how
to assess the robustness and uncertainty of the SA results (76%) but also on how to interpret the results
to support air quality plans (45%) is needed (Figure 4-38).
Figure 4-38: Which type of guidance is most lacking to support source apportionment?

Strengthening of air quality monitoring, modelling and plans under the Ambient Air Quality Directives Ref: ED14240 | Phase 1 Technical Annex | Issue number B2 | Date 22/09/21
136
4.3.3 Main messages
Most respondents use models to support air quality planning and source apportionment. Normally they
do not report modelling results for compliance assessment via e-reporting and if they do so it is rarely
as the only source of information for the assessment. When used for e-reporting, model results of
different scales ranging from several meters to ten kilometres are used. This clearly will impair the
comparability of different model results.
There is no general approach to check hot spot locations based on modelling results. Exceedance
indicators are mostly calculated using high resolution modelling applications. The population
exceedance indicator is recognised as the most relevant indicator while road length and ecosystems in
exceedance are considered less relevant by most. Guidance and better data are most needed for the
estimation of population exceedance indicators
Source apportionment is not done on a regular basis. Most applications will not stop at source
identification but will also contribute to air quality planning by assessing the improvement in air quality
upon emission changes
More legal provisions are needed in the AAQD for the use of modelling for planning and exceedance
situation assessment. Also, guidance on how to assess the robustness and uncertainty of source
apportionment results is needed.

Strengthening of air quality monitoring, modelling and plans under the Ambient Air Quality Directives Ref: ED14240 | Phase 1 Technical Annex | Issue number B2 | Date 22/09/21
137
4.4 Improving quality of air quality modelling (Q8)
4.4.1 Current situation
4.4.1.1 Where air quality modelling is used, is a standard model validation based on R², bias and
RMSE used in the QA/QC process? (8.1)
30 out of 39 respondents (77%) use standard validation statistics based on R2, bias and RMSE. (Figure
4-39). A smaller number use the FAIRMODE MQO (23 out of 41 (56%)) which increases to 67% if we
include those that don’t know whether the FAIRMODE MQO are used. What is probably more important
is that there is still a minority that states they are not using a standard model validation method in the
QA/QC process.
Figure 4-39: Where air quality modelling is used, is a standard model validation based on R², bias and RMSE (left) or the FAIRMODE Modelling Quality Objectives and Indicators (right) used in the QA/QC process?
Do you use standard validation statistics? Do you use FAIRMODE MQO?
4.4.1.2 Do you have a 'good enough' threshold for these parameters? (8.2)
When using standard model validation statistics (R2, bias and RMSE) threshold values that allow
assessing whether these model statistics are acceptable are needed. For the FAIRMODE MQO the
threshold values are determined by considering the measurement uncertainty of the observations with
which the modelling results are compared. When questioned about the threshold values they use
(Table 4-4), most (67%) of respondents refer to the FAIRMODE MQO. In one Member State the
respondent noted that threshold values are set by legislation while in another Member State model
validation is based on a set of criteria that were developed over the course of the years and in which
model results are compared to the results of a reference model. Also, thresholds specified in the CAFE
and the AAQDs are mentioned by two parties (17%).
Table 4-4: Do you have a 'good enough' threshold for standard model validation statistics R², bias and RMSE?
Stakeholder category 'good enough' threshold values for R², bias and RMSE
Competent Authorities As stated in the National AQ legislation (25 % etc)
Competent Authorities Thresholds specify in CAFE Directive
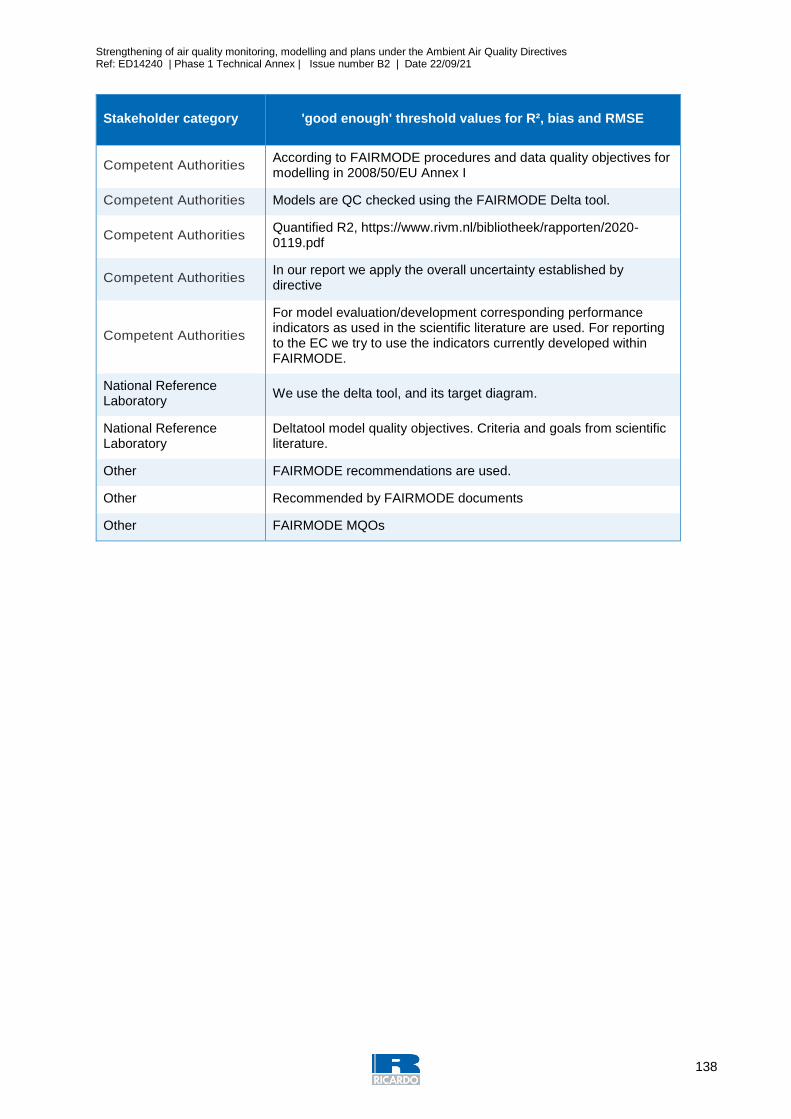
Strengthening of air quality monitoring, modelling and plans under the Ambient Air Quality Directives Ref: ED14240 | Phase 1 Technical Annex | Issue number B2 | Date 22/09/21
138
Stakeholder category 'good enough' threshold values for R², bias and RMSE
Competent Authorities According to FAIRMODE procedures and data quality objectives for modelling in 2008/50/EU Annex I
Competent Authorities Models are QC checked using the FAIRMODE Delta tool.
Competent Authorities Quantified R2, https://www.rivm.nl/bibliotheek/rapporten/2020-0119.pdf
Competent Authorities In our report we apply the overall uncertainty established by directive
Competent Authorities
For model evaluation/development corresponding performance indicators as used in the scientific literature are used. For reporting to the EC we try to use the indicators currently developed within FAIRMODE.
National Reference Laboratory
We use the delta tool, and its target diagram.
National Reference Laboratory
Deltatool model quality objectives. Criteria and goals from scientific literature.
Other FAIRMODE recommendations are used.
Other Recommended by FAIRMODE documents
Other FAIRMODE MQOs
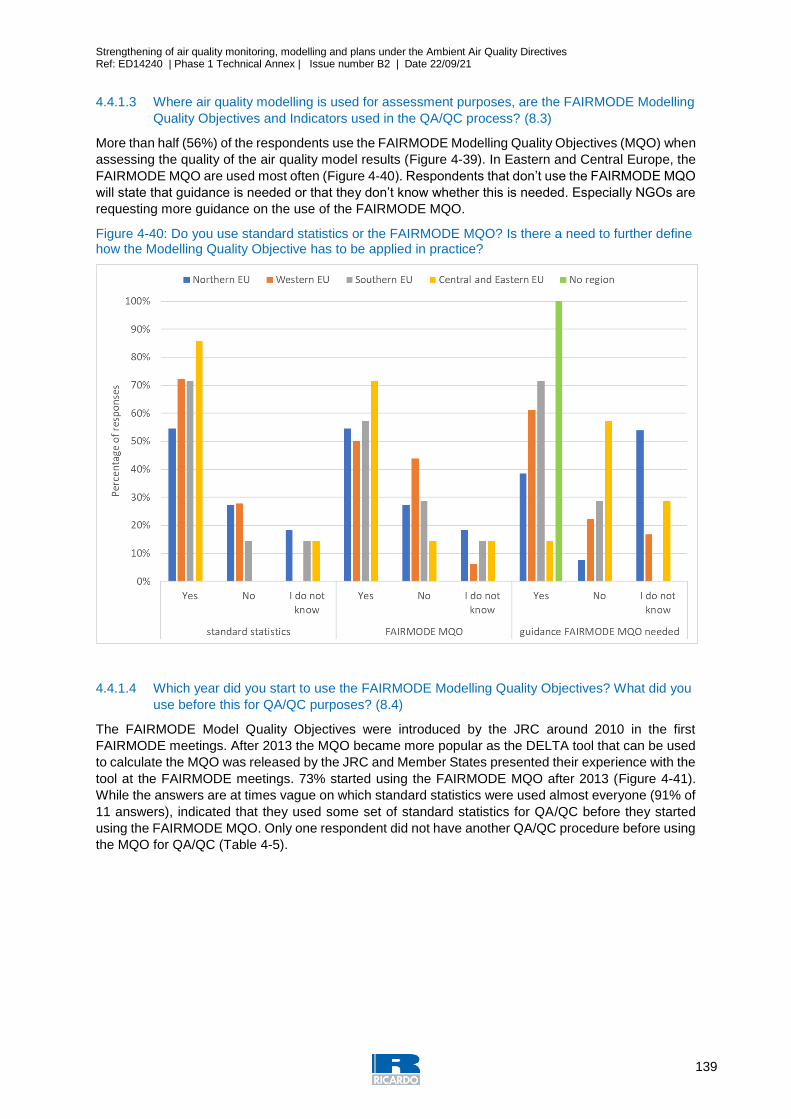
Strengthening of air quality monitoring, modelling and plans under the Ambient Air Quality Directives Ref: ED14240 | Phase 1 Technical Annex | Issue number B2 | Date 22/09/21
139
4.4.1.3 Where air quality modelling is used for assessment purposes, are the FAIRMODE Modelling
Quality Objectives and Indicators used in the QA/QC process? (8.3)
More than half (56%) of the respondents use the FAIRMODE Modelling Quality Objectives (MQO) when
assessing the quality of the air quality model results (Figure 4-39). In Eastern and Central Europe, the
FAIRMODE MQO are used most often (Figure 4-40). Respondents that don’t use the FAIRMODE MQO
will state that guidance is needed or that they don’t know whether this is needed. Especially NGOs are
requesting more guidance on the use of the FAIRMODE MQO.
Figure 4-40: Do you use standard statistics or the FAIRMODE MQO? Is there a need to further define how the Modelling Quality Objective has to be applied in practice?
4.4.1.4 Which year did you start to use the FAIRMODE Modelling Quality Objectives? What did you
use before this for QA/QC purposes? (8.4)
The FAIRMODE Model Quality Objectives were introduced by the JRC around 2010 in the first
FAIRMODE meetings. After 2013 the MQO became more popular as the DELTA tool that can be used
to calculate the MQO was released by the JRC and Member States presented their experience with the
tool at the FAIRMODE meetings. 73% started using the FAIRMODE MQO after 2013 (Figure 4-41).
While the answers are at times vague on which standard statistics were used almost everyone (91% of
11 answers), indicated that they used some set of standard statistics for QA/QC before they started
using the FAIRMODE MQO. Only one respondent did not have another QA/QC procedure before using
the MQO for QA/QC (Table 4-5).
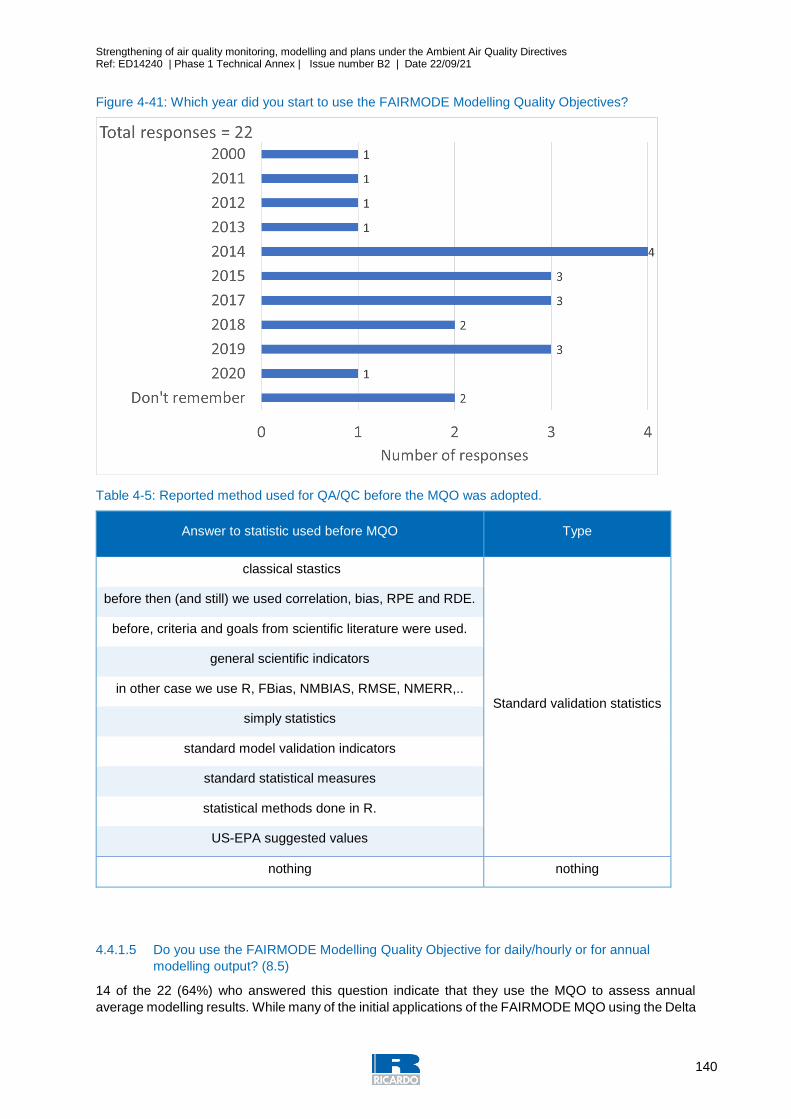
Strengthening of air quality monitoring, modelling and plans under the Ambient Air Quality Directives Ref: ED14240 | Phase 1 Technical Annex | Issue number B2 | Date 22/09/21
140
Figure 4-41: Which year did you start to use the FAIRMODE Modelling Quality Objectives?
Table 4-5: Reported method used for QA/QC before the MQO was adopted.
Answer to statistic used before MQO Type
classical stastics
Standard validation statistics
before then (and still) we used correlation, bias, RPE and RDE.
before, criteria and goals from scientific literature were used.
general scientific indicators
in other case we use R, FBias, NMBIAS, RMSE, NMERR,..
simply statistics
standard model validation indicators
standard statistical measures
statistical methods done in R.
US-EPA suggested values
nothing nothing
4.4.1.5 Do you use the FAIRMODE Modelling Quality Objective for daily/hourly or for annual
modelling output? (8.5)
14 of the 22 (64%) who answered this question indicate that they use the MQO to assess annual
average modelling results. While many of the initial applications of the FAIRMODE MQO using the Delta
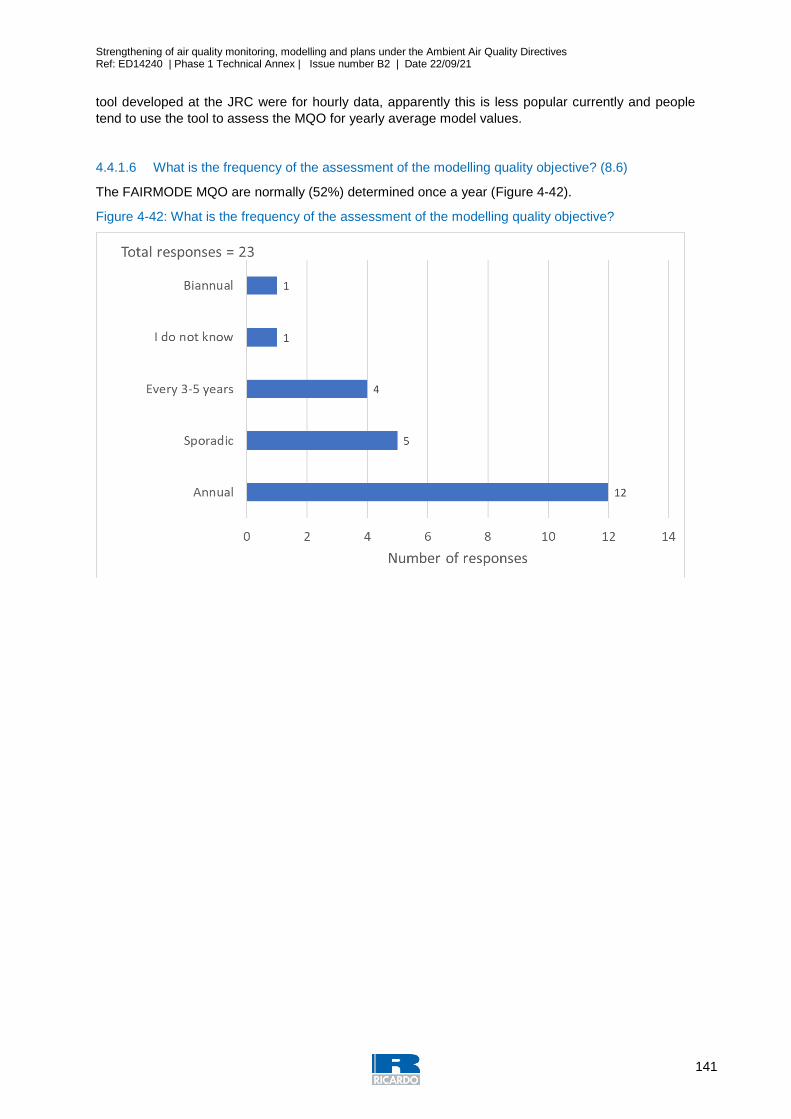
Strengthening of air quality monitoring, modelling and plans under the Ambient Air Quality Directives Ref: ED14240 | Phase 1 Technical Annex | Issue number B2 | Date 22/09/21
141
tool developed at the JRC were for hourly data, apparently this is less popular currently and people
tend to use the tool to assess the MQO for yearly average model values.
4.4.1.6 What is the frequency of the assessment of the modelling quality objective? (8.6)
The FAIRMODE MQO are normally (52%) determined once a year (Figure 4-42).
Figure 4-42: What is the frequency of the assessment of the modelling quality objective?
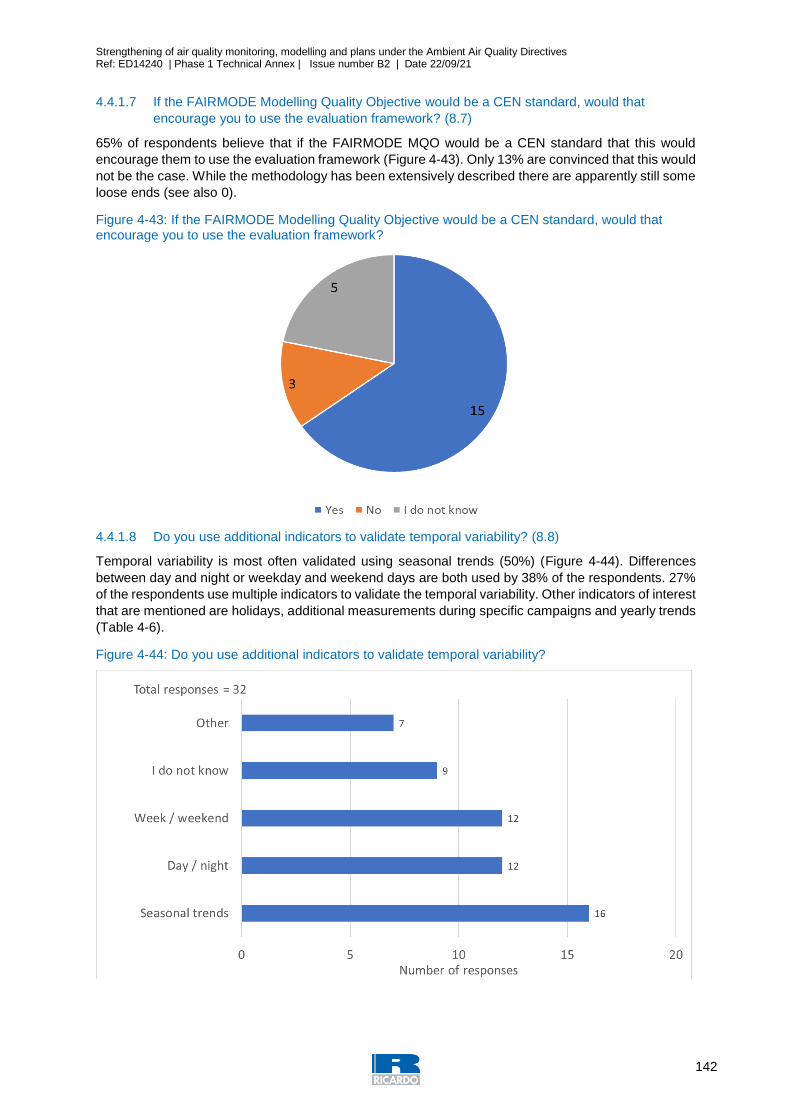
Strengthening of air quality monitoring, modelling and plans under the Ambient Air Quality Directives Ref: ED14240 | Phase 1 Technical Annex | Issue number B2 | Date 22/09/21
142
4.4.1.7 If the FAIRMODE Modelling Quality Objective would be a CEN standard, would that
encourage you to use the evaluation framework? (8.7)
65% of respondents believe that if the FAIRMODE MQO would be a CEN standard that this would
encourage them to use the evaluation framework (Figure 4-43). Only 13% are convinced that this would
not be the case. While the methodology has been extensively described there are apparently still some
loose ends (see also 0).
Figure 4-43: If the FAIRMODE Modelling Quality Objective would be a CEN standard, would that encourage you to use the evaluation framework?
4.4.1.8 Do you use additional indicators to validate temporal variability? (8.8)
Temporal variability is most often validated using seasonal trends (50%) (Figure 4-44). Differences
between day and night or weekday and weekend days are both used by 38% of the respondents. 27%
of the respondents use multiple indicators to validate the temporal variability. Other indicators of interest
that are mentioned are holidays, additional measurements during specific campaigns and yearly trends
(Table 4-6).
Figure 4-44: Do you use additional indicators to validate temporal variability?
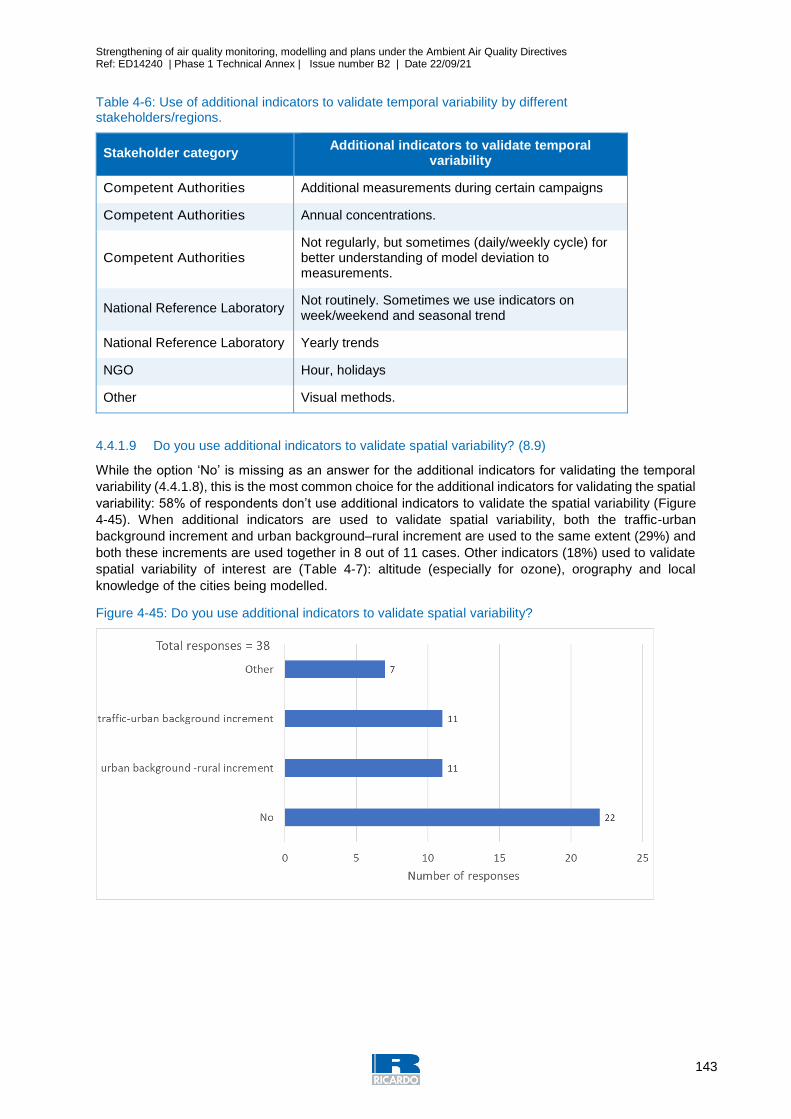
Strengthening of air quality monitoring, modelling and plans under the Ambient Air Quality Directives Ref: ED14240 | Phase 1 Technical Annex | Issue number B2 | Date 22/09/21
143
Table 4-6: Use of additional indicators to validate temporal variability by different stakeholders/regions.
Stakeholder category Additional indicators to validate temporal
variability
Competent Authorities Additional measurements during certain campaigns
Competent Authorities Annual concentrations.
Competent Authorities Not regularly, but sometimes (daily/weekly cycle) for better understanding of model deviation to measurements.
National Reference Laboratory Not routinely. Sometimes we use indicators on week/weekend and seasonal trend
National Reference Laboratory Yearly trends
NGO Hour, holidays
Other Visual methods.
4.4.1.9 Do you use additional indicators to validate spatial variability? (8.9)
While the option ‘No’ is missing as an answer for the additional indicators for validating the temporal
variability (4.4.1.8), this is the most common choice for the additional indicators for validating the spatial
variability: 58% of respondents don’t use additional indicators to validate the spatial variability (Figure
4-45). When additional indicators are used to validate spatial variability, both the traffic-urban
background increment and urban background–rural increment are used to the same extent (29%) and
both these increments are used together in 8 out of 11 cases. Other indicators (18%) used to validate
spatial variability of interest are (Table 4-7): altitude (especially for ozone), orography and local
knowledge of the cities being modelled.
Figure 4-45: Do you use additional indicators to validate spatial variability?
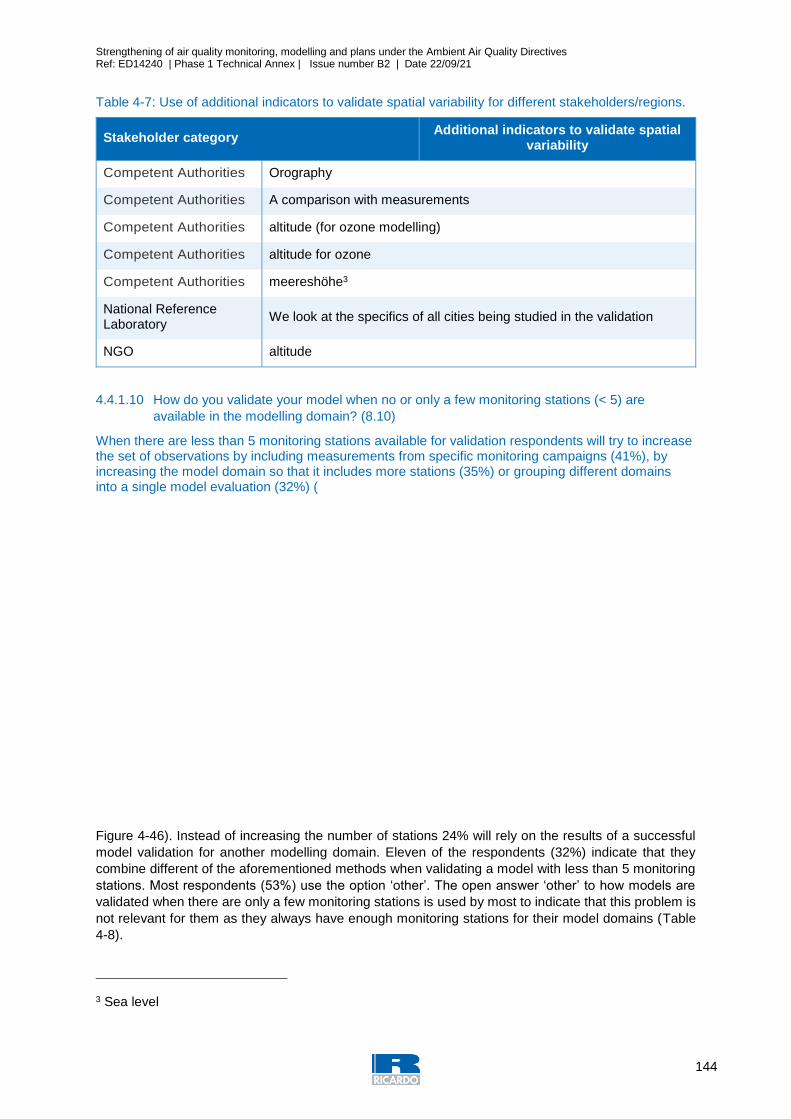
Strengthening of air quality monitoring, modelling and plans under the Ambient Air Quality Directives Ref: ED14240 | Phase 1 Technical Annex | Issue number B2 | Date 22/09/21
144
Table 4-7: Use of additional indicators to validate spatial variability for different stakeholders/regions.
Stakeholder category Additional indicators to validate spatial
variability
Competent Authorities Orography
Competent Authorities A comparison with measurements
Competent Authorities altitude (for ozone modelling)
Competent Authorities altitude for ozone
Competent Authorities meereshöhe3
National Reference Laboratory
We look at the specifics of all cities being studied in the validation
NGO altitude
4.4.1.10 How do you validate your model when no or only a few monitoring stations (< 5) are
available in the modelling domain? (8.10)
When there are less than 5 monitoring stations available for validation respondents will try to increase the set of observations by including measurements from specific monitoring campaigns (41%), by increasing the model domain so that it includes more stations (35%) or grouping different domains into a single model evaluation (32%) (
Figure 4-46). Instead of increasing the number of stations 24% will rely on the results of a successful
model validation for another modelling domain. Eleven of the respondents (32%) indicate that they
combine different of the aforementioned methods when validating a model with less than 5 monitoring
stations. Most respondents (53%) use the option ‘other’. The open answer ‘other’ to how models are
validated when there are only a few monitoring stations is used by most to indicate that this problem is
not relevant for them as they always have enough monitoring stations for their model domains (Table
4-8).
3 Sea level

Strengthening of air quality monitoring, modelling and plans under the Ambient Air Quality Directives Ref: ED14240 | Phase 1 Technical Annex | Issue number B2 | Date 22/09/21
145
Figure 4-46: How do you validate your model when no or only a few monitoring stations (< 5) are available in the modelling domain? The ‘other’ are further detailed in Table 4-8.
Table 4-8:What other methods do you use when you validate your model when no or only a few monitoring stations (< 5) are available in the modelling domain which are not listed in
Strengthening of air quality monitoring, modelling and plans under the Ambient Air Quality Directives Ref: ED14240 | Phase 1 Technical Annex | Issue number B2 | Date 22/09/21
146
Figure 4-46.
Stakeholder category Other methods used when only a few monitoring
stations are available
Competent Authorities We do not have such domains, or we merge the data from different domains (such as couple of cities)
Competent Authorities Increase the number of observations by including results from specific monitoring campaigns
Competent Authorities The situation did not occur so far
Competent Authorities Work with the available stations
National Reference Laboratory Not applicable
National Reference Laboratory We model the whole country as one region
4.4.1.11 Do you organise monitoring campaigns specifically for model validation (e.g. validate
specific model features)? (8.11)
Most (62%) monitoring campaigns are not organised specifically for model validation (Figure 4-47).
Further details (Table 4-9) on such model validation monitoring campaigns indicate that these are not
done frequently but for specific model setups and/or locations and rely on passive samplers and mobile
measurement stations. Such validation monitoring campaigns are reported for all EU regions albeit only
once for Central and Eastern EU where as six times for Western EU. In most (11/15) cases this is done
by Designated competent authorities as per AAQDs.
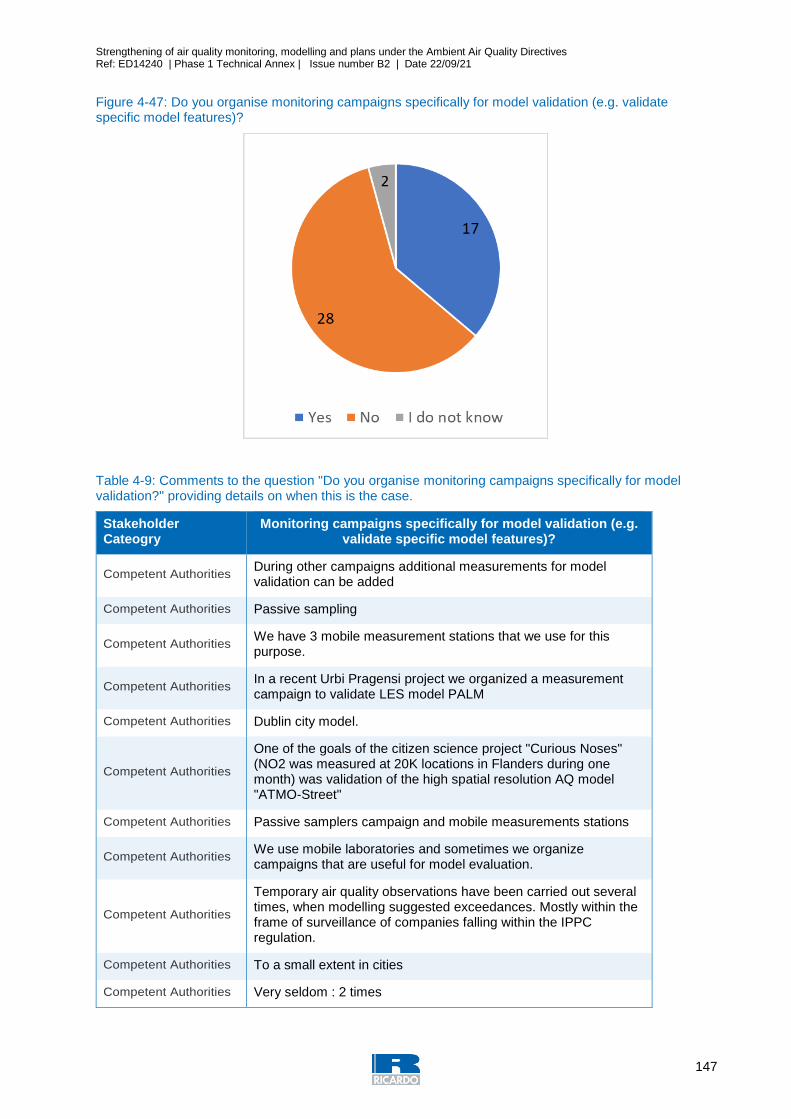
Strengthening of air quality monitoring, modelling and plans under the Ambient Air Quality Directives Ref: ED14240 | Phase 1 Technical Annex | Issue number B2 | Date 22/09/21
147
Figure 4-47: Do you organise monitoring campaigns specifically for model validation (e.g. validate specific model features)?
Table 4-9: Comments to the question "Do you organise monitoring campaigns specifically for model validation?" providing details on when this is the case.
Stakeholder Cateogry
Monitoring campaigns specifically for model validation (e.g. validate specific model features)?
Competent Authorities During other campaigns additional measurements for model validation can be added
Competent Authorities Passive sampling
Competent Authorities We have 3 mobile measurement stations that we use for this purpose.
Competent Authorities In a recent Urbi Pragensi project we organized a measurement campaign to validate LES model PALM
Competent Authorities Dublin city model.
Competent Authorities
One of the goals of the citizen science project "Curious Noses" (NO2 was measured at 20K locations in Flanders during one month) was validation of the high spatial resolution AQ model "ATMO-Street"
Competent Authorities Passive samplers campaign and mobile measurements stations
Competent Authorities We use mobile laboratories and sometimes we organize campaigns that are useful for model evaluation.
Competent Authorities
Temporary air quality observations have been carried out several times, when modelling suggested exceedances. Mostly within the frame of surveillance of companies falling within the IPPC regulation.
Competent Authorities To a small extent in cities
Competent Authorities Very seldom : 2 times
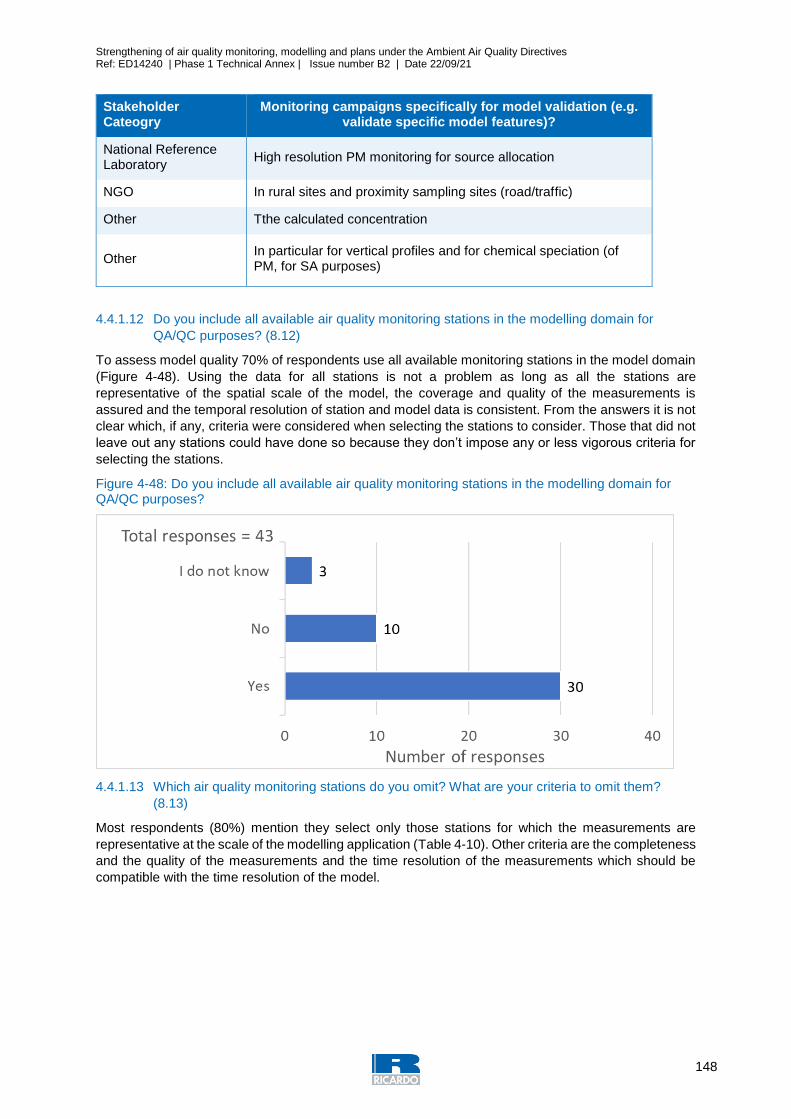
Strengthening of air quality monitoring, modelling and plans under the Ambient Air Quality Directives Ref: ED14240 | Phase 1 Technical Annex | Issue number B2 | Date 22/09/21
148
Stakeholder Cateogry
Monitoring campaigns specifically for model validation (e.g. validate specific model features)?
National Reference Laboratory
High resolution PM monitoring for source allocation
NGO In rural sites and proximity sampling sites (road/traffic)
Other Tthe calculated concentration
Other In particular for vertical profiles and for chemical speciation (of PM, for SA purposes)
4.4.1.12 Do you include all available air quality monitoring stations in the modelling domain for
QA/QC purposes? (8.12)
To assess model quality 70% of respondents use all available monitoring stations in the model domain
(Figure 4-48). Using the data for all stations is not a problem as long as all the stations are
representative of the spatial scale of the model, the coverage and quality of the measurements is
assured and the temporal resolution of station and model data is consistent. From the answers it is not
clear which, if any, criteria were considered when selecting the stations to consider. Those that did not
leave out any stations could have done so because they don’t impose any or less vigorous criteria for
selecting the stations.
Figure 4-48: Do you include all available air quality monitoring stations in the modelling domain for QA/QC purposes?
4.4.1.13 Which air quality monitoring stations do you omit? What are your criteria to omit them?
(8.13)
Most respondents (80%) mention they select only those stations for which the measurements are
representative at the scale of the modelling application (Table 4-10). Other criteria are the completeness
and the quality of the measurements and the time resolution of the measurements which should be
compatible with the time resolution of the model.
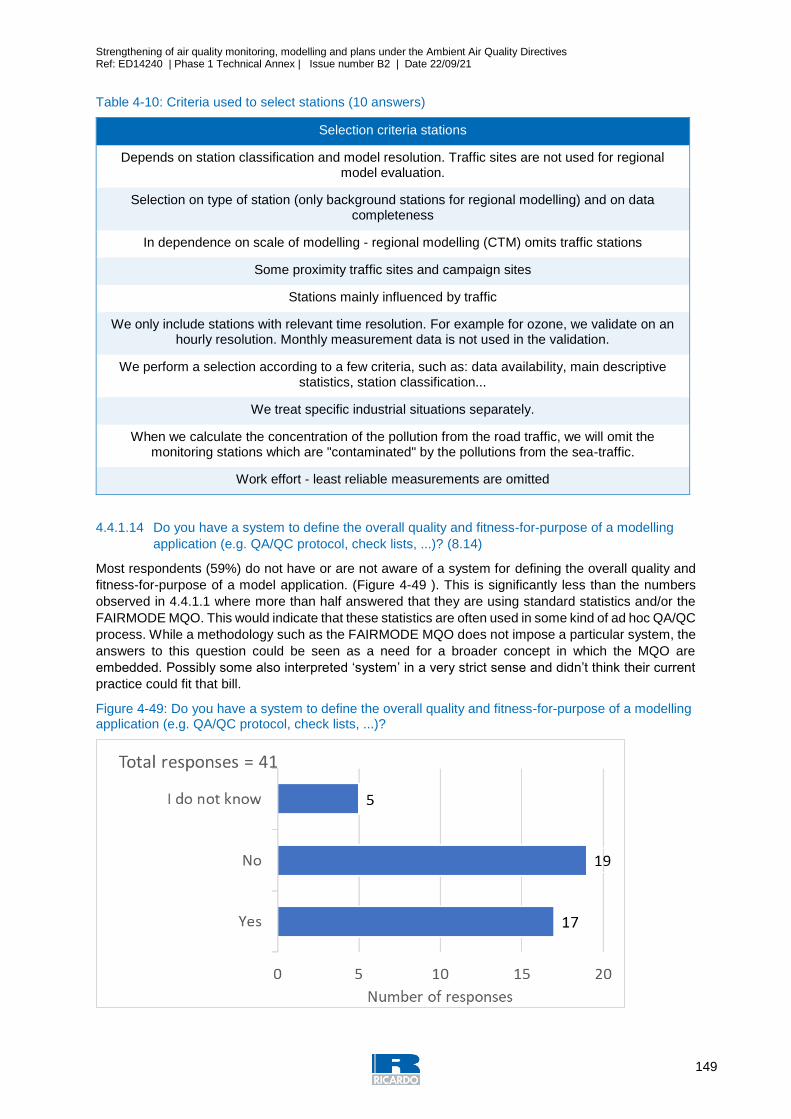
Strengthening of air quality monitoring, modelling and plans under the Ambient Air Quality Directives Ref: ED14240 | Phase 1 Technical Annex | Issue number B2 | Date 22/09/21
149
Table 4-10: Criteria used to select stations (10 answers)
Selection criteria stations
Depends on station classification and model resolution. Traffic sites are not used for regional model evaluation.
Selection on type of station (only background stations for regional modelling) and on data completeness
In dependence on scale of modelling - regional modelling (CTM) omits traffic stations
Some proximity traffic sites and campaign sites
Stations mainly influenced by traffic
We only include stations with relevant time resolution. For example for ozone, we validate on an hourly resolution. Monthly measurement data is not used in the validation.
We perform a selection according to a few criteria, such as: data availability, main descriptive statistics, station classification...
We treat specific industrial situations separately.
When we calculate the concentration of the pollution from the road traffic, we will omit the monitoring stations which are "contaminated" by the pollutions from the sea-traffic.
Work effort - least reliable measurements are omitted
4.4.1.14 Do you have a system to define the overall quality and fitness-for-purpose of a modelling
application (e.g. QA/QC protocol, check lists, ...)? (8.14)
Most respondents (59%) do not have or are not aware of a system for defining the overall quality and
fitness-for-purpose of a model application. (Figure 4-49 ). This is significantly less than the numbers
observed in 4.4.1.1 where more than half answered that they are using standard statistics and/or the
FAIRMODE MQO. This would indicate that these statistics are often used in some kind of ad hoc QA/QC
process. While a methodology such as the FAIRMODE MQO does not impose a particular system, the
answers to this question could be seen as a need for a broader concept in which the MQO are
embedded. Possibly some also interpreted ‘system’ in a very strict sense and didn’t think their current
practice could fit that bill.
Figure 4-49: Do you have a system to define the overall quality and fitness-for-purpose of a modelling application (e.g. QA/QC protocol, check lists, ...)?
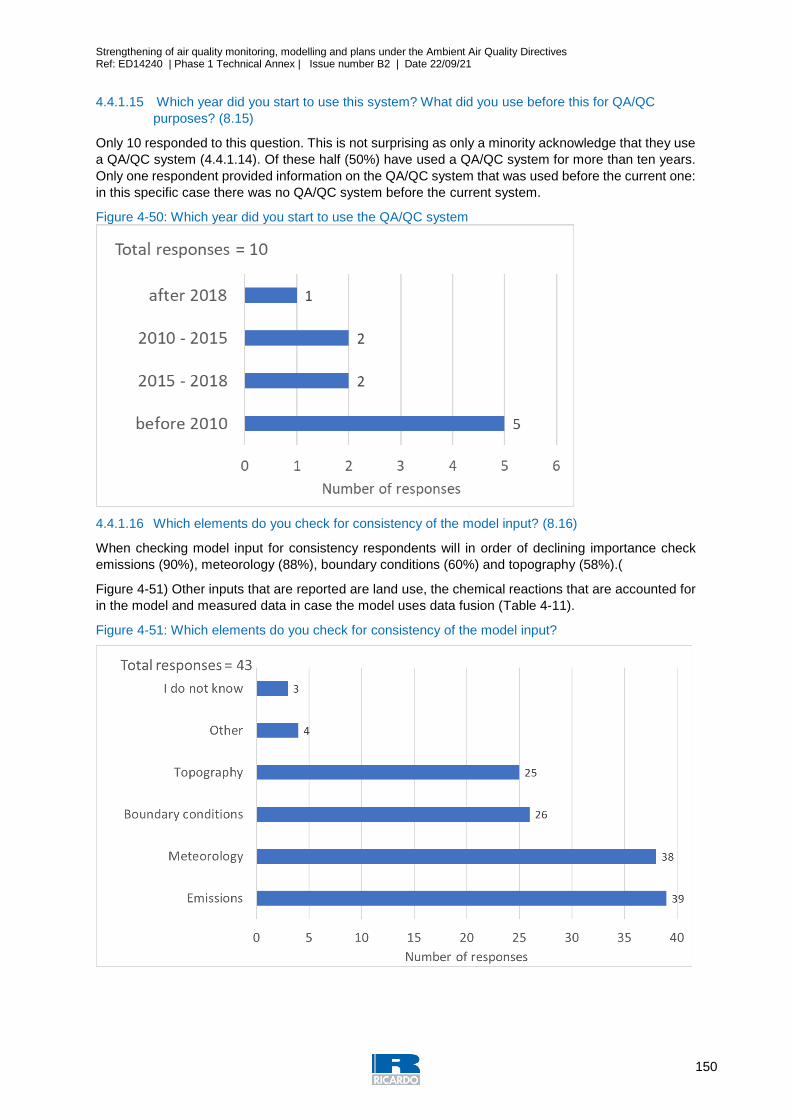
Strengthening of air quality monitoring, modelling and plans under the Ambient Air Quality Directives Ref: ED14240 | Phase 1 Technical Annex | Issue number B2 | Date 22/09/21
150
4.4.1.15 Which year did you start to use this system? What did you use before this for QA/QC
purposes? (8.15)
Only 10 responded to this question. This is not surprising as only a minority acknowledge that they use
a QA/QC system (4.4.1.14). Of these half (50%) have used a QA/QC system for more than ten years.
Only one respondent provided information on the QA/QC system that was used before the current one:
in this specific case there was no QA/QC system before the current system.
Figure 4-50: Which year did you start to use the QA/QC system
4.4.1.16 Which elements do you check for consistency of the model input? (8.16)
When checking model input for consistency respondents will in order of declining importance check
emissions (90%), meteorology (88%), boundary conditions (60%) and topography (58%).(
Figure 4-51) Other inputs that are reported are land use, the chemical reactions that are accounted for
in the model and measured data in case the model uses data fusion (Table 4-11).
Figure 4-51: Which elements do you check for consistency of the model input?
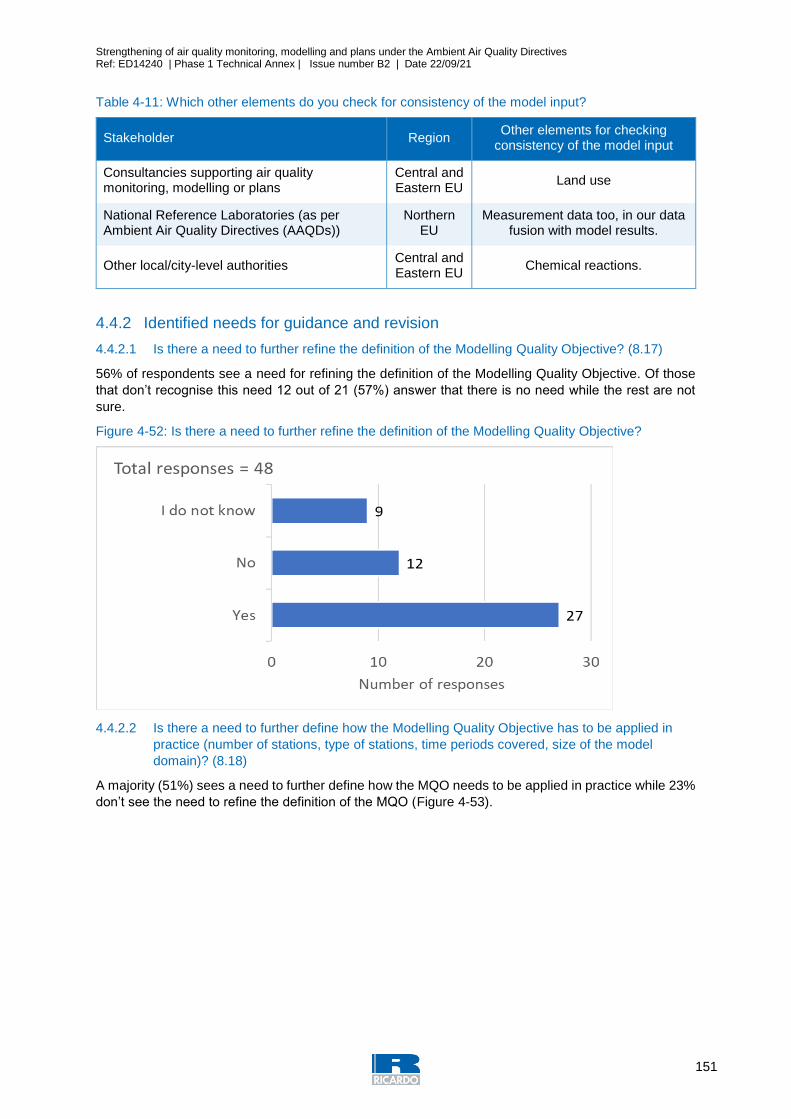
Strengthening of air quality monitoring, modelling and plans under the Ambient Air Quality Directives Ref: ED14240 | Phase 1 Technical Annex | Issue number B2 | Date 22/09/21
151
Table 4-11: Which other elements do you check for consistency of the model input?
Stakeholder Region Other elements for checking
consistency of the model input
Consultancies supporting air quality monitoring, modelling or plans
Central and Eastern EU
Land use
National Reference Laboratories (as per Ambient Air Quality Directives (AAQDs))
Northern EU
Measurement data too, in our data fusion with model results.
Other local/city-level authorities Central and Eastern EU
Chemical reactions.
4.4.2 Identified needs for guidance and revision
4.4.2.1 Is there a need to further refine the definition of the Modelling Quality Objective? (8.17)
56% of respondents see a need for refining the definition of the Modelling Quality Objective. Of those
that don’t recognise this need 12 out of 21 (57%) answer that there is no need while the rest are not
sure.
Figure 4-52: Is there a need to further refine the definition of the Modelling Quality Objective?
4.4.2.2 Is there a need to further define how the Modelling Quality Objective has to be applied in
practice (number of stations, type of stations, time periods covered, size of the model
domain)? (8.18)
A majority (51%) sees a need to further define how the MQO needs to be applied in practice while 23%
don’t see the need to refine the definition of the MQO (Figure 4-53).
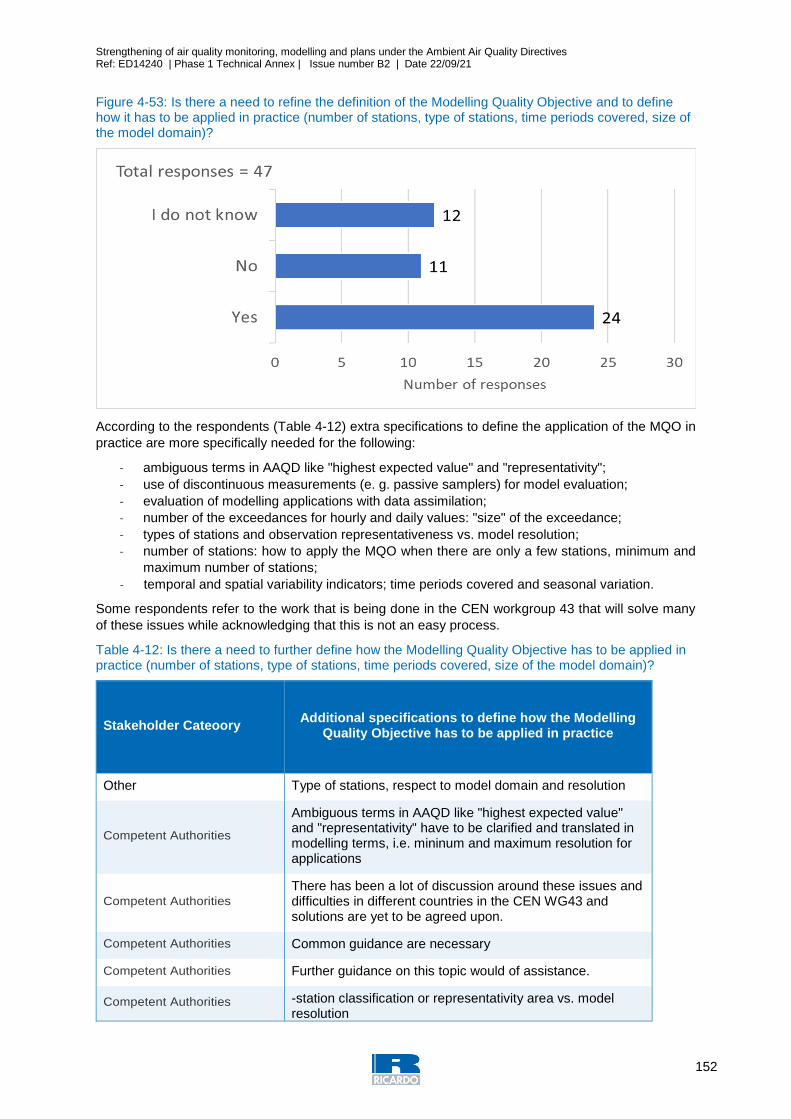
Strengthening of air quality monitoring, modelling and plans under the Ambient Air Quality Directives Ref: ED14240 | Phase 1 Technical Annex | Issue number B2 | Date 22/09/21
152
Figure 4-53: Is there a need to refine the definition of the Modelling Quality Objective and to define how it has to be applied in practice (number of stations, type of stations, time periods covered, size of the model domain)?
According to the respondents (Table 4-12) extra specifications to define the application of the MQO in
practice are more specifically needed for the following:
- ambiguous terms in AAQD like "highest expected value" and "representativity";
- use of discontinuous measurements (e. g. passive samplers) for model evaluation;
- evaluation of modelling applications with data assimilation;
- number of the exceedances for hourly and daily values: "size" of the exceedance;
- types of stations and observation representativeness vs. model resolution;
- number of stations: how to apply the MQO when there are only a few stations, minimum and
maximum number of stations;
- temporal and spatial variability indicators; time periods covered and seasonal variation.
Some respondents refer to the work that is being done in the CEN workgroup 43 that will solve many
of these issues while acknowledging that this is not an easy process.
Table 4-12: Is there a need to further define how the Modelling Quality Objective has to be applied in practice (number of stations, type of stations, time periods covered, size of the model domain)?
Stakeholder Cateoory Additional specifications to define how the Modelling
Quality Objective has to be applied in practice
Other Type of stations, respect to model domain and resolution
Competent Authorities
Ambiguous terms in AAQD like "highest expected value" and "representativity" have to be clarified and translated in modelling terms, i.e. mininum and maximum resolution for applications
Competent Authorities There has been a lot of discussion around these issues and difficulties in different countries in the CEN WG43 and solutions are yet to be agreed upon.
Competent Authorities Common guidance are necessary
Competent Authorities Further guidance on this topic would of assistance.
Competent Authorities -station classification or representativity area vs. model resolution
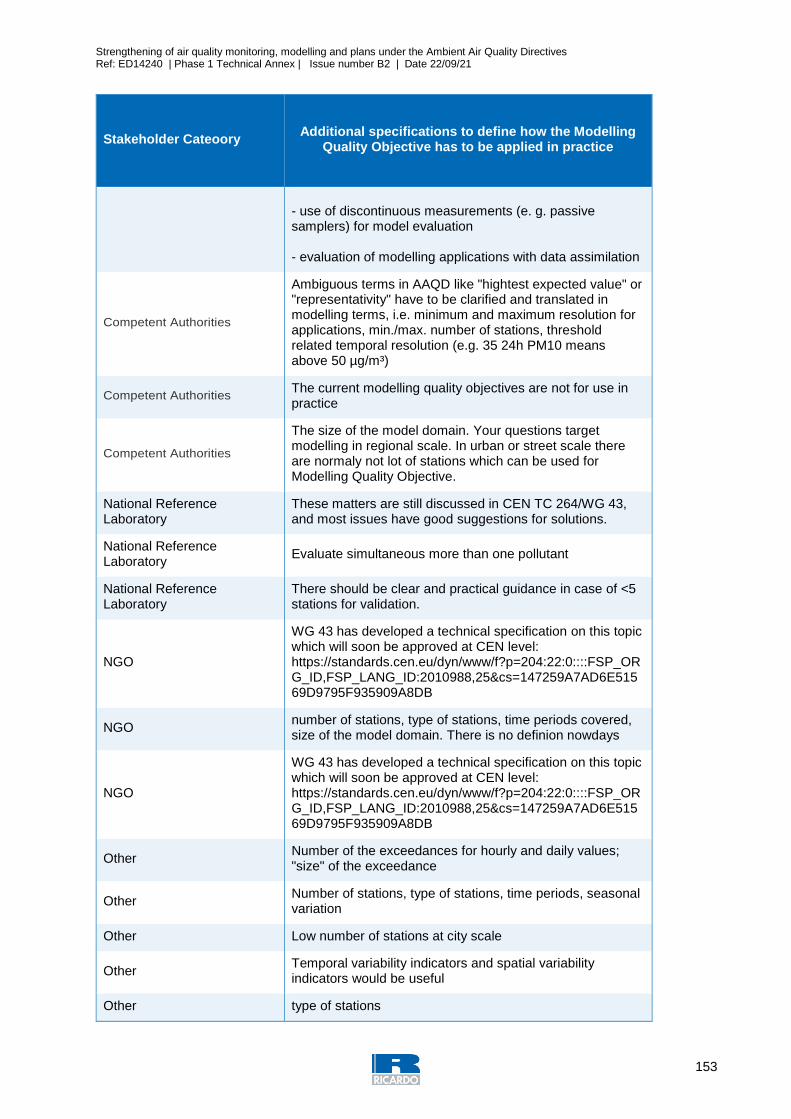
Strengthening of air quality monitoring, modelling and plans under the Ambient Air Quality Directives Ref: ED14240 | Phase 1 Technical Annex | Issue number B2 | Date 22/09/21
153
Stakeholder Cateoory Additional specifications to define how the Modelling
Quality Objective has to be applied in practice
- use of discontinuous measurements (e. g. passive samplers) for model evaluation - evaluation of modelling applications with data assimilation
Competent Authorities
Ambiguous terms in AAQD like "hightest expected value" or "representativity" have to be clarified and translated in modelling terms, i.e. minimum and maximum resolution for applications, min./max. number of stations, threshold related temporal resolution (e.g. 35 24h PM10 means above 50 µg/m³)
Competent Authorities The current modelling quality objectives are not for use in practice
Competent Authorities
The size of the model domain. Your questions target modelling in regional scale. In urban or street scale there are normaly not lot of stations which can be used for Modelling Quality Objective.
National Reference Laboratory
These matters are still discussed in CEN TC 264/WG 43, and most issues have good suggestions for solutions.
National Reference Laboratory
Evaluate simultaneous more than one pollutant
National Reference Laboratory
There should be clear and practical guidance in case of <5 stations for validation.
NGO
WG 43 has developed a technical specification on this topic which will soon be approved at CEN level: https://standards.cen.eu/dyn/www/f?p=204:22:0::::FSP_ORG_ID,FSP_LANG_ID:2010988,25&cs=147259A7AD6E51569D9795F935909A8DB
NGO number of stations, type of stations, time periods covered, size of the model domain. There is no definion nowdays
NGO
WG 43 has developed a technical specification on this topic which will soon be approved at CEN level: https://standards.cen.eu/dyn/www/f?p=204:22:0::::FSP_ORG_ID,FSP_LANG_ID:2010988,25&cs=147259A7AD6E51569D9795F935909A8DB
Other Number of the exceedances for hourly and daily values; "size" of the exceedance
Other Number of stations, type of stations, time periods, seasonal variation
Other Low number of stations at city scale
Other Temporal variability indicators and spatial variability indicators would be useful
Other type of stations
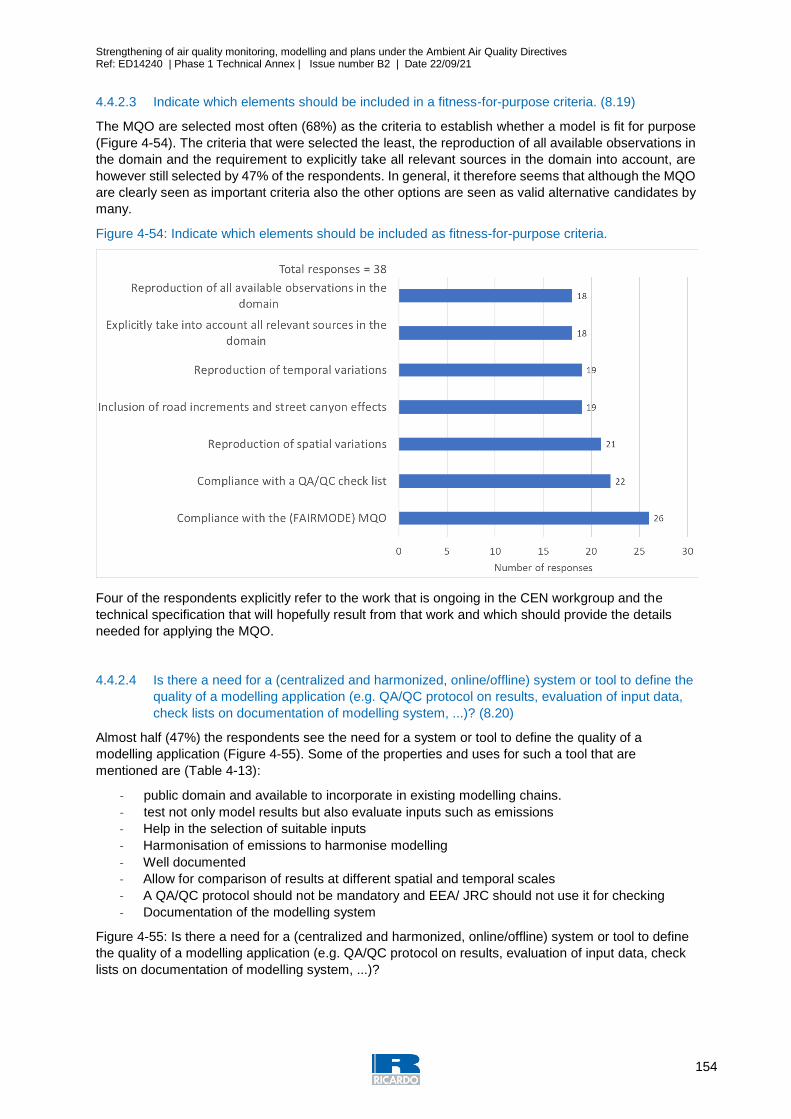
Strengthening of air quality monitoring, modelling and plans under the Ambient Air Quality Directives Ref: ED14240 | Phase 1 Technical Annex | Issue number B2 | Date 22/09/21
154
4.4.2.3 Indicate which elements should be included in a fitness-for-purpose criteria. (8.19)
The MQO are selected most often (68%) as the criteria to establish whether a model is fit for purpose
(Figure 4-54). The criteria that were selected the least, the reproduction of all available observations in
the domain and the requirement to explicitly take all relevant sources in the domain into account, are
however still selected by 47% of the respondents. In general, it therefore seems that although the MQO
are clearly seen as important criteria also the other options are seen as valid alternative candidates by
many.
Figure 4-54: Indicate which elements should be included as fitness-for-purpose criteria.
Four of the respondents explicitly refer to the work that is ongoing in the CEN workgroup and the
technical specification that will hopefully result from that work and which should provide the details
needed for applying the MQO.
4.4.2.4 Is there a need for a (centralized and harmonized, online/offline) system or tool to define the
quality of a modelling application (e.g. QA/QC protocol on results, evaluation of input data,
check lists on documentation of modelling system, ...)? (8.20)
Almost half (47%) the respondents see the need for a system or tool to define the quality of a
modelling application (Figure 4-55). Some of the properties and uses for such a tool that are
mentioned are (Table 4-13):
- public domain and available to incorporate in existing modelling chains.
- test not only model results but also evaluate inputs such as emissions
- Help in the selection of suitable inputs
- Harmonisation of emissions to harmonise modelling
- Well documented
- Allow for comparison of results at different spatial and temporal scales
- A QA/QC protocol should not be mandatory and EEA/ JRC should not use it for checking
- Documentation of the modelling system
Figure 4-55: Is there a need for a (centralized and harmonized, online/offline) system or tool to define
the quality of a modelling application (e.g. QA/QC protocol on results, evaluation of input data, check
lists on documentation of modelling system, ...)?
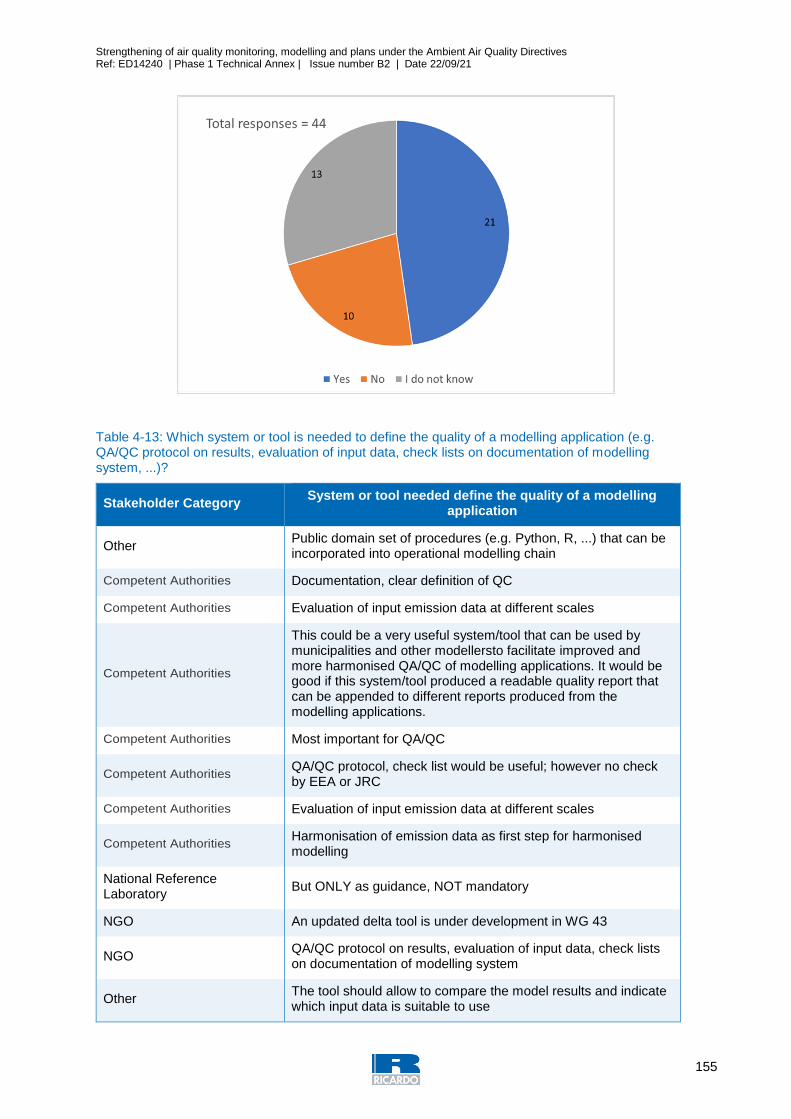
Strengthening of air quality monitoring, modelling and plans under the Ambient Air Quality Directives Ref: ED14240 | Phase 1 Technical Annex | Issue number B2 | Date 22/09/21
155
Table 4-13: Which system or tool is needed to define the quality of a modelling application (e.g. QA/QC protocol on results, evaluation of input data, check lists on documentation of modelling system, ...)?
Stakeholder Category System or tool needed define the quality of a modelling
application
Other Public domain set of procedures (e.g. Python, R, ...) that can be incorporated into operational modelling chain
Competent Authorities Documentation, clear definition of QC
Competent Authorities Evaluation of input emission data at different scales
Competent Authorities
This could be a very useful system/tool that can be used by municipalities and other modellersto facilitate improved and more harmonised QA/QC of modelling applications. It would be good if this system/tool produced a readable quality report that can be appended to different reports produced from the modelling applications.
Competent Authorities Most important for QA/QC
Competent Authorities QA/QC protocol, check list would be useful; however no check by EEA or JRC
Competent Authorities Evaluation of input emission data at different scales
Competent Authorities Harmonisation of emission data as first step for harmonised modelling
National Reference Laboratory
But ONLY as guidance, NOT mandatory
NGO An updated delta tool is under development in WG 43
NGO QA/QC protocol on results, evaluation of input data, check lists on documentation of modelling system
Other The tool should allow to compare the model results and indicate which input data is suitable to use

Strengthening of air quality monitoring, modelling and plans under the Ambient Air Quality Directives Ref: ED14240 | Phase 1 Technical Annex | Issue number B2 | Date 22/09/21
156
Stakeholder Category System or tool needed define the quality of a modelling
application
Other Easy to compare the modelling results between places, time scale
Other QA/QC protocol for model results could be available as a recommendation - but it is not clear whether it should be mandatory
Other A QA/QC protocol providing both MQI/MQC for modelling results, but also indications to check/evaluate input data
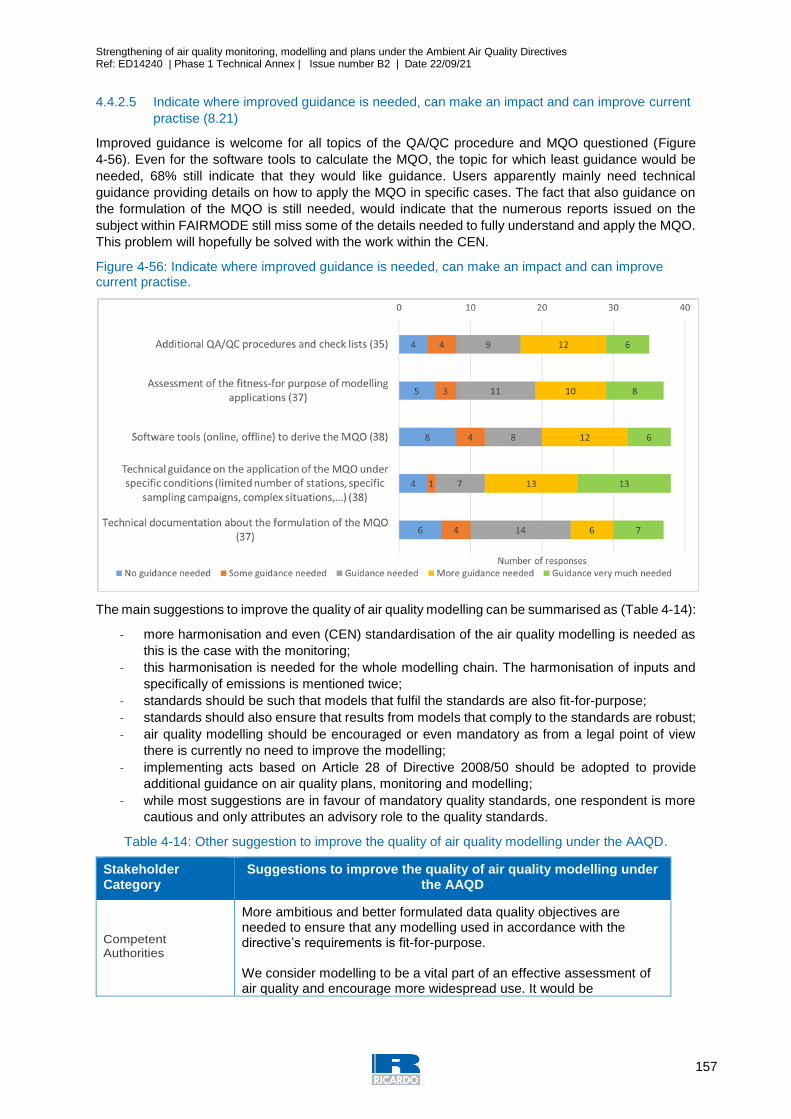
Strengthening of air quality monitoring, modelling and plans under the Ambient Air Quality Directives Ref: ED14240 | Phase 1 Technical Annex | Issue number B2 | Date 22/09/21
157
4.4.2.5 Indicate where improved guidance is needed, can make an impact and can improve current
practise (8.21)
Improved guidance is welcome for all topics of the QA/QC procedure and MQO questioned (Figure
4-56). Even for the software tools to calculate the MQO, the topic for which least guidance would be
needed, 68% still indicate that they would like guidance. Users apparently mainly need technical
guidance providing details on how to apply the MQO in specific cases. The fact that also guidance on
the formulation of the MQO is still needed, would indicate that the numerous reports issued on the
subject within FAIRMODE still miss some of the details needed to fully understand and apply the MQO.
This problem will hopefully be solved with the work within the CEN.
Figure 4-56: Indicate where improved guidance is needed, can make an impact and can improve current practise.
The main suggestions to improve the quality of air quality modelling can be summarised as (Table 4-14):
- more harmonisation and even (CEN) standardisation of the air quality modelling is needed as
this is the case with the monitoring;
- this harmonisation is needed for the whole modelling chain. The harmonisation of inputs and
specifically of emissions is mentioned twice;
- standards should be such that models that fulfil the standards are also fit-for-purpose;
- standards should also ensure that results from models that comply to the standards are robust;
- air quality modelling should be encouraged or even mandatory as from a legal point of view
there is currently no need to improve the modelling;
- implementing acts based on Article 28 of Directive 2008/50 should be adopted to provide
additional guidance on air quality plans, monitoring and modelling;
- while most suggestions are in favour of mandatory quality standards, one respondent is more
cautious and only attributes an advisory role to the quality standards.
Table 4-14: Other suggestion to improve the quality of air quality modelling under the AAQD.
Stakeholder Category
Suggestions to improve the quality of air quality modelling under the AAQD
Competent Authorities
More ambitious and better formulated data quality objectives are needed to ensure that any modelling used in accordance with the directive’s requirements is fit-for-purpose. We consider modelling to be a vital part of an effective assessment of air quality and encourage more widespread use. It would be
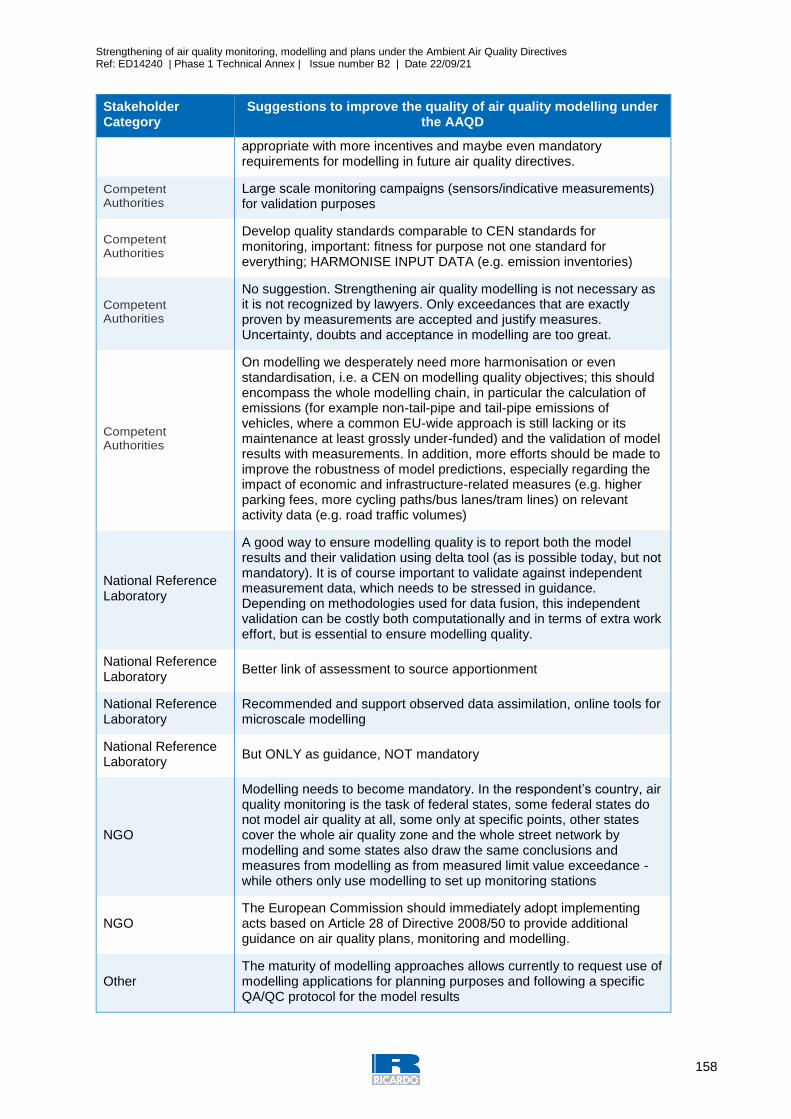
Strengthening of air quality monitoring, modelling and plans under the Ambient Air Quality Directives Ref: ED14240 | Phase 1 Technical Annex | Issue number B2 | Date 22/09/21
158
Stakeholder Category
Suggestions to improve the quality of air quality modelling under the AAQD
appropriate with more incentives and maybe even mandatory requirements for modelling in future air quality directives.
Competent Authorities
Large scale monitoring campaigns (sensors/indicative measurements) for validation purposes
Competent Authorities
Develop quality standards comparable to CEN standards for monitoring, important: fitness for purpose not one standard for everything; HARMONISE INPUT DATA (e.g. emission inventories)
Competent Authorities
No suggestion. Strengthening air quality modelling is not necessary as it is not recognized by lawyers. Only exceedances that are exactly proven by measurements are accepted and justify measures. Uncertainty, doubts and acceptance in modelling are too great.
Competent Authorities
On modelling we desperately need more harmonisation or even standardisation, i.e. a CEN on modelling quality objectives; this should encompass the whole modelling chain, in particular the calculation of emissions (for example non-tail-pipe and tail-pipe emissions of vehicles, where a common EU-wide approach is still lacking or its maintenance at least grossly under-funded) and the validation of model results with measurements. In addition, more efforts should be made to improve the robustness of model predictions, especially regarding the impact of economic and infrastructure-related measures (e.g. higher parking fees, more cycling paths/bus lanes/tram lines) on relevant activity data (e.g. road traffic volumes)
National Reference Laboratory
A good way to ensure modelling quality is to report both the model results and their validation using delta tool (as is possible today, but not mandatory). It is of course important to validate against independent measurement data, which needs to be stressed in guidance. Depending on methodologies used for data fusion, this independent validation can be costly both computationally and in terms of extra work effort, but is essential to ensure modelling quality.
National Reference Laboratory
Better link of assessment to source apportionment
National Reference Laboratory
Recommended and support observed data assimilation, online tools for microscale modelling
National Reference Laboratory
But ONLY as guidance, NOT mandatory
NGO
Modelling needs to become mandatory. In the respondent’s country, air quality monitoring is the task of federal states, some federal states do not model air quality at all, some only at specific points, other states cover the whole air quality zone and the whole street network by modelling and some states also draw the same conclusions and measures from modelling as from measured limit value exceedance - while others only use modelling to set up monitoring stations
NGO The European Commission should immediately adopt implementing acts based on Article 28 of Directive 2008/50 to provide additional guidance on air quality plans, monitoring and modelling.
Other The maturity of modelling approaches allows currently to request use of modelling applications for planning purposes and following a specific QA/QC protocol for the model results
Strengthening of air quality monitoring, modelling and plans under the Ambient Air Quality Directives Ref: ED14240 | Phase 1 Technical Annex | Issue number B2 | Date 22/09/21
159
4.4.3 Main messages
More than half the respondents use standard validation statistics based on R2, bias and RMSE (77%)
or the FAIRMODE Model Quality Objective (MQO) (56%). While this indicates that the validation of
model results is becoming more common, this also means that a model quality objective, be it standard
statistics or the FAIRMODE MQO, is still not used by everyone. According to 65% of respondents they
would be encouraged to use the FAIRMODE MQO if this would be a CEN standard.
Additional indicators to validate temporal and spatial variability are not used by everyone. Less than
half the respondents (42%) use additional indicators to validate spatial variability.
The criteria to select (additional) stations for the validation process should be further defined. To assess
model quality 70% of respondents use all available monitoring stations in the model domain. It is not
clear whether this implies that the respondents consider all these station data to be comparable in terms
of representativeness, data quality and temporal coverage or whether the respondents simply neglect
such considerations when selecting the stations. Respondents list a combination of different solutions
for coping with a situation where there are not enough monitoring stations to validate the model result.
It is not possible to single out one criterium to assess whether a model is fit for purpose. While, the
FAIRMODE MQO is considered an important criterium to assess model fitness for purpose, also other
options such as compliance to a QA/QC check list or the ability to reproduce spatial or temporal
variation, are valid alternative candidates by many.
Users require additional guidance on how to apply the MQO in practice. Harmonisation and even
standardisation would improve model quality but as long as modelling and model validation is not legally
mandatory there is no real need to improve and assess model quality.
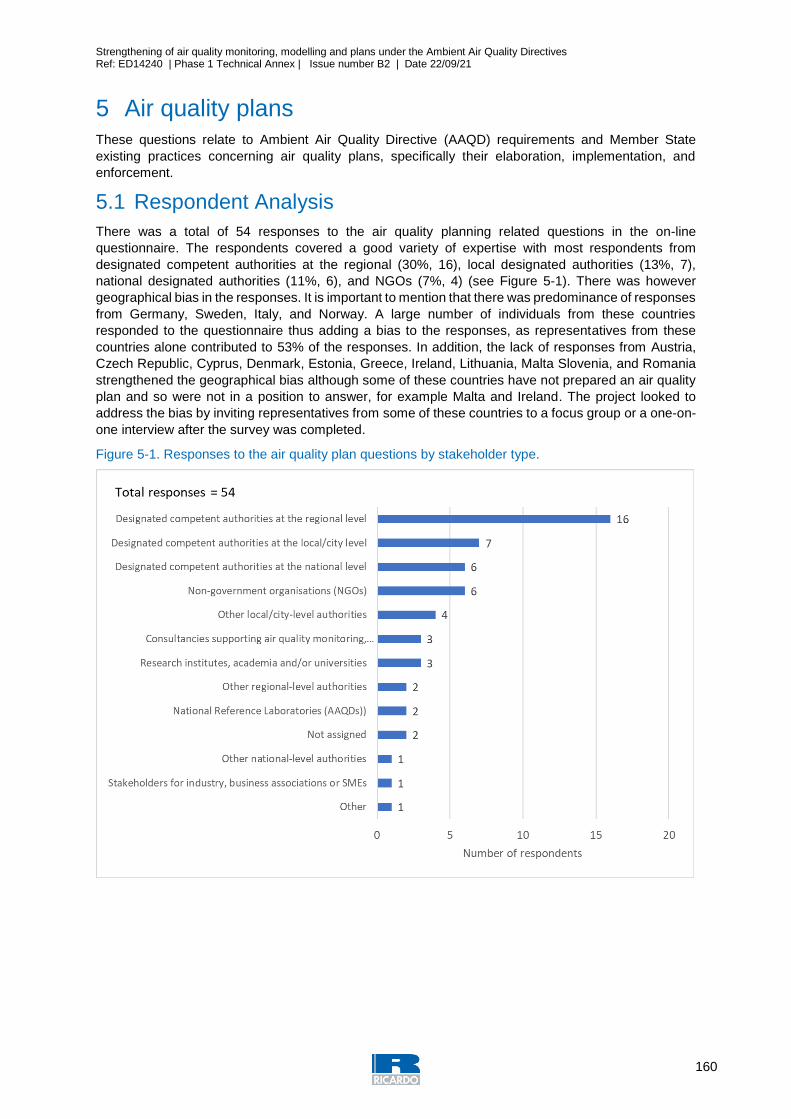
Strengthening of air quality monitoring, modelling and plans under the Ambient Air Quality Directives Ref: ED14240 | Phase 1 Technical Annex | Issue number B2 | Date 22/09/21
160
5 Air quality plans These questions relate to Ambient Air Quality Directive (AAQD) requirements and Member State
existing practices concerning air quality plans, specifically their elaboration, implementation, and
enforcement.
5.1 Respondent Analysis
There was a total of 54 responses to the air quality planning related questions in the on-line
questionnaire. The respondents covered a good variety of expertise with most respondents from
designated competent authorities at the regional (30%, 16), local designated authorities (13%, 7),
national designated authorities (11%, 6), and NGOs (7%, 4) (see Figure 5-1). There was however
geographical bias in the responses. It is important to mention that there was predominance of responses
from Germany, Sweden, Italy, and Norway. A large number of individuals from these countries
responded to the questionnaire thus adding a bias to the responses, as representatives from these
countries alone contributed to 53% of the responses. In addition, the lack of responses from Austria,
Czech Republic, Cyprus, Denmark, Estonia, Greece, Ireland, Lithuania, Malta Slovenia, and Romania
strengthened the geographical bias although some of these countries have not prepared an air quality
plan and so were not in a position to answer, for example Malta and Ireland. The project looked to
address the bias by inviting representatives from some of these countries to a focus group or a one-on-
one interview after the survey was completed.
Figure 5-1. Responses to the air quality plan questions by stakeholder type.
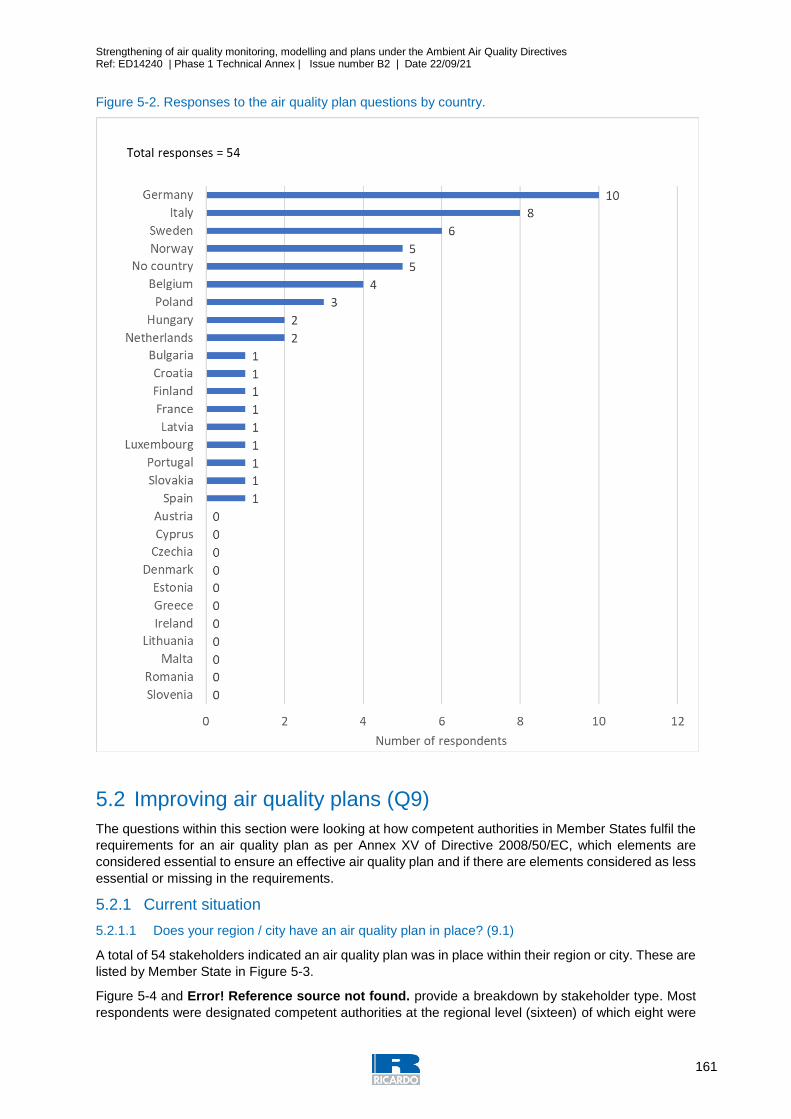
Strengthening of air quality monitoring, modelling and plans under the Ambient Air Quality Directives Ref: ED14240 | Phase 1 Technical Annex | Issue number B2 | Date 22/09/21
161
Figure 5-2. Responses to the air quality plan questions by country.
5.2 Improving air quality plans (Q9)
The questions within this section were looking at how competent authorities in Member States fulfil the
requirements for an air quality plan as per Annex XV of Directive 2008/50/EC, which elements are
considered essential to ensure an effective air quality plan and if there are elements considered as less
essential or missing in the requirements.
5.2.1 Current situation
5.2.1.1 Does your region / city have an air quality plan in place? (9.1)
A total of 54 stakeholders indicated an air quality plan was in place within their region or city. These are
listed by Member State in Figure 5-3.
Figure 5-4 and Error! Reference source not found. provide a breakdown by stakeholder type. Most
respondents were designated competent authorities at the regional level (sixteen) of which eight were
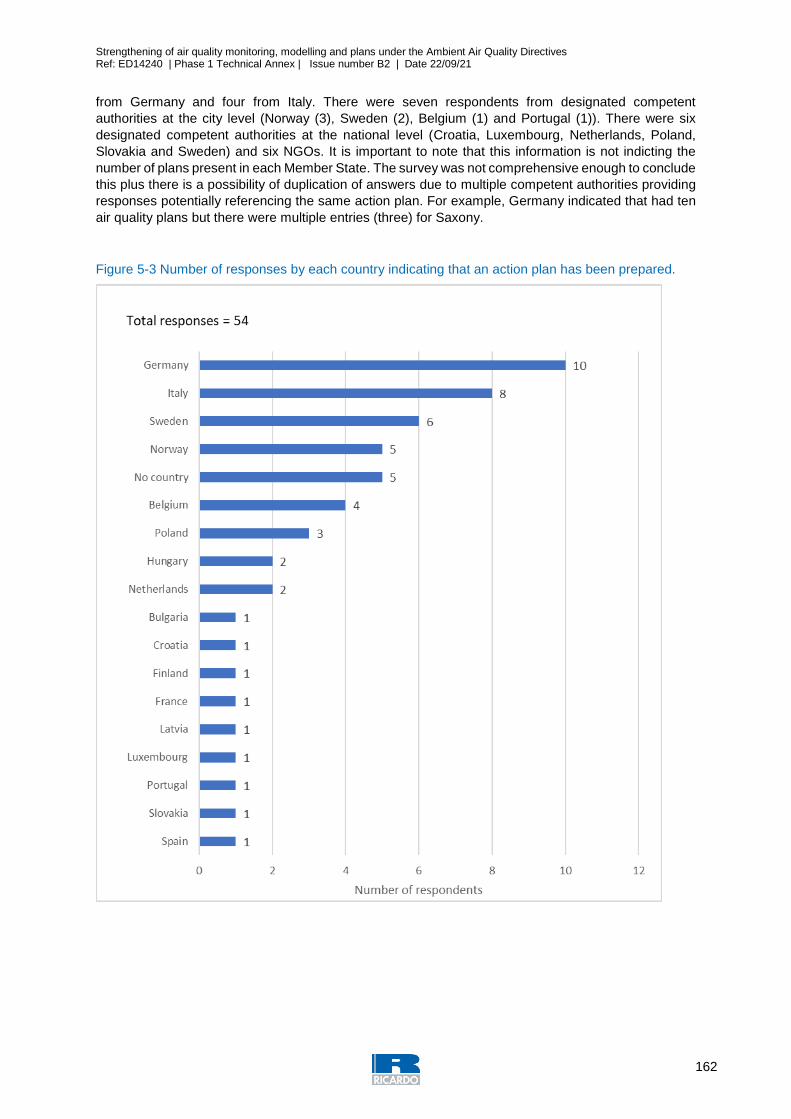
Strengthening of air quality monitoring, modelling and plans under the Ambient Air Quality Directives Ref: ED14240 | Phase 1 Technical Annex | Issue number B2 | Date 22/09/21
162
from Germany and four from Italy. There were seven respondents from designated competent
authorities at the city level (Norway (3), Sweden (2), Belgium (1) and Portugal (1)). There were six
designated competent authorities at the national level (Croatia, Luxembourg, Netherlands, Poland,
Slovakia and Sweden) and six NGOs. It is important to note that this information is not indicting the
number of plans present in each Member State. The survey was not comprehensive enough to conclude
this plus there is a possibility of duplication of answers due to multiple competent authorities providing
responses potentially referencing the same action plan. For example, Germany indicated that had ten
air quality plans but there were multiple entries (three) for Saxony.
Figure 5-3 Number of responses by each country indicating that an action plan has been prepared.
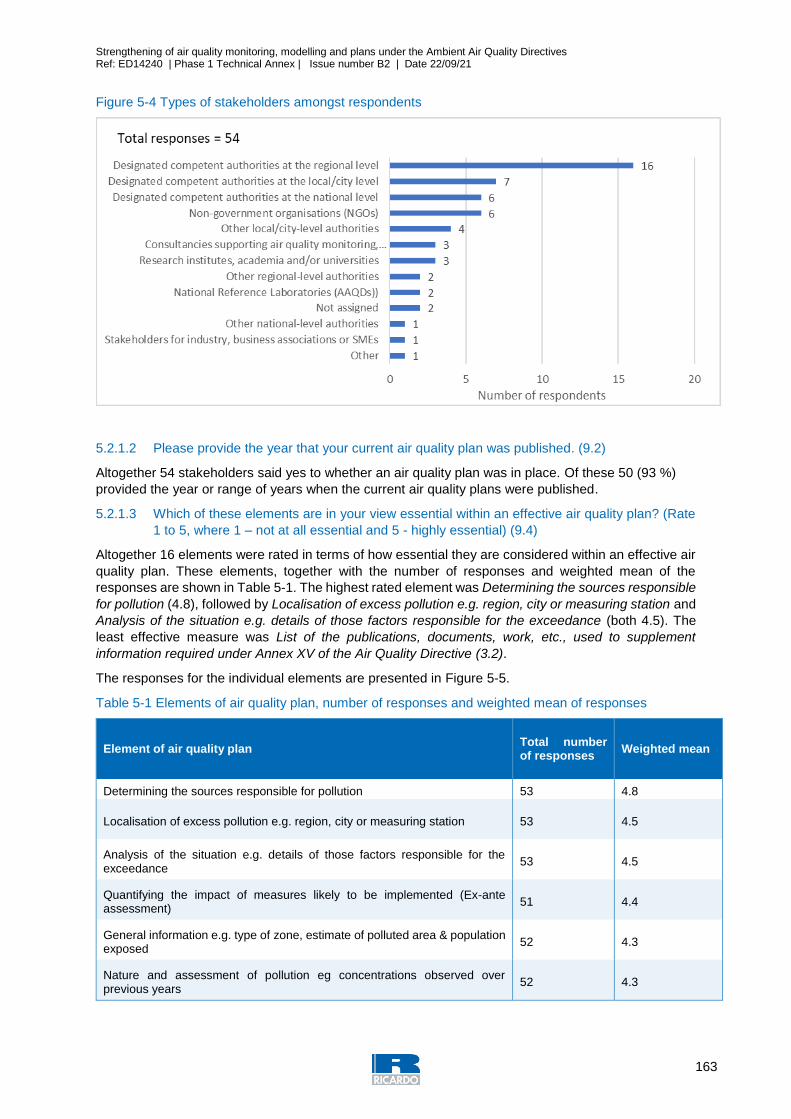
Strengthening of air quality monitoring, modelling and plans under the Ambient Air Quality Directives Ref: ED14240 | Phase 1 Technical Annex | Issue number B2 | Date 22/09/21
163
Figure 5-4 Types of stakeholders amongst respondents
5.2.1.2 Please provide the year that your current air quality plan was published. (9.2)
Altogether 54 stakeholders said yes to whether an air quality plan was in place. Of these 50 (93 %)
provided the year or range of years when the current air quality plans were published.
5.2.1.3 Which of these elements are in your view essential within an effective air quality plan? (Rate
1 to 5, where 1 – not at all essential and 5 - highly essential) (9.4)
Altogether 16 elements were rated in terms of how essential they are considered within an effective air
quality plan. These elements, together with the number of responses and weighted mean of the
responses are shown in Table 5-1. The highest rated element was Determining the sources responsible
for pollution (4.8), followed by Localisation of excess pollution e.g. region, city or measuring station and
Analysis of the situation e.g. details of those factors responsible for the exceedance (both 4.5). The
least effective measure was List of the publications, documents, work, etc., used to supplement
information required under Annex XV of the Air Quality Directive (3.2).
The responses for the individual elements are presented in Figure 5-5.
Table 5-1 Elements of air quality plan, number of responses and weighted mean of responses
Element of air quality plan Total number of responses
Weighted mean
Determining the sources responsible for pollution 53 4.8
Localisation of excess pollution e.g. region, city or measuring station 53 4.5
Analysis of the situation e.g. details of those factors responsible for the exceedance
53 4.5
Quantifying the impact of measures likely to be implemented (Ex-ante assessment)
51 4.4
General information e.g. type of zone, estimate of polluted area & population exposed
52 4.3
Nature and assessment of pollution eg concentrations observed over previous years
52 4.3
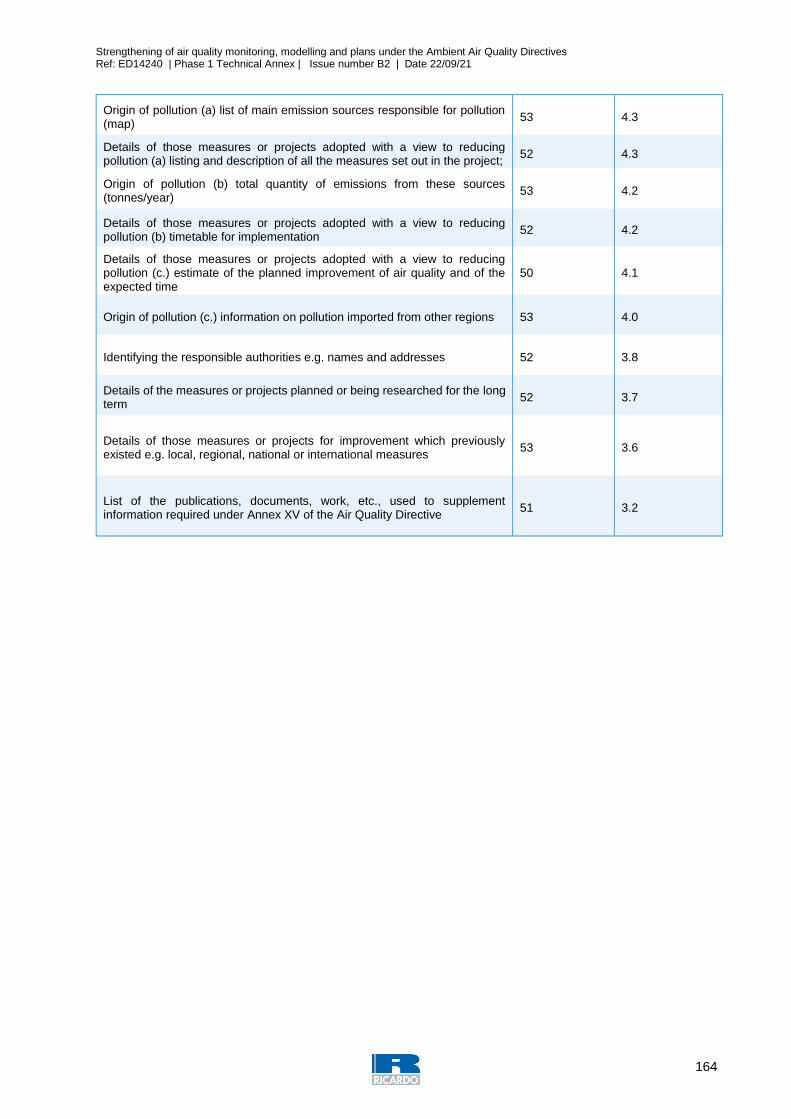
Strengthening of air quality monitoring, modelling and plans under the Ambient Air Quality Directives Ref: ED14240 | Phase 1 Technical Annex | Issue number B2 | Date 22/09/21
164
Origin of pollution (a) list of main emission sources responsible for pollution (map)
53 4.3
Details of those measures or projects adopted with a view to reducing pollution (a) listing and description of all the measures set out in the project;
52 4.3
Origin of pollution (b) total quantity of emissions from these sources (tonnes/year)
53 4.2
Details of those measures or projects adopted with a view to reducing pollution (b) timetable for implementation
52 4.2
Details of those measures or projects adopted with a view to reducing pollution (c.) estimate of the planned improvement of air quality and of the expected time
50 4.1
Origin of pollution (c.) information on pollution imported from other regions 53 4.0
Identifying the responsible authorities e.g. names and addresses 52 3.8
Details of the measures or projects planned or being researched for the long term
52 3.7
Details of those measures or projects for improvement which previously existed e.g. local, regional, national or international measures
53 3.6
List of the publications, documents, work, etc., used to supplement information required under Annex XV of the Air Quality Directive
51 3.2
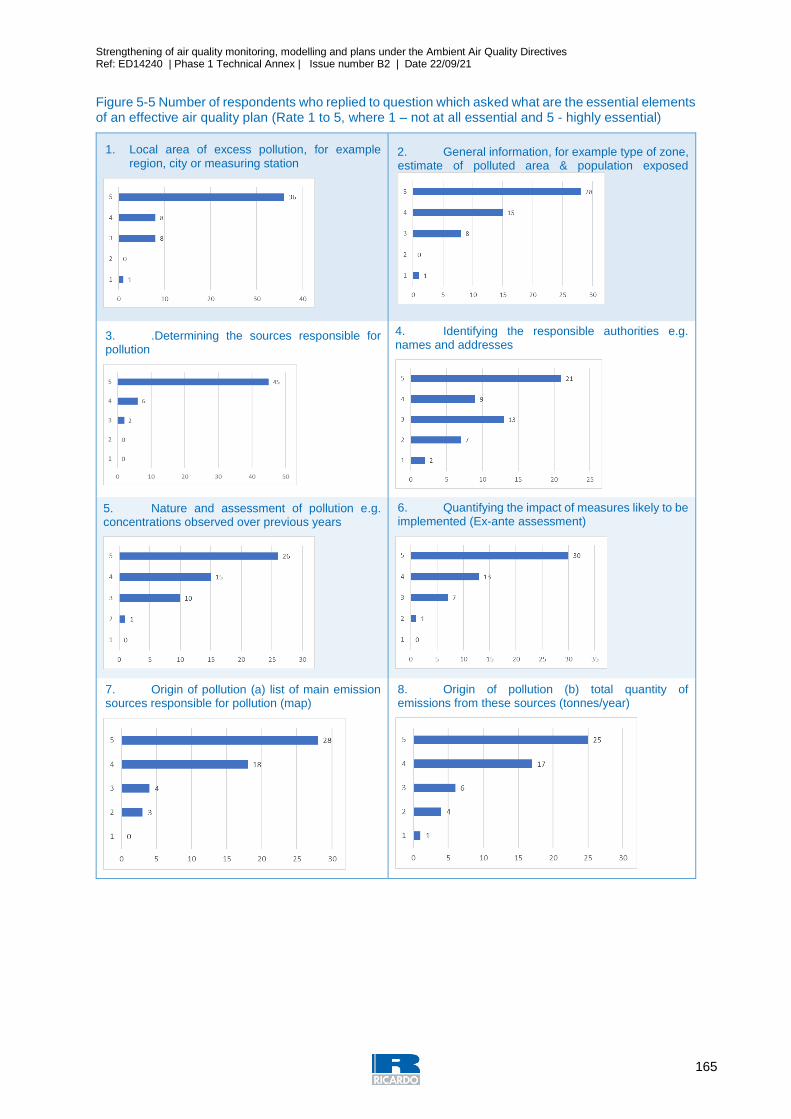
Strengthening of air quality monitoring, modelling and plans under the Ambient Air Quality Directives Ref: ED14240 | Phase 1 Technical Annex | Issue number B2 | Date 22/09/21
165
Figure 5-5 Number of respondents who replied to question which asked what are the essential elements of an effective air quality plan (Rate 1 to 5, where 1 – not at all essential and 5 - highly essential)
1. Local area of excess pollution, for example region, city or measuring station
2. General information, for example type of zone, estimate of polluted area & population exposed
3. .Determining the sources responsible for pollution
4. Identifying the responsible authorities e.g. names and addresses
5. Nature and assessment of pollution e.g. concentrations observed over previous years
6. Quantifying the impact of measures likely to be implemented (Ex-ante assessment)
7. Origin of pollution (a) list of main emission sources responsible for pollution (map)
8. Origin of pollution (b) total quantity of emissions from these sources (tonnes/year)
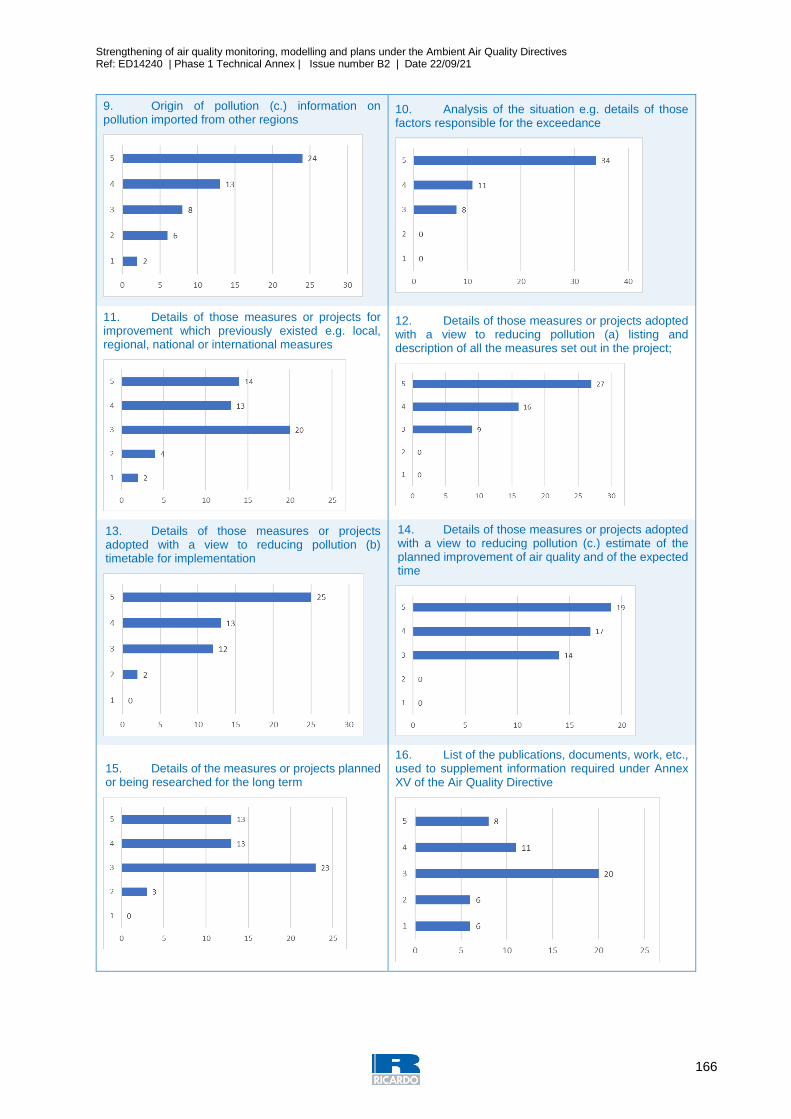
Strengthening of air quality monitoring, modelling and plans under the Ambient Air Quality Directives Ref: ED14240 | Phase 1 Technical Annex | Issue number B2 | Date 22/09/21
166
9. Origin of pollution (c.) information on pollution imported from other regions
10. Analysis of the situation e.g. details of those factors responsible for the exceedance
11. Details of those measures or projects for improvement which previously existed e.g. local, regional, national or international measures
12. Details of those measures or projects adopted with a view to reducing pollution (a) listing and description of all the measures set out in the project;
13. Details of those measures or projects adopted with a view to reducing pollution (b) timetable for implementation
14. Details of those measures or projects adopted with a view to reducing pollution (c.) estimate of the planned improvement of air quality and of the expected time
15. Details of the measures or projects planned or being researched for the long term
16. List of the publications, documents, work, etc., used to supplement information required under Annex XV of the Air Quality Directive
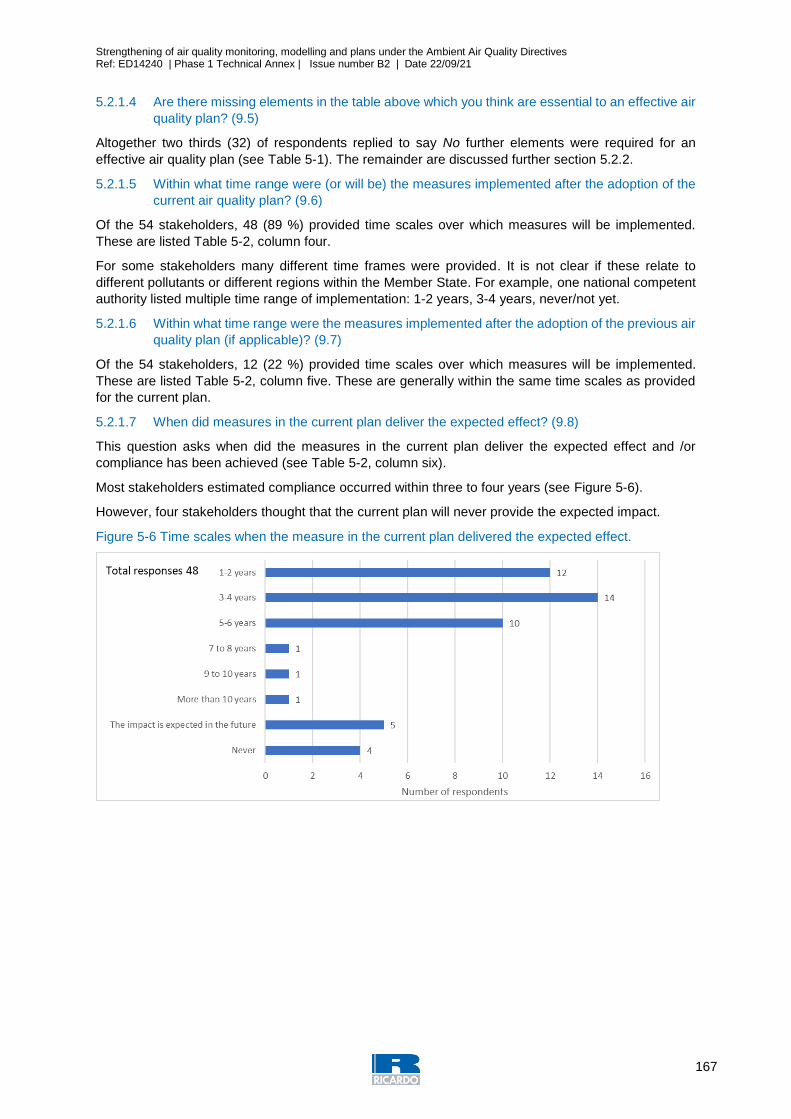
Strengthening of air quality monitoring, modelling and plans under the Ambient Air Quality Directives Ref: ED14240 | Phase 1 Technical Annex | Issue number B2 | Date 22/09/21
167
5.2.1.4 Are there missing elements in the table above which you think are essential to an effective air
quality plan? (9.5)
Altogether two thirds (32) of respondents replied to say No further elements were required for an
effective air quality plan (see Table 5-1). The remainder are discussed further section 5.2.2.
5.2.1.5 Within what time range were (or will be) the measures implemented after the adoption of the
current air quality plan? (9.6)
Of the 54 stakeholders, 48 (89 %) provided time scales over which measures will be implemented.
These are listed Table 5-2, column four.
For some stakeholders many different time frames were provided. It is not clear if these relate to
different pollutants or different regions within the Member State. For example, one national competent
authority listed multiple time range of implementation: 1-2 years, 3-4 years, never/not yet.
5.2.1.6 Within what time range were the measures implemented after the adoption of the previous air
quality plan (if applicable)? (9.7)
Of the 54 stakeholders, 12 (22 %) provided time scales over which measures will be implemented.
These are listed Table 5-2, column five. These are generally within the same time scales as provided
for the current plan.
5.2.1.7 When did measures in the current plan deliver the expected effect? (9.8)
This question asks when did the measures in the current plan deliver the expected effect and /or
compliance has been achieved (see Table 5-2, column six).
Most stakeholders estimated compliance occurred within three to four years (see Figure 5-6).
However, four stakeholders thought that the current plan will never provide the expected impact.
Figure 5-6 Time scales when the measure in the current plan delivered the expected effect.
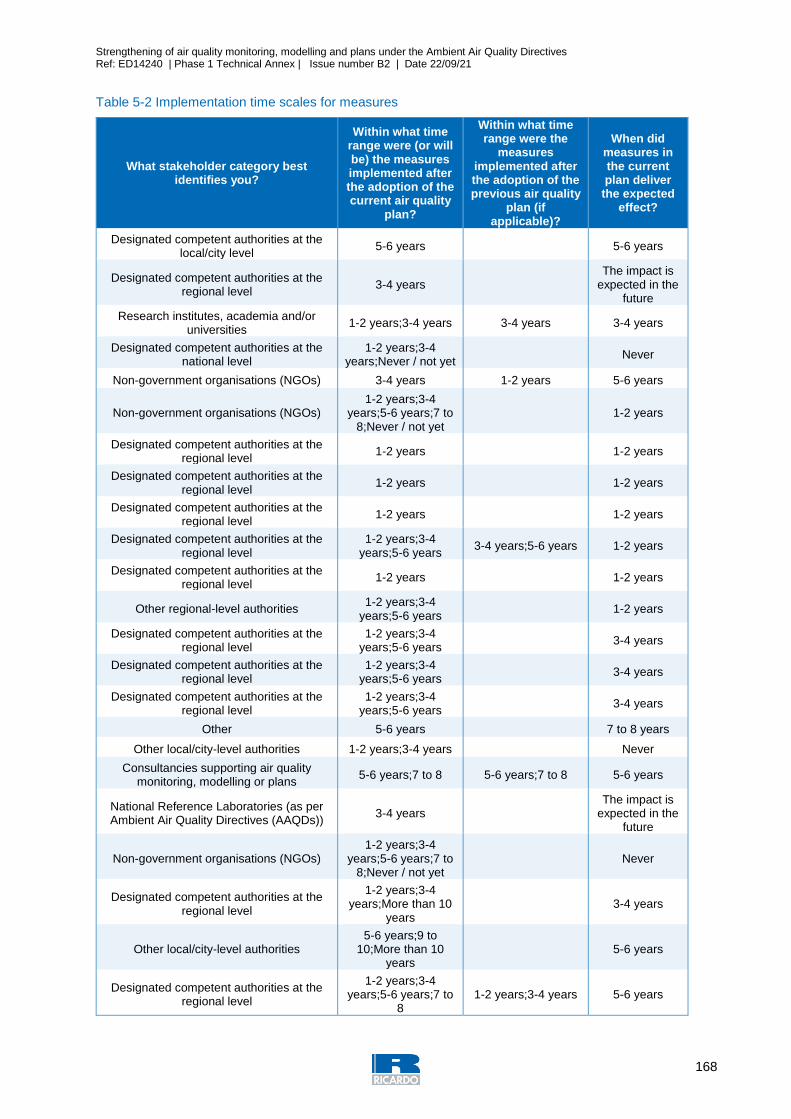
Strengthening of air quality monitoring, modelling and plans under the Ambient Air Quality Directives Ref: ED14240 | Phase 1 Technical Annex | Issue number B2 | Date 22/09/21
168
Table 5-2 Implementation time scales for measures
What stakeholder category best identifies you?
Within what time range were (or will be) the measures implemented after the adoption of the current air quality
plan?
Within what time range were the
measures implemented after the adoption of the previous air quality
plan (if applicable)?
When did measures in the current plan deliver
the expected effect?
Designated competent authorities at the local/city level
5-6 years
5-6 years
Designated competent authorities at the regional level
3-4 years
The impact is expected in the
future
Research institutes, academia and/or universities
1-2 years;3-4 years 3-4 years 3-4 years
Designated competent authorities at the national level
1-2 years;3-4 years;Never / not yet
Never
Non-government organisations (NGOs) 3-4 years 1-2 years 5-6 years
Non-government organisations (NGOs) 1-2 years;3-4
years;5-6 years;7 to 8;Never / not yet
1-2 years
Designated competent authorities at the regional level
1-2 years
1-2 years
Designated competent authorities at the regional level
1-2 years
1-2 years
Designated competent authorities at the regional level
1-2 years
1-2 years
Designated competent authorities at the regional level
1-2 years;3-4 years;5-6 years
3-4 years;5-6 years 1-2 years
Designated competent authorities at the regional level
1-2 years
1-2 years
Other regional-level authorities 1-2 years;3-4
years;5-6 years
1-2 years
Designated competent authorities at the regional level
1-2 years;3-4 years;5-6 years
3-4 years
Designated competent authorities at the regional level
1-2 years;3-4 years;5-6 years
3-4 years
Designated competent authorities at the regional level
1-2 years;3-4 years;5-6 years
3-4 years
Other 5-6 years
7 to 8 years
Other local/city-level authorities 1-2 years;3-4 years
Never
Consultancies supporting air quality monitoring, modelling or plans
5-6 years;7 to 8 5-6 years;7 to 8 5-6 years
National Reference Laboratories (as per Ambient Air Quality Directives (AAQDs))
3-4 years
The impact is expected in the
future
Non-government organisations (NGOs) 1-2 years;3-4
years;5-6 years;7 to 8;Never / not yet
Never
Designated competent authorities at the regional level
1-2 years;3-4 years;More than 10
years
3-4 years
Other local/city-level authorities 5-6 years;9 to
10;More than 10 years
5-6 years
Designated competent authorities at the regional level
1-2 years;3-4 years;5-6 years;7 to
8 1-2 years;3-4 years 5-6 years
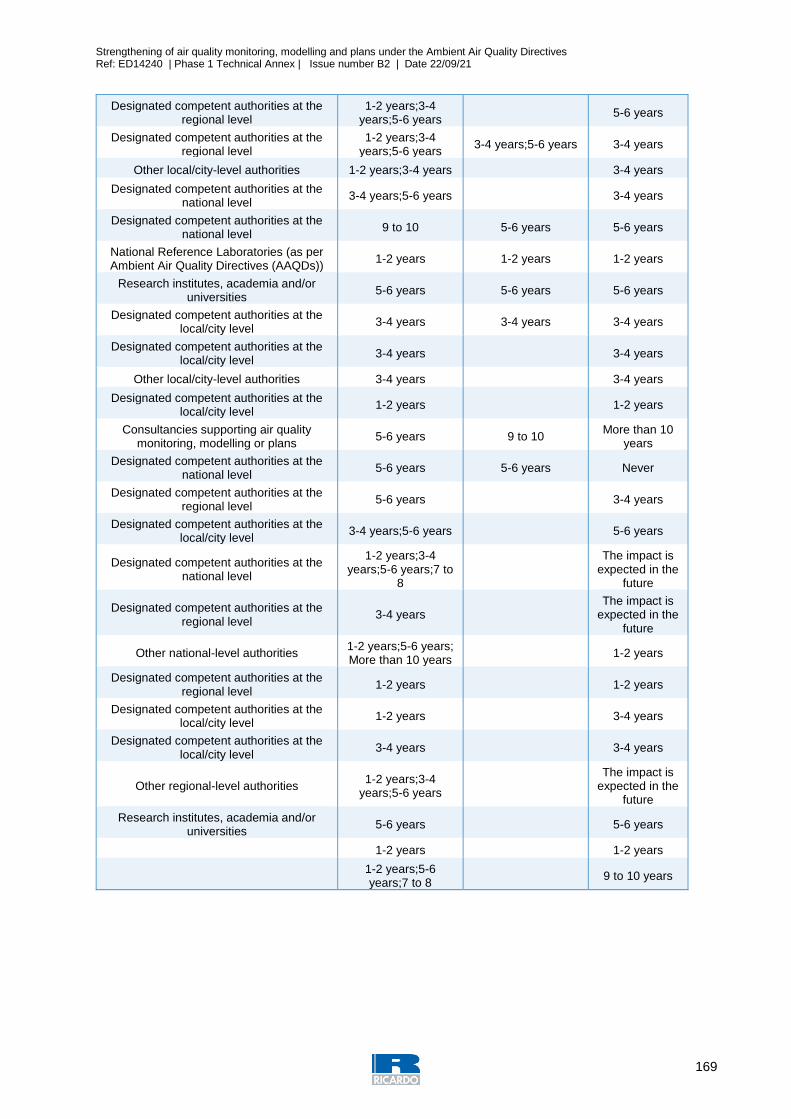
Strengthening of air quality monitoring, modelling and plans under the Ambient Air Quality Directives Ref: ED14240 | Phase 1 Technical Annex | Issue number B2 | Date 22/09/21
169
Designated competent authorities at the regional level
1-2 years;3-4 years;5-6 years
5-6 years
Designated competent authorities at the regional level
1-2 years;3-4 years;5-6 years
3-4 years;5-6 years 3-4 years
Other local/city-level authorities 1-2 years;3-4 years
3-4 years
Designated competent authorities at the national level
3-4 years;5-6 years
3-4 years
Designated competent authorities at the national level
9 to 10 5-6 years 5-6 years
National Reference Laboratories (as per Ambient Air Quality Directives (AAQDs))
1-2 years 1-2 years 1-2 years
Research institutes, academia and/or universities
5-6 years 5-6 years 5-6 years
Designated competent authorities at the local/city level
3-4 years 3-4 years 3-4 years
Designated competent authorities at the local/city level
3-4 years
3-4 years
Other local/city-level authorities 3-4 years
3-4 years
Designated competent authorities at the local/city level
1-2 years
1-2 years
Consultancies supporting air quality monitoring, modelling or plans
5-6 years 9 to 10 More than 10
years
Designated competent authorities at the national level
5-6 years 5-6 years Never
Designated competent authorities at the regional level
5-6 years
3-4 years
Designated competent authorities at the local/city level
3-4 years;5-6 years
5-6 years
Designated competent authorities at the national level
1-2 years;3-4 years;5-6 years;7 to
8
The impact is
expected in the future
Designated competent authorities at the regional level
3-4 years
The impact is expected in the
future
Other national-level authorities 1-2 years;5-6 years; More than 10 years
1-2 years
Designated competent authorities at the regional level
1-2 years
1-2 years
Designated competent authorities at the local/city level
1-2 years
3-4 years
Designated competent authorities at the local/city level
3-4 years
3-4 years
Other regional-level authorities 1-2 years;3-4
years;5-6 years
The impact is expected in the
future
Research institutes, academia and/or universities
5-6 years
5-6 years
1-2 years
1-2 years
1-2 years;5-6 years;7 to 8
9 to 10 years
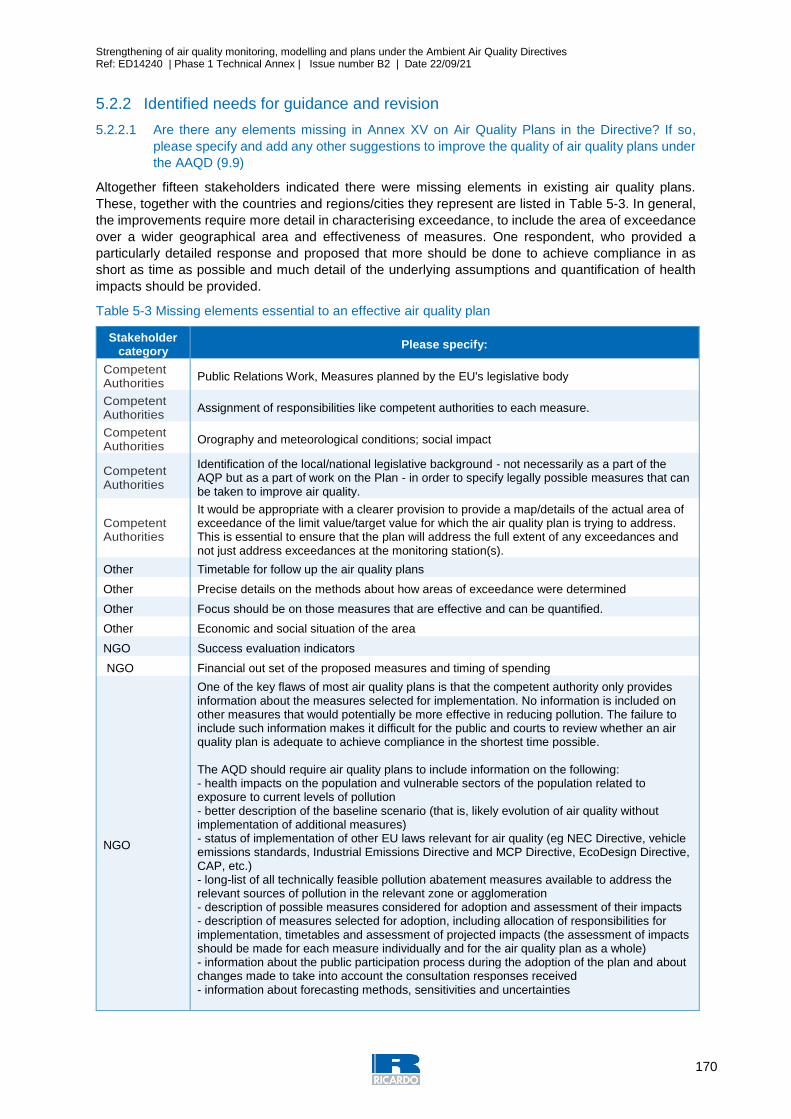
Strengthening of air quality monitoring, modelling and plans under the Ambient Air Quality Directives Ref: ED14240 | Phase 1 Technical Annex | Issue number B2 | Date 22/09/21
170
5.2.2 Identified needs for guidance and revision
5.2.2.1 Are there any elements missing in Annex XV on Air Quality Plans in the Directive? If so,
please specify and add any other suggestions to improve the quality of air quality plans under
the AAQD (9.9)
Altogether fifteen stakeholders indicated there were missing elements in existing air quality plans.
These, together with the countries and regions/cities they represent are listed in Table 5-3. In general,
the improvements require more detail in characterising exceedance, to include the area of exceedance
over a wider geographical area and effectiveness of measures. One respondent, who provided a
particularly detailed response and proposed that more should be done to achieve compliance in as
short as time as possible and much detail of the underlying assumptions and quantification of health
impacts should be provided.
Table 5-3 Missing elements essential to an effective air quality plan
Stakeholder category
Please specify:
Competent Authorities
Public Relations Work, Measures planned by the EU's legislative body
Competent Authorities
Assignment of responsibilities like competent authorities to each measure.
Competent Authorities
Orography and meteorological conditions; social impact
Competent Authorities
Identification of the local/national legislative background - not necessarily as a part of the AQP but as a part of work on the Plan - in order to specify legally possible measures that can be taken to improve air quality.
Competent Authorities
It would be appropriate with a clearer provision to provide a map/details of the actual area of exceedance of the limit value/target value for which the air quality plan is trying to address. This is essential to ensure that the plan will address the full extent of any exceedances and not just address exceedances at the monitoring station(s).
Other Timetable for follow up the air quality plans
Other Precise details on the methods about how areas of exceedance were determined
Other Focus should be on those measures that are effective and can be quantified.
Other Economic and social situation of the area
NGO Success evaluation indicators
NGO Financial out set of the proposed measures and timing of spending
NGO
One of the key flaws of most air quality plans is that the competent authority only provides information about the measures selected for implementation. No information is included on other measures that would potentially be more effective in reducing pollution. The failure to include such information makes it difficult for the public and courts to review whether an air quality plan is adequate to achieve compliance in the shortest time possible. The AQD should require air quality plans to include information on the following: - health impacts on the population and vulnerable sectors of the population related to exposure to current levels of pollution - better description of the baseline scenario (that is, likely evolution of air quality without implementation of additional measures) - status of implementation of other EU laws relevant for air quality (eg NEC Directive, vehicle emissions standards, Industrial Emissions Directive and MCP Directive, EcoDesign Directive, CAP, etc.) - long-list of all technically feasible pollution abatement measures available to address the relevant sources of pollution in the relevant zone or agglomeration - description of possible measures considered for adoption and assessment of their impacts - description of measures selected for adoption, including allocation of responsibilities for implementation, timetables and assessment of projected impacts (the assessment of impacts should be made for each measure individually and for the air quality plan as a whole) - information about the public participation process during the adoption of the plan and about changes made to take into account the consultation responses received - information about forecasting methods, sensitivities and uncertainties
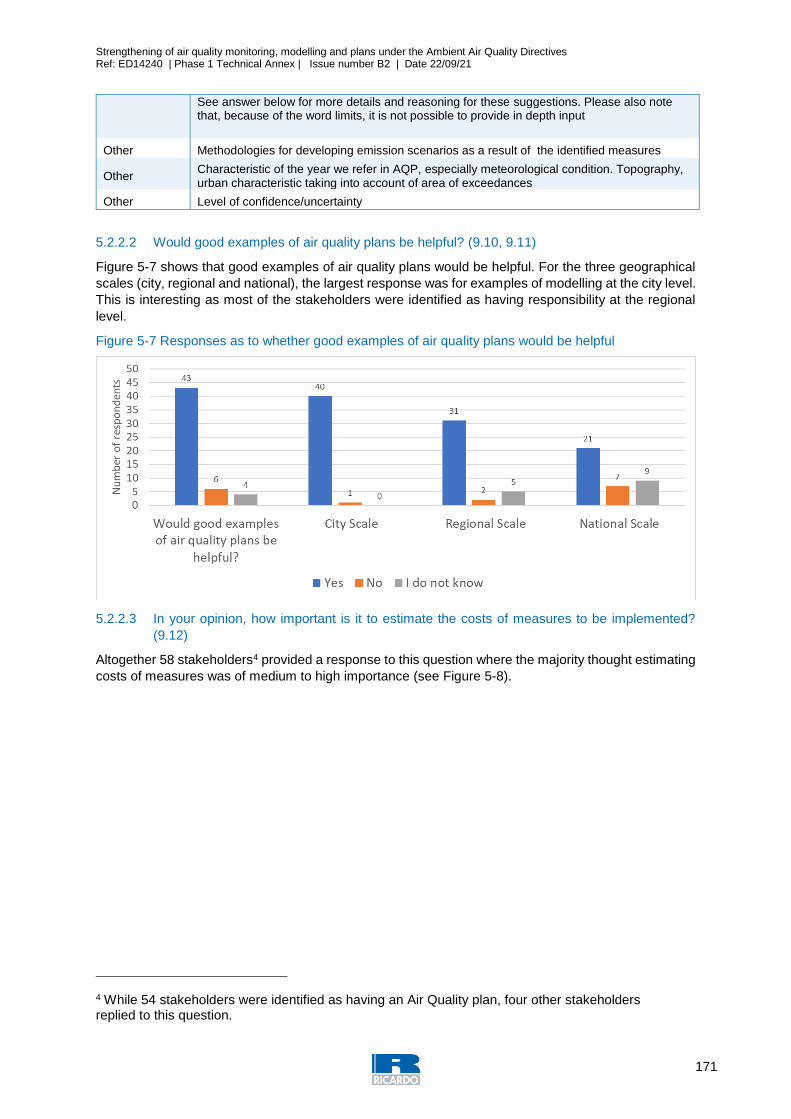
Strengthening of air quality monitoring, modelling and plans under the Ambient Air Quality Directives Ref: ED14240 | Phase 1 Technical Annex | Issue number B2 | Date 22/09/21
171
See answer below for more details and reasoning for these suggestions. Please also note that, because of the word limits, it is not possible to provide in depth input
Other Methodologies for developing emission scenarios as a result of the identified measures
Other Characteristic of the year we refer in AQP, especially meteorological condition. Topography, urban characteristic taking into account of area of exceedances
Other Level of confidence/uncertainty
5.2.2.2 Would good examples of air quality plans be helpful? (9.10, 9.11)
Figure 5-7 shows that good examples of air quality plans would be helpful. For the three geographical
scales (city, regional and national), the largest response was for examples of modelling at the city level.
This is interesting as most of the stakeholders were identified as having responsibility at the regional
level.
Figure 5-7 Responses as to whether good examples of air quality plans would be helpful
5.2.2.3 In your opinion, how important is it to estimate the costs of measures to be implemented?
(9.12)
Altogether 58 stakeholders4 provided a response to this question where the majority thought estimating
costs of measures was of medium to high importance (see Figure 5-8).
4 While 54 stakeholders were identified as having an Air Quality plan, four other stakeholders replied to this question.
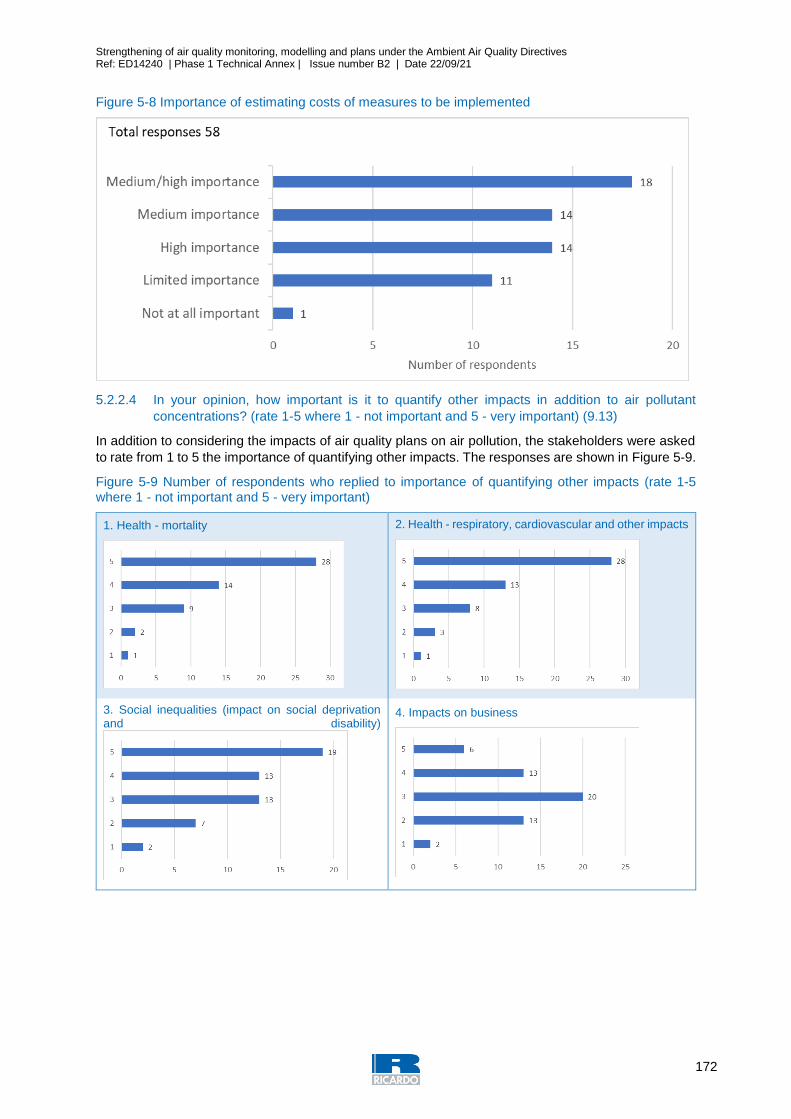
Strengthening of air quality monitoring, modelling and plans under the Ambient Air Quality Directives Ref: ED14240 | Phase 1 Technical Annex | Issue number B2 | Date 22/09/21
172
Figure 5-8 Importance of estimating costs of measures to be implemented
5.2.2.4 In your opinion, how important is it to quantify other impacts in addition to air pollutant
concentrations? (rate 1-5 where 1 - not important and 5 - very important) (9.13)
In addition to considering the impacts of air quality plans on air pollution, the stakeholders were asked
to rate from 1 to 5 the importance of quantifying other impacts. The responses are shown in Figure 5-9.
Figure 5-9 Number of respondents who replied to importance of quantifying other impacts (rate 1-5 where 1 - not important and 5 - very important)
1. Health - mortality
2. Health - respiratory, cardiovascular and other impacts
3. Social inequalities (impact on social deprivation and disability)
4. Impacts on business
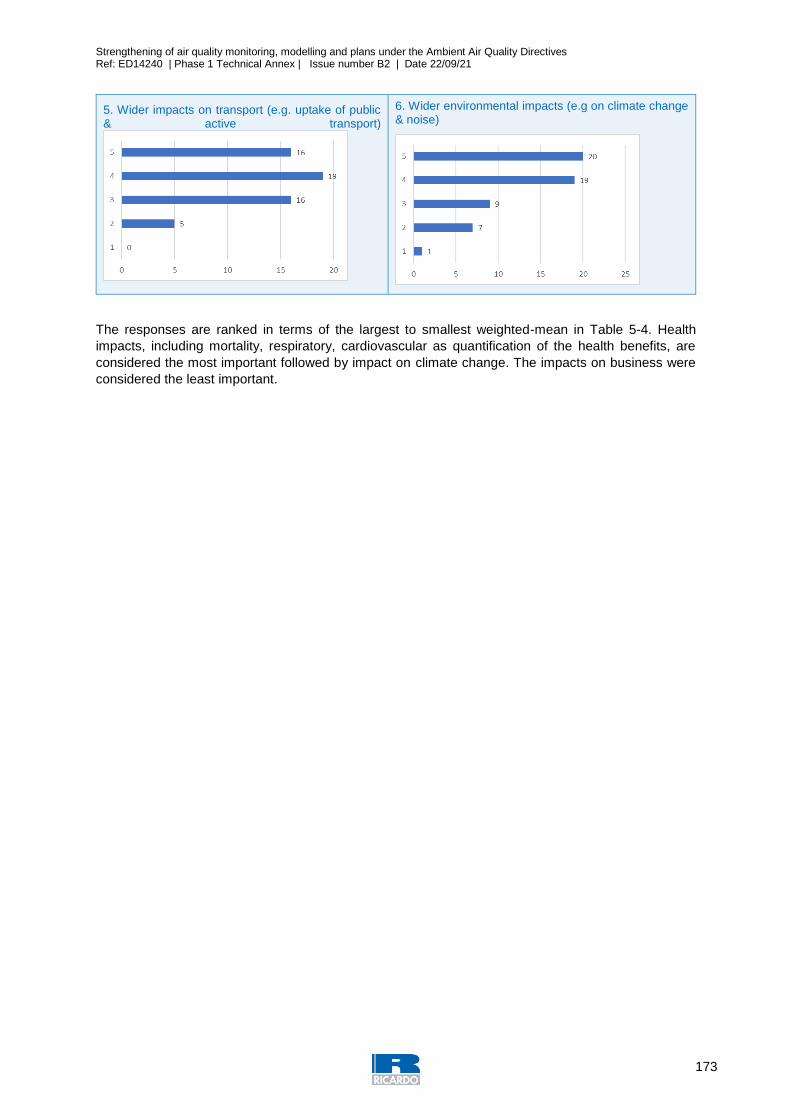
Strengthening of air quality monitoring, modelling and plans under the Ambient Air Quality Directives Ref: ED14240 | Phase 1 Technical Annex | Issue number B2 | Date 22/09/21
173
5. Wider impacts on transport (e.g. uptake of public & active transport)
6. Wider environmental impacts (e.g on climate change & noise)
The responses are ranked in terms of the largest to smallest weighted-mean in Table 5-4. Health
impacts, including mortality, respiratory, cardiovascular as quantification of the health benefits, are
considered the most important followed by impact on climate change. The impacts on business were
considered the least important.
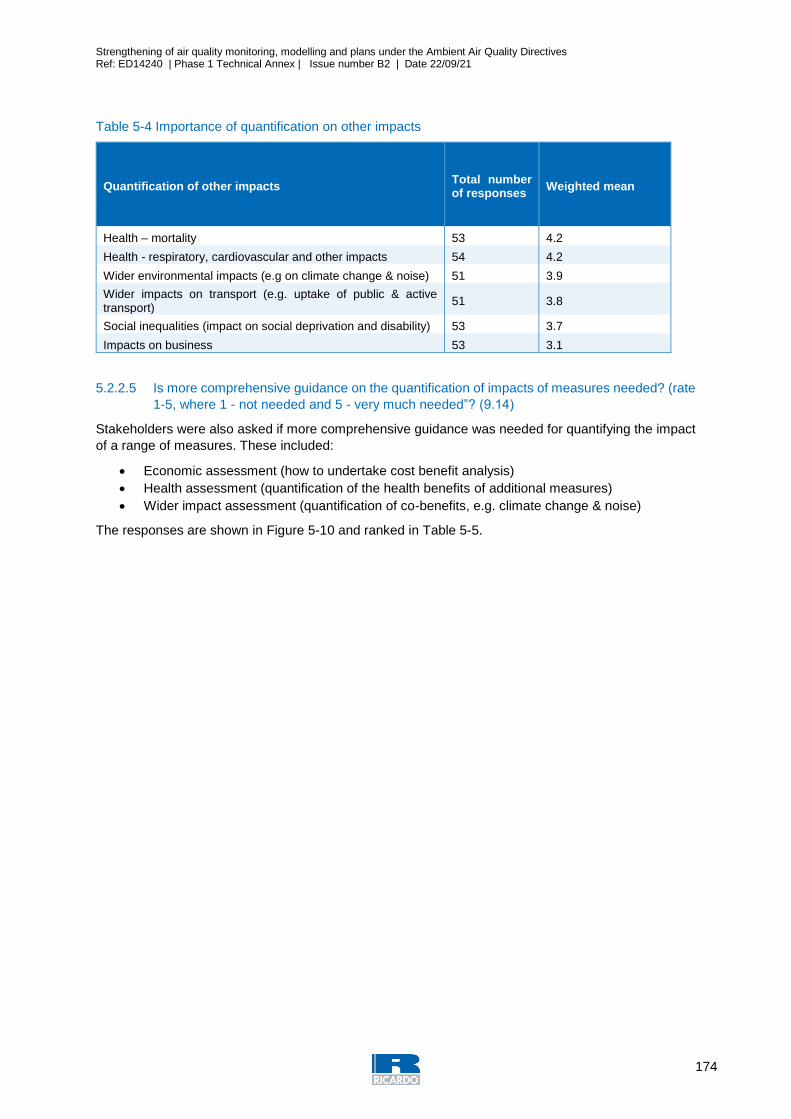
Strengthening of air quality monitoring, modelling and plans under the Ambient Air Quality Directives Ref: ED14240 | Phase 1 Technical Annex | Issue number B2 | Date 22/09/21
174
Table 5-4 Importance of quantification on other impacts
Quantification of other impacts Total number of responses
Weighted mean
Health – mortality 53 4.2
Health - respiratory, cardiovascular and other impacts 54 4.2
Wider environmental impacts (e.g on climate change & noise) 51 3.9
Wider impacts on transport (e.g. uptake of public & active transport)
51 3.8
Social inequalities (impact on social deprivation and disability) 53 3.7
Impacts on business 53 3.1
5.2.2.5 Is more comprehensive guidance on the quantification of impacts of measures needed? (rate
1-5, where 1 - not needed and 5 - very much needed”? (9.14)
Stakeholders were also asked if more comprehensive guidance was needed for quantifying the impact
of a range of measures. These included:
Economic assessment (how to undertake cost benefit analysis)
Health assessment (quantification of the health benefits of additional measures)
Wider impact assessment (quantification of co-benefits, e.g. climate change & noise)
The responses are shown in Figure 5-10 and ranked in Table 5-5.
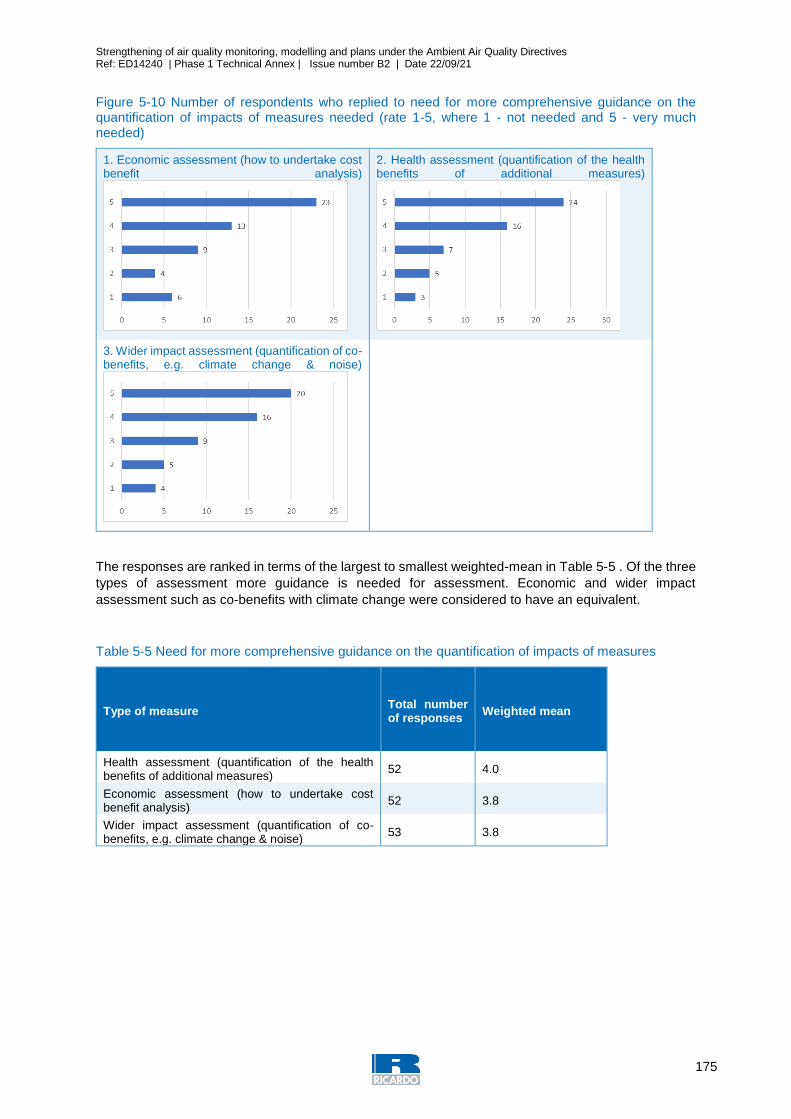
Strengthening of air quality monitoring, modelling and plans under the Ambient Air Quality Directives Ref: ED14240 | Phase 1 Technical Annex | Issue number B2 | Date 22/09/21
175
Figure 5-10 Number of respondents who replied to need for more comprehensive guidance on the quantification of impacts of measures needed (rate 1-5, where 1 - not needed and 5 - very much needed)
1. Economic assessment (how to undertake cost benefit analysis)
2. Health assessment (quantification of the health benefits of additional measures)
3. Wider impact assessment (quantification of co-benefits, e.g. climate change & noise)
The responses are ranked in terms of the largest to smallest weighted-mean in Table 5-5 . Of the three
types of assessment more guidance is needed for assessment. Economic and wider impact
assessment such as co-benefits with climate change were considered to have an equivalent.
Table 5-5 Need for more comprehensive guidance on the quantification of impacts of measures
Type of measure Total number of responses
Weighted mean
Health assessment (quantification of the health benefits of additional measures)
52 4.0
Economic assessment (how to undertake cost benefit analysis)
52 3.8
Wider impact assessment (quantification of co-benefits, e.g. climate change & noise)
53 3.8
Strengthening of air quality monitoring, modelling and plans under the Ambient Air Quality Directives Ref: ED14240 | Phase 1 Technical Annex | Issue number B2 | Date 22/09/21
176
5.2.3 Main messages
Fifty-four stakeholders responded to say an air quality plan was in place within their region or city. Most
air quality plans are assigned to designated competent authorities at the regional level (sixteen),
followed by designated competent authorities at the city level (seven). There were six designated
competent authorities at the national level and six NGOs.
There was a wide range of time scales over which implementation of measures would be achieved and
as a plan contains many measures some stakeholders responded by indicating measures were
implemented over multiple time scales. The time scales for implementing measures for the previous
plans appear to be generally the same as for the current plan.
With regards to the essential elements of the current air quality plans, determining the sources
responsible for the exceedance was considered the most important, followed by “localisation” of excess
pollution and analysing the factors responsible for exceedance.
A third of stakeholders said that there was still improvement required for air quality plans. Improvements
suggested included better characterisation of the exceedance, for example increasing the area where
the measures should apply as well as increasing the effectiveness of the measures themselves.
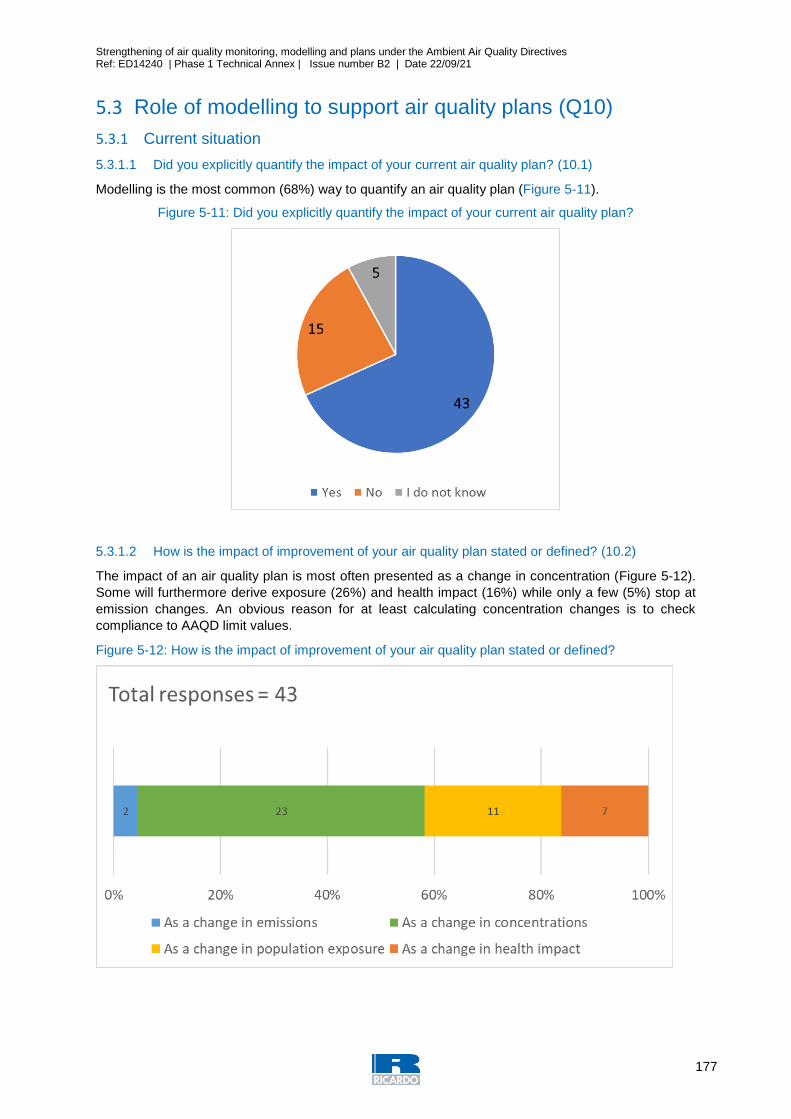
Strengthening of air quality monitoring, modelling and plans under the Ambient Air Quality Directives Ref: ED14240 | Phase 1 Technical Annex | Issue number B2 | Date 22/09/21
177
5.3 Role of modelling to support air quality plans (Q10)
5.3.1 Current situation
5.3.1.1 Did you explicitly quantify the impact of your current air quality plan? (10.1)
Modelling is the most common (68%) way to quantify an air quality plan (Figure 5-11).
Figure 5-11: Did you explicitly quantify the impact of your current air quality plan?
5.3.1.2 How is the impact of improvement of your air quality plan stated or defined? (10.2)
The impact of an air quality plan is most often presented as a change in concentration (Figure 5-12).
Some will furthermore derive exposure (26%) and health impact (16%) while only a few (5%) stop at
emission changes. An obvious reason for at least calculating concentration changes is to check
compliance to AAQD limit values.
Figure 5-12: How is the impact of improvement of your air quality plan stated or defined?

Strengthening of air quality monitoring, modelling and plans under the Ambient Air Quality Directives Ref: ED14240 | Phase 1 Technical Annex | Issue number B2 | Date 22/09/21
178
5.3.1.3 Did you quantify the impact of individual measures of your air quality plan? (10.3)
The impact of individual measures is quantified by more than half (56%) the respondents (Figure 5-13).
Figure 5-13: How did you quantify the measures in the air quality plan?
5.3.1.4 Did you use an emission model to translate actions (technical or non-technical) into
emission changes? (10.4)
On two occasions the improvement in the air quality plan was quantified as a change in emissions and
there is no indication of the consequential change in concentration, exposure and health impact, that is
the air quality plan assessment stopped at the emission changes. The calculation of emission changes
using an emission model is more common (65%) than the calculation of the impact of individual
measures (56%) (Figure 5-13).
5.3.1.5 Did you use an air quality model to translate emission changes into concentration changes?
(10.5)
Most (76%) air quality plans involve calculating concentration changes for emission changes. The
modelling needed to quantify the impact of the abatement measures (56%) and the emission modelling
to calculate emission changes (65%) are less common (Figure 5-13).
5.3.1.6 Did you develop the air quality plan using an optimisation approach? (10.6)
An optimisation procedure is only used by a few (8%) in their air quality planning model (Figure 5-14).
The ‘other’ option is not explained by any of the respondents. One respondent uses the ‘other’ for
specifying that the air quality plan was developed in cooperation with the municipality. One respondent
used the other field to provide their concern that air quality planning modelling is limited to assessing
the effects of a set of selected measures. Their view is that in order to comply with the “as short as
possible” requirement in Article 23 of the Directive, air quality plans should provide forecast modelling
for the long-list o²f all technically feasible measures and select the most effective ones.
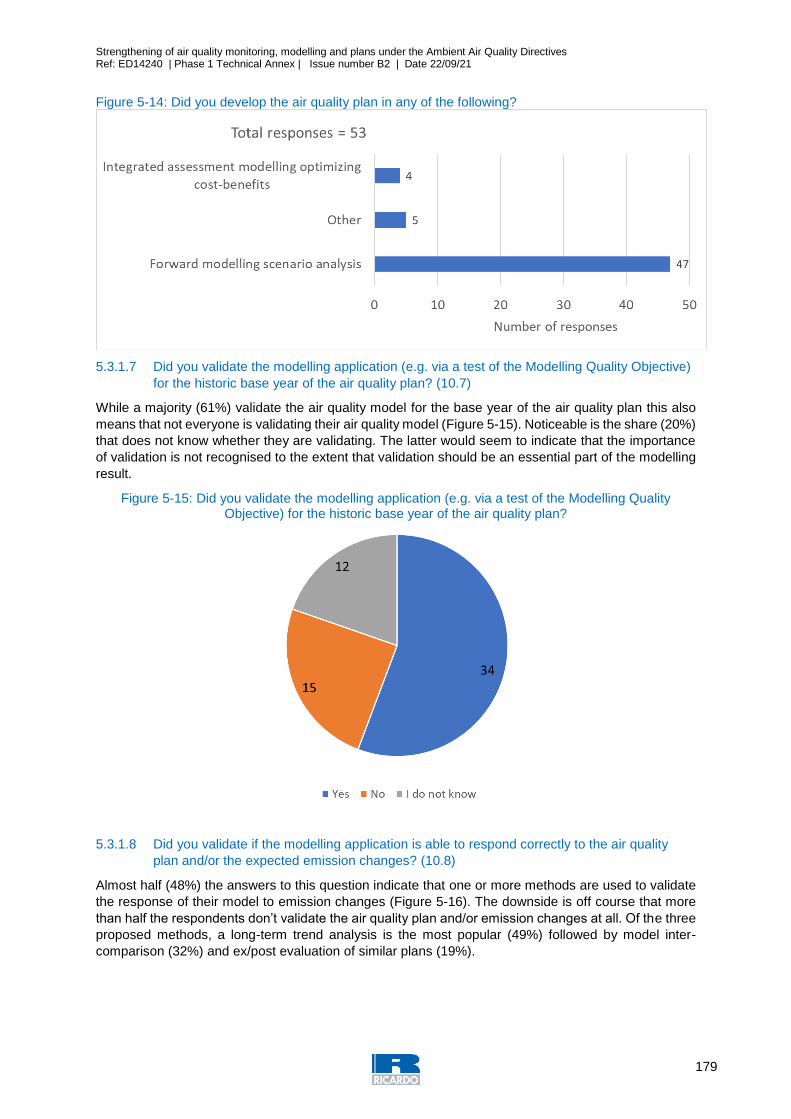
Strengthening of air quality monitoring, modelling and plans under the Ambient Air Quality Directives Ref: ED14240 | Phase 1 Technical Annex | Issue number B2 | Date 22/09/21
179
Figure 5-14: Did you develop the air quality plan in any of the following?
5.3.1.7 Did you validate the modelling application (e.g. via a test of the Modelling Quality Objective)
for the historic base year of the air quality plan? (10.7)
While a majority (61%) validate the air quality model for the base year of the air quality plan this also
means that not everyone is validating their air quality model (Figure 5-15). Noticeable is the share (20%)
that does not know whether they are validating. The latter would seem to indicate that the importance
of validation is not recognised to the extent that validation should be an essential part of the modelling
result.
Figure 5-15: Did you validate the modelling application (e.g. via a test of the Modelling Quality Objective) for the historic base year of the air quality plan?
5.3.1.8 Did you validate if the modelling application is able to respond correctly to the air quality
plan and/or the expected emission changes? (10.8)
Almost half (48%) the answers to this question indicate that one or more methods are used to validate
the response of their model to emission changes (Figure 5-16). The downside is off course that more
than half the respondents don’t validate the air quality plan and/or emission changes at all. Of the three
proposed methods, a long-term trend analysis is the most popular (49%) followed by model inter-
comparison (32%) and ex/post evaluation of similar plans (19%).
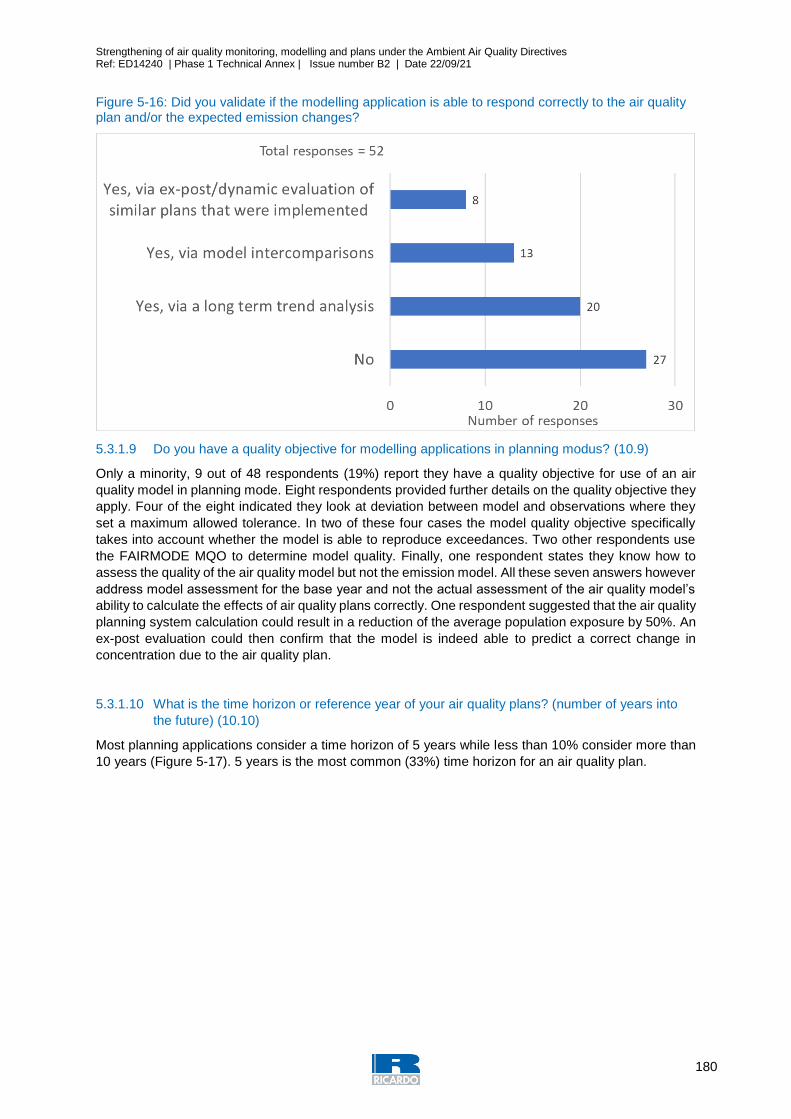
Strengthening of air quality monitoring, modelling and plans under the Ambient Air Quality Directives Ref: ED14240 | Phase 1 Technical Annex | Issue number B2 | Date 22/09/21
180
Figure 5-16: Did you validate if the modelling application is able to respond correctly to the air quality plan and/or the expected emission changes?
5.3.1.9 Do you have a quality objective for modelling applications in planning modus? (10.9)
Only a minority, 9 out of 48 respondents (19%) report they have a quality objective for use of an air
quality model in planning mode. Eight respondents provided further details on the quality objective they
apply. Four of the eight indicated they look at deviation between model and observations where they
set a maximum allowed tolerance. In two of these four cases the model quality objective specifically
takes into account whether the model is able to reproduce exceedances. Two other respondents use
the FAIRMODE MQO to determine model quality. Finally, one respondent states they know how to
assess the quality of the air quality model but not the emission model. All these seven answers however
address model assessment for the base year and not the actual assessment of the air quality model’s
ability to calculate the effects of air quality plans correctly. One respondent suggested that the air quality
planning system calculation could result in a reduction of the average population exposure by 50%. An
ex-post evaluation could then confirm that the model is indeed able to predict a correct change in
concentration due to the air quality plan.
5.3.1.10 What is the time horizon or reference year of your air quality plans? (number of years into
the future) (10.10)
Most planning applications consider a time horizon of 5 years while less than 10% consider more than
10 years (Figure 5-17). 5 years is the most common (33%) time horizon for an air quality plan.
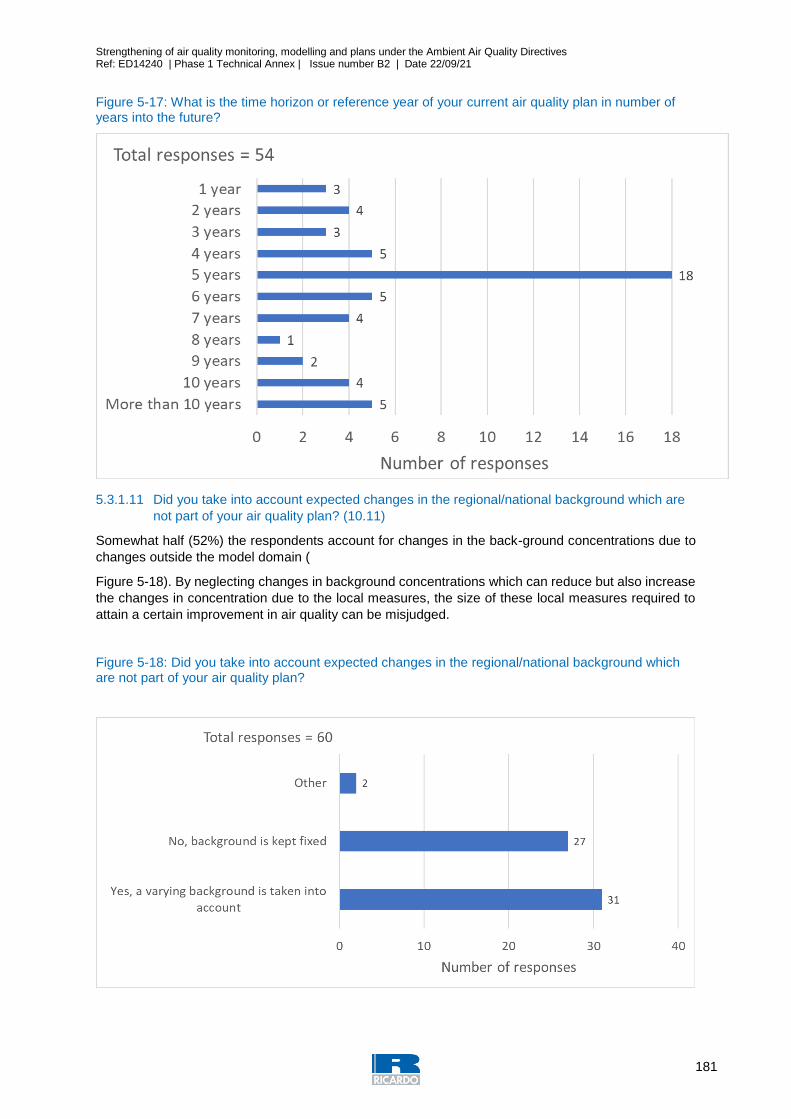
Strengthening of air quality monitoring, modelling and plans under the Ambient Air Quality Directives Ref: ED14240 | Phase 1 Technical Annex | Issue number B2 | Date 22/09/21
181
Figure 5-17: What is the time horizon or reference year of your current air quality plan in number of years into the future?
5.3.1.11 Did you take into account expected changes in the regional/national background which are
not part of your air quality plan? (10.11)
Somewhat half (52%) the respondents account for changes in the back-ground concentrations due to
changes outside the model domain (
Figure 5-18). By neglecting changes in background concentrations which can reduce but also increase
the changes in concentration due to the local measures, the size of these local measures required to
attain a certain improvement in air quality can be misjudged.
Figure 5-18: Did you take into account expected changes in the regional/national background which are not part of your air quality plan?
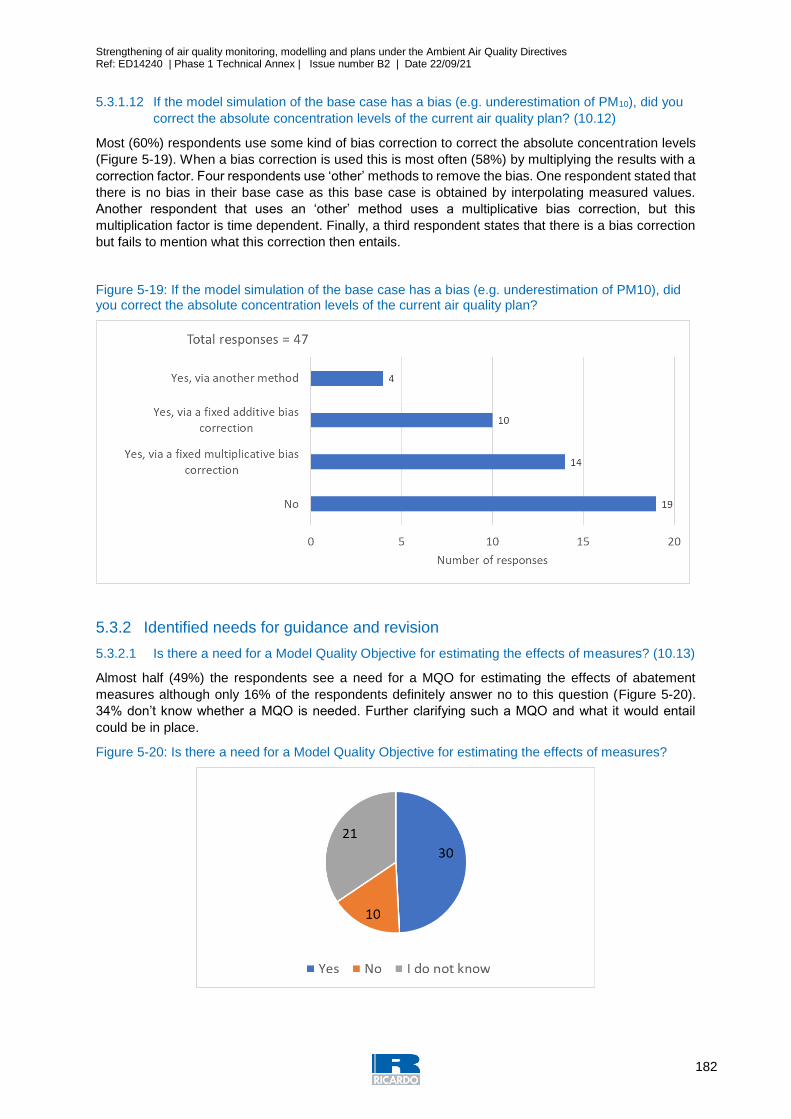
Strengthening of air quality monitoring, modelling and plans under the Ambient Air Quality Directives Ref: ED14240 | Phase 1 Technical Annex | Issue number B2 | Date 22/09/21
182
5.3.1.12 If the model simulation of the base case has a bias (e.g. underestimation of PM10), did you
correct the absolute concentration levels of the current air quality plan? (10.12)
Most (60%) respondents use some kind of bias correction to correct the absolute concentration levels
(Figure 5-19). When a bias correction is used this is most often (58%) by multiplying the results with a
correction factor. Four respondents use ‘other’ methods to remove the bias. One respondent stated that
there is no bias in their base case as this base case is obtained by interpolating measured values.
Another respondent that uses an ‘other’ method uses a multiplicative bias correction, but this
multiplication factor is time dependent. Finally, a third respondent states that there is a bias correction
but fails to mention what this correction then entails.
Figure 5-19: If the model simulation of the base case has a bias (e.g. underestimation of PM10), did you correct the absolute concentration levels of the current air quality plan?
5.3.2 Identified needs for guidance and revision
5.3.2.1 Is there a need for a Model Quality Objective for estimating the effects of measures? (10.13)
Almost half (49%) the respondents see a need for a MQO for estimating the effects of abatement
measures although only 16% of the respondents definitely answer no to this question (Figure 5-20).
34% don’t know whether a MQO is needed. Further clarifying such a MQO and what it would entail
could be in place.
Figure 5-20: Is there a need for a Model Quality Objective for estimating the effects of measures?
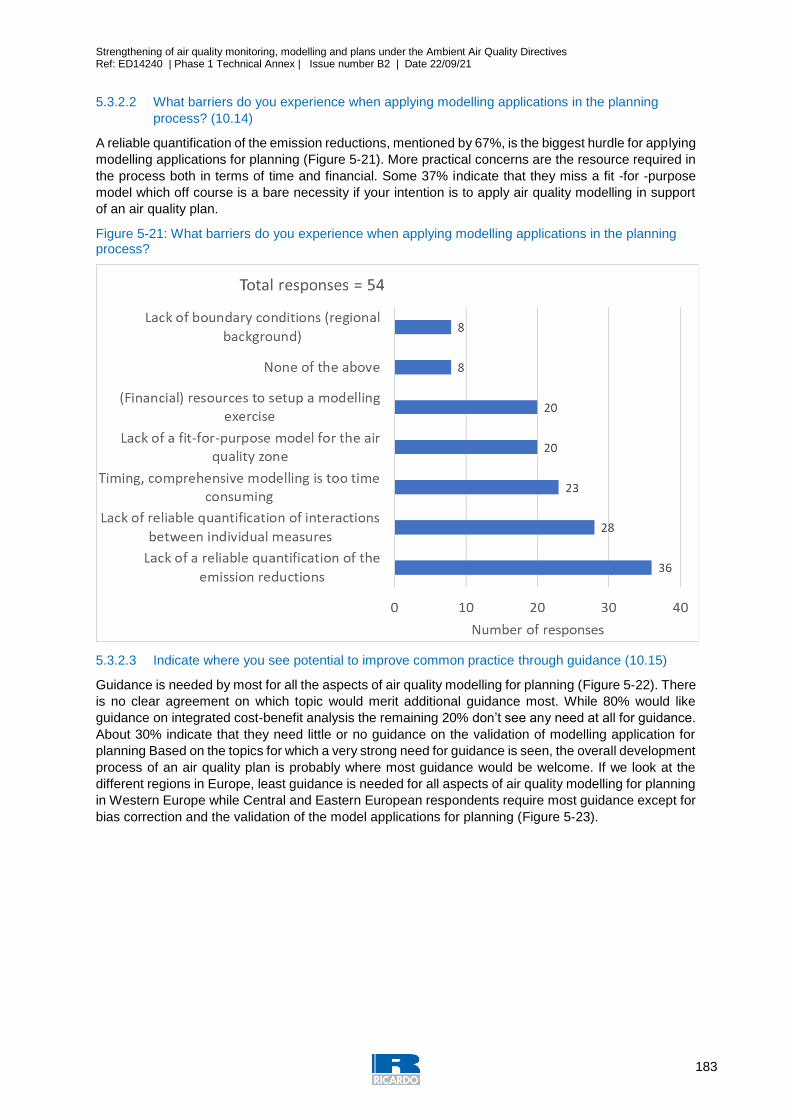
Strengthening of air quality monitoring, modelling and plans under the Ambient Air Quality Directives Ref: ED14240 | Phase 1 Technical Annex | Issue number B2 | Date 22/09/21
183
5.3.2.2 What barriers do you experience when applying modelling applications in the planning
process? (10.14)
A reliable quantification of the emission reductions, mentioned by 67%, is the biggest hurdle for applying
modelling applications for planning (Figure 5-21). More practical concerns are the resource required in
the process both in terms of time and financial. Some 37% indicate that they miss a fit -for -purpose
model which off course is a bare necessity if your intention is to apply air quality modelling in support
of an air quality plan.
Figure 5-21: What barriers do you experience when applying modelling applications in the planning process?
5.3.2.3 Indicate where you see potential to improve common practice through guidance (10.15)
Guidance is needed by most for all the aspects of air quality modelling for planning (Figure 5-22). There
is no clear agreement on which topic would merit additional guidance most. While 80% would like
guidance on integrated cost-benefit analysis the remaining 20% don’t see any need at all for guidance.
About 30% indicate that they need little or no guidance on the validation of modelling application for
planning Based on the topics for which a very strong need for guidance is seen, the overall development
process of an air quality plan is probably where most guidance would be welcome. If we look at the
different regions in Europe, least guidance is needed for all aspects of air quality modelling for planning
in Western Europe while Central and Eastern European respondents require most guidance except for
bias correction and the validation of the model applications for planning (Figure 5-23).
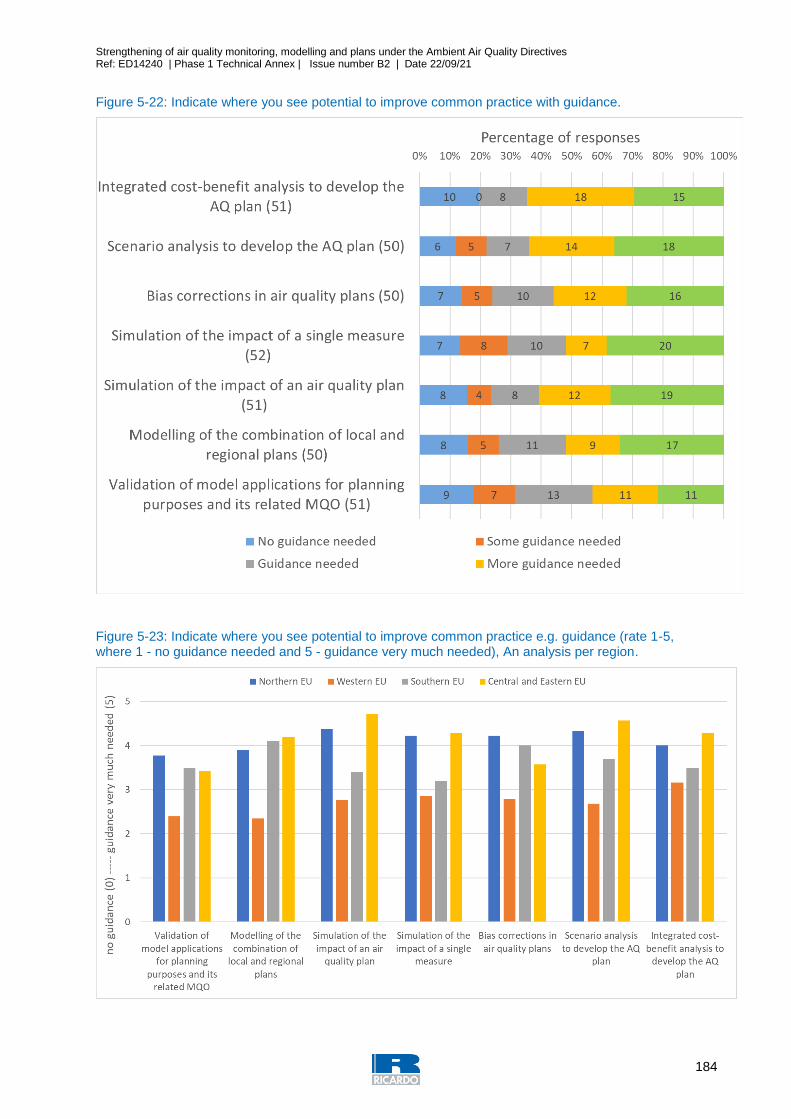
Strengthening of air quality monitoring, modelling and plans under the Ambient Air Quality Directives Ref: ED14240 | Phase 1 Technical Annex | Issue number B2 | Date 22/09/21
184
Figure 5-22: Indicate where you see potential to improve common practice with guidance.
Figure 5-23: Indicate where you see potential to improve common practice e.g. guidance (rate 1-5, where 1 - no guidance needed and 5 - guidance very much needed), An analysis per region.
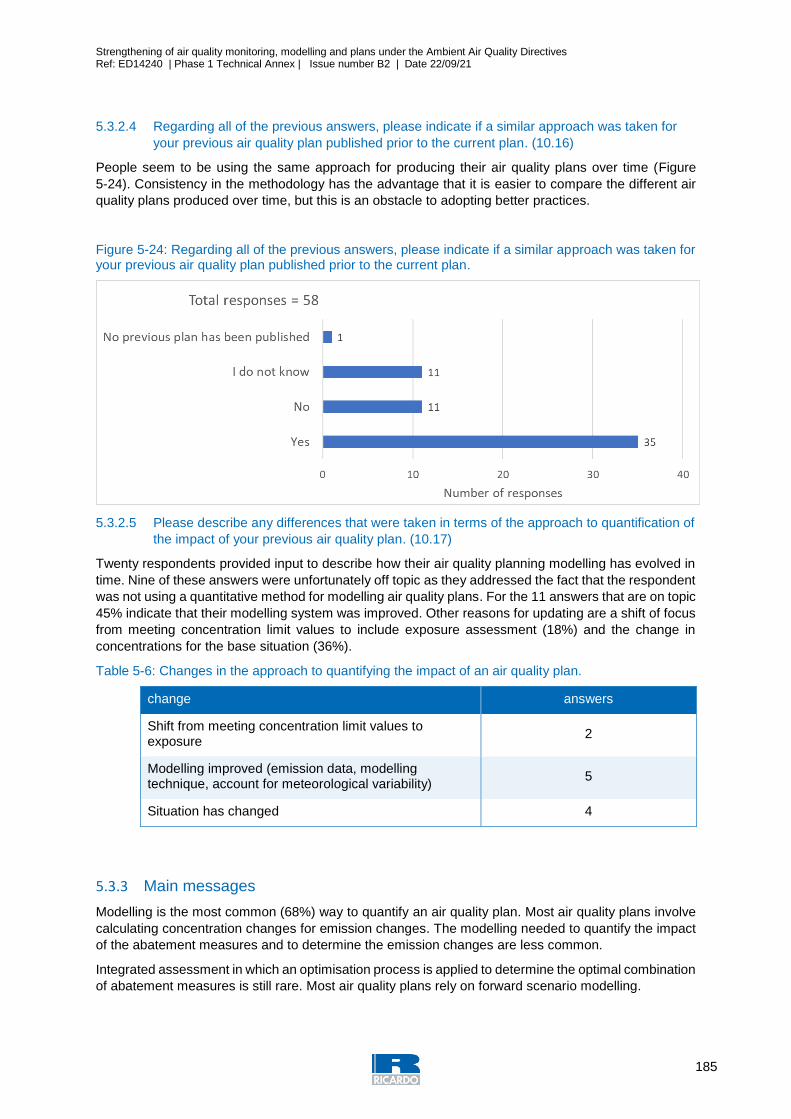
Strengthening of air quality monitoring, modelling and plans under the Ambient Air Quality Directives Ref: ED14240 | Phase 1 Technical Annex | Issue number B2 | Date 22/09/21
185
5.3.2.4 Regarding all of the previous answers, please indicate if a similar approach was taken for
your previous air quality plan published prior to the current plan. (10.16)
People seem to be using the same approach for producing their air quality plans over time (Figure
5-24). Consistency in the methodology has the advantage that it is easier to compare the different air
quality plans produced over time, but this is an obstacle to adopting better practices.
Figure 5-24: Regarding all of the previous answers, please indicate if a similar approach was taken for your previous air quality plan published prior to the current plan.
5.3.2.5 Please describe any differences that were taken in terms of the approach to quantification of
the impact of your previous air quality plan. (10.17)
Twenty respondents provided input to describe how their air quality planning modelling has evolved in
time. Nine of these answers were unfortunately off topic as they addressed the fact that the respondent
was not using a quantitative method for modelling air quality plans. For the 11 answers that are on topic
45% indicate that their modelling system was improved. Other reasons for updating are a shift of focus
from meeting concentration limit values to include exposure assessment (18%) and the change in
concentrations for the base situation (36%).
Table 5-6: Changes in the approach to quantifying the impact of an air quality plan.
change answers
Shift from meeting concentration limit values to exposure
2
Modelling improved (emission data, modelling technique, account for meteorological variability)
5
Situation has changed 4
5.3.3 Main messages
Modelling is the most common (68%) way to quantify an air quality plan. Most air quality plans involve
calculating concentration changes for emission changes. The modelling needed to quantify the impact
of the abatement measures and to determine the emission changes are less common.
Integrated assessment in which an optimisation process is applied to determine the optimal combination
of abatement measures is still rare. Most air quality plans rely on forward scenario modelling.

Strengthening of air quality monitoring, modelling and plans under the Ambient Air Quality Directives Ref: ED14240 | Phase 1 Technical Annex | Issue number B2 | Date 22/09/21
186
Most planning models are not validated and there is no MQO for planning. Validation of the modelling
in support of the air quality plan is often only done for the historic base year of the air quality plan and
not for the response of the model to emission changes. For the quality objective for modelling
applications in planning modus respondents only mention the application of the FAIRMODE MQO to
the historic base year.
Quantification of the emission reduction of measures is seen as the most important obstacle by 67% of
respondents. There is no clear agreement on which topic would merit additional guidance most: all the
aspects of air quality modelling for planning seem to require additional guidance.
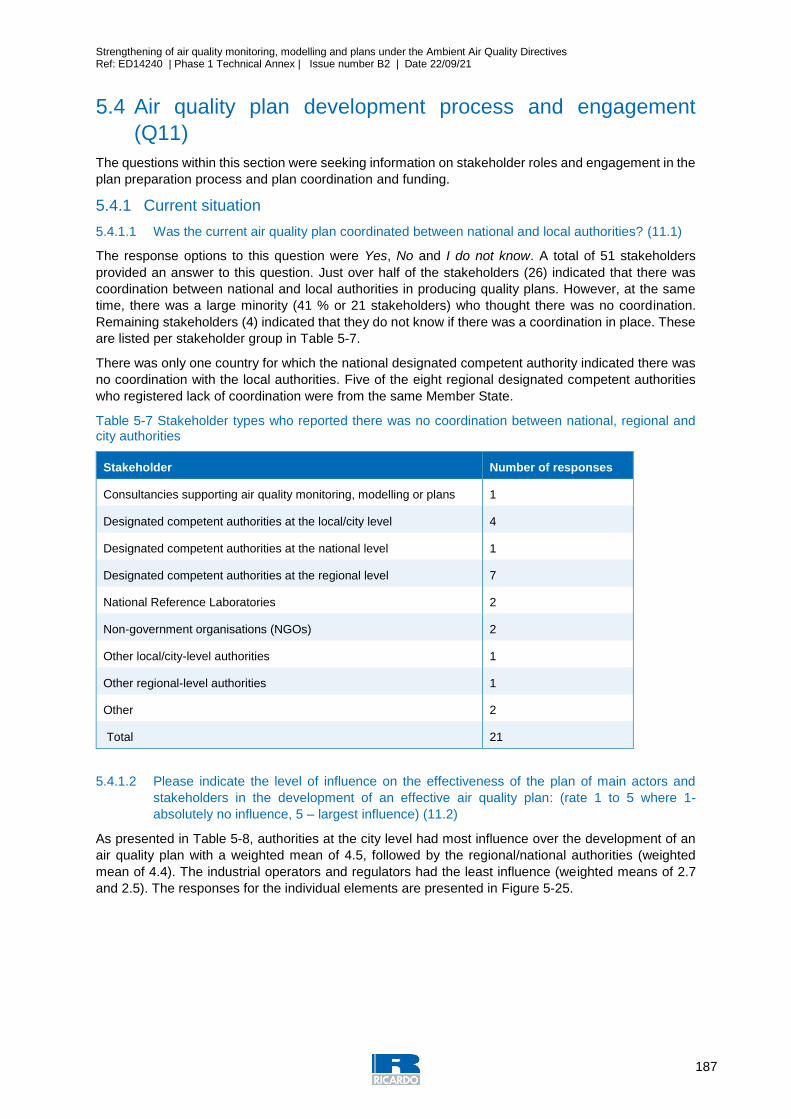
Strengthening of air quality monitoring, modelling and plans under the Ambient Air Quality Directives Ref: ED14240 | Phase 1 Technical Annex | Issue number B2 | Date 22/09/21
187
5.4 Air quality plan development process and engagement
(Q11)
The questions within this section were seeking information on stakeholder roles and engagement in the
plan preparation process and plan coordination and funding.
5.4.1 Current situation
5.4.1.1 Was the current air quality plan coordinated between national and local authorities? (11.1)
The response options to this question were Yes, No and I do not know. A total of 51 stakeholders
provided an answer to this question. Just over half of the stakeholders (26) indicated that there was
coordination between national and local authorities in producing quality plans. However, at the same
time, there was a large minority (41 % or 21 stakeholders) who thought there was no coordination.
Remaining stakeholders (4) indicated that they do not know if there was a coordination in place. These
are listed per stakeholder group in Table 5-7.
There was only one country for which the national designated competent authority indicated there was
no coordination with the local authorities. Five of the eight regional designated competent authorities
who registered lack of coordination were from the same Member State.
Table 5-7 Stakeholder types who reported there was no coordination between national, regional and city authorities
Stakeholder Number of responses
Consultancies supporting air quality monitoring, modelling or plans 1
Designated competent authorities at the local/city level 4
Designated competent authorities at the national level 1
Designated competent authorities at the regional level 7
National Reference Laboratories 2
Non-government organisations (NGOs) 2
Other local/city-level authorities 1
Other regional-level authorities 1
Other 2
Total 21
5.4.1.2 Please indicate the level of influence on the effectiveness of the plan of main actors and
stakeholders in the development of an effective air quality plan: (rate 1 to 5 where 1-
absolutely no influence, 5 – largest influence) (11.2)
As presented in Table 5-8, authorities at the city level had most influence over the development of an
air quality plan with a weighted mean of 4.5, followed by the regional/national authorities (weighted
mean of 4.4). The industrial operators and regulators had the least influence (weighted means of 2.7
and 2.5). The responses for the individual elements are presented in Figure 5-25.
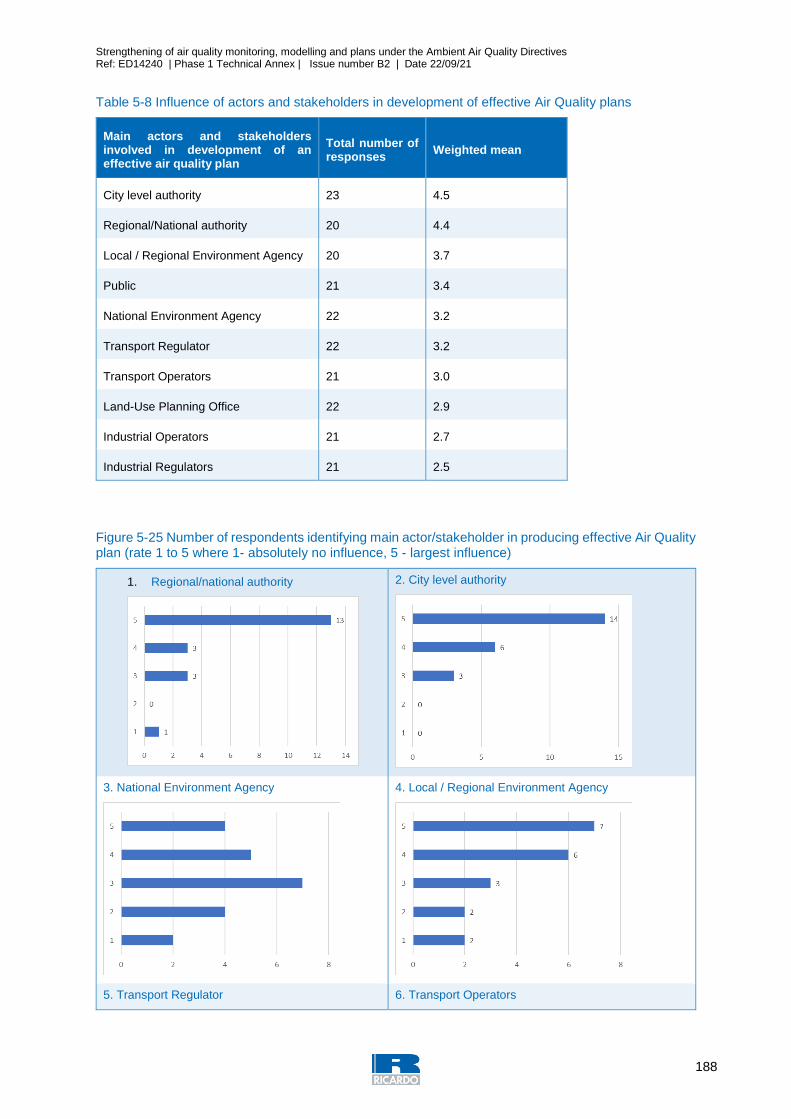
Strengthening of air quality monitoring, modelling and plans under the Ambient Air Quality Directives Ref: ED14240 | Phase 1 Technical Annex | Issue number B2 | Date 22/09/21
188
Table 5-8 Influence of actors and stakeholders in development of effective Air Quality plans
Main actors and stakeholders involved in development of an effective air quality plan
Total number of responses
Weighted mean
City level authority 23 4.5
Regional/National authority 20 4.4
Local / Regional Environment Agency 20 3.7
Public 21 3.4
National Environment Agency 22 3.2
Transport Regulator 22 3.2
Transport Operators 21 3.0
Land-Use Planning Office 22 2.9
Industrial Operators 21 2.7
Industrial Regulators 21 2.5
Figure 5-25 Number of respondents identifying main actor/stakeholder in producing effective Air Quality plan (rate 1 to 5 where 1- absolutely no influence, 5 - largest influence)
1. Regional/national authority
2. City level authority
3. National Environment Agency
4. Local / Regional Environment Agency
5. Transport Regulator 6. Transport Operators
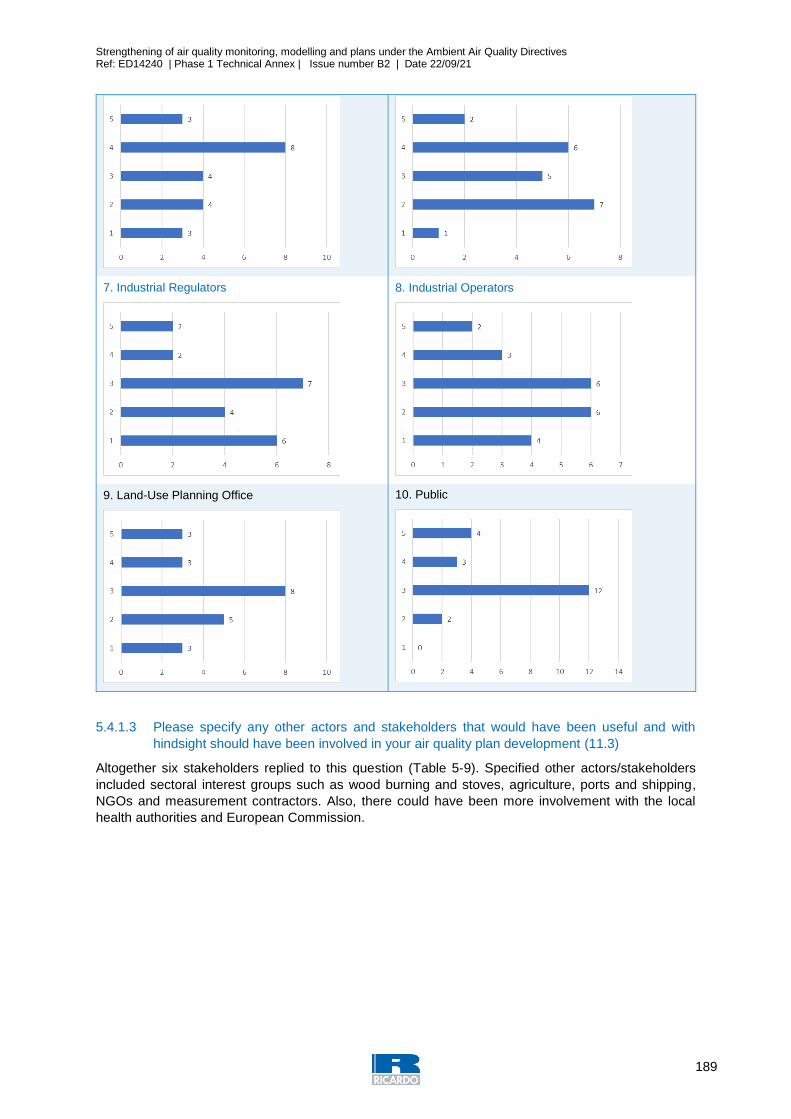
Strengthening of air quality monitoring, modelling and plans under the Ambient Air Quality Directives Ref: ED14240 | Phase 1 Technical Annex | Issue number B2 | Date 22/09/21
189
7. Industrial Regulators
8. Industrial Operators
9. Land-Use Planning Office
10. Public
5.4.1.3 Please specify any other actors and stakeholders that would have been useful and with
hindsight should have been involved in your air quality plan development (11.3)
Altogether six stakeholders replied to this question (Table 5-9). Specified other actors/stakeholders
included sectoral interest groups such as wood burning and stoves, agriculture, ports and shipping,
NGOs and measurement contractors. Also, there could have been more involvement with the local
health authorities and European Commission.
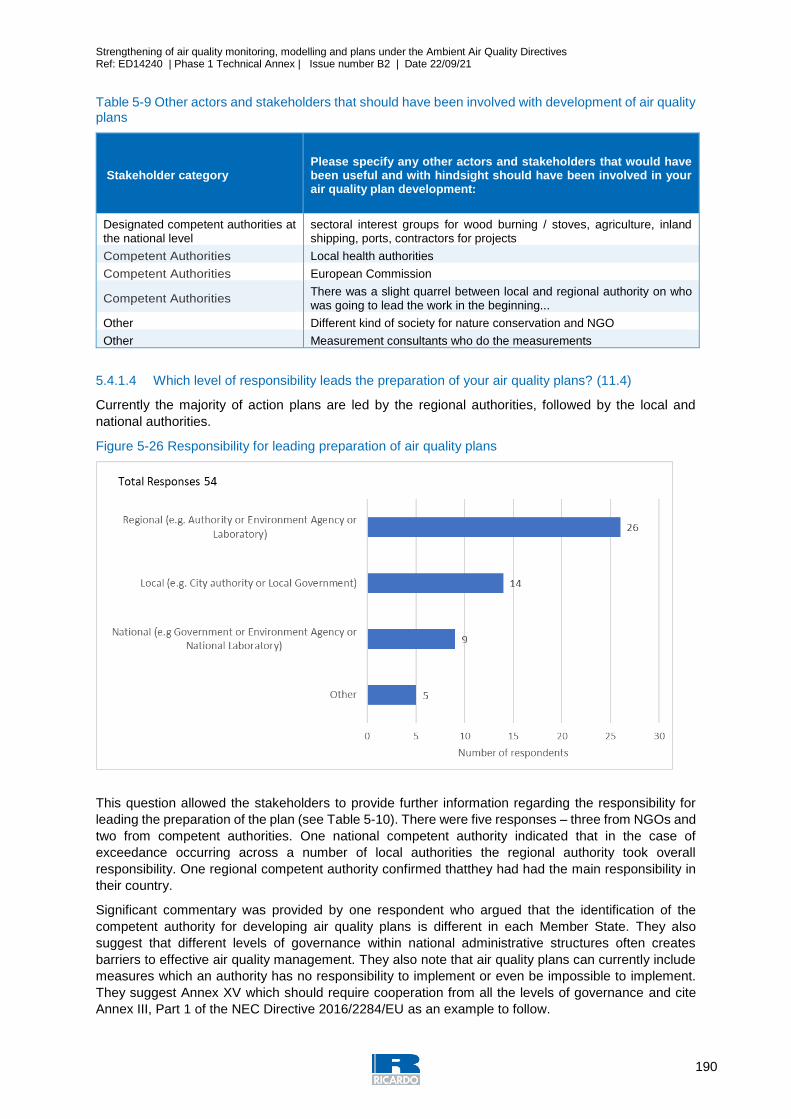
Strengthening of air quality monitoring, modelling and plans under the Ambient Air Quality Directives Ref: ED14240 | Phase 1 Technical Annex | Issue number B2 | Date 22/09/21
190
Table 5-9 Other actors and stakeholders that should have been involved with development of air quality plans
Stakeholder category Please specify any other actors and stakeholders that would have been useful and with hindsight should have been involved in your air quality plan development:
Designated competent authorities at the national level
sectoral interest groups for wood burning / stoves, agriculture, inland shipping, ports, contractors for projects
Competent Authorities Local health authorities
Competent Authorities European Commission
Competent Authorities There was a slight quarrel between local and regional authority on who was going to lead the work in the beginning...
Other Different kind of society for nature conservation and NGO
Other Measurement consultants who do the measurements
5.4.1.4 Which level of responsibility leads the preparation of your air quality plans? (11.4)
Currently the majority of action plans are led by the regional authorities, followed by the local and
national authorities.
Figure 5-26 Responsibility for leading preparation of air quality plans
This question allowed the stakeholders to provide further information regarding the responsibility for
leading the preparation of the plan (see Table 5-10). There were five responses – three from NGOs and
two from competent authorities. One national competent authority indicated that in the case of
exceedance occurring across a number of local authorities the regional authority took overall
responsibility. One regional competent authority confirmed thatthey had had the main responsibility in
their country.
Significant commentary was provided by one respondent who argued that the identification of the
competent authority for developing air quality plans is different in each Member State. They also
suggest that different levels of governance within national administrative structures often creates
barriers to effective air quality management. They also note that air quality plans can currently include
measures which an authority has no responsibility to implement or even be impossible to implement.
They suggest Annex XV which should require cooperation from all the levels of governance and cite
Annex III, Part 1 of the NEC Directive 2016/2284/EU as an example to follow.
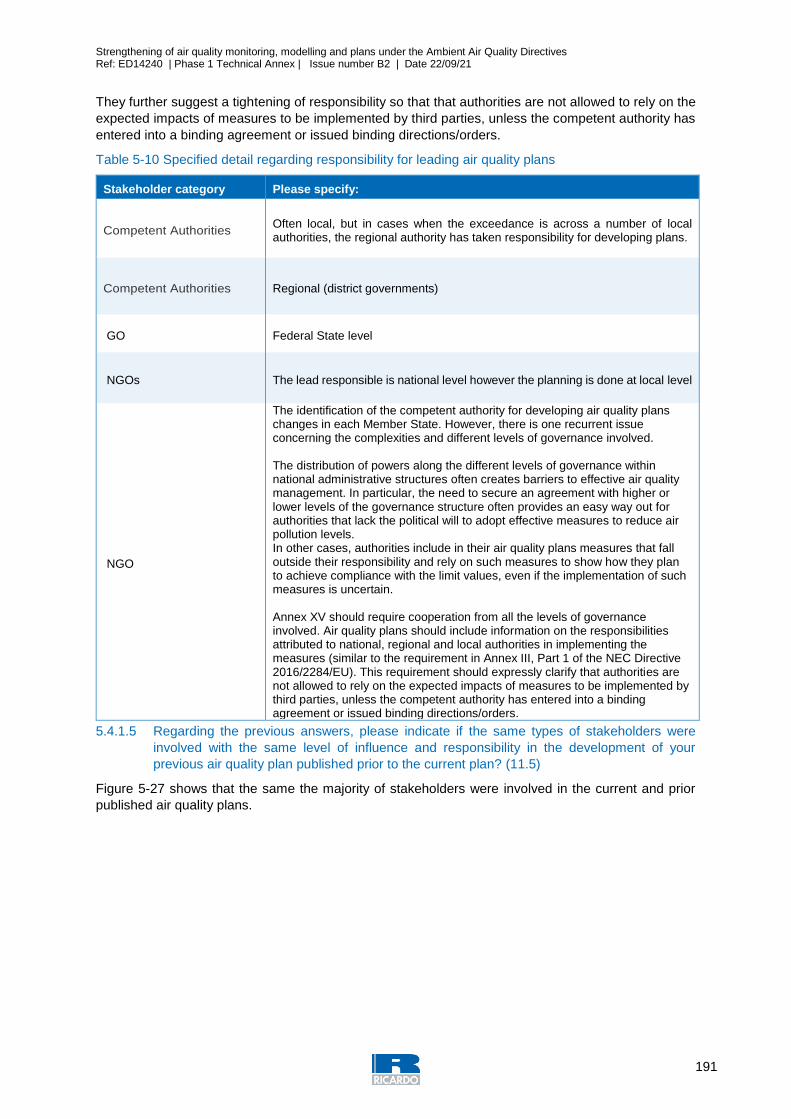
Strengthening of air quality monitoring, modelling and plans under the Ambient Air Quality Directives Ref: ED14240 | Phase 1 Technical Annex | Issue number B2 | Date 22/09/21
191
They further suggest a tightening of responsibility so that that authorities are not allowed to rely on the
expected impacts of measures to be implemented by third parties, unless the competent authority has
entered into a binding agreement or issued binding directions/orders.
Table 5-10 Specified detail regarding responsibility for leading air quality plans
Stakeholder category Please specify:
Competent Authorities Often local, but in cases when the exceedance is across a number of local authorities, the regional authority has taken responsibility for developing plans.
Competent Authorities Regional (district governments)
GO Federal State level
NGOs The lead responsible is national level however the planning is done at local level
NGO
The identification of the competent authority for developing air quality plans changes in each Member State. However, there is one recurrent issue concerning the complexities and different levels of governance involved. The distribution of powers along the different levels of governance within national administrative structures often creates barriers to effective air quality management. In particular, the need to secure an agreement with higher or lower levels of the governance structure often provides an easy way out for authorities that lack the political will to adopt effective measures to reduce air pollution levels. In other cases, authorities include in their air quality plans measures that fall outside their responsibility and rely on such measures to show how they plan to achieve compliance with the limit values, even if the implementation of such measures is uncertain. Annex XV should require cooperation from all the levels of governance involved. Air quality plans should include information on the responsibilities attributed to national, regional and local authorities in implementing the measures (similar to the requirement in Annex III, Part 1 of the NEC Directive 2016/2284/EU). This requirement should expressly clarify that authorities are not allowed to rely on the expected impacts of measures to be implemented by third parties, unless the competent authority has entered into a binding agreement or issued binding directions/orders.
5.4.1.5 Regarding the previous answers, please indicate if the same types of stakeholders were
involved with the same level of influence and responsibility in the development of your
previous air quality plan published prior to the current plan? (11.5)
Figure 5-27 shows that the same the majority of stakeholders were involved in the current and prior
published air quality plans.
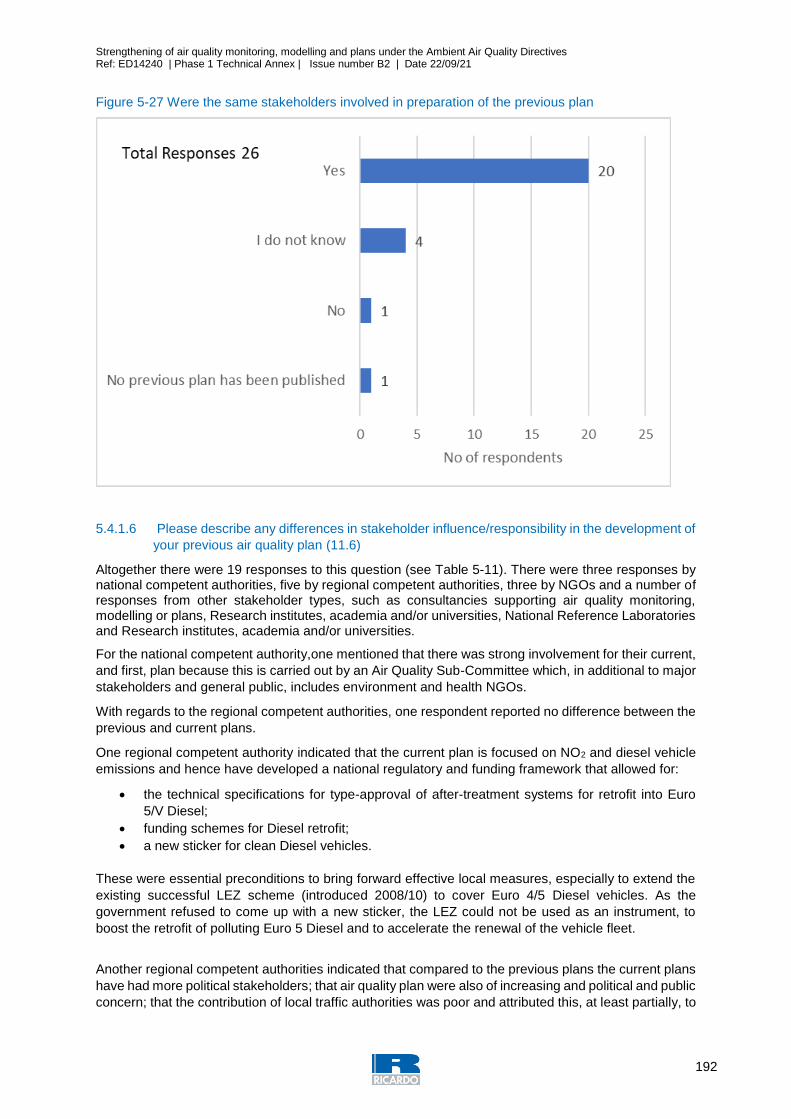
Strengthening of air quality monitoring, modelling and plans under the Ambient Air Quality Directives Ref: ED14240 | Phase 1 Technical Annex | Issue number B2 | Date 22/09/21
192
Figure 5-27 Were the same stakeholders involved in preparation of the previous plan
5.4.1.6 Please describe any differences in stakeholder influence/responsibility in the development of
your previous air quality plan (11.6)
Altogether there were 19 responses to this question (see Table 5-11). There were three responses by national competent authorities, five by regional competent authorities, three by NGOs and a number of responses from other stakeholder types, such as consultancies supporting air quality monitoring, modelling or plans, Research institutes, academia and/or universities, National Reference Laboratories and Research institutes, academia and/or universities.
For the national competent authority,one mentioned that there was strong involvement for their current,
and first, plan because this is carried out by an Air Quality Sub-Committee which, in additional to major
stakeholders and general public, includes environment and health NGOs.
With regards to the regional competent authorities, one respondent reported no difference between the
previous and current plans.
One regional competent authority indicated that the current plan is focused on NO2 and diesel vehicle
emissions and hence have developed a national regulatory and funding framework that allowed for:
the technical specifications for type-approval of after-treatment systems for retrofit into Euro
5/V Diesel;
funding schemes for Diesel retrofit;
a new sticker for clean Diesel vehicles.
These were essential preconditions to bring forward effective local measures, especially to extend the
existing successful LEZ scheme (introduced 2008/10) to cover Euro 4/5 Diesel vehicles. As the
government refused to come up with a new sticker, the LEZ could not be used as an instrument, to
boost the retrofit of polluting Euro 5 Diesel and to accelerate the renewal of the vehicle fleet.
Another regional competent authorities indicated that compared to the previous plans the current plans
have had more political stakeholders; that air quality plan were also of increasing and political and public
concern; that the contribution of local traffic authorities was poor and attributed this, at least partially, to
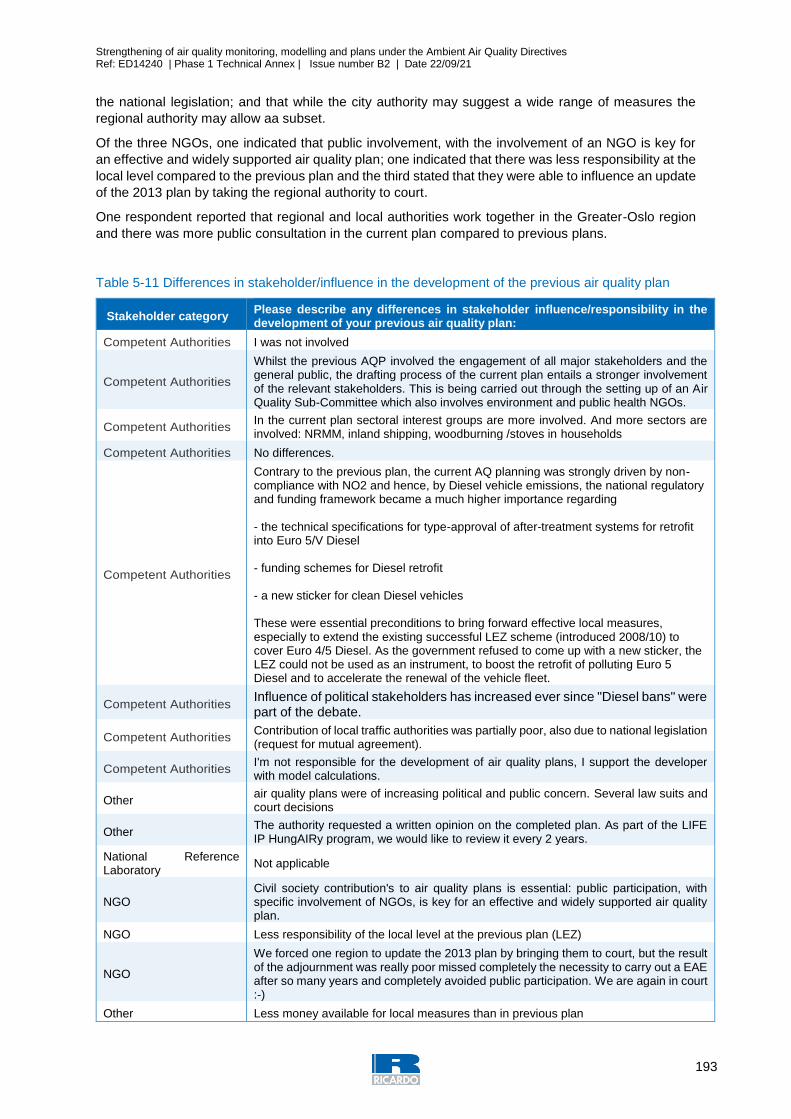
Strengthening of air quality monitoring, modelling and plans under the Ambient Air Quality Directives Ref: ED14240 | Phase 1 Technical Annex | Issue number B2 | Date 22/09/21
193
the national legislation; and that while the city authority may suggest a wide range of measures the
regional authority may allow aa subset.
Of the three NGOs, one indicated that public involvement, with the involvement of an NGO is key for
an effective and widely supported air quality plan; one indicated that there was less responsibility at the
local level compared to the previous plan and the third stated that they were able to influence an update
of the 2013 plan by taking the regional authority to court.
One respondent reported that regional and local authorities work together in the Greater-Oslo region
and there was more public consultation in the current plan compared to previous plans.
Table 5-11 Differences in stakeholder/influence in the development of the previous air quality plan
Stakeholder category Please describe any differences in stakeholder influence/responsibility in the development of your previous air quality plan:
Competent Authorities I was not involved
Competent Authorities
Whilst the previous AQP involved the engagement of all major stakeholders and the general public, the drafting process of the current plan entails a stronger involvement of the relevant stakeholders. This is being carried out through the setting up of an Air Quality Sub-Committee which also involves environment and public health NGOs.
Competent Authorities In the current plan sectoral interest groups are more involved. And more sectors are involved: NRMM, inland shipping, woodburning /stoves in households
Competent Authorities No differences.
Competent Authorities
Contrary to the previous plan, the current AQ planning was strongly driven by non-compliance with NO2 and hence, by Diesel vehicle emissions, the national regulatory and funding framework became a much higher importance regarding - the technical specifications for type-approval of after-treatment systems for retrofit into Euro 5/V Diesel - funding schemes for Diesel retrofit - a new sticker for clean Diesel vehicles These were essential preconditions to bring forward effective local measures, especially to extend the existing successful LEZ scheme (introduced 2008/10) to cover Euro 4/5 Diesel. As the government refused to come up with a new sticker, the LEZ could not be used as an instrument, to boost the retrofit of polluting Euro 5 Diesel and to accelerate the renewal of the vehicle fleet.
Competent Authorities Influence of political stakeholders has increased ever since "Diesel bans" were part of the debate.
Competent Authorities Contribution of local traffic authorities was partially poor, also due to national legislation (request for mutual agreement).
Competent Authorities I'm not responsible for the development of air quality plans, I support the developer with model calculations.
Other air quality plans were of increasing political and public concern. Several law suits and court decisions
Other The authority requested a written opinion on the completed plan. As part of the LIFE IP HungAIRy program, we would like to review it every 2 years.
National Reference Laboratory
Not applicable
NGO Civil society contribution's to air quality plans is essential: public participation, with specific involvement of NGOs, is key for an effective and widely supported air quality plan.
NGO Less responsibility of the local level at the previous plan (LEZ)
NGO
We forced one region to update the 2013 plan by bringing them to court, but the result of the adjournment was really poor missed completely the necessity to carry out a EAE after so many years and completely avoided public participation. We are again in court :-)
Other Less money available for local measures than in previous plan
Strengthening of air quality monitoring, modelling and plans under the Ambient Air Quality Directives Ref: ED14240 | Phase 1 Technical Annex | Issue number B2 | Date 22/09/21
194
Stakeholder category Please describe any differences in stakeholder influence/responsibility in the development of your previous air quality plan:
Other
Regional and local authorities worked together to define measures over the Greater-Oslo region, including the neighbouring municipalities Public consultations were also carried out to a larger degree than in previous planning rounds
Other Regions are in charge of AQ plans; central government (Min. Environment) coordinates
Other Nothing changed, only "cosmetic".
Not identified
The city authority delivers a high amount of measures, but has effectively no rights to put stricter measures in place, cause the higher authorities don't want them. So the city authority provides a wide range of measures The regional authority decides which they want to accept. Even higher authorities also defines how city authorities have to act or limit there right for actions
5.4.1.7 During the development of your current air quality plan, were the public, actors and/or
stakeholders consulted? (11.7)
For this question respondents were offered the options Yes or No. For the vast majority of plans
stakeholders (91%, 48) were consulted during development. Of the respondents 8% (5) who reported
stekeholders were not consulted. These were:
two NGOs;
one competent authority;
one city authority;
one National Reference Laboratory.
5.4.1.8 When did engagement and consultations with the public, actors and stakeholders take place
during the development of the current air quality plan? (11.8)
This question required the stakeholder to identify when engagement and consultation with development
of the air quality plan took place. Options provided were as follows with a Yes, No and I do not know
option for each:
At the outset of plan development
At the generation of a long list of measures to choose from to improve air quality
When there was a short list of measures from which to choose a preferred option/package of
measures
When the preferred option had been decided
The responses are presented in Figure 5-28. The majority of respondents indicated that stakeholders
were involved at each stage in the development of the current air quality plan with most engagement
looking to occur after the preferred option shad been decided.
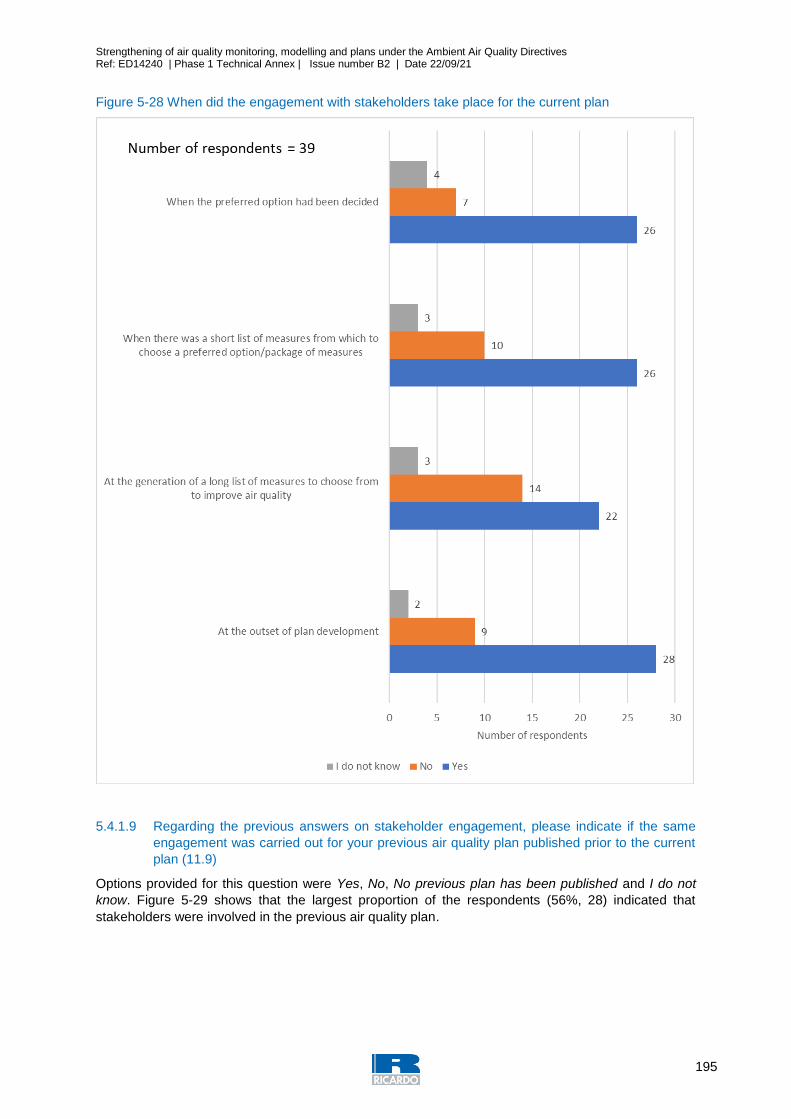
Strengthening of air quality monitoring, modelling and plans under the Ambient Air Quality Directives Ref: ED14240 | Phase 1 Technical Annex | Issue number B2 | Date 22/09/21
195
Figure 5-28 When did the engagement with stakeholders take place for the current plan
5.4.1.9 Regarding the previous answers on stakeholder engagement, please indicate if the same
engagement was carried out for your previous air quality plan published prior to the current
plan (11.9)
Options provided for this question were Yes, No, No previous plan has been published and I do not
know. Figure 5-29 shows that the largest proportion of the respondents (56%, 28) indicated that
stakeholders were involved in the previous air quality plan.
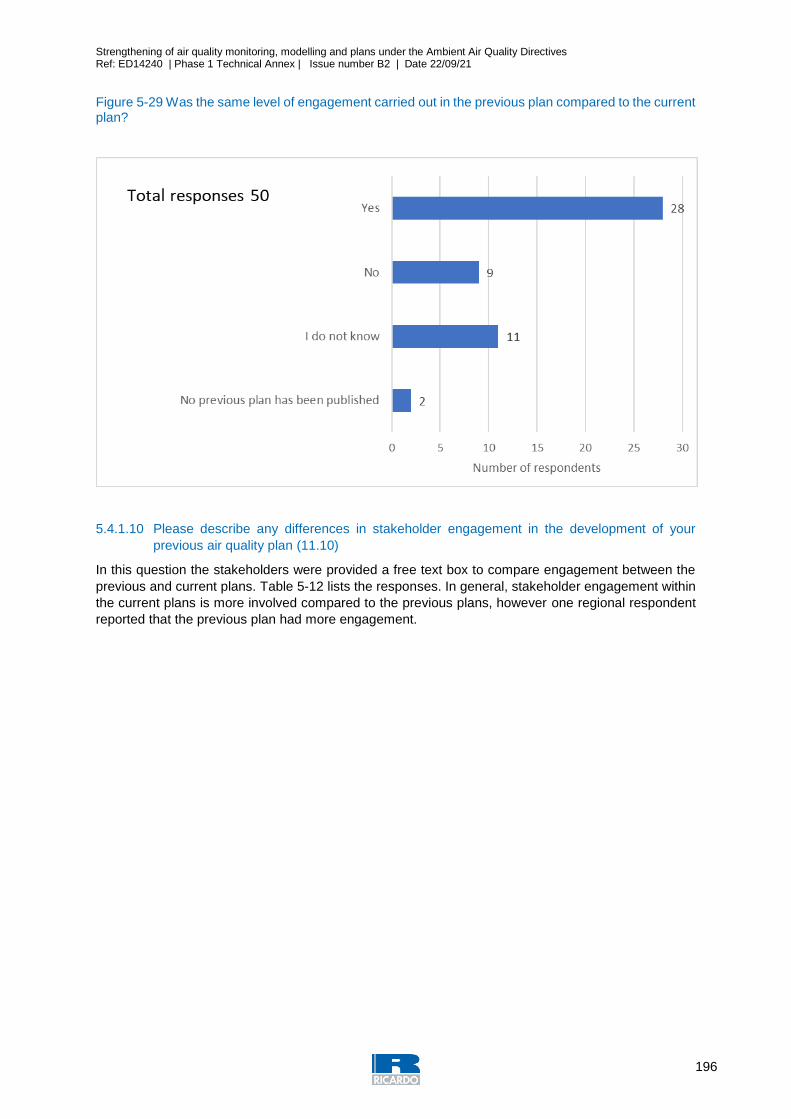
Strengthening of air quality monitoring, modelling and plans under the Ambient Air Quality Directives Ref: ED14240 | Phase 1 Technical Annex | Issue number B2 | Date 22/09/21
196
Figure 5-29 Was the same level of engagement carried out in the previous plan compared to the current plan?
5.4.1.10 Please describe any differences in stakeholder engagement in the development of your
previous air quality plan (11.10)
In this question the stakeholders were provided a free text box to compare engagement between the
previous and current plans. Table 5-12 lists the responses. In general, stakeholder engagement within
the current plans is more involved compared to the previous plans, however one regional respondent
reported that the previous plan had more engagement.
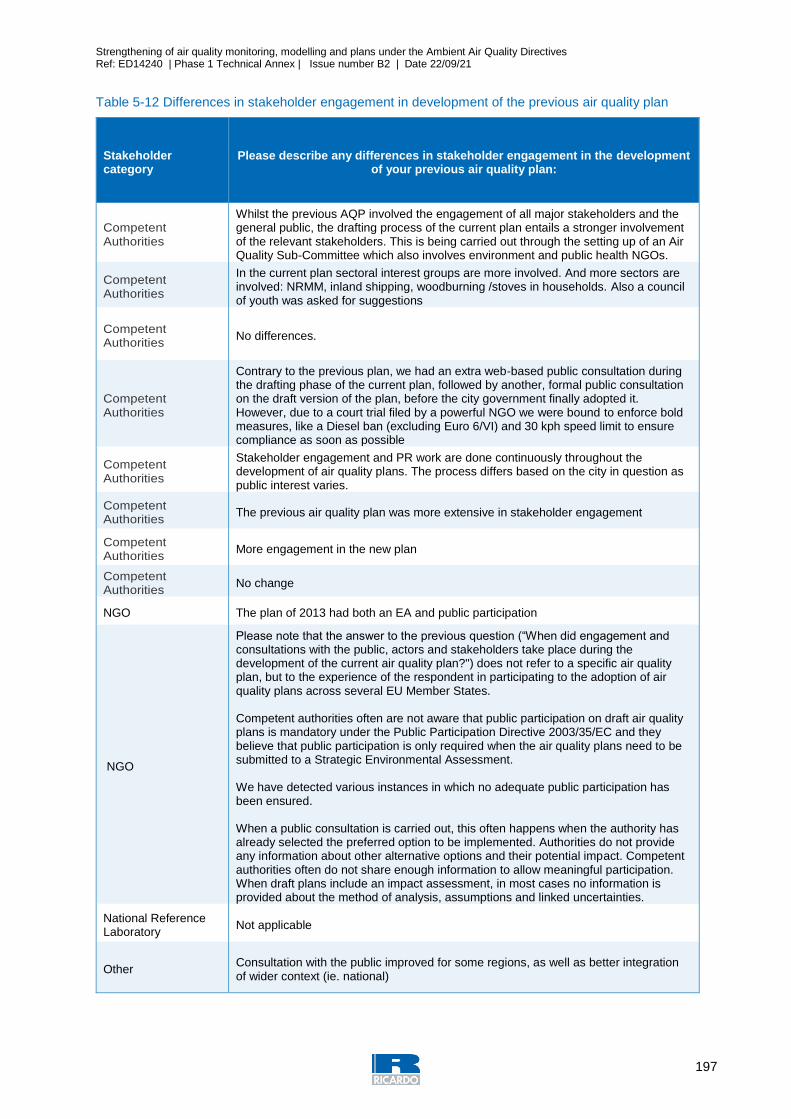
Strengthening of air quality monitoring, modelling and plans under the Ambient Air Quality Directives Ref: ED14240 | Phase 1 Technical Annex | Issue number B2 | Date 22/09/21
197
Table 5-12 Differences in stakeholder engagement in development of the previous air quality plan
Stakeholder category
Please describe any differences in stakeholder engagement in the development of your previous air quality plan:
Competent Authorities
Whilst the previous AQP involved the engagement of all major stakeholders and the general public, the drafting process of the current plan entails a stronger involvement of the relevant stakeholders. This is being carried out through the setting up of an Air Quality Sub-Committee which also involves environment and public health NGOs.
Competent Authorities
In the current plan sectoral interest groups are more involved. And more sectors are involved: NRMM, inland shipping, woodburning /stoves in households. Also a council of youth was asked for suggestions
Competent Authorities
No differences.
Competent Authorities
Contrary to the previous plan, we had an extra web-based public consultation during the drafting phase of the current plan, followed by another, formal public consultation on the draft version of the plan, before the city government finally adopted it. However, due to a court trial filed by a powerful NGO we were bound to enforce bold measures, like a Diesel ban (excluding Euro 6/VI) and 30 kph speed limit to ensure compliance as soon as possible
Competent Authorities
Stakeholder engagement and PR work are done continuously throughout the development of air quality plans. The process differs based on the city in question as public interest varies.
Competent Authorities
The previous air quality plan was more extensive in stakeholder engagement
Competent Authorities
More engagement in the new plan
Competent Authorities
No change
NGO The plan of 2013 had both an EA and public participation
NGO
Please note that the answer to the previous question (“When did engagement and consultations with the public, actors and stakeholders take place during the development of the current air quality plan?") does not refer to a specific air quality plan, but to the experience of the respondent in participating to the adoption of air quality plans across several EU Member States. Competent authorities often are not aware that public participation on draft air quality plans is mandatory under the Public Participation Directive 2003/35/EC and they believe that public participation is only required when the air quality plans need to be submitted to a Strategic Environmental Assessment. We have detected various instances in which no adequate public participation has been ensured. When a public consultation is carried out, this often happens when the authority has already selected the preferred option to be implemented. Authorities do not provide any information about other alternative options and their potential impact. Competent authorities often do not share enough information to allow meaningful participation. When draft plans include an impact assessment, in most cases no information is provided about the method of analysis, assumptions and linked uncertainties.
National Reference Laboratory
Not applicable
Other Consultation with the public improved for some regions, as well as better integration of wider context (ie. national)

Strengthening of air quality monitoring, modelling and plans under the Ambient Air Quality Directives Ref: ED14240 | Phase 1 Technical Annex | Issue number B2 | Date 22/09/21
198
Other Larger involvement of relevant stakeholders in the most recent plan, plus more focus on the communication of the results to the public all through the planning process
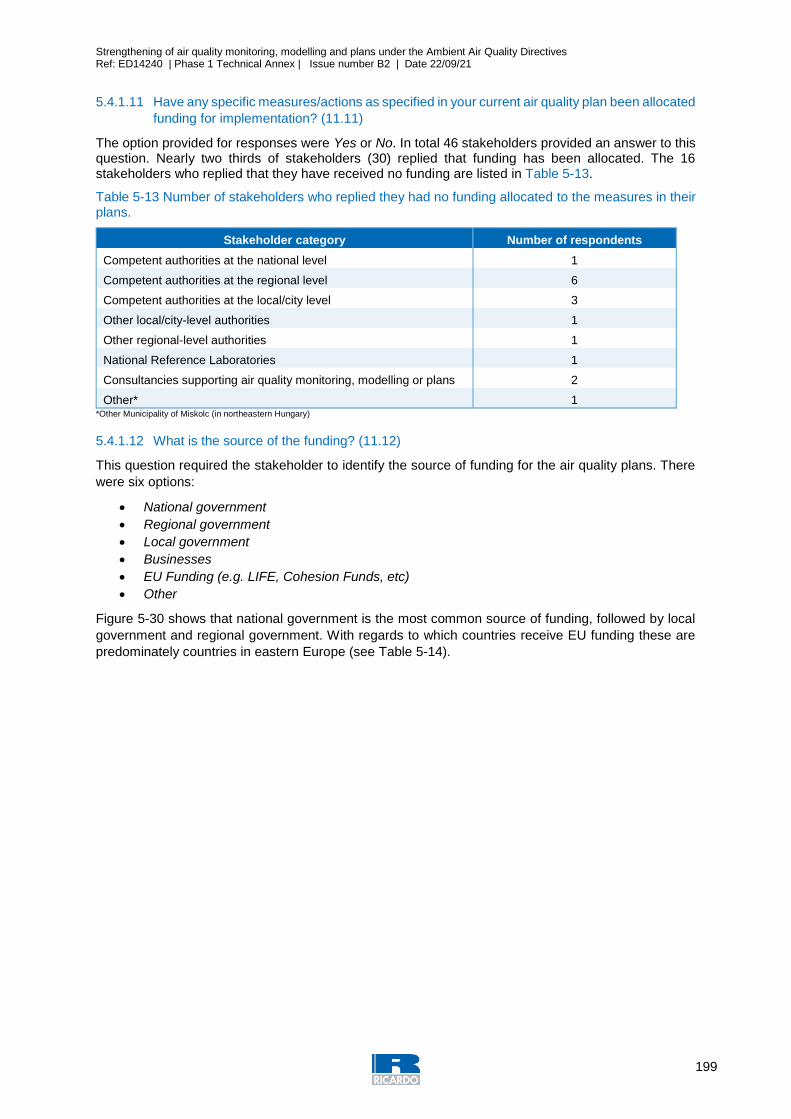
Strengthening of air quality monitoring, modelling and plans under the Ambient Air Quality Directives Ref: ED14240 | Phase 1 Technical Annex | Issue number B2 | Date 22/09/21
199
5.4.1.11 Have any specific measures/actions as specified in your current air quality plan been allocated
funding for implementation? (11.11)
The option provided for responses were Yes or No. In total 46 stakeholders provided an answer to this question. Nearly two thirds of stakeholders (30) replied that funding has been allocated. The 16 stakeholders who replied that they have received no funding are listed in Table 5-13.
Table 5-13 Number of stakeholders who replied they had no funding allocated to the measures in their plans.
Stakeholder category Number of respondents
Competent authorities at the national level 1
Competent authorities at the regional level 6
Competent authorities at the local/city level 3
Other local/city-level authorities 1
Other regional-level authorities 1
National Reference Laboratories 1
Consultancies supporting air quality monitoring, modelling or plans 2
Other* 1 *Other Municipality of Miskolc (in northeastern Hungary)
5.4.1.12 What is the source of the funding? (11.12)
This question required the stakeholder to identify the source of funding for the air quality plans. There
were six options:
National government
Regional government
Local government
Businesses
EU Funding (e.g. LIFE, Cohesion Funds, etc)
Other
Figure 5-30 shows that national government is the most common source of funding, followed by local
government and regional government. With regards to which countries receive EU funding these are
predominately countries in eastern Europe (see Table 5-14).
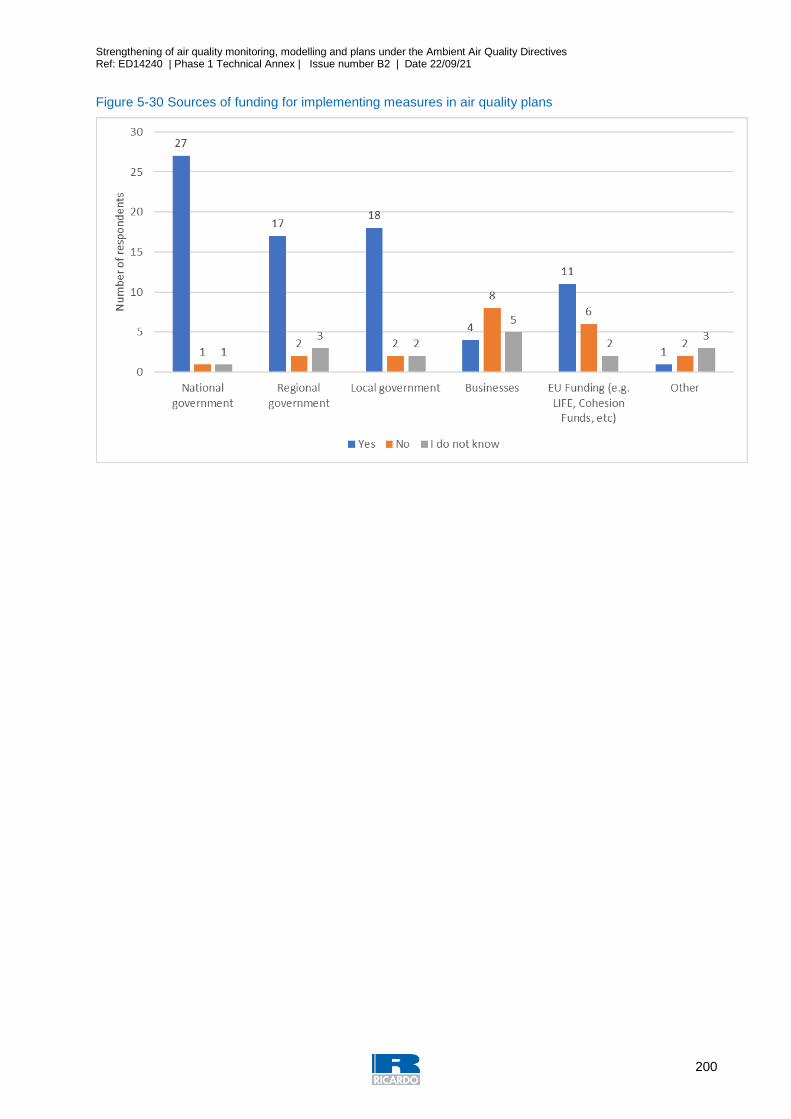
Strengthening of air quality monitoring, modelling and plans under the Ambient Air Quality Directives Ref: ED14240 | Phase 1 Technical Annex | Issue number B2 | Date 22/09/21
200
Figure 5-30 Sources of funding for implementing measures in air quality plans
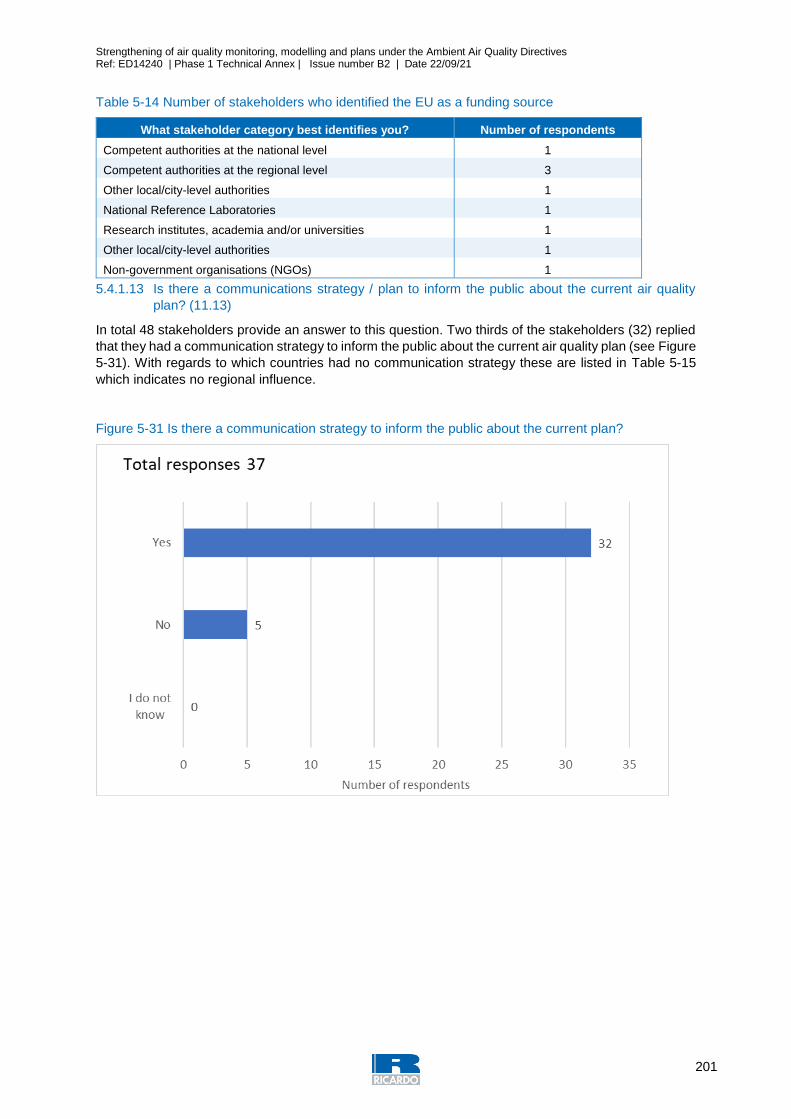
Strengthening of air quality monitoring, modelling and plans under the Ambient Air Quality Directives Ref: ED14240 | Phase 1 Technical Annex | Issue number B2 | Date 22/09/21
201
Table 5-14 Number of stakeholders who identified the EU as a funding source
What stakeholder category best identifies you? Number of respondents
Competent authorities at the national level 1
Competent authorities at the regional level 3
Other local/city-level authorities 1
National Reference Laboratories 1
Research institutes, academia and/or universities 1
Other local/city-level authorities 1
Non-government organisations (NGOs) 1
5.4.1.13 Is there a communications strategy / plan to inform the public about the current air quality
plan? (11.13)
In total 48 stakeholders provide an answer to this question. Two thirds of the stakeholders (32) replied
that they had a communication strategy to inform the public about the current air quality plan (see Figure
5-31). With regards to which countries had no communication strategy these are listed in Table 5-15
which indicates no regional influence.
Figure 5-31 Is there a communication strategy to inform the public about the current plan?
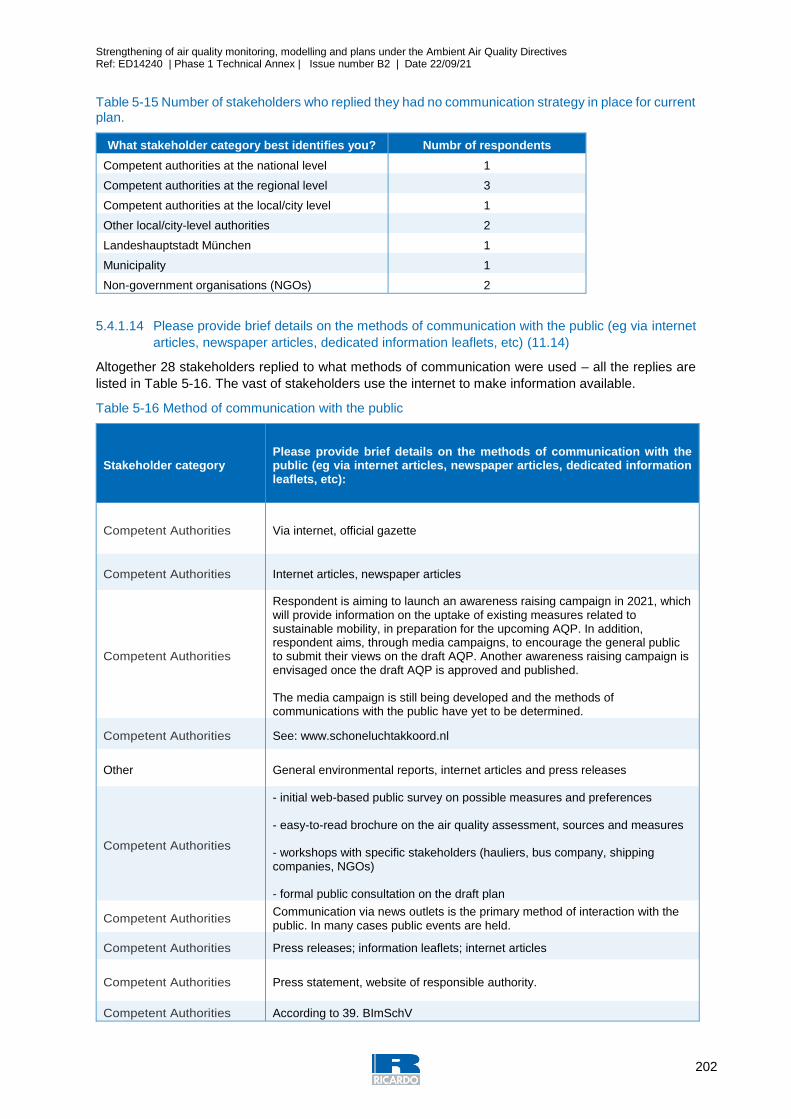
Strengthening of air quality monitoring, modelling and plans under the Ambient Air Quality Directives Ref: ED14240 | Phase 1 Technical Annex | Issue number B2 | Date 22/09/21
202
Table 5-15 Number of stakeholders who replied they had no communication strategy in place for current plan.
What stakeholder category best identifies you? Numbr of respondents
Competent authorities at the national level 1
Competent authorities at the regional level 3
Competent authorities at the local/city level 1
Other local/city-level authorities 2
Landeshauptstadt München 1
Municipality 1
Non-government organisations (NGOs) 2
5.4.1.14 Please provide brief details on the methods of communication with the public (eg via internet
articles, newspaper articles, dedicated information leaflets, etc) (11.14)
Altogether 28 stakeholders replied to what methods of communication were used – all the replies are
listed in Table 5-16. The vast of stakeholders use the internet to make information available.
Table 5-16 Method of communication with the public
Stakeholder category Please provide brief details on the methods of communication with the public (eg via internet articles, newspaper articles, dedicated information leaflets, etc):
Competent Authorities Via internet, official gazette
Competent Authorities Internet articles, newspaper articles
Competent Authorities
Respondent is aiming to launch an awareness raising campaign in 2021, which will provide information on the uptake of existing measures related to sustainable mobility, in preparation for the upcoming AQP. In addition, respondent aims, through media campaigns, to encourage the general public to submit their views on the draft AQP. Another awareness raising campaign is envisaged once the draft AQP is approved and published. The media campaign is still being developed and the methods of communications with the public have yet to be determined.
Competent Authorities See: www.schoneluchtakkoord.nl
Other General environmental reports, internet articles and press releases
Competent Authorities
- initial web-based public survey on possible measures and preferences - easy-to-read brochure on the air quality assessment, sources and measures - workshops with specific stakeholders (hauliers, bus company, shipping companies, NGOs) - formal public consultation on the draft plan
Competent Authorities Communication via news outlets is the primary method of interaction with the public. In many cases public events are held.
Competent Authorities Press releases; information leaflets; internet articles
Competent Authorities Press statement, website of responsible authority.
Competent Authorities According to 39. BImSchV
Strengthening of air quality monitoring, modelling and plans under the Ambient Air Quality Directives Ref: ED14240 | Phase 1 Technical Annex | Issue number B2 | Date 22/09/21
203
Stakeholder category Please provide brief details on the methods of communication with the public (eg via internet articles, newspaper articles, dedicated information leaflets, etc):
Competent Authorities Internet, press release
Competent Authorities Website, press conferences, reports
Competent Authorities Website, press conferences, reports
Competent Authorities
One of the main measures in the AQP is a development of the network of so-called Eco-managers in the municipalities of the Region. Their main role is to implement the AQP and educate local society - also about the measures to be introduced as a part of local provisions and the AQP. Local authorities of the region are also obliged to conduct 2 local information campaigns per year on the provisions aiming to the replacement of insufficient solid fuels boilers and on available public subsidies for residents. Furthermore the Region conducts an ongoing campaign on the taken measures and existing regulations through internet articles, regional campaigns, information leaflets, dedicated website and the actions taken under the LIFE Integrated Project.
Other Dedicated information leaflets and internet (https://www.lansstyrelsen.se/vastra-gotaland/miljo-och-vatten/miljoovervakning/miljokvalitetsnormer-for-luft.html)
Competent Authorities vVa internet articles, newspaper articles, dedicated information leaflets,
Competent Authorities Local government website
Competent Authorities SITE
Competent Authorities Website set up describing the program, information leaflets, newspaper articles, information through city level authorities social media channels etc.
Other
During the implementation of the plan, each year the persons responsible for the measures were asked - what was done, how much financial resources were spent, a report was prepared and published on the website of the department.
National Reference Laboratory
All levels of government discuss and publish next step in plans
Other
Press conferences, press releases, televison programs and interviews, newspaper articles, open access to technical reports, decidacated webpages and internet articles - There was larger focus on communication in the current AQ plans that in the previous round
Other Internet
Other Full reports and synthetic reports available on institutional websites, plus newspaper articles
Other Mostly internet and newspapers.
Other Internet and media publications
Other Press releases; information leaflets; internet articles
5.4.1.15 Regarding the previous answers on communication, please indicate if a communication
strategy was carried out for your previous air quality plan published prior to the current plan
(11.15)
A total of 45 stakeholders provided an answer to this question. Nearly two thirds of the stakeholders
registered that there was also a communication strategy in place for the previous plan (see Figure 5-32).
With regards to which countries had no communication strategy in place for the previous plan these are
listed in Error! Reference source not found..
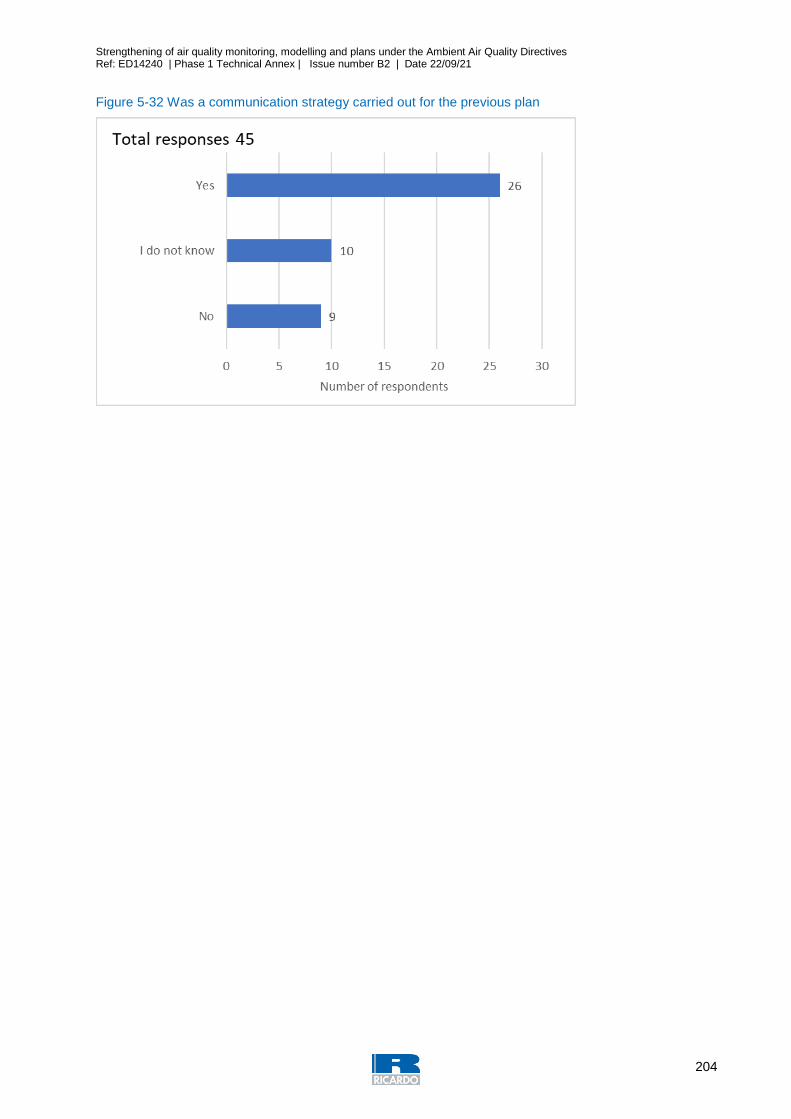
Strengthening of air quality monitoring, modelling and plans under the Ambient Air Quality Directives Ref: ED14240 | Phase 1 Technical Annex | Issue number B2 | Date 22/09/21
204
Figure 5-32 Was a communication strategy carried out for the previous plan

Strengthening of air quality monitoring, modelling and plans under the Ambient Air Quality Directives Ref: ED14240 | Phase 1 Technical Annex | Issue number B2 | Date 22/09/21
205
5.4.2 Identified needs for guidance and revision
5.4.2.1 Are there any changes that could be made to the AAQD that would facilitate the development
and implementation of air quality plans? (11.16)
This question requested a response of Yes, No or I do not know plus they were asked to specify the
changes in a free text box. All together 48 stakeholders responded to this question. Just over half of the
stakeholders (26) responded Yes that changes were needed to facilitate development and
implementation of air quality plans (see Figure 5-33). The individual improvements suggested are listed
in
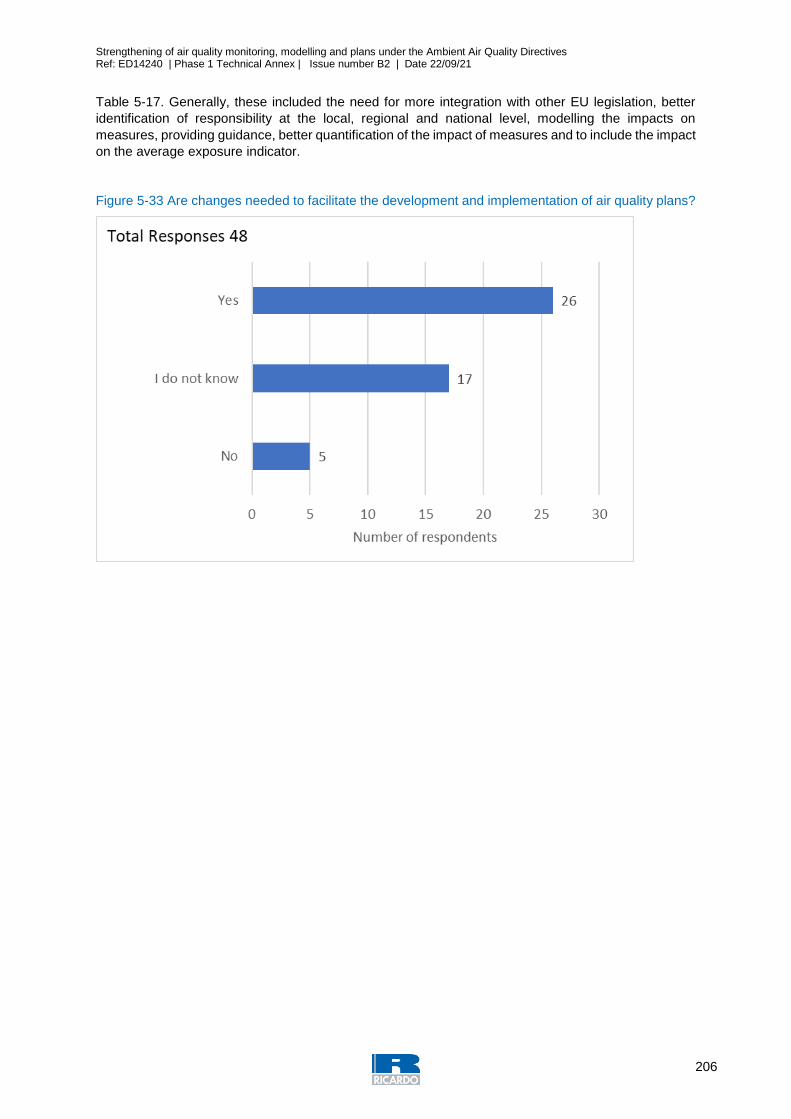
Strengthening of air quality monitoring, modelling and plans under the Ambient Air Quality Directives Ref: ED14240 | Phase 1 Technical Annex | Issue number B2 | Date 22/09/21
206
Table 5-17. Generally, these included the need for more integration with other EU legislation, better
identification of responsibility at the local, regional and national level, modelling the impacts on
measures, providing guidance, better quantification of the impact of measures and to include the impact
on the average exposure indicator.
Figure 5-33 Are changes needed to facilitate the development and implementation of air quality plans?
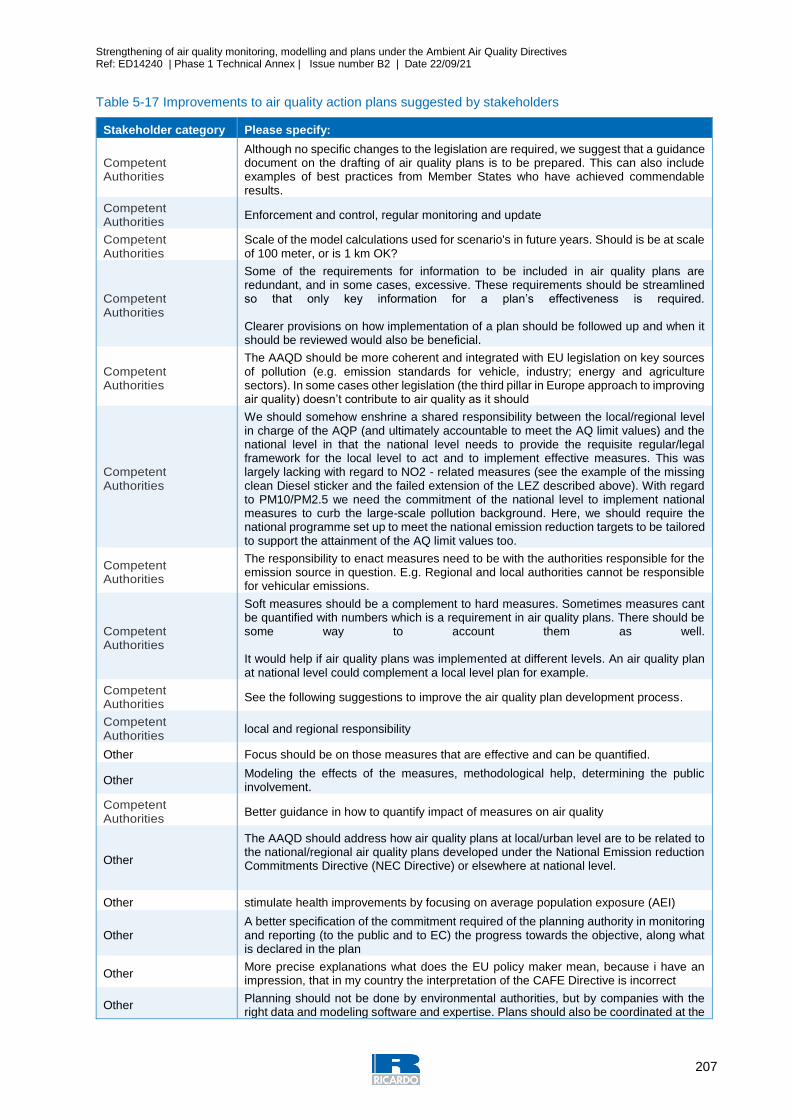
Strengthening of air quality monitoring, modelling and plans under the Ambient Air Quality Directives Ref: ED14240 | Phase 1 Technical Annex | Issue number B2 | Date 22/09/21
207
Table 5-17 Improvements to air quality action plans suggested by stakeholders
Stakeholder category Please specify:
Competent Authorities
Although no specific changes to the legislation are required, we suggest that a guidance document on the drafting of air quality plans is to be prepared. This can also include examples of best practices from Member States who have achieved commendable results.
Competent Authorities
Enforcement and control, regular monitoring and update
Competent Authorities
Scale of the model calculations used for scenario's in future years. Should is be at scale of 100 meter, or is 1 km OK?
Competent Authorities
Some of the requirements for information to be included in air quality plans are redundant, and in some cases, excessive. These requirements should be streamlined so that only key information for a plan’s effectiveness is required. Clearer provisions on how implementation of a plan should be followed up and when it should be reviewed would also be beneficial.
Competent Authorities
The AAQD should be more coherent and integrated with EU legislation on key sources of pollution (e.g. emission standards for vehicle, industry; energy and agriculture sectors). In some cases other legislation (the third pillar in Europe approach to improving air quality) doesn’t contribute to air quality as it should
Competent Authorities
We should somehow enshrine a shared responsibility between the local/regional level in charge of the AQP (and ultimately accountable to meet the AQ limit values) and the national level in that the national level needs to provide the requisite regular/legal framework for the local level to act and to implement effective measures. This was largely lacking with regard to NO2 - related measures (see the example of the missing clean Diesel sticker and the failed extension of the LEZ described above). With regard to PM10/PM2.5 we need the commitment of the national level to implement national measures to curb the large-scale pollution background. Here, we should require the national programme set up to meet the national emission reduction targets to be tailored to support the attainment of the AQ limit values too.
Competent Authorities
The responsibility to enact measures need to be with the authorities responsible for the emission source in question. E.g. Regional and local authorities cannot be responsible for vehicular emissions.
Competent Authorities
Soft measures should be a complement to hard measures. Sometimes measures cant be quantified with numbers which is a requirement in air quality plans. There should be some way to account them as well. It would help if air quality plans was implemented at different levels. An air quality plan at national level could complement a local level plan for example.
Competent Authorities
See the following suggestions to improve the air quality plan development process.
Competent Authorities
local and regional responsibility
Other Focus should be on those measures that are effective and can be quantified.
Other Modeling the effects of the measures, methodological help, determining the public involvement.
Competent Authorities
Better guidance in how to quantify impact of measures on air quality
Other
The AAQD should address how air quality plans at local/urban level are to be related to the national/regional air quality plans developed under the National Emission reduction Commitments Directive (NEC Directive) or elsewhere at national level.
Other stimulate health improvements by focusing on average population exposure (AEI)
Other A better specification of the commitment required of the planning authority in monitoring and reporting (to the public and to EC) the progress towards the objective, along what is declared in the plan
Other More precise explanations what does the EU policy maker mean, because i have an impression, that in my country the interpretation of the CAFE Directive is incorrect
Other Planning should not be done by environmental authorities, but by companies with the right data and modeling software and expertise. Plans should also be coordinated at the
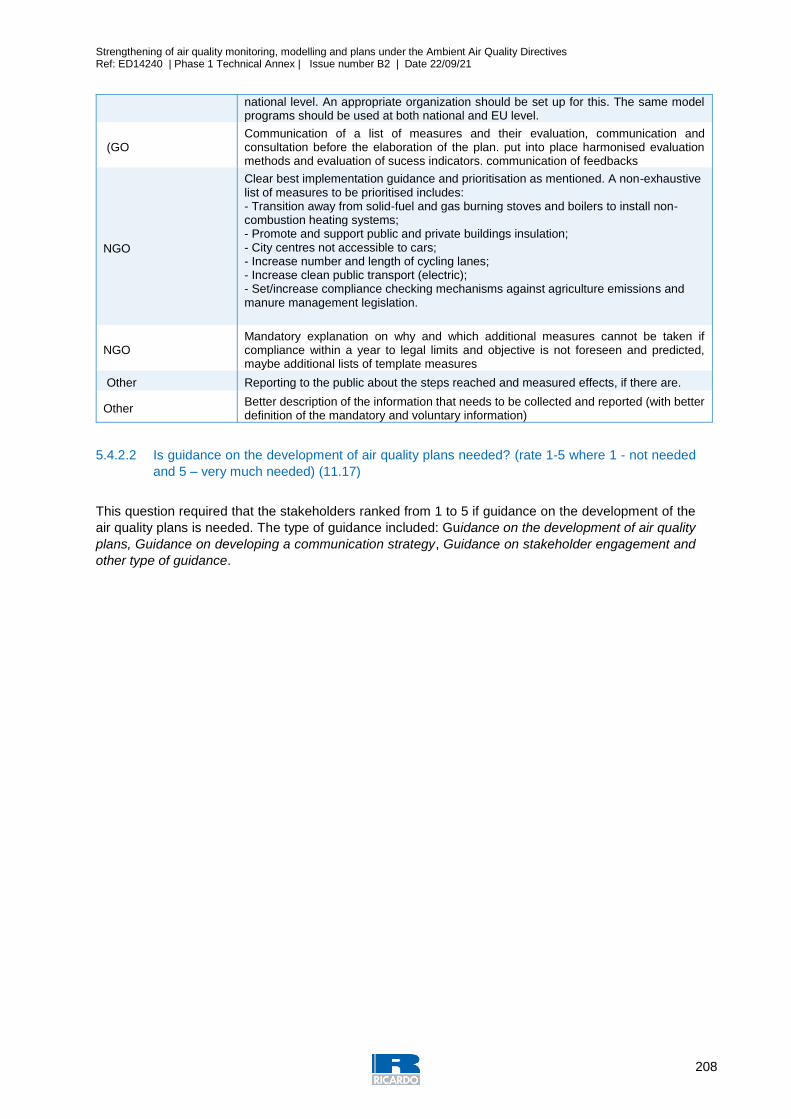
Strengthening of air quality monitoring, modelling and plans under the Ambient Air Quality Directives Ref: ED14240 | Phase 1 Technical Annex | Issue number B2 | Date 22/09/21
208
national level. An appropriate organization should be set up for this. The same model programs should be used at both national and EU level.
(GO Communication of a list of measures and their evaluation, communication and consultation before the elaboration of the plan. put into place harmonised evaluation methods and evaluation of sucess indicators. communication of feedbacks
NGO
Clear best implementation guidance and prioritisation as mentioned. A non-exhaustive list of measures to be prioritised includes: - Transition away from solid-fuel and gas burning stoves and boilers to install non-combustion heating systems; - Promote and support public and private buildings insulation; - City centres not accessible to cars; - Increase number and length of cycling lanes; - Increase clean public transport (electric); - Set/increase compliance checking mechanisms against agriculture emissions and manure management legislation.
NGO Mandatory explanation on why and which additional measures cannot be taken if compliance within a year to legal limits and objective is not foreseen and predicted, maybe additional lists of template measures
Other Reporting to the public about the steps reached and measured effects, if there are.
Other Better description of the information that needs to be collected and reported (with better definition of the mandatory and voluntary information)
5.4.2.2 Is guidance on the development of air quality plans needed? (rate 1-5 where 1 - not needed
and 5 – very much needed) (11.17)
This question required that the stakeholders ranked from 1 to 5 if guidance on the development of the
air quality plans is needed. The type of guidance included: Guidance on the development of air quality
plans, Guidance on developing a communication strategy, Guidance on stakeholder engagement and
other type of guidance.

Strengthening of air quality monitoring, modelling and plans under the Ambient Air Quality Directives Ref: ED14240 | Phase 1 Technical Annex | Issue number B2 | Date 22/09/21
209
Figure 5-34 shows that Guidance on development air quality plans is by far the most needed type of
guidance with 20 of the 32 respondents providing the highest score of 5.
In terms of the average responses Table 5-18 shows that guidance on stakeholder engagement and
other guidance documents were ranked more highly than developing a communication strategy.
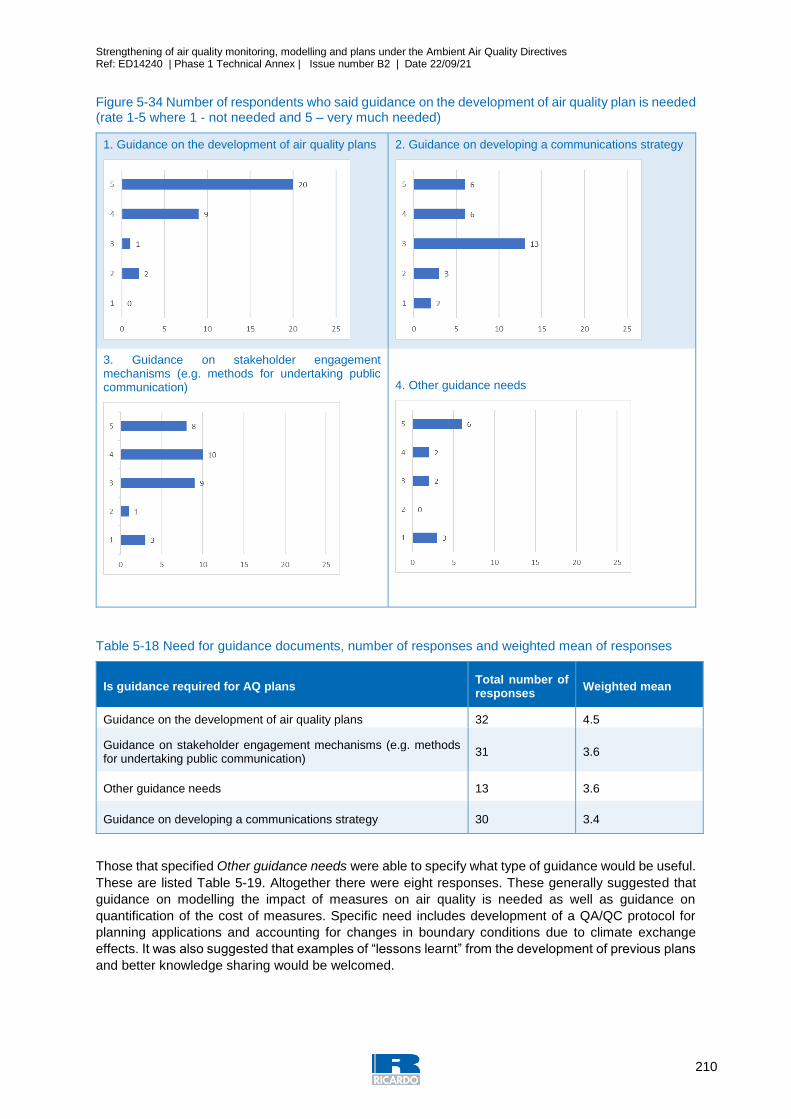
Strengthening of air quality monitoring, modelling and plans under the Ambient Air Quality Directives Ref: ED14240 | Phase 1 Technical Annex | Issue number B2 | Date 22/09/21
210
Figure 5-34 Number of respondents who said guidance on the development of air quality plan is needed (rate 1-5 where 1 - not needed and 5 – very much needed)
1. Guidance on the development of air quality plans
2. Guidance on developing a communications strategy
3. Guidance on stakeholder engagement mechanisms (e.g. methods for undertaking public communication)
4. Other guidance needs
Table 5-18 Need for guidance documents, number of responses and weighted mean of responses
Is guidance required for AQ plans Total number of responses
Weighted mean
Guidance on the development of air quality plans 32 4.5
Guidance on stakeholder engagement mechanisms (e.g. methods for undertaking public communication)
31 3.6
Other guidance needs 13 3.6
Guidance on developing a communications strategy 30 3.4
Those that specified Other guidance needs were able to specify what type of guidance would be useful.
These are listed Table 5-19. Altogether there were eight responses. These generally suggested that
guidance on modelling the impact of measures on air quality is needed as well as guidance on
quantification of the cost of measures. Specific need includes development of a QA/QC protocol for
planning applications and accounting for changes in boundary conditions due to climate exchange
effects. It was also suggested that examples of “lessons learnt” from the development of previous plans
and better knowledge sharing would be welcomed.
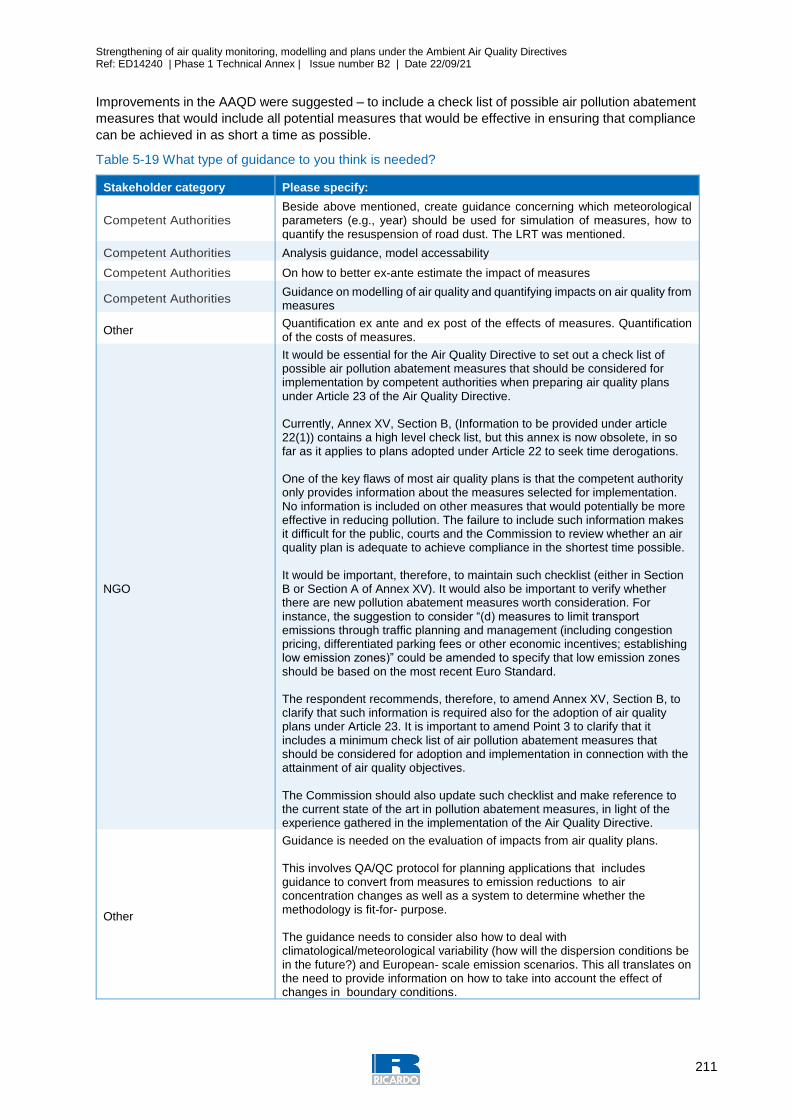
Strengthening of air quality monitoring, modelling and plans under the Ambient Air Quality Directives Ref: ED14240 | Phase 1 Technical Annex | Issue number B2 | Date 22/09/21
211
Improvements in the AAQD were suggested – to include a check list of possible air pollution abatement
measures that would include all potential measures that would be effective in ensuring that compliance
can be achieved in as short a time as possible.
Table 5-19 What type of guidance to you think is needed?
Stakeholder category Please specify:
Competent Authorities Beside above mentioned, create guidance concerning which meteorological parameters (e.g., year) should be used for simulation of measures, how to quantify the resuspension of road dust. The LRT was mentioned.
Competent Authorities Analysis guidance, model accessability
Competent Authorities On how to better ex-ante estimate the impact of measures
Competent Authorities Guidance on modelling of air quality and quantifying impacts on air quality from measures
Other Quantification ex ante and ex post of the effects of measures. Quantification of the costs of measures.
NGO
It would be essential for the Air Quality Directive to set out a check list of possible air pollution abatement measures that should be considered for implementation by competent authorities when preparing air quality plans under Article 23 of the Air Quality Directive. Currently, Annex XV, Section B, (Information to be provided under article 22(1)) contains a high level check list, but this annex is now obsolete, in so far as it applies to plans adopted under Article 22 to seek time derogations. One of the key flaws of most air quality plans is that the competent authority only provides information about the measures selected for implementation. No information is included on other measures that would potentially be more effective in reducing pollution. The failure to include such information makes it difficult for the public, courts and the Commission to review whether an air quality plan is adequate to achieve compliance in the shortest time possible. It would be important, therefore, to maintain such checklist (either in Section B or Section A of Annex XV). It would also be important to verify whether there are new pollution abatement measures worth consideration. For instance, the suggestion to consider “(d) measures to limit transport emissions through traffic planning and management (including congestion pricing, differentiated parking fees or other economic incentives; establishing low emission zones)” could be amended to specify that low emission zones should be based on the most recent Euro Standard. The respondent recommends, therefore, to amend Annex XV, Section B, to clarify that such information is required also for the adoption of air quality plans under Article 23. It is important to amend Point 3 to clarify that it includes a minimum check list of air pollution abatement measures that should be considered for adoption and implementation in connection with the attainment of air quality objectives. The Commission should also update such checklist and make reference to the current state of the art in pollution abatement measures, in light of the experience gathered in the implementation of the Air Quality Directive.
Other
Guidance is needed on the evaluation of impacts from air quality plans. This involves QA/QC protocol for planning applications that includes guidance to convert from measures to emission reductions to air concentration changes as well as a system to determine whether the methodology is fit-for- purpose. The guidance needs to consider also how to deal with climatological/meteorological variability (how will the dispersion conditions be in the future?) and European- scale emission scenarios. This all translates on the need to provide information on how to take into account the effect of changes in boundary conditions.
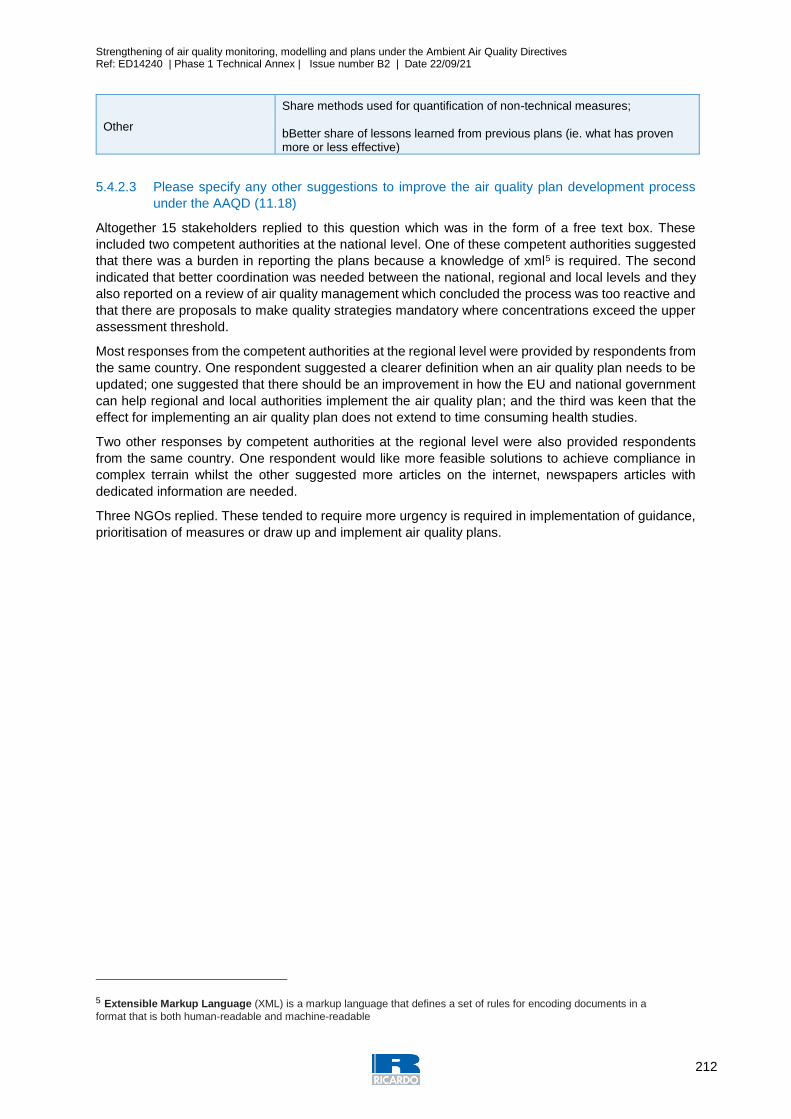
Strengthening of air quality monitoring, modelling and plans under the Ambient Air Quality Directives Ref: ED14240 | Phase 1 Technical Annex | Issue number B2 | Date 22/09/21
212
Other
Share methods used for quantification of non-technical measures; bBetter share of lessons learned from previous plans (ie. what has proven more or less effective)
5.4.2.3 Please specify any other suggestions to improve the air quality plan development process
under the AAQD (11.18)
Altogether 15 stakeholders replied to this question which was in the form of a free text box. These
included two competent authorities at the national level. One of these competent authorities suggested
that there was a burden in reporting the plans because a knowledge of xml5 is required. The second
indicated that better coordination was needed between the national, regional and local levels and they
also reported on a review of air quality management which concluded the process was too reactive and
that there are proposals to make quality strategies mandatory where concentrations exceed the upper
assessment threshold.
Most responses from the competent authorities at the regional level were provided by respondents from
the same country. One respondent suggested a clearer definition when an air quality plan needs to be
updated; one suggested that there should be an improvement in how the EU and national government
can help regional and local authorities implement the air quality plan; and the third was keen that the
effect for implementing an air quality plan does not extend to time consuming health studies.
Two other responses by competent authorities at the regional level were also provided respondents
from the same country. One respondent would like more feasible solutions to achieve compliance in
complex terrain whilst the other suggested more articles on the internet, newspapers articles with
dedicated information are needed.
Three NGOs replied. These tended to require more urgency is required in implementation of guidance,
prioritisation of measures or draw up and implement air quality plans.
5 Extensible Markup Language (XML) is a markup language that defines a set of rules for encoding documents in a
format that is both human-readable and machine-readable

Strengthening of air quality monitoring, modelling and plans under the Ambient Air Quality Directives Ref: ED14240 | Phase 1 Technical Annex | Issue number B2 | Date 22/09/21
213
Table 5-20 Other suggestions to improve the air quality plan development process under the AQDD
Stakeholder category
Please specify any other suggestions to improve the air quality plan development process under the AAQD:
Competent Authorities
Good tool like Papers, so even people that don't know xml can report the plan
Competent Authorities
A mechanism to ensure better cooperation between national, regional and local authorities would be beneficial. This has previously been identified as a significant problem in many different countries. There is also scope to strengthen the focus on exposure reduction approaches in action planning and also to strengthen links to the National Air Pollution Control Programmes required under the NEC directive. Best-practice guidance regarding issues of governance and coordination of action plans could also be very useful. A recent review of air quality management in our country identified the need to ensure a more pro-active management of air quality. Air quality management in accordance to the air quality directive is primarily reactive, whereby action plans are to be produced following an observed exceedance. Since the limit values are not to be exceeded, the focus of action plans therefore needs to be on more short-term and drastic measures to reduce concentrations as quickly as possible. A more pro-active, long-term approach to introducing measures to improve air quality is, however, likely to be more cost-effective. Article 12 of the directive does state that Member States shall maintain the levels of those pollutants below the limit values and shall endeavour to preserve the best ambient air quality, compatible with sustainable development. However, there are no formal requirements or guidance on how this is to be achieved. The review of the national system for air quality management resulted in a proposal to make the development of long-term air quality strategies mandatory where concentrations exceed the upper assessment threshold. This proposal has not yet been implemented but is currently under consideration by the National Government. The proposal is similar to the approach taken in Norway, where the requirement for developing an action plan is triggered by exceedances of the upper assessment thresholds rather than the limit values. Similar approaches could be appropriate for inclusion in any future revision of the air quality directive in order to formalise the requirements in article 12.
Competent Authorities
Suggesting additional feasible solutions to comply with air quality standards in critical meteorological and geographical areas (e.g. Po Valley)
Competent Authorities
We should have a clearer definition when an AQP needs to be updated
Competent Authorities
Legislative anchoring of permanent large scale measures with the responsible authorities on EU and national level help with the implementation of air quality plans in regards to local and regional nuances.
Competent Authorities
Articles on the Internet, newspaper articles, dedicated information brochures, public meetings
Competent Authorities
Air quality plan should be only limited to lager relevant exceedance situations and not for single local restricted hot spots like section of a single road < 100 m => simplification required; reduce effort for elaborating analysis of situation should be limited only on essential but no addition of time consuming health studies.
Other In a few years there will be no need of further air quality plans focusing on exceedance situations. Additional plans focusing on the health of the general public with regular update would be an asset. Similar to environmental noise mapping.
NGO The European Commission should immediately adopt implementing acts based on Article 28 of Directive 2008/50 to provide additional guidance on air quality plans, monitoring and modelling.
NGO Prioritisation of measures as requirements for AQ plans such as those mentioned above.
NGO
One recurrent issue relates to the time taken by competent authorities to draw up air quality plans. Drafting and adoption can in some cases take several years, frustrating the urgency required by Article 23, in order to ensure attainment of the limit values in the shortest time possible. Respondent recommends to amend Annex XV of the Directive to clarify that air quality
Strengthening of air quality monitoring, modelling and plans under the Ambient Air Quality Directives Ref: ED14240 | Phase 1 Technical Annex | Issue number B2 | Date 22/09/21
214
plans are an emergency tool to address serious hazards to public health. Procedures to draw up and update air quality plans should last the shortest time possible and, in no case, more than 12 months.
Other Provide a shared and periodically updated EU-wide air quality expected scenario based on projected activities pathways and national measures
Other
The biggest problem of AQP is development of measures and how should they be translated into ecological effect. It is easy to translate "hard measures" into impact on AQ, but what about measures such as changing of peoples habits, or growth of biologically active surface or other? I think that in AQD it should be quite clear, that AQP should have local character, ant it should be developed on local level (area of exceedance), but should also take into account information from regional to national level (change in the background). As I said earlier I think that in my country the interpretation of the CAFE Directive according AQP is incorrect.
Other A comprehensive QA/QC protocol for planning applications would be useful.
Other Support is welcome, but no strict rules
Strengthening of air quality monitoring, modelling and plans under the Ambient Air Quality Directives Ref: ED14240 | Phase 1 Technical Annex | Issue number B2 | Date 22/09/21
215
5.4.3 Main messages
This section summarises the main messages and lessons learnt plus identifies recommendations for
the technical revisions in Task 4.
Just over half of the stakeholders indicated that there was coordination between national and local
authorities in producing air quality plans, however, there was a large minority (41 %) who thought there
was a lack of coordination.
In terms of actors and stakeholders involved in the development of effective plans, the regional or
national authorities and city level authorities were considered to be the main actors influencing the
effectiveness of the plan. The public were seen to be relative more important actors compared to
transport and industrial regulators and operators.
In most countries, the regional authorities lead the majority of work on the preparation of the air quality
plans. In the case of Sweden, the regional authority takes overall responsibilities when exceedance
occurs over multiple local authority areas.
Most respondents (91%) indicated that stakeholders were involved in the production of the current plan.
Generally, it was indicated that there is more engagement with the production of the current plan than
the previous plan. Overall, the highest engagement was indicated at the outset of plan development
and once the preferred measures have been chosen.
A third of stakeholders indicated that there was no funding allocated to support their plans. The
remaining stakeholders stated that the national government is typically the main source of funding.
Two thirds of stakeholders indicated that the development of the current plans was supported by a
communication strategy.
More than half the stakeholders indicated that changes to air quality planning process is needed –
typical changes included more integration with other EU legislation, more clarity of responsibility at the
local, regional and national levels and better clarification of impact of measures. It was also suggested
that more guidance on development of the air quality plans would be beneficial.
NGOs provided extensive commentary on the process with the overall aim to introduce measures that
ensure compliance in the shortest possible time
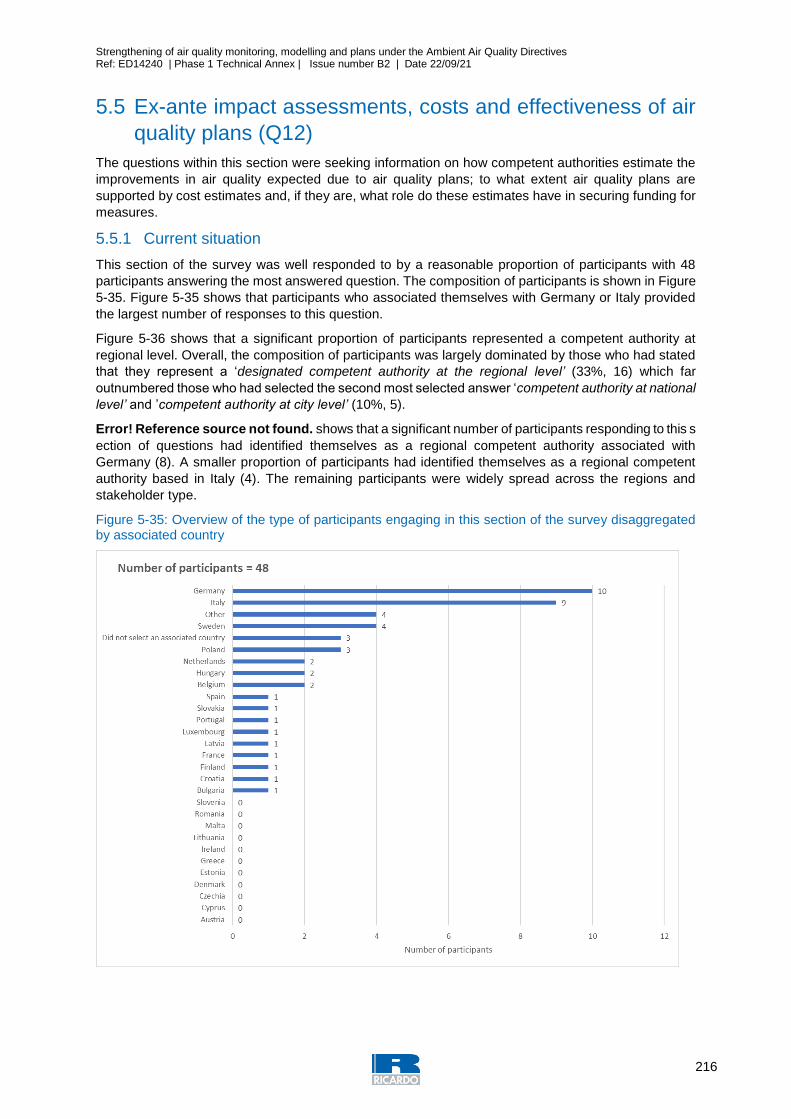
Strengthening of air quality monitoring, modelling and plans under the Ambient Air Quality Directives Ref: ED14240 | Phase 1 Technical Annex | Issue number B2 | Date 22/09/21
216
5.5 Ex-ante impact assessments, costs and effectiveness of air
quality plans (Q12)
The questions within this section were seeking information on how competent authorities estimate the
improvements in air quality expected due to air quality plans; to what extent air quality plans are
supported by cost estimates and, if they are, what role do these estimates have in securing funding for
measures.
5.5.1 Current situation
This section of the survey was well responded to by a reasonable proportion of participants with 48
participants answering the most answered question. The composition of participants is shown in Figure
5-35. Figure 5-35 shows that participants who associated themselves with Germany or Italy provided
the largest number of responses to this question.
Figure 5-36 shows that a significant proportion of participants represented a competent authority at
regional level. Overall, the composition of participants was largely dominated by those who had stated
that they represent a ‘designated competent authority at the regional level’ (33%, 16) which far
outnumbered those who had selected the second most selected answer ‘competent authority at national
level’ and ’competent authority at city level’ (10%, 5).
Error! Reference source not found. shows that a significant number of participants responding to this s
ection of questions had identified themselves as a regional competent authority associated with
Germany (8). A smaller proportion of participants had identified themselves as a regional competent
authority based in Italy (4). The remaining participants were widely spread across the regions and
stakeholder type.
Figure 5-35: Overview of the type of participants engaging in this section of the survey disaggregated by associated country
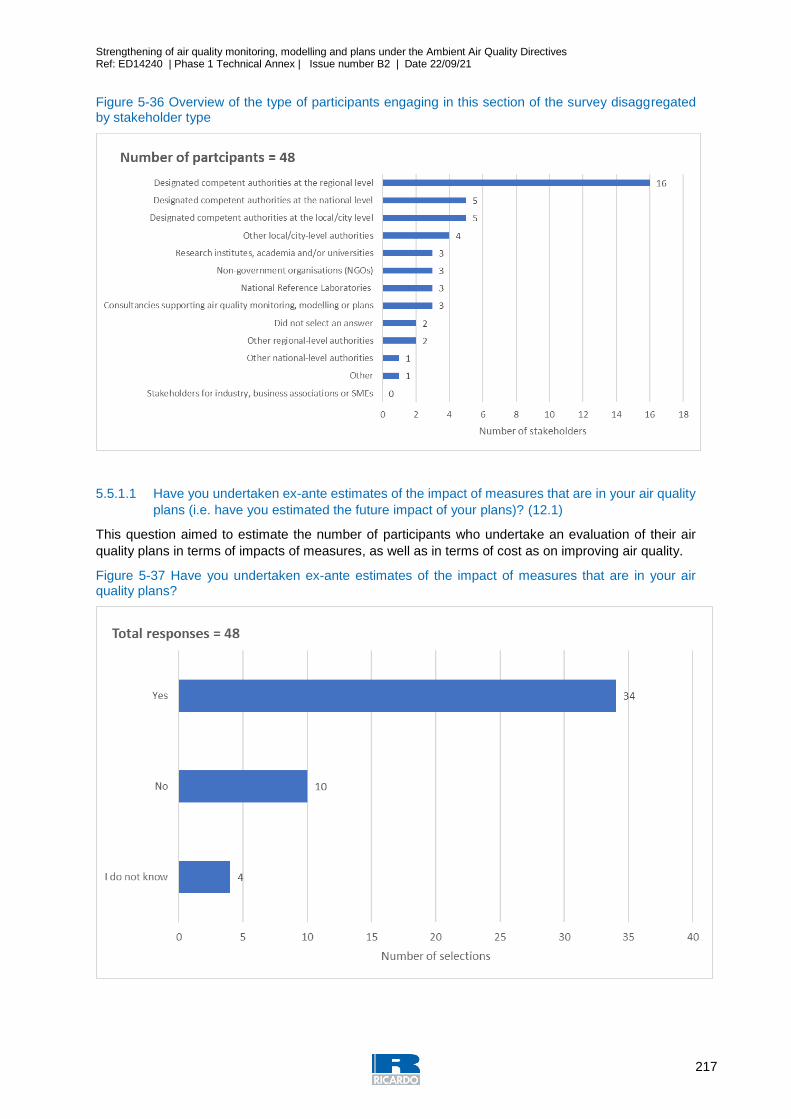
Strengthening of air quality monitoring, modelling and plans under the Ambient Air Quality Directives Ref: ED14240 | Phase 1 Technical Annex | Issue number B2 | Date 22/09/21
217
Figure 5-36 Overview of the type of participants engaging in this section of the survey disaggregated by stakeholder type
5.5.1.1 Have you undertaken ex-ante estimates of the impact of measures that are in your air quality
plans (i.e. have you estimated the future impact of your plans)? (12.1)
This question aimed to estimate the number of participants who undertake an evaluation of their air
quality plans in terms of impacts of measures, as well as in terms of cost as on improving air quality.
Figure 5-37 Have you undertaken ex-ante estimates of the impact of measures that are in your air quality plans?
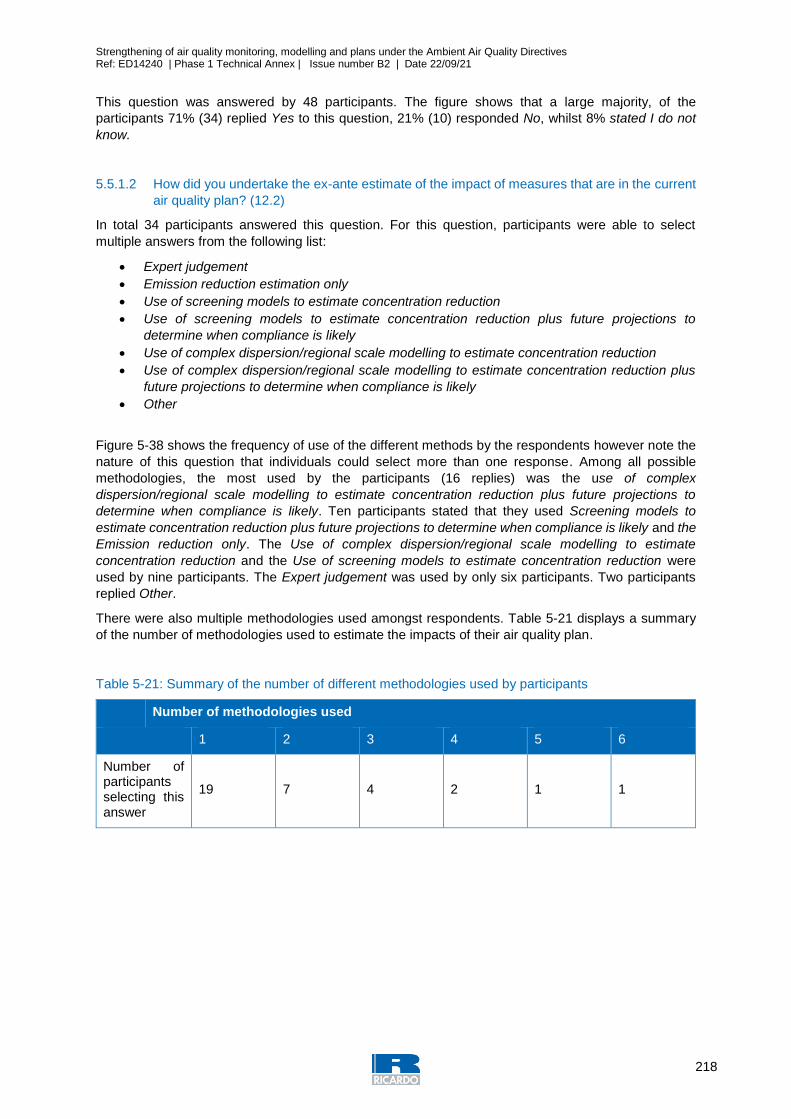
Strengthening of air quality monitoring, modelling and plans under the Ambient Air Quality Directives Ref: ED14240 | Phase 1 Technical Annex | Issue number B2 | Date 22/09/21
218
This question was answered by 48 participants. The figure shows that a large majority, of the
participants 71% (34) replied Yes to this question, 21% (10) responded No, whilst 8% stated I do not
know.
5.5.1.2 How did you undertake the ex-ante estimate of the impact of measures that are in the current
air quality plan? (12.2)
In total 34 participants answered this question. For this question, participants were able to select
multiple answers from the following list:
Expert judgement
Emission reduction estimation only
Use of screening models to estimate concentration reduction
Use of screening models to estimate concentration reduction plus future projections to
determine when compliance is likely
Use of complex dispersion/regional scale modelling to estimate concentration reduction
Use of complex dispersion/regional scale modelling to estimate concentration reduction plus
future projections to determine when compliance is likely
Other
Figure 5-38 shows the frequency of use of the different methods by the respondents however note the
nature of this question that individuals could select more than one response. Among all possible
methodologies, the most used by the participants (16 replies) was the use of complex
dispersion/regional scale modelling to estimate concentration reduction plus future projections to
determine when compliance is likely. Ten participants stated that they used Screening models to
estimate concentration reduction plus future projections to determine when compliance is likely and the
Emission reduction only. The Use of complex dispersion/regional scale modelling to estimate
concentration reduction and the Use of screening models to estimate concentration reduction were
used by nine participants. The Expert judgement was used by only six participants. Two participants
replied Other.
There were also multiple methodologies used amongst respondents. Table 5-21 displays a summary
of the number of methodologies used to estimate the impacts of their air quality plan.
Table 5-21: Summary of the number of different methodologies used by participants
Number of methodologies used
1 2 3 4 5 6
Number of participants selecting this answer
19 7 4 2 1 1
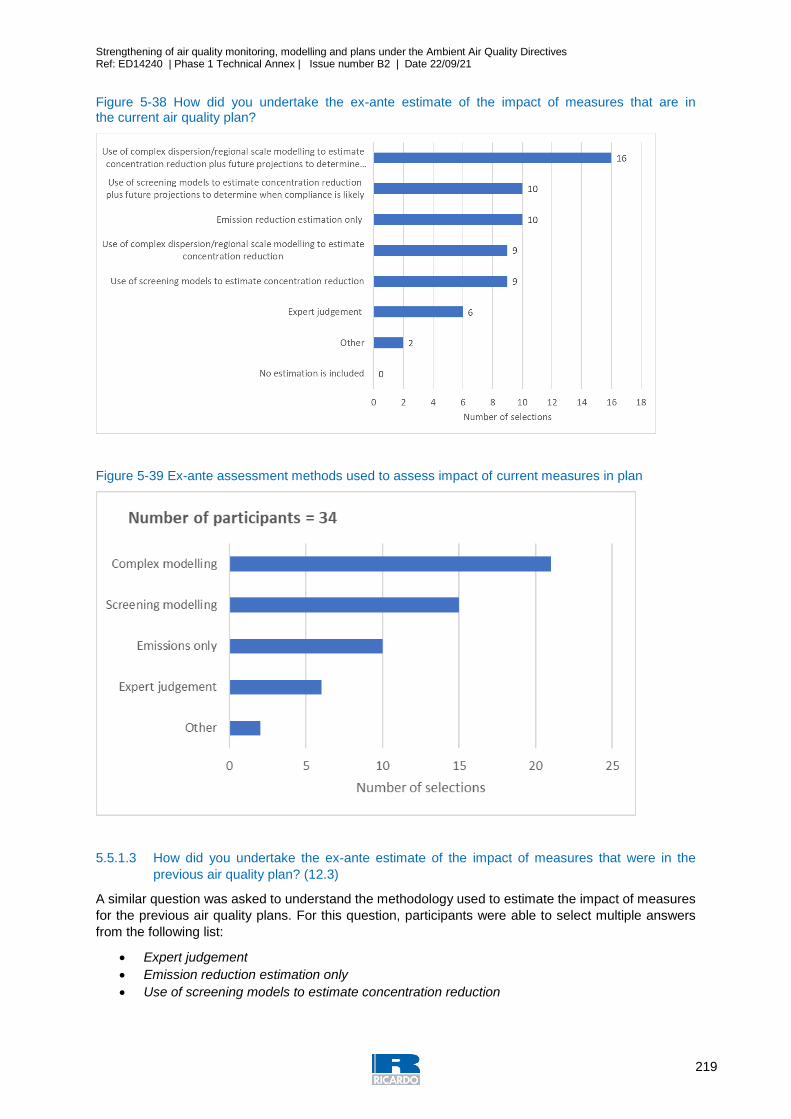
Strengthening of air quality monitoring, modelling and plans under the Ambient Air Quality Directives Ref: ED14240 | Phase 1 Technical Annex | Issue number B2 | Date 22/09/21
219
Figure 5-38 How did you undertake the ex-ante estimate of the impact of measures that are in the current air quality plan?
Figure 5-39 Ex-ante assessment methods used to assess impact of current measures in plan
5.5.1.3 How did you undertake the ex-ante estimate of the impact of measures that were in the
previous air quality plan? (12.3)
A similar question was asked to understand the methodology used to estimate the impact of measures
for the previous air quality plans. For this question, participants were able to select multiple answers
from the following list:
Expert judgement
Emission reduction estimation only
Use of screening models to estimate concentration reduction
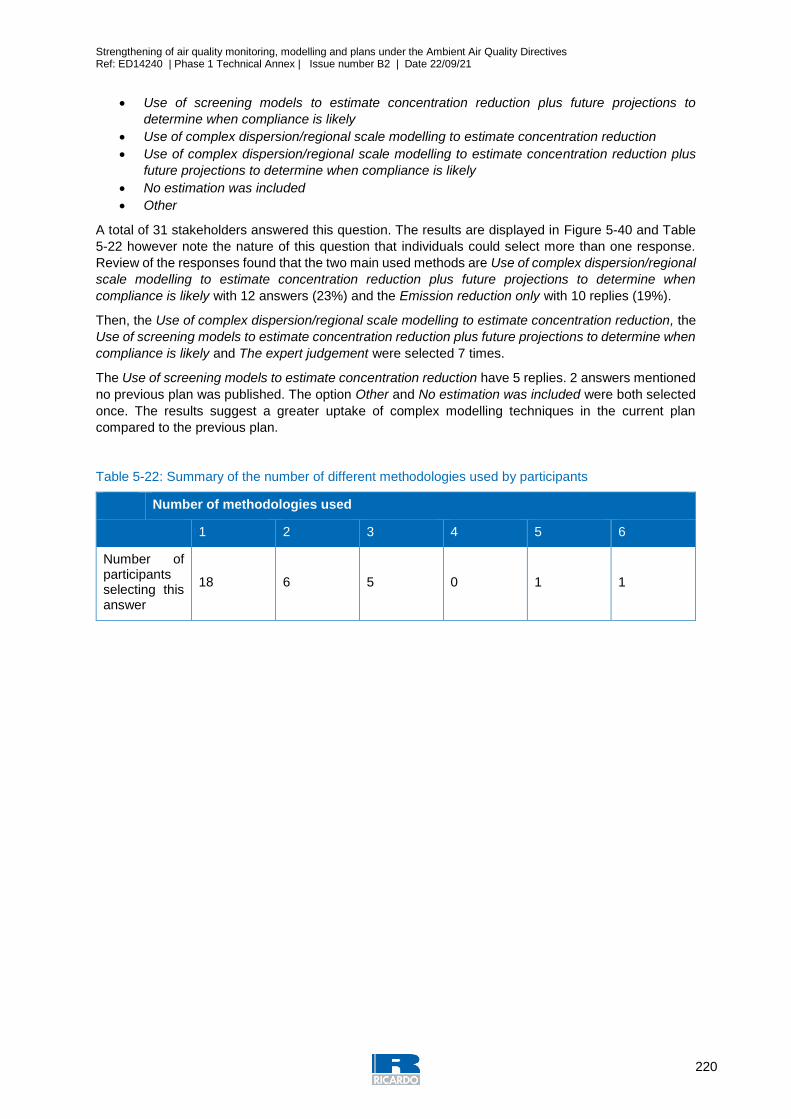
Strengthening of air quality monitoring, modelling and plans under the Ambient Air Quality Directives Ref: ED14240 | Phase 1 Technical Annex | Issue number B2 | Date 22/09/21
220
Use of screening models to estimate concentration reduction plus future projections to
determine when compliance is likely
Use of complex dispersion/regional scale modelling to estimate concentration reduction
Use of complex dispersion/regional scale modelling to estimate concentration reduction plus
future projections to determine when compliance is likely
No estimation was included
Other
A total of 31 stakeholders answered this question. The results are displayed in Figure 5-40 and Table
5-22 however note the nature of this question that individuals could select more than one response.
Review of the responses found that the two main used methods are Use of complex dispersion/regional
scale modelling to estimate concentration reduction plus future projections to determine when
compliance is likely with 12 answers (23%) and the Emission reduction only with 10 replies (19%).
Then, the Use of complex dispersion/regional scale modelling to estimate concentration reduction, the
Use of screening models to estimate concentration reduction plus future projections to determine when
compliance is likely and The expert judgement were selected 7 times.
The Use of screening models to estimate concentration reduction have 5 replies. 2 answers mentioned
no previous plan was published. The option Other and No estimation was included were both selected
once. The results suggest a greater uptake of complex modelling techniques in the current plan
compared to the previous plan.
Table 5-22: Summary of the number of different methodologies used by participants
Number of methodologies used
1 2 3 4 5 6
Number of participants selecting this answer
18 6 5 0 1 1
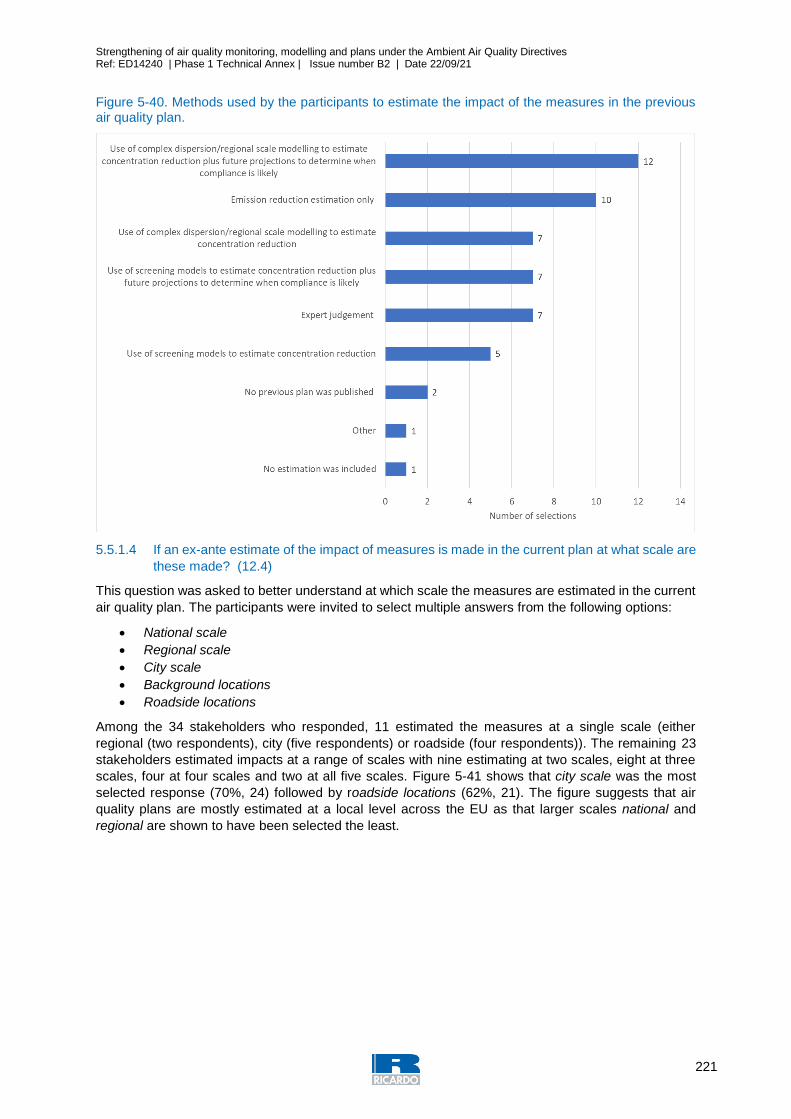
Strengthening of air quality monitoring, modelling and plans under the Ambient Air Quality Directives Ref: ED14240 | Phase 1 Technical Annex | Issue number B2 | Date 22/09/21
221
Figure 5-40. Methods used by the participants to estimate the impact of the measures in the previous air quality plan.
5.5.1.4 If an ex-ante estimate of the impact of measures is made in the current plan at what scale are
these made? (12.4)
This question was asked to better understand at which scale the measures are estimated in the current
air quality plan. The participants were invited to select multiple answers from the following options:
National scale
Regional scale
City scale
Background locations
Roadside locations
Among the 34 stakeholders who responded, 11 estimated the measures at a single scale (either
regional (two respondents), city (five respondents) or roadside (four respondents)). The remaining 23
stakeholders estimated impacts at a range of scales with nine estimating at two scales, eight at three
scales, four at four scales and two at all five scales. Figure 5-41 shows that city scale was the most
selected response (70%, 24) followed by roadside locations (62%, 21). The figure suggests that air
quality plans are mostly estimated at a local level across the EU as that larger scales national and
regional are shown to have been selected the least.
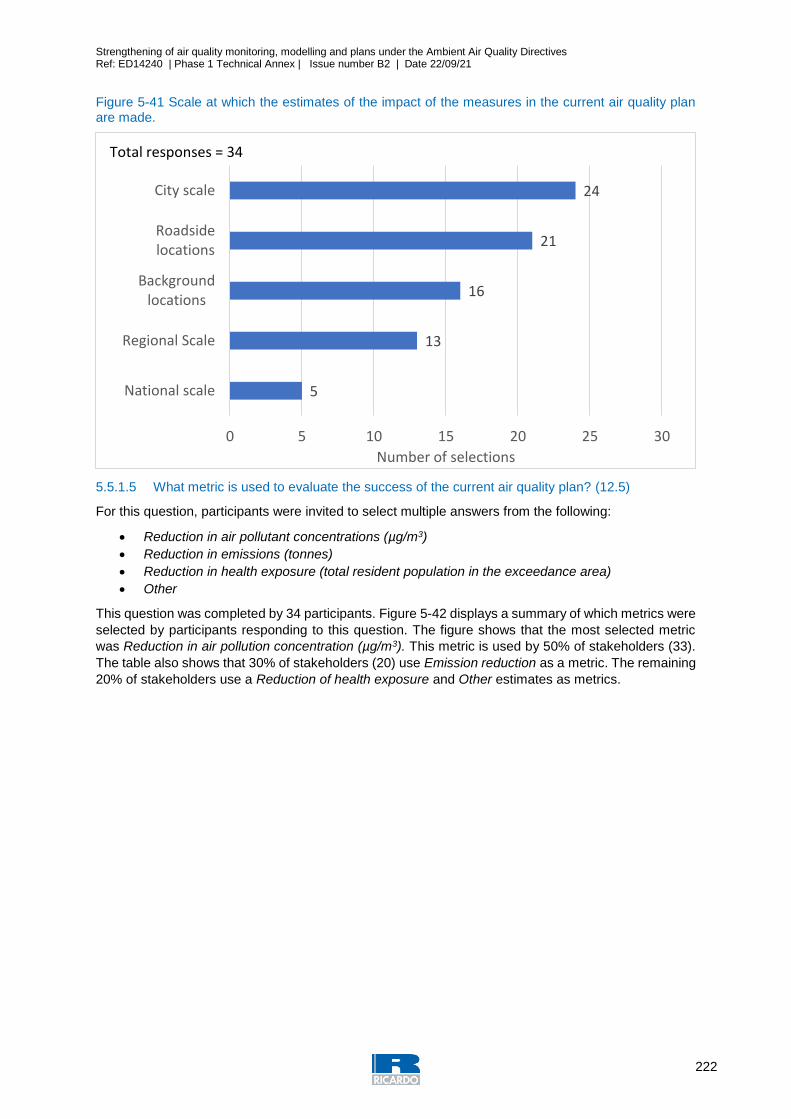
Strengthening of air quality monitoring, modelling and plans under the Ambient Air Quality Directives Ref: ED14240 | Phase 1 Technical Annex | Issue number B2 | Date 22/09/21
222
Figure 5-41 Scale at which the estimates of the impact of the measures in the current air quality plan are made.
5.5.1.5 What metric is used to evaluate the success of the current air quality plan? (12.5)
For this question, participants were invited to select multiple answers from the following:
Reduction in air pollutant concentrations (µg/m3)
Reduction in emissions (tonnes)
Reduction in health exposure (total resident population in the exceedance area)
Other
This question was completed by 34 participants. Figure 5-42 displays a summary of which metrics were
selected by participants responding to this question. The figure shows that the most selected metric
was Reduction in air pollution concentration (µg/m3). This metric is used by 50% of stakeholders (33).
The table also shows that 30% of stakeholders (20) use Emission reduction as a metric. The remaining
20% of stakeholders use a Reduction of health exposure and Other estimates as metrics.
5
13
16
21
24
0 5 10 15 20 25 30
National scale
Regional Scale
Backgroundlocations
Roadsidelocations
City scale
Number of selections
Total responses = 34
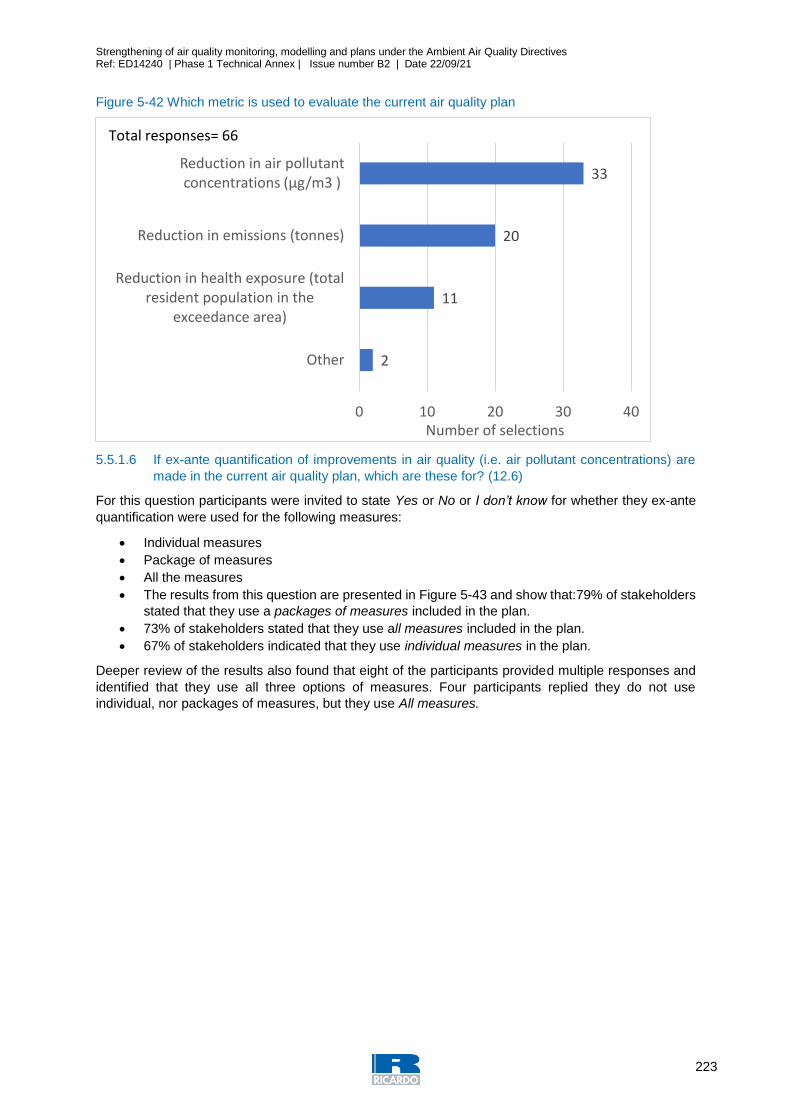
Strengthening of air quality monitoring, modelling and plans under the Ambient Air Quality Directives Ref: ED14240 | Phase 1 Technical Annex | Issue number B2 | Date 22/09/21
223
Figure 5-42 Which metric is used to evaluate the current air quality plan
5.5.1.6 If ex-ante quantification of improvements in air quality (i.e. air pollutant concentrations) are
made in the current air quality plan, which are these for? (12.6)
For this question participants were invited to state Yes or No or I don’t know for whether they ex-ante
quantification were used for the following measures:
Individual measures
Package of measures
All the measures
The results from this question are presented in Figure 5-43 and show that:79% of stakeholders
stated that they use a packages of measures included in the plan.
73% of stakeholders stated that they use all measures included in the plan.
67% of stakeholders indicated that they use individual measures in the plan.
Deeper review of the results also found that eight of the participants provided multiple responses and
identified that they use all three options of measures. Four participants replied they do not use
individual, nor packages of measures, but they use All measures.
2
11
20
33
0 10 20 30 40
Other
Reduction in health exposure (totalresident population in the
exceedance area)
Reduction in emissions (tonnes)
Reduction in air pollutant concentrations (μg/m3 )
Number of selections
Total responses= 66
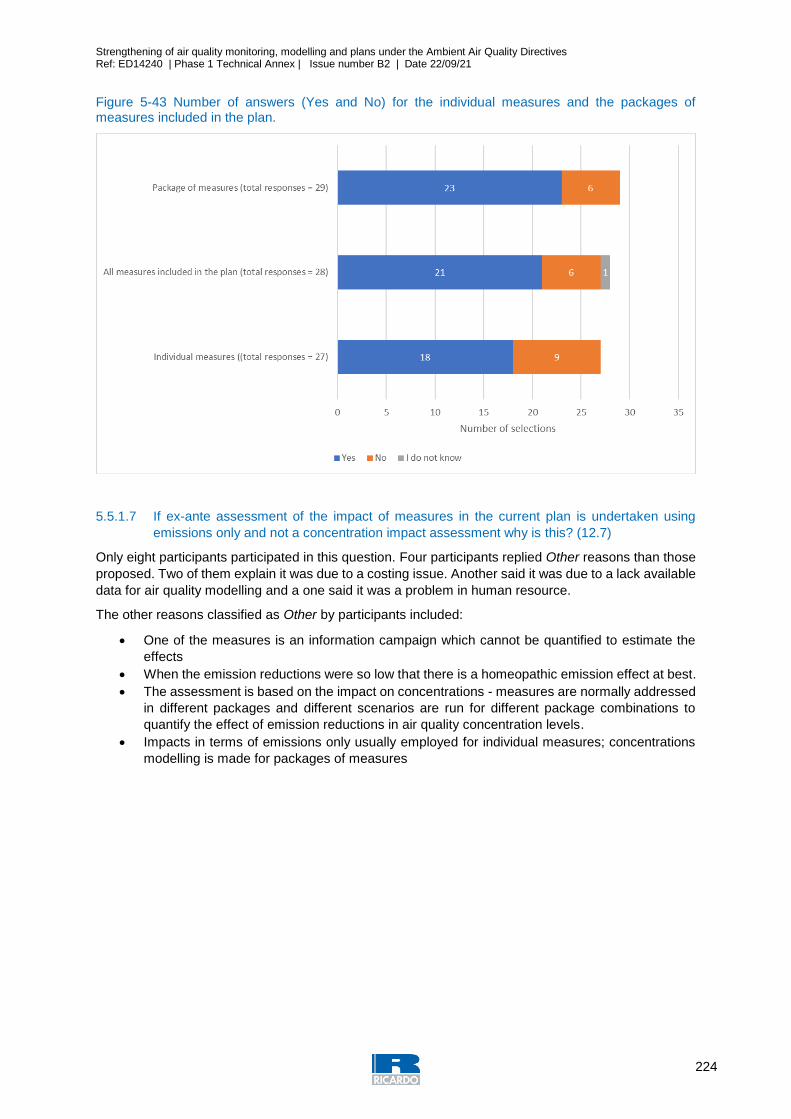
Strengthening of air quality monitoring, modelling and plans under the Ambient Air Quality Directives Ref: ED14240 | Phase 1 Technical Annex | Issue number B2 | Date 22/09/21
224
Figure 5-43 Number of answers (Yes and No) for the individual measures and the packages of measures included in the plan.
5.5.1.7 If ex-ante assessment of the impact of measures in the current plan is undertaken using
emissions only and not a concentration impact assessment why is this? (12.7)
Only eight participants participated in this question. Four participants replied Other reasons than those
proposed. Two of them explain it was due to a costing issue. Another said it was due to a lack available
data for air quality modelling and a one said it was a problem in human resource.
The other reasons classified as Other by participants included:
One of the measures is an information campaign which cannot be quantified to estimate the
effects
When the emission reductions were so low that there is a homeopathic emission effect at best.
The assessment is based on the impact on concentrations - measures are normally addressed
in different packages and different scenarios are run for different package combinations to
quantify the effect of emission reductions in air quality concentration levels.
Impacts in terms of emissions only usually employed for individual measures; concentrations
modelling is made for packages of measures
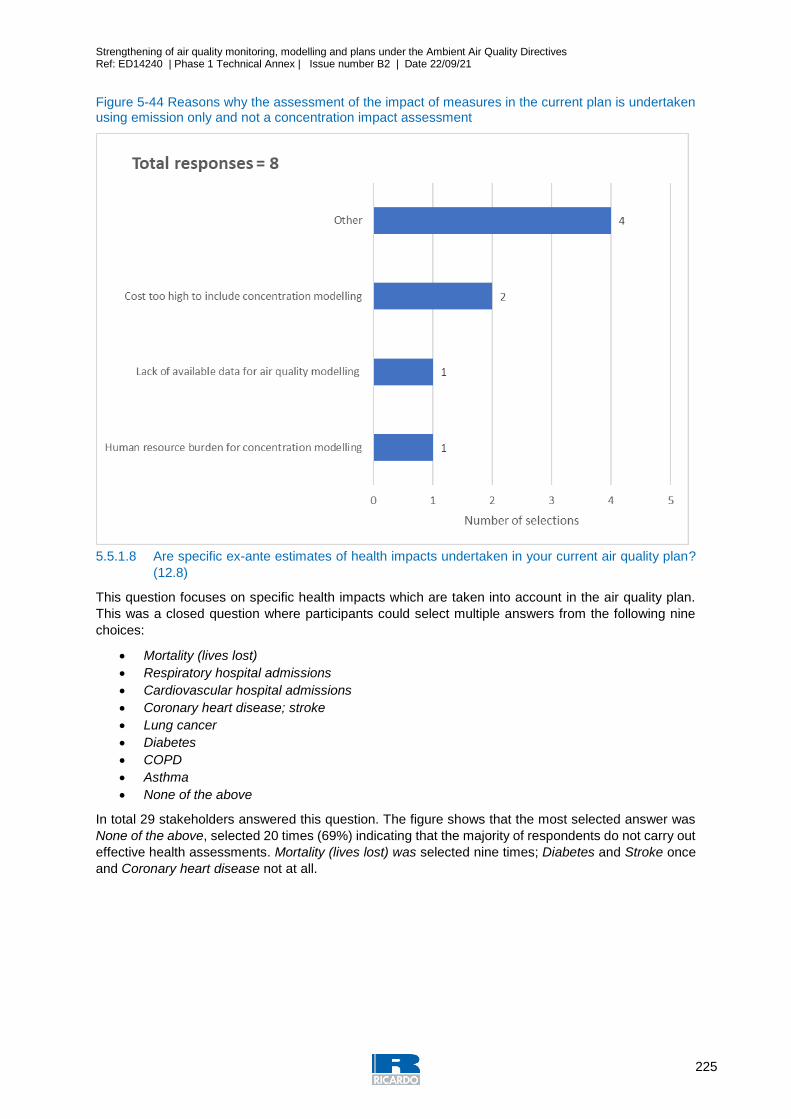
Strengthening of air quality monitoring, modelling and plans under the Ambient Air Quality Directives Ref: ED14240 | Phase 1 Technical Annex | Issue number B2 | Date 22/09/21
225
Figure 5-44 Reasons why the assessment of the impact of measures in the current plan is undertaken using emission only and not a concentration impact assessment
5.5.1.8 Are specific ex-ante estimates of health impacts undertaken in your current air quality plan?
(12.8)
This question focuses on specific health impacts which are taken into account in the air quality plan.
This was a closed question where participants could select multiple answers from the following nine
choices:
Mortality (lives lost)
Respiratory hospital admissions
Cardiovascular hospital admissions
Coronary heart disease; stroke
Lung cancer
Diabetes
COPD
Asthma
None of the above
In total 29 stakeholders answered this question. The figure shows that the most selected answer was
None of the above, selected 20 times (69%) indicating that the majority of respondents do not carry out
effective health assessments. Mortality (lives lost) was selected nine times; Diabetes and Stroke once
and Coronary heart disease not at all.
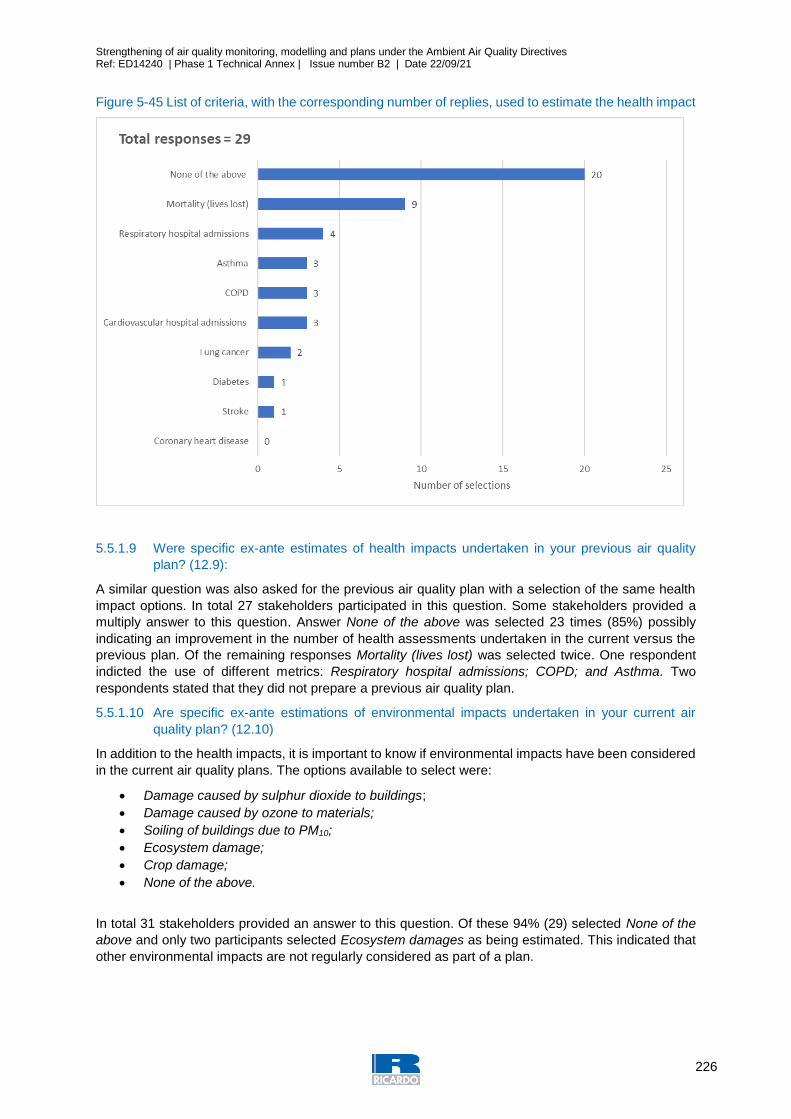
Strengthening of air quality monitoring, modelling and plans under the Ambient Air Quality Directives Ref: ED14240 | Phase 1 Technical Annex | Issue number B2 | Date 22/09/21
226
Figure 5-45 List of criteria, with the corresponding number of replies, used to estimate the health impact
5.5.1.9 Were specific ex-ante estimates of health impacts undertaken in your previous air quality
plan? (12.9):
A similar question was also asked for the previous air quality plan with a selection of the same health
impact options. In total 27 stakeholders participated in this question. Some stakeholders provided a
multiply answer to this question. Answer None of the above was selected 23 times (85%) possibly
indicating an improvement in the number of health assessments undertaken in the current versus the
previous plan. Of the remaining responses Mortality (lives lost) was selected twice. One respondent
indicted the use of different metrics: Respiratory hospital admissions; COPD; and Asthma. Two
respondents stated that they did not prepare a previous air quality plan.
5.5.1.10 Are specific ex-ante estimations of environmental impacts undertaken in your current air
quality plan? (12.10)
In addition to the health impacts, it is important to know if environmental impacts have been considered
in the current air quality plans. The options available to select were:
Damage caused by sulphur dioxide to buildings;
Damage caused by ozone to materials;
Soiling of buildings due to PM10;
Ecosystem damage;
Crop damage;
None of the above.
In total 31 stakeholders provided an answer to this question. Of these 94% (29) selected None of the
above and only two participants selected Ecosystem damages as being estimated. This indicated that
other environmental impacts are not regularly considered as part of a plan.
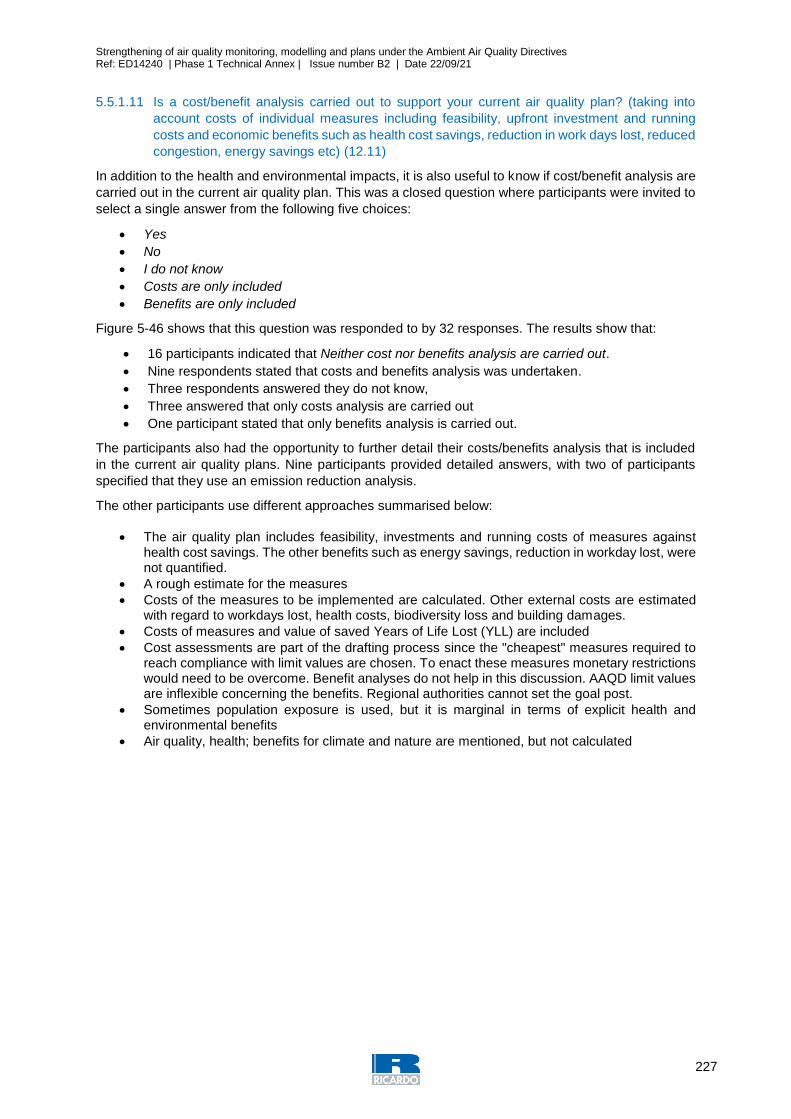
Strengthening of air quality monitoring, modelling and plans under the Ambient Air Quality Directives Ref: ED14240 | Phase 1 Technical Annex | Issue number B2 | Date 22/09/21
227
5.5.1.11 Is a cost/benefit analysis carried out to support your current air quality plan? (taking into
account costs of individual measures including feasibility, upfront investment and running
costs and economic benefits such as health cost savings, reduction in work days lost, reduced
congestion, energy savings etc) (12.11)
In addition to the health and environmental impacts, it is also useful to know if cost/benefit analysis are
carried out in the current air quality plan. This was a closed question where participants were invited to
select a single answer from the following five choices:
Yes
No
I do not know
Costs are only included
Benefits are only included
Figure 5-46 shows that this question was responded to by 32 responses. The results show that:
16 participants indicated that Neither cost nor benefits analysis are carried out.
Nine respondents stated that costs and benefits analysis was undertaken.
Three respondents answered they do not know,
Three answered that only costs analysis are carried out
One participant stated that only benefits analysis is carried out.
The participants also had the opportunity to further detail their costs/benefits analysis that is included
in the current air quality plans. Nine participants provided detailed answers, with two of participants
specified that they use an emission reduction analysis.
The other participants use different approaches summarised below:
The air quality plan includes feasibility, investments and running costs of measures against health cost savings. The other benefits such as energy savings, reduction in workday lost, were not quantified.
A rough estimate for the measures
Costs of the measures to be implemented are calculated. Other external costs are estimated with regard to workdays lost, health costs, biodiversity loss and building damages.
Costs of measures and value of saved Years of Life Lost (YLL) are included
Cost assessments are part of the drafting process since the "cheapest" measures required to reach compliance with limit values are chosen. To enact these measures monetary restrictions would need to be overcome. Benefit analyses do not help in this discussion. AAQD limit values are inflexible concerning the benefits. Regional authorities cannot set the goal post.
Sometimes population exposure is used, but it is marginal in terms of explicit health and environmental benefits
Air quality, health; benefits for climate and nature are mentioned, but not calculated
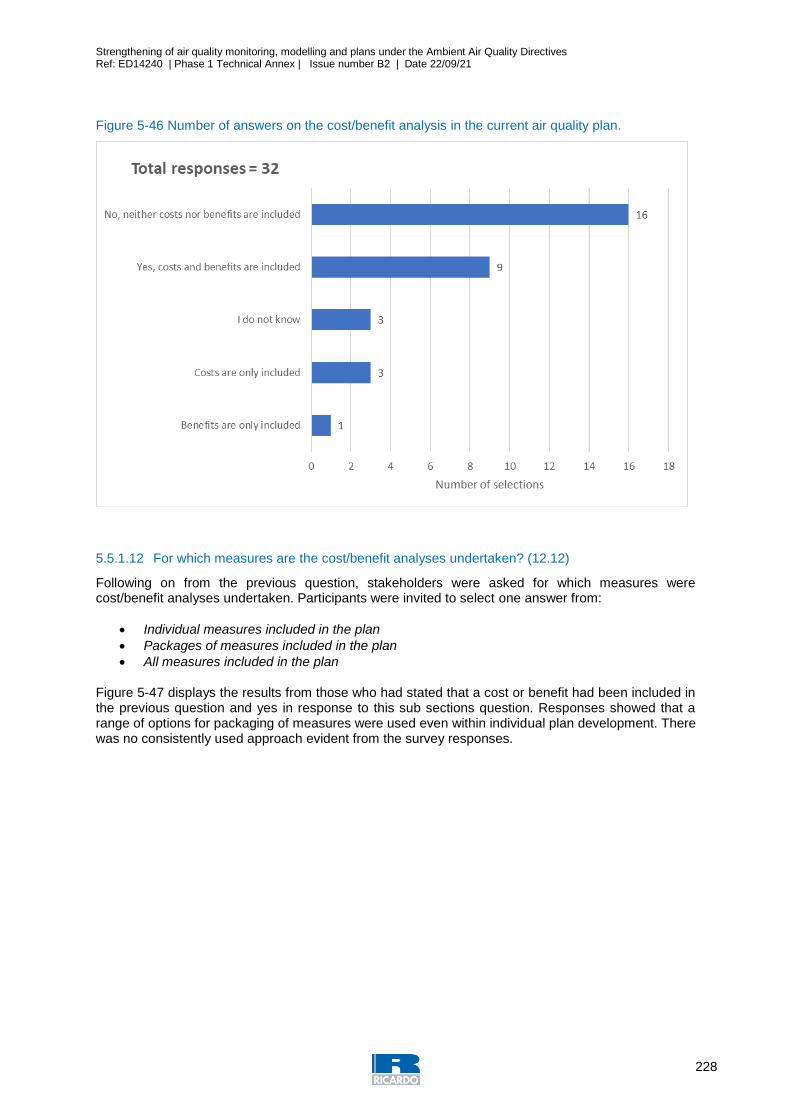
Strengthening of air quality monitoring, modelling and plans under the Ambient Air Quality Directives Ref: ED14240 | Phase 1 Technical Annex | Issue number B2 | Date 22/09/21
228
Figure 5-46 Number of answers on the cost/benefit analysis in the current air quality plan.
5.5.1.12 For which measures are the cost/benefit analyses undertaken? (12.12)
Following on from the previous question, stakeholders were asked for which measures were cost/benefit analyses undertaken. Participants were invited to select one answer from:
Individual measures included in the plan
Packages of measures included in the plan
All measures included in the plan Figure 5-47 displays the results from those who had stated that a cost or benefit had been included in the previous question and yes in response to this sub sections question. Responses showed that a range of options for packaging of measures were used even within individual plan development. There was no consistently used approach evident from the survey responses.
Strengthening of air quality monitoring, modelling and plans under the Ambient Air Quality Directives Ref: ED14240 | Phase 1 Technical Annex | Issue number B2 | Date 22/09/21
229
Figure 5-47 Measures concerned by the cost/benefit analysis in the current air quality plan.
5.5.1.13 How important were the cost estimates in securing funds for measures? (1 - least important,
5 - most important) and How important were the cost savings (benefits) in securing funds for
measures? (1- least important, 5 - most important) (12.13)
If the cost/benefit analysis was carried out as a part of a development of the current air quality plan,
participants were asked to rate how important the cost estimates and the cost saving benefits were in
securing funds for measures.
In total 12 participants provided an answer to the first question related to the cost estimates and 10
participants responded to the second question related to cost savings (benefits).
The number of responses and weighted mean of the responses are shown in Table 5-23.
Table 5-23 Importance of the cost estimates and cost savings in securing funds for measures in the air quality plan and weighted mean of responses
Element of air quality plan Total number of responses
Weighted mean
How important were the cost estimates in securing funds for measures? 12 2.3
How important were the cost savings (benefits) in securing funds for measures?
10 1.8
The table suggests that neither cost estimates nor cost savings are vital in the current mechanisms
used to secure funding for measures to improve air quality. Due to the low response rate, this result
should be considered as indicative only.
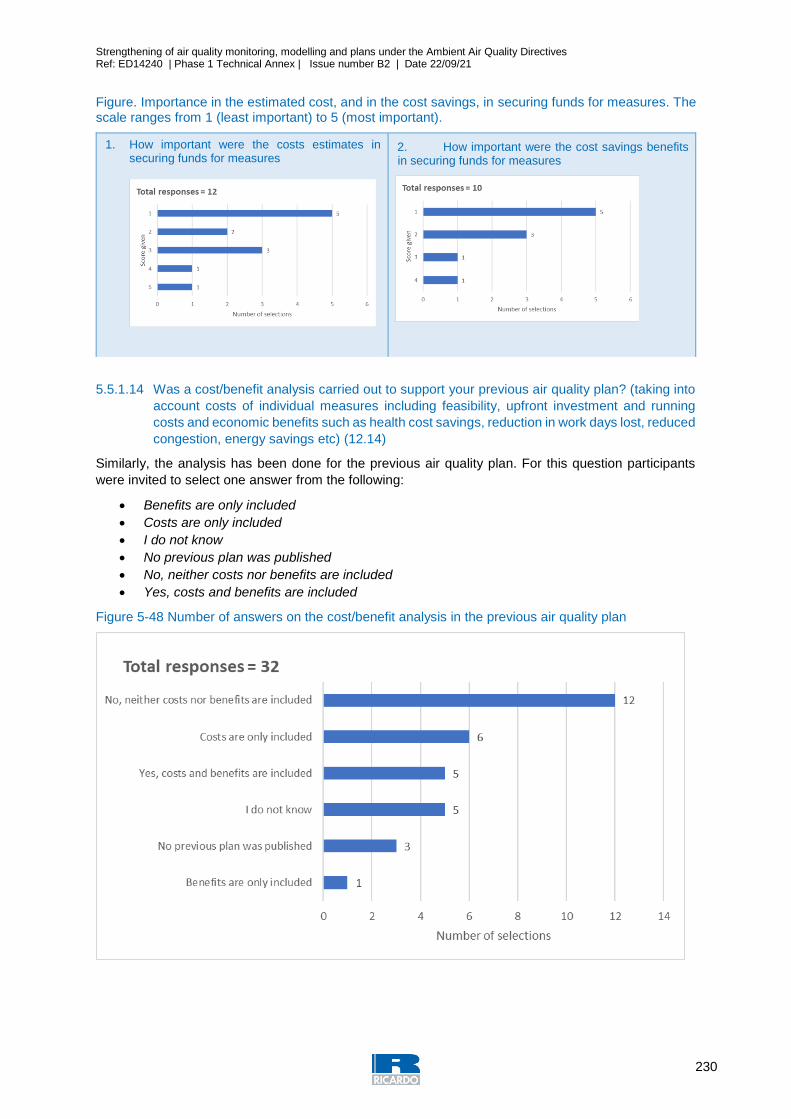
Strengthening of air quality monitoring, modelling and plans under the Ambient Air Quality Directives Ref: ED14240 | Phase 1 Technical Annex | Issue number B2 | Date 22/09/21
230
Figure. Importance in the estimated cost, and in the cost savings, in securing funds for measures. The scale ranges from 1 (least important) to 5 (most important).
1. How important were the costs estimates in securing funds for measures
2. How important were the cost savings benefits in securing funds for measures
5.5.1.14 Was a cost/benefit analysis carried out to support your previous air quality plan? (taking into
account costs of individual measures including feasibility, upfront investment and running
costs and economic benefits such as health cost savings, reduction in work days lost, reduced
congestion, energy savings etc) (12.14)
Similarly, the analysis has been done for the previous air quality plan. For this question participants
were invited to select one answer from the following:
Benefits are only included
Costs are only included
I do not know
No previous plan was published
No, neither costs nor benefits are included
Yes, costs and benefits are included
Figure 5-48 Number of answers on the cost/benefit analysis in the previous air quality plan
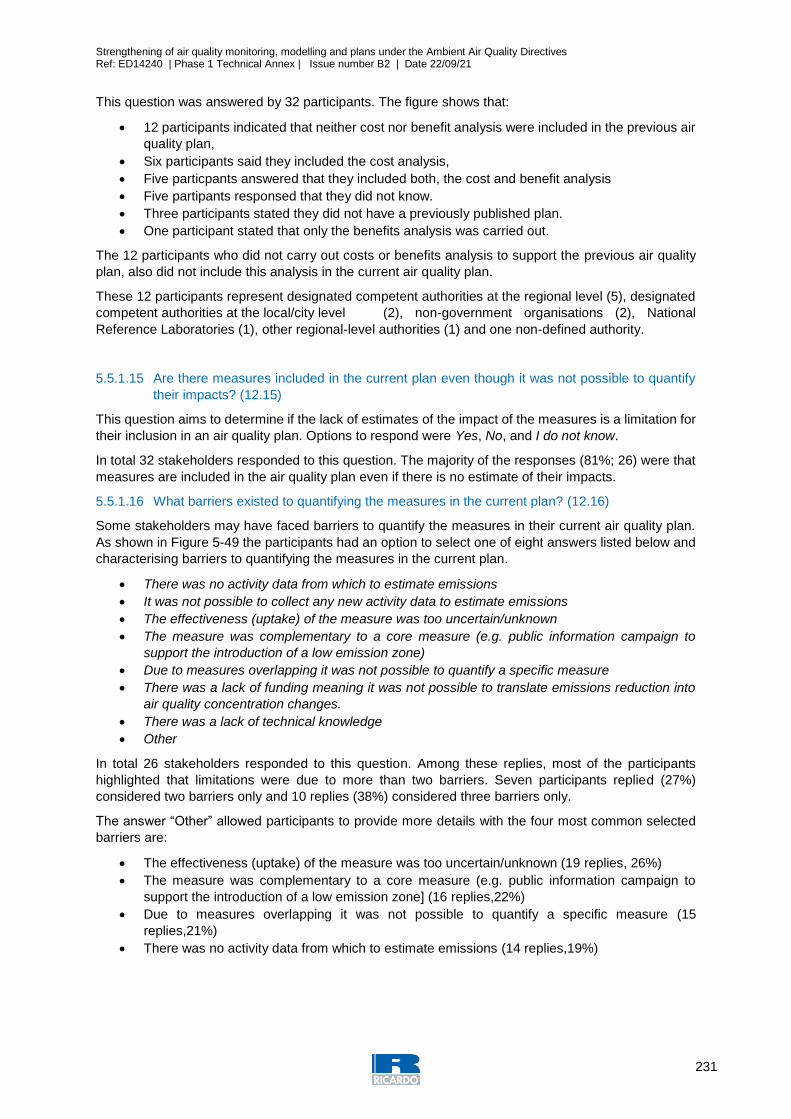
Strengthening of air quality monitoring, modelling and plans under the Ambient Air Quality Directives Ref: ED14240 | Phase 1 Technical Annex | Issue number B2 | Date 22/09/21
231
This question was answered by 32 participants. The figure shows that:
12 participants indicated that neither cost nor benefit analysis were included in the previous air
quality plan,
Six participants said they included the cost analysis,
Five particpants answered that they included both, the cost and benefit analysis
Five partipants responsed that they did not know.
Three participants stated they did not have a previously published plan.
One participant stated that only the benefits analysis was carried out.
The 12 participants who did not carry out costs or benefits analysis to support the previous air quality
plan, also did not include this analysis in the current air quality plan.
These 12 participants represent designated competent authorities at the regional level (5), designated
competent authorities at the local/city level (2), non-government organisations (2), National
Reference Laboratories (1), other regional-level authorities (1) and one non-defined authority.
5.5.1.15 Are there measures included in the current plan even though it was not possible to quantify
their impacts? (12.15)
This question aims to determine if the lack of estimates of the impact of the measures is a limitation for
their inclusion in an air quality plan. Options to respond were Yes, No, and I do not know.
In total 32 stakeholders responded to this question. The majority of the responses (81%; 26) were that
measures are included in the air quality plan even if there is no estimate of their impacts.
5.5.1.16 What barriers existed to quantifying the measures in the current plan? (12.16)
Some stakeholders may have faced barriers to quantify the measures in their current air quality plan.
As shown in Figure 5-49 the participants had an option to select one of eight answers listed below and
characterising barriers to quantifying the measures in the current plan.
There was no activity data from which to estimate emissions
It was not possible to collect any new activity data to estimate emissions
The effectiveness (uptake) of the measure was too uncertain/unknown
The measure was complementary to a core measure (e.g. public information campaign to
support the introduction of a low emission zone)
Due to measures overlapping it was not possible to quantify a specific measure
There was a lack of funding meaning it was not possible to translate emissions reduction into
air quality concentration changes.
There was a lack of technical knowledge
Other
In total 26 stakeholders responded to this question. Among these replies, most of the participants
highlighted that limitations were due to more than two barriers. Seven participants replied (27%)
considered two barriers only and 10 replies (38%) considered three barriers only.
The answer “Other” allowed participants to provide more details with the four most common selected
barriers are:
The effectiveness (uptake) of the measure was too uncertain/unknown (19 replies, 26%)
The measure was complementary to a core measure (e.g. public information campaign to
support the introduction of a low emission zone] (16 replies,22%)
Due to measures overlapping it was not possible to quantify a specific measure (15
replies,21%)
There was no activity data from which to estimate emissions (14 replies,19%)
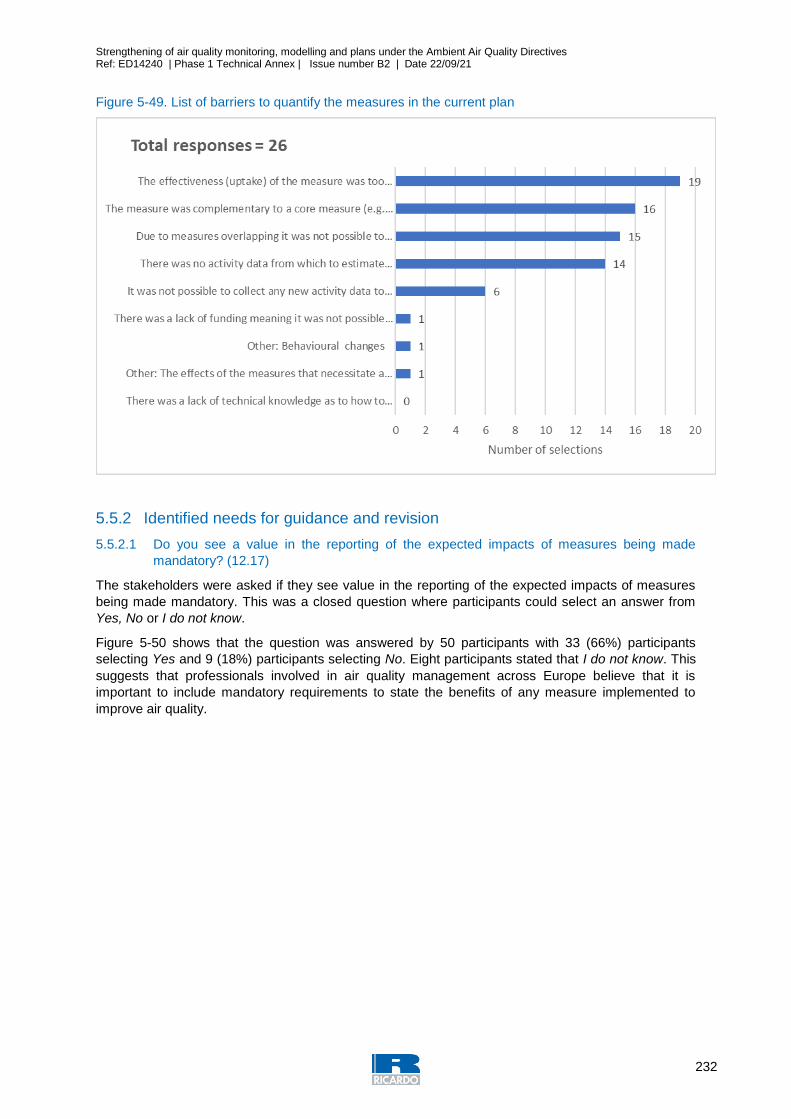
Strengthening of air quality monitoring, modelling and plans under the Ambient Air Quality Directives Ref: ED14240 | Phase 1 Technical Annex | Issue number B2 | Date 22/09/21
232
Figure 5-49. List of barriers to quantify the measures in the current plan
5.5.2 Identified needs for guidance and revision
5.5.2.1 Do you see a value in the reporting of the expected impacts of measures being made
mandatory? (12.17)
The stakeholders were asked if they see value in the reporting of the expected impacts of measures
being made mandatory. This was a closed question where participants could select an answer from
Yes, No or I do not know.
Figure 5-50 shows that the question was answered by 50 participants with 33 (66%) participants
selecting Yes and 9 (18%) participants selecting No. Eight participants stated that I do not know. This
suggests that professionals involved in air quality management across Europe believe that it is
important to include mandatory requirements to state the benefits of any measure implemented to
improve air quality.
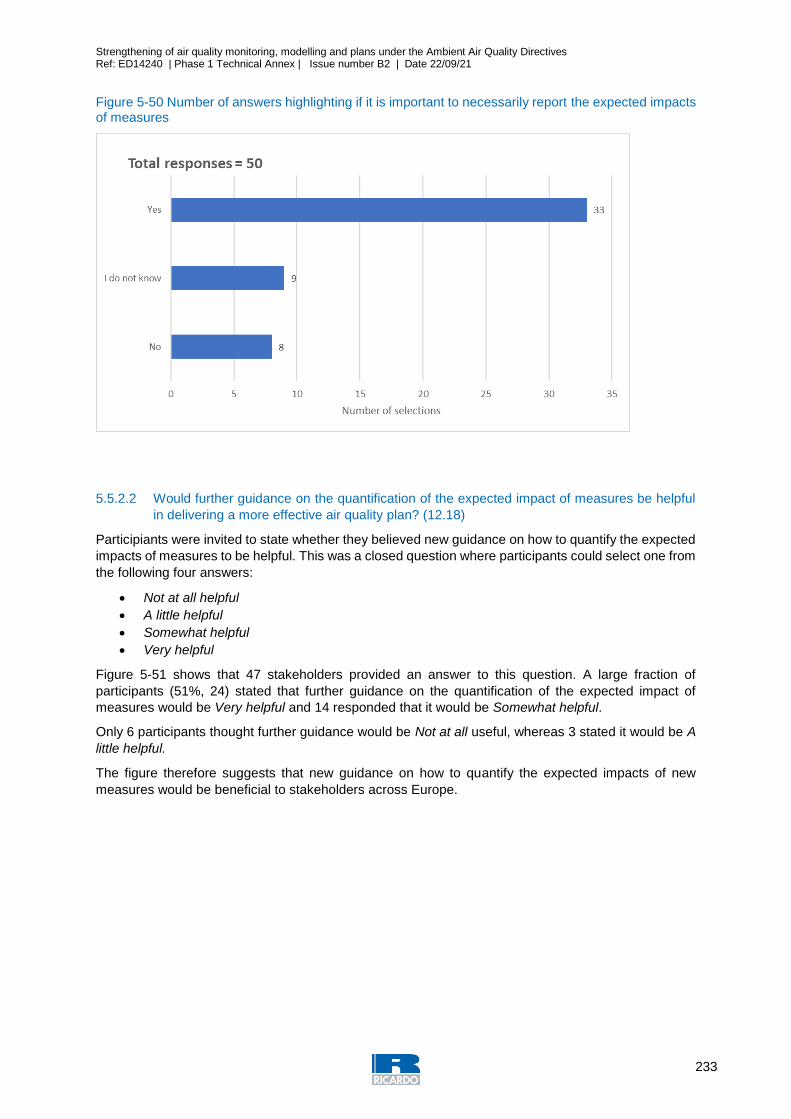
Strengthening of air quality monitoring, modelling and plans under the Ambient Air Quality Directives Ref: ED14240 | Phase 1 Technical Annex | Issue number B2 | Date 22/09/21
233
Figure 5-50 Number of answers highlighting if it is important to necessarily report the expected impacts of measures
5.5.2.2 Would further guidance on the quantification of the expected impact of measures be helpful
in delivering a more effective air quality plan? (12.18)
Participiants were invited to state whether they believed new guidance on how to quantify the expected
impacts of measures to be helpful. This was a closed question where participants could select one from
the following four answers:
Not at all helpful
A little helpful
Somewhat helpful
Very helpful
Figure 5-51 shows that 47 stakeholders provided an answer to this question. A large fraction of
participants (51%, 24) stated that further guidance on the quantification of the expected impact of
measures would be Very helpful and 14 responded that it would be Somewhat helpful.
Only 6 participants thought further guidance would be Not at all useful, whereas 3 stated it would be A
little helpful.
The figure therefore suggests that new guidance on how to quantify the expected impacts of new
measures would be beneficial to stakeholders across Europe.
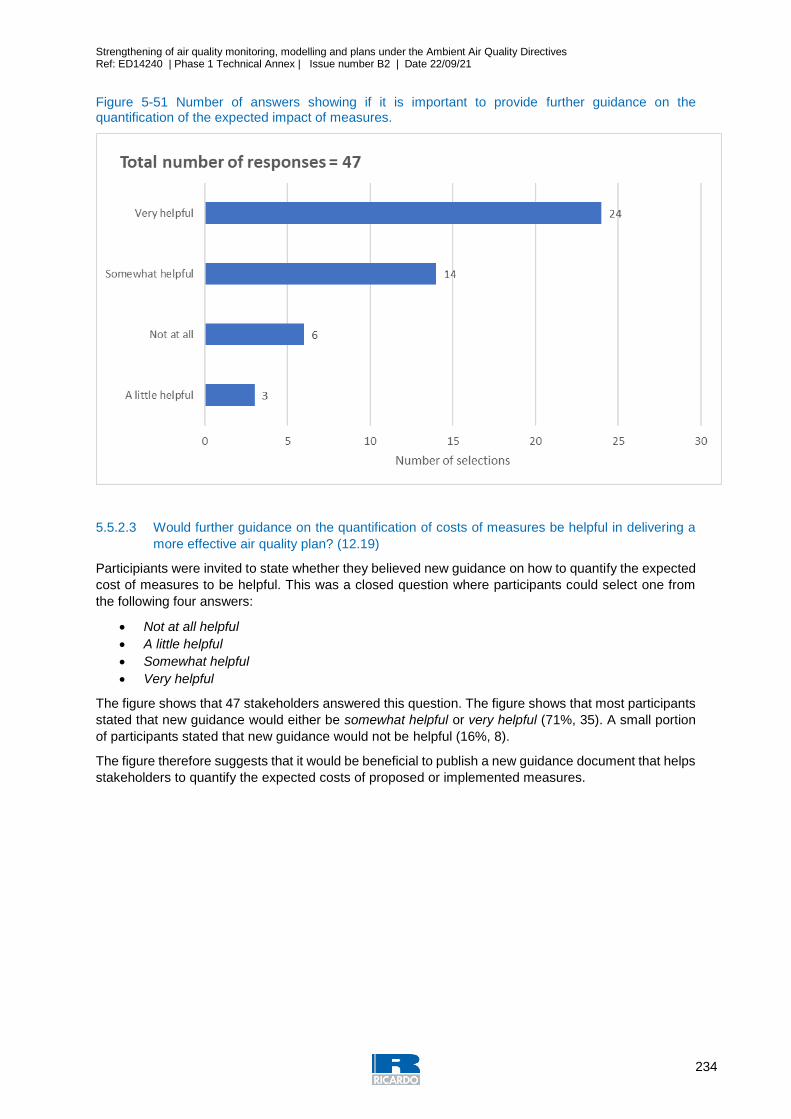
Strengthening of air quality monitoring, modelling and plans under the Ambient Air Quality Directives Ref: ED14240 | Phase 1 Technical Annex | Issue number B2 | Date 22/09/21
234
Figure 5-51 Number of answers showing if it is important to provide further guidance on the quantification of the expected impact of measures.
5.5.2.3 Would further guidance on the quantification of costs of measures be helpful in delivering a
more effective air quality plan? (12.19)
Participiants were invited to state whether they believed new guidance on how to quantify the expected
cost of measures to be helpful. This was a closed question where participants could select one from
the following four answers:
Not at all helpful
A little helpful
Somewhat helpful
Very helpful
The figure shows that 47 stakeholders answered this question. The figure shows that most participants
stated that new guidance would either be somewhat helpful or very helpful (71%, 35). A small portion
of participants stated that new guidance would not be helpful (16%, 8).
The figure therefore suggests that it would be beneficial to publish a new guidance document that helps
stakeholders to quantify the expected costs of proposed or implemented measures.
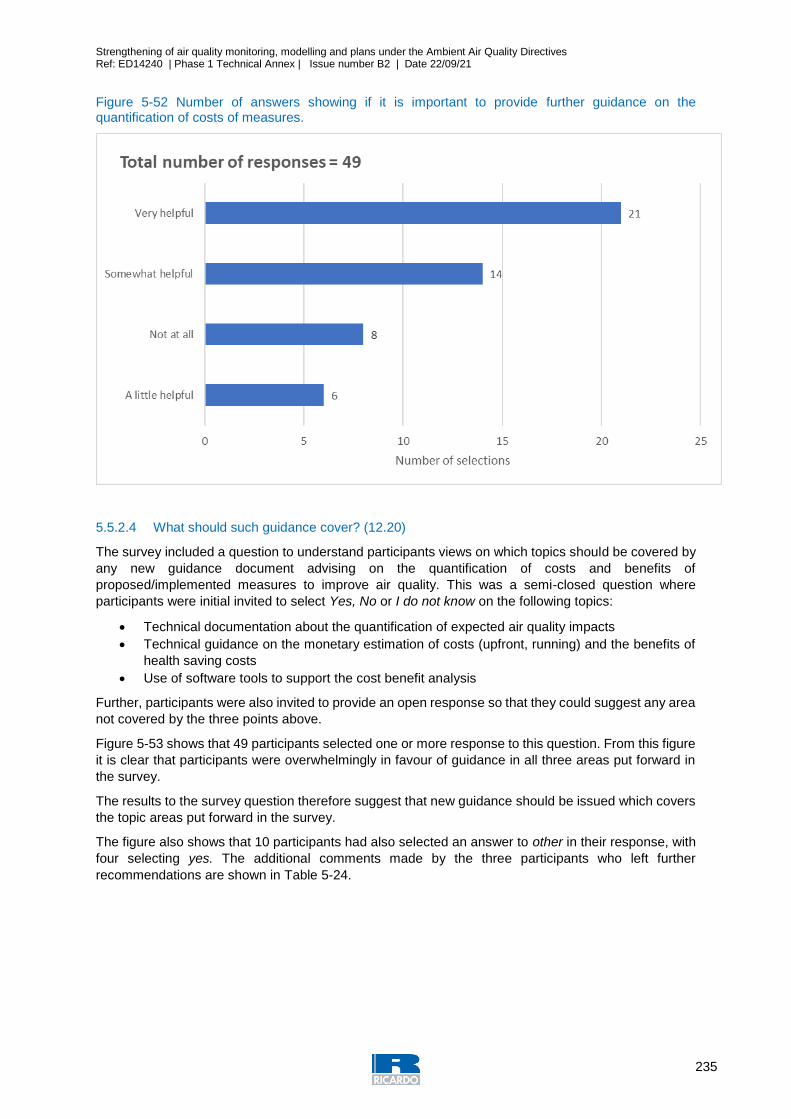
Strengthening of air quality monitoring, modelling and plans under the Ambient Air Quality Directives Ref: ED14240 | Phase 1 Technical Annex | Issue number B2 | Date 22/09/21
235
Figure 5-52 Number of answers showing if it is important to provide further guidance on the quantification of costs of measures.
5.5.2.4 What should such guidance cover? (12.20)
The survey included a question to understand participants views on which topics should be covered by
any new guidance document advising on the quantification of costs and benefits of
proposed/implemented measures to improve air quality. This was a semi-closed question where
participants were initial invited to select Yes, No or I do not know on the following topics:
Technical documentation about the quantification of expected air quality impacts
Technical guidance on the monetary estimation of costs (upfront, running) and the benefits of
health saving costs
Use of software tools to support the cost benefit analysis
Further, participants were also invited to provide an open response so that they could suggest any area
not covered by the three points above.
Figure 5-53 shows that 49 participants selected one or more response to this question. From this figure
it is clear that participants were overwhelmingly in favour of guidance in all three areas put forward in
the survey.
The results to the survey question therefore suggest that new guidance should be issued which covers
the topic areas put forward in the survey.
The figure also shows that 10 participants had also selected an answer to other in their response, with
four selecting yes. The additional comments made by the three participants who left further
recommendations are shown in Table 5-24.
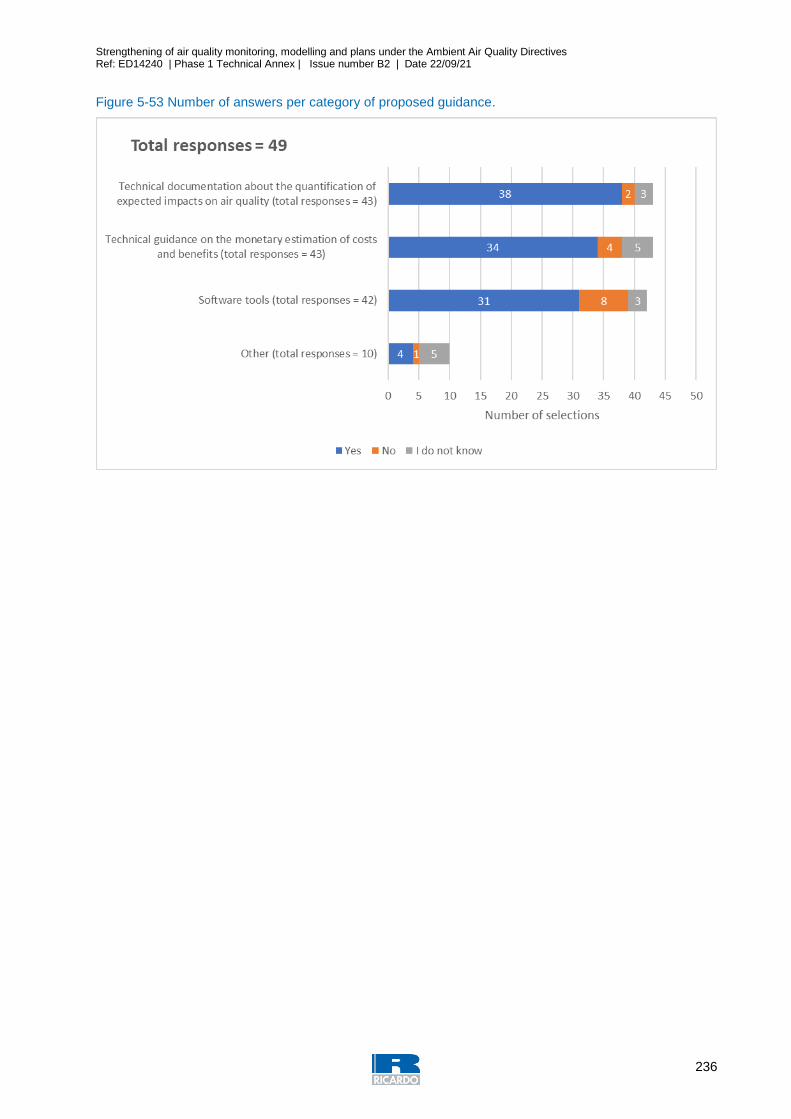
Strengthening of air quality monitoring, modelling and plans under the Ambient Air Quality Directives Ref: ED14240 | Phase 1 Technical Annex | Issue number B2 | Date 22/09/21
236
Figure 5-53 Number of answers per category of proposed guidance.

Strengthening of air quality monitoring, modelling and plans under the Ambient Air Quality Directives Ref: ED14240 | Phase 1 Technical Annex | Issue number B2 | Date 22/09/21
237
Table 5-24: Description of suggested Other guidance options on the quantification of costs of measures which be helpful in delivering a more effective air quality plan.
Stakeholder category
Please specify:
Competent Authorities
Guidance document could perhaps provide an insight on how local data related to the relationship between pollution reduction and related health costs could be generated. Such data at Member State level would result in more robust calculations.
NGO
Additional guidance and a clearer legal framework is needed for the quantification of expected impacts on air quality. A common issue regarding the implementation of air quality plans is the adoption of flawed methods of analysing the projected impact. Competent authorities often try to overestimate the possible impact of the selected measures and/or rely on overly optimistic assumptions. Very few air quality plans explain the methods used for forecasting the evolution of air quality and the underlying assumptions and uncertainties. Moreover, scenarios are often modelled only for five-year intervals. Such practice makes it difficult to verify whether other measures would allow to achieve compliance at an earlier date. Respondent recommends inserting new guidance in Annex XV of the Directive containing clarifications and minimum requirements for analysing the projected impact of pollution abatement measures. In particular, it should be required that competent authorities: - describe the method used for forecasting evolution of air quality and assess the impact of air quality plan and the relevant assumptions - include in the impact assessment only pollution abatement measures that will definitely be adopted and implemented (for instance, include measures that fall under the responsibility of other levels of governance only where the relevant authority has formally committed to implement such measure) - in line with the obligation to achieve compliance in the shortest time possible, when modelling future scenarios, whenever the projections extend to longer periods of time (e.g. 3/5/10 years), the results should be shown for each year of the projection period - include an assessment of the margin of uncertainty of the projections and margin of confidence on factors such as the real world emissions of vehicles or stoves or the uncertainty about the impact of voluntary measures aiming at pushing behaviour changes - include sensitivity scenarios describing the upper and lower confidence intervals in light of possible variations in the different assumptions and description of the best-case, most likely and worst-case scenarios. The AQD should also clarify expressly that cost benefit analysis is not an appropriate primary method for selecting measures for inclusion in an air quality plan. The correct approach to air quality plans is to include all technically feasible and effective measures to bring forward compliance (see following answer for more information about this point).
Other
Guidance to simplify how to deal with measures that cannot be quantified. Lookup tables on effectiveness of some measures, such as Marlis. Positive/negative lists of effects of measures. A european wide unified easy to use, cost free online software tool to estimate the effectiveness of measures.
5.5.2.5 Please specify any other suggestions to improve the ex-ante estimation of expected costs
and benefits (for air quality improvements, health etc) of air quality measures in air quality
plans under the AAQD. (12.21)
Participants were invited to provided additional comments on what could be done to improve the
estimating of expected costs and benefits. The answers provided by 10 participants are presented in
Table 5-25.
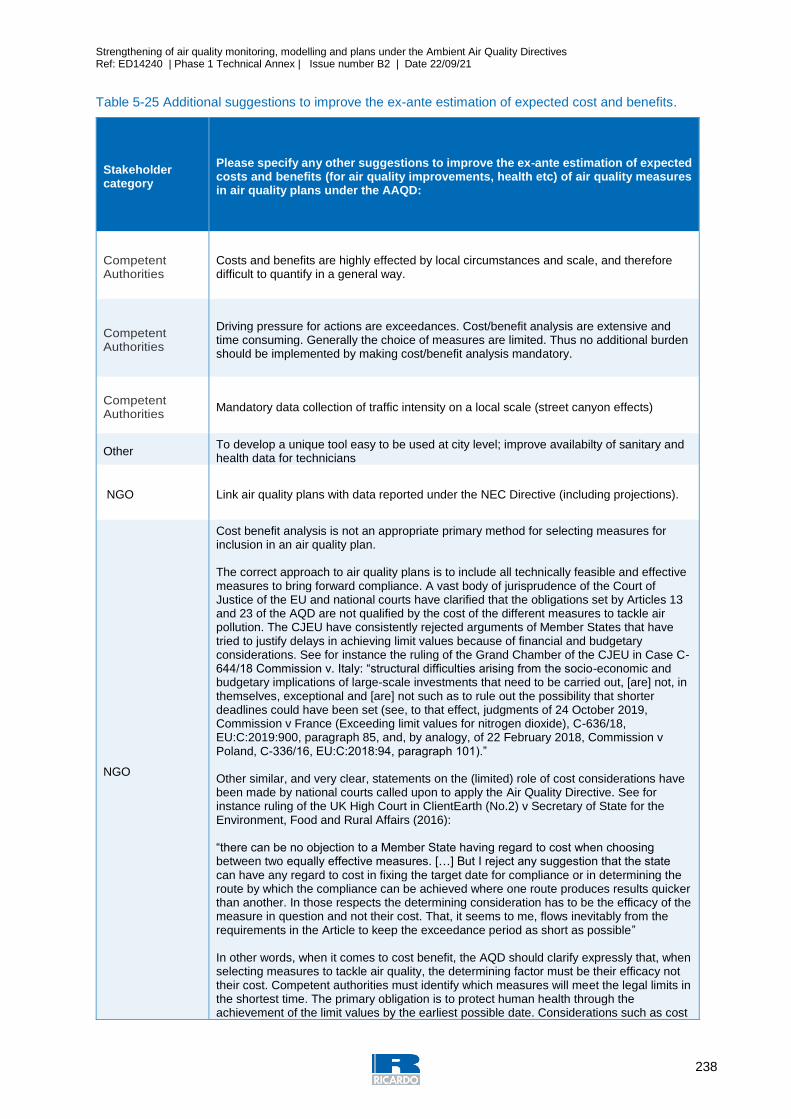
Strengthening of air quality monitoring, modelling and plans under the Ambient Air Quality Directives Ref: ED14240 | Phase 1 Technical Annex | Issue number B2 | Date 22/09/21
238
Table 5-25 Additional suggestions to improve the ex-ante estimation of expected cost and benefits.
Stakeholder category
Please specify any other suggestions to improve the ex-ante estimation of expected costs and benefits (for air quality improvements, health etc) of air quality measures in air quality plans under the AAQD:
Competent Authorities
Costs and benefits are highly effected by local circumstances and scale, and therefore difficult to quantify in a general way.
Competent Authorities
Driving pressure for actions are exceedances. Cost/benefit analysis are extensive and time consuming. Generally the choice of measures are limited. Thus no additional burden should be implemented by making cost/benefit analysis mandatory.
Competent Authorities
Mandatory data collection of traffic intensity on a local scale (street canyon effects)
Other To develop a unique tool easy to be used at city level; improve availabilty of sanitary and health data for technicians
NGO Link air quality plans with data reported under the NEC Directive (including projections).
NGO
Cost benefit analysis is not an appropriate primary method for selecting measures for inclusion in an air quality plan. The correct approach to air quality plans is to include all technically feasible and effective measures to bring forward compliance. A vast body of jurisprudence of the Court of Justice of the EU and national courts have clarified that the obligations set by Articles 13 and 23 of the AQD are not qualified by the cost of the different measures to tackle air pollution. The CJEU have consistently rejected arguments of Member States that have tried to justify delays in achieving limit values because of financial and budgetary considerations. See for instance the ruling of the Grand Chamber of the CJEU in Case C-644/18 Commission v. Italy: “structural difficulties arising from the socio-economic and budgetary implications of large-scale investments that need to be carried out, [are] not, in themselves, exceptional and [are] not such as to rule out the possibility that shorter deadlines could have been set (see, to that effect, judgments of 24 October 2019, Commission v France (Exceeding limit values for nitrogen dioxide), C-636/18, EU:C:2019:900, paragraph 85, and, by analogy, of 22 February 2018, Commission v Poland, C-336/16, EU:C:2018:94, paragraph 101).” Other similar, and very clear, statements on the (limited) role of cost considerations have been made by national courts called upon to apply the Air Quality Directive. See for instance ruling of the UK High Court in ClientEarth (No.2) v Secretary of State for the Environment, Food and Rural Affairs (2016): “there can be no objection to a Member State having regard to cost when choosing between two equally effective measures. […] But I reject any suggestion that the state can have any regard to cost in fixing the target date for compliance or in determining the route by which the compliance can be achieved where one route produces results quicker than another. In those respects the determining consideration has to be the efficacy of the measure in question and not their cost. That, it seems to me, flows inevitably from the requirements in the Article to keep the exceedance period as short as possible” In other words, when it comes to cost benefit, the AQD should clarify expressly that, when selecting measures to tackle air quality, the determining factor must be their efficacy not their cost. Competent authorities must identify which measures will meet the legal limits in the shortest time. The primary obligation is to protect human health through the achievement of the limit values by the earliest possible date. Considerations such as cost
Strengthening of air quality monitoring, modelling and plans under the Ambient Air Quality Directives Ref: ED14240 | Phase 1 Technical Annex | Issue number B2 | Date 22/09/21
239
or unpopularity of measures are not lawful reasons for excluding effective measures from a plan. The only situation in which cost can be taken into consideration is where there are two equally effective measures i.e. only where two measures can be shown to be equally effective at bringing forward the likely date of compliance can the authority lawfully choose the lowest cost option. Consequently, cost benefit analysis is not an appropriate primary method for selecting measures for inclusion in an air quality plan. Measures which would be most effective in bringing forward the likely compliance date should be included in an air quality plan.
NGO
Impacts heavily rely on the specific situation. Even simple measure like traffic speed reductions rely on the traffic composition (heavy trucks, light trucks, passenger cars, buses), the level of service, slope and gradient of speed. Most relevant is to make the impact on pollutant concentration mandatory for measures which are securely implemented. It is not useful to calculate impact on measures which are in the planning or concept phase, subject to financing, subject to a political decision or dependent on the behaviour of third parties. Otherwise, the effectiveness of many measures will be calculated that will not be implemented in the end. This would be counterproductive and would forecast pollution reductions that do not occur. The concentration of air pollutants is the decisive factor. Cost-benefit analyses are only helpful for communication purposes.
NGO Analysis of cost with internalisation of costs of measures is a crucial tool (e.g. traffic reduction etc...)
Other
Guidance of how to convert from measures to emissions values will be very useful Guidance on how to link to National air quality plans as boundary conditions will be very useful Guidance on how to deal with meteorological variability will be very useful. The AAQD focuses on impacts on air quality concentrations and compliance with limit and target values - Before extending the guidance to the evaluation of additional cost and benefits (such as health impacts, energy and infrastructure (buildings) savings, ecosystem damages, etc..) a harmonised QA/QC protocol for air quality plans will be very helpful.
240
5.5.3 Main messages
This section of the survey was completed by a wide range of participants. Germany was the most
represented country in this question (21%) followed by Italy (15%), with a significant proportion of the
participants stating that they represent the designated authorities at the regional level (33%).
The results from this section of the survey show that a majority of the participants (71%) declared they
have undertaken ex-ante estimates of the impact of measures in their air quality plans. When the ex-
ante estimate of the impact of measures in the current air quality plan is performed, the most common
method used is the Use of complex dispersion/regional scale modelling to estimate concentration
reduction plus future projections to determine when compliance is likely, as stated by 26% of
participants referencing the current air quality plan and 23% referencing the previous air quality plan.
When the ex-ante estimate of the impact of measures was made for the current plan, 70% of participants
stated that the estimation is completed at city scale and 62% referred to roadside locations.
To evaluate the success of the current air quality plan, the participants usually use two metrics (47%)
and the most common metric is the reduction in air pollutant concentrations selected by 50% of
respondents followed by emissions reduction (30%).
Of those respondents indicating that ex-ante quantification of improvements in air quality are made in
the current air quality plan, 79% stated that they use it for packages of measures, 75% undertake the
analysis for all measures and 67% for individual measures.
When respondents were asked what they took into account for health impact assessments most of the
replies (69%) suggested the participants did not undertake such an assessment suggesting that health
impact assessments are not widely undertaken.
The survey also asked participants whether any estimations were made on their plan’s impact on the
environment. Only a small proportion of participants (6%) who supplied a response to this question
stated that their associated country included mechanisms in its policy framework to estimate the
ecosystem damages by proposed/implemented measures to improve air quality.
Half of the participants declared they did not include cost or benefits analysis to support their current
air quality plan and only 28% include both cost and benefit estimations. At the same time, most of the
participants stated that the cost estimates and the cost saving are not currently utilised to secure funds
for measure implementation.
The survey also highlights several barriers the participants faced to quantify the measures in their
current plan such as the effectiveness of the measure was too uncertain/unknown (26%) and because
the measure was complementary to a core measure (22%).
Most of the participants (71%) stated that more guidance on the quantification of costs of measures
would be very helpful and somewhat helpful in delivering a more effective air quality plan. 88% of this
group suggested that the guidance should present technical documentation about the quantification of
expected impacts on air quality, the technical guidance on the monetary estimation of costs and benefits
was suggested by 79% and the guidance detailing software tools by 74%.
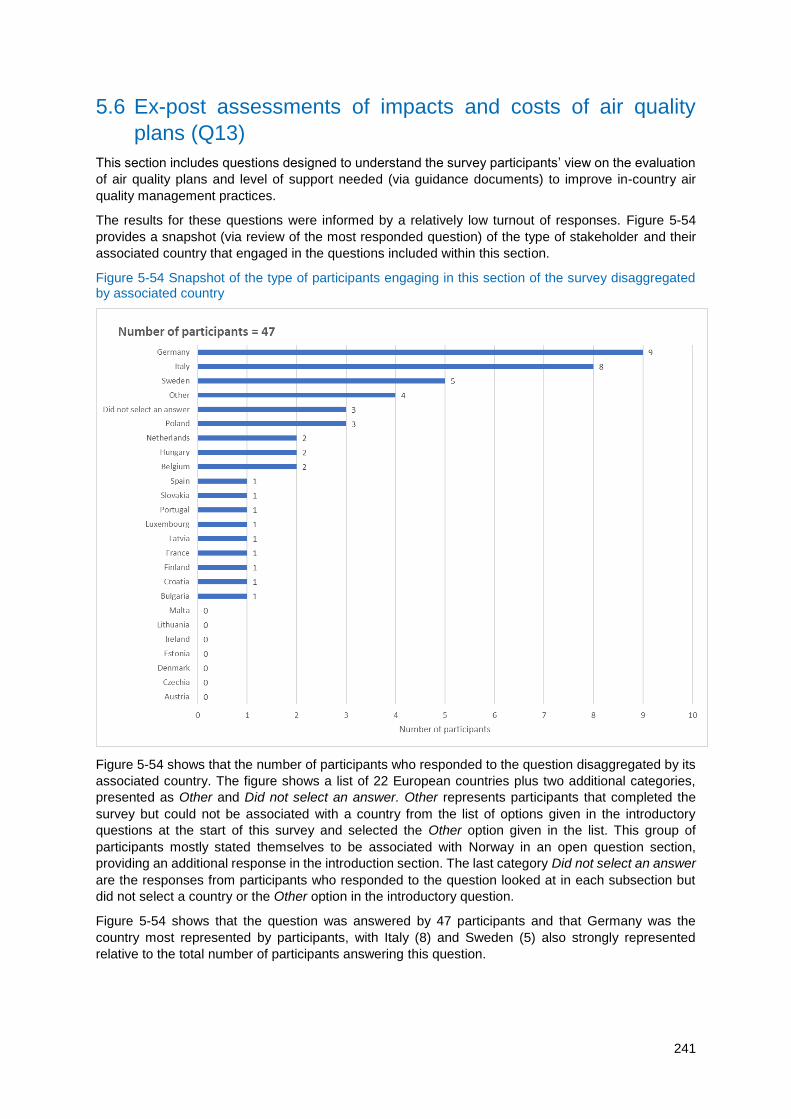
241
5.6 Ex-post assessments of impacts and costs of air quality
plans (Q13)
This section includes questions designed to understand the survey participants’ view on the evaluation
of air quality plans and level of support needed (via guidance documents) to improve in-country air
quality management practices.
The results for these questions were informed by a relatively low turnout of responses. Figure 5-54
provides a snapshot (via review of the most responded question) of the type of stakeholder and their
associated country that engaged in the questions included within this section.
Figure 5-54 Snapshot of the type of participants engaging in this section of the survey disaggregated by associated country
Figure 5-54 shows that the number of participants who responded to the question disaggregated by its
associated country. The figure shows a list of 22 European countries plus two additional categories,
presented as Other and Did not select an answer. Other represents participants that completed the
survey but could not be associated with a country from the list of options given in the introductory
questions at the start of this survey and selected the Other option given in the list. This group of
participants mostly stated themselves to be associated with Norway in an open question section,
providing an additional response in the introduction section. The last category Did not select an answer
are the responses from participants who responded to the question looked at in each subsection but
did not select a country or the Other option in the introductory question.
Figure 5-54 shows that the question was answered by 47 participants and that Germany was the
country most represented by participants, with Italy (8) and Sweden (5) also strongly represented
relative to the total number of participants answering this question.

242
Figure 5-55 Overview of the type of participants engaging in this section of the survey disaggregated by stakeholder type
Figure 5-55 shows that regional competent authorities was the most represented stakeholder group in
answers to this section of questions with local and national stakeholder also representing a sizable
proportion of the responses.
Generally, the results from each question found a relatively high number of responses from Germany,
Italy and Sweden. The analysis for each question reviews the high-level response to each question and
then shows whether the responses differed between participants of different countries. The analysis
does not provide any lengthy insight into whether opinions differ between stakeholder type, so it is
important to bear in mind that the influence of responses from Germany are largely provided by
participants of the designated competent authority at the regional level stakeholder type.
5.6.1 Current situation
5.6.1.1 Have you evaluated the effect of your current air quality plan over the period of its application?
(13.1)
This question is designed to understand whether participants are actively involved in the evaluation of
its air quality plans. This was a closed question in which participants were asked to select an answer
from a choice of three options; Yes, No or I do not know. Participants who selected Yes were invited to
answer a follow up question regarding their methodology for evaluating the impacts of their air quality
plans.
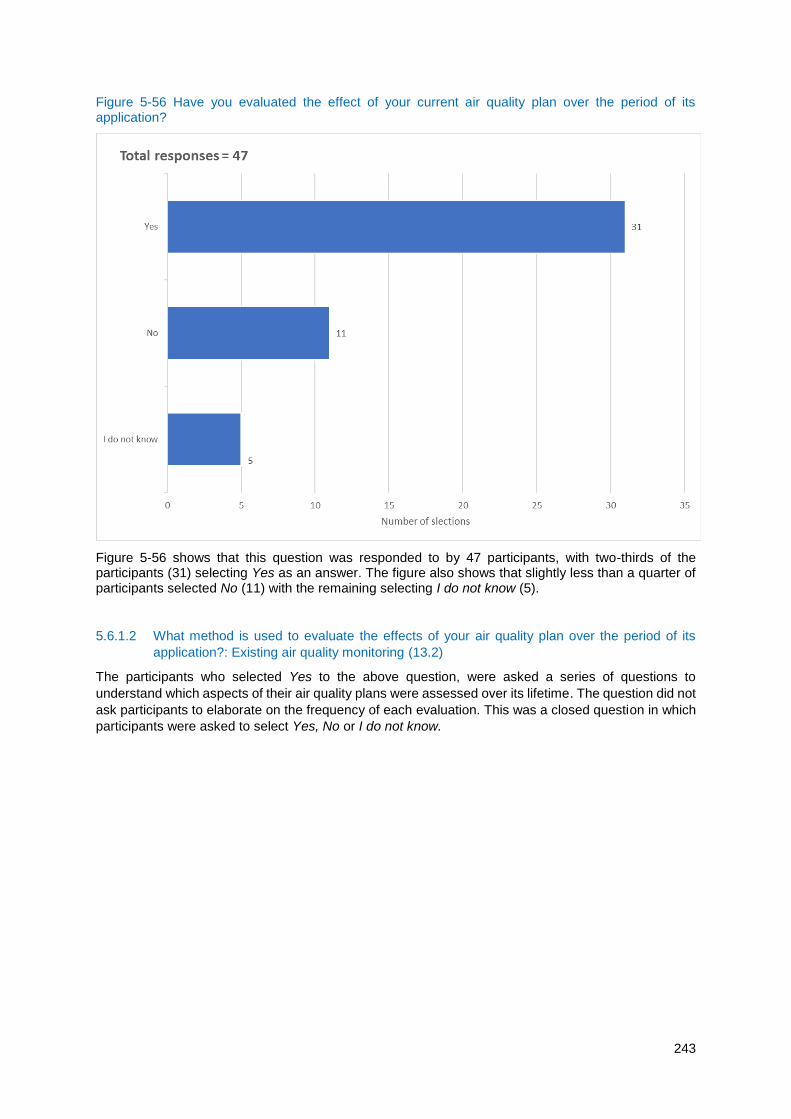
243
Figure 5-56 Have you evaluated the effect of your current air quality plan over the period of its application?
Figure 5-56 shows that this question was responded to by 47 participants, with two-thirds of the participants (31) selecting Yes as an answer. The figure also shows that slightly less than a quarter of participants selected No (11) with the remaining selecting I do not know (5).
5.6.1.2 What method is used to evaluate the effects of your air quality plan over the period of its
application?: Existing air quality monitoring (13.2)
The participants who selected Yes to the above question, were asked a series of questions to
understand which aspects of their air quality plans were assessed over its lifetime. The question did not
ask participants to elaborate on the frequency of each evaluation. This was a closed question in which
participants were asked to select Yes, No or I do not know.
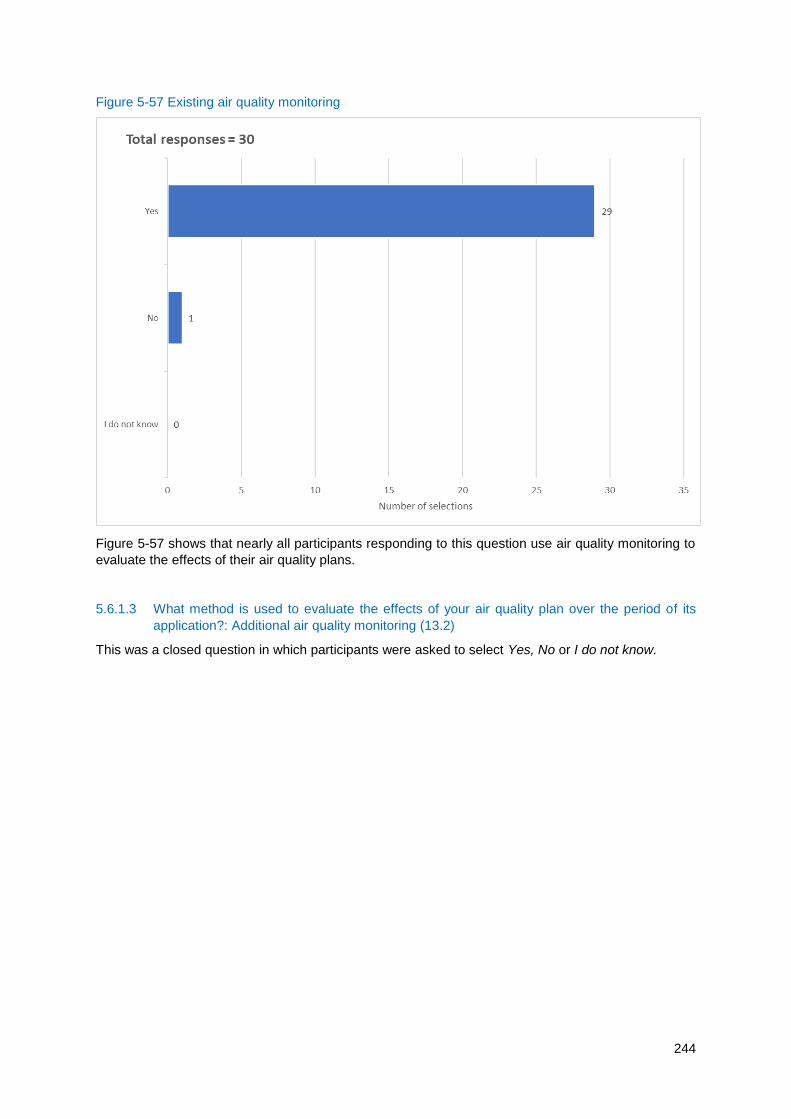
244
Figure 5-57 Existing air quality monitoring
Figure 5-57 shows that nearly all participants responding to this question use air quality monitoring to
evaluate the effects of their air quality plans.
5.6.1.3 What method is used to evaluate the effects of your air quality plan over the period of its
application?: Additional air quality monitoring (13.2)
This was a closed question in which participants were asked to select Yes, No or I do not know.

245
Figure 5-58 Additional air quality monitoring
Figure 5-58 shows a mixed response to this question with an almost even spread between those who
selected Yes (11) as an answer and those who selected No (10).
5.6.1.4 What method is used to evaluate the effects of your air quality plan over the period of its
application? Activity monitoring (e.g. traffic flows, or fleet composition via Automatic number
plate recognition cameras, fuel sales) (13.2)
This was a closed question in which participants were asked to select Yes, No or I do not know.
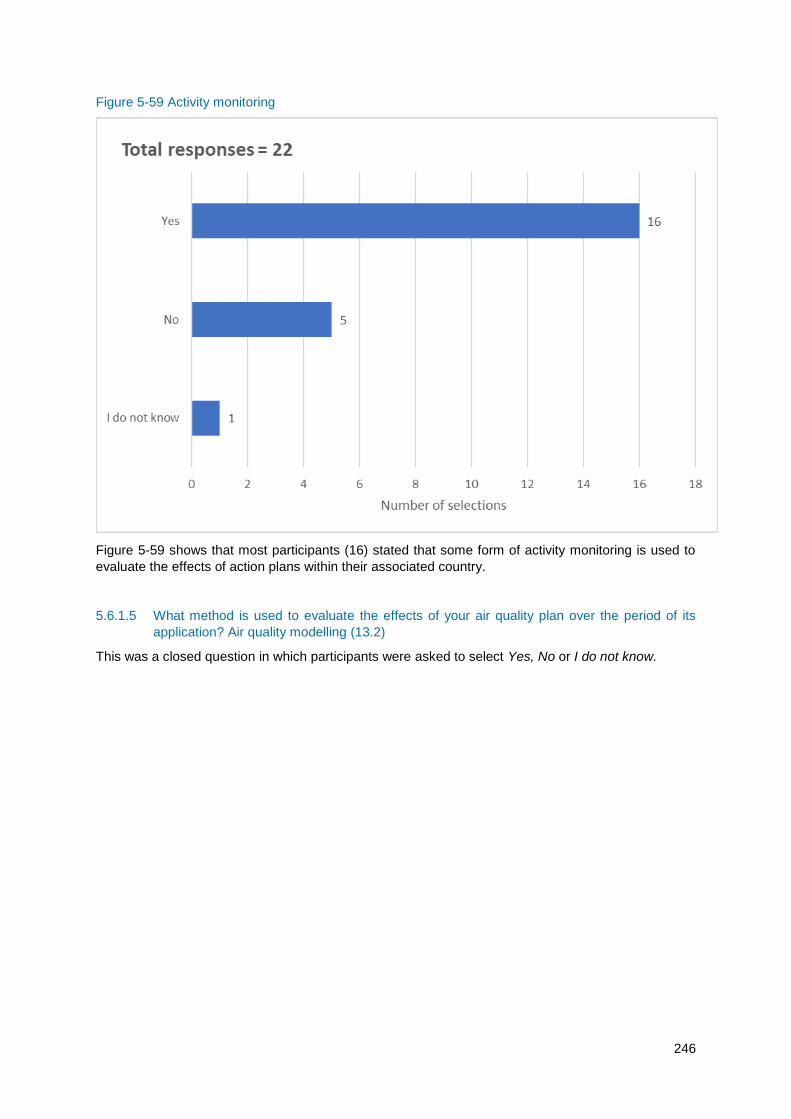
246
Figure 5-59 Activity monitoring
Figure 5-59 shows that most participants (16) stated that some form of activity monitoring is used to
evaluate the effects of action plans within their associated country.
5.6.1.5 What method is used to evaluate the effects of your air quality plan over the period of its
application? Air quality modelling (13.2)
This was a closed question in which participants were asked to select Yes, No or I do not know.
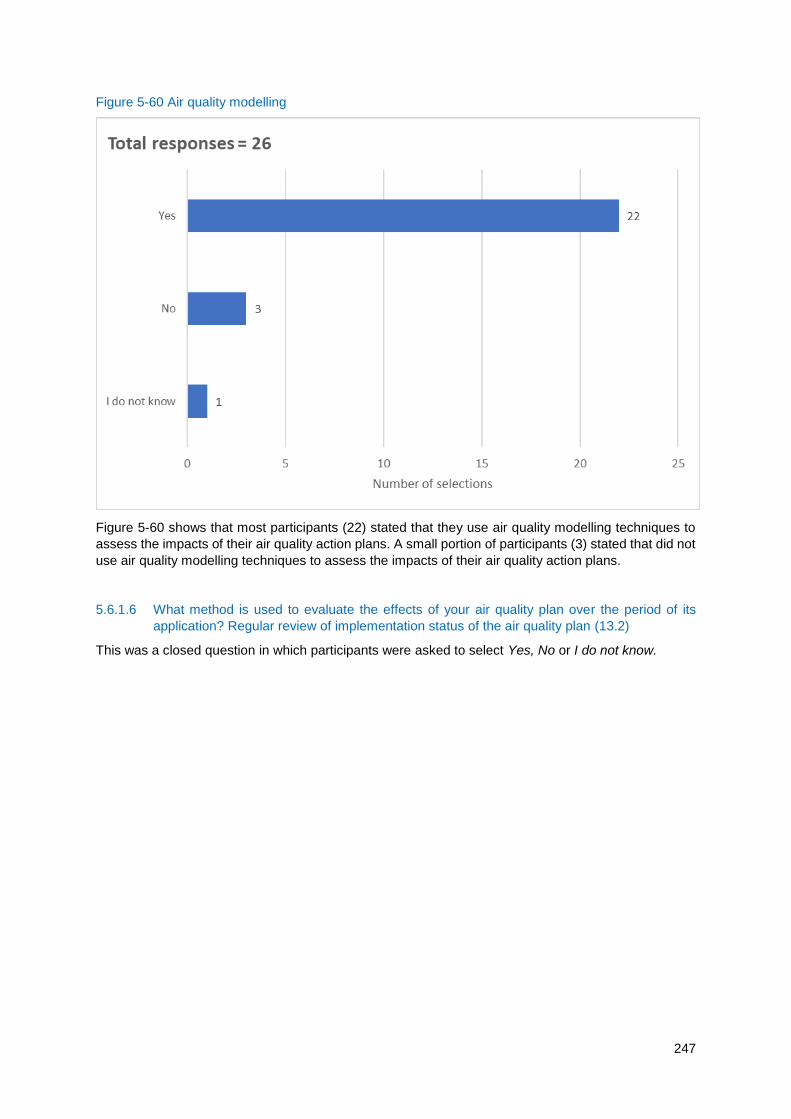
247
Figure 5-60 Air quality modelling
Figure 5-60 shows that most participants (22) stated that they use air quality modelling techniques to
assess the impacts of their air quality action plans. A small portion of participants (3) stated that did not
use air quality modelling techniques to assess the impacts of their air quality action plans.
5.6.1.6 What method is used to evaluate the effects of your air quality plan over the period of its
application? Regular review of implementation status of the air quality plan (13.2)
This was a closed question in which participants were asked to select Yes, No or I do not know.
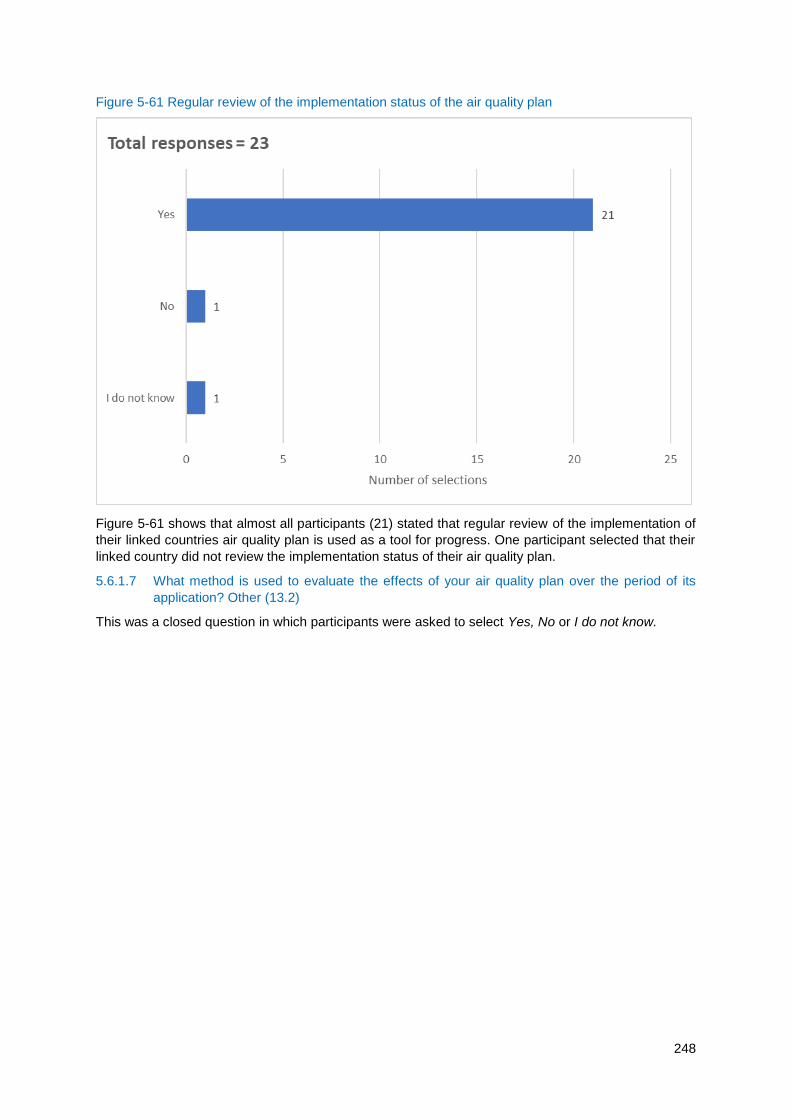
248
Figure 5-61 Regular review of the implementation status of the air quality plan
Figure 5-61 shows that almost all participants (21) stated that regular review of the implementation of
their linked countries air quality plan is used as a tool for progress. One participant selected that their
linked country did not review the implementation status of their air quality plan.
5.6.1.7 What method is used to evaluate the effects of your air quality plan over the period of its
application? Other (13.2)
This was a closed question in which participants were asked to select Yes, No or I do not know.
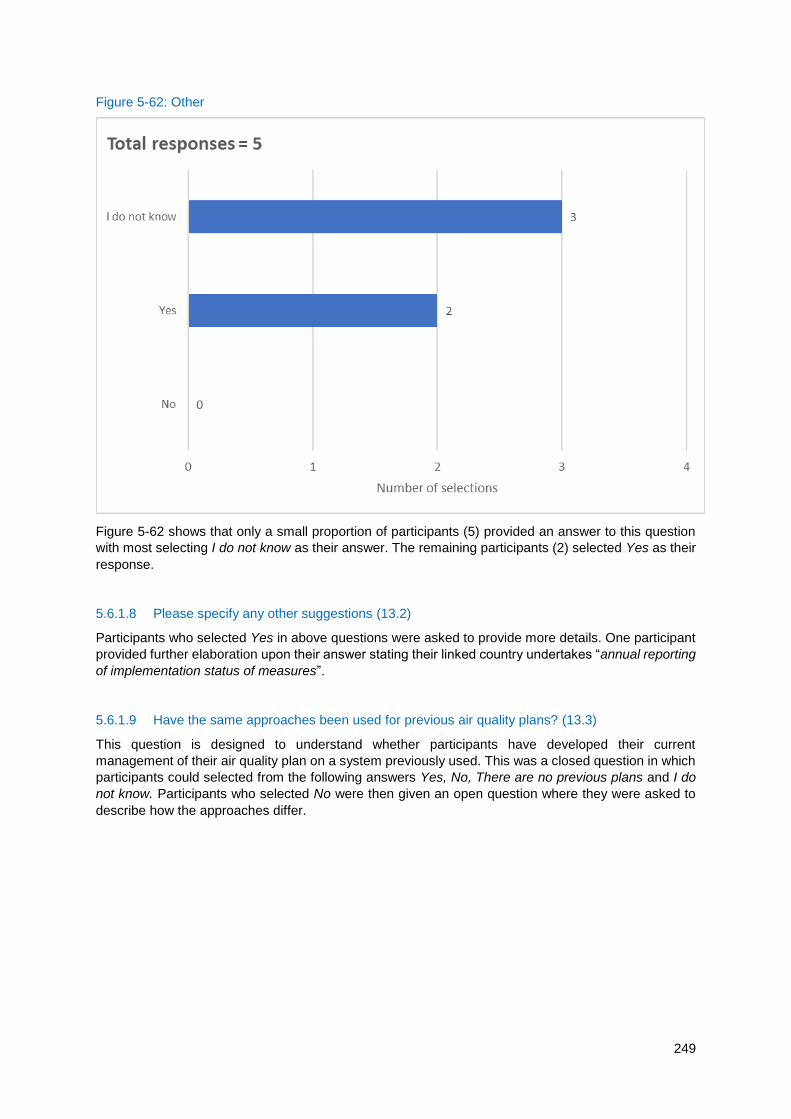
249
Figure 5-62: Other
Figure 5-62 shows that only a small proportion of participants (5) provided an answer to this question
with most selecting I do not know as their answer. The remaining participants (2) selected Yes as their
response.
5.6.1.8 Please specify any other suggestions (13.2)
Participants who selected Yes in above questions were asked to provide more details. One participant
provided further elaboration upon their answer stating their linked country undertakes “annual reporting
of implementation status of measures”.
5.6.1.9 Have the same approaches been used for previous air quality plans? (13.3)
This question is designed to understand whether participants have developed their current
management of their air quality plan on a system previously used. This was a closed question in which
participants could selected from the following answers Yes, No, There are no previous plans and I do
not know. Participants who selected No were then given an open question where they were asked to
describe how the approaches differ.
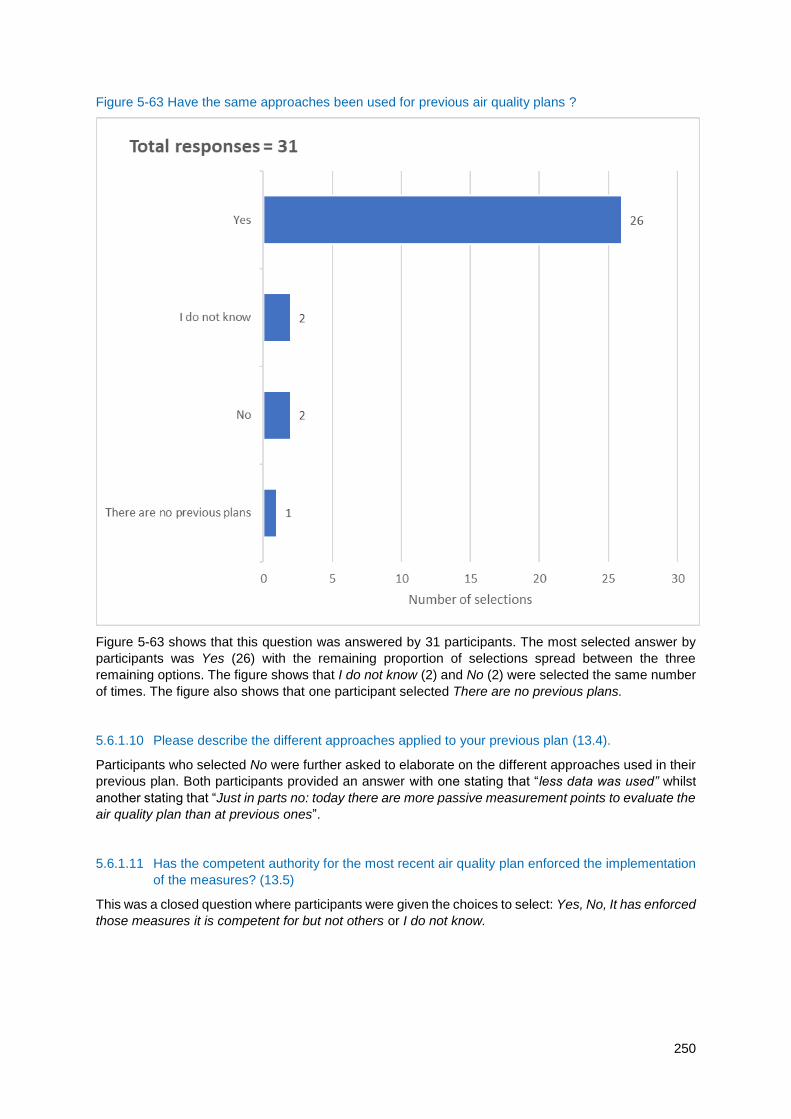
250
Figure 5-63 Have the same approaches been used for previous air quality plans ?
Figure 5-63 shows that this question was answered by 31 participants. The most selected answer by
participants was Yes (26) with the remaining proportion of selections spread between the three
remaining options. The figure shows that I do not know (2) and No (2) were selected the same number
of times. The figure also shows that one participant selected There are no previous plans.
5.6.1.10 Please describe the different approaches applied to your previous plan (13.4).
Participants who selected No were further asked to elaborate on the different approaches used in their
previous plan. Both participants provided an answer with one stating that “less data was used” whilst
another stating that “Just in parts no: today there are more passive measurement points to evaluate the
air quality plan than at previous ones”.
5.6.1.11 Has the competent authority for the most recent air quality plan enforced the implementation
of the measures? (13.5)
This was a closed question where participants were given the choices to select: Yes, No, It has enforced
those measures it is competent for but not others or I do not know.
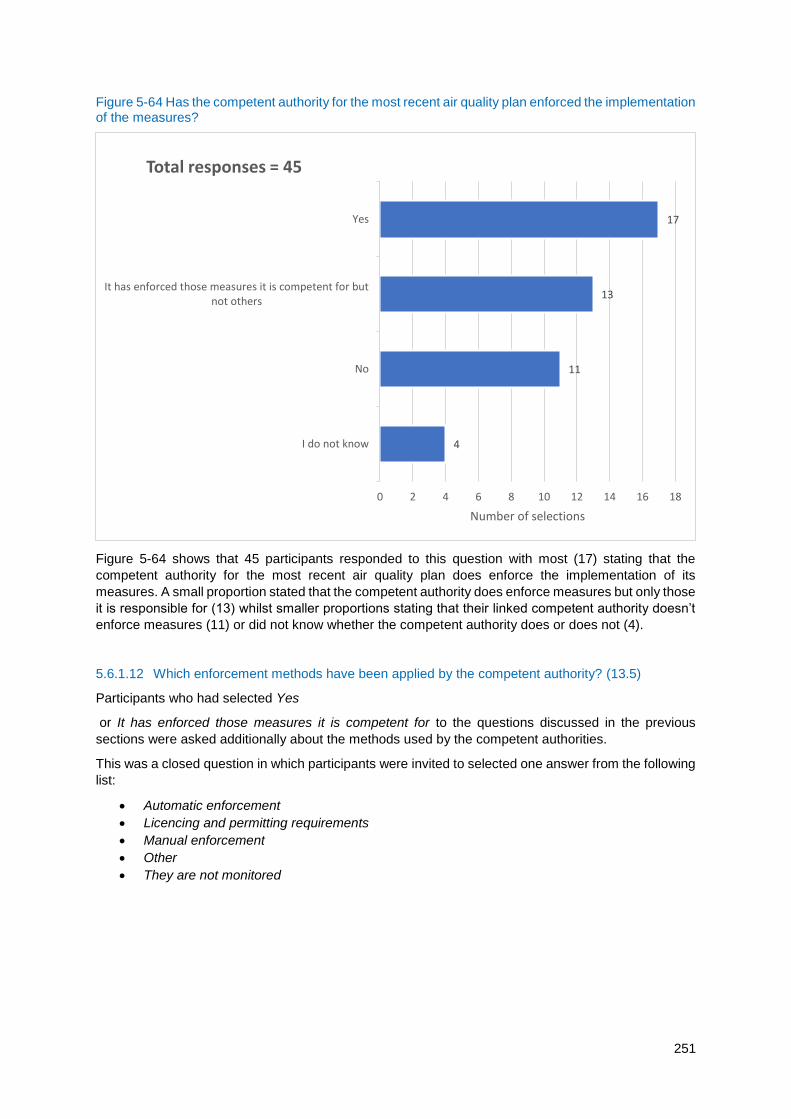
251
Figure 5-64 Has the competent authority for the most recent air quality plan enforced the implementation of the measures?
Figure 5-64 shows that 45 participants responded to this question with most (17) stating that the
competent authority for the most recent air quality plan does enforce the implementation of its
measures. A small proportion stated that the competent authority does enforce measures but only those
it is responsible for (13) whilst smaller proportions stating that their linked competent authority doesn’t
enforce measures (11) or did not know whether the competent authority does or does not (4).
5.6.1.12 Which enforcement methods have been applied by the competent authority? (13.5)
Participants who had selected Yes
or It has enforced those measures it is competent for to the questions discussed in the previous
sections were asked additionally about the methods used by the competent authorities.
This was a closed question in which participants were invited to selected one answer from the following
list:
Automatic enforcement
Licencing and permitting requirements
Manual enforcement
Other
They are not monitored
4
11
13
17
I do not know
No
It has enforced those measures it is competent for butnot others
Yes
0 2 4 6 8 10 12 14 16 18
Number of selections
Total responses = 45
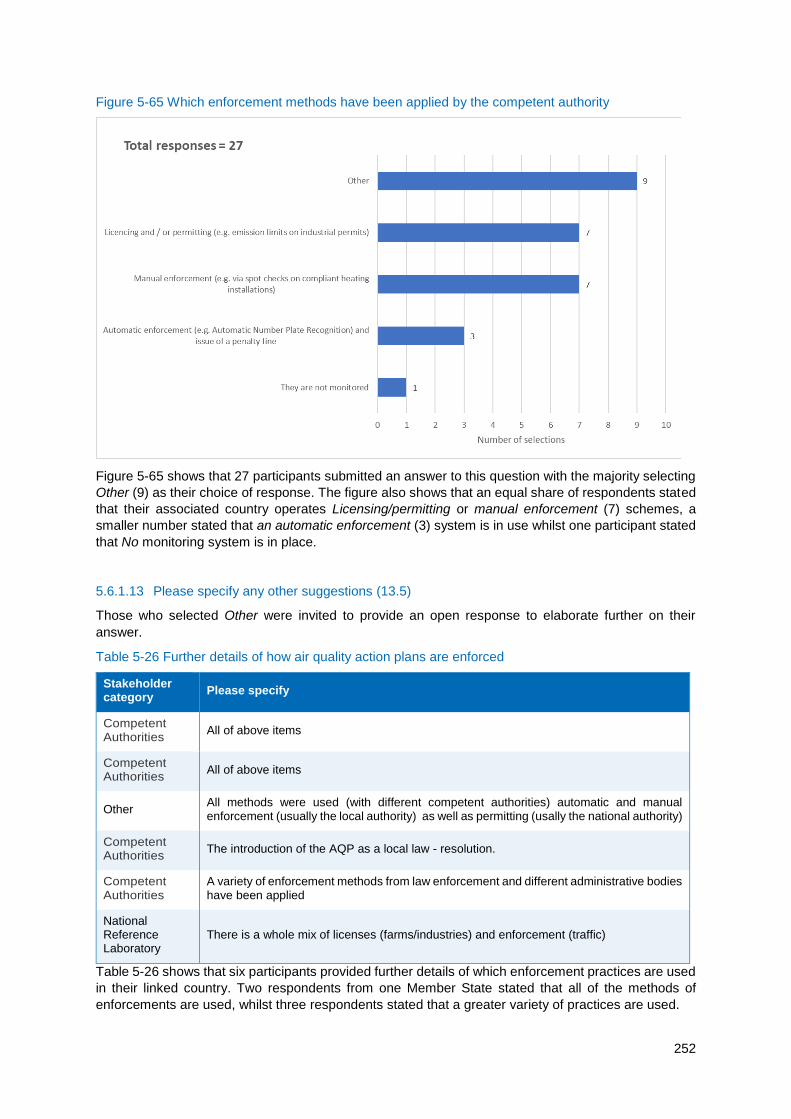
252
Figure 5-65 Which enforcement methods have been applied by the competent authority
Figure 5-65 shows that 27 participants submitted an answer to this question with the majority selecting
Other (9) as their choice of response. The figure also shows that an equal share of respondents stated
that their associated country operates Licensing/permitting or manual enforcement (7) schemes, a
smaller number stated that an automatic enforcement (3) system is in use whilst one participant stated
that No monitoring system is in place.
5.6.1.13 Please specify any other suggestions (13.5)
Those who selected Other were invited to provide an open response to elaborate further on their
answer.
Table 5-26 Further details of how air quality action plans are enforced
Stakeholder category
Please specify
Competent Authorities
All of above items
Competent Authorities
All of above items
Other All methods were used (with different competent authorities) automatic and manual enforcement (usually the local authority) as well as permitting (usally the national authority)
Competent Authorities
The introduction of the AQP as a local law - resolution.
Competent Authorities
A variety of enforcement methods from law enforcement and different administrative bodies have been applied
National Reference Laboratory
There is a whole mix of licenses (farms/industries) and enforcement (traffic)
Table 5-26 shows that six participants provided further details of which enforcement practices are used
in their linked country. Two respondents from one Member State stated that all of the methods of
enforcements are used, whilst three respondents stated that a greater variety of practices are used.
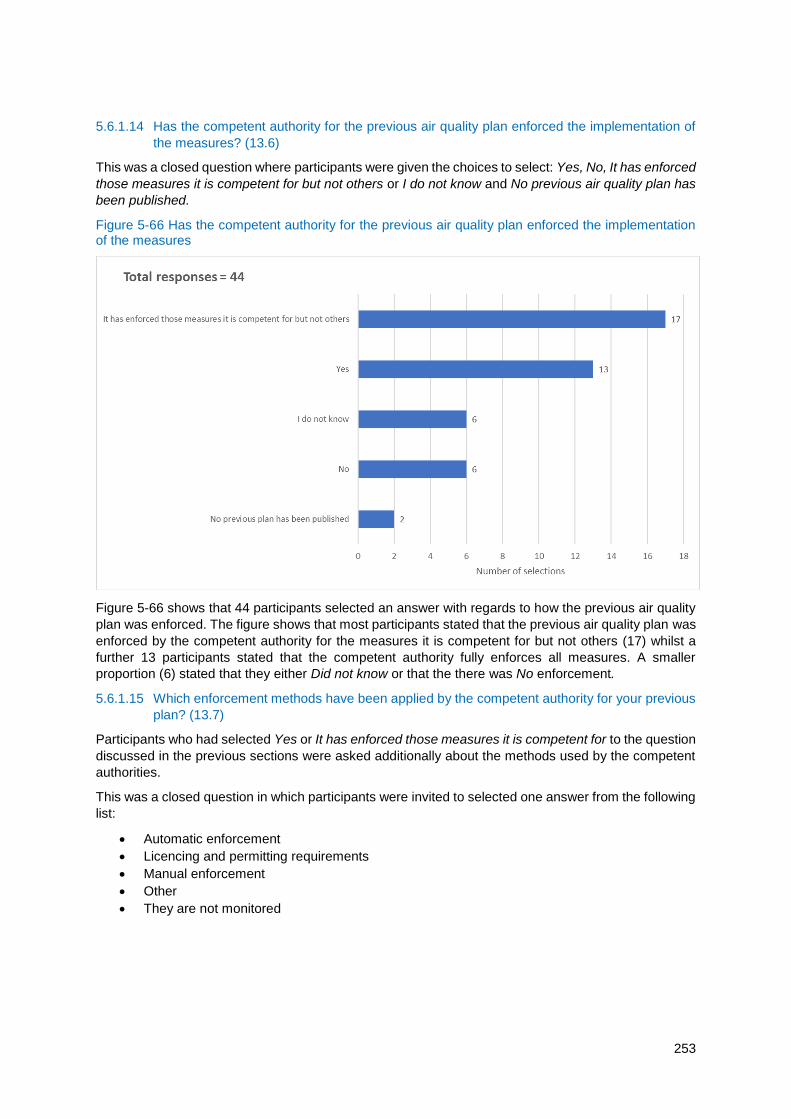
253
5.6.1.14 Has the competent authority for the previous air quality plan enforced the implementation of
the measures? (13.6)
This was a closed question where participants were given the choices to select: Yes, No, It has enforced
those measures it is competent for but not others or I do not know and No previous air quality plan has
been published.
Figure 5-66 Has the competent authority for the previous air quality plan enforced the implementation of the measures
Figure 5-66 shows that 44 participants selected an answer with regards to how the previous air quality
plan was enforced. The figure shows that most participants stated that the previous air quality plan was
enforced by the competent authority for the measures it is competent for but not others (17) whilst a
further 13 participants stated that the competent authority fully enforces all measures. A smaller
proportion (6) stated that they either Did not know or that the there was No enforcement.
5.6.1.15 Which enforcement methods have been applied by the competent authority for your previous
plan? (13.7)
Participants who had selected Yes or It has enforced those measures it is competent for to the question
discussed in the previous sections were asked additionally about the methods used by the competent
authorities.
This was a closed question in which participants were invited to selected one answer from the following
list:
Automatic enforcement
Licencing and permitting requirements
Manual enforcement
Other
They are not monitored
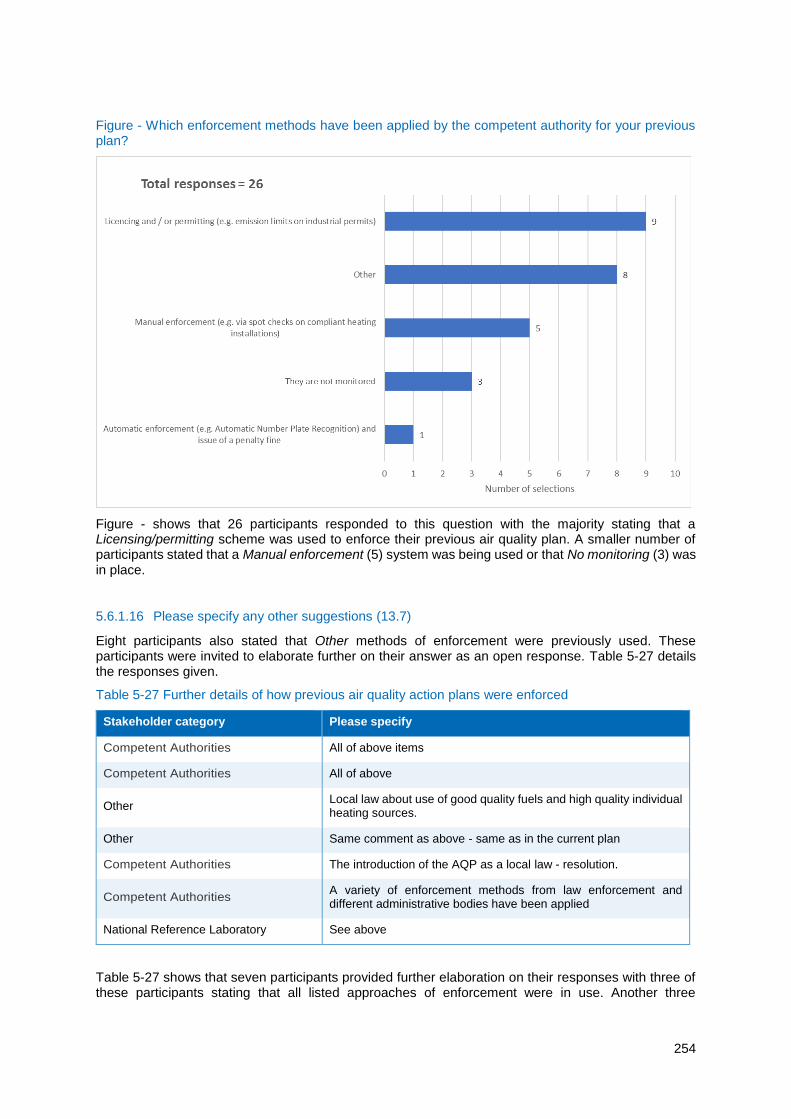
254
Figure - Which enforcement methods have been applied by the competent authority for your previous plan?
Figure - shows that 26 participants responded to this question with the majority stating that a Licensing/permitting scheme was used to enforce their previous air quality plan. A smaller number of participants stated that a Manual enforcement (5) system was being used or that No monitoring (3) was in place.
5.6.1.16 Please specify any other suggestions (13.7)
Eight participants also stated that Other methods of enforcement were previously used. These participants were invited to elaborate further on their answer as an open response. Table 5-27 details the responses given.
Table 5-27 Further details of how previous air quality action plans were enforced
Stakeholder category Please specify
Competent Authorities All of above items
Competent Authorities All of above
Other Local law about use of good quality fuels and high quality individual heating sources.
Other Same comment as above - same as in the current plan
Competent Authorities The introduction of the AQP as a local law - resolution.
Competent Authorities A variety of enforcement methods from law enforcement and different administrative bodies have been applied
National Reference Laboratory See above
Table 5-27 shows that seven participants provided further elaboration on their responses with three of these participants stating that all listed approaches of enforcement were in use. Another three
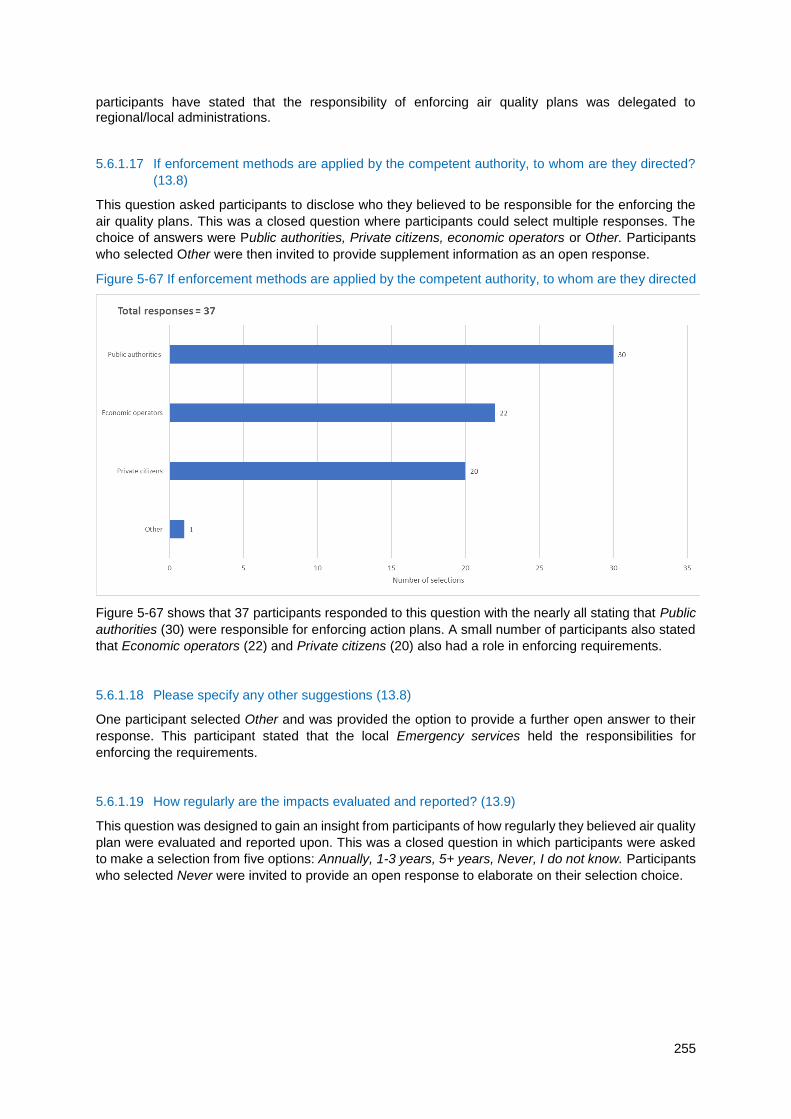
255
participants have stated that the responsibility of enforcing air quality plans was delegated to regional/local administrations.
5.6.1.17 If enforcement methods are applied by the competent authority, to whom are they directed?
(13.8)
This question asked participants to disclose who they believed to be responsible for the enforcing the
air quality plans. This was a closed question where participants could select multiple responses. The
choice of answers were Public authorities, Private citizens, economic operators or Other. Participants
who selected Other were then invited to provide supplement information as an open response.
Figure 5-67 If enforcement methods are applied by the competent authority, to whom are they directed
Figure 5-67 shows that 37 participants responded to this question with the nearly all stating that Public
authorities (30) were responsible for enforcing action plans. A small number of participants also stated
that Economic operators (22) and Private citizens (20) also had a role in enforcing requirements.
5.6.1.18 Please specify any other suggestions (13.8)
One participant selected Other and was provided the option to provide a further open answer to their
response. This participant stated that the local Emergency services held the responsibilities for
enforcing the requirements.
5.6.1.19 How regularly are the impacts evaluated and reported? (13.9)
This question was designed to gain an insight from participants of how regularly they believed air quality
plan were evaluated and reported upon. This was a closed question in which participants were asked
to make a selection from five options: Annually, 1-3 years, 5+ years, Never, I do not know. Participants
who selected Never were invited to provide an open response to elaborate on their selection choice.
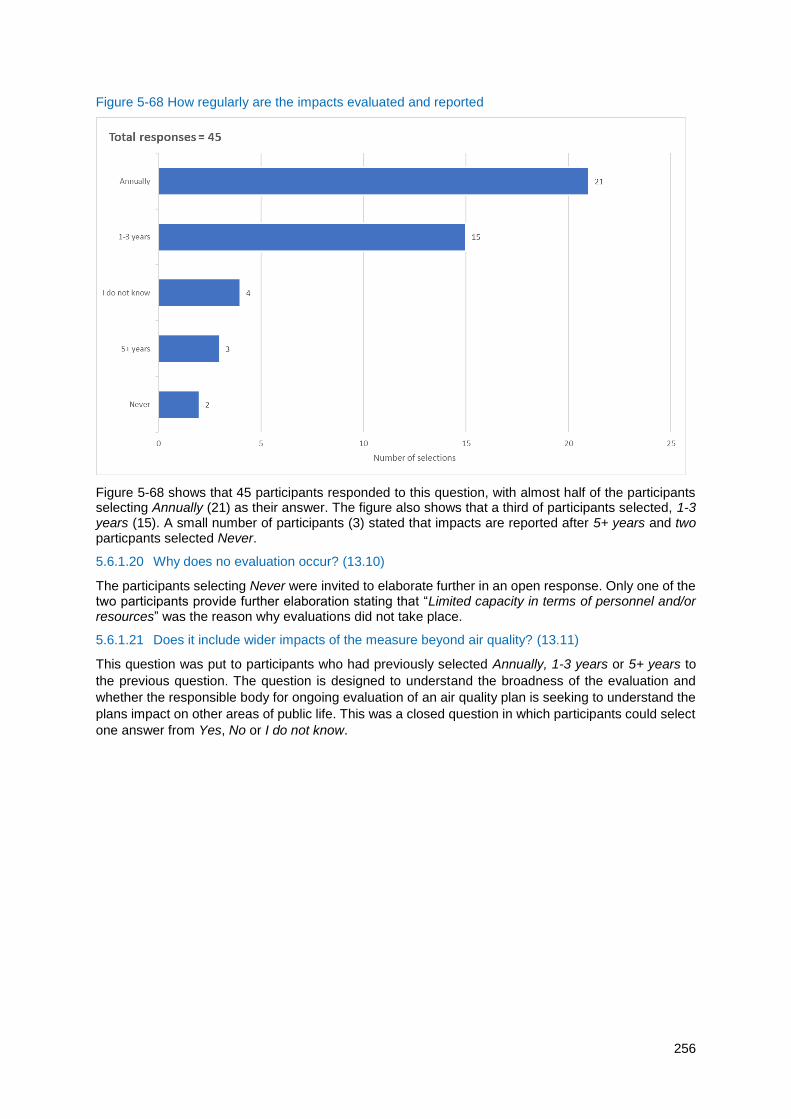
256
Figure 5-68 How regularly are the impacts evaluated and reported
Figure 5-68 shows that 45 participants responded to this question, with almost half of the participants selecting Annually (21) as their answer. The figure also shows that a third of participants selected, 1-3 years (15). A small number of participants (3) stated that impacts are reported after 5+ years and two particpants selected Never.
5.6.1.20 Why does no evaluation occur? (13.10)
The participants selecting Never were invited to elaborate further in an open response. Only one of the two participants provide further elaboration stating that “Limited capacity in terms of personnel and/or resources” was the reason why evaluations did not take place.
5.6.1.21 Does it include wider impacts of the measure beyond air quality? (13.11)
This question was put to participants who had previously selected Annually, 1-3 years or 5+ years to
the previous question. The question is designed to understand the broadness of the evaluation and
whether the responsible body for ongoing evaluation of an air quality plan is seeking to understand the
plans impact on other areas of public life. This was a closed question in which participants could select
one answer from Yes, No or I do not know.
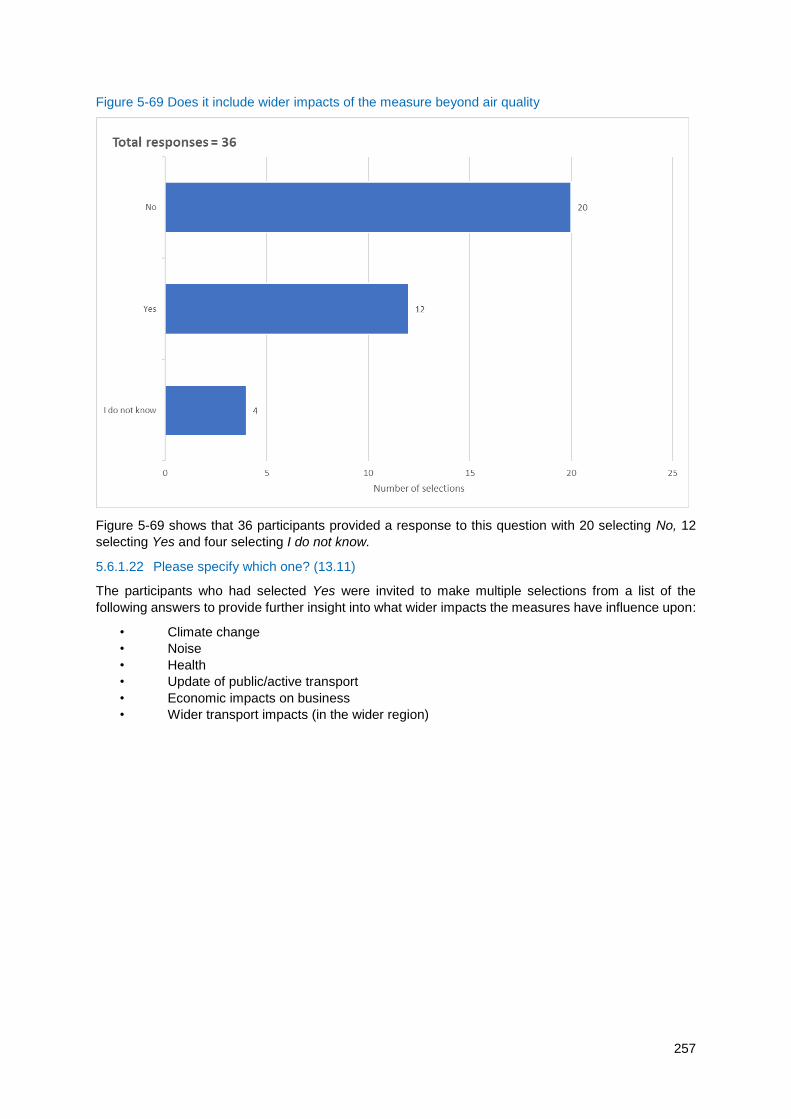
257
Figure 5-69 Does it include wider impacts of the measure beyond air quality
Figure 5-69 shows that 36 participants provided a response to this question with 20 selecting No, 12
selecting Yes and four selecting I do not know.
5.6.1.22 Please specify which one? (13.11)
The participants who had selected Yes were invited to make multiple selections from a list of the
following answers to provide further insight into what wider impacts the measures have influence upon:
• Climate change
• Noise
• Health
• Update of public/active transport
• Economic impacts on business
• Wider transport impacts (in the wider region)
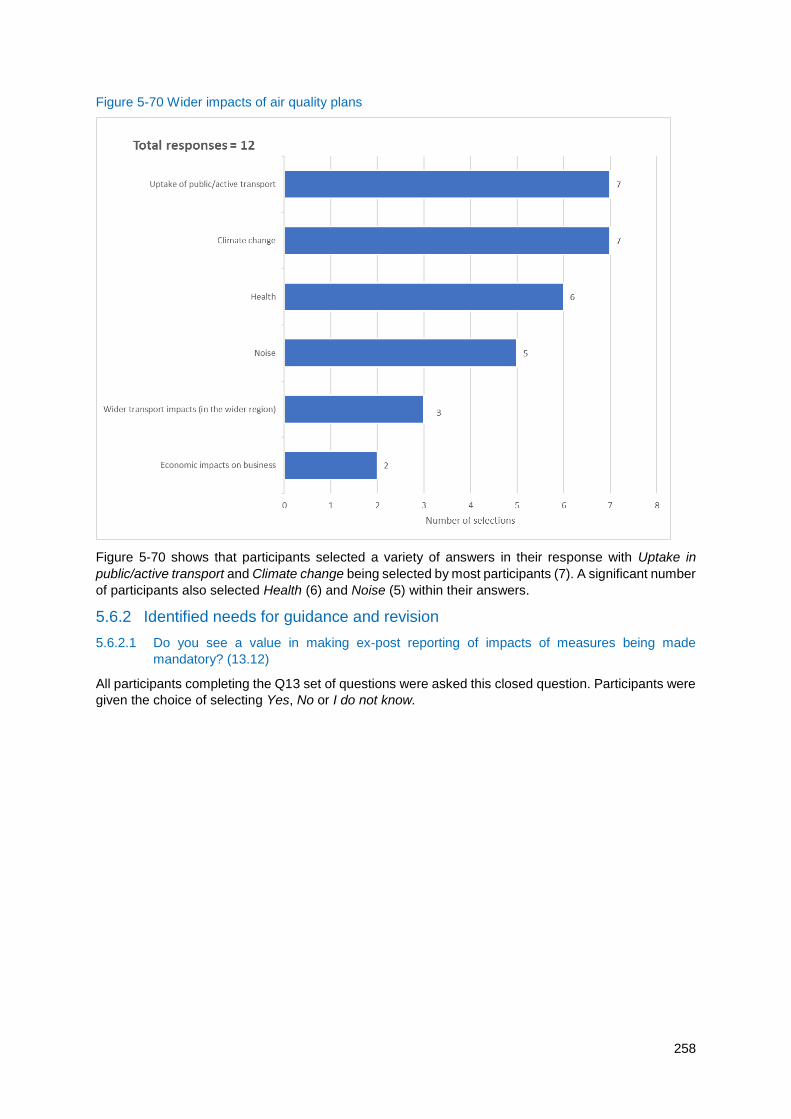
258
Figure 5-70 Wider impacts of air quality plans
Figure 5-70 shows that participants selected a variety of answers in their response with Uptake in
public/active transport and Climate change being selected by most participants (7). A significant number
of participants also selected Health (6) and Noise (5) within their answers.
5.6.2 Identified needs for guidance and revision
5.6.2.1 Do you see a value in making ex-post reporting of impacts of measures being made
mandatory? (13.12)
All participants completing the Q13 set of questions were asked this closed question. Participants were
given the choice of selecting Yes, No or I do not know.
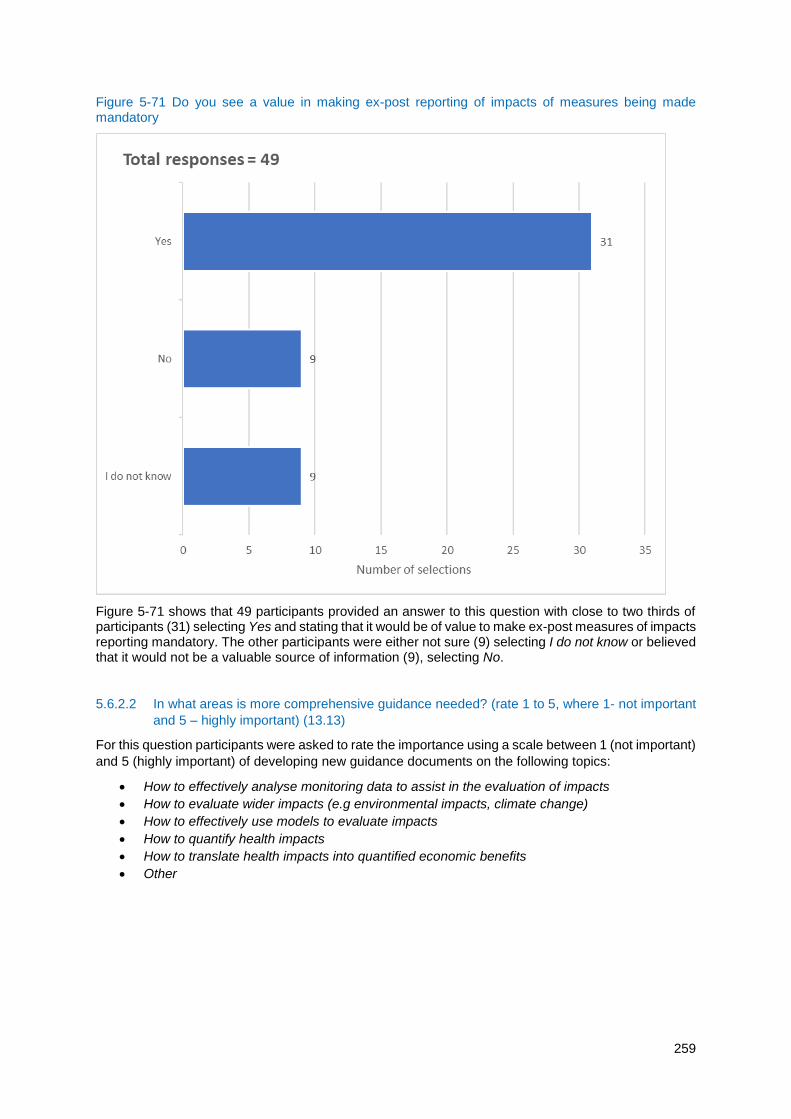
259
Figure 5-71 Do you see a value in making ex-post reporting of impacts of measures being made mandatory
Figure 5-71 shows that 49 participants provided an answer to this question with close to two thirds of participants (31) selecting Yes and stating that it would be of value to make ex-post measures of impacts reporting mandatory. The other participants were either not sure (9) selecting I do not know or believed that it would not be a valuable source of information (9), selecting No.
5.6.2.2 In what areas is more comprehensive guidance needed? (rate 1 to 5, where 1- not important
and 5 – highly important) (13.13)
For this question participants were asked to rate the importance using a scale between 1 (not important)
and 5 (highly important) of developing new guidance documents on the following topics:
How to effectively analyse monitoring data to assist in the evaluation of impacts
How to evaluate wider impacts (e.g environmental impacts, climate change)
How to effectively use models to evaluate impacts
How to quantify health impacts
How to translate health impacts into quantified economic benefits
Other
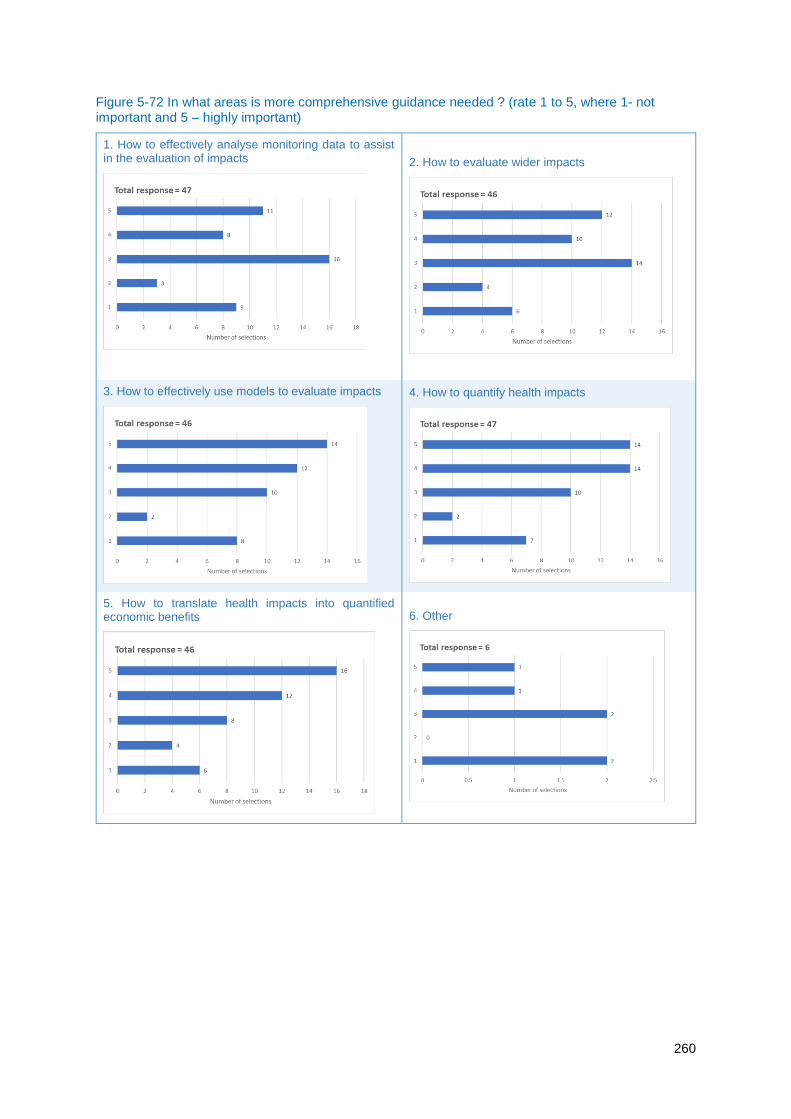
260
Figure 5-72 In what areas is more comprehensive guidance needed ? (rate 1 to 5, where 1- not important and 5 – highly important)
1. How to effectively analyse monitoring data to assist in the evaluation of impacts
2. How to evaluate wider impacts
3. How to effectively use models to evaluate impacts
4. How to quantify health impacts
5. How to translate health impacts into quantified economic benefits
6. Other
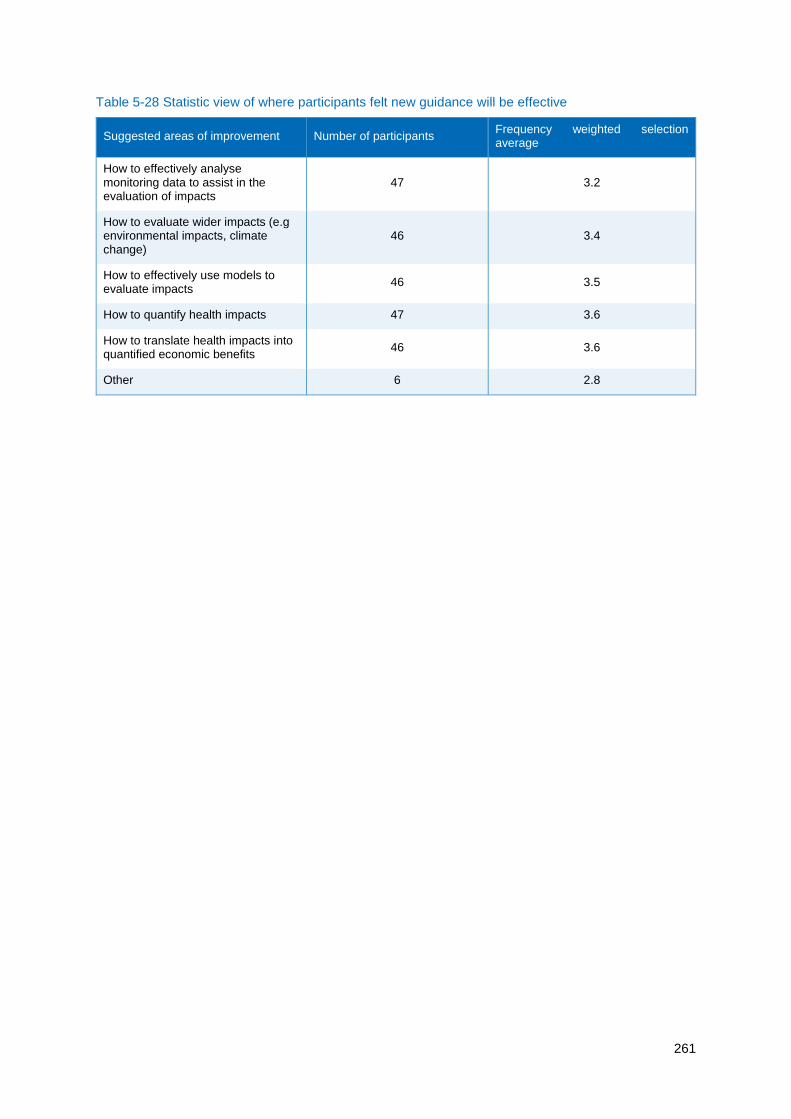
261
Table 5-28 Statistic view of where participants felt new guidance will be effective
Suggested areas of improvement Number of participants Frequency weighted selection average
How to effectively analyse monitoring data to assist in the evaluation of impacts
47 3.2
How to evaluate wider impacts (e.g environmental impacts, climate change)
46 3.4
How to effectively use models to evaluate impacts
46 3.5
How to quantify health impacts 47 3.6
How to translate health impacts into quantified economic benefits
46 3.6
Other 6 2.8

262
Figure 5-72 and

263
Table 5-28 shows that overall participants considered new guidance documents to be highly important
in all topics, although it is also quite clear that a significant proportion of participants also stated the
opposite extreme (selecting 1). Each section of column charts is discussed in further detail under its
relevant subheading.
With regards to How to effectively analyse monitoring data to assist in the evaluation of impacts
question, a large proportion of participants (20) selected one of the extreme options (1 or 5). For this
question the most selected answer was 3, followed by 5 (highly important) and 1 (not important). The
table shows that the frequency weighted mean for selections in this category was 3.2, suggesting a
modest need for more comprehensive guidance.
A similar finding was shown when considering how to evaluate How to evaluate wider impacts
question 3 (14) was the most selected answer. For this question a far greater number of participants
selected 4 (10) and 5 (12) than 1 (6) or 2 (4), suggesting that production of a new guidance on how to
evaluate the wider impacts would be useful overall to participants.
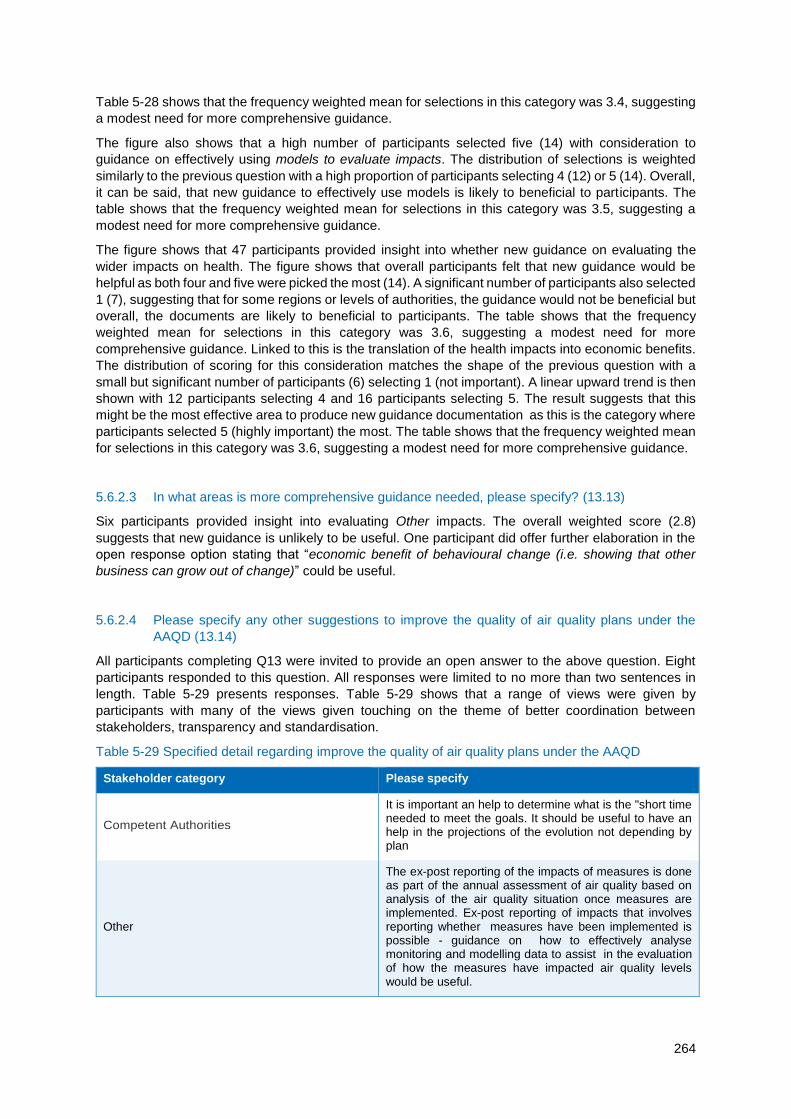
264
Table 5-28 shows that the frequency weighted mean for selections in this category was 3.4, suggesting
a modest need for more comprehensive guidance.
The figure also shows that a high number of participants selected five (14) with consideration to
guidance on effectively using models to evaluate impacts. The distribution of selections is weighted
similarly to the previous question with a high proportion of participants selecting 4 (12) or 5 (14). Overall,
it can be said, that new guidance to effectively use models is likely to beneficial to participants. The
table shows that the frequency weighted mean for selections in this category was 3.5, suggesting a
modest need for more comprehensive guidance.
The figure shows that 47 participants provided insight into whether new guidance on evaluating the
wider impacts on health. The figure shows that overall participants felt that new guidance would be
helpful as both four and five were picked the most (14). A significant number of participants also selected
1 (7), suggesting that for some regions or levels of authorities, the guidance would not be beneficial but
overall, the documents are likely to beneficial to participants. The table shows that the frequency
weighted mean for selections in this category was 3.6, suggesting a modest need for more
comprehensive guidance. Linked to this is the translation of the health impacts into economic benefits.
The distribution of scoring for this consideration matches the shape of the previous question with a
small but significant number of participants (6) selecting 1 (not important). A linear upward trend is then
shown with 12 participants selecting 4 and 16 participants selecting 5. The result suggests that this
might be the most effective area to produce new guidance documentation as this is the category where
participants selected 5 (highly important) the most. The table shows that the frequency weighted mean
for selections in this category was 3.6, suggesting a modest need for more comprehensive guidance.
5.6.2.3 In what areas is more comprehensive guidance needed, please specify? (13.13)
Six participants provided insight into evaluating Other impacts. The overall weighted score (2.8)
suggests that new guidance is unlikely to be useful. One participant did offer further elaboration in the
open response option stating that “economic benefit of behavioural change (i.e. showing that other
business can grow out of change)” could be useful.
5.6.2.4 Please specify any other suggestions to improve the quality of air quality plans under the
AAQD (13.14)
All participants completing Q13 were invited to provide an open answer to the above question. Eight
participants responded to this question. All responses were limited to no more than two sentences in
length. Table 5-29 presents responses. Table 5-29 shows that a range of views were given by
participants with many of the views given touching on the theme of better coordination between
stakeholders, transparency and standardisation.
Table 5-29 Specified detail regarding improve the quality of air quality plans under the AAQD
Stakeholder category Please specify
Competent Authorities
It is important an help to determine what is the "short time needed to meet the goals. It should be useful to have an help in the projections of the evolution not depending by plan
Other
The ex-post reporting of the impacts of measures is done as part of the annual assessment of air quality based on analysis of the air quality situation once measures are implemented. Ex-post reporting of impacts that involves reporting whether measures have been implemented is possible - guidance on how to effectively analyse monitoring and modelling data to assist in the evaluation of how the measures have impacted air quality levels would be useful.
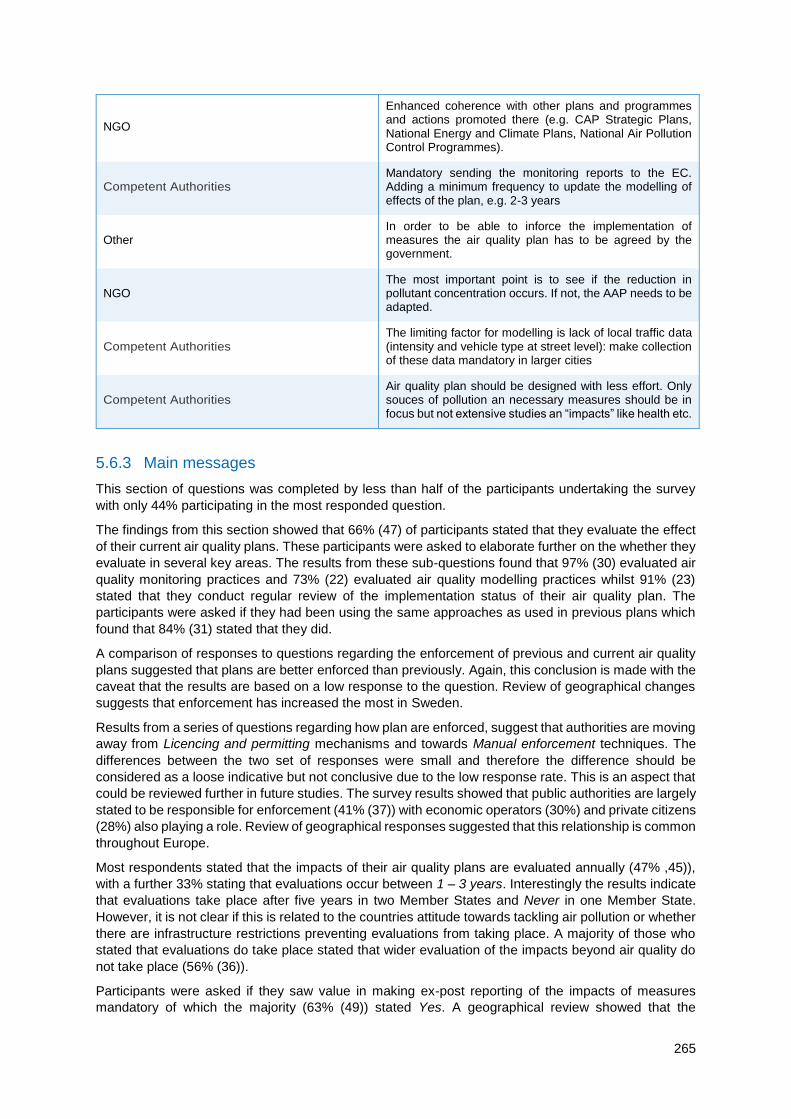
265
NGO
Enhanced coherence with other plans and programmes and actions promoted there (e.g. CAP Strategic Plans, National Energy and Climate Plans, National Air Pollution Control Programmes).
Competent Authorities Mandatory sending the monitoring reports to the EC. Adding a minimum frequency to update the modelling of effects of the plan, e.g. 2-3 years
Other In order to be able to inforce the implementation of measures the air quality plan has to be agreed by the government.
NGO The most important point is to see if the reduction in pollutant concentration occurs. If not, the AAP needs to be adapted.
Competent Authorities The limiting factor for modelling is lack of local traffic data (intensity and vehicle type at street level): make collection of these data mandatory in larger cities
Competent Authorities Air quality plan should be designed with less effort. Only souces of pollution an necessary measures should be in focus but not extensive studies an “impacts” like health etc.
5.6.3 Main messages
This section of questions was completed by less than half of the participants undertaking the survey
with only 44% participating in the most responded question.
The findings from this section showed that 66% (47) of participants stated that they evaluate the effect
of their current air quality plans. These participants were asked to elaborate further on the whether they
evaluate in several key areas. The results from these sub-questions found that 97% (30) evaluated air
quality monitoring practices and 73% (22) evaluated air quality modelling practices whilst 91% (23)
stated that they conduct regular review of the implementation status of their air quality plan. The
participants were asked if they had been using the same approaches as used in previous plans which
found that 84% (31) stated that they did.
A comparison of responses to questions regarding the enforcement of previous and current air quality
plans suggested that plans are better enforced than previously. Again, this conclusion is made with the
caveat that the results are based on a low response to the question. Review of geographical changes
suggests that enforcement has increased the most in Sweden.
Results from a series of questions regarding how plan are enforced, suggest that authorities are moving
away from Licencing and permitting mechanisms and towards Manual enforcement techniques. The
differences between the two set of responses were small and therefore the difference should be
considered as a loose indicative but not conclusive due to the low response rate. This is an aspect that
could be reviewed further in future studies. The survey results showed that public authorities are largely
stated to be responsible for enforcement (41% (37)) with economic operators (30%) and private citizens
(28%) also playing a role. Review of geographical responses suggested that this relationship is common
throughout Europe.
Most respondents stated that the impacts of their air quality plans are evaluated annually (47% ,45)),
with a further 33% stating that evaluations occur between 1 – 3 years. Interestingly the results indicate
that evaluations take place after five years in two Member States and Never in one Member State.
However, it is not clear if this is related to the countries attitude towards tackling air pollution or whether
there are infrastructure restrictions preventing evaluations from taking place. A majority of those who
stated that evaluations do take place stated that wider evaluation of the impacts beyond air quality do
not take place (56% (36)).
Participants were asked if they saw value in making ex-post reporting of the impacts of measures
mandatory of which the majority (63% (49)) stated Yes. A geographical review showed that the

266
responses were well distributed between the twelve countries represented in the answers, suggesting
a universal agreement across Europe.
Participants were also asked for their view on guidance documents. The results from the series of sub
-questions in this area found that overall, participants would slightly benefit from new guidance in how
to evaluate wider impacts, effectively use models to evaluate impacts, quantifying health impacts and
translating health impacts into quantified economic benefits. However, review of the high-level results
disaggregated by each participant associated country found the need for guidance documents to be
higher in some countries and not needed at all in others. The results from this analysis found that there
is a high demand for guidance documents in eight Member States and an extremely low demand from
participants in one Member State.
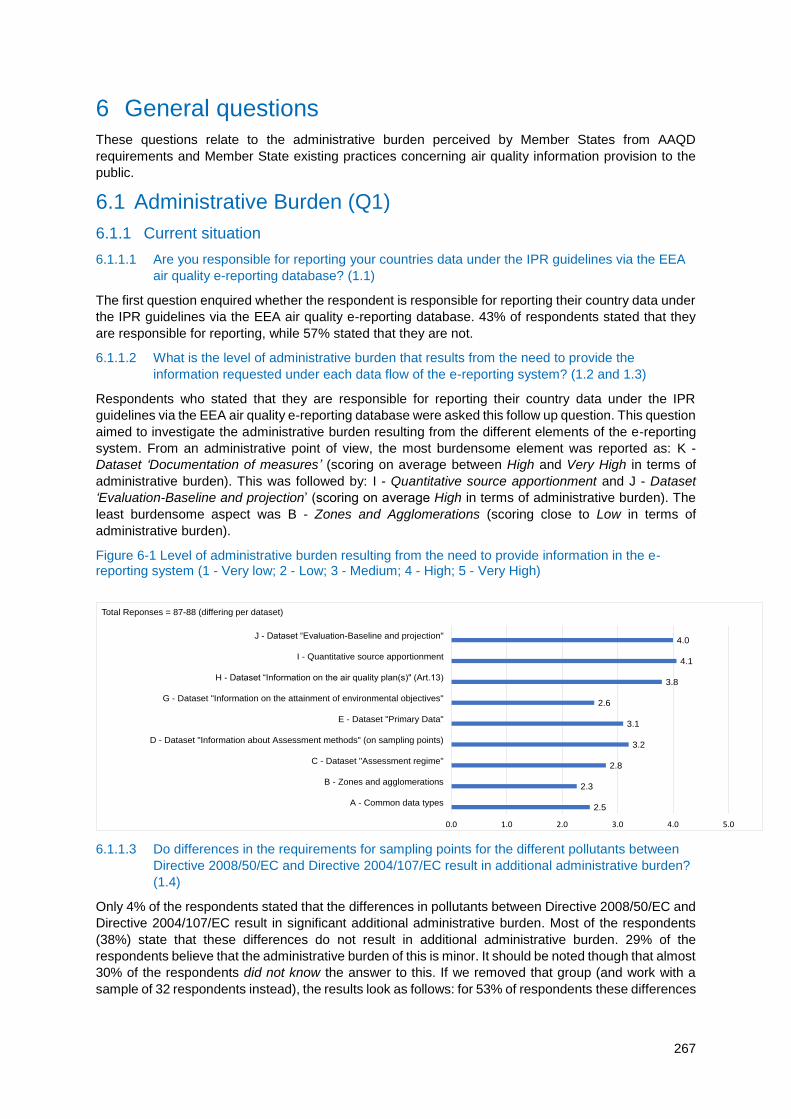
267
6 General questions These questions relate to the administrative burden perceived by Member States from AAQD
requirements and Member State existing practices concerning air quality information provision to the
public.
6.1 Administrative Burden (Q1)
6.1.1 Current situation
6.1.1.1 Are you responsible for reporting your countries data under the IPR guidelines via the EEA
air quality e-reporting database? (1.1)
The first question enquired whether the respondent is responsible for reporting their country data under
the IPR guidelines via the EEA air quality e-reporting database. 43% of respondents stated that they
are responsible for reporting, while 57% stated that they are not.
6.1.1.2 What is the level of administrative burden that results from the need to provide the
information requested under each data flow of the e-reporting system? (1.2 and 1.3)
Respondents who stated that they are responsible for reporting their country data under the IPR
guidelines via the EEA air quality e-reporting database were asked this follow up question. This question
aimed to investigate the administrative burden resulting from the different elements of the e-reporting
system. From an administrative point of view, the most burdensome element was reported as: K -
Dataset ‘Documentation of measures’ (scoring on average between High and Very High in terms of
administrative burden). This was followed by: I - Quantitative source apportionment and J - Dataset
‘Evaluation-Baseline and projection’ (scoring on average High in terms of administrative burden). The
least burdensome aspect was B - Zones and Agglomerations (scoring close to Low in terms of
administrative burden).
Figure 6-1 Level of administrative burden resulting from the need to provide information in the e-reporting system (1 - Very low; 2 - Low; 3 - Medium; 4 - High; 5 - Very High)
6.1.1.3 Do differences in the requirements for sampling points for the different pollutants between
Directive 2008/50/EC and Directive 2004/107/EC result in additional administrative burden?
(1.4)
Only 4% of the respondents stated that the differences in pollutants between Directive 2008/50/EC and
Directive 2004/107/EC result in significant additional administrative burden. Most of the respondents
(38%) state that these differences do not result in additional administrative burden. 29% of the
respondents believe that the administrative burden of this is minor. It should be noted though that almost
30% of the respondents did not know the answer to this. If we removed that group (and work with a
sample of 32 respondents instead), the results look as follows: for 53% of respondents these differences
2.5
2.3
2.8
3.2
3.1
2.6
3.8
4.1
4.0
0.0 1.0 2.0 3.0 4.0 5.0
A - Common data types
B - Zones and agglomerations
C - Dataset "Assessment regime"
D - Dataset "Information about Assessment methods" (on sampling points)
E - Dataset "Primary Data"
G - Dataset "Information on the attainment of environmental objectives"
H - Dataset “Information on the air quality plan(s)" (Art.13)
I - Quantitative source apportionment
J - Dataset “Evaluation-Baseline and projection"
Total Reponses = 87-88 (differing per dataset)
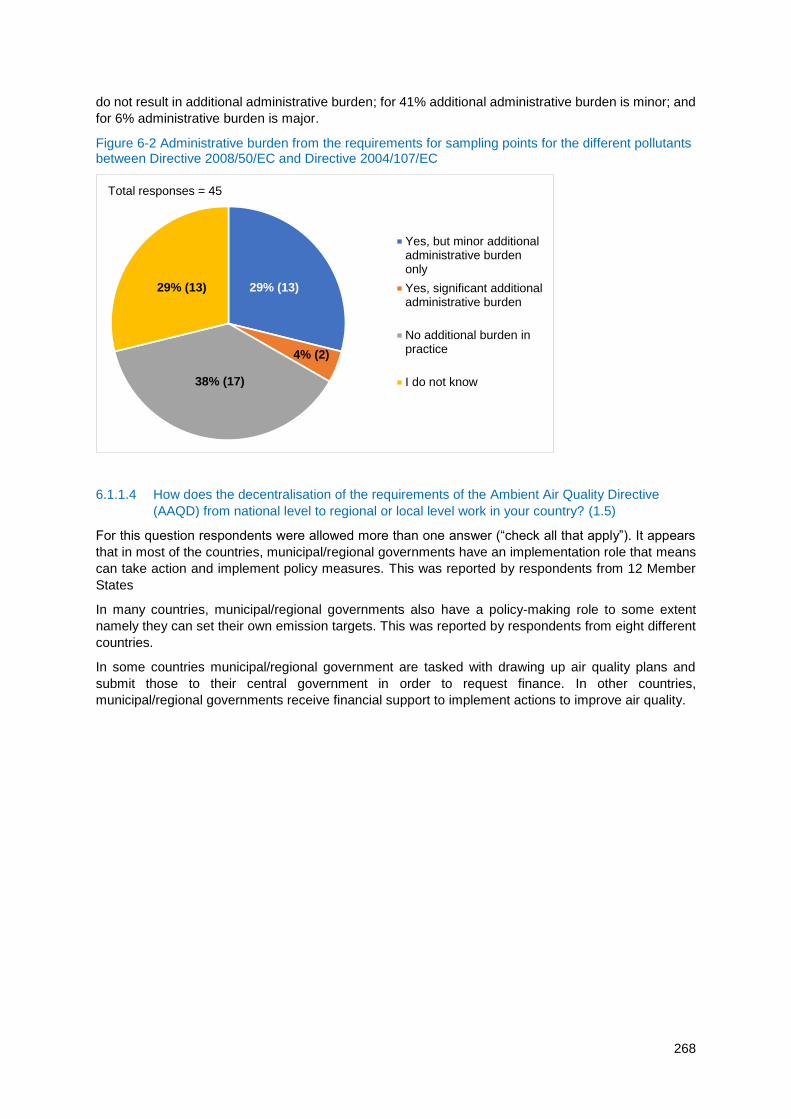
268
do not result in additional administrative burden; for 41% additional administrative burden is minor; and
for 6% administrative burden is major.
Figure 6-2 Administrative burden from the requirements for sampling points for the different pollutants between Directive 2008/50/EC and Directive 2004/107/EC
6.1.1.4 How does the decentralisation of the requirements of the Ambient Air Quality Directive
(AAQD) from national level to regional or local level work in your country? (1.5)
For this question respondents were allowed more than one answer (“check all that apply”). It appears
that in most of the countries, municipal/regional governments have an implementation role that means
can take action and implement policy measures. This was reported by respondents from 12 Member
States
In many countries, municipal/regional governments also have a policy-making role to some extent
namely they can set their own emission targets. This was reported by respondents from eight different
countries.
In some countries municipal/regional government are tasked with drawing up air quality plans and
submit those to their central government in order to request finance. In other countries,
municipal/regional governments receive financial support to implement actions to improve air quality.
29% (13)
4% (2)
38% (17)
29% (13)
Total responses = 45
Yes, but minor additionaladministrative burdenonly
Yes, significant additionaladministrative burden
No additional burden inpractice
I do not know
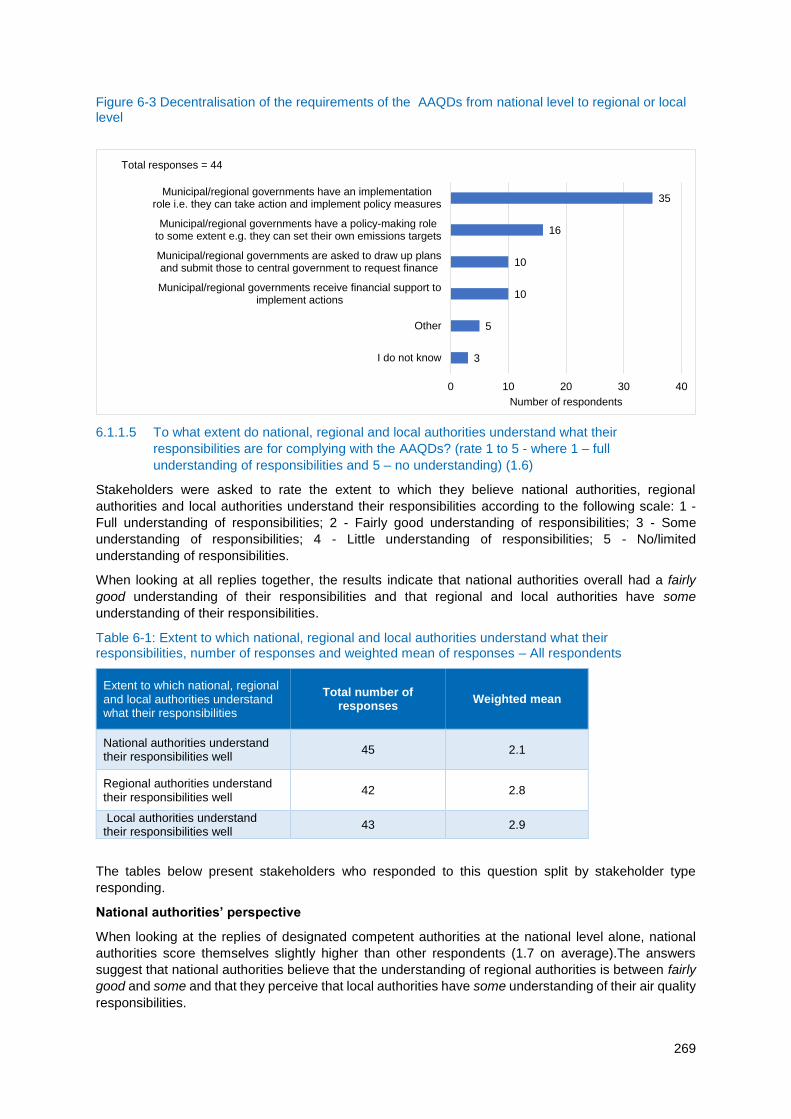
269
Figure 6-3 Decentralisation of the requirements of the AAQDs from national level to regional or local level
6.1.1.5 To what extent do national, regional and local authorities understand what their
responsibilities are for complying with the AAQDs? (rate 1 to 5 - where 1 – full
understanding of responsibilities and 5 – no understanding) (1.6)
Stakeholders were asked to rate the extent to which they believe national authorities, regional
authorities and local authorities understand their responsibilities according to the following scale: 1 -
Full understanding of responsibilities; 2 - Fairly good understanding of responsibilities; 3 - Some
understanding of responsibilities; 4 - Little understanding of responsibilities; 5 - No/limited
understanding of responsibilities.
When looking at all replies together, the results indicate that national authorities overall had a fairly
good understanding of their responsibilities and that regional and local authorities have some
understanding of their responsibilities.
Table 6-1: Extent to which national, regional and local authorities understand what their responsibilities, number of responses and weighted mean of responses – All respondents
Extent to which national, regional and local authorities understand what their responsibilities
Total number of responses
Weighted mean
National authorities understand their responsibilities well
45 2.1
Regional authorities understand their responsibilities well
42 2.8
Local authorities understand their responsibilities well
43 2.9
The tables below present stakeholders who responded to this question split by stakeholder type
responding.
National authorities’ perspective
When looking at the replies of designated competent authorities at the national level alone, national
authorities score themselves slightly higher than other respondents (1.7 on average).The answers
suggest that national authorities believe that the understanding of regional authorities is between fairly
good and some and that they perceive that local authorities have some understanding of their air quality
responsibilities.
3
5
10
10
16
35
0 10 20 30 40
I do not know
Other
Municipal/regional governments receive financial support toimplement actions
Municipal/regional governments are asked to draw up plansand submit those to central government to request finance
Municipal/regional governments have a policy-making roleto some extent e.g. they can set their own emissions targets
Municipal/regional governments have an implementationrole i.e. they can take action and implement policy measures
Number of respondents
Total responses = 44

270
Table 6-2: Extent to which national, regional and local authorities understand their responsibilities: number of responses and weighted mean of responses – National Authorities perspective
Extent to which national, regional and local authorities understand what their responsibilities
Total number of responses
Weighted mean
National authorities understand their responsibilities well
15 1.7
Regional authorities understand their responsibilities well
11 2.5
Local authorities understand their responsibilities well
13 3
There was only one respondent representing ‘other national level authorities’ and so this response was
not analysed.
Regional authorities’ perspective
When looking at the replies of the designated competent authorities at the regional level alone, national
authorities scored worse than in the previous cases (2.2 on average which is equivalent to almost fairly
good). This suggests that the regional authorities perceive that their national peers have less
understanding of their responsibilities compared to responses from all stakeholders. Regional
authorities in three Member States answered this question.
Table 6-3: Extent to which national, regional and local authorities understand what their responsibilities, number of responses and weighted mean of responses – Regional authorities’ perspective
Extent to which national, regional and local authorities understand what their responsibilities
Total number of responses
Weighted mean
National authorities understand their responsibilities well
12 2.2
Regional authorities understand their responsibilities well
13 2.4
Local authorities understand their responsibilities well
12 3
Local authorities’ perspective
When looking at the replies of the designated competent authorities at the local level alone it seems
that these authorities believe that their local / city-level peers have a better understanding of their
responsibilities compared to the view of other stakeholders. Local authorities in this case score between
fairly good and some in terms of understanding of their responsibilities. Interestingly, local authorities
expressed that regional authorities have little to no understanding of their responsibilities. Only two local
authorities replied to this question.
Table 6-4: Extent to which national, regional and local authorities understand what their responsibilities, number of responses and weighted mean of responses – Local authorities perspective
Extent to which national, regional and local authorities understand what their responsibilities
Total number of responses
Weighted mean
National authorities understand their responsibilities well
5 2.6

271
Regional authorities understand their responsibilities well
5 4.4
Local authorities understand their responsibilities well
5 2.4
Three local authorities provided very different answers, where they rate the understanding of
responsibilities of national authorities above fairly good and that of regional authorities as nearly fairly
good.
Table 6-5: Extent to which national, regional and local authorities understand what their responsibilities, number of responses and weighted mean of responses – Other local/city-level authorities
Extent to which national, regional and local authorities understand what their responsibilities
Total number of responses
Weighted mean
National authorities understand their responsibilities well
3 1.7
Regional authorities understand their responsibilities well
3 2.3
Local authorities understand their responsibilities well
3 2.7
NGOs perspective
NGOs believe national authorities have the best understanding of their responsibilities (although this
has been rated as fairly good) and that local authorities have the least understanding (rated between
some to little understanding).
Table 6-6: Extent to which national, regional and local authorities understand what their responsibilities, number of responses and weighted mean of responses – NGOs perspective
Extent to which national, regional and local authorities understand what their responsibilities
Total number of responses
Weighted mean
National authorities understand their responsibilities well
4 2
Regional authorities understand their responsibilities well
4 2.7
Local authorities understand their responsibilities well
4 3.5
6.1.1.6 Please state the extent to which you believe the following aspects, as suggested in the
study, are impacting negatively on efficiencies / administrative burden (rate 1 to 5 - where 1
– no impact and 5 – very high impact) (1.7)
The study Supporting the Fitness Check of the EU Ambient Air Quality Directives (AAQDs) concluded
that some inefficiencies exist around the devolution of the requirements of the AAQDs from national to
local level, and that this could be improved / administrative burden could be reduced by making this
process more effective. In particular, the following elements were identified as burdensome:
- Availability of funding to support the devolution of the requirements of the AAQs to local level
- Availability of guidance from national tiers of government to local tiers of government
- Lack of effective communication between the national – regional – local tiers of government
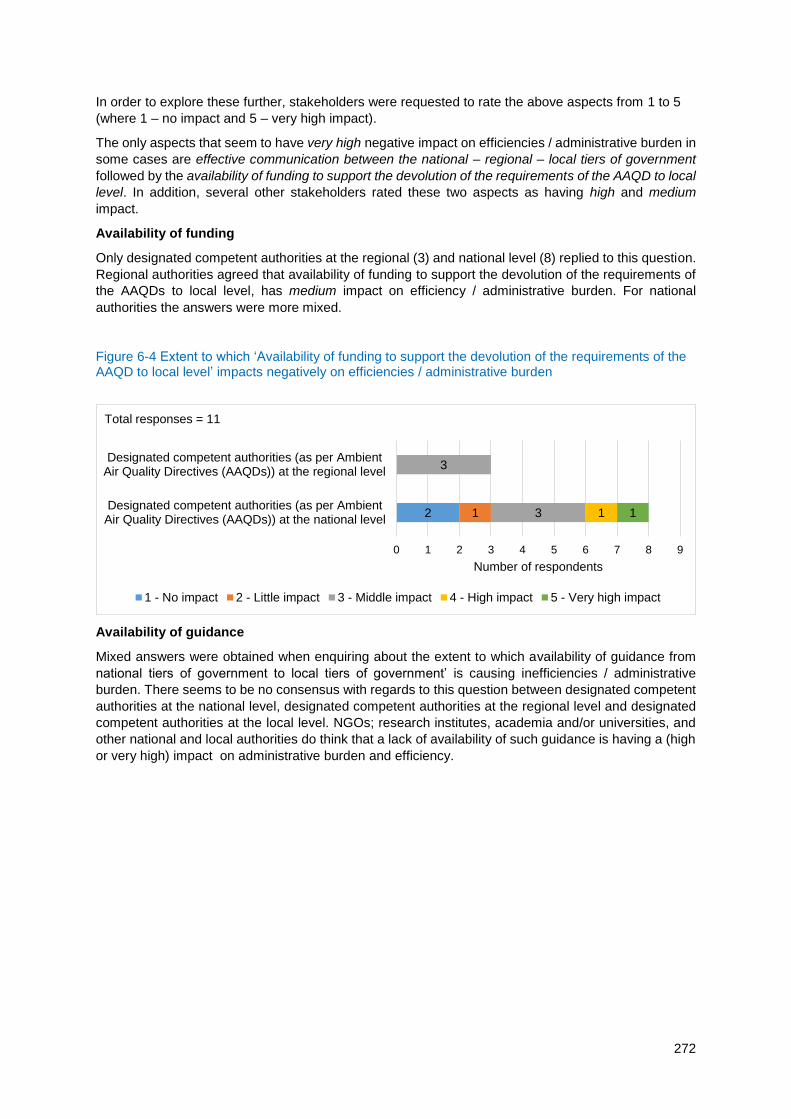
272
In order to explore these further, stakeholders were requested to rate the above aspects from 1 to 5
(where 1 – no impact and 5 – very high impact).
The only aspects that seem to have very high negative impact on efficiencies / administrative burden in
some cases are effective communication between the national – regional – local tiers of government
followed by the availability of funding to support the devolution of the requirements of the AAQD to local
level. In addition, several other stakeholders rated these two aspects as having high and medium
impact.
Availability of funding
Only designated competent authorities at the regional (3) and national level (8) replied to this question.
Regional authorities agreed that availability of funding to support the devolution of the requirements of
the AAQDs to local level, has medium impact on efficiency / administrative burden. For national
authorities the answers were more mixed.
Figure 6-4 Extent to which ‘Availability of funding to support the devolution of the requirements of the AAQD to local level’ impacts negatively on efficiencies / administrative burden
Availability of guidance
Mixed answers were obtained when enquiring about the extent to which availability of guidance from
national tiers of government to local tiers of government’ is causing inefficiencies / administrative
burden. There seems to be no consensus with regards to this question between designated competent
authorities at the national level, designated competent authorities at the regional level and designated
competent authorities at the local level. NGOs; research institutes, academia and/or universities, and
other national and local authorities do think that a lack of availability of such guidance is having a (high
or very high) impact on administrative burden and efficiency.
2 1 3
3
1 1
0 1 2 3 4 5 6 7 8 9
Designated competent authorities (as per AmbientAir Quality Directives (AAQDs)) at the national level
Designated competent authorities (as per AmbientAir Quality Directives (AAQDs)) at the regional level
Number of respondents
Total responses = 11
1 - No impact 2 - Little impact 3 - Middle impact 4 - High impact 5 - Very high impact
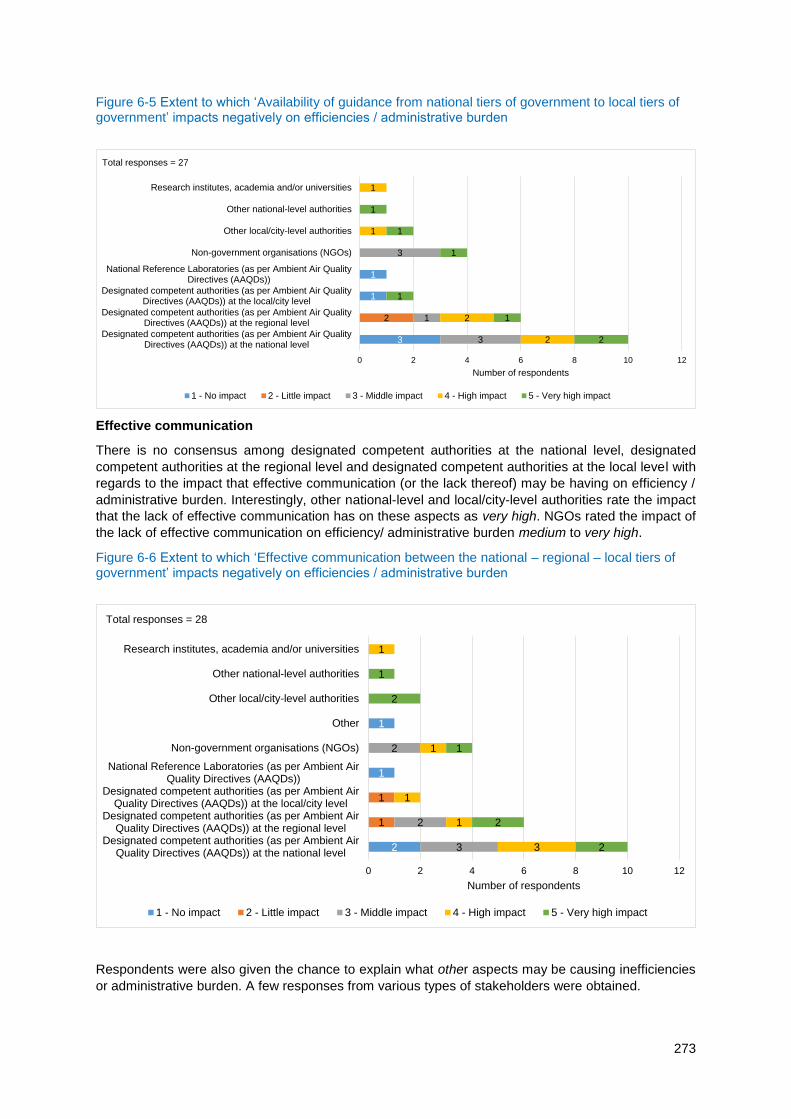
273
Figure 6-5 Extent to which ‘Availability of guidance from national tiers of government to local tiers of government’ impacts negatively on efficiencies / administrative burden
Effective communication
There is no consensus among designated competent authorities at the national level, designated
competent authorities at the regional level and designated competent authorities at the local level with
regards to the impact that effective communication (or the lack thereof) may be having on efficiency /
administrative burden. Interestingly, other national-level and local/city-level authorities rate the impact
that the lack of effective communication has on these aspects as very high. NGOs rated the impact of
the lack of effective communication on efficiency/ administrative burden medium to very high.
Figure 6-6 Extent to which ‘Effective communication between the national – regional – local tiers of government’ impacts negatively on efficiencies / administrative burden
Respondents were also given the chance to explain what other aspects may be causing inefficiencies
or administrative burden. A few responses from various types of stakeholders were obtained.
3
1
1
2
3
1
3
2
2
1
1
2
1
1
1
1
1
0 2 4 6 8 10 12
Designated competent authorities (as per Ambient Air QualityDirectives (AAQDs)) at the national level
Designated competent authorities (as per Ambient Air QualityDirectives (AAQDs)) at the regional level
Designated competent authorities (as per Ambient Air QualityDirectives (AAQDs)) at the local/city level
National Reference Laboratories (as per Ambient Air QualityDirectives (AAQDs))
Non-government organisations (NGOs)
Other local/city-level authorities
Other national-level authorities
Research institutes, academia and/or universities
Number of respondents
Total responses = 27
1 - No impact 2 - Little impact 3 - Middle impact 4 - High impact 5 - Very high impact
2
1
1
1
1
3
2
2
3
1
1
1
1
2
2
1
2
1
0 2 4 6 8 10 12
Designated competent authorities (as per Ambient AirQuality Directives (AAQDs)) at the national level
Designated competent authorities (as per Ambient AirQuality Directives (AAQDs)) at the regional level
Designated competent authorities (as per Ambient AirQuality Directives (AAQDs)) at the local/city level
National Reference Laboratories (as per Ambient AirQuality Directives (AAQDs))
Non-government organisations (NGOs)
Other
Other local/city-level authorities
Other national-level authorities
Research institutes, academia and/or universities
Number of respondents
Total responses = 28
1 - No impact 2 - Little impact 3 - Middle impact 4 - High impact 5 - Very high impact
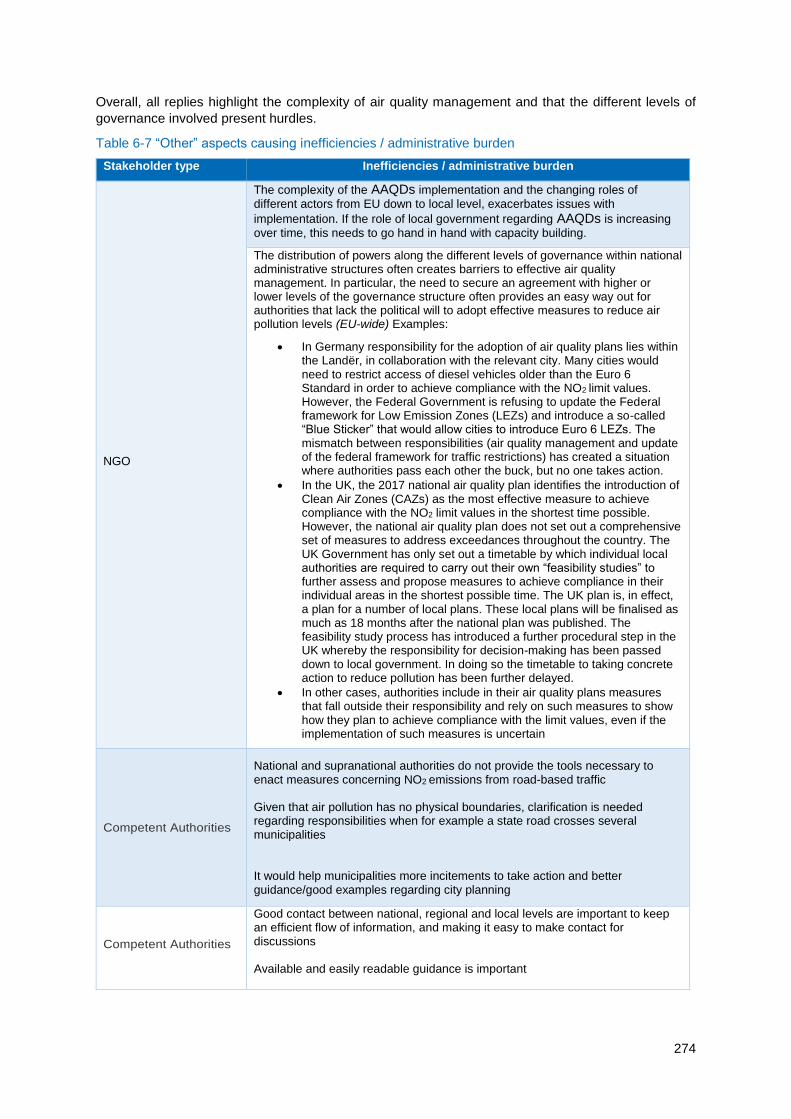
274
Overall, all replies highlight the complexity of air quality management and that the different levels of
governance involved present hurdles.
Table 6-7 “Other” aspects causing inefficiencies / administrative burden
Stakeholder type Inefficiencies / administrative burden
NGO
The complexity of the AAQDs implementation and the changing roles of
different actors from EU down to local level, exacerbates issues with
implementation. If the role of local government regarding AAQDs is increasing
over time, this needs to go hand in hand with capacity building.
The distribution of powers along the different levels of governance within national administrative structures often creates barriers to effective air quality management. In particular, the need to secure an agreement with higher or lower levels of the governance structure often provides an easy way out for authorities that lack the political will to adopt effective measures to reduce air pollution levels (EU-wide) Examples:
In Germany responsibility for the adoption of air quality plans lies within the Landër, in collaboration with the relevant city. Many cities would need to restrict access of diesel vehicles older than the Euro 6 Standard in order to achieve compliance with the NO2 limit values. However, the Federal Government is refusing to update the Federal framework for Low Emission Zones (LEZs) and introduce a so-called “Blue Sticker” that would allow cities to introduce Euro 6 LEZs. The mismatch between responsibilities (air quality management and update of the federal framework for traffic restrictions) has created a situation where authorities pass each other the buck, but no one takes action.
In the UK, the 2017 national air quality plan identifies the introduction of Clean Air Zones (CAZs) as the most effective measure to achieve compliance with the NO2 limit values in the shortest time possible. However, the national air quality plan does not set out a comprehensive set of measures to address exceedances throughout the country. The UK Government has only set out a timetable by which individual local authorities are required to carry out their own “feasibility studies” to further assess and propose measures to achieve compliance in their individual areas in the shortest possible time. The UK plan is, in effect, a plan for a number of local plans. These local plans will be finalised as much as 18 months after the national plan was published. The feasibility study process has introduced a further procedural step in the UK whereby the responsibility for decision-making has been passed down to local government. In doing so the timetable to taking concrete action to reduce pollution has been further delayed.
In other cases, authorities include in their air quality plans measures that fall outside their responsibility and rely on such measures to show how they plan to achieve compliance with the limit values, even if the implementation of such measures is uncertain
Competent Authorities
National and supranational authorities do not provide the tools necessary to enact measures concerning NO2 emissions from road-based traffic Given that air pollution has no physical boundaries, clarification is needed regarding responsibilities when for example a state road crosses several municipalities It would help municipalities more incitements to take action and better guidance/good examples regarding city planning
Competent Authorities
Good contact between national, regional and local levels are important to keep an efficient flow of information, and making it easy to make contact for discussions Available and easily readable guidance is important
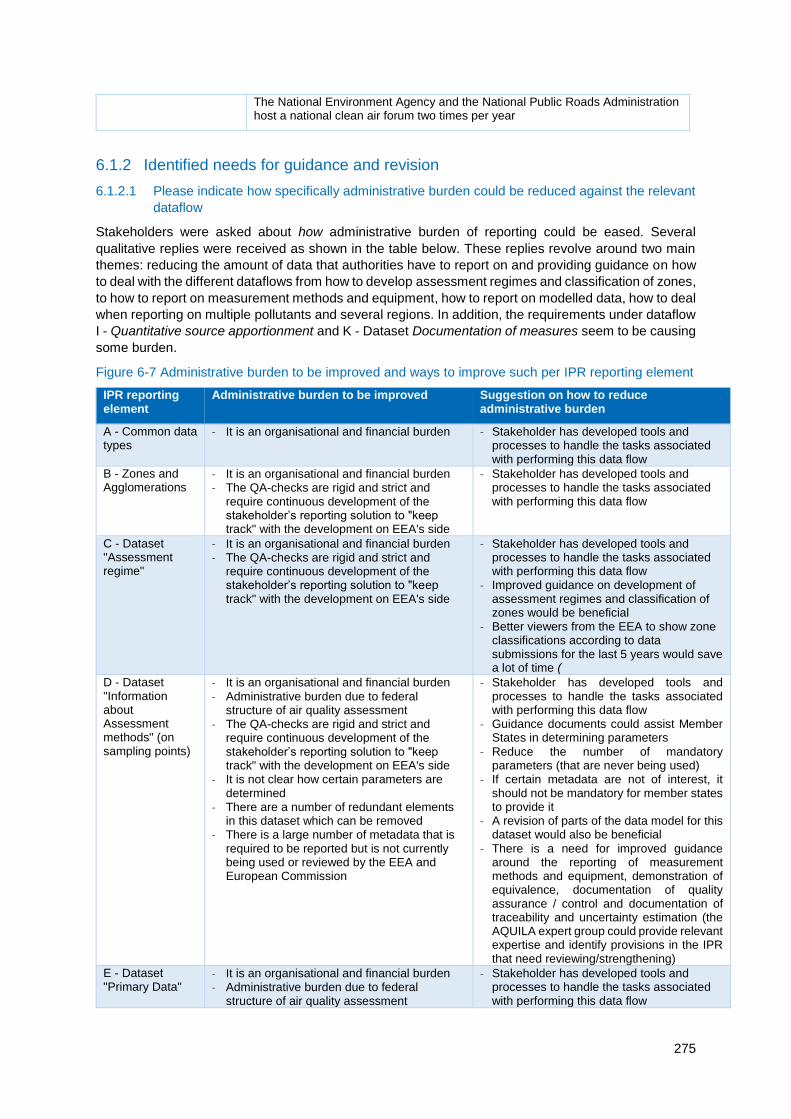
275
The National Environment Agency and the National Public Roads Administration host a national clean air forum two times per year
6.1.2 Identified needs for guidance and revision
6.1.2.1 Please indicate how specifically administrative burden could be reduced against the relevant
dataflow
Stakeholders were asked about how administrative burden of reporting could be eased. Several
qualitative replies were received as shown in the table below. These replies revolve around two main
themes: reducing the amount of data that authorities have to report on and providing guidance on how
to deal with the different dataflows from how to develop assessment regimes and classification of zones,
to how to report on measurement methods and equipment, how to report on modelled data, how to deal
when reporting on multiple pollutants and several regions. In addition, the requirements under dataflow
I - Quantitative source apportionment and K - Dataset Documentation of measures seem to be causing
some burden.
Figure 6-7 Administrative burden to be improved and ways to improve such per IPR reporting element
IPR reporting element
Administrative burden to be improved Suggestion on how to reduce administrative burden
A - Common data types
- It is an organisational and financial burden - Stakeholder has developed tools and processes to handle the tasks associated with performing this data flow
B - Zones and Agglomerations
- It is an organisational and financial burden - The QA-checks are rigid and strict and
require continuous development of the stakeholder’s reporting solution to "keep track" with the development on EEA's side
- Stakeholder has developed tools and processes to handle the tasks associated with performing this data flow
C - Dataset "Assessment regime"
- It is an organisational and financial burden - The QA-checks are rigid and strict and
require continuous development of the stakeholder’s reporting solution to "keep track" with the development on EEA's side
- Stakeholder has developed tools and processes to handle the tasks associated with performing this data flow
- Improved guidance on development of assessment regimes and classification of zones would be beneficial
- Better viewers from the EEA to show zone classifications according to data submissions for the last 5 years would save a lot of time (
D - Dataset "Information about Assessment methods" (on sampling points)
- It is an organisational and financial burden
- Administrative burden due to federal structure of air quality assessment
- The QA-checks are rigid and strict and require continuous development of the stakeholder’s reporting solution to "keep track" with the development on EEA's side
- It is not clear how certain parameters are determined
- There are a number of redundant elements in this dataset which can be removed
- There is a large number of metadata that is required to be reported but is not currently being used or reviewed by the EEA and European Commission
- Stakeholder has developed tools and processes to handle the tasks associated with performing this data flow
- Guidance documents could assist Member States in determining parameters
- Reduce the number of mandatory parameters (that are never being used)
- If certain metadata are not of interest, it should not be mandatory for member states to provide it
- A revision of parts of the data model for this dataset would also be beneficial
- There is a need for improved guidance around the reporting of measurement methods and equipment, demonstration of equivalence, documentation of quality assurance / control and documentation of traceability and uncertainty estimation (the AQUILA expert group could provide relevant expertise and identify provisions in the IPR that need reviewing/strengthening)
E - Dataset "Primary Data"
- It is an organisational and financial burden - Administrative burden due to federal
structure of air quality assessment
- Stakeholder has developed tools and processes to handle the tasks associated with performing this data flow
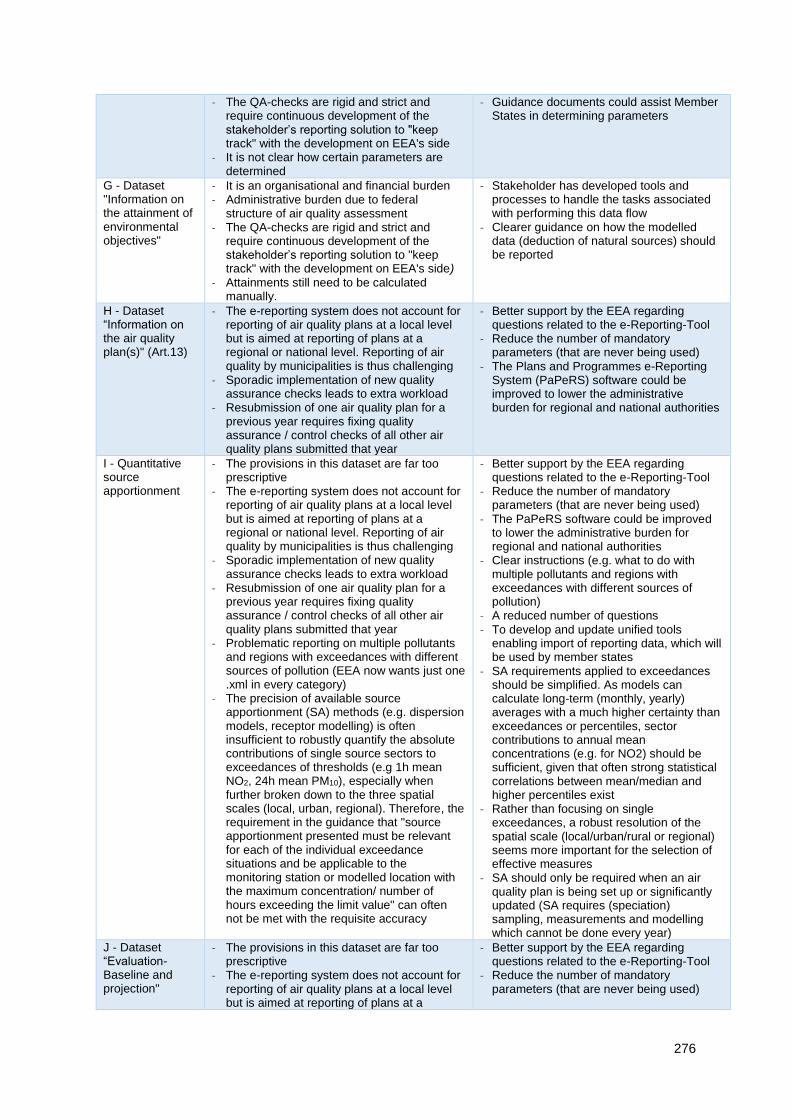
276
- The QA-checks are rigid and strict and require continuous development of the stakeholder’s reporting solution to "keep track" with the development on EEA's side
- It is not clear how certain parameters are determined
- Guidance documents could assist Member States in determining parameters
G - Dataset "Information on the attainment of environmental objectives"
- It is an organisational and financial burden - Administrative burden due to federal
structure of air quality assessment - The QA-checks are rigid and strict and
require continuous development of the stakeholder’s reporting solution to "keep track" with the development on EEA's side)
- Attainments still need to be calculated manually.
- Stakeholder has developed tools and processes to handle the tasks associated with performing this data flow
- Clearer guidance on how the modelled data (deduction of natural sources) should be reported
H - Dataset “Information on the air quality plan(s)" (Art.13)
- The e-reporting system does not account for reporting of air quality plans at a local level but is aimed at reporting of plans at a regional or national level. Reporting of air quality by municipalities is thus challenging
- Sporadic implementation of new quality assurance checks leads to extra workload
- Resubmission of one air quality plan for a previous year requires fixing quality assurance / control checks of all other air quality plans submitted that year
- Better support by the EEA regarding questions related to the e-Reporting-Tool
- Reduce the number of mandatory parameters (that are never being used)
- The Plans and Programmes e-Reporting System (PaPeRS) software could be improved to lower the administrative burden for regional and national authorities
I - Quantitative source apportionment
- The provisions in this dataset are far too prescriptive
- The e-reporting system does not account for reporting of air quality plans at a local level but is aimed at reporting of plans at a regional or national level. Reporting of air quality by municipalities is thus challenging
- Sporadic implementation of new quality assurance checks leads to extra workload
- Resubmission of one air quality plan for a previous year requires fixing quality assurance / control checks of all other air quality plans submitted that year
- Problematic reporting on multiple pollutants and regions with exceedances with different sources of pollution (EEA now wants just one .xml in every category)
- The precision of available source apportionment (SA) methods (e.g. dispersion models, receptor modelling) is often insufficient to robustly quantify the absolute contributions of single source sectors to exceedances of thresholds (e.g 1h mean NO2, 24h mean PM10), especially when further broken down to the three spatial scales (local, urban, regional). Therefore, the requirement in the guidance that "source apportionment presented must be relevant for each of the individual exceedance situations and be applicable to the monitoring station or modelled location with the maximum concentration/ number of hours exceeding the limit value" can often not be met with the requisite accuracy
- Better support by the EEA regarding questions related to the e-Reporting-Tool
- Reduce the number of mandatory parameters (that are never being used)
- The PaPeRS software could be improved to lower the administrative burden for regional and national authorities
- Clear instructions (e.g. what to do with multiple pollutants and regions with exceedances with different sources of pollution)
- A reduced number of questions
- To develop and update unified tools enabling import of reporting data, which will be used by member states
- SA requirements applied to exceedances should be simplified. As models can calculate long-term (monthly, yearly) averages with a much higher certainty than exceedances or percentiles, sector contributions to annual mean concentrations (e.g. for NO2) should be sufficient, given that often strong statistical correlations between mean/median and higher percentiles exist
- Rather than focusing on single exceedances, a robust resolution of the spatial scale (local/urban/rural or regional) seems more important for the selection of effective measures
- SA should only be required when an air quality plan is being set up or significantly updated (SA requires (speciation) sampling, measurements and modelling which cannot be done every year)
J - Dataset “Evaluation-Baseline and projection"
- The provisions in this dataset are far too prescriptive
- The e-reporting system does not account for reporting of air quality plans at a local level but is aimed at reporting of plans at a
- Better support by the EEA regarding questions related to the e-Reporting-Tool
- Reduce the number of mandatory parameters (that are never being used)
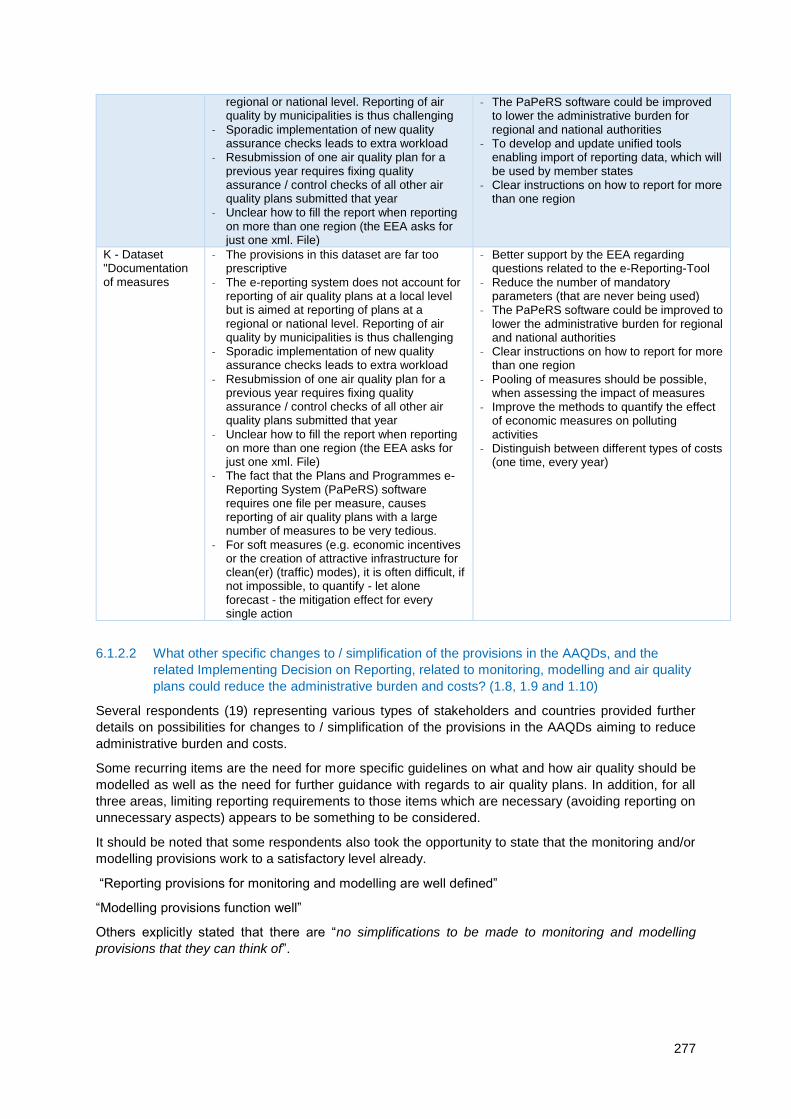
277
regional or national level. Reporting of air quality by municipalities is thus challenging
- Sporadic implementation of new quality assurance checks leads to extra workload
- Resubmission of one air quality plan for a previous year requires fixing quality assurance / control checks of all other air quality plans submitted that year
- Unclear how to fill the report when reporting on more than one region (the EEA asks for just one xml. File)
- The PaPeRS software could be improved to lower the administrative burden for regional and national authorities
- To develop and update unified tools enabling import of reporting data, which will be used by member states
- Clear instructions on how to report for more than one region
K - Dataset "Documentation of measures
- The provisions in this dataset are far too prescriptive
- The e-reporting system does not account for reporting of air quality plans at a local level but is aimed at reporting of plans at a regional or national level. Reporting of air quality by municipalities is thus challenging
- Sporadic implementation of new quality assurance checks leads to extra workload
- Resubmission of one air quality plan for a previous year requires fixing quality assurance / control checks of all other air quality plans submitted that year
- Unclear how to fill the report when reporting on more than one region (the EEA asks for just one xml. File)
- The fact that the Plans and Programmes e-Reporting System (PaPeRS) software requires one file per measure, causes reporting of air quality plans with a large number of measures to be very tedious.
- For soft measures (e.g. economic incentives or the creation of attractive infrastructure for clean(er) (traffic) modes), it is often difficult, if not impossible, to quantify - let alone forecast - the mitigation effect for every single action
- Better support by the EEA regarding questions related to the e-Reporting-Tool
- Reduce the number of mandatory parameters (that are never being used)
- The PaPeRS software could be improved to lower the administrative burden for regional and national authorities
- Clear instructions on how to report for more than one region
- Pooling of measures should be possible, when assessing the impact of measures
- Improve the methods to quantify the effect of economic measures on polluting activities
- Distinguish between different types of costs (one time, every year)
6.1.2.2 What other specific changes to / simplification of the provisions in the AAQDs, and the
related Implementing Decision on Reporting, related to monitoring, modelling and air quality
plans could reduce the administrative burden and costs? (1.8, 1.9 and 1.10)
Several respondents (19) representing various types of stakeholders and countries provided further
details on possibilities for changes to / simplification of the provisions in the AAQDs aiming to reduce
administrative burden and costs.
Some recurring items are the need for more specific guidelines on what and how air quality should be
modelled as well as the need for further guidance with regards to air quality plans. In addition, for all
three areas, limiting reporting requirements to those items which are necessary (avoiding reporting on
unnecessary aspects) appears to be something to be considered.
It should be noted that some respondents also took the opportunity to state that the monitoring and/or
modelling provisions work to a satisfactory level already.
“Reporting provisions for monitoring and modelling are well defined”
“Modelling provisions function well”
Others explicitly stated that there are “no simplifications to be made to monitoring and modelling
provisions that they can think of”.
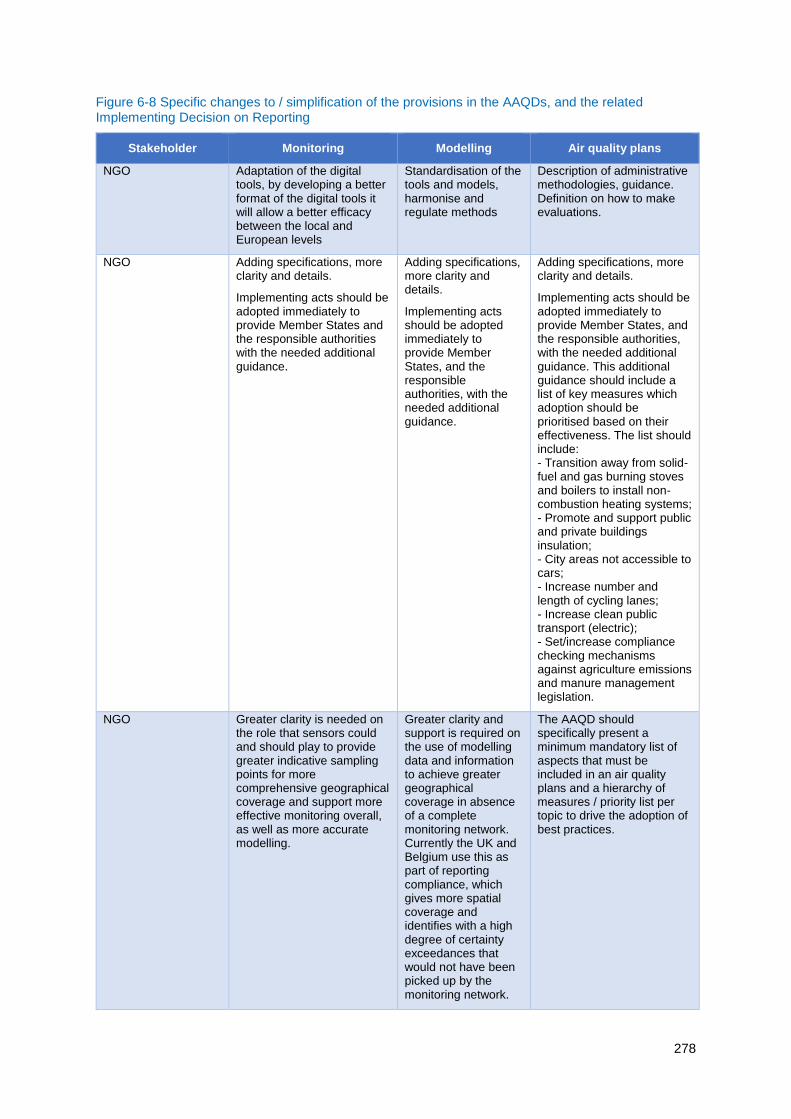
278
Figure 6-8 Specific changes to / simplification of the provisions in the AAQDs, and the related Implementing Decision on Reporting
Stakeholder Monitoring Modelling Air quality plans
NGO Adaptation of the digital tools, by developing a better format of the digital tools it will allow a better efficacy between the local and European levels
Standardisation of the tools and models, harmonise and regulate methods
Description of administrative methodologies, guidance. Definition on how to make evaluations.
NGO Adding specifications, more clarity and details.
Implementing acts should be adopted immediately to provide Member States and the responsible authorities with the needed additional guidance.
Adding specifications, more clarity and details.
Implementing acts should be adopted immediately to provide Member States, and the responsible authorities, with the needed additional guidance.
Adding specifications, more clarity and details.
Implementing acts should be adopted immediately to provide Member States, and the responsible authorities, with the needed additional guidance. This additional guidance should include a list of key measures which adoption should be prioritised based on their effectiveness. The list should include: - Transition away from solid-fuel and gas burning stoves and boilers to install non-combustion heating systems; - Promote and support public and private buildings insulation; - City areas not accessible to cars; - Increase number and length of cycling lanes; - Increase clean public transport (electric); - Set/increase compliance checking mechanisms against agriculture emissions and manure management legislation.
NGO Greater clarity is needed on the role that sensors could and should play to provide greater indicative sampling points for more comprehensive geographical coverage and support more effective monitoring overall, as well as more accurate modelling.
Greater clarity and support is required on the use of modelling data and information to achieve greater geographical coverage in absence of a complete monitoring network. Currently the UK and Belgium use this as part of reporting compliance, which gives more spatial coverage and identifies with a high degree of certainty exceedances that would not have been picked up by the monitoring network.
The AAQD should specifically present a minimum mandatory list of aspects that must be included in an air quality plans and a hierarchy of measures / priority list per topic to drive the adoption of best practices.

279
The use of sensors as part of a modelling network is not addressed yet and will be required in future. The AAQD could support development of standards that meet legislative requirements.
Competent Authorities
A reduction in monitoring/modelling requirements. Future legislation could consider removal/reduce the frequency of monitoring/modelling for pollutants for which MS have been consistently in line and below the lower assessment thresholds.
Guidance on estimating the population exposed to pollution under indents 2(b) of Annex XV as well as on estimating improvements in air quality under 8(c) of the same annex, would facilitate the air quality plans process and related assessments.
Competent Authorities
Dataflows H-K ask for calculation of scenarios. The scenario 'without measures' is difficult; background concentrations without measures are not calculated. Effectiveness of the individual measures in local situations is hard to show.
Competent Authorities
Equivalence of PM measurement instruments has been difficult in Sweden and in other Member States. There is a need to update and address problems with the AAQD provisions and associated Guide on Demonstration of Equivalence. There is a lot of room for interpretation regarding where air quality should be assessed and where the limit values apply. Review and clarify issues regarding the data quality objectives. The reference method for PM is a filter sampler without the possibility for real-time data. Since there is a real-time data requirement in the AAQD, it must be clarified how to fulfil this when using the reference method. The ozone monitoring provisions are highly complicated and open to
The role of modelling in air quality assessment and the FAIRMODE expert group should be formalized in the AAQD. Some of the reporting requirements are unnecessary and the information being provided is not currently being used. More pragmatic reporting requirements should facilitate increased reporting of model data.
The provisions on contents and reporting of action plans should be less prescriptive and streamlined to information that is most important to the effectiveness of a plan.
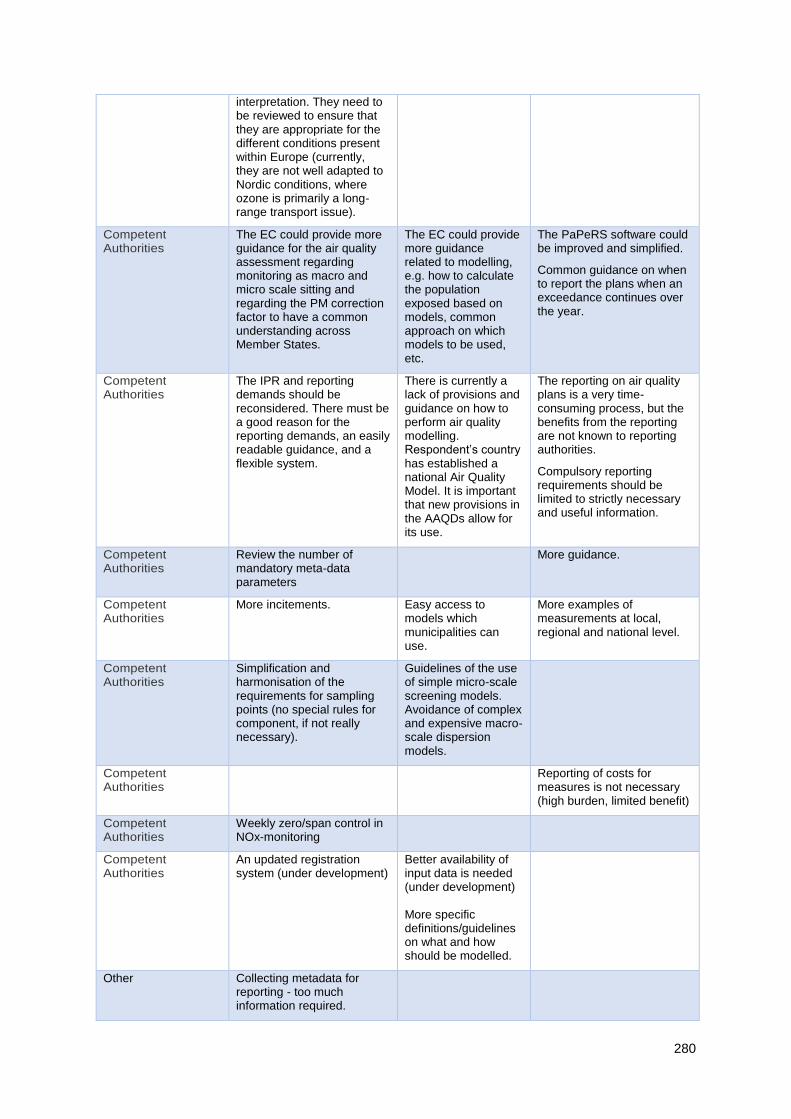
280
interpretation. They need to be reviewed to ensure that they are appropriate for the different conditions present within Europe (currently, they are not well adapted to Nordic conditions, where ozone is primarily a long-range transport issue).
Competent Authorities
The EC could provide more guidance for the air quality assessment regarding monitoring as macro and micro scale sitting and regarding the PM correction factor to have a common understanding across Member States.
The EC could provide more guidance related to modelling, e.g. how to calculate the population exposed based on models, common approach on which models to be used, etc.
The PaPeRS software could be improved and simplified.
Common guidance on when to report the plans when an exceedance continues over the year.
Competent Authorities
The IPR and reporting demands should be reconsidered. There must be a good reason for the reporting demands, an easily readable guidance, and a flexible system.
There is currently a lack of provisions and guidance on how to perform air quality modelling. Respondent’s country has established a national Air Quality Model. It is important that new provisions in the AAQDs allow for its use.
The reporting on air quality plans is a very time-consuming process, but the benefits from the reporting are not known to reporting authorities.
Compulsory reporting requirements should be limited to strictly necessary and useful information.
Competent Authorities
Review the number of mandatory meta-data parameters
More guidance.
Competent Authorities
More incitements. Easy access to models which municipalities can use.
More examples of measurements at local, regional and national level.
Competent Authorities
Simplification and harmonisation of the requirements for sampling points (no special rules for component, if not really necessary).
Guidelines of the use of simple micro-scale screening models. Avoidance of complex and expensive macro-scale dispersion models.
Competent Authorities
Reporting of costs for measures is not necessary (high burden, limited benefit)
Competent Authorities
Weekly zero/span control in NOx-monitoring
Competent Authorities
An updated registration system (under development)
Better availability of input data is needed (under development) More specific definitions/guidelines on what and how should be modelled.
Other Collecting metadata for reporting - too much information required.
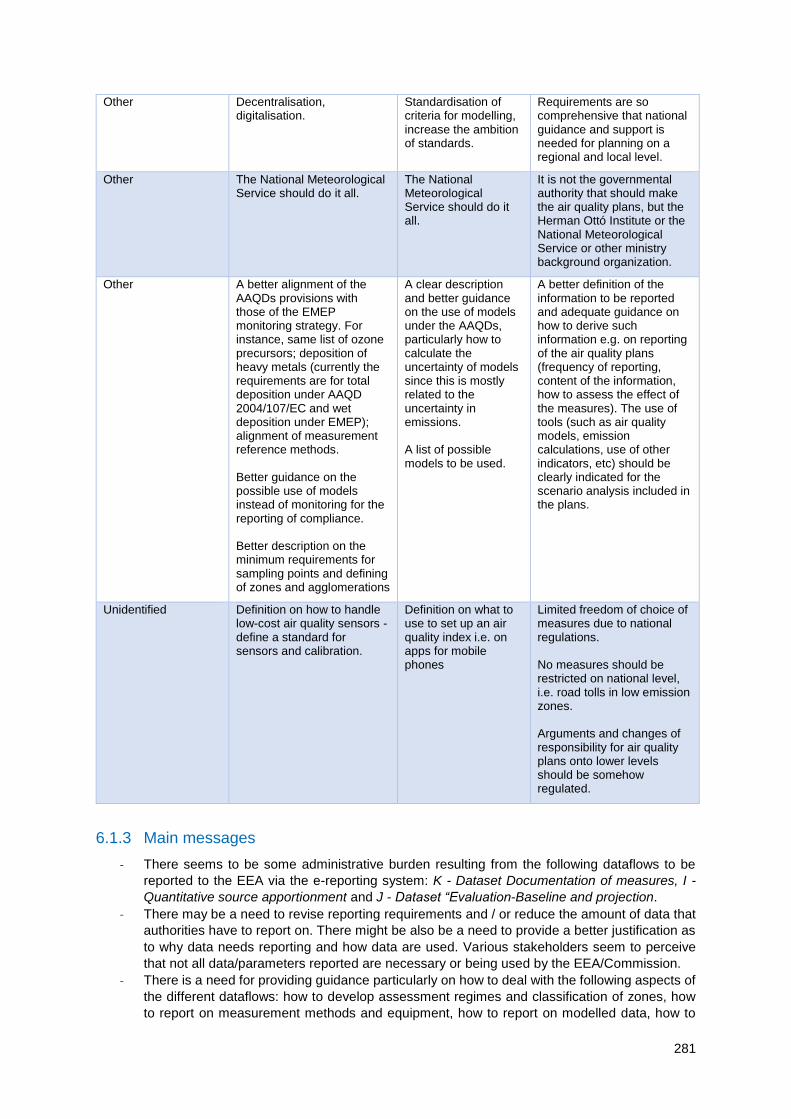
281
Other Decentralisation, digitalisation.
Standardisation of criteria for modelling, increase the ambition of standards.
Requirements are so comprehensive that national guidance and support is needed for planning on a regional and local level.
Other The National Meteorological Service should do it all.
The National Meteorological Service should do it all.
It is not the governmental authority that should make the air quality plans, but the Herman Ottó Institute or the National Meteorological Service or other ministry background organization.
Other A better alignment of the AAQDs provisions with those of the EMEP monitoring strategy. For instance, same list of ozone precursors; deposition of heavy metals (currently the requirements are for total deposition under AAQD 2004/107/EC and wet deposition under EMEP); alignment of measurement reference methods. Better guidance on the possible use of models instead of monitoring for the reporting of compliance. Better description on the minimum requirements for sampling points and defining of zones and agglomerations
A clear description and better guidance on the use of models under the AAQDs, particularly how to calculate the uncertainty of models since this is mostly related to the uncertainty in emissions. A list of possible models to be used.
A better definition of the information to be reported and adequate guidance on how to derive such information e.g. on reporting of the air quality plans (frequency of reporting, content of the information, how to assess the effect of the measures). The use of tools (such as air quality models, emission calculations, use of other indicators, etc) should be clearly indicated for the scenario analysis included in the plans.
Unidentified Definition on how to handle low-cost air quality sensors - define a standard for sensors and calibration.
Definition on what to use to set up an air quality index i.e. on apps for mobile phones
Limited freedom of choice of measures due to national regulations. No measures should be restricted on national level, i.e. road tolls in low emission zones. Arguments and changes of responsibility for air quality plans onto lower levels should be somehow regulated.
6.1.3 Main messages
- There seems to be some administrative burden resulting from the following dataflows to be
reported to the EEA via the e-reporting system: K - Dataset Documentation of measures, I -
Quantitative source apportionment and J - Dataset “Evaluation-Baseline and projection.
- There may be a need to revise reporting requirements and / or reduce the amount of data that
authorities have to report on. There might be also be a need to provide a better justification as
to why data needs reporting and how data are used. Various stakeholders seem to perceive
that not all data/parameters reported are necessary or being used by the EEA/Commission.
- There is a need for providing guidance particularly on how to deal with the following aspects of
the different dataflows: how to develop assessment regimes and classification of zones, how
to report on measurement methods and equipment, how to report on modelled data, how to
282
deal when reporting on multiple pollutants and several regions. Guidance with regards to
modelling (what and how air quality should be modelled) as well as air quality plans seem also
necessary.
- Overall there is the perception that neither national, regional or local level authorities fully
understand their responsibilities regarding air quality and there are indications that authorities
in each governance level are not confident in the level of understanding of authorities in other
governance levels.
- The availability of funding to support the devolution of the requirements of the AAQD to local
level, seems to be impacting efficiency / administrative burden. The survey did not capture ‘how’
this is exactly the case and does not provide examples to illustrate this concern.
- Albeit without consensus, results indicate that the extent to which availability of guidance from
national tiers of government to local tiers of government’ is causing inefficiencies /
administrative burden.
- Albeit without consensus, results indicate that the lack of effective communication seems to be
impacting efficiency / administrative burden. However, the survey does not provide any further
details on how the efficiency and administrative burden are impacted by this aspect.
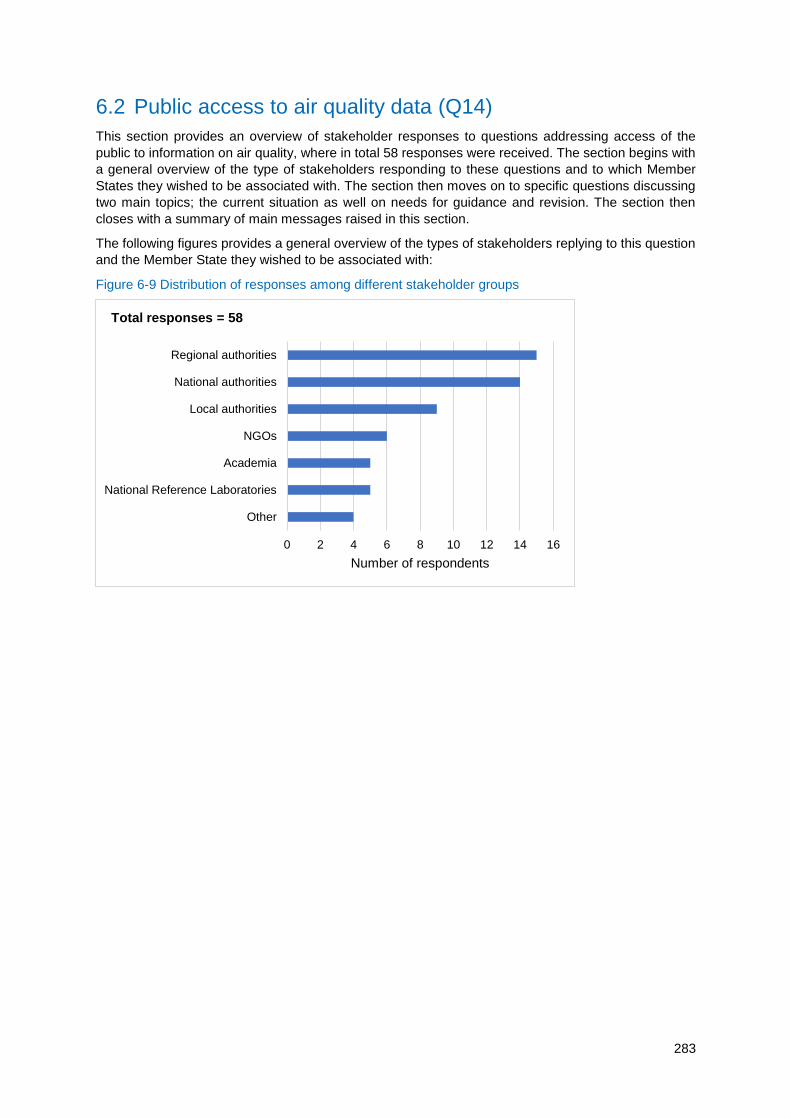
283
6.2 Public access to air quality data (Q14)
This section provides an overview of stakeholder responses to questions addressing access of the
public to information on air quality, where in total 58 responses were received. The section begins with
a general overview of the type of stakeholders responding to these questions and to which Member
States they wished to be associated with. The section then moves on to specific questions discussing
two main topics; the current situation as well on needs for guidance and revision. The section then
closes with a summary of main messages raised in this section.
The following figures provides a general overview of the types of stakeholders replying to this question
and the Member State they wished to be associated with:
Figure 6-9 Distribution of responses among different stakeholder groups
0 2 4 6 8 10 12 14 16
Other
National Reference Laboratories
Academia
NGOs
Local authorities
National authorities
Regional authorities
Number of respondents
Total responses = 58
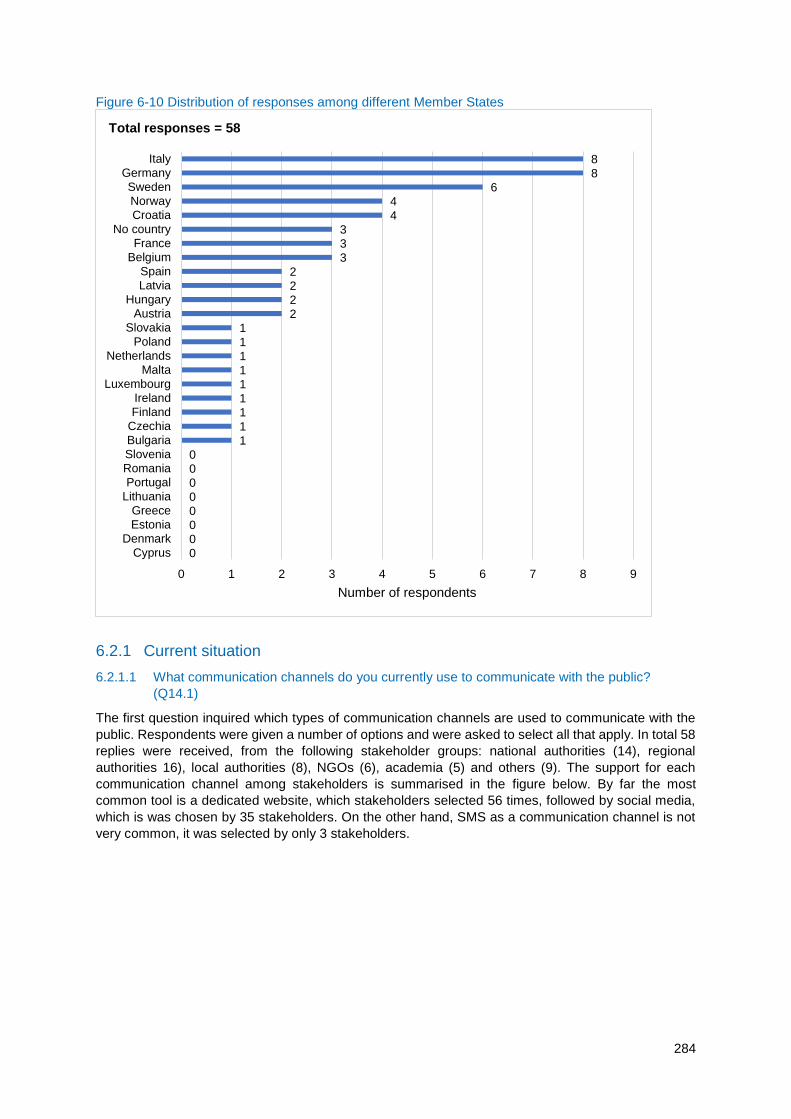
284
Figure 6-10 Distribution of responses among different Member States
6.2.1 Current situation
6.2.1.1 What communication channels do you currently use to communicate with the public?
(Q14.1)
The first question inquired which types of communication channels are used to communicate with the
public. Respondents were given a number of options and were asked to select all that apply. In total 58
replies were received, from the following stakeholder groups: national authorities (14), regional
authorities 16), local authorities (8), NGOs (6), academia (5) and others (9). The support for each
communication channel among stakeholders is summarised in the figure below. By far the most
common tool is a dedicated website, which stakeholders selected 56 times, followed by social media,
which is was chosen by 35 stakeholders. On the other hand, SMS as a communication channel is not
very common, it was selected by only 3 stakeholders.
0
0
0
0
0
0
0
0
1
1
1
1
1
1
1
1
1
2
2
2
2
3
3
3
4
4
6
8
8
0 1 2 3 4 5 6 7 8 9
Cyprus
Denmark
Estonia
Greece
Lithuania
Portugal
Romania
Slovenia
Bulgaria
Czechia
Finland
Ireland
Luxembourg
Malta
Netherlands
Poland
Slovakia
Austria
Hungary
Latvia
Spain
Belgium
France
No country
Croatia
Norway
Sweden
Germany
Italy
Number of respondents
Total responses = 58
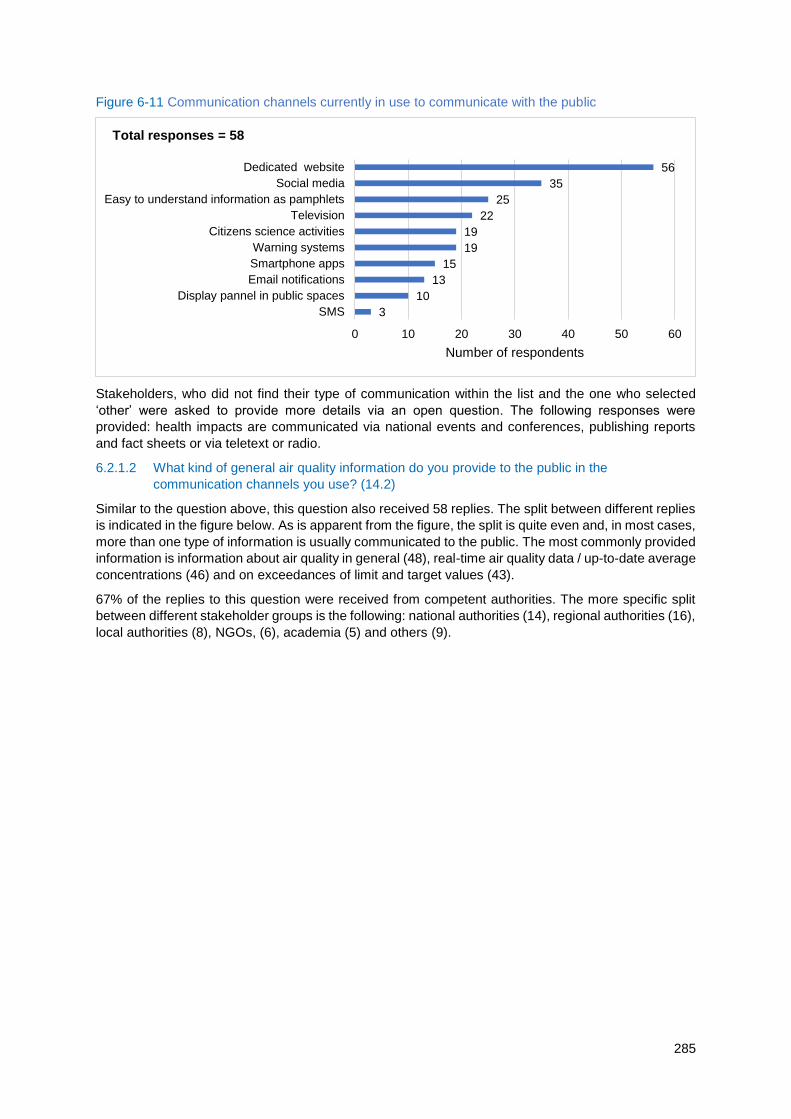
285
Figure 6-11 Communication channels currently in use to communicate with the public
Stakeholders, who did not find their type of communication within the list and the one who selected
‘other’ were asked to provide more details via an open question. The following responses were
provided: health impacts are communicated via national events and conferences, publishing reports
and fact sheets or via teletext or radio.
6.2.1.2 What kind of general air quality information do you provide to the public in the
communication channels you use? (14.2)
Similar to the question above, this question also received 58 replies. The split between different replies
is indicated in the figure below. As is apparent from the figure, the split is quite even and, in most cases,
more than one type of information is usually communicated to the public. The most commonly provided
information is information about air quality in general (48), real-time air quality data / up-to-date average
concentrations (46) and on exceedances of limit and target values (43).
67% of the replies to this question were received from competent authorities. The more specific split
between different stakeholder groups is the following: national authorities (14), regional authorities (16),
local authorities (8), NGOs, (6), academia (5) and others (9).
3
10
13
15
19
19
22
25
35
56
0 10 20 30 40 50 60
SMS
Display pannel in public spaces
Email notifications
Smartphone apps
Warning systems
Citizens science activities
Television
Easy to understand information as pamphlets
Social media
Dedicated website
Number of respondents
Total responses = 58
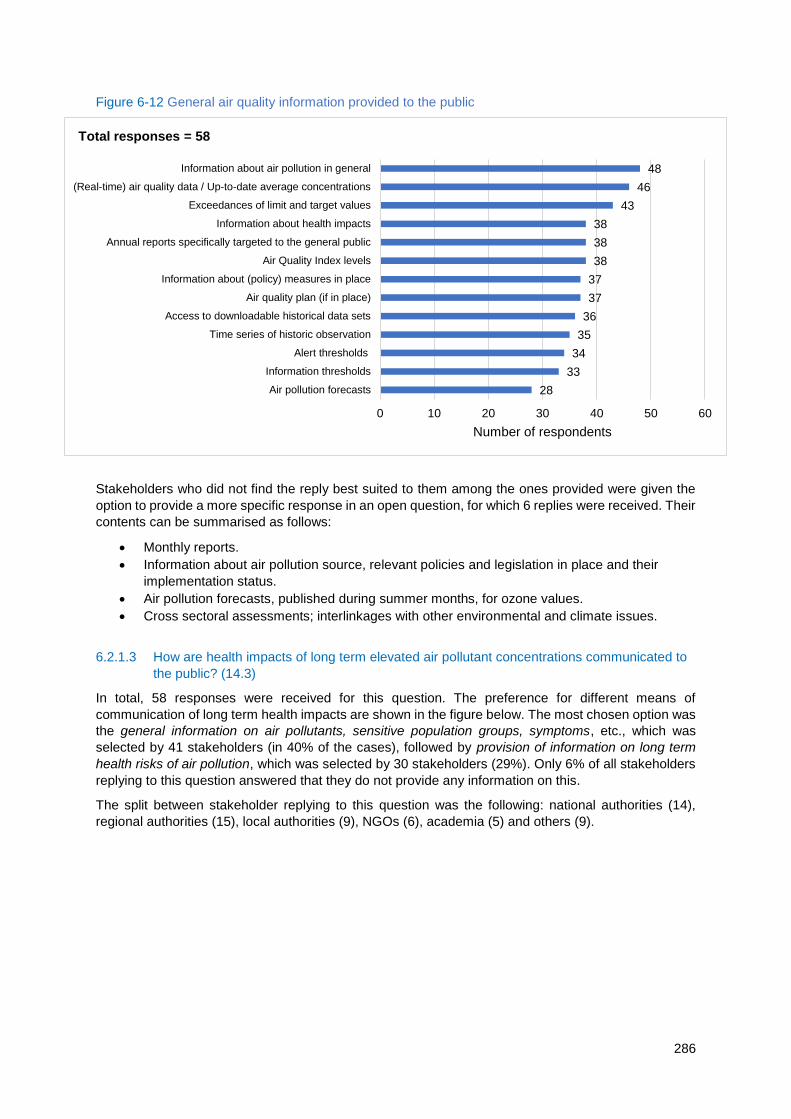
286
Figure 6-12 General air quality information provided to the public
Stakeholders who did not find the reply best suited to them among the ones provided were given the
option to provide a more specific response in an open question, for which 6 replies were received. Their
contents can be summarised as follows:
Monthly reports.
Information about air pollution source, relevant policies and legislation in place and their
implementation status.
Air pollution forecasts, published during summer months, for ozone values.
Cross sectoral assessments; interlinkages with other environmental and climate issues.
6.2.1.3 How are health impacts of long term elevated air pollutant concentrations communicated to
the public? (14.3)
In total, 58 responses were received for this question. The preference for different means of
communication of long term health impacts are shown in the figure below. The most chosen option was
the general information on air pollutants, sensitive population groups, symptoms, etc., which was
selected by 41 stakeholders (in 40% of the cases), followed by provision of information on long term
health risks of air pollution, which was selected by 30 stakeholders (29%). Only 6% of all stakeholders
replying to this question answered that they do not provide any information on this.
The split between stakeholder replying to this question was the following: national authorities (14),
regional authorities (15), local authorities (9), NGOs (6), academia (5) and others (9).
28
33
34
35
36
37
37
38
38
38
43
46
48
0 10 20 30 40 50 60
Air pollution forecasts
Information thresholds
Alert thresholds
Time series of historic observation
Access to downloadable historical data sets
Air quality plan (if in place)
Information about (policy) measures in place
Air Quality Index levels
Annual reports specifically targeted to the general public
Information about health impacts
Exceedances of limit and target values
(Real-time) air quality data / Up-to-date average concentrations
Information about air pollution in general
Number of respondents
Total responses = 58
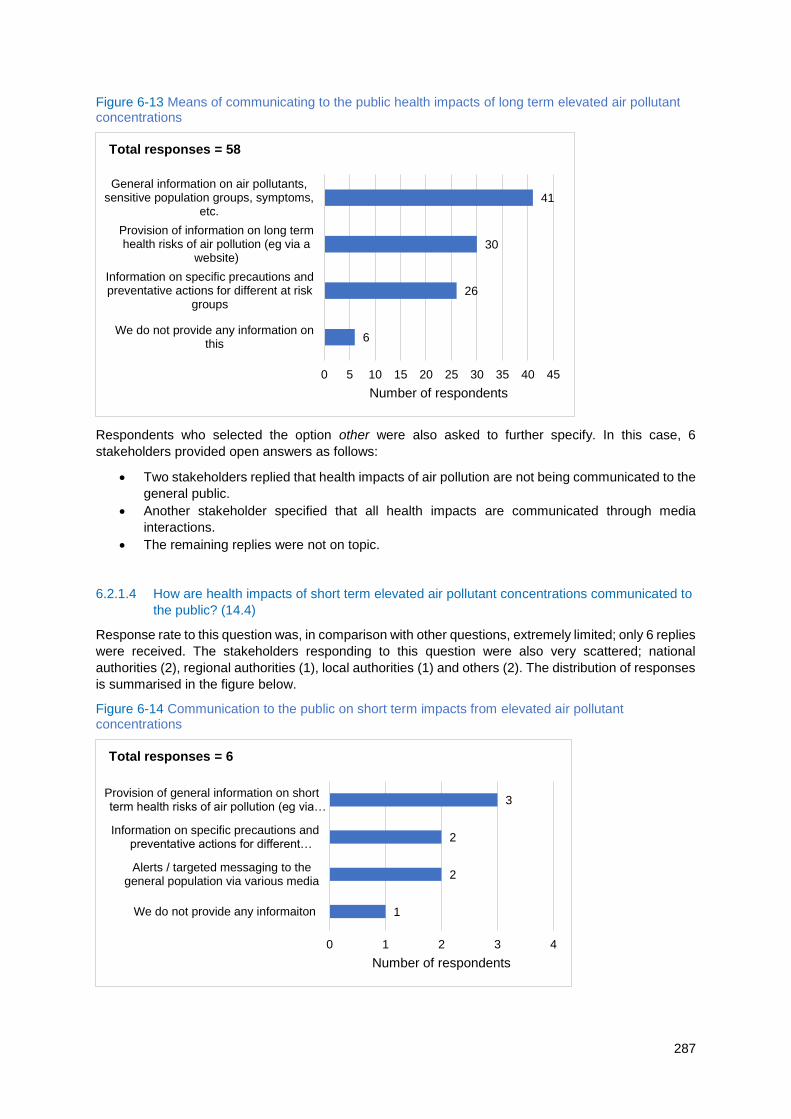
287
Figure 6-13 Means of communicating to the public health impacts of long term elevated air pollutant concentrations
Respondents who selected the option other were also asked to further specify. In this case, 6
stakeholders provided open answers as follows:
Two stakeholders replied that health impacts of air pollution are not being communicated to the
general public.
Another stakeholder specified that all health impacts are communicated through media
interactions.
The remaining replies were not on topic.
6.2.1.4 How are health impacts of short term elevated air pollutant concentrations communicated to
the public? (14.4)
Response rate to this question was, in comparison with other questions, extremely limited; only 6 replies
were received. The stakeholders responding to this question were also very scattered; national
authorities (2), regional authorities (1), local authorities (1) and others (2). The distribution of responses
is summarised in the figure below.
Figure 6-14 Communication to the public on short term impacts from elevated air pollutant concentrations
6
26
30
41
0 5 10 15 20 25 30 35 40 45
We do not provide any information onthis
Information on specific precautions andpreventative actions for different at risk
groups
Provision of information on long termhealth risks of air pollution (eg via a
website)
General information on air pollutants,sensitive population groups, symptoms,
etc.
Number of respondents
Total responses = 58
1
2
2
3
0 1 2 3 4
We do not provide any informaiton
Alerts / targeted messaging to thegeneral population via various media
Information on specific precautions andpreventative actions for different…
Provision of general information on shortterm health risks of air pollution (eg via…
Number of respondents
Total responses = 6
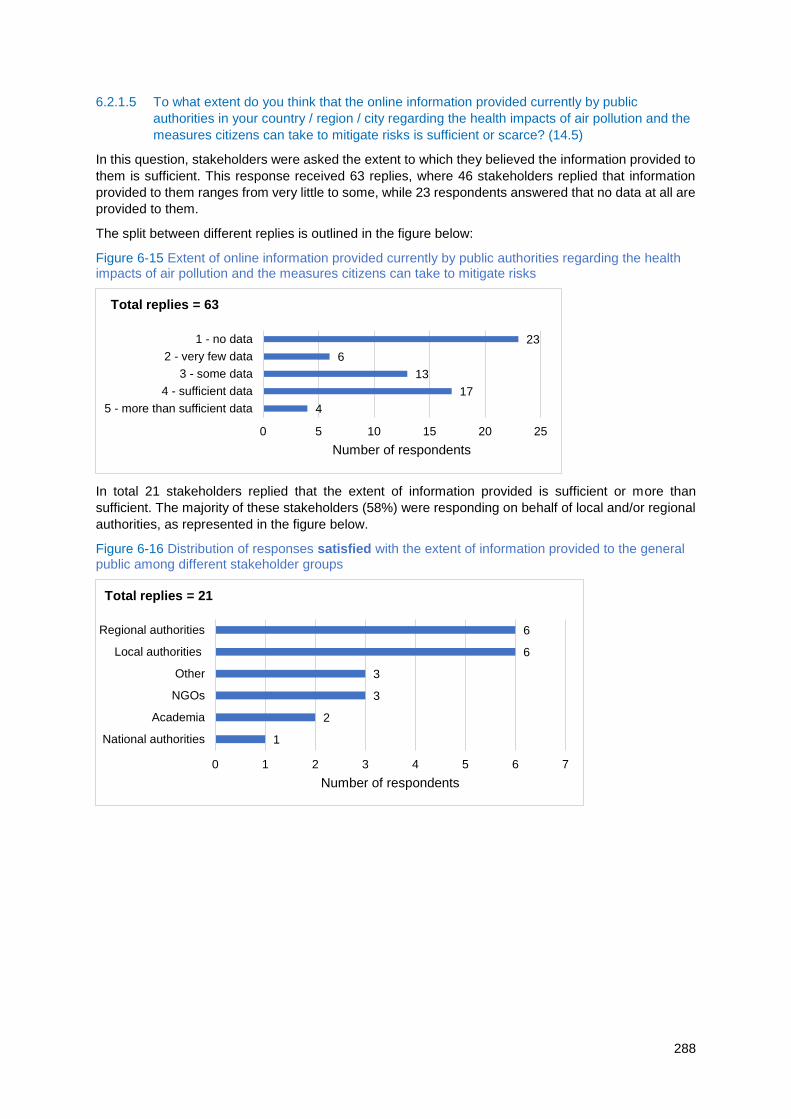
288
6.2.1.5 To what extent do you think that the online information provided currently by public
authorities in your country / region / city regarding the health impacts of air pollution and the
measures citizens can take to mitigate risks is sufficient or scarce? (14.5)
In this question, stakeholders were asked the extent to which they believed the information provided to
them is sufficient. This response received 63 replies, where 46 stakeholders replied that information
provided to them ranges from very little to some, while 23 respondents answered that no data at all are
provided to them.
The split between different replies is outlined in the figure below:
Figure 6-15 Extent of online information provided currently by public authorities regarding the health impacts of air pollution and the measures citizens can take to mitigate risks
In total 21 stakeholders replied that the extent of information provided is sufficient or more than
sufficient. The majority of these stakeholders (58%) were responding on behalf of local and/or regional
authorities, as represented in the figure below.
Figure 6-16 Distribution of responses satisfied with the extent of information provided to the general public among different stakeholder groups
4
17
13
6
23
0 5 10 15 20 25
5 - more than sufficient data
4 - sufficient data
3 - some data
2 - very few data
1 - no data
Number of respondents
Total replies = 63
1
2
3
3
6
6
0 1 2 3 4 5 6 7
National authorities
Academia
NGOs
Other
Local authorities
Regional authorities
Number of respondents
Total replies = 21
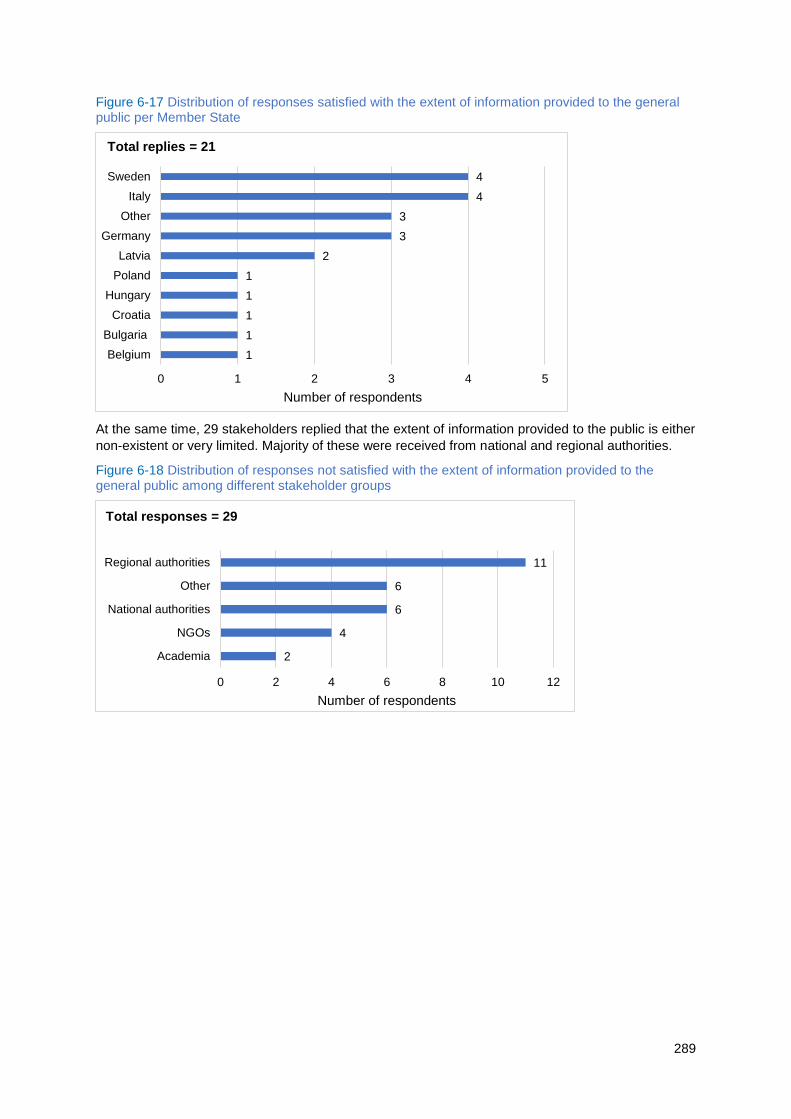
289
Figure 6-17 Distribution of responses satisfied with the extent of information provided to the general public per Member State
At the same time, 29 stakeholders replied that the extent of information provided to the public is either
non-existent or very limited. Majority of these were received from national and regional authorities.
Figure 6-18 Distribution of responses not satisfied with the extent of information provided to the general public among different stakeholder groups
1
1
1
1
1
2
3
3
4
4
0 1 2 3 4 5
Belgium
Bulgaria
Croatia
Hungary
Poland
Latvia
Germany
Other
Italy
Sweden
Number of respondents
Total replies = 21
2
4
6
6
11
0 2 4 6 8 10 12
Academia
NGOs
National authorities
Other
Regional authorities
Number of respondents
Total responses = 29
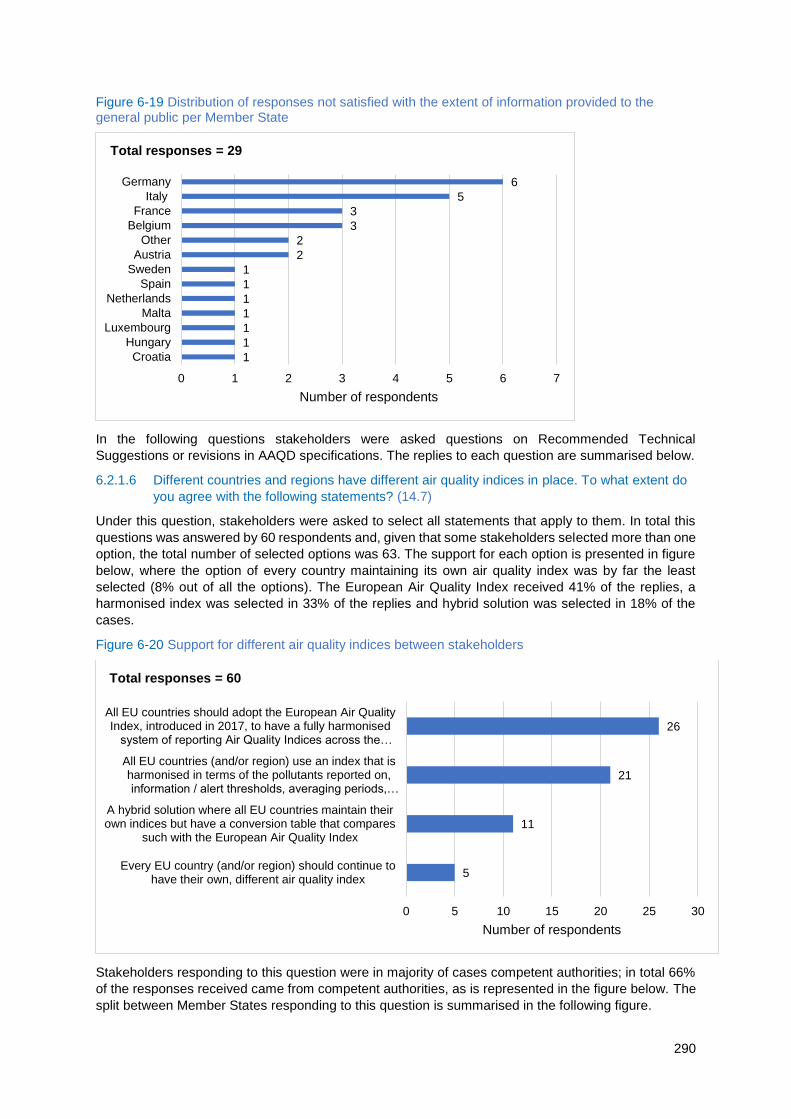
290
Figure 6-19 Distribution of responses not satisfied with the extent of information provided to the general public per Member State
In the following questions stakeholders were asked questions on Recommended Technical
Suggestions or revisions in AAQD specifications. The replies to each question are summarised below.
6.2.1.6 Different countries and regions have different air quality indices in place. To what extent do
you agree with the following statements? (14.7)
Under this question, stakeholders were asked to select all statements that apply to them. In total this
questions was answered by 60 respondents and, given that some stakeholders selected more than one
option, the total number of selected options was 63. The support for each option is presented in figure
below, where the option of every country maintaining its own air quality index was by far the least
selected (8% out of all the options). The European Air Quality Index received 41% of the replies, a
harmonised index was selected in 33% of the replies and hybrid solution was selected in 18% of the
cases.
Figure 6-20 Support for different air quality indices between stakeholders
Stakeholders responding to this question were in majority of cases competent authorities; in total 66%
of the responses received came from competent authorities, as is represented in the figure below. The
split between Member States responding to this question is summarised in the following figure.
1
1
1
1
1
1
1
2
2
3
3
5
6
0 1 2 3 4 5 6 7
Croatia
Hungary
Luxembourg
Malta
Netherlands
Spain
Sweden
Austria
Other
Belgium
France
Italy
Germany
Number of respondents
Total responses = 29
5
11
21
26
0 5 10 15 20 25 30
Every EU country (and/or region) should continue tohave their own, different air quality index
A hybrid solution where all EU countries maintain theirown indices but have a conversion table that compares
such with the European Air Quality Index
All EU countries (and/or region) use an index that isharmonised in terms of the pollutants reported on,information / alert thresholds, averaging periods,…
All EU countries should adopt the European Air QualityIndex, introduced in 2017, to have a fully harmonised
system of reporting Air Quality Indices across the…
Number of respondents
Total responses = 60
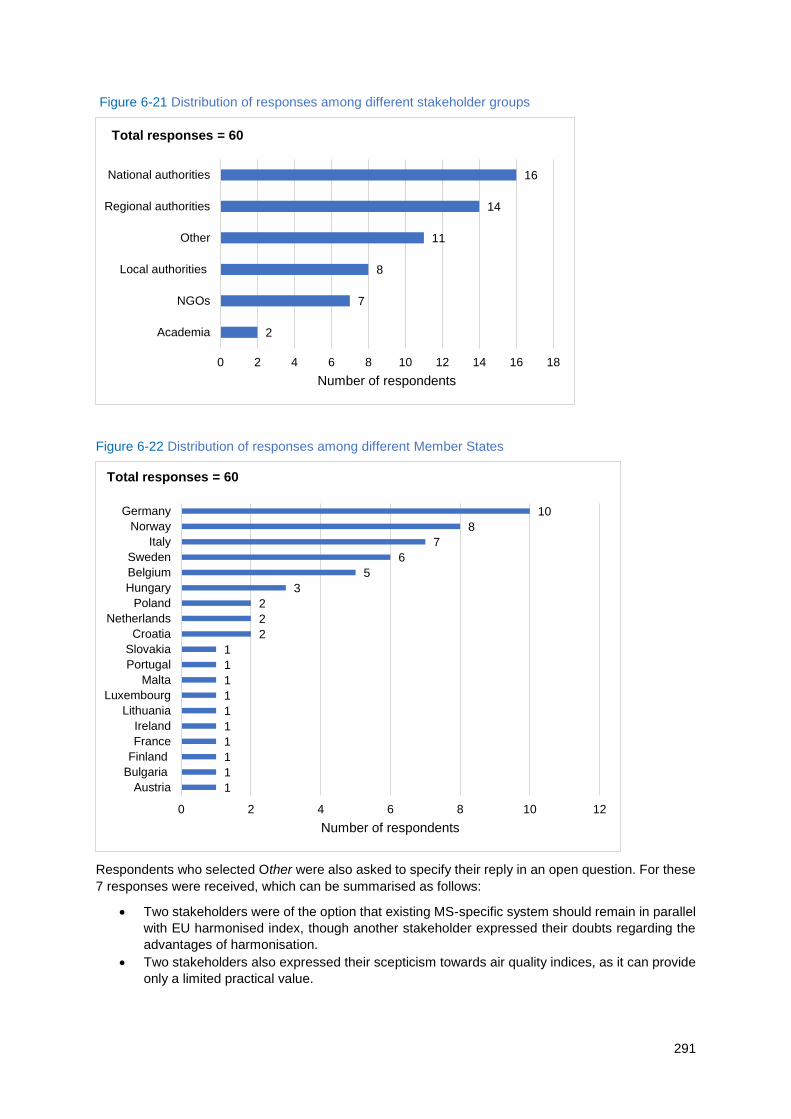
291
Figure 6-21 Distribution of responses among different stakeholder groups
Figure 6-22 Distribution of responses among different Member States
Respondents who selected Other were also asked to specify their reply in an open question. For these
7 responses were received, which can be summarised as follows:
Two stakeholders were of the option that existing MS-specific system should remain in parallel
with EU harmonised index, though another stakeholder expressed their doubts regarding the
advantages of harmonisation.
Two stakeholders also expressed their scepticism towards air quality indices, as it can provide
only a limited practical value.
2
7
8
11
14
16
0 2 4 6 8 10 12 14 16 18
Academia
NGOs
Local authorities
Other
Regional authorities
National authorities
Number of respondents
Total responses = 60
1
1
1
1
1
1
1
1
1
1
2
2
2
3
5
6
7
8
10
0 2 4 6 8 10 12
Austria
Bulgaria
Finland
France
Ireland
Lithuania
Luxembourg
Malta
Portugal
Slovakia
Croatia
Netherlands
Poland
Hungary
Belgium
Sweden
Italy
Norway
Germany
Number of respondents
Total responses = 60
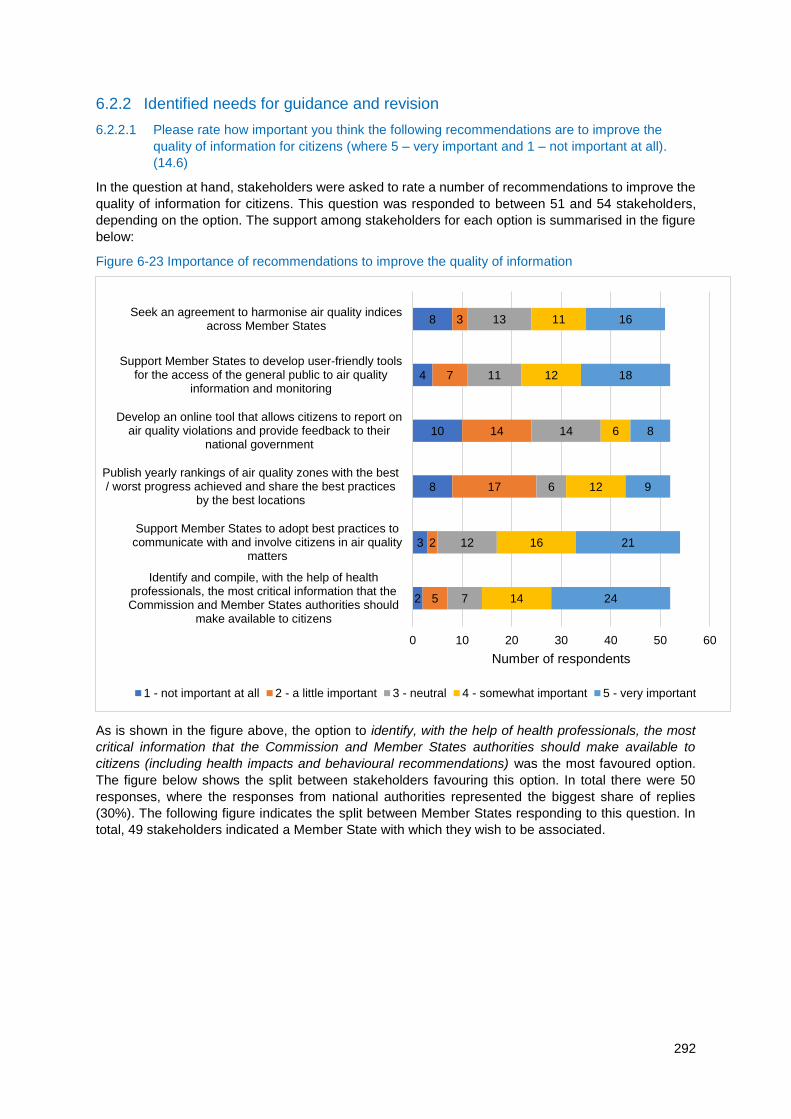
292
6.2.2 Identified needs for guidance and revision
6.2.2.1 Please rate how important you think the following recommendations are to improve the
quality of information for citizens (where 5 – very important and 1 – not important at all).
(14.6)
In the question at hand, stakeholders were asked to rate a number of recommendations to improve the
quality of information for citizens. This question was responded to between 51 and 54 stakeholders,
depending on the option. The support among stakeholders for each option is summarised in the figure
below:
Figure 6-23 Importance of recommendations to improve the quality of information
As is shown in the figure above, the option to identify, with the help of health professionals, the most
critical information that the Commission and Member States authorities should make available to
citizens (including health impacts and behavioural recommendations) was the most favoured option.
The figure below shows the split between stakeholders favouring this option. In total there were 50
responses, where the responses from national authorities represented the biggest share of replies
(30%). The following figure indicates the split between Member States responding to this question. In
total, 49 stakeholders indicated a Member State with which they wish to be associated.
2
3
8
10
4
8
5
2
17
14
7
3
7
12
6
14
11
13
14
16
12
6
12
11
24
21
9
8
18
16
0 10 20 30 40 50 60
Identify and compile, with the help of healthprofessionals, the most critical information that theCommission and Member States authorities should
make available to citizens
Support Member States to adopt best practices tocommunicate with and involve citizens in air quality
matters
Publish yearly rankings of air quality zones with the best/ worst progress achieved and share the best practices
by the best locations
Develop an online tool that allows citizens to report onair quality violations and provide feedback to their
national government
Support Member States to develop user-friendly toolsfor the access of the general public to air quality
information and monitoring
Seek an agreement to harmonise air quality indicesacross Member States
Number of respondents
1 - not important at all 2 - a little important 3 - neutral 4 - somewhat important 5 - very important
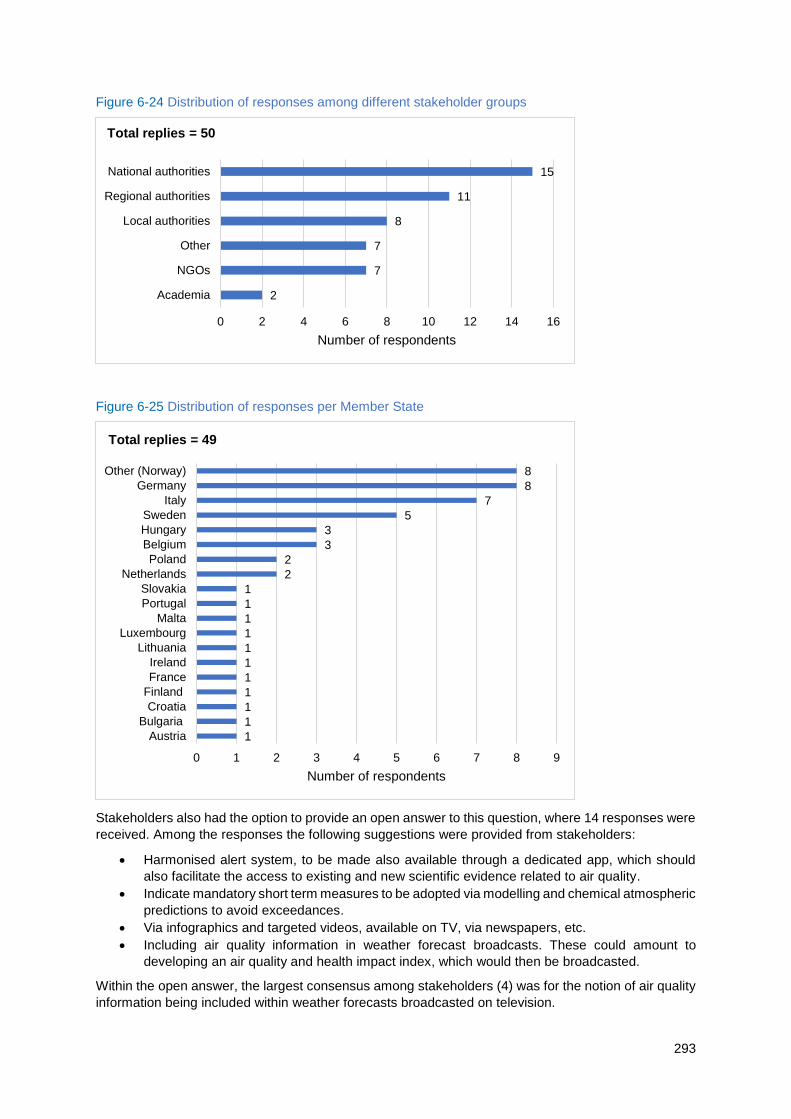
293
Figure 6-24 Distribution of responses among different stakeholder groups
Figure 6-25 Distribution of responses per Member State
Stakeholders also had the option to provide an open answer to this question, where 14 responses were
received. Among the responses the following suggestions were provided from stakeholders:
Harmonised alert system, to be made also available through a dedicated app, which should
also facilitate the access to existing and new scientific evidence related to air quality.
Indicate mandatory short term measures to be adopted via modelling and chemical atmospheric
predictions to avoid exceedances.
Via infographics and targeted videos, available on TV, via newspapers, etc.
Including air quality information in weather forecast broadcasts. These could amount to
developing an air quality and health impact index, which would then be broadcasted.
Within the open answer, the largest consensus among stakeholders (4) was for the notion of air quality
information being included within weather forecasts broadcasted on television.
2
7
7
8
11
15
0 2 4 6 8 10 12 14 16
Academia
NGOs
Other
Local authorities
Regional authorities
National authorities
Number of respondents
Total replies = 50
1
1
1
1
1
1
1
1
1
1
1
2
2
3
3
5
7
8
8
0 1 2 3 4 5 6 7 8 9
Austria
Bulgaria
Croatia
Finland
France
Ireland
Lithuania
Luxembourg
Malta
Portugal
Slovakia
Netherlands
Poland
Belgium
Hungary
Sweden
Italy
Germany
Other (Norway)
Number of respondents
Total replies = 49
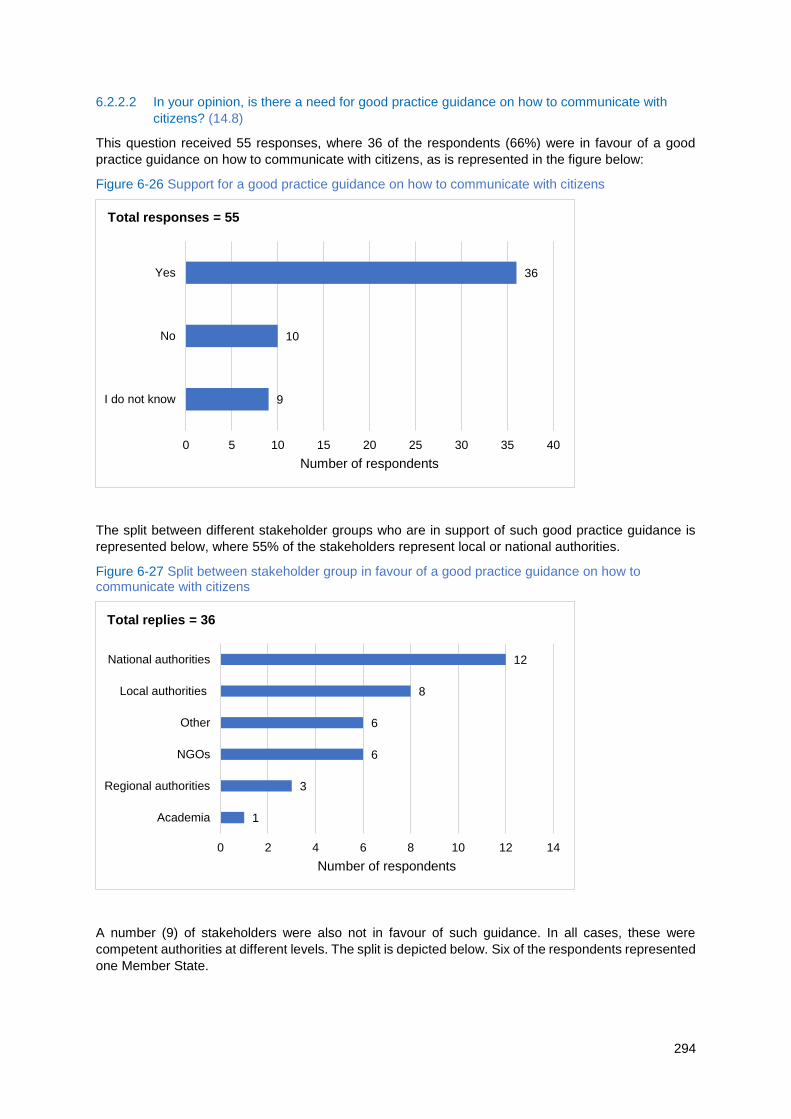
294
6.2.2.2 In your opinion, is there a need for good practice guidance on how to communicate with
citizens? (14.8)
This question received 55 responses, where 36 of the respondents (66%) were in favour of a good
practice guidance on how to communicate with citizens, as is represented in the figure below:
Figure 6-26 Support for a good practice guidance on how to communicate with citizens
The split between different stakeholder groups who are in support of such good practice guidance is
represented below, where 55% of the stakeholders represent local or national authorities.
Figure 6-27 Split between stakeholder group in favour of a good practice guidance on how to communicate with citizens
A number (9) of stakeholders were also not in favour of such guidance. In all cases, these were
competent authorities at different levels. The split is depicted below. Six of the respondents represented
one Member State.
9
10
36
0 5 10 15 20 25 30 35 40
I do not know
No
Yes
Number of respondents
Total responses = 55
1
3
6
6
8
12
0 2 4 6 8 10 12 14
Academia
Regional authorities
NGOs
Other
Local authorities
National authorities
Number of respondents
Total replies = 36
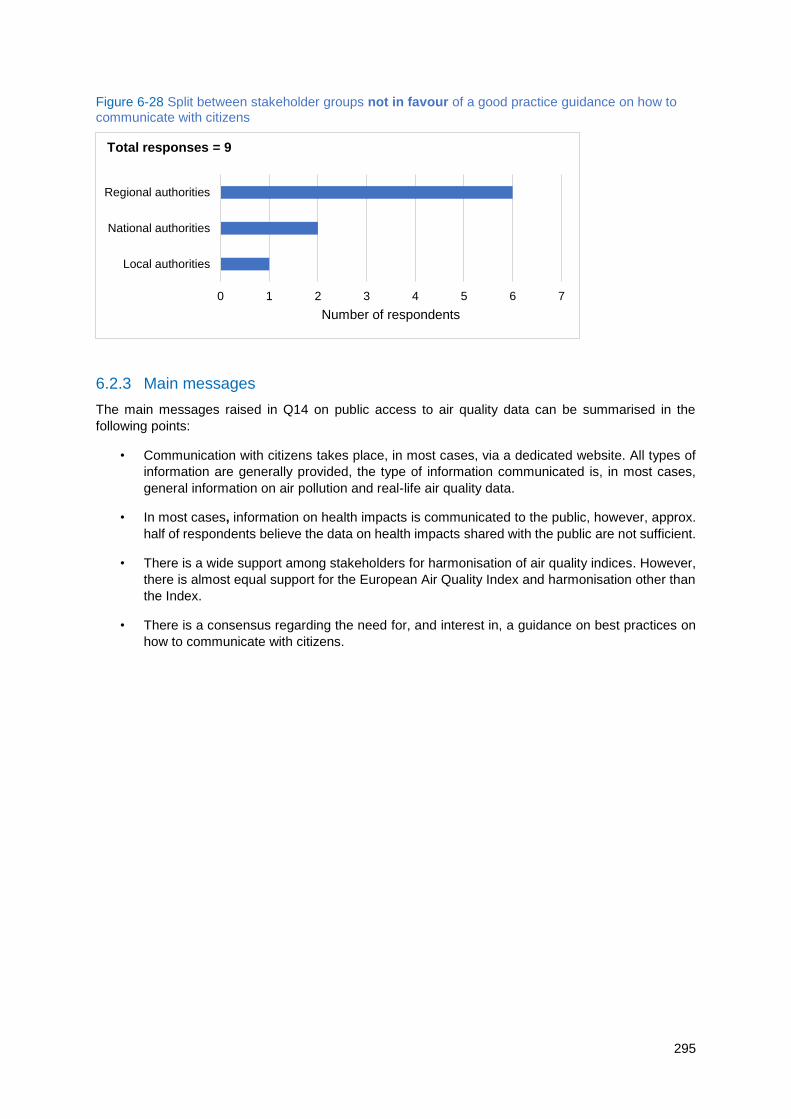
295
Figure 6-28 Split between stakeholder groups not in favour of a good practice guidance on how to communicate with citizens
6.2.3 Main messages
The main messages raised in Q14 on public access to air quality data can be summarised in the
following points:
• Communication with citizens takes place, in most cases, via a dedicated website. All types of
information are generally provided, the type of information communicated is, in most cases,
general information on air pollution and real-life air quality data.
• In most cases, information on health impacts is communicated to the public, however, approx.
half of respondents believe the data on health impacts shared with the public are not sufficient.
• There is a wide support among stakeholders for harmonisation of air quality indices. However,
there is almost equal support for the European Air Quality Index and harmonisation other than
the Index.
• There is a consensus regarding the need for, and interest in, a guidance on best practices on
how to communicate with citizens.
0 1 2 3 4 5 6 7
Local authorities
National authorities
Regional authorities
Number of respondents
Total responses = 9
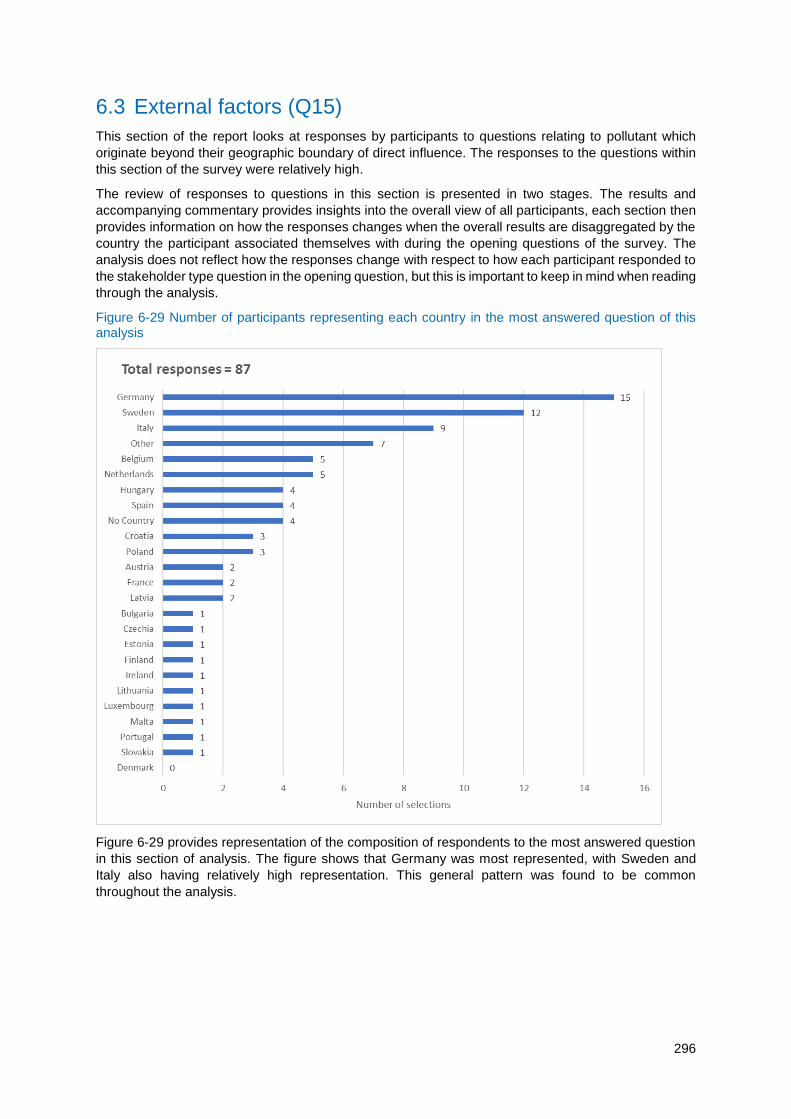
296
6.3 External factors (Q15)
This section of the report looks at responses by participants to questions relating to pollutant which
originate beyond their geographic boundary of direct influence. The responses to the questions within
this section of the survey were relatively high.
The review of responses to questions in this section is presented in two stages. The results and
accompanying commentary provides insights into the overall view of all participants, each section then
provides information on how the responses changes when the overall results are disaggregated by the
country the participant associated themselves with during the opening questions of the survey. The
analysis does not reflect how the responses change with respect to how each participant responded to
the stakeholder type question in the opening question, but this is important to keep in mind when reading
through the analysis.
Figure 6-29 Number of participants representing each country in the most answered question of this analysis
Figure 6-29 provides representation of the composition of respondents to the most answered question
in this section of analysis. The figure shows that Germany was most represented, with Sweden and
Italy also having relatively high representation. This general pattern was found to be common
throughout the analysis.
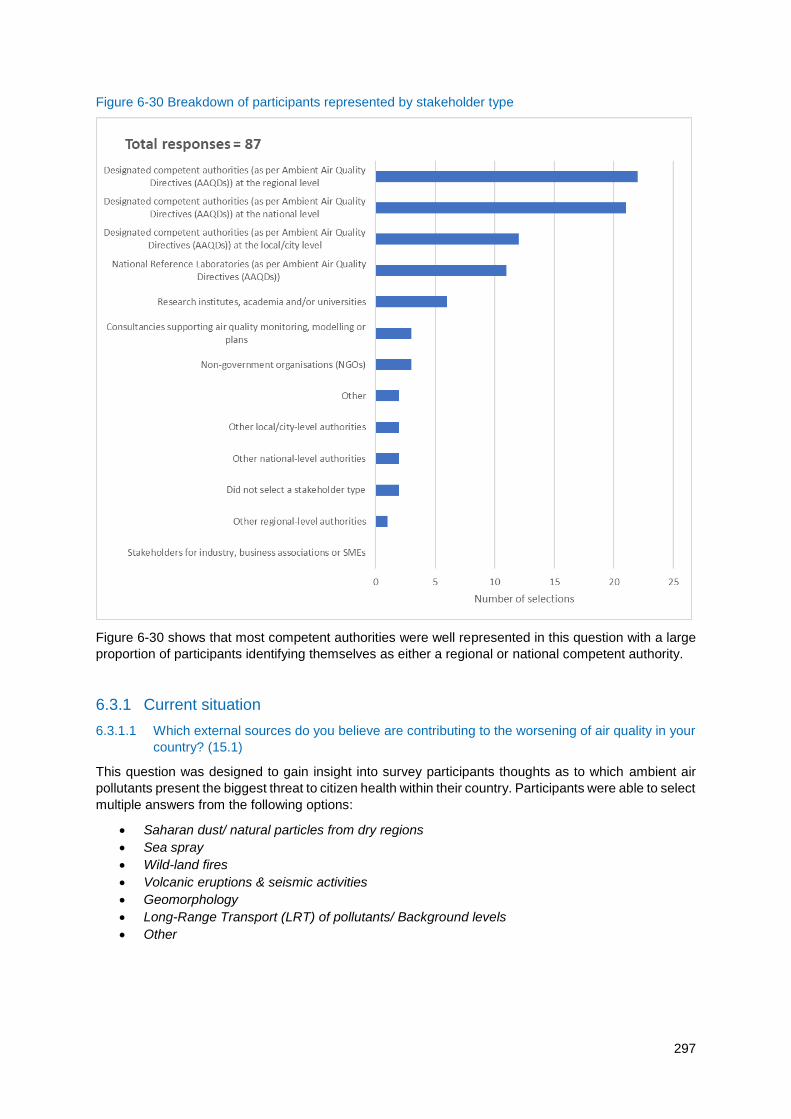
297
Figure 6-30 Breakdown of participants represented by stakeholder type
Figure 6-30 shows that most competent authorities were well represented in this question with a large
proportion of participants identifying themselves as either a regional or national competent authority.
6.3.1 Current situation
6.3.1.1 Which external sources do you believe are contributing to the worsening of air quality in your
country? (15.1)
This question was designed to gain insight into survey participants thoughts as to which ambient air
pollutants present the biggest threat to citizen health within their country. Participants were able to select
multiple answers from the following options:
Saharan dust/ natural particles from dry regions
Sea spray
Wild-land fires
Volcanic eruptions & seismic activities
Geomorphology
Long-Range Transport (LRT) of pollutants/ Background levels
Other
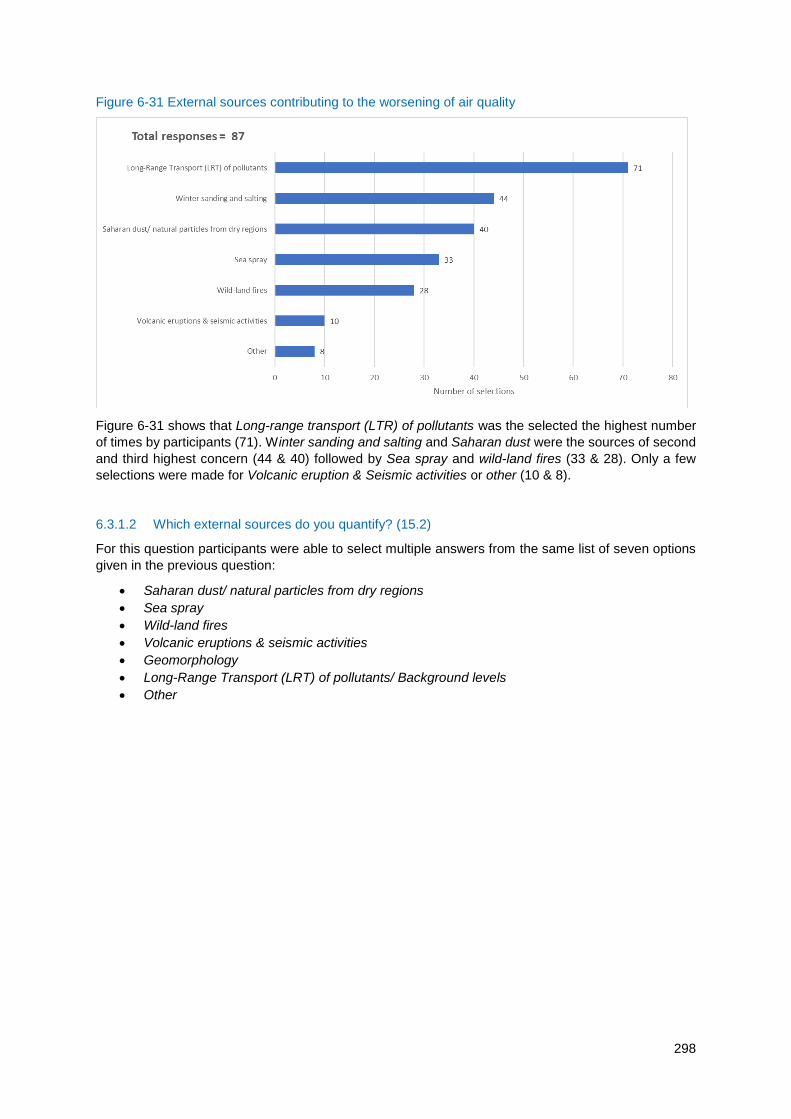
298
Figure 6-31 External sources contributing to the worsening of air quality
Figure 6-31 shows that Long-range transport (LTR) of pollutants was the selected the highest number
of times by participants (71). Winter sanding and salting and Saharan dust were the sources of second
and third highest concern (44 & 40) followed by Sea spray and wild-land fires (33 & 28). Only a few
selections were made for Volcanic eruption & Seismic activities or other (10 & 8).
6.3.1.2 Which external sources do you quantify? (15.2)
For this question participants were able to select multiple answers from the same list of seven options
given in the previous question:
Saharan dust/ natural particles from dry regions
Sea spray
Wild-land fires
Volcanic eruptions & seismic activities
Geomorphology
Long-Range Transport (LRT) of pollutants/ Background levels
Other
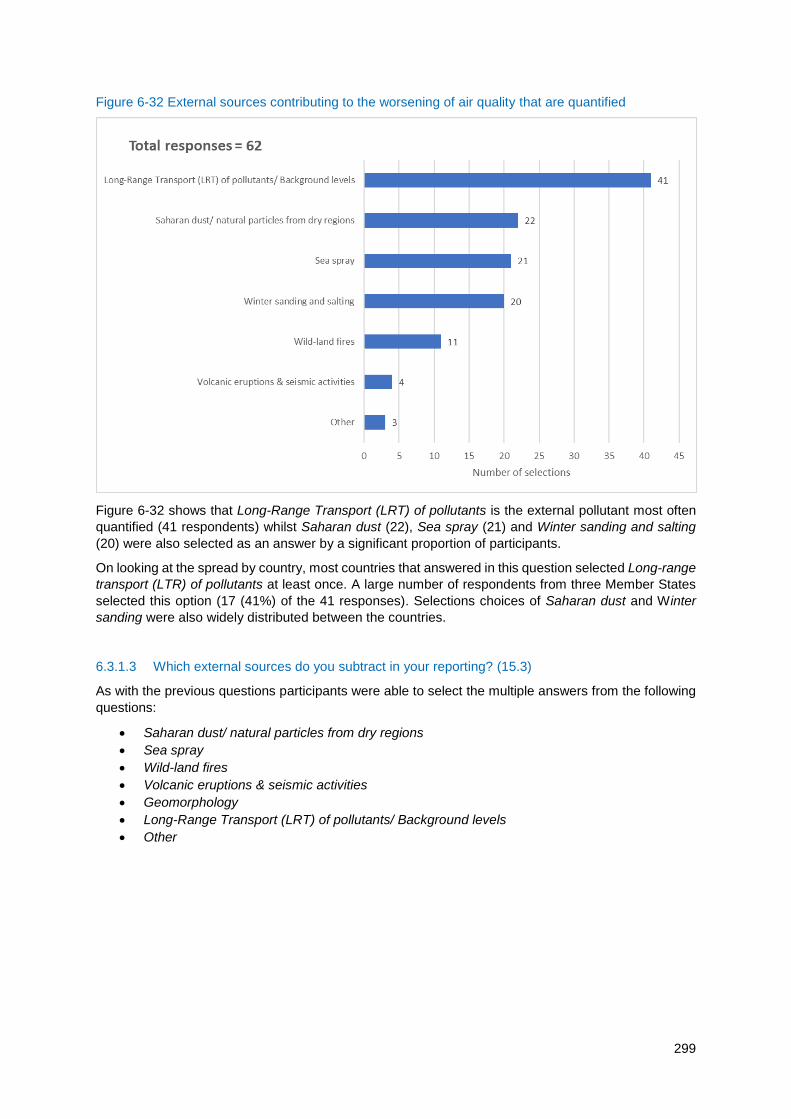
299
Figure 6-32 External sources contributing to the worsening of air quality that are quantified
Figure 6-32 shows that Long-Range Transport (LRT) of pollutants is the external pollutant most often
quantified (41 respondents) whilst Saharan dust (22), Sea spray (21) and Winter sanding and salting
(20) were also selected as an answer by a significant proportion of participants.
On looking at the spread by country, most countries that answered in this question selected Long-range
transport (LTR) of pollutants at least once. A large number of respondents from three Member States
selected this option (17 (41%) of the 41 responses). Selections choices of Saharan dust and Winter
sanding were also widely distributed between the countries.
6.3.1.3 Which external sources do you subtract in your reporting? (15.3)
As with the previous questions participants were able to select the multiple answers from the following
questions:
Saharan dust/ natural particles from dry regions
Sea spray
Wild-land fires
Volcanic eruptions & seismic activities
Geomorphology
Long-Range Transport (LRT) of pollutants/ Background levels
Other
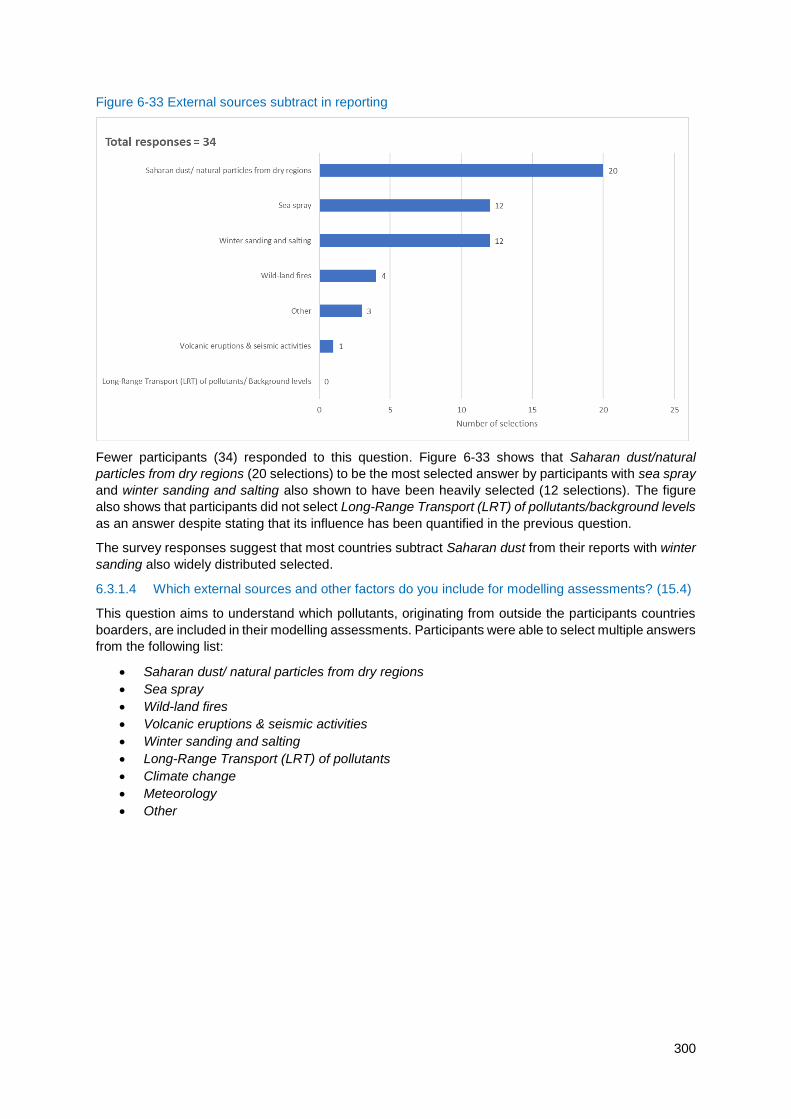
300
Figure 6-33 External sources subtract in reporting
Fewer participants (34) responded to this question. Figure 6-33 shows that Saharan dust/natural
particles from dry regions (20 selections) to be the most selected answer by participants with sea spray
and winter sanding and salting also shown to have been heavily selected (12 selections). The figure
also shows that participants did not select Long-Range Transport (LRT) of pollutants/background levels
as an answer despite stating that its influence has been quantified in the previous question.
The survey responses suggest that most countries subtract Saharan dust from their reports with winter
sanding also widely distributed selected.
6.3.1.4 Which external sources and other factors do you include for modelling assessments? (15.4)
This question aims to understand which pollutants, originating from outside the participants countries
boarders, are included in their modelling assessments. Participants were able to select multiple answers
from the following list:
Saharan dust/ natural particles from dry regions
Sea spray
Wild-land fires
Volcanic eruptions & seismic activities
Winter sanding and salting
Long-Range Transport (LRT) of pollutants
Climate change
Meteorology
Other
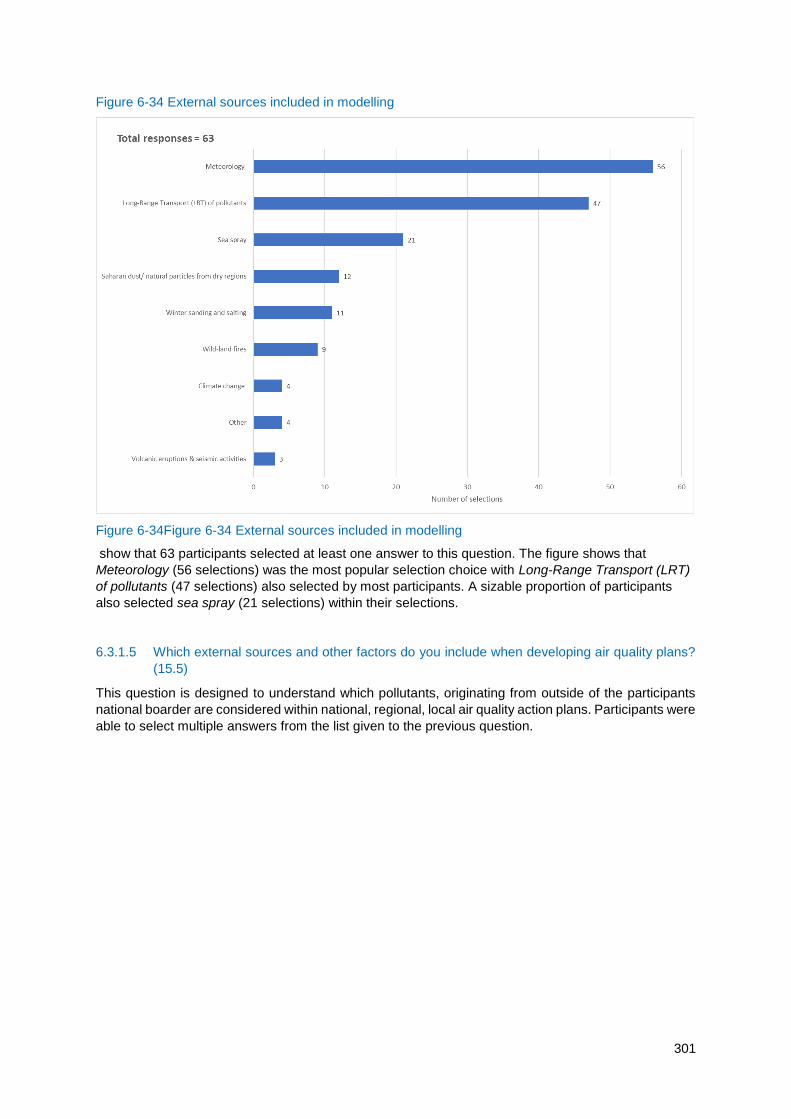
301
Figure 6-34 External sources included in modelling
Figure 6-34Figure 6-34 External sources included in modelling
show that 63 participants selected at least one answer to this question. The figure shows that
Meteorology (56 selections) was the most popular selection choice with Long-Range Transport (LRT)
of pollutants (47 selections) also selected by most participants. A sizable proportion of participants
also selected sea spray (21 selections) within their selections.
6.3.1.5 Which external sources and other factors do you include when developing air quality plans?
(15.5)
This question is designed to understand which pollutants, originating from outside of the participants
national boarder are considered within national, regional, local air quality action plans. Participants were
able to select multiple answers from the list given to the previous question.
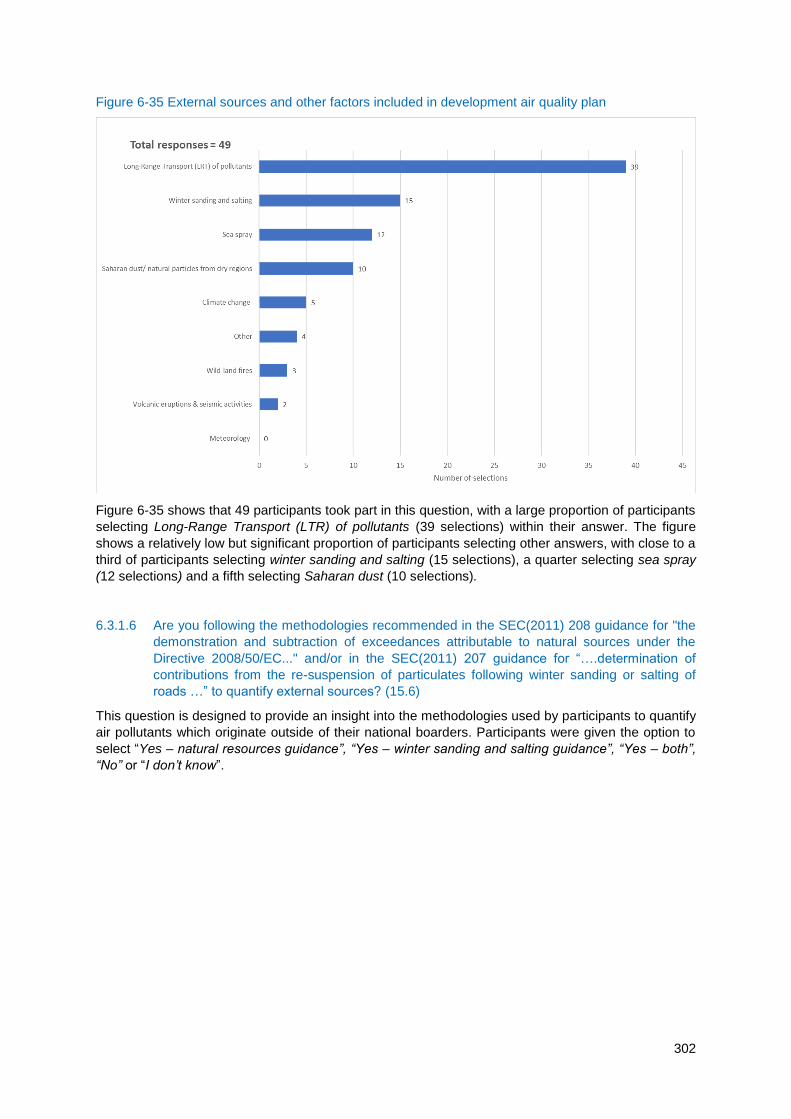
302
Figure 6-35 External sources and other factors included in development air quality plan
Figure 6-35 shows that 49 participants took part in this question, with a large proportion of participants
selecting Long-Range Transport (LTR) of pollutants (39 selections) within their answer. The figure
shows a relatively low but significant proportion of participants selecting other answers, with close to a
third of participants selecting winter sanding and salting (15 selections), a quarter selecting sea spray
(12 selections) and a fifth selecting Saharan dust (10 selections).
6.3.1.6 Are you following the methodologies recommended in the SEC(2011) 208 guidance for "the
demonstration and subtraction of exceedances attributable to natural sources under the
Directive 2008/50/EC..." and/or in the SEC(2011) 207 guidance for “….determination of
contributions from the re-suspension of particulates following winter sanding or salting of
roads …” to quantify external sources? (15.6)
This question is designed to provide an insight into the methodologies used by participants to quantify
air pollutants which originate outside of their national boarders. Participants were given the option to
select “Yes – natural resources guidance”, “Yes – winter sanding and salting guidance”, “Yes – both”,
“No” or “I don’t know”.
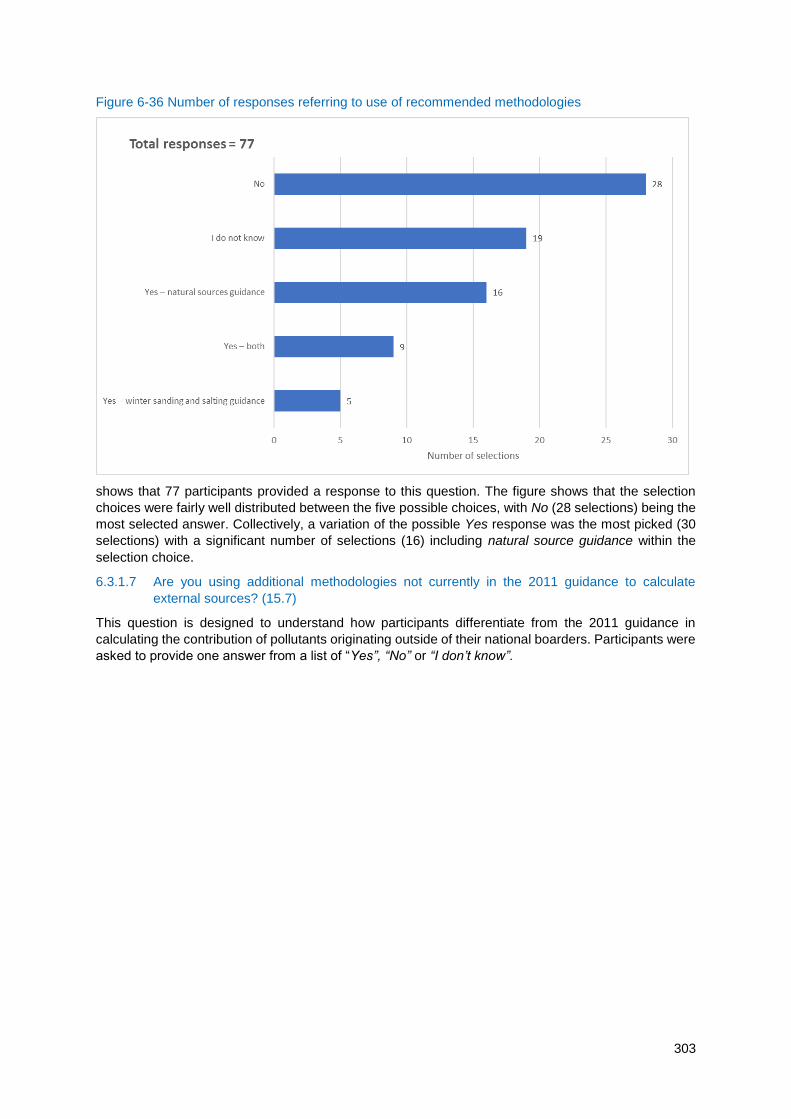
303
Figure 6-36 Number of responses referring to use of recommended methodologies
shows that 77 participants provided a response to this question. The figure shows that the selection
choices were fairly well distributed between the five possible choices, with No (28 selections) being the
most selected answer. Collectively, a variation of the possible Yes response was the most picked (30
selections) with a significant number of selections (16) including natural source guidance within the
selection choice.
6.3.1.7 Are you using additional methodologies not currently in the 2011 guidance to calculate
external sources? (15.7)
This question is designed to understand how participants differentiate from the 2011 guidance in
calculating the contribution of pollutants originating outside of their national boarders. Participants were
asked to provide one answer from a list of “Yes”, “No” or “I don’t know”.
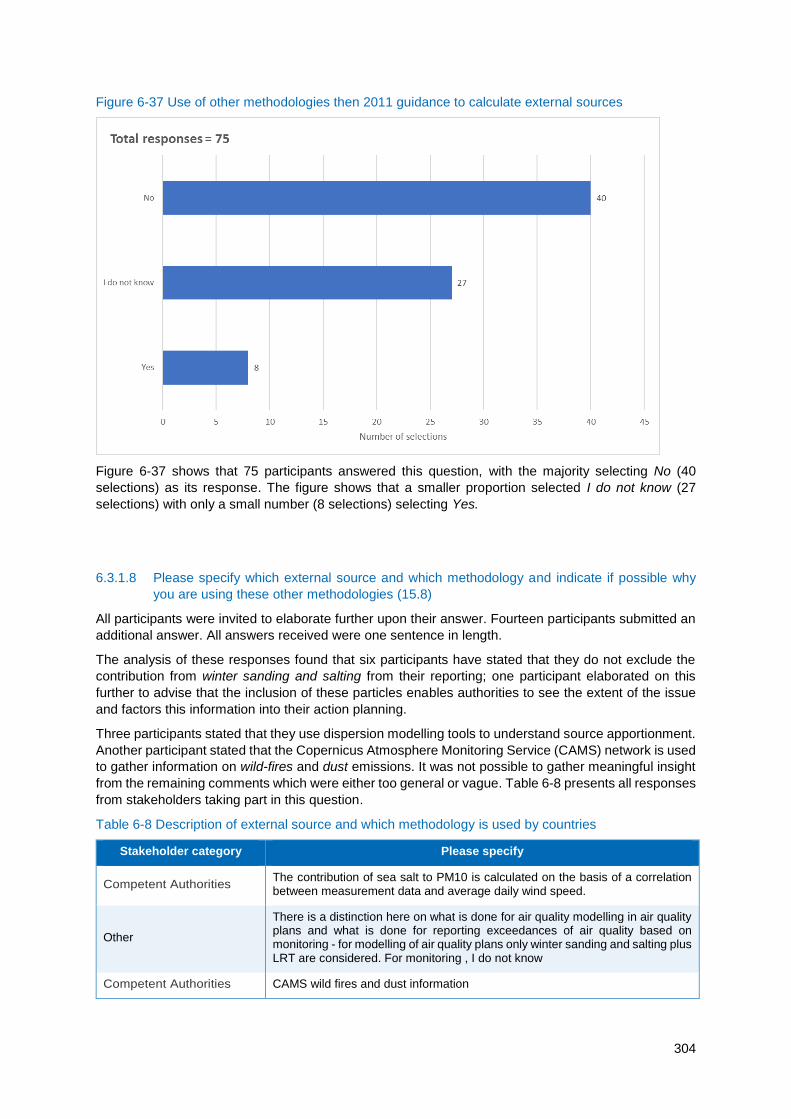
304
Figure 6-37 Use of other methodologies then 2011 guidance to calculate external sources
Figure 6-37 shows that 75 participants answered this question, with the majority selecting No (40
selections) as its response. The figure shows that a smaller proportion selected I do not know (27
selections) with only a small number (8 selections) selecting Yes.
6.3.1.8 Please specify which external source and which methodology and indicate if possible why
you are using these other methodologies (15.8)
All participants were invited to elaborate further upon their answer. Fourteen participants submitted an
additional answer. All answers received were one sentence in length.
The analysis of these responses found that six participants have stated that they do not exclude the
contribution from winter sanding and salting from their reporting; one participant elaborated on this
further to advise that the inclusion of these particles enables authorities to see the extent of the issue
and factors this information into their action planning.
Three participants stated that they use dispersion modelling tools to understand source apportionment.
Another participant stated that the Copernicus Atmosphere Monitoring Service (CAMS) network is used
to gather information on wild-fires and dust emissions. It was not possible to gather meaningful insight
from the remaining comments which were either too general or vague. Table 6-8 presents all responses
from stakeholders taking part in this question.
Table 6-8 Description of external source and which methodology is used by countries
Stakeholder category Please specify
Competent Authorities The contribution of sea salt to PM10 is calculated on the basis of a correlation between measurement data and average daily wind speed.
Other
There is a distinction here on what is done for air quality modelling in air quality plans and what is done for reporting exceedances of air quality based on monitoring - for modelling of air quality plans only winter sanding and salting plus LRT are considered. For monitoring , I do not know
Competent Authorities CAMS wild fires and dust information
305
Competent Authorities We applied only pilot project for winter sanding and salting
Competent Authorities Ireland has not had exceedances for PM10 or PM2.5 and does not subtract external sources.
Other Winter sanding and salting is includes in our measurements of particles and it contributes to the air quality. We see no need to exclude it.
Competent Authorities
Possible contributions from winter sanding and salting are taken into account in air quality plans, but are not subtracted from our reported air quality data. Instead of subtracting any increases in concentrations of PM10 from winter sanding and salting, measures are taken by authorities to actually address the problem and improve actual air quality instead of manipulating the data/compliance assessments being reported.
National Reference Laboratory
Source apportionment is done within our modelling system, but not with the aim of subtracting external sources. In Swedish conditions, exceedances are most often caused by local/urban anthropogenic activities.
Competent Authorities In the respondents’s state the State Institute for Environment is responsible for quantification of external sources.
Competent Authorities Exists a specific methodology for our country. Approved for CE
Competent Authorities We use dispersion modelling (the NORTRIP-model) for the quantification on PM10 from winter sanding and saltning. However we do not subtract these exceedances, i.e. they are included in the reported exceedences of PM10.
Competent Authorities External sources are only considered if relevant for compliance, this is not often the case, therefore we leave
National Reference Laboratory
The following questions to those who are concerned
Competent Authorities External sources are only considered if relevant for compliance, this is not often the case, therefore we leave the following questions to those who are concerned
6.3.2 Identified needs for guidance and revision
6.3.2.1 Is there a need to include additional eligible external factors for subtraction under the AAQDs?
(15.9)
This question is designed to understand how robust the AAQDs are at accurately reflecting national
contributions to cross boundary air pollution. For this question participants were asked to select from a
choice of Yes, No or I do not know.
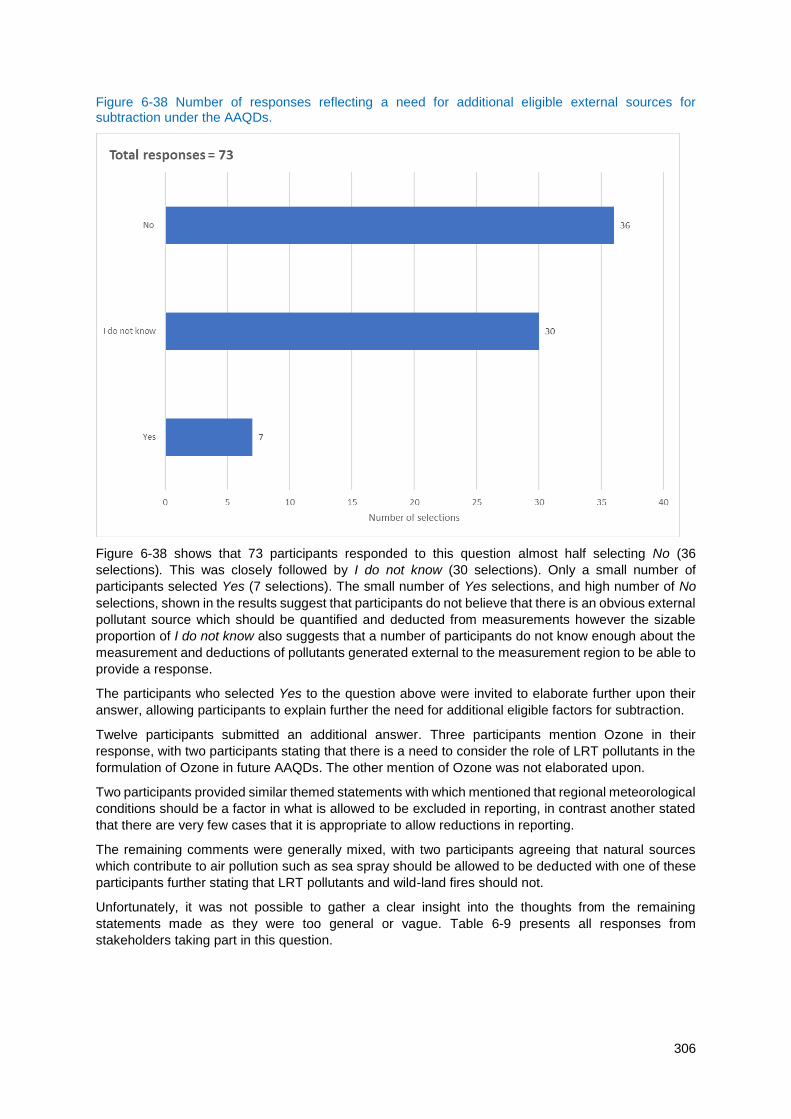
306
Figure 6-38 Number of responses reflecting a need for additional eligible external sources for subtraction under the AAQDs.
Figure 6-38 shows that 73 participants responded to this question almost half selecting No (36
selections). This was closely followed by I do not know (30 selections). Only a small number of
participants selected Yes (7 selections). The small number of Yes selections, and high number of No
selections, shown in the results suggest that participants do not believe that there is an obvious external
pollutant source which should be quantified and deducted from measurements however the sizable
proportion of I do not know also suggests that a number of participants do not know enough about the
measurement and deductions of pollutants generated external to the measurement region to be able to
provide a response.
The participants who selected Yes to the question above were invited to elaborate further upon their
answer, allowing participants to explain further the need for additional eligible factors for subtraction.
Twelve participants submitted an additional answer. Three participants mention Ozone in their
response, with two participants stating that there is a need to consider the role of LRT pollutants in the
formulation of Ozone in future AAQDs. The other mention of Ozone was not elaborated upon.
Two participants provided similar themed statements with which mentioned that regional meteorological
conditions should be a factor in what is allowed to be excluded in reporting, in contrast another stated
that there are very few cases that it is appropriate to allow reductions in reporting.
The remaining comments were generally mixed, with two participants agreeing that natural sources
which contribute to air pollution such as sea spray should be allowed to be deducted with one of these
participants further stating that LRT pollutants and wild-land fires should not.
Unfortunately, it was not possible to gather a clear insight into the thoughts from the remaining
statements made as they were too general or vague. Table 6-9 presents all responses from
stakeholders taking part in this question.
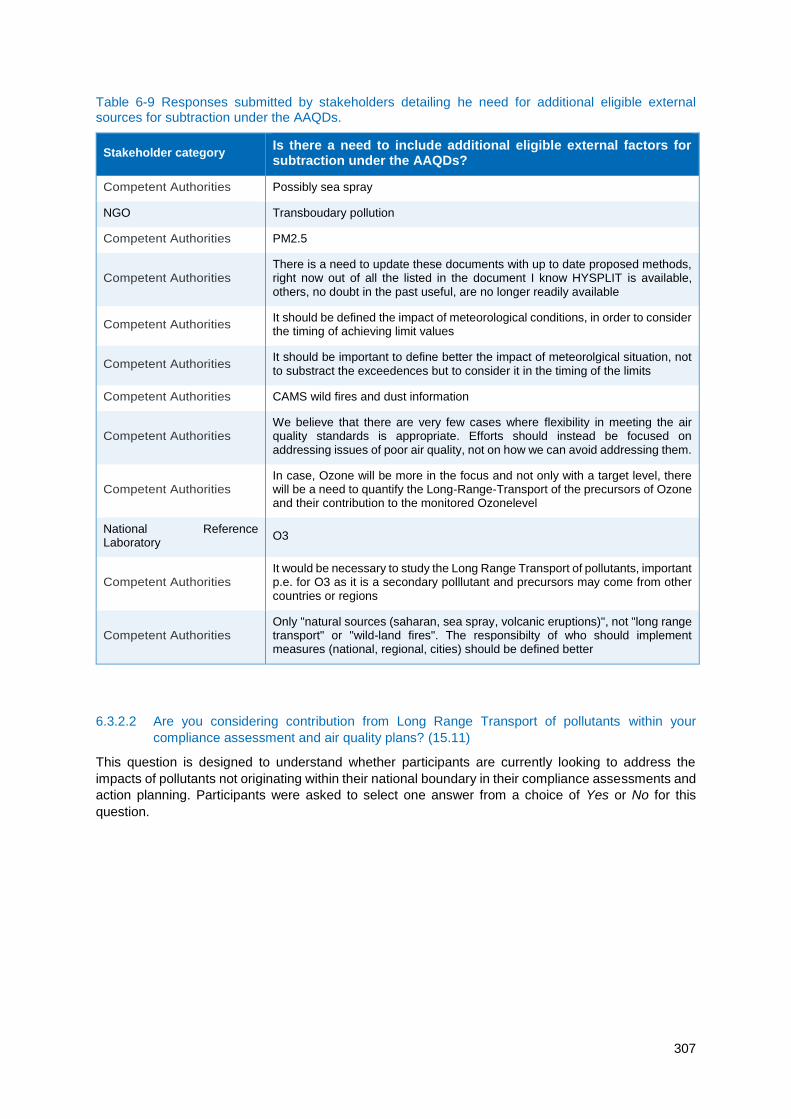
307
Table 6-9 Responses submitted by stakeholders detailing he need for additional eligible external sources for subtraction under the AAQDs.
Stakeholder category Is there a need to include additional eligible external factors for subtraction under the AAQDs?
Competent Authorities Possibly sea spray
NGO Transboudary pollution
Competent Authorities PM2.5
Competent Authorities There is a need to update these documents with up to date proposed methods, right now out of all the listed in the document I know HYSPLIT is available, others, no doubt in the past useful, are no longer readily available
Competent Authorities It should be defined the impact of meteorological conditions, in order to consider the timing of achieving limit values
Competent Authorities It should be important to define better the impact of meteorolgical situation, not to substract the exceedences but to consider it in the timing of the limits
Competent Authorities CAMS wild fires and dust information
Competent Authorities We believe that there are very few cases where flexibility in meeting the air quality standards is appropriate. Efforts should instead be focused on addressing issues of poor air quality, not on how we can avoid addressing them.
Competent Authorities In case, Ozone will be more in the focus and not only with a target level, there will be a need to quantify the Long-Range-Transport of the precursors of Ozone and their contribution to the monitored Ozonelevel
National Reference Laboratory
O3
Competent Authorities It would be necessary to study the Long Range Transport of pollutants, important p.e. for O3 as it is a secondary polllutant and precursors may come from other countries or regions
Competent Authorities Only "natural sources (saharan, sea spray, volcanic eruptions)", not "long range transport" or "wild-land fires". The responsibilty of who should implement measures (national, regional, cities) should be defined better
6.3.2.2 Are you considering contribution from Long Range Transport of pollutants within your
compliance assessment and air quality plans? (15.11)
This question is designed to understand whether participants are currently looking to address the
impacts of pollutants not originating within their national boundary in their compliance assessments and
action planning. Participants were asked to select one answer from a choice of Yes or No for this
question.
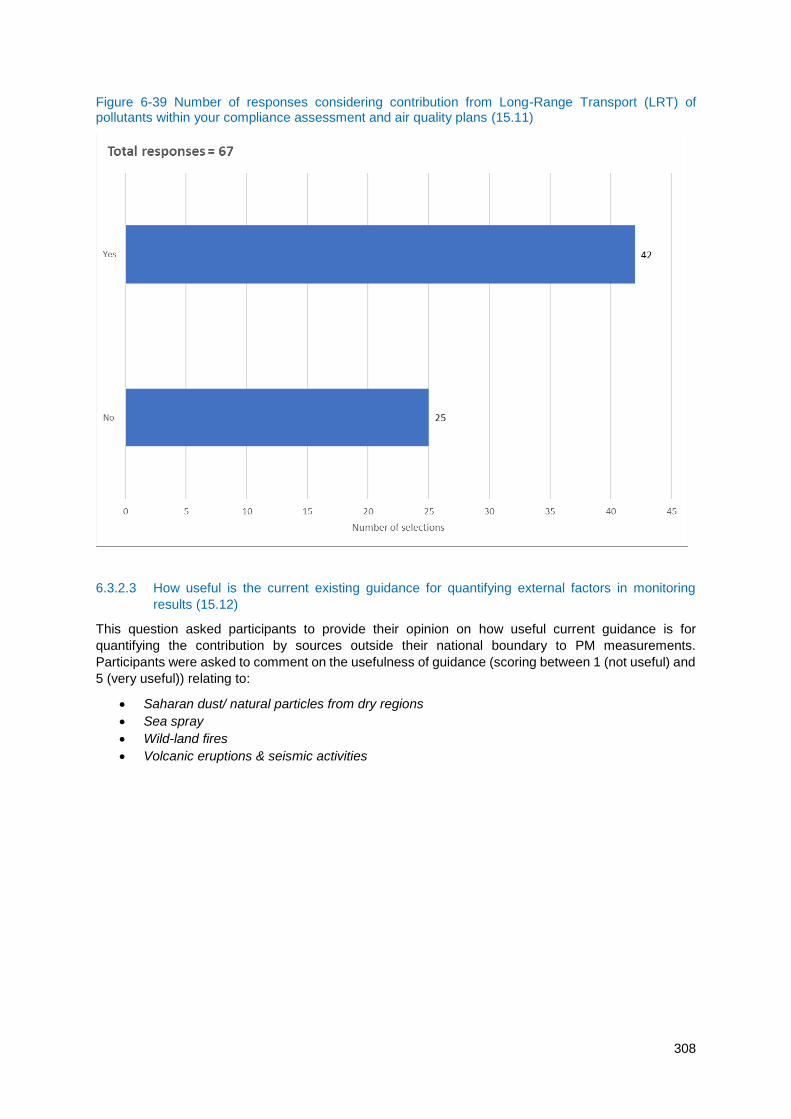
308
Figure 6-39 Number of responses considering contribution from Long-Range Transport (LRT) of pollutants within your compliance assessment and air quality plans (15.11)
6.3.2.3 How useful is the current existing guidance for quantifying external factors in monitoring
results (15.12)
This question asked participants to provide their opinion on how useful current guidance is for
quantifying the contribution by sources outside their national boundary to PM measurements.
Participants were asked to comment on the usefulness of guidance (scoring between 1 (not useful) and
5 (very useful)) relating to:
Saharan dust/ natural particles from dry regions
Sea spray
Wild-land fires
Volcanic eruptions & seismic activities
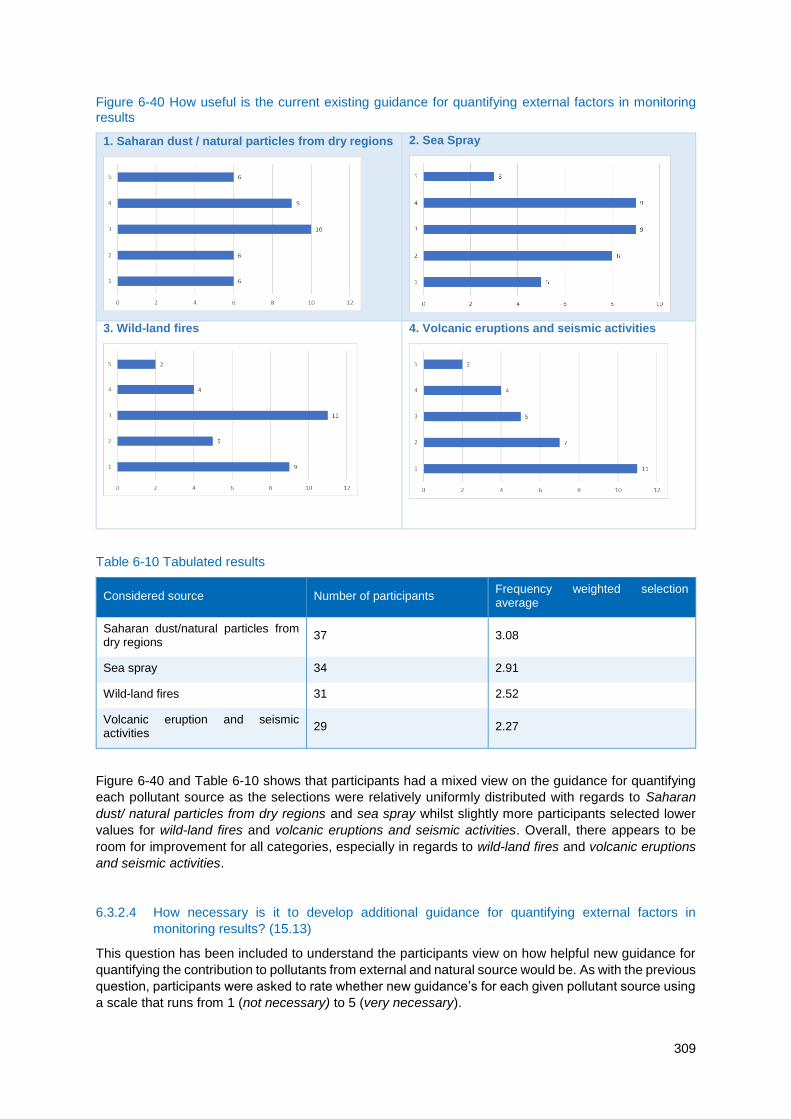
309
Figure 6-40 How useful is the current existing guidance for quantifying external factors in monitoring results
1. Saharan dust / natural particles from dry regions
2. Sea Spray
3. Wild-land fires
4. Volcanic eruptions and seismic activities
Table 6-10 Tabulated results
Considered source Number of participants Frequency weighted selection average
Saharan dust/natural particles from dry regions
37 3.08
Sea spray 34 2.91
Wild-land fires 31 2.52
Volcanic eruption and seismic activities
29 2.27
Figure 6-40 and Table 6-10 shows that participants had a mixed view on the guidance for quantifying
each pollutant source as the selections were relatively uniformly distributed with regards to Saharan
dust/ natural particles from dry regions and sea spray whilst slightly more participants selected lower
values for wild-land fires and volcanic eruptions and seismic activities. Overall, there appears to be
room for improvement for all categories, especially in regards to wild-land fires and volcanic eruptions
and seismic activities.
6.3.2.4 How necessary is it to develop additional guidance for quantifying external factors in
monitoring results? (15.13)
This question has been included to understand the participants view on how helpful new guidance for
quantifying the contribution to pollutants from external and natural source would be. As with the previous
question, participants were asked to rate whether new guidance’s for each given pollutant source using
a scale that runs from 1 (not necessary) to 5 (very necessary).
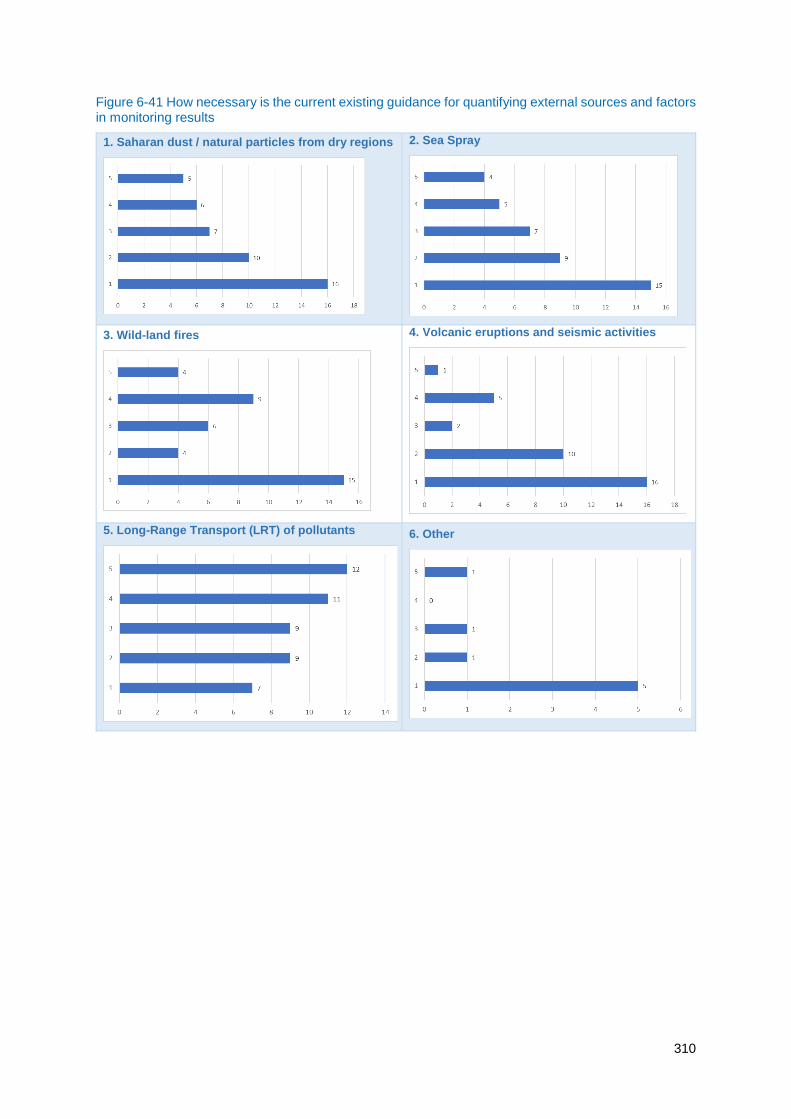
310
Figure 6-41 How necessary is the current existing guidance for quantifying external sources and factors in monitoring results
1. Saharan dust / natural particles from dry regions
2. Sea Spray
3. Wild-land fires
4. Volcanic eruptions and seismic activities
5. Long-Range Transport (LRT) of pollutants
6. Other
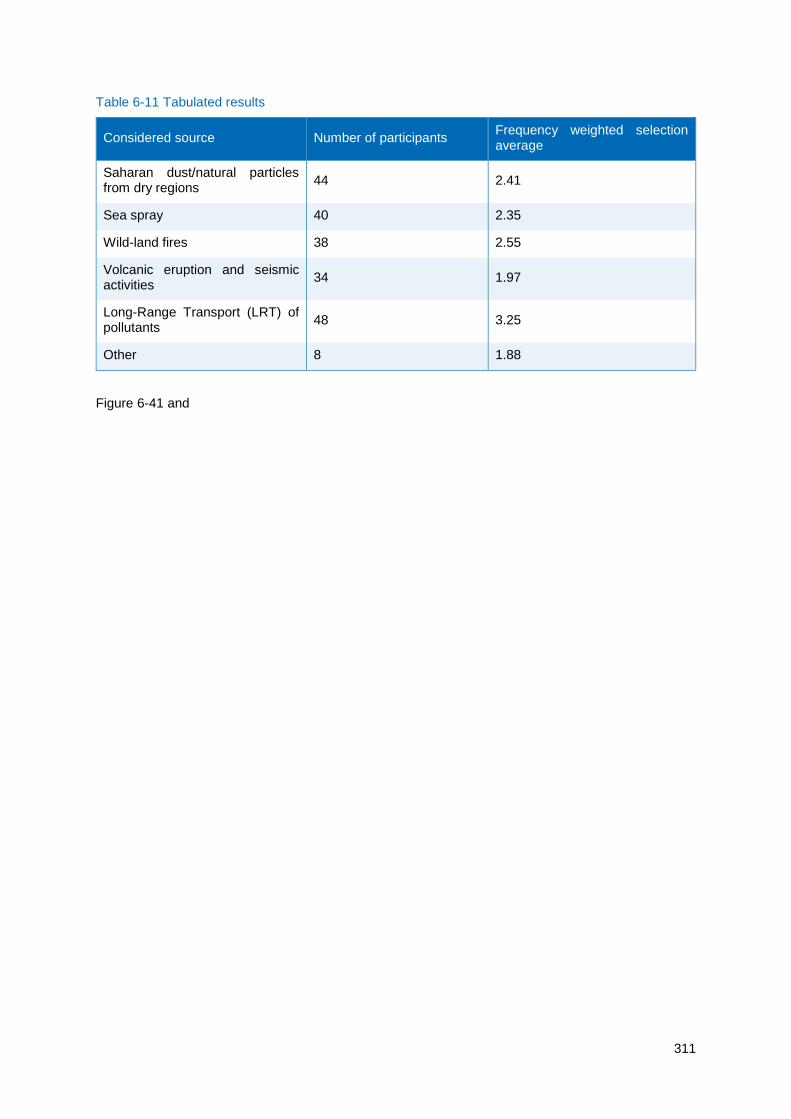
311
Table 6-11 Tabulated results
Considered source Number of participants Frequency weighted selection average
Saharan dust/natural particles from dry regions
44 2.41
Sea spray 40 2.35
Wild-land fires 38 2.55
Volcanic eruption and seismic activities
34 1.97
Long-Range Transport (LRT) of pollutants
48 3.25
Other 8 1.88
Figure 6-41 and

312
Table 6-11 shows that overall, participants did not consider new guidance on identifying and quantifying
the contribution from external and natural PM sources to be necessary, with the exception of Long-
Range Transport (LRT) of pollutants which a significant number of participants (23) selected four (fairly
necessary) and five (very necessary). This suggests that new guidance should focus on this topic.
6.3.2.5 How necessary is it to develop additional guidance to include external sources in air quality
modelling assessments? (15.14)
This question has been included to understand the participants view on how useful new guidance would
be for modelling the influence of cross boundary and natural pollutants. As with the previous question,
participants were asked to rate necessity between 1 (not necessary) to 5 (very necessary).
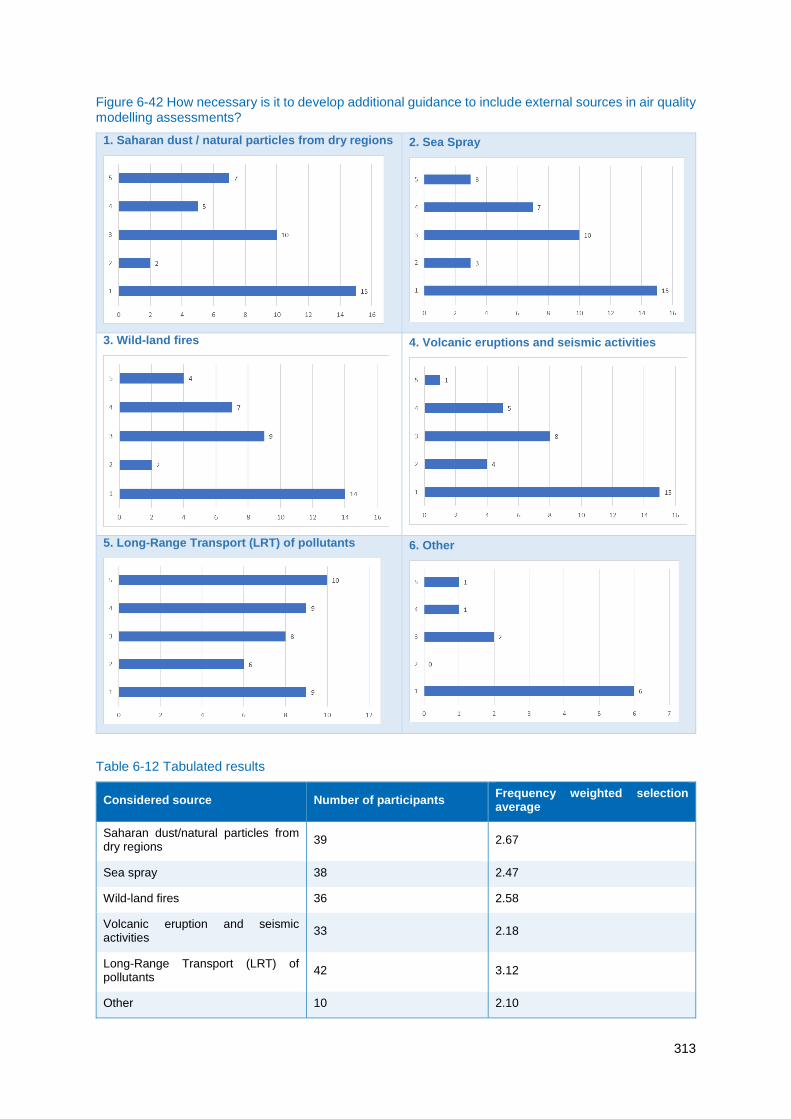
313
Figure 6-42 How necessary is it to develop additional guidance to include external sources in air quality modelling assessments?
1. Saharan dust / natural particles from dry regions
2. Sea Spray
3. Wild-land fires
4. Volcanic eruptions and seismic activities
5. Long-Range Transport (LRT) of pollutants
6. Other
Table 6-12 Tabulated results
Considered source Number of participants Frequency weighted selection average
Saharan dust/natural particles from dry regions
39 2.67
Sea spray 38 2.47
Wild-land fires 36 2.58
Volcanic eruption and seismic activities
33 2.18
Long-Range Transport (LRT) of pollutants
42 3.12
Other 10 2.10

314
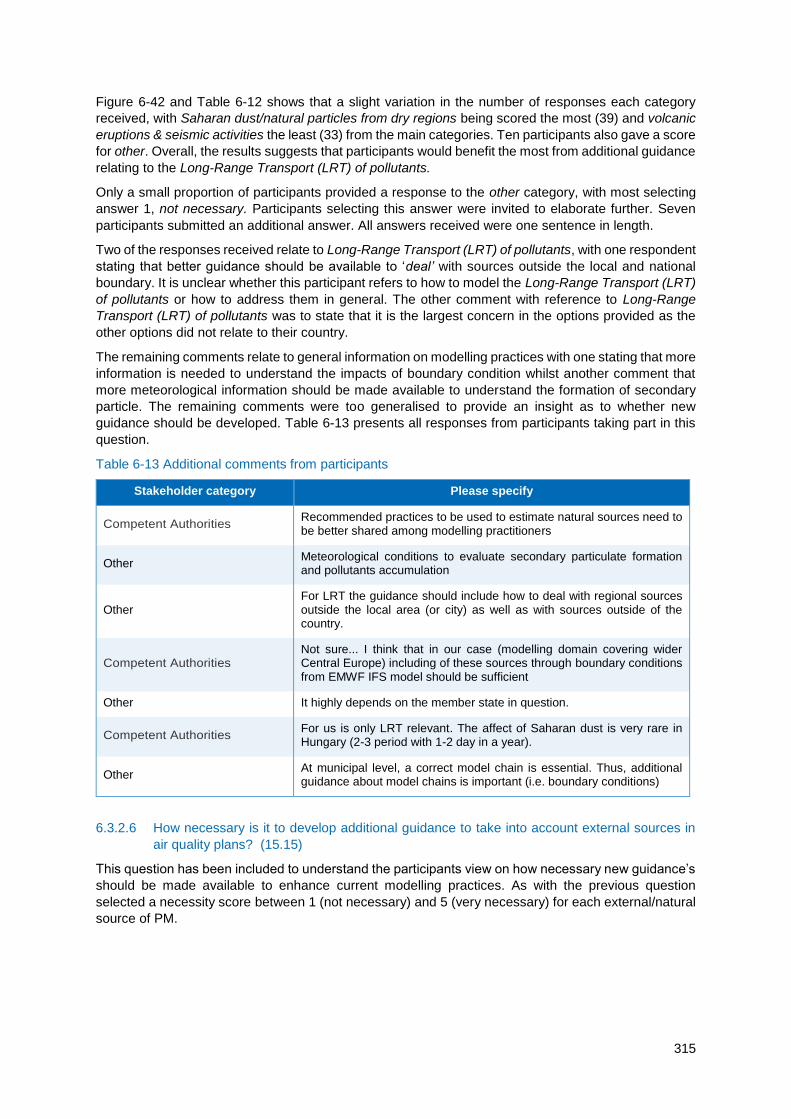
315
Figure 6-42 and Table 6-12 shows that a slight variation in the number of responses each category
received, with Saharan dust/natural particles from dry regions being scored the most (39) and volcanic
eruptions & seismic activities the least (33) from the main categories. Ten participants also gave a score
for other. Overall, the results suggests that participants would benefit the most from additional guidance
relating to the Long-Range Transport (LRT) of pollutants.
Only a small proportion of participants provided a response to the other category, with most selecting
answer 1, not necessary. Participants selecting this answer were invited to elaborate further. Seven
participants submitted an additional answer. All answers received were one sentence in length.
Two of the responses received relate to Long-Range Transport (LRT) of pollutants, with one respondent
stating that better guidance should be available to ‘deal’ with sources outside the local and national
boundary. It is unclear whether this participant refers to how to model the Long-Range Transport (LRT)
of pollutants or how to address them in general. The other comment with reference to Long-Range
Transport (LRT) of pollutants was to state that it is the largest concern in the options provided as the
other options did not relate to their country.
The remaining comments relate to general information on modelling practices with one stating that more
information is needed to understand the impacts of boundary condition whilst another comment that
more meteorological information should be made available to understand the formation of secondary
particle. The remaining comments were too generalised to provide an insight as to whether new
guidance should be developed. Table 6-13 presents all responses from participants taking part in this
question.
Table 6-13 Additional comments from participants
Stakeholder category Please specify
Competent Authorities Recommended practices to be used to estimate natural sources need to be better shared among modelling practitioners
Other Meteorological conditions to evaluate secondary particulate formation and pollutants accumulation
Other For LRT the guidance should include how to deal with regional sources outside the local area (or city) as well as with sources outside of the country.
Competent Authorities Not sure... I think that in our case (modelling domain covering wider Central Europe) including of these sources through boundary conditions from EMWF IFS model should be sufficient
Other It highly depends on the member state in question.
Competent Authorities For us is only LRT relevant. The affect of Saharan dust is very rare in Hungary (2-3 period with 1-2 day in a year).
Other At municipal level, a correct model chain is essential. Thus, additional guidance about model chains is important (i.e. boundary conditions)
6.3.2.6 How necessary is it to develop additional guidance to take into account external sources in
air quality plans? (15.15)
This question has been included to understand the participants view on how necessary new guidance’s
should be made available to enhance current modelling practices. As with the previous question
selected a necessity score between 1 (not necessary) and 5 (very necessary) for each external/natural
source of PM.
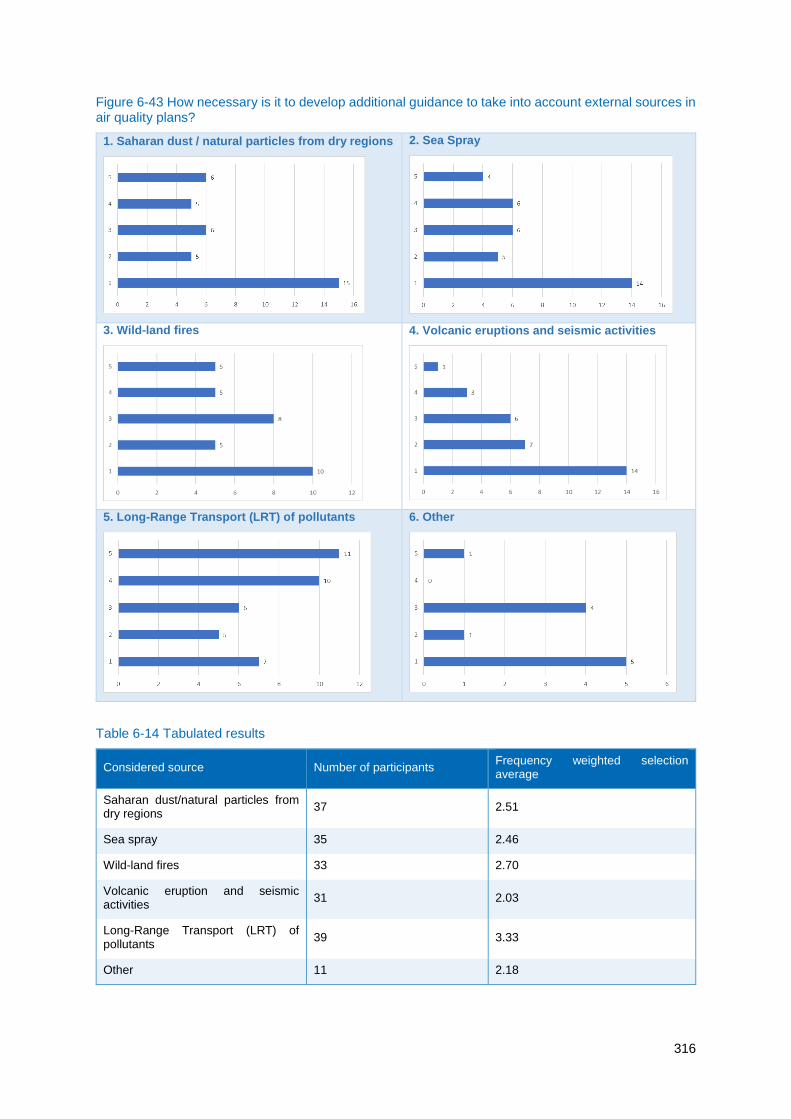
316
Figure 6-43 How necessary is it to develop additional guidance to take into account external sources in air quality plans?
1. Saharan dust / natural particles from dry regions
2. Sea Spray
3. Wild-land fires
4. Volcanic eruptions and seismic activities
5. Long-Range Transport (LRT) of pollutants
6. Other
Table 6-14 Tabulated results
Considered source Number of participants Frequency weighted selection average
Saharan dust/natural particles from dry regions
37 2.51
Sea spray 35 2.46
Wild-land fires 33 2.70
Volcanic eruption and seismic activities
31 2.03
Long-Range Transport (LRT) of pollutants
39 3.33
Other 11 2.18
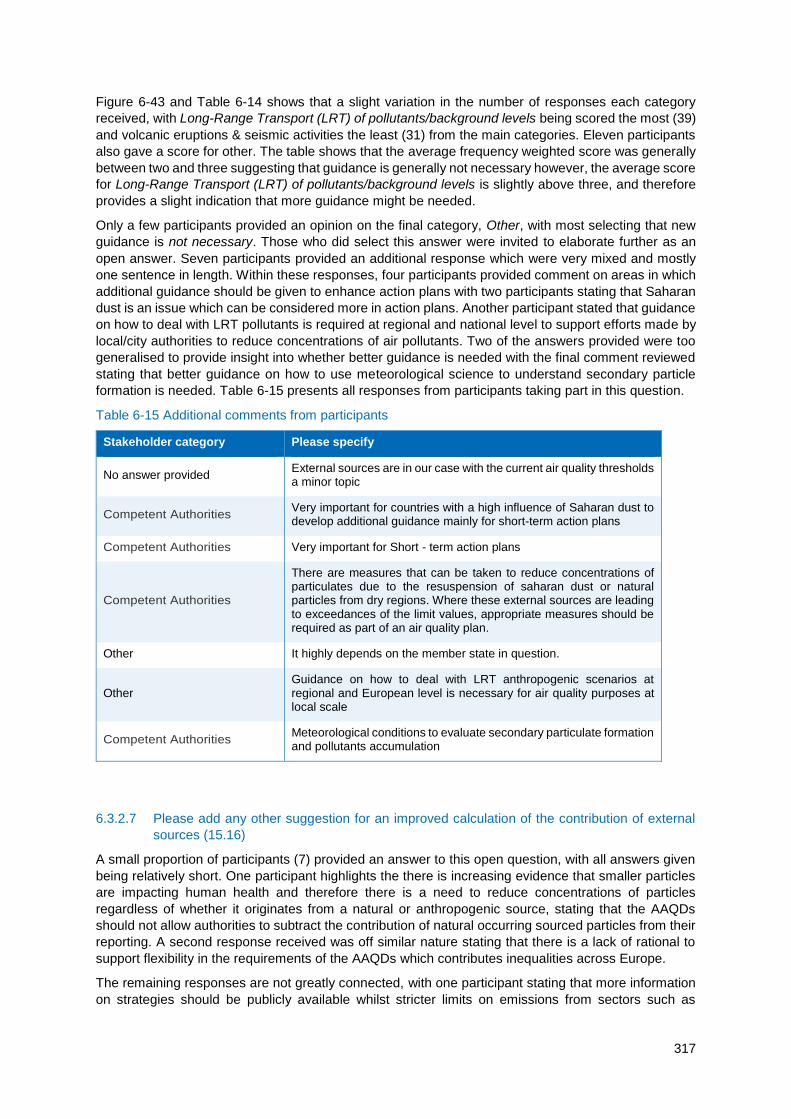
317
Figure 6-43 and Table 6-14 shows that a slight variation in the number of responses each category
received, with Long-Range Transport (LRT) of pollutants/background levels being scored the most (39)
and volcanic eruptions & seismic activities the least (31) from the main categories. Eleven participants
also gave a score for other. The table shows that the average frequency weighted score was generally
between two and three suggesting that guidance is generally not necessary however, the average score
for Long-Range Transport (LRT) of pollutants/background levels is slightly above three, and therefore
provides a slight indication that more guidance might be needed.
Only a few participants provided an opinion on the final category, Other, with most selecting that new
guidance is not necessary. Those who did select this answer were invited to elaborate further as an
open answer. Seven participants provided an additional response which were very mixed and mostly
one sentence in length. Within these responses, four participants provided comment on areas in which
additional guidance should be given to enhance action plans with two participants stating that Saharan
dust is an issue which can be considered more in action plans. Another participant stated that guidance
on how to deal with LRT pollutants is required at regional and national level to support efforts made by
local/city authorities to reduce concentrations of air pollutants. Two of the answers provided were too
generalised to provide insight into whether better guidance is needed with the final comment reviewed
stating that better guidance on how to use meteorological science to understand secondary particle
formation is needed. Table 6-15 presents all responses from participants taking part in this question.
Table 6-15 Additional comments from participants
Stakeholder category Please specify
No answer provided External sources are in our case with the current air quality thresholds a minor topic
Competent Authorities Very important for countries with a high influence of Saharan dust to develop additional guidance mainly for short-term action plans
Competent Authorities Very important for Short - term action plans
Competent Authorities
There are measures that can be taken to reduce concentrations of particulates due to the resuspension of saharan dust or natural particles from dry regions. Where these external sources are leading to exceedances of the limit values, appropriate measures should be required as part of an air quality plan.
Other It highly depends on the member state in question.
Other Guidance on how to deal with LRT anthropogenic scenarios at regional and European level is necessary for air quality purposes at local scale
Competent Authorities Meteorological conditions to evaluate secondary particulate formation and pollutants accumulation
6.3.2.7 Please add any other suggestion for an improved calculation of the contribution of external
sources (15.16)
A small proportion of participants (7) provided an answer to this open question, with all answers given
being relatively short. One participant highlights the there is increasing evidence that smaller particles
are impacting human health and therefore there is a need to reduce concentrations of particles
regardless of whether it originates from a natural or anthropogenic source, stating that the AAQDs
should not allow authorities to subtract the contribution of natural occurring sourced particles from their
reporting. A second response received was off similar nature stating that there is a lack of rational to
support flexibility in the requirements of the AAQDs which contributes inequalities across Europe.
The remaining responses are not greatly connected, with one participant stating that more information
on strategies should be publicly available whilst stricter limits on emissions from sectors such as
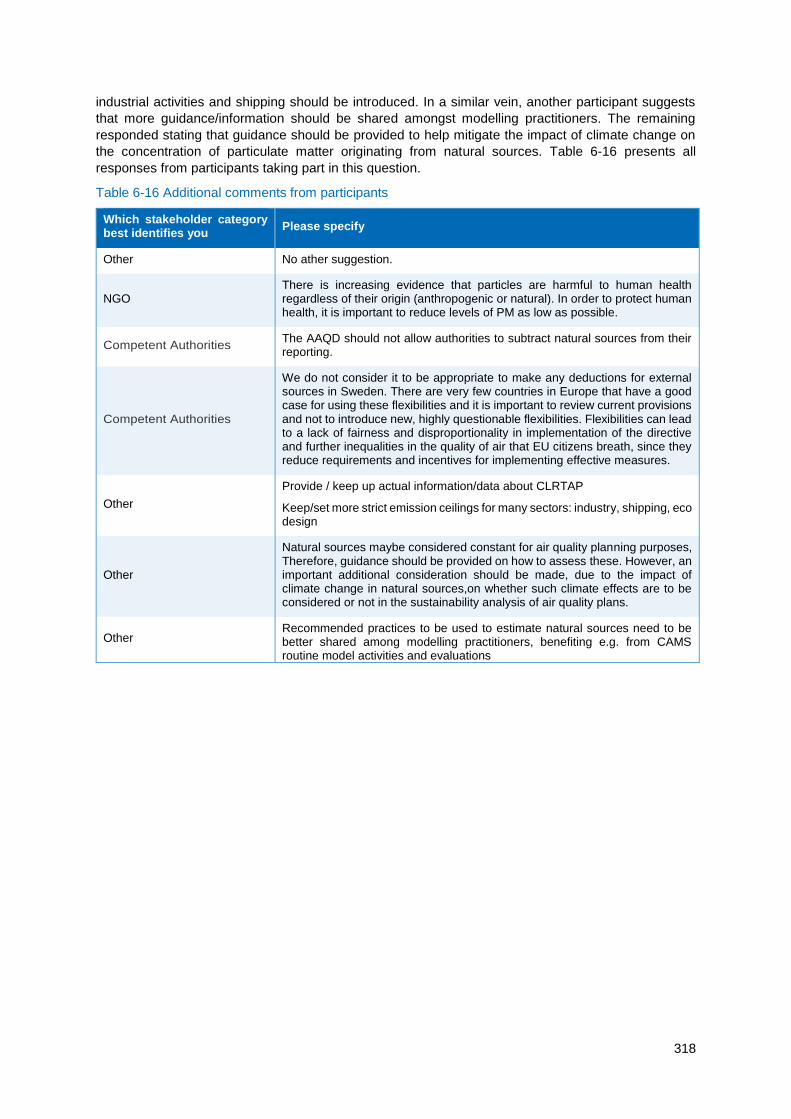
318
industrial activities and shipping should be introduced. In a similar vein, another participant suggests
that more guidance/information should be shared amongst modelling practitioners. The remaining
responded stating that guidance should be provided to help mitigate the impact of climate change on
the concentration of particulate matter originating from natural sources. Table 6-16 presents all
responses from participants taking part in this question.
Table 6-16 Additional comments from participants
Which stakeholder category best identifies you
Please specify
Other No ather suggestion.
NGO There is increasing evidence that particles are harmful to human health regardless of their origin (anthropogenic or natural). In order to protect human health, it is important to reduce levels of PM as low as possible.
Competent Authorities The AAQD should not allow authorities to subtract natural sources from their reporting.
Competent Authorities
We do not consider it to be appropriate to make any deductions for external sources in Sweden. There are very few countries in Europe that have a good case for using these flexibilities and it is important to review current provisions and not to introduce new, highly questionable flexibilities. Flexibilities can lead to a lack of fairness and disproportionality in implementation of the directive and further inequalities in the quality of air that EU citizens breath, since they reduce requirements and incentives for implementing effective measures.
Other
Provide / keep up actual information/data about CLRTAP
Keep/set more strict emission ceilings for many sectors: industry, shipping, eco design
Other
Natural sources maybe considered constant for air quality planning purposes, Therefore, guidance should be provided on how to assess these. However, an important additional consideration should be made, due to the impact of climate change in natural sources,on whether such climate effects are to be considered or not in the sustainability analysis of air quality plans.
Other Recommended practices to be used to estimate natural sources need to be better shared among modelling practitioners, benefiting e.g. from CAMS routine model activities and evaluations
319
6.3.2.8 Main messages
This section was generally completed by a medium to high number of participants which were found to
represent most of the European countries the survey targeted the opinions of.
The analysis showed a universal trend across the European countries that LRT (82% (87)), Saharan
dust (46%), winter sanding and salting (46%) and sea spray (38%) were the biggest external
contributors to air pollution. The contribution of these pollutants was also found to be the external
sources that participants quantify the behind the most selected (LRT (66%), Saharan dust (35% (62)),
winter sanding and salting (34%) and sea spray (32%)).
The survey asked participants their views as to how the external sources influences modelling and air
quality plans. The findings showed that across Europe, participants made a high number of selections
for Meteorology (89%) and LRT (75%) and selected LTR (80% (49)) in addition to winter salting and
sanding (31%), sea spray (25%) and Saharan dust (20%) as factors which they include in air quality
planning. With regards, to methodology used for planning, participants overwhelmingly (83% (77))
stated that they use 2011 guidance documents for quantifying sources, with a high proportion selecting
an answer which included the natural source guidance document. In addition to this, participants stated
that they generally not (53% (75) using additional methodologies with approximately half (49% (73))
stating that there is no need to include additional eligible external factors for subtraction under the
AAQDs. The final question in this subsection found that most participants (63% (67)) stated that they
are considering contribution from Long Range Transport of pollutants within your compliance
assessment and air quality plans.
The final part of this section looked at the need to produce new guidance documents. With regards to
quantifying sources, the analysis found that overall, participants showed a modest need for guidance
on Saharan dust. Guidance for LRT was scored particularly high by five Member States in relation to
quantifying external sources and factors in monitoring results. Guidance on Saharan dust and LRT with
respect to excluding sources in air quality modelling assessments was scored high by five Member
States for Saharan dust and by seven Member States for LRT.