Stream Particles as the Probe of the Dust-Plasma-Magnetosphere Interaction at Saturn
23
Stream particles as the probe of the dust‐plasma‐magnetosphere interaction at Saturn H.‐W. Hsu, 1,2,3 F. Postberg, 1,2 S. Kempf, 1,3,4 M. Trieloff, 2 M. Burton, 5 M. Roy, 5 G. Moragas‐Klostermeyer, 1,3 and R. Srama 1,6 Received 20 January 2011; revised 6 June 2011; accepted 13 June 2011; published 16 September 2011. [1] We analyze the dynamics and composition of Saturnian stream particles measured by the Cosmic Dust Analyser (CDA) onboard the Cassini spacecraft. To reconstruct the dynamical properties of Saturnian stream particles, we adopt a backward tracing method with in situ solar wind measurements to filter out the influence of the interplanetary magnetic field. Our results show that stream particles from Saturn have sizes ranging from 2 to 8 nm (radius) with ejection velocities between 50 and 200 kms −1 . Moreover, the derived “ejection region” of stream particles in the outer part of Saturn’s E ring is indicative of the dust charging condition profile in the planet’s magnetosphere. By using the Cassini magnetospheric plasma measurements as input, our ejection model considers stochastic charging and well reproduces the dynamical properties of stream particles derived from backward simulations. An updated analysis of CDA stream‐particle mass spectra confirms that the silicateous material is the most probable composition of Saturnian stream particles, in contrast to E ring particles whose composition is dominated by water ice. This compositional discrepancy can be reproduced by our model if the different sputter efficiencies of silicateous material and water ice are considered. We suggest that silicateous impurities released from icy grains at the outer E ring are the most probable source of Saturnian stream particles. Finally, we discuss the role of dust particles as a mobile neutral reservoir in Saturn’s magnetosphere which may be responsible for certain features in the Cassini O and O 2 + measurements. Citation: Hsu, H.-W., F. Postberg, S. Kempf, M. Trieloff, M. Burton, M. Roy, G. Moragas‐Klostermeyer, and R. Srama (2011), Stream particles as the probe of the dust‐plasma‐magnetosphere interaction at Saturn, J. Geophys. Res., 116, A09215, doi:10.1029/2011JA016488. 1. Introduction [2] For decades, the interaction between dust particles, the plasma, and neutral molecules has been proposed to explain both the in‐situ plasma electron measurements [Sittler et al., 1983; Rymer et al., 2008] and neutral gas observations [Ip, 1997; Jurac et al., 2001; Johnson et al., 2008] in Saturn’s magnetosphere. With respect to the plasma/neutral‐surface interactions, micron‐sized dust grains in the tenuous E ring could be as important as embedded icy moons due to their large total surface area and the great extension (between 3 and 20 R S [Srama et al., 2006], 1 R S = 60268 km is the equatorial radius of Saturn). In a planetary magnetosphere, dust particles can act as both source (e.g., via sputtering or radiolysis reactions) and obstacle to the magnetospheric plasma/neutrals and modify their spatial and energy dis- tributions via mass and charge exchange processes. [3] From a dust dynamics point of view, by transferring electric charges and momentum, the magnetospheric plasma is shown to have great influence on E ring dust grains. As the Lorentz force exerted on a dust particle is directly pro- portional to the amount of charge it carries, the plasma, which determines the charging conditions, regulates the dust dynamics accordingly. Adopting −5 V surface potential for E ring dust grains located at Enceladus’ orbit and consid- ering the electromagnetic force, the radiation pressure, and the gravitational force from the oblate Saturn, Horányi et al. [1992] suggested that only particles of one micrometer radius are able to develop large orbital eccentricity and to populate the region between 3 to 8 R S , the dimension of the E ring based on early optical observations [Showalter et al., 1991]. Acquiring momentum from the fast corotating ions in the magnetosphere, the plasma drag effect enables E ring dust grains to propagate from the inner to outer system and was proposed to explain the large extent of the E ring based 1 MPI für Kernphysik, Heidelberg, Germany. 2 Institut für Geowissenschaften, Ruprecht ‐ Karls Universität, Heidelberg, Germany. 3 Laboratory for Atmospheric and Space Physics, University of Colorado, Boulder, Colorado, USA. 4 Institut für Geophysik und Extraterrestrische Physik, Universität Braunschweig, Braunschweig, Germany. 5 Jet Propulsion Laboratory, Pasadena, California, USA. 6 Institut für Raumfahrtsysteme, Universität Stuttgart, Stuttgart, Germany. Copyright 2011 by the American Geophysical Union. 0148‐0227/11/2011JA016488 JOURNAL OF GEOPHYSICAL RESEARCH, VOL. 116, A09215, doi:10.1029/2011JA016488, 2011 A09215 1 of 23
-
Upload
independent -
Category
Documents
-
view
4 -
download
0
Transcript of Stream Particles as the Probe of the Dust-Plasma-Magnetosphere Interaction at Saturn

Stream particles as the probe of the dust‐plasma‐magnetosphereinteraction at Saturn
H.‐W. Hsu,1,2,3 F. Postberg,1,2 S. Kempf,1,3,4 M. Trieloff,2 M. Burton,5 M. Roy,5
G. Moragas‐Klostermeyer,1,3 and R. Srama1,6
Received 20 January 2011; revised 6 June 2011; accepted 13 June 2011; published 16 September 2011.
[1] We analyze the dynamics and composition of Saturnian stream particles measured bythe Cosmic Dust Analyser (CDA) onboard the Cassini spacecraft. To reconstruct thedynamical properties of Saturnian stream particles, we adopt a backward tracing methodwith in situ solar wind measurements to filter out the influence of the interplanetarymagnetic field. Our results show that stream particles from Saturn have sizes ranging from2 to 8 nm (radius) with ejection velocities between 50 and 200 kms−1. Moreover, thederived “ejection region” of stream particles in the outer part of Saturn’s E ring isindicative of the dust charging condition profile in the planet’s magnetosphere. By usingthe Cassini magnetospheric plasma measurements as input, our ejection model considersstochastic charging and well reproduces the dynamical properties of stream particlesderived from backward simulations. An updated analysis of CDA stream‐particle massspectra confirms that the silicateous material is the most probable composition of Saturnianstream particles, in contrast to E ring particles whose composition is dominated bywater ice. This compositional discrepancy can be reproduced by our model if the differentsputter efficiencies of silicateous material and water ice are considered. We suggest thatsilicateous impurities released from icy grains at the outer E ring are the most probablesource of Saturnian stream particles. Finally, we discuss the role of dust particles as amobile neutral reservoir in Saturn’s magnetosphere which may be responsible for certainfeatures in the Cassini O and O2
+ measurements.
Citation: Hsu, H.-W., F. Postberg, S. Kempf, M. Trieloff, M. Burton, M. Roy, G. Moragas‐Klostermeyer, and R. Srama (2011),Stream particles as the probe of the dust‐plasma‐magnetosphere interaction at Saturn, J. Geophys. Res., 116, A09215,doi:10.1029/2011JA016488.
1. Introduction
[2] For decades, the interaction between dust particles, theplasma, and neutral molecules has been proposed to explainboth the in‐situ plasma electron measurements [Sittler et al.,1983; Rymer et al., 2008] and neutral gas observations [Ip,1997; Jurac et al., 2001; Johnson et al., 2008] in Saturn’smagnetosphere. With respect to the plasma/neutral‐surfaceinteractions, micron‐sized dust grains in the tenuous E ringcould be as important as embedded icy moons due to theirlarge total surface area and the great extension (between 3
and 20 RS [Srama et al., 2006], 1 RS = 60268 km is theequatorial radius of Saturn). In a planetary magnetosphere,dust particles can act as both source (e.g., via sputtering orradiolysis reactions) and obstacle to the magnetosphericplasma/neutrals and modify their spatial and energy dis-tributions via mass and charge exchange processes.[3] From a dust dynamics point of view, by transferring
electric charges and momentum, the magnetospheric plasmais shown to have great influence on E ring dust grains. Asthe Lorentz force exerted on a dust particle is directly pro-portional to the amount of charge it carries, the plasma,which determines the charging conditions, regulates the dustdynamics accordingly. Adopting −5 V surface potential forE ring dust grains located at Enceladus’ orbit and consid-ering the electromagnetic force, the radiation pressure, andthe gravitational force from the oblate Saturn, Horányi et al.[1992] suggested that only particles of one micrometerradius are able to develop large orbital eccentricity and topopulate the region between 3 to 8 RS, the dimension of theE ring based on early optical observations [Showalter et al.,1991]. Acquiring momentum from the fast corotating ions inthe magnetosphere, the plasma drag effect enables E ringdust grains to propagate from the inner to outer system andwas proposed to explain the large extent of the E ring based
1MPI für Kernphysik, Heidelberg, Germany.2Institut für Geowissenschaften, Ruprecht‐Karls Universität,
Heidelberg, Germany.3Laboratory for Atmospheric and Space Physics, University of
Colorado, Boulder, Colorado, USA.4Institut für Geophysik und Extraterrestrische Physik, Universität
Braunschweig, Braunschweig, Germany.5Jet Propulsion Laboratory, Pasadena, California, USA.6Institut für Raumfahrtsysteme, Universität Stuttgart, Stuttgart,
Germany.
Copyright 2011 by the American Geophysical Union.0148‐0227/11/2011JA016488
JOURNAL OF GEOPHYSICAL RESEARCH, VOL. 116, A09215, doi:10.1029/2011JA016488, 2011
A09215 1 of 23

on recent in situ observations [Srama et al., 2006; Horányiet al., 2008; Beckmann, 2008].[4] In this work we focus on even smaller dust particles,
the stream particles. Stream particles are nanometer scaledust particles ejected with speeds ^100 kms−1 from both theJovian and Saturnian systems. Applying a proper method,the information that stream particles carry can provide fur-ther implications and constraints on the dust‐plasma/neutralinteraction at their source region (the “Dust Astronomy”concept [Grün et al., 2001]). We start from briefly intro-ducing the discovery and the unique properties of streamparticles.
1.1. Jovian Stream Particles
[5] The discovery of Jovian stream particles was made bythe Ulysses spacecraft during its first Jupiter flyby in 1992[Grün et al., 1993]. The 28 ± 3 day impact modulationdetected by Ulysses was suggested to be caused by theinteraction between the interplanetary magnetic field (IMF)and submicron dust particles [Hamilton and Burns, 1993].Adopting in situ solar wind measurements to account for theLorentz force on the dynamics of Jovian stream particles,the backward simulations by Zook et al. [1996] showed thatthe measurements could only be reproduced by particleswith radii between 5 and 15 nm and impact velocitiesexceeding 100 kms−1. This work indicates that the dynam-ical properties of stream particles are outside the instru-ment’s calibration range and cannot be derived directly fromthe instrument signals.[6] After the Ulysses measurements outlined the stream
particle dynamics in interplanetary space, the subsequentGalileo mission provided further details in the Jovianmagnetosphere. A frequency analysis revealed the orbitalperiod of the volcanically active moon Io from the Galileodust data set and strongly suggested that Io is the mainsource of Jovian stream particles [Graps et al., 2000].Furthermore, stream particles are also found to be modu-lated by the inclined Jovian magnetic field and the varyingcharging conditions in the dawn‐to‐dusk asymmetric IoPlasma Torus (IPT) [Grün et al., 1998; Horányi et al., 1997;Krüger et al., 2003a].[7] Aiming toward the Saturnian system, the Cassini‐
Huygens spacecraft flew by Jupiter on 30 December 2000.The Cassini dust detector, the Cosmic Dust Analyser (CDA)is capable of measuring both the elemental composition anddynamical properties of impinging dust grains. Postberget al. [2006] showed that CDA mass spectra of Jovianstream particles are dominated by sodium chloride withtraces of sulfur (see Figure 4a and section 4), which suggeststhat these particles are probably the first solid condensedinside volcanic plumes on Io and supports their iogenicorigin proposed by the periodogram analysis [Graps et al.,2000]. Hsu et al. [2010a] showed that the flux measuredby CDA followed a similar trend as the dust emission ratederived from the Galileo data [Krüger et al., 2003b], whichcorrelates to the ultraviolet emission of the IPT observed bythe Cassini Ultraviolet Imaging Spectrograph (UVIS)[Delamere et al., 2004]. It is likely that a more complexinteraction/coupling between tiny dust particles and themagnetospheric neutral/plasma that is not yet understood[Hsu et al., 2010a].
1.2. Saturnian Stream Particles
[8] The existence of Saturnian stream particles was pre-dicted first by Horányi [2000] based on the plasma modelderived from Voyager data. The discovery of Saturnianstream particles during Cassini’s Saturn approach in 2004[Kempf et al., 2005a] confirmed the idea of the Saturniansystem being the source of fast nanometer sized dust parti-cles. At a distance of 1400 RS (0.56AU) from Saturn, CDAstarted to register faint impacts characterized by a shortsignal risetime. Due to the similarity between these impactsignals and those of Jovian stream particles and theincreasing particle flux as the decreasing Saturn distance,these particles were recognized as Saturnian stream particles[Kempf et al., 2005a].[9] The IMF conditions during Cassini’s Saturn approach
phase was monitored by the onboard magnetometer overmore than 10 solar rotations [Jackman et al., 2004, 2005]. Itwas found that the IMF was highly structured and consistedof compression and rarefaction regions, which were asso-ciated with corotating interaction regions (CIRs) [Jackmanet al., 2004], a common solar wind structure between 2 and10 AU resulting from the interaction between slow and fastsolar wind. The field direction followed the Parker spiralmodel well and showed a two‐sector structure during eachsolar rotation with the heliospheric current sheet (HCS)where the field direction reverses, embedded in the com-pression region [Jackman et al., 2008]. Similar to theirJovian counters, Saturnian stream particles are also found tobe interactive with the IMF.[10] Within ∼500 RS (0.2AU) of Saturn, a recurrent
stream‐particle impact pattern that correlated with CIR rare-faction and compression regions was observed. Impact burstswere observed during high IMF strength solar wind com-pression periods, while faint impacts from the Saturn line‐of‐sight (LOS) direction were detected in low IMF strengthrarefaction regions. The faint, Saturn‐LOS impacts areinferred as recently ejected particles [Hsu et al., 2010b, 2011]and are found to cluster in only one of IMF sectors. This wassuggested as the outcome of combined effects from the streamparticle ejection pattern and the IMF influence [Hsu et al.,2010b]. The analyses of stream‐particle measurements dur-ing stable IMF periods show that these particles have sizesbetween 2 and 9 nm with ejection velocities ≥70 kms−1 inalignment with the Saturn’s ring plane (±25°) [Hsu et al.,2010a, 2010b].[11] As the stream particles originate in the Saturnian
system, one would expect them to have a similar composi-tion to those of Saturnian ring particles. It is known that thedense main rings and the tenuous E ring together with theembedded icy moons are mostly composed of pure water ice[Pilcher et al., 1970; Hillier et al., 2007]. In contrast, themain element identified in mass spectra of Saturnian streamparticles was silicon [Kempf et al., 2005b] with only a smalland occasional contribution of water ice. To explore therecently discovered south polar region of Enceladus [Spahnet al., 2006; Porco et al., 2006], few low altitude Enceladusflyby have been performed. During plume crossings in2008, features coinciding with plume jets’ sources weredetected by the ion and electron detectors of the CassiniPlasma Spectrometer (CAPS). These detections are sug-gested to be caused by particles smaller than 2 nm carrying
HSU ET AL.: DUST‐MAGNETOSPHERE INTERACTION AT SATURN A09215A09215
2 of 23

opposite signs of electric charges [Jones et al., 2009]. Thenanoparticle features extended further out from the Encela-dus’ Hill sphere and were proposed to be the major source ofSaturnian stream particles [Jones et al., 2009]. A comparisonof the composition of these particles with Saturnian streamparticles may help to resolve the actual source of Saturnianstream particles. Unfortunately, these particles are not yetaccelerated byEc and simply too faint to be detected by CDA.We will address this issue in section 6.[12] Based on the knowledge learned from Saturnian E
ring mass spectra, a refined analysis of stream particlecomposition was carried out for this work (see alsoF. Postberg et al., manuscript in preparation, 2011). The mainfocus is to look for the presence of water in stream particlesas well as the presence of other constituents. Together withthe dynamical information, we infer constraints on thechemical/physical properties and the likely source of Satur-nian stream particles. Moreover, the information can providefurther implications for the dust‐neutral/plasma interaction inSaturn’s magnetosphere. The data used in this study includestream‐particle measurements from 2004 and the early 2005,i.e., the Cassini‐Saturn approach phase and the first threeorbits after the Saturn Orbit Insertion (SOI) [Kempf et al.,2005a; Hsu et al., 2010a, 2010b, 2011].[13] We start by describing the instrumentation and the
stream‐particle data set. In section 3 we present the back-ward‐tracing simulation to give more precise constraints onthe dynamical properties of Saturnian stream particles, fol-lowed by the updated composition analysis in section 4. Tojustify our backward simulation results, in section 5 webuild an axially symmetric ejection model, which calculatesthe equation of motion and the charging equation tounderstand the ejection process of nanodust particles fromSaturn’s magnetosphere. Results from various analysisapproaches will be discussed with other Cassini findings insection 6. A summary concludes this paper in section 7.
2. CDA Saturnian Stream Particle Observations
2.1. Cosmic Dust Analyser
[14] Cosmic Dust Analyser (CDA) is the dust instrumentaboard the Cassini spacecraft [Srama et al., 2004]. It con-sists of two independent subsystems, the High Rate Detector(HRD) and the Dust Analyser (DA). The HRD is intended tomonitor the flux of micron sized grains in high dust densityenvironments and is not suited for stream particle mea-surements. The DA is an impact ionization dust detectordesigned to measure the mass, speed, charge, and the com-position of individual impinging dust particles. It comprisesof following detectors: a charge sensing unit (QP detector) asthe entrance grids, an Impact Ionization Detector (IID)similar to Ulysses/Galileo detectors, and a time‐of‐flight(TOF) mass spectrometer (Chemical Analyzer, CA). Once aspecified threshold is reached, three detectors are capable oftriggering an impact record event.[15] While entering the DA, a nanodust particle first
passes the QP detector. However, charges carried by sub-micron particles with potential of only a few volt are tooweak to be measured. Stream particles thus are invisible tothe QP detector. After passing the QP grids, the impactorcan hit one of the targets. Due to the high impact speed(�10 kms−1), particle, target material, and target con-
taminants are ionized forming an impact plasma. Under theelectric field exerted by the instrument, negative chargedcomponents (mostly electrons) are collected on the targetswhile the ions are accelerated toward the CA. The risetimeof the target signals is indicative of the impact speed whilethe signal amplitude reflects both the impact speed and theparticle mass. However, the speed and the mass ranges ofstream particles are out of the calibration range, hence thesebasic dynamical properties cannot be derived directly fromimpact signals. Nevertheless, the composition of the impactplasma can still be measured by the CDA mass spectrometer.[16] The IID is divided into two concentric hemispherical
targets: an inner rhodium target (Chemical Analyser Target,CAT) and a outer gold target (Impact Ionization Target,IIT). Particles hitting the larger IIT generate no mass spec-trum whereas ions generated from CAT impacts will befocused toward the CA to produce time‐of‐flight massspectra.[17] Most of Saturnian stream–particle impacts were too
faint to trigger an recording event at DA targets and the iongrid in front of the CA. Instead, stream–particle detectionswere predominantly triggered by the multiplier signal of theH+ mass line in the TOF spectra [Kempf et al., 2005b;Postberg et al., 2009a]. An analysis showed that hydrogenions found in Jovian and Saturnian stream particle spectramost likely originate from target contamination since theyield was much higher than the amount of atoms in theparticles [Postberg et al., 2006, 2009a]. Due to these extrahydrogen ions CDA is capable of detecting Saturnian streamparticles whose signals are about ten times weaker than theirJovian counter parts. However, the effective detection areafor faint stream‐particle impacts is limited to the smallerCAT and therefore reduced to 1/6.5 of the total CDAdetection area.
2.2. Saturnian Stream Particle Data Set
[18] During 2004 and early 2005, 3258 stream particlesare registered. From this data set, 2375 impacts registered ininterplanetary space are selected for the detailed backwardsimulation (section 3). Particles registered in different solarwind conditions experience the dynamical influence fromthe solar wind to a different extent and result in a differentimpact pattern. Based on the directionality and the impactcharge yield, these impacts can be divided into two popu-lations [Kempf et al., 2005a; Hsu et al., 2010b, 2011] asshown in the impact angle distribution (Figure 1b). Thecomponent detected along the Saturn‐LOS consists of faintimpacts and is interpreted as particles coming directly fromthe Saturn system with only modest IMF influence. Thenon‐Saturn LOS component, characterized by strongerimpact signals, mostly occurs during periods of enhancedIMF and is composed of particles accelerated significantlyin interplanetary space. The distribution of ion grid (QI)signals from the selected data set is shown in Figure 1a. Theimpact charge signal of most Saturnian stream particles isweaker than 2 fC, which is about five to ten times less thantheir Jovian counterparts.
3. Backward Tracing Simulation
[19] The backward tracing has been proven to be aneffective method for studying the dynamics of Lorentz
HSU ET AL.: DUST‐MAGNETOSPHERE INTERACTION AT SATURN A09215A09215
3 of 23

force‐sensitive dust particles [Zook et al., 1996]. AdoptingCassini dust and solar wind measurements, a similarapproach is applied for Saturnian stream particles. Thebackward simulation not only is used for deriving particles’dynamical properties but also provides clues about theirorigin.[20] The main idea of backward tracing method is to use
in situ IMF and solar wind measurements as constraints forstudying stream‐particle dynamics. In interplanetary space,the IMF acts as a giant mass‐spectrometer which shapes thetrajectories of dust stream particles depending on the IMFconfiguration and particle properties. Therefore, detectionsof stream particles along the spacecraft trajectory are actu-ally the outcomes of combined effects of initial particleproperties and time‐varying solar wind conditions. Byreversing the direction of the electromagnetic force based onIMF measurements and by integrating backward in time, wecan (at least partially) cancel out the solar wind influenceand derive the initial stream‐particle dynamic properties(which are outside the instrument calibration range).
3.1. Equation of Motion
[21] In our simulation, the trajectory of a charged particlein the interplanetary space is described by the equation ofmotion, which can be expressed as
ad ¼ �GM�r�r�3
� GMSrSr3S
þ Qd
mdv� Bð Þ: ð1Þ
[22] G is the gravitational constant, M� (1.989 × 1030 kg)is the mass of the Sun, MS (5.685 × 1026 kg) is the mass ofSaturn. r� and rS are the position vectors from the Sun andSaturn to the dust grain. B is the interplanetary magneticfield vector, and v = vd − vsw, where vd and vsw are thevelocity vectors of the dust grain and the solar wind.[23] The first two terms on the right‐hand side of
equation (1) are gravitational forces from the Sun and Saturn.The third term is the Lorentz force, which exceeds gravita-tional forces by orders of magnitude for stream particles.Qd /md is the particle charge‐to‐mass ratio:
Qd
md¼ 3 �0 �d
%d s2d; ð2Þ
where �0 is the vacuum permittivity, sd is the dust grainradius, %d is the dust bulk density, md is the dust grainmass, and �d = Qd/4p�0sd is the dust grain electrostaticsurface potential. As can be seen in equation (2), Qd /md
couples these three free parameters sd, %d and �d togetherand it is also the quantity that is directly involved in thecalculation of the equation of motion. Therefore, we adoptQd /md in our simulation to reduce the parameter space andcomputation time. The Qd/md range of dust particles usedin our simulation is equivalent to a radius range of 51.5to 2.0 nm (assuming %d = 1.0 kgm−3 and �d = +5 V), ormd /Qd range of ∼2 × 10⁶ to 3000 amu/q.[24] To calculate the electromagnetic force, the in situ
Cassini solar wind measurements are adopted. We use five‐minute averaged Cassini MAG data for the IMF and theone‐hour temporal resolution solar wind speed derived fromthe phase space density cut‐off of He+ measured by CassiniMIMI/CHEMS [Hill et al., 2004] (Regarding the timeresolution of the solar wind data we used, please seesection 3.3). During the period of interest, the solar windvelocity varied between 400 and 600 kms−1. The IMFranged from ≤0.1 nT in rarefaction regions to ^1 nT in thecompressed solar wind. Since the equation of motion isintegrated backward in time, the directions of vsw and Bneed to be reversed in the calculation.
3.2. Simulation Setup
[25] For each registered stream particle, we start thesimulation at the time of impact detection. Test particles arelaunched from the spacecraft position with velocity vectorsalong the instrument FOV. We divide the CAT (IIT) FOVinto 16 (25) directions along concentric cones (Figure 2b).Particles launched along each direction have various com-binations of impact velocities (vimp) and charge‐to‐massratios (Qd /md). The test particle’s initial velocity (vimp)ranges from 40 to 350 kms−1 with 11 velocity intervals. Thecharge‐to‐mass ratio ranges from 50 to 32000 Ckg−1 with15 intervals. In total, there are 2,640 (4,125) test particles foreach CAT (IIT) impact in our simulation.[26] In each time step, the measured B and vsw are
extrapolated from the spacecraft location to the location ofthe test particle with following assumptions: (1) solar windplasma flows radially outward from the Sun with measuredspeed, (2) the IMF structure stays intact while the solar wind
Figure 1. Statistics of the stream particle data set used in the backward simulation (section 3). Shown inhistograms are (a) impact ion yield (QI signal) and (b) impact CDA‐Saturn angle (gCDA). Gray dashedlines represent all events adopted in the backward simulation. Black solid lines show events that fulfill theselection criteria and used for the final analysis.
HSU ET AL.: DUST‐MAGNETOSPHERE INTERACTION AT SATURN A09215A09215
4 of 23

plasma is moving outward, and therefore, (3) the solar windparcel at the position of the test particle at time tnow has thesame properties as that of the Cassini measurements at t ′.The third assumption can be solved by
r�′ ¼Xtnowt¼t′
vsw � 5 min ð3Þ
r ′� is the distance between the dust grain and the spacecraft,projected on to the spacecraft‐Sun line at tnow (positivetoward the Sun in the simulation). The time interval ischosen to be five‐minute, i.e., the same as the IMF data.Equation (3) simply transforms the distance between thespacecraft and the test particle to the solar wind propagationtime by using the solar wind speed measurements. Forexample, for a test particle located further from the Sun thanthe spacecraft, t ′ is always smaller/earlier than tnow.
[27] Since stream particles can reach speeds comparableto the solar wind, the size of the time steps needs to beevaluated with care. The radial component (with respect tothe Sun) of the particle velocity (vdR) determines the timethat a particle spends in a solar wind parcel. Imagine aparticle that moves radially outward from the Sun with thespeed of solar wind (i.e., co‐moving with the solar windplasma), except for the decreasing strength with increasingdistance to the Sun, the magnetic field along the particletrajectory will be approximately constant. Since the space-craft moves much slower than the solar wind, the Cassinisolar wind speed measurements can be approximated as realvalues. With the solar wind speed (the extrapolation followsthe method described above) and the dust velocity, thelength of a time step (Dt) can be determined asDt = 5 min ×vsw /(vsw + vdR), where the five minutes is the time interval ofthe IMF data. In the simulation, vdR is positive toward thesun direction.
Figure 2. Solutions of backward simulation of two stream‐particle impact events: (a, b) the solutions ofan CAT impact detected at 2004‐330/12:50:57 and (c, d) the result of an IIT impact registered at 2004‐214/20:36:24. Figures 2a and 2c show the number of solutions on the charge‐to‐mass ratio‐impact veloc-ity parameter space while Figures 2b and 2d show the instrument field of view grid used in our simulationwith overlapped number of solutions. Other information related to the impact event, such as QI amplitude,directionality, and number of solutions obtained from the backward tracing simulations, are also listed.
HSU ET AL.: DUST‐MAGNETOSPHERE INTERACTION AT SATURN A09215A09215
5 of 23

[28] Since the main idea of backward simulation is to usethe solar wind measurements as constraints for the stream‐particle dynamics, we consider only impacts registeredwhen the spacecraft was outside Saturn’s magnetosphereand thus exposed to the solar wind (2375 out of all3258 impacts). In the simulations, test particles that reach agiven “sphere” around Saturn are ranked as possible solu-tions. In general the “Saturn sphere” has an angular size of∼30° seen from the spacecraft location.
3.3. Limitations of the Backward Simulation
[29] The procedure described above is basically the sameas in the work by Zook et al. [1996]. It allows applying thein situ solar wind measurements to calculate the Lorentzforce at any given location without engaging in computa-tionally expensive MHD (magnetohydrodynamics) calcula-tions. However, solar wind structures reorganizedthemselves as they move outward from the Sun. For exam-ple, CIRs, common solar wind structures within 10 AU[Gazis et al., 1999], form when fast solar wind streamsovertake slow streams and result in shock waves andcompression‐rarefaction structures. Our solar wind propa-gation method is not tenable at regions either close to CIR‐related shocks or within highly fluctuating solar windcompression regions. As mentioned before, in 2004, thesolar wind was highly structured and consisted of rarefac-tions and compressions. In rarefaction regions, the variationof B is generally small, which is ideal for the backwardsimulation. However, the field strength in solar wind com-pressions varies greatly over a short timescale. To retain theprogram stability, we choose the time step size to be fiveminutes. From the CDA‐measurement aspect, as shown byKempf et al. [2005a] and Hsu et al. [2010a, 2010b, 2011],Saturnian stream particles were accelerated significantly insolar wind compressions which results in detections devi-ated from the CDA‐Saturn LOS (i.e., large CDA‐Saturnangle, gCDA). Therefore, to assure the accuracy of ourbackward simulation results, we can simply eliminateimpacts with large gCDA (i.e., detections in solar windcompressions) from the impact list.[30] Another limitation of the backward simulation is
related to dust charging. Since the charging currents on to adust particle depend on the charging history, it cannot becalculated reversely in time. Performing the backwardsimulation implies a constant dust charge. However, at thevicinity of Saturn’s orbit, it takes ∼3 days for a 9 nm dustgrain to collect a single solar wind electron and to emit asingle photo‐electron produced by the solar UV (assumingplasma density of 5 · 104 m−3 and a temperature of 1 eV).The long charging time means that in most cases the elec-trostatic charge carried by a stream particle at time of impactis the same as when it left the dense plasma region in theSaturnian magnetosphere. The difference in Qd/md inducedby one additional elemental charge is 3% for 9.0 nm grainsand 20% for 2 nm grains.
3.4. From Solutions to Results
[31] An example of solutions from a CAT impact regis-tered at 2004‐330/12:50:57 is shown in Figure 2. Squares inFigure 2a represent our parameter space and are color codedwith the number of test particles that were successfullytraced backward from the spacecraft to Saturn for this
impact event. A similar color code is applied on the CDA‐FOV grid in Figure 2b. The impact information is alsolisted. We obtain multiple solutions for this event. Multiplesolutions are often seen in results of small gCDA impacts. Infact, only very few events have one unique solution (e.g. theimpact at 2004‐214T20:36:24 shown in Figures 2c and 2d).There are 409 impact events where we find no solution at all(pre‐SOI: 258, post‐SOI: 151). Impacts without any solutionare mostly detected at large gCDA and therefore are notincluded in the final result (described above). To derive thedynamical properties of these particles, we adopt a two‐stepstrategy: elimination and intersection. At first, we eliminatesolutions from impact events that are unsuitable for ourbackward tracing code. Secondly, we add valid solutions ofall Saturnian stream‐particle impacts together to find sta-tistical meaningful results.[32] As mentioned above, our solar wind model may not
be fully applicable to large gCDA impacts (i.e., particles thattraveled through solar wind compressions). Hence, we firstlimit our samples to impacts detected at gCDA ⩽ 60°.Moreover, considering the artificial “Saturn sphere”, the testparticles whose initial velocity vectors point toward the“Saturn sphere” will easily fulfill our criterion for a suc-cessful backward tracing. This significantly biases oursimulation results especially for solutions with small Qd/md
(less influenced by the Lorentz force) and leads to poorresolution in terms of refining the stream‐particle dynamicproperties in the parameter space. Therefore, only impactswith gCDA ⩽ 60° whose solutions are derived from particleslaunched with direction >15° away from spacecraft‐Saturndirection are taken into the next procedure, the solutionintersection.[33] Statistics related to impacts used for the final analysis
are shown in Figures 1a, 1b, 3a, and 3b. The QI signal (boldline in Figure 1a) is below 5 fC, which is typical fordetections during quiet IMF periods. The gCDA of theimpacts show a bimodal distribution (Figure 1b): the twogCDA groups correspond to weak and strong IMF influencedimpacts. Only solutions from the weak IMF influencedimpacts are used (bold line in Figure 3a). Figure 3a showsthe numbers of solutions as function of angular separationbetween the initial particle velocity vector and the SaturnLOS. Applying all selection criteria, Figure 3b showsnumbers of solutions in each vimp − Qd /md set (normalizedto the maximum and expressed in percentage). The redsquares represent the most probable impact properties forSaturnian stream particles detected by CDA. This arearoughly centers along the line of vimp = 0.011 × Qd/md + 30,and extends from Qd/md ’ 1000 Ckg−1 and vimp = 40 kms−1
to the upper right corner of the parameter space. Notice thatthe numbers of successful tracing events for big and fastparticle bins (upper left part of the Figure 3b) are only 20%less than the peak value in the red area. However, thesesolutions are from parameter sets that are not sensitive to theelectromagnetic force and may be beyond the capability ofthe backward tracing method. Hence, it is reasonable toassume that most of them, if not all, are unrealistic solutionswhich just can not be filtered out by our selection criteria.[34] One big advantage of employing backward simula-
tion technique is that it helps eliminate the influence of theLorentz force on stream particles’ dynamics and recovertheir initial dynamical properties. We assume that the
HSU ET AL.: DUST‐MAGNETOSPHERE INTERACTION AT SATURN A09215A09215
6 of 23

velocity of each particle at its closest approach to Saturn istheir ejection velocities (vex). Thus we can transform oursolutions from the frame of vimp in Figure 3d to vex.Figures 3c–3f show the results of the backward simulation.In Figure 3c, the number of impacts with solutions in eachvex − Qd/md bin is counted and normalized to the totalnumber of selected impacts (shown in percentage). This plotbasically shows the likelihood of stream particles’ initialdynamical properties. Similar to Figure 3b, high likelihoodbins (>60%) concentrate along the belt across bottommiddle to the upper right corner. Figures 3d and 3e showhistograms of Qd/md and vex separately. The simulationssuggest that the Saturnian stream particles in general have
Qd /md greater than 1000 Ckg−1 (smaller than ∼11 nm) withejection velocity between 50 to 200 kms−1. This agreeswith the estimates by Hsu et al. [2010a, 2010b].[35] Before going further to the backward tracing results, a
few remarks should be made concerning the stream particleejection process. As described before, positively chargedparticles with proper sizes can acquire enough energy fromthe outward pointing Ec to overcome the gravitational forceand finally escape from the system. Therefore, the equation ofenergy conservation can be written as
1
2md v
2ex ¼ �GMSmd
2r0þZ rms
r0
fco � Qd � Ec dr: ð4Þ
Figure 3. (top) Statistics of solutions and (middle and bottom) results from the backward simulation.(a) Number of solutions as function of angular separation between particles’ initial velocity vectors andSaturn direction. In total 188,552 solutions are selected. (b) The number of solutions of each charge‐to‐mass ratio‐impact velocity gird. The maximal number of solutions in one single bin is 1551. (c) Afterfiltering out the IMF influence, Figure 3b is transformed into Figure 3c, which shows the likelihood ofthe charge‐to‐mass ratios and the ejection velocities of detected stream particles. (d, e) The likelihoodof stream‐particle charge‐to‐mass ratios and ejection velocities. Figure 3e shows the most probableacceleration‐starting location, or we called the “ejection region” of Saturnian stream particles. Verticaldashed lines mark the outer edge of the A ring and orbits of the icy satellites. The shaded region repre-sents the variation by adopting different selection criteria. In general, the ejection region is locatedbetween the orbits of Dione and Rhea. Vertical axes at the right are the number of events for caseswith gCDA 60° and 80°, respectively.
HSU ET AL.: DUST‐MAGNETOSPHERE INTERACTION AT SATURN A09215A09215
7 of 23

On the right hand side, the first term is the total energy of adust particle with initial Keplerian motion. The second term isthe energy that particles acquire from the corotation electricfield. The E field can be expressed as Ec = −Vco × B, whereVco is the corotation velocity and B is the magnetic field ofSaturn. fco is the fraction of corotation, r is the distance toSaturn, rms is the boundary of the Saturnian magnetosphere,and r0 is the radial distance where a particle starts to beaccelerated by Ec.[36] Assuming that the magnetic field of Saturn is a per-
fect dipole and fco is independent of radial distance, we canexpress equation (4) as function of Qd/md and vex:
r0 ¼Qd
md� fco � A� B
v2ex þ Qd
md� fco � C
; ð5Þ
where A = 2 · W · B0 · RS3, B = G · MS, and C = A/rms. W =
1.64 × 10⁻⁴ second−1 [Desch and Kaiser, 1981] and B0 =21.535 m T are the rotation rate and the equatorial surfacemagnetic field strength, respectively. With equation (5), wecan interpret our solutions from the backward tracing sim-ulation as the likely region (r0) from which particles start tobe accelerated, also called the “ejection region”.[37] Figure 3f shows the likelihood of the stream particle
ejection region along the equatorial plane of Saturn’s mag-netosphere after applying equation (5) to the backwardtracing results. The reason for the limitation to the equatorialregion is that in the equation (5) the latitude is not taken intoconsideration. Nevertheless, it is still sufficient for ourpurposes since both model calculations [Horányi, 2000] andobservations [Hsu et al., 2010b] suggest that Saturnianstream particles were ejected along the magnetic equator.For deriving the ejection region we only use solutions withvelocity vectors which lie within ±30° from the Saturn ringplane.[38] As apparent in Figure 3f, the most likely ejection
region is close to Rhea’s orbit. The shaded area shows theejection region profile with different selection parameters(gCDA from ⩽60° to ⩽80° and fco from 80% to 100%). Theresult seems robust as the peak location does not vary muchas the parameters change. However, the assumptions onwhich equation (5) bases, such as a dipolar magnetic fieldstructure and the constant fco across the magnetosphere,certainly are not fully realistic. Starting from 6 RS, Saturn’smagnetic field gradually deforms from a dipolar to a disc‐like structure because of the magnetospheric current sheet[Arridge et al., 2008]. Due to several mechanisms (e.g., themass loading, the radial transport of magnetospheric plasma,etc.), the plasma corotation speed reduces to 70 to 80% ofthe E × B flow velocity at the region between orbits ofTethys and Rhea [Wilson et al., 2008, 2009; Pontius andHill, 2009]. However, the corotation electric field decreasesoutward with the distance square, thus most of the accelera-tion that particles acquire from Ec takes place at the innersystem, where the field is still dipolar‐like and the corotationlag is roughly independent on the radial distance. We there-fore conclude that the taken assumptions are reasonable andthe derived ejection region is tenable.[39] The most likely ejection region is located at the outer
part of the E ring between 7 and 9 RS. Interestingly, allprominent dust reservoirs are located inside of 4 RS (the
dense part of the E ring, the active Enceladus plume, and themain rings). The ejection region coincides with the regionwhere the measured surface potential of E ring grains andthe spacecraft turn from negative to positive [Wahlund et al.,2005; Sittler et al., 2005, 2006; Kempf et al., 2006;Wahlundet al., 2009]. To be accelerated outward by Ec, dust particlesneed to be charged positively. On one hand the “ejectionregion” seems like a dynamical effect as Figure 3f isindicative of the charging profile. On the other hand it isalso possible that stream particles do originate from theejection region and serve as a sink of the E ring grains. Inthe later case, we should see the indication of water ice inCDA mass spectra.
4. Stream Particle Composition
[40] The composition of the E ring as well as the surfacesof the embedded ice moons is dominated by water ice[Hillier et al., 2007; Postberg et al., 2008, 2009b; Spenceret al., 2009]. Thus a similar composition is expected forstream particles. However, this is not the case [Kempf et al.,2005b]. Since the analysis by Kempf et al. [2005b], theunderstanding of CDA spectra and the Saturnian dustenvironment have been significantly improved. With thatenhanced knowledge we here investigate the data set usedfor the backward simulation for compositional similaritiesbetween stream particles and E ring grains. Besides waterice some E ring grains contain a substantial amount of alkalisalts which thus can also be expected to be found in streamparticles.[41] At low and intermediate impact speeds (1 to 12 kms−1),
as applicable for most E ring particle detections, the char-acterizing cations for water in CDA spectra is the hydroniumion (H3O
+) and its cluster with neutral water molecules((H3O)
+ − (H2O)n) [Hillier et al., 2007]. For the regime ofstream particles (50 to 200 kms−1) it is plausible that watermolecules are mostly disintegrated into O+ and H+. Bothions form mass lines in stream particle spectra [Kempf et al.,2005b]. However, H+ is known to be produced abundantlyfrom contamination of the CDA impact target at high impactspeeds. Therefore, H+ is either the dominant peak in streamparticle spectra (Figure 4a) or (in most cases) has triggeredthe event recording (Figures 4b and 4c). O+ might also stemfrom contamination, albeit only to a lesser extent [Postberget al., 2009a].[42] For this work it is attempted to estimate the water
content in Saturnian stream particles by comparing theamplitudes of the O+ mass line with those in spectra pro-duced by Jovian stream particles, which are supposed tocontain no water ice but sodium chloride as their bulkcomponent [Postberg et al., 2006]. Because of their similarspeed and size the latter are well suited for such a com-parison. Although Jovian stream particle spectra frequentlyshow an O+ mass line it stems (too unknown extents) eitherfrom a minor silicateous compound in the grains or CDAcontamination [Postberg et al., 2006]. Thus, if water is abulk component of Saturnian stream particles, the fraction ofreleased O+ ions should be systematically higher than in theJovian case.[43] Because of the small size of the grains which hit
the instrument at extreme velocities, the impact producesmuch more ions from target material and contaminants
HSU ET AL.: DUST‐MAGNETOSPHERE INTERACTION AT SATURN A09215A09215
8 of 23

(Rh+, C+, H+) than from the dust particle (Figure 4). The ionsignal from the particle itself often is barely above the noiselevel or not present at all [Postberg et al., 2009a]. About80% of the registered stream particles show ion yield below2 fC and are too small to produce highly significant particlemass lines at all. In contrast to Kempf et al. [2005b], whoalso tried to evaluate the weak and noisy spectra with aniterative method, here we only use the most distinct spectrawith ion yields above 2 fC for an individual compositionalcharacterization. Even in this subset the probable particlecompounds show up only in a fraction of spectra.[44] Thus in principle the compositional results discussed
here are only valid for a small proportion of stream particles.However, if the ultra‐weak spectral signals with ion yieldsbelow 2 fC are co‐added, they show the same characteristicparticle mass lines as the larger impacts (Figure 5). Thesimilar proportion of mass line intensities indicates that thefraction of larger particles used in Table 1 is indeed repre-sentative for the whole ensemble.[45] Jovian stream particles are on average a bit faster
(200–300 kms−1) and larger (5–20 nm) than in the Saturniancase. Therefore, they produce a higher average ion yield onimpact. However, the ion yields of both dust populationhave an overlap between 2 and 10 fC, this fraction of thepopulations is used for the comparison in Table 1. It showsthe average mass line amplitudes of certain ion species andhow frequently they are detected in Jovian and Saturnianstream particle spectra. Spectra not considered in Table 1have ion yields above the overlapping range in the Joviancase, and below the overlapping range in the Saturnian case.The properties of the different sets of spectra are summa-rized in Table 2. The Jovian subset used here was recordedfrom day 248 to 251 in year 2000 when Cassini wasapproaching Jupiter and encountered a stream particle burstof fairly homogenous composition. These spectra are com-pared with Saturnian stream particle recorded in the sameperiod which was used for the backward simulation.[46] The first three ion species (H3
+, C+, Rh+) shown inTable 1 are ions stemming from the instrument target. Their
Figure 4. The CDAmass spectra of (a) Jovian and (b and c)Saturnian stream particles. Figure 4a shows the mass spec-trum is co‐added from thirty Jovian stream particle spectrarecorded in 2000. The Na+, K+, and probably O+ lines areparticle constituents. Figure 4b gives an example of a partic-ularly oxygen rich spectrum. These rare cases likely mark animpact of a stream particle with abundant water ice. Masslines from carbon (C+) and rhodium (Rh+) stem from theinstruments target. Since the spectrum shows no siliconmass line it is in best agreement with a pure water ice grain.Figure 4c shows the spectrum of an impact from a relativelylarge Saturnian stream particle (ion yield = 6 fC) withunusually distinct particle mass lines and typical composi-tion. Since there is no access of oxygen, the spectrum isindicative of a silicate particle with few or no water ice.
Figure 5. Co‐added spectrum of the 923 individual ultra‐faint spectra with ion yields below 2 fC which have not beenconsidered for the individual analysis shown in Table 1.Although the possible particle mass lines (O+, Si+, Na+) aretoo weak to be identified in individual spectra, they formdistinct signatures when co‐added.
HSU ET AL.: DUST‐MAGNETOSPHERE INTERACTION AT SATURN A09215A09215
9 of 23

yield is indicative of dynamical properties. The other speciesshown (O+, Si+, Na+) are possible particle constituents. Thehigher abundance of the target material Rh+ in Jovian streamparticle spectra implies their higher impact energies. Sincehigher impact energies are unfavorable for the formation ofhydrogen cluster‐ions H3
+ its reduced yield points at higherenergy densities, too.[47] The average contribution of O+ ions is similar for the
Jovian and Saturnian stream particles. This finding isindicative for water ice not being a main constituent ofSaturnian stream particles in general. However, about 5% ofthe spectra are outliers with a significantly increased abun-dance of O+ ions (Figure 4b), a phenomenon which cannotbe observed in the Jovian case. This finding strongly indi-cates an occasional dominance of water ice. In most caseshowever, there is no indication for water ice as the bulkcomponent of the particles as observed in the E ring. Only avarying minor water ice constituent of not more than about50% (maybe far less) is in agreement with most spectra.[48] The main difference between the stream particle
spectra sets is the higher abundance and occurrence of Na+
at Jupiter and of Si+ at Saturn. Na+ at Jupiter stems from theparticles bulk component NaCl [Postberg et al., 2006]. AtSaturn the faint and rare sodium mass lines are in most casesin agreement with a possible low level target contamination[Postberg et al., 2009a]. This is of particular relevance sincealkali ions play a major role in spectra of E ring grains[Postberg et al., 2009b] which are to a greater part producedby the active venting of the moon Enceladus. About 6% ofE ring ice grains contain sodium salts on a percent level anddue to its low ionization energy Na+ is the most abundant ionin these spectra. The strong depletion of alkali compounds inSaturnian stream particles coincides with the depletion ofwater ice.[49] Jovian and Saturnian spectra frequently show Si+.
Although the Jovian particles in the sample are likely largerthan the Saturnian ones Si+ mass lines have a lower fre-quency and lower average intensity than at Saturn (Table 1).Thus, the main finding of Si+ as the most reliably identifiedparticle compound [Kempf et al., 2005b] is confirmed(Figure 4c). In contrast to Jovian stream particles [Postberget al., 2006] the Saturnian counterpart shows a clear trend ofincreasing Si+ occurrence with increasing total ion yield.Often the ratio of Si+ to O+ is in good agreement with silicateas a main particle constituent.[50] Organic compounds are also suspected to be a minor
constituent of E ring grains [Postberg et al., 2008]. In theimpact speed regime of stream particles Hydrocarbons likelydecompose completely into H+ and C+ [Srama et al., 2009].Since these ions also form large mass lines from CDA target
contamination [Postberg et al., 2009a] no conclusions on acontribution of organic compounds in Saturnian streamparticles can be drawn. Kempf et al. [2005b], also suggestthat nitrogen bearing compounds might play a role for thecomposition of stream particles because of occasional sig-natures at 14 (N+) and 18 amu (NH4
+). Here we suggest thatH2O
+ is responsible for the rare and faint 18 amu mass linesrather than NH4
+. However, the mass line at 14 amu is inagreement with (albeit not proof for) an occasional contri-bution of a nitrogen bearing compound.[51] In summary, Si+ is the most abundant particle com-
pound identifiable in stream particle spectra confirming theresult of Kempf et al. [2005b]. Water and alkali signatures,as expected from E ring grains, are clearly depleted and evenless abundant than in the previous analysis Kempf et al.[2005b]. There seems to be only a small sub‐populationof stream particles which consists predominately of waterice. A plausible explanation for the distinct compositionaldiscrepancy between stream particles and E ring grains isgiven in the following section.
5. Ejection Model
[52] Motivated by the results from the backward simula-tion and the composition analysis, we construct a dynamicalmodel to understand the evolution of these tiny particlesinside Saturn’s magnetosphere as well as to examine thebackward tracing results. To achieve these, certain featuresmust be considered in the model. First, due to their tinysizes, stream particles only carry small number of charges.This implies that the dust charging currents are too weak tobe treated as continuous ones. Consequently, the chargesthat particles carry vary stochastically and the equilibriumpotential is no longer valid to represent their charging state.Hence, the dust charging calculation needs to consider thequantized nature of electric charges and be modeled togetherwith dust dynamics.[53] Secondly, the properties of different materials need to
be considered in the model. For example, water ice is morefragile than silicate (smaller tensile strength). Regarding thecharging, silicate emits more secondary electrons and ischarged more positively. The material property differencesmay be crucial to understand the compositional discrepancy.[54] Another important issue relevant to the composition
is the actual source of stream particles. Assuming there is nomysterious silicateous dust source at around Rhea’s orbit,these silicate nanoparticles must be transported from theiractual source (most probably in the inner system) to the“ejection region” where they become stream particles.[55] Acquiring momentum from the fast rotating ions in
Saturn’s magnetosphere, the plasma drag enables E ringdust grains to propagate from Enceladus to the outer system[Horányi et al., 2008; Srama et al., 2006]. A long‐term
Table 2. Properties of the Spectra Sets Used in Table 1a
Number Period (Day, Year) Distance Average Ion Yield
Saturn 208 (1031) 120–300, 2004 52–550 RS 3.0 fCJupiter 86 (222) 248–251, 2000 1490–1520 RJ 7.5 fC
aThe first row is the number of spectra with ion yields between 2–10 fCused for the comparison in Table 1. The number in parentheses is the totalspectrum number recorded in that period (regardless of the ion yield).
Table 1. Frequency (Occurrence) ofMass Lines and Their AverageIntensity (Absolute Amplitude and Relative Amplitude WithRespect to the Saturnian Spectra)
Planet H3+ C+ Rh+ O+ Si+ Na+
Occurrence Saturn 54% 99% 94% 65% 46% 12%Jupiter 64% 100% 98% 78% 20% 91%
Absolute Amplitude Saturn 0.24 3.5 1.1 0.33 0.17 0.09Jupiter 0.17 5.3 2.8 0.34 0.11 0.48
Relative Amplitude Saturn 1.0 1.0 1.0 1.0 1.0 1.0Jupiter 0.7 1.5 2.5 1.0 0.6 5.3
HSU ET AL.: DUST‐MAGNETOSPHERE INTERACTION AT SATURN A09215A09215
10 of 23

dynamical modeling of micron‐sized E ring dust grainsconducted by S. Kempf et al. (manuscript in preparation,2011) suggests that the E ring grains close to Rhea’s orbitare trapped due to the reduced Lorentz force resulting fromtheir neutralized charging state. Meanwhile, plasma sput-tering, an erosion mechanism caused by energetic particlebombardment, continues to degrade dust grains to smallerpieces (e.g., smaller grains, molecules, and atoms). Thisevolution scenario of E ring grains provides an outward dusttransportation from the inner system to the outer “ejectionregion”. Although not applicable directly to stream particles,this scenario outlines important physical processes thatoperate in Saturn’s magnetosphere. In our simulation, wewill adopt different starting locations to explore the impor-tance of the source/transportation issue.[56] Integrating aforementioned features, here we present
an axially symmetric ejection model, which calculatescharging and dynamical evolution simultaneously fornanometer sized dust particles in Saturn’s magnetosphere.To calculate the charging, an ad hoc plasma model is builtbased on recently published Cassini measurements. In par-ticular, the charging currents of two Lorentzian (� distri-bution) electron populations are considered. Furthermore,we consider the dust charging as a Poisson process in ourmodel. This approach is used for fitting laboratory measure-ments [Grimm et al., 2006] and is a realistic way to calculatethe stochastic charge variation of tiny dust particles.[57] We do not consider longitudinal variation of mag-
netospheric plasma as observed by the Cassini spacecraft.Gurnett et al. [2007] found the connection between themodulations of rotational plasma and the Saturn Kilometricradiation (SKR) and suggested it to be triggered by thecentrifugally driven instability in the plasma disk. Morookaet al. [2009] presented electron density distributions indifferent magnetospheric regions based on measurementscarried out by the Langmuir probe (LP) of the Radio andPlasma Wave Science (RPWS) onboard Cassini. As learnedfrom the Jovian stream particle detections, the longitudinalvariation of the plasma/charging environments leads to anasymmetric ejection pattern [Horányi et al., 1997; Krügeret al., 2003a]. A similar situation may happen at Saturn aswell. However, the data set used in this analysis covers morethan a half year and a wide range of longitudes. The vari-ability shorter than this timescale and also the longitudinalvariation are surely smeared out in the data set and may notbe accessible. Hence, an axially symmetric model should bereasonably representative.
5.1. Dust Charging in Saturn’s Magnetosphere
[58] To begin with, here we briefly introduce the chargingequation. As having been extensively discussed in theliterature [Whipple, 1981; Horányi, 1996; Kempf et al.,2006], the time evolution of electric charges carried on adust grain (Qd) in a plasma environment is
dQd
dt¼ Je þ Ji þ J� þ Jsec: ð6Þ
The Je and Ji are the electron and ion collection currents, i.e.,the flux of electron and ion that a dust grain captures fromthe ambient plasma. Jn is the current that describe the fluxof photo‐electron induced by solar UV photons. Jsec issecondary electron emission current, which describes the
flux of secondary electron emission caused by energeticelectrons. The electron current is a negative current whilethe others are positive currents. The current strengthsdepend on various conditions, such as plasma characteristics(the composition, the number density, the temperature, andthe energy distribution of plasma), the solar UV photon flux(effect on Jn), and dust grain properties (the surface potential�d, the material properties, the dust grain‐plasma relativespeed, etc.).[59] The dust charging calculation in this work basically
follows the Orbital Motion Limited (OML) theory [Mott‐Smith and Langmuir, 1926] which is valid under conditionof sd � lD � Dd where lD is the plasma Debye length andDd is the inter‐grain distance. Nonetheless, a deficiency ofplasma electron was measured in the vicinity of Enceladus’orbit and in its plume. High density of submicron dust grainsare proposed to account for the missing electrons [Wahlundet al., 2009; Yaroshenko et al., 2009]. Under such dustyplasma condition, the amount of charges carried on eachgrain is reduced and dust grains act collectively as heavy,negative plasma component [Goertz and Ip, 1984; Havneset al., 1990]. However, the grain size distribution in thesubmicron range may differ from a simple power law, thedegree of influence of the proposed dusty plasma effect isnot yet clear. Our model mostly focuses on the outer E ringregions where the OML approach is applicable. In the worstcase our results can be considered as an upper limit, i.e., themaximum charge and the force that a particle can acquire,even under dusty plasma conditions.[60] As Io to Jupiter, the tiny icy moon Enceladus is the
major neutral/plasma source in Saturn’s magnetosphere[Hansen et al., 2006]. However, different from the Jovianmagnetosphere, the neutral gas density exceeds plasmadensity by more than an order of magnitude across theSaturnian magnetosphere [Delamere et al., 2007]. Everysecond Enceladus emits a few hundred kilograms of watervapor into the system and only about 10% are ionized byelectron impact or photo‐ionization [Sittler et al., 2008].The density of neutral atoms/molecules (such as O and OH)at Enceladus is estimated to be ∼700 cm−3 [Melin et al.,2009] to 1000 cm−3 [Jurac et al., 2002], or even 105 to106 cm−3 in Enceladus’ plume [Waite et al., 2006]. Withinthe dense Enceladus neutral cloud, the electron temperatureis low (<1e V) and the charge exchange between neutral‐ioncollisions is the dominant mechanism to redistribute neutralsfrom Enceladus into the broader torus (between ∼3 to 7 RS).Further outward from Enceladus, due to the increase ofelectron temperature, more ions are to be produced by theelectron impact ionization process. The plasma ions andelectrons formed in the inner system then diffuse outwardand go through centrifugal instability interchange with theouter hot, tenuous plasma, sometimes observed as injectionevents in the region between 6 to 11 RS. The planetwardtransported hot electrons follow adiabatic heating andsuperimposed with the cold electron population, while theinjected ions may interact with the dense neutral torus whichproduces energetic neutral atoms (ENAs).[61] The plasma models that we use for the ejection model
is based on recent Cassini measurements. Results fromMoncuquet et al. [2005],Persoon et al. [2006], and Schipperset al. [2008] are adopted for the plasma (thermal and super-thermal) electrons. Models from Young et al. [2005], Kane
HSU ET AL.: DUST‐MAGNETOSPHERE INTERACTION AT SATURN A09215A09215
11 of 23

et al. [2008], Tokar et al. [2008], Wilson et al. [2008, 2009],and Persoon et al. [2009] are adopted for the ion popula-tions. Based on these works, an ad hoc axially symmetricplasma model is built as the input for the charging calcu-lation. Magnetospheric protons (H+) and water group ions(W+) are assumed to have Maxwellian distribution whileboth electron components (cold and hot) are found to followthe kappa distribution [Schippers et al., 2008]. The density,the temperature, and the scale height (with respect to theequatorial plane) of ion and electron components along theL shell are plotted in Figure 6. Also shown in the plot arethe kappa indices for electron populations and the plasmaion flow speed (v�), which is adopted from Wilson et al.[2009] and Kane et al. [2008] and is used to evaluate thestrength of the corotation electric field by Ec = −v� × B.[62] In an environment with dense plasma such as plan-
etary magnetosphere, where the ionization current inducedby UV photons is not important, thermal electrons (energy <
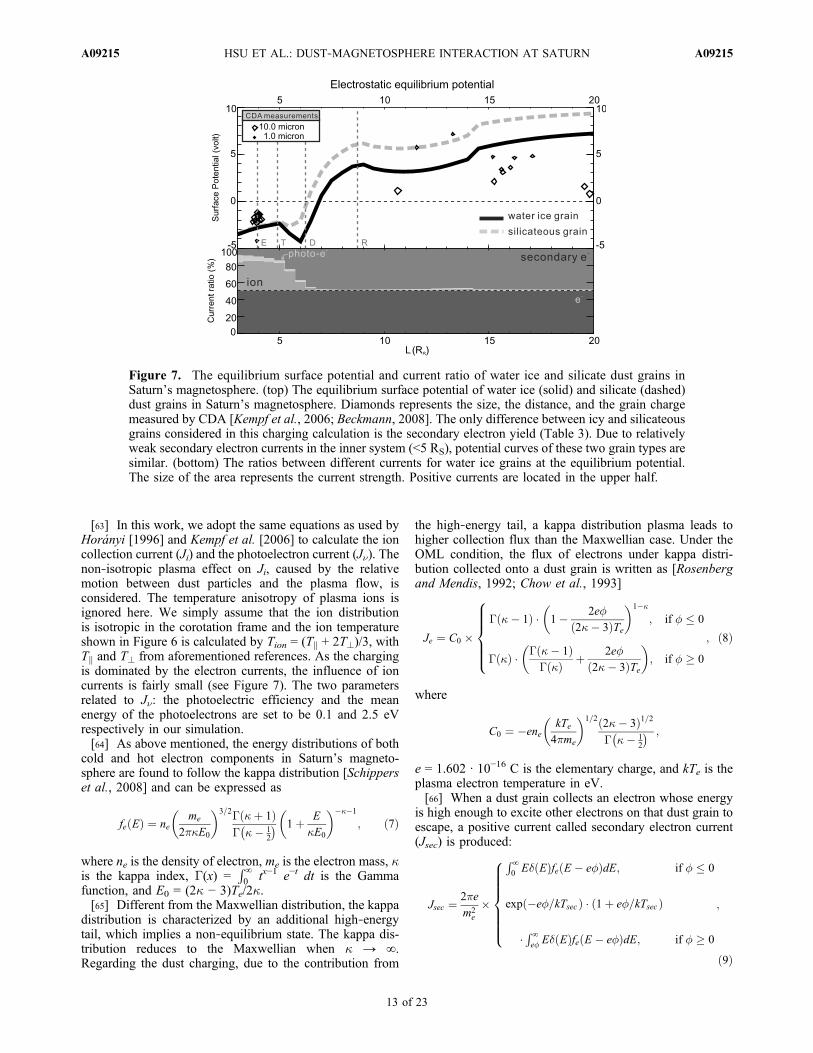
100 eV) always dominate the grain charging due to theirhigh mobility and therefore lead to a negative surfacepotential. This is the case for E ring particles inside of∼7 RS. The equilibrium potential (when the net current to thegrain is zero) of water ice grain together with CDA chargemeasurements in Saturn’s magnetosphere [Kempf et al.,2006] are shown in Figure 7. Contributions from variouscurrents at equilibrium potential as function of distance toSaturn are shown in Figure 7 (bottom). The electron col-lection current is the primary one throughout the magneto-sphere. Inside 5 RS, the equilibrium is reached by thebalance between the electron and (mainly) ion currents. Asthe electron temperature increases with distance to Saturn,outside of 5 RS the secondary electron current takes over ioncurrents and becomes the major positive current. Outside∼7 RS the electron temperature is so high that dust grainsloose more electrons than they collect and reach positiveequilibrium potential.
Figure 6. The plasma model used for the charging calculation in the ejection model: (top to bottom) theplasma density, the temperature, the scale height, electron � indexes, and the azimuthal plasma flowspeed. Except for the plasma speed panel, the solid, dotted, dashed, and dash‐dotted lines representthe properties of cold electrons, hot electrons, water group ions, and protons as function of L shell inthe equatorial region. The hot electron population are assumed to distribute homogeneously regardlessof the distance to the equator. In the bottom panel, the dashed line marks the speed of full corotationand the solid line represents the true plasma flow speed. Five vertical dotted lines mark the orbitsof Saturnian moons: Tethys, Dione, Rhea, Titan, and Hyperion. The plasma model is based on Cassinimeasurements, for more detail please see references mentioned in the text.
HSU ET AL.: DUST‐MAGNETOSPHERE INTERACTION AT SATURN A09215A09215
12 of 23
[63] In this work, we adopt the same equations as used byHorányi [1996] and Kempf et al. [2006] to calculate the ioncollection current (Ji) and the photoelectron current (Jn). Thenon‐isotropic plasma effect on Ji, caused by the relativemotion between dust particles and the plasma flow, isconsidered. The temperature anisotropy of plasma ions isignored here. We simply assume that the ion distributionis isotropic in the corotation frame and the ion temperatureshown in Figure 6 is calculated by Tion = (Tk + 2T?)/3, withTk and T? from aforementioned references. As the chargingis dominated by the electron currents, the influence of ioncurrents is fairly small (see Figure 7). The two parametersrelated to Jn: the photoelectric efficiency and the meanenergy of the photoelectrons are set to be 0.1 and 2.5 eVrespectively in our simulation.[64] As above mentioned, the energy distributions of both
cold and hot electron components in Saturn’s magneto-sphere are found to follow the kappa distribution [Schipperset al., 2008] and can be expressed as
fe Eð Þ ¼ neme
2��E0
� �3=2G �þ 1ð ÞG �� 1
2
� � 1þ E
�E0
� ����1
; ð7Þ
where ne is the density of electron, me is the electron mass, �is the kappa index, G(x) =
R∞0 tx−1 e−t dt is the Gamma
function, and E0 = (2� − 3)Te/2�.[65] Different from the Maxwellian distribution, the kappa
distribution is characterized by an additional high‐energytail, which implies a non‐equilibrium state. The kappa dis-tribution reduces to the Maxwellian when � → ∞.Regarding the dust charging, due to the contribution from
the high‐energy tail, a kappa distribution plasma leads tohigher collection flux than the Maxwellian case. Under theOML condition, the flux of electrons under kappa distri-bution collected onto a dust grain is written as [Rosenbergand Mendis, 1992; Chow et al., 1993]
Je ¼ C0 �G �� 1ð Þ � 1� 2e�
2�� 3ð ÞTe
� �1��
; if � � 0
G �ð Þ � G �� 1ð ÞG �ð Þ þ 2e�
2�� 3ð ÞTe
� �; if � 0
8>>>><>>>>:
; ð8Þ
where
C0 ¼ �enekTe4�me
� �1=2 2�� 3ð Þ1=2G �� 1
2
� � ;
e = 1.602 · 10−16 C is the elementary charge, and kTe is theplasma electron temperature in eV.[66] When a dust grain collects an electron whose energy
is high enough to excite other electrons on that dust grain toescape, a positive current called secondary electron current(Jsec) is produced:
Jsec ¼ 2�e
m2e
�
R∞0 E� Eð Þfe E � e�ð ÞdE; if � � 0
exp �e�=kTsecð Þ � 1þ e�=kTsecð Þ
� R∞e� E� Eð Þfe E � e�ð ÞdE; if � 0
8>>>>>><>>>>>>:
;
ð9Þ
Figure 7. The equilibrium surface potential and current ratio of water ice and silicate dust grains inSaturn’s magnetosphere. (top) The equilibrium surface potential of water ice (solid) and silicate (dashed)dust grains in Saturn’s magnetosphere. Diamonds represents the size, the distance, and the grain chargemeasured by CDA [Kempf et al., 2006; Beckmann, 2008]. The only difference between icy and silicateousgrains considered in this charging calculation is the secondary electron yield (Table 3). Due to relativelyweak secondary electron currents in the inner system (<5 RS), potential curves of these two grain types aresimilar. (bottom) The ratios between different currents for water ice grains at the equilibrium potential.The size of the area represents the current strength. Positive currents are located in the upper half.
HSU ET AL.: DUST‐MAGNETOSPHERE INTERACTION AT SATURN A09215A09215
13 of 23

where kTsec is the mean secondary electron energy. Labo-ratory studies found that the energy of secondary electronsfollows the Maxwellian distribution with mean energy offew eV. Here we set kTsec = 2.5 eV.[67] The d(E) is the secondary electron yield and is a
function of primary electron energies E. It can be expressedby an empirical universal yield curve with two material‐dependent parameters: the maximum yield dM and theoptimal energy EM (in eV), i.e., the secondary yield curvereaches the maximum value dM at the incident energy of EM.Here we adopt the expression for the secondary electronyield from Sternglass [1954]:
� Eð Þ ¼ 7:4 �M E=EMð Þ � exp �2 E=EMð Þ1=2� �
: ð10Þ
[68] Adopting the Sternglass yield curve, Meyer‐Vernet[1982] has derived the secondary electron current for aMaxwellian distributed plasma. As the yield increases withthe energy of primary electrons, the excess high‐energy tailof kappa distribution plasma consequently results in greaterJsec. As Jsec becomes more and more important toward theouter Saturnian magnetosphere, it ultimately determines theneutral point of the E ring dust grain potential (Figure 7). Bysubstituting equation (7) and equation (10) into equation (9),the secondary electron current under kappa distributionplasma can be written as
J�sec ¼ C1 �
F �; �;EMð Þ; if� � 0
exp �e�=kTsecð Þ � 1þ e�=kTsecð Þ
�F �; �;EMð Þ; if� 0
8>>>><>>>>:
; ð11Þ
where
C1 ¼ 7:4 �M ne e � 2�með Þ�1=2� �E0ð Þ�3=2� �þ 1ð Þ= �� 1=2ð Þ;
and
F �; �;EMð Þ ¼Z ∞
max e�;0ð ÞE2=EM
� � � exp �2 E=EMð Þ1=2� �
� 1þ E � e�ð Þ=�E0ð ÞdE:
Using the � indices profile (Figure 6) and a given EM value(Table 3), the secondary electron current at different grainpotential can be calculated by integrating equation (11)numerically up to 10 keV.[69] As the Saturnian stream particles most probably are
composed of silicateous material [Kempf et al., 2005b], weadopt the secondary emission characteristics of SiO2 from[Kanaya et al., 1978] for the charging calculation. The sameis done for water ice grain as a comparison in order tounderstand the compositional discrepancy from the charg-
ing/dynamics point of view. The dM and EM are listed inTable 3. Due to the higher secondary emission yield, thezero equilibrium potential point of silicate grains is locatedaround Dione’s orbit (6.26 RS), inward of those of water icegrains (see Figure 7). In our model, two curves lie within−5 V to + 10 V among the magnetosphere. However, theRPWS measurements show that the spacecraft potentialdrops to more than −10 V at the boundary between thenegative and positive charging regions Wahlund et al.[2009, Figures 8 and 9], which cannot be seen in our model.
5.2. Charging of Nanodust: A Poisson ProcessApproach
[70] The number of electric charges carried on an isolatedgrain is about 0.7 · �d · snm, where snm is the grain radius innanometer. So a 5 nm grain with � = −2 V carries only7 additional electrons on its surface. The small number ofcharges implies that the charging currents can not beapproximated as continuous fluxes (as for mm‐sized grains)but must be considered as discrete and quantized processes.Furthermore, by adding or removing one electron, theLorentz force that this dust particle experiences will change∼14%. Therefore, a more sophisticated method for nano-particle charging calculation is necessary.[71] To simulate the charging and dynamical evolution of
a nanoparticle, we developed a procedure that treats the dustcharging as a Poisson process. In this scenario, the afore-mentioned charging currents are considered as the expectednumber of charging events in a given time interval so thatthe probability of an event number can be calculated fromthe Poisson distribution. As the charging conditions varythroughout the magnetosphere, the expected event rate is nota constant but is a function of plasma and dust particleparameters (e.g. surface potential). To be more specific, thisis actually an inhomogeneous Poisson process. The proba-bility distribution of the number of events between t1 and t2can be written as
P �12; kð Þ ¼ e��12 � �k12
k!; k ¼ 0; 1; 2; :; ð12Þ
where k is the event number and l12 is the expected numberof charging events (i.e., the rate) between t1 and t2. With thecharging currents equation (6), it can be expressed as
�12 ¼Z t2
t1
� tð Þdt ¼Z t2
t1
Jej j þ Jij j þ J�j j þ Jsecj j dt: ð13Þ
Then the type of charging event can be determined by thefollowing probability distribution:
P Jð Þ ¼Z t2
t1
Jj jdt = �12; ð14Þ
where a = e, i, n, and sec. Equation (14) turns the variousOML currents into a charging event type probability dis-tribution. In other words, it determines whether a dust grainwill obtain/loose an ion/electron for this charging event.[72] So there are two probabilities involved in this
procedure: the first one describes the event number proba-bility in one time step (the equation (12)). It is a function ofk and l12. The second one is converted from OML currents
Table 3. The Secondary Electron Emission Parameters and theMacroscopic Tensile Strength of Water Ice and SiO2
a
dM EM (eV) Ft References
SiO2 3.9 430 48 Kanaya et al. [1978], Gold [1977]Water ice 2.3 340 1 Kempf et al. [2006]
aFt in N/m2 = 107 dyne/cm2.
HSU ET AL.: DUST‐MAGNETOSPHERE INTERACTION AT SATURN A09215A09215
14 of 23

and it reflects the relative importance of each current. Inpractice, the charging event during a given time interval canbe evaluated with equation (12), equation (14), and n + 1random numbers. The first random number determines theamount of events (n) that happen during this time intervalvia equation (12), while the rest random number(s) is used todecide the type of charging event based on the relativestrength between aforementioned currents via equation (14).Interestingly, we have developed this procedure indepen-dently but somehow reached a similar approach as Cui andGoree [1994].[73] To recap, the goal of the ejection model is to follow
the dynamical and charging evolution of negatively chargednanodust grains. Since the grain is so tiny that it only carriessmall number of charges, each charging event could havedeterminant influence on its evolution path. Moreover, evenwith one elementary charge variation, the potential of such asmall grain changes largely, which consequently affects thecurrent strength. Thus, our stochastic charging approxima-tion is valid only with a small time step size. In order tomonitor each charge variation we choose our time step sizesso that in most cases no more than one charging event takesplace during each time step, i.e., P(l12, k > 1) � 1.[74] As the event rate is proportional to the grain surface
area, bigger grains then require smaller time steps to fulfillthe condition. Compromising with the computation time, weset an upper limit of l12 ∼0.4, which means that in the worst
case the probability to have more than one event in singletime step is about 6.2% (P(l12 = 0.4, k = 0, 1) ’ 67.0%,26.8%).[75] Figure 8 shows the comparison between continuous
charging and stochastic charging curves for different sizedsilicate grains (3 nm and 50 nm) at 6 RS in the ring plane.The modeled equilibrium potential at this distance is around−2 V. Though both grains start with zero charge, theircharging histories are quite different. For the 50 nm grain,its potential fluctuates between −1 V and −3 V, i.e., ±1 V ofthe “expected” potential. In contrast, for the 3 nm grain thedeviation between two charging curves is large. Eventhough the equilibrium potential is negative, short excur-sions toward positive grain potential can still occur. Asexpected, the stochastic effect is more important for tinygrains due to the quantized nature of electric charge. Sincethe Lorentz force governs the dynamics of nanoparticles, thestochastic charge variation then acts as a strong diffusionmechanism on stream particles’ dynamics and makes theirdynamical evolution no longer determinative.
5.3. Dust Dynamics in Saturn’s Magnetosphere
[76] The motion of a charge particle under Saturn’sgravity and the Lorentz force in cylindrical coordinates(r, F, z) can be described as
€r ¼ Qd
md� Bz � r � _F� W
� �� GMS
R3r þ r _F
2
€F ¼ 1
r
Qd
md� _zBr � _rBzð Þ � 2_r _F
�
€z ¼ Qd
md� Br � r � W� _F
� �� GMS
R3z
ð15Þ
where r is defined as the distance between the particle andSaturn’s center of mass projected onto the ring plane, F isthe azimuthal angle, and z is the distance of the particle tothe ring plane. We ignore the gravitational force caused bythe oblateness of Saturn (i.e., the J2 term) and simply use adipole magnetic field in our calculation. Test particles startwith negative charges equivalent to ∼−1 V from slightlyeccentric orbits between 5 to 6 RS with maximum z of ±1 RS
(corresponds to inclination of 10°). Their position vector andcharge are traced until reaching one of the following sce-narios: collision with the A ring, remaining in the E ring orescaping from the magnetosphere (r ≥ 25 RS). Our modeldoes not consider the reduction of the particle size due tosputtering.
5.4. Ejection Model Results
[77] Figure 9 shows an example of the dynamical evolu-tion path of a 3 nm SiO2 particle. The particle starts with2 electron charges from 5.5 RS with ∼3° inclination. It keepscharged negatively for 30 hours and then oscillates betweendifferent polarities a few times before the ejection. Aroundthe 31st hour, this particle reached its apocenter at 6 RS andbecame positively charged. Within the following half hour,the acceleration is clearly shown as the velocity of thisparticle increased as it moved outward. Once it becamenegatively charged again, the velocity decreased as it movedoutward until it reached the new apocenter at ∼8 RS. This“orbit maneuver” puts the particle into a larger orbit andincreases the possibility of obtaining positive charges.
Figure 8. Comparison of stochastic charge variation on3 and 50 nm grains. The potential calculated from continu-ous charging currents is marked by the gray dashed line as areference. One electric charge variation corresponds to∼0.48 V and ∼0.03 V difference for 3 nm and 50 nm grainrespectively.
HSU ET AL.: DUST‐MAGNETOSPHERE INTERACTION AT SATURN A09215A09215
15 of 23

During its last orbit, the grain charges flipped forth and backwithin a few hours and eventually became positive and wasejected from the system. The final ejection speed of thisparticle is about 100 kms−1. The “ejection region” of thisevent calculated from equation (5) is 9.8 RS.[78] Figure 10 shows the distributions of charge‐to‐mass
ratio (Qd /md), ejection speed (vex), ejection time, the ele-vation angle of 3 nm SiO2 stream particles. The simulated‘ejection region’ is also shown to compare with backwardsimulation results. For 3 nm particles, 98.5% of simulatedgrains are ejected but never collided with the A ring.Interestingly, even negatively charged particles are ejected(2 out of ∼10000 ejected with one negative charge and 3 outof ∼10000 ejected with neutral potential). In these cases, theejection of stream particles is similar to the energetic neutralatoms (ENAs) formation process.[79] The charge‐to‐mass ratio and ejection velocity dis-
tributions together with the joint contour are shown inFigure 10a. Each bin of Qd/md histogram (Figure 10a, top)represent one electric charge difference. Most of 3 nm grainscarry 9 ± 2 electric charges during ejection. The charge‐to‐mass ratio extends widely from 103 to 104 Ckg−1, corre-sponding to 1 to 15 electric charges. About 90% of them
reach ejection speed between 75 and 125 kms−1. Moreimportant, the Qd/md − vex contour fits to the backwardsimulation results (Figure 3e) very well. Note that these twomethods are entirely independent. The backward tracingresults are derived from the observations in the interplane-tary space, i.e., stream‐particle–solar wind interaction,whereas the ejection model is based on the magnetosphericplasma measurements.[80] Furthermore, even though these grains start from 5 to
6 RS, the simulated “ejection region” showed in Figure 10bis located at the vicinity of Rhea’s orbit, the same as thebackward tracing result (Figure 3f). Therefore we confirmthat the derived “ejection region” actually reflects thecombined dynamical effects from the plasma configurationin Saturn’s magnetosphere, the grain properties, and thecharging process.[81] The inclination distribution (Figure 10c) shows that
most particles are ejected along the ring plane, which agreeswith the CDA observations. Figure 10d shows the ejectiontime distributions of 3 nm particles with different compo-sitions. About 80% of silicateous grains are ejected in thefirst five days after the starting of simulation, in contrast theejected percentage of icy grains in the same timescale isonly 42%. The shorter ejection time of nanoscale silicateparticles implies that the ejection process is a more effectivemechanism to remove them from the system, most likelydue to the higher dM. About 50% of icy grains are stillbound in the magnetosphere after 20 days and are expectedto be further sputtered down.[82] In Figure 11 we plot the ejection model results on to
the Qd /md − vex contour obtained from backward simula-tions (Figure 3c) in order to compare the dynamical prop-erties between different grain materials. On top of that,Chow et al. [1993] had shown that the secondary electronyield of nanodust grains could be largely enhanced. Thestream‐particle observations then provide an opportunity toexamine their hypothesis. Accounting for the proposed yieldenhancement due to their small sizes, we simply double themaximum yield by a factor of 2 regardless of the incidentelectron energy and grain sizes.[83] In general, the four parameter sets shown in Figure 11
fit well with the “solution belt” from backward simulations.The consistence between results of two independent approa-ches (forward and backward methods) provides confirmationfor both methods and the dynamically ‐old stream particlescenario. The Qd/md and vex derived from different parametersare fitted by a power law function vex = a · (Qd/md)
b. Theparameters a and b are listed in Table 4. For particles withthe same size, the lower density (i.e., the icy type) and thehigher secondary electron yield lead to slightly larger ejectionvelocity and charge‐to‐mass ratio. Except that, there is nosignificant difference between results of four parameter setsregarding the dynamical properties. The maximal Qd /md andvex derived are about 20000 Ckg−1 and 180 kms−1 (2 nmwater ice grains with doubled dM).[84] Figure 12 shows the ratio between the ejection time
(the median value) and the estimated sputtering lifetime as afunction of particle radius and the starting location. Plasmasputtering has great influence on the evolution of E ring dustgrains [Jurac et al., 2001; Horányi et al., 2008; Johnsonet al., 2008]. The fate of nanoparticles in the E ring is hencedetermined by two competing processes: the ejection pro-
Figure 9. The evolution path of a 3 nm silicateous grain.The particle starts from 5.5 RS and charged ∼−1 V with aslightly inclined (∼3°) and elliptic orbit. (a) The particle tra-jectory in the r‐z plane. The electric polarity is shown bydifferent colors: negative and neutral, black; positive, gray.The ring plane of Saturn is marked by the horizontal grayline. (b) The charges, the distance to the planet, and thevelocity of this particle are plotted with respect to time.The periods when the particle is charged positively aremarked by vertical dotted lines. Notice the changes of par-ticle velocity during the positive charge epochs.
HSU ET AL.: DUST‐MAGNETOSPHERE INTERACTION AT SATURN A09215A09215
16 of 23

cess and the plasma sputtering erosion. The ratio betweenthese two timescales serves as an index of the relativeimportance of the mechanisms as well as the index of theparticles’ destiny. If the ratio reaches unity (marked by thedark grey dashed line) the sputtering effect dominates,otherwise these particles are likely to be ejected. The sput-tering lifetime used here is extrapolated from Jurac et al.[2001] and is only a rough estimation based on tsp = 50 ×(sd [nm]/1000) for water ice particles. Studies have shownthat the sputtering rate of water ice is at least ten timeshigher than those of silicate [Tielens et al., 1994; Guilletet al., 2009]. In the dense part of the E ring (4 to 5 RS)where the ion temperature as well as the plasma flow speedare low, the difference can even reach a factor of 100. Herewe conservatively choose tsp for silicate being ten timeslonger than water ice. Note that the reduction of grain sizesdue to sputtering was not considered in our ejection model(i.e., grain sizes keep constant in the calculation), therefore
Figure 12 should be seen as a relative rather than an absoluteresult.[85] Figure 12a shows the ejection‐to‐erosion timescale
ratio for simulations started near the “ejection region”. Withlow secondary electron yield the water ice particles are lesseffective to be ejected. The ejection probabilities for bothmaterials increase significantly with the enhanced yield.However, comparing with icy particles, SiO2 particles aremore likely to be ejected as stream particles, with or withoutthe secondary electron yield enhancement.[86] Figure 12b shows the same parameter sets as in
Figure 12a but with the starting location shifted 1 RS pla-netward (between 4 to 4.5 RS). In Figure 12b, the ratiobetween the ejection time and the sputtering lifetime isgenerally closer to unity, i.e., the ejection process is lessefficient for particles from the inner region. Compared toSiO2 particles, icy nanoparticles are mostly consumed by theplasma sputtering. On top of that, smaller icy particles tend
Figure 10. The statistics of dynamical properties from ∼10000 simulated 3 nm silicateous particles.(a) The charge‐to‐mass ratio‐ejection velocity distributions. The bin size of charge‐to‐mass ratio histo-gram represents one electric charge difference. The grid used in the contour is the same as those infigure 3e. The most probable charge‐to‐mass ratio, average ejection velocity, and their standard devia-tion are also given. (b) The ejection region calculated based on simulation results and equation (5).(c) Distribution of inclinations of the ejection velocity vector. (d) The ejection time of 3 nmd particleswith different compositions. It is clear that silicateous particles (black solid line) are ejected more effi-ciently than water ice ones (gray dashed line). Note that there is no dM enhancement in this plot.
HSU ET AL.: DUST‐MAGNETOSPHERE INTERACTION AT SATURN A09215A09215
17 of 23

to be dominated by sputtering than bigger ones. Eventhough our code does not include the size‐decreasing effect,qualitatively speaking, the erosion of icy nanoparticles in theE ring behaves like a runaway process: the smaller the grainis, the less probable they are to be ejected.
6. Discussion
6.1. The Source
[87] So far, we have shown the dynamical fingerprint ofstream particles based on the backward tracing simulations.With an updated composition analysis we confirmed thatmost Saturnian stream particles are composed of silicateousmaterial. Motivated by these results, the ejection modeldemonstrates that the stream particle ejection is shaped bynot only the plasma/charging conditions but also the mate-rial properties. The results suggest that icy nanoparticlessuffer greatly from the plasma sputtering erosion while thesilicateous particles have higher chances to survive and to beejected as stream particles.[88] This result explains many observation facts. First, the
modeled dynamical properties fit nicely to the backwardsimulation result. It also agrees with previous estimations[Hsu et al., 2010a, 2010b] and the CDA impact signals[Kempf et al., 2005a]. Secondly, using equation (5)), the“ejection region” profile derived from the backward simu-lation is successfully reproduced. This suggests that the
“ejection region” is a combined effect of the chargingcondition profile, grain properties, and the location of thetrue source. Last but not least, our result shows that, com-pared to water ice nanoparticles, silicateous particles aremore likely to be ejected from the system. This agrees withthe mass spectra analysis and explains the compositionaldiscrepancy between the ice‐rich system and the silicateousstream particles. However, the question remains. Where isthe actual source of Saturnian stream particles?
Figure 11. Comparison of backward simulation and ejec-tion model results. The dynamical properties derived fromthe ejection model, as listed in Table 4, are plotted on topof the backward simulation result (background contour, thesame as Figure 3c).
Table 4. Qd/md and vex Derived From the Ejection Model forDifferent Grain Parameters Fitted by a Power Law, vex = a · (Qd /md)
b
a b
SiO2, dM = 3.9 1.34 0.50SiO2, dM = 7.8 1.59 0.49H2O, dM = 2.3 0.52 0.60H2O, dM = 4.6 1.65 0.48
Figure 12. The ratio between the ejection time (the medianvalue) and the estimated sputtering lifetime as function ofparticle radius. Particles with smaller secondary electronyield are more difficult to be ejected. The sputtering lifetimefor SiO2 particles is assumed to be ten times longer than forwater ice particles’. Results of particles started from differentradial distance are shown: (a) 5 to 6 RS and (b) 4 to 4.5 RS.The ratio of the particle ejection time and the lifetime is closerto unity in Figure 12b than in Figure 12a, which suggests thatnanoparticles are more likely to be ejected from the “ejectionregion” than from the core of the E ring.
HSU ET AL.: DUST‐MAGNETOSPHERE INTERACTION AT SATURN A09215A09215
18 of 23

[89] From the composition aspect, the source of streamparticles must be able to provide the observed particleconstituents. The water ice, found in few percent of streamparticle mass spectra, is likely contributed from all threeaforementioned sources (the main rings, nanodust in Ence-ladus’ plume, and E ring particles). However, the dynamicalsimulation results shown in Figure 12 suggest that it is hardfor icy nanoparticles at the inner magnetosphere to survivethe plasma sputtering. Nanoparticles detected at the vicinityof Enceladus [Jones et al., 2009] are expected to consist ofwater ice and thus are likely to be eroded rather than beingejected. The same argument applies to particles from themain ring since they are located further inward and arecomposed mostly of water ice. Though the stochastic chargevariation provides a mechanism for nanoparticles to tunnelthrough the negative charged region (which means that theequilibrium potential of the source location is less deter-minant than previously thought), the influence of the neg-ative charge polarity is yet not ignorable since it prolongsthe duration of particles staying in the negative chargedregion. As this region coincides with the location where themaximum plasma sputtering effect takes place, it conse-quently amplifies the erosion of tiny particles.[90] To shield and transport nanoparticles from the inner
negative charging region to the outer “ejection region”, Ering particles can serve as an effective carrier. Originatingfrom Enceladus, E ring grains interact and distribute them-selves in the magnetosphere. During their outward coursepowered by the plasma drag, part of their mass is lost due tothe plasma sputtering. As mentioned earlier, their dynamicsis also affected by the charging profile, which causes thedust confinement at the inner magnetosphere and conse-quently enhances the plasma sputtering, as suggested by S.Kempf et al. (manuscript in preparation, 2011). Thereforewe suggest that Saturnian stream particles are most likelyplasma‐altered, dynamically old particles rather than freshlyproduced nanoparticles. Following results from thedynamical simulation, we propose silicateous impuritiesreleased in the outer E ring as the main source of Saturnianstream particles. Presuming that a certain number of E ringgrains contain tiny amounts of silicateous material, afterleaving Enceladus’ plume into the E ring, the icy material isconstantly eroded by plasma sputtering whereas theembedded silicateous parts keep intact. As the icy componentsurrounds these silicateous “raisins” is eroded, sputtering‐resistant component will eventually be released from thelarger E ring grains and start their own dynamical evolutionsas described by our ejection model. While Enceladus hasbeen found to be the dominant source of E ring dust grains[Spahn et al., 2006], the ultimate source of Saturnian streamparticles should also be Enceladus. Further details will bepresented in F. Postberg et al. (manuscript in preparation,2011).
6.2. Lower Size Limit
[91] With the presence of a magnetic field, chargeddust particles with large charge‐to‐mass ratio (i.e., smallgyroradii) mimic plasma particles, whose motion can bedescribed by the guiding center approximation, and thus aretrapped by the magnetic field. This condition can be exam-ined by the Alfven criterion [Alfvén and Fälthammar, 1963;
Morfill et al., 1980] and gives the theoretical lower sizelimit of ejected stream particles:
rg � rB
B
< 0:1 ð16Þ
where rg is the particle gyroradius. As rg / (Qd/md)−1 / sd
2,with the same charging potential and magnetic field, smallerparticles move “adiabatically” and are trapped along thefield line whereas particles too large to fulfill the Alfvencriterion can drift across the magnetic field because of theirlarge gyroradii. Assuming a dipolar magnetic field, outsidethe synchronous orbit (1.86 RS), equation (16) becomes
s2d <�0�dB0
10%dWL31�
ffiffiffiffiffiffiffiffiffiffiGMs
W2r3s
s !�1
ð17Þ
where L = rs/RS is the location of the particle at the equa-torial plane in unit of RS. Taking �d ∼ 2 V, equation (17)indicates that the smallest icy particles ejected are below1 nm at 8 RS and are about 2 nm at 4 RS. This generallyagrees with simulation results shown in Figure 11. Sincebackward simulation results show a decreasing likelihoodtoward higher Qd/md and vex we suggest that the detectedSaturnian stream particles are ^2 nm in radius.[92] Arridge et al. [2008] have reported that, depending
on the local time and the solar wind dynamic pressure themagnetic field of Saturn at the middle‐to‐outer magneto-sphere may be stretched from a quasi‐dipolar configurationinto a magnetodisc. Within the current sheet‐like magneticfield, rB in equation (16) decreases and thus raises thelower size limit. In other words, the lower size cut ofSaturnian stream particles in theory provides constraints onthe particle ejection longitude and the degree of compressionof the magnetosphere.
6.3. Charging of Nanoparticles
6.3.1. Secondary Electron Emission[93] In addition to the sputtering, the enhancement of the
secondary electron yield, as proposed by Chow et al. [1993],does have influence on our simulation results. First, particleswith higher dM are ejected with higher Qd/md and vex.Second, higher dM particles are ejected more easily(Figure 10d). From the dynamical point of view, the polarityflip of the dust grain potential profile must be located nearthe “ejection region” indicated by the backward tracingresults (Figure 3f). For grains with larger secondary electronyield, the potential turning point shifts planetward andresults in “ejection region” distance �8 RS. Therefore, ourresults agree with the moderate enhancement of secondaryelectron emission yield for tiny dust grains (e.g., ∼2 times ofthose measured from laboratory flat targets, regardless of theincident electron energy and grain sizes).6.3.2. Stochastic Charging and Its Dynamical Effect[94] Compared to micron‐sized dust grains, nanoparticles
only carried little amount of electric charges. The stochasticcharge variation consequently have a significant effect ontheir dynamics. As shown in Figures 8 and 9, even in anegative charging environment, silicateous nanoparticlescan temporarily reach positive surface potential and initiatethe outward orbital evolution. Spahn et al. [2003] haveshown that the perturbation from fluctuating planetary
HSU ET AL.: DUST‐MAGNETOSPHERE INTERACTION AT SATURN A09215A09215
19 of 23

magnetic field is capable to produce dispersions on orbitalinclinations and eccentricities for micron sized grains. Theauthors also claimed that the stochastic variations mighteven dominate the dynamics of tiny dust grains. In ourstudy, the stochastic charging variation acts as a diffusionmechanism and, as predicted, eventually governs thedynamical evolution of nanometer‐sized dust grains.6.3.3. Field Emission and Coulomb Explosion[95] One of the charging processes not included in our
model is the field emission. The field emission is caused bythe stronger electric field developed on a charged surface.The field emission draws limits on the surface potential ofdust particles regardless of the plasma environment. Beforereaching the field emission limit, the charges carried on adust particle may result in a strong electrostatic force that ispowerful enough to disrupt the particle, the so‐called the“Coulomb explosion”. The Coulomb explosion depends onthe size, the surface potential, and the material tensilestrength. Following Rhee [1976] and Mendis [1991], thecritical radius (ac, in mm) as a function of potential (�) andthe tensile strength (Ft, in dyne/cm2) is
ac ¼ 9:4 � �j j � F�1=2t : ð18Þ
[96] Considering only the Coulomb explosion, equation (18)and Table 3 imply that icy particles must be bigger than15 nm to survive the −5 V potential, while SiO2 particleswill reach first the electron field emission limit before dis-ruption by the Coulomb force. However, in the microscopicscale, materials behave differently and their tensile strengthmay reach 1010 dyne/cm2, i.e., comparable to the electronfield emission limit. As releasing ions requires a strongerelectric field, with a positive potential the ion field emissionlimit may not be reached before the electric field breaks theparticle apart. Because the tensile strength for nanoparticlesis unknown, it is hard to judge the importance of Coulombexplosion. We can only speculate that nanoparticles inSaturn’s magnetosphere most likely survive the negativepotential but their charges may be limited by the electronfield emission. However, in two interesting/extreme casesthe Coulomb explosion is certainly important.[97] As mentioned earlier, the RPWS observation shows
that the spacecraft potential can reach −20 V between 7 and9 RS. If nanoparticles follow the same potential, particlessmaller than 2 nm may not survive the Coulomb explosion.An opposite condition may take place in the flux tube of hot,tenuous plasma associated with interchange (between 5 to10 RS) [Hill et al., 2005]. In this case, particles will acquirehigh positive potential. Smaller particles will also be elim-inated whereas bigger particles can gain additional energy tobe ejected as stream particles.
6.4. Implications on the Magnetosphere of Saturn
[98] The existence of Saturnian stream particles togetherwith their composition confirms the idea that the plasmasputtering dominates the mass loss of E ring dust grains, asproposed by Jurac et al. [2001] and Johnson et al. [2008].After being ejected from Enceladus’ plume, E ring particlesbehave as mass‐transporting vehicles that redistributeEnceladus’ material to the whole magnetosphere. Besidesthe main ion sputtering product: H2O, O2 is also possible tobe generated by thermal electrons (energy <100 eV [Sieger
et al., 1998]) from E ring grains. Following the ionizationand dissociation processes, these neutral molecules then aretransformed into other neutral species (OH and O) or ions(H2O
+, OH+, O+, H+, O2+, .etc). Therefore, the mobile E ring
grains serve as an extended source that provide neutrals andplasma in the middle‐to‐outer magnetosphere.[99] Recently reported atomic oxygen emission observed
by the Cassini UVIS showed that the line‐of‐sight intensityoutside of 10 RS is about 30% of the maximum intensitylocated at 4 RS [Melin et al., 2009]. By taking neutral‐neutral scattering [Farmer, 2009] and other effects, such ascharge exchange, into account, the observed broad neutralcloud can be simulated with a single source at the orbit ofEnceladus [Cassidy and Johnson, 2010]. Compared to theplume of Enceladus, sputtering of E ring grains contributesfar less to Saturn’s neutral cloud at the inner magnetosphere.However, as E ring extends outward until Titan’s orbit, thedissociated products from the sputtered E ring grains maybecome a more important local source at the middle‐to‐outer magnetosphere, where the neutrals cannot be trans-ported to.[100] Another interesting plasma component is the O2
+
population. Molecule oxygen is known to form predomi-nantly from the radiolytic decomposition of ice rather thangas phase reactions. After being ionized, O2
+ in the magne-tosphere can therefore be a tracer of radiolysis of icy surfaces[Mauk et al., 2009]. Based on Cassini CAPS measurements,Martens et al. [2008] showed that the abundance ratiobetween O2
+ and water group ions is about 0.3% inside 8 RS
and increases significantly between 8 to 10 RS with a diparound Rhea’s orbit. Probable sources of O2 are E ringparticles, Rhea and its tentative ring as proposed byMartenset al. [2008], and the main rings [Tseng et al., 2010].Considering the location of the rising O2
+/W+ feature and thesurface area of Rhea, Martens et al. [2008] suggested thatO2 molecules produced from the surface of Rhea and itstentative rings are the source of observed O2
+.[101] However, only a fraction of O2 molecules produced
on the surface of Rhea can escape into the magnetosphere,the rest are trapped by the moon’s gravitational field (whichis the reason of O2 being the main constituent of Europa andGanymede’s tenuous atmosphere). In contrast, O2 producedfrom the E ring grain surface are released freely into themagnetosphere. Furthermore, outside the dense Enceladusneutral torus, the temperature of thermal electron rises withincreasing distance (see Schippers et al. [2008] and Figure 6)and reaches the O2 production threshold of 10 ± 2 eV[Orlando and Sieger, 2003] at around 8 to 10 RS, whichcoincides with the rising O2
+/W+ feature. Therefore, wesuggest that the O2 produced from the electron–E ringparticle interaction also contributes as a local extendedsource. Estimating the E ring contribution to the magneto-spheric neutral/plasma is beyond the scope of this paper. It isclearly necessary to adopt in situ E ring measurements and/or dynamical simulations into sputtering calculations tounderstand the sources and sinks of plasma and neutrals inSaturn’s magnetosphere.
7. Summary
[102] In this work we have analyzed the CDA Saturnianstream particle measurements during 2004 and early 2005.
HSU ET AL.: DUST‐MAGNETOSPHERE INTERACTION AT SATURN A09215A09215
20 of 23

Since these particles are outside the instrument’s calibrationrange, we performed backward tracing simulations within‐situ Cassini solar wind and dust measurements to derivetheir dynamical properties. Combining an ejection model,based on Cassini magnetospheric plasma measurements, andthe compositional analysis, we reconstruct the evolution pathof stream particles in Saturn’s magnetosphere that providesinsights to the physical/chemical interactions between E ringdust grains and the magnetosphere. Results and implicationsfrom this work are summarized as following:[103] 1. The ejection velocities of Saturnian stream
particles range from 50 to 200 kms−1. Their charge‐to‐ massratios range from 1000 to 20000 Ckg−1, which correspondsto a radius of 2 to 8 nm assuming +5 V potential and densityof 2300 kgm−3 (Figure 3). The derived most probable“ejection region” (Figure 3h) is located between Dione andRhea’s orbits and is indicative of dust charging profile andits influence on stream particles’ dynamics.[104] 2. The updated analysis of CDA mass spectra
confirms that silicateous material is a major compound ofstream particles (Table 1) as suggested by Kempf et al.[2005b]. Water ice rich particles are only in agreementwith a few percent of spectra. The dominance of silicateouscomponents in most stream particles also supports the ideaof sputtering being the main loss mechanism of icy E ringdust grains as suggested by Jurac et al. [2001] and Johnsonet al. [2008].[105] 3. Utilizing the Cassini plasma measurements, the
stream particle ejection model well reproduces the dynam-ical properties derived from the backward simulations(Figure 11 and Table 4). The differences in secondaryelectron yield and plasma sputtering resistance betweenwater ice and silicateous material result in a compositionalselection mechanism which determines the dynamical evo-lution and leads to the observed compositional discrepancy.We suggest that Saturnian stream particles are silicateousimpurities released from ice grains in the outer E ring andthe ultimate source is Enceladus (F. Postberg et al., manu-script in preparation, 2011).[106] 4. The stochastic charge variation provides a diffu-
sion mechanism for nanometer sized particles, whichweakens the dominance of the charging environment. Thiseffect governs their dynamical evolution and results in theejection of Saturnian stream particles.[107] 5. The influence of secondary electron yield
enhancement due to tiny grain sizes as proposed by Chowet al. [1993] has been evaluated in our ejection model. Byincreasing the yield by a factor of two, the modeled stream‐particle dynamical properties still fit to the backward tracingresults (Figure 11).[108] 6. Due to the large extension of the E ring, the
neutrals and plasma contributed from dust particles viaplasma–icy surface processes need to be considered in orderto understand the mass budget and the dust‐neutral‐plasmainteractions in Saturn’s magnetosphere (e.g., the extendedatomic oxygen UV emission and the O2
+/W+ ratio).[109] 7. Future study of Saturnian stream particles should
seek for longitudinal and temporal variations and theirimplications. With recently developed knowledge andmethods, the interaction between Jovian dust stream parti-cles and Jupiter’s magnetosphere should be revisited tosupport the EJSM mission.
[110] Acknowledgments. This project is supported by the DFGunder the grant KE 1384/1‐1 at the Max‐Planck Institut für Kernphysik.We acknowledge fruitful discussions with J. Schmidt on the chargingprocess. We thank M. E. Hill, who graciously provided us with the solarwind speed data. We also acknowledge anonymous referees for thevaluable comments. H.‐W.H. thanks his family and Chun‐Yu. M.T.and F.P. acknowledge support from the Priority Programme 1385 “The first10 million years of the solar system—a planetary materials approach”funded by Deutsche Forschungsgemeinschaft.[111] Philippa Browning thanks Christopher Arridge and another
reviewer for their assistance in evaluating this paper.
ReferencesAlfvén, H., and C. G. Fälthammar (1963), Cosmical Electrodynamics,Fundamental Principles, 2nd ed., Oxford Univ. Press, New York.
Arridge, C. S., C. T. Russell, K. K. Khurana, N. Achilleos, S. W. H. Cowley,M. K. Dougherty, D. J. Southwood, and E. J. Bunce (2008), Saturn’s mag-netodisc current sheet, J. Geophys. Res., 113, A04214, doi:10.1029/2007JA012540.
Beckmann, U. (2008), Dynamik von Staubteilchen in Saturns E‐Ring, Ph.D.thesis, Ruprecht‐Karls‐Univ. Heidelberg, Heidelberg, Germany.
Cassidy, T. A., and R. E. Johnson (2010), Collisional spreading ofEnceladus’ neutral cloud, Icarus, 209, 696–703, doi:10.1016/j.icarus.2010.04.010.
Chow, V., D. Mendis, and M. Rosenberg (1993), Role of grain size andparticle velocity distribution in secondary electron emission in spaceplasmas, J. Geophys. Res., 98, 19,065–19,076.
Cui, C., and J. Goree (1994), Fluctuations of the charge on a dust grain in aplasma, IEEE Trans. Plasma Sci., 22, 151–158, doi:10.1109/27.279018.
Delamere, P. A., A. Steffl, and F. Bagenal (2004), Modeling temporalvariability of plasma conditions in the Io torus during the Cassini era,J. Geophys. Res., 109, A10216, doi:10.1029/2003JA010354.
Delamere, P. A., F. Bagenal, V. Dols, and L. C. Ray (2007), Saturn’s neutraltorus versus Jupiter’s plasma torus, Geophys. Res. Lett., 34, L09105,doi:10.1029/2007GL029437.
Desch, M. D., and M. L. Kaiser (1981), Voyager measurement of therotation period of Saturn’s magnetic field, Geophys. Res. Lett., 8,253–256, doi:10.1029/GL008i003p00253.
Farmer, A. J. (2009), Saturn in hot water: Viscous evolution of theEnceladus torus, Icarus, 202, 280–286, doi:10.1016/j.icarus.2009.02.031.
Gazis, P. R., et al. (1999), Corotating interaction regions in the outer heli-osphere, Space Sci. Rev., 89, 269–305, doi:10.1023/A:1005270027347.
Goertz, C. K., and W. Ip (1984), Limitation of electrostatic charging of dustparticles in a plasma, Geophys. Res. Lett., 11, 349–352, doi:10.1029/GL011i004p00349.
Gold, L. W. (1977), Engineering properties of fresh‐water ice, J. Glaciol.,19(81), 197–212.
Graps, A., E. Grün, H. Svedhem, H. Krüger, M. Horányi, A. Heck, andS. Lammers (2000), Io as a source of the Jovian dust streams, Nature,405, 48–50.
Grimm, M., B. Langer, S. Schlemmer, T. Lischke, U. Becker, W. Widdra,D. Gerlich, R. Flesch, and E. Rühl (2006), Charging mechanisms oftrapped element‐selectively excited nanoparticles exposed to soft X rays,Phys. Rev. Lett., 96(6), 066,801, doi:10.1103/PhysRevLett.96.066801.
Grün, E., et al. (1993), Discovery of Jovian dust streams and interstellargrains by the Ulysses spacecraft, Nature, 362, 428–430.
Grün, E., et al. (1998), Galileo observes electromagnetically coupled dustin the Jovian magnetosphere, J. Geophys. Res., 103, 20,011–20,022.
Grün, E., S. Kempf, H. Krüger, M. Landgraf, and R. Srama (2001), Dustastronomy: A new approach to the study of interstellar dust, in Proceed-ings of the Meteoroids 2001 Conference, 6–10 August 2001, Kiruna,Sweden, edited by B. Warmbein, Eur. Space Agency Spec. Publ., ESASP‐495, 651–662.
Guillet, V., A. P. Jones, and G. Pineau Des Forêts (2009), Shocks indense clouds. II. Dust destruction and SiO formation in J shocks, Astron.Astrophys., 497, 145–153, doi:10.1051/0004-6361/200811115.
Gurnett, D. A., A. M. Persoon, W. S. Kurth, J. B. Groene, T. F. Averkamp,M. K. Dougherty, and D. J. Southwood (2007), The variable rotationperiod of the inner region of Saturn’s plasma disk, Science, 316,442–445, doi:10.1126/science.1138562.
Hamilton, D., and J. Burns (1993), Ejection of dust from Jupiter’s gossamerring, Nature, 364, 695–699.
Hansen, C. J., L. Esposito, A. I. F. Stewart, J. Colwell, A. Hendrix, W. Pryor,D. Shemansky, and R. West (2006), Enceladus’ water vapor plume,Science, 311, 1422–1425, doi:10.1126/science.1121254.
Havnes, O., T. K. Aanesen, and F. Melandso (1990), On dust charges andplasma potentials in a dusty plasma with dust size distribution, J. Geophys.Res., 95, 6581–6585, doi:10.1029/JA095iA05p06581.
HSU ET AL.: DUST‐MAGNETOSPHERE INTERACTION AT SATURN A09215A09215
21 of 23

Hill, M. E., D. C. Hamilton, G. Gloeckler, S.M. Krimigis, and D. G.Mitchell(2004), Near‐Saturn solar wind speeds determined from MIMI/CHEMSmeasurements of pickup ion spectra at the Cassini spacecraft, Eos Trans.AGU, 85(47), Fall Meet. Suppl., Abstract P51A‐1412.
Hill, T. W., A. M. Rymer, J. L. Burch, F. J. Crary, D. T. Young,M. F. Thomsen, D. Delapp, N. André, A. J. Coates, and G. R. Lewis (2005),Evidence for rotationally driven plasma transport in Saturn’s magneto-sphere, Geophys. Res. Lett., 32, L14S10, doi:10.1029/2005GL022620.
Hillier, J. K., S. F. Green, N. McBride, J. P. Schwanethal, F. Postberg,R. Srama, S. Kempf, G. Moragas‐Klostermeyer, J. A. M. McDonnell,and E. Grün (2007), The composition of Saturn’s E ring, Mon. Not. R.Astron. Soc., 377, 1588–1596, doi:10.1111/j.1365-2966.2007.11710.x.
Horányi, M. (1996), Charged dust dynamics in the solar system, Annu. Rev.Astrophys., 34, 383–418, doi:10.1146/annurev.astro.34.1.383.
Horányi, M. (2000), Dust streams from Jupiter and Saturn, Phys. Plasmas,7(10), 3847–3850.
Horányi, M., J. Burns, and D. Hamilton (1992), The dynamics of Saturn’s Ering particles, Icarus, 97, 248–259, doi:10.1016/0019-1035(92)90131-P.
Horányi, M., E. Grün, and A. Heck (1997), Modeling the Galileo dust mea-surements at Jupiter, Geophys. Res. Lett., 24, 2175–2178, doi:10.1029/97GL01539.
Horányi, M., A. Juhász, and G. E. Morfill (2008), Large‐scale structure ofSaturn’s E‐ring, Geophys. Res. Lett., 35, L04203, doi:10.1029/2007GL032726.
Hsu, H., S. Kempf, F. Postberg, R. Srama, C. M. Jackman, G. Moragas‐Klostermeyer, S. Helfert, and E. Grün (2010a), Interaction of the solarwind and stream particles, results from the Cassini dust detector, AIPConf. Proc., 1216, 510–513, doi:10.1063/1.3395914.
Hsu, H., S. Kempf, and C. M. Jackman (2010b), Observation of Saturnianstream particles in the interplanetary space, Icarus, 206, 653–661,doi:10.1016/j.icarus.2009.06.033.
Hsu, H.‐W., S. Kempf, F. Postberg, M. Trieloff, M. Burton, M. Roy,G. Moragas‐Klostermeyer, and R. Srama (2011), Cassini dust stream par-ticle measurements during the first three orbits at Saturn, J. Geophys. Res.,116, A08213, doi:10.1029/2010JA015959.
Ip, W. (1997), On the neutral cloud distribution in the Saturnian magneto-sphere, Icarus, 126, 42–57, doi:10.1006/icar.1996.5618.
Jackman, C.M., N. Achilleos, E. J. Bunce, S.W.H. Cowley,M.K.Dougherty,G. H. Jones, S. E. Milan, and E. J. Smith (2004), Interplanetary magneticfield at ∼9 AU during the declining phase of the solar cycle and its implica-tions for Saturn’s magnetospheric dynamics, J. Geophys. Res., 109,A11203, doi:10.1029/2004JA010614.
Jackman, C. M., N. Achilleos, E. J. Bunce, S. W. H. Cowley, and S. E. Milan(2005), Structure of the interplanetary magnetic field during the intervalspanning the first Cassini fly‐through of Saturn’s magnetosphere and itsimplications for Saturn’s magnetospheric dynamics, Adv. Space Res.,36, 2120–2126, doi:10.1016/j.asr.2004.12.023.
Jackman, C. M., R. J. Forsyth, and M. K. Dougherty (2008), The overallconfiguration of the interplanetary magnetic field upstream of Saturn asrevealed by Cassini observations, J. Geophys. Res., 113, A08114,doi:10.1029/2008JA013083.
Johnson, R. E., M. Famá, M. Liu, R. A. Baragiola, E. C. Sittler, andH. T. Smith (2008), Sputtering of ice grains and icy satellites in Saturn’sinner magnetosphere, Planet. Space Sci., 56, 1238–1243, doi:10.1016/j.pss.2008.04.003.
Jones, G. H., et al. (2009), Fine jet structure of electrically charged grains inEnceladus’ plume, Geophys. Res. Lett., 36, L16204, doi:10.1029/2009GL038284.
Jurac, S., R. E. Johnson, and J. D. Richardson (2001), Saturn’s E ring andproduction of the neutral torus, Icarus, 149, 384–396, doi:10.1006/icar.2000.6528.
Jurac, S., M. A.McGrath, R. E. Johnson, J. D. Richardson, V.M.Vasyliunas,and A. Eviatar (2002), Saturn: Search for a missing water source,Geophys.Res. Lett., 29(24), 2172, doi:10.1029/2002GL015855.
Kanaya, K., S. Ono, and F. Ishigaki (1978), Secondary electron emissionfrom insulators, J. Phys. D Appl. Phys., 11, 2425–2437, doi:10.1088/0022-3727/11/17/015.
Kane, M., D. G. Mitchell, J. F. Carbary, S. M. Krimigis, and F. J. Crary(2008), Plasma convection in Saturn’s outer magnetosphere determinedfrom ions detected by the Cassini INCA experiment, Geophys. Res. Lett.,35, L04102, doi:10.1029/2007GL032342.
Kempf, S., R. Srama, M. Horányi, M. Burton, S. Helfert, G. Moragas‐Klostermeyer, M. Roy, and E. Grün (2005a), High‐velocity streamsof dust originating from Saturn, Nature, 433, 289–291.
Kempf, S., et al. (2005b), Composition of Saturnian stream particles,Science, 307, 1274–1276.
Kempf, S., U. Beckmann, R. Srama, M. Horanyi, S. Auer, and E. Grün(2006), The electrostatic potential of E ring particles, Planet. SpaceSci., 54, 999–1006, doi:10.1016/j.pss.2006.05.012.
Krüger, H., M. Horányi, and E. Grün (2003a), Jovian dust streams: Probesof the Io plasma torus, Geophys. Res. Lett., 30(2), 1058, doi:10.1029/2002GL015920.
Krüger, H., P. Geissler, M. Horányi, A. Graps, S. Kempf, R. Srama,G. Moragas‐Klostermeyer, R. Moissl, T. Johnson, and E. Grün (2003b),Jovian dust streams: A monitor of Io’s volcanic plume activity, Geophys.Res. Lett., 30(21), 2101, doi:10.1029/2003GL017827.
Martens, H. R., D. B. Reisenfeld, J. D. Williams, R. E. Johnson, andH. T. Smith (2008), Observations of molecular oxygen ions in Saturn’sinner magnetosphere, Geophys. Res. Lett., 35, L20103, doi:10.1029/2008GL035433.
Mauk, B. H., et al. (2009), Fundamental plasma processes in Saturn’smagnetosphere, in Saturn From Cassini–Huygens, edited by M. K.Dougherty, L. W. Esposito, and S. M. Krimigis, pp. 281–331, Springer,Dordrecht, Netherlands, doi:10.1007/978-1-4020-9217-6_11.
Melin, H., D. E. Shemansky, and X. Liu (2009), The distribution of atomichydrogen and oxygen in the magnetosphere of Saturn, Planet. Space Sci.,57, 1743–1753, doi:10.1016/j.pss.2009.04.014.
Mendis, D. A. (1991), The role of field emission in the electrostatic disrup-tion of cosmic dust, Astrophys. Space Sci., 176, 163–167, doi:10.1007/BF00643087.
Meyer‐Vernet, N. (1982), “Flip‐flop” of electric potential of dust grains inspace, Astron. Astrophys., 105, 98–106.
Moncuquet, M., A. Lecacheux, N. Meyer‐Vernet, B. Cecconi, and W. S.Kurth (2005), Quasi thermal noise spectroscopy in the inner magneto-sphere of Saturn with Cassini/RPWS: Electron temperatures and density,Geophys. Res. Lett., 32, L20S02, doi:10.1029/2005GL022508.
Morfill, G. E., E. Grün, and T. V. Johnson (1980), Dust in Jupiter’s mag-netosphere: Physical processes, Planet. Space Sci., 28, 1087–1100,doi:10.1016/0032-0633(80)90067-7.
Morooka, M. W., et al. (2009), The electron density of Saturn’s magneto-sphere, Ann. Geophys., 27, 2971–2991.
Mott‐Smith, H. M., and I. Langmuir (1926), The theory of collectors ingaseous Ddscharges, Phys. Rev., 28, 727–763, doi:10.1103/PhysRev.28.727.
Orlando, T., and M. T. Sieger (2003), The role of electron‐stimulated pro-duction of O2 from water ice in the radiation processing of outer solarsystem surfaces, Surf. Sci., 528, 1–7, doi:10.1016/S0039-6028(02)02602-X.
Persoon, A. M., D. A. Gurnett, W. S. Kurth, and J. B. Groene (2006), Asimple scale height model of the electron density in Saturn’s plasma disk,Geophys. Res. Lett., 33, L18106, doi:10.1029/2006GL027090.
Persoon, A. M., et al. (2009), A diffusive equilibrium model for the plasmadensity in Saturn’s magnetosphere, J. Geophys. Res., 114, A04211,doi:10.1029/2008JA013912.
Pilcher, C. B., C. R. Chapman, L. A. Lebofsky, and H. H. Kieffer (1970),Saturn’s rings: Identification of water frost, Science, 167, 1372–1373,doi:10.1126/science.167.3923.1372.
Pontius, D. H., and T. W. Hill (2009), Plasma mass loading from theextended neutral gas torus of Enceladus as inferred from the observedplasma corotation lag, Geophys. Res. Lett., 36, L23103, doi:10.1029/2009GL041030.
Porco, C. C., et al. (2006), Cassini observes the active south pole ofEnceladus, Science, 311, 1393–1401, doi:10.1126/science.1123013.
Postberg, F., S. Kempf, R. Srama, S. F. Green, J. K. Hillier, N. McBride,and E. Grün (2006), Composition of Jovian dust stream particles, Icarus,183, 122–134, doi:10.1016/j.icarus.2006.02.001.
Postberg, F., S. Kempf, J. K. Hillier, R. Srama, S. F. Green, N. McBride,and E. Grün (2008), The E‐ring in the vicinity of Enceladus II: Signaturesof Enceladus in the elemental composition of E‐ring particles, Icarus, 193,438–454, doi:10.1016/j.icarus.2007.09.001.
Postberg, F., S. Kempf, D. Rost, T. Stephan, R. Srama, M. Trieloff,A. Mocker, and M. Goerlich (2009a), Discriminating contamination fromparticle components in spectra of Cassini’s dust detector CDA, Planet.Space Sci., 57, 1359–1374, doi:10.1016/j.pss.2009.06.027.
Postberg, F., S. Kempf, J. Schmidt, N. Brilliantov, A. Beinsen, B. Abel,U. Buck, and R. Srama (2009b), Sodium salts in E‐ring ice grains froman ocean below the surface of Enceladus, Nature, 459, 1098–1101,doi:10.1038/nature08046.
Rhee, J. W. (1976), Electrostatic disruption of lunar dust particles, inInterplanetary Dust and Zodiacal Light, Lecture Notes Phys., vol. 48,edited by H. Elsaesser and H. Fechtig, pp. 238–240, Springer, Berlin.doi:10.1007/BF00643087.
Rosenberg, M., and D. A. Mendis (1992), A note on dust grain charging inspace plasmas, J. Geophys. Res., 97, 14,773–14,776.
Rymer, A. M., B. H. Mauk, T. W. Hill, C. Paranicas, D. G. Mitchell,A. J. Coates, and D. T. Young (2008), Electron circulation in Saturn’smagnetosphere, J. Geophys. Res., 113, A01201, doi:10.1029/2007JA012589.
HSU ET AL.: DUST‐MAGNETOSPHERE INTERACTION AT SATURN A09215A09215
22 of 23

Schippers, P., et al. (2008), Multi‐instrument analysis of electron popula-tions in Saturn’s magnetosphere, J. Geophys. Res., 113, A07208,doi:10.1029/2008JA013098.
Showalter, M. R., J. N. Cuzzi, and S. M. Larson (1991), Structure and par-ticle properties of Saturn’s E ring, Icarus, 94, 451–473.
Sieger, M. T., W. C. Simpson, and T. M. Orlando (1998), Production of O2on icy satellites by electronic excitation of low‐temperature water ice,Nature, 394, 554–556, doi:10.1038/29015.
Sittler, E. C., Jr., K. W. Ogilvie, and J. D. Scudder (1983), Survey oflow‐energy plasma electrons in Saturn’s magnetosphere: Voyagers 1and 2, J. Geophys. Res., 88, 8847–8870, doi:10.1029/JA088iA11p08847.
Sittler, E. C., et al. (2005), Preliminary results on Saturn’s inner plasma-sphere as observed by Cassini: Comparison with Voyager, Geophys.Res. Lett., 32, L14S07, doi:10.1029/2005GL022653.
Sittler, E. C., et al. (2006), Cassini observations of Saturn’s inner plasma-sphere: Saturn orbit insertion results, Planet. Space Sci., 54, 1197–1210,doi:10.1016/j.pss.2006.05.038.
Sittler, E. C., et al. (2008), Ion and neutral sources and sinks withinSaturn’s inner magnetosphere: Cassini results, Planet. Space Sci., 56,3–18, doi:10.1016/j.pss.2007.06.006.
Spahn, F., A. V. Krivov, M. Sremčević, U. Schwarz, and J. Kurths (2003),Stochastic forces in circumplanetary dust dynamics, J. Geophys. Res.,108(E4), 5021, doi:10.1029/2002JE001925.
Spahn, F., et al. (2006), Cassini dust measurements at Enceladus andimplications for the origin of the E ring, Science, 311, 1416–1418,doi:10.1126/science.1121375.
Spencer, J. R. et al. (2009), Enceladus: An active cryovolcanic satellite,in Saturn From Cassini‐Huygens, edited by M. K. Dougherty, L. W.Esposito, and S. M. Krimigis, pp. 683–724, Springer, Dordrecht,Netherlands, doi:10.1007/978-1-4020-9217-6_21.
Srama, R., et al. (2004), The Cassini Cosmic Dust Analyzer, Space Sci.Rev., 114, 465–518, doi:10.1007/s11214-004-1435-z.
Srama, R., et al. (2006), In situ dust measurements in the inner Saturniansystem, Planet. Space Sci., 54, 967–987, doi:10.1016/j.pss.2006.05.021.
Srama, R., et al. (2009), Mass spectrometry of hyper‐velocity impacts oforganic micrograins, Rapid Commun. Mass Spectrom., 23, 3895–3906,doi:10.1002/rcm.4318.
Sternglass, E. J. (1954), An experimental investigation of electron back‐and secondary emission from solids, Ph.D. thesis, Cornell Univ., Ithaca,N. Y.
Tielens, A. G. G. M., C. F. McKee, C. G. Seab, and D. J. Hollenbach(1994), The physics of grain‐grain collisions and gas‐grain sputteringin interstellar shocks, Astrophys. J., 431, 321–340, doi:10.1086/174488.
Tokar, R. L., et al. (2008), Cassini detection of water‐group pick‐up ions inthe Enceladus torus, Geophys. Res. Lett., 35, L14202, doi:10.1029/2008GL034749.
Tseng, W., W. Ip, R. E. Johnson, T. A. Cassidy, and M. K. Elrod (2010),The structure and time variability of the ring atmosphere and ionosphere,Icarus, 206, 382–389, doi:10.1016/j.icarus.2009.05.019.
Wahlund, J.‐E., et al. (2005), The inner magnetosphere of Saturn: CassiniRPWS cold plasma results from the first encounter, Geophys. Res. Lett.,32, L20S09, doi:10.1029/2005GL022699.
Wahlund, J., et al. (2009), Detection of dusty plasma near the E‐ring ofSaturn,Planet. Space Sci., 57, 1795–1806, doi:10.1016/j.pss.2009.03.011.
Waite, J. H., et al. (2006), Cassini Ion and Neutral Mass Spectrometer:Enceladus plume composition and structure, Science, 311, 1419–1422,doi:10.1126/science.1121290.
Whipple, E. C. (1981), Potentials of surfaces in space, Rep. Progress Phys.,44, 1197–1250.
Wilson, R. J., R. L. Tokar, M. G. Henderson, T. W. Hill, M. F. Thomsen,and D. H. Pontius (2008), Cassini plasma spectrometer thermal ion mea-surements in Saturn’s inner magnetosphere, J. Geophys. Res., 113,A12218, doi:10.1029/2008JA013486.
Wilson, R. J., R. L. Tokar, and M. G. Henderson (2009), Thermal ionflow in Saturn’s inner magnetosphere measured by the Cassini plasmaspectrometer: A signature of the Enceladus torus?, Geophys. Res. Lett.,36, L23104, doi:10.1029/2009GL040225.
Yaroshenko, V. V., S. Ratynskaia, J. Olson, N. Brenning, J. Wahlund,M. Morooka, W. S. Kurth, D. A. Gurnett, and G. E. Morfill (2009),Characteristics of charged dust inferred from the Cassini RPWS measure-ments in the vicinity of Enceladus, Planet. Space Sci., 57, 1807–1812,doi:10.1016/j.pss.2009.03.002.
Young, D. T., et al. (2005), Composition and dynamics of plasma inSaturn’s magnetosphere, Science, 307, 1262–1266.
Zook, H., E. Grün, M. Baguhl, D. Hamilton, G. Linkert, J.‐C. Liou,R. Forsyth, and J. Phillips (1996), Solar wind magnetic field bending ofJovian dust trajectories, Science, 274, 1501–1503.
M. Burton and M. Roy, Jet Propulsion Laboratory, 4800 Oak Grove Dr.,Pasadena, CA 91109, USA.H.‐W. Hsu, S. Kempf, G. Moragas‐Klostermeyer, and R. Srama, MPI für
Kernphysik, Saupfercheckweg 1, Heidelberg D‐69117, Germany. (hsu@mpi‐hd.mpg.de)F. Postberg and M. Trieloff, Institut für Geowissenschaften, Ruprecht‐
Karls Universität, Im Neuenheimer Feld 234‐236, Heidelberg D‐69120,Germany.
HSU ET AL.: DUST‐MAGNETOSPHERE INTERACTION AT SATURN A09215A09215
23 of 23