strategies for improving coffee production and processing in ...
48
March 2021 STRATEGIES FOR IMPROVING COFFEE PRODUCTION AND PROCESSING IN PAPUA NEW GUINEA: LESSONS FROM THE TOP FIVE COFFEE - PRODUCING COUNTRIES Carolyn A. Afolami www.pngnri.org No. 184 Eugene E. Ezebilo
-
Upload
khangminh22 -
Category
Documents
-
view
1 -
download
0
Transcript of strategies for improving coffee production and processing in ...
March 2021
STRATEGIES FOR IMPROVING COFFEE PRODUCTION AND PROCESSING IN PAPUA NEW GUINEA: LESSONS FROM THE TOP FIVE COFFEE-PRODUCING COUNTRIES
Carolyn A. Afolami
www.pngnri.org
No. 184
Eugene E. Ezebilo

This page is intentionally left blank
DISCUSSION PAPER
No.184 March 2021
STRATEGIES FOR IMPROVING COFFEE PRODUCTION AND PROCESSING IN PAPUA NEW GUINEA: LESSONS FROM THE TOP FIVE COFFEE-PRODUCING COUNTRIES
Carolyn A. Afolami
Eugene E. Ezebilo
First published in 2021All rights reserved. No part of this publication may be reproduced, stored in a retrieval system or trans-mitted in any form or by any means, electronic, mechanical, photocopying or otherwise, without the prior permission of the publisher.
Copyright © 2021 The National Research Institute.
Direct any inquiries regarding this publication to: Publications EditorNational Research InstituteP.O. Box 5854Boroko, NCD 111 Papua New Guinea
Tel: +675 326 0300/326 0061; Fax: +675 326 0213Email: [email protected]: www.pngnri.org
The Papua New Guinea National Research Institute (PNG NRI) is an independent statutory authority established by an Act of Parliament in 1988 and confirmed by the IASER (Amendment) Act 1993.
PNG NRI is mandated by legislation to carry out independent research and analysis on development issues affecting PNG. The legislation states that the functions of the PNG NRI are:(a) The promotion of research into Papua New Guinea society and the economy; and,(b) The undertaking of research into social, political and economic problems of Papua New Guinea in order
to enable practical solutions to such problems to be formulated.
ISBN 9980 75 282 3National Library Service of Papua New Guinea
ABCDE 202423222120
The opinions expressed in this report are those of the authors and not necessarily the views of the Papua New Guinea National Research Institute.
Cover designed by PNG NRI Digital Media Unit
Table of ContentsAbstract vIntroduction 1 Objectives of the study 2 Structure of the paper 2 Brief background of the coffee sector in PNG 3 Coffee processing in PNG 5Overview of global coffee production 7 Production and processing of coffee in the top five coffee-producing countries 9Materials and methods 13 Study area 13 Data collection 13 Some factors that have been found in the literature that influence crop output 14 Data analysis 14 Results 17Findings from the review of literature on key challenges to coffee production and processing in PNG 25 Discussion 27 Lessons that PNG can learn from the top five coffee-producing countries 29Conclusion 31References 33
i
List of Charts, Figures and Tables
7
8
17
17
18
List of FiguresFigure 1: Global production of Arabica and Robusta coffee by million 60kg bags, 2015–2018
Figure 2: Coffee production in four world regions by million 60kg bags, 2015–2018
Figure 3: Coffee harvest areas in the top five coffee-producing countries by 100,000 hectares,
1998–2018
Figure 4: Coffee harvest area in PNG by 10,000 hectares, 1998–2018
Figure 5: Coffee production in the top five coffee-producing countries by 100,000 tonnes, 1998–2018
Figure 6: Coffee production in PNG by 10,000 tonnes, 1998–2018 18
Figure 7: Coffee yield in the top five-coffee producing countries by 100kg per hectare, 1998–2018 19
Figure 8: Coffee yield in PNG by 100kg per hectare, 1998–2018 19
List of TablesTable 1: PNG coffee grading system 5
Table 2: Description and descriptive statistics of variables used in our analysis 20
Table 3: OLS regression results of coffee output on coffee harvest area, extension services, and, world market price for Arabica 22
Table 4: OLS regression results of annual coffee outputs on world market prices of Robusta 23
ii
iii
AcknowledgementsThe authors thank the Government of Papua New Guinea for financial support. We thank Dr Francis Odhuno, Program Leader, Economic Policy Research Program at the Papua New Guinea National Research Institute (PNG NRI) for his valuable comments on the earlier version of this manuscript. We also thank Ms Logea Nao and Mr Ronald Sofe, who are Research Fellows at PNG NRI, for their comments on the earlier version of the manuscript.
About the AuthorsProfessor Carolyn A. Afolami is the Programme Leader, Agricultural Economics and Environmental Policy Programme of the Centre of Excellence in Agricultural Development and Sustainable Environment (CEADESE), Federal University of Agriculture Abeokuta, Ogun State, Nigeria. She is a Professor of Agricultural Economics at the Department of Agricultural Economics and Farm Management at the same university. She was Director, Agricultural Media Resources and Extension Centre, Federal University of Agriculture Abeokuta, Ogun State, Nigeria. Her research interest is environmental and production economics.
Associate Professor Eugene E. Ezebilo is the Deputy Director for Research at the PNG National Research Institute. He is an Associate Professor of Economics and holds a PhD in Economics from the Swedish University of Agricultural Sciences, Sweden. His research interests include economic development, housing economics and policy, environmental and resource economics, food security and socioeconomic impact analysis.
Authors’ ContributionsAssociate Professor Eugene Ezebilo conceived and designed the project, collected secondary data from several databases and conducted brief review of literature to identify some key papers relevant for the study. He also estimated the Ordinary Least Squares regression models. Professor Carolyn Afolami wrote the first version of the manuscript. Associate Professor Ezebilo and Professor Afolami contributed in the revision of the first version of the manuscript and prepared the final version.
Abbreviations and AcronymsCIC Coffee Industry CorporationDAL (PNG) Department of Agriculture and LivestockFAOSTAT Food and Agriculture Organization StatisticsGDP Gross Domestic ProductGoPNG Government of Papua New Guineaha hectareICO International Coffee OrganizationNARI (PNG) National Agricultural Research InstituteNFCG National Federation of Coffee GrowersOLS Ordinary Least SquaresPPAP Productive Partnerships in Agriculture ProjectPNG Papua New GuineaSCGA (PNG) Smallholder Coffee Growers Association
iv
v
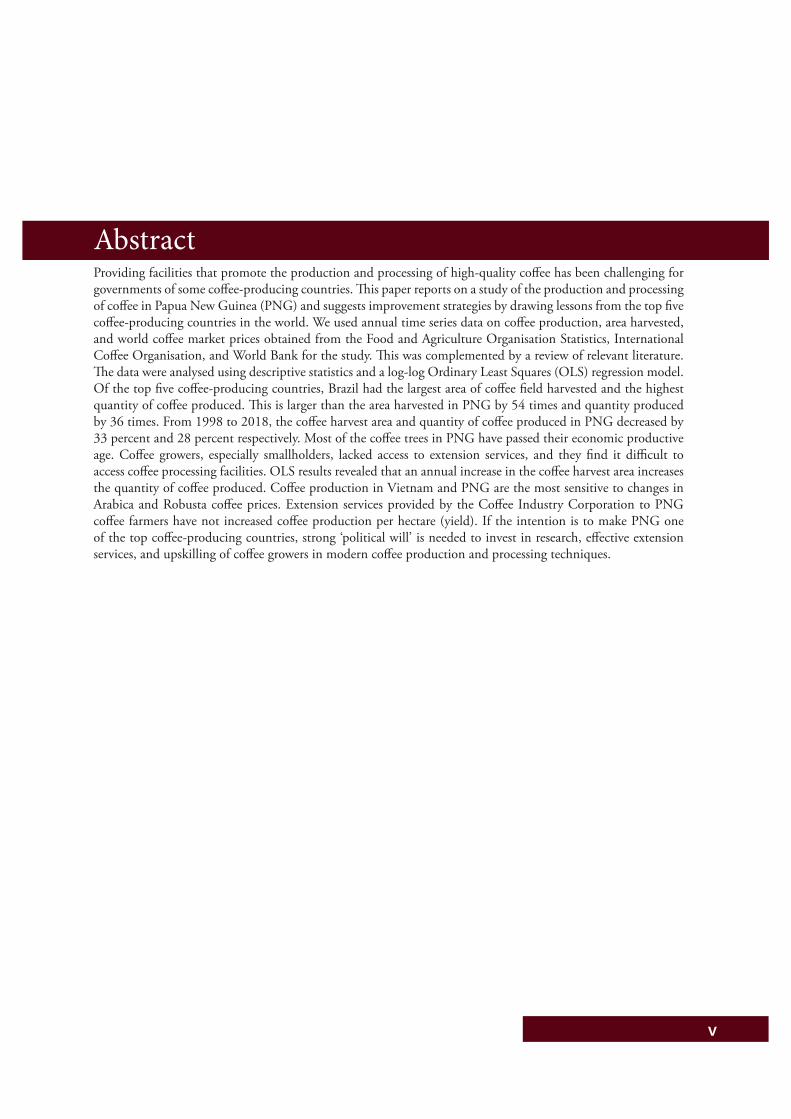
Abstract Providing facilities that promote the production and processing of high-quality coffee has been challenging for governments of some coffee-producing countries. This paper reports on a study of the production and processing of coffee in Papua New Guinea (PNG) and suggests improvement strategies by drawing lessons from the top five coffee-producing countries in the world. We used annual time series data on coffee production, area harvested, and world coffee market prices obtained from the Food and Agriculture Organisation Statistics, International Coffee Organisation, and World Bank for the study. This was complemented by a review of relevant literature. The data were analysed using descriptive statistics and a log-log Ordinary Least Squares (OLS) regression model. Of the top five coffee-producing countries, Brazil had the largest area of coffee field harvested and the highest quantity of coffee produced. This is larger than the area harvested in PNG by 54 times and quantity produced by 36 times. From 1998 to 2018, the coffee harvest area and quantity of coffee produced in PNG decreased by 33 percent and 28 percent respectively. Most of the coffee trees in PNG have passed their economic productive age. Coffee growers, especially smallholders, lacked access to extension services, and they find it difficult to access coffee processing facilities. OLS results revealed that an annual increase in the coffee harvest area increases the quantity of coffee produced. Coffee production in Vietnam and PNG are the most sensitive to changes in Arabica and Robusta coffee prices. Extension services provided by the Coffee Industry Corporation to PNG coffee farmers have not increased coffee production per hectare (yield). If the intention is to make PNG one of the top coffee-producing countries, strong ‘political will’ is needed to invest in research, effective extension services, and upskilling of coffee growers in modern coffee production and processing techniques.

vi
Coffee is one of the most tradeable agricultural commodities in the world and plays a pivotal role in several economies (Sengupta et al., 2020). There are several coffee species; however, the most frequently cultivated species for commercial purposes are Coffea Arabica (i.e., Arabica) and Coffea robusta (i.e., Robusta) (Winston et al., 2005). Arabica produces higher quality beans and attracts higher market prices than Robusta. However, Robusta is more resistant to diseases than Arabica. According to an International Coffee Organization (ICO) report (ICO, 2020), global production of Arabica is higher than Robusta. The production of Arabica from 2015 to 2018 ranged from 91 million 60kg bags to 101 million 60kg bags. In the case of Robusta, production ranged from 60 million 60kg bags to 72 million 60kg bags. Coffee production and processing are often influenced by climatic conditions, pests and diseases, market price, technology, labour, and finance (Trevisan, 2018; Folnovic, 2020). Coffee has seasonal variation, with years of high production followed by years of low production and vice versa (Volsi et al., 2019); this is a form of cobweb production pattern.
Coffee quality is one of the important factors that determines the market price of coffee (Yadessa et al., 2020; Joet et al., 2010). Quality is determined by various physical and physico-chemical constituents of the raw beans. Other factors that influence the quality of coffee include coffee variety, conditions of cultivation site, crop fertilisation, and harvesting and processing techniques (Joet et al., 2010; Ferreira et al., 2013). The components of coffee that determine its quality influence the appearance of roasted coffee beans, flavour of the coffee beverage, and its aroma. The type of processing method used is an important determinant of the profitability of coffee production (Ferreira et al., 2013).
The choice of processing method is often influenced by factors such as cost-benefit ratio, the need to comply with environmental legislation, and the desired quality standard for the product (Ferreira et al., 2013). There are two commonly used processing methods: dry processing and wet processing (Subedi, 2011). The dry processing method involves either completely drying coffee beans in yards or partially drying coffee beans in yards and then using mechanical dryers to complete the drying process. Wet processing involves the peeling of coffee beans, washing and the removal of mucilage (Ferreira et al., 2013). To ensure the supply of product of high quality and higher profitability of the coffee business, it is important to use a processing technique, such as the wet processing method, that improves the quality of coffee products. Quality of coffee can be improved by removing most of the processing errors.
In Papua New Guinea (PNG), coffee has been the second leading agricultural commodity, after oil palm (Department of Agriculture and Livestock [DAL], 2020). Coffee production provides opportunities for employment and foreign exchange earnings. Coffee contributed 27 percent of the total agricultural export from 2012 to 2017 and accounted for 6 percent of the Gross Domestic Product (GDP) within the same period. It contributes to multiple sectors of PNG’s economy including transport, construction, manufacturing, retail and wholesale, insurance, and banking. Arabica is a coffee species that is frequently cultivated in PNG, mainly in the altitude between 700 to 2050 metres above sea level in the Highlands region (Coffee Industry Corporation, [CIC], 2016). Robusta is cultivated in areas of up to 550 metres above sea level in the coastal areas of PNG.
PNG provides high quality fine flavour Arabica coffee that is cherished by coffee consumers (Giovannucci & Hunt, 2009). However, coffee production in PNG appears to have been declining. According to a report by AECOM (2018) on PNG coffee market study, the export has dropped to 934 60kg bags between 1998 and 2018. The price of coffee has also been declining over time in the international market. The implication is that, given that the two components of coffee revenue (output and price) to the producers is declining, the revenue would decline over time and have serious consequences for the producers and the PNG economy that is dependent on it.
1
Introduction
2
To make growing cash crops — including coffee — more attractive to farmers, the Government of PNG (GoPNG) has implemented initiatives such as the Productive Partnerships in Agriculture Project (PPAP) in collaboration with the World Bank. The Project focuses on improving performance in coffee production (DAL, 2020). This contributes to the GoPNG’s commitment to increase the contribution of cash crops — including coffee — to the country’s economy as highlighted in the Medium-Term Development Plan III (Department of National Planning and Monitoring, 2018).
PNG’s coffee industry provides one of the highest potentials for growth and gains within the agricultural sector and has the potential to support the growth of the economy (CARE International in PNG, 2015). However, the quantity and quality of coffee produced in PNG continue to decline, which threatens many households who depend on coffee for their livelihoods. The decline also adversely impacts government revenue from the agricultural sector. Because coffee contributes immensely to PNG’s economy and the livelihoods of many households, it is pertinent we find strategies to address the problems associated with the production and processing of coffee in the country.
Objectives of the studyThe three objectives of this study are as follows:
i. To review the production and processing of coffee in the top five coffee-producing countries of the world and examine the impact of coffee harvest area, world market price of coffee, and extension services on production of coffee.
ii. To assess the production and processing of coffee in PNG and highlight the challenges facing coffee growers.
iii. To find strategies to improve the production and processing of coffee in PNG by drawing lessons from the top five coffee-producing countries in the world.
Findings from the study reported in this paper will be useful to policy makers, planners and agricultural managers when making informed decisions about the development of sustainable coffee production and processing strategies that will improve the yield and quality of this commodity in PNG.
Structure of the paperThe introductory section is followed by a section on background of coffee sector in PNG and global coffee production. These are immediately followed in a sequence by an overview of coffee production and processing in top five coffee-producing countries in the world, materials and methods, results, and discussion. The last section is conclusions.
Coffee was first introduced to PNG by the British at the end of the nineteenth century (Giovannucci & Hunt, 2009). Strong commercial growth in coffee production began at plantations primarily owned by non-citizens in the 1950s. The area cultivated surged significantly in the 1960s with rapid expansion from a few thousand hectares and the start of a shift to smallholder plots. In the mid-1970s, Top Premium coffee grades A and AA dropped from 15 percent of national production to around 5 percent (Giovannucci & Hunt, 2009). Premium coffee grades A and X were around 25 percent of PNG’s coffee exports in the 1990s. By the mid-2000s, this had fallen to just over 12 percent. After PNG ndependence in 1975, the plantation owners found the coffee business to be increasingly less politically and physically viable. Many of the plantations shrank and were subdivided and some gradually stopped operating. The fragmentation of the plantations and the government redistributions created smaller ‘blocks’ of 20 to 30 hectares, most of which were owned by PNG citizens (Giovannucci & Hunt, 2009).
Coffee has been one of the most important cash crops in PNG. Other important cash crops include copra, cocoa, rubber, and oil palm (Imbun, 2014). Coffee was ranked the number one contributor to the country’s economy until 2000 when coffee was overtaken by oil palm (Imbun, 2014). Coffee producers in PNG can be classified into smallholders, plantations, and block-holders. Smallholders account for 85 percent of coffee production, plantations account for 10 percent, and block-holders account for 5 percent (CIC, 2016). On average, smallholders have around 2 hectares of coffee plots. Th e farmers are dispersed and produce low-grade coffee. Plantations have around 50 hectares and block-holders have around 20 hectares. Coffee contributes to the livelihoods of more than 2.5 million people in the 15 provinces of PNG that cultivate coffee (Aba et al., 2014). It is important to note that coffee produced on plantations often receives higher price premiums in international markets because of the better quality and consistency associated with standardised business practices, than coffee produced by smallholders.
Smallholders often produce cherries to parchment using simple hand pulpers, sun drying it, and selling the parchment to roadside buyers and factories (Aba et al., 2014). Plantation owners often have facilities for dry and wet processing. Some sell their processed products directly to exporters while those who have an export licence will export the product themselves. The block-holder scheme was established through the ‘ 2 0 hectares block’ scheme administered by the Agriculture Bank (i.e., what is currently the National Development Bank) in 1970s (Aba et al., 2014).
Arabica is grown in 15 of PNG’s 22 provinces by more than 450,000 households, but production is mainly centred in Eastern Highlands, Western Highlands, Jiwaka, Morobe, and Simbu provinces (CIC, 2020). East Sepik supplies most of PNG’s Robusta for exports. The Arabica coffee produced in PNG, especially that produced on the larger estates, is considered one of the finest gourmet coffee in the world.
PNG is presently ranked seventeenth out of 50 coffee-producing countries in the world (World Atlas, 2019). The main challenge for PNG coffee growers is how to consistently produce coffee in the correct quantity and quality required for international market.
There are 84 coffee processors in PNG (CIC, 2016). The pr ocessors buy cherries from smallholders. Some coffee plantations have their own processors (Aba et al., 2014). A standard processor has a capacity of 25,000 bags whereas some of the processors have the capacity of 100,000 bags (CIC, 2016). The P N G c o ffee in du stry is restricted by high production costs, low productivity, and inconsistencies. Large numbers of smallholder farmers reside in remote rural areas with limited access to wet milling, transportation, and storage facilities (AECOM, 2018).
The number of large plantations has continued to diminish because of high operating costs security and transportation challenges, and land ownership disputes (AECOM, 2018). Extension services are important in disseminating valuable information to coffee farmers about modern production and processing. Th e CI C
Brief background of the coffee sector in PNG
3
4
is responsible for providing the services, but smallholders have continued to have limited access to the services (AECOM, 2018). GoPNG has provided regulations and licensing requirements to sustain quality standards at all stages of coffee production. However, it has not been able to improve quality (AECOM, 2018). The PPAP was established to improve the performance and sustainability of value chains in coffee-producing areas (DAL, 2020). The PPAP is intended to improve the livelihoods of smallholder coffee producers.
According to Sitapai (2012), agricultural extension services in PNG were influenced by the decentralisation policy that was adopted following the country’s independence in 1975. The main aim of the policy was to empower provinces so that they could determine their own development priorities and manage their budgets. The corporatisation policy that commenced in the 1990s resulted in the creation of key commodity entities for cash crops such as coffee, cocoa, oil palm, and coconut as a way of giving the industries autonomy. This resulted in a shift of research and development and extension and marketing functions from the DAL to the corporate entities. These entities in turn developed extension services in collaboration with provinces and district level governments. In the case of coffee, the CIC took over the research and extension functions associated with the crop in 1990. The Corporation was given the responsibility of producing improved coffee varieties, agronomic and processing techniques, and extension service models.
5
In the past, plantations and rural mills provided smallholders with a centralised facility to process coffee. However, as most of the plantations and rural mills ceased operation, smallholders began to produce coffee of inconsistent quality (Sengere et al., 2019; Curry et al., 2019). This contributes to the productivity issues associated with processing in PNG. Dry mills are owned by the large coffee exporting firms. Currently, export millers may attempt to add value to the coffee parchment sold by smallholder farmers. This restricts individual farmers from participating in any price premiums earned from quality achievement. Coffee is sold and exported in national grades, and most smallholder coffee is blended and homogenised with limited traceability to their source.
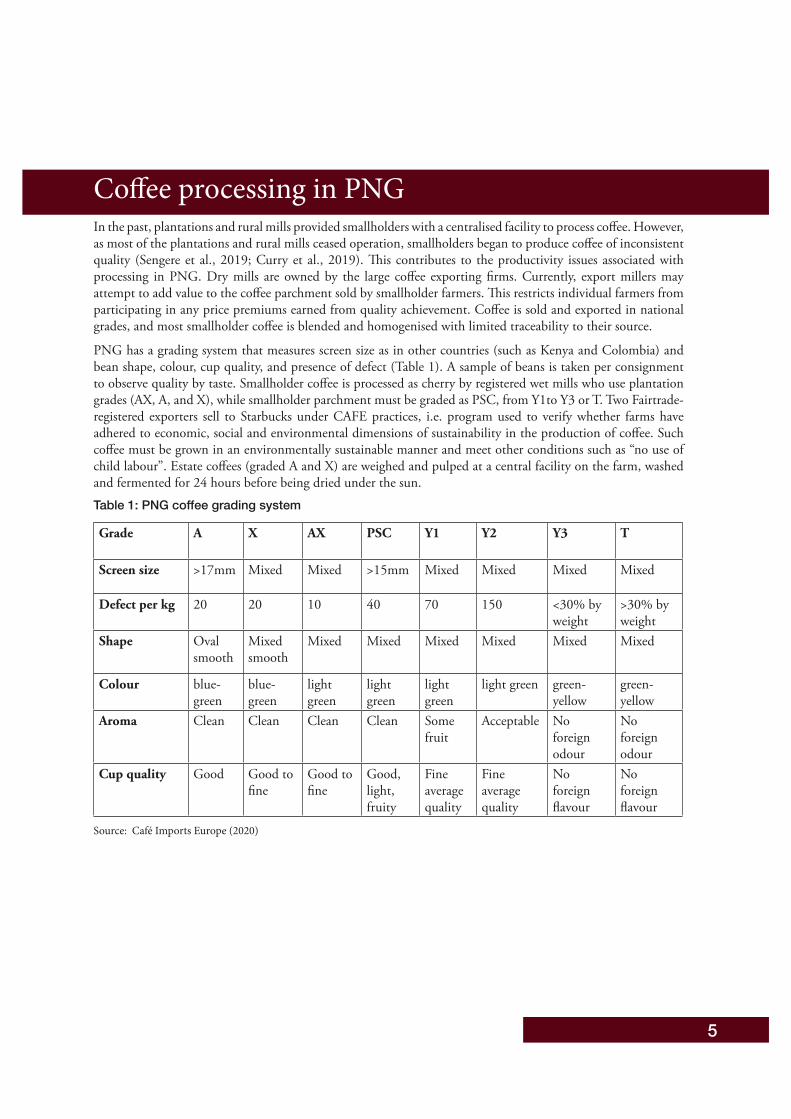
PNG has a grading system that measures screen size as in other countries (such as Kenya and Colombia) and bean shape, colour, cup quality, and presence of defect (Table 1). A sample of beans is taken per consignment to observe quality by taste. Smallholder coffee is processed as cherry by registered wet mills who use plantation grades (AX, A, and X), while smallholder parchment must be graded as PSC, from Y1to Y3 or T. Two Fairtrade-registered exporters sell to Starbucks under CAFE practices, i.e. program used to verify whether farms have adhered to economic, social and environmental dimensions of sustainability in the production of coffee. Such coffee must be grown in an environmentally sustainable manner and meet other conditions such as “no use of child labour”. Estate coffees (graded A and X) are weighed and pulped at a central facility on the farm, washed and fermented for 24 hours before being dried under the sun. Table 1: PNG coffee grading system
Grade A X AX PSC Y1 Y2 Y3 T
Screen size >17mm Mixed Mixed >15mm Mixed Mixed Mixed Mixed
Defect per kg 20 20 10 40 70 150 <30% by weight
>30% by weight
Shape Oval smooth
Mixed smooth
Mixed Mixed Mixed Mixed Mixed Mixed
Colour blue-green
blue-green
light green
light green
light green
light green green-yellow
green-yellow
Aroma Clean Clean Clean Clean Some fruit
Acceptable No foreign odour
No foreign odour
Cup quality Good Good to fine
Good to fine
Good, light, fruity
Fine average quality
Fine average quality
No foreign flavour
No foreign flavour
Source: Café Imports Europe (2020)
Coffee processing in PNG

6
7
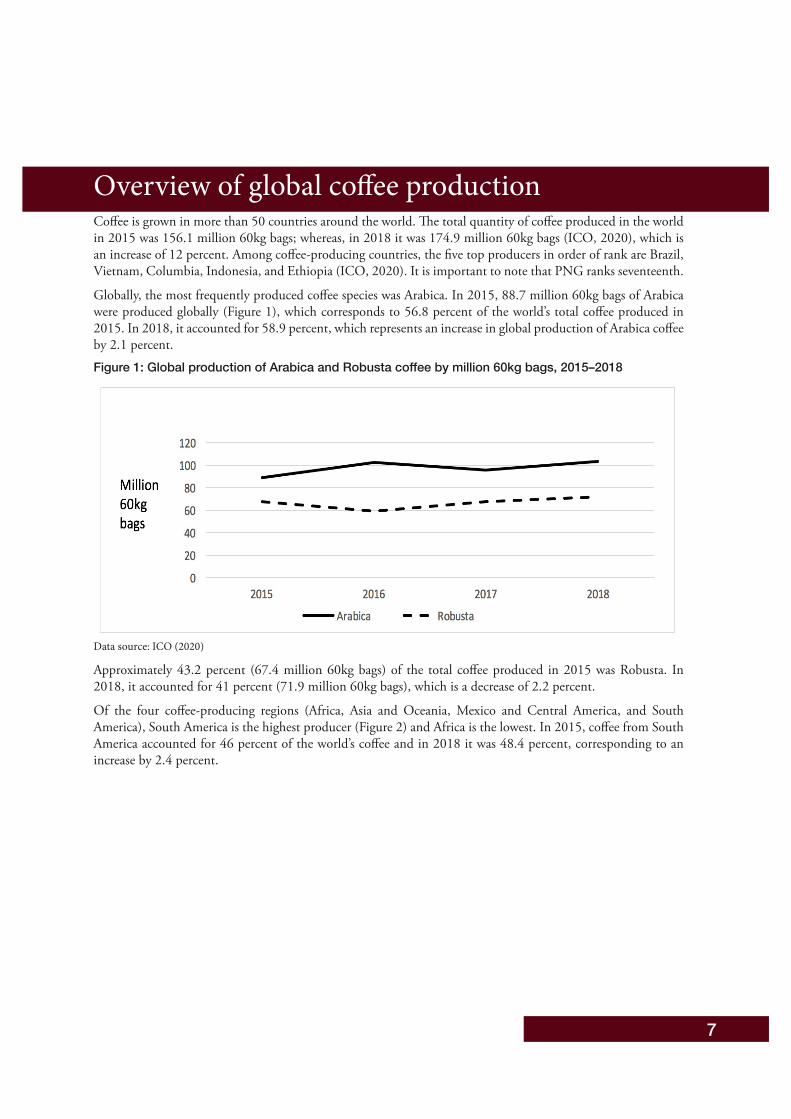
Coffee is grown in more than 50 countries around the world. The total quantity of coffee produced in the world in 2015 was 156.1 million 60kg bags; whereas, in 2018 it was 174.9 million 60kg bags (ICO, 2020), which is an increase of 12 percent. Among coffee-producing countries, the five top producers in order of rank are Brazil, Vietnam, Columbia, Indonesia, and Ethiopia (ICO, 2020). It is important to note that PNG ranks seventeenth.
Globally, the most frequently produced coffee species was Arabica. In 2015, 88.7 million 60kg bags of Arabica were produced globally (Figure 1), which corresponds to 56.8 percent of the world’s total coffee produced in 2015. In 2018, it accounted for 58.9 percent, which represents an increase in global production of Arabica coffee by 2.1 percent. Figure 1: Global production of Arabica and Robusta coffee by million 60kg bags, 2015–2018
Data source: ICO (2020)
Approximately 43.2 percent (67.4 million 60kg bags) of the total coffee produced in 2015 was Robusta. In 2018, it accounted for 41 percent (71.9 million 60kg bags), which is a decrease of 2.2 percent.
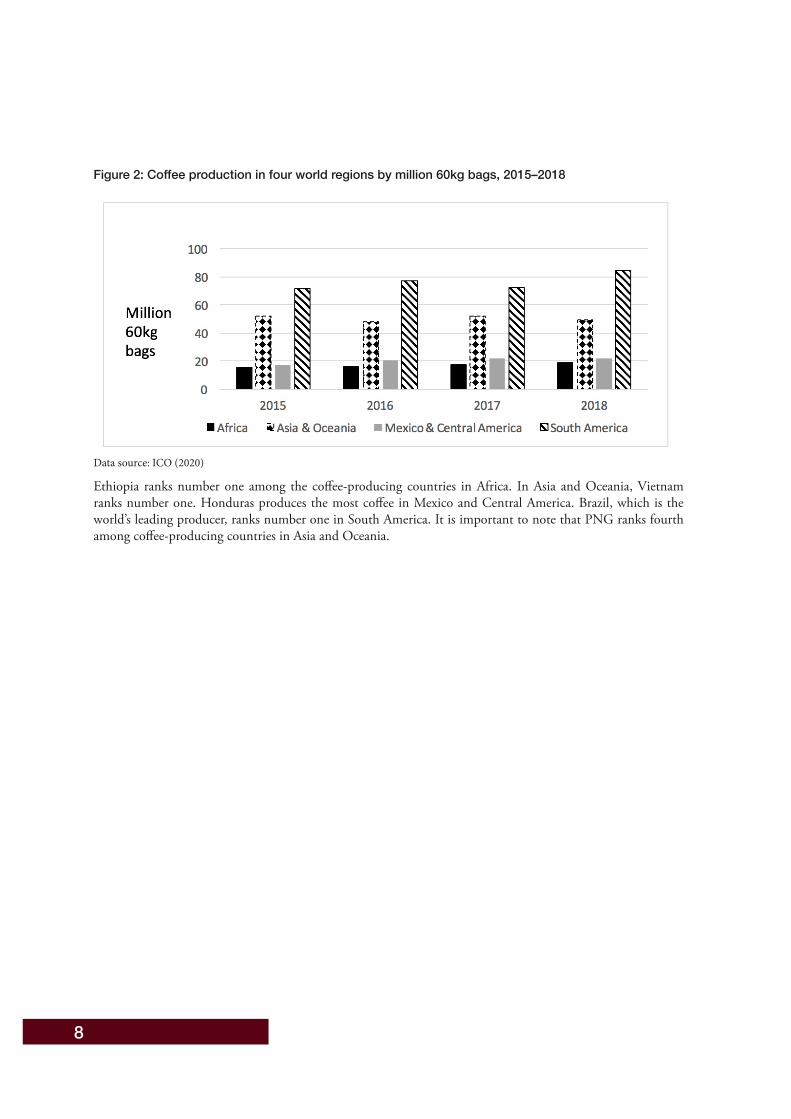
Of the four coffee-producing regions (Africa, Asia and Oceania, Mexico and Central America, and South America), South America is the highest producer (Figure 2) and Africa is the lowest. In 2015, coffee from South America accounted for 46 percent of the world’s coffee and in 2018 it was 48.4 percent, corresponding to an increase by 2.4 percent.
Overview of global coffee production
8
Figure 2: Coffee production in four world regions by million 60kg bags, 2015–2018
Data source: ICO (2020)
Ethiopia ranks number one among the coffee-producing countries in Africa. In Asia and Oceania, Vietnam ranks number one. Honduras produces the most coffee in Mexico and Central America. Brazil, which is the world’s leading producer, ranks number one in South America. It is important to note that PNG ranks fourth among coffee-producing countries in Asia and Oceania.
9
The main differences between the coffee-producing countries are the soil, elevation, and management practices such as fertilisation, pruning, thinning, and post-harvest operations (de Almeida & Zylbersztajn, 2017; Ferreira et al., 2013). Altitude affects the temperature in which coffee grows and can boost or hinder a coffee tree’s ability to absorb nutrients from the soil. Coffee growers follow various management practices depending on the type of production systems they prefer (Hinsene et al., 2015).
The dry processing method is inexpensive compared to the wet processing method (Ghosh & Venkatachalapathy, 2014). In the dry method, the whole cherries are dried under the sun in open air, followed by the separation of the hull (dried pulp and parchment) for getting the green beans. Coffee beans dried by the sun may take 4 to 5 days depending on the weather condition. Unpredictable weather events can increase the moisture content, and the drying time may be prolonged to 7 to 21 days.
On the contrary, the wet processing method requires less labour and monitoring than other processes (Ghosh & Venkatachalapathy, 2014). However, this method requires a large quantity of water and investment, but it often gives rise to a superior coffee quality. In the wet process, the pulp of the coffee cherries is removed mechanically, but the parchment remains attached to the beans. There are several dryers available for coffee drying including mechanical dryers as well as combination of both solar dryers assisted with mechanical dryer. A new trend of coffee drying called microwave drying, which retains the characteristic flavour, is now available in several countries throughout the world.
The electric dryer is used where temperature control is more precise and drying time can be reduced (Ghosh & Venkatachalapathy, 2014). However, the chances of over-drying or un-uniform temperature distribution inside dryer, may affect the final product of coffee quality. Dried coffee seeds are passed through the hulling machine to remove the hull and by mechanical aspiration the hulls are separated from the seeds. Hulled coffee seeds are manually inspected for defected and discoloured seeds, which are then removed. Electronic colour sorters may also be used to eliminate defective seeds, as an alternative to manual sorting. Sorted good quality beans are graded based on seed size, colour, and other standard tests to estimate the brewing quality of the finished coffee.
Countries adopt different methods based on the desired quality of the coffee beans and available resources. The mode of coffee processing strongly influences the quality of green coffee and thereby establishes the characteristic differences in the flavour of dry and wet processed coffees (Kleinwächter et al., 2015).
The quality of the green coffee beans is dictated by bean size, colour, shape, method of drying, crop year, and presence of defects (cracked bean, withered bean, bean in parchment, mouldy bean). The differences in the cup quality between coffees processed from dry and wet methods has been the major concern for coffee importers and quality experts (Bytof et al., 2004). Application of dry and wet coffee processing techniques by the processors has led, to some extent, to the differences in the quality. If the quality of coffee processed by these two methods is significantly different, then the market will be affected (Subedi, 2011). Post-harvest coffee processing activities contribute to about 60 percent of the quality of green coffee beans (Haile & Kang, 2019). Post-harvest operations include pulping, processing, drying, hulling, cleaning, sorting, grading, storage, roasting, grinding, and cupping.
A brief review of production and processing of coffee in the top five coffee-producing countries is presented in the following subsection:
i. Coffee production and processing in Brazil. Brazil is the largest producer and exporter of coffee in the world.According to data from ICO (2020), the country produced 33.9 percent of world’s total coffee in 2015 and37.2 percent in 2018, which is an increase of 3.3 percent. The country’s share of coffee species being producedis almost 70 percent Arabica and the remainder Robusta. Brazil has an estimated 300,000 coffee plantations
Production and processing of coffee in the top five coffee-producing countries
10
(Mello, 2012). Coffee thrives in Brazil because of the temperature, heavy rainfall, and a distinctive dry season that provides optimum conditions for its growth. A team is often hired to maintain and care for coffee trees.
Following the end of large-scale government intervention in the Brazilian coffee market in the 1990s, the coffee sector reinvented itself (Volsi et al., 2019). Production systems were modernised, and more innovative production techniques were applied to improve competitiveness especially through differentiation in product quality. Furthermore, cost reductions and internal management mechanisms to achieve buyer satisfaction and confidence were implemented. Coffee producers cultivated their crop only in re gi on s that have favourable conditions for coffee production. Th ey also sought to va lue-add to their products by producing special coffee with seals of quality and geographical certifications. Th e us e of technology and agricultural machinery, the development of new varieties, and the adoption of irrigation facilities have increased productivity (Volsi et al., 2019).
Brazil practices a sun-grown production system, which relies on high-yielding coffee varieties (Watson & Achinelli, 2008). This was adopted during the outbreak of coffee leaf-rust disease that infected shade-grown cultivars. The coffee trees in Brazilian plantations are grown very close together, following the monoculture model imposed by the Brazilian development policy. Farmers cultivate 3,000 to 5,000 trees per hectare. Sun-grown coffee has the potential to provide a higher yield than shade grown coffee in the short-term; however, it can quickly exhaust the soil, which makes the system more reliant on fertilisers (Watson & Achinelli, 2008). The national government offers agricultural support to farmers who grow coffee, including loans at low-interest rates. An extension agency provides services to farmers to grow coffee. However, the agency often promotes a monocrop model of high yielding sun-grown coffee.
Two methods are used in Brazil to process coffee. The dry processing method has been the traditional system where coffee cherries are dried in the yard completely or partially dried in the yards and later finished by mechanical drying (Ferreira et al., 2013). Dry processing is the most popular method in the country. The cherries are dried to reduce the moisture content to 12 percent. Coffee cherries are harvested mechanically, which lowers the quality of the coffee products. The wet processing method has been promoted in Brazil because it contributes to a better quality of coffee product.
ii. Coffee production and processing in Vietnam. Vietnam is the second largest coffee producer in the world(ICO, 2019). Robusta makes up the largest share (92.9%) of coffee grown in Vietnam, and Arabica makesup about 7 percent. In terms of total output volume, Robusta accounts for 97 percent. The Arabica coffeecultivated in Vietnam is a crossbreed of Robusta and Arabica. Several varieties of Arabica have been producedby Vietnamese researchers that are adaptable to local soil and climate and have high productivity and increasedresistance to pests and diseases (ICO, 2019). According to the Specialty Coffee Association, standards of somenew Arabica varieties produced by Vietnam had over 80 points and are graded as specialty coffee (ICO, 2019). It has the potential to improve the quality of Vietnamese coffee. Most of the coffees are cultivated in areas with an altitude between 500 to 1,200 metres above sea level. This gives the coffee a sweet aroma.
Several initiatives have been implemented by the Vietnamese government to improve the quality of coffee for export and promote the cultivation of Arabica. These initiatives have resulted in the expansion of coffee cultivation in the growing areas and an improvement in yields and quality. The V ietnamese government has made a commitment to restrict the cultivation area to 600,000 hectares while improving coffee quality (ICO,
2019).
Vietnamese coffee farmers use advanced agricultural production techniques to obtain national and internationalcertifications such as the Common Code for the Coffee Community (4C) T ade Z e (UTZ) anRainforest Alliance (RA). More than 30 percent of the total coffee growing areas of Vietnam have been certified by Sustainable Development Initiatives.
Arabica is cultivated in mountainous areas where temperatures range from 20 C to 22 C and is between 1,300 to 1,900mm (ICO, 2019). Robusta is cultivated in areas that have hot weather (temperature between 24 C and 26 C), high humidity, and weak direct sunlight. Coffee is either grown as a sole crop
11
(monocropping) or intercropped with other industrial crops. The density of Arabica ranges from 2,660 to 6,660 trees per hectare, whereas the density of Robusta is about 1,330 trees per hectare.
In Vietnam, coffee cherries are mostly harvested by hand by stripping both unripe and overripe cherries from the trees or stripping only the ripe cherries and leaving the unripe for harvesting later (ICO, 2019). Dry processing method is the most common method in Vietnam. It entails the drying of cherries under the sun or in mechanical dryers. However, almost 80 percent of farmers use sunlight drying, which involves a drying period of 12 to 16 hours to reduce the humidity in cherries to 10 percent and 12 percent. Large-scale coffee producers often use a wet processing method.
iii. Coffee production and processing in Colombia. The country is the world’s third largest coffee producer (ICO, 2020). On average, it contributes 8 percent share of the total world coffee production. Colombia used to be the second largest coffee producer; however, it moved to third position following the leaf rust disease that hit the Columbian coffee crop because of heavy rains in 2008 and 2009. Colombian farmers mainly grow Arabica coffee. Disease-resistant coffee varieties have been cultivated.
The National Federation of Coffee Growers (NFCG) is an industry association that represents the nation’s coffee producers and has been responsible for creating a name for Colombian coffee (Equal Exchange, 2020). The NFCG guarantees purchase of coffee, but farmers are under no obligation to sell to the association.
Colombia has 38 cooperatives that are independent of the NFCG. Of these, 19 are certified fairtrade by the Fairtrade Labelling. The majority of the coffee is grown under shade and some is grown under full sun (Equal Exchange, 2020). Deforestation and soil and water contamination from overuse of pesticide are among the most prevalent environmental problems facing the coffee industry.
Colombia remains the only premium single origin coffee able to compete successfully in the arena of canned supermarket blends (Equal Exchange, 2020). The country’s terrain restricts the adoption of mechanisation in the harvesting of coffee. Thus, coffee is harvested by hand when it is ripe and cleaned to avoid mucilage from seeping into the beans. This results in high quality coffee products and promotes the involvement of coffee growers in the industry. It is important to note that Colombian coffee production is mainly a family-run operation. Harvesting and processing is carried out by the growers themselves.
The most common processing method used in Colombia is ‘washed processing’, which involves removing the skin and mucilage from the cherries before drying (Equal Exchange, 2020). The fruit is typically broken down by controlled fermentation and then removed using water, hence the term ‘washed’. Most coffee farmers in Colombia process their coffees by using their own facilities. The Colombia Coffee Federation has a system where small producers apply wet processes to their coffee either on their farms or close to their farms. The small producers then take their wet-processed coffee to collection points. From there, the coffee is moved to the mills operated by the Federation. The coffee is sorted and graded according to the national standards at the mills. The standard Colombia coffees exported by the Coffee Federation are distinguished by grade, but origin is not specified.
iv. Coffee production and processing in Indonesia. Indonesia is the fourth highest producer of coffee in the world (ICO, 2020). It grows more than 90 percent Robusta and almost 10 percent Arabica. It contributes an average of 6 percent to the total world coffee production. The country’s production focuses more on quantity than quality, which has led it to grow more low-quality Robusta (Nelson, 2008). Its specialty, known as kopi luwak, is the most expensive coffee bean in the world (Bale, 2016; Nelson, 2007). The specialty is harvested from the faeces of Asian palm civets through an intensive process and it has a unique distinctive taste. Drying is the most frequently used processing method. The cherries are dried under the sun and then de-hulled in a dry state. Some farmers, especially in Sumatra, Flores and Papua, use a wet hulling technique. This involves using rustic pulping machines called ‘luwak’ to mechanically remove the outer skin from the cherries. The coffee beans, still coated with mucilage, are then stored for up to a day. Following the waiting period, the mucilage is washed off and the coffee is partially dried for sale. Harvesting is done using hand picking by both smallholders and medium-sized estate owners.
12
v. Coffee production and processing in Ethiopia. Ethiopia is ranked the fifth largest producer of coffee (ICO, 2020). It is the geographic home of Arabica coffee. The country is the leading coffee producer and consumer in Africa. The coffee production systems are mainly categorised as garden, plantation, semi-forest, and forest coffee, which vary in intensity of management. The country produces only Arabica coffee and about 95 percent of Ethiopia’s coffee is produced by smallholder farmers on less than two hectares of land while the remaining 5 percent is grown on modern commercial farms.
The Harar, Limu, Sidamo, and Yirgacheffe beans are all trademarked varieties of the Arabica bean, with the rights owned and protected by the Government of Ethiopia. The country is naturally endowed with a suitable climate and an impressive selection of distinctive coffee profiles and has the potential to produce large amounts of “differentiated high-quality green coffee” (Asfaw, 2018). However, the process of coffee production has not changed much since the tenth century. Nearly all of Ethiopia’s coffee production is still carried out manually, from the planting of new trees to the final pickings that are then sent to warehouses in Addis Ababa. Inadequate infrastructure, access to services, low value addition, inadequate technology transfers and research are among major constraints of coffee production in Ethiopia (Degaga, 2020).
The wet processing method is commonly used in Ethiopia. This processing method results in a nuanced flavour profiles that are softer and more distinctive and bring out citrusy and floral notes. Dry processing is often used for coffee intended for domestic consumption. The Oromia Coffee Farmers’ Cooperative Union (a private organisation of 405 cooperatives with over 400,000 farmers) has three coffee processing plants located in Dire Dawa, Gelan and Qality that wash and remove the husks from the green coffee bean (African Agribusiness, 2020). Ethiopia has more than 200 coffee processing plants.
13
Study areaThe study covers six coffee-producing countries in four continents: Brazil, Vietnam, Colombia, Indonesia, Ethiopia, and PNG.
Brazil is located in South America. The agriculture sector is one of the most important sectors in the country. It accounts for four percent of the annual gross domestic product and nine percent total employment in the country (Alves, 2020). The most important agriculture products in the country include coffee, soybeans, beef, sugarcane, and ethanol (Meyer, 2010). It is estimated that coffee will contribute US$41,732 million in revenue to the economy of Brazil in 2020 (Statista, 2020a). Coffee production provides jobs for more than eight million people in Brazil.
Vietnam is located in South-East Asia. Agriculture accounts for almost 33 percent of the country’s economy. Agriculture, forestry, and fishing was 14.7 percent of Vietnam’s GDP in 2018 and almost 40 percent of the total employment (Statista, 2020b). Coffee is one of the major sources of income in the country; its export value has been almost 15 percent (ICO, 2019). Coffee contributed to 2.26 percent of the GDP in 2016 and 2.16 percent in 2017. The coffee industry provides more than five hundred thousand jobs in Vietnam.
Colombia is located in South America. The agriculture sector accounted for 6.29 percent of the country’s GDP in 2018 and 6.74 percent in 2019 (World Bank, 2020). Following the diversification of Colombia’s economy, coffee’s contribution to the GDP has been around 2 percent.
Indonesia is located in South-East Asia. The country’s agricultural products include coffee, palm oil, copra, and cocoa. The agricultural sector contributed 24.3 percent to the country’s GDP in 1986 but declined to 12.7 percent in 2019 (The GlobalEconomy.com, 2020). As the economy of Indonesia is highly diversified, coffee exports accounts for only about 0.13 percent of the GDP (Dwiartama et al., 2020). Small-scale coffee growers having between one to two hectares own more than 90 percent of coffee plantations in Indonesia (Indonesia Investment, 2020). This often results in challenges associated with safeguarding stable production volumes and quality of products, which contribute to the country’s loss of competitiveness in the international market.
Ethiopia is located in East Africa. The main agricultural products of the country include coffee, potatoes and sugarcane. Agriculture contributed 33.9 percent to the country’s GDP in 2019 (Plecher, 2020). Coffee provides source of livelihoods for several millions of smallholder farmers in Ethiopia. The export value of coffee in the country is almost 25 percent of the country’s export value (Philippe, 2020).
PNG is located in Oceania. It shares a boundary with Indonesia in the north and Australia in the south. Agricultural sector accounts for almost 30 percent of the country’s GDP and employs over 80 percent of the workforce (DAL, 2020). The sector is dominated by subsistence farmers. The main cash crops of PNG include oil palm, coffee, cocoa, and copra. Coffee is the second most important agricultural commodities and it contributed 6 percent to the country’s GDP from 2012 to 2017 (DAL, 2020). The coffee industry provides job for more than two and half million people in the country, and it is dominated by smallholders.
Data collectionData used for this study were obtained from secondary sources. Annual time series data were obtained from several databases and were complemented by secondary information from review of journal articles, books, policy papers and briefs on production and processing of coffee in PNG and the top five coffee-producing countries of the world. We collected time series data from 1961 to 2018 on annual coffee production, annual area of coffee harvested and annual yield per hectare of various coffee producing countries as well as world coffee prices from Food and Agriculture Organization Statistics (FAOSTAT), ICO, and World Bank databases. We reviewed several international journal articles and grey (unpublished) articles.
Materials and methods
14
Some factors that have been found in the literature that influence crop outputWe identified several factors in the literature that influence crop output (coffee inclusive). These include:
• Production inputs access to support institutions such as credit/ finance (Dilebo, 2019) and extension services (Baloch & Thapa, 2018);
• Farm and farmer characteristics which include farm size, farm owner’s education (Looga et al., 2018);
• World market price of coffee (Prajantv et al., 2019);
• Soil fertility, rainfall, pests and diseases and agronomic practices (Bugri, 2008); and,
• Others include farmer’s experience (Dilebo, 2019) and hectarage planted (Mugweru et al., 2016).
Thus, factors that have the potential to influence the output (production) of coffee can be modelled implicitly as follows:
PROD = f (production inputs, access to support institutions, biotic factors, abiotic factors, technology, market price, producers’ socioeconomic factors, E) (1)
Production inputs include land, labour and management, access to support institutions include extension services, credit facility/finance and membership of cooperative societies. The biotic factors include pests, diseases, weeds, and coffee species. Abiotic factors include temperature, rainfall, altitude, soil type, soil pH (i.e., the state of acidity or alkalinity of the soil) and humidity. In terms of technology, it includes the access to equipment, machines and tools for cultivation, maintenance of coffee trees, harvesting and processing coffee, improved coffee seedlings. Producers’ socioeconomic factors include personal attributes of the farmer such years of experience in production of coffee, educational level, income level, age, and marital status. Production cost includes market price of outputs and inputs. The random error is E.
Data analysisData were analysed using descriptive and inferential statistics and graphs. We used an Ordinary Least Squares (OLS) regression model. The regression model was used to examine the influence of annual area of coffee harvested, extension services, and prices of coffee on the total annual quantity of coffee produced in PNG and the top five coffee-producing countries.
We had wanted to explore as many factors as possible that influence coffee output; however, this is possible if primary data can be used to complement appropriate secondary data for the study. We had to rely on secondary data alone for this study because the collection of primary data became impossible with the outbreak of COVID-19 pandemic in PNG, in 2020. In fact, we have prepared a data collection instrument for interviewing coffee farmers from whom primary data were to be collected. As we could not conduct the planned survey, our analysis is based primarily on the secondary data collected from databases and reports.
Our analysis focuses on the influence of annual area of coffee field harvested, extension services and world market price of Arabica and Robusta coffee on annual quantity of coffee produced in PNG and top five coffee-producing countries in the world.
As the annual quantity of coffee produced by each of the top five coffee-producing countries and PNG are continuous variables, OLS regression model is used to examine the factors influencing it. Since OLS regression analysis assumed homoscedasticity of the random errors, i.e., that error terms from one period to another has a constant variance (Greene, 2003), we applied the log-log form transformation to correct for heteroscedasticity and auto-correlation in our model.
This involves the transformation of the annual area of coffee field harvested, annual quantity of coffee produced, world market price of Arabica coffee and Robusta coffee into log forms using the LIMDEP Statistical Software (Econometric Software Inc., 2007). The heteroscedasticity was further corrected using the White’s heteroscedastic consistent variance estimator (Greene, 2003). The functional form of the model is as follows:
15
Log(PROD) =β0+ β1Log(AREA)+ß2CICEXT+β3Log(ARABPRC)
+β4Log(ROBUPRC)+ E (2)
Where PROD is the total quantity of coffee produced per annum in tonne,
β is the vector of parameters to be estimated,
AREA is the size of coffee field harvested annually in hectare,
CICEXT is extension services provided by the CIC to farmers in PNG, 1 for year (from 1990 to 2018) when made available, 0, otherwise years (i.e., years before 1990).
ARABPRC is the annual world market price for Arabica coffee per tonne in US$,
ROBUPRC is the annual world market price for Robusta coffee per tonne in US$,
and E is the random error term, which is assumed to be independently and identically distributed.
We first estimated six models, one each for the top five coffee-producing countries and for PNG. However, the high correlation between ARABPRC and ROBUPRC made us run a separate series of models for the influence of ROBUPRC on coffee produced. However, as Robusta is not grown in Ethiopia, the country was excluded from that analysis. To compare the PNG model with that of the top five coffee-producing countries, we estimated a model with and without CICEXT. Thus, we estimated a total of 12 OLS models (seven contained ARABPRC [Table 3] and five contained ROBUPRC [Table 4]).
It is important to note that the CICEXT variable was used only in the PNG model because we do not have information about the time (year) when there was availability of extension services in the top five coffee-producing countries. The CIC began to provide extension services to PNG coffee farmers from 1990.
f the top five coffee-producing countries that we iOf the top five coffee-producing countries that we investigated, Brazil had the largest area of cof-fee field harvested annually from 1998 to 2018 (Figure 3). The area harvested ranges from 1.8

16
million hectares in 2017 to 2.39 million hectares in 2003. It decreased from 2.07 million hectares in 1998 to 1.87 million hectares in 2018, a de-crease o
17
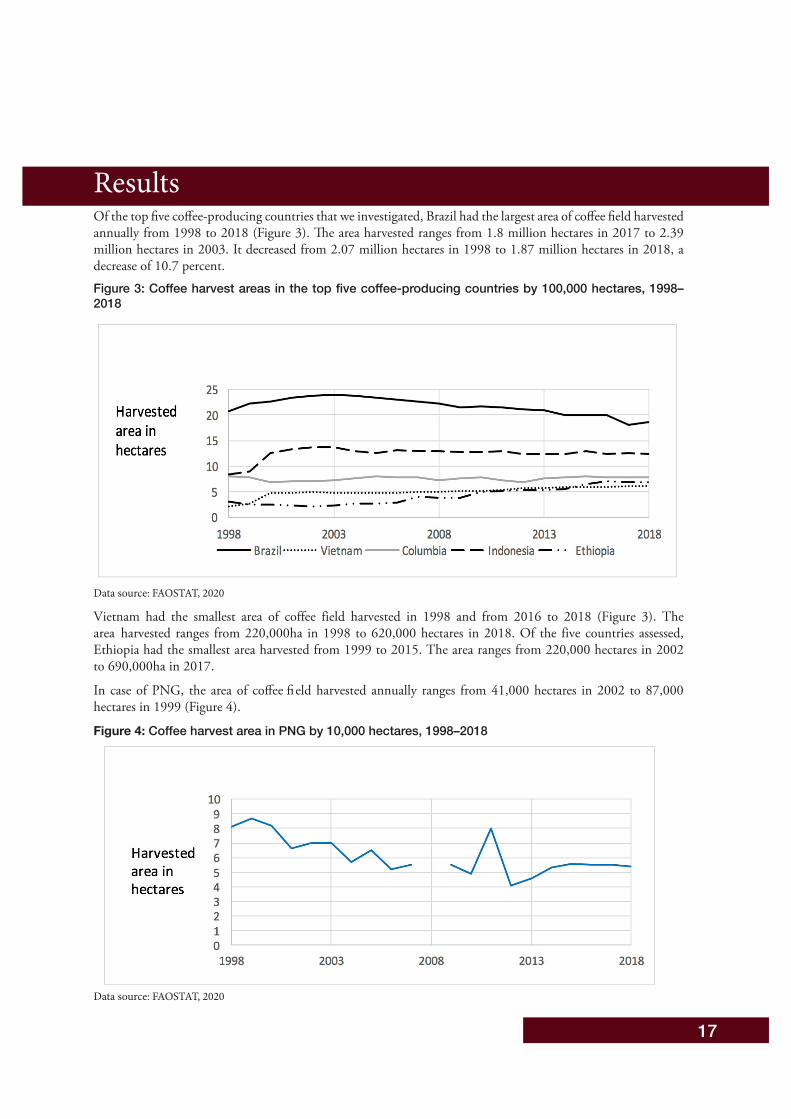
Of the top five coffee-producing countries that we investigated, Brazil had the largest area of coffee field harvested annually from 1998 to 2018 (Figure 3). The area harvested ranges from 1.8 million hectares in 2017 to 2.39 million hectares in 2003. It decreased from 2.07 million hectares in 1998 to 1.87 million hectares in 2018, a decrease of 10.7 percent. Figure 3: Coffee harvest areas in the top five coffee-producing countries by 100,000 hectares, 1998–2018
Data source: FAOSTAT, 2020
Vietnam had the smallest area of coffee field harvested in 1998 and from 2016 to 2018 (Figure 3). The area harvested ranges from 220,000ha in 1998 to 620,000 hectares in 2018. Of the five countries assessed, Ethiopia had the smallest area harvested from 1999 to 2015. The area ranges from 220,000 hectares in 2002 to 690,000ha in 2017.
In case of PNG, the area of coffee field harvested annually ranges from 41,000 hectares in 2002 to 87,000 hectares in 1999 (Figure 4).
Figure 4: Coffee harvest area in PNG by 10,000 hectares, 1998–2018
Data source: FAOSTAT, 2020
Results
18
Area of coffee field harvested in PNG decreased from 81,000 hectares in 1998 to 54,000 hectares in 2018, a decrease of 33 percent. In comparison to the smallest area of coffee field harvest among the top five countries, PNG’s largest area harvested (87,000 hectares) is lower than the smallest harvested area (220,000 hectares) among these countries by 71 percent.
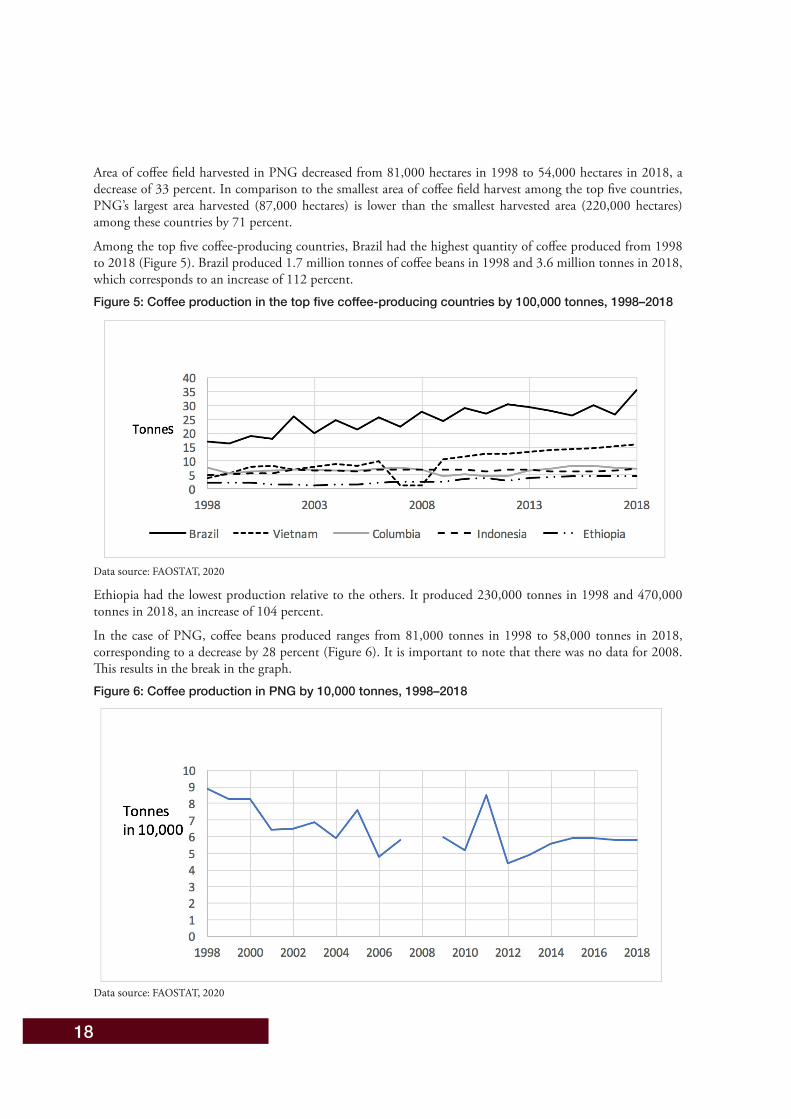
Among the top five coffee-producing countries, Brazil had the highest quantity of coffee produced from 1998 to 2018 (Figure 5). Brazil produced 1.7 million tonnes of coffee beans in 1998 and 3.6 million tonnes in 2018, which corresponds to an increase of 112 percent. Figure 5: Coffee production in the top five coffee-producing countries by 100,000 tonnes, 1998–2018
Data source: FAOSTAT, 2020
Ethiopia had the lowest production relative to the others. It produced 230,000 tonnes in 1998 and 470,000 tonnes in 2018, an increase of 104 percent.
In the case of PNG, coffee beans produced ranges from 81,000 tonnes in 1998 to 58,000 tonnes in 2018, corresponding to a decrease by 28 percent (Figure 6). It is important to note that there was no data for 2008. This results in the break in the graph.Figure 6: Coffee production in PNG by 10,000 tonnes, 1998–2018
Data source: FAOSTAT, 2020
19
PNG’s annual coffee production is lower than that of all top five coffee-producing countries over the period of our study (Figures 5 and 6).
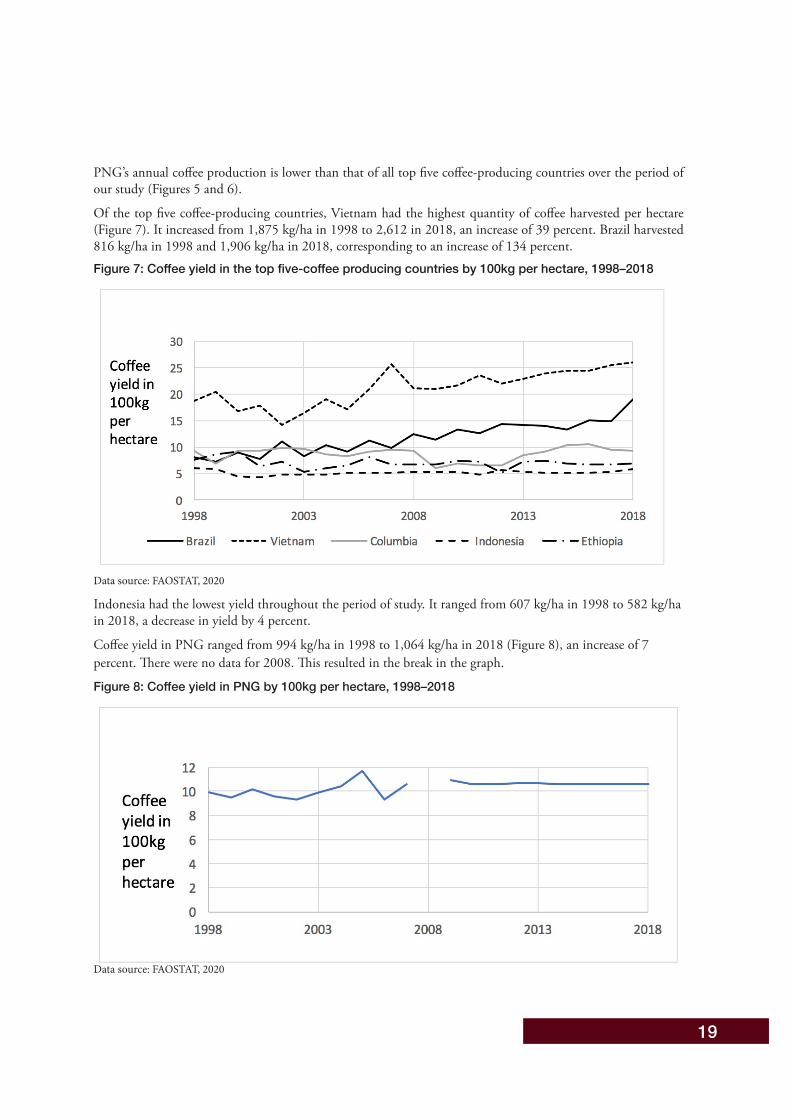
Of the top five coffee-producing countries, Vietnam had the highest quantity of coffee harvested per hectare (Figure 7). It increased from 1,875 kg/ha in 1998 to 2,612 in 2018, an increase of 39 percent. Brazil harvested 816 kg/ha in 1998 and 1,906 kg/ha in 2018, corresponding to an increase of 134 percent. Figure 7: Coffee yield in the top five-coffee producing countries by 100kg per hectare, 1998–2018
Data source: FAOSTAT, 2020
Indonesia had the lowest yield throughout the period of study. It ranged from 607 kg/ha in 1998 to 582 kg/ha in 2018, a decrease in yield by 4 percent.
Coffee yield in PNG ranged from 994 kg/ha in 1998 to 1,064 kg/ha in 2018 (Figure 8), an increase of 7 percent. There were no data for 2008. This resulted in the break in the graph.
Figure 8: Coffee yield in PNG by 100kg per hectare, 1998–2018
Data source: FAOSTAT, 2020
20
PNG had its highest yield in 2005 (1,171 kg/ha) and its lowest in 2002 and 2006 (930 kg/ha). Coffee yield in PNG is generally higher than that of Indonesia, Ethiopia, and Columbia (Figures 7 and 8). In fact, coffee yield in PNG was higher than that of Brazil from 1998 to 2007.
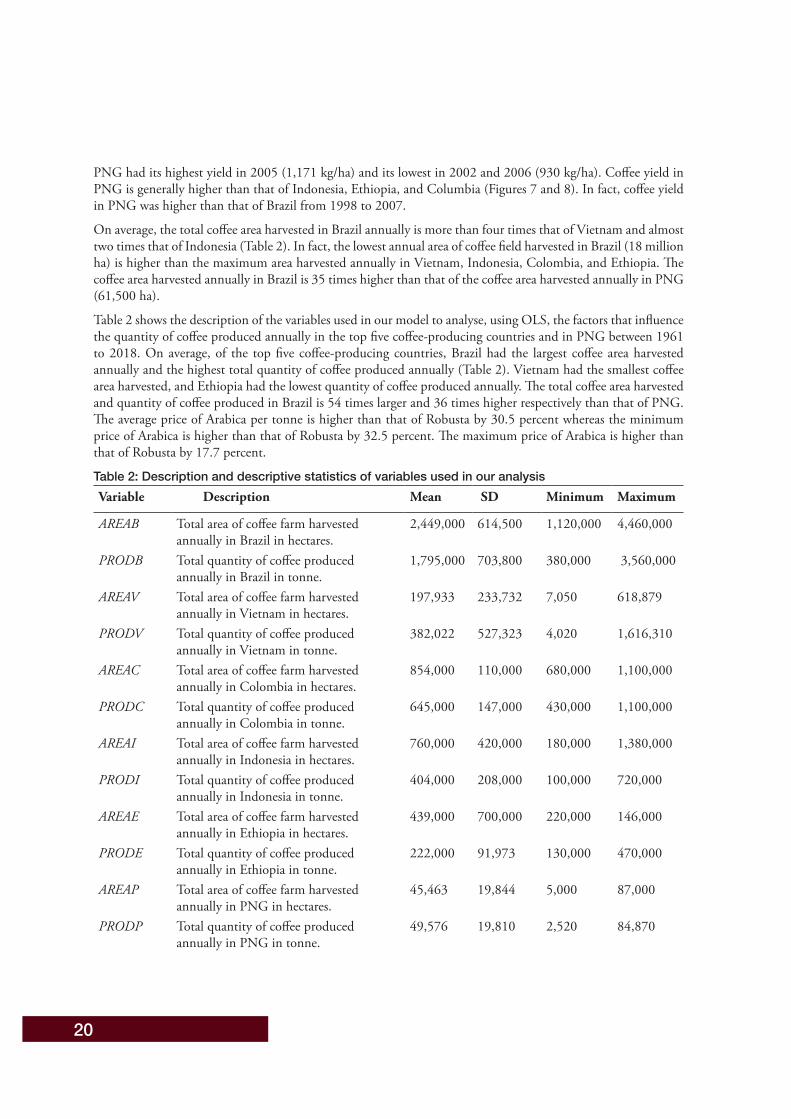
On average, the total coffee area harvested in Brazil annually is more than four times that of Vietnam and almost two times that of Indonesia (Table 2). In fact, the lowest annual area of coffee field harvested in Brazil (18 million ha) is higher than the maximum area harvested annually in Vietnam, Indonesia, Colombia, and Ethiopia. The coffee area harvested annually in Brazil is 35 times higher than that of the coffee area harvested annually in PNG (61,500 ha).
Table 2 shows the description of the variables used in our model to analyse, using OLS, the factors that influence the quantity of coffee produced annually in the top five coffee-producing countries and in PNG between 1961 to 2018. On average, of the top five coffee-producing countries, Brazil had the largest coffee area harvested annually and the highest total quantity of coffee produced annually (Table 2). Vietnam had the smallest coffee area harvested, and Ethiopia had the lowest quantity of coffee produced annually. The total coffee area harvested and quantity of coffee produced in Brazil is 54 times larger and 36 times higher respectively than that of PNG. The average price of Arabica per tonne is higher than that of Robusta by 30.5 percent whereas the minimum price of Arabica is higher than that of Robusta by 32.5 percent. The maximum price of Arabica is higher than that of Robusta by 17.7 percent.
Table 2: Description and descriptive statistics of variables used in our analysisVariable Description Mean SD Minimum Maximum
AREAB Total area of coffee farm harvested annually in Brazil in hectares.
2,449,000 614,500 1,120,000 4,460,000
PRODB Total quantity of coffee produced annually in Brazil in tonne.
1,795,000 703,800 380,000 3,560,000
AREAV Total area of coffee farm harvested annually in Vietnam in hectares.
197,933 233,732 7,050 618,879
PRODV Total quantity of coffee produced annually in Vietnam in tonne.
382,022 527,323 4,020 1,616,310
AREAC Total area of coffee farm harvested annually in Colombia in hectares.
854,000 110,000 680,000 1,100,000
PRODC Total quantity of coffee produced annually in Colombia in tonne.
645,000 147,000 430,000 1,100,000
AREAI Total area of coffee farm harvested annually in Indonesia in hectares.
760,000 420,000 180,000 1,380,000
PRODI Total quantity of coffee produced annually in Indonesia in tonne.
404,000 208,000 100,000 720,000
AREAE Total area of coffee farm harvested annually in Ethiopia in hectares.
439,000 700,000 220,000 146,000
PRODE Total quantity of coffee produced annually in Ethiopia in tonne.
222,000 91,973 130,000 470,000
AREAP Total area of coffee farm harvested annually in PNG in hectares.
45,463 19,844 5,000 87,000
PRODP Total quantity of coffee produced annually in PNG in tonne.
49,576 19,810 2,520 84,870
21
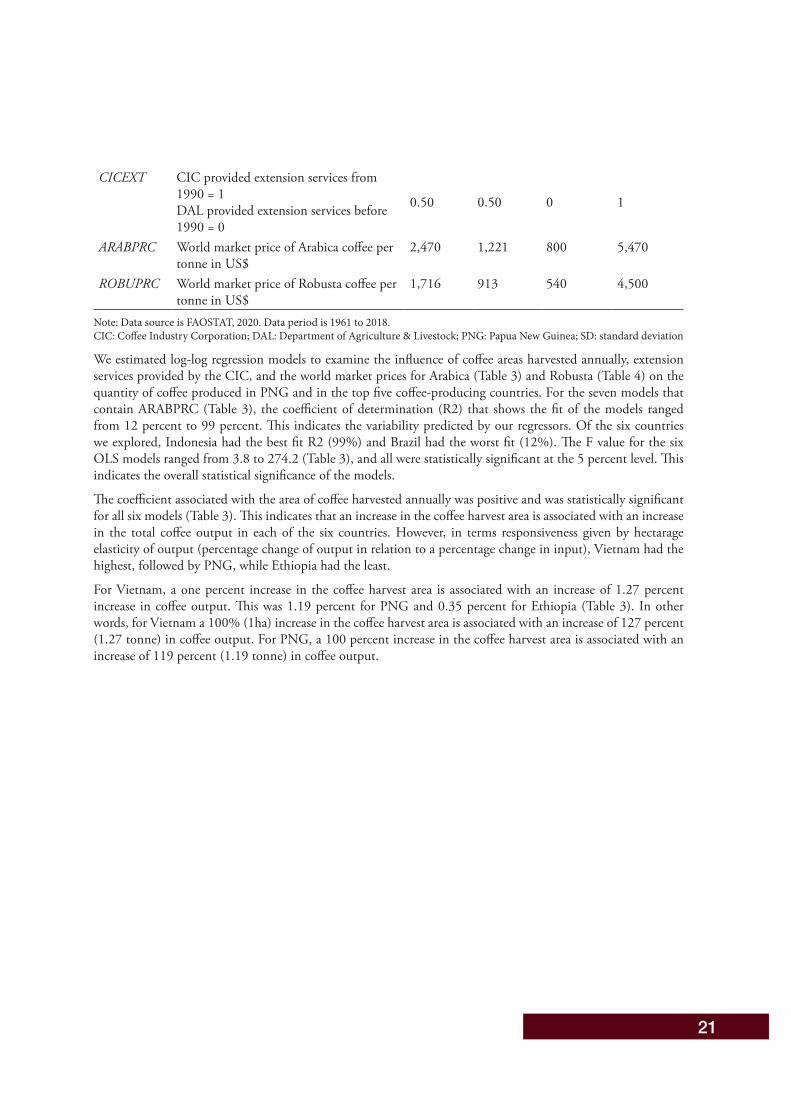
CICEXT CIC provided extension services from 1990 = 1 DAL provided extension services before 1990 = 0
0.50 0.50 0 1
ARABPRC World market price of Arabica coffee per tonne in US$
2,470 1,221 800 5,470
ROBUPRC World market price of Robusta coffee per tonne in US$
1,716 913 540 4,500
Note: Data source is FAOSTAT, 2020. Data period is 1961 to 2018. CIC: Coffee Industry Corporation; DAL: Department of Agriculture & Livestock; PNG: Papua New Guinea; SD: standard deviation
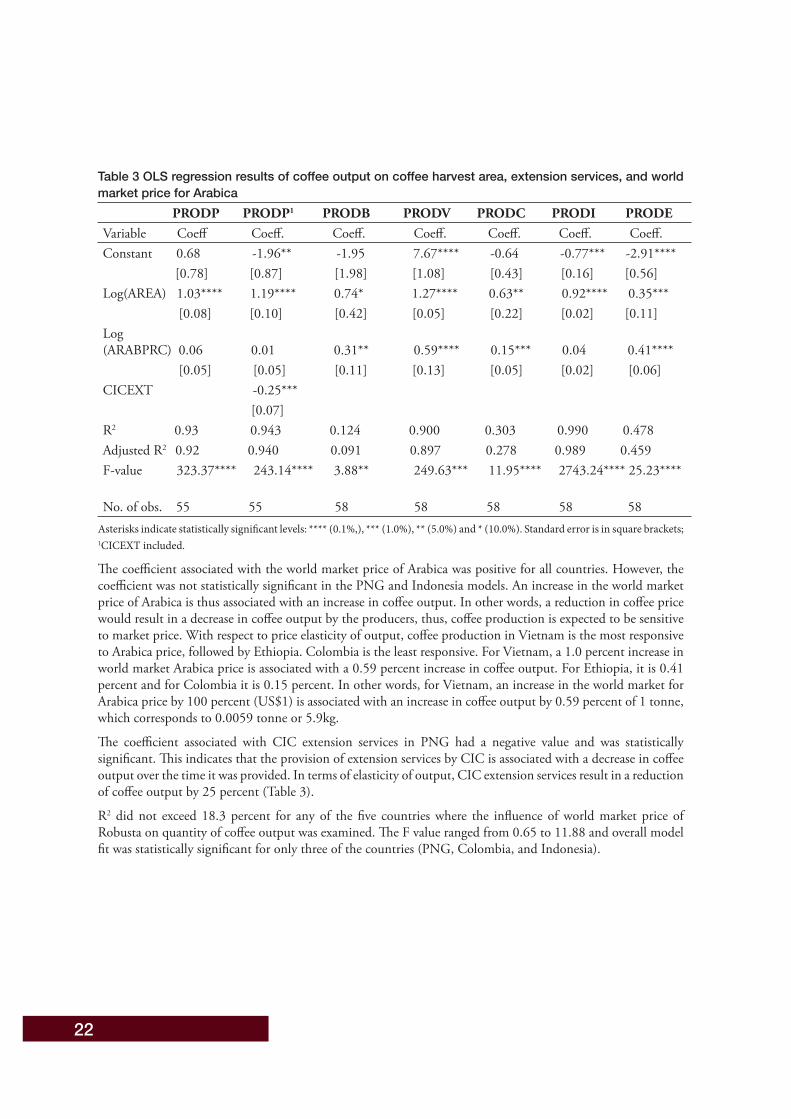
We estimated log-log regression models to examine the influence of coffee areas harvested annually, extension services provided by the CIC, and the world market prices for Arabica (Table 3) and Robusta (Table 4) on the quantity of coffee produced in PNG and in the top five coffee-producing countries. For the seven models that contain ARABPRC (Table 3), the coefficient of determination (R2) that shows the fit of the models ranged from 12 percent to 99 percent. This indicates the variability predicted by our regressors. Of the six countries we explored, Indonesia had the best fit R2 (99%) and Brazil had the worst fit (12%). The F value for the six OLS models ranged from 3.8 to 274.2 (Table 3), and all were statistically significant at the 5 percent level. This indicates the overall statistical significance of the models.
The coefficient associated with the area of coffee harvested annually was positive and was statistically significant for all six models (Table 3). This indicates that an increase in the coffee harvest area is associated with an increase in the total coffee output in each of the six countries. However, in terms responsiveness given by hectarage elasticity of output (percentage change of output in relation to a percentage change in input), Vietnam had the highest, followed by PNG, while Ethiopia had the least.
For Vietnam, a one percent increase in the coffee harvest area is associated with an increase of 1.27 percent increase in coffee output. This was 1.19 percent for PNG and 0.35 percent for Ethiopia (Table 3). In other words, for Vietnam a 100% (1ha) increase in the coffee harvest area is associated with an increase of 127 percent (1.27 tonne) in coffee output. For PNG, a 100 percent increase in the coffee harvest area is associated with an increase of 119 percent (1.19 tonne) in coffee output.
22
Table 3 OLS regression results of coffee output on coffee harvest area, extension services, and world market price for Arabica PRODP PRODP1 PRODB PRODV PRODC PRODI PRODE Variable Coeff Coeff. Coeff. Coeff. Coeff. Coeff. Coeff.Constant 0.68 -1.96** -1.95 7.67**** -0.64 -0.77*** -2.91**** [0.78] [0.87] [1.98] [1.08] [0.43] [0.16] [0.56]Log(AREA) 1.03**** 1.19**** 0.74* 1.27**** 0.63** 0.92**** 0.35*** [0.08] [0.10] [0.42] [0.05] [0.22] [0.02] [0.11]Log(ARABPRC) 0.06 0.01 0.31** 0.59**** 0.15*** 0.04 0.41**** [0.05] [0.05] [0.11] [0.13] [0.05] [0.02] [0.06]CICEXT -0.25*** [0.07]R2 0.93 0.943 0.124 0.900 0.303 0.990 0.478 Adjusted R2 0.92 0.940 0.091 0.897 0.278 0.989 0.459F-value 323.37**** 243.14**** 3.88** 249.63*** 11.95**** 2743.24**** 25.23**** No. of obs. 55 55 58 58 58 58 58
Asterisks indicate statistically significant levels: **** (0.1%,), *** (1.0%), ** (5.0%) and * (10.0%). Standard error is in square brackets; 1CICEXT included.
The coefficient associated with the world market price of Arabica was positive for all countries. However, the coefficient was not statistically significant in the PNG and Indonesia models. An increase in the world market price of Arabica is thus associated with an increase in coffee output. In other words, a reduction in coffee price would result in a decrease in coffee output by the producers, thus, coffee production is expected to be sensitive to market price. With respect to price elasticity of output, coffee production in Vietnam is the most responsive to Arabica price, followed by Ethiopia. Colombia is the least responsive. For Vietnam, a 1.0 percent increase in world market Arabica price is associated with a 0.59 percent increase in coffee output. For Ethiopia, it is 0.41 percent and for Colombia it is 0.15 percent. In other words, for Vietnam, an increase in the world market for Arabica price by 100 percent (US$1) is associated with an increase in coffee output by 0.59 percent of 1 tonne, which corresponds to 0.0059 tonne or 5.9kg.
The coefficient associated with CIC extension services in PNG had a negative value and was statistically significant. This indicates that the provision of extension services by CIC is associated with a decrease in coffee output over the time it was provided. In terms of elasticity of output, CIC extension services result in a reduction of coffee output by 25 percent (Table 3).
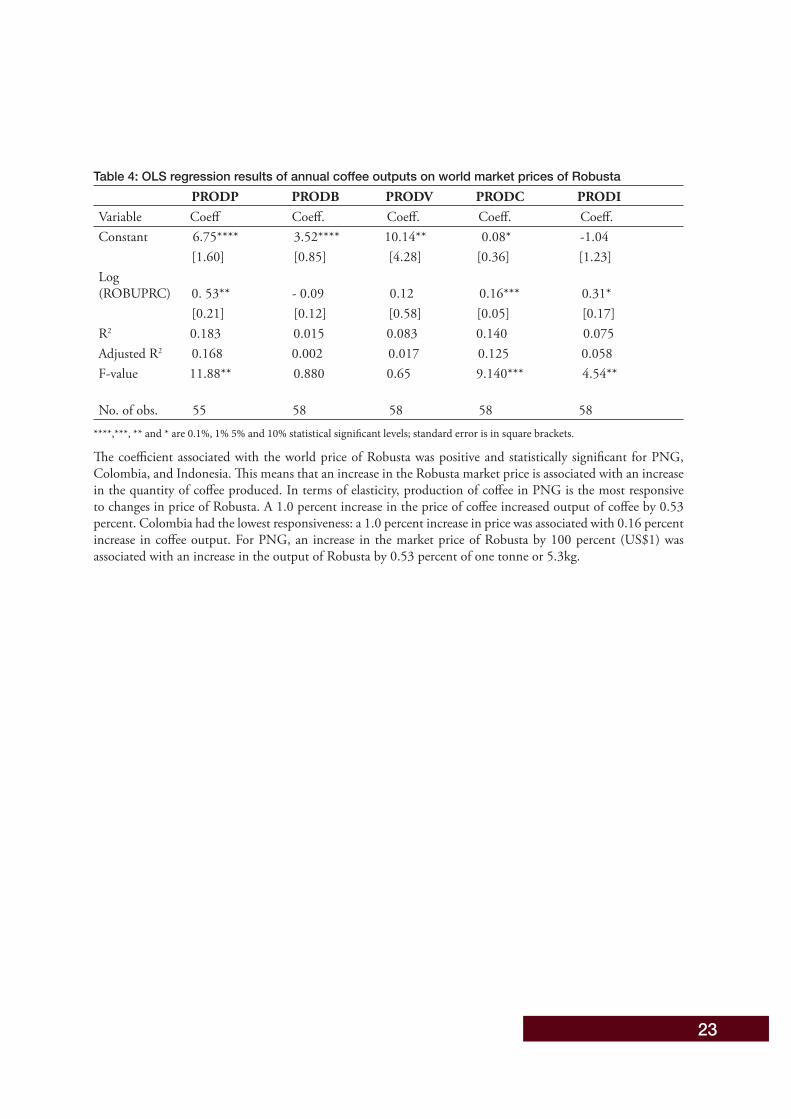
R2 did not exceed 18.3 percent for any of the five countries where the influence of world market price of Robusta on quantity of coffee output was examined. The F value ranged from 0.65 to 11.88 and overall model fit was statistically significant for only three of the countries (PNG, Colombia, and Indonesia).
23
Table 4: OLS regression results of annual coffee outputs on world market prices of Robusta PRODP PRODB PRODV PRODC PRODI Variable Coeff Coeff. Coeff. Coeff. Coeff. Constant 6.75**** 3.52**** 10.14** 0.08* -1.04 [1.60] [0.85] [4.28] [0.36] [1.23] Log(ROBUPRC) 0. 53** - 0.09 0.12 0.16*** 0.31* [0.21] [0.12] [0.58] [0.05] [0.17] R2 0.183 0.015 0.083 0.140 0.075 Adjusted R2 0.168 0.002 0.017 0.125 0.058 F-value 11.88** 0.880 0.65 9.140*** 4.54** No. of obs. 55 58 58 58 58
****,***, ** and * are 0.1%, 1% 5% and 10% statistical significant levels; standard error is in square brackets.
The coefficient associated with the world price of Robusta was positive and statistically significant for PNG, Colombia, and Indonesia. This means that an increase in the Robusta market price is associated with an increase in the quantity of coffee produced. In terms of elasticity, production of coffee in PNG is the most responsive to changes in price of Robusta. A 1.0 percent increase in the price of coffee increased output of coffee by 0.53 percent. Colombia had the lowest responsiveness: a 1.0 percent increase in price was associated with 0.16 percent increase in coffee output. For PNG, an increase in the market price of Robusta by 100 percent (US$1) was associated with an increase in the output of Robusta by 0.53 percent of one tonne or 5.3kg.

24
25
Our review of the literature revealed that the challenges to coffee production and processing in PNG include the following:
• Inadequate access to basic infrastructure and facilities. Smallholder farmers, especially those who reside in remote areas, find it difficult to access facilities for milling and storage of coffee. There are no good road networks to transport farm inputs and products to and from their coffee farms.
• Farm management practices. Most of the coffee trees tend to have passed their economic productive age, which has resulted in a reduction of crop yield. Necessary coffee husbandry practices, such as regular pruning and provision of shade trees, are either delayed or not done by producers.
• Diminishing yield and inconsistent quality of product. The quality of coffee produced in PNG tends to be declining. For example, the quality profile of coffee for exports in 2015 to 2016 shows that 72 percent of exports were low grade (Y1-Y3 or lower). Only 28.0 percent were high grade and only 6.0 percent was of the highest quality. (A or AA grade) (AECOM, 2018).
• Inadequate extension services. Coffee farmers, especially smallholders, need information about modern coffee production techniques. However, they often find it difficult to access services from extension agents.
• Technology. Modern technology can assist coffee farmers improve productivity and make coffee production more attractive. However, coffee farmers in PNG often lack modern technology; this restricts their ability to achieve their full potential in the coffee business.
• Change of cropping pattern. Some coffee growers convert whole or part of their coffee fields to other more economical crops because of a decline in coffee market price or issues associated with access to coffee processing facilities. The switch to other crops may also be because of shortages of labour for necessary farm operations such as pruning coffee trees and picking coffee beans.
• Pests and diseases. Pests and diseases such as coffee berry borer, coffee leaf rust, coffee green scale and pink disease (DAL, 2020) are other issues militating against coffee production.
• Unfavourable market prices. The price that smallholder producers receive for their coffee is often less than the premium price that exporters receive. This often discourages smallholders from paying much attention to necessary farm practices, which impacts the productivity of coffee.
• Access to finance. Some coffee farmers wish to expand their coffee farm or purchase equipment for processing coffee. However, they often find it difficult to access loans from commercial banks.
• Access to land for commercial coffee production. For coffee production to be profitable, especially in terms of economies of scale, a large area of land is needed. However, it is often difficult to access large areas of land with proper titles. This is because the State-owned land associated with proper titles is almost exhausted. Communal-owned land, which accounts for almost 97 percent of the total land in PNG, does not have proper titles.
• Security issues. Theft of coffee products, especially in rural areas, is often a major concern for coffee farmers and increases production costs and losses.
Findings from review of the literature on key challenges to coffee production and processing in PNG

26
27
Discussion The findings from this study show that PNG has the potential to become one of the leading coffee-producing countries in the world. The country’s climatic and environmental conditions are suitable for growing various species of coffee, which gives it an edge over some top coffee-producing countries. This could be the reason that PNG, on average, had a higher coffee yield per hectare compared to all top five coffee-producing countries except Vietnam, as revealed by our analysis. However, size of the area of coffee fields harvested and quantity of coffee produced by PNG have continued to be lower than those of other top five coffee-producing countries that we examined in this study. The PPAP being implemented by GoPNG in collaboration with the World Bank has the potential to raise the coffee production of PNG and make the country more competitive in the coffee market. However, only some coffee growers benefit from the PPAP, which might make it difficult to achieve the desired increase in coffee production. For the PPAP to contribute more meaningfully to the coffee sector, there is a need for more effective and efficient mechanisms to monitor and evaluate the PPAP. The Project should focus more on the replanting of coffee trees and rehabilitation of coffee plantations. All coffee growers should have access (i.e., an all inclusion programme) to benefit from the PPAP so that total coffee production can improve in PNG.
Most of the coffee trees in PNG appear to have passed their economic productive age. Some farmers have continued to convert coffee fields to short rotation crops such as broccoli, potato, and onion. This contributes to the decline in the quantity of coffee produced in PNG. Coffee plantations that have the potential to contribute immensely to the quantity of coffee produced in PNG are either deteriorating or are not functional, which further contributes to the decline in coffee production.
If the intention is to increase coffee production in PNG, GoPNG should consider providing loan facilities to smallholder coffee farmers and coffee plantation owners who want to expand coffee production or rehabilitate their plantations. However, an effective monitoring mechanism should be established to see that the loans are used for their intended purpose. This initiative was used successfully to increase coffee production in Brazil during a coffee industry crisis (Watson & Achinelli, 2008). Modernisation of coffee production systems and innovation techniques should be encouraged by the GoPNG through its agencies such as CIC and the DAL especially in terms of providing extension services to smallholder coffee farmers. According to Volsi et al. (2019), modernisation of coffee production systems and innovative techniques contributed to making Brazil a top coffee producer in the world. The smallholders should be trained to practice mixed cropping on their coffee fields as a strategy to minimise risks associated with the volatility in coffee market prices. This has the potential to discourage the decimation or conversion of coffee fields for the cultivation of other crops.
PNG can improve the yield and quality of its coffee by funding more research into the development of coffee varieties that provide higher yields and are resistant to diseases. The focus should be on both Arabica and varieties of Robusta that provide high yield. Although the Highlands region is the highest producer of coffee in PNG, regions in the lowlands such as Momase and Southern should be encouraged to expand the cultivation of coffee. Research institutes such as the PNG National Agricultural Research Institute (NARI) in collaboration with CIC should be funded to conduct research to develop a highly competitive PNG coffee speciality. This has the potential of giving PNG its own special coffee; as seen in Indonesia, Vietnam, and Ethiopia, this adds more value to the country’s coffee business. This approach aligns with the practice adopted by the Vietnamese government that has supported several initiatives to improve quality of coffee for export (ICO, 2019). The initiatives resulted in the development of several varieties of Arabica that have high productivity and resistance to pests and diseases.
If PNG’s aim is to increase coffee yield, the country has much to learn from Vietnam in terms of coffee farm management practices. In Indonesia, research resulted in the development of a speciality called kopi luwak, which is the most expensive coffee bean in the world (Bale, 2016; Nelson, 2007). Although PNG has its own speciality coffee (e.g., Blue Mountain, Arusha, Mundo Novo, Catimore, and Caturra), they are not as expensive as kopi luwak. Coffee researchers in PNG need to consider doing more research into speciality coffee by drawing lessons from Indonesia.
28
The wet processing method improves the quality of coffee; however, dry processing is more common among smallholder coffee farmers in PNG. Some coffee growers, especially smallholders, find it difficult to access facilities for processing, which lowers the quality of coffee they produce. Furthermore, agents who buy coffee from producers do not consider quality when determining the price of coffee beans, which discourages producers from putting more effort to produce high quality coffee. The wet processing method should be promoted among smallholders, who can apply wet processing to the coffee on their farms and move the treated coffee to the nearest mills. The PNG Smallholder Coffee Growers Association (SCGA) should consider investing in coffee mills and in coffee collection points to assist its members process wet coffee as is done by the Colombian NFCG (Equal Exchange, 2020). This should reduce the coffee processing difficulties faced by some coffee growers in PNG and may even encourage people to enter the coffee business. It is important to note that in the past, plantations and rural coffee mills in PNG provided a centralised facility for smallholders to process their coffee (Sengere et al., 2019; Curry et al., 2019). However, when most of the coffee plantations and rural mills became no longer functional, smallholder coffee farmers began to produce coffee of inconsistent quality. Thus, PNG can draw lessons from the centralised system used in the past to develop a more effective coffee processing mechanism that produces quality coffee.
Our findings revealed that for all the countries we examined, an increase in the coffee harvest area results in an increase in the production of coffee. This aligns with the findings of Dilebo (2019) whose Ethiopian study of the determinants of coffee market supply found that an increase in coffee farm size increases coffee supply to the market. In an Estonian study of determinants of agricultural farm productivity, Looga et al. (2018) found that an increase in farm size increases total production of agricultural produce. This suggests that if GoPNG’s intention is to increase the production of coffee in the country, it should consider increasing the area of land covered by coffee. This can be achieved by providing incentives that discourage the conversion of coffee fields to other crops while encouraging people to cultivate more coffee trees. The incentive could be subsidies to farmers who grow coffee. Coffee plantations that are in deplorable conditions should be rehabilitated and new ones established.
The Government should have a target on the maximum area of land that should be allocated to coffee production so that some resources can be channelled into the improvement of coffee quality and productivity. This is in line with Vietnamese strategy in which the Government restricts the coffee cultivated areas to 600,000 hectares to focus its efforts on improving coffee quality (ICO, 2020). GoPNG can draw lessons from the Vietnamese Government by simultaneously expanding coffee production and improving coffee quality. Although some coffee growers may be willing to expand coffee production, they may be restricted by the unavailability of land, especially customary land with proper titles for sustainable development (Wangi & Ezebilo, 2017). This calls for the Department of Lands and Physical Planning and its allies to address the issues associated with access to customary land with proper titles for development. Although our findings show that PNG had higher coffee production per hectare than four of the top five coffee-producing countries (Vietnam was the exception), there is still room to raise the level of yield.
According to the law of supply, an increase in market price for a good will result in an increase in the quantity of that good being supplied to the market by producers (Gravelle & Rees, 2004). In our study, we found that an increase in the world market price of Arabica and Robusta increased the quantity of coffee produced by farmers, which conforms to the law of supply. A possible reason is that market price provides coffee producers with economic incentives to produce more coffee to get more income. Our findings align with Prajantv et al.’s (2019), who found in their Indonesian study that world market price influences coffee production positively. Mugweru et al. (2016) found in their Kenyan study that an increase in coffee price results in an increase in coffee output. It is important to note that of the six countries we examined, coffee production in PNG is the most sensitive to changes to the market price of Robusta, whereas coffee production in Vietnam is the most sensitive to changes in the price of Arabica. The findings suggest mechanisms are needed to absorb shocks that may be triggered by changes in coffee market prices. PNG can promote this by encouraging coffee farmers to diversify their coffee production by engaging in downstream processing to add more value to the coffee they produce.
The government of most countries initiate policies and strategies intended to provide agricultural extension
29
services to promote agricultural production by disseminating relevant information and technologies. We found that, on average, the extension services provided by CIC to PNG coffee farmers have not been able to increase production per hectare over the years. This finding is aligned with findings of Baloch and Thapa (2018), who found in their Pakistani study of the effect of agricultural extension services on date palm production that appropriate extension services increase production. The disparity between our findings may be because the remoteness of some of coffee-producing areas in PNG makes it difficult for extension officers to reach some farmers. Also, the officers may not have been using a participatory approach to disseminate messages, which may make it difficult for farmers to adopt new innovations. This calls for GoPNG to conduct an extensive evaluation of the extension activities of the CIC to identify areas of weakness and strength and strategies to address the weaknesses.
We found in our review of the literature that coffee growers in PNG face challenges that restrict them from achieving their full potential in the production and processing of coffee. GoPNG should address these challenges through its agencies such as DAL, CIC, NARI and the Department of Lands and Physical Planning. Effective agricultural extension services are vital for providing information about modern production and processing techniques to coffee growers. However, the services have not often been made available to some coffee growers, especially smallholders. This may explain why some coffee growers have converted their coffee fields to other crops. Ezebilo (2015), in his study of PNG’s drive to achieve self-sufficiency in food production, suggested there is a need to improve the current condition of extension services.
The CIC should put more effort into providing extension services to coffee growers in coffee-producing provinces. Because of the poor road networks and inadequate access to facilities for milling and storage, GoPNG should, through the Department of Implementation and Rural Development, provide rural feeder roads to improve road networks in rural areas. Coffee farmer cooperatives (Altman et al., 2020), PNG SCGA, and other coffee grower groups should consider investing in coffee milling equipment and establish coffee bean collection points where coffee growers can deposit their stock for milling as done in Columbia (Equal Exchange, 2020). This mechanism can also be used to assist smallholder growers to market their coffee stock as currently being promoted by the PNG SCGA.
The National Development Bank should consider providing loans to promising coffee growers at low interest rates, in a non-cumbersome manner, because ease of access to loans is crucial to its use. This could boost coffee production in PNG and provide more job opportunities in the coffee industry. Market is one of the most important factors that provides coffee growers an incentive to engage in coffee production. However, growers do not often get the expected prices for their products because of several agents in the market chain, which tend to dwarf the price. Furthermore, the agents do not account for the quality of coffee being purchased, which means that they pay flat rates for coffee of different qualities. This reduces the willingness of coffee growers to engage fully in activities required to produce quality coffee, which tends to have an adverse effect on coffee output. The PNG SCGA has been attempting to export coffee on behalf of smallholder growers, in order to get a better price for coffee. This is a good initiative that can motivate the growers to continue in their coffee business. However, it is not clear how the SCGA determines the price of the coffee being exported.
Lessons that PNG can learn from the top five coffee-producing countriesIf PNG aspires to be one of the top coffee-producing countries in the world, it should consider drawing the following lessons from the top five coffee-producing countries in the world:
• Coffee plantations can trigger an increase in coffee production and increase profit from coffee production through economies of scale as evidenced in Brazil (Mello, 2012). PNG needs to rehabilitate its coffee plantations and establish new plantations in various coffee-producing provinces. The plantations will not only increase coffee production in the country, they will also contribute by providing more jobs and increasing PNG’s export base.
• There is a need for GoPNG to encourage modernisation of coffee production systems through promoting effective extension services and training of all groups of coffee grower on modern systems and innovations
30
in producing coffee. There is also a need to provide more funds for research in areas such as development of new coffee varieties and farm management practices that aim at increasing yield. Brazil has used the strategy being advocated in this study successfully by encouraging innovative production techniques to improve competitiveness and product quality (Volsi et al., 2019).
• GoPNG should consider providing agricultural support to farmers who grow coffee through loans facility at low interest rates and easy access. The support has the potential to encourage farmers to grow coffee and reduce the tendency of converting coffee fields to other crops as being currently experienced in some provinces of PNG. Brazil has used agricultural support through loan facility to boost coffee production (Watson & Achinelli, 2008).
• If Robusta coffee is managed properly, it can contribute to the production of high-quality coffee that can compete with Arabica. Vietnam, which produces mostly Robusta coffee has successfully improved the species through Government’s initiatives aimed at improving coffee for export (ICO, 2019). If PNG adopts the strategy, it has the potential to expand coffee production and improve yields and quality of coffee produced in the country.
• Cultivation of disease resistant coffee varieties and avoidance of the abuse of pesticides use in coffee growing areas are options to pursue. Colombia, which used to be the second largest coffee producer in the world, dropped to the third position because of the leaf rust disease that ravaged its coffee industry. However, the problem was addressed using disease resistant varieties of coffee. But the coffee industry is still facing environmental problems because of overuse of pesticides, which contaminates soil and water. PNG can increase and sustain production of high quality by cultivating disease resistant varieties of coffee. The abuse of use of pesticides by coffee growers can be avoided by providing coffee growers information on the appropriate quantity of pesticide to use and the potential environmental impacts of pesticides on yield and quality of coffee.
• Coffee grower groups such as PNG SCGA and coffee farmers’ cooperative societies have important role to play in coffee production, processing, and marketing as evidenced in Colombia (Equal Exchange, 2020). For instance, the Colombian NFCG has a system where smallholders are assisted in milling, grading and export of their coffee. The PNG SCGA can draw lessons from the Colombian NFCG as well as from Ethiopia’s Oromia Coffee Farmers’ Cooperative Union (African Agribusiness, 2020). PNG SCGA has the potential to address the problems associated with processing and marketing of coffee in PNG.
• GoPNG should consider funding more research into the development of high-quality speciality coffee that can attract a high price premium. Indonesia has a coffee speciality called kopi luwak, which is currently the most expensive coffee in the world (Bale, 2016). PNG has one of the best soil types and climates for coffee production, so GoPNG should invest in research to develop a coffee speciality that could be highly priced.
31
Conclusions This study provides insight into the production and processing of coffee in PNG and offer suggestions for improvement by drawing lessons from the top five coffee-producing countries in the world. The findings revealed that PNG has suitable environmental and climatic conditions for growing high quality coffee. However, the challenges that coffee growers, especially smallholders, face — such as inadequate facilities for processing coffee, inadequate extension services and limited access to finance — have restricted PNG from being one of the top coffee-producing countries. The presence of mostly old coffee trees coupled with the conversion of coffee fields to other types of economical crops further threatens the production and productivity of coffee in PNG.
If the aim is to increase the production of quality coffee and improve PNG’s competitiveness in the world coffee markets, GoPNG should promote effective agricultural extension services for all coffee grower groups (not only just one group). This can be achieved by providing effective monitoring and evaluation mechanisms for extension service delivery that ensure that extension officers provide proper services to the appropriate clienteles. If extension officers are not enough, GoPNG should consider employing more trained officers who can provide coffee growers advice about innovative modern coffee production techniques. It is important to replace the old coffee trees with new high yielding and disease resistant coffee varieties to increase production and productivity in the nearest future. If the PPAP is implemented in an effective manner, it has the potential to provide the opportunity to replace most old coffee trees in PNG with new high yielding coffee stock. However, only some coffee growers benefit from the project, which tend to dwarf the contribution of the project to the total coffee production. It is important to promote wet processing method by encouraging coffee grower groups, such as PNG SCGA and farmers’ cooperative societies, to own their own coffee processing mills for processing coffee of their members. GoPNG should consider providing loans through the National Development Bank to the coffee groups for the purchase of coffee milling machines. As PNG has the potential to produce a coffee speciality of high quality that can attract high price in the coffee market, GoPNG should consider providing more funding to research institutes such as the CIC in collaboration with PNG NARI to continue conducting research into coffee speciality and development of high yielding and disease resistant varieties.
The important lessons that can be drawn from top five coffee-producing countries that we reviewed are that ‘political will’ on the part of the government is crucial in moving PNG coffee industry forward to the next level. ‘Political will’ is required for investment in areas such as research in high yielding, disease resistant varieties and high valued coffee specialities. ‘Political will’ is also required in investment in effective extension services and in providing agricultural and infrastructural support for coffee growers. Improvement in coffee productivity in PNG through best management practices of the world’s top coffee-producing countries will allow coffee growers to earn more money. Advancement in the coffee industry will require both public and private participation. However, the public sector must stick to facilitating and regulating, while the private sector engages in the production of coffee. Training coffee growers and processors is important to achieve long-term goals in the coffee industry. Widespread awareness of potential gains of high-quality coffee is important. It is imperative to strengthen group formation by coffee growers, with close partnerships between farmers and coffee chain leaders such as processors, buyers, and exporters.
PNG used to have plantations and rural coffee mills that provided a centralised facility for processing to the smallholder coffee farmers, which resulted in the production of quality coffee. The CIC should consider developing a modernised centralised processing system. Further research is required in areas such as smallholder coffee growers’ decision to convert their coffee field to other crops, productivity of farmers at farm level, and how to make marketing of coffee products more competitive.
This discussion paper contributes to the discussions on how to improve the contribution of agricultural sector including coffee production in PNG’s economy. The findings will assist agriculture managers, planners, and policy makers make informed decisions about how to sustainably boost coffee production.

32
33
Aba, L.A., Aipi, B., and Irau, T. (2012). Supply response of coffee in Papua New Guinea. Bank of Papua New Guinea Working Paper 2012/01: Port Moresby, Papua New Guinea.
AECOM (2018). Papua New Guinea coffee market study. Retrieved from https://phama.com.au/wp-content/ uploads/2018/08/TR131-PNG-Coffee-Market-Study-V1.0-FINAL.pdf (accessed 05 June 2020).
Africa Agribusiness (2020). Ethiopia: Oromia Coffee Farmers Union set to unveil $1.5 million coffee processing plant. Africa Agribusiness Communities. Retrieved from https:// africabusinesscommunities.com/agribusiness/news/ethiopia-oromia-coffee-farmers-union-set- to-unveil-$1.5-million-coffee-processing-plant/
Altman, M., Lamontagne, L., Odhuno, F., and Altman, H. (2020). Productivity of coffee farmers’ cooperatives in the Eastern Highlands Province Papua New Guinea: Evidence from survey data. (PNG NRI Discussion Paper 177). Port Moresby: Papua New Guinea National Research Institute.
Alves, B. (2020). Agriculture industry in Brazil – statistics and facts. https://www.statista.com/topics/5838/ agriculture-in-brazil/ (accessed 11 November 2020). Asfaw, T. F. (2018). Evaluating the quality of coffee product on marketing performance of Ethiopian Commodity Exchange (ECX) Hawassa branch. International Journal of Social Sciences Perspectives, 2 (1): 50-79. Retrieved from doi: 10.33094/7.2017.2018.21.50.79. Bale, R. (2016, 29 April). The disturbing secret behind the world’s most expensive coffee. National Geographic.
Baloch, M.A., and Thapa, G.B. (2018). The effect of agricultural extension services: Date farmers’ case in Balochistan, Pakistan. Journal of the Saudi Society of Agricultural Sciences, 17 (3): 282-289.
Bugri, J.T. (2008). The dynamics of tenure security, agricultural production and environmental degradation in Africa: Evidence from stakeholders in north-east Ghana. Land Use Policy, 25 (2): 271-285.
Bytof, G., Knopp, S. E., Schieberle, P., Teutsch, I., and Selmar, D. (2004). Influence of processing on the generation of γ-aminobutyric acid in green coffee beans. European Food Research and Technology, 220: 245-250.
Cafe Imports Europe, (2020): Origins: Papua New Guinea. Retrieved from https://www.cafeimports.com/ europe/papua-new-guinea (accessed 17 September 2020) CARE International in PNG, (2015). Coffee industry support project design document. Port Moresby, PNG: CARE International.
Coffee Industry Corporation (2016). The Papua New Guinea Coffee Handbook (2nd ed.). Goroka, PNG: Coffee Industry Corporation. Curry, G. N., Koczberski, G., and Inu, S. M. (2019). Women’s and men’s work: the production and marketing of fresh food and export crops in Papua New Guinea. Oceania. Retrieved from https://doi. org/10.1002/ocea.5222.
de Almeida, L. F., and Zylbersztajn, D. (2017). Key success factors in the Brazilian coffee agrichain: present and future challenges. International Journal on Food System Dynamics, 8 (1): 45-53.
Degaga, J. (2020). Review on coffee production and marketing in Ethiopia. Journal of Marketing and Consumer Research, 67 (2020): 1-15. Retrieved from doi: 10.7176/JMCR/67-02.
Department of Agriculture and Livestock (DAL) (2020). Coffee. Retrieved from https://www.agriculture.gov. pg/coffee/ (accessed 15 September 2020).
References
Department of National Planning and Monitoring (2018). Medium Term Development Plan III. Volume Two. Department of National Planning and Monitoring, Port Moresby.
Dwiartama, A., Hartatri, D.F.S., Neilson, J., and Vicol, M. (2020). Nine myths about Indonesian specialty coffee farmers and development. The Conversation. https://theconversation.com/nine-myths-about- indonesian-specialty-coffee-farmers-and-development-145394 (accessed 13 November 2020).
Dilebo, T.T. (2019). Determinants of coffee market supply: The case of Yirgachefe district, Gedeo, Southern Ethiopia. Journal of Agricultural and Crop Research, 7 (5): 64-71.
Econometric Software Inc. (2007). NLOGIT Version 4.0. New York: Econometric Software.
Equal Exchange (2020). History of coffee in Colombia. Retrieved from https://equalexchange.coop/history-of- coffee-in-colombia (accessed 15 September 2020).
Ezebilo, E. (2015). Papua New Guinea’s drive for self-sufficiency in food production: Are we ready? PNG NRI Spotlight, 8 (3).
FAOSTAT (2020). Crops. http://www.fao.org/faostat/en/#data/QC (Accessed 12 June 2020).
Ferreira, G.F.P., de Nouvaes, Q.S., Malta, M.R., and de Souza, S.E. (2013). Quality of coffee produced in Southwest region of Bahia, Brazil subjected to different forms of processing and drying. African Journal of Agricultural Research, 8 (20): 2334-2339.
Folnovic, T. (2020). Sustainable coffee farming across the world. Message posted to https://blog.agrivi.com/ post/sustainable-coffee-farming-across-the-world (accessed 20 September 2020).
Ghosh, P., and Venkatachalapathy, N. (2014). Processing and drying of coffee - a review. International Journal of Engineering Research and Technology, 3 (12): 784-794. Giovannucci, D., and Hunt, J. (2009). Strategic assessment of the coffee sector in Papua New Guinea. Retrieved from https://www.dgiovannucci.net/wp-content/uploads/2018/12/png-coffee-strategy_giovannucci- hunt.pdf
Gravelle, H., and Rees, R. (2004). Microeconomics. Harlow: Pearson Education.
Greene, W.H. (2003). Econometric analysis (5th ed.). Upper Saddle River, NJ: Prentice Hall.
Haile, M., and Kang, W. H. (2019). The harvest and post-harvest management practices’ impact on coffee quality. the harvest and post-harvest management practices’ impact on coffee quality. IntechOpen. Retrieved from doi: 10.5772/intechopen.89224.
Hinsene, G., Gezahegn B., and Chemeda, A. (2015). Influence of coffee production systems on the occurrence of coffee beans abnormality: implication on coffee quality. Asian Journal of Plant Sciences, 14: 40-44. Retrieved from doi: 10.3923/ajps.2015.40.44.
Imbun, B.Y. (2014). Struggling or in transition: Small household growers and the coffee industry in Papua New Guinea. Asia Pacific Viewpoint, 55 (1): 24-37.
Indonesia Investment. (2020). Indonesia Investment: Coffee. https://www.indonesia-investments.com/ business/commodities/coffee/item186 (Accessed 14 November 2020).
International Coffee Organization. (2020). Trade Statistics Tables: Production [statistics]. Retrieved from http://www.ico.org/prices/po-production.pdf (accessed 15 August 2020).
ICO (International Coffee Organization). (2019). Country coffee profile: Vietnam. Available online at http:// www.ico.org/documents/cy2018-19/icc-124-9e-profile-vietnam.pdf (Accessed 16 October 2020)
Joet, T., Laffargue, A., Descroix, F., Doulbeau, S., Bertrand, B., Kochko, A., and Dussert, S. (2010). Influence of environmental factors, wet processing and their interactions on the biochemical composition of green Arabica coffee beans. Food Chemistry, 118 (3): 693-701.
34
Kleinwächter, M., Bytof, G., and Selmar, D. (2015). Coffee Beans and Processing. In V.R. Preedy (Ed.), Coffee Health and Disease Prevention (pp.73–81). San Diego, CA: Academic Press.
Looga, J., Jurgenson, E., Sikk, K., Matveev, E., and Maasikamae, S. (2018). Land fragmentation and other determinants of agricultural farm productivity: The case of Estonia. Land Use Policy, 79: 285-292. Mello, J. (2012). Brazilian coffee industry. The Brazil business.. Retrieved from http://thebrazilbusiness.com/ article/brazilian-coffee-industry
Meyer, A. (2010). Brazil agriculture. https://www.brazil.org.za/agriculture.html#:~:text=Agriculture%20 is%20an%20important%20industry,(in%20order%20of%20importance) (Accessed 17 November 2020).
Mugweru, E.K., Odhiambo, S., and Nyandemo, S. (2016). Determinants of coffee production in the Kenyan economy. Journal of Agricultural Policy, 1 (1): 37-57.
Nelson, J. (2008). Global private regulation and value-chain restructuring in Indonesia smallholder coffee systems. World Development, 36 (9): 1607-1622.
Nelson, J. (2007). Institutions, the governance of quality and on-farm value retention for Indonesian speciality coffee. Singapore Journal of Tropical Geography, 28 (3): 188-204.
Philippe, J. (2020). Supporting coffee farmers in Ethiopia. Retrieved from https://www.ifc.org/wps/wcm/ connect/news_ext_content/ifc_external_corporate_site/news+and+events/news/ethiopia_coffee (accessed 12 November 2020).
Plecher, H. (2020). Share of economic sectors in the GDP in Ethiopia 2019. Retrieved from https:// www.statista.com/statistics/455149/share-of-economic-sectors-in-the-gdp-in- ethiopia/#:~:text=In%202019%2C%20the%20share%20of,sector%20contributed%20about%20 36.87%20percent. (accessed 12 November 2020).
Prajantv, S.D.W., Pramono, E., and Azia, F. (2019). Factors influencing Indonesia coffee export volume. Advances in Social Science, Education and Humanities Research, 390: 41-45.
Sengere, R.W., Curry, G. N., and Koczberski, G. (2019). Forging alliances: coffee grower and chain leader partnerships to improve productivity and coffee quality in Papua New Guinea. Asia Pacific Viewpoint, 60 (2): 220-235.
Sengupta, B., Priyadarshinee, R., Roy, A., Banerjee, A., Malaviya, A., Singha, S., Mandal., and Kumar, A. (2020). Toward sustainable and eco-friendly production of coffee: abatement of wastewater and evaluation of its potential valorization. Clean Technologies and Environmental Policy, 22: 995–1014 (2020). Retrieved from https://doi.org/10.1007/s10098-020-01841-y. Sitapai, E.C. (2012). A critical analysis of agricultural extension service in Papua New Guinea: Past, present and future. Paper presented at the CIMC National Agriculture Conference, 24 25 May 2012, Lae. Statista (2020a). Coffee: Brazil [statistics]. Retrieved from https://www.statista.com/outlook/30010000/115/ coffee/brazil (accessed 15 November 2020). Statista (2020b). Agriculture in Vietnam — statistics and facts [statistics].Retrieved from https://www.statista. com/topics/5653/agriculture-in-vietnam/ (accessed 15 November 2020).
Subedi, R.N. (2011). Comparative analysis of dry and wet processing of coffee with respect to quality and cost in Kavre district, Nepal: A case of Panchkhal village. International Journal of Applied and Basic Sciences, 2 (5): 181-193. The GlobalEconomy.com (2020). Indonesia: GDP share of agriculture. https://www.theglobaleconomy. com/Indonesia/share_of_agriculture/#:~:text=Indonesia%3A%20Value%20added%20in%20 the%20agricultural%20sector%20as%20percent%20of%20GDP&text=The%20average%20
35
value%20for%20Indonesia,from%202019%20is%2012.72%20percent (accessed 10 November 2020)
Trevisan, A. (2018, 28 August). What are the factors that affect coffee quality? Message posted to https://blog. eureka.co.it/en/factors-that-affect-coffee-quality Volsi, B., Telle.,T.S., Caldarelli., C.E., and da Camara, M.R.G. (2019). The dynamics of coffee production in Brazil. PLOS ONE, 14 (7): e0219742.
Wangi, T., and Ezebilo, E. (2017). Accessibility of customary land for property development in Papua New Guinea: Challenges and prospects. PNG NRI Spotlight, 10 (1).
Watson, K., and Achinelli, M. L. (2008). Context and contingency: the coffee crisis for conventional small‐ scale coffee farmers in Brazil. The Geographical Journal, 174 (3): 223-234.
Winston, E., Op de Laak, J., Marsh, T., Lempke, H., Aung, O., Nyunt, T., and Chapman, K. (2005). Arabica coffee manual for Myanmar. Food and Agriculture Organisation, Bangkok, Thailand.
World Atlas (2019). Top coffee producing countries. Data available at https://www.worldatlas.com/articles/ top-coffee-producing-countries.html
World Bank (2020). Agriculture, forestry and fishing, value added (% of GDP) — Colombia. https://data. worldbank.org/indicator/NV.AGR.TOTL.ZS?locations=CO (accessed 15 November 2020).
Yadessa, A., Burkhadt, J., Bekele, E., and Goldbach, H. (2020). The major factors influencing coffee quality in Ethiopia: The case of wild Arabica coffee (Coffea Arabica L.) from its natural habitat of southwest and southeast Afromontane rainforest. African Journal of Plant Science, 14 (6): 213-230.
36

29
The National Research Institute, PO Box 5854, Boroko, Port Moresby, National Capital District 111, Papua New Guinea; Telephone +675 326 0300; Email: [email protected]
This and other NRI publications are available at www.pngnri.org.