Strategic management in local hospital markets
11
RESEARCH ARTICLE Open Access Strategic management in local hospital markets: service duplication or service differentiation Hanh Q. Trinh Abstract Background: The purpose of this study is to assess the influences of market structure on hospitals’ strategic decision to duplicate or differentiate services and to assess the relationship of duplication and differentiation to hospital performance. This study is different from previous research because it examines how a hospital decides which services to be duplicated or differentiated in a dyadic relationship embedded in a complex competitive network. Methods: We use Linear Structural Equations (LISREL) to simultaneously estimate the relationships among market structure, duplicated and differentiated services, and performance. All non-federal, general acute hospitals in urban counties in the United States with more than one hospital are included in the sample (n = 1726). Forty-two high- tech services are selected for the study. Data are compiled from the American Hospital Association Annual Survey of Hospitals, Area Resource File, and CMS cost report files. State data from HealthLeaders-InterStudy for 2015 are also used. Results: The findings provide support that hospitals duplicate and differentiate services relative to rivals in a local market. Size asymmetry between hospitals is related to both service duplication (negatively) and service differentiation (positively). With greater size asymmetry, a hospital utilizes its valuable resources for its own advantage to thwart competition from rivals by differentiating more high-tech services and reducing service duplication. Geographic distance is positively related to service duplication, with duplication increasing as distance between hospitals increases. Market competition is associated with lower service duplication. Both service differentiation and service duplication are associated with lower market share, higher costs, and lower profits. Conclusions: The findings underscore the role of market structure as a check and balance on the provision of high-tech services. Hospital management should consider cutting back some services that are oversupplied and/or unprofitable and analyze the supply and demand in the market to avoid overdoing both service duplication and service differentiation. Keywords: Hospital services, Hospital strategy, High-tech services, Service duplication, Service differentiation © The Author(s). 2020 Open Access This article is licensed under a Creative Commons Attribution 4.0 International License, which permits use, sharing, adaptation, distribution and reproduction in any medium or format, as long as you give appropriate credit to the original author(s) and the source, provide a link to the Creative Commons licence, and indicate if changes were made. The images or other third party material in this article are included in the article's Creative Commons licence, unless indicated otherwise in a credit line to the material. If material is not included in the article's Creative Commons licence and your intended use is not permitted by statutory regulation or exceeds the permitted use, you will need to obtain permission directly from the copyright holder. To view a copy of this licence, visit http://creativecommons.org/licenses/by/4.0/. The Creative Commons Public Domain Dedication waiver (http://creativecommons.org/publicdomain/zero/1.0/) applies to the data made available in this article, unless otherwise stated in a credit line to the data. Correspondence: [email protected] Health Care Administration, University of Wisconsin-Milwaukee, Northwest Quadrant B 6428, 2025 E Newport Avenue, Milwaukee, WI 53211-2906, USA Trinh BMC Health Services Research (2020) 20:880 https://doi.org/10.1186/s12913-020-05728-y
-
Upload
khangminh22 -
Category
Documents
-
view
2 -
download
0
Transcript of Strategic management in local hospital markets

RESEARCH ARTICLE Open Access
Strategic management in local hospitalmarkets: service duplication or servicedifferentiationHanh Q. Trinh
Abstract
Background: The purpose of this study is to assess the influences of market structure on hospitals’ strategicdecision to duplicate or differentiate services and to assess the relationship of duplication and differentiation tohospital performance. This study is different from previous research because it examines how a hospital decideswhich services to be duplicated or differentiated in a dyadic relationship embedded in a complex competitivenetwork.
Methods: We use Linear Structural Equations (LISREL) to simultaneously estimate the relationships among marketstructure, duplicated and differentiated services, and performance. All non-federal, general acute hospitals in urbancounties in the United States with more than one hospital are included in the sample (n = 1726). Forty-two high-tech services are selected for the study. Data are compiled from the American Hospital Association Annual Surveyof Hospitals, Area Resource File, and CMS cost report files. State data from HealthLeaders-InterStudy for 2015 arealso used.
Results: The findings provide support that hospitals duplicate and differentiate services relative to rivals in a localmarket. Size asymmetry between hospitals is related to both service duplication (negatively) and servicedifferentiation (positively). With greater size asymmetry, a hospital utilizes its valuable resources for its ownadvantage to thwart competition from rivals by differentiating more high-tech services and reducing serviceduplication. Geographic distance is positively related to service duplication, with duplication increasing as distancebetween hospitals increases. Market competition is associated with lower service duplication. Both servicedifferentiation and service duplication are associated with lower market share, higher costs, and lower profits.
Conclusions: The findings underscore the role of market structure as a check and balance on the provision ofhigh-tech services. Hospital management should consider cutting back some services that are oversupplied and/orunprofitable and analyze the supply and demand in the market to avoid overdoing both service duplication andservice differentiation.
Keywords: Hospital services, Hospital strategy, High-tech services, Service duplication, Service differentiation
© The Author(s). 2020 Open Access This article is licensed under a Creative Commons Attribution 4.0 International License,which permits use, sharing, adaptation, distribution and reproduction in any medium or format, as long as you giveappropriate credit to the original author(s) and the source, provide a link to the Creative Commons licence, and indicate ifchanges were made. The images or other third party material in this article are included in the article's Creative Commonslicence, unless indicated otherwise in a credit line to the material. If material is not included in the article's Creative Commonslicence and your intended use is not permitted by statutory regulation or exceeds the permitted use, you will need to obtainpermission directly from the copyright holder. To view a copy of this licence, visit http://creativecommons.org/licenses/by/4.0/.The Creative Commons Public Domain Dedication waiver (http://creativecommons.org/publicdomain/zero/1.0/) applies to thedata made available in this article, unless otherwise stated in a credit line to the data.
Correspondence: [email protected] Care Administration, University of Wisconsin-Milwaukee, NorthwestQuadrant B 6428, 2025 E Newport Avenue, Milwaukee, WI 53211-2906, USA
Trinh BMC Health Services Research (2020) 20:880 https://doi.org/10.1186/s12913-020-05728-y

BackgroundThe competitive market facing hospitals in urban areasis very different from other markets. Each hospital islarge enough to have considerable influence on the mar-ket. Because there are only a few hospitals serving thesame clientele in the market, they are interdependentand closely watch one another’s moves [1]. As they com-pete for the same local clientele, sustaining market shareis their primary concern. It is a zero-sum game where, ifone gains market share, others lose. To sustain marketshare, hospitals usually engage in two fundamental stra-tegic activities around their service offerings – serviceduplication and service differentiation.The first strategy involves duplicating services that are
already offered by rivals in an attempt to attract cus-tomers away from them [2–5]. This kind of competitionamong local hospitals can lead to a “medical arms race,”and eventually to a price war, where hospitals end up aseither winners or losers. The second strategy is servicedifferentiation, which avoids competition based on prices[6–9]. Hospitals may provide services that others do notoffer, thus making themselves different from their rivals.They may be able to demonstrate the competence andhigh proficiency needed to control or to bring down thecost of these services [10]. While not a contributor to amedical arms race, the differentiation strategy can en-courage hospitals to offer services that may not be justi-fied economically.The purpose of this paper is to study what influences
hospitals in their pursuit of either service duplication orservice differentiation, and the impact of their strategicactivities on hospital performance. We focus on high-tech services because these represent a special segmentof a local market that has the potential for creating dif-ferentiation as well as duplication. This study is differentfrom previous research because it examines how a hos-pital decides which services to be duplicated or differen-tiated in a dyadic relationship embedded in a complexcompetitive network, and because it examines the rela-tionship of both strategies to performance.
Framework and hypothesesThe institutional theory of organizations argues thatfirms often will better position themselves in a marketby duplicating services (a form of imitation) that are of-fered by rivals [11, 12]. A firm uncertain of customerneeds tends to imitate the practices of successful firms,assuming its rivals are accepted in the competitive mar-ket. The advantage of offering similar services is to gainlegitimacy while avoiding the risk of making the firstmove [13–15]. If a firm is not sure what the best courseof action is, imitating others is a way to maintain its rela-tive position or to neutralize the action of rivals [16]. Onthe other hand, there is a risk that competition can be
very intense, eroding prices and profits [17]. It is com-mon to see hospitals in the general acute service marketproviding similar services such as general medicine, ob-stetrics, cardiology, pediatric, etc.In addition, cost-based reimbursement historically has
motivated hospitals to compete without considering thecosts of care, offering a full range of services and latesttechnologies to attract physicians and patients [18–20].Under cost-based reimbursement, hospitals have incen-tives to offer services with little regard for economic effi-ciency even when the services are duplicated acrosshospitals [18]. Previous studies have focused on the ef-fects of duplicated services on hospital performance, andthe environmental and organizational characteristics thatinfluence service duplication [2–5]. Other studies havefocused on the service offerings of hospitals clustered inthe same multihospital system. They found that consoli-dation of services lags behind consolidation of adminis-trative services, which suggests that medical staff arereluctant to change practice patterns and hospitals pre-fer to continue to preserve revenues [21–35]. Theseforces uphold the offering of duplicative services acrosscluster members.The strategic management theory suggests that firms
can also compete by providing services that rivals do nothave, a form of differentiation. By being different, a firmcan benefit as it faces less competition, earns higher rev-enues, and has a good chance to run a local monopoly[36–38]. There are many ways hospitals can differentiatetheir services. Some focus on high-tech services and useof the latest technologies such as robot surgery, or organtransplant. Some focus on quality of medical staff.Others pursue rare services such as burn care, protontherapy, and magnetoencephalography (MEG). Both du-plication and differentiation are associated with benefitsand costs that can have a profound impact on hospitalperformance in market share, cost of services, andprofits.Service differentiation has received some attention as a
means of classifying hospital system types [39, 40], and dif-ferentiation of services has been associated with several fac-tors, most notably higher market competition [9, 19, 41].However, its relationship with performance remains rela-tively unexplored.One of the key arguments we propose in this study is
that geographical proximity induces rivalry, which, inturn, leads to either duplication or differentiation of ser-vices. Economic theory suggests that firms located fardistant from each other will face less competition. Whenthey are closer to each other geographically, competitionbecomes fierce [42]. In a hospital market, when hospitalslocate far apart, competition for similar high-tech ser-vices is less intense because distance serve as an effectivebarrier, sorting out real from potential rivals [1]. When
Trinh BMC Health Services Research (2020) 20:880 Page 2 of 11

there are no nearby rivals (e.g., within 15miles), hospi-tals face less direct competitive threat, as nearby cus-tomers have convenient access to their services. If firmslocate near each other, however, they may avoid provid-ing similar services from rivals because similarity forcesthem into a price war that squeezes profit. They turn todifferentiation of services to reduce competition. Theabove discussion suggests the following hypotheses.
Hypotheses 1–2Hospitals duplicate more services of rivals if their loca-tion is geographically farther apart. Hospitals differenti-ate more services from rivals if their location isgeographically proximate.Another key factor influencing the choice of duplica-
tion or differentiation is asymmetry among firms. Not allfirms possess the same level of resources. Some firmshave unique and valuable resources, which allow themto sustain competitive advantage and enhance opportun-ism to expand market share, deliver services that aremost profitable, and leave services that are imitable toweaker firms. Power asymmetry exists when a firm usesits power, through its valuable resources, to dominate orinfluence the actions of other firms in a dyadic relation-ship for its own advantages [43]. The asymmetrical rela-tionship puts a weaker firm at greater degree ofvulnerability to opportunism. The powerful firm mayuse its advantage to maximize its capabilities that distin-guish it from its rivals [38]. It also uses its advantage togain more leverage at the expense of the weaker firm,and coerces the weaker firm to perform tasks on its be-half [44].In a local hospital market, a powerful hospital with
special capabilities usually provides customers withhigh-tech services that are not only inimitable but alsomore profitable than other imitable services. Inimitablehigh-tech status is not easy to deliver as it is a combin-ation of possession of knowledge, use of the knowledge,and proficiency of its use [45]. A hospital with these cap-abilities would leverage its power advantage to opposeor circumvent competition, whatever it decides to do[46]. Since the dominant hospital substantially holdsmore capabilities than the others, it establishes thepower asymmetry which eventually is accepted by otherhospitals in the market [1]. A dominant hospital tendsto exercise its potential capabilities to differentiate high-tech services, while a weaker hospital duplicates servicesthat are imitable. We therefore hypothesize thefollowing.
Hypotheses 3–4Hospitals with more power asymmetry differentiate moreservices from rivals. Hospitals with less power asymmetryduplicate more services of rivals.
Strategic management theory suggests that marketcompetition is a key component that induces firm toprotect market share from rivals. Because firms in thesame industry located in a local market are mutuallydependent, the strategy of one firm will affect that of ri-vals. As competition is mounting, a firm must positionitself vis-à-vis its rivals, and it looks for ways to differen-tiate its services from the rest. With differentiation, firmscircumvent duplication of services. By offering differentservices, a firm reduces competition and avoids competi-tion based on price. In a hospital market, market compe-tition is likely to influence hospitals to protect theirmarket share with service differentiation [9, 47].
Hypotheses 5–6Hospitals in more competitive markets duplicate fewerservices of rivals and differentiate more services fromrivals.In addition to geographical proximity, power asym-
metry, and market competition, other market forces alsoinfluence firms’ strategic behavior. In the health care in-dustry, other market pressures notably come from popu-lation density, community munificence, specialistphysicians, and managed care. In a community with highpopulation density, there are naturally more patientswith medical problems that require more high-tech ser-vices. Located in such a high- density community, hospi-tals are likely to provide as many services as possible.They tend to duplicate as well as differentiate servicesfrom rivals.
Hypotheses 7–8Hospitals in communities with higher population densityduplicate and differentiate more services from rivals.Community munificence plays a role in firm strategies
as it is the resources that support firm growth. Firms lo-cated in a community with high munificence have moreadvantages to survive [48]. These firms are able to pur-sue exploration strategies for new services to make themunique. Wealthy patients in a highly munificent commu-nity have ample financial resources to pay for expensivehigh-tech services, and hospitals are more likely to meettheir needs.
Hypotheses 9–10Hospitals in wealthier communities duplicate and differ-entiate more services from rivals.To compete with rivals, firms will try to attract the
most talent to work for them. Likewise, hospitals tend tooffer high-tech services as an inducement to attract themost talented physicians, particularly specialist physi-cians [3, 49].
Trinh BMC Health Services Research (2020) 20:880 Page 3 of 11

Hypotheses 11–12Hospitals in communities with higher density of specialistphysicians duplicate and differentiate more services fromrivals.To attract buyers, firms are more likely to present
themselves as purveyors of high-quality services. In thehealth care industry, insurance companies demand high-tech services on behalf of their members. Hospitals in acommunity with greater managed care penetration aremore likely to provide high-tech services to attract cus-tomer business as a way of maintaining or increasingmarket share [3, 50].
Hypotheses 13–14Hospitals in communities with more managed care pres-ence duplicate and differentiate more services fromrivals.As other characteristics from the organization might
influence firms’ strategic behaviors, we include them inour study as control variables. They are multihospitalmembership, non-profit ownership, bed size, and casemix index. These variables could influence the levels ofservice duplication and service differentiation.Economic theory suggests that firms with valuable as-
sets that are rare, inimitable and difficult to copy will beable to pursue strategic differentiation. These firms willface less competition and thus will have a good marketshare with a better profit. In a local market, firms closelywatch rivals’ move, and such a strategic position willsoon be copied by others. They are attracted to thisprofitable opportunity and are eager to join in the goodfortunes of the successful firms [16]. But imitation is as-sociated with costs as well as with benefits. The benefitsfirms can enjoy are the legitimacy and access to the mar-ket. The cost is the erosion of profitability. As somefirms imitate the successful firms, imitation of productscan lead to competition with lower prices [16]. As morefirms offer the same or similar services, they sooner orlater engage in direct competition through which a pricewar emerges. Lower prices will unavoidably squeezeprofits to the level that no firms will be able to makeextra profits. However, firms can avoid this unexpectedsituation if they find ways to collude. Empirical researchindicates that firms offering similar services oftenrecognize their interdependence and collude [51–53].In a local hospital market, offering different services
has both benefits and costs. With a wide range of high-tech services that are inimitable like robot surgery andorgan transplantation, hospitals are able to increase mar-ket share by attracting more customers for more reve-nues. With the increase in usage of these services, costper unit will fall [10, 54]. However, they might not beable to maximize economies of scales if their high-techservices are too expensive for consumers to afford. On
the other hand, duplicating services might not gain ad-equate volumes of services for lowering cost per unit. Italso might inevitably force hospitals to engage in a pricewar that leads to lower profits.
Hypotheses 15–16Hospitals differentiating more services will have highermarket share, higher profits and lower costs. Hospitalsduplicating more services will have lower market share,lower profits, and higher costs.
MethodsData set and sampleIn this study, a non-federal general acute hospital in anurban county in the United States is the unit of analysis.“Urban” is defined as an area located inside the UnitedStates Census Bureau’s “Core Based Statistical Areas”(CBSAs). The data on high-tech service duplication anddifferentiation were drawn from the 2015 AmericanHospital Association’s (AHA) Annual Survey of Hospi-tals file. Data on organizational characteristics and envir-onmental factors were obtained from the 2015 AHA andthe 2015 Area Resource File. Data on managed carewere retrieved from the 2015 HealthLeaders-InterStudysource.The data set consists of 1726 general acute hospitals,
compared to a total of 2831general acute hospitals in2015 in urban counties. There are two reasons for thisdifference. First, 830 hospitals are sole hospitals that donot exercise a strategy of service similarity or differenti-ation because there are no other hospitals in theircounty for competition. Second, 246 hospitals are re-ported as acute in the AHA file but as non-acute inCMS data files. Third, 29 hospitals do not report assets.Therefore, they were excluded from our sample.Different from previous studies that focus on hospitals’
broader competitive responses in a market, this studycalls for attention to the dyadic competition betweentwo rivals where the influences of geographical distancetogether with power asymmetry, market competition,multi-hospital membership are more evident. As two ri-vals are embedded in a web of competitive relationshipswith other rivals where these two rivals respond not onlyto each other’s moves, but also to other rivals through achain of interactions in the market, they make strategicdecisions with uncertain and incomplete knowledge.The complicated, intertwined competition embedded inthe web create a big challenge for hospitals to developeffective strategies.A way to untangle strategic decisions to duplicate or
differentiate from rivals is to examine each decision in adyad. For example, consider a market with 15 services,in which hospital A provides services 1, 2, 3, 4, 5, and 6;hospital B services 5, 6, 7, and 8; hospital C services 9,
Trinh BMC Health Services Research (2020) 20:880 Page 4 of 11

10, 11, 12, 13, 14, and 15. Hospital A may want to pro-vide service 9 in order to differentiate from hospital B,but hospital C already provides service 9. In other words,hospital A is not able to differentiate service 9 in relationto hospital C. If hospital A chooses to differentiate ser-vice 9 in relation to hospital B, it will duplicate service 9with hospital C. As all hospitals one by one continueadding more services for differentiation, they might un-intentionally turn the process of differentiation into aprocess of duplication. The advantage of our methodo-logical approach is that it reflects the reality in whichfirms respond to each of rivals’ moves [19]. It allows usto have a better understanding why firms decide to du-plicate or differentiate services with some rivals, but notwith others.This study defines duplication as number of the same
services offered by the focal hospital in a dyad, and dif-ferentiation as the number of unique services offered bythe focal hospital in a dyad. The algorithm first createsall possible pairs of hospitals in each county, then countsthe number of services each hospital offers that each ofits potential rivals do or do not. The number of possiblepairs of hospitals is calculated using a concept of permu-tation [55] as follows:
nPr ¼n!n‐rð Þ!
P: number of possible pairs of hospitals.n: number of hospitals located in the same county.r: number of hospitals in each pair.With this permutation approach, the number of pos-
sible pairs of hospitals increases substantially with an in-crease in the number of pairs of hospitals within thesame county. For example, there are two possible pairs(AB and BA) with two hospitals A and B in the samecounty, six possible pairs (AB, BA, BC, CB, AC, and CA)with three hospitals A, B, and C, etc. By adding up allthese possible pairs, the sample size for the study in-creases from 1726 to 11,264. Because the permutation ofa set of hospitals is an ordered sequence, it means thatAB and BA are two different possible pairs. Within eachpossible pair, the first hospital is treated as a focal one,and the second is its potential rival. Services provided bythese two hospitals are compared to identify which ser-vices the second hospital provides or does not provide.These services are the ones that the focal hospital dupli-cates or differentiates from the potential rival. For ex-ample, suppose hospital A provides services 1–6, andhospital B offers services 5–8. Hospitals A and B providethe same services 5 and 6, but they differentiate fromeach other on other services. Hospital A differentiateswith services 1, 2, 3, and 4, and hospital B with services7 and 8.
We transformed the data of 1726 hospitals in a vectorform into a new dataset with a matrix form using theStructured Query Language (SQL) procedure in SAS toproduce 12,364 possible pairs of hospitals in which afocal hospital is paired with each of its rivals in the samecounty. With this new data set, we calculated matrix var-iables such as geographical distance, power asymmetry,similar and different services before saving them alongwith other variables in another dataset for furtheranalysis.
MeasurementExogenous variablesMarket structure variables
Geographical distance Geographical distance is thestraight-line distance between the focal hospital and itspotential rival. Geographic Information System (arcGIS)is used to calculate the distances between pairs ofhospitals.
Size asymmetry Size is used as a measure of power. Sizeasymmetry is measured as a ratio of bed size of a focalhospital to the bed size of its potential rival.
Local market competition Local market competition ismeasured at the county level with 1 - Herfindahl-Hirschman Index (HHI). HHI is the sum of the squaredproportions of each hospital’s bed size to total bed sizewithin the same county.
Population density Population density is measured as apopulation of the county in thousands divided by thearea in square miles.
Community munificence Munificence is measured asincome in thousands divided by the population of thecounty.
Specialist physicians Specialist physician density ismeasured by total specialist physicians per 1000 popula-tion in the county.
Managed care Managed care is measured as the ratio ofthe number of people covered by managed care in thestate to the state population (due to the unavailability ofthis measure at the county level).
Control variables
Multihospital system membership Membership ismeasured with 0 representing no membership, and 1representing membership in a multihospital system.
Trinh BMC Health Services Research (2020) 20:880 Page 5 of 11

Non-profit ownership Ownership status is measuredwith 1 representing for-profit, and 0 representing non-profit.
Bed size Bed size is measured as the number of staffedbeds.
Case mix index Case mix index is the degree of severityof illness, prognosis, treatment difficult, and resource in-tensity. The index is from the CMS file 2015.
Endogenous variablesThree endogenous variables are used to measure hos-pital performance, as follows.
Market share per bed Market share per bed is the hos-pital’s patient days divided by the county’s total patientdays. This ratio is divided by the hospital’s number ofbeds.
Cost per discharge Cost per discharge is used to cap-ture hospital costs associated with delivering health care.It is the total cost divided by the number of cases. Be-cause hospitals have different case mix severity, the costper discharge is adjusted with case mix index so thatcomparison across hospitals can be made.
Return on assets Commonly used in studies of financialperformance, return on assets is the profit/loss dividedby total assets. Profit/loss is the difference between reve-nues and expenses. Return on assets measures the abilityto use company assets to generate profits.The final endogenous variables are the number of du-
plicated and differentiated services.
Duplicated services and differentiated services Asnoted earlier, duplication and differentiation are mea-sured by pairing a focal hospital with each of its poten-tial rivals one at a time. With each pairing, duplication isthe number of high-tech services that a focal hospitaland its rival both have, and differentiation is the numberof high-tech services that a focal hospital has but its po-tential competitor does not. This measurement makes itpossible to understand which market factors influencethe way hospitals decide to provide the similar or differ-ent services.Table 1 includes 42 services (see Table 1) reported in
the AHA data file that require high-technology, such asorgan transplant, magnetic resonance imaging, cardiacsurgery, robotic surgery, to capture a wide range of ser-vices [56]. They are the type of services utilized by hos-pitals in their efforts to differentiate themselves fromcompetitors [8, 47, 54].Measures and sources are summarized in Table 2.
Table 1 Hospital High-Tech Services
1. Computed-tomography (CT) scanner
2. Magnetic resonance imaging (MRI)
3. Diagnostic radioisotope facility
4. Optical Colonoscopy
5. Full-field digital mammography
6. Multi-slice spiral computed tomography < 64 slice
7. Multi-slice spiral computed tomography 64 + slice
8. Endoscopic retrograde
9. Adult diagnostic/invasive catheterization
10. Single photon emission computerized tomography
11. Adult interventional cardiac catheterization
12. Endoscopic ultrasound
13. Adult cardiac electrophysiology
14. Extracorporeal shock-wave lithotripter (ESWL)
15. Robotic surgery
16. Adult cardiac surgery
17. Intensity-Modulated Radiation Therapy (IMRT)
18. Ablation of Barretts esophagus
19. Esophageal impedance study
20. Image-guided radiation therapy
21. Positron emission tomography/CT (PET/CT)
22. Shaped beam Radiation System
23. Stereotactic radiosurgery
24. Positron emission tomography (PET)
25. Computer assisted orthopedic surgery
26. Virtual colonoscopy
27. Genetic testing/counseling
28. Tissue transplant
29. Electron Beam Computed Tomography (EBCT)
30. Other transplant
31. Kidney transplant
32. Intraoperative MRI (IMRT)
33. Pediatric card electrophysiology
34. Bone Marrow transplant services
35. Pediatric diagnostic/invasive catheterization
36. Pediatric interventional cardiac catheterization
37. Pediatric cardiac surgery
38. Magnetoencephalography (MEG)
39. Liver transplant
40. Heart transplant
41. Proton therapy
42. Lung transplant
Trinh BMC Health Services Research (2020) 20:880 Page 6 of 11

Analytic methodThe study utilizes path analyses to evaluate the simultan-eous inter-relationships among sets of exogenous and en-dogenous variables. The linear structural relations (LISREL) approach to path analysis is used in this study due toits ability to simultaneously examine relationships amongendogenous variable. Variables with positively skewed dis-tribution were logged. Descriptive statistics and correl-ation coefficients for all variables are reported in Table 3.LISREL output provides a variety of goodness-of-fit
measures for the entire model. Among these are (1) thechi -square goodness-of-fit measure and its related de-grees of freedom and probability level, (2) the goodness-of-fit (GFI), (3) the adjusted goodness-of-fit index(AGFI), and (4) the root mean square residual (RMSR).Results of the LISREL analysis indicate that the modelfits the data well. The probability of the fit is 100%, andthe chi-square with 67 degrees of freedom is 33.45. Thegoodness-of-fit (GFI) is 1.00 and the root mean squareresidual (RMSR) is 0.0051.
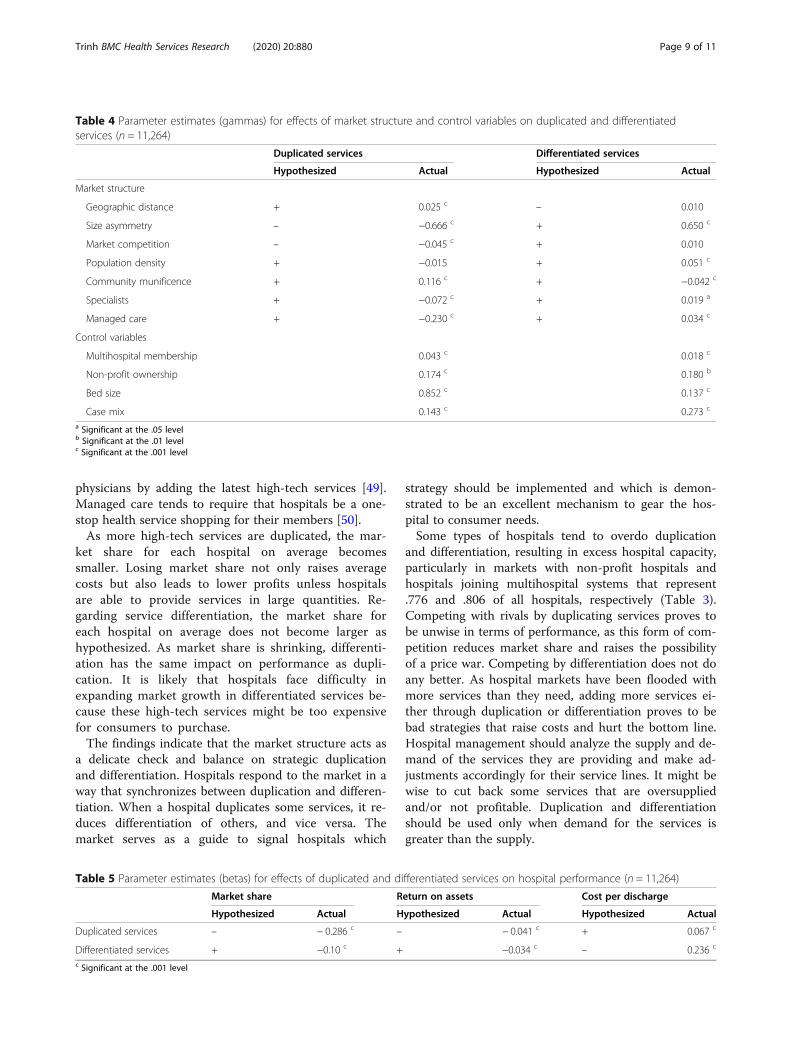
ResultsResults in Table 4 indicate that 11 out of 14 effects ofmarket structure are significant in the hypothesized
directions with either service duplication or differenti-ation, with 6 effects associated with service duplication,and 5 effects associated with service differentiation. Ashypothesized, service duplication is positively associatedwith geographic distance and community munificence,and is negatively associated with size asymmetry, andmarket competition. Duplication is negatively associatedwith specialist physicians and managed care in the op-posite direction of the hypotheses. Service differentiationis positively associated with size asymmetry, populationdensity, specialist physicians, and managed care, but isnegatively associated with munificence. Only the munifi-cence result is contrary to the hypothesized direction.All control variables are significant.Table 5 displays all 6 significant beta coefficient esti-
mates relating duplication and differentiation to perform-ance. Duplication is negatively related to market share andreturn on assets and positively related to cost per dis-charge, as hypothesized. The same findings hold for differ-entiation but are opposite to the directions hypothesized.
DiscussionThis study is different from previous research because itexamines how a hospital decides which services to be
Table 2 Measures and Sources
VARIABLE MEASURE SOURCE
Hospital performance
Market share per bed Log of percentage of hospital inpatient days divided by total marketinpatient days adjusted for hospital bed size
AHA Annual Survey
Cost per discharge Total hospital inpatient costs divided by total hospital dischargesadjusted for case mix index
Center for Medicare and Medicaid Services
Return on assets Profit divided by total assets Center for Medicare and Medicaid Services
Duplicated services Number of high-tech services that both a focal hospital and itscompetitor provide
AHA Annual Survey
Differentiated services Number of high-tech services that a focal hospital provides but itscompetitor does not
AHA Annual Survey
Market structure
Geographic distance Log of distance in miles between local hospital and each of itscompetitors in a local market
AHA Annual Survey, arcGIS
Size asymmetry Log of ratio of local hospital bed size over each of its competitors ina local market
AHA Annual Survey
Market competition 1 – HHI within county AHA Annual Survey
Population density Log of population of county in thousands divided by areas in miles Area Resource File
Community munificence Log of per capita income in thousand within county Area Resource File
Specialists per 1000 population Log of number of specialist physicians per 1000 population Area Resource File
Managed care penetration Percentage managed care members over population in state Bates White Economic Consulting
Control variables
Multihospital membership 0: No, 1: Yes AHA Annual Survey
Ownership for non-profit 0: No, 1: Yes AHA Annual Survey
Bed size Log of staffed beds AHA Annual Survey
Case mix index Medicare case mix index Center for Medicare and Medicaid Services
Trinh BMC Health Services Research (2020) 20:880 Page 7 of 11

duplicated or differentiated in a dyadic relationship em-bedded in a complex competitive network. Rather thanusing a gross measure as the number of duplicated ordifferentiated services that a hospital provides, we usemore fine-tuned measures by counting the number ofservices that are duplicated or differentiated between afocal hospital and each of its rivals one at a time. Thefindings provide partial support for 8 of the 14 hypoth-eses that offer explanations for duplicating and differen-tiating arrangements among rivals in a local market. Sizeasymmetry has stronger effects than geographic distanceand market competition as it influences both duplicationand differentiation. Geographical distance appears toplay a role in service duplication, but not in service dif-ferentiation. The farther apart the rivals are, the moreservices are duplicated. With greater size asymmetry, ahospital utilizes its valuable resources for its own advan-tage to thwart competition from rivals by differentiating
more high-tech services and reducing service duplica-tion. It is noted that local market competition is not as-sociated with service differentiation, but it is associatednegatively with service duplication. It is possible that ascompetition becomes intense, hospitals avoid duplicationof services for fear of a price war.The findings indicate that high population density in-
fluences only differentiation of services, which is consist-ent with the hypothesis. Hospitals in a high-densitycommunity may need to add more high-tech servicesinto their service lines. Hospitals in a community withhigh munificence offer more service duplication and lessservice differentiation. It is likely that hospitals take ad-vantage of financial resources available by duplicatingmany high-tech services to the extent that there are notmany services left for service differentiation. Other mar-ket factors also affect service duplication and differenti-ation. Hospitals respond to the demand of specialist
Table 3 Descriptive statistics and correlation matrix of study variables (n = 11,264)
Mean S.D. 1 2 3 4 5 6 7 8 9 10 11 12 13 14 15 16
1. Market shareper bed in %(log)
−3.916 1.117 1.000
2. Cost perdischarge Inthousands
9.028 .291 −.144 1.000
3. Return onassets
.052 .163 .125 −.108 1.000
4. Duplicatedservices
12.249 6.213 −.003 .037 −.036 1.000
5. Differentiatedservices
6.239 6.465 −.063 .227 −.029 −.128 1.000
6. Geographicdistance in miles(log)
2.339 .954 −.271 .015 −.039 −.194 −.021 1.000
7. Size asymmetry(log)
−.001 1.098 −.003 .053 −.032 −.010 .682 .001 1.000
8. Marketcompetition
.871 .135 −.849 .189 −.110 −.018 .038 .328 −.001 1.000
9. Populationdensity (log)
.571 1.106 −.589 .157 −.064 .179 .050 −.042 .004 .524 1.000
10. Communitymunificence (log)
3.949 .207 −.199 .204 −.064 .139 .026 −.010 .004 .236 .4703 1.000
11. Specialists per1000 population(log)
.953 .430 −.197 .011 −.025 .277 .062 .230 .001 .121 .517 .558 1.000
12. Managed care .377 .163 −.410 .314 −.145 −.242 .039 .258 −.008 .403 .019 .011 −.238 1.000
13. Multihospitalmembership
.806 .396 −.021 −.063 −.007 .066 .025 −.011 .048 .014 .001 −.016 .016 −.041 1.000
14. Non-profitownership
.776 .417 .080 .212 −.230 .237 .201 −.077 .184 −.063 .072 0.080 .167 −.044 −.025 1.000
15. Bed size (log) 5.443 .809 −.189 .058 −.075 .512 .493 −.143 .678 .119 .216 .067 .220 −.023 .083 −.283 1.000
16. Case mixindex
1.651 .263 −.123 .072 .086 .275 .418 −.136 .289 .090 .044 .062 .124 .057 .001 −.032 .398 1.000
Trinh BMC Health Services Research (2020) 20:880 Page 8 of 11
physicians by adding the latest high-tech services [49].Managed care tends to require that hospitals be a one-stop health service shopping for their members [50].As more high-tech services are duplicated, the mar-
ket share for each hospital on average becomessmaller. Losing market share not only raises averagecosts but also leads to lower profits unless hospitalsare able to provide services in large quantities. Re-garding service differentiation, the market share foreach hospital on average does not become larger ashypothesized. As market share is shrinking, differenti-ation has the same impact on performance as dupli-cation. It is likely that hospitals face difficulty inexpanding market growth in differentiated services be-cause these high-tech services might be too expensivefor consumers to purchase.The findings indicate that the market structure acts as
a delicate check and balance on strategic duplicationand differentiation. Hospitals respond to the market in away that synchronizes between duplication and differen-tiation. When a hospital duplicates some services, it re-duces differentiation of others, and vice versa. Themarket serves as a guide to signal hospitals which
strategy should be implemented and which is demon-strated to be an excellent mechanism to gear the hos-pital to consumer needs.Some types of hospitals tend to overdo duplication
and differentiation, resulting in excess hospital capacity,particularly in markets with non-profit hospitals andhospitals joining multihospital systems that represent.776 and .806 of all hospitals, respectively (Table 3).Competing with rivals by duplicating services proves tobe unwise in terms of performance, as this form of com-petition reduces market share and raises the possibilityof a price war. Competing by differentiation does not doany better. As hospital markets have been flooded withmore services than they need, adding more services ei-ther through duplication or differentiation proves to bebad strategies that raise costs and hurt the bottom line.Hospital management should analyze the supply and de-mand of the services they are providing and make ad-justments accordingly for their service lines. It might bewise to cut back some services that are oversuppliedand/or not profitable. Duplication and differentiationshould be used only when demand for the services isgreater than the supply.
Table 4 Parameter estimates (gammas) for effects of market structure and control variables on duplicated and differentiatedservices (n = 11,264)
Duplicated services Differentiated services
Hypothesized Actual Hypothesized Actual
Market structure
Geographic distance + 0.025 c – 0.010
Size asymmetry – −0.666 c + 0.650 c
Market competition – −0.045 c + 0.010
Population density + −0.015 + 0.051 c
Community munificence + 0.116 c + −0.042 c
Specialists + −0.072 c + 0.019 a
Managed care + −0.230 c + 0.034 c
Control variables
Multihospital membership 0.043 c 0.018 c
Non-profit ownership 0.174 c 0.180 b
Bed size 0.852 c 0.137 c
Case mix 0.143 c 0.273 c
a Significant at the .05 levelb Significant at the .01 levelc Significant at the .001 level
Table 5 Parameter estimates (betas) for effects of duplicated and differentiated services on hospital performance (n = 11,264)
Market share Return on assets Cost per discharge
Hypothesized Actual Hypothesized Actual Hypothesized Actual
Duplicated services – − 0.286 c – − 0.041 c + 0.067 c
Differentiated services + −0.10 c + −0.034 c – 0.236 c
c Significant at the .001 level
Trinh BMC Health Services Research (2020) 20:880 Page 9 of 11

LimitationsOne limitation of this study is related to market bound-ary. The use of county as a local market boundary mightbe imprecise for counting duplicated and differentiatedservices. It might also affect the measures of marketcompetition. A second limitation is related to measuringmanaged care market penetration at the state level dueto a lack of data available at the county level. Third, across-sectional design constrains the attribution of caus-ality. Longitudinal studies and more refined marketboundaries would enhance the findings.
ConclusionCaught in a dyadic competition with each of many rivalsin a web of complex dynamic market, it is not easy forhospitals to find a proper strategy choosing between du-plication and differentiation that will work simultan-eously against many or all of their rivals. Overwhelmedand under pressure to compete, hospitals tend to pro-vide more services, resulting in a market that is floodedwith more services than it needs. To avoid this stressfulsituation, hospital management must identify a strategicfit between the internal organization and the externalmarket before selecting strategies that are suitable withthis fit. Analyzing the supply and demand of the servicesin the market and finding a balance between duplicationand differentiation would help hospitals avoid a situationof excess capacity beyond the public needs that conse-quentially lead to rising costs and lower profits.
AbbreviationsMEG: Magnetoencephalography; CBSAs: Core based statistical areas;AHA: American hospital association; CMS: Centers for medicare and medicaidservices; SQL: Structured query language; ArcGIS: Geographic informationsystem; HHI: Herfindahl-hirschman index; LISREL: Linear structural relations;GFI: Goodness-of-fit; AGFI: Adjusted goodness-of-fit; RMSR: Root mean squareresidual
AcknowledgementsThe author is grateful to James W. Begun for the valuable feedback on thedraft.
Author’s contributionsThe sole author was responsible for all aspects of the study and manuscript.The author(s) read and approved the final manuscript.
FundingThe author received no funding support.
Availability of data and materialsThe data used in this study was authorized by Margaret Weglarz under thelicense agreement with the American Hospital Association, but there arerestrictions to the use of these data, which are not publicly available.
Ethics approval and consent to participateInstitutional review and ethics approval were not required as no data werecollected from human subjects.
Consent for publicationNot applicable.
Competing interestsThe author declares that he/she does not have competing interests.
Received: 14 April 2020 Accepted: 9 September 2020
References1. Luke RD. Spatial competition and cooperation in local hospital markets.
Med Care Rev. 1991;48(2):207–37.2. Connor RA, Feldman RD, Dowd BE. The effects of market concentration and
horizontal mergers on hospital costs and prices. Int J Econ Bus. 1998;52(2):159–80.
3. Devers KJ, Brewster LR, Casalino LP. Changes in hospital competitivestrategy: a new medical arms race? Health Serv Res. 2003;38(1 Pt, II):447–69.
4. Morrisey MA. Competition in hospital and health insurance markets: areview and research agenda. Health Serv Res. 2001;36(1):191–222.
5. Trinh HQ, Begun JW, Luke RD. Hospital service duplication: evidence on themedical arms race. Health Care Manag Rev. 2008;33(3):192–202.
6. Forte M, Hoffman JJ, Lamont BT, Brockmann EN. Organizational form andenvironment: an analysis of between-form and within-form responses toenvironmental change. Strateg Manag J. 2000;7(3):753–74.
7. Ketchen DJ, Thomas JB, Snow CC. Organizational configurations andperformance: a comparison of theoretical approaches. Acad Manag J. 1993;36:1278–313.
8. Lamont BT, Marlin D, Hoffman JJ. Porter’s generic strategies discontinuousenvironments and performance: a longitudinal study of changing strategiesin the hospital industry. Health Serv Res. 1993;28(4):623–40.
9. Zwanziger J, Melnick GA, Simonson L. Differentiation and specialization inthe California hospital industry 1983 to 1988. Med Care. 1996;34(4):361–72.
10. Kumar KR, Subramanian YC. Pure versus hybrid: performance implications ofPorter’s generic strategies. Health Care Manag Rev. 1997;22(4):47–60.
11. DiMaggio PG, Powell WW. The iron cage revisited: institutional isomorphismand collective rationality in organizational fields. Am Sociol Rev. 1983;48(2):147–60.
12. Suchman MC. Managing legitimacy: strategic and institutional approaches.Acad Manag Rev. 1995;20(4):571–610.
13. Dutton JM, Freedman RD. External environment and internal strategies:calculating, experimenting, and imitating in organizations. In Advances inStrategic Management 1985, ed. Lamb RB 3:39-67. Greenwich: JAI.
14. Levitt B, March JG. Organizational learning. Annu Rev Sociol. 1988;14(3):319–40.15. Lieberman M, Montgomery D. First mover advantages. Strateg Manage J
Summer Spec Issue. 1988;9:41–58.16. Gary MS, Larsen E, Markides CC (2006) Firm imitation and performance: a
simulation study. In Strategic and International Management Working Paper.London Business School. London; 2006.
17. Peteraf MA. Intra-industry structure and the response toward rivals. ManagDecis Econ. 1993;14:519–28.
18. Farley DE, Hogan C. Case-mix specialization in the market for hospitalservices. Health Serv Res. 1990;25(5):757–83.
19. Luft HS, Robinson JC, Garnick DW. Hospital behavior in a local marketcontext. Med Care Rev. 1986;432:217–51.
20. Robinson JC, Luft HS. The impact on hospital market structure on patientvolume, length of stay, and cost of care 1972–1982. J Health Econ. 1985;4:333–56.
21. Bazzoli GJ, Chan B, Shortell SM, D’Aunno T. The financial performance ofhospitals belonging to health networks and systems. Inquiry. 2000;37(3):234–52.
22. Bazzoli GJ, LoSasso A, Arnould R, Shalowitz M. Hospital reorganization andrestructuring achieved through merger. Health Care Manag Rev. 2002;27(2):7–20.
23. Bazzoli GJ, Dynan L, Burns RL, Yap C. Two decades of organizational changein health care: what have we learned? Med Care Res Rev. 2004;61:247–331.
24. Burns LR, Bazzoli GJ, Dynan L, Wholey DR. Impact of HMO market structureon physician-hospital strategic alliances. Health Serv Res. 2000;35:101–32.
25. Burns LR, Gimm G, Nicholson S. The financial performance of integratedhealth organizations. J Healthc Manag. 2005;50:191–212.
26. Burns LR, Pauly MV. Integrated delivery networks: a detour on the road tointegrated health care? Health Aff. 2002;21(4):128–43.
27. Clement JP, McCue MJ, Luke RD, et al. Strategic hospital alliances: impacton financial performance. Health Aff. 1997;16(6):193–203.
Trinh BMC Health Services Research (2020) 20:880 Page 10 of 11

28. Cuellar AE, Gertler PJ. How the expansion of hospital systems has affectedconsumers. Health Aff. 2005;24(1):213–9.
29. Dranove DC, Simpson J, White WD. Is managed care leading toconsolidation in health care markets? Health Serv Res. 2002;37:573–94.
30. Friedman L, Goes J. Why integrated health networks have failed. FrontHealth Serv Manag. 2001;17(4):3–28.
31. Hines S, Joshi MS. Variation in quality of care within health systems. J QualPatient Saf. 2008;34:326–32.
32. Luke RD. Taxonomy of health networks and systems: a reassessment. HealthServ Res. 2006;41:621–8.
33. Luke RD, Begun JW. Have integrated health networks failed in healthcare?Front Health Serv Manag. 2001;17(4):45–50.
34. Trinh HQ, Begun JW, Luke RD. Better to receive than to give?Interorganizational service arrangements and hospital performance. HealthCare Manag Rev. 2010;35:88–97.
35. Trinh HQ, Begun JW, Luke RD. Service duplication within urban hospitalclusters. Health Care Manag Rev. 2014;39(1):41–9.
36. Barney JB. Is the resource-based “view” a useful perspective for strategicmanagement research? Yes. Acad Manag Rev. 2001;26(1):41–58.
37. Deephouse D. To be different, or to be the same? It’s a question and theoryof strategic balance. Strateg Manag J. 1999;20:147–66.
38. Porter ME. Towards a dynamic theory of strategy. Strateg Manage J WinterSpec Issue. 1990;12:95–117.
39. Bazzoli GJ, Shortell SM, Dubbs N, Chan C, Kralovec P. A taxonomy of healthnetworks and systems: bringing order out of chaos. Health Serv Res. 1999;33(6):1683–717.
40. Shay PD, Mick SS. Clustered and distinct: a taxonomy of local multihospitalsystems. Health Care Manag Sci. 2017;20:303–15.
41. Trinh HQ, Begun JW (2019) Strategic differentiation of high-tech services inlocal hospital markets. Inquiry https://journals.sagepub.com/doi/full/https://doi.org/10.1177/0046958019882591.
42. Chung W, Kalnins A. Agglomeration effects and performance: a test of theTexas lodging industry. Strateg Manag J. 2001;22:969–88.
43. Johnsen RE, Ford D. Interaction capability development of smaller suppliersin relationships with larger customers. Ind Mark Manag. 2006;35(8):1002–15.
44. Nyaga GN, Lynch DF. Power asymmetry, adaptation and collaboration indyadic relationships involving a powerful partner. J Supply Chain Manag.2013;49(3):42–65.
45. Tsekouras G. PhD Thesis, Integration, organization and management:Investigating capability development: SPRU, University of Sussex; 1998.https://ethos.bl.uk/OrderDetails.do?uin=uk.bl.ethos.263212.
46. Mintzberg H, Quinn JB. The strategy process: concepts and contexts.Englewood Cliffs: Prentice Hall; 1992.
47. Rivers PA, Glover SH. Health care competition strategic mission and patientsatisfaction: research model and propositions. J Health Org Manag. 2008;22(6):627–41.
48. Castrogiovanni GJ. Environmental munificence: a theoretical assessment.Acad Manag. 1991;16(3):542–65.
49. Bigelow B, Mahon J. Strategic behavior of hospitals: a framework foranalysis. Med Care Rev. 1989;463:295–311.
50. Zwanziger J, Melnick GA. Can managed care plans control health carecosts? Health Aff. 1996;152:185–99.
51. Caves RE, Porter ME. From entry barriers to mobility barriers: conjecturaldecisions and contrived deterrence to new competition. Q J Econ. 1977;91:241–62.
52. Cool K, Dierick I. Rivalry, strategic groups, and firm profitability. StrategManag J. 1993;14(1):47–59.
53. Nair A, Filer L. Cointegration of firm strategies within groups: a long runanalysis of firm behavior in the Japanese industry. Strateg Manag J. 2003;24(2):145–59.
54. Marlin D, Huonker JW, Sun M. An examination of the relationship betweenstrategic group membership and hospital performance. Health Care ManagRev. 2002;27(4):18–29.
55. McCall R. Fundamental statistics for behavioral sciences. Boston MA:Cengage; 2000.
56. Hartz AJ, Krakauer H, Kuhn EM, et al. Hospital characteristics and moralityrates. N Engl J Med. 1989;321:1720–5.
Publisher’s NoteSpringer Nature remains neutral with regard to jurisdictional claims inpublished maps and institutional affiliations.
Trinh BMC Health Services Research (2020) 20:880 Page 11 of 11