Strategic inventory allocation for product platform strategy
18
Strategic inventory allocation 233 Journal of Advances in Management Research Vol. 7 No. 2, 2010 pp. 233-249 # Emerald Group Publishing Limited 0972-7981 DOI 10.1108/09727981011085011 Strategic inventory allocation for product platform strategy Yohanes Kristianto, Petri Helo and Josu Takala Department of Production, University of Vaasa, Vaasa, Finland Abstract Purpose – This paper focuses on decision making related to the use of strategic inventory allocation in product platform design. The purpose of the paper is to present a novel approach to managing product variety by considering product and manufacturing strategy, and considering the supply chain benefits. Design/methodology/approach – Discrete event simulation is used for analyzing product platform performance in terms of inventory level and throughput. Simulation parameters such as lead times and safety stock allocation are optimized by using an analytical model of strategic safety stock allocation. Findings – The results show that strategic safety stock allocation supports product platform strategy by increasing production output, and reducing inventory level and customer order queues at a higher level of product variety. Research limitations/implications – Linking the safety stock allocation and product platform strategy facilitates simultaneous product and process design by providing the most optimum platform strategy at minimum safety stock allocation. Practical implications – Strategic safety stock allocation facilitates decision making with regard to lean strategy by reducing inventory level, agile strategy by increasing the amount of product variety and outputs, and responsiveness by reducing the number of customer order queues. Originality/value – The paper presents an innovative customer order decoupling point decision. Keywords Inventory management, Production planning and control, Supply chain management, Decision making Paper type Research paper 1. Introduction Meeting customer requirements by customizing the manufacturing strategy is one of the strategic goals which challenge supply chain (SC) managers over time. This concept underscores the importance of coordinating the development of product and manufacturing process design (Huang et al., 2007) within SCs to enable concurrent engineering (Fixson, 2005; Fogliato et al., 2003; Hult and Swan, 2003). Thus, improvement of the product platform commonality (Wacker and Trelevan, 1986; Martin and Ishii, 1996; Siddique et al., 1998; Kotha and Swamidhas, 2000) should consider the complexity of the manufacturing process (Forza and Salvador, 2002) in order to avoid operational problems. Although not conflicting with the previous literature, this paper however proposes the concept of offering higher product platform commonality as well as increasing the amount of product variety by optimizing manufacturing process design to satisfy customer requirements such as varied products, guaranteed lead times and low costs. Strategic inventory allocation is used to minimize inventory cost by giving guaranteed lead times to support commonality strategy. The purpose of this paper is to investigate the effect of coordinating the development of product design and manufacturing process design (Huang et al., 2007) in order to meet the design requirements for SC agility (Sharifi et al., 2006; Pandey and Garg, 2007) at mass production efficiency. Our efforts in this paper broadly follow Graves and Willems (2000, 2008), except that we take into account the possible effects The current issue and full text archive of this journal is available at www.emeraldinsight.com/0972-7981.htm
-
Upload
independent -
Category
Documents
-
view
0 -
download
0
Transcript of Strategic inventory allocation for product platform strategy

Strategicinventoryallocation
233
Journal of Advances in ManagementResearch
Vol. 7 No. 2, 2010pp. 233-249
# Emerald Group Publishing Limited0972-7981
DOI 10.1108/09727981011085011
Strategic inventory allocation forproduct platform strategy
Yohanes Kristianto, Petri Helo and Josu TakalaDepartment of Production, University of Vaasa, Vaasa, Finland
Abstract
Purpose – This paper focuses on decision making related to the use of strategic inventory allocationin product platform design. The purpose of the paper is to present a novel approach to managingproduct variety by considering product and manufacturing strategy, and considering the supplychain benefits.Design/methodology/approach – Discrete event simulation is used for analyzing productplatform performance in terms of inventory level and throughput. Simulation parameters such aslead times and safety stock allocation are optimized by using an analytical model of strategic safetystock allocation.Findings – The results show that strategic safety stock allocation supports product platformstrategy by increasing production output, and reducing inventory level and customer order queues ata higher level of product variety.Research limitations/implications – Linking the safety stock allocation and product platformstrategy facilitates simultaneous product and process design by providing the most optimumplatform strategy at minimum safety stock allocation.Practical implications – Strategic safety stock allocation facilitates decision making with regard tolean strategy by reducing inventory level, agile strategy by increasing the amount of product varietyand outputs, and responsiveness by reducing the number of customer order queues.Originality/value – The paper presents an innovative customer order decoupling point decision.
Keywords Inventory management, Production planning and control, Supply chain management,Decision making
Paper type Research paper
1. IntroductionMeeting customer requirements by customizing the manufacturing strategy is oneof the strategic goals which challenge supply chain (SC) managers over time. Thisconcept underscores the importance of coordinating the development of product andmanufacturing process design (Huang et al., 2007) within SCs to enable concurrentengineering (Fixson, 2005; Fogliato et al., 2003; Hult and Swan, 2003). Thus,improvement of the product platform commonality (Wacker and Trelevan, 1986;Martin and Ishii, 1996; Siddique et al., 1998; Kotha and Swamidhas, 2000) shouldconsider the complexity of the manufacturing process (Forza and Salvador, 2002) inorder to avoid operational problems.
Although not conflicting with the previous literature, this paper however proposesthe concept of offering higher product platform commonality as well as increasing theamount of product variety by optimizing manufacturing process design to satisfycustomer requirements such as varied products, guaranteed lead times and low costs.Strategic inventory allocation is used to minimize inventory cost by giving guaranteedlead times to support commonality strategy.
The purpose of this paper is to investigate the effect of coordinating thedevelopment of product design and manufacturing process design (Huang et al., 2007)in order to meet the design requirements for SC agility (Sharifi et al., 2006; Pandey andGarg, 2007) at mass production efficiency. Our efforts in this paper broadly followGraves and Willems (2000, 2008), except that we take into account the possible effects
The current issue and full text archive of this journal is available atwww.emeraldinsight.com/0972-7981.htm
JAMR7,2
234
of strategic inventory allocation into product platform development by consideringthe number of possible product varieties. In particular, unlike most of the existingliterature on platforming strategy, we explicitly investigate the rules of platformdesign strategy according to strategic safety stock allocation, which further affect totalcost reduction and the increasing of throughput.
In addition to recent literature, product platform analysis is a special feature of thispaper to demonstrate strategic inventory allocation usability in product platformanalysis. The idea is to build common product platform by deciding on the degree ofcustomer involvement in the manufacturing phase. This approach has been posited byBlecker and Abdelkafi (2007) in proposing a future research direction to provide ananalysis of the effects of component commonality on the decoupling points.
The following section first introduces relevant literature on product family analysis(Related literature section). The model development section starts with manufacturingprocess design development in terms of strategic safety stock allocation and customerorder decoupling point (CODP) decisions, which then continues with the problemexample section, which investigates the benefits of the developed model. The design ofexperiment section investigates factors that are associated with SC performancethrough discrete event simulation. The discussion section presents and discusses thesimulation results, which are concluded in the section conclusion and further research,which explores the information behind the simulation results in the previous sectionand discusses some possible future research directions.
2. Related literatureCollier (1981, 1982) and Eynan and Rosenblatt (1996) presented product configurationanalysis in taking into consideration the effect at the aggregate inventory level. Collier(1982) shows that a lower number of distinct components will reduce the total safetystock, which means that it will also improve the component commonality. Similarly,Jiao and Tseng (1996) explain that both design and manufacturing concerns need to beconsidered in the commonality measure by arguing that a high commonality ofprocesses would necessitate high commonality of the components involved.
Jiao and Tseng (1996) broaden the concept of design for manufacture by proposingdesign for mass customization, which optimizes reusability/commonality, synthesizesthe product family architecture (PFA) and facilitates meta-level integration throughoutthe design process. The same author then enhanced the concept by mapping thefunctionality, behavioral and structural perspective of PFA to represent differentphases of product development integration (Jiao and Tseng, 2000).
Related to the approaches of Jiao and Tseng (2000) on PFA, Fine (2000) and Fixson(2005) offer a product-operations strategy combination by considering three decisiondomains, namely product, process and SC domain decisions. Eventhough this is ageneral description of the coordinated product design, Fixson (2005) broaden theconcept of commonality by assessing the product architecture from its functionalityand interface characteristics.
Recently, Sanchez (2002) has studied the collaboration of product and process thatmake up the platform. The author mentioned that product architecture decisions haveto be made jointly and simultaneously with process architecture decisions. The reasonis that the product development strategy should improve the variety and at the sametime increase the reliability of the manufacturing process by increasing the servicelevel. As a consequence, costs would not be defined solely by bill of materials (BOMs)for specific product models, but would have to be defined ‘‘system-wide’’ with reference
Strategicinventoryallocation
235
to all development, production and SC costs that would be incurred in developing andrealizing new product variations over the lifetime of the platform (Kristianto and Helo,2009, 2010).
With regard to Sanchez’s (2002) concept, this paper can be used as a contribution tothe previous literature by linking the manufacturing process design according to theCODP and looking forward to finding the opportunity of increasing the number ofproduct variants. Strategic safety stock allocation is used to measure product platformbenefit in terms of inventory level reduction and customer service level (the number oforder queues and production throughput). Thus, coordinating the development ofproduct design and manufacturing process design is embodied by developing pushpull manufacturing strategy to drive the product design process.
3. Model development of manufacturing process designThis section focuses on modeling of manufacturing process design to detail how toallocate safety stock in deciding on the CODP so that it meets inventory cost andservice time optimization. This benefit is then extended further in terms of orderfulfillment rates by simulating the manufacturing process design at different numberof product variants in section 4.
Hereafter, we revisit Kristianto and Helo (2010) strategic inventory allocation. In thissection, we re-written the modeling and add some necessary assumptions with regardsto manufacturing process design simulation.
We solve the manufacturing process design by decomposing the multi-stage SCstrategic inventory location model into J-stages, where J is the number of workstationsin the SC and there is one stage for each node. For each node-j we define ��j to be theoptimum service rates and Wj to be the optimum service times. Those two decisionsare optimized against demand rate at stage-j �j, demand inter-arrival and service timesstandard deviation at stage-j �A�j and �j, respectively, to incorporate supply anddemand uncertainties.
Suppose the demand inter-arrival and processing rate are assumed according to GI/G/1 queue model by considering that the order intensity is not stationary and is justbarely less than one ð1� "Þ < � < 1 or is equal to or greater than one ð� � 1Þ. Thismodel closely represents demand uncertainty within mass customized production.
We assume that demand inter-interval time standard deviation �A�j is equal todifference between average 1=�j and least of demand inter-interval time 1=Dj. Thereason is that the demand process is non-stationary so that we put the highest demandinter-arrival time dispersion. Thus, for independent inbound service and productionprocess time, then we have service rate standard deviation as:
�j ¼ �ðmþpÞ�j ¼ffiffiffiffiffiffiffiffiffiffiffiffiffiffiffiffiffiffiffiffi�2
ij þ �2T�j
qfor �2
ij is inbound service variance and �2T�j production process variance at stage-j.
We assume that the SC can mitigate the bullwhip effect by taking productionprocess standard deviation �T�j should equal to �A�j and places an order equal to �ij�j
where �ij denotes arc ði; jÞ 2 A from downstream stage-j to upstream stage-i, for which�ij > 0. If this condition exists in each stage, then the effect of supply uncertainty(inbound service time standard deviation) �ij where:
�ij ¼ maxf�ij;maxf�iji : ði:jÞ 2 Agg for i ¼ 1; 2; . . . ; j� 1
JAMR7,2
236
can be minimized. We also require promised lead times:
Wj ¼ maxfWiji : ði:jÞ 2 Ag
to minimize inventory allocation and idle capacity thus that inbound service time:
Wi ¼ maxfWj � Tj;maxfWii : ði:jÞ 2 Agjg:
In regarding G/GI/1 queue system, Wi should not be over than waiting time in a queueto avoid backorders so that we have:
Wi �Wq�j ��jð�2
A�j þ �2j Þ
2ð1� �jÞð1Þ
In pursuing 100 percent guaranteed lead times, we consider penalty cost CW�j andservice cost CT�j to meet the required responsiveness at minimum service cost asfollows:
EðCÞj ¼ CT�j �j þ CW�j Nj ð2Þ
Equation (2) can be generalized into
EðCÞ ¼ CT�j �j þ CW�j
�2j �j �
2A�j þ �2
j Þ2 ð�j � �jÞ
þ �j
!ð3Þ
We simplify Equation (2) by excluding CW�j �j since it is not significant to E(C) ascompared to:
CW�j ð�2j �j ð�2
A�j þ �2j Þ=2 ð�j � �jÞÞ:
Thus, Equation (3) can be optimized according to �j so that we have:
CT�j þ�2
j ð�2A�j þ �2
j Þ CW�j
2 ð�j � �jÞ��2
j ð�2A�j þ �2
j Þ CW�j �j
2 ð�j � �jÞ2¼ 0 ð4Þ
�j ¼�jð4CT �
ffiffiffiffiffiffiffiffiffiffiffiffiffiffiffiffiffiffiffiffiffiffiffiffiffiffiffiffiffiffiffiffiffiffiffiffiffiffiffiffiffiffiffiffiffiffiffiffiffiffiffiffiffiffiffiffiffiffiffiffiffiffiffiffiffiffiffiffiffi4CTð1þ 4CT þ ð�2
A�jþ �2
j ÞCW�j�jÞq
Þ4 CT
ð5Þ
Equation (5) can be used to decide on base stock location by considering the least non-negative �j value at stage-j. This decision is used to calculate the optimum service timeof each stage as Wj ¼ ð�j=�jÞ Wq�j.
For the case of supply shortage we have maximum production time Tj asTj ¼ Wj �Wq�j. Conversely, when the supplier service level is higher than the buyerthen the buyer may ask material delivery delay by Wq�j �Wi to reduce the buyerinventory. The positive impact is that this delay has no any effect to net replenishment
Strategicinventoryallocation
237
time � for stage-j that is defined as the replenishment time Wi þ Tj minus its servicetime Wj or � ¼ Wi þ Tj �Wj.
Following Graves and Willems (2000) formulation for the expected inventory EðIjÞthat represents the safety stock held at stage-j, then, EðIjÞ can be founded as thedifference between cumulative replenishment and cumulative shipment (Graves andWillems, 2000), as follows:
EðIjÞ ¼ Djð�Þ � �jð�Þ ð6Þ
Djð�Þ ¼ � �j þ zj �D
ffiffiffi�p
ð7Þ
Equation (7) expresses the expected safety stock at maximum possible demand byfinding the demand bound Djð�Þ where it equals maximum stock during � at a certainlevel of customer service level at stage-j zj (Graves and Willems, 2000). It is possible toget EðIjÞ ¼ 0, which means we can manage stage-j as make-to-order (MTO) instead ofmake-to-stock (MTS).
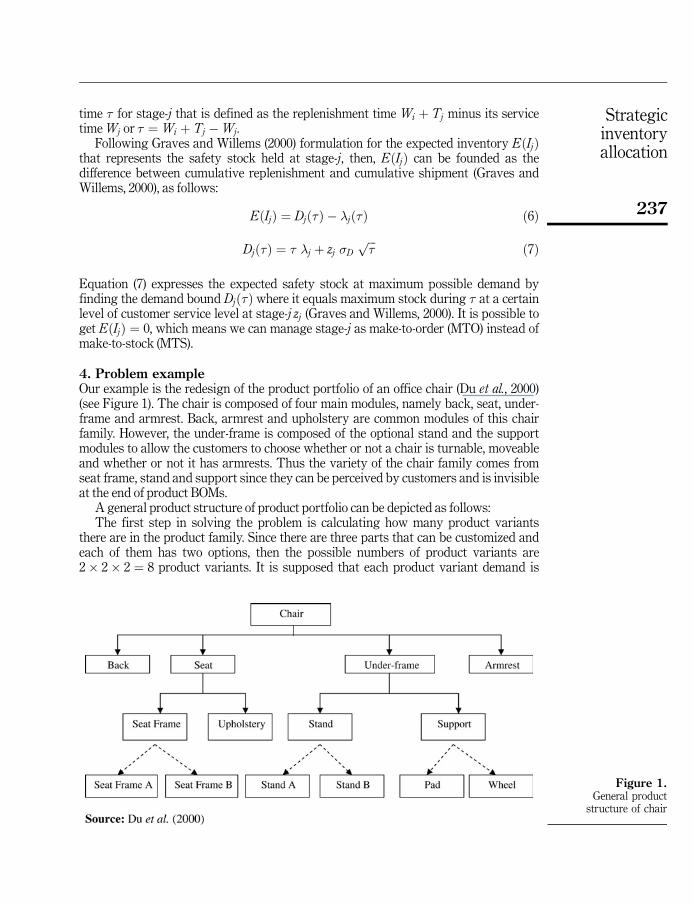
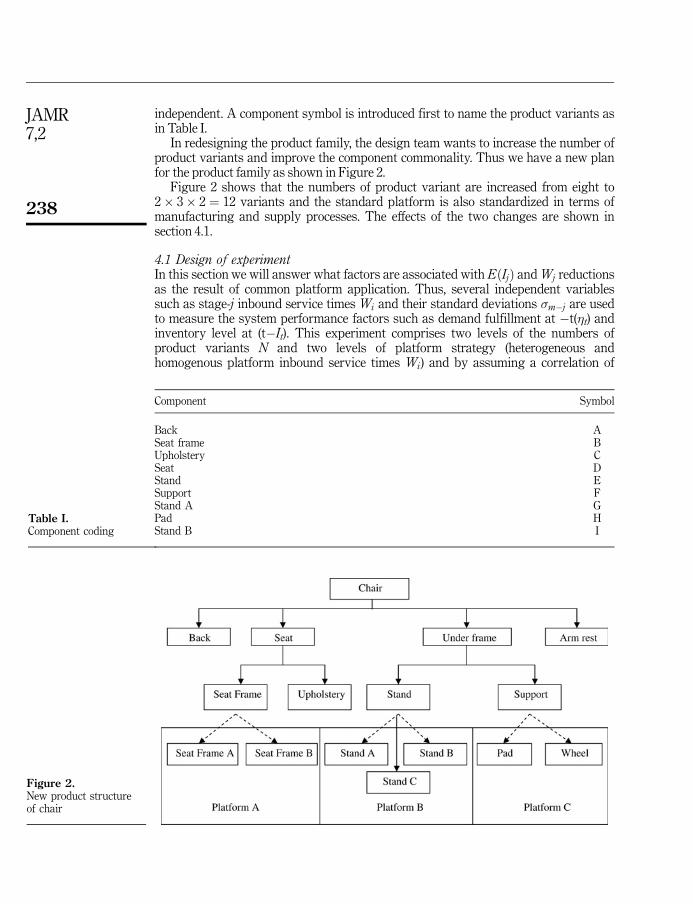
4. Problem exampleOur example is the redesign of the product portfolio of an office chair (Du et al., 2000)(see Figure 1). The chair is composed of four main modules, namely back, seat, under-frame and armrest. Back, armrest and upholstery are common modules of this chairfamily. However, the under-frame is composed of the optional stand and the supportmodules to allow the customers to choose whether or not a chair is turnable, moveableand whether or not it has armrests. Thus the variety of the chair family comes fromseat frame, stand and support since they can be perceived by customers and is invisibleat the end of product BOMs.
A general product structure of product portfolio can be depicted as follows:The first step in solving the problem is calculating how many product variants
there are in the product family. Since there are three parts that can be customized andeach of them has two options, then the possible numbers of product variants are2� 2� 2 ¼ 8 product variants. It is supposed that each product variant demand is
Figure 1.General product
structure of chair
JAMR7,2
238
independent. A component symbol is introduced first to name the product variants asin Table I.
In redesigning the product family, the design team wants to increase the number ofproduct variants and improve the component commonality. Thus we have a new planfor the product family as shown in Figure 2.
Figure 2 shows that the numbers of product variant are increased from eight to2� 3� 2 ¼ 12 variants and the standard platform is also standardized in terms ofmanufacturing and supply processes. The effects of the two changes are shown insection 4.1.
4.1 Design of experimentIn this section we will answer what factors are associated with EðIjÞ and Wj reductionsas the result of common platform application. Thus, several independent variablessuch as stage-j inbound service times Wi and their standard deviations �m�j are usedto measure the system performance factors such as demand fulfillment at �t(�t) andinventory level at (t�It). This experiment comprises two levels of the numbers ofproduct variants N and two levels of platform strategy (heterogeneous andhomogenous platform inbound service times Wi) and by assuming a correlation of
Table I.Component coding
Component Symbol
Back ASeat frame BUpholstery CSeat DStand ESupport FStand A GPad HStand B I
Figure 2.New product structureof chair

Strategicinventoryallocation
239
EðIjÞ and Wj it is clearly understood that this experiment will be executed undermultivariate analysis as shown in Table II.
In supporting platform strategy, it is assumed that the processing times for theentire components within the same platform Wplatform are equal. Since the process timevariation is influenced mostly by inbound service time, then it is chosen as anindependent variable. The reason is that production time is controllable and dependssolely on internal process optimization, while on the contrary inbound service time canbe assumed as a source of process time variation because we cannot control thecomponent suppliers.
The simulation is done by using EXTEND 6.0 simulation software and simulationvariables such as Tj;Wi;Wj and EðIÞ are extracted from the above analytical modelsthat are shown in Figure 3.
Figure 3 shows the order fulfillment process according to section 3. It showscustomer demand at stage-j is pooled in batch node. The order is processed atprocessing time Wj as a promised lead time from stage-j by using available inventoryat stage-j ðInv�stage�jÞ. However, stage-j needs to produce products to replenish theconsumed inventory at stage-j. This replenishment time depends on the stage-iprocessing time ðprod stage�iÞ. Inventory level EðIjÞ for each stage is represented bynodes Inv-stage-j and Inv stage-i. The supplier inventory level is put on the upstream ofthe simulation model at a very high level by assuming that the supply is alwaysavailable. Finally, the performance indicators of this simulation model are demandfulfillment at�t �t and inventory level at�tIt where t is the simulation period.
Table II.Design of experiment
for two outcomes(E(Ij) and Wj)
�platform > �j �platform � �j
N ¼ 8 N ¼ 12 N ¼ 8 N ¼ 12
Heterogeneous �platform (�t and It) (�t and It ) (�t and It ) (�t and It )Homogenous �platform (�t and It) (�t and It ) (�t and It ) (�t and It )
Figure 3.Simulation model for
product platform analysis

JAMR7,2
240
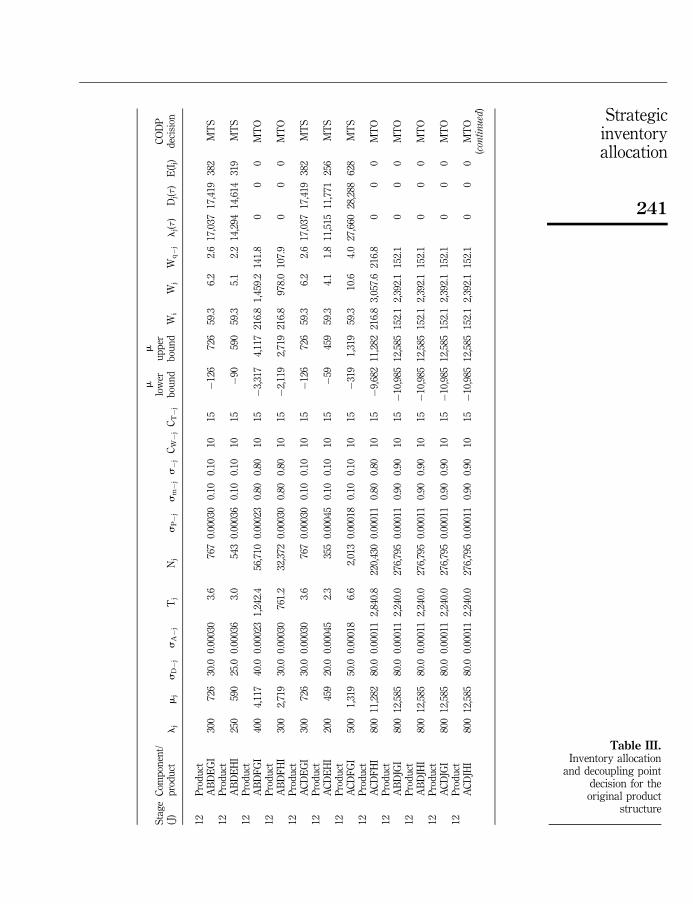
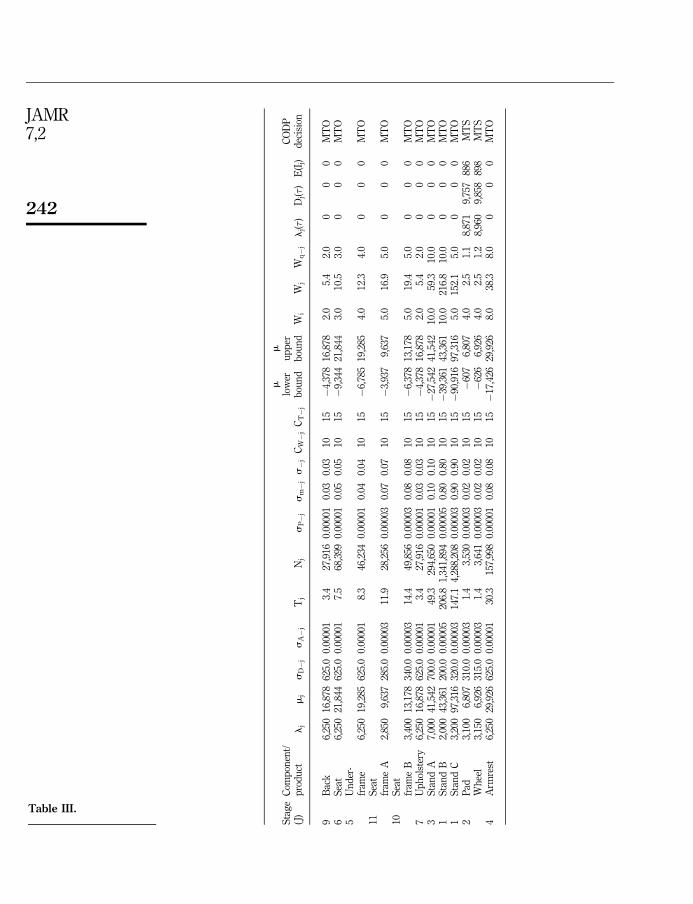
4.2 Strategic inventory allocation analysis resultsInventory level EðIjÞ, push pull strategy (decoupling point) and Wj in the originalproduct structure (N ¼ 8) are shown in Table II in considering services rates andinbound service and production rates. This paper assumes that �D for all products andcomponents is 5 percent. Thus, by utilizing Equations(1)-(6) we can decide on strategicsafety stock allocation to decide on push or pull CODP. It indicates that the longerinbound process time Wi creates higher EðIjÞ. This result implies that manufacturingand supply capability Wi have an important role in determining EðIjÞ allocation.
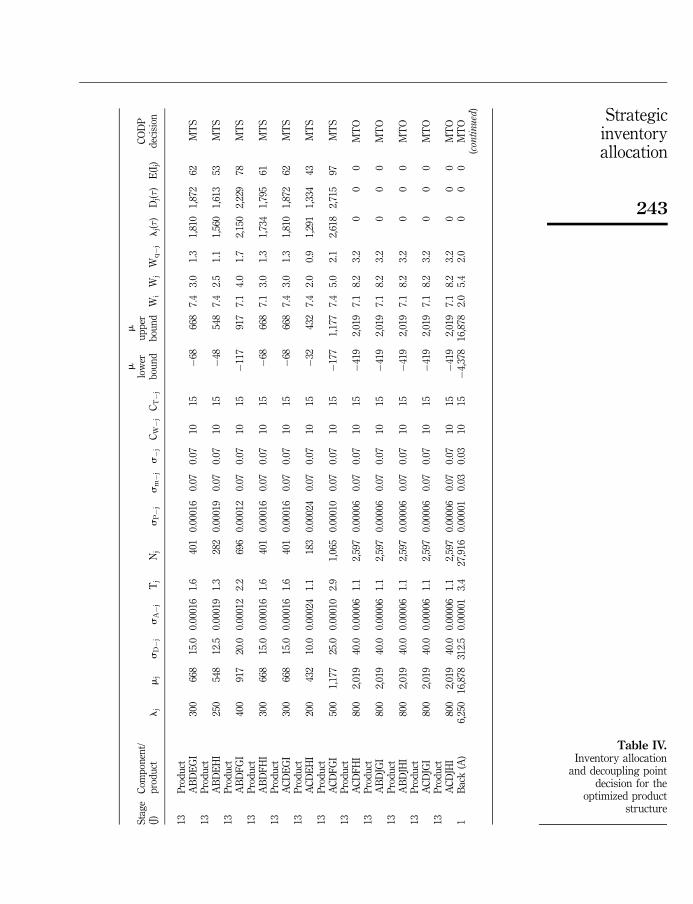
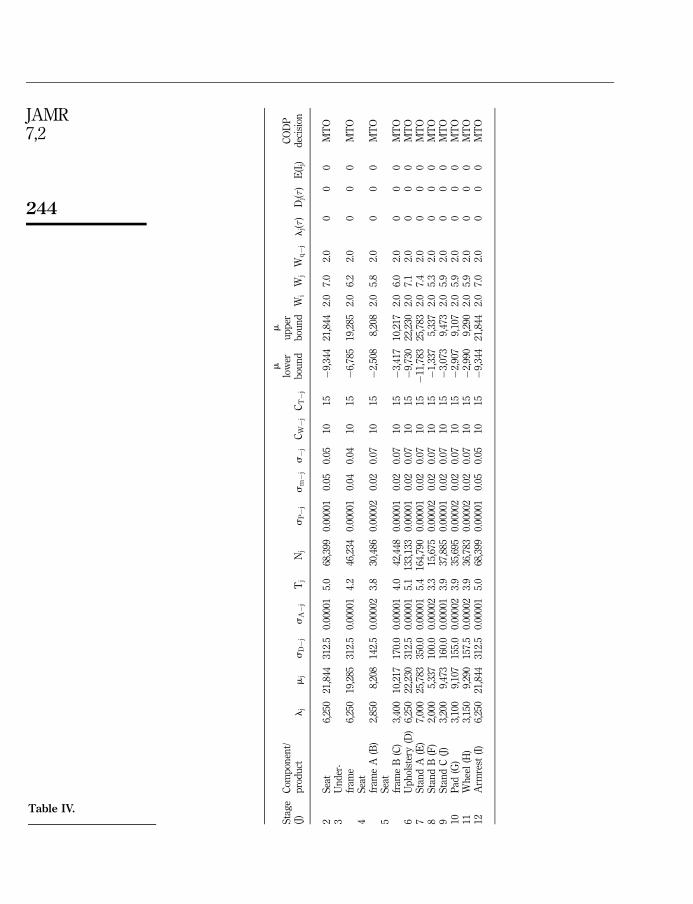
Table III shows that different Wi affects different CODP. The above result is thencompared to Table IV in terms of EðIjÞ and service rate Wj to investigate thedifferences, as shown in Table IV.
When we compare Tables III and IV in terms of EðIjÞ and Wj (see columns 19 and 21in Tables III and IV), then there is a significant improvement in service time Wj andexpected inventory EðIjÞ reduction for the entire product variants and components.These results imply that improving product platform commonality gives benefit interms of customer service level improvement by increasing the amount of productvariety and at the same time reducing service times and inventory allocation.
Without losing generality, the design of the experiment is only subjected to productsABDEGI in Tables III and IV by considering that all the product variantmanufacturing process designs are developed in the same way. Thus, the resultvariation only depends on order size where the inventory level, processing time andorder queue pattern positively follow the order size pattern.
Data from Table V are then used to investigate the process variablesðWj; �platform;NÞ effects on SC performance through multivariate analysis. Thisanalysis is chosen to determine what factors significantly influence performanceindicators such as Nj; Ii; Ij and Output independently or jointly. The most influencingfactor is then analysed further by using multivariate analysis of variance to decide onthe best strategy for increasing profit by considering the performance indicator values.
Table VI shows that processing time and inbound process time standard deviationtogether have an effect on maximum order queuing and inventory level at stage-j. Onthe other hand, the number of product varieties affects all the performance indicators(significance level of <0.05 gives no effect on performance indicators). These resultsimply that the number of product variants correlated to the requirement for developingcommon product platform is the main factor for determining SC performance.
In addition to common product platform development, benefit is produced inreducing the order queue. This implies that higher product platform commonalityreduces processing time and inbound service time standard deviation. Specifically,Table IV shows that higher product variety that is supported by well-planned platformstrategy (lower �platform and homogeneous Wj) significantly supports lean strategy byreducing inventory level, agile strategy by increasing the number of product variantsand outputs, and responsiveness by reducing customer order queues.
4.3 Managerial implicationsSimilar strategic safety stock allocation proposed in the previous literature (Graves andWillems, 2000, 2008) focused exclusively on SC design. This suggests that theallocation of strategic safety stock to decide on push pull CODP is idiosyncratic to aparticular product architecture design. However, the growing of product variety forcesSC to allow the higher level of customer involvement in the product developmentprocess. This suggest SC to align product development process and manufacturing
Strategicinventoryallocation
241
Table III.Inventory allocation
and decoupling pointdecision for theoriginal product
structure
Sta
ge
(J)
Com
pon
ent/
pro
du
ctl
jm
js
D�
js
A�
jT
jN
js
P�
js
m�
js�
jC
W�
jC
T�
j
m
low
erb
oun
d
m
up
per
bou
nd
Wi
Wj
Wq�
jl
j(�)
Dj(�
)E
(Ij)
CO
DP
dec
isio
n
12P
rod
uct
AB
DE
GI
300
726
30.0
0.00
030
3.6
767
0.00
030
0.10
0.10
1015
�12
672
659
.36.
22.
617
,037
17,4
1938
2M
TS
12P
rod
uct
AB
DE
HI
250
590
25.0
0.00
036
3.0
543
0.00
036
0.10
0.10
1015
�90
590
59.3
5.1
2.2
14,2
9414
,614
319
MT
S12
Pro
du
ctA
BD
FG
I40
04,
117
40.0
0.00
023
1,24
2.4
56,7
100.
0002
30.
800.
8010
15�
3,31
74,
117
216.
81,
459.
214
1.8
00
0M
TO
12P
rod
uct
AB
DF
HI
300
2,71
930
.00.
0003
076
1.2
32,3
720.
0003
00.
800.
8010
15�
2,11
92,
719
216.
897
8.0
107.
90
00
MT
O12
Pro
du
ctA
CD
EG
I30
072
630
.00.
0003
03.
676
70.
0003
00.
100.
1010
15�
126
726
59.3
6.2
2.6
17,0
3717
,419
382
MT
S12
Pro
du
ctA
CD
EH
I20
045
920
.00.
0004
52.
335
50.
0004
50.
100.
1010
15�
5945
959
.34.
11.
811
,515
11,7
7125
6M
TS
12P
rod
uct
AC
DF
GI
500
1,31
950
.00.
0001
86.
62,
013
0.00
018
0.10
0.10
1015
�31
91,
319
59.3
10.6
4.0
27,6
6028
,288
628
MT
S12
Pro
du
ctA
CD
FH
I80
011
,282
80.0
0.00
011
2,84
0.8
220,
430
0.00
011
0.80
0.80
1015
�9,
682
11,2
8221
6.8
3,05
7.6
216.
80
00
MT
O12
Pro
du
ctA
BD
JGI
800
12,5
8580
.00.
0001
12,
240.
027
6,79
50.
0001
10.
900.
9010
15�
10,9
8512
,585
152.
12,
392.
115
2.1
00
0M
TO
12P
rod
uct
AB
DJH
I80
012
,585
80.0
0.00
011
2,24
0.0
276,
795
0.00
011
0.90
0.90
1015�
10,9
8512
,585
152.
12,
392.
115
2.1
00
0M
TO
12P
rod
uct
AC
DJG
I80
012
,585
80.0
0.00
011
2,24
0.0
276,
795
0.00
011
0.90
0.90
1015�
10,9
8512
,585
152.
12,
392.
115
2.1
00
0M
TO
12P
rod
uct
AC
DJH
I80
012
,585
80.0
0.00
011
2,24
0.0
276,
795
0.00
011
0.90
0.90
1015�
10,9
8512
,585
152.
12,
392.
115
2.1
00
0M
TO
(con
tinued
)
JAMR7,2
242
Table III.
Sta
ge
(J)
Com
pon
ent/
pro
du
ctl
jm
js
D�
js
A�
jT
jN
js
P�
js
m�
js�
jC
W�
jC
T�
j
mlo
wer
bou
nd
mu
pp
erb
oun
dW
iW
jW
q�
jl
j(�)
Dj(�
)E
(Ij)
CO
DP
dec
isio
n
9B
ack
6,25
016
,878
625.
00.
0000
13.
427
,916
0.00
001
0.03
0.03
1015
�4,
378
16,8
782.
05.
42.
00
00
MT
O6
Sea
t6,
250
21,8
4462
5.0
0.00
001
7.5
68,3
990.
0000
10.
050.
0510
15�
9,34
421
,844
3.0
10.5
3.0
00
0M
TO
5U
nd
er-
fram
e6,
250
19,2
8562
5.0
0.00
001
8.3
46,2
340.
0000
10.
040.
0410
15�
6,78
519
,285
4.0
12.3
4.0
00
0M
TO
11S
eat
fram
eA
2,85
09,
637
285.
00.
0000
311
.928
,256
0.00
003
0.07
0.07
1015
�3,
937
9,63
75.
016
.95.
00
00
MT
O10
Sea
tfr
ame
B3,
400
13,1
7834
0.0
0.00
003
14.4
49,8
560.
0000
30.
080.
0810
15�
6,37
813
,178
5.0
19.4
5.0
00
0M
TO
7U
ph
olst
ery
6,25
016
,878
625.
00.
0000
13.
427
,916
0.00
001
0.03
0.03
1015
�4,
378
16,8
782.
05.
42.
00
00
MT
O3
Sta
nd
A7,
000
41,5
4270
0.0
0.00
001
49.3
294,
650
0.00
001
0.10
0.10
1015�
27,5
4241
,542
10.0
59.3
10.0
00
0M
TO
1S
tan
dB
2,00
043
,361
200.
00.
0000
520
6.8
1,34
1,89
40.
0000
50.
800.
8010
15�
39,3
6143
,361
10.0
216.
810
.00
00
MT
O1
Sta
nd
C3,
200
97,3
1632
0.0
0.00
003
147.
14,
288,
208
0.00
003
0.90
0.90
1015�
90,9
1697
,316
5.0
152.
15.
00
00
MT
O2
Pad
3,10
06,
807
310.
00.
0000
31.
43,
530
0.00
003
0.02
0.02
1015
�60
76,
807
4.0
2.5
1.1
8,87
19,
757
886
MT
SW
hee
l3,
150
6,92
631
5.0
0.00
003
1.4
3,64
10.
0000
30.
020.
0210
15�
626
6,92
64.
02.
51.
28,
960
9,85
889
8M
TS
4A
rmre
st6,
250
29,9
2662
5.0
0.00
001
30.3
157,
998
0.00
001
0.08
0.08
1015�
17,4
2629
,926
8.0
38.3
8.0
00
0M
TO
Strategicinventoryallocation
243
Table IV.Inventory allocation
and decoupling pointdecision for the
optimized productstructure
Sta
ge
(J)
Com
pon
ent/
pro
du
ctl
jm
js
D�
js
A�
jT
jN
js
P�
js
m�
js�
jC
W�
jC
T�
j
mlo
wer
bou
nd
mu
pp
erb
oun
dW
iW
jW
q�
jl
j(�)
Dj(�
)E
(Ij)
CO
DP
dec
isio
n
13P
rod
uct
AB
DE
GI
300
668
15.0
0.00
016
1.6
401
0.00
016
0.07
0.07
1015
�68
668
7.4
3.0
1.3
1,81
01,
872
62M
TS
13P
rod
uct
AB
DE
HI
250
548
12.5
0.00
019
1.3
282
0.00
019
0.07
0.07
1015
�48
548
7.4
2.5
1.1
1,56
01,
613
53M
TS
13P
rod
uct
AB
DF
GI
400
917
20.0
0.00
012
2.2
696
0.00
012
0.07
0.07
1015
�11
791
77.
14.
01.
72,
150
2,22
978
MT
S13
Pro
du
ctA
BD
FH
I30
066
815
.00.
0001
61.
640
10.
0001
60.
070.
0710
15�
6866
87.
13.
01.
31,
734
1,79
561
MT
S13
Pro
du
ctA
CD
EG
I30
066
815
.00.
0001
61.
640
10.
0001
60.
070.
0710
15�
6866
87.
43.
01.
31,
810
1,87
262
MT
S13
Pro
du
ctA
CD
EH
I20
043
210
.00.
0002
41.
118
30.
0002
40.
070.
0710
15�
3243
27.
42.
00.
91,
291
1,33
443
MT
S13
Pro
du
ctA
CD
FG
I50
01,
177
25.0
0.00
010
2.9
1,06
50.
0001
00.
070.
0710
15�
177
1,17
77.
45.
02.
12,
618
2,71
597
MT
S13
Pro
du
ctA
CD
FH
I80
02,
019
40.0
0.00
006
1.1
2,59
70.
0000
60.
070.
0710
15�
419
2,01
97.
18.
23.
20
00
MT
O13
Pro
du
ctA
BD
JGI
800
2,01
940
.00.
0000
61.
12,
597
0.00
006
0.07
0.07
1015
�41
92,
019
7.1
8.2
3.2
00
0M
TO
13P
rod
uct
AB
DJH
I80
02,
019
40.0
0.00
006
1.1
2,59
70.
0000
60.
070.
0710
15�
419
2,01
97.
18.
23.
20
00
MT
O13
Pro
du
ctA
CD
JGI
800
2,01
940
.00.
0000
61.
12,
597
0.00
006
0.07
0.07
1015
�41
92,
019
7.1
8.2
3.2
00
0M
TO
13P
rod
uct
AC
DJH
I80
02,
019
40.0
0.00
006
1.1
2,59
70.
0000
60.
070.
0710
15�
419
2,01
97.
18.
23.
20
00
MT
O1
Bac
k(A
)6,
250
16,8
7831
2.5
0.00
001
3.4
27,9
160.
0000
10.
030.
0310
15�
4,37
816
,878
2.0
5.4
2.0
00
0M
TO
(con
tinued
)
JAMR7,2
244
Table IV.
Sta
ge
(J)
Com
pon
ent/
pro
du
ctl
jm
js
D�
js
A�
jT
jN
js
P�
js
m�
js�
jC
W�
jC
T�
j
m
low
erb
oun
d
m
up
per
bou
nd
Wi
Wj
Wq�
jl
j(�)
Dj(�
)E
(Ij)
CO
DP
dec
isio
n
2S
eat
6,25
021
,844
312.
50.
0000
15.
068
,399
0.00
001
0.05
0.05
1015
�9,
344
21,8
442.
07.
02.
00
00
MT
O3
Un
der
-fr
ame
6,25
019
,285
312.
50.
0000
14.
246
,234
0.00
001
0.04
0.04
1015
�6,
785
19,2
852.
06.
22.
00
00
MT
O4
Sea
tfr
ame
A(B
)2,
850
8,20
814
2.5
0.00
002
3.8
30,4
860.
0000
20.
020.
0710
15�
2,50
88,
208
2.0
5.8
2.0
00
0M
TO
5S
eat
fram
eB
(C)
3,40
010
,217
170.
00.
0000
14.
042
,448
0.00
001
0.02
0.07
1015
�3,
417
10,2
172.
06.
02.
00
00
MT
O6
Up
hol
ster
y(D
)6,
250
22,2
3031
2.5
0.00
001
5.1
133,
133
0.00
001
0.02
0.07
1015
�9,
730
22,2
302.
07.
12.
00
00
MT
O7
Sta
nd
A(E
)7,
000
25,7
8335
0.0
0.00
001
5.4
164,
790
0.00
001
0.02
0.07
1015
�11
,783
25,7
832.
07.
42.
00
00
MT
O8
Sta
nd
B(F
)2,
000
5,33
710
0.0
0.00
002
3.3
15,6
750.
0000
20.
020.
0710
15�
1,33
75,
337
2.0
5.3
2.0
00
0M
TO
9S
tan
dC
(J)
3,20
09,
473
160.
00.
0000
13.
937
,885
0.00
001
0.02
0.07
1015
�3,
073
9,47
32.
05.
92.
00
00
MT
O10
Pad
(G)
3,10
09,
107
155.
00.
0000
23.
935
,695
0.00
002
0.02
0.07
1015
�2,
907
9,10
72.
05.
92.
00
00
MT
O11
Wh
eel
(H)
3,15
09,
290
157.
50.
0000
23.
936
,783
0.00
002
0.02
0.07
1015
�2,
990
9,29
02.
05.
92.
00
00
MT
O12
Arm
rest
(I)
6,25
021
,844
312.
50.
0000
15.
068
,399
0.00
001
0.05
0.05
1015
�9,
344
21,8
442.
07.
02.
00
00
MT
O

Strategicinventoryallocation
245
process to find the efficient way in which products can be manufactured andrecombined into new configurations without losing functionality and performance.
For practitioners, strategic safety stock allocation to decide on CODP and productplatform models are valuable, as they highlight various managerial and strategicimplications of design for SC decisions. These decisions are usually based on the firm’svision of SC agility (Sharifi et al., 2006). When the framework of mapping out adynamic and structured approach for developing agile SCs is understood in asystematic manner, strategic safety stock allocation facilitates decision making withregard to lean strategy by reducing inventory level, agile strategy by increasing theamount of product variety and outputs, and responsiveness by reducing the numbersof customer order queues.
In addition to concurrent engineering, concentrating on product design problemcreates complexity in shop floor activities due to the variety of different products thathave to be built. In order to manage this complexity it is of paramount importance forthe shop floor personnel to have reliable manufacturing process design. First, a highcorrectness level of BOMs make it possible to avoid production stoppages, andconsequently delivery delays, which used to occur regularly because of missinginformation or because of errors detected during the manufacturing process.Additionally, the presence of BOMs that are virtually without errors increases materialplanning reliability, further reducing the risk of delayed deliveries or the level (andtherefore the cost) of safety inventories (Forza and Salvador, 2002). Finally, eliminatingbill of material errors can be accomplished by adopting a common product platform tosupport the application of strategic safety stock allocation.
Table V.Design of experiment
results
Factors (independent variables)Performance indicators
Order on hand Stage-i It Stage-j It Output
343 0 0 406Heterogeneous N ¼ 8 �platform < �j 260 0 0 409Wj 271 0 0 408
62 192 235 157N ¼ 8 �platform > �j 27 0 282 122
82 192 234 15790 0 83 329
Homogenous N ¼ 8 �platform > �j 202 0 71 467Wj 193 0 73 326
41 193 234 158N ¼ 8 �platform < �j 2 194 237 157
92 191 234 157170 0 0 389
Heterogeneous N ¼ 12 �platform < �j 232 0 0 387Wj 250 0 0 388
435 0 0 324N ¼ 12 �platform > �j 440 0 0 320
441 0 0 29018 0 66 330
Homogenous N ¼ 12 �platform > �j 24 0 28 355Wj 7 0 18 362
0 0 15 370N ¼ 12 �platform < �j 5 0 25 365
31 0 3 378

JAMR7,2
246
5. Conclusions and future researchThis paper has discussed the benefit of strategic inventory allocation for productplatform strategy through it abilities to send 100 percent guarantee lead times atminimum inventory costs. We may summarize the results derived from the model asfollows:
. Manufacturing process design supports product development processoptimization through safety stock allocation, and CODP optimization exploresthe benefits of strategic safety stock for developing common product platform.
Table VI.Multivariate analysis
Tests of between-subjects effects
SourceDependentvariable
Type III sumof squares df
Meansquare F Sig.
Corrected model Maximum queue 493,094.500a 7 70,442.071 51.988 0.000Stage-i inventory 121,953.167b 7 17,421.881 11.340 0.000Stage-j inventory 234,889.167c 7 33,555.595 172.154 0.000Product outputs 225,944.292d 7 32,277.756 34.101 0.000
Intercept Maximum queue 575,980.167 1 575,980.167 425.091 0.000Stage-i inventory 38,560.167 1 38,560.167 25.100 0.000Stage-j inventory 140,760.167 1 140,760.167 722.156 0.000Product outputs 2,350,630.042 1 2,350,630.042 2,483.388 0.000
N Maximum queue 6,272.667 1 6,272.667 4.629 0.047Stage-i inventory 38,560.167 1 38,560.167 25.100 0.000Stage-j inventory 97,282.667 1 97,282.667 499.099 0.000Product outputs 42,084.375 1 42,084.375 44.461 0.000
Wj Maximum queue 221,952.667 1 221,952.667 163.808 0.000Stage-i inventory 1,568.167 1 1,568.167 1.021 0.327Stage-j inventory 4,704.000 1 4,704.000 24.133 0.000Product outputs 0.375 1 0.375 0.000 0.984
stdev Maximum queue 4,374.000 1 4,374.000 3.228 0.091Stage-i inventory 1,568.167 1 1,568.167 1.021 0.327Stage-j inventory 4,873.500 1 4,873.500 25.003 0.000Product outputs 7,812.042 1 7,812.042 8.253 0.011
N * Wj Maximum queue 88,573.500 1 88,573.500 65.370 0.000Stage-i inventory 1,568.167 1 1,568.167 1.021 0.327Stage-j inventory 28.167 1 28.167 0.145 0.709Product outputs 672.042 1 672.042 0.710 0.412
N * stdev Maximum queue 44,204.167 1 44,204.167 32.624 0.000Stage-i inventory 1,568.167 1 1,568.167 1.021 0.327Stage-j inventory 1,734.000 1 1,734.000 8.896 0.009Product outputs 1,053.375 1 1,053.375 1.113 0.307
Wj * stdev Maximum queue 6,733.500 1 6,733.500 4.970 0.040Stage-i inventory 38,560.167 1 38,560.167 25.100 0.000Stage-j inventory 56,066.667 1 56,066.667 287.644 0.000Product outputs 106,800.042 1 106,800.042 112.832 0.000
N * Wj * stdev Maximum queue 120,984.000 1 120,984.000 89.290 0.000Stage-i inventory 38,560.167 1 38,560.167 25.100 0.000Stage-j inventory 70,200.167 1 70,200.167 360.155 0.000Product outputs 67,522.042 1 67,522.042 71.336 0.000
Notes: aR Squared¼ 0.016 (Adjusted R Squared¼ �0.057); bR Squared¼ 0.368 (Adjusted RSquared¼ 0.321); cR Squared¼ 0.784 (Adjusted R Squared¼ 0.768); dR Squared¼ 0.405 (AdjustedR Squared¼ 0.341)

Strategicinventoryallocation
247
In fact, this effort reduces product platform strategy misapplication by givingguidance on what factors should be considered in creating product platform,thus complementing the previous finding on product platform benefit forreducing safety stock (Collier, 1981, 1982).
. Order processing time and supply uncertainty are two factors that need to beconsidered for developing product platform (Kristianto and Helo, 2009). Thisconclusion corresponds with SC collaboration (Shariffi et al., 2006) where supplycommitment is required by the final manufacturer from the supplier to make theorder processing time uniform. Strategic inventory allocation once more in thiscase supports supply and order processing time uncertainty reduction byallocating the appropriate amount of safety stock to anticipate possiblemaximum demands. This allocation depends on the supply variance of thesuppliers and also the processing rates of the manufacturer. Furthermore, theprocessing rate is also optimized by considering demand and supply standarddeviation (Equation (6)) Thus, strategic inventory allocation in this paperprovides in-depth analysis from the product, process and SC point of view(Salvador et al., 2002).
However, if the benefit of strategic inventory allocation is assumed to be limited forplatform strategy, then we ignore the bigger effect of this allocation strategy on futureapplications of concurrent engineering. Future concurrent engineering needs all SCactivities to have limited interdependency and to share their capability with otherparties in the SC to reduce product development time. In that situation, the strategicinventory allocation role is to give guidance to the SC in developing componentsaccording to CODP, in accordance with the strategic inventory allocation. The latestdeveloped product family should not create higher inventory allocation by puttingmore stock in each component. Thus the supplier must develop components thatguarantee lower supply and processing time uncertainty.
References
Blecker, T. and Abdelkafi, N. (2007), ‘‘The development of component commonality metricfor mass customization’’, IEEE Transactions on Engineering Management, Vol. 54 No. 1,pp. 69-84.
Collier, D.A. (1981), ‘‘The measurement and operating benefits of component part commonality’’,Decision Sciences, Vol. 12 No. 1, pp. 85-96.
Collier, D.A. (1982), ‘‘Aggregate safety stock levels and component part commonality’’,Management Science, Vol. 28 No. 11, pp. 1296-303.
Du, X., Jiao, J. and Tseng, M. (2000), ‘‘Architecture of product family for mass customization’’,ICMIT 2000, available at: http://ieeexplore.ieee.org/stamp/stamp.jsp?tp¼&arnumber¼917377&isnumber¼19805 (accessed 5 March 2009 at 05:21).
Eynan, A. and Rosenblatt, M.J. (1996), ‘‘Component commonality effect on inventory cost’’, IIETransactions, Vol. 28, pp. 93-104.
Fine, C.H. (2000), ‘‘Clockspeed-based strategies for supply chain design’’, Production andOperations Management, Vol. 9 No. 3, pp. 213-21.
Fixson, S.K. (2005), ‘‘Product architecture assessment: a tool to link product, process, and supplychain design decisions’’, Journal of Operations Management, Vol. 23, pp. 345-69.
Fogliato, F.S., Da Silveira, G.C.J. and Royer, R. (2003), ‘‘Flexibility driven index for measuringmass customization feasibility on industrial products’’, International Journal of ProductionResearch, Vol. 23 No. 8, pp. 1811-29.
JAMR7,2
248
Forza, C. and Salvador, F. (2002), ‘‘Managing for variety in the order acquisition and orderfulfillment process: the contribution of product configuration systems’’, InternationalJournal of Production Economics, Vol. 76, pp. 87-98.
Graves, S.C. and Willems, S.P. (2000), ‘‘Optimizing strategic safety stock placement in supplychains’’, Manufacturing and Service Operations Management, Vol. 2 No. 1, pp.68-83.
Graves, S.C. and Willems, S.P. (2008), ‘‘Strategic inventory placement in supply chains:nonstationary demand’’, Manufacturing and Service Operations Management, Vol. 10No. 2, pp. 278-87.
Huang, G.Q., Zhang, X.Y. and Lo, V.H.Y. (2007), ‘‘Integrated configuration of product platformproducts and supply chains for mass customization: a game theoretic approach’’, IEEETransactions on Engineering Management, Vol. 54 No. 1, pp. 156-71.
Hult, G. and Scott Swan, K. (2003), ‘‘A research agenda for the Nexus of product development andsupply chain management’’, Journal of Product Innovation Management, Vol. 20 No. 5,pp. 333-6.
Jiao, J. and Tseng, M.M. (1996), ‘‘Design for mass customization’’, Annals of the CIRP, Vol. 5 No. 1,pp. 153-66.
Jiao, J. and Tseng, M.M. (2000), ‘‘Fundamental of product family design architecture’’, IntegratedManufacturing System, Vol. 11 No. 7, pp. 469-83.
Kotha, S. and Swamidhas, P.M. (2000), ‘‘Strategy, advanced manufacturing technology andperformance: empirical evidence from US manufacturing firms’’, Journal of OperationsManagement, Vol. 18, pp. 257-77.
Kristianto, Y. and Helo, P. (2009), ‘‘Strategic thinking in supply and innovation in dualsourcing procurement’’, International Journal of Applied Management Science, Vol. 1 No. 4,pp. 401-19.
Kristianto, Y. and Helo, P. (2010), ‘‘Built-to-order supply chain: response analysis with controlmodel’’, International Journal of Procurement Management, Vol. 3 No. 2, pp. 181-98.
Martin, M. and Ishii, K. (1996), ‘‘Design for variety: a methodology for understanding the costs ofproduct proliferation’’, in Wood, K. (Ed.), Design Theory and Methodology – DTM’96,ASME, Irvine, CA, Paper No. 96-DETC/DTM-1610.
Pandey, V.C. and Garg, S. (2007), ‘‘Analysis of interaction among the enablers of agility in supplychain’’, Journal of Advances in Management Research, Vol. 6 No. 1, pp. 8-26.
Salvador, F., Forza, C. and Rungtusanatham, M. (2002), ‘‘How to mass customize: productarchitectures, sourcing configurations’’, Business Horizon, Vol. July-August, pp. 61-9.
Sanchez, R. (2002), ‘‘Creating modular platforms for strategic flexibility’’, Design ManagementReview, Winter, Vol. 2, pp. 58-67.
Sharifi, H., Ismail, H.S. and Reid, I. (2006), ‘‘Achieving agility in supply chain throughsimultaneous ‘design of and design for’ supply chain’’, Journal of ManufacturingTechnology Management, Vol. 17 No. 8, pp. 1078-98.
Siddique, Z., Rosen, D.W. and Wang, N. (1998), ‘‘On the applicability of product variety designconcepts to automotive platform commonality’’, in Krovi, V. and Ananthasuresh, G.K.(Eds), Design Theory and Methodology, ASME, Atlanta, GA, Paper No. DETC98/DTM-5661.
Wacker, J.G. and Trelevan, M. (1986), ‘‘Component part standardization: an analysis ofcommonality sources and indices’’, Journal of Operations Management, Vol. 6 No. 2,pp. 219-44.
Further reading
Agard, B. and Kusiak, A. (2004), ‘‘Data mining based technology for the design of productfamilies’’, International Journal of Production Research, Vol. 42 No. 15, pp. 2955-69.

Strategicinventoryallocation
249
Ulrich, K. (1995), ‘‘The role of product architecture in the manufacturing firm’’, Research Policy,Vol. 24, May, pp. 419-40.
About the authors
Yohanes Kristianto is now a PhD student in Industrial Management at University of Vaasa,Finland. His research interests are in the area of supply-chain strategy/management andproduction/operations management. His papers have been published in several internationaljournals. Yohanes Kristianto is the corresponding author and can be contacted at:[email protected]
Petri Helo is a Research Professor in Department of Production, University of Vaasa. Hisresearch addresses the management of logistics processes in supply demand networks, whichtake place in electronics, machine building and food industries. His papers have been publishedin several international journals.
Josu Takala is a Research Professor in the Department of Production, University of Vaasa.His research interests are in the area of technology management and production/operationsmanagement. His papers have been published in several international journals.
To purchase reprints of this article please e-mail: [email protected] visit our web site for further details: www.emeraldinsight.com/reprints

Reproduced with permission of the copyright owner. Further reproduction prohibited without permission.