Outsourcing of Organizational Routines Knowledge, control ...
STRATEGIC DEPENDENCE ON THE IT RESOURCE AND OUTSOURCING:
A TEST OF THE STRATEGIC CONTROL MODEL
Detmar Straub Georgia State University
J. Mack Robinson College of Business Box 4015
Atlanta, GA 30302-4015 Phone: 404.413.7378
Fax: 617.253.4424 [email protected]
Peter Weill
MIT Sloan School of Management
3 Cambridge Center NE20-336 Cambridge, MA 02142 Phone: 617.253.2348 Fax: 617.253.4424
Kathy S. Schwaig Kennesaw State University
Michael J. Coles College of Business 1000 Chastain Road
Kennesaw, GA 30144-5591 Phone: 770.423.6323
Fax: 770.423.6539 [email protected]
Forthcoming in the 2008 Springer-Verlag edition of Information Systems Outsourcing. This book is the proceedings of the ICOIS (International Conference on the Outsourcing of IS), held in
Heidelberg, Germany, May, 2007.
Copyright ©Detmar Straub, Peter Weill, and Kathy Stewart Schwaig, 2007. All rights reserved.
Authors: Detmar W. Straub, Peter Weill, Kathy Stewart Schwaig
2
Authors: Detmar W. Straub, Peter Weill, Kathy Stewart Schwaig
ABSTRACT
Using resource dependency theory (RDT), this research analyzes how organizations control their information technology resources to improve organizational performance. According to RDT, organizations must manage their dependency on external organizations and limit external dependencies when resources are considered critical. The current study proposes and tests a Strategic Control Model positing that managers seek to control important, strategic resources in order to create value for the firm and to avoid dependency on external entities. Utilizing a research design that captured extensive quantitative data on the control of IT functions and services, the research team gathered five years of data on 54 business units(BUs) in 27 global companies located in seven countries. Study 1 examined the linkagesof these 54 BUs to firm performance. In study 2, managers in these firms reported on 378 different outsourcing decisions each of 7 core and 7 noncore IT activities. Findings show that firms with strategic investments in IT tend to locate control of their IT resources inside the firm. Locating the Extent of Control within the firm in cases where the firm depends on IT as a strategic resource proves to be a good explanation for effective decisions leading to higher performance. Viewing IT as a strategic resource alone does not lead to positive business unit outcomes, but the moderating influence of Extent of Control is found to establish the complex statistical relationship with business unit performance. For these reasons, it is critical that a theoretically-grounded firm-wide process for decisions on locating IT control is in place to capture business value. Strategic control proves to be a good explanation for how the most effective managers outsource IT. Firms with a more strategic view of IT outsourced fewer core assets. The selective outsourcing approach also has a complex statistical relationship with business unit performance, i.e., firms with selectively outsourcing IT having higher revenues per employee and faster completion times for new IT products. For these reasons, it is critical that a clear firm-wide process for management decision making on IT sourcing is in place to capture business value.
KEYWORDS
resource dependency theory; IT outsourcing decisions; strategic information systems; strategic IT resources; core competency; IT outsourcing; IT performance; firm performance; Extent of control
1. INTRODUCTION
When managers decide to outsource IT, they should do this to create value for the firm. One means of creating business value is by achieving dramatic cost savings through outsourcing; another is through decisions that lead to strategic control of IT resources. In the former, IT outsourcing returns profits to the firm by taking advantage of economies in the marketplace. Theoretically, IT vendors/outsourcers drive down the costs of production and technical expertise by spreading these expenses over a large client base; accordingly, their customers are able to benefit indirectly from these economies of scale through attractive pricing of IT products and services by vendors. Strategic control is a second avenue for value creation. Managers who identify IT resources that are critical to their firm’s operations and to its strategic direction are theoretically better able to manage those resources if the firm maintains control over them. By divesting themselves of activities that are not strategic, they can capitalize on superior design, marketing, production, inbound logistics, or distribution capabilities. Thus, organizations that outsource IT activities that are not strategic can concentrate energies on distinctive resources that are directly related to value creation for the firm. The notion of strategic control of the IT resource has strong theoretical underpinnings in resource dependency theory. While both the cost savings and strategic control lines of reasoning have solid theoretical bases, nearly all of the research to date on IT sourcing has posited and/or tested economic and financial models, i.e., has stressed cost,
Authors: Detmar W. Straub, Peter Weill, Kathy Stewart Schwaig
3
rather than positing strategic control models. The current study seeks to fill this gap in the IT outsourcing research portfolio by proposing and testing a Strategic Control Model. The notion of resource dependency is central to RDT and to the two studies presented. Specifically, a resource dependency is created any time a firm relies on an external entity for a resource needed by the firm. The more critical the resource is to the firm, the more serious is the dependency. This model posits, therefore, that, overall, when organizations depend on external entities for IT resources critical to their survival, they yield control and ultimately jeopardize the firm’s performance. Using a research design that captured quantitative data on the sourcing of IT functions and services, the research team gathered five years of data on 54 business units in 27 global companies located in seven countries. More than 560 data points were gathered for each participating organization, including detailed information on organizational outsourcing and the related decision-making process. This data was collected for both the corporate and business-unit levels. Corporate-level executives (e.g., CEOs, COOs, Director of Strategy), CIOs, and business unit IT managers were among the interviewees and sources of data in the study. Archival data such as annual reports and strategic plans supplemented the overall data collection effort. Managers in these firms reported on 378 different outsourcing decisions each of 7 core and 7 noncore IT activities. This rich dataset provided the grist for testing the Strategic Control Model. The results of this study offer insights for researchers and managerial guidelines regarding whether and how managers control the IT resource. When making such critical decisions, strategic control proves to be a good explanation for how the most effective managers outsource IT and how the firm reaps downstream benefits from their control decisions.
2. THEORETICAL AND CONCEPTUAL BACKGROUND
2.1. Resource Dependency Theory
Resource Dependency Theory (RDT) examines organizational decision making in light of the impact of the environment on the organization. RDT recognizes that the key to organizational survival is the ability to acquire and maintain resources (Pfeffer and Salancik, 1978). An organization must be open to its environment due to its dependence on that environment to obtain critical resources such as personnel, information, raw materials and technology. Resource acquisition may, in fact, be problematic and unpredictable. To guarantee the flow of resources, therefore, a firm will adapt to changes in its environment that impact the flow of resources to the firm. Adaptation is not passive, however, but rather a strategic choice to cope with pressure in the environment (De Wit and Verhoeven, 2000). Successful organizations, therefore, attempt to minimize their dependence on or increase their influence over organizations in their environment (Birkinshaw, Toulan, and Arnold, 2001). Although organizations are constrained by their dependency on their environment, opportunities exist to pursue organizational interest (Pfeffer and Salancik, 1978). Firms can negotiate their positions within these constraints. RDT recognizes that organizational strategy focuses not only on products and customers but also on the suppliers and other entities in the environment that impact the flow of resources to the firm. Organizations thereby interact dynamically as they act strategically to manage their resource dependency on other firms (Pfeffer and Salancik, 1978). Given the preceding discussion of RDT, an important research question emerges: To what extent does the degree of dependency that results from outsourcing various IT resources affect firm performance? The ultimate decision that organizations make is based upon the degree of control desired for a given IT resource. According to RDT, firms will choose to own, nurture, have exclusive access to, and thus control strategic resources that will lead to improved competitiveness. Conversely, it is not necessary for firms to own and control those assets that are not strategic and integral to their distinctive competence.
Authors: Detmar W. Straub, Peter Weill, Kathy Stewart Schwaig
4
In the following sections we present our conceptual argument based up on RDT and we then derive the Strategic Control Model. We then empirically examine the model in two complementary studies.
2.2. Information Technology Outsourcing and RDT
Prior studies indicate that outsourcing is a strategic arrangement for a firm (Lacity and Hirschheim, 1993; Insinga and Werle, 2000). At its core, RDT argues that no firm can exclusively rely on its own resources to survive. The effectiveness of a firm, therefore, is related to its ability to acquire needed resources from external vendors.
RDT argues that organizations will engage in a strategic decision making process when deciding whether or not to acquire critical resources from external entities (Pfeffer and Salancik, 1978). Important resources will be retained in-house while less important resources will be outsourced. Implicit in the outsourcing deal will be a dependent relationship that will have to be negotiated and constructed. According to Pfeffer and Salancik (1978) this dependence is determined by three resource dimensions: importance, discretion and substitutability for that resource. Important resources are those critical to the survival of the firm. Discretion is the ability of the firm to control resource availability. Finally, substitutability refers to the availability of alternative sources for obtaining the resource. By assessing all three factors with respect to a given IT resource, a firm can determine the degree of dependence associated with outsourcing a specific resource and make the decision according to the degree of control the firm is willing to relinquish.
Importance of the IT resource is probably the most researched of the three factors affecting the firm’s dependence. IT resources are playing an increasingly critical role in organizations. Much has been written about the strategic role of the IT resource in organizations (Sethi and King, 1994; Clemons, and Row, 1991; Brynjolfsson and Hitt, 1996) and studies have found a relationship between IT and sustained competitive advantage (Clemons, 1991; Clemons and Row, 1991). With respect to discretion, firms attempt to minimize dependency on external entities through negotiation and contracts. In addition, many IT resources in firms are idiosyncratic to the business and not easily duplicated. Hence, few or no substitutes exist for those IT resources that have a great deal of specificity to the firm. While discretion and substitutability are important factors, we have chosen to focus on and operationalize the importance factor.
Lacity and Willcocks (2001) analyzed hundreds of case studies and determined that the decision to outsource critical IT applications increased the firm’s dependency on the external entity. The resultant dependency is enough to deter the firm from transferring control via an outsourcing deal. Similarly Kern and Willcocks (2002) analyzed several outsourcing relationships and concluded that too much dependence on vendor’s performance is risky. Traditionally, core IT applications are recommended for in house control (Lacity and Hirschheim, 1993). Research suggests that core competencies are what make an organization “unique” in its competitiveness (Quinn and Hilmer, 1994). It is the knowledge that the organization has gained of its own processes (Prahalad and Hamel, 1990) that allows it to compete with the best in the world (Quinn and Hilmer, 1994). An organization that possesses a core competency can integrate core technologies and governance processes, realizing price-performance ratios and customer service levels that exceed those of its competitors (Prahalad, 1993). Core technologies are a critical enabler of this capability (Prahalad, 1993). To compete globally, firms need to ask whether external control of a function will improve its ability to perform an activity at a level comparable with the best of breed (Drtina, 1994).
2.3. Control of the IT Resource
Although the issue of IT as a strategic resource has been discussed widely in IS studies, no previous research has empirically examined the effect of a resource-dependency perspective on sourcing decisions (Dibbern et al., 2004). While prior research using transaction cost analysis (Ang and Straub, 1998, Beier, 1989, Grover et al., 1996, Nam et al., 1996, Schary and Coakley, 1991) has studied the impact of asset specificity on external
Authors: Detmar W. Straub, Peter Weill, Kathy Stewart Schwaig
5
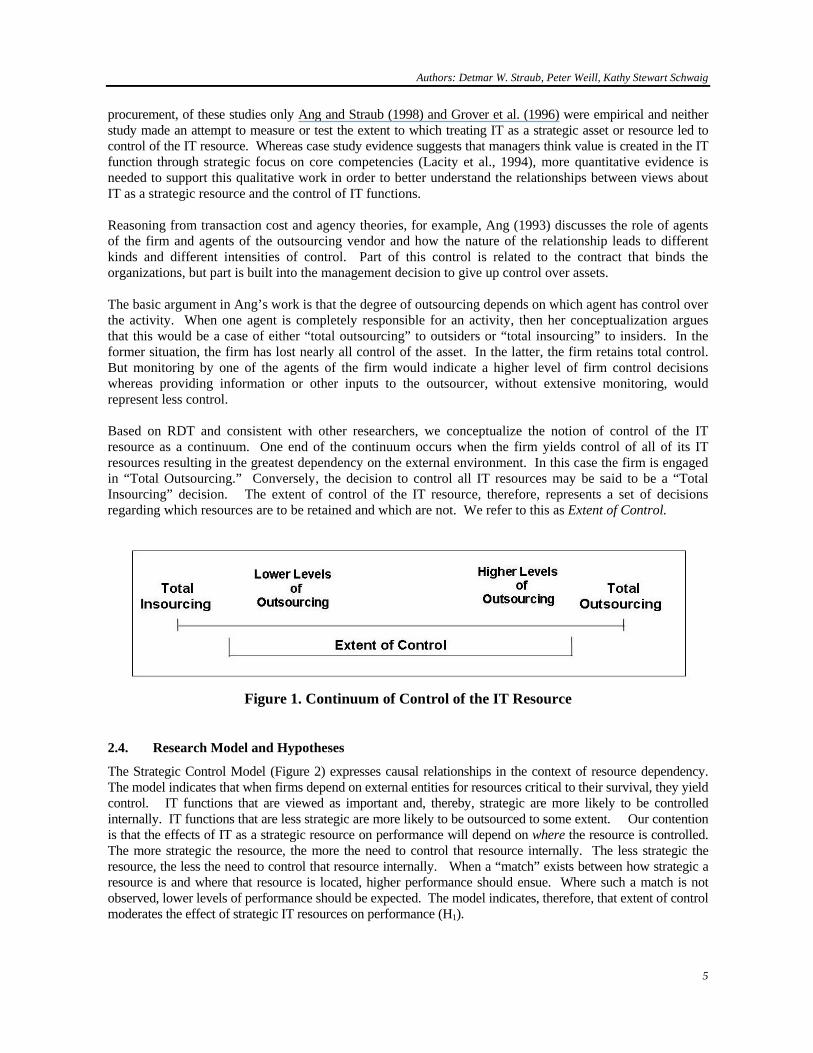
procurement, of these studies only Ang and Straub (1998) and Grover et al. (1996) were empirical and neither study made an attempt to measure or test the extent to which treating IT as a strategic asset or resource led to control of the IT resource. Whereas case study evidence suggests that managers think value is created in the IT function through strategic focus on core competencies (Lacity et al., 1994), more quantitative evidence is needed to support this qualitative work in order to better understand the relationships between views about IT as a strategic resource and the control of IT functions. Reasoning from transaction cost and agency theories, for example, Ang (1993) discusses the role of agents of the firm and agents of the outsourcing vendor and how the nature of the relationship leads to different kinds and different intensities of control. Part of this control is related to the contract that binds the organizations, but part is built into the management decision to give up control over assets. The basic argument in Ang’s work is that the degree of outsourcing depends on which agent has control over the activity. When one agent is completely responsible for an activity, then her conceptualization argues that this would be a case of either “total outsourcing” to outsiders or “total insourcing” to insiders. In the former situation, the firm has lost nearly all control of the asset. In the latter, the firm retains total control. But monitoring by one of the agents of the firm would indicate a higher level of firm control decisions whereas providing information or other inputs to the outsourcer, without extensive monitoring, would represent less control. Based on RDT and consistent with other researchers, we conceptualize the notion of control of the IT resource as a continuum. One end of the continuum occurs when the firm yields control of all of its IT resources resulting in the greatest dependency on the external environment. In this case the firm is engaged in “Total Outsourcing.” Conversely, the decision to control all IT resources may be said to be a “Total Insourcing” decision. The extent of control of the IT resource, therefore, represents a set of decisions regarding which resources are to be retained and which are not. We refer to this as Extent of Control.
Figure 1. Continuum of Control of the IT Resource
2.4. Research Model and Hypotheses
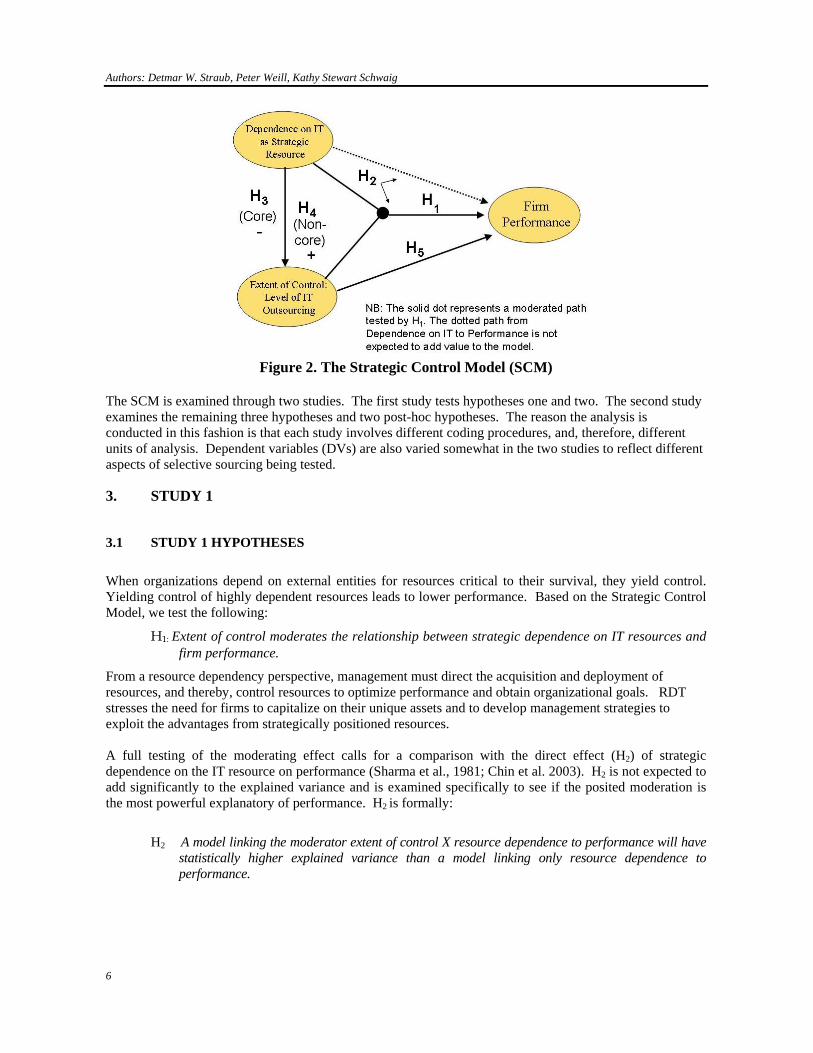
The Strategic Control Model (Figure 2) expresses causal relationships in the context of resource dependency. The model indicates that when firms depend on external entities for resources critical to their survival, they yield control. IT functions that are viewed as important and, thereby, strategic are more likely to be controlled internally. IT functions that are less strategic are more likely to be outsourced to some extent. Our contention is that the effects of IT as a strategic resource on performance will depend on where the resource is controlled. The more strategic the resource, the more the need to control that resource internally. The less strategic the resource, the less the need to control that resource internally. When a “match” exists between how strategic a resource is and where that resource is located, higher performance should ensue. Where such a match is not observed, lower levels of performance should be expected. The model indicates, therefore, that extent of control moderates the effect of strategic IT resources on performance (H1).
Authors: Detmar W. Straub, Peter Weill, Kathy Stewart Schwaig
6
Figure 2. The Strategic Control Model (SCM)
The SCM is examined through two studies. The first study tests hypotheses one and two. The second study examines the remaining three hypotheses and two post-hoc hypotheses. The reason the analysis is conducted in this fashion is that each study involves different coding procedures, and, therefore, different units of analysis. Dependent variables (DVs) are also varied somewhat in the two studies to reflect different aspects of selective sourcing being tested.
3. STUDY 1
3.1 STUDY 1 HYPOTHESES
When organizations depend on external entities for resources critical to their survival, they yield control. Yielding control of highly dependent resources leads to lower performance. Based on the Strategic Control Model, we test the following:
H1: Extent of control moderates the relationship between strategic dependence on IT resources and firm performance.
From a resource dependency perspective, management must direct the acquisition and deployment of resources, and thereby, control resources to optimize performance and obtain organizational goals. RDT stresses the need for firms to capitalize on their unique assets and to develop management strategies to exploit the advantages from strategically positioned resources. A full testing of the moderating effect calls for a comparison with the direct effect (H2) of strategic dependence on the IT resource on performance (Sharma et al., 1981; Chin et al. 2003). H2 is not expected to add significantly to the explained variance and is examined specifically to see if the posited moderation is the most powerful explanatory of performance. H2 is formally:
H2 A model linking the moderator extent of control X resource dependence to performance will have statistically higher explained variance than a model linking only resource dependence to performance.
Authors: Detmar W. Straub, Peter Weill, Kathy Stewart Schwaig
7
3.2 Study 1 Design and Sampling
To assess the hypotheses, 54 business units (BUs) in 27 firms were investigated. See Appendix A for a list of firms. These firms were headquartered in seven countries (USA, Canada, Malaysia, Singapore, Australia, UK and Switzerland) in the financial, retail and manufacturing industries. These three industries are at the forefront of change in industry structure due to the combination of technological innovation and the accelerated pace of globalization (Bradley et al., 1993). They also provide a contrast in their strategic use of information and information technology (Cash et al., 1992, Porter and Millar, 1985). Data were collected both at the firm and business unit (BU) levels. The firm level provides insight into the strategic role of IT in the organization. The business unit level allows us to examine the outsourcing decision at the point closest to the outsourcing experience. In order to focus on BU outsourcing of IT in complex and representative settings, the firms selected met the following criteria:
1. Comprised of at least two autonomously managed BUs with a distinct set of products or customers;
2. Were in the top five in their industry by market share in their region; 3. Recorded data on historical IT investment, IT outsourcing and performance which could be
made available to the researchers; and 4. As a group of firms, offered a broadly based international perspective.
To implement the study internationally, a research team collected data from universities located in or near the country of the firm’s headquarters (see “Acknowledgments” for list of research partners). The researchers met to refine the concepts and methods for the study and then used the same data collection procedures.
3.3. Study 1 Data Collection
To adequately address the issues raised in the current study requires a study design that collects data from multiple respondents, thereby achieving independence of sources and reducing the likelihood of systematic bias. Data were collected via interviews, the completion of response forms by participants, analysis of organizational documentation (e.g., memos, internal reports) and notes of presentations made by executive managers about recent strategy and technology developments. In each firm there were a minimum of four participants, some interviewed on multiple occasions. The four participants were the Chief Information Officer (CIO), IS executives from at least two different business units, and a corporate executive (CE) who was able to provide a strategic perspective across the firm as a whole. This person was the CEO, the Chief Financial Officer, Chief Operating Officer, or the Director of Strategy. In each firm, the CIO was interviewed about IS arrangements and the decision-making process relating to both business and IT strategy and the extent of IT outsourcing. Four different response forms were distributed to participants. When these were completed and returned, interviews were held with each IT manager, including the CIO and the BU manager to explore the issues in more depth and to ensure that consistent definitions of constructs were used in the data collection. Excerpts from these interviews appear later in the paper. To ensure independence of variables, data on IT investment was gathered through different sources. The subjective view of IT as a strategic resource was provided by the CIO while objective IT investment data and performance data were gathered primarily from the CE and his/her staff, the one exception being IT investment in competitive systems, as described below. IT managers from the respective business units provided data on the nature and degree of outsourcing in the BUs. As can be seen in Table 1, some of these measurements called for judgments whereas others were more oriented toward accounting-type data.

Authors: Detmar W. Straub, Peter Weill, Kathy Stewart Schwaig
8
Performance data was also gathered from two sources: the CE and the BU information technology managers and then checked for inter-rater reliability.
3.4. Study 1 Measures
The measures employed for each construct are discussed below and summarized in Table 1. Relevant instrument items are in Appendix B. 3.4.1 Dependence on IT as a Strategic Resource: Objective Measures
To capture the firm’s dependence on IT as a strategic resource, we chose first to use objective measures of the percentage of the IT budget that was considered strategic. To achieve consistency across the sample we provided respondents with a simple definition of strategic IT based on the work of Clemons (1991), Ives and Learmonth (1984), and Porter and Millar (1985). CIOs were asked to provide the percentage of the IT budget over the past 5 years that was invested to:
...increase or protect your sales (or market share) by providing new (or improved) customer service or products. This type of investment generally positions the firm in the marketplace (e.g. creates competitive advantage by significantly reducing the delivery time of your services by placing order entry links in your customer's offices).
Besides RESOURCE1, data on actual firm actions included the calculation of both a five-year average and an average year-to-year percentage change in assessments of IT as a strategic resource (RESOURCE2). 3.4.2 Dependence on IT as a Strategic Resource: Subjective Measures
The goal of this set of measures (RESOURCE3 - RESOURCE6) was to capture the CIO’s belief of the extent to which managers (both senior managers and BU managers) saw IT as a strategic resource. We asked the CIO to consider his or her dealings with senior business managers and answer four items. The items measured factors such as whether BU managers considered IT when they formed business strategies or whether they viewed a flexible IT infrastructure as strategic. Scores from the four, five-point Likert scales were used to measure IT as a strategic resource, with higher scores indicating IT was a highly strategic resource. The measures tap into arguments that a focus on IT lowers dependency on others’ IT resources which will, in turn, lead to advantages. The measures, positioned at a molar level of abstraction, are omnibus measures. See Appendix B for the relevant instrument items.
Table 1. Constructs and Measure Construct Code Description of Measure
Dependence on IT as a Strategic Resource:
RESOURCE1 % of strategic IT investment in prior year
Objective Measures RESOURCE2 % of strategic IT investment - average % change over previous 5 years
Dependence on IT as a Strategic Resource:
RESOURCE3 The extent that BU managers consider IT in their strategic decision-making
Subjective Measures RESOURCE4 The extent that IT infrastructure has a role in BU decision-making
RESOURCE5 Senior managers see IT as providing competitive advantage RESOURCE6 IT enables new business strategies
Extent of Control of IT Resource:
CONTROL1 Average of rankings of the extent to which IT is outsourced by the BUs in each of 15 functional areas
Level of Outsourcing CONTROL2 % of IT investment spent on services outside the firm-- average % change over past 5 years
CONTROL3 % of IT investment spent on services outside the firm over last two years
Firm Performance: PERF1-2 Profits per employee ($)
Authors: Detmar W. Straub, Peter Weill, Kathy Stewart Schwaig
9
Business Units PERF3 Pricing against competitors (index) PERF4 Return on assets
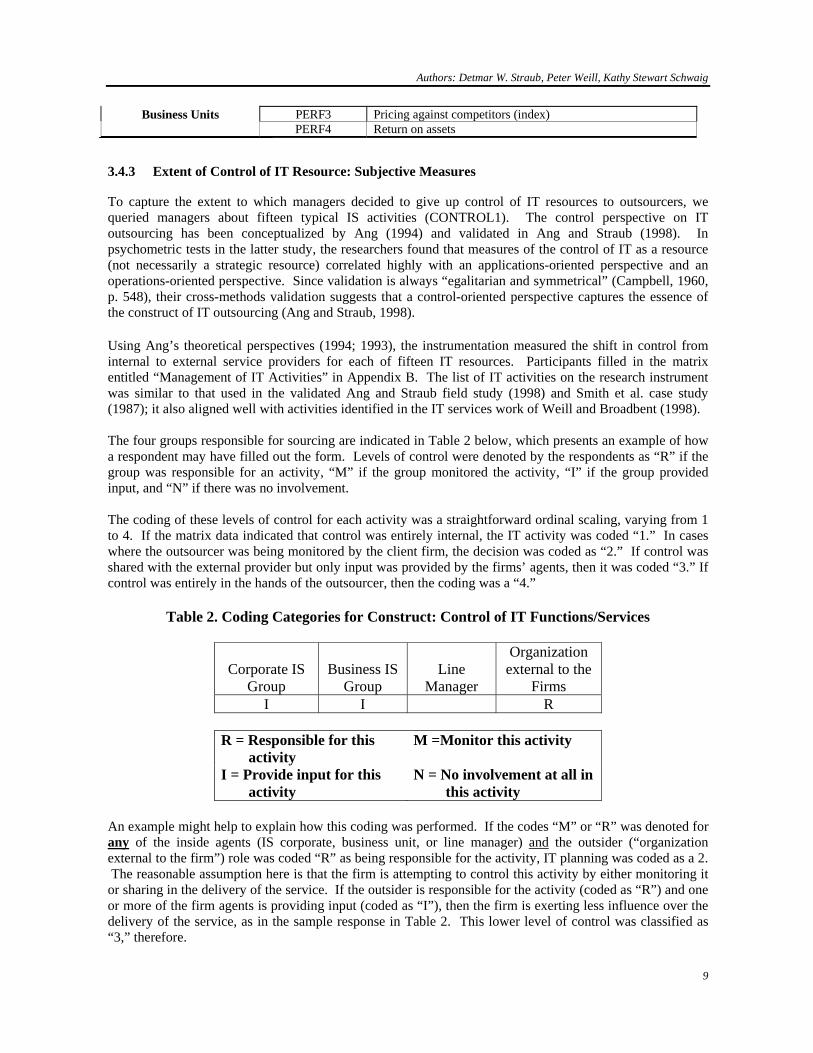
3.4.3 Extent of Control of IT Resource: Subjective Measures To capture the extent to which managers decided to give up control of IT resources to outsourcers, we queried managers about fifteen typical IS activities (CONTROL1). The control perspective on IT outsourcing has been conceptualized by Ang (1994) and validated in Ang and Straub (1998). In psychometric tests in the latter study, the researchers found that measures of the control of IT as a resource (not necessarily a strategic resource) correlated highly with an applications-oriented perspective and an operations-oriented perspective. Since validation is always “egalitarian and symmetrical” (Campbell, 1960, p. 548), their cross-methods validation suggests that a control-oriented perspective captures the essence of the construct of IT outsourcing (Ang and Straub, 1998). Using Ang’s theoretical perspectives (1994; 1993), the instrumentation measured the shift in control from internal to external service providers for each of fifteen IT resources. Participants filled in the matrix entitled “Management of IT Activities” in Appendix B. The list of IT activities on the research instrument was similar to that used in the validated Ang and Straub field study (1998) and Smith et al. case study (1987); it also aligned well with activities identified in the IT services work of Weill and Broadbent (1998). The four groups responsible for sourcing are indicated in Table 2 below, which presents an example of how a respondent may have filled out the form. Levels of control were denoted by the respondents as “R” if the group was responsible for an activity, “M” if the group monitored the activity, “I” if the group provided input, and “N” if there was no involvement. The coding of these levels of control for each activity was a straightforward ordinal scaling, varying from 1 to 4. If the matrix data indicated that control was entirely internal, the IT activity was coded “1.” In cases where the outsourcer was being monitored by the client firm, the decision was coded as “2.” If control was shared with the external provider but only input was provided by the firms’ agents, then it was coded “3.” If control was entirely in the hands of the outsourcer, then the coding was a “4.”
Table 2. Coding Categories for Construct: Control of IT Functions/Services
Corporate IS
Group
Business IS
Group
Line
Manager
Organization external to the
Firms I I R
R = Responsible for this activity
M =Monitor this activity
I = Provide input for this activity
N = No involvement at all in this activity
An example might help to explain how this coding was performed. If the codes “M” or “R” was denoted for any of the inside agents (IS corporate, business unit, or line manager) and the outsider (“organization external to the firm”) role was coded “R” as being responsible for the activity, IT planning was coded as a 2. The reasonable assumption here is that the firm is attempting to control this activity by either monitoring it or sharing in the delivery of the service. If the outsider is responsible for the activity (coded as “R”) and one or more of the firm agents is providing input (coded as “I”), then the firm is exerting less influence over the delivery of the service, as in the sample response in Table 2. This lower level of control was classified as “3,” therefore.
Authors: Detmar W. Straub, Peter Weill, Kathy Stewart Schwaig
10
3.4.4 Extent of Control of IT Resource: Objective Measures An objective surrogate for control over the IT resource is the extent to which a firm outsources IT. Two objective measures were also used. The first, CONTROL2, was gathered at the corporate level. It is a financial measure where the outsourcing budget is expressed as a percentage of the firm's total IS budget for that year. Five years of data were collected allowing the calculation of both a five-year average (CONTROL2) and an average year-to-year percentage change in outsourcing (CONTROL3). Similar approaches were used in Loh and Venkatraman (1992) and Grover et al. (1996). The second objective variable, CONTROL3, was the percentage of IT investment spent on services outside the firm. Averaged over the last five years, CONTROL3 measured the delta or change in percentage of IT investment outside the firm. 3.4.5 Business Unit Performance
The construct “Performance” is used extensively in organizational and information systems research. A broad range of quantitative performance measures are often employed by researchers, including measures of profit such as return on assets (ROA) (Floyd and Woolridge, 1990, Hitt and Brynjolfsson, 1996), return on net worth (Cron and Sobol, 1983), expenses as a ratio of income (Bender, 1986, Harris and Katz, 1991), and the ratio of operating profit to revenue (Markus and Soh, 1993). These measures of profitability are lagging measures (i.e., accounting end-of-period measures). Kaplan and Norton (1992) recommend a balance of leading (i.e., measures of performance that predict lagging measures) and lagging measures to capture performance. We chose 3 measures that provide a balance of leading and lagging measures that also relate well with the theoretical issues we are expostulating. They tap into: (1) labor productivity, (2) competitiveness, and (3) return on assets. First, profit per employee (PERF1-2) was chosen as a measure of labor productivity (Weill, 1992) as it is likely to be sensitive to the level of outsourcing used. The first of the measures included cost of goods sold (COGS) and all other expenses. The second was COGS alone. Two other firm-level measures were used, namely, an index of competitiveness of the firm compared to its industry (PERF3). This was assessed by the chief officer of the business unit. Finally, a standard return on assets (ROA) measure (PERF4). All of these measures should reflect higher performance if the firm does not outsource more strategic assets than the SCM argues it should. See Appendix B for instrument items and elaboration.
3.5 Study 1 Instrument Validation
Many of the measures employed to test the SCM are likely formative rather than reflective (Gerbing and Anderson, 1988) in that the types of measurement and the scales being employed were radically different for most measures and constructs. For example, the construct “firm performance” was measured by two profitability per employee figures and two items tapping into competitiveness and asset utilization. While each of these very different measures “forms” the construct of firm performance, they may not “reflect” it (Campbell, 1960; Fornell and Larcker, 1981; Fornell and Bookstein, 1982; Cohen, 1990; Thompson, 1995; Chin, 1998; Diamantopoulos and Winklhofer, 2001) in the sense that our four questions with similar low to high semantic anchors do “reflect” the perception of the CIO on whether IT is viewed as a strategic resource. One indication of whether statistical tests favor a formative or reflective handling is to examine their assumptions. Reliability tests such as Cronbach’s α make the assumption that scales are relatively similar in the meaning of the scale values; if not, the α statistic rapidly becomes meaningless. Constructs that rely on formative measures call for structural equation modeling (SEM) techniques such as Partial Least Squares (PLS) or LISREL, and PLS, in particular, can model the latent construct whether it is reflective or formative (Gefen, et al., 2000).The other advantage of using PLS analysis is that the measurement error is
Authors: Detmar W. Straub, Peter Weill, Kathy Stewart Schwaig
11
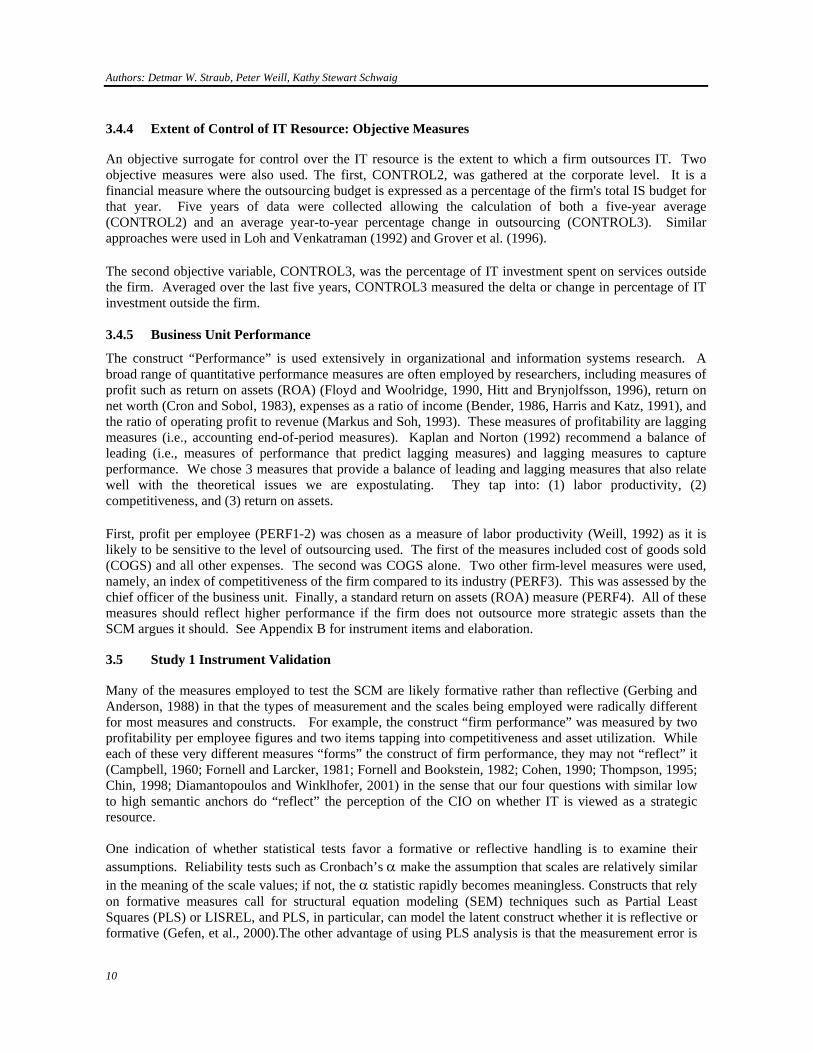
being modeled, and it is, therefore, possible to use all measures even when their contribution is calculated as being small or modest.1 Given the choice of measures in the present study, we engaged in several different forms of analysis to examine the psychometric properties of the instrument. Cronbach’s α assesses the reliability of the measures. PLS loadings assess the extent to which the nonperformance measures (or indicators) are reflective of the construct to which they have been assigned. PLS weights assess the extent to which performance measures (or indicators) are formative of the construct to which they have been assigned. The relevant PLS loadings/weights are presented in Table 3. The occasionally insignificant loading/weight in Table 3 is not a surprise, given that some of the measures are formative (Edwards and Bagozzi, 2000). The reflective subjective measures (no. 2 in Table 3) should have loaded well, and, indeed, they all load significantly, at α protection level of .05, which reinforces the interpretation that the instrument has some convergent validity.
Table 3. Loadings/Weightings from PLS Run
Construct Item PLS Loading or Weighting
T
Dependence on IT as Strategic Resource (Objective)
RESOURCE1 RESOURCE2
.9464
.6580 7.6849* 1.7191
Dependence on IT as Strategic Resource (Subjective)
RESOURCE5 RESOURCE6 RESOURCE4 RESOURCE3
.9194
.7558
.5280
.4837
1.9704* 1.9871* 2.7585* 3.1304*
Firm Performance PERF1 PERF2 PERF4 PERF3
.8758
.7094
.4613
.3282
13.5146* 4.8963* 2.7507* 1.5997
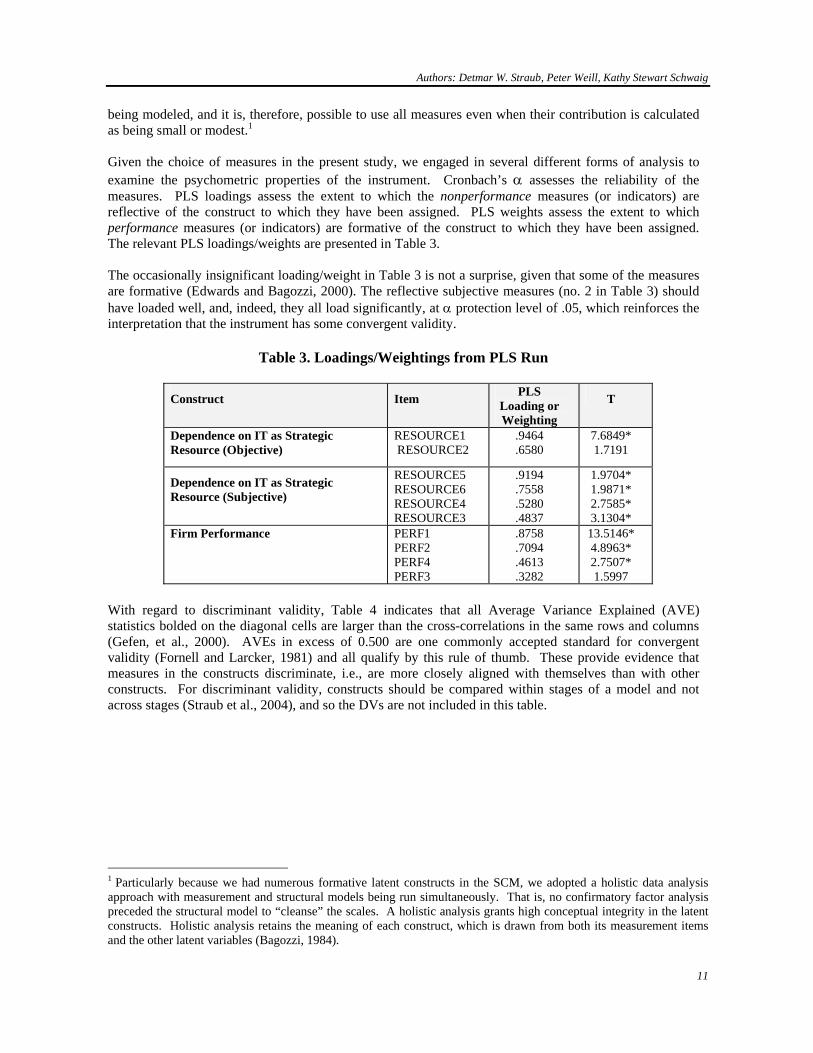
With regard to discriminant validity, Table 4 indicates that all Average Variance Explained (AVE) statistics bolded on the diagonal cells are larger than the cross-correlations in the same rows and columns (Gefen, et al., 2000). AVEs in excess of 0.500 are one commonly accepted standard for convergent validity (Fornell and Larcker, 1981) and all qualify by this rule of thumb. These provide evidence that measures in the constructs discriminate, i.e., are more closely aligned with themselves than with other constructs. For discriminant validity, constructs should be compared within stages of a model and not across stages (Straub et al., 2004), and so the DVs are not included in this table.
1 Particularly because we had numerous formative latent constructs in the SCM, we adopted a holistic data analysis approach with measurement and structural models being run simultaneously. That is, no confirmatory factor analysis preceded the structural model to “cleanse” the scales. A holistic analysis grants high conceptual integrity in the latent constructs. Holistic analysis retains the meaning of each construct, which is drawn from both its measurement items and the other latent variables (Bagozzi, 1984).
Authors: Detmar W. Straub, Peter Weill, Kathy Stewart Schwaig
12
Table 4. PLS AVE Discriminant Validity Matrix2 In addition to these tests, the Cronbach’s α for the subjective view of IT as a strategic resource was .920, which is acceptable by Nunnally’s rule of thumb (1994). Therefore, our interpretation of these loadings/weightings is that whereas the measures are not perfect, they are sufficiently valid for purposes of further testing. They are also acceptable because we are adopting a holistic analytical approach, which means that no attempts have been made to “cleanse” the constructs and reduce the a priori measurement error in the entire instrument (Bagozzi, 1984). Measurement error is accounted for in the statistical technique, but not removed. If we find significance under these harsher statistical conditions, then the findings may be interpreted to be even more robust than otherwise.
3.6 Study 1 Descriptive Statistics
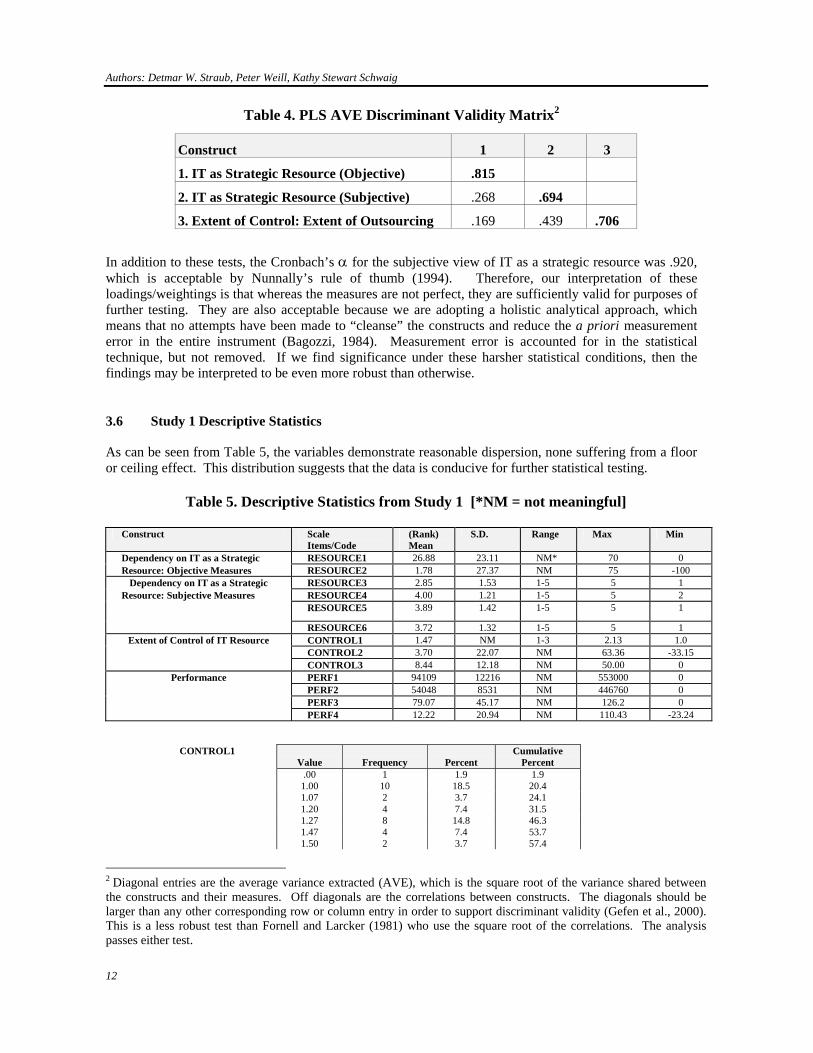
As can be seen from Table 5, the variables demonstrate reasonable dispersion, none suffering from a floor or ceiling effect. This distribution suggests that the data is conducive for further statistical testing.
Table 5. Descriptive Statistics from Study 1 [*NM = not meaningful]
Construct Scale
Items/Code (Rank) Mean
S.D. Range Max Min
Dependency on IT as a Strategic RESOURCE1 26.88 23.11 NM* 70 0 Resource: Objective Measures RESOURCE2 1.78 27.37 NM 75 -100
Dependency on IT as a Strategic RESOURCE3 2.85 1.53 1-5 5 1 Resource: Subjective Measures RESOURCE4 4.00 1.21 1-5 5 2
RESOURCE5 3.89 1.42 1-5 5 1
RESOURCE6 3.72 1.32 1-5 5 1 Extent of Control of IT Resource CONTROL1 1.47 NM 1-3 2.13 1.0
CONTROL2 3.70 22.07 NM 63.36 -33.15 CONTROL3 8.44 12.18 NM 50.00 0
Performance PERF1 94109 12216 NM 553000 0 PERF2 54048 8531 NM 446760 0 PERF3 79.07 45.17 NM 126.2 0 PERF4 12.22 20.94 NM 110.43 -23.24
CONTROL1
Value
Frequency
Percent Cumulative
Percent .00 1 1.9 1.9 1.00 10 18.5 20.4 1.07 2 3.7 24.1 1.20 4 7.4 31.5 1.27 8 14.8 46.3 1.47 4 7.4 53.7 1.50 2 3.7 57.4
2 Diagonal entries are the average variance extracted (AVE), which is the square root of the variance shared between the constructs and their measures. Off diagonals are the correlations between constructs. The diagonals should be larger than any other corresponding row or column entry in order to support discriminant validity (Gefen et al., 2000). This is a less robust test than Fornell and Larcker (1981) who use the square root of the correlations. The analysis passes either test.
Construct 1 2 3
1. IT as Strategic Resource (Objective) .815
2. IT as Strategic Resource (Subjective) .268 .694
3. Extent of Control: Extent of Outsourcing .169 .439 .706
Authors: Detmar W. Straub, Peter Weill, Kathy Stewart Schwaig
13
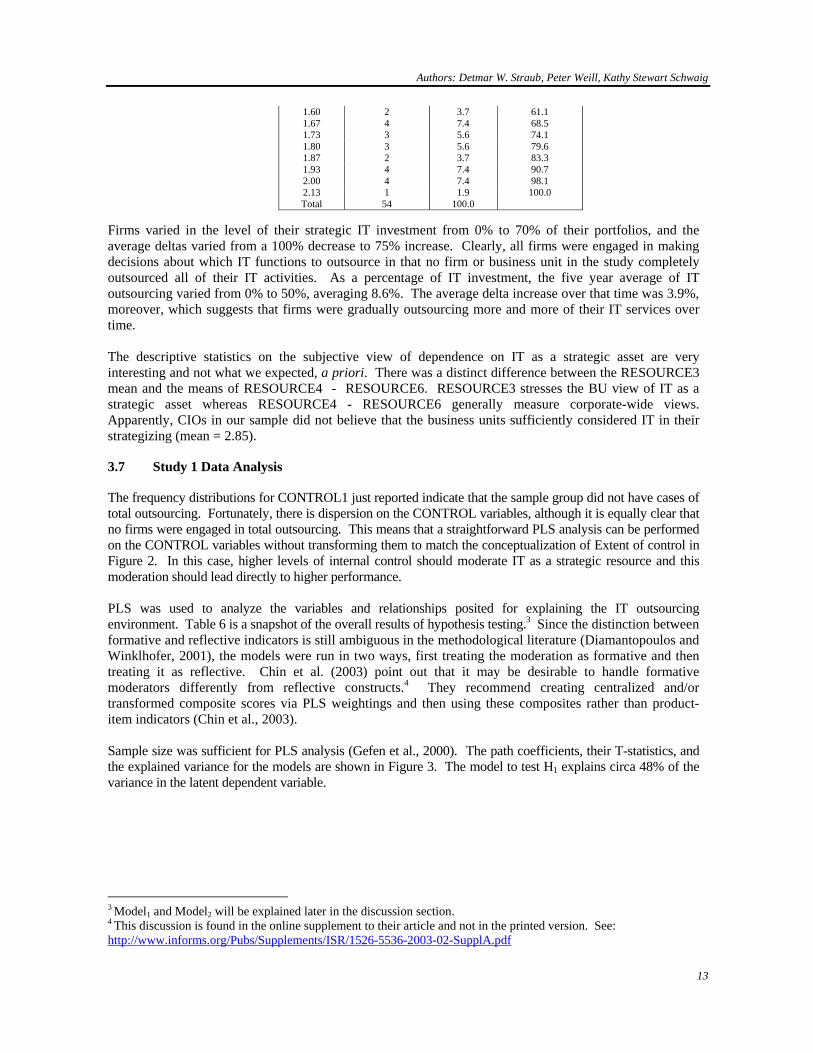
1.60 2 3.7 61.1 1.67 4 7.4 68.5 1.73 3 5.6 74.1 1.80 3 5.6 79.6 1.87 2 3.7 83.3 1.93 4 7.4 90.7 2.00 4 7.4 98.1 2.13 1 1.9 100.0 Total 54 100.0
Firms varied in the level of their strategic IT investment from 0% to 70% of their portfolios, and the average deltas varied from a 100% decrease to 75% increase. Clearly, all firms were engaged in making decisions about which IT functions to outsource in that no firm or business unit in the study completely outsourced all of their IT activities. As a percentage of IT investment, the five year average of IT outsourcing varied from 0% to 50%, averaging 8.6%. The average delta increase over that time was 3.9%, moreover, which suggests that firms were gradually outsourcing more and more of their IT services over time. The descriptive statistics on the subjective view of dependence on IT as a strategic asset are very interesting and not what we expected, a priori. There was a distinct difference between the RESOURCE3 mean and the means of RESOURCE4 - RESOURCE6. RESOURCE3 stresses the BU view of IT as a strategic asset whereas RESOURCE4 - RESOURCE6 generally measure corporate-wide views. Apparently, CIOs in our sample did not believe that the business units sufficiently considered IT in their strategizing (mean = 2.85).
3.7 Study 1 Data Analysis
The frequency distributions for CONTROL1 just reported indicate that the sample group did not have cases of total outsourcing. Fortunately, there is dispersion on the CONTROL variables, although it is equally clear that no firms were engaged in total outsourcing. This means that a straightforward PLS analysis can be performed on the CONTROL variables without transforming them to match the conceptualization of Extent of control in Figure 2. In this case, higher levels of internal control should moderate IT as a strategic resource and this moderation should lead directly to higher performance. PLS was used to analyze the variables and relationships posited for explaining the IT outsourcing environment. Table 6 is a snapshot of the overall results of hypothesis testing.3 Since the distinction between formative and reflective indicators is still ambiguous in the methodological literature (Diamantopoulos and Winklhofer, 2001), the models were run in two ways, first treating the moderation as formative and then treating it as reflective. Chin et al. (2003) point out that it may be desirable to handle formative moderators differently from reflective constructs.4 They recommend creating centralized and/or transformed composite scores via PLS weightings and then using these composites rather than product-item indicators (Chin et al., 2003).
Sample size was sufficient for PLS analysis (Gefen et al., 2000). The path coefficients, their T-statistics, and the explained variance for the models are shown in Figure 3. The model to test H1 explains circa 48% of the variance in the latent dependent variable.
3 Model1 and Model2 will be explained later in the discussion section. 4 This discussion is found in the online supplement to their article and not in the printed version. See: http://www.informs.org/Pubs/Supplements/ISR/1526-5536-2003-02-SupplA.pdf
Authors: Detmar W. Straub, Peter Weill, Kathy Stewart Schwaig
14
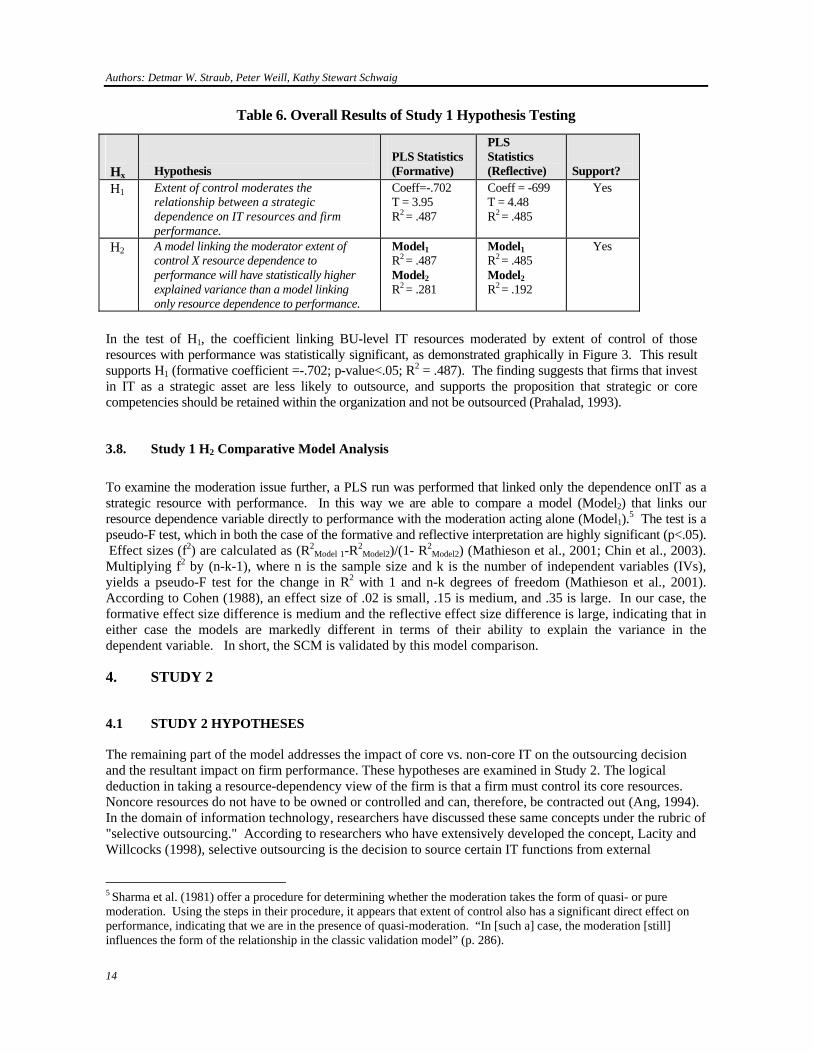
Table 6. Overall Results of Study 1 Hypothesis Testing
In the test of H1, the coefficient linking BU-level IT resources moderated by extent of control of those resources with performance was statistically significant, as demonstrated graphically in Figure 3. This result supports H1 (formative coefficient =-.702; p-value<.05; R2 = .487). The finding suggests that firms that invest in IT as a strategic asset are less likely to outsource, and supports the proposition that strategic or core competencies should be retained within the organization and not be outsourced (Prahalad, 1993).
3.8. Study 1 H2 Comparative Model Analysis
To examine the moderation issue further, a PLS run was performed that linked only the dependence onIT as a strategic resource with performance. In this way we are able to compare a model (Model2) that links our resource dependence variable directly to performance with the moderation acting alone (Model1).5 The test is a pseudo-F test, which in both the case of the formative and reflective interpretation are highly significant (p<.05). Effect sizes (f2) are calculated as (R2
Model 1-R2Model2)/(1- R2
Model2) (Mathieson et al., 2001; Chin et al., 2003). Multiplying f2 by (n-k-1), where n is the sample size and k is the number of independent variables (IVs), yields a pseudo-F test for the change in R2 with 1 and n-k degrees of freedom (Mathieson et al., 2001). According to Cohen (1988), an effect size of .02 is small, .15 is medium, and .35 is large. In our case, the formative effect size difference is medium and the reflective effect size difference is large, indicating that in either case the models are markedly different in terms of their ability to explain the variance in the dependent variable. In short, the SCM is validated by this model comparison.
4. STUDY 2
4.1 STUDY 2 HYPOTHESES
The remaining part of the model addresses the impact of core vs. non-core IT on the outsourcing decision and the resultant impact on firm performance. These hypotheses are examined in Study 2. The logical deduction in taking a resource-dependency view of the firm is that a firm must control its core resources. Noncore resources do not have to be owned or controlled and can, therefore, be contracted out (Ang, 1994). In the domain of information technology, researchers have discussed these same concepts under the rubric of "selective outsourcing." According to researchers who have extensively developed the concept, Lacity and Willcocks (1998), selective outsourcing is the decision to source certain IT functions from external
5 Sharma et al. (1981) offer a procedure for determining whether the moderation takes the form of quasi- or pure moderation. Using the steps in their procedure, it appears that extent of control also has a significant direct effect on performance, indicating that we are in the presence of quasi-moderation. “In [such a] case, the moderation [still] influences the form of the relationship in the classic validation model” (p. 286).
Hx
Hypothesis
PLS Statistics (Formative)
PLS Statistics (Reflective)
Support?
H1 Extent of control moderates the relationship between a strategic dependence on IT resources and firm performance.
Coeff=-.702 T = 3.95 R2 = .487
Coeff = -699 T = 4.48 R2 = .485
Yes
H2 A model linking the moderator extent of control X resource dependence to performance will have statistically higher explained variance than a model linking only resource dependence to performance.
Model1 R2 = .487 Model2 R2 = .281
Model1 R2 = .485 Model2 R2 = .192
Yes
Authors: Detmar W. Straub, Peter Weill, Kathy Stewart Schwaig
15
provider(s) while still retaining in-house 20-80% of the IT budget.6 The basic argument made by Lacity and Willcocks (1998) and DiRomualdo and Gurbaxani (1998) is that strategic analysis of the IT portfolio is key to successful outsourcing decisions. The underlying line of reasoning is that IT functions have "distinctiveness" (Lacity et al., 1996) and an ability to affect competitiveness that senior managers must not ignore. Based on their empirical findings from multiple case studies, Lacity, Willcocks and Feeny (1996) found that "companies that consistently succeed in selecting what can be outsourced to their advantage usually distinguish between the contribution that an IT activity makes to business operations and its impact on competitive positioning" (p. 14).
4.1.1 Current Evidence for the Influence of IT Strategic Resources on Sourcing Decisions
Confirming this reasoning is additional evidence that firms should focus on outsourcing business processes that are not essential to their distinctive competence. Willcocks and Fitzgerald (1993) found that most companies successful with IT outsourcing used a selective approach to outsourcing. Focusing on core competencies through outsourcing non-core activities has become a primary means by which fast growing companies achieve success according to a Coopers & Lybrand survey of 248 US CEOs (Williams, 1997). Of sampled firms, 83% increased outsourcing in order to focus more on their core competencies. In a KPMG survey of Australian managers, a significant proportion of managers indicated that strategic objectives like focusing on core business objectives played a major role in their decision to outsource IT (Hurley and Rundell, 1997). To further test the strategic control model outlined above, we propose that:
H3: The more IT is viewed as a strategic resource, the less firms will outsource core IT activities.
H4: The more IT is viewed as a strategic resource, the more firms will outsource noncore IT activities.
4.1.2 Downstream Effects: IT Outsourcing and Business Unit Performance
According to RDT, organizational effectiveness is the assessment of the organization’s output and activities by various groups or participants. Managers control the IT resource in ways that improve organizational effectiveness by creating value and increased organizational performance (McFarlan and Nolan, 1995, Barney, 1991). Several empirical studies have investigated aspects of this relationship. Grover et al. (1996) found strong relationships between the degree of IT outsourcing and particular aspects of performance, notably: (a) the ability to focus on core competencies;7 (b) the ability to utilize human and technological resources of the service provider; and (c) the ability to gain access to leading-edge IT and to avoid the risk of technological obsolescence. They did not examine financial or IT productivity issues. In addition, Grover, Teng and Cheon (1998) argued that RDT provides an appropriate theoretical lens for examining the impact of IS sourcing decision on organizational operating efficiency. To date, empirical studies have not found positive relationships between IT outsourcing and firm performance (Loh and Venkatraman, 1992, Teng et al., 1995). Likewise, in a study of over 20 major US-based outsourcing
6 The range in this definition was based on the empirical work of Fitzgerald and Willcocks (1993). Lacity, Willcocks, and Feeny (1996) provide an alternate definition of selective sourcing: "The practice of outsourcing select IT applications to vendors while retaining other IT applications in-house, referred to as 'selective sourcing,' 'smart sourcing,' or 'right sourcing,' eschews the all-or-nothing approach in favor of more flexible, modular outsourcing." p. 14. 7 Thus, Grover et al. (1996) were testing the effect of outsourcing on the downstream ability of firms to achieve better focus on core competencies. But they did not examine strategic focus on core competencies as a predictor of degree of outsourcing.
Authors: Detmar W. Straub, Peter Weill, Kathy Stewart Schwaig
16
decisions, Smith, Mitra, and Narasimhan (1998) found few significant relationships between extent of IT outsourcing and firm-level performance measures.8 Some evidence does indicate that selective outsourcing practices do impact productivity. Lacity et al.'s (1998) analysis of transcribed interviews from 145 participants found that selective outsourcing decisions reduced costs more than total outsourcing, but they did not study the impact on other performance variables. Numerous explanations for why empirical studies have not consistently uncovered a strong relationship between IT outsourcing decisions and organizational performance exist. Many internal and external variables affect performance besides IT. For example, task productivity and personnel changes can have a dramatic effect (Lucas and Baroudi, 1994) and business environment and pricing decisions are also critical. Nevertheless, there should be circumstances in which the benefits of IT outsourcing have large impacts on firms. This study offers an opportunity to test this proposition. Our contention is that non-reflective outsourcing decisions in and of itself may not lead to higher performance levels. But when firms make a distinction between core and non-core IT processes and engage in “selective” outsourcing (Lacity and Hirschheim, 1995), represented by the front-end linkages in the SCM (Figure 1, below), then there is a greater likelihood that downstream performance will be impacted. To test the downstream impacts of selective outsourcing at different levels of the corporation, we propose the following:
H5: Selective outsourcing (insourcing core IT activities and outsourcing noncore activities) will lead to higher firm performance.
4.2 Study 2 Design and Sampling To assess study 2 hypotheses, the same 54 business units (BUs) in 27 firms from study 1 are examined. As mentioned earlier, reasons exist as to why we chose to analyze this dataset in two studies. Here we coded the outsourcing decisions as either CORE or NONCORE resulting in a different unit of analysis and a larger sample size of 378. We also examine the formative construct of firm performance through separate regression functions although in this case we are still able to use PLS to validate the extent of control construct.
4.3. Study 2 Data Collection
As in study 1, there are a minimum of four participants in each firm drawn from the following groups: (1) the CEO, CFO, COO, and/or Director of Strategy; (2) the CIO; and (3) IS executives from at least two different business units. All other data collection and measurement properties also apply to study 2, including the gathering of both subjective and objective data.
4.4 Study 2 Measures
The measures used for each construct are discussed below and summarized in Table 7. Measures that are identical to study 1 are not repeated here. Relevant instrument items are in Appendix B.
8 Smith et al. (1987) used a wide variety of archival financial measures and ratios. Among the COMPUSTAT metrics analyzed were: SGandA / Sales; Operating expense/ Sales; Sales / Employee; Asset Turnover; Return on Assets; Return on Equity; Operating Margin; Growth Rate; Dividend yield; Dividend / Sales; Market to book ratio; Cash and Equivalent / Sales; Total Liabilities / Sales; Long term debt / Sales; and Current Liabilities / Sales. This work is the subject of Smith's dissertation at the Georgia Institute of Technology.
Authors: Detmar W. Straub, Peter Weill, Kathy Stewart Schwaig
17
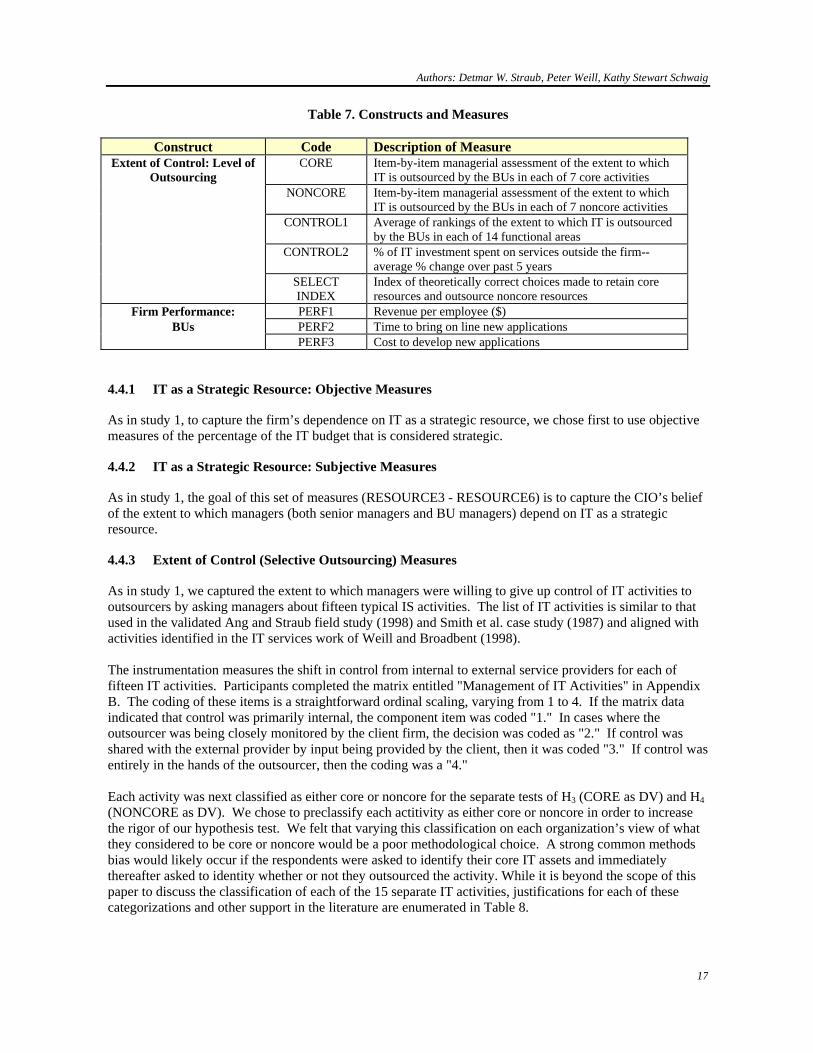
Table 7. Constructs and Measures
Construct Code Description of Measure Extent of Control: Level of
Outsourcing CORE Item-by-item managerial assessment of the extent to which
IT is outsourced by the BUs in each of 7 core activities NONCORE Item-by-item managerial assessment of the extent to which
IT is outsourced by the BUs in each of 7 noncore activities CONTROL1 Average of rankings of the extent to which IT is outsourced
by the BUs in each of 14 functional areas CONTROL2 % of IT investment spent on services outside the firm--
average % change over past 5 years SELECT
INDEX Index of theoretically correct choices made to retain core resources and outsource noncore resources
Firm Performance: PERF1 Revenue per employee ($) BUs PERF2 Time to bring on line new applications
PERF3 Cost to develop new applications
4.4.1 IT as a Strategic Resource: Objective Measures
As in study 1, to capture the firm’s dependence on IT as a strategic resource, we chose first to use objective measures of the percentage of the IT budget that is considered strategic.
4.4.2 IT as a Strategic Resource: Subjective Measures
As in study 1, the goal of this set of measures (RESOURCE3 - RESOURCE6) is to capture the CIO’s belief of the extent to which managers (both senior managers and BU managers) depend on IT as a strategic resource.
4.4.3 Extent of Control (Selective Outsourcing) Measures
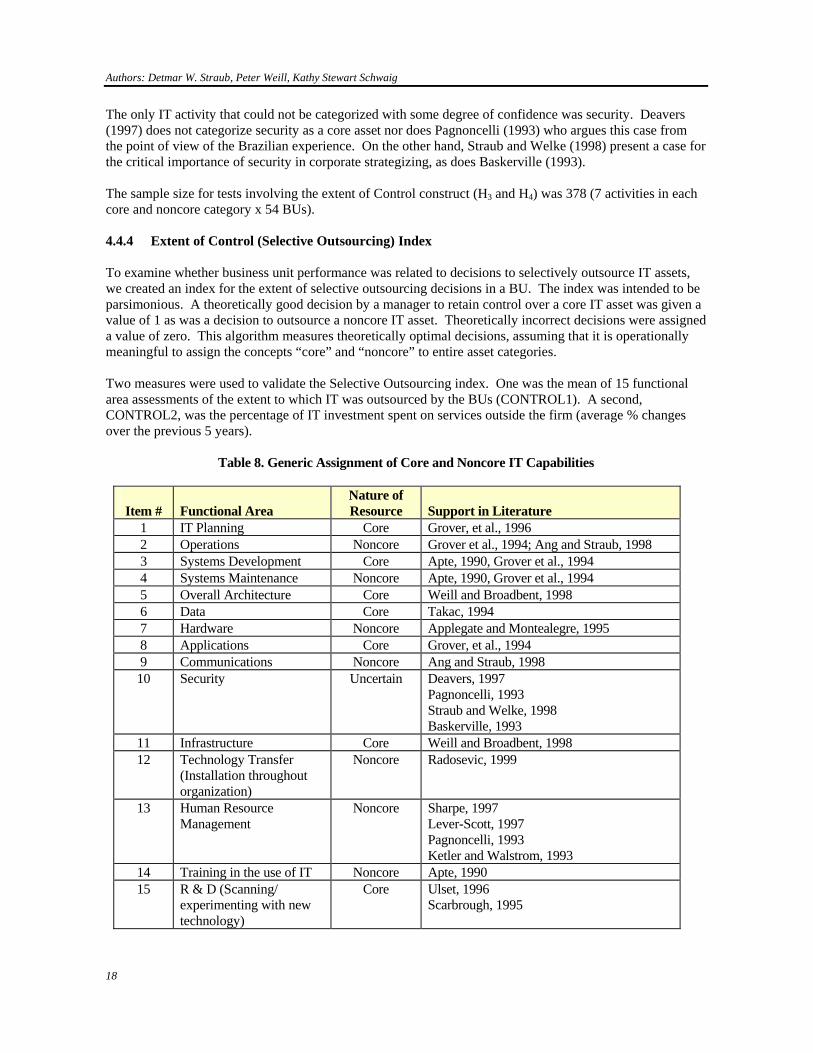
As in study 1, we captured the extent to which managers were willing to give up control of IT activities to outsourcers by asking managers about fifteen typical IS activities. The list of IT activities is similar to that used in the validated Ang and Straub field study (1998) and Smith et al. case study (1987) and aligned with activities identified in the IT services work of Weill and Broadbent (1998). The instrumentation measures the shift in control from internal to external service providers for each of fifteen IT activities. Participants completed the matrix entitled "Management of IT Activities" in Appendix B. The coding of these items is a straightforward ordinal scaling, varying from 1 to 4. If the matrix data indicated that control was primarily internal, the component item was coded "1." In cases where the outsourcer was being closely monitored by the client firm, the decision was coded as "2." If control was shared with the external provider by input being provided by the client, then it was coded "3." If control was entirely in the hands of the outsourcer, then the coding was a "4." Each activity was next classified as either core or noncore for the separate tests of H3 (CORE as DV) and H4 (NONCORE as DV). We chose to preclassify each actitivity as either core or noncore in order to increase the rigor of our hypothesis test. We felt that varying this classification on each organization’s view of what they considered to be core or noncore would be a poor methodological choice. A strong common methods bias would likely occur if the respondents were asked to identify their core IT assets and immediately thereafter asked to identity whether or not they outsourced the activity. While it is beyond the scope of this paper to discuss the classification of each of the 15 separate IT activities, justifications for each of these categorizations and other support in the literature are enumerated in Table 8.
Authors: Detmar W. Straub, Peter Weill, Kathy Stewart Schwaig
18
The only IT activity that could not be categorized with some degree of confidence was security. Deavers (1997) does not categorize security as a core asset nor does Pagnoncelli (1993) who argues this case from the point of view of the Brazilian experience. On the other hand, Straub and Welke (1998) present a case for the critical importance of security in corporate strategizing, as does Baskerville (1993). The sample size for tests involving the extent of Control construct (H3 and H4) was 378 (7 activities in each core and noncore category x 54 BUs). 4.4.4 Extent of Control (Selective Outsourcing) Index To examine whether business unit performance was related to decisions to selectively outsource IT assets, we created an index for the extent of selective outsourcing decisions in a BU. The index was intended to be parsimonious. A theoretically good decision by a manager to retain control over a core IT asset was given a value of 1 as was a decision to outsource a noncore IT asset. Theoretically incorrect decisions were assigned a value of zero. This algorithm measures theoretically optimal decisions, assuming that it is operationally meaningful to assign the concepts “core” and “noncore” to entire asset categories. Two measures were used to validate the Selective Outsourcing index. One was the mean of 15 functional area assessments of the extent to which IT was outsourced by the BUs (CONTROL1). A second, CONTROL2, was the percentage of IT investment spent on services outside the firm (average % changes over the previous 5 years).
Table 8. Generic Assignment of Core and Noncore IT Capabilities
Item #
Functional Area
Nature of Resource
Support in Literature
1 IT Planning Core Grover, et al., 1996 2 Operations Noncore Grover et al., 1994; Ang and Straub, 1998 3 Systems Development Core Apte, 1990, Grover et al., 1994 4 Systems Maintenance Noncore Apte, 1990, Grover et al., 1994 5 Overall Architecture Core Weill and Broadbent, 1998 6 Data Core Takac, 1994 7 Hardware Noncore Applegate and Montealegre, 1995 8 Applications Core Grover, et al., 1994 9 Communications Noncore Ang and Straub, 1998 10 Security Uncertain Deavers, 1997
Pagnoncelli, 1993 Straub and Welke, 1998 Baskerville, 1993
11 Infrastructure Core Weill and Broadbent, 1998 12 Technology Transfer
(Installation throughout organization)
Noncore Radosevic, 1999
13 Human Resource Management
Noncore Sharpe, 1997 Lever-Scott, 1997 Pagnoncelli, 1993 Ketler and Walstrom, 1993
14 Training in the use of IT Noncore Apte, 1990 15 R & D (Scanning/
experimenting with new technology)
Core Ulset, 1996 Scarbrough, 1995
Authors: Detmar W. Straub, Peter Weill, Kathy Stewart Schwaig
19
4.4.5 Business Unit Performance Measures We chose 3 measures that provide a balance of leading and lagging measures that also tap into the theoretical issues we are articulating; they are measures of: (1) labor productivity, (2) time-to-market of new applications, and (3) cost of new applications. First, revenue per employee was chosen as a measure of labor productivity (Weill, 1992) as it is likely to be sensitive to the level of outsourcing used. To account for IT performance of the BU, two additional measures were used. Both measures tapped into the BU application development capability. They were: (1) time to develop new applications (average over five years) and (2) cost of developing new applications (average over five years).
4.5 Study 2 Instrument Validation
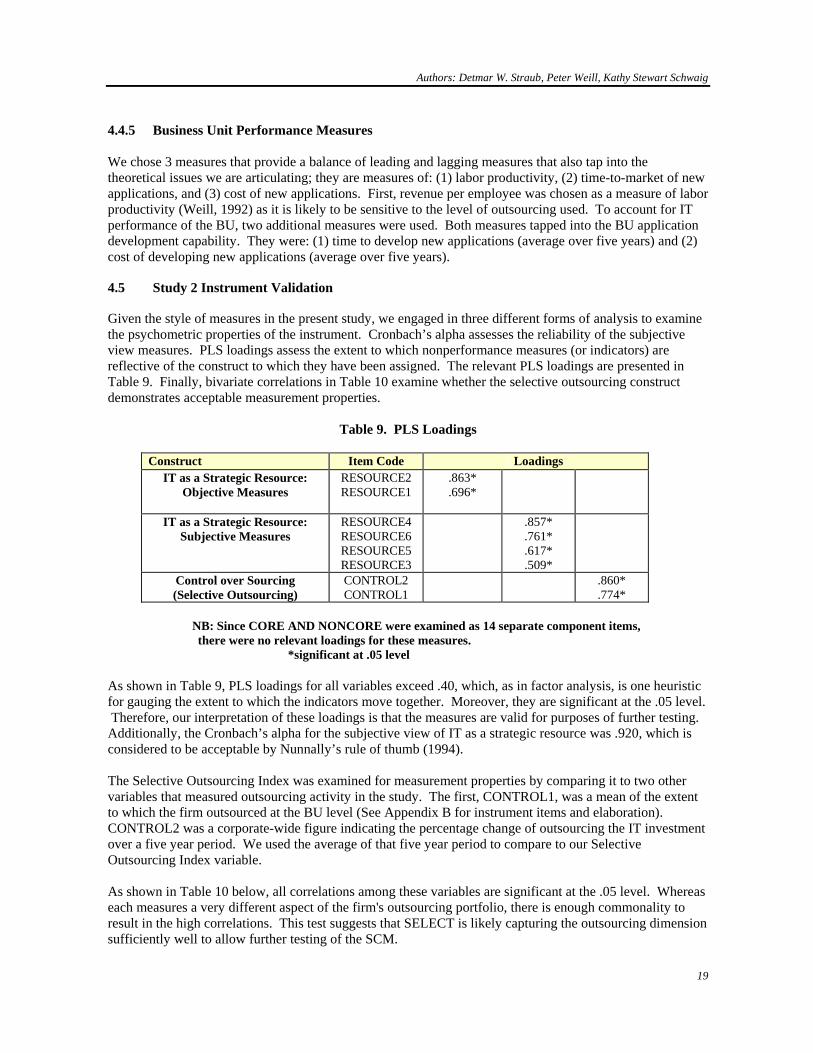
Given the style of measures in the present study, we engaged in three different forms of analysis to examine the psychometric properties of the instrument. Cronbach’s alpha assesses the reliability of the subjective view measures. PLS loadings assess the extent to which nonperformance measures (or indicators) are reflective of the construct to which they have been assigned. The relevant PLS loadings are presented in Table 9. Finally, bivariate correlations in Table 10 examine whether the selective outsourcing construct demonstrates acceptable measurement properties.
Table 9. PLS Loadings Construct Item Code Loadings
IT as a Strategic Resource: Objective Measures
RESOURCE2 RESOURCE1
.863*
.696*
IT as a Strategic Resource: Subjective Measures
RESOURCE4 RESOURCE6 RESOURCE5 RESOURCE3
.857* .761* .617* .509*
Control over Sourcing (Selective Outsourcing)
CONTROL2 CONTROL1
.860* .774*
NB: Since CORE AND NONCORE were examined as 14 separate component items, there were no relevant loadings for these measures.
*significant at .05 level As shown in Table 9, PLS loadings for all variables exceed .40, which, as in factor analysis, is one heuristic for gauging the extent to which the indicators move together. Moreover, they are significant at the .05 level. Therefore, our interpretation of these loadings is that the measures are valid for purposes of further testing. Additionally, the Cronbach’s alpha for the subjective view of IT as a strategic resource was .920, which is considered to be acceptable by Nunnally’s rule of thumb (1994). The Selective Outsourcing Index was examined for measurement properties by comparing it to two other variables that measured outsourcing activity in the study. The first, CONTROL1, was a mean of the extent to which the firm outsourced at the BU level (See Appendix B for instrument items and elaboration). CONTROL2 was a corporate-wide figure indicating the percentage change of outsourcing the IT investment over a five year period. We used the average of that five year period to compare to our Selective Outsourcing Index variable. As shown in Table 10 below, all correlations among these variables are significant at the .05 level. Whereas each measures a very different aspect of the firm's outsourcing portfolio, there is enough commonality to result in the high correlations. This test suggests that SELECT is likely capturing the outsourcing dimension sufficiently well to allow further testing of the SCM.
Authors: Detmar W. Straub, Peter Weill, Kathy Stewart Schwaig
20
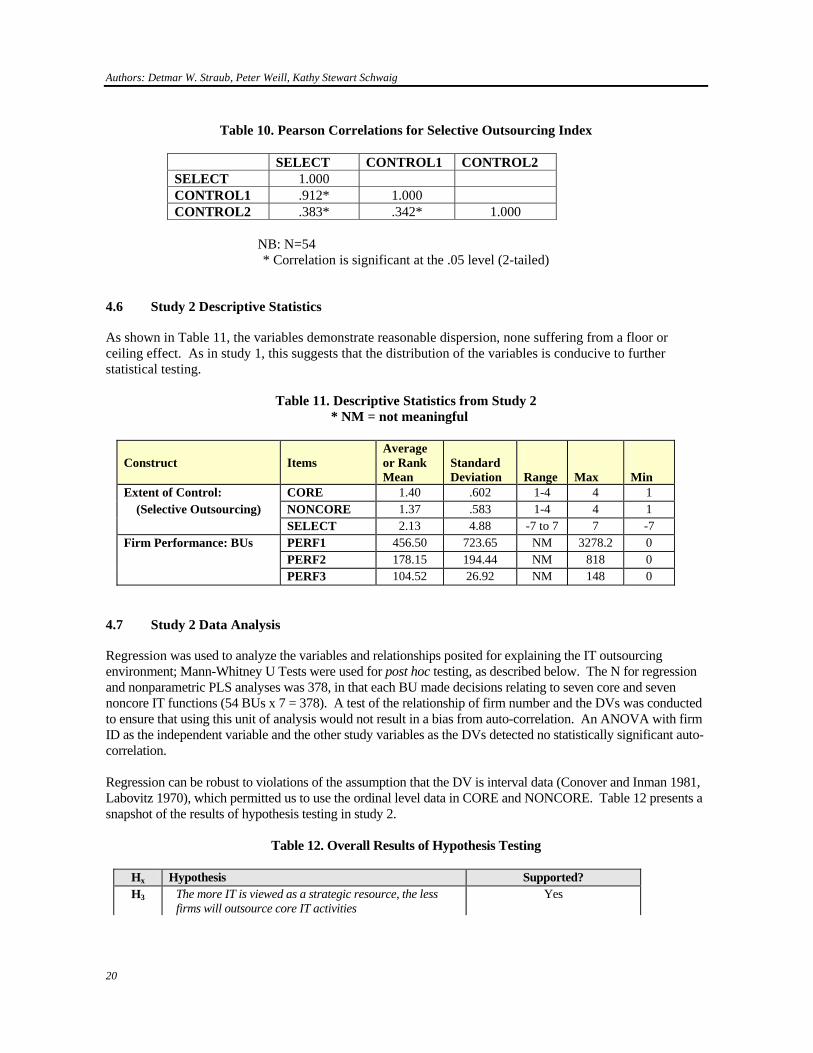
Table 10. Pearson Correlations for Selective Outsourcing Index
SELECT CONTROL1 CONTROL2 SELECT 1.000 CONTROL1 .912* 1.000 CONTROL2 .383* .342* 1.000
NB: N=54 * Correlation is significant at the .05 level (2-tailed)
4.6 Study 2 Descriptive Statistics
As shown in Table 11, the variables demonstrate reasonable dispersion, none suffering from a floor or ceiling effect. As in study 1, this suggests that the distribution of the variables is conducive to further statistical testing.
Table 11. Descriptive Statistics from Study 2 * NM = not meaningful
Construct Items
Average or Rank Mean
Standard Deviation
Range
Max
Min
Extent of Control: CORE 1.40 .602 1-4 4 1 (Selective Outsourcing) NONCORE 1.37 .583 1-4 4 1 SELECT 2.13 4.88 -7 to 7 7 -7 Firm Performance: BUs PERF1 456.50 723.65 NM 3278.2 0
PERF2 178.15 194.44 NM 818 0 PERF3 104.52 26.92 NM 148 0
4.7 Study 2 Data Analysis
Regression was used to analyze the variables and relationships posited for explaining the IT outsourcing environment; Mann-Whitney U Tests were used for post hoc testing, as described below. The N for regression and nonparametric PLS analyses was 378, in that each BU made decisions relating to seven core and seven noncore IT functions (54 BUs x 7 = 378). A test of the relationship of firm number and the DVs was conducted to ensure that using this unit of analysis would not result in a bias from auto-correlation. An ANOVA with firm ID as the independent variable and the other study variables as the DVs detected no statistically significant auto-correlation. Regression can be robust to violations of the assumption that the DV is interval data (Conover and Inman 1981, Labovitz 1970), which permitted us to use the ordinal level data in CORE and NONCORE. Table 12 presents a snapshot of the results of hypothesis testing in study 2.
Table 12. Overall Results of Hypothesis Testing Hx Hypothesis Supported? H3 The more IT is viewed as a strategic resource, the less
firms will outsource core IT activities Yes
Authors: Detmar W. Straub, Peter Weill, Kathy Stewart Schwaig
21
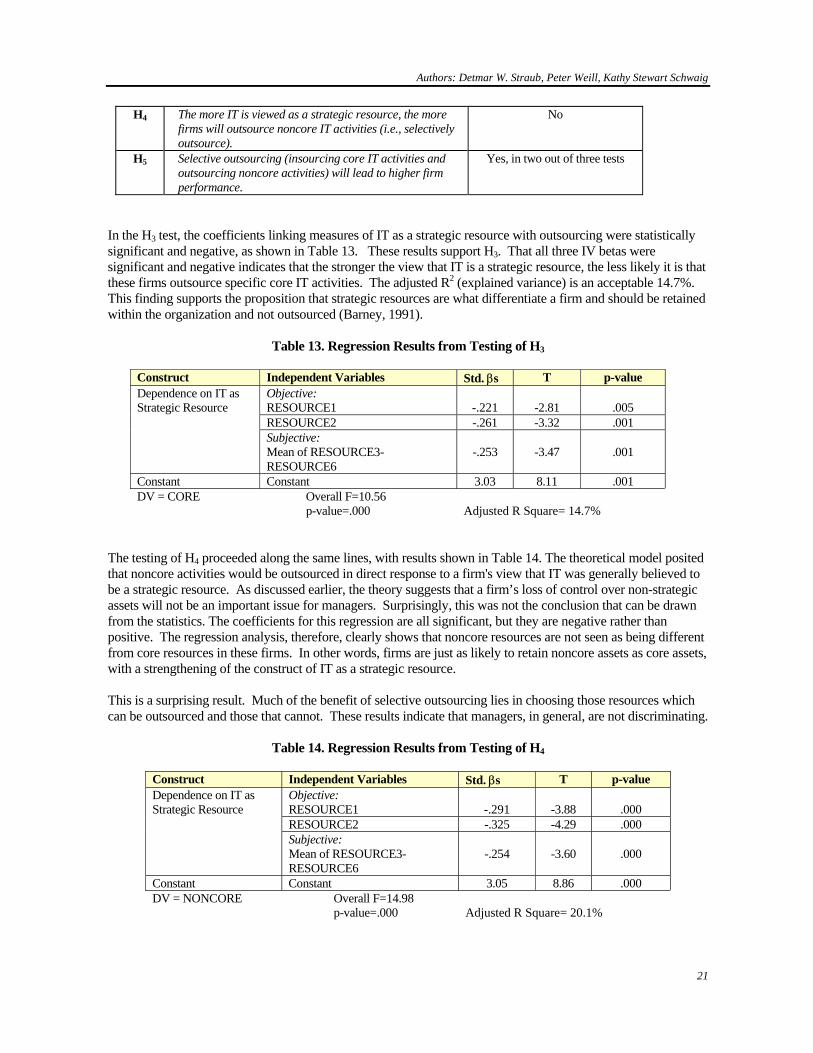
H4 The more IT is viewed as a strategic resource, the more firms will outsource noncore IT activities (i.e., selectively outsource).
No
H5 Selective outsourcing (insourcing core IT activities and outsourcing noncore activities) will lead to higher firm performance.
Yes, in two out of three tests
In the H3 test, the coefficients linking measures of IT as a strategic resource with outsourcing were statistically significant and negative, as shown in Table 13. These results support H3. That all three IV betas were significant and negative indicates that the stronger the view that IT is a strategic resource, the less likely it is that these firms outsource specific core IT activities. The adjusted R2 (explained variance) is an acceptable 14.7%. This finding supports the proposition that strategic resources are what differentiate a firm and should be retained within the organization and not outsourced (Barney, 1991).
Table 13. Regression Results from Testing of H3
Construct Independent Variables Std. βs T p-value Dependence on IT as Strategic Resource
Objective: RESOURCE1
-.221
-2.81
.005
RESOURCE2 -.261 -3.32 .001 Subjective:
Mean of RESOURCE3-RESOURCE6
-.253
-3.47
.001
Constant Constant 3.03 8.11 .001 DV = CORE Overall F=10.56
p-value=.000 Adjusted R Square= 14.7%
The testing of H4 proceeded along the same lines, with results shown in Table 14. The theoretical model posited that noncore activities would be outsourced in direct response to a firm's view that IT was generally believed to be a strategic resource. As discussed earlier, the theory suggests that a firm’s loss of control over non-strategic assets will not be an important issue for managers. Surprisingly, this was not the conclusion that can be drawn from the statistics. The coefficients for this regression are all significant, but they are negative rather than positive. The regression analysis, therefore, clearly shows that noncore resources are not seen as being different from core resources in these firms. In other words, firms are just as likely to retain noncore assets as core assets, with a strengthening of the construct of IT as a strategic resource. This is a surprising result. Much of the benefit of selective outsourcing lies in choosing those resources which can be outsourced and those that cannot. These results indicate that managers, in general, are not discriminating.
Table 14. Regression Results from Testing of H4
Construct Independent Variables Std. βs T p-value Dependence on IT as Strategic Resource
Objective: RESOURCE1
-.291
-3.88
.000
RESOURCE2 -.325 -4.29 .000 Subjective:
Mean of RESOURCE3-RESOURCE6
-.254
-3.60
.000
Constant Constant 3.05 8.86 .000 DV = NONCORE Overall F=14.98
p-value=.000 Adjusted R Square= 20.1%
Authors: Detmar W. Straub, Peter Weill, Kathy Stewart Schwaig
22
4.8 Study 2 Test of H5
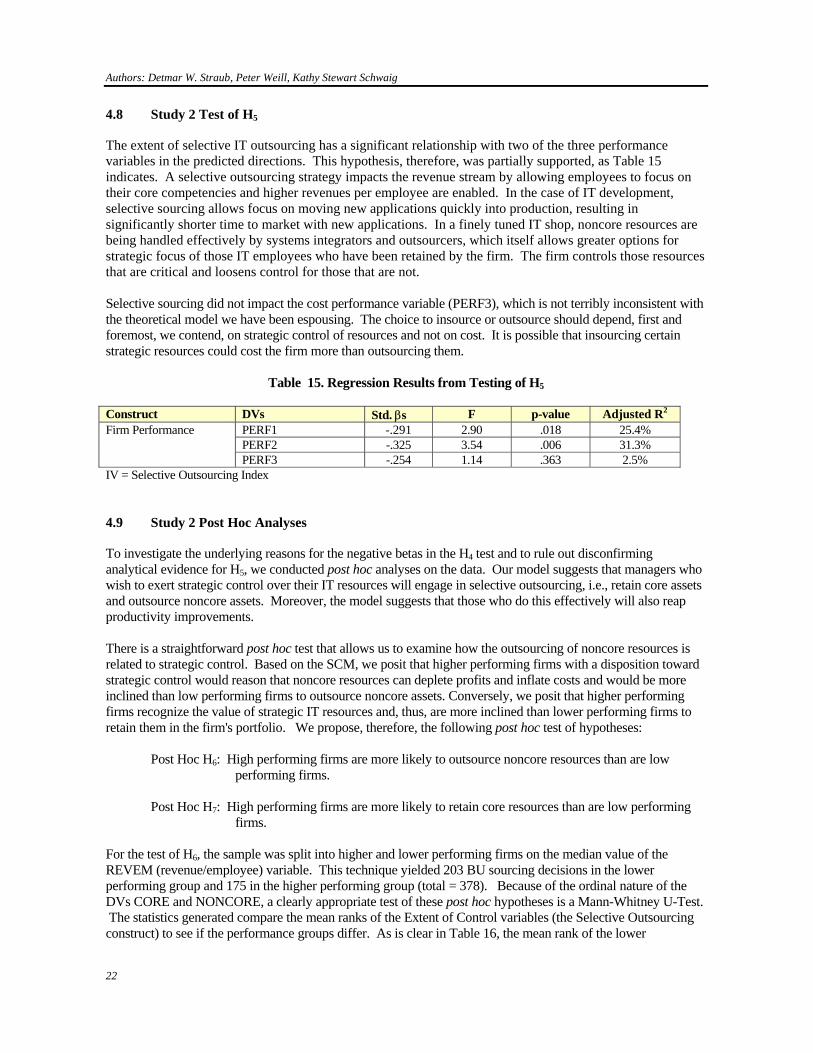
The extent of selective IT outsourcing has a significant relationship with two of the three performance variables in the predicted directions. This hypothesis, therefore, was partially supported, as Table 15 indicates. A selective outsourcing strategy impacts the revenue stream by allowing employees to focus on their core competencies and higher revenues per employee are enabled. In the case of IT development, selective sourcing allows focus on moving new applications quickly into production, resulting in significantly shorter time to market with new applications. In a finely tuned IT shop, noncore resources are being handled effectively by systems integrators and outsourcers, which itself allows greater options for strategic focus of those IT employees who have been retained by the firm. The firm controls those resources that are critical and loosens control for those that are not. Selective sourcing did not impact the cost performance variable (PERF3), which is not terribly inconsistent with the theoretical model we have been espousing. The choice to insource or outsource should depend, first and foremost, we contend, on strategic control of resources and not on cost. It is possible that insourcing certain strategic resources could cost the firm more than outsourcing them.
Table 15. Regression Results from Testing of H5 Construct DVs Std. βs F p-value Adjusted R2
Firm Performance PERF1 -.291 2.90 .018 25.4% PERF2 -.325 3.54 .006 31.3% PERF3 -.254 1.14 .363 2.5% IV = Selective Outsourcing Index
4.9 Study 2 Post Hoc Analyses
To investigate the underlying reasons for the negative betas in the H4 test and to rule out disconfirming analytical evidence for H5, we conducted post hoc analyses on the data. Our model suggests that managers who wish to exert strategic control over their IT resources will engage in selective outsourcing, i.e., retain core assets and outsource noncore assets. Moreover, the model suggests that those who do this effectively will also reap productivity improvements. There is a straightforward post hoc test that allows us to examine how the outsourcing of noncore resources is related to strategic control. Based on the SCM, we posit that higher performing firms with a disposition toward strategic control would reason that noncore resources can deplete profits and inflate costs and would be more inclined than low performing firms to outsource noncore assets. Conversely, we posit that higher performing firms recognize the value of strategic IT resources and, thus, are more inclined than lower performing firms to retain them in the firm's portfolio. We propose, therefore, the following post hoc test of hypotheses:
Post Hoc H6: High performing firms are more likely to outsource noncore resources than are low performing firms.
Post Hoc H7: High performing firms are more likely to retain core resources than are low performing
firms.
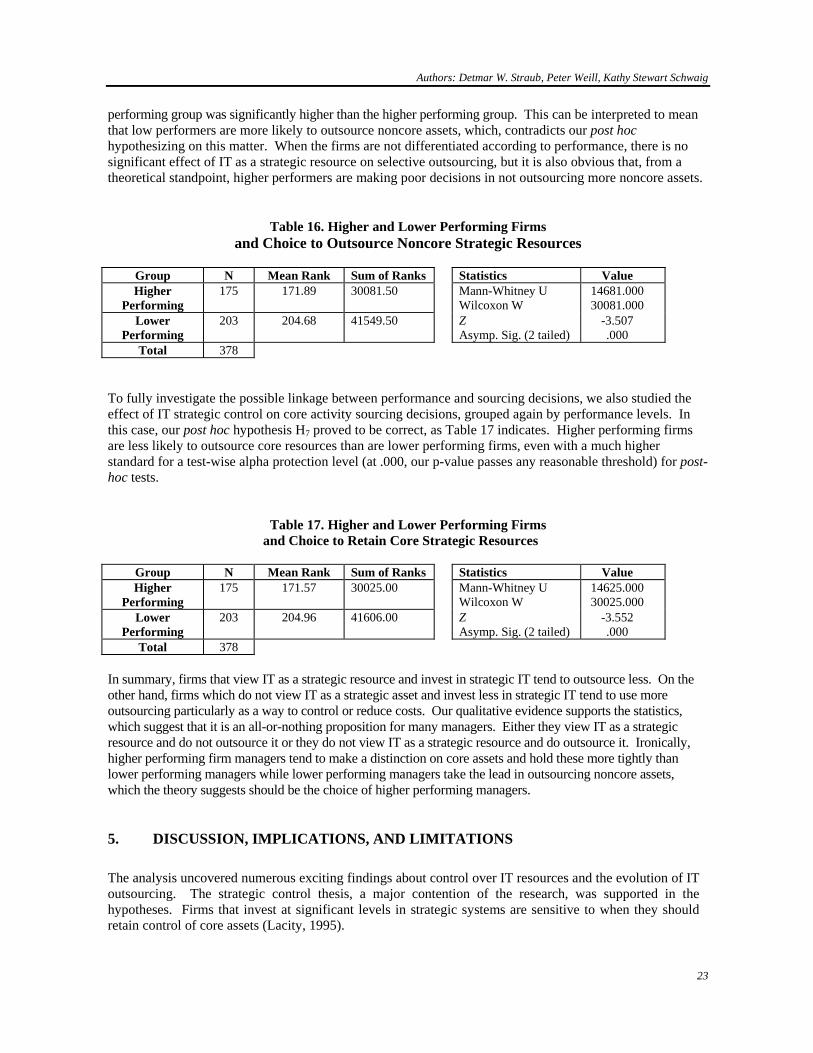
For the test of H6, the sample was split into higher and lower performing firms on the median value of the REVEM (revenue/employee) variable. This technique yielded 203 BU sourcing decisions in the lower performing group and 175 in the higher performing group (total = 378). Because of the ordinal nature of the DVs CORE and NONCORE, a clearly appropriate test of these post hoc hypotheses is a Mann-Whitney U-Test. The statistics generated compare the mean ranks of the Extent of Control variables (the Selective Outsourcing construct) to see if the performance groups differ. As is clear in Table 16, the mean rank of the lower
Authors: Detmar W. Straub, Peter Weill, Kathy Stewart Schwaig
23
performing group was significantly higher than the higher performing group. This can be interpreted to mean that low performers are more likely to outsource noncore assets, which, contradicts our post hoc hypothesizing on this matter. When the firms are not differentiated according to performance, there is no significant effect of IT as a strategic resource on selective outsourcing, but it is also obvious that, from a theoretical standpoint, higher performers are making poor decisions in not outsourcing more noncore assets.
Table 16. Higher and Lower Performing Firms and Choice to Outsource Noncore Strategic Resources
Group N Mean Rank Sum of Ranks Statistics Value Higher
Performing 175 171.89 30081.50 Mann-Whitney U
Wilcoxon W 14681.000 30081.000
Lower Performing
203 204.68 41549.50 Z Asymp. Sig. (2 tailed)
-3.507 .000
Total 378
To fully investigate the possible linkage between performance and sourcing decisions, we also studied the effect of IT strategic control on core activity sourcing decisions, grouped again by performance levels. In this case, our post hoc hypothesis H7 proved to be correct, as Table 17 indicates. Higher performing firms are less likely to outsource core resources than are lower performing firms, even with a much higher standard for a test-wise alpha protection level (at .000, our p-value passes any reasonable threshold) for post-hoc tests.
Table 17. Higher and Lower Performing Firms and Choice to Retain Core Strategic Resources
Group N Mean Rank Sum of Ranks Statistics Value Higher
Performing 175 171.57 30025.00 Mann-Whitney U
Wilcoxon W 14625.000 30025.000
Lower Performing
203 204.96 41606.00 Z Asymp. Sig. (2 tailed)
-3.552 .000
Total 378 In summary, firms that view IT as a strategic resource and invest in strategic IT tend to outsource less. On the other hand, firms which do not view IT as a strategic asset and invest less in strategic IT tend to use more outsourcing particularly as a way to control or reduce costs. Our qualitative evidence supports the statistics, which suggest that it is an all-or-nothing proposition for many managers. Either they view IT as a strategic resource and do not outsource it or they do not view IT as a strategic resource and do outsource it. Ironically, higher performing firm managers tend to make a distinction on core assets and hold these more tightly than lower performing managers while lower performing managers take the lead in outsourcing noncore assets, which the theory suggests should be the choice of higher performing managers.
5. DISCUSSION, IMPLICATIONS, AND LIMITATIONS
The analysis uncovered numerous exciting findings about control over IT resources and the evolution of IT outsourcing. The strategic control thesis, a major contention of the research, was supported in the hypotheses. Firms that invest at significant levels in strategic systems are sensitive to when they should retain control of core assets (Lacity, 1995).
Authors: Detmar W. Straub, Peter Weill, Kathy Stewart Schwaig
24
Sustaining an IT-enabled competitive advantage requires continuous innovation, environmental scanning and a corporate mindset that understands the strategic use of IT. Such an environment is difficult to cultivate when control over a strategic asset is handed over to an integrator or service provider. Bendigo Bank, a regional Australian bank, decided to bring information technology back in house. Vicky Kelly, Bendigo Bank’s CIO, explains (Zampatakis, 1997):
In banking now, the lines between the business of banking and IT are becoming blurred. We need the IT knowledge within our organization so we can use it to help the business and we want immediate access so we can change direction at a moments notice. Outsourcing doesn’t provide that.
Whether managers view IT as a strategic resource or not, the outsourcing decision is almost certainly not an indiscriminate one. There is evidence in the study that selective sourcing decisions lead to higher performance and that there are adverse consequences involved in ignoring the connection between viewing IT as a strategic resource and selectively outsourcing it. Higher levels of performance uncovered in this study include: (1) larger profits per employee and (2) higher ROA. PERF3, increased competitiveness or comparative pricing against competitors, did not load significantly (see Table 3), but the other performance measures did. These significant effects are last in a value chain that begins by arguing that strategic choices about sourcing IT eventually impact the firm's bottom line.
Grounded in resource dependency theory, the strategic control model expresses these relationships in a parsimonious fashion. In this study, the model received sufficient support to justify further research in this vein. In short, it appears that firms that selectively outsource IT and take advantage of these competitive opportunities will be justified in their investment decision. A significant business payoff awaits firms that can successfully manage selective outsourcing.
Managers and researchers alike need to consider the implications of these findings. For scholars, it is important to note that the strategic control hypothesis received support through both the objective and subjective measures, but that the theoretical framework does needs further work in construct specification and testing of subjective measures and alternate measures of performance.
Of course, all research has limitations and there are some that need to be noted in the present study and addressed in future work. Whereas the quality of the data was generally excellent and 14 observations per business unit assessing the outsourcing activity (CONTROL1) added richness to our measures, further studies in differing settings and locales are always in order and part of the process of normal science.
Measurement issues lie at the heart of solid research and, although most of the measures in the instrument performed reasonably well, further work in this vein can refine and hone the approach. It would be useful, for example, to have accompanying subjective and objective measures for even more variables in the data set. This would help to rule out methods bias and to conclude that the effects observed are not artifactual. Instrumentation of the attitudes toward IT as a strategic asset needs to be revisited.
Core IT assets need to be investigated vis-á-vis noncore assets. Asking whether an IT activity is strategic or core and then asking in the same instrument whether it was outsourced has a built-in methods bias. The results of this approach to instrumentation may be artifactual. Researchers should seek out ways to measure these variables without collecting the data at the same time and from the same source.
Given that the present study represents a departure from the usual outsourcing theory bases of transaction cost and incomplete contracting (Ang and Straub, 1998; Lacity and Hirscheim, 1993; Richmond, et al., 1992a; Richmond, et al., 1992b), we feel that RBT has proven itself to be a useful lens for formulating theoretical propositions related to the outsourcing decision.
Practitioners should recognize that deciding which IT resources are strategic is a crucial phase in the overall systems integration process. Non-core assets can be taken over by outsourcers with no loss of
Authors: Detmar W. Straub, Peter Weill, Kathy Stewart Schwaig
25
strategic control. On the other hand, retaining IT assets that are strategic will enable the firm to remain competitive and better capable of responding to future technological uncertainty.
This study raises interesting questions about the worldwide trend of increasing IT outsourcing. For example, some governments (e.g. Federal Government of Australia)9 have mandated market testing for outsourcing all IT investments, often combining several departments in the outsourcing contract (e.g., Taxation and Health) to achieve a stronger bargaining position. In contrast to this approach, the results of this study strongly support a selective approach to outsourcing based on strategic control of key IT assets and the core competencies of the organization. Strategic control should be the ultimate purpose of outsourcing, rather than any arbitrary attribution of value to IT outsourcing in its own right. Managers in the position to influence key outsourcing decisions should think about the need to strategically control each IT activity and make their decisions accordingly.
ACKNOWLEDGMENTS
We wish to acknowledge researchers who contributed to the collection of insights and data for this research:
• Marianne Broadbent, The Gartner Group • Carey Butler , Monash University, Australia • Tim O’Brien, formally of Melbourne Business School, University of Melbourne • John Henderson and Christine Lentz, Boston University • Jeff Sampler, London Business School • Bob Tricker, John Whitman and Ali Farhoomand, Hong Kong University • Peter Keen, Keen Education • Jack Rockart, Jeanne Ross and Jim Short, Massachusetts Institute of Technology • Judith Quillard, IBM • Neo Boon Siong and Christina Soh, Nanyang Technological University, Singapore
9 See www.aph.gov. au for details of a Federal Australian Government inquiry into IT outsourcing.
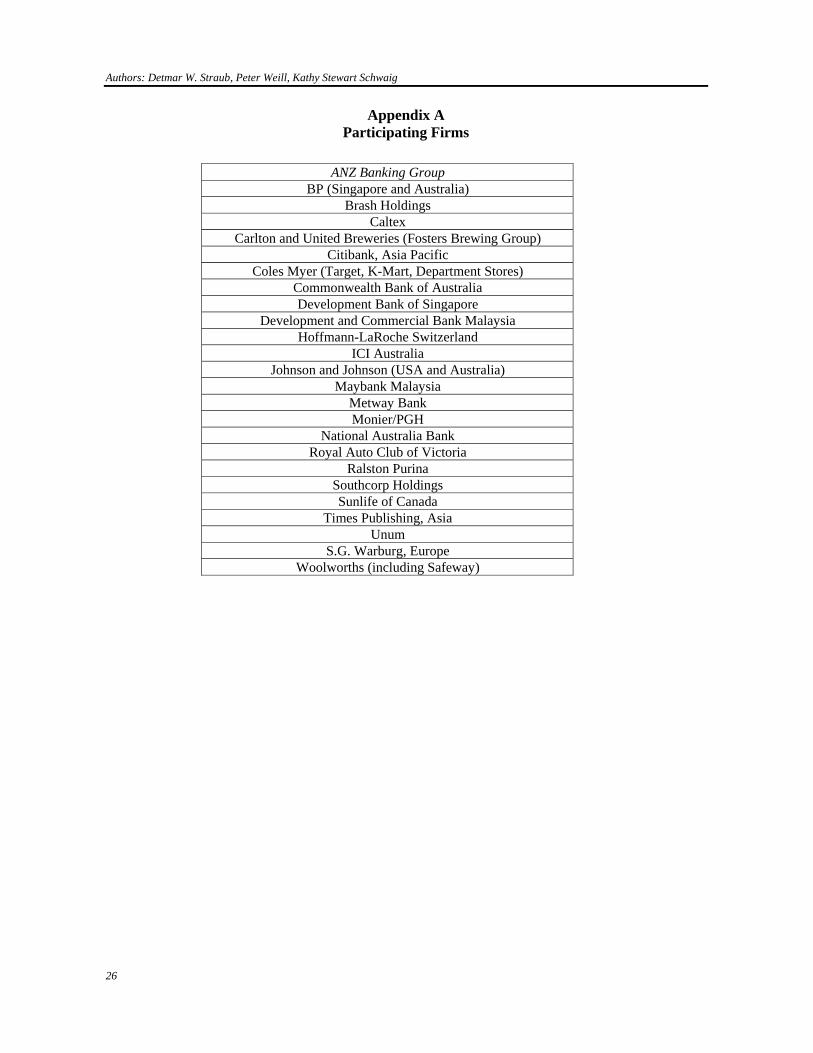
Authors: Detmar W. Straub, Peter Weill, Kathy Stewart Schwaig
26
Appendix A Participating Firms
ANZ Banking Group
BP (Singapore and Australia) Brash Holdings
Caltex Carlton and United Breweries (Fosters Brewing Group)
Citibank, Asia Pacific Coles Myer (Target, K-Mart, Department Stores)
Commonwealth Bank of Australia Development Bank of Singapore
Development and Commercial Bank Malaysia Hoffmann-LaRoche Switzerland
ICI Australia Johnson and Johnson (USA and Australia)
Maybank Malaysia Metway Bank Monier/PGH
National Australia Bank Royal Auto Club of Victoria
Ralston Purina Southcorp Holdings Sunlife of Canada
Times Publishing, Asia Unum
S.G. Warburg, Europe Woolworths (including Safeway)
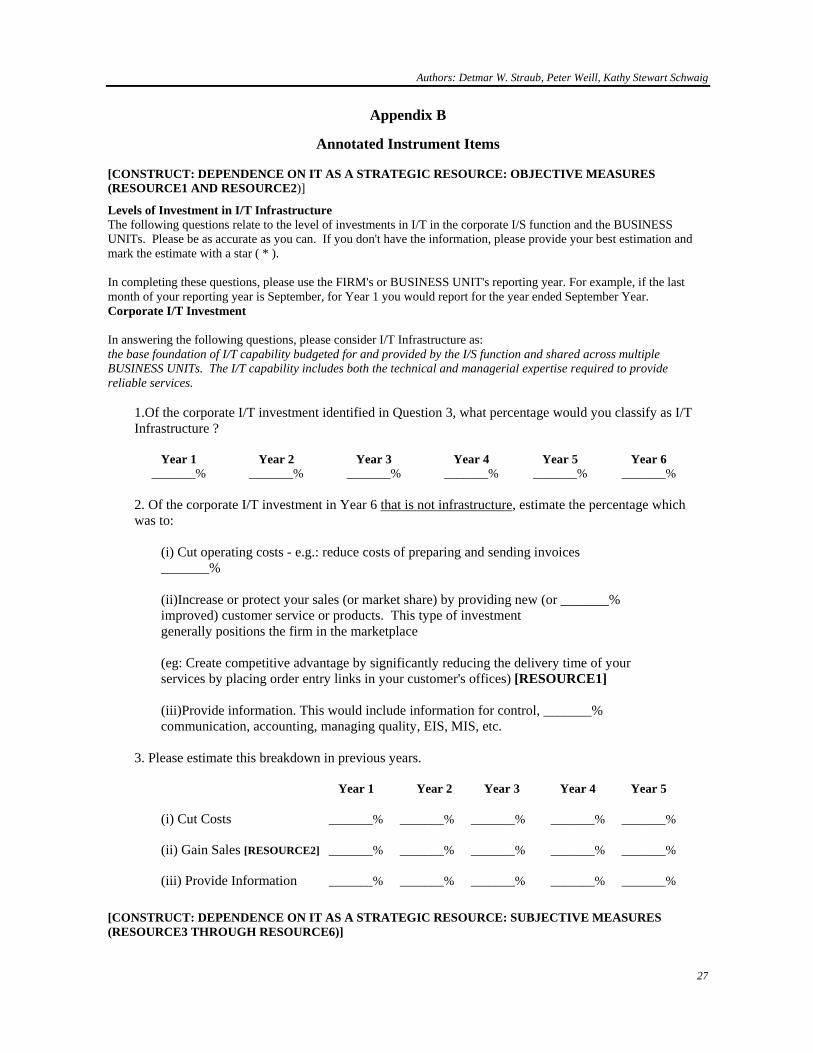
Authors: Detmar W. Straub, Peter Weill, Kathy Stewart Schwaig
27
Appendix B
Annotated Instrument Items [CONSTRUCT: DEPENDENCE ON IT AS A STRATEGIC RESOURCE: OBJECTIVE MEASURES (RESOURCE1 AND RESOURCE2)]
Levels of Investment in I/T Infrastructure The following questions relate to the level of investments in I/T in the corporate I/S function and the BUSINESS UNITs. Please be as accurate as you can. If you don't have the information, please provide your best estimation and mark the estimate with a star ( * ). In completing these questions, please use the FIRM's or BUSINESS UNIT's reporting year. For example, if the last month of your reporting year is September, for Year 1 you would report for the year ended September Year. Corporate I/T Investment In answering the following questions, please consider I/T Infrastructure as: the base foundation of I/T capability budgeted for and provided by the I/S function and shared across multiple BUSINESS UNITs. The I/T capability includes both the technical and managerial expertise required to provide reliable services.
1.Of the corporate I/T investment identified in Question 3, what percentage would you classify as I/T Infrastructure ?
Year 1 Year 2 Year 3 Year 4 Year 5 Year 6 _______% _______% _______% _______% _______% _______%
2. Of the corporate I/T investment in Year 6 that is not infrastructure, estimate the percentage which was to:
(i) Cut operating costs - e.g.: reduce costs of preparing and sending invoices _______% (ii)Increase or protect your sales (or market share) by providing new (or _______% improved) customer service or products. This type of investment generally positions the firm in the marketplace (eg: Create competitive advantage by significantly reducing the delivery time of your services by placing order entry links in your customer's offices) [RESOURCE1] (iii)Provide information. This would include information for control, _______% communication, accounting, managing quality, EIS, MIS, etc.
3. Please estimate this breakdown in previous years. Year 1 Year 2 Year 3 Year 4 Year 5
(i) Cut Costs _______% _______% _______% _______% _______%
(ii) Gain Sales [RESOURCE2] _______% _______% _______% _______% _______%
(iii) Provide Information _______% _______% _______% _______% _______%
[CONSTRUCT: DEPENDENCE ON IT AS A STRATEGIC RESOURCE: SUBJECTIVE MEASURES (RESOURCE3 THROUGH RESOURCE6)]
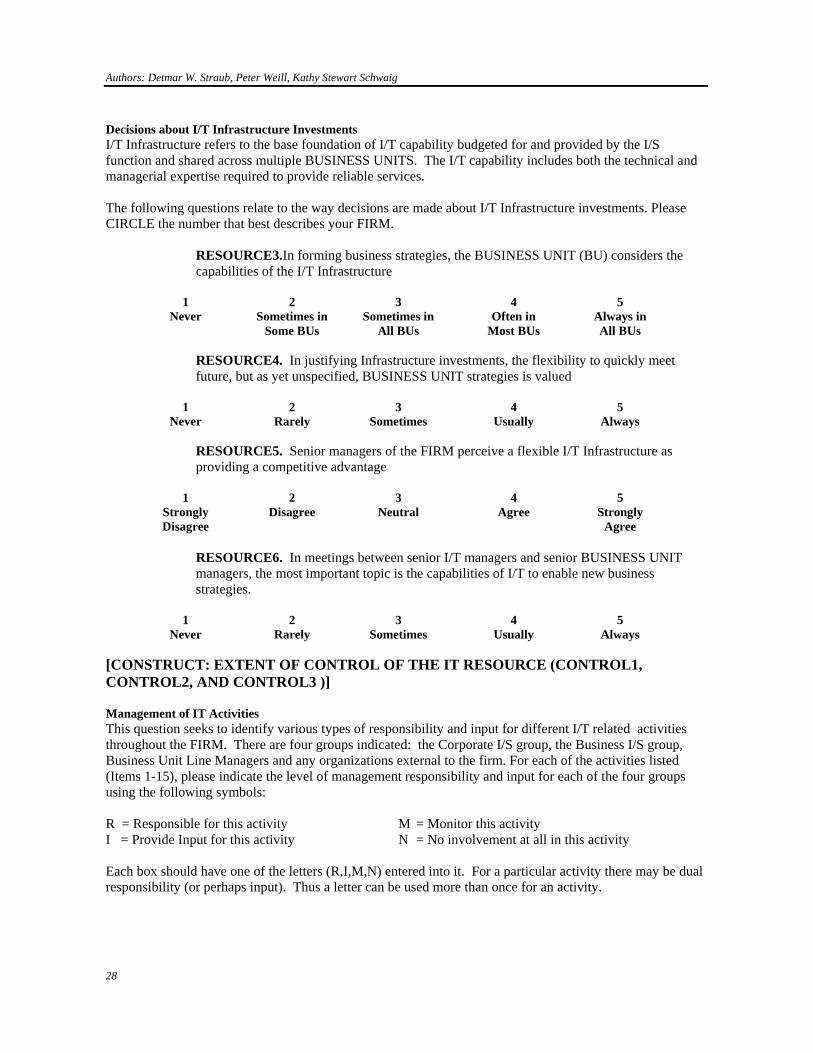
Authors: Detmar W. Straub, Peter Weill, Kathy Stewart Schwaig
28
Decisions about I/T Infrastructure Investments I/T Infrastructure refers to the base foundation of I/T capability budgeted for and provided by the I/S function and shared across multiple BUSINESS UNITS. The I/T capability includes both the technical and managerial expertise required to provide reliable services. The following questions relate to the way decisions are made about I/T Infrastructure investments. Please CIRCLE the number that best describes your FIRM.
RESOURCE3.In forming business strategies, the BUSINESS UNIT (BU) considers the capabilities of the I/T Infrastructure
1 2 3 4 5 Never Sometimes in Sometimes in Often in Always in Some BUs All BUs Most BUs All BUs
RESOURCE4. In justifying Infrastructure investments, the flexibility to quickly meet future, but as yet unspecified, BUSINESS UNIT strategies is valued
1 2 3 4 5 Never Rarely Sometimes Usually Always
RESOURCE5. Senior managers of the FIRM perceive a flexible I/T Infrastructure as providing a competitive advantage
1 2 3 4 5 Strongly Disagree Neutral Agree Strongly Disagree Agree
RESOURCE6. In meetings between senior I/T managers and senior BUSINESS UNIT managers, the most important topic is the capabilities of I/T to enable new business strategies.
1 2 3 4 5 Never Rarely Sometimes Usually Always [CONSTRUCT: EXTENT OF CONTROL OF THE IT RESOURCE (CONTROL1, CONTROL2, AND CONTROL3 )]
Management of IT Activities This question seeks to identify various types of responsibility and input for different I/T related activities throughout the FIRM. There are four groups indicated: the Corporate I/S group, the Business I/S group, Business Unit Line Managers and any organizations external to the firm. For each of the activities listed (Items 1-15), please indicate the level of management responsibility and input for each of the four groups using the following symbols: R = Responsible for this activity M = Monitor this activity I = Provide Input for this activity N = No involvement at all in this activity Each box should have one of the letters (R,I,M,N) entered into it. For a particular activity there may be dual responsibility (or perhaps input). Thus a letter can be used more than once for an activity.
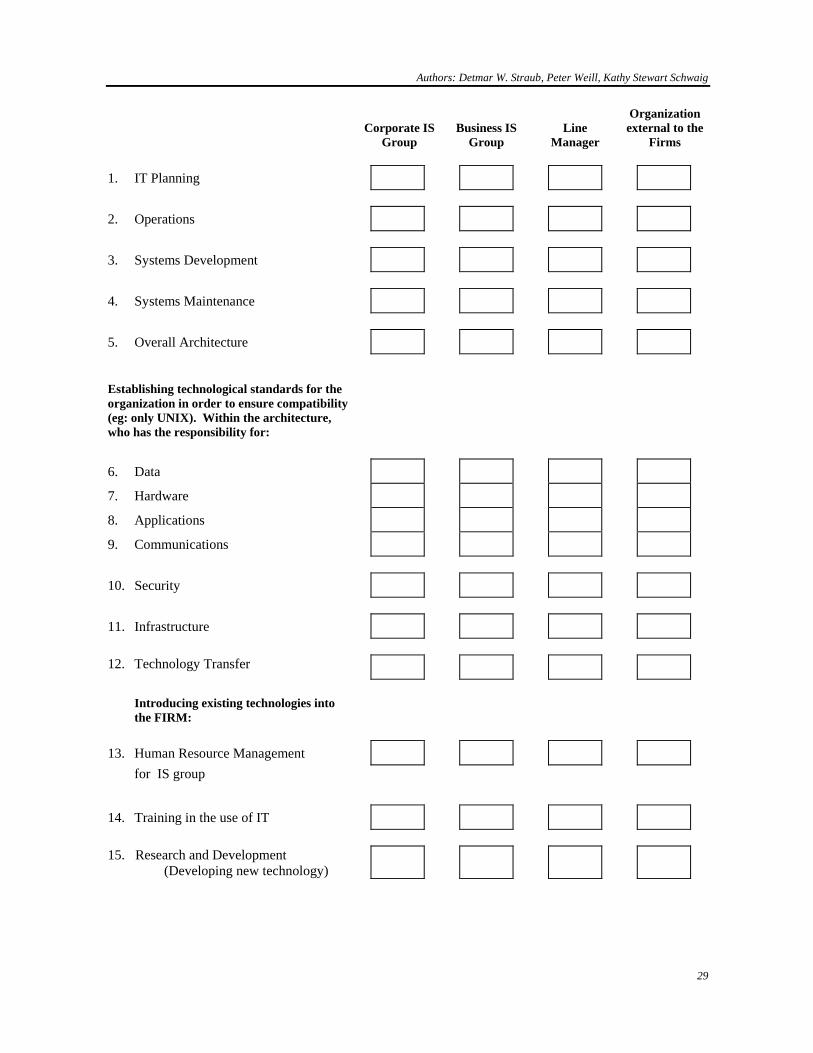
Authors: Detmar W. Straub, Peter Weill, Kathy Stewart Schwaig
29
Corporate IS
Group
Business IS
Group
Line
Manager
Organization external to the
Firms 1. IT Planning 2. Operations 3. Systems Development 4. Systems Maintenance 5. Overall Architecture
Establishing technological standards for the organization in order to ensure compatibility (eg: only UNIX). Within the architecture, who has the responsibility for:
6. Data
7. Hardware
8. Applications
9. Communications 10. Security 11. Infrastructure 12. Technology Transfer
Introducing existing technologies into the FIRM:
13. Human Resource Management for IS group 14. Training in the use of IT 15. Research and Development
(Developing new technology)
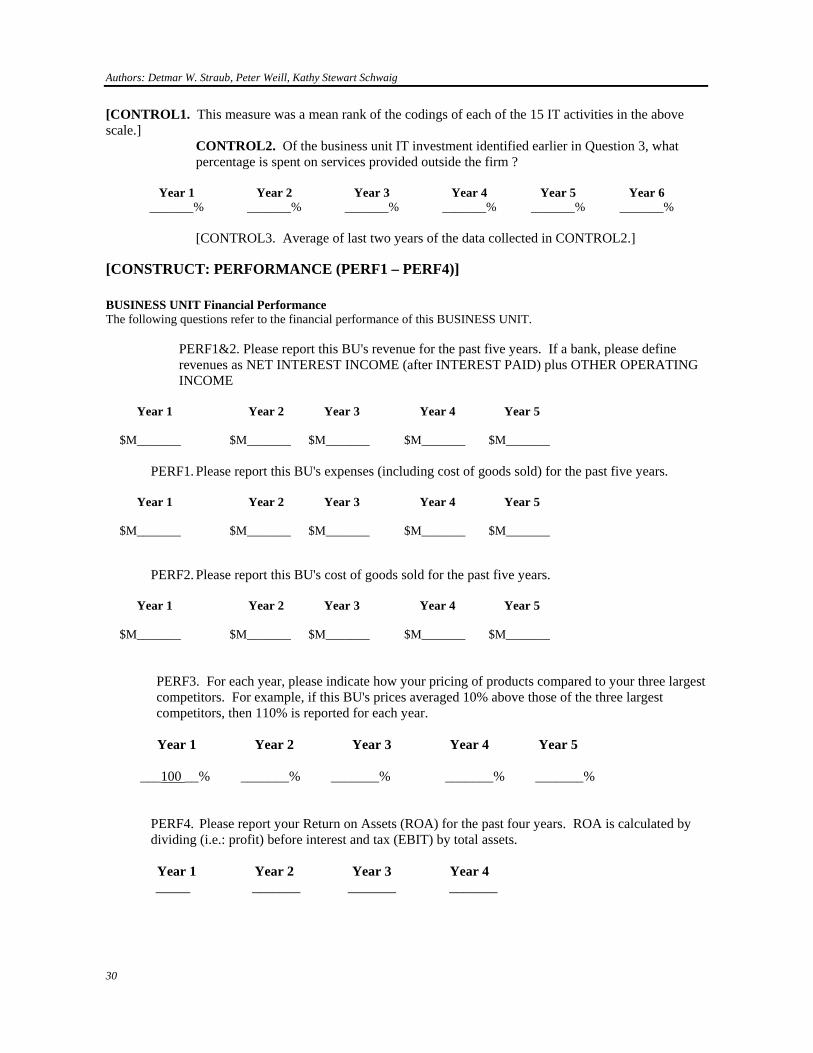
Authors: Detmar W. Straub, Peter Weill, Kathy Stewart Schwaig
30
[CONTROL1. This measure was a mean rank of the codings of each of the 15 IT activities in the above scale.]
CONTROL2. Of the business unit IT investment identified earlier in Question 3, what percentage is spent on services provided outside the firm ?
Year 1 Year 2 Year 3 Year 4 Year 5 Year 6 _______% _______% _______% _______% _______% _______%
[CONTROL3. Average of last two years of the data collected in CONTROL2.]
[CONSTRUCT: PERFORMANCE (PERF1 – PERF4)] BUSINESS UNIT Financial Performance The following questions refer to the financial performance of this BUSINESS UNIT.
PERF1&2. Please report this BU's revenue for the past five years. If a bank, please define revenues as NET INTEREST INCOME (after INTEREST PAID) plus OTHER OPERATING INCOME
Year 1 Year 2 Year 3 Year 4 Year 5 $M_______ $M_______ $M_______ $M_______ $M_______
PERF1. Please report this BU's expenses (including cost of goods sold) for the past five years.
Year 1 Year 2 Year 3 Year 4 Year 5 $M_______ $M_______ $M_______ $M_______ $M_______
PERF2. Please report this BU's cost of goods sold for the past five years.
Year 1 Year 2 Year 3 Year 4 Year 5 $M_______ $M_______ $M_______ $M_______ $M_______
PERF3. For each year, please indicate how your pricing of products compared to your three largest competitors. For example, if this BU's prices averaged 10% above those of the three largest competitors, then 110% is reported for each year.
Year 1 Year 2 Year 3 Year 4 Year 5 ___100 __% _______% _______% _______% _______%
PERF4. Please report your Return on Assets (ROA) for the past four years. ROA is calculated by dividing (i.e.: profit) before interest and tax (EBIT) by total assets.
Year 1 Year 2 Year 3 Year 4 _____ _______ _______ _______

Authors: Detmar W. Straub, Peter Weill, Kathy Stewart Schwaig
31
REFERENCES
ALDRICH, H. AND J. PFEFFER (1976). Environments of Organizations, Annual Review of Sociology, 2, 79-105. AMIT, R. AND P. SCHOEMAKER (1993). Strategic Assets and Organizational Rent, Strategic Management Journal 14 (1), 33-46. ANG, S., AND BEATH, C.M. (1993). Hierarchical Elements in Software Contracts, Journal of Organizational Computing, 3 (3), 329-361. ANG, S. (1994). Toward Conceptual Clarity of Outsourcing, In B.C. Glasson et al. (Ed.), Business Process Reengineering: Information Systems Opportunities and Challenges, Elsevier Science B.V. (North-Holland), 113-126. ANG, S. AND D.W. STRAUB (1998). Production and Transaction Economies and IS Outsourcing: A Study of the U.S. Banking Industry, MIS Quarterly, 22 (4), 535-552. APPLEGATE L.M and R. MONTEALEGRE, (1995). Eastman Kodak Co. Managing Information Systems through Strategic Alliances, 192030, Harvard Business School. APTE, U. (1990). Global Outsourcing of Information Systems and Processing Services, The Information Society, 7, 278-303. BAGOZZI, R.P. (1984). A Prospectus for Theory Construction in Marketing, Journal of Marketing, 48, Winter, 11-29. BARNEY, J. (1991). Firm Resources and Sustained Competitive Advantage, Journal of Management, 17 (1), 99-120. BASKERVILLE, R (1993), Information Systems Security Design Methods: Implications for Information Systems Development. ACM Computing Surveys, 25, 375-414. BEIER, F.J. (1989). Transportation Contracts and the Experience Effect: A Framework for Future Research, Journal of Business Logistics, 10 (2), 73-89. BENDER, D.H. (1986). Financial Impact of Information Processing, Journal of Management Information Systems, 3 (2), 22-32. BIRKINSHAW, J, O. TOULAN, AND D. ARNOLD (2001). Global Account Management in Multinational Corporations: Theory and Evidence; Journal of International Business Studies 32 (2), 231-248. BRADLEY, S.P., J.A. HOUSMAN AND R.L. NOLAN (1993). Globalization and Technology, In S.P. Bradley, J.A. Housman and R.L. Nolan (Ed.), Globalization, Technology, and Competition: The Fusion of Computers and Telecommunications in the 1990s, Harvard Business School Press, Boston, 3-32. BRYNJOLFSSON, E. AND L. HITT, (1996). Paradox Lost? Firm-level Evidence on the Returns to Information Systems Spending, Management Science, 42 (4), 541-559. CAMPBELL, D.T. (1960). Recommendations for APA Test Standards Regarding Construct, Trait, Discriminant Validity, American Psychologist, 15, 546-553.
Authors: Detmar W. Straub, Peter Weill, Kathy Stewart Schwaig
32
CASH, J.I., F.W. MCFARLAN, J.L. MCKENNEY AND L.M. APPLEGATE (1992). Corporate Information Systems Management: Text and Cases, Irwin, Burr Ridge, Illinois,. CHIN, W.W. (1998). The Partial Least Squares Approach to Structural Equation Modeling, In G. A. Marcoulides (Ed.), Modern Methods for Business Research, London, 295-336. CHIN, W.W., MARCOLIN, B.L., AND NEWSTED, P.R. (2003). A Partial Least Squares Latent Variable Modeling Approach for Measuring Interaction Effects: Results from a Monte Carlo Simulation Study and an Electronic-Mail Emotion/Adoption Study, Information Systems Research, 14 (2), 189-217. CLEMONS, E.K. (1991). Evaluation of Strategic Investments in Information Technology, Communications of the ACM, 34, 1 24-36. CLEMONS, E.K. AND M.C. ROW (1991). Sustaining IT Advantage: The Role of Structural Differences, MIS Quarterly, 15, 3 275-292. COHEN, J. (1988). Statistical Power Analysis for the Behavioral Sciences, (2nd ed.) L. Erlbaum Associates, Hillsdale, NJ. COHEN, P., J. COHEN, J. TERESI, M. MARCHI AND C.N. VELEZ (1990). Problems in the Measurement of Latent Variables in Structural Equation Causal Models, Applied Psychological Measurement, 14, 183-196. CONOVER, W.J., AND R. L. IMAN. (1981), Rank Transformations As a Bridge Between Parametric and Nonparametric Statistics, The American Statistician, 35(3), 124-133. CRON, W.L. AND M.G. SOBOL (1983). The Relationship Between Computerization and Performance: A Strategy for Maximizing the Benefits of Computerization, Journal of Information Management, 6, 171-181. DEAVERS, K.L. (1997). Outsourcing: A Corporate Competitiveness Strategy: Not a Search for Low Wages, Journal of Labor Research, 18 (4), 503-520. De WIT, K, ; VERHOEVEN, J.C. (2000), Stakeholder in Universities and Colleges in Flanders, European Journal of Education, 35 (4) 421-437. DIAMANTOPOULOS, ADAMANTIOS AND HEIDI M. WINKLHOFER (2001). Index Construction with Formative Indicators: An Alternative to Scale Development, Journal of Marketing Research, 38 (2), 269-277. DIBBERN, J., T. GOLES, R. HIRSCHHEIM, AND B. JAYATILAKA (2004). Information Systems Outsourcing: A Survey and Analysis of the Literature, The DATA BASE for Advances in Information Systems, 35 (4), 6-102. DIROMUALDO, A. AND V. GURBAXANI (1998). Strategic Intent for IT Outsourcing, Sloan Management Review, 39, 4 67-80. DRTINA, R.E. (1994). The Outsourcing Decision, Management Accounting, 75 (9), 56-62. EDWARDS, E.A. AND R. BAGOZZI (2000). On the Nature and Direction of Relationships between Constructs and Measures, Psychological Methods, 5 (2), 155-174.
Authors: Detmar W. Straub, Peter Weill, Kathy Stewart Schwaig
33
FITZGERALD, G. AND L. WILLCOCKS (1993). Information Technology Outsourcing Practice: A U.K. Survey, Business Intelligence, London. FLOYD, S.W. AND B. WOOLRIDGE (1990). Path Analysis of the Relationship Between Competitive Strategy, Information Technology, and Financial Performance, Journal of Management Information Systems, 47-64. FORNELL, C.R. AND F.L. BOOKSTEIN (1982). Two Structural Equation Models: LISREL and PLS Applied to Consumer Exit-Voice Theory, Journal of Marketing Research, 19 (4), 440-452. FORNELL, C. AND D. LARCKER (1981). Evaluating Structural Equation Models with Unobservable Variables and Measurement Error, Journal of Marketing Research, 18, 39-50. GEFEN, D., D. STRAUB AND M-C. BOUDREAU (2000). Structural Equation Modeling and Regression: Guidelines for Research Practice, Communications of AIS, 7 (7), 1-78. GERBING, D.W. AND J.C. ANDERSON (1988). An Updated Paradigm for Scale Development Incorporating Unidimensionality and Its Assessment, Journal of Marketing Research, 25, 186-192. GROVER, V., M.J. CHEON AND J.T.C. TENG (1996). The Effect of Service Quality and Partnership on the Outsourcing of Information Systems Functions, Journal of Management Information Systems, 12 (4), 89-116. GROVER, V. AND J. TENG AND M.J. CHEON (1998). Towards a Theoretically-based Model of Information Systems Outsourcing, In Strategic Source of Information Systems: Perspective and Practices, Willcocks, L.P. and Lacity, M (eds) NY: Wiley. HARRIS, S.E., AND KATZ, J.L. (1991). Organizational Performance and Information Technology Investment Intensity in the Insurance Industry, Organization Science, 2, 3 263-295. HITT, L.M. AND E. BRYNJOLFSSON (1996). Productivity, Business Profitability, and Consumer Surplus: Three Different Measures of Information Technology Value, MIS Quarterly, 20 (2), 121-142. HURLEY, M. AND J. RUNDELL (1997). The IT Outsourcing Imperative: Intelligently Managing the Inevitable Decision, KPMG Report, Australia. IVES, B. AND G. LEARMONTH (1984). The Information System as a Competitive Weapon, Communications of the ACM, 27 (12), 1193-1201. INSINGA, R.C. AND M.J. WERLE (2000). Linking Outsourcing to Business Strategy, Academy of Management Executive 14 (4), 59-61. KAPLAN, R. AND D. NORTON (1992). The Balanced Scorecard - Measures that Drive Performance, Harvard Business Review, 70, 1 71-79. KERN, T. AND L.P. WILLCOCKS (2002). Service Provision and the Net: Risky Application Sourcing? In Information Systems Outsourcing: Enduring Themes, Emergent Patterns, and Future Directions, Hirschheim, R., Heinzl, A. and Dibbern, J. (eds.), Heidelberg: Springer. KETLER, K. and J. WALSTROM (1993), The Outsourcing Decision, International Journal of Information Management, 13 (6), 449-460.
Authors: Detmar W. Straub, Peter Weill, Kathy Stewart Schwaig
34
Labovitz, S. (1970). The Assignment of Numbers to Rank Order Categories. American Society Review 35, 515–524. LACITY, M. AND R. HIRSCHHEIM (1993). Information Systems Outsourcing Myths, Metaphors, and Realities, John Wiley & Sons, Ltd., New York. LACITY, M. (1995). IT Outsourcing: Maximize Flexibility and Control, Harvard Business Review, 84-93. LACITY, M. AND R. HIRSCHHEIM (1995). Beyond the Information Systems Outsourcing Bandwagon: The Insourcing Response, John Wiley and Sons, New York, NY. LACITY, M., R. HIRSCHHEIM AND L. WILLCOCKS (1994). Realizing Outsourcing Expectations, Information Systems Management, 11 (4), 7-18. LACITY, M.C. AND L.P. WILLCOCKS (1998). An Empirical Investigation of Information Technology Sourcing Practices: Lessons from Experience, MIS Quarterly, 22, 363-408. LACITY, M.C., L.P. WILLCOCKS AND D.F. FEENY (1996). The Value of Selective IT Sourcing, Sloan Management Review, 37 (3), 13-25. LACITY, M.C., L.P. WILLCOCKS (2001). Global Information Technology Outsourcing: In Search of Business Advantage, Wiley, Chicester, UK.
LEVER, SCOTT (1997), An Analysis of Managerial Motivations Behind Outsourcing Practices in Human Resources, Human Resource Planning Society, 20 (2). LOH, L. AND N. VENKATRAMAN (1992). Diffusion of Information Technology Outsourcing: Influence Sources and the Kodak Effect, Information Systems Research, 3 (4), 334-378. LUCAS, H.C. AND J. BAROUDI (1994). The Role of Information Technology in Organization Design, Journal of Management Information Systems, 10 (4), 9-23. MARKUS, L.M. AND C. SOH (1993). Banking on Information Technology: Converting IT Spending into Firm Performance, In R.D. Banker, R.J. Kauffman and M.A. Mahmood (Ed.), Strategic and Economic Impacts of Information Technology Investment: Perspectives on Organizational Growth and Competitive Advantage, Idea Group Publishing, Middletown, PA, 364-392. MATHIESON, K., E. PEACOCK, AND W.W. CHIN (2001). Extending the Technology Acceptance Model: The Influence of Perceived User Resources, The DATA BASE for Advances in Information Systems, 32 (3), 86-112. MCFARLAN, F.W. AND R.L. NOLAN (1995). How to Manage an IT Outsourcing Alliance, Sloan Management Review, 36 (2), 9-23. NAM, K.S., H. RAJAGOPALAN, R. RAO AND A. CHAUDHURY (1996). A Two-Level Investigation of Information Systems Outsourcing, Communications of the ACM, 39 (7), 36-44. NUNNALLY, J.C. AND I.H. BERNSTEIN (1994). Psychometric Theory, McGraw-Hill, New York. PAGNONCELLI, D. (1993), Managed Outsourcing: A Strategy for a Competitive Company in the 1990s Management Decision 31 (7), 15-22. PFEFFER, J. AND G.R. SALANCIK (2003). The External Control of Organizations: A Resource Dependency Perspective Stanford University Press Originally published: New York: Harper & Row (1978).
Authors: Detmar W. Straub, Peter Weill, Kathy Stewart Schwaig
35
PORTER, M.E. AND V.E. MILLAR (1985). How Information Gives You a Competitive Advantage, Harvard Business Review, 149-160. PRAHALAD, C.K. (1993). The Role of Core Competencies in the Corporation, Research-Technology Management, 36 (6), 40-47. PRAHALAD, C.K. AND G. HAMEL (1990). The Core Competence of the Corporation, Harvard Business Review, 68 (3), 79-91. QUINN, J.B. AND F.G. HILMER (1994). Strategic Outsourcing, Sloan Management Review, 35 (4), 43-55. RADOSEVIC, S. (1999):, Patterns of Innovative Activities in Countries of Central and Eastern Europe: An Analysis Based on Comparison of Innovation Surveys, Science Policy Research Unit, Working Paper, Brighton: University of Sussex, No.34. RICHMOND, W.B., A. SEIDMANN AND A.B. WHINSTON (1992a). Incomplete Contracting Issues in Information Systems Development Outsourcing, Decision Support Systems, 8 (5), 459-477. RICHMOND, W.B., A. SEIDMANN AND A.B. WHINSTON (1992b). Contract Theory and Information Technology Outsourcing, Decision Support Systems, 8 (5), 459-477. SCARBROUGH, H. (1995). Blackboxes, Hostages and Prisoners, Organization Studies, 16 (6), 991-1019. SCHARY, P.B. AND J. COAKLEY (1991). Logistics Organization and the Information System, International Journal of Logistics Management, 2 (2), 22-29. SETHI, V. AND W. KING (1994). Development of Measures to Access the Extent to Which An Information Technology Application Provides Competitive Advantage Management Science 40 (12), 1601-1627. SHARMA, S., R.M. DURAND, AND O. GUR-ARIE (1981). Identification and Analysis of Moderator Variables, Journal of Marketing Research, 18, 291-299. SMITH, H.J., D. STODDARD AND L. APPLEGATE (1987). Manufacturers Hanover: The New Organization A, B and C (9-189-051), Harvard Business School Press. SMITH, M.A., S. MITRA AND S. NARASIMHAN (1998). Information Systems Outsourcing: A Study of Pre-Event Firm Characteristics, Journal of Management Information Systems, 15 (2), 61-93. STRAUB, D.W., M.-C. BOUDREAU, AND D. GEFEN (2004). Validation Guidelines for IS Positivist Research, CAIS, 13 (24), 380-427. STRAUB, D.W. AND WELKE, R.J. (1998). Coping With Systems Risk: Security Planning Models For Management Decision Making. MIS Quarterly, 22 (4), 441-469. TAKAC, P. (1994), Outsourcing: a key to Controlling Escalating Costs?’ International Journal of Technology Management, 2, 139-155. TENG, J.T.C., M.J. CHEON AND V. GROVER (1995). Decisions to Outsource Information Systems Functions: Testing a Strategy-Theoretic Discrepancy Model, Decision Sciences, 26 (1), 75-103.
Authors: Detmar W. Straub, Peter Weill, Kathy Stewart Schwaig
36
THOMPSON, R., D.W. BARCLAY, AND C.A. HIGGINS (1995). The Partial Least Squares Approach to Causal Modeling: Personal Computer Adoption and Use as an Illustration, Technology Studies: Special Issue on Research Methodology, 2 (2), 284-324. ULSET, S. (1996). R&D Outsourcing and Contractual Governance: An Empirical Study of Commercial R&D Projects, Journal of Economic Behavior & Organization, 30 (1), 63-82. WEILL, P. (1992). The Relationship between Investment in Information Technology and Firm Performance: A Study of the Valve Manufacturing Sector, Information Systems Research, 3 (4), 307-333. WEILL, P. AND M. BROADBENT (1998). Leveraging the New Infrastructure: How Market Leaders Capitalise on Information Technology, Harvard Business School Press, Cambridge, MA. WILLCOCKS, L. AND G. FITZGERALD (1993). A Business Guide to Outsourcing IT: A Study of European Best Practice in the Selection, Management, and Use of IT Services, Business Intelligence, London, UK. WILLCOCKS, L. AND M. LACITY (1998). Strategic Sourcing of Information Systems: Perspectives and Practices, John Wiley & Songs, New York, NY. WILLCOCKS, L. AND M. LACITY (2001), Global Information Technology Outsourcing - In Search of Business Advantage, John Wiley & Sons, New York, NY. WILLIAMS, K. (1997). Has Your Company Outsourced Yet? Management Accounting, 78 (9), 14. ZAMPATAKIS, H. (1997). Why Bendigo Went Back in House, The Australian Financial Review, February 6.
Copyright © 2022 FDOKUMEN