STRA02200704001.pdf - Homi Bhabha National Institute
223
INFORMATION TECHNOLOGY AND KNOWLEDGE ENGINEERING CENTRIC KNOWLEDGE MANAGEMENT: A MATURITY MODEL BASED ON KEY MATURITY INDICATORS By K.K.KURIAKOSE STRA02200704001 INDIRA GANDHI CENTRE FOR ATOMIC RESEARCH, KALPAKKAM A thesis submitted to the Board of Studies in Strategic Studies In partial fulfillment of requirements for the Degree of DOCTOR OF PHILOSOPHY of HOMI BHABHA NATIONAL INSTITUTE July, 2014
-
Upload
khangminh22 -
Category
Documents
-
view
3 -
download
0
Transcript of STRA02200704001.pdf - Homi Bhabha National Institute

INFORMATION TECHNOLOGY AND KNOWLEDGE ENGINEERING
CENTRIC KNOWLEDGE MANAGEMENT: A MATURITY MODEL
BASED ON KEY MATURITY INDICATORS
By
K.K.KURIAKOSE
STRA02200704001
INDIRA GANDHI CENTRE FOR ATOMIC RESEARCH, KALPAKKAM
A thesis submitted to the
Board of Studies in Strategic Studies
In partial fulfillment of requirements
for the Degree of
DOCTOR OF PHILOSOPHY
of
HOMI BHABHA NATIONAL INSTITUTE
July, 2014


DEDICATIONS
This Thesis is dedicated to
The Almighty
My parents
My parents-in-law
My Family
My relatives
My teachers & superiors
My colleagues
My friends
And
To the global knowledge sharing community
Whose combined knowledge and wisdom guided me

ACKNOWLEDGEMENTS
This thesis is prepared with the support and blessings of many well-wishers. The
foremost among them is my research guide Dr. Baldev Raj, former Director, Indira
Gandhi Centre for Atomic Research(IGCAR), Kalpakkam. From the day he had agreed
to be my guide, till this day, he has been a source of constant encouragement, guidance
and advice, in spite of his extremely busy schedule and I express my heartfelt gratitude
for the same. I am extremely grateful to Dr. T. Jayakumar, Dean Engineering Sciences,
HBNI, who has been my research guide after the retirement of Dr. Baldev Raj, for his
advice, guidance and encouragement. I am also indebted to Shri S. C. Chetal, former
Director, IGCAR and Dr. P.R.Vasudeva Rao, Director, IGCAR for the kind support
extended to complete this research and the thesis. I am extremely grateful to Shri
S.A.V.Satya Murty, Director, EIRSG for the advice, guidance and all the support that
was provided to complete the course requirements and the thesis. I am also grateful to
Dr. P Swaminathan, former Director, EIG and Shri S. Athinarayanan, former Head
Computer Division for the advice, guidance and support.
I am greatly indebted to various professors of IIT, Madras: Prof. L.S.Ganesh,
Prof. Sanghamitra Bhattacharyya, Prof. L. Prakash Sai, Prof. T.J. Kamalanabhan and
Prof. S. Bharadhwaj for their help to complete my course requirements.
I am extremely grateful to Dr. K. Gopalakrishnan and Dr. J. Ajith Kumar, former
research scholars of IIT Madras, who have taught me the fundamentals of knowledge
management and whole heartedly shared their literature collection. I am also grateful to
them for sparing their valuable time for the periodical discussions and advice.

I am extremely grateful to Dr. M. Sai Baba, Chairman, Doctoral Committee and
members of Doctoral Committee, Dr. B.P.C Rao and Dr. U.Kamachi Mudali for their
guidance and encouragement. I am highly indebted to Dr.B.P.C Rao for his painstaking
efforts in reviewing the draft thesis, and his valuable advice in improving the quality of
the thesis.
I am grateful to my colleagues Smt. R.Malathi, Shri V.Parameswaran and Shri B.
Subba Raju, for their help in conducting the field work and data analysis and Smt.
H.Seetha and Smt. Bindu Sankar for their help in publications. I am also grateful to Dr.
Subhra Rani Patra, former Research Associate, IGCAR for the valuable discussions. I
express my sincere gratitude to Dr. Pankaj Metha, IGCAR for the valuable advice on
language quality. I also express my gratitude to my colleagues V.Sivasankar, D.
Thirupurasundari, P.Karuthapandian, Ibrahim Khan, V.Srinivasa Rao, M.Uma
Maheshwari, T.Ramachandran, S.N.Srinivasan, S.Venkatesan, P.Solairaj, K.Rajesh,
A.Boopalan, V.Balu, N.Radhakrishnan, R. Nandakumar and N.Sathiskumar for their
help during the preparation of the thesis. I am extremely grateful to all my colleagues of
Computer Division who have helped me in different ways to complete this research and
thesis. I am also indebted to my colleagues of IGCAR who have spared their valuable
time for discussions and completing the questionnaire. I am unable to acknowledge
them individually as the number is very large. I gratefully acknowledge the support
received from Smt. Rama Srinivasan for typing the thesis and Kum. P. Krishnaveni for
the assistance in xeoxing.
Last but not the least I acknowledge my family members- my wife Smt. Gemma
Kuriakose, my children Shri Gejoy Kuriakose and Shri Ajay Kuriakose, for their
sacrifice and encouragement.

i
SYNOPSIS
KEYWORDS: Knowledge Management, Maturity Model, Inhibiting Factors,
Information Technology, Knowledge Engineering
Knowledge management (KM) aims to create wealth and value by providing
organisational entities, the right knowledge, at the right place and at the right time. KM
has proven benefits and has been adopted by 80% of the world’s biggest companies.
Knowledge management maturity model describes the development of KM over time. It
provides a roadmap for successful KM implementation. The objective of the thesis is to
develop a flexible and adaptable KM maturity model and demonstrate its utility in the
context of a government controlled nuclear research and development (R&D)
organisation. This model is the core contribution of this thesis to the literature in KM.
Vast amount of nuclear knowledge has been created and accumulated through decades
of R&D and operational experience. This knowledge is of paramount importance for the
continued use of existing nuclear installations and future innovations. Unfortunately the
present status of nuclear knowledge and its management still remain in an unsatisfactory
condition. It is in this organisational context that the development of a KM maturity
model was undertaken.
The thesis presents a detailed review of KM literature covering various facets such as
people, process, technology, knowledge, return on investment, critical success factors
and evolution of KM. Detailed study of the existing KM maturity models and the
morphological analysis carried out is discussed. The context of the nuclear R&D

ii
organisation, where the knowledge management maturity model was demonstrated, is
discussed. Also the complexities of nuclear KM and R&D KM are discussed. A new
KM maturity model, proposed is discussed. The application and validation of this
model through a case study is discussed. The maturity level of the organisation and its
ten subunits were assessed, through the case study. The inhibiting factors of the
organisation and its subunits were identified through a survey. Flexibility of the
proposed model and its adaptability to other organizations have demonstrated and
evaluated by expert judgment. The process of knowledge creation in the organisational
context in general and one subunit of the organisation in particular was studied. The
concept of ba which is the context for knowledge creation, and a new framework for ba
based on SECI model that was developed are discussed. The ba structure based on the
organisational units and a taxonomy pertaining to the knowledge of the subunit that was
developed are described. The conclusions, contributions, recommendations and scope
for further work are discussed.

iii
CONTENTS
Page No.
SYNOPSIS..………......………….…………………………………………………..….…….……....i
LIST OF FIGURES ..………..……………..………………………………..…………...............…vii
LIST OF TABLES..………..………………………………………………………………..…….....ix
ABBREVIATIONS ….…..……………. ……………………………………….…………..……....xi
CHAPTER 1 INTRODUCTION TO KNOWLEDGE MANAGEMENT………...…...….......1
1.1 CLASSIFICATION OF KNOWLEDGE………………………………………….……………1
1.1.1 Explicit and Tacit Knowledge…………………………………………………...…….1
1.1.2 Core advanced and Innovative Knowledge ….…………………………………...…...2
1.2 KNOWLEDGE MANAGEMENT…….…………………………...……………...……...…....2
1.3 EVOLUTION OF KNOWLEDGE MANAGEMENT……………………..………....……….4
1.4 ENABLING FACTORS OF KNOWLEDGE MANAGEMENT.…...…………………..……..6
1.5 KEY AREAS OF KNOWLEDGE MANAGEMENT ..……………..………………….…...11
1.5.1 Knowledge..….………..…………………………….…………………...…….........12
1.5.2 Process ……..…………………………….…………….……………….…......…….12
1.5.2.1 Knowledge Creation…….…………………..….………………..…....…..12
1.5.2.2 Knowledge Sharing…………….…….……….….……......……………....16
1.5.2.3 Knowledge Utilization………………….…….…………………..…….....17
1.5.3 Return On Investment.….…….….….………………….………………..….....….....17
1.5.4 People……………….……………….………………….………..……………….....19
1.5.4.1 Knowledge Sharing Culture.………………...….……..…………………..19
1.5.4.2 Co-opetition .……..………………….……….….……..……...……….....21
1.5.4.3 Leadership……………………………….……………..……………….....22
1.5.4.4 People Centric KM.…………………….…………...………………….....23
1.5.5 Technology…………….…………….……………………………...…………….....23
1.5.5.1 IT and KE Centric KM..……………………….……………………….....25
1.5.6 People and Technology..…………….…...……………………………………….....28
1.6 KNOWLEDGE MANAGEMENT MATURITY MODELS………………..….……...…...…29
1.6.1 General Characteristics...…………….…………………..…………….………........30
1.6.2 Existing Models……..……………….………………….…………………….….....32
1.7 THE CONTEXT OF NUCLEAR R&D ORGANISATION……………...…..…..…….……36
1.7.1 Nuclear Knowledge Management…….……………………....…….………………36
1.7.2 R&D Knowledge Management…………………………………...………………...41
1.8 RESEARCH MOTIVATION…..……………………………………….……...…...………...43
1.9 RESEARCH OBJECTIVES……..…………………………....……….…………...…………44

iv
1.10 RESEARCH METHODOLOGY………………………………………….….…………….…45
1.11 OVERVIEW OF THE THESIS...……...………………………………….……………..……46
CHAPTER 2 MORPHOLOGICAL ANALYSIS OF KNOWLEDGE MANAGEMENT
MATURITY MODELS ………………………………...……….........…..…..…47
2.1 MORPHOLOGICAL ANALYSIS…………………………...……………………..…...........47
2.1.1 Dimensions and Options…………………………………………………....…..48
2.1.2 Discussions and Contributions………………………………………….………55
2.2 SUMMARY……………………………...……………………………………………....……57
CHAPTER 3 DEVELOPMENT OF KMI – KMM MODEL…………...…….…….…............58
3.1 CHARACTERISTICS OF KNOWLEDGE MANAGEMENT MATURITY MODELS…....58
3.2 THE PROPOSED KNOWLEDGE MANAGEMENT MATURITY MODEL..……...............66
3.2.1 Key Areas…………………………...…………………………………..............68
3.2.2 Key Parameters………………………………………….……………..…...…...69
3.2.2.1 ‘People’ Key Parameters……….…………………………………………69
3.2.2.2 ‘Process’ Key Parameters…………………………………………………70
3.2.2.3 ‘Technology’ Key Parameters…………….………………………………71
3.2.2.4 ‘Knowledge’ Key Parameters….…….……………………………………72
3.2.2.5 ‘RoI’ Key Parameters….………….………………………………………72
3.2.3 Key Values……………………………………………………………………...75
3.2.4 Maturity Levels and Maturity Indicators…………………………….……........75
3.2.4.1 Level 0: Default…………………...…………………………………..76
3.2.4.2 Level 1: Initial………………….. ………………………………….…77
3.2.4.3 Level 2: Qualitative Development………………...…………………..78
3.2.4.4 Level 3: Quantitative Development..……...…………………………..80
3.2.4.5 Level 4: Maturity………………………….…………………………..82
3.2.4.6 Level 5: Extended Organisational Maturity………….………………..84
3.3 FLEXIBILITY OF THE MODEL…………………………...………………………..……....88
3.4 ASSESSMENT METHODOLOGY……...……………………………………………...........94
3.5 UNIQUE FEATURES OF THE MODEL…………………….……………............................94
3.6 VALIDATION METHODOLOGY..……………………...………………..………...............96
3.7 FEEDBACK AND EXPERT OPINION………………………..…………………..................97
3.8 SUMMARY…….…………………………...…………………...…………………....………99
CHAPTER 4 DEMONSTRATION OF THE KMI – KMM MODEL IN THE
CONTEXTOF A NUCLEAR R&D ORGANISATION…………………….…100
4.1 ORGANISATIONAL CONTEXT……………………...…………………………..…...…..100
4.1.1 GROUPS AND ACTIVITIES………………………………………………….101
4.2 ORGANISATIONAL STUDY……...………...……………………………………..…..…..105
4.2.1 Research Methodology…………...……………………………….......... .........106

v
4.2.2 Pilot Study……………………………………………………………………..106
4.2.3 Detailed Study…….….…………………….………….……………….……..106
4.2.3.1 Maturity Level Assessment………..………………………...………....107
4.3 ANALYSIS……………………………………………………….………………..…...…....109
4.3.1 Groups…………………………………………………………………….…....109
4.3.2 Organisation………………………………………………………………........120
4.4 ADAPTABILITY OF THE MODEL….………...………………….………….....................121
4.4.1 Organisation A…………….......………………………………………..……..121
4.4.2 Organisation B……….……………………………………………...................123
4.4.3 Discussion…………………..………………………………………………….125
4.5 VALIDATION……………………………….………………………………………...…….125
4.5.1 Construct Validity………………….…...…………………………...................125
4.5.2 External Validity…………………….…...…………………………….…...….125
4.5.3 Reliability…………………………………………………………………...….126
4.6 OBJECTIVITY OF DATA.………………………………………………………..……..….126
4.7 SUMMARY………………………………………….……………………………..……......128
CHAPTER 5 IDENTIFICATION OF INHIBITING FACTORS FOR KM MATURITY
IN THE CONTEXTOF A NUCLEAR R&D ORGANISATION..….…….…129
5.1 INHIBITING FACTORS………….…………………………………………………..........129
5.2 PARTICIPANT PROFILE…………………...……………………………………..…..…..133
5.2.1 Participation………….……………………………………………...................133
5.2.2 Demographic Variables…..……………..………….. .………………………..134
5.3 ANALYSIS…………………….…...………………………………………...………...…..142
5.3.1 Groups………………………. …....……………………………………………..142
5.3.2 Organisation..……………...……………………………………………………..153
5.4 DISCUSSION……………..….……………………………………………..………….…....155
5.5 SUMMARY…………………...………………………..…………….…………...................156
CHAPTER 6 KNOWLEDGE CREATION AND Ba:A STUDY..…..…………….………....157
6.1 INTRODUCTION……….…………………………………..………………..……….…......157
6.2 SECI Ba........................................................................................... …....................................159
6.3 TYPES OF Ba IN THE ORGANISATIONAL CONTEXT…….…… ……..........................160
6.4 KNOWLEDGE CREATION IN GROUP G9…………….……….……………..……...…..162
6.5 KNOWLEDGE CLASSIFICATION IN GROUP G9…….…….………………….....……..164
6.6 SUMMARY………………………………………………………….………………..…..…171
CHAPTER 7 SUMMARY AND RECOMMENDATIONS…..…….…….……….….……...172
7.1 RESEARCH OBJECTIVES………………………… ………….…………………...….….172
7.2 RESEARCH METHODOLOGY………….…………………………………….…..…….…172

vi
7.3 ANALYSIS AND FINDINGS…………….…………………………………….…..…........173
7.4 RECOMMENDATIONS………………..…………… …………………………...…...……174
7.4.1 People……………………....……………….……………………….................174
7.4.2 Process…………………………………………………………………............175
7.4.3 Technology………………………………….……………………….................176
7.4.4 Knowledge……………………………………………………………………..176
7.4.5 Return on Investment…………………… .………………………….…..…..176
7.4.6 Enabling Factors………………………… .……………………………....…..177
7.4.7 Procedure for KM Activities……………………………………………….......177
7.5 CONTRIBUTIONS…………………….……………………………………………… …....178
7.6 CONCLUSION……………………………………...………………………….…..…..……178
CHAPTER 8 FUTURE WORK………………….…………………………….……… .……...180
APPENDIX A
EXPERT OPINION ON KMI-KMM MODEL………….………………....……………....……..182
APPENDIX B
QUESTIONNAIRE - SEMI STRUCTURED INTERVIEW –(PILOT STUDY)……....…..……..186
APPENDIX C
QUESTIONNAIRE- FOCUS GROUP DISCUSSION………………………………………...…188
APPENDIX D
QUESTIONNAIRE –INHIBITING FACTORS……….…………………….…......……...............189
APPENDIX E
QUESTIONNAIRE -SEMISTRUCTURED INTERVIEW AT GROUP G9 ……………...….....192
REFERENCES…………………………………………………………….….…………..……......193

vii
LIST OF FIGURES
Figure No. Page No.
1.1 Four Types of Ba….......................... ……......................................................................15
1.2 Typical KM Portal............................................................................................................24
1.3 Knowledge Transfer through the Phases of a NPP Life Cycle.…...................................38
1.4 The First Two Levels of Fast Reactor Taxonomy............................................................39
3.1 KMM Model Development Process.................................................................................67
3.2 Key Areas.……………….…………………………………………….………………..68
3.3 Maturity Levels and Key Maturity Indicators….............................................................87
3.4 Key Areas and Maturity Levels of KMIX-KMM Model…..……….………………..…89
3.5 Maturity Levels and Maturity Indicators of KMIY-KMM Model..……………………93
4.1 KM Maturity of Group G1.............................................................................................110
4.2 KM Maturity of Group G2.............................................................................................111
4.3 KM Maturity of Group G3.............................................................................................112
4.4 KM Maturity of Group G4.............................................................................................113
4.5 KM Maturity of Group G5.............................................................................................114
4.6 KM Maturity of Group G6.............................................................................................115
4.7 KM Maturity of Group G7.............................................................................................116
4.8 KM Maturity of Group G8.............................................................................................117
4.9 KM Maturity of Group G9.............................................................................................118
4.10 KM Maturity of Group G10...........................................................................................119
4.11 KM Maturity of the Organisation..................................................................................120
4.12 KM maturity of ORGA…………………………………………………………..……123
4.13 KM maturity of ORGB……………..….…………………….………………………..124
5.1a Type of Work (Organisation).........................................................................................135
5.1b Type of Work (Groups)..................................................................................................135
5.2a Qualification (Organisation)..........................................................................................136
5.2b Qualification (Groups)...................................................................................................136
5.3a Discipline (Organisation)...............................................................................................137
5.3b Discipline (Groups)........................................................................................................137

viii
5.4a Grade (Organisation).....................................................................................................138
5.4b Grade (Groups)..............................................................................................................138
5.5a Service (Organisation)...................................................................................................139
5.5b Service (Groups)............................................................................................................139
5.6a Age (Organisation)........................................................................................................140
5.6b Age (Groups).................................................................................................................140
5.7a Gender (Organisation)...................................................................................................141
5.7b Gender (Groups)............................................................................................................141
6.1 SECI Ba.........................................................................................................................159
6.2 Types of Ba Based on Organisational Units..................................................................160
6.3 Integration of Ba............................................................................................................162
6.4 Taxonomy of Reactor Knowledge.................................................................................169

ix
LIST OF TABLES
Table No. Page No.
1.1 The Structure of Two Top Levels of The Topic Stage Matrix........................................40
2 .1 Morphological analysis of 15 KMM Models Analysed…...............................................52
2.2 Morphological Box ..........................................................................................................56
3.1 Characteristics of 15 KMM Models Studied....................................................................59
3.2 Key Parameters……….....................................................................................................73
3.3 KMI for Level-0,1 & 2…….............................................................................................80
3.4. KMI for Level-3 & 4…………………............................................................................85
3.5 Maturity Levels and Key Maturity Indicators…………. ................................................86
3.6 Key Ares and Key Parameters of KMIX-KMM Model.……………….………………88
3.7 Maturity Levels and Key Maturity Indicators of KMIX-KMM Model…...……………90
3.8 Key Parameters of KMIY-KMM Model……….…………………...…………………..91
3.9 Maturity Levels and Maturity Indicators of KMIY-KMM Model…....………………..92
3.10 Features of KMI-KMM Model as Strengths of Other Models………….……………..96
3.11 Comparison of Expert Opinions on KMI-KMM Model……...………...………………98
4.1 Groups and Activities………………………………………………...……………….101
4.2 Key Maturity Indicators for Groups ..............................................................................108
4.3 Maturity Level of Groups and Organisation……………………………….……….....109
4.4 Key Maturity Indicators for Groups of ORGA…………….……….…….…...............122
4.5 Maturity Levels for Groups and ORGA........................................................................122
4.6 Key Maturity Indicators for Groups of ORGB…………………….……………….…124
4.7 Maturity Levels for Groups of ORGB…………………………….…..………………124
4.8 Maturity Levels of Groups and Organisation with G2 highlighted…..…….………….127
4.8A Maturity Levels of Groups and Organisation without G2………………….………….128
5.1 Inhibiting Factors of Groups…………………………………………………………...131
5.2 Participants from Groups……........................................................................................133
5.3 Employees and Participants………………………………………………………........134
5.4 Demographic Variables of the Population……………………………..........................142
5.5 Inhibiting Factors of Group G1………………………………………………………..143
5.6 Inhibiting Factors of Group G2......................................................................................144

x
5.7 Inhibiting Factors of Group G3.....................................................................................145
5.8 Inhibiting Factors of Group G4…….............................................................................146
5.9 Inhibiting Factors of Group G5.....................................................................................147
5.10 Inhibiting Factors of Group G6.....................................................................................148
5.11 Inhibiting Factors of Group G7.....................................................................................149
5.12 Inhibiting Factors of Group G8.....................................................................................150
5.13 Inhibiting Factors of Group G9.....................................................................................151
5.14 Inhibiting Factors of Group G10...................................................................................152
5.15 Inhibiting Factors of the Organisation……………………...........................................153
5.16 Frequency distribution of Most Predominant Inhibiting Factors…….…….………….154
6.1 Reactor Systems and Sub Systems………………………………………………….....164

xi
ABBREVIATIONS
AI Artificial Intelligence
APQC American Productivity and Quality Centre
BSC Balanced Score Card
CKO Chief Knowledge Officer
CMM Capability Maturity Model
CMMI Capability Maturity Model Integration
DSS Decision Support Systems
EDP Electronic Data Processing
EIM Enterprise Information Management
FAQ Frequently Asked Questions
FBTR Fast Breeder Test Reactor
FR-KOS Fast Reactor Knowledge Organisation System
IAEA International Atomic Energy Agency
ICT Information and Communication Technology
IEEE Institution of Electrical and Electronics Engineers
IKMS Information and Knowledge Management System
IM Information Management
IMS Information Management Systems
IT Information Technology
KA Key Areas
KBS Knowledge-Based Systems

xii
KE Knowledge Engineering
KM Knowledge Management
KMCA Knowledge Management Capability Assessment
KMI Key Maturity Indicators
KMM Knowledge Management Maturity
KMS Knowledge Management System
KP Key Parameters
KPQ Knowledge Process Quality
KV Key Values
MIS Management Information System
NPP Nuclear Power Plant
RoI Return on Investment
R&D Research and Development
SECI Socialization Externalization Combination Internalization
WWW World Wide Web
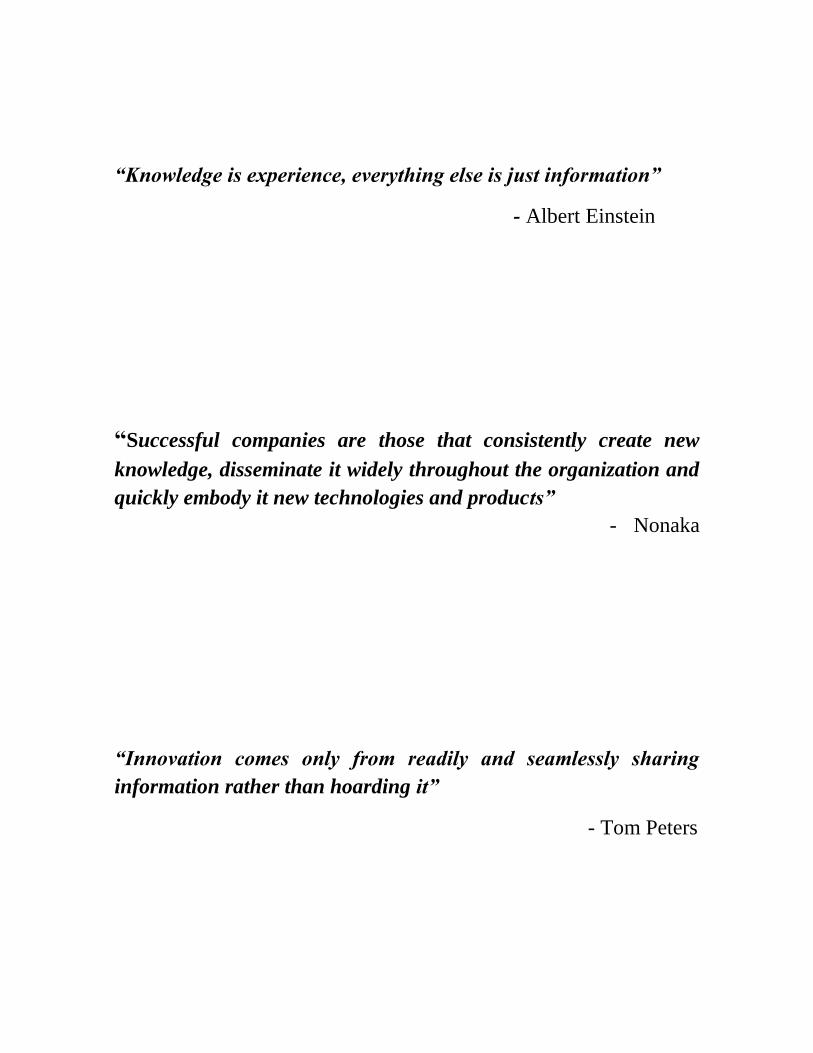
“Knowledge is experience, everything else is just information”
- Albert Einstein
“Successful companies are those that consistently create new
knowledge, disseminate it widely throughout the organization and
quickly embody it new technologies and products”
- Nonaka
“Innovation comes only from readily and seamlessly sharing
information rather than hoarding it”
- Tom Peters

CHAPTER 1
INTRODUCTION TO KNOWLEDGE MANAGEMENT
Knowledge is related to information and data. According to Ackoff (1989), data is raw. It simply
exists and has no significance beyond its existence. Information is the data that has been given
meaning by way of relational connection. In other words information is the processed data. This
"meaning" that information gives, may or may not be useful. Knowledge is the appropriate
collection of information, such that its intent is to be useful. According to this, data is a pre-
requisite for information and information is a pre-requisite for knowledge. Hence information
includes data. Also knowledge includes information and data. In other words, data and
information are subsets of knowledge.
1.1 CLASSIFICATION OF KNOWLEDGE
According to Davenport and Prusak (1998), when experience and insight are added to
information, it becomes knowledge. Knowledge is broader, deeper and richer than data or
information. Knowledge is a fluid mix of framed experiences, values, contextual information, and
expert insights that provide a framework for evaluating and incorporating new experiences and
information. Knowledge originates and is applied in the minds of people. It is embedded in
people, tasks, routines and networks. Two different classifications of knowledge are given below.
1.1.1 Explicit and Tacit Knowledge
Knowledge is basically classified into explicit knowledge and tacit knowledge. Explicit
knowledge is the knowledge that is easily expressed, captured stored and reused. In contrast, tacit
knowledge is highly personal. It is hard to formalize and therefore difficult to communicate to
others. Tacit and explicit knowledge are not separate but mutually complimentary entities. These
entities interact with each other in the creative activities of human beings. Explicit knowledge is
the articulated form of knowledge, knowledge expressed in words, documents, drawings,

2
paintings, audio, video etc.(Nonaka, 1991). Tacit knowledge is that component of knowledge
which resides in living beings, which is implicit, unconscious, personal, subjective, unstructured
and inexpressible, but it can be acted upon by indwelling and is the basis for the formation of
explicit knowledge. It is connected to values, perceptions and beliefs. The statement ‗we know
more than what we can tell‘ of Polanyi highlights the inexpressible nature of tacit knowledge
(Polanyi, 1966). However the term ‗explicit knowledge‘ is used where the knowledge is already
available explicitly in the form of documents, audio/video recordings etc. in electronic or non-
electronic form and the term ‗tacit knowledge‘ where the knowledge still resides in the minds of
people in the form of experience, feelings, opinions, intuition etc. It is possible to convert certain
percentage of the tacit knowledge into explicit by suitable knowledge elicitation methods.
1.1.2 Core Advanced and Innovative Knowledge
Zack (1999) classified knowledge into core, advanced and innovative based on the strategic
nature of the knowledge for an organisation. The core knowledge is the minimum level of
knowledge required for survival. Since it is commonly held by members of the industry, it does
not provide competitive advantage to the organisation. Advanced knowledge enables an
organisation to be competitively viable. The knowledge differentiation is achieved by the
knowledge content. Innovative knowledge enables an organisation to lead it and face competitors
by innovative methods.
1.2 KNOWLEDGE MANAGEMENT
Knowledge Management (KM) draws concepts from various disciplines like Information and
Communication Technology (ICT), Systems Science and Engineering, Information Science,
Knowledge Engineering (KE), Collaborative Engineering, Organisational Development, Change
Management, Performance Management etc. Successful organisation constantly search for better

3
ways to improve performance of the organisation. It is reported that frequent disappointment with
past management initiatives have motivated managers to gain new understanding into the
underlying, but complex mechanism such as knowledge which govern an enterprise‘s
effectiveness (Wiig, 1997). Though the importance of knowledge and its management is accepted
by academicians and practitioners, only a few firms have been successful in effectively
implementing knowledge management (Gopalakrishnan and Ganesh, 2004).
Knowledge management is the buzzword in any modern organisation, whether it is service,
manufacturing or Research and Development (R&D). Knowledge management has proven
benefits and has been adopted by 80% of the world‘s biggest companies (KPMG Consulting,
2000). KM is now being acknowledged not just as a source of wealth but as mechanism to
maintain market position, avoid failure and beat the competition (Bhara, 2001).
Knowledge management aims to create wealth and value by providing organisational entities, the
right knowledge, at the right place and at the right time. It is a conscious strategy of getting the
right knowledge to the right people at the right time and helping people share and put information
into action in ways that will improve organisational performance (APQC, 2000). The effective
utilization of knowledge by various entities results in improved skills and competencies for
decision making, performance improvement and innovations.
The most fundamental processes in KM are knowledge creation, knowledge sharing and
knowledge utilization. These processes can happen at various levels, such as, individual, group,
department, organisation, nation and global. The increase in levels results in exponentially
increasing complexities, challenges and benefits. Based on the boundary of KM processes under
consideration, different KM systems evolve viz, personal KM, group KM, departmental KM,

4
organisational KM, national KM and global KM. In most of the literature ‗KM‘ refers to
organisational KM and the same convention is followed in this thesis.
The term ‗knowledge management‘ means different things to different authors and practitioners.
Knowledge management is the process of capturing an organisation‘s collective expertise,
wherever, it resides, in databases, in paper or in people‘s heads and distributing it wherever it can
produce maximum benefits (Hibbard, 1997). The essence of this definition is ‗make available the
collective knowledge to improve performance‘. Collective knowledge can be created by
combining knowledge from various sources. The sources of knowledge could be various entities
of the organisation like employees, teams, departments, polices, procedures etc. In order to make
the collective knowledge, individual knowledge needs to be shared. The purpose of making
collective knowledge available is to improve performance.
Defining knowledge management is akin to the old fable of the blind men and the elephant where
each person touches different part of the elephant‘s body and arrives at their perception of what
the elephant looks like and really is (Bonanno, 2003). Extending the concept of Fahey and Prusak
(1998), it can be stated that, not developing a working definition of knowledge management is
another deadliest sin of KM.
1.3 EVOLUTION OF KNOWLEDGE MANAGEMENT
Knowledge management in the context of organisations can be traced to various concepts and
practices in pursuit of productivity improvement and organisational effectiveness, efficiency and
excellence. These concepts can be traced to F.W.Taylor‘s scientific management principles, and
the resultant ‗time and motion study‘ and other industrial engineering practices. According to
Taylor(1911), the principal object of management should be to secure the maximum prosperity

5
for the employer, coupled with the maximum prosperity for each employee. He argues that the
greatest prosperity can exist only as the result of the greatest possible productivity of the men and
machines of the establishment. Later the concept of ‗human relations‘ emerged out of the famous
Hawthrone Experiments of George Elton Mayo(Mayo,1933). Other concepts like ‗total quality
management‘, ‗systems thinking‘, ‗balanced score card ‘, ‗business process re-engineering‘,
‗management information system‘ and ‗knowledge management‘ were marketed as ‗magic‘
solutions to productivity improvement and other organisational problems.
According to Wiig (1997) explicit and systematic management of knowledge has emerged
naturally as a result of several developments such as changes in socio-economic and business
environment that increased the demand for knowledge based products and services, development
in ICT and Artificial Intelligence (AI), better understanding of operations research, strategic
planning, system thinking, applied cybernetics, cognitive science, and organisational behaviour.
Wiig (1997) identified the following 6 eras in the evolution of KM:
i.) Agrarian economics
ii.) Natural resource economics
iii.) Industrial revolution
iv.) Product revolution
v.) Information revolution
vi.) Knowledge revolution.
The ideas and practices of KM are as old as human civilization. For hundreds of years owners of
family business have passed their commercial wisdom on to their children, master craftsman have
painstakingly taught their trades to apprentices and workers have exchanged ideas and know how
on the job (Hanson et al., 1999). Tracing the practice of the concepts of KM, since the early

6
civilization, four different eras in the history of KM can be identified. The first era is
characterized by informal and unsystematic practices of KM, though the term KM was not in
existence at that time. The second era is characterized by formal, disciplined and systematic
practices of KM, after the introduction of the term KM. The third era is characterized by agile
practices and ‗wisdom of the crowd‘. The fourth era is characterized by adoption of Knowledge
Engineering practices with higher thrust on RoI, which is the future KM. It can be observed that
the progress from 1st to 2
nd era is driven by the realization that, systematic, explicit and
deliberate activities are necessary to derive significant benefits from KM and enabled by the
availability of information and communication technologies. The progress from 2nd
to 3rd
era is
driven by web2.0 technologies and a realization that organisations need to move from traditional
command and control to participatory approach. The progress from 3rd
to 4th
era is driven by the
desire to achieve higher benefits from KM and is enabled by AI and KE technologies. Hence, it is
obvious that technology plays the most important role in the advancement of KM.
1.4 ENABLING FACTORS OF KNOWLEDGE MANAGEMENT
Implementation of knowledge management in an organisation involves significant changes in the
organisational processes. Several studies have proposed many key variables for successful
implementation of knowledge management, which are called enabling factors. Alternatively
these factors are also called critical success factors. The absence of these factors are called
inhibiting factors.
Rao (2003) identified a KM frame work with ‗8Cs‘ viz connectivity, content, community, culture,
capacity co-operation, commerce and capital. The study of Chong et al. (2005) identified the
following 11 enabling factors for successful implementation of knowledge management:
Employee training

7
Employee involvement
Spirit of team work
Employee empowerment
Top management leadership and commitment
Information systems infrastructure
Performance measurement
Knowledge friendly culture
Benchmarking
Knowledge structure
Elimination of organisational constraints
McCabe (2003) identified the following 10 enabling success factors to establish KM as an
enterprise wide discipline:
Align KM goals to the corporate strategy.
Build the technology infrastructure to support KM
Focus on strategic knowledge communities.
Establish a multi dimensional frame work linking communities to the business.
Approach KM as a holistic business system.
Establish community goals that align business and member drivers.
Integrate KM process to business process.
Recognize that KM is a process, not a project.
Establish metrics and a performance management process.
Institutionalize KM to ensure that it is sustainable.
Holthouse (2003) identified the following 10 enabling success factors of KM:

8
Knowledge sharing
Instilling responsibility for knowledge sharing.
Capturing and reasoning past experiences.
Embedding know-how in products, services and processes.
Developing productive work spaces / places.
Driving knowledge generation for innovation.
Building and mapping community expertise.
Building and mining customer knowledge bases.
Understanding and measuring the value of intangibles
Leveraging intellectual assets.
The following research outcomes reported in Rao, (2003), indicate the common mistakes when
implementing KM:
Not developing a solid business case with RoI
Leading with technology
Posting KM on standalone initiative and not engaging the people doing the work, also
known as the ones with the knowledge
Not implementing KM to improve a business process.
Developing a KM initiative without associating it to the way people work as a daily basis.
Ignoring the need for extensive training and change management
Not aligning KM with critical business processes.
Not knowing how to approach the technology infrastructure.
Inadequate human resource support for KM initiatives

9
The recommendations reported in Rao, (2003) for organisations evaluating the launch a KM
practice are:
Develop a robust business case that shows how KM solves problems and impacts the
organisation strategically.
Get involvement from thought leaders and influencers, through the development of a cross
functional advisory board or Steering Committee.
Select three different pilot areas to conduct projects that show the value of KM and use a
rigorous project management methodology and measurement systems to track the value.
Evaluate the business need for KM capabilities before focusing on improving specific
business processes.
Use enterprise portal software to provide information access and application access across
the enterprise.
Then integrate with other technologies as needed to provide specific solutions.
Identify critical intellectual capital; use KM to align it to critical business processes.
Consider building the KM technology infrastructure upon integrated ‗out of the box‘
suites and adding best of breed where ever justified.
Professionally develop employees who will be leading KM-related activities and projects.
Fahey and Prusak(1998), identified the following 11 sins of KM:
Not developing a working definition of knowledge
Emphasizing knowledge stocks to the detriment of knowledge flow.
Viewing knowledge as existing predominantly outside the heads of individuals.
Not understanding that a fundamental intermediate purpose of managing knowledge is to
create shared context.
Paying little heed to the role and importance of tacit knowledge
10
Disentangling knowledge from its uses.
Down playing thinking and reasoning
Focusing on the past and the present and not on the future
Failing to recognize the importance of experimentation
Substituting technological contact for human interface
Seeking to develop direct measures of knowledge
Fahey and Prusak(1998) also provided the following suggestions:
Managers need to continually reflect on knowledge as an organisation phenomenon.
Managers must be obsessive about noting and correcting errors in their stock of
knowledge- in what they think they know.
Managers must be vigilant about detecting and correcting errors in their process of
knowing- the generation, moving and leveraging knowledge throughout the organisation.
Organisation must engage in critical, sustained and honest self reflection about the eleven
errors.
After studying 31 KM projects in 24 companies Davenport et al, 1998, identified 8 enabling
factors :
i. Link to economic performance or industry value
ii. Technical and organisational infrastructure
iii. Standard flexible knowledge structure
iv. Knowledge friendly culture
v. Clear purpose and language
vi. Change in motivational practices
vii. Multiple channels for knowledge transfer

11
viii. Senior management support
Szulanski (1994) identified three barriers to knowledge transfer: ignorance of source and
recipient, absorptive capacity of recipient and lack of relationship between source and recipient.
He found that an average of 27 months is required for transfer of best practice even in the best of
the firms. O‘ Dell and Grayson (1998) identified many hurdles of knowledge sharing, such as
organisational silos, culture of promoting individual expertise, lack of integration of KM into
work process etc. They also identified the enablers of knowledge transfer as technology, culture,
leadership and measurement. Ruggles (1998), through a study of 431 organisations, identified the
biggest impediments to knowledge transfer as culture, followed by top management‘s failure to
signal the importance. Further he identified that the biggest difficulties in KM are changing
people‘s behavior and measuring the value and performance of knowledge assets. According to
Gupta and Govindarajan (2000), an enterprise‘s intellectual capital consists of the stock of
knowledge held by individuals and corporate units multiplied by the velocity at which such
knowledge is shared throughout the organisation
1.5 KEY AREAS OF KNOWLEDGE MANAGEMENT
It can be observed that most of the factors discussed above are related to either people in the
organisation, or knowledge management processes in the organisation, or the technology
infrastructure used for KM in the organisation or knowledge availability and requirement of the
organisation or return on investment of KM in the organisation. These factors are called Key
Areas (KA) of KM which are Knowledge, Process, Return on Investment (RoI), People and
Technology. These key areas are discussed in the following sections:

12
1.5.1 Knowledge
Knowledge is critical and it needs to be effectively managed. When other things being equal, the
difference between success and failure may turn out to be, how effectively the knowledge is
managed (Davenport et al, 1998). Leveraging knowledge is not only important but it may be the
most important job management has (Drucker, 1993). Leading management and organisation
theorists have popularized the concept of treating organisational knowledge as a valuable strategic
asset. For survival, growth and competitive advantage, an organisation must create, locate,
capture, share, preserve, and apply the knowledge to solve problems and exploit opportunities
(Zack, 1999). Also organisational knowledge is more complex compared to individual
knowledge.
1.5.2 Processes
The importance of knowledge creation, knowledge sharing and knowledge utilization processes
was highlighted by Nonaka, (1991) as successful companies are those that consistently create
new knowledge, disseminate it widely throughout the organisation and quickly embody it new
technologies and products. These three activities define the knowledge creating company whose
sole business is continuous innovation. Other KM processes are knowledge acquisition,
knowledge preservation/knowledge storage, knowledge access/ retrieval, knowledge
classification, knowledge representation etc.
1.5.2.1 Knowledge Creation
Knowledge is created by organisational entities during normal work or through specific activities
like R&D, brainstorming, problem solving etc. While the ever popular efforts involving capture,
access and transfer of knowledge can lead to increased efficiency, knowledge generation is the
key to growth (Ruggles, 1998). Knowledge creation is akin to ‗exploration‘, in which individuals

13
and teams generate new ideas and concepts, by combining existing knowledge (Kogut and
Zander, 1992; Nahapiet and Ghoshal, 1999). The creation of knowledge is closely tied to the
innovation of products and services (Subramaniam and Youndt, 2005). In the context of an R&D
organisation, knowledge creation is the most important KM process.
Nonaka (1994), proposed that knowledge is created through interaction between tacit knowledge
and explicit knowledge at various levels of organisational entities such as individuals, teams,
organisation and extended organisation through the process of Socialization, Externalization,
Combination and Internalization, popularly known as SECI framework. In socialization mode,
tacit knowledge gets converted into new tacit knowledge and hence new tacit knowledge is
created. It is a process of sharing experiences and thereby, creating new tacit knowledge.
Observation, imitation and practice are more important than the use of language in socialization.
Examples of knowledge creation through socialization include apprenticeship, on the job training,
monthly meetings, conferences, informal meetings etc. In externalization mode, tacit knowledge
gets converted into explicit knowledge and thus, new explicit knowledge is created. It is the
process of transforming tacit knowledge into explicit form. Tacit knowledge elicitation through
interviews is an example of externalization. Externalization also takes place through meetings,
brain storming sessions etc. In combination mode, different modules of explicit knowledge get
combined into new explicit knowledge. Configuration or reconfiguration of knowledge through
adding, sorting, filtering, categorizing of explicit knowledge can result in new explicit knowledge.
Data mining and knowledge discovery are also examples of combination. In internalization mode,
explicit knowledge gets converted into tacit knowledge and it is related to ‗learning‘.
It can be observed that though there are four mode of knowledge creation, they are not mutually
exclusive. For example in a meeting all the four modes may be taking place. Since tacit

14
knowledge of different participants is shared, socialization mode of knowledge creation is taking
place in a meeting. Since different participants externalize their tacit knowledge through
question- answers, comments, criticism etc, externalization mode of knowledge creation is taking
place. When the minutes of the meeting are prepared, it is a combination mode of knowledge
creation. When different participants understand and learn from what other participants have
externalized or from the minutes of the meeting, observations etc., it is the process of knowledge
creation, through internalization.
The process of organisational knowledge creation requires a context in terms of who participates,
how they participate and when they participate. Ba provides such a context. Ba literally means
‗place‘ and can be considered as a context in which knowledge is shared, created and utilized. Ba
is not only a specific space, but also a specific time. It can be physical, virtual or mental space-
time combination. Ba provides the necessary energy, quality and place for knowledge creation,
where information is interpreted to become knowledge (Nonaka et al., 2000). The key concept in
ba is interaction. Based on type of interaction and medium of interaction, four types of ba are
originating ba, dialoguing ba, systemizing ba and exercising ba, which is depicted in Figure 1.1
Originating ba is the primary ba from where the knowledge creation process begins. It is
characterized by face to face and individual interactions, where individuals share experiences,
feelings, emotions etc.(Nonaka and Konno, 1998). From originating ba emerge care, love, trust
and commitment which form the basis for knowledge sharing among individuals (Nonaka et al.,
2000).

15
Type of Interaction
Figure 1.1 Four types of Ba (Nonaka et. al, 2000)
Dialoguing ba is defined by face to face and collective interactions (Nonaka et al., 2000). It
corresponds to the externalization phase of knowledge creation. It is the place where individuals‘
tacit knowledge in the form of experience, emotions, beliefs etc. are articulated and shared among
the participants and converted in to shared concepts. This ba is more consciously created by
selecting people with the right mix of knowledge, skills and attitude.
Systemizing ba is defined by virtual and collective interactions (Nonaka et al., 2000). It
corresponds to the combination phase of knowledge creation. Information and communication
technology offers a virtual collaborative environment of systemizing ba through groupware,
online forums etc.
Exercising ba is defined by virtual and individual interactions. It corresponds to the
internalization, phase of knowledge creation. Here individuals internalize the explicit knowledge
that is received through documents, manuals etc.
Individual Collective
Face-to-Face
Media
Virtual
Originating Ba Dialoguing Ba
Exercising Ba Systemising Ba

16
1.5.2.2 Knowledge Sharing
Knowledge sharing is a process of exchange of explicit or tacit knowledge between two agents,
during which one agent purposefully receives and uses the knowledge provided by another. The
importance of knowledge sharing is conveyed by Nonaka (1991) as making personal knowledge
available to others is the central activity of the knowledge creating company. Tobias(2006)
observed that knowledge communication and knowledge transfer can be identified as the central
task of knowledge management. An organisational culture that encourages open and transparent
communication among the employees would lead to increased collaboration and knowledge
sharing (Anantatmula and Kanungo, 2007). Knowledge communication is more than
communication of information (e.g., facts, figures, events, situations, developments, etc.), or
emotions (e.g., fears, hopes, reservations, commitment etc.) because it requires conveying
context, background and basic assumptions (Eppler, 2006). From the above discussions, it is
clear that knowledge sharing is the focal point in knowledge management and it significantly
differs from sharing of data or information.
Depending on the type of knowledge, knowledge sharing methods are classified in to codification
approach and personalization approach. The former is centered on explicit knowledge with the
strategy of ‗people to document‘ and ‗document to people‘, while the latter is centered on tacit
knowledge with the strategy of ‗people to people‘ . In codification approach, knowledge sharing
is by the process of externalization, combination and internalization. In personalization approach,
knowledge sharing is by the process of socialization. Only by effective knowledge sharing
among various organisational entities, new knowledge can be generated and the generated
knowledge can be utilized. A holistic approach to knowledge sharing should address both
approaches.

17
The research study conducted by Ribiere (2001), revealed that high solidarity and high trust
respectively are essential for knowledge management initiatives based on codification approach
and personalization approach to be successful.
1.5.2.3 Knowledge Utilization
Knowledge utilization refers to the practices and process that enable effective utilization of
available knowledge within the organisation. It represents the ‗exploitation‘ of existing
knowledge for the organisation‘s purposes. Alavi and Leinder (2001) stated that the source of
competitive advantage resides in application of knowledge, rather than the knowledge itself.
According to Davenport and Probust ( 2002) the economic value of knowledge does not lie in
possessing it, but in using it. When knowledge is utilized, the organisation is benefited, in terms
of increased productivity, efficiency, effectiveness and innovation. Knowledge utilization
involves identification of knowledge, accessing the knowledge, internalizing the knowledge,
recalling the knowledge and applying the knowledge.
1.5.3 Return on Investment
Return on Investment (RoI), on KM is the benefit that the organisation gets. According to
Wolford, (1999), knowledge based initiatives must show a return on investment, otherwise they
are simply waste Pilot projects for KM must have clearly defined measurable objectives that can
be achieved in less than 6 months, even though, change over to an enterprise-wide KM involves
a change process that can span several years (Davenport and Probust, 2002). Quantitative and
qualitative metrics for actionable understanding should target RoI, barriers to sharing knowledge,
employee attitude, level of knowledge standardization, KM system‘s maturity level and
assessment of intellectual capital and knowledge assets (Rao, 2003). Kochikar and Suresh(2003)

18
discussed many tangible and intangible benefits for the organisation on successful
implementation of KM. A few of them are given below:
Raising the quality of performance: The primary mechanism for raising the quality of
performance is through the institutionalization of ‗best practices‘ residing in organisational
pockets, a process which needs the sharing and adoption of these practices across
departmental interfaces.
Reducing the cost: Achieving greater productivity requires higher level of reuse. The cost of
redoing something that has been done earlier and relearning something that has been learnt
earlier, anywhere in the organisation, should be less. Successful implementation of KM leads
to reduction in the cost of product/service.
Managing risk: The de-risking measures in diversifying into new technologies, domains,
services and geographical areas, require that the organisation must learn new ways of doing
things. Managing risks resulting from attrition and personal movements require that as much
knowledge as possible should be documented and effective succession planning process is in
place.
Meeting Growth Expectations and Innovation: Maintaining a consistently high pace of
growth and innovation needs the culture of collaboration, experimentation and dissemination
of knowledge. This enables new employees to learn rapidly and become more productive.
Managing Virtual Teams: Many organisations that have globalized operations often require
teams that are spread across continents to collaborate in delivering single customer solution.
Such virtual team work requires a mind set of working with co-workers who may be situated
in different time zones and may belong to different cultures, and good technologies to support
communication and collaboration.

19
The intangible benefits include increased customer satisfaction, higher employee satisfaction and
cultural change that results in more synergistic organisation. KM has direct and indirect impact on
many other organisational performance parameters.
1.5.4 People
According to Nonaka and Takeuchi (1995), everyone in a knowledge creating company is a
knowledge creator and all the individuals engaged in knowledge creation are considered as
―knowledge creating crew‖. The knowledge creating crew can be classified into ―knowledge
practitioners‖ i.e. front line employees and line managers, ―knowledge engineers‖ i.e. middle
managers and ―knowledge officers‖ i.e. top managers. Knowledge practitioners accumulate,
generate and update both tacit and explicit knowledge, acting almost as ―walking archives‖ on a
day-to-day basis. Knowledge engineers serve as the bridge between knowledge practitioners and
knowledge officers. They mediate between ―what is‖ and ―what should be‖. They engineer new
knowledge according to the organisation‘s vision. Knowledge officers give an organisation‘s
knowledge creating activities a sense of direction by articulating grand concepts on what the
company ought to be; establishing a knowledge vision in the form of a corporate vision or policy
statement; and setting the standards for justifying the value of the knowledge that is being created
(Nonaka and Takeuchi ,1995). From the above discussions, it is clear that every employee in the
organisation plays a significant role in KM. Recognizing the importance of KM roles, many
organisations have created roles like Chief Knowledge Officer (CKO) and Knowledge Officers at
various levels.
1.5.4.1 Knowledge sharing culture
According to Coutu (2003), cultural change in an organisation involves transformational learning.
It includes creating an environment of genuine trust and openness, building flat organisations
20
where people are truly empowered, and creating self managed teams. Turning knowledge into
action is easier in organisations that have driven fear and internal competition out of the culture
(Pfeffer and Sutton,1999). There is a general agreement that a knowledge friendly organisational
culture must be nurtured in order to succeed with a knowledge management initiative.
American Productivity and Quality Centre (APQC) had conducted a study of organisations that
were known to have a corporate culture that supports knowledge sharing. The study‘s central
finding is that however strong your commitment and approaches the knowledge management,
your culture is stronger. Organisations successful in promoting a strong knowledge sharing
culture do not try to change their culture to fit their knowledge management approach. They
build their knowledge management approach to fit their culture. As a result, there is not one right
way to get people to share, but many different ways depending on the values and style of the
organisation (McDermott and O‘Dell, 2000). In an organisation, with a knowledge sharing
culture, people would share ideas and insights because they see it as natural, rather than
something they are forced to do. They would expect it of each other and assume that sharing
ideas is the right thing to do (McDermott and O‘Dell, 2000).
Davenport and Prusak (1998) identified 4 main factors that encourage employees to share
knowledge
1) Altruism: ―It is possible that knowledge sharer may be a nice guy who wants to help
whether or not he gets anything but a ‗thank you‘ in return. Or he may be so passionate
about his knowledge that he is happy to share it whenever he gets a chance‖.
2) Reciprocity: ―A knowledge seller will spend the time and effort needed to share
knowledge effectively if he expects the buyers to be willing sellers when he is in the

21
market for their knowledge. Reciprocity may be achieved less directly than by getting
knowledge back from others as payment for providing it to them‖.
3) Repute: ―A knowledge seller usually wants others to know him as a knowledgeable
person with valuable expertise that he is willing to share with others in the organisation.
Having a reputation of knowledge sharing makes achieving reciprocity more likely and
can also lead to tangible benefits of rewards and recognition‖.
4) Trust: ―Without trust knowledge management will fail regardless of how thoroughly it is
supported by technology and rhetoric and even if the survival of the organisation depends
on effective knowledge transfer.‖
Employees who are altruistic will continue to be knowledge shares irrespective of other
organisational factors. However, by giving due recognition to altruistic behaviour, more and more
employees may tend to exhibit such behaviour. Employees with ‗reciprocity‘ behaviour need to
be motivated by monitory and other tangible rewards. Employees with ‗reputation‘ behaviour
need to be motivated by suitable recognition scheme for knowledge sharers. Concerted efforts
need to be made to improve the level of trust between employees and between employees and
management.
1.5.4.2 Co-opetition
Co-opetition refers to simultaneous co-operation and competition. Kim (1997) highlighted co-
opetition as one of the knowledge strategies. According to Farson and Keyes, (2002), prizes for
performance undermine team work because, they place competition above collaborations. Since
knowledge is a source of competitive advantage, firms, departments and even individuals will
compete based on knowledge they possess. However, the same knowledge can be shared and
mutual advantage can be derived, depending on ‗how much‘ is to be shared, when, with whom

22
and under what conditions. Using a game theoretic frame work Loebecke et al.(1999) reported
that knowledge sharing takes place when value added because of monopolistic knowledge is low,
synergetical value gained from mutual knowledge sharing is high, value gained from
leveragability is high and value lost because of other party‘s negative reverse impact is low.
1.5.4.3 Leadership
For successful KM initiatives, it is necessary to develop leadership capabilities at all levels of
functionality (Nonaka, 1994; Holsapple and Joshi, 1999). Leaders create environments, reinforce
norms and help set expectations through what they do, through their actions and not just their
words (Pfeffer and Sutton,1999). Leaders provide vision, motivation, systems and structures at all
levels of the organisation that facilitate conversion of knowledge into competitive advantage
(Bryant, 2003). Suri Babu et al. (2008), through a survey of 247 managers in three major public
sector undertakings in India, has identified a positive relationship between leadership capability
and KM effectiveness.
Successful introduction of KM in to an organisation, requires an expert on KM and top
managers who believe in KM. (Davenport and Probust, 2002). Nonaka and Konno (1998)
reported that knowledge is manageable only insofar as leaders embrace and foster the dynamism
of knowledge creation and the success of knowledge creation depends on management‘s
assumption of responsibility, justification, financial backing and caring. Coutu, (2002)
emphasizes that unless leaders become learners themselves, unless they can acknowledge their
own vulnerabilities and uncertainties, transformation learning will never take place. Literature
discusses mainly two types of leadership, viz, transformational leadership and transactional
leadership. While transformational leaders inspire exceptional performance, transactional leaders
aspire to achieve solid, consistent performance that meets agreed upon goals. Transformational

23
leaders create an atmosphere conducive to knowledge creation, sharing and exploitation. Bryant
(2003) studied the effect of leadership on KM and concluded that transformational leadership is
necessary for knowledge creation and knowledge sharing and transactional leadership is
necessary for knowledge exploitation (utilization). APQC has identified leadership behaviors that
encourages and that discourages knowledge sharing in an organisation ( APQC, 2010a, 2010b).
1.5.4.4 People Centric KM
A group of researchers and practitioners believe that knowledge resides in the minds of the people
and what is explicitly available is only information. Mostly they have their educational
background in psychology, philosophy, sociology or management. To them knowledge is a
process, a complex set of dynamic skills which enables them to act in different situations (Sveiby,
1996). This track is as old as the human civilization. However, the progress is slow. The
concentration is on tacit knowledge and personalization approach. It is concerned with motivating
people and creating conducive environments for knowledge creation, knowledge sharing,
knowledge utilization and innovation.
1.5.5 Technology
Technology facilitates KM processes such as knowledge creation, knowledge preservation and
knowledge dissemination. The technology architecture should provide all the basic functionality
and features associated with robust, scalable and secure enterprise knowledge portal (Kochikar
and Suresh, 2003). A typical knowledge portal contains a central KM repository and several
satellite repositories which can be accessed by both intranet users and extranet users as shown in
the following Figure 1.2 The rationale behind the satellite repository system is to permit the
individual departments in the organisation to own the knowledge relevant to their areas. The
knowledge portal need to have integration with various corporate databases such as Human

24
Resource, Finance, Projects etc. The central components of the knowledge portal are the easy to
use knowledge navigator utility with contextual and powerful browse / search features,
personalization, subscription, user specified knowledge hierarchy, keyword-based search criteria,
expert locator, collaboration tools, online learning tools etc. The portal shall also need to include
features such as online document submission facility, review, feedback and publication work
flow, online chat facility and innovative ways of showcasing new and relevant knowledge. It
should have facility for monitoring knowledge usage and knowledge sharing behavior of
employees.
Figure 1.2 Typical KM Portal (Kochikar and Suresh, 2003)
The technologies that are currently being utilized and have great potential are Information
Technology and Knowledge Engineering. The emergence of internet and intranet technology has
enabled, KM to acquire the kind of formidable possibilities that were previously not possible
(Natarajan and Shekhar, 2000). Mobile accessible information puts knowledge to work right at
…….
Intranet
HR
Firewall
Security
System
Departmental
KM Repository 1 Departmental
KM
Repository n
Materials
Management
Digital Library
Data Warehouse
Finance
USERS
USERS
Central KM
Repository
Projects
Extranet

25
the demand points. Mobile technologies enhance communication, information and collaboration,
the three cornerstones of knowledge building and usage (Keen and Mackintosh, 2001).
Information technology certainly plays a central role in KM (Gupta and Govindarajan, 2000).
1.5.5.1 Information Technology and Knowledge Engineering Centric KM
Over the years, organisations have developed and deployed Information Technology (IT)
solutions in the pursuit for efficiency, effectiveness and excellence. If the usage of IT for
productivity improvement in organisations can be analyzed, it can be seen that the starting point is
basic data processing systems. Data processing systems, process transactions and produce reports.
It represents the automation of fundamental, routine processing to support operations. For
example, it could be the pace of assembly line production, it could be basic accounting operation
or it could be the monitoring the progress of projects. For this purpose, Electronic Data
Processing (EDP) departments have been set up in many organisations. The idea of using the
information captured in transaction processing system for decision making gave birth to Decision
Support Systems (DSS), Management Information Systems (MIS), Enterprise Information
Management (EIM) etc. The information used in these systems is structured. However knowledge
is unstructured and exists in both explicit and tacit form. In a similar way it is argued that
‗Knowledge Management‘ is an extension of ‗Information Management‘ (IM) and ‗Knowledge
Management Systems‘(KMS) are natural extensions of ‗Information Management Systems‘(IMS)
aimed at enhanced efficiency, effectiveness and excellence.
Gottschalk (2002) analyses the growth of information technology in organisation and classifies in
to three eras. During the first era, the concentration was on EDP to achieve efficiency by
automation of manual process. During era2, the concentration was on MIS where the focus is on
effectiveness by providing the right information to the management. During era3 (current one),

26
the focus is on strategic information systems to achieve excellence and competitiveness by
effective utilization of organisational knowledge.
Knowledge Engineering is the art of bringing the principles and tools of artificial intelligence
research to bear on difficult application problems requiring expert knowledge for their solution
(Feigenbaum, 1977 cited by Zhongzhi, 2011). R&D in the area of AI, aims to endow computers
with human abilities and KE is the practical application of those aspects of AI that are well
understood to real problems (Kendal and Creen, 2007). Knowledge-Based Systems (KBS) are
computer programs embedded with human knowledge that are designed to emulate the work of
human experts. The technical issues of acquiring this knowledge, representing it and using it
appropriately to construct and explain lines of reasoning are important problems in the design of
knowledge based system (Hendriks and Vriens, 1997). Presently KE based on knowledge and
information processing is a remarkable characteristic of AI. In knowledge based systems,
knowledge will be stored in the computer in defined structure for KM, problem solving and
knowledge sharing (Zhongzhi, 2011). Kendal and Creen (2007) discuss five steps in transferring
human knowledge into KBS and seven types of KBS. The 5 steps are:
i. Knowledge Acquisition
ii. Knowledge Validation
iii. Knowledge Representation
iv. Inference and Explanation
v. Justification.
The 7 types of Knowledge-Based Systems discussed in Kendal and Creen (2007) are:
i. Expert Systems,
ii. Neural Networks,
iii. Case-Based Reasoning,
27
iv. Genetic Algorithms,
v. Intelligent Agents,
vi. Data Mining
vii. Intelligent Tutoring Systems.
According to Prasad and Nadessin (2003) if advances in computing and communications can
accelerate the pace at which automated tasks can be performed, we can conceive that KM too may
benefit from the kind of growth envisaged by Moore‘s law. As the application of Moore‘s law
shrinks devices to minuscule levels, wearable computing, coupled with enablers of human
communications, such as Instant Messaging will create spontaneous knowledge networks with
people as nodes. Advances in digital wireless communications will enable personal area
networks of devices and sensors. AI-based natural language processing, text mining, speech
recognition and text to speech conversion will increase the access, to knowledge and will make
just in time knowledge a reality (Prasad and Nadessin, 2003).
Assuming the validity of the data information and knowledge continuum, it can be concluded that
KMS is natural extensions of IMS and KBS, for organisational efficiency, effectiveness,
excellence. KMS uses the technologies of IMS and KBS and require tight integration with those
systems. KMS is much more complex because of the dynamic and transient nature of tacit
knowledge and the unstructured form of explicit knowledge, in addition to the complexities of
modern organisation. Most successful organisations have made a transition from Data Processing
System to Information Management System and moved to Knowledge Management System.
According to Tusi (2003), the objectives of developing a KMS are: capture, create and share
knowledge; locate relevant knowledge; provide an environment for knowledge exchange; connect
people with relevant interest and skills; facilitate and support intelligent problem solving.

28
The phenomenal development in IT, that have dramatically expanded the access to knowledge, is
the main enabler and even a driver of KM as perceived currently. KE practices that enable better
elicitation, representation and retrieval of tacit knowledge will drive KM in to new frontiers.
With the technological revolution of internet, World Wide Web (WWW) and fast expanding
mobile communication, people are able to get almost all the knowledge they need, at anytime
and anywhere. This significant expansion in availability and access of knowledge is not simply
limited to digitized explicit knowledge, but even the tacit knowledge residing in the minds of the
people, by identifying and connecting the right expert, irrespective of the time or geographical
location. Information and Communication Technologies can not only enhance knowledge sharing
by lowering temporal and spatial barriers between knowledge workers and improving access to
information about knowledge but also motivate knowledge sharing (Hendriks, 1999).
Hence, IT and KE are at the centre stage of KM and the important role played by them will
exponentially increase in future as fast developments take place in these technologies. However,
significant role need to be played by other Key Areas of KM such as People, Process, Knowledge
and RoI. Technology can enable and even shape other Key Areas. Since fast developments are
taking place in these technologies, future KM will exploit these developments and may even
become drivers to unexplored and uncharted territories of organisational effectiveness.
1.5.6 People and Technology
Technology reshapes human beings and this was advocated by McLuhan,
(http://marshallmcluhan.com). The phrase ―the medium is the message" coined by McLuhan
meaning that the form of a medium embeds itself in the message. In other words, the medium
influences how the message is perceived. People and technology exist in a symbiotic relationship.

29
As people become too much dependent on the technologies created by them, people get
transformed to suit the new technologies (Lochhead, 1994).
McLuhan reported that the visual and individualistic print culture would soon be brought to an
end by what he called "electronic interdependence" where humankind will move from
individualism and fragmentation to a collective identity, with a "tribal base". McLuhan's coinage
for this new social organisation is the global village. Key to McLuhan's argument is the idea that
technology has no per se moral bent—it is a tool that profoundly shapes an individual's and, by
extension, a society's self-conception and realization.
In the organisational context, it is argued that technology and organisation cannot be separated
from each other, because they are mutually constituted. Technology and its users are each
constituted by the other- each shape and are shaped in turn by the other. Technology is not
simply passive tools, waiting for us to use them(Introna, 2011).
However, it is to be kept in mind that mere adoption of a technology alone is not adequate to
realize the organisational benefits. The human action that is facilitated or restricted by technology
is simultaneously empowered or restricted by the organisational context. For example ―Google‖
search is allowed in some organisations, while it is prohibited in some other organisations.
1.6 KNOWLEDGE MANAGEMENT MATURITY MODELS
Essentially the motivation for KM implementation should be driven by the organisational needs.
KM implementation needs a clear road map that is derived based on goals and resources
available. In order to provide a road map for KM implementation, many practitioners and
researchers have developed Knowledge Management Maturity (KMM) models. Maturity models

30
are basically application of life cycle approach. The entity develops through the levels, until the
highest level which is the level of perfection.
1.6.1 General Characteristics
Maturity models describe the development of an entity over time. The entity can be anything of
interest. It can be a human being, an organisation, a technology, a product, a process etc. A
maturity model gives a path to improvement. Maturity model can also be used as a basis for
comparison (Klimko, 2001). Maturity models have the following properties (Klimko, 2001,
Weerdmeester et al., 2003):
The development of a single entity is simplified and described with a limited number of
maturity levels (usually 4 to 6).
Levels are characterized by certain requirements which the entity has to achieve on that
level.
Levels are sequentially ordered, from an initial level to an ending level of perfection.
During the development, the entity progresses forward from one level to the next.
No levels can be skipped.
A well known maturity model is Maslow‘s hierarchy of human needs (Maslow 1943). Maslow
postulates that there are five levels in human needs. The human needs start with physiological
needs and progresses to safety needs, needs of love and belonging, esteem needs and finally to
self actualization needs.
Another very popular maturity model is Capability Maturity Model (CMM) and its latest version
Capability Maturity Model Integration (CMMI) developed by Software Engineering Institute of

31
Carnegie Mellon University for process improvement. CMMI supports both a staged
representation and a continuous representation. In the staged representation, the model has five
stages. Maturity level 1 is called ―Initial‖, which is characterized by ad hoc and chaotic processes.
Maturity level 2 is called ―Managed‖, which is characterized by processes that are planned and
executed as per the policy. Maturity level 3 is called ―Defined‖ which is characterized by
standardized processes that are used to establish consistency across the organisation. Maturity
level 4 is called ―Quantitatively Managed‖, which is characterized by managing the process
performance through quantitative objectives. Maturity level 5 is called ―Optimizing‖, which is
characterized by continual improvement of process performance through continual and innovative
process and technological improvements (Chrissis et al., 2007).
In this thesis, the entity of interest is knowledge management and hence only KM
maturity(KMM) models are considered. The path to success in KM implementation involves
significant changes in process, technology and other infrastructures, mindset of people and
systems, process and culture of the organisation. It is extremely difficult to achieve such
significant changes that affect the entire organisation through a ‗big bang‘ approach in a single
step. It is a worthy decision to implement KM through an evolutionary process with adequate
‗absorbing time‘ for various organisational entities. A clear road map for such an implementation
provides the necessary guidance for various stake holders. KMM model provides a framework for
organisations to assess their current level of KM maturity. KMM model can be considered as an
application of structured approach to knowledge management implementation. KMM model can
be defined as the ―application of systematic, disciplined, quantifiable approach- that is, an
engineering approach to development, implementation and successive progression to attain
maturity in knowledge management‖.
32
1.6.2 Existing Models
KMM models are reviewed based on the context of development, number of maturity levels, key
areas, assessment methodology, validation methodology etc. The assessment methodology could
be subjective or in the sense that the evaluation is purely based on the opinion expressed by
various stake holders. It could also be objective in the sense that the evaluation involves
collection and analysis of evidences to support the opinion expressed by various stake holders.
The model could be validated by survey methods, or by case study method, in the context of one
or more organisations.
Various KMM models reviewed are briefly described below. Kochikar (2000) had developed a
generic KMM model, in the context of Infosys Technologies Ltd. The model has five maturity
levels, viz, default, reactive, aware, convinced and sharing. The assessment methodology is
objective. The KAs considered are people, process & technology. The model does not specify
anything about validation. The model will be referred as KMM (Kochikar).
Hubert and Lemons (2010) of APQC had developed a generic KMM model for application to
APQC‘s road map to KM results. The model has five maturity levels, viz, initiate, develop,
standardize, optimize and innovate. The model specifies the characteristics of different maturity
levels in generic terms, without explicitly identifying any specific KA. The model does not
specify anything about the methodology of assessment and validation. The model will be referred
as KMM (Hubert).
Kulkarni and Freeze (2004) had developed a Knowledge Management Capability Assessment
(KMCA) model, for determining the capability levels of an organisation in various knowledge
areas. The model identifies six capability levels, viz, difficult, possible, encouraged, enabled,

33
managed and continuously improved. The model specifies micro capability levels like +, ++ etc.
in between two adjacent capability levels. The model classifies the knowledge into four areas,
viz, expertise, lessons learned, knowledge documents, and data. These areas are called knowledge
capability areas, which are essentially the KAs. The model specifies the subjective assessment
methodology with typical questions. The model is validated by survey method. The model will be
referred as KMCA (Kulkarni).
Klimko (2001) had developed a generic KMM model. The model has five maturity levels, viz,
initial, knowledge discoverer, knowledge creator, knowledge manager and knowledge renewer.
The model specifies the characteristics of each stage in terms of focus, key processes, challenge,
tool, and pitfall. The model neither specifies the assessment nor validation methodology. The
model will be referred as KMM (Klimko).
KPMG Consulting (2000) had proposed a generic KMM model called ‗Knowledge Journey‘. The
model has five maturity levels, viz, knowledge chaotic, knowledge aware, knowledge focused,
knowledge managed and knowledge centric. The model specifies the characteristics of different
maturity levels in terms of KAs, viz, people, process, content and technology. The model will be
referred as Knowledge Journey (KPMG).
Natarajan (2005) developed a KMM model for software industry. The model has four maturity
levels. Each maturity levels is called a K-stage. The model is validated by case study approach.
The KAs identified are business process readiness, technology infrastructure, human behaviour
and leadership. The model does not specify the assessment methodology. The model will be
referred as KMM (Natarajan).

34
Paulzen and Perc (2002) proposed a maturity model for quality improvement in KM. The authors
call it ‗Knowledge Process Quality‘ (KPQ) model. The model has five maturity levels, viz, initial,
aware, established, quantitatively managed and optimizing. The KAs identified are organisation,
people and technology. Though the model discusses the assessment globally, it does not clearly
specify the methodology. The validation of the model is discussed as the future work. The model
will be referred as KPQ (Paulzen).
Mohanty and Chand (2005) developed a KMM model, keeping the requirements of Tata
Consultancy Services in mind. The model has five maturity levels, viz, initial, intent, initiative,
intelligent and innovative. The assessment methodology described is objective. The KAs
considered are people, process and technology. The authors call the model as 5iKM3 and will be
referred by 5iKM3 (Mohanty).
Wisdom Source Technologies developed a KMM model (Wisdom Source, 2004). The model has
eight levels of maturity, viz, standardized infrastructure for knowledge sharing, top-down quality
assured information flow, top-down retention measurement, organisational learning,
organisational knowledgebase, process-driven knowledge sharing, continual process improvement
and organisational self-actualization. The model specifies the characteristics of different maturity
levels in generic terms, without explicitly identifying any specific KAs. The model is called K3M
and will be referred by K3M (Wisdom Source).
Gottschalk (2002) proposed a maturity model for KM technology in Law Firms. The model has
four maturity levels, viz, end user tools, who knows what, what they know and what they think.
The model discusses the technology characteristics at each level. Also the model discusses the
classification of knowledge into core, advanced and innovative. It also classifies the knowledge

35
into administrative, declarative, procedural and analytical. The model neither specifies the
assessment nor validation methodology. The model will be referred as KMM (Gottschalk).
Ehms and Langen (2002), developed a KMM model, keeping the requirements of Siemens in
mind. The model has five maturity levels, viz, initial, repeated, defined, managed and optimizing.
The model identifies eight KAs, viz, strategy & knowledge goals, environment & partnerships,
people & competencies, collaboration & culture, leadership & support, knowledge structures&
knowledge forms, technology & infrastructure and processes, roles & organisation. The
assessment methodology described is objective. The model will be referred as KMM (Ehms).
Kruger and Snyman (2007) developed a strategic KMM model. It identifies six maturity levels,
viz, ICT as an enabler of KM, deciding on KM principles, ability to formulate organisation-wide
knowledge policy, building knowledge strategies, formulation of KM strategies and ubiquitous
knowledge. The model specifies the characteristics of different maturity levels in generic terms.
The model will be referred as Strategic KMM (Kruger).
Gallagher and Hazlett (2004) proposed a generic KMM model. The model has four maturity
levels, viz, K-aware, K-Managed, K-enabled, and K-optimized. The KAs identified are
knowledge infrastructure, knowledge culture and knowledge technology. The assessment
methodology is objective. A case study approach is proposed to validate the model. The model is
named as KM3 and will be referred by KM3 (Gallagher).
Pee and Kankanhalli (2009) proposed a generic KMM model. The model has five maturity
levels, viz, initial, aware, defined, managed and optimizing. The KAs considered are people,
process & technology. The assessment methodology is objective. A case study approach is used

36
to validate the model. The model is named as G-KMM model and will be referred by G-KMM
(Pee).
Boyles et al. (2009), proposed a KM assessment tool, in the context of nuclear industry. The
assessment is based on the model with five maturity levels. It identifies seven KAs, viz, policy,
human resource, training, documentation, technology, tacit knowledge and KM culture. In the
five level model each KA progresses from ‗not utilized‘, ‗to a little extent‘, ‗to some extent‘, ‗to a
great extent‘ and ‗to a very great extent‘. Self –assessment methodology is prescribed. The model
will be referred as KMM (Boyles).
1.7 THE CONTEXT OF NUCLEAR R&D ORGANISATION
This thesis proposes a KMM model in the context of a nuclear R&D organisation, which is
controlled and funded by Government of India. The complexity of managing knowledge in such
an organisation involves the twin complexity of nuclear knowledge management and R&D
knowledge management.
1.7.1 Nuclear Knowledge Management
Nuclear organisations can be classified into nuclear R&D organisations and nuclear plants (power
plants or reprocessing plants). The knowledge pertaining to nuclear organisations is termed
nuclear knowledge. Nuclear technology is a complex one as it involves many disciplines of
science and engineering. Knowledge management in the context of Nuclear Power Plant (NPP)
acquires much more important role, because of the long time scales involved, high technological
excellence required, stringent safety regulations, difficulties in attracting and retaining talented
work force etc. Added to this, there is always a challenge to improve the safety and reduce the
downtime as well as the unit energy cost. Though nuclear knowledge management has many

37
things in common with managing any other domain knowledge, managing it requires specific
programmes and needs to achieve the objectives. (Yanev, 2009).
There are many stake holders for nuclear knowledge such as designers, consultants, operators,
vendors, academic and R&D institutions, governments, regulators, international organisations etc.
Nuclear knowledge has been accumulated over a century with specific experience in design,
construction, commissioning, operation & maintenance, and R&D. Effective mechanisms need to
be developed for preservation of this knowledge and its transfer to successive generations.
Effective management of nuclear knowledge should include succession planning for the nuclear
work force, the maintenance of the ‗nuclear safety case‘ for operational reactors, and retention of
the nuclear knowledge accumulated over the past six decades (IAEA, 2006).
De Grosbois and Kumar (2009), through a study of NPPs have identified 42 common KM
practices like KM System, Communities of Practices, Training simulators, Knowledge elicitation,
Knowledge codification etc., which highlight the KM options available to the management of
NPPs.
The knowledge in an NPP can be broadly classified based on different phases of the power plant
viz research and development, conceptual design, detail design, construction, commissioning,
operation & maintenance, decommissioning, and refurbishment as depicted in Figure 1.3 (IAEA,
2006). Knowledge transfer takes place from one phase to another in a sequential manner.

38
Figure 1.3 Knowledge transfer through the phases of an NPP life cycle (IAEA, 2006)
Nuclear power plants are basically classified into thermal reactors and fast reactors based on the
energy of neutron that is used to sustain the chain reaction in the nuclear reactor. Thermal reactors
use slowed down neutrons, while fast reactors make use of high energy neutrons without slowing
down. IAEA has developed a scheme for classification of knowledge pertaining to Fast Reactors
known as Fast Reactor Knowledge Organisation System (FR-KOS). The knowledge in FR-
KOS is organised based on the metadata of the original document in a hierarchical structure, as
depicted in Figure 1.4 and Table 1.1
Arrows indicate
knowledge flow
between phases
Research and Development
Conceptual Design
Detail Design
Construction
Commissioning
Operation and Maintenance
MMMaintenance
Refurbishment
Decommissionin
g
DESIGN
OPERATION &
DECOMMISSIONING

39
Figure 1.4 The first two levels of Fast Reactor Taxonomy (Pryakhin et al., 2009)
FR-KOS is based on a taxonomy intended to guide experts and will help research and
development, educational and industrial organisations to facilitate the process of fast reactor
knowledge mining (Pryakhin, et al. 2009). It consists of an electronic repository of fast reactor
knowledge and experience from various countries with facilities for effective search and
knowledge mining.
BR-5/BR-10
DFR
EBR-II
Fermi
Rapsodie
BOR-60
KNK-II
JOYO
FFTF
FBTR
PEC
CEFR
Other
BN-350
Phenix
PFR
BN-600
MONJU
SNR-300
CRBRP
PFBR
KALIMAR
PRISM
SAFR
ALMR
Demonstration
And Prototype
Fast Reactor
Experimental
Fast Reactors
CDFR
EFR
BN-800
BN-1600
BN-1800
DFBR
Level-1
Commercial
Fast Reactor
SPX-1
SPX-2
SNR-2
All
Fast Reactors
Level-2
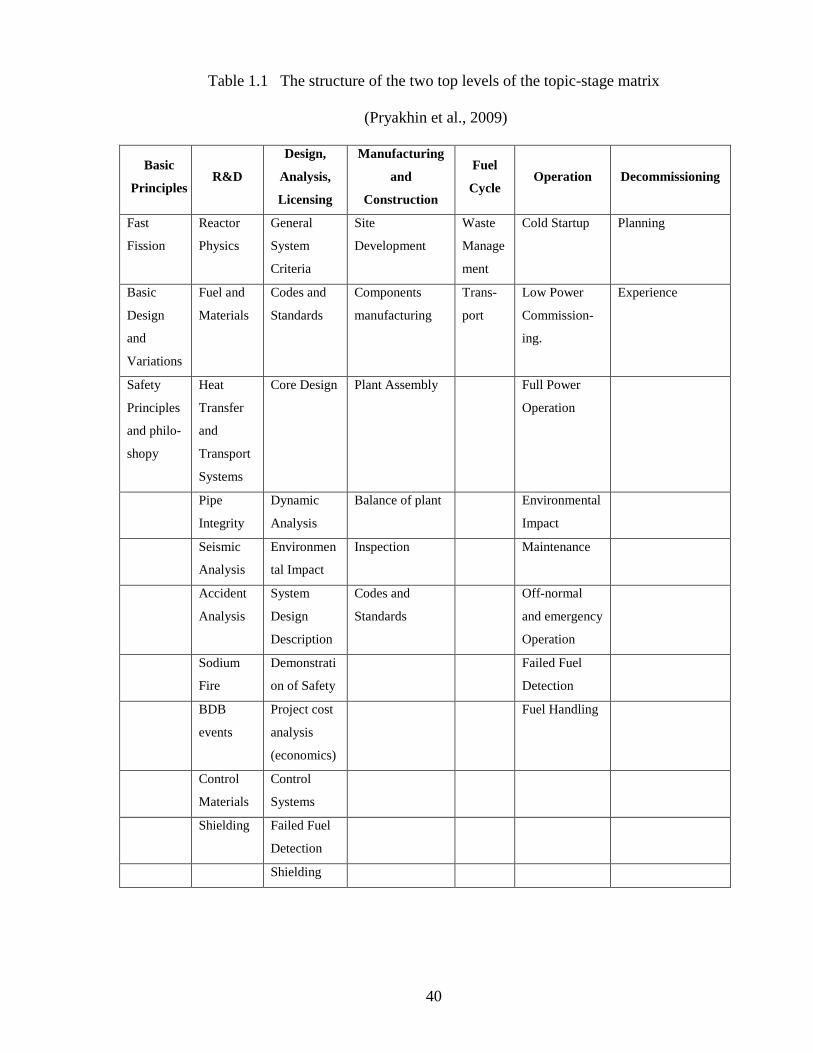
40
Table 1.1 The structure of the two top levels of the topic-stage matrix
(Pryakhin et al., 2009)
Basic
Principles R&D
Design,
Analysis,
Licensing
Manufacturing
and
Construction
Fuel
Cycle Operation Decommissioning
Fast
Fission
Reactor
Physics
General
System
Criteria
Site
Development
Waste
Manage
ment
Cold Startup Planning
Basic
Design
and
Variations
Fuel and
Materials
Codes and
Standards
Components
manufacturing
Trans-
port
Low Power
Commission-
ing.
Experience
Safety
Principles
and philo-
shopy
Heat
Transfer
and
Transport
Systems
Core Design Plant Assembly Full Power
Operation
Pipe
Integrity
Dynamic
Analysis
Balance of plant Environmental
Impact
Seismic
Analysis
Environmen
tal Impact
Inspection Maintenance
Accident
Analysis
System
Design
Description
Codes and
Standards
Off-normal
and emergency
Operation
Sodium
Fire
Demonstrati
on of Safety
Failed Fuel
Detection
BDB
events
Project cost
analysis
(economics)
Fuel Handling
Control
Materials
Control
Systems
Shielding Failed Fuel
Detection
Shielding

41
The first level of FR-KOS classifies reactors into different types like experimental reactor,
commercial reactor etc. There is also a general section containing knowledge on all fast reactor
facilities, without reference to any particular reactor. The second level lists the reactors under
each type. At the third level (Table 1.2), the knowledge acquired in each reactor facility is
classified into different stages like basic principles, R&D etc. At the fourth level knowledge in
each stage is classified. For example the knowledge in R&D stage is classified into reactor
physics, fuels and materials etc. At the fifth level the meta-data pertaining to knowledge
documents is placed. At the sixth level the available knowledge documents will be placed. The
meta-data, in FR-KOS contains information like, title, authors, type, abstract, key words, reactor
facilities, reactor stages etc. which facilitates accurate placement and retrieval of knowledge.
1.7.2 R&D Knowledge Management
The entire activities of an R&D organisation are centered on knowledge creation. R&D
organisation is different from other organisations because of its mission, the people working in
such organisations, the target work carried out by people, the knowledge that is quested, the
culture of the organisations, the financial support received, the responsibility to the government
and society. Today‘s R&D organisations are pressed by the demand of efficiency, effectiveness
and accountability on the one hand and the requirement of the greater multidisciplinary and
multi-site collaboration on the other hand; all of which takes place in an in an environment of
increased technological discontinuities, accelerated technological obsolescence and competence
erosion and enhanced competition(Osama ,2006).
The main function of R&D organisation is creation of knowledge that is necessary for the current
and projected future activities. The knowledge created by R&D acts like insurance against future
uncertainties. The challenge for KM is different in organisation whose life blood is knowledge

42
creation and continuous learning than it is for those for whom better reuse of existing knowledge
is primary (Leonard-Barton, 1995, Page-Shipp, 2000).
One of the major challenges faced by R&D organisation is in performance measurement, because
most of the outputs are intangible. Austin (1996) asserts that measuring only the easy-to-identity
or easy-to-measure areas, especially at the expense of the critical but difficult-to-measure areas, is
a flawed practice that creates the possibility that individuals would channel their productive
energies towards, those areas that are measured, and fail to do what is critical for the organisation.
Current R&D organisations are held responsible for efficiency, effectiveness and accountability in
quantitative terms compared to earlier paradigm of assessing R&D performance through
qualitative assessments. Measuring the effectiveness of R&D and innovation processes has long
been a vexing problem faced by research and corporate managers alike (Osama, 2006). In order
to comprehensively focus on R&D productivity, Jain and Triandis, (1990) proposed the concept
of organisational effectiveness. They defined organisational effectiveness as a vector that includes
quantifiable and non quantifiable outputs and reflects the quality and the relationship of outputs to
broad organisational goals and objectives. According to Rouse and Boff (2004) an R&D
organisation creates value only if it creates knowledge to meet the future needs. Also the value
the organisation creates is the value of the knowledge created, whether that knowledge is utilized
or not.
Performance monitoring of R&D organisations need to consider multiple attributes like input,
process, output, outcome, in addition to employee satisfaction and customer satisfaction. The
problem of performance multidimensionality and hence, measurement complexity is most severe
in R&D settings due to the inherent multidimensionality of R&D‘s output and the long term and
intangible nature of the process itself. Osama ( 2006) found that R&D organisations do a poor

43
job of linking together the strategy, performance and incentive system. Also he proposed that
R&D performance can be influenced by better alignment of individual motivations and
organisational goals.
One of the performance measurement approaches that internalizes the inherent
multidimensionality of the organisational performance measurement challenge is the Balanced
Score Card (BSC) developed by Kaplan ad Norton (1992). The key insight that triggered the idea
of BSC was the notion that organisational performance cannot be measured by a single metric but
must incorporate a whole series of metrics, across a number of performance dimensions,
including input, process and output metrics and metrics measuring intangible aspects of
performance (Kaplan and Norton, 1992). Though Balanced Score Card was developed mainly
for the corporate world, modified versions were developed for the R&D organisations (Osama,
2006). The above discussions highlight the multidimensionality and complexity of R&D
performance measurements and the need for comprehensive R&D KM model that addresses the
above complexities.
1.8 RESEARCH MOTIVATION
Despite the availability of many KMM models in literature, a comprehensive framework that can
represent different perspectives and provide a holistic picture, is not found in literature. Also it
can be seen that each model has certain strengths and interesting features. Some of the models
were developed by practitioners, for the use in their own organisation or for use as a consultancy
service. Some other models were developed by academicians. In many instances the assessment
methodology, validation etc. were not covered. Also the flexibility and adaptability of these
models to various organisational environments is neither discussed nor known. Hence,
practically adapting the model developed in the context of one organisation to another

44
organisation with the publically available information has difficulties. Hence, there is adequate
motivation to develop a new model which will satisfy the following requirements:
The model is to be developed in the context of Nuclear R&D organisation
The model should be modular in structure for ease in design and use
It should be flexible for continual improvement to suit the various changes in
organisational environments
The model should be practically adaptable to any organisation
1.9 RESEARCH OBJECTIVES
In this context, the following research objectives were arrived at:
Identify a morphological framework for KM maturity models for holistic representation.
Develop a flexible KM maturity model in the context of nuclear R&D organisation.
Validate the model.
Assess the current level of KM maturity of the context organisation and its sub units
using the developed model, thereby demonstrating the applicability of the model.
Identify the inhibiting factors to attain higher levels of maturity for the context
organisation and its sub units.
Arrive at an appropriate recommendation for the context organisation to achieve higher
levels of KM maturity.
Study the knowledge creation process and the context of knowledge creation (ba) in one
sub unit of the organisation.
Develop of a taxonomy of knowledge pertaining to one sub unit of the organisation.

45
1.10 RESARCH METHODOLOGY
The research methodology used is an exploratory study. A combination of case study and survey
was used without triangulation. Case study was used to identify the KM maturity levels of the
organisation and its 10 sub units, while survey was used to identify the inhibiting factors to attain
higher levels of KM maturity for the organisation and its 10 sub units. According to Yin (2009),
case studies are preferred, when how or why questions are posed, the investigator has little control
over the events and the focus is on a contemporary phenomenon with in a real-life context. In
case studies the richness of the phenomenon and the extensiveness of the real life context require
the case study investigators to cope with technically distinctive situations of more variables of
interest than data points. Here, an essential tactics is to use multiple sources of evidence, with
data needing to coverage in a triangular fashion (Yin, 2009).
Four tests that have been commonly used to establish the quality of any empirical research are
construct validity, internal validity, external validity and reliability (Yin, 2009). Construct validity
is concerned with identifying correct operational measures for the concepts being studied. Internal
validity is concerned with establishing causal relationship in which certain conditions are believed
to lead to other conditions. External validity is concerned with generalization of the findings of
the study. Reliability is concerned with demonstrating that the operations of the study can be
repeated with the same results. The goal of reliability is to minimize the biases in the study.
Through literature survey and morphological analysis of KM maturity models, the attractive
features of the existing models were identified. Based on this, a new flexible KM maturity model
with the attractive features of the existing models has been developed. The model has been
demonstrated and validated through the case study of a nuclear R&D organisation. The current
KM maturity levels of the organisation and its 10 subunits has been assessed through the case

46
study. The inhibiting factors to attain higher level of KM maturity of the target organisation and
its subunits were identified through a survey. The knowledge creation process and the context of
knowledge creation (ba) in the organisational context and in the context of one subunit of the
organisation were studied. A taxonomy pertaining to the knowledge of one subunit was
developed. The recommendations to attain higher level of KM maturity for the organisation were
given.
1.11 OVERVIEW OF THE THESIS
In Chapter 2 morphological analysis of KMM models is described. In Chapter 3 the development
of a new flexible KMM model, is discussed. In Chapter 4 the demonstration of the model through
a case study approach is covered. In Chapter 5 the inhibiting factors to attain higher levels KM
maturity for the target organisation through survey methodology are discussed. In Chapter 6 the
study of knowledge creation process and the context of knowledge creation (ba) in the
organisation and in one of the subunits of the organisation is discussed. Development of a
taxonomy pertaining to the knowledge of that subunit is also described. In Chapter 7 the
conclusions and recommendations are discussed. In Chapter 8 the future directions are explained.

47
CHAPTER 2
MORPHOLOGICAL ANALYSIS OF KNOWLEDGE
MANAGEMENT MATURITY MODELS
In this chapter morphological analysis of KMM models is presented. In order to provide a road
map for KM implementation, many practitioners and researchers have developed KMM models.
What are the different forms, structure and characteristics of these KMM models? Despite the
availability of many models in literature, a comprehensive framework that can represent different
perspectives and provide a holistic picture of KMM model is not found in literature. A
morphological framework of KMM models addresses this issue and this is discussed in this
chapter.
2.1 MORPHOLOGICAL ANALYSIS
The term morphology comes from classical Greek (morphe) and means the study of shape or
form. It is concerned with the structure and parts of an entity (object) and how these fit together
to form a whole. The entity can be physical, social or conceptual (Ritchey, 2006). Morphological
analysis is a method of structuring and investigating the total set of relationships, contained in
multidimensional, non quantifiable problem complexes (Zwicky, 1969, cited by Ritchey, 2006).
Morphological analysis commences by identifying and defining the dimensions (parameters) and
probable options (values) of the entity to be analyzed. A morphological box, also known as
Zwicky box, is constructed by setting the dimensions and options in an ‗n‘ dimensional matrix.
Each cell of the n dimensional box contains one particular option for each of the dimensions,
which indicates a particular configuration of the entity. Each option in a dimension is a row in the

48
matrix. The rows of same dimension are parallel to each other, and orthogonal to the rows of
other dimensions. The rows of different dimensions intersect each other to form cells in the
morphological box.
As a simple example, imagine a car with three dimensions size, color and engine type. Let the
probable options for size be small, medium & large, for color be white, black, red & green and for
engine type be petrol & diesel. Since there are 3 options for size, 4 options for color & 2 options
for engine there are 24 (3*4*2) cells in the morphological box, each representing one particular
car with one option for each dimension. The 3 dimensional matrix containing all the possible
relationships is the complete and systematic morphological field.
2.1.1 Dimensions and Options
The morphological frame work developed for this work has identified six dimensions. Each
dimension has two or more options. 15 KMM models from literature discussed in Chapter 1,
Section 1.6.2 were used as the basis for the dimensions and options. The dimensions and options
are discussed below:
Context: The dimension ‗Context‘ refers to the context in which the maturity model has been
developed. The maturity model can be developed in the context of a specific organisation or a
specific industry sector like software, manufacturing, R&D etc. Also, it could be developed in a
general context without any reference to any organisation or any industry sector. Hence the 3
options considered for the dimension ‗Context‘ are ‗General‘, ‗Organisation‘ and ‗Industry
Sector‘. Certain models clearly specify the context of development. For example the KMM
(Kochikar) explicitly mention that the context is organisational. Some other models clearly

49
specify that, the model has been developed keeping the context of a specific industry sector. Some
models explicitly mention that the model is developed in the general context.
Out of the 15 models studied, it was observed that eight (53.4%) models were developed in the
general context, four(26.6%) were in the context of specific organisation and three(20%) were in
the context of specific industry sector.
Applicability:The dimension ‗Applicability‘ refers to the entity to which the model can be
applied. The maturity model may be applicable in general to any organisation, or it may be
applicable only for the specific organisation, or to the specific industry sector. Hence the options
of the dimension ‗Applicability‘ are ‗General‘, ‗Organisation‘ and ‗Industry Sector‘. It can be
noticed that the options of the dimension ‗Context‘ and ‗Applicability‘ are identical. Does it
indicate that the two dimensions are the same? It can be observed from Table 3.2 that, the models
developed in the context of ‗Organisation‘ has the ‗General‘ applicability. For example the KMM
(Kochikar) , explicitly mention that the context is organisational, while the applicability is
general; ― while the model has been developed keeping the Infosys context and KM goals in
mind, it is sufficiently generic to be used in any organisation which considers knowledge leverage
as significant determinant of success‖ (Kochikar, 2000). Hence, it can be concluded that the
dimensions ‗Context‘ and ‗Applicability‘ are different.
Out of the 15 models studied, it was observed that twelve (80%) models have a general
applicability three (20%) models have specific industry sector applicability and none (0%) have
organisation specific applicability.
50
Levels: Theoretically the model can progress from a lower level of perfection to a higher level of
perfection either in stages or continuously. However all the models reviewed used a staged model
of progression. Hence, the continuous model of progression is not considered. The dimension
‗Levels‘ indicates the number of maturity levels from the lowest level of perfection to the highest
level of perfection. Ideally, the options for ‗Levels‘ could be any positive number. However, the
options considered in this analysis are, the number of levels used in the models reviewed (4, 5,
6&8).
Out of the 15 models analysed, it was observed that nine (60%) models had 5 levels, three (20%)
models had 4 levels, two (13.3%) models had 6 levels and one (6.7%) model had 8 levels.
Assessment: The dimension ‗Assessment‘ indicates the methodology suggested or described in
the model to assess the knowledge management maturity level of the organisation. It could be
subjective in the sense that the evaluation is purely based on the opinion expressed by various
stake holders. It could be objective in the sense that the evaluation involves collection and
analysis of evidences to support the opinion expressed by various stake holders. Some of the
models do not explicitly mention the assessment methodology. Hence, three options considered
are ‗Subjective‘, ‗Objective‘ and ‗Not known‘.
Out of the 15 models studied, it was observed that eight (53.4%) models have not mentioned the
assessment methodology, five (33.3%) models have used objective methodology, while two
(13.3%) models have used subjective methodology.
Validation : The dimension ‗Validation‘ indicates the methodology used to validate the model.
The model could be validated by empirical methods, or by case study method, in the context of

51
one or more organisations. It could also be possible that the model be validated by more than one
method. However, that option was not considered, since none of the models studied, used
multiple methods. In majority of the models, the validation is not specified, indicating that the
model may not be validated or the validation details cannot be revealed due to confidentiality.
Hence the options considered are ‗Empirical‘, ‗Case study‘ and ‗Not known‘.
Out of the 15 models studied, it was observed that twelve (80%) models have ―not known‖
validation methodology, two (13.3%) models have used case study methodology, while one
(6.7%) model had used empirical methodology.
Key Areas: The dimension ‗Key Areas‘ indicates the key areas considered by the model to
characterize various maturity stages. Some of the models have used specific key areas like people,
process, technology, knowledge, content, culture, leadership, strategy, etc. These models have
used a set of Key Areas such as ―people, process, technology‖, ―people, process, content,
technology‖ etc. Only the set of ―people, process, technology‖ is used by 4 models
[KMM(Kochikar), KPQ(Paulzen), 5iKM3(Mohanty) and G-KMM(Pee)]. Also many models
include the Key Area like ‗people‘, ‗technology‘ etc. in their respective set of Key Areas. Hence,
for simplicity the options considered are ‗General‘ which indicates, that characteristics are
described in general terms, without any specific Key Areas and ‗Specific‘, which indicates that
characteristics are described in terms of specific Key Areas.
Out of the 15 models studied, it was observed that eleven (73.3%) models described the
characteristics in terms specific Key Areas and four (26.7%) models have described
characteristics in general terms. Table 2.1 depicts the overall results of morphological analysis
carried out based on the 15 models studied.

52
Table 2 .1 Morphological analysis of 15 KMM models analysed
Sl.
No.
Dimension Options Models No. of
Models
% of
Models
1. Context General KMM(Hubert),
KMM(Klimko),
Knowledge
Journey(KPMG),
KPQ(Paulzen),
K3M(Wisdom Source),
Strategic KMM(Kruger),
KM3(Gallagher),
G-KMM(Pee)
8 53.4
Organisation KMM(Kochikar),
KM CA(Kulkarni),
5iKM3(Mohanty),
KMM(Ehms),
4 26.7
Industry
Sector
KMM(Natarajan),
KMM(Gottschalk),
KMM(Boyles)
3 20

53
2. Applicability General KMM(Kochikar),
KMM(Hubert),
KM CA(Kulkarni),
KMM(Klimko),
Knowledge
Journey(KPMG),
5iKM3(Mohanty),
KMM(Ehms),
KPQ(Paulzen),
K3M(Wisdom Source),
Strategic KMM(Kruger),
KM3(Gallagher),
G-KMM(Pee)
12 80
Organisation 0 0
Industry
Sector
KMM(Natarajan),
KMM(Gottschalk),
KMM(Boyles),
3 20
3. Levels 4 KMM(Natarajan),
KMM(Gottschalk),
KM3(Gallagher)
3 20
5 KMM(Kochikar),
KMM(Hubert),
KMM(Klimko),
Knowledge
Journey(KPMG),
KPQ(Paulzen),
5iKM3(Mohanty),
KMM(Ehms),
G-KMM(Pee),
KMM(Boyles),
9 60
6 KMCA(Kulkarni),
Strategic KMM(Kruger)
2 13.3
8 K3M(Wisdom Source) 1 6.7

54
4. Assessment Subjective KMCA(Kulkarni),
KMM(Boyles)
2 13.3
Objective KMM(Kochikar),
5iKM3(Mohanty),
KMM(Ehms),
KM3(Gallagher),
G-KMM(Pee)
5 33.3
Not known KMM(Hubert),
KMM(Klimko),
Knowledge
Journey(KPMG),
KMM(Natarajan),
KPQ(Paulzen),
K3M(Wisdom Source),
KMM(Gottschalk),
Strategic KMM(Kruger)
8 53.4
5. Validation Case Study KMM(Natarajan),
G-KMM(Pee)
2 13.3
Empirical KM CA(Kulkarni) 1 6.7
Not known KMM(Kochikar),
KMM(Hubert),
KMM(Klimko),
Knowledge
Journey(KPMG),
KPQ(Paulzen),
5iKM3(Mohanty),
K3M(Wisdom Source)
KMM(Gottschalk),
KMM(Ehms), Strategic
KMM(Kruger),
KM3(Gallagher),
KMM(Boyles)
12 80

55
6. Key Areas General KMM(Hubert),
KMM(Klimko),
K3M(Wisdom Source),
Strategic KMM(Kruger)
4 26.7
Specific KMM(Kochikar),
KPQ(Paulzen),
5iKM3(Mohanty),
G-KMM(Pee),
KMCA(Kulkarni),
Knowledge
Journey(KPMG),
KMM(Natarajan),
KMM(Gottschalk),
KMM(Ehms),
KM3(Gallagher),
KMM(Boyles)
11 73.3
2.1.2 Discussions and Contributions
The morphological analysis described, provides a holistic view of the KM maturity models based
on the published literature. Analyzing different KMM models based on different options provide
multiple perspectives. It provides an indication of the options of various dimensions, which
different models have dealt used. The analysis also provides a quantitative picture of the usage of
various options by the models in the literature.
Each model can be described in terms of a specific combination of the options. For example
KMM(Kochikar) can be described by the following combination of dimensions. Context:
Organisation/ Applicability: General/ Levels: 5/ Assessment: Objective/ Validation: Not
known/ Key Areas: Specific/. Other KMM models can also be mapped into the morphological
frame work and analyzed in terms of the dimensions and options.

56
The morphological analysis considered 6 dimensions and constitutes a 6 dimensional matrix. The
total number of cells in the morphological box as depicted in Table 2.2 is 648(3*3*4*3*3*2).
This indicates 648 KMM models are possible based on the dimensions and options considered.
The morphological analysis of KMM models has implications both for practitioners and
researchers. A practitioner can classify certain options as strengths and then evaluate various
models based on the morphological framework and select an appropriate framework that has
maximum relevance. A researcher interested in developing a flexible model in the context of an
organisation can evaluate the available models in the literature based on the morphological
framework and design a KMM model. This approach is used in this thesis to develop a flexible
and adaptable model.
Table 2.2 Morphological Box
Sl.
No.
Dimension Options No. of
Options
1. Context General
3 Organisation
Industry
Sector
2. Applicability General
3 Organisation
Industry
Sector
3. Levels 4
4 5
6
8
4. Assessment Subjective
3 Objective
Not known
5. Validation Case Study
3 Empirical
Not known
6. Key Areas General 2
Specific

57
2.2 SUMMARY
In this chapter a morphological framework proposed for developing a flexible KMM model is
described. The morphological framework based on the 15 KMM models studied, provided a
quantitative analysis of the extent of usage of different options by various models.

58
CHAPTER 3
DEVELOPMENT OF KMI-KMM MODEL
In this chapter, Key Maturity Indicator (KMI) based KMM model is proposed. The
characteristics of 15 relevant models are discussed, the attractive features are identified and KMI-
KMM model is presented.
3.1 CHARACTERISTICS OF KNOWLEDGE MANAGEMENT MATURITY
MODELS
The characteristics of the 15 KMM models studied along with their strengths are summarized in
Table 3.1. In Table 3.1, column 2 lists the model names followed by the authors. The models
are named with the name of the first author, wherever available. Column 3 lists the KAs identified
in the model. The models which did not identify any KA are represented as ‗Generic‘. Column 4
lists the number of levels of the models followed by the names of the levels. Column 5 lists the
characteristics of the maturity levels in progression from the lowest level to the highest level.
Column 6 lists the identified strengths of the KMM model.

59
Table 3.1 Characteristics of the 15 KMM Models Studied
Sl.
No.
Model Name
and Author
Key Areas No of Levels
and Names
Characteristics of Levels Strengths
1 KMM (Kochikar)
Kochikar (2000)
People
Process
Technology
5
Default
Reactive
Aware
Convinced
Sharing
Fragmented knowledge
Need based knowledge sharing
Organisation-wide knowledge sharing systems
with visible link between KM processes and results
Self-sustaining KM movement
Institutionalization of knowledge sharing culture
Detailed description of
general behavioral
characteristics and
specific characteristics
based on KA at each
level. An objective
assessment methodology
2 KMM (Hubert )
Hubert and
Lemons (2010)
Generic
5
Initiate
Develop
Standardize
Optimize
Innovate
Informal and inconsistent KM processes
Establishment of a KM strategy that is tightly
linked to the business strategy
Refining the KM processes into standard replicable
methodologies
Expansion of KM strategy throughout the
organisation
Continuous improvement, Institutionalization and
breakthrough innovation
KM strategy that is
linked to business
strategy. Individual,
departmental and
organisational
performance assessment
aligned with the KM
strategy.
3 KMCA(Kulkarni)
Kulkarni and
Freeze
( 2004)
Knowledge
6
Difficult
Possible
Encouraged
Discouragement for knowledge sharing
Selective knowledge sharing
Recognition and reward for knowledge sharing
KM enabling of normal workflow
Detailed assessment
methodology.
Validation of the model
Use of micro maturity

60
Sl.
No.
Model Name
and Author
Key Areas No of Levels
and Names
Characteristics of Levels Strengths
Enabled
Managed
Continuously
Improved
Monitoring and measuring of knowledge sharing
Systematic measurement and improvement of
knowledge sharing
levels such as +, ++ etc.
4 KMM(Klimko)
Klimko
( 2001)
Generic
5
Initial
Knowledge
Discoverer
Knowledge
Creator
Knowledge
Manager
Knowledge
Renewer
Lack of specific attention for KM activities
Recognition of the importance of existing
knowledge
Identification and creation of new knowledge
required for future activities
Institutionalization of KM function with dedicated
KM unit with documented and measurable KM
processes
Knowledge sharing with other organisations and
exploiting common ways of knowledge creation
Advanced and
Innovative knowledge.
Documented and
measurable KM
processes.
Inter- organisational
knowledge sharing.
5 Knowledge
Journey(KPMG)
KPMG (2000)
People
Process
Content
Technology
5
Knowledge
Chaotic
Knowledge Aware
Knowledge
Focused
Knowledge
Lack of visible relationship between KM and
achievement of organisational goals
Implementation of KM pilot projects
Organisation-wide usage of KM tools and
realization of business benefits
Implementation of integrated framework for KM
tools and procedures
Identification of
characteristics in terms
KAs like people,
process, technology and
content.

61
Sl.
No.
Model Name
and Author
Key Areas No of Levels
and Names
Characteristics of Levels Strengths
Managed
Knowledge
Centric
Adoption of KM procedures and tools as integral
part of organisational and individual processes
6 KMM (Natarajan)
Natarajan (2005)
Business Process
Readiness
Technology
Infrastructure
Human
Behaviour
Leadership
4
K-stages
Lack of specific KM
Establishment of information sharing mechanism
Establishment of systematic KM processes
Institutionalization of KM as an integral part of
business activity
Validation of the model
7 KPQ (Paulzen)
Paulzen and
Perc(2002)
Organisation
People
Technology
5
Initial
Aware
Established
Quantitatively
Managed
Optimizing.
Unplanned knowledge processes
Implementation of the first structure to ensure a
higher process quality
Systematic structure and definition of knowledge
processes
Enhancement of the process management through
tracking the performance measures
Establishment of structures for continuous
improvement
Integration of KM
processes in to business
process.
8 5iKM3
(Mohanty)
People
Process
5
Initial
Lack of formal processes for effective usage of
organisational knowledge
Integration of KM
processes to business

62
Sl.
No.
Model Name
and Author
Key Areas No of Levels
and Names
Characteristics of Levels Strengths
Mohanty and
Chand (2004)
Technology
Intent
Initiative
Intelligent
Innovative.
Realization of the potential in harnessing
organisational knowledge for business benefits
Knowledge enabled business processes and
realization of its business impacts
Matured collaboration and collective organisational
intelligence
Utilization of organisational knowledge for
continuous process optimization and business
advantage
process and business
benefits
An assessment model
that includes a proposed
solution.
9 K3M
Wisdom Source
(2004)
Generic.
8
Infrastructure For
Knowledge Sharing
Top-Down Quality
Assured
Information Flow
Top-Down
Retention
Measurement
Organisational
Learning
Organisational
Knowledge Base
Capturing and delivering of knowledge in
repeatable steps
Identification of executive block of knowledge that
is critical to lead the organisation as a cohesive unit
Measurement of team understanding of executive
knowledge
Culture of knowledge sharing and organisational
learning
Culture of continuous improvement and innovation
Result focused process frame work
Culture of knowledge creation
Continuous process development
Good concentration on
process improvement.

63
Sl.
No.
Model Name
and Author
Key Areas No of Levels
and Names
Characteristics of Levels Strengths
Process-Driven
Knowledge Sharing
Continual Process
Improvement
Organisational Self-
Actualization
10 KMM(Gottschalk )
Gottschalk (2002)
Technology
Knowledge
4
End User Tools
Who Knows
What
What They Know
What They Think
Usage of standardized productivity tools by
knowledge workers
Creation of knowledge maps
Usage of data mining technology to retrieve
relevant knowledge
Availability of AI techniques for solving
knowledge problems
Good concentration on
technology.
11 KMM(Ehms)
Ehms and Langen
(2002)
Strategy &
Knowledge
Goals
Environment &
Partnerships
People &
Competencies
5
Initial
Repeated
Defined
Managed
Optimizing
Lack of conscious control of knowledge process
Recognition of the importance of KM activities in
business
Stable and practiced KM activities that are
integrated into day to day work processes with
necessary technical systems and KM roles
Measurement of KM efficiency
Organisational ability to adapt to any new KM
Integration of KM
processes in to business
process.
KM Measurements
An objective assessment
methodology

64
Sl.
No.
Model Name
and Author
Key Areas No of Levels
and Names
Characteristics of Levels Strengths
Collaboration &
Culture
Leadership &
Support
Knowledge
Structures &
Knowledge
Forms
Technology &
Infrastructure
Processes
Roles &
Organisation
requirements
12 KMM(Kruger)
Kruger and
Snyman (2007)
Generic
5
Initial
Repeated
Defined
Managed
Optimizing
Lack of awareness on the importance of knowledge
as a strategic resource and ineffective management
of Information and Communication Technology
Recognition of the importance of KM function and
evolution of ICT systems into data and information
systems
Formulation of organisation-wide KM policy and
implementation of ICT systems to support
management decisions and knowledge work
KM policy and strategy.
Good concentration on
technology KA
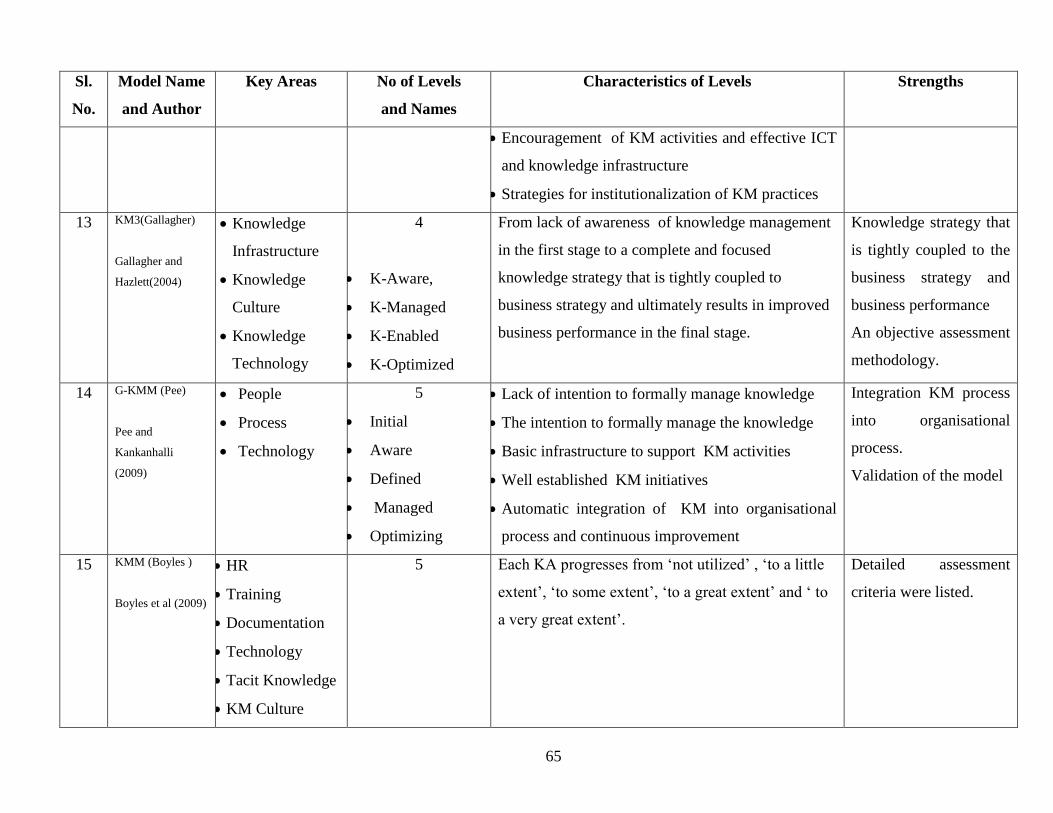
65
Sl.
No.
Model Name
and Author
Key Areas No of Levels
and Names
Characteristics of Levels Strengths
Encouragement of KM activities and effective ICT
and knowledge infrastructure
Strategies for institutionalization of KM practices
13 KM3(Gallagher)
Gallagher and
Hazlett(2004)
Knowledge
Infrastructure
Knowledge
Culture
Knowledge
Technology
4
K-Aware,
K-Managed
K-Enabled
K-Optimized
From lack of awareness of knowledge management
in the first stage to a complete and focused
knowledge strategy that is tightly coupled to
business strategy and ultimately results in improved
business performance in the final stage.
Knowledge strategy that
is tightly coupled to the
business strategy and
business performance
An objective assessment
methodology.
14 G-KMM (Pee)
Pee and
Kankanhalli
(2009)
People
Process
Technology
5
Initial
Aware
Defined
Managed
Optimizing
Lack of intention to formally manage knowledge
The intention to formally manage the knowledge
Basic infrastructure to support KM activities
Well established KM initiatives
Automatic integration of KM into organisational
process and continuous improvement
Integration KM process
into organisational
process.
Validation of the model
15 KMM (Boyles )
Boyles et al (2009)
HR
Training
Documentation
Technology
Tacit Knowledge
KM Culture
5 Each KA progresses from ‗not utilized‘ , ‗to a little
extent‘, ‗to some extent‘, ‗to a great extent‘ and ‗ to
a very great extent‘.
Detailed assessment
criteria were listed.

66
3.2 THE PROPOSED KNOWLEDGE MANAGEMENT MATURITY MODEL
From Table 3.1 it is clear that each model has certain strengths. Some of the models were
developed by practitioners, for use in their own organisation or for use as consultancy service
[KMM(Kochikar), KMM(Ehms) etc. ]. For these models the details of assessment methodology,
validation etc. are not available in open literature. Some other models are developed by
academicians, where the assessment methodology, validation etc. are not done in detail
[KMM(Klimko), KPQ(Paulzen) etc.]. Also details concerning flexibility and adaptability of these
models to various organisational environments is scarce in open literature. Hence, practically
adapting one model to another organisation may pose difficulties.
In view of this, a new KMM model is proposed which will satisfy the following requirements:
The context of the model is nuclear R&D organisation
The model should be modular in structure for flexibility
The Key Areas in KM are People, Process, Technology, Knowledge and RoI
The model should be capable to assess the current maturity level individually in different
Key Areas and the overall KM
The model should have micro maturity levels like +, ++, similar to the ones used by
Kulkarni and Freeze (2004) to motivate the organisation in improving the maturity level as
shown in Table 3.1, Sl.No.3
The model should be adaptable to other general organizations as well as specific industries
Possibility to consider the extended value chain of the organisation.

67
The development of the KMM model proceeds with the identification of the specific options for
various dimensions identified in the morphological analysis carried out in Chapter 2. The KMM
model development process is depicted in Figure 3.1.
Figure 3.1 KMM model development process
In the context of this research work, the dimensions and options selected are listed below:
Context - Organisation (Nuclear R&D).
Applicability - General
Key Areas – Specific (People, Process, Technology, Knowledge & RoI).
Number of Levels - 6
Assessment - Objective
Validation - Expert Judgment/Case Study

68
3.2.1 Key Areas
The Key Areas considered are People, Process, Technology, Knowledge and Return on
investment (RoI) as represented in Figure 3.2, as they represent almost all organizations ensuring
adaptability
Figure 3.2 Key Areas
Each KA is identified with certain number of parameters called Key Parameters (KP). Each
parameter is identified with certain values called Key Values (KV). The Key Parameters
identified for different Key Areas and the Key Values are listed below.

69
3.2.2 Key Parameters
The Key Parameters for different Key Areas are listed below. The Key Parameters under the Key
Areas are considered as orthogonal. However some overlap among the Key Parameters is
possible because of the overlap among the Key Areas themselves. The classification of
parameters into different Key areas was done based on the larger dependence of the parameter on
a specific Key Area.
3.2.2.1 ‘People’ Key Parameters
In ‗People‘ Key Area six parameters viz Awareness, Participation, Reward and Recognition
Scheme, KM Roles, Communities of Practice, Mentoring and Succession Planning have been
considered. Awareness indicates the level of understanding and acceptance of employees the
practical meaning of KM as applicable to them in the organisational context. Though awareness
indicates the level of understanding, a process is necessary to measure and improve the
awareness. However, since it is more concerned with ‗People‘ the parameter is classified under
‗People‘. The parameter ‗Participation‘ indicates the level of participation of employees in formal
KM activities. Again though this parameter also indicates a level, a process is necessary to
measure and improve the participation. However since it is more concerned with ‗People‘ the
parameter is classified under ‗People‘. The parameter ‗Reward and Recognition Scheme‘
indicates the effectiveness of reward and recognition schemes to motivate employees for
voluntary participation in formal KM activities. Though introduction of ‗Reward and Recognition
Scheme‘, measuring its effectiveness etc. requires a process, since the parameter indicates the
effectiveness, which is a people dependent level resulting from the scheme, the parameter is
classified under ‗People‘. The parameter ‗KM roles‘ indicates the effectiveness of KM roles like
Chief Knowledge Officer, Departmental Knowledge Officers etc. A process is necessary to create
KM roles and assess the effectiveness etc. Since the parameter indicates the effectiveness of the

70
roles which is more ‗People‘ dependent, it is classified under ‗People‘. The parameter
‗Communities of Practice‘ indicates the effectiveness of knowledge sharing communities.
Though a process is necessary to create ‗Communities of Practice‘ and assess its effectiveness
etc., since the parameter indicates the effectiveness of knowledge sharing communities, which is
more ‗People‘ dependent, it is classified under ‗People‘. The parameter ‗Mentoring and
Succession Planning‘ indicates the effectiveness of mentoring and succession planning. Though a
process is necessary to implement ‗Mentoring and Succession Planning‘ scheme and assess its
effectiveness, since the parameter indicates the effectiveness of the scheme, which is more
‗People‘ dependent, it is classified under ‗People‘.
3.2.2.2 ‘Process’ Key Parameters
In the Key Area ‗Process‘ four parameters viz KM Policy, KM Strategy, KM Processes and
Process Integration have been chosen. The parameter ‗KM Policy‘ indicates the effectiveness of
KM Policy which is a statement of intent of what one wants to achieve with KM. This parameter
sets the goals of KM for the organisation. The effectiveness of KM policy depends on the policy
and its implementation. Since this parameter is more related to ‗Process‘, it is classified under
‗Process‘. The parameter ‗KM Strategy‘ indicates the effectiveness of KM strategy which is a
statement of how one wants to achieve KM. It is the effectiveness of the methods used by the
organisation to achieve its KM goals. Since this parameter is more related to ‗Process‘, it is
classified under ‗Process‘. The parameter ‗KM Processes‘ indicates the overall effectiveness of
different KM processes viz. Knowledge identification, knowledge creation, knowledge
acquisition, knowledge preservation, knowledge quality rating, knowledge sharing, knowledge
utilization and KM RoI measurement. This parameter is classified under ‗Process‘. The
parameter ‗Process integration‘ indicates level of integration and the effectiveness of integration
of KM processes (which are listed under KM Process) with normal work processes. This

71
parameter is classified under ‗Process‘. All these processes have some element of ‗People‘,
because these are implemented by people. However since these parameters are more process
related than people related, these have been considered under ‗Process‘.
3.2.2.3 ‘Technology’ Key Parameters
In the Key Area ‗Technology‘ six parameters viz. Network, Data and Information Management,
Explicit Knowledge Management, Tacit Knowledge Management, KE Techniques and
Technology Integration have been considered. The parameter ‗Network‘ indicates the
effectiveness of organisation-wide connectivity of computer systems and other related resources.
The parameter ‗Data and Information Management‘ indicates the effectiveness of organisation-
wide data and information system. The parameter ‗Explicit Knowledge Management‘ indicates
the effectiveness of technology for content management. The parameter ‗Tacit Knowledge
Management‘ indicates the effectiveness of technology for collaboration and management of tacit
knowledge. The parameter ‗KE Techniques‘ indicates the effectiveness of AI and KE techniques
for knowledge elicitation, knowledge representation, knowledge retrieval, inference etc. The
parameter ‗Technology Integration‘ indicates the level of integration and its overall effectiveness
of various technology enabled systems of the organisation like Data Management Systems,
Information Management Systems, Content Management Systems, Collaboration Systems, AI
and KE Systems etc. All the above parameters also have some relation to ‗People‘ because
technology infrastructure is used by people and some relation to ‗Process‘ because some
processes are required to implement the technology infrastructure and monitor its effectiveness.
However, since these are more technology related than people or process, these parameters are
classified under ‗Technology‘

72
3.2.2.4 ‘Knowledge’ Key Parameters
In the Key Area ‗Knowledge‘ four parameters viz Knowledge Classification, Knowledge
Capability Areas, Knowledge Organisation and Knowledge Value have been considered. The
parameter ‗Knowledge Classification‘ indicates the combined effectiveness of core, advanced and
innovative knowledge. The parameter ‗Knowledge Capability Areas‘ indicates the combined
effectiveness of data, knowledge documents, lessons learned, expertise, knowledge in the form of
Frequently Asked Questions (FAQ), blogs, wikis etc. The parameter ‗Knowledge Organisation‘
indicates the combined effectiveness of the organisation of the knowledge, based on knowledge
map, meta knowledge, taxonomy etc. The parameter ‗Knowledge Value‘ indicates the combined
value of the knowledge available in the organisational repository, as perceived by the
organisation. Although the above parameters have some relation to ‗People‘ and ‗Process‘, since
these are more related to ‗Knowledge‘ these are classified under ‗Knowledge‘.
3.2.2.5 ‘RoI’ Key Parameters
In the Key Area ‗RoI‘ three parameters viz Employee Satisfaction, Productivity and
Organisational Reputation have been considered. The parameter ‗Employee Satisfaction ‘
indicates the level of satisfaction of employees on KM activities. The parameter ‗Productivity‘
indicates productivity improvement due to KM activities. The parameter ‗Organisational
Reputation‘ indicates Improvement in organisational reputation due to KM activities. Though
the above parameters also have some relation to ‗People‘ and ‗Process‘, since these are more
related to ‗RoI‘ these are classified under ‗RoI‘.
Key Parameters of different Key Areas in the proposed KMM model are summarized listed in
the Table 3.2.

73
Table 3.2 Key Parameters
Sl. No
KA Key Area Sl. No
KP Key Parameters Description
1
People
1 Awareness The level of understanding and acceptance of employees the practical
meaning of KM as applicable to them in the organisational context.
2 Participation The level of participation of employees in formal KM activities.
3 Reward and Recognition
Scheme
The effectiveness of reward and recognition schemes to motivate
employees for voluntary participation in formal KM activities.
4 KM roles The effectiveness of KM roles which can be full time or part time.
5 Communities of Practice The effectiveness of knowledge sharing communities.
6 Mentoring and Succession
Planning
The effectiveness of mentoring and succession planning.
2
Process
1 KM Policy The effectiveness of KM Policy which is a statement of intent of what
one wants to achieve with KM.
2 KM Strategy The effectiveness of KM Strategy which is a statement of how one
wants to achieve KM.
3
KM Processes
The KM processes considered are knowledge identification,
knowledge creation, knowledge acquisition, knowledge preservation,
knowledge quality, knowledge sharing, knowledge utilization and KM
RoI measurement. The parameter indicates the overall effectiveness of
KM processes.
4
Process Integration
Process integration refers to the integration of KM processes with
normal work processes. The parameter indicates the level of
integration and its effectiveness.
3
Technology
1
Network Network refers to organisation-wide connectivity of computer systems
and other related resources. The parameter indicates the effectiveness
of the network.
2
Data and Information
Management
The effectiveness of organisation-wide data and information system.

74
Sl. No
KA
Key Area Sl. No
KP
Key Parameters Description
3
Technology
3
Explicit Knowledge
Management
The effectiveness of technology for content management.
4 Tacit Knowledge
Management
The effectiveness of technology for collaboration and management of tacit
knowledge.
5 KE Techniques The effectiveness of AI and KE for knowledge elicitation, knowledge
representation, knowledge retrieval, inference etc.
6
Technology Integration
The integration of various technology enabled systems of the organisation like
Data Management Systems, Information Management Systems, Content
Management Systems, Collaboration Systems, AI and KE Systems etc. The
parameter indicates the level of integration and its overall effectiveness.
4
Knowledge
1
Knowledge
Classification
Knowledge is classified into core, advanced and innovative. The parameter
indicates the combined effectiveness of core, advanced and innovative
knowledge.
2
Knowledge Capability
Areas
The knowledge capability areas identified in the literature, viz, data,
knowledge documents,lessons learned, expertise and knowledge in the form of
Frequently Asked Questions (FAQ). Also it includes unapproved and un
solicited knowledge in the form of blogs, wikis etc. The combined
effectiveness is indicated by the parameter.
3
Knowledge Organisation
Knowledge organisation refers to the organisation of the knowledge based on
knowledge map, meta knowledge, taxonomy etc. and its combined
effectiveness is indicated by the parameter.
4 Knowledge Value The combined value of the knowledge available in the organisational
repository, as perceived by the organisation.
5
RoI 1 Employee Satisfaction The level of satisfaction of employees on KM activities.
2 Productivity Productivity improvement due to KM activities.
3 Organisational
Reputation
Improvement in organisational reputation due to KM activities.

75
3.2.3 Key Values
The ‗Key Values‘ identified for the Key Parameters are:
Nil
Low
Medium
High
0 – 100
The value ‗Nil‘ indicates that the key parameter is either not applicable or not assessed or does
not exist. The values ‗Low‘, ‗Medium‘ and ‗High‘ indicate that the key parameter is assessed
qualitatively. The value 0-100 indicates that the key parameter is assessed quantitatively and it is
expressed as percentage.
3.2.4 Maturity Levels and Maturity Indicators
The proposed KMI-KMM model has six maturity levels (level 0 to level 5). The maturity levels
are named as:
Default (0)
Initial (1)
Qualitative Development (2)
Quantitative Development (3)
Maturity (4)
Extended-Organisational Maturity (5)
The uniqueness of the proposed proposed model is the use of extended organisational maturity as
level 5. The proposed KMI-KMM model identifies different maturity levels by a specific
combination of Key Maturity Indicators (KMI). Each KMI is identified by a specific combination
of KA, KP and KV. For an organisation to be in a specific maturity level, all the KMIs pertaining

76
to that level and all preceding levels need to be satisfied. No level can be skipped. Micro maturity
levels such as + and ++ similar the ones proposed in Kulkarni and Freeze (2004), are proposed in
this KMM model to motivate organisations to improve the maturity levels.
If an organisation satisfies all the KMIs pertaining to one level, say level 1, and at least one KMI
pertaining to the next level (level2) for each KA, or KV exceeds the requirements of the particular
level (level 1) for at least one KP for each KA, then that organisation is considered to be in a
level 1+. Similarly, if the organisation satisfies at least 50% of the KMIs pertaining to level 2 for
each KA, or KV exceeds the requirements of the particular level (level 1) for 50% of KPs for
each KA, then that organisation is considered to be in a level of 1++. Also if the organisation
satisfies all KMIs of level 1 and satisfies at least one KMI of level 2 or KV exceeds the
requirements of the particular level(level 1) for at least one KP for a specific KA, then that
organisation is considered to be in level 1 in the overall maturity and 1+ in that specific KA
alone. Similarly if the organisation satisfies all KMIs of level 1 and satisfies at least 50 % of the
KMIs of level 2 or KV exceeds requirement of the particular level(level 1) for at least 50% of the
KPs for one or more specific KAs alone, then that organisation is considered to be in level 1 in
the overall maturity and 1++ in the specific KAs alone. The maturity levels, their general
characteristics, characteristics in terms of Key Areas and Key maturity Indicators of different
levels are described below.
3.2.4.1 Level 0: Default
Level 0 is the basic level. By default all organisations will be at a minimum of level 0. It is
characterized by the absence of any formal KM activity. The organisation recognizes and rewards
only individual expertise and capabilities. Organisation is in a level of ‗unconscious
incompetence‘ in KM. The characteristics of Level 0 are as follows:

77
People: Awareness of KM may not exist. People work in isolation and compete with each other.
The thinking is ―we do not know anything about KM‖.
Process: The only KM processes are mandatory reports, formal training and informal
socialization.
Technology: Generally individual productivity tools are being used.
Knowledge: Only routine knowledge required for survival is created and shared through
training and informal socialization.
RoI: This Key Area is not applicable at this level, since formal KM does not exist.
Since this is the default level the Key Values of Key Parameters are not assessed.
3.2.4.2 Level 1 : Initial
It is characterized by the intention of the management to start formal knowledge management
activity. Though organisation does not have the clarity on how to proceed, it initiates KM
activities. Organisation generally works as silos and the knowledge sharing takes place only
within the silos. Though islands of excellence exist, pool of excellence is lacking. Organisation is
in a level of ‗conscious incompetence‘ in KM. The characteristics of Level 1 are as follows:
People : A low level of awareness of formal knowledge management and the need for knowledge
management exists among the employees. Participation in KM activities is low. Only part-time
KM roles exist. Mentoring and succession planning is prevalent in an adhoc way. The thinking is
―we need KM, but it is too difficult and time consuming‖
Process: A documented KM policy and KM strategy exists. Organisation-wide procedure for
documenting and selective sharing of routine and procedural knowledge exists. Procedure for
formal knowledge sharing sessions exists.
78
Technology: Organisation wide network exists. Isolated/networked systems for data,
information and explicit knowledge like publication, progress report, project reports etc., exist.
Also technology infrastructure for tacit knowledge sharing exists in a primitive level.
Knowledge: The quantity of routine and procedural knowledge shared has improved.
RoI: Since formal KM activities are only initiated RoI may be negligible.
3.2.4.3 Level 2: Qualitative Development
This stage is characterized by qualitative assessment of KM activities and its impact on the
performance of individuals, department and organisation. Based on the qualitative assessment, the
performance of KM activities and its impact on the organisational performance is good.
People: Organisation wide awareness and participation of KM activities is monitored
qualitatively and is good. Dedicated full time KM roles were created in addition to part time roles
with clear mandate and review mechanism. A committee of senior management reviews the
progress and takes appropriate corrective actions. Reward and recognition schemes are
introduced. Knowledge sharing communities are encouraged. Mentoring and succession planning
is practiced with appropriate knowledge transfer. The thinking is ―we are doing KM‖
Process: The effectiveness of KM policy and KM strategy is improved in a qualitative way.
Formal processes for knowledge identification, creation, acquisition, approval, quality rating,
preservation, sharing, utilization and impact assessment on performance of individuals,
department and organisation exists. All the formal processes are documented, the effectiveness is
measured qualitatively and corrective mechanisms are incorporated. The effectiveness of the
formal processes is good.
Technology: A user friendly knowledge portal with necessary content management and
collaboration technologies, and necessary security features is operational. Integration of

79
organisational data and information system with knowledge portal is being explored. Knowledge
engineering techniques are being explored for knowledge acquisition, knowledge representation,
knowledge retrieval and inference. The portal of the organization is so configured in such a way
that employees can do the information/knowledge oriented work from the portal itself. All the
necessary links to other internal and external websites and utilities are provided. The effectiveness
of the portal is monitored qualitatively and is good.
Knowledge: In addition to routine knowledge, advanced knowledge required for performance
improvement and future activities is created/ acquired and shared. Tacit knowledge is elicited and
shared across the organisation, in addition to sharing in communities. Knowledge is organized
with Knowledge Map, Meta Knowledge structure and taxonomy. Knowledge in the form of
Lessons Learned, Frequently Asked Questions (FAQ), Expertise, Data etc. are documented,
preserved and shared. Also unapproved and unsolicited knowledge is being shared. The quality
of knowledge and its organisation is measured qualitatively and is good.
RoI: Since formal KM activities are improved qualitatively the RoI should be good. Employees
are satisfied with the KM activities. Improvement in productivity and organizational reputation
due to KM initiatives are visible.
The Key Maturity Indicators for level0, level1 and level2 are given in Table 3.3

80
Table 3.3 KMI for Level 0,1 and 2
Key Area Key Parameters Key values
(Level 0)
Key values
(Level 1)
Key values
(Level 2)
People
Awareness Nil Low Medium
Participation Nil Low Medium
KM roles Nil Low Medium
Mentoring and Succession Planning Nil Low Medium
Communities of Practice Nil Nil Low
Reward and Recognition Scheme Nil Nil Low
Process
KM Policy Nil Low Medium
KM Strategy Nil Low Medium
KM Processes Nil Low Medium
Process Integration Nil Nil Low
Technology
Network Nil Medium High
Data and IM Nil Medium High
Explicit KM Nil Low Medium
Tacit KM Nil Low Medium
KE techniques Nil Nil Low
Technology Integration Nil Nil Low
Knowledge
Knowledge Classification Nil Low Medium
Knowledge Capability Areas Nil Nil Medium
Knowledge Organisation Nil Nil Medium
Knowledge Value Nil Nil Medium
RoI
Employee Satisfaction Nil Nil Medium
Productivity Nil Nil Medium
Organisational Reputation Nil Nil Medium
3.2.4.4 Level 3: Quantitative Development
This stage is characterized by quantitative assessment of KM activities and its impact on the
organisational performance. The organisation is able to quantitatively link the KM activities and

81
the organisational effectiveness in terms of various performance indicators. The effectiveness of
the measured parameters reaches more than 50% of the targeted value. Organisation reaches the
level of ‗conscious competence‘ in KM.
People: Awareness and acceptance of KM activities is improved significantly. More than 50% of
the employees are active participants in KM activities. Knowledge sharing communities exist
irrespective of departmental boundaries and more than 50% of the employees are members in one
or more knowledge sharing communities. People have started recognizing that knowledge
management is a part of the normal work. Dedicated KM roles, reward & recognition scheme and
mentoring and succession planning continues with quantitatively measurable RoI. The thinking is
―we are doing KM very well‖.
Process: The effectiveness of KM policy and KM strategy is improved and is more than 50% of
the targeted value. Organisation wide KM processes get integrated with normal work processes
with quantitative measurements and corrective mechanisms. More than 50% of the normal work
processes have integrated KM processes.
Technology: Integration of organisational data and information system with knowledge portal is
successful in locating the relevant knowledge. Isolated applications using KE techniques used for
knowledge acquisition, knowledge representation, knowledge retrieval and inference like natural
language processing, speech recognition, ontology, knowledge discovery through data mining /
text mining, case based reasoning, rule based reasoning etc are successful and is being integrated
with the knowledge portal. The portal is configured in such a way that more than 50% of the
employees do the information/knowledge oriented work from the portal itself. The effectiveness
of the knowledge portal is measured quantitatively and is more than 50%.
Knowledge: In addition to routine and advanced knowledge, innovative knowledge required for
innovations and leadership positions is created/ acquired and shared. The quality of knowledge in

82
Knowledge Capability Areas and its organisation is measured quantitatively in addition to
qualitative measurements. The overall quality of the knowledge shared is more than 50% of the
targeted value.
RoI: Employee satisfaction, productivity improvement and improvement in organisational
reputation due to KM initiatives are quantitatively monitored. These parameters are more than
50% of the targeted value indicating significant improvement in RoI.
3.2.4.5 Level 4: Maturity
Knowledge management has become an integral part of every activity and got embedded into the
organisational culture. The level is characterized by continual improvement and
institutionalization of the knowledge management practices. The effectiveness of the measured
parameters reaches more than 90%. Organisation reaches the level of ―unconscious competence‖
in KM.
People: Everyone recognizes knowledge management as an integral part of their work. They are
able to see the visible link which is backed by qualitative and quantitative measurements between
KM activities and performance & growth of individuals, department and organisation. People
have become insensitive to organisational hierarchies and affiliations as far as KM activities are
concerned. Collaborative activities and knowledge sharing communities are widespread
throughout the organisation. The effectiveness of KM roles has reached a level where dedicated
senior level KM roles like Chief Knowledge officer may get replaced with part-time roles, though
lower level roles for technology enhancement/maintenance may continue. The effectiveness of
reward & recognition scheme and mentoring and succession planning have reached a level where
exclusive schemes may get vanished and may become a part of the normal work culture.
Continual improvement in effectiveness of various parameters, performance, growth and RoI is

83
monitored and is moiré than 90%. The thinking is ―we have achieved in making KM a way of our
life‖.
Process: The effectiveness of KM policy, KM strategy, KM processes and process integration is
continually improved and is moiré than 90% of the targeted value. Process integration has reached
a level, where KM processes have become an integral part of every organisational activity
including organisational performance measurements.
Technology: The data and information system of the organisation get seamlessly integrated with
the knowledge management portal. KE techniques used for knowledge acquisition, knowledge
representation, knowledge retrieval and inference like natural language processing, speech
recognition, ontology, knowledge discovery through data mining / text mining, case based
reasoning, rule based reasoning etc are matured and get seamlessly integrated with the
knowledge management portal. The portal is configured in such a way that all the employees can
do all the information/knowledge oriented work from the portal itself. All the employees have
made the KM portal as their preferred home page. The security, reliability, availability, user
friendliness and effectiveness of the KM portal is continually improved and is more than 90%.
Knowledge: The quality and quantity of knowledge shared is continually improved and is more
than 90% of the targeted value. The knowledge necessary to carry out the current and future
activities of the organisation is guaranteed as an integrated package of explicit and tacit
knowledge.
RoI: Employee satisfaction, productivity improvement and improvement in organisational
reputation due to KM initiatives are than 90% of the targeted value, indicating a high level of
RoI. The organization is getting significant tangible and intangible benefits due to its investments
in KM initiatives.
The Key Maturity Indicators for level 3 and level 4 are given in Table 3.4

84
3.2.4.6 Level 5: Extended - Organisational Maturity
Level 5 is characterized by achieving maturity with respect to partnering organisations like,
suppliers, customers and other alliance organisations and seamless integration with these
organisations. Essentially, organisational boundaries with respect to knowledge management
breaks down and the target organisation along with the partnering organisations together as a
single entity reach the KMIs of level 4 maturity. However to achieve level 5 maturity, the
extended organisation may have to assess the current level and gradually progress from that
level, however low it is.
The Key Maturity Indicators for various maturity levels are summarized in Table 3.5 and they are
pictorially represented in Figure 3.3.
In Figure 3.3 each triangle in the pentagon represents a Key Area. The maturity levels (0-5) in
each KA are represented by the outer lines of each box within the triangle. The Key Parameters
and the corresponding Key Values for various Maturity Levels are represented in the respective
boxes in abbreviated form. The abbreviations are expanded and represented below the pentagon.

85
Table 3.4 KMI for Level 3 & 4
Key Area Key Parameters Key values %
(Level 3) Key values %
(Level 4)
People
Awareness >50 >90
Participation >50 >90
KM roles >50 >90
Mentoring and Succession Planning >50 >90
Communities of Practice >50 >90
Reward and Recognition Scheme >50 >90
Process
KM Policy >50 >90
KM Strategy >50 >90
KM Processes >50 >90
Process Integration >50 >90
Technology
Network >50 >90
Data and Information Management >50 >90
Explicit KM >50 >90
Tacit KM >50 >90
KE techniques >50 >90
Technology Integration >50 >90
Knowledge
Knowledge Classification >50 >90
Knowledge Capability Areas >50 >90
Knowledge Organisation >50 >90
Knowledge Value >50 >90
RoI
Employee Satisfaction >50 >90
Productivity >50 >90
Organisational Reputation >50 >90

86
Table 3.5 Maturity Levels and Key Maturity Indicators
Maturity
Level
Key Parameters &
Key Values
(People)
Key Parameters &
Key Values
(Process)
Key Parameters &
Key Values
(Technology)
Key Parameters & Key
Values (Knowledge)
Key Parameters & Key
Values
( ROI)
0 Default
Nil Nil Nil Nil Nil
1
Initial
Awareness- Low
Participation -Low
KM roles –Low
Mentoring and Succession Planning-Low
Communities of Practice-Nil
Reward and Recognition Scheme- Nil
KM Policy-Low
KM Strategy-Low
KM Processes-Low
Process Integration-Nil
Network-Medium
Data and IM-Medium
Explicit KM-Low
Tacit KM-Low
KE techniques-Nil
Technology Integration- Nil
Knowledge Classification-Low
Knowledge Capability Areas-Nil
Knowledge Organisation-Nil
Knowledge Value-Nil
Employee Satisfaction-Nil
Productivity-Nil
Organisational Reputation- Nil
2
Qualitative
Development
Awareness- Medium
Participation -Medium
KM roles -Medium
Mentoring and Succession Planning-Medium
Communities of Practice-Low
Reward and Recognition Scheme- Low
KM Policy-Medium
KM Strategy-Medium
KM Processes-Medium
Process Integration-Low
Network-High
Data and IM-High
Explicit KM-Medium
Tacit KM-Medium
KE Techniques-Low
Technology Integration-Low
Knowledge Classification-Medium
Knowledge Capability Areas-Medium
Knowledge Organisation-Medium
Knowledge Value-Medium
Employee Satisfaction-Medium
Productivity- Medium
Organisational Reputation-Medium
3
Quantitative
Development
Awareness->50
Participation ->50
KM roles ->50
Mentoring and Succession Planning->50
Communities of Practice->50
Reward and Recognition Scheme- >50
KM Policy->50
KM Strategy->50
KM Processes->50
Process Integration->50
Network->50
Data and IM->50
Explicit KM->50
Tacit KM->50
KE techniques->50
Technology Integration->50
Knowledge Classification->50
KnowledgeCapability Areas->50
Knowledge Organisation->50
Knowledge Value->50
Employee Satisfaction->50%
Productivity->50%
OrganisationalReputation->50%
4
Maturity
Awareness->90
Participation ->90
KM roles ->90
Mentoring and Succession Planning->90
Communities of Practice->90
Reward and Recognition Scheme- >90
KM Policy->90
KM Strategy->90
KM Processes->90
Process Integration->90
Network->90
Data and IM->90
Explicit KM->90
Tacit KM->90
KE techniques->90
Technology Integration->90
Knowledge Classification- >90
Knowledge Capability Areas- >90
Knowledge Organisation- >90
Knowledge Value->90
Employee Satisfaction->90%
Productivity- >90%
Organisational Reputation- ->90%
5 Extended-
organisational
maturity.
Same as level 4 with extended value chain of the
organisation.
Same as level 4 with extended
value chain of the organisation.
Same as level 4 with extended value
chain of the organisation.
Same as level 4 with extended value chain
of the organisation.
Same as level 4 with extended value
chain of the organisation.

87
Fig. 3.3 Maturity Levels and Key Maturity Indicators

88
3.3 FLEXIBILITY OF THE MODEL
Flexibility of KMI-KMM model is demonstrated by modifying the model and creating 2 modified
KMI-KMM models viz KMIX-KMM model and KMIY-KMM model as discussed below:
KMIX-KMM model is a subset of KMI-KMM model. It has only in 3 Key Areas viz People,
Technology and Knowledge. In ‗People‘ Key Area it has only in 3 Key Parameters viz:
Awareness, Participation and KM Roles. In ‗Technology‘ Key Area it has only in 2 Key
Parameters viz: Network and , Explicit Knowledge Management. In ‗Knowledge‘ Key Area, it
has only one Key Parameter viz Knowledge Classification. The Key Areas and Key Parameters of
the KMIX-KMM model are listed in Table 3.6.
Table 3.6 Key Ares and Key Parameters of KMIX-KMM Model
Sl.No. Key Areas Key Parameters
1 People
Awareness
2 Participation
3 KM Roles
4 Technology
Network
5 Explicit Knowledge Management
6 Knowledge
Knowledge Classification
The Key Areas and maturity levels are pictorially represented in Figure 3.4. Since the Key Areas
are only 3, the figure is a triangle. The Key Values for different maturity levels are assumed to be
the same as that of KMI-KMM Model. However, that also can be modified, if required. The Key
Values for different maturity levels KMIX-KMM model are given in Table 3.7

89
Figure 3.4 Key Areas and Maturity Levels of KMIX-KMM Model
KMIY-KMM model is a superset of the KMI-KMM model. It has the same Key Areas and Key
Parameters as that of KMI-KMM-model. However, it has one additional Key Parameter in the
Key Area ‗RoI‘ viz. ‗Innovation‘ which indicates improvement in innovation due to KM
activities. The Key Parameters of KMIY-KMM model is listed in Table 3.8. The additional Key
Parameter introduced is shown in bold characters.

90
Table 3.7 Maturity Levels and Key Maturity Indicators of KMIX-KMM Model
Maturity
Level
Key Parameters & Key Values
(People)
Key Parameters & Key Values
(Technology)
Key Parameters & Key Values
(Knowledge)
0
Default Nil Nil Nil
1
Initial
Awareness- Low
Participation -Low
KM roles –Low
Network-Medium
Explicit KM-Low
Knowledge Classification-Low
2
Qualitative
Development
Awareness- Medium
Participation -Medium
KM roles -Medium
Network-High
Explicit KM-Medium
Knowledge Classification-Medium
3
Quantitative
Development
Awareness->50
Participation ->50
KM roles ->50
Network->50
Explicit KM->50
Knowledge Classification->50
4
Maturity
Awareness->90
Participation ->90
KM roles ->90
Network->90
Explicit KM->90
Knowledge Classification- >90
5
Extended-
organisational
maturity.
Same as level 4 with extended
value chain of the organisation.
Same as level 4 with extended
value chain of the organisation.
Same as level 4 with extended value
chain of the organisation.

91
Table 3.8 Key Parameters of KMIY-KMM Model
Sl.No. Key Areas Key Parameters
1
People
Awareness
2 Participation
3 KM Roles
4 Mentoring & Succession Planning
5 Reward & Recognition Scheme
6 Communities of Practice
7
Technology
Network
8 Data & Information Management
9 Explicit Knowledge Management
10 Tacit Knowledge Management
11 KE Techniques
12 Technology Integration
13
Process
K M Policy
14 K M Strategy
15 K M Processes
16 Process Integration
17
Knowledge
Knowledge Classification
18 Knowledge Capability Area
19 Knowledge Organisation
20 Knowledge Value
21
RoI
Employee Satisfaction
22 Productivity
23 Organisational Reputation
24 Innovation
Maturity Levels and Key Maturity Indicators of KMIY-KMM model is shown in Table 3.9 and
in Figure 3.5, assuming the Key Values of the additional Key Parameter introduced are similar to
the other Key parameters. The additional Key Parameter and its Key Value are shown in bold
characters.
Also, it is possible to simultaneously remove some Key Areas or Key Parameters and add some
other Key Areas or Key Parameters. It is also possible to alter the Key Values. This demonstrates
the flexibility of the model.
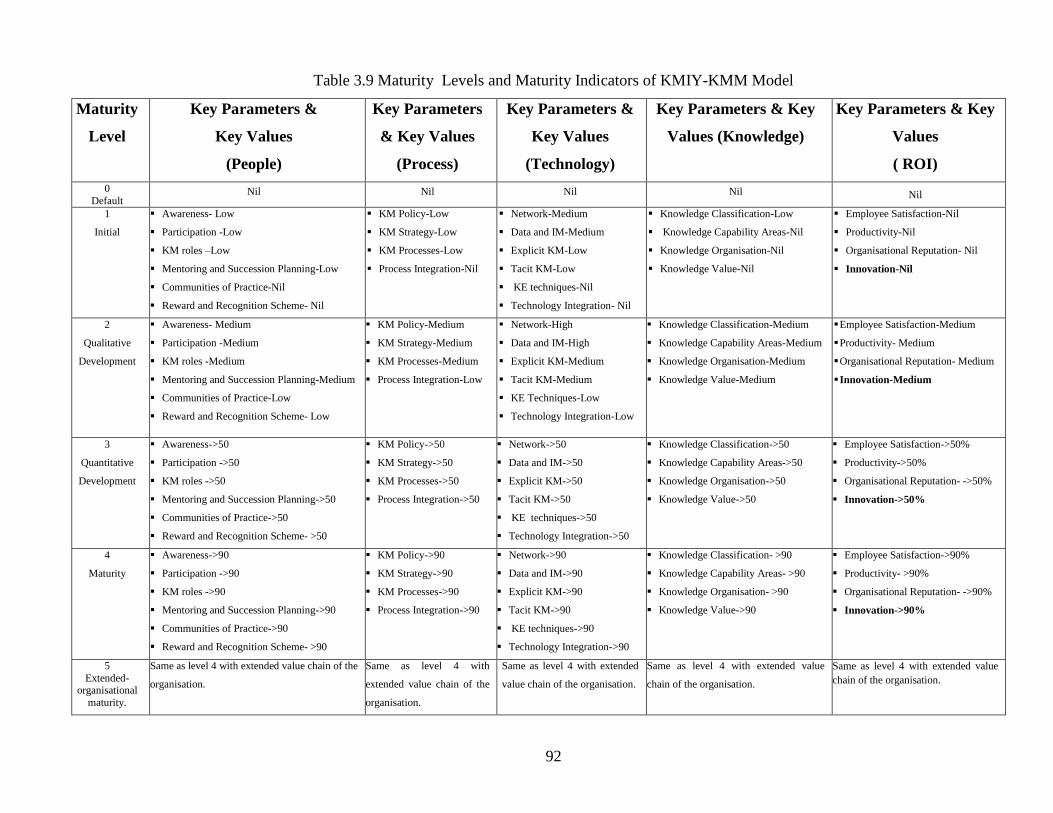
92
Table 3.9 Maturity Levels and Maturity Indicators of KMIY-KMM Model
Maturity
Level
Key Parameters &
Key Values
(People)
Key Parameters
& Key Values
(Process)
Key Parameters &
Key Values
(Technology)
Key Parameters & Key
Values (Knowledge)
Key Parameters & Key
Values
( ROI)
0
Default Nil Nil Nil Nil Nil
1
Initial
Awareness- Low
Participation -Low
KM roles –Low
Mentoring and Succession Planning-Low
Communities of Practice-Nil
Reward and Recognition Scheme- Nil
KM Policy-Low
KM Strategy-Low
KM Processes-Low
Process Integration-Nil
Network-Medium
Data and IM-Medium
Explicit KM-Low
Tacit KM-Low
KE techniques-Nil
Technology Integration- Nil
Knowledge Classification-Low
Knowledge Capability Areas-Nil
Knowledge Organisation-Nil
Knowledge Value-Nil
Employee Satisfaction-Nil
Productivity-Nil
Organisational Reputation- Nil
Innovation-Nil
2
Qualitative
Development
Awareness- Medium
Participation -Medium
KM roles -Medium
Mentoring and Succession Planning-Medium
Communities of Practice-Low
Reward and Recognition Scheme- Low
KM Policy-Medium
KM Strategy-Medium
KM Processes-Medium
Process Integration-Low
Network-High
Data and IM-High
Explicit KM-Medium
Tacit KM-Medium
KE Techniques-Low
Technology Integration-Low
Knowledge Classification-Medium
Knowledge Capability Areas-Medium
Knowledge Organisation-Medium
Knowledge Value-Medium
Employee Satisfaction-Medium
Productivity- Medium
Organisational Reputation- Medium
Innovation-Medium
3
Quantitative
Development
Awareness->50
Participation ->50
KM roles ->50
Mentoring and Succession Planning->50
Communities of Practice->50
Reward and Recognition Scheme- >50
KM Policy->50
KM Strategy->50
KM Processes->50
Process Integration->50
Network->50
Data and IM->50
Explicit KM->50
Tacit KM->50
KE techniques->50
Technology Integration->50
Knowledge Classification->50
Knowledge Capability Areas->50
Knowledge Organisation->50
Knowledge Value->50
Employee Satisfaction->50%
Productivity->50%
Organisational Reputation- ->50%
Innovation->50%
4
Maturity
Awareness->90
Participation ->90
KM roles ->90
Mentoring and Succession Planning->90
Communities of Practice->90
Reward and Recognition Scheme- >90
KM Policy->90
KM Strategy->90
KM Processes->90
Process Integration->90
Network->90
Data and IM->90
Explicit KM->90
Tacit KM->90
KE techniques->90
Technology Integration->90
Knowledge Classification- >90
Knowledge Capability Areas- >90
Knowledge Organisation- >90
Knowledge Value->90
Employee Satisfaction->90%
Productivity- >90%
Organisational Reputation- ->90%
Innovation->90%
5
Extended- organisational
maturity.
Same as level 4 with extended value chain of the
organisation.
Same as level 4 with
extended value chain of the
organisation.
Same as level 4 with extended
value chain of the organisation.
Same as level 4 with extended value
chain of the organisation.
Same as level 4 with extended value
chain of the organisation.

93
Figure 3.5 Maturity Levels and Maturity Indicators of KMIY-KMM Model

94
3.4 ASSESSMENT METHODOLOGY
The methodology describes the assessment of current level of maturity of the target organisation.
An objective assessment methodology consisting of verification of records, in depth interview and
focus group discussion is proposed. Any organisation that is to be assessed has to start with level
1. If an organisation is assessed to be in level 1, it can further be assessed for level 1+, 1++, 2 etc.
The current maturity level of the organisation has to be arrived at in consultation with various
stake holders of the organisation. The assessment methodology is demonstrated in Chapter 4.
3.5 UNIQUE FEATURES OF THE MODEL
The approach based on the unique concept of KMI makes the model more flexible and adaptable.
Since KMI is a combination of KA, KP and KV, the flexibility in selecting the KMI indicates, the
flexibility in selecting KA, KP and KV as well. This concept also makes the model amenable for
continual improvement of the model itself, by introducing additional KMIs, removing the
unwanted KMIs or modifying the KMIs to adapt to the changes in the organisational
environments. The adaptability of the model is demonstrated in Chapter 4. This being the first
model that has used the unique concept of KMI, the model is named as KMI-KMM (Key
Maturity Indicator-Knowledge Management Maturity) model.
To the best of the knowledge of the researcher, this is the first model that used a balanced
approach with adequate concentration on 5 Key Areas viz. People, Process, Technology,
Knowledge and RoI. Most of the models use only 3 KM process, viz. knowledge creation,
knowledge sharing and knowledge utilization. This model uses additional processes viz.
knowledge identification, knowledge acquisition, knowledge preservation, knowledge quality and
KM RoI measurement. Knowledge preservation is very important in the context of nuclear
organisation. Also this model uses succession planning as a Key Parameter which is very

95
important for nuclear organisation. Essentially, RoI is an outcome of KM maturity. This is the
first model which has used RoI as a Key Area and argues that without achieving the targeted RoI,
the maturity is incomplete.
This model considers application of Knowledge Engineering techniques as mandatory for higher
levels of KM maturity. Though maximum number of models (60%) in literature have used 5
levels of maturity, this model has used 6 levels of maturity. In this model also the highest level of
maturity for the organisation is achieved in 5 levels. The 6th
level of maturity is proposed for the
extended organisation. The final maturity level (6th
level) considers the target organisation along
with other partnering organisations like suppliers, customers and collaborators as a single entity.
By considering the 6th
level for extended organisation, the model extends the traditional boundary
of the organisation, and a step forward in the direction of ‗National‘ and ‗Global‘ knowledge
management.
The proposed KMI-KMM model has the strengths of the models as detailed in Table 3.10. In
comparison the developed model KMI-KMM model is more robust with distinct Key Maturity
Indicators and clear objective evaluation criteria.
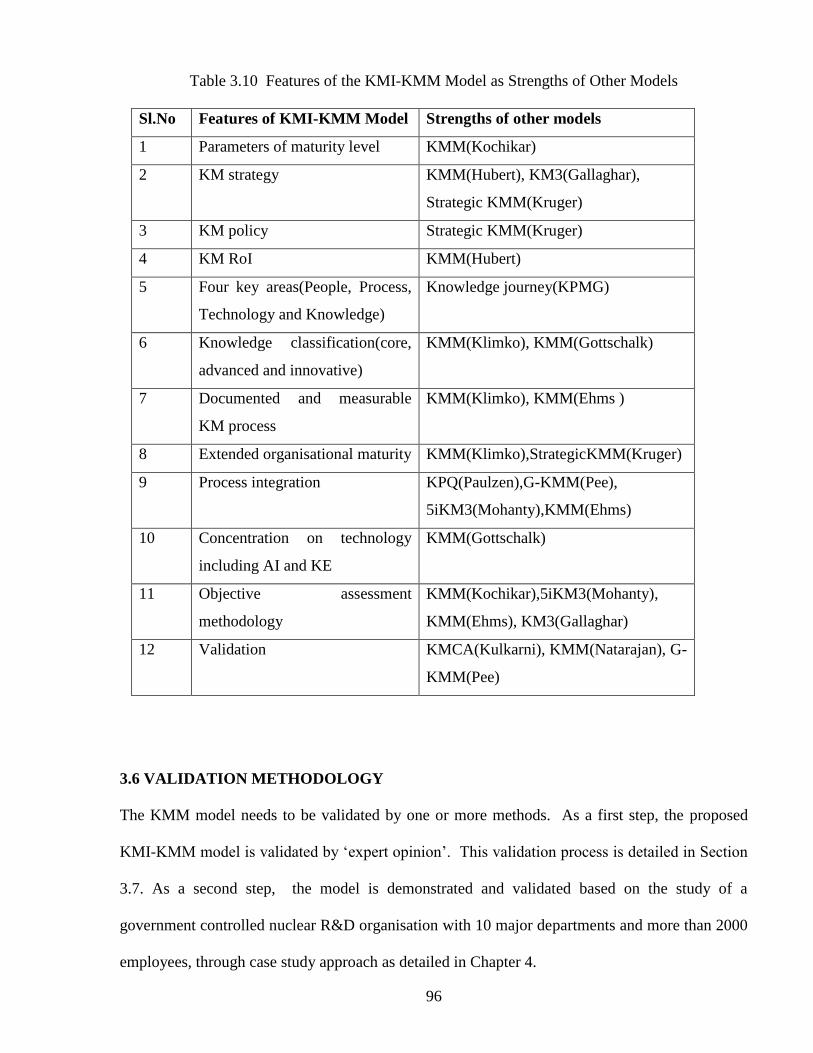
96
Table 3.10 Features of the KMI-KMM Model as Strengths of Other Models
Sl.No Features of KMI-KMM Model Strengths of other models
1 Parameters of maturity level KMM(Kochikar)
2 KM strategy KMM(Hubert), KM3(Gallaghar),
Strategic KMM(Kruger)
3 KM policy Strategic KMM(Kruger)
4 KM RoI KMM(Hubert)
5 Four key areas(People, Process,
Technology and Knowledge)
Knowledge journey(KPMG)
6 Knowledge classification(core,
advanced and innovative)
KMM(Klimko), KMM(Gottschalk)
7 Documented and measurable
KM process
KMM(Klimko), KMM(Ehms )
8 Extended organisational maturity KMM(Klimko),StrategicKMM(Kruger)
9 Process integration KPQ(Paulzen),G-KMM(Pee),
5iKM3(Mohanty),KMM(Ehms)
10 Concentration on technology
including AI and KE
KMM(Gottschalk)
11 Objective assessment
methodology
KMM(Kochikar),5iKM3(Mohanty),
KMM(Ehms), KM3(Gallaghar)
12 Validation KMCA(Kulkarni), KMM(Natarajan), G-
KMM(Pee)
3.6 VALIDATION METHODOLOGY
The KMM model needs to be validated by one or more methods. As a first step, the proposed
KMI-KMM model is validated by ‗expert opinion‘. This validation process is detailed in Section
3.7. As a second step, the model is demonstrated and validated based on the study of a
government controlled nuclear R&D organisation with 10 major departments and more than 2000
employees, through case study approach as detailed in Chapter 4.
97
3.7 FEEDBACK AND EXPERT OPINION
The model development had gone through many iterations and review. At each stage of the
development process, the model was presented to experts within and outside the organisation. The
feedbacks given were incorporated. The feedbacks were in the form of characteristics at different
stages, parameters and values at different maturity levels, the representation of the model in the
form of pentagon, name of the model etc.
In order to validate the KMI-KMM model, expert opinions on the model were obtained. The
experts were selected based on their experience, position, publications, academic qualifications
etc. Expert opinions were obtained from the following academic institutes/ industry through an
assessment Questionnaire:
1) T.A. Pai Management Institute, Manipal
2) Indian Institute of Management, Kozhikode
3) Anna University, Chennai
4) Cognizant Technology Solutions, Chennai
The expert opinions received are given in Appendix A and tabulated in Table 3.11.

98
Table 3.11 Comparison of Expert Opinions on KMI-KMM Model
Sl.No Parameters Expert 1 Expert 2 Expert 3 Expert 4
1 The proposed model conforms with the
theory and practices in the KM literature
Agree Agree Agree Agree
2 The proposed Key Areas, Key Parameters
and Key Maturity Indicators are relevant
Relevant Relevant Relevant Relevant
3 The Key Area, Return of Investment (RoI)
proposed in the model is useful and good
Agree Agree Agree Agree
4 The proposal of a maturity level for
extended organisation is acceptable
Acceptable Acceptable Acceptable Acceptable
5 The approach followed in the model
development process is very arbitrary
Non-
Arbitrary
Non-
Arbitrary
Non-
Arbitrary
Not-
Arbitrary
6 The proposed model is flexible concerning
addition / removal of key parameters
Agree Agree Agree Agree
7 The proposed model can be adopted to
other organisations as well
Agree Agree Agree Agree
8 Comments I think this work is very
unique in its outcomes and is
a fruit of systematic effort.
The researcher has combined
multiple inputs from
different sources to develop a
model that captures different
parameters very well. Highly
commended and
recommended for a doctorate
degree.
Number of
key
parameters
varies for
each key
area.
Quantitative
assessment
is also
carried out.
A thorough analysis
has been done by the
researcher. The
indicators are very
appropriate to the
context chosen. The
researcher has done
sufficient research
benchmarking. Can
be adopted with
some context
specific changes.

99
The experts feel that the KMI-KMM model conforms to the theory and practice in KM literature;
the proposed Key Areas, Key Parameters & Key Maturity indicators are relevant; the Key Area
Return on Investment (RoI) proposed in the model is useful & good; the proposal of a maturity
level for extended organisation is acceptable; the approach followed in the model development
process is non-arbitrary; the proposed model is flexible and adaptable.
3.8 SUMMARY
In this chapter a knowledge management maturity model called KMI-KMM is developed. The
model is flexible with its unique KMI concept and can be adapted to any organisational
environment. The model uses a balanced approach with adequate concentration on various key
areas, viz, People, Process, Technology, Knowledge and RoI. The model has been validated by
experts from three academic institutes and one expert from industry.

100
CHAPTER 4
DEMONSTRATION OF THE KMI-KMM MODEL IN THE
CONTEXT OF A NUCLEAR R&D ORGANISATION
This Chapter describes the work carried out to evaluate the knowledge management maturity of
an organisation and its subunits based on the KMI-KMM model described in Chapter 3 through
an embedded case study. The study also validates the KMI-KMM model.
4.1 ORGANISATIONAL CONTEXT
The KMI-KMM model has been proposed in the context of a nuclear R&D organisation, which is
controlled and financed by Government. The complexity of managing knowledge in such an
organisation involves the twin complexity of nuclear knowledge management and R&D
knowledge management as highlighted in Section 1.7. The organisation had initiated formal KM
practices a few years back. It had developed and documented a formal KM policy for the
organisation. It had implemented an interconnected technology infrastructure for knowledge
preservation and sharing, with freedom for individual subunits to organize its own knowledge
repository, which is the knowledge management portal of the organisation. The subunits are
called ‗groups‘ in the organisation and the same name will be used in subsequent discussions.
The organisation had also created part time KM roles like Chief Knowledge Officer and Group
Knowledge Officers, with a task force constituted by the Director, who is the Chief Executive
Officer of the organisation. In the next section the activities of the organisation and its groups are
briefly discussed.

101
4.1.1 Groups and Activities
The main organisational activities are R&D with respect to Nuclear Reactors. The organisation
has 11 major technical groups and two non technical groups. Only 10 technical groups are
considered for the study. Though the organisation is predominantly R&D oriented, it has groups
which are carrying out technical services, operation and maintenance and project execution. Brief
description of the activities of the groups are listed in Table 4.1 (IGCAR, 2011).
Table 4.1 Groups and Activities
Group Activities
G1 Carrying out R&D and analytic support with respect to all the
Chemistry aspects of the organisation.
G2 Developing Electronics and Instrumentation Systems,
providing Computational and Data Communication services to
the organisation.
G3 Providing Engineering Services to the organisation.
G4 Design and Project Execution.
G5 Development and testing of models and prototype components.
G6 Carrying out basic research and applied research.
G7 Carrying out basic research.
G8 Carrying out Design and R&D.
G9 Plant Operation and Maintenance.
G10 Technology Development, R&D activities and Project
execution.
The following are the broad characteristics of the organisation and its groups (www.igcar.gov):
The organisation has established comprehensive R&D facilities covering the entire
spectrum of Fast Breeder Reactor Technology related to Sodium Technology, Reactor
Engineering, Reactor Physics, Metallurgy and Materials, Chemistry of Fuels and its
materials, Fuel Reprocessing, Reactor Safety, Control and Instrumentation, Computer

102
Application etc. and has developed a strong base in a variety of disciplines related to this
advanced technology. Apart from thrust areas related to nuclear technology, the
organisation has credentials as a leader of basic research in various frontier and topical
areas.
The organisation has staff strength of 2816 including 1274 Engineers and Scientists. The
annual outlay of the organisation is 670 million rupees towards R&D activities and plan
schemes.
The organisation extends its expertise and facilities to other R&D Sectors and industries.
It also has collaborations with other R&D organisation and educational institutions. It
also has identified the knowledge gap areas, where expertise needs to be developed.
The organisation in its journey of excellence has achieved several scientific and
technological milestones, with international benchmarks and high impact on its mission
program. Enhancing Quality and Commitment of Human Resources is the key to the
strategy of achieving and sustaining excellence. The organisation facilitates innovations in
management of Science and Technology for enhancing the focus, creativity and
productivity (IGCAR, 2007).
Group G1: This group is responsible for carrying out R&D, to provide input to all the chemistry
aspect of reactor and associated fuel cycles. The group also provides analytical support to various
activities of the organisation. It also develops instrumentation and facilities in support of R&D
activities.The knowledge management portal shows the list of publications and selected
publications. Quarterly progress reports and electronic articles are made available. Future planed
activities are also documented. Profile and contact details of people are also made available

103
Group G2: This group is responsible for the development of electronics and instrumentation
system for the fast reactor and associated fuel cycles. The group uses various design tools and
case tools to carry out its work. It also develops training simulators and various application
software. The group provides computational and data communication services to various units of
the organisation. It is also responsible for knowledge management activities of the organisation.
The knowledge management portal shows the publications, design reports, progress reports and
presentations. Knowledge documents are classified based on a taxonomy. A secured server with
restricted access is also made available. Profile and contact details of people are also made
available
Group G3: This group is responsible for providing various engineering services pertaining to
Civil Engineering, Electrical Engineering and Mechanical Engineering and Telecommunication
services to the organisation.The group had a knowledge management portal showing activities,
publications, presentations etc. However currently the server is not active due to technical
problem
Group G4: This group is responsible for the design, construction and commissioning of facilities
to close the fuel cycle of Fast Breeder Reactor.The knowledge management portal shows the
activities in general.
Group G5: This group is responsible for development and testing of scaled model and proto type
components. The group has sodium and water test facilities, steam generator test facility and
boron enrichment plant.The knowledge management portal shows the publications, design
reports, progress reports and presentations. A secured database server with restricted access is
also made available, which contains various events and internal reports. Advanced and innovative

104
knowledge in the form of mega challenges and identified gap areas are documented. Profile and
contact details of people are also made available
Group G6: This group is responsible for carrying out research on both basic and applied aspects
of materials. The activities include development of special materials and welding consumables,
optimization of thermo mechanical treatments and other fabrication processes, characterization of
micro structuring and mechanical properties and their inter relationships, modeling of micro
structural stability and phase evolution corrosion and bio-foulding studies, development and
application of specialized non destructive evaluation techniques, advanced mechanical property
measurement like impression creep testing , irradiation experiments, development of technologies
for robotic and remote handling.The group had a knowledge management portal showing
activities, publications, presentations etc. However currently the server is not active due to
technical problem
Group G7: This group is responsible for conducting basic research on topical problems in
material science including super conductivity and nano materials.The knowledge management
portal shows the publications and presentations. In addition discussion forum and wiki is also
implemented. Profile and contact details of people are also made available.
Group G8: This group is responsible for the design and development of Reactor assembly
components and executes R&D in the domain of structural mechanics, thermal hydraulics and
safety engineering.The group had a knowledge management portal showing activities,
publications, presentations etc. However currently the server is not active due to technical
problem

105
Group G9: The group is responsible for the operation and maintenance of Fast Breeder Test
Reactor. The group also provides training to the operation and maintenance staff of the
reactor.The knowledge management portal shows the publications, progress reports, milestones
and frequently asked questions. The group also has a secured server with restricted access for
internal use.
Group G10: This group is responsible for the development of fast reactor fuel reprocessing
technology as well as design, construction and operation of the reprocessing plants. The group
also carries out various R&D activities. The knowledge management portal shows the
publications, presentations and collaborative projects.
The above discussion highlights the activities of the organisation in general and KM related
activities in particular. It can be observed that the activities of different groups are highly
diversified in nature. Hence the study of the organisation and its 10 groups reflects a
representative study of multiple organisations. KM practices of one of the groups will be
discussed in detail in Chapter 6.
4.2 ORGANISATIONAL STUDY
In order to assess KM maturity of various groups, the proposed KMI-KMM model was used. A
case study approach was found to be appropriate and employed for the maturity assessment, since
many of the questions were pertaining to ‗how‘ and ‗why‘ and an in-depth description of the
phenomenon was required.

106
4.2.1 Research Methodology
The main research questions are:
Why the organisation had initiated the formal KM practices?
How can the KM maturity level of the organisation be identified?
In order to answer the above questions, it is necessary to have a structured methodology to
implement the KM practices and to measure the progress of the KM implementation for the
organisation under consideration. A KM maturity model is an accepted methodology for
systematic implementation of KM practices. Hence, the proposed KMI-KMM model is used as
the basis, to find the probable answers to the main research questions and to evaluate the current
maturity of the organisation and its major groups.The main focus of the study is identification of
the current KM maturity level of the organisation and its groups. The unit of analysis is the KM
practices of the organisation and subunits of analysis are the KM practices of the groups of the
organisation.
4.2.2 Pilot Study
Pilot study was conducted using semi-structured interview with selected representatives of the
organisation. The guiding questionnaire used for this interview is given in the Appendix B. The
pilot study revealed that the KM awareness needs significant improvement. Also it revealed some
of the prevailing inhibiting factors for attaining higher levels of KM maturity.
4.2.3 Detailed Study
Since there are sub-units of analysis, an embedded case study is found to be appropriate. Based on
the experience gained through pilot study, the following strategy was adopted to conduct the
study.

107
Conduct an awareness seminar in each group
Conduct a focus group discussion with the participants on their current practices and
expectations.
Verify various records
4.2.3.1 Maturity Level Assessment
The participants for the awareness seminar and focus group discussion were selected randomly
from each group. The guiding questionnaire used for the focus group discussion is given in
Appendix C. The seminar and the focus group discussion were audio recorded. The records
verified include the web site of the organisation, annual report of the organisation, the knowledge
management portal of the organisation, and various Data and Information Management Systems
of the organisation.
Based on the study, the current maturity levels of individual groups were arrived at by the
researcher. The Key Maturity Indicators for each group that are arrived at and their respective
maturity levels are depicted in the Table 4.2 and 4.3 respectively. Because of the practical
difficulties in arriving at Key Values for ‗Productivity‘ and ‗Organisational Reputation‘ only
‗Employee Satisfaction‘ was considered as the Key Parameter for RoI in the study. Also
‗Knowledge Value‘ is not evaluated.
In Table 4.2 the columns Key Areas and Key Parameters are the same described in Section 3.2.2
and Table 3.2 in Chapter 3. The column KV G1 refers to the Key Value of group G1 for
respective Key Area and Key Parameter. In Table 4.3 ML(People) represents maturity level of
People Key Area for the respective group. Similarly, maturity level of other Key Areas like
Process, Technology etc. are represented by ML(Process), ML(Technology) respectively.

108
Table 4.2 Key Maturity Indicators for Groups
Sl.No. Key Areas Key Parameters KV
G1
KV
G2
KV
G3
KV
G4
KV
G5
KV
G6
KV
G7
KV
G8
KV
G9
KV
G10
1
People
Awareness L M L L M L M M M L
2 Participation L M L L M L M M M L
3 KM Roles L M L L M L M M M L
4 Mentoring & Succession
Planning
L L L L L L L L L L
5 Reward & Recognition Scheme L L L L L L L L L L
6 Communities of Practice L L L L L L L L L L
7
Technology
Network H H H H H H H H H H
8 Data & Information
Management
M M M M M M M M M M
9 Explicit Knowledge
Management
L M L L M L M L M L
10 Tacit Knowledge Management L L L L L L M L L L
11 KE Techniques N L N N N N N N N N
12 Technology Integration N N N N N N N N N N
13
Process
K M Policy L L L L L L L L L L
14 K M Strategy L L L L L L L L L L
15 K M Processes L L L L L L L L L L
16 Process Integration N N N N N N N N N N
17 Knowledge
Knowledge Classification L L L L M L M L L L
18 Knowledge Capability Area L L L L L L M L L L
19 Knowledge Organisation N N N N N N N N N N
20 RoI Employee Satisfaction L L L L L L L L L L
N - Nil ; L - Low; M - Medium; H - High
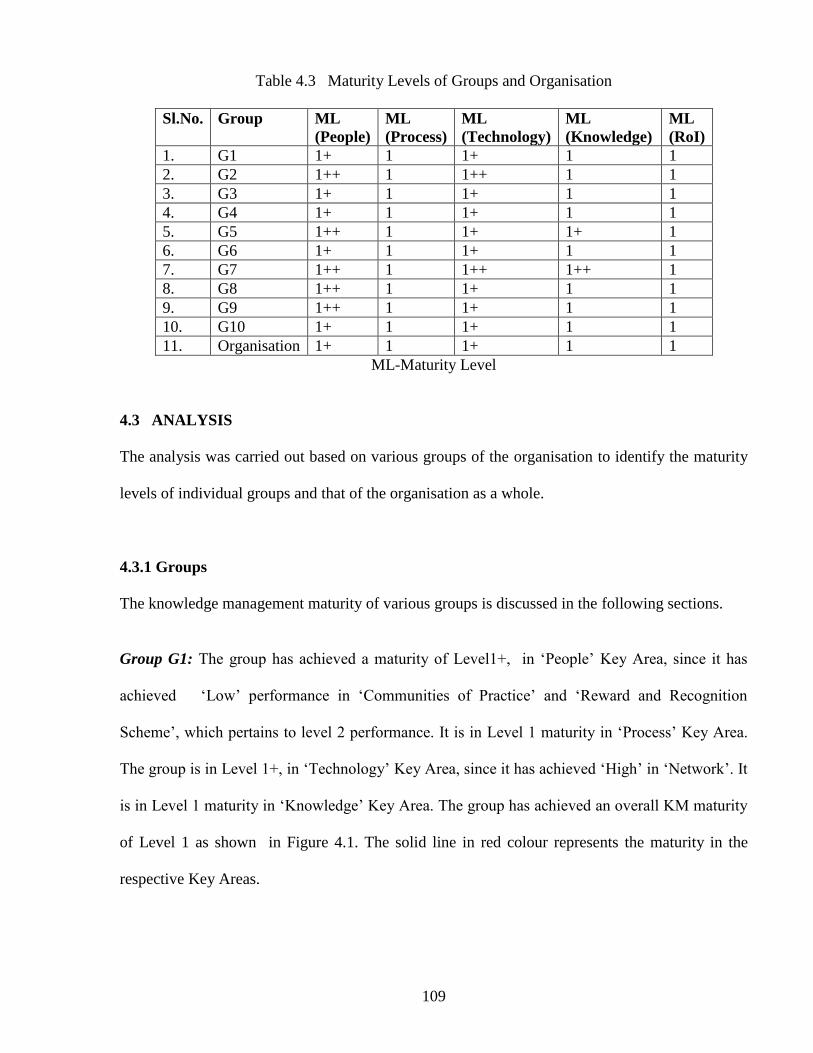
109
Table 4.3 Maturity Levels of Groups and Organisation
Sl.No. Group ML
(People)
ML
(Process)
ML
(Technology)
ML
(Knowledge)
ML
(RoI)
1. G1 1+ 1 1+ 1 1
2. G2 1++ 1 1++ 1 1
3. G3 1+ 1 1+ 1 1
4. G4 1+ 1 1+ 1 1
5. G5 1++ 1 1+ 1+ 1
6. G6 1+ 1 1+ 1 1
7. G7 1++ 1 1++ 1++ 1
8. G8 1++ 1 1+ 1 1
9. G9 1++ 1 1+ 1 1
10. G10 1+ 1 1+ 1 1
11. Organisation 1+ 1 1+ 1 1
ML-Maturity Level
4.3 ANALYSIS
The analysis was carried out based on various groups of the organisation to identify the maturity
levels of individual groups and that of the organisation as a whole.
4.3.1 Groups
The knowledge management maturity of various groups is discussed in the following sections.
Group G1: The group has achieved a maturity of Level1+, in ‗People‘ Key Area, since it has
achieved ‗Low‘ performance in ‗Communities of Practice‘ and ‗Reward and Recognition
Scheme‘, which pertains to level 2 performance. It is in Level 1 maturity in ‗Process‘ Key Area.
The group is in Level 1+, in ‗Technology‘ Key Area, since it has achieved ‗High‘ in ‗Network‘. It
is in Level 1 maturity in ‗Knowledge‘ Key Area. The group has achieved an overall KM maturity
of Level 1 as shown in Figure 4.1. The solid line in red colour represents the maturity in the
respective Key Areas.

110

111
Group G2: The group has achieved a maturity of Level1++, in ‗People‘ Key Area, since it has
achieved a ‗Medium‘ performance in ‗Awareness‘, ‗Participation‘ & ‗KM roles‘ and ‗Low‘
performance in ‗Communities of Practice‘ and ‗Reward and Recognition Scheme‘ , which
pertains to level 2 performance. It is in Level 1 maturity in ‗Process‘ Key Area. The group is in
Level 1++, in ‗Technology‘ Key Area, since it has achieved ‗High‘ in ‗ Network‘, ‗Medium‘ in
‗Explicit KM‘ and ‗Low‘ in ‗KE Techniques‘. It is in Level 1 maturity in ‗Knowledge‘ Key Area.
The group has achieved an overall KM maturity of Level 1, as shown in Figure 4.2

112
Group G3: The group has achieved a maturity of Level1+, in ‗People‘ Key Area, since it has
achieved a ‗Low‘ performance in ‗Communities of Practice‘, and ‗Reward and Recognition
Scheme‘ which pertains to level 2 performance. It is in Level 1 maturity in ‗Process‘ Key Area.
The group is in Level 1+, in ‗Technology‘ Key Area, since it has achieved ‗High‘ in ‗Network‘. It
is in Level 1 maturity in ‗Knowledge‘ Key Area. The group has achieved an overall KM maturity
of Level 1, as shown in Figure 4.3

113
The Group G4: The group has achieved a maturity of Level1+, in ‗People‘ Key Area, since it has
achieved a ‗Low‘ performance in ‗Reward & Recognition Scheme‘ and ‗Communities of
Practice‘, which pertains to level 2 performance. It is in Level 1 maturity in ‗Process‘ Key Area.
The group is in Level 1+, in ‗Technology‘ Key Area, since it has achieved ‗High‘ in ‗Network‘. It
is in Level 1 maturity in ‗Knowledge‘ Key Area. The group has achieved an overall KM maturity
of Level 1, as shown in Figure 4.4

114
Group G5: The group has achieved a maturity of Level1++, in ‗People‘ Key Area, since it has
achieved a ‗Medium‘ performance in ‗Awareness‘, ‗Participation‘ & ‗KM roles‘ and ‗Low‘
performance in ‗Communities of Practice‘ and ‗Reward & Recognition Scheme‘, which pertains
to level 2 performance. It is in Level 1 maturity in ‗Process‘ Key Area. The group is in Level 1+,
in ‗Technology‘ Key Area, since it has achieved ‗High‘ in ‗Network‘ and ‗Medium‘ in ‗Explicit
KM‘. It is in Level 1+ maturity in ‗Knowledge‘ Key Area, since it has achieved, ‗Medium‘
performance in ‗Knowledge Classification‘. The group has achieved an overall KM maturity of
Level 1, as shown in Figure 4.5.

115
Group G6: The group has achieved a maturity of Level1+ in ‗People‘ Key Area, since it has
achieved a ‗Low‘ performance in ‗Reward& Recognition scheme‘ and ‗Communities of Practice‘
which pertains to level 2 performance. It is in Level 1 maturity in ‗Process‘ Key Area. The group
is in Level 1+ in ‗Technology‘ Key Area, since it has achieved ‗High‘ in ‗Network‘. It is in Level
1 maturity in ‗Knowledge‘ Key Area. The group has achieved an overall KM maturity of Level 1.
The KM maturity of the Group G6 pictorially represented in Figure 4.6

116
Group G7: : The group has achieved a maturity of Level1++, in ‗People‘ Key Area, since it has
achieved a ‗Medium‘ performance in ‗Awareness‘, ‗Participation‘ & ‗KM roles‘ and ‗Low‘
performance in ‗Reward& Recognition scheme‘ and ‗Communities of Practice‘, which pertains to
level 2 performance. It is in Level 1 maturity in ‗Process‘ Key Area. The group is in Level 1++, in
‗Technology‘ Key Area, since it has achieved ‗High‘ in ‗Network‘, ‗Medium‘ in ‗Explicit KM‘,
and ‗Tacit KM‘. It is in Level 1++ maturity in ‗Knowledge‘ Key Area, since it has achieved,
‗Medium‘ performance in ‗Knowledge Classification‘ and ‗Knowledge Capability Area‘. The
group has achieved an overall KM maturity of Level 1, as shown in Figure 4.7.

117
Group G8: The group has achieved a maturity of Level1++, in ‗People‘ Key Area, since it has
achieved a ‗Medium‘ performance in ‗Awareness‘, ‗Participation‘ & ‗KM roles‘ and ‗Low‘
performance in ‗Reward& Recognition scheme‘ and ‗Communities of Practice‘, which pertains to
level 2 performance. It is in Level 1 maturity in ‗Process‘ Key Area. The group is in Level 1+, in
‗Technology‘ Key Area, since it has achieved ‗High‘ in ‗Network‘. It is in Level 1 maturity in
‗Knowledge‘ Key Area. The group has achieved an overall KM maturity of Level 1, as shown in
Figure 4.8.

118
Group G9: The group has achieved a maturity of Level1++, in ‗People‘ Key Area, since it has
achieved a ‗Medium‘ performance in ‗Awareness‘, ‗Participation‘ and ‗KM roles‘ and ‗Low‘
performance in ‗Reward & Recognition Scheme‘ and ‗Communities of Practice‘, which pertains
to level 2 performance. It is in Level 1 maturity in ‗Process‘ Key Area. The group is in Level 1+,
in ‗Technology‘ Key Area, since it has achieved ‗High‘ in ‗Network‘, ‗Medium‘ in ‗Explicit
KM‘. It is in Level 1 maturity in ‗Knowledge‘ Key Area. The group has achieved an overall KM
maturity of Level 1, as shown in Figure 4.9.

119
Group G10: The group has achieved a maturity of Level1+, in ‗People‘ Key Area, since it has
achieved a ‗Low‘ performance in ‗Reward & Recognition Scheme‘ and ‗Communities of
Practice‘, which pertains to level 2 performance. It is in Level 1 maturity in ‗Process‘ Key Area.
The group is in Level 1+, in ‗Technology‘ Key Area, since it has achieved ‗High‘ in ‗Network‘. It
is in Level 1 maturity in ‗Knowledge‘ Key Area. The group has achieved an overall KM maturity
of Level 1, as shown in Figure 4.10

120
4.3.2 Organisation
The overall organisational KM maturity is determined by the lowest level achieved by any of the
groups. Hence the KM maturity of the organisation is Level1+, in ‗People‘ Key Area, Level 1
in ‗Process‘ Key Area, Level 1+, in ‗Technology‘ Key Area and Level 1 in ‗Knowledge‘ Key
Area. The organisation has achieved an ‗Employee Satisfaction‘ of ‗Low‘ in KM activities.
However as per the model, RoI is not evaluated for Level 1 maturity. The organisation has
achieved an overall KM maturity of Level 1. The KM maturity of the organisation is depicted in
Figure 4.11

121
The organisation need to focus more on ‗Process‘ and ‗Knowledge‘ Key Areas to move to Level
1+. For the organisation to progress to Level 1++, it needs to qualitatively improve on the various
parameters identified in the model. Also it needs to have a mechanism to monitor and take
corrective actions on the qualitative progress on the parameters.
4.4 ADAPTABILITY OF THE MODEL
Adaptability of KMI-KMM model is demonstrated by applying the modified model KMIX-
KMM model discussed in Chapter 3, to 2 hypothetical organisations viz organisation A denoted
by ORGA and organisation B denoted by ORGB.
4.4.1 Organisation A
It may be recalled that KMIX-KMM model is a subset of KMI-KMM model and ORGA is
interested only in the Key Areas and Key Parameters of KMIX-KMM model.
Assuming that ORGA has the same number of groups as that of the target organisation and the
data obtained was the same as that of the target organisation while ORGA has adapted the
KMIX-KMM model, the results are shown in Table 4.4 and 4.5
Comparing the results in Table 4.4 and 4.5 of ORGA with that in 4.2 and 4.3 of the target
organisation, it can be seen that the KM maturity levels of many groups ORGA are higher. It can
be observed from Table 4.5 that KM maturity of level 2 has been achieved by G2, G5, G7, G8 &
G9 in ‗People‘ Key Area, by G2, G5, G7 & G9 in ‗Technology‘ Key Area and by G5 & G7 in
‗Knowledge‘ Key Area respectively. However, since the organisational KM maturity is decided
by the lowest level maturity achieved by any of the groups, the organisational KM maturity is in
level 1, 1+ and 1 in ‗People‘, ‗Technology‘ and ‗Knowledge‘ Key Areas respectively. The KM
maturity ORGA is depicted in Figure 4.12.

122
Table 4.4 Key Maturity Indicators for Groups of ORGA
Sl.No. Key Areas Key Parameters KV
G1
KV
G2
KV
G3
KV
G4
KV
G5
KV
G6
KV
G7
KV
G8
KV
G9
KV
G10
1 People
Awareness L M L L M L M M M L
2 Participation L M L L M L M M M L
3 KM Roles L M L L M L M M M L
4 Technology
Network H H H H H H H H H H
5 Explicit Knowledge
Management
L M L L M L M L M L
6 Knowledge
Knowledge Classification L L L L M L M L L L
Table 4.5 Maturity Levels for Groups and ORGA
Sl.No. Group ML(People) ML(Technology) ML(Knowledge)
1. G1 1 1+ 1
2. G2 2 2 1
3. G3 1 1+ 1
4. G4 1 1+ 1
5. G5 2 2 2
6. G6 1 1+ 1
7. G7 2 2 2
8. G8 2 1+ 1
9. G9 2 2 1
10. G10 1 1+ 1
11. Organisation 1 1+ 1

123
Figure 4.12 KM maturity of ORGA
4.4.2 Organisation B
It is assumed that organisation B is also interested in the same Key Areas and Key Parameters as
that of ORGA and hence, decided to adapt KMIX-KMM model. However ORGB has only two
groups whose data is identical to that of G5 and G7 of the target organisation. The results are
depicted in Table 4.6 and 4.7. It can be seen that ORGB has achieved level 2 maturity in all the
Key Areas, since all the groups of ORGB have achieved level 2 maturity in all the Key Areas.
The KM maturity ORGB is depicted in Figure 4.13

124
Table 4.6 Key Maturity Indicators for Groups of ORGB
Sl.No. Key Areas Key Parameters KV
G5
KV
G7
1 People
Awareness M M
2 Participation M M
3 KM Roles M M
4 Technology
Network H H
5 Explicit Knowledge
Management
M M
6 Knowledge
Knowledge Classification M M
Table 4.7 Maturity Levels for Groups of ORGB
Sl.No. Group ML(People) ML(Technology) ML(Knowledge)
1 G5 2 2 2
2 G7 2 2 2
3 Organisation 2 2 2
Figure 4.13 KM maturity of ORGB

125
4.4.3 Discussion
It can be observed that ORGA and ORGB were able to easily adapt the modified KMIX-KMM
model to suit their requirements. It can also be observed that since these organisations have
adapted the modified KMIX-KMM model, the KM maturity levels of the groups and that of the
organisation are different than that of the target organisation, even though the data is identical.
Similarly, it is also possible for another organisation to adapt super-set model similar to KMIY-
KMM model by adding additional Key Areas or Key Parameters. This demonstrates the
flexibility and adaptability inbuilt into the KMMI-KMM model.
4.5 VALIDATION
Different tests that are used to validate the study are described in the following sections.
4.5.1 Construct Validity
A pilot study was conducted across the cross section of the organisation and the feed backs
received were implemented in the case study. This case study used multiple sources of evidences
like focus group discussion, semi-structured interview, organisational web site, organisational
annual report etc. The key informants of the organisation have reviewed the draft case study
report. Hence it can be concluded that operational measures of the concepts are correct and thus
the study satisfies the construct validity.
4.5.2 External Validity
Since the case study has embedded sub units of analysis, the findings of the study can be
analytically generalized across similar organisations. Also the extension of the study to
hypothetical organisations, further generalizes the study.
126
4.5.3 Reliability
Since the study has used multiple sources of evidences, objective data and random participants,
the reliability can be ensured.
In addition to the above 4 tests, the study also satisfies discriminant validity (Trochim,2000).
Different groups of the organisation are at different levels of maturity with reference to different
Key Areas. This indicates that Key Areas are distinct and not correlated, providing evidence of
discriminant validity. Also the ‗absolute test‘ specified by Kulkarni and Freeze(2004) is satisfied
as detailed below. For every Key Areas, achieving a lower level maturity is a prerequisite for
achieving next level maturity. The results indicate that none of the higher levels can be satisfied
without satisfying the lower levels. Hence the study validates the knowledge management
maturity model developed in Chapter 3.
4.6 OBJECTIVITY OF DATA
The case study pertains to one organisation and its 10 groups. Through the case study, KM
maturity levels of the groups and that of the organisation were assessed. Depending on the values
obtained for the Key Parameters through the case study, the KM maturity level of the groups of
the organisation was determined. KM maturity level of the organisation was determined by the
lowest level achieved by any of the groups of the organisation. Analysis was done for each
individual group and for the organisation as a whole.
Since the different groups of the organisation are involved in diversified activities like basic
research, applied research, design, project execution, technical service, operation and
maintenance, accademics etc. the organisation is highly diversified. Also different groups of the
organisation are at different maturity levels. For the data collection and interpretation individual

127
groups of the organisation were taken as different entities. For the case study, data was collected
through various sources such as focus group discussion, semi-structured interview, annual report
of the organisation, organisational web site, KM portal of the organisation, various Information
Management Systems of the organisation. For the focus group discussion, the participants from
each group were selected randomly. Since most of the data were objective and obtained from
multiple sources, objectivity was maintained. Also the analysis and the draft report were
presented to the key officials of the organisation. Hence, though the organisation was selected
based on accessibility to data, objectivity was maintained in the data collection and
interpretation.
The maturity levels of various groups and that of the organisation given in Table 4.3 are
reproduced in Table 4.8 with highlighted G2 data. The researcher belongs to group G2. The
maturity level of G2 is shown in bold italics. The maturity levels of various groups and that of
the organisation after removing G2 is given in Table 4.8A.
Table 4.8 Maturity Levels of Groups and Organisation with G2 highlighted
Sl.No. Groups ML
(People)
ML
(Process)
ML
(Technology)
ML
(Knowledge)
ML
(RoI)
1. G1 1+ 1 1+ 1 1
2. G2 1++ 1 1++ 1 1
3. G3 1+ 1 1+ 1 1
4. G4 1+ 1 1+ 1 1
5. G5 1++ 1 1+ 1+ 1
6. G6 1+ 1 1+ 1 1
7. G7 1++ 1 1++ 1++ 1
8. G8 1++ 1 1+ 1 1
9. G9 1++ 1 1+ 1 1
10. G10 1+ 1 1+ 1 1
11. Organisation 1+ 1 1+ 1 1
ML-Maturity Level

128
Table 4.8A Maturity Levels of Groups and Organisation without G2
Sl.No. Groups ML
(People)
ML
(Process)
ML
(Technology)
ML
(Knowledge)
ML
(RoI)
1. G1 1+ 1 1+ 1 1
2. G3 1+ 1 1+ 1 1
3. G4 1+ 1 1+ 1 1
4. G5 1++ 1 1+ 1+ 1
5. G6 1+ 1 1+ 1 1
6. G7 1++ 1 1++ 1++ 1
7. G8 1++ 1 1+ 1 1
8. G9 1++ 1 1+ 1 1
9. G10 1+ 1 1+ 1 1
10. Organisation 1+ 1 1+ 1 1
It can be observed that, the elimination of group G2 from the study does not affect the maturity
level of the organisation, since maturity level of the organisation is determined by the lowest level
achieved by any of the groups. Also the maturity level of G2 (People-1++; Process-1;
Technology-1++; Knowledge-1; RoI-1) is comparable to the maturity level of other groups like
G5, G7, G8 etc. Hence, it can be stated that, the familiarity of the researcher with the organisation
did not influence the findings of the study.
4.7 SUMMARY
In this Chapter, the KMI-KMM model developed in the Chapter 3 was applied in an
organisational context, to demonstrate its applicability. The KM maturity of a nuclear R&D
organisation and its groups were assessed. Adaptability of the model was demonstrated by
applying the modified model to 2 hypothetical organisations. Also the model was validated by the
case study approach.

129
CHAPTER 5
IDENTIFICATION OF INHIBITING FACTORS FOR KM
MATURITY IN THE CONTEXT OF A NUCLEAR R&D
ORGANISATION
In this chapter the inhibiting factors to attain higher levels of KM maturity of the target
organisation whose KM maturity was assessed in Chapter 4 was identified through survey
methodology. The study also suggests methods to improve KM maturity of the target
organisation.
5.1 Inhibiting Factors
In order to identify the inhibiting factors which prevent the organisation attaining higher levels of
KM maturity, a questionnaire was developed and this is given in Appendix D. It contained 21
factors that can influence the KM maturity. It was developed based on the e literature survey in
Chapter 1 and the study of the organisation. The presence of those factors can act as enablers and
the absence can act as inhibitors. Detailed discussion on these factors is covered in Section 1.4
Inhibiting factors of various groups and the organization were identified through a survey. A
questionnaire was used based on a five point Likert scale (strongly agree, agree, neither agree/nor
disagree, disagree, strongly disagree) to collect the response from the participants. The
questionnaire was pre-tested, with a few senior, middle and junior level employees, for the
understanding of the questions and the concepts that is represented. Based on the feedback
received, the structure was modified to make the inhibiting factors more explicit by adding the ‗if‘

130
to all the inhibiting factors. For example for the inhibiting factor ―lack of adequate time‖ the
initial question was ‗I am willing to share more of my work, experiences, ideas, expertise, etc.
with other members of the organisation as my contribution to the organisational knowledge
repository, if: I have more time’. The question was modified as ‗I am willing to share more of my
work, experiences, ideas, expertise, etc. with other members of the organisation as my
contribution to the organisational knowledge repository: if I have more time’. Also since the
questionnaire was personally administered by the researcher after an awareness seminar in each
group, the necessary clarifications could be provided. However, the clarifications required were
minimum.
If the answer to the question is ‗strongly agree‘, it indicates that the factor say ‗lack of time‘ is a
strong inhibiting factor. If the answer is ‗strongly agree‘ or ‗agree‘ it is considered as a positively
answered question. The mean, standard deviation and percentage of positive responses for each
group are summarized in the Table 5.1.
The strongest inhibiting factor based on the mean, for each group is highlighted. Detailed analysis
is presented in Section 5.3.

131
Table 5.1 Inhibiting Factors of Groups
S.No Inhibiting Factors G1 G2 G3 G4 G5 G6 G7 G8 G9 G10
M SD PR M SD PR M SD PR M SD PR M SD PR M SD PR M SD PR M SD PR M SD PR M SD PR
1
Lack of time
3.33 1.12 56 3.43 1.01 54 3.86 0.92 78 4.13 0.81 87 3.82 0.97 74 3.93 0.96 78 3.67 0.69 55 3.68 1.12 61 3.29 1.07 50 3.83 0.92 77
2 Lack of awareness of knowledge
requirements
3.67 1.12 75 3.94 0.73 77 3.95 1.00 81 4.31 0.48 100 4.13 1.00 82 3.86 0.99 71 4.28 0.67 88 4.29 0.66 96 3.57 1.09 14 4.00 0.77 77
3 Lack of expertise in organizing the
available Knowledge
4.33 1.12 78 3.40 1.01 51 3.70 0.91 70 3.88 0.62 75 3.97 0.90 77 2.86 0.91 28 3.44 0.62 39 3.82 0.77 68 3.43 0.85 50 4.00 0.84 82
4 Lack of awareness of the process of contribution
4.11 0.33 100 3.66 0.84 60 4.08 0.72 84 4.00 0.52 87 4.03 0.81 79 3.36 1.11 50 3.89 0.83 61 3.86 0.89 68 4.14 0.53 93 3.76 0.77 67
5
Lack of assistance in contribution
3.22 1.39 44 3.20 1.21 43 3.43 1.12 54 3.56 0.89 56 3.38 1.16 59 2.21 1.37 14 2.83 0.79 16 3.36 0.87 46 3.36 1.08 50 3.71 0.96 68
6 Lack of user friendly technology infrastructure
3.67 1.32 67 4.06 0.76 80 4.00 0.78 75 4.31 0.70 87 4.28 0.69 92 3.93 0.96 64 3.72 1.02 44 4.25 0.84 75 4.00 0.88 78 4.23 0.60 91
7 Lack of integration of the process of contribution with day-today work
3.11 1.45 56 4.09 0.70 86 3.92 0.89 67 4.44 0.73 87 4.38 0.63 82 4.00 0.85 78 3.83 0.92 50 4.29 0.76 82 4.00 0.68 78 4.00 0.87 80
8 Lack of awareness of the utility of the contributions
4.22 0.67 89 3.40 1.03 54 3.57 1.01 57 3.44 1.03 62 3.77 0.81 69 3.86 0.83 71 3.39 1.09 44 4.00 0.77 79 3.36 0.84 43 3.89 0.99 77
9 Lack of tangible reward
3.78 1.09 56 3.00 1.08 34 3.03 1.21 32 2.94 1.06 31 3.38 1.09 43 3.00 0.93 21 3.00 1.08 22 3.43 1.23 54 2.64 1.01 14 3.03 1.25 40
10 Lack of recognition
4.22 1.20 67 3.29 0.99 48 3.14 1.13 38 3.06 1.29 50 3.59 1.23 66 3.21 1.15 43 3.00 1.03 17 3.39 1.10 46 2.86 1.10 21 3.66 0.91 65
11 Lack of gratefulness
4.44 1.13 78 3.03 0.89 28 3.22 1.20 40 3.13 1.20 37 3.44 1.25 54 2.57 1.12 14 2.83 0.86 17 3.07 1.12 25 2.57 0.51 0 3.37 0.88 57
12 Lack of feedback
4.56 0.53 100 3.77 1.06 74 3.89 0.97 70 3.88 0.96 81 4.10 0.75 77 2.00 0.65 78 3.94 0.73 72 4.14 0.59 89 3.79 0.89 64 4.11 0.83 82
13 Lack of weightage for contribution in
performance appraisal 2.89 1.36 33 3.31 1.11 46 3.35 1.14 46 3.31 1.45 62 3.64 1.04 66 3.71 0.80 78 3.00 0.97 22 3.50 1.29 57 3.14 1.08 28 3.14 1.46 54

132
S.No Inhibiting Factors G1 G2 G3 G4 G5 G6 G7 G8 G9 G10
14 Lack of protection of intellectual
property 4.11 1.27 78 3.40 3.80 48 3.41 1.01 48 2.75 1.34 31 3.54 1.27 56 4.14 0.83 86 3.44 0.86 33 3.50 1.32 57 3.79 0.89 64 3.49 1.27 57
15 Lack of assurance against negative
reverse impact 3.89 0.78 67 3.80 0.93 71 3.84 0.90 67 3.31 1.14 50 3.56 1.17 64 4.36 0.81 93 3.39 0.92 17 3.64 1.03 57 3.71 0.91 57 3.77 1.11 71
16 Lack of assurance against belittling
by colleagues 3.22 0.97 33 2.80 1.13 28 3.27 0.90 38 2.69 1.08 18 2.90 1.02 25 3.21 0.77 43 2.61 0.70 6 2.75 1.17 25 2.71 1.07 14 3.57 1.07 57
17
Lack of awareness on the significance
of the contribution to the organisation 4.11 1.05 78 3.77 1.03 66 3.73 1.07 62 3.88 1.15 75 4.18 0.91 84 4.43 0.49 100 4.00 0.91 72 4.32 0.98 82 4.07 0.83 71 3.94 1.06 74
18 Lack of directive from the reporting
officer 3.11 0.93 33 3.06 1.00 31 3.05 0.97 38 3.50 1.15 50 3.36 0.84 38 3.57 1.05 50 2.83 0.62 6 3.61 1.17 54 3.36 1.01 43 3.37 0.91 51
19 Lack of contributions from colleagues
3.67 0.87 67 3.00 1.06 34 2.97 1.07 27 3.00 1.26 31 3.31 1.06 43 3.64 0.89 50 2.83 0.71 11 3.11 1.34 43 2.57 0.94 7 3.09 1.01 37
20
Lack of assurance on meeting the
knowledge requirements by the
organisational knowledge repository
4.00 0.76 78 3.43 1.09 46 3.54 0.96 57 3.50 0.86 75 3.87 0.86 66 3.54 0.93 61 3.11 1.08 39 3.89 0.88 71 2.79 0.97 21 3.69 0.90 77
21 Lack of mandatory organisational
policy on contributions 4.00 0.7 78 3.26 1.07 74 3.14 1.25 43 3.00 1.41 31 3.31 1.17 46 3.07 0.88 21 2.67 1.03 11 2.89 1.26 48 2.93 1.00 21 2.91 1.20 48
M-Mean, SD – Standard Deviation, PR – Positive Response

133
5.2 PARTICIPANT PROFILE
In this Section the participant profile is analyzed in terms of the percentage of participation and
demographic variables.
5.2.1 Participation
The participation is analyzed in terms of the percentage of participation from each group with
respect to the total number of participants and with respect to the total number of employees in
that group. Table 5.2 depicts the number of participants from each group and the percentage with
respect to the total number of participants, ordered in the descending order of the percentage. The
highest percentage is from G5 followed by G3.
Table 5.2 Participants from Groups
Group Participants Percentage
G5 39 15.91
G3 37 15.10
G2 35 14.28
G10 35 14.28
G8 28 11.42
G7 18 7.34
G4 16 6.53
G6 14 5.71
G9 14 5.71
G1 9 3.60
Total 245 100
Table 5.3 depicts the number of employees, participants and the percentage of participants with
respect to the number of employees from different groups and the organisation(ORG), in the

134
descending order of the percentage of the groups. The participation from all groups, except three
groups (G6,G9,G1), are higher than the percentage of participants for the organisation (11.7).
Table 5.3 Employees and participants
Group Employees Participants Percentage
G4 43 16 37.20
G2 127 35 27.55
G8 108 28 25.92
G5 252 39 15.47
G7 135 18 13.33
G3 297 37 12.45
G10 296 35 11.82
G6 278 14 5.03
G9 339 14 4.13
G1 219 9 4.11
ORG 2094 245 11.70
5.2.2 Demographic Variables
The demographic variables of the participants are analyzed in this Section. The overall profile of
participants from the organisation and that from various groups vary significantly. Figure 5.1a
depicts the profile of organisation-wide participants based on type of work. Though the
organisation is predominantly carrying out Research & Development, the highest number of
participants were carrying out development work (31%), followed by research (27%). Figure 5.1b
depicts the group-wise profile based on type of work. The group G1 mostly carries out research
work(75%), followed by project. The group G2 mainly carries out development work(50%)
followed by research(35%). The group G3 mainly carries out development work(50%) followed
by research(35%). The group G4 carries out development work(47%) followed by research(40%).

135
The group G5 carries out mostly development work(54%) followed by research(25%). The group
G6 carries out mostly project work(46%) followed by design(39%). The group G7 carries out
project work and technical services equally(50%). The group G8 carries out mostly development
work(82%) followed by technical services (12%). The group G9 carries out mostly development
work(71%) followed by project (22%). The group G10 carries out development work and
research almost equally(39% and 31%).
Type of Work %
Research 29
Development 29
Project 21
Technical
Services 21
Figure 5.1a Type of Work (Organisation)
Figure 5.1b Type of Work (Groups)
0
10
20
30
40
50
60
70
80
90
G1 G2 G3 G4 G5 G6 G7 G8 G9 G10
Research 75 35 0 0 5 50 88 7 14 48
Development 0 50 14 25 53 0 12 86 0 4
Project 25 10 33 75 5 50 0 7 14 22
Technical Services 0 5 53 0 37 0 0 0 72 26
Per
cen
tage
Type of Work
Groups
29
29
21
21
Type of Work(Organization)
Research
Development
Project
Technical Services

136
Figure 5.2a and 5.2b depicts the qualification of participants organisation-wide and group-wise
respectively. The overall participants of the organisation were mostly graduates (44%), followed
by postgraduates (29%). The maximum participants for G1(72%), G2(52%), G4(47%), G6(46%)
were post graduates. For G5(54%), G8(82%), G9(71%), G10(39%), the maximum participants
were graduates. For G7 the participants were equally distributed between post graduates and Ph.D
holders. For G3 alone the maximum(56%) participants were diploma holders.
Qualification %
Diploma 18
Graduate 44
Post Graduate 29
Ph.D. 9
Figure 5.2a Qualification (Organisation)
Figure 5.2b Qualification (Groups)
0
10
20
30
40
50
60
70
80
G1 G2 G3 G4 G5 G6 G7 G8 G9 G10
Diploma 0 3 57 19 23 0 0 0 0 31
Graduate 14 39 33 44 51 43 0 48 71 44
Post Graduate 72 52 10 37 21 36 50 52 21 22
Ph.D. 14 6 0 0 5 21 50 0 8 3
Per
cen
tage
Qualification
Groups
18
44
29
9Qualification(Organization)
Diploma
Graduate
Post Graduate
Ph.D.

137
The discipline of the participants of the organisation and groups is depicted in Figure 5.3a and
5.3b respectively. Organisation-wide the discipline of engineering was more predominant (73%),
compared to science (27%). Also all groups except G1, G7 and G10, the engineering discipline
was more predominant.
Discipline %
Science 27
Engineering 73
Figure 5.3a Discipline (Organisation)
Figure 5.3b Discipline (Groups)
0
10
20
30
40
50
60
70
80
90
100
G1 G2 G3 G4 G5 G6 G7 G8 G9 G10
Science 100 24 4 0 3 17 82 4 9 53
Engineering 0 76 96 100 97 83 18 96 91 47
Per
cen
tage
Discipline
Groups
27
73
Discipline (Organization)
Science
Engineering

138
The grade of the participants of the organisation and groups is depicted in Figure 5.4a and 5.4b
respectively. The organisation-wide participants were mostly middle level employees (65%). The
same trend was observed in all the groups except G9, where only senior officers participated.
Grade %
Upto SO/B 14
SO/C-E 65
SO/F-G 16
SO/H &
Above 5
Figure 5.4a Grade (Organisation)
Figure 5.4b Grade (Groups)
0
10
20
30
40
50
60
70
80
90
100
G1 G2 G3 G4 G5 G6 G7 G8 G9 G10
Upto SO/B 0 12 40 0 8 14 0 0 0 36
SO/C-E 100 69 56 86 65 72 64 82 0 64
SO/F-G 0 19 4 14 22 14 29 14 57 0
SO/H & Above 0 0 0 0 5 0 7 4 43 0
Per
cen
tage
Grade
Groups

139
The service of the participants of the organisation and groups is depicted in Figure 5.5a and 5.5b
respectively. Organisation-wide participants were predominantly ‗low‘ (less than 10 years)
experienced (44%). In all the groups except G5, G9 and G10 the same trend was observed. In G5
and G10 the participants were predominantly ‗medium‘ (10-19 years) experienced. In G9 the
participants were predominantly ‗high‘ (more than 20 years) experienced.
Service %
< 10 44
10 – 19 23
20 – 30 22
> 30 11
Figure 5.5a Service (Organisation)
Figure 5.5b Service (Groups)
0
10
20
30
40
50
60
70
G1 G2 G3 G4 G5 G6 G7 G8 G9 G10
< 10 66 53 40 54 27 67 43 70 0 41
10 - 19 17 18 25 15 32 22 21 11 0 44
20 - 30 17 20 16 23 29 11 22 19 64 9
> 30 0 9 19 8 12 0 14 0 36 6
Per
cen
tage
Service
Groups
44
23
22
11Service(Organization)
< 10
10 - 19
20 - 30
> 30

140
The age of the participants of the organisation and groups is depicted in Figure 5.6a and 5.6b
respectively. Organisation-wide participants were predominantly young (less than 30 years)
(31%). In groups G2, G6 and G8 the same trend was observed. In G1 and G10 the participants
were equally distributed between ‗less than 30‘ and ‗30 to 39‘ years of age. In G3 and G4 ‗30 to
39‘ age group was predominant. In G5 and G7 ‗40 to 50‘ age group was predominant. In G9
alone the participants were predominantly old( greater than 50).
Age %
< 30 31
30 – 39 29
40 – 50 25
> 50 15
Figure 5.6a Age (Organisation)
Figure 5.6b Age (Groups)
0
10
20
30
40
50
60
70
G1 G2 G3 G4 G5 G6 G7 G8 G9 G10
< 30 43 42 19 19 5 64 31 61 0 40
30 - 39 43 23 31 43 37 29 13 21 0 40
40 - 50 0 26 22 19 42 7 37 18 43 14
> 50 14 9 28 19 16 0 19 0 57 6
Per
cen
tage
Age
Groups

141
The gender distribution of the participants of the organisation and groups is depicted in Figure
5.7a and 5.7b respectively. Organisation-wide participants were predominantly male (83%) In
almost all the groups the same trend was observed, except G2 and G6, where the female
participants were comparable.
Gender %
Male 83
Female 17
Figure 5.7a Gender (Organisation)
Figure 5.7b Gender (Groups)
0
10
20
30
40
50
60
70
80
90
100
G1 G2 G3 G4 G5 G6 G7 G8 G9 G10
Male 86 56 94 94 97 54 76 96 93 76
Female 14 44 6 6 3 46 24 4 7 24
Per
cen
tage
Gender
Male
Female
Groups

142
The analysis could not find any relationship of demographic variables with predominant
inhibiting factors. Two demographic variables namely Grade and Gender in the population
obtained from the organisational web site is depicted in Table 5.4. It indicates that sample
represents the population. Also the sample size (245) is more than the minimum requirement
given in literature (sample size of 239 for a population of 2000).
Table 5.4 Demographic variables of the population
DV(Grade) E DV(Gender) E
Upto B 24 Male 86
C-E 51 Female 14
F-G 19
H& above 6
DV-Demographic Variable; E- No of Employees
5.3 ANALYSIS
The analysis was carried out based on various groups of the organisation and organisation wide,
to identify the prominent inhibiting factors.
5.3.1 Groups
The inhibiting factors of various groups are discussed in the following sections. The inhibiting
factors are depicted in descending order of the mean. The standard deviation and percentage of
positive responses are also listed. It can be observed that stronger inhibiting factors based on
mean vary for different groups. Also it can be observed that the standard deviation and
percentage of positive response for different inhibiting factors vary for different groups. These
variations reflects the diverse perceptions of KM in different groups.

143
Group G1: The inhibiting factors of the group in the descending order of the mean are depicted in
Table 5.5. It can be seen that the strongest inhibiting factor is ‗lack of feedback‘, with a mean of
4.56, standard deviation of 0.53 and 100% positive responses.
Table 5.5 Inhibiting Factors of Group G1
Sl.No Inhibiting Factors (G1) M SD PR
1 Lack of feedback 4.56 0.53 100
2 Lack of gratefulness 4.44 1.13 78
3 Lack of expertise in organizing the available knowledge 4.33 1.12 78
4 Lack of recognition 4.22 1.20 67
5 Lack of awareness of the utility of the contributions 4.22 0.67 89
6 Lack of protection of intellectual property 4.11 1.27 78
7 Lack of awareness on the significance of the contribution to
the organisation 4.11 1.05 78
8 Lack of awareness of the process of contribution 4.11 0.33 100
9 Lack of assurance on meeting the knowledge requirements
by the organisational knowledge repository 4.00 0.76 78
10 Lack of mandatory organisational policy on contributions 4.00 0.70 78
11 Lack of assurance against negative reverse impact 3.89 0.78 67
12 Lack of tangible reward 3.78 1.09 56
13 Lack of user friendly technology infrastructure 3.67 1.32 67
14 Lack of awareness of knowledge requirements 3.67 1.12 75
15 Lack of contributions from colleagues 3.67 0.87 67
16 Lack of time 3.33 1.12 56
17 Lack of assistance in contribution 3.22 1.39 44
18 Lack of assurance against belittling by colleagues 3.22 0.97 33
19 Lack of integration of the process of contribution with day
to day work 3.11 1.45 56
20 Lack of directive from the reporting officer 3.11 0.93 33
21 Lack of weightage for contribution in performance appraisal 2.89 1.36 33

144
Group G2: The inhibiting factors of the group in the descending order of the mean are depicted
in Table 5.6. The strongest inhibiting factor is ‗lack of integration of the process of contribution
with day to day work‘, with a mean of 4.09, standard deviation of 0.70 and 86% positive
responses.
Table 5.6 Inhibiting Factors of Group G2
Sl.No Inhibiting Factors (G2) M SD PR
1 Lack of integration of the process of contribution with day to
day work 4.09 0.70 86
2 Lack of user friendly technology infrastructure 4.06 0.76 80
3 Lack of awareness of knowledge requirements 3.94 0.73 77
4 Lack of assurance against negative reverse impact 3.80 0.93 71
5 Lack of feedback 3.77 1.06 74
6 Lack of awareness on the significance of the contribution to
the organisation 3.77 1.03 66
7 Lack of awareness of the process of contribution 3.66 0.84 60
8 Lack of assurance on meeting the knowledge requirements by
the organisational knowledge repository 3.43 1.09 46
9 Lack of time 3.43 1.01 54
10 Lack of protection of intellectual property 3.40 3.80 48
11 Lack of awareness of the utility of the contributions 3.40 1.03 54
12 Lack of expertise in organizing the available knowledge 3.40 1.01 51
13 Lack of weightage for contribution in performance appraisal 3.31 1.11 46
14 Lack of recognition 3.29 0.99 48
15 Lack of mandatory organisational policy on contributions 3.26 1.07 74
16 Lack of assistance in contribution 3.20 1.21 43
17 Lack of directive from the reporting officer 3.06 1.00 31
18 Lack of gratefulness 3.03 0.89 28
19 Lack of tangible reward 3.00 1.08 34
20 Lack of contributions from colleagues 3.00 1.06 34
21 Lack of assurance against belittling by colleagues 2.80 1.13 28

145
Group G3: The inhibiting factors of the group in the descending order of the mean are depicted in
Table 5.7. The strongest inhibiting factor is ‗lack of awareness of the process of contribution‘
with a mean of 4.08, standard deviation of 0.72 and 84% positive responses.
Table 5.7 Inhibiting Factors of G3
Sl.No Inhibiting Factors (G3) Mean SD PR
1 Lack of awareness of the process of contribution 4.08 0.72 84
2 Lack of user friendly technology infrastructure 4.00 0.78 75
3 Lack of awareness of knowledge requirements 3.95 1.00 81
4
Lack of integration of the process of contribution with
day to day work 3.92 0.89 67
5 Lack of feedback 3.89 0.97 70
6 Lack of time 3.86 0.92 78
7 Lack of assurance against negative reverse impact 3.84 0.90 67
8
Lack of awareness on the significance of the
contribution to the organisation 3.73 1.07 62
9 Lack of expertise in organizing the available knowledge 3.70 0.91 70
10 Lack of awareness of the utility of the contributions 3.57 1.01 57
11
Lack of assurance on meeting the knowledge
requirements by the organisational knowledge
repository
3.54 0.96 57
12 Lack of assistance in contribution 3.43 1.12 54
13 Lack of protection of intellectual property 3.41 1.01 48
14
Lack of weightage for contribution in performance
appraisal 3.35 1.14 46
15 Lack of assurance against belittling by colleagues 3.27 0.90 38
16 Lack of gratefulness 3.22 1.20 40
17 Lack of recognition 3.14 1.25 43
18
Lack of mandatory organisational policy on
contributions 3.14 1.13 38
19 Lack of directive from the reporting officer 3.05 0.97 38
20 Lack of tangible reward 3.03 1.21 32
21 Lack of contributions from colleagues 2.97 1.07 27

146
Group G4: The inhibiting factors of the group in the descending order of the mean are depicted in
Table 5.8. The strongest inhibiting factor is ‗lack of integration of the process of contribution with
day to day work‘, with a mean of 4.44, standard deviation of 0.73 and 87% positive responses.
Table 5.8 Inhibiting Factors of Group G4
Sl.No Inhibiting Factors (G4) Mean SD PR
1 Lack of integration of the process of contribution with day to day
work 4.44 0.73 87
2 Lack of user friendly technology infrastructure 4.31 0.70 87
3 Lack of awareness of knowledge requirements 4.31 0.48 100
4 Lack of time 4.13 0.81 87
5 Lack of awareness of the process of contribution 4.00 0.52 87
6 Lack of awareness on the significance of the contribution to the
organisation 3.88 1.15 75
7 Lack of feedback 3.88 0.96 81
8 Lack of expertise in organizing the available knowledge 3.88 0.62 75
9 Lack of assistance in contribution 3.56 0.89 56
10 Lack of directive from the reporting officer 3.50 1.15 50
11 Lack of assurance on meeting the knowledge requirements by the
organisational knowledge repository 3.50 0.86 75
12 Lack of awareness of the utility of the contributions 3.44 1.03 62
13 Lack of weightage for contribution in performance appraisal 3.31 1.45 62
14 Lack of assurance against negative reverse impact 3.31 1.14 50
15 Lack of gratefulness 3.13 1.20 37
16 Lack of recognition 3.06 1.29 50
17 Lack of mandatory organisational policy on contributions 3.00 1.41 31
18 Lack of contributions from colleagues 3.00 1.26 31
19 Lack of tangible reward 2.94 1.06 31
20 Lack of protection of intellectual property 2.75 1.34 31
21 Lack of assurance against belittling by colleagues 2.69 1.08 18

147
Group G5: The inhibiting factors of the group in the descending order of the mean are depicted in
Table 5.9. The strongest inhibiting factor is ‗lack of integration of the process of contribution with
day to day work‘, with a mean of 4.38, standard deviation of 0.63 and 82% positive responses.
Table 5.9 Inhibiting Factors of Group G5
Sl.No Inhibiting Factors (G5) Mean SD PR
1 Lack of integration of the process of contribution with day to
day work 4.38 0.63 82
2 Lack of user friendly technology infrastructure 4.28 0.69 92
3 Lack of awareness on the significance of the contribution to
the organisation 4.18 0.91 84
4 Lack of awareness of knowledge requirements 4.13 1.00 82
5 Lack of feedback 4.10 0.75 77
6 Lack of awareness of the process of contribution 4.03 0.81 79
7 Lack of expertise in organizing the available knowledge 3.97 0.90 77
8 Lack of assurance on meeting the knowledge requirements
by the organisational knowledge repository 3.87 0.86 66
9 Lack of time 3.82 0.97 74
10 Lack of awareness of the utility of the contributions 3.77 0.81 69
11 Lack of weightage for contribution in performance appraisal 3.64 1.04 66
12 Lack of recognition 3.59 1.23 66
13 Lack of assurance against negative reverse impact 3.56 1.17 64
14 Lack of protection of intellectual property 3.54 1.27 56
15 Lack of gratefulness 3.44 1.25 54
16 Lack of assistance in contribution 3.38 1.16 59
17 Lack of tangible reward 3.38 1.09 43
18 Lack of directive from the reporting officer 3.36 0.84 38
19 Lack of mandatory organisational policy on contributions 3.31 1.17 46
20 Lack of contributions from colleagues 3.31 1.06 43
21 Lack of assurance against belittling by colleagues 2.90 1.02 25

148
Group G6: The inhibiting factors of the group in the descending order of the mean are depicted
in Table 5.10. The strongest inhibiting factor is ‗lack of awareness on the significance of
contribution to the organisation‘, with a mean of 4.43, standard deviation of 0.49 and 100%
positive responses.
Table 5.10 Inhibiting Factors of Group G6
Sl.No Inhibiting Factors (G6)
Mean SD PR
1 Lack of awareness on the significance of the contribution to the
organisation 4.43 0.49 100
2 Lack of assurance against negative reverse impact 4.36 0.81 93
3 Lack of protection of intellectual property 4.14 0.83 86
4 Lack of integration of the process of contribution with day to
day work 4.00 0.85 78
5 Lack of time 3.93 0.96 78
6 Lack of user friendly technology infrastructure 3.93 0.96 64
7 Lack of awareness of knowledge requirements 3.86 0.99 71
8 Lack of awareness of the utility of the contributions 3.86 0.83 71
9 Lack of weightage for contribution in performance appraisal 3.71 0.80 78
10 Lack of contributions from colleagues 3.64 0.89 50
11 Lack of directive from the reporting officer 3.57 1.05 50
12 Lack of assurance on meeting the knowledge requirements by
the organisational knowledge repository 3.54 0.93 61
13 Lack of awareness of the process of contribution 3.36 1.11 50
14 Lack of recognition 3.21 1.15 43
15 Lack of assurance against belittling by colleagues 3.21 0.77 43
16 Lack of mandatory organisational policy on contributions 3.07 0.88 21
17 Lack of tangible reward 3.00 0.93 21
18 Lack of expertise in organizing the available knowledge 2.86 0.91 28
19 Lack of gratefulness 2.57 1.12 14
20 Lack of assistance in contribution 2.21 1.37 14
21 Lack of feedback 2.00 0.65 78

149
Group G7: The inhibiting factors of the group in the descending order of the mean are depicted in
Table 5.11. The strongest inhibiting factor is ‗lack of awareness of knowledge requirements‘, with
a mean of 4.28, standard deviation of 0.67 and 88% positive responses.
Table 5.11 Inhibiting Factors of Group G7
Sl.No Inhibiting Factors (G7) Mean SD PR
1 Lack of awareness of knowledge requirements 4.28 0.67 88
2 Lack of awareness on the significance of the contribution
to the organisation 4.00 0.91 72
3 Lack of feedback 3.94 0.73 72
4 Lack of awareness of the process of contribution 3.89 0.83 61
5 Lack of integration of the process of contribution with
day to day work 3.83 0.92 50
6 Lack of user friendly technology infrastructure 3.72 1.02 44
7 Lack of time 3.67 0.69 55
8 Lack of protection of intellectual property 3.44 0.86 33
9 Lack of expertise in organizing the available knowledge 3.44 0.62 39
10 Lack of awareness of the utility of the contributions 3.39 1.09 44
11 Lack of assurance against negative reverse impact 3.39 0.92 17
12 Lack of assurance on meeting the knowledge
requirements by the organisational knowledge repository 3.11 1.08 39
13 Lack of tangible reward 3.00 1.08 22
14 Lack of recognition 3.00 1.03 17
15 Lack of weightage for contribution in performance
appraisal 3.00 0.97 22
16 Lack of gratefulness 2.83 0.86 17
17 Lack of assistance in contribution 2.83 0.79 16
18 Lack of contributions from colleagues 2.83 0.71 11
19 Lack of directive from the reporting officer 2.83 0.62 6
20 Lack of mandatory organisational policy on contributions 2.67 1.03 11
21 Lack of assurance against belittling by colleagues 2.61 0.70 6

150
Group G8: The inhibiting factors of the group in the descending order of the mean are depicted in
Table 5.12. The strongest inhibiting factor is ‗lack of awareness on the significance of
contribution to the organisation‘, with a mean of 4.32, standard deviation of 0.98 and 82%
positive responses.
Table 5.12 Inhibiting Factors of Group G8
Sl.No Inhibiting Factors (G8) Mean SD PR
1 Lack of awareness on the significance of the contribution to
the organisation 4.32 0.98 82
2 Lack of integration of the process of contribution with day to
day work 4.29 0.76 82
3 Lack of awareness of knowledge requirements 4.29 0.66 96
4 Lack of user friendly technology infrastructure 4.25 0.84 75
5 Lack of feedback 4.14 0.59 89
6 Lack of awareness of the utility of the contributions 4.00 0.77 79
7 Lack of assurance on meeting the knowledge requirements by
the organisational knowledge repository 3.89 0.88 71
8 Lack of awareness of the process of contribution 3.86 0.89 68
9 Lack of expertise in organizing the available knowledge 3.82 0.77 68
10 Lack of time 3.68 1.12 61
11 Lack of assurance against negative reverse impact 3.64 1.03 57
12 Lack of directive from the reporting officer 3.61 1.17 54
13 Lack of protection of intellectual property 3.50 1.32 57
14 Lack of weightage for contribution in performance appraisal 3.50 1.29 57
15 Lack of tangible reward 3.43 1.23 54
16 Lack of recognition 3.39 1.10 46
17 Lack of assistance in contribution 3.36 0.87 46
18 Lack of contributions from colleagues 3.11 1.34 43
19 Lack of gratefulness 3.07 1.12 25
20 Lack of mandatory organisational policy on contributions 2.89 1.26 48
21 Lack of assurance against belittling by colleagues 2.75 1.17 25

151
Group G9: The inhibiting factors of the group in the descending order of the mean are depicted in
Table 5.13. The strongest inhibiting factor is ‗lack of awareness of the process of contribution‘,
with a mean of 4.14, standard deviation of 0.53 and 93% positive responses.
Table 5.13 Inhibiting Factors of Group G9
Sl.No Inhibiting Factors (G9) Mean SD PR
1 Lack of awareness of the process of contribution 4.14 0.53 93
2 Lack of awareness on the significance of the contribution to the
organisation 4.07 0.83 71
3 Lack of user friendly technology infrastructure 4.00 0.88 78
4 Lack of integration of the process of contribution with day to
day work 4.00 0.68 78
5 Lack of feedback 3.79 0.89 64
6 Lack of protection of intellectual property 3.79 0.89 64
7 Lack of assurance against negative reverse impact 3.71 0.91 57
8 Lack of awareness of knowledge requirements 3.57 1.09 14
9 Lack of expertise in organizing the available knowledge 3.43 0.85 50
10 Lack of time 3.29 1.07 50
11 Lack of assistance in contribution 3.36 1.08 50
12 Lack of directive from the reporting officer 3.36 1.01 43
13 Lack of awareness of the utility of the contributions 3.36 0.84 43
14 Lack of weightage for contribution in performance appraisal 3.14 1.08 28
15 Lack of mandatory organisational policy on contributions 2.93 1.00 21
16 Lack of recognition 2.86 1.10 21
17 Lack of assurance on meeting the knowledge requirements by
the organisational knowledge repository 2.79 0.97 21
18 Lack of assurance against belittling by colleagues 2.71 1.07 14
19 Lack of tangible reward 2.64 1.01 14
20 Lack of contributions from colleagues 2.57 0.94 7
21 Lack of gratefulness 2.57 0.51 10

152
Group G10: The inhibiting factors of the group in the descending order of the mean are depicted
in Table 5.14. The strongest inhibiting factor is ‗lack of user friendly technology infrastructure‘,
with a mean of 4.23, standard deviation of 0.60 and 91% positive responses.
Table 5.14 Inhibiting Factors of Group G10
Sl.No Inhibiting Factors (G10) Mean SD PR
1 Lack of user friendly technology infrastructure 4.23 0.60 91
2 Lack of feedback 4.11 0.83 82
3 Lack of integration of the process of contribution with day- to-
day work 4.00 0.87 80
4 Lack of expertise in organizing the available knowledge 4.00 0.84 82
5 Lack of awareness of knowledge requirements 4.00 0.77 77
6 Lack of awareness on the significance of the contribution to
the organisation 3.94 1.06 74
7 Lack of awareness of the utility of the contributions 3.89 0.99 77
8 Lack of time 3.83 0.92 77
9 Lack of assurance against negative reverse impact 3.77 1.11 71
10 Lack of awareness of the process of contribution 3.76 0.77 67
11 Lack of assistance in contribution 3.71 0.96 68
12 Lack of assurance on meeting the knowledge requirements by
the organisational knowledge repository 3.69 0.90 77
13 Lack of recognition 3.66 0.91 65
14 Lack of assurance against belittling by colleagues 3.57 1.07 57
15 Lack of protection of intellectual property 3.49 1.27 57
16 Lack of directive from the reporting officer 3.37 0.91 51
17 Lack of gratefulness 3.37 0.88 57
18 Lack of weightage for contribution in performance appraisal 3.14 1.46 54
19 Lack of contributions from colleagues 3.09 1.01 37
20 Lack of tangible reward 3.03 1.25 40
21 Lack of mandatory organisational policy on contributions 2.91 1.20 48

153
5.3.2 Organisation
The inhibiting factors of the organisation in the descending order of the mean are depicted in
Table 5.15.
Table 5.15 Inhibiting Factors of the Organisation
Sl.No. Inhibiting Factors Mean SD PR
1 Lack of user friendly technology infrastructure 4.10 0.81 77.55
2 Lack of integration of the process of contribution with
day-to-day work 4.08 0.85 78.36
3 Lack of awareness of knowledge requirements 4.03 0.87 82.04
4 Lack of awareness on the significance of the
contribution to the organisation 4.01 0.99 75.10
5 Lack of feedback 4.00 0.85 77.95
6 Lack of awareness of the process of contribution 3.89 0.80 73.77
7 Lack of time 3.72 1.00 68.16
8 Lack of assurance against negative reverse impact 3.71 1.02 64.08
9 Lack of expertise in organizing the available
Knowledge 3.71 0.92 64.89
10 Lack of awareness of the utility of the contributions 3.68 0.95 64.48
11
Lack of assurance on meeting the knowledge
requirements by the organisational knowledge
repository
3.58 0.98 56.79
12 Lack of protection of intellectual property 3.50 1.17 53.87
13 Lack of recognition 3.35 1.12 48.57
14 Lack of weightage for contribution in performance
appraisal 3.34 1.19 51.42
15 Lack of assistance in contribution 3.31 1.12 48.97
16 Lack of directive from the reporting officer 3.27 0.98 40.00
17 Lack of gratefulness 3.17 1.10 37.14
18 Lack of tangible reward 3.12 1.14 36.32
19 Lack of mandatory organisational policy on
contributions 3.09 1.16 37.55
20 Lack of contributions from colleagues 3.09 1.07 34.69
21 Lack of assurance against belittling by colleagues 3.00 1.05 31.02

154
The most predominant inhibiting factors based on mean (mean >=4.0) are ‗lack of user friendly
technology infrastructure‘ (mean=4.10), ‗lack of integration of the process of contribution with
day to day work‘ (mean=4.08), ‗lack of awareness of knowledge requirements‘ (mean=4.03),
‗lack of awareness on the significance of the contribution to the organisation‘ (mean=4.01), and
‗lack of feedback‘ (mean=4.00). The organisation need to formulate and implement an action plan
to eliminate or at least minimize the inhibiting factors, to achieve higher levels of KM maturity.
The frequency distribution of most predominant 5 inhibiting factors (based on mean) for the
groups and the organisation in descending order is depicted in Table 5.16.
Table 5.16 Frequency distribution of Most Predominant Inhibiting Factors
Sl.No. Inhibiting Factors Frequency Percentage
1
Lack of integration of the process of contribution with
day-to-day work 10 18.2
2 Lack of feedback 9 16.4
3 Lack of awareness of knowledge requirements 8 14.5
4 Lack of user friendly technology infrastructure 8 14.5
5
Lack of awareness on the significance of the
contribution to the organisation 6 10.9
6 Lack of awareness of the process of contribution 4 7.3
7 Lack of time 2 3.6
8
Lack of expertise in organizing the available
Knowledge 2 3.6
9 Lack of assurance against negative reverse impact 2 3.6
10 Lack of gratefulness 1 1.8
11 Lack of recognition 1 1.8
12 Lack of awareness of the utility of the contributions 1 1.8
13 Lack of protection of intellectual property 1 1.8

155
It can be observed that, based on the frequency distribution the top 5 inhibiting factors are:
Lack of integration of the process of contribution with day-today work
Lack of feedback
Lack of awareness of knowledge requirements
Lack of user friendly technology infrastructure
Lack of awareness on the significance of the contribution to the organization
5.4 DISCUSSION
The survey used a questionnaire which was pre-tested and modified based on the feedbacks
received during the pre-test. Also the survey used stratification by taking each group as a separate
entity. Also participants from each group were randomly selected. Hence, it can be considered as
stratified random sampling. Also the responses were anonymous and voluntary. The analysis and
the draft report were presented to the key officials of the organisation. Hence, though the
organisation was selected based on accessibility to data, objectivity was maintained in the study.
Following are some of the suggestions made by the participants that indicate the areas that need to
be improved.
Some persons from each section should be made responsible to collect and make the
information available
All organisational publications should be made available in the portal
Provision for marks for documents and contributors should be available
Discussion forums should be made available
In addition to approved knowledge documents, unapproved knowledge documents, blogs
are also to be made available

156
Search capability may be made more versatile
More credit should be given to the knowledge sharer
Submission of knowledge documents should be made mandatory
Record of important discussions and talks should be made available
It can be observed that the most predominant inhibiting factor is the lack of integration of KM
processes with day-to-day work. As highlighted in Section 1.5.2.1, the most important KM
process in the context of an R&D organization is knowledge creation. Improvements in the
effectiveness of knowledge creation will help an R&D organization to achieve higher levels of
KM maturity. Hence, the process of knowledge creation and its context pertaining to one group
are studied in Chapter 6.
5.5 SUMMARY
In this Chapter, the inhibiting factors which prevent various groups in the organisation as well as
the organisation from attaining higher levels of maturity are identified through a survey. The
profile of participants in terms of participation and demographic variables were analysed. The
frequency distribution of most predominant 5 inhibiting factors for the groups and the
organization were tabulated. The study revealed that the most predominant inhibiting factors are
lack of integration of KM processes with day-to-day work, lack of feedback, lack of awareness
and lack of user friendly technology infrastructure.

157
CHAPTER 6
KNOWLEDGE CREATION AND BA: A STUDY
In this chapter the process of knowledge creation and the concept of ba are discussed. A new
framework of ba based on the mode of knowledge creation and the type of interaction is
proposed. Also the design of ba in the organisational context is illustrated. Subsequently the
current practice of knowledge creation, in one of the groups (G9) of the organisation discussed in
Chapter 4 is studied. Also taxonomy for knowledge pertaining to the group is developed.
6.1. INTRODUCTION
Knowledge creation is the most important KM process in the context of an R&D organisation and
it takes place in ba. Improvements in the effectiveness of knowledge creation will help an R&D
organization to achieve higher levels of KM maturity. This thesis proposes a new ba, viz, SECI
ba, based on literature survey and organisational study and illustrates in the organisational
context. The illustration is in the general context of the organisation and specific context of one of
the groups (G9) of the organisation discussed in Chapter 4. This study of knowledge creation was
conducted based on the published literature, the information available on the knowledge
management portal and a semi structured interview conducted with a few knowledge officers of
the group.
The group G9 is responsible for the operation and maintenance of a Fast Breeder Test
Reactor(FBTR). This reactor was designed and constructed based on an agreement that was
signed with French Atomic Energy Commission for transfer of the design of the Rapsodie
Reactor, training of personnel in Rapsodie and transfer of manufacturing technology for critical
components. It is a 40 MWt/13.2 MWe sodium cooled loop type mixed carbide fuelled reactor

158
and it is operational since 1985(Srinivasan, et al., 2006). It is a research reactor intended to gain
knowledge in design, construction, commissioning, training, operation, maintenance and
decommissioning of fast reactors. It also serves as a test bed for various R&D related to fuel
development and structural materials.
Vast amount of knowledge was created during the reactor design, construction, operation,
maintenance and experiments carried out in the reactor. This knowledge is preserved, shared and
utilized for the design of new fast breeder reactors, which are being constructed. The knowledge
in reactor is classified based on phase of the reactor like R&D, design, construction,
commissioning, operation, etc. and further based on reactor subsystems like neutronics, sodium
system, steam water system, electrical system, central data processing system, fuel handling
system and auxiliary systems. The knowledge is further classified based on different forms like
experiences, incidents, lessons learned, improvements and recommendations and further based on
the form of knowledge like publications, internal reports, design document etc.
This being the first operational fast reactor in India, the initial knowledge transfer from the
collaborators was very effective. The subsequent knowledge creation, knowledge sharing and
knowledge preservation resulted not only in the improved performance of the reactor, but also in
the design of new fast reactors. Every technical challenge in the reactor has been unique in its
own way. Every problem has been identified, right solutions found and the journey continued.
Every problem was a challenge which brought different diagnostic techniques and
troubleshooting aids as its spin off. This made the reactor operation and maintenance an exciting
journey towards continuous learning for perfection and mastery of a nascent technology (IGCAR,
2010).

159
6.2 SECI Ba
The four types of ba described in Section 1.5.2.1 correspond to four modes of knowledge creation
and based on type of interaction, viz., individual or collective and media of interaction, viz, face
to face or virtual.
This thesis proposes four types of ba (SECI Ba) in line with four modes of knowledge creation
viz., socializing ba, externalizing ba, combining ba and internalizing ba. These four modes of
knowledge creation can take place by real interactions or virtual interactions through the use of
ICT. Hence, these result in eight types of ba, namely, real socializing ba, real externalizing ba,
real combining ba, real internalizing ba and virtual socializing ba, virtual externalizing ba,
virtual combining ba, virtual internalizing ba. as depicted in Figure 6.1.
Also since the interactions can take place at different levels of the organisational unit, the 8 types
of ba specific to the organisational unit can be evolved resulting in nx8 independent ba, where ‗n‘
is the number of organisational units.
Figure 6.1 SECI Ba

160
6.3 TYPES OF BA IN THE ORGANISATIONAL CONTEXT
The organisation considered is the one discussed in chapter 4. It is divided into various Groups
which are divided into Divisions and further divided into Sections. In this context, the following
ba are possible:
Sectional ba
Divisional ba
Group ba
Organisational ba
Inter-organisational ba
Different ba based on organisational units is depicted in Figure 6.2. In all the above organisational
unit based ba, the 8 types of ba described earlier are possible.
Figure 6.2 Types of Ba based on organisational units
Organisation 1
Real
Internalizing
Ba
Real
Combining Ba
Group 1 Group N
Division O Division 1
Section P Section 1
Organisation M
Virtual
Internalizing
Ba Virtual
Combining Ba
Inter-organisational Ba
Organisational Ba
Divisional Ba
Group Ba
Sectional Ba

161
In sectional ba the participants are limited to the members of the section. Formal and informal
meetings organized within the section, where different modes of knowledge creation takes place
are examples of sectional ba. In Divisional ba the participants are limited to the members of the
Division, but they transcend sectional boundaries. Formal and informal meetings organized
within the Division, like task force meetings, project review meetings, divisional meetings, where
different modes of knowledge creation takes place are examples of Divisional ba.
In Group ba the participants are limited to the members of the Group but they transcend the
Divisional and Sectional boundaries. Formal and informal meetings are arranged within the
Group, like Task Force meeting, Group meetings and Technical meetings, where different modes
of knowledge creation takes place are examples of Group ba.
In Organisational ba the participants are limited the organisation, but they transcend the Group,
Divisional and Sectional boundaries. Formal and informal meetings, that are organized within the
organization, like Task Force meetings, various Committee meetings where different modes of
knowledge creation takes place are examples of organisational ba.
In Inter-organisational ba, the participants transcend the organisational boundaries. Formal and
informal meetings organized with participants from various organisations where different modes
of knowledge creation takes place are examples of Inter-organisational ba.
Ba that exist in different organisational units can be connected to form a greater ba, in a similar
way as that of a modular system. However the coherence among the ba has to achieved based on
shared knowledge vision, trust and care. Also knowledge flow takes place in both directions when
different ba are integrated as depicted in Figure 6.3.

162
Sectional Ba Divisional Ba Group Ba Organisational Ba Inter-organisational Ba
6.4 KNOWLEDGE CREATION IN GROUP G9
Knowledge creation in Group G9 was studied based on semi-structured interview with key
officials of the group. The guiding Questionnaire is given in Appendix E. In the context of the
Group G9 all the 4 modes of knowledge creation takes place regularly. Since this group is mainly
located in a single building almost all the knowledge creation takes place in real mode. When
socialization mode is considered, the initial project team was given on the job training in
Rapsodie. At present new operators are given on the job training followed by different levels of
assessment in the form of qualification tests. Also the operators meant for new reactors are given
on the job training. Daily morning knowledge sharing sessions are held, where the experience of
the previous day and the work plan for the current day are discussed. These knowledge sharing
sessions are attended by knowledge engineers and selected knowledge practitioners. In addition,
there are regular weekly knowledge sharing sessions conducted for knowledge engineers,
Knowledge flow
Knowledge flow
Figure 6.3 Integration of Ba

163
knowledge officers and selected knowledge practitioners. In addition, there are periodic
knowledge sharing sessions attended by knowledge officers, selected knowledge engineers and
external experts. All these knowledge creation processes take place in ‗Real Socializing Ba‘.
Considering the externalization mode, regular tacit knowledge elicitation programmes are held,
and the elicited knowledge in the form of audio/video recordings and documents are made
available in the knowledge portal. Also regular weekly meetings of knowledge engineers with
knowledge officers and knowledge engineers with knowledge practitioners are conducted, where
discussions and brainstorming sessions are held. These knowledge creation processes take place
in ‗Real Externalizing Ba’.
Also minutes of meetings of important knowledge sharing sessions are prepared and shared.
Daily operation logs are prepared and shared. Operation document for each system is prepared
and shared. An ‗event reporting system‘ is in practice where normal plant events and significant
events are documented and shared. System manuals and flow sheets are prepared and shared.
Operation manuals and emergency operating procedures are documented and shared. Monthly
schedule and monthly reports are prepared and shared. This reactor has recently completed 25
years of successful operation. A knowledge module in the form of a book was brought out
combining various knowledge modules from the various phases of the project like design,
construction, commissioning, operation, maintenance, R&D, retrofitting etc. This is another
classic example of combination mode of knowledge creation that had taken place in ‗Real
Combining Ba‘.

164
Class room and on the job training are given to the operators, maintenance personnel, station
chemists and reactor physicists. Whenever a modification in any of the systems are required, the
proposal for the modification is discussed and an engineering change notification is prepared and
circulated among the relevant stake holders and concurrence is obtained before the modification is
being carried out. The initial project team of the reactor had internalized the fast reactor design
knowledge from the design documents provided by the Rapsodie engineers. Similarly, the
operators of the reactor internalize the knowledge of fast reactor operation from operation
manuals. These are examples of ‗Real Internalizing Ba‘.
6.5 KNOWLEDGE CLASSIFICATION IN GROUP G9
Within each phase of FBTR, the knowledge is classified based systems, subsystems and sub-
subsystems. This classification based on systems, subsystems and sub-subsystems for the Group
G9 is detailed in Table 6.1. The reactor is divided into 9 systems viz Reactor Block Pile, Sodium
System, Steam Water System, Auxiliary System, Fuel Handling, Station Power Supply, Turbine
& Alternator, Central Data Processing System and Reactor Protection System. Each system is
divided further into subsystems and sub-subsystems.
Table 6.1 Reactor systems and subsystems
System Subsystem Sub-subsystem
Reactor Block Pile
Reactor Assembly
Rotation Plug Cooling
System(RPC)
Reactor Core
Interseal Argon system Core Cover Plate Mechanism
(CCPM)

165
System Subsystem Sub-subsystem
Core Thermocouple Couple (CTC)
Control Rod Drive Mechanism
(CRDM)
Inflatable Seals
Biological Shield Cooling Emergency Storage Tank
Control Rod Drive
Mechanism
Clad Rupture Detection
circuit (CRD)
CRD in Argon
CRD in Sodium(DND)
Displacement
Measurement
Device(DMD)
Preheating and Emergency
cooling
Primary cover gas Helium Injection Circuit
Sodium System
Primary Sodium System
Primary Sodium Main Circuit
Primary Fill & Drain Circuit
Primary Cold Trap Cooling Circuit
Primary Sodium Purification
Circuit
Primary Sodium Pumps and
Drives
Secondary Sodium System
Secondary Sodium Main Circuit
Secondary Sodium Purification
Circuit
Secondary Cold Trap Cooling
Circuit
Hydrogen in Argon Detection
Secondary Cover Gas
Sodium in Argon Detection (SAD)

166
System Subsystem Sub-subsystem
Secondary Sodium Pumps and
Drives
Steam Generator Leak Detection
System
Steam Water System
Condensate System Chemical Dosing Units
Steam water system Condensate Polishing Unit
Auxiliary Steam Circuit
Feed water system Package Boiler
Auxiliary System Raw water system
Service Water System
Fire Fighting
Domestic Water System
Fire Water System
CO2 Fire Fighting System
Compressed Air System Mulsyfyre System
Service Argon System
Active Liquid Effluent
System
Condenser Cooling Water
Circuit
Service Water System
Reaction product discharge
& recovery circuit
Dimineralised water plant Demineralised Water Storage and
Distribution System
Flooding System
Air condition and
Ventilation
Active Building Air Conditioning
and Ventilation
Inactive area Air conditioning and
Ventilation

167
System Subsystem Sub-subsystem
Fuel Handling
Fresh Element charging
and transfer
Fresh Element storage and
transportation
Irradiated element
transport and storage
Irradiated element
discharging
Station Power Supply
Main power Supply 6.6KV power supply Bus
415V power supply Bus
Emergency power supply Diesel Generators
Control power supply
24V DC power supply/Battery
Bank
48V DC power supply/Battery
Bank
220V DC power supply/Battery
Bank
Uninterrupted power supply(UPS)
Turbine & Alternator
Alternator and its
auxiliaries Generator air cooling
Centrifuge
Turbine and its auxiliaries
Gland sealing
Vaccum system
Turbovisory parameters
Central Data Processing
System
Main system
Stand alone system
Reactor Protection
System
Neutronic Instruments
LOR circuit
SCRAM circuit

168
It can be observed that some of the subsystems may not have sub-subsystems. For instance the
subsystem ‗Reactor Assembly‘ has no sub-subsystem. Within each system/ subsystem/ sub-
subsystem, the knowledge is further classified based on type of knowledge like ―Lessons
Learned‖, ―Experiences‖, ―Precautions‖, ―Guidelines‖, ―Recommendations‖, ―Improvements‖,
―Incidents‖ and ―Repeated Incidents‖. The causes of the incidents were categorized as ―Design
Deficiency‖, ―Operator Error‖, ―Equipment Failure‖ etc. Also the remedial measures are
documented.
The knowledge is also categorized based on the form of knowledge like publications,
presentations, internal reports, design reports, manuals, drawings, operating documents, minutes
of meetings, elicited knowledge etc.
The taxonomy starts with the phase of the reactor like R&D, Design, Consruction etc. Within
each phase, system/ subsystem/ sub-subsystem is considered. Within each system/ subsystem/
sub-subsystem, the type of knowledge and further the form of knowledge are considered. The
developed taxonomy is depicted in Figure 6.4

169
R & D
Steam water system
Auxiliary System
Fuel handling S ystem
Station power Supply
Turbine & Alternator
Central data Processing System
Reactor Production system
Experiences Precautions Guidelines Recommen - d ation s
Improvements Incidents Repeated Incidents
Presenta tions Internal Reports
Design Reports
Manuals Drawings Operating Documents
Elicited Knowledge
Sodium System
Figure 6.4 Taxonomy of Reactor knowledge
NUCLEAR REACTOR KNOWLEDGE
R & D Design Construction Commission Operation &
Maintanance Refurbishment Deco m missioning
Lessons learned
Publications
Reactor Block pile

170
The following typical examples illustrate the structure of knowledge base. It starts with the phase
of the reactor, followed by reactor subsystem, followed by type of knowledge, followed by the
form of knowledge followed by the actual documents
Examples:
Construction → Sodium System → Precautions → Internal Report →Cleanliness
Commissioning → Sodium System → Primary Sodium → Guidelines → Internal
Note→ Leak Tightness
Commissioning → Sodium System → Secondary Sodium System → Incident →
Internal Report → Sodium Leak from Cold Trap → Causes → High Heat Flux →
Remedial Measures →Provide Surface Thermocouples
Commissioning → Sodium System → Lessons Learned→ Presentation→ Stringent
Quality Assurance Procedures
Commissioning → Sodium System → Recommendations → Publication→ Transfer
of Sodium from a Storage Tank → Usage of Electro Magnetic Pump rather than
Pressurizing the Tank
Operation → Reactor Protection System → Control Rod Drive Mechanism →Incident
→ Internal Note → Uncontrolled Withdrawal of one Control Rod → Causes →
Sluggishness of Raise Contactor → Remedial Measures→ Control Rods Level
Discordance as Lowering of Rod Input
Each knowledge module has meta knowledge structure with Title, Author, Journal/Conference/
Technical Meeting/Others, Date, Summary, Keywords, Utility, and Target Users. Also tacit
knowledge has a structure with Name, Designation, Qualification, Date of Birth, Date of joining

171
Service, Contact Details, Expertise, Interest, Domains of work, Projects Carried out, Knowledge
Artifacts and Remarks.
6. 6 SUMMARY
In this chapter the process of knowledge creation, which is the most important KM process in
the context of an R&D organisation was discussed. A framework of ba based on the SECI mode
of knowledge creation and the type of interaction was proposed (SECI ba). Also the design of ba
in the organisational context was illustrated. The current practice of knowledge creation, in the
group based on SECI ba was discussed. A taxonomy for the knowledge pertaining to the group
was developed. The developments were discussed with the key officials of the group.
Improvements in knowledge creation can significantly improve the KM maturity level of the
group.

172
CHAPTER 7
SUMMARY AND RECOMMENDATIONS
In this chapter the thesis is summarized in terms of objectives, research methodology, analysis,
findings, contributions, recommendations and limitations.
7.1 RESEARCH OBJECTIVES
The core objective of the research was to develop a flexible and adaptable KM maturity model
combining the attractive features of the existing models. Demonstration and validation of the
model were part of the core objectives. Assessing the current level of KM maturity of the
organisation and its sub units also were objectives. Identifying the inhibiting factors to attain
higher levels of maturity for the organisation and its sub units was also an objective. Knowledge
creation being the most important KM process in the context of R&D organisation, a detailed
study of this process was another objective. Development of a taxonomy pertaining to the
knowledge of one of the sub-units of the organisation was another objective. Arriving at an
appropriate recommendation for the context organisation to achieve higher levels of KM maturity
was the final objective.
7.2 RESARCH METHODOLOGY
A combination of case study and survey was used without triangulation. Case study was used to
identify the KM maturity levels of the organisation and its 10 sub units, while survey was used to
identify the inhibiting factors to attain higher levels of KM maturity for the organisation and its
10 sub units. Through study of existing KM maturity models and morphological analysis, the
strengths of the existing models were identified. Based on the above studies a new flexible and

173
adaptable KM maturity model which combines the attractive features of the existing models was
developed. The model was validated by expert judgment. Also application of the model was
demonstrated and validated through a case study of a nuclear R&D organisation. The current KM
maturity levels of the organisation and its 10 sub-units were assessed through case study
approach. The inhibiting factors to attain higher levels of KM maturity for the target organisation
and its 10 sub-units were identified through survey methodology. The recommendations to attain
higher levels of KM maturity for the organisation were given. Also the process of knowledge
creation and ba in the general context of the organisation and specific context of one sub unit of
the organisation were studied. SECI ba, based SECI model of knowledge creation was proposed
in the organisational context. A taxonomy pertaining to the knowledge of the sub unit also was
proposed.
7.3 ANALYSIS AND FINDINGS
The study revealed that, the organisation had initiated formal KM practices, a few years back,
with a KM policy, technology infrastructure, and KM roles. It had attained a KM maturity of
Level1+, in ‗People‘ Key Area, Level 1 in ‗Process‘ Key Area, Level 1+, in ‗Technology‘
Key Area and Level 1 in ‗Knowledge‘ Key Area. The organisation has achieved an ‗Employee
Satisfaction‘ of ‗Low‘ in KM activities. However as per the model, RoI is not evaluated for Level
1 maturity. The organisation has achieved an overall KM maturity of Level 1. The study had
identified many inhibiting factors, which prevented the organisation from attaining higher levels
of maturity. The study had also assessed the KM maturity of the individual sub units of the
organisation and identified the respective inhibiting factors.

174
7.4 RECOMMENDATIONS
Currently the context organisation has attained an overall KM maturity of Level 1. However,
many groups are in Level 1+ and 1++ with respect to ‗People‘, ‗Technology‘ and ‗Knowledge‘
Key Areas. The organisation needs to focus more on ‗Process‘ and ‗Knowledge‘ Key Areas to
move to Level 1+ and 1++. For the organisation to progress to Level 2, it needs to qualitatively
improve up on the various parameters identified in the model. Also it needs to have a mechanism
to monitor and take corrective actions on the qualitative progress on the parameters. To progress
to Level 3 the organisation needs to introduce quantitative monitoring in addition to qualitative
monitoring. The recommendations for improving the maturity are proposed in the following
sections based on key areas and enabling factors.
7.4.1 People
Currently the awareness of KM among the employees is low. A working definition of
‗knowledge‘ and ‗knowledge management‘ needs to be developed. A typical definition is given in
Section 7.6 of this thesis.
Awareness can be improved by seminars, discussions, brainstorming sessions, knowledge cafes
etc. The awareness need to be periodically monitored, qualitatively and corrective actions need to
be taken.
The participation of employees in KM activities is currently low. This level of participation need
to be improved by assigning higher level of priority to KM activities. Recognition of the benefits
of KM, to employees and to the organisation in practical terms can enhance the participation.
Participation can be monitored by No. of documents submitted, No. of documents downloaded,
No. of knowledge sharing sessions, over all knowledge sharing quality index etc.

175
Though there are formal KM roles, the effectiveness is low. Assigning higher priority and proper
training for KM roles can enhance the effectiveness. Introduction of qualitative and quantitative
monitoring of the effectiveness can improve it further.
The effectiveness of mentoring and succession planning is low. In general the reporting officer
acts as the mentor and hence knowledge transfer takes place. However the busy schedule of the
reporting officers and probable negative reverse impact can adversely affect the effectiveness of
knowledge transfer. The succession planning generally follows the seniority. However if the
successor can be identified at least two years ahead of superannuation, the effectiveness of
knowledge transfer can be further improved. All the critical tasks need to have knowledge
preservation schemes by proper documentation and tacit knowledge transfer to probable
successors to guard against unplanned attrition.
Formal communities, in the form of ‗Quality Circles‘ and ‗Technical Colloquiums‘ are existing.
Also informal communities are existing. However more and more communities need to be created
and nurtured to make it more effective in knowledge sharing, problem solving and innovation.
Adequate support by the reporting officers and qualitative and quantitative monitoring can
improve further the effectiveness of communities of practice.
7.4.2 Process
The current KM processes are centered around mandatory documentation like publications,
design reports, presentations etc. and formal knowledge sharing sessions like colloquiums,
seminars etc. The effectiveness need to be monitored, qualitatively and quantitatively and
corrective actions need to be taken. The effectiveness of the KM policy and KM strategy need to
be improved through brain storming sessions and feedback. Lack of process integration was one

176
of the major inhibitors. Hence KM should get integrated with more and more normal work
process.
7.4.3 Technology
Currently an intranet based knowledge portal is available. About 800 users are accessing the
portal every month. Also another system is operational for management of data. Integration of
both systems will bring more benefits. Also introducing features for document submission, rating,
approval, feedback, publishing, collaboration, keeping track the usage etc. will enhance the
utility. AI and KE techniques for knowledge representation, knowledge elicitation, knowledge
discovery etc. can be introduced after a critical level of participation and utility has been
established.
7.4.4 Knowledge
A knowledge organisation scheme based on a flexible taxonomy applicable for the organisation
and individual sub-units is to be developed. A typical taxonomy applicable for one of the sub
units was developed in Chapter 6. It is necessary to identify core, advanced and innovative
knowledge applicable to the organisation and individual sub-units. Documenting experiences like
‗lessons learned‘, ‗best practices‘, FAQ etc. need to be made mandatory. The quantity and quality
of knowledge available in the repository and its utilization need to be monitored qualitatively &
quantitatively and corrective actions need to be taken periodically.
7.4.5 Return on Investment
Benefits of KM efforts need to monitored periodically and corrective actions need to be taken.
Though the study has been conducted based on employee satisfaction alone, other factors of
organisational performance as per the model also need to be considered.

177
7.4.6 Enabling Factors
Many enabling factors were discussed in Chapter 1. These factors are enabling conditions for
successful KM. Also the study identified the present inhibiting factors that prevent the
organisation and various sub units from achieving higher levels of KM maturity. Removing the
inhibiting factors will enhance the effectiveness of KM activities. A knowledge sharing culture,
need to be nurtured with a strong commitment and involvement from the leadership. The impact
of various enabling factors, on improving the maturity need to be studied. The presence of these
enabling factors need to ensured to achieve higher levels of maturity.
7.4.7 Procedure for KM Activities
A typical procedure for implementation of KM activities is given below. The activity considered
is ‗KM Awareness Creation‘. Similar procedure need to be developed for all other KM activities.
KM Activity : KM Awareness Creation
Goal: The goal of awareness creation is to ensure that all the employees understand the practical
meaning of KM, its importance, the benefits to individuals and to the organisation, the method of
practicing and monitoring.
Policy: The management is committed to improve the awareness of KM among all the employees
and create a shared vision with respect to KM for the organisation.
Action Plan: The awareness about KM can be improved by different methods like training,
group discussion, soliciting suggestions, ideas, feedback from employees etc. It is felt that each
Division can be one entity targeted for improving the awareness.
Resources Required: Skilled manpower, financial resources and infrastructural resources
Stake Holders: All the employees
Responsibility: The responsibility of improving awareness should be entrusted to employees who
are motivated to carry out the work.

178
Training: The necessary training to the people to whom the responsibility of improving the
awareness has been entrusted may be given.
Monitoring: Monitor the progress in awareness and shared vision at Divisional level through
survey, focus group, semi structured interview etc.
Review and Correction: Review the progress with appropriate level of management and take the
corrective actions.
7.5 CONTRIBUTIONS
The major contributions of this thesis are:
1. Development of a morphological frame work of KM maturity models (Chapter 2)
2. Development of a flexible and adaptable KM maturity model (KMI-KMM) based on the
unique concept of ‗Key Maturity Indicators‘ (Chapter 3)
3. Application of the proposed KMI-KMM model for assessment of the level of maturity in the
context of a nuclear R&D organisation and its groups (Chapter 4)
4. Identification of the inhibiting factors of the context organisation and its groups to attain
higher level of KM maturity and recommendation for improving the KM maturity (Chapter 5
& 7)
5. Study of knowledge creation process, the context of knowledge creation and classification of
knowledge in one group of the organization (Chapter 6)
7.6 CONCLUSION
Formal knowledge management is in the fore front of the business strategy of many organisations.
Deriving business benefits from KM depends on many factors. A guiding KM maturity model is
essential for any organisation, embarking on formal KM, to bench mark its activities. The major
contributions of this research to the body of knowledge in the discipline of KM is given in Section

179
7.5. As a spin off to this study, KM awareness programmes were conducted in all the groups of
the organisation, and hence, the target organisation is benefited, by improved KM awareness and
a better understanding of the KM path ahead. As a working definition, an organisation can
consider knowledge as that data, information and experience when shared and utilized by the
organisational entities, has the potential to improve the organisational performance.
This thesis redefines KM as one that creates and nurtures the technology and people centric
organisational environment of trust, solidarity and co-opetition where liberal knowledge
creation, knowledge sharing and knowledge utilization takes place as an integral part of every
role, on a continuous basis, thereby improving the dynamic capacity of the employees to act
effectively, in various situations resulting in improved organisational performance and thus
improved quality of life and happiness to all the stakeholders. Knowledge management creates
synergy and long term sustainable growth, prosperity and happiness to individuals, teams,
organisations, society, nations and to the entire world.

180
CHAPTER 8
FUTURE WORK
The core contribution of this research is the flexible and adaptable KM maturity model based on
the unique concept of Key Maturity Indicators. In this chapter, the possible extensions to this
research are discussed.
This model has been developed based on the study of 15 KM maturity models and the context
study of one organisation. Detailed study of more number of maturity models will provide
insights into more number of attractive features and the model can be improved by incorporating
those features which are relevant. In-depth study of more number of organisations where maturity
models are applied can provide additional insights to improve the model further. The model can
be tuned to the requirements of the organisation by tuning the Key Maturity Indicators and
introducing additional Key Maturity Indicators that are relevant to the organisation and removing
the ones that are irrelevant to the organisation, thus developing organisation specific models.
In addition to the validation by expert judgment, the model has been demonstrated and validated
in the context of only one organisation and its 10 subunits. More number of organisational studies
can be carried out to further validate the model. The model can be validated across multiple
industry sectors by conducting organisational study across those industry sectors. Also a
longitudinal study of the same organisation using the model can demonstrate the improvements in
the KM maturity of the organisation and also aid in further validation of the model.
Detailed study of one of the KM processes namely knowledge creation was carried out in one of
the organisational subunits. As an extension to this research knowledge creation process in other

181
subunits of the organisation can be studied. Also other KM process like knowledge sharing,
knowledge utilization, knowledge preservation etc. can be studied in one or more number of
organisational subunits. These studies can provide valuable insights to further improve the model.
Development of a maturity model is only a beginning. It needs to undergo many improvements
until the model itself attains the ‗maturity‘. The following remarks are worth pondering about, for
any organisation embarking on KM initiatives.
Continually improved and well applied knowledge will be the fuel to improve quality of life for
the world at large (Wiig 1997)
Only when we have made up our minds that sharing knowledge is important, not only for
efficiency’s sake, but also to increase the humanization of the business and social environments,
in which we work, we will be prepared for the task confronting us. When established procedures
are not conducive to the sharing of knowledge, the company must be ready to re-structure itself in
to an organisation, more amenable to knowledge sharing (Davenport and Probst 2002).
Though the initial battle to win the first converts to the practice of knowledge sharing is a hugely
uphill one, with a judicious mix of motivation, facilitation and awareness mechanisms, steady
progress can be made on the road towards achieving greater sharing and the pace of adoption
accelerates with time. Once a ‘critical mass’ of users has been reached, the movement reaches a
take-off point, beyond which it becomes self sustaining without significant effort being devoted to
motivation. KM becomes part of the organisational fabric and sharing becomes an integral part
of every role across the organisation, thus reducing considerably the effort required of dedicated
KM roles. (Kochikar and Suresh, 2003).

182
APPENDIX – A
EXPERT OPINION ON KMI-KMM MODEL

183

184

185

186
APPENDIX - B
QUESTIONNAIRE - SEMI STRUCTURED INTERVIEW( Pilot Study )
1. Percentage of activities of this Division in the following categories
Basic Research 0, 25%, 50%, 75%, 100%
Applied Research 0, 25%, 50%, 75%, 100%
Design 0, 25%, 50%, 75%, 100%
Development 0, 25%, 50%, 75%, 100%
Project Execution 0, 25%, 50%, 75%, 100%
Services 0, 25%, 50%, 75%, 100%
Any other 0, 25%, 50%, 75%, 100%
2. Percentage of activities of the Division in the following modes
individual oriented 0, 25%, 50%, 75%, 100%
team oriented 0, 25%, 50%, 75%, 100%
3. What are the processes/ practices in your Division for Explicit & Tacit knowledge(with
examples)(Explicit knowledge is that which is available in the form of documents, audio/
video recordings etc.; Tacit knowledge is the one that resides in the minds of the people in
the form of experiences, intuitions, beliefs etc.)
a. New knowledge creation/generation
b. knowledge sharing
c. knowledge utilization
d. knowledge preservation

187
4. How can the practices be improved?
5. How can we integrate KM practices in day- to–day work practices?
6. Will you please give some examples of current & required knowledge pertaining to the
Division
7. How can the knowledge pertaining to the Division be classified?
8. How can the knowledge management portal IGCIMS be improved?
9. What are effects of KM practices on performance in the level of Individual/ Division /
Group / Centre ?
10. What are the parameters on which performance of Individual/Division is evaluated?
11. How do you motivate scientists for better performance including higher participation in
KM activities?
12. Do you believe that an effective strategy and actions for organisation-wide management of
Data, Information & Knowledge can foster collaboration, considerably save the
productive time of scientists, and thus improve the overall organisational performance?

188
APPENDIX - C
QUESTIONNAIRE - FOCUS GROUP DISCUSSION
1. How often you use the knowledge management portal?
2. What is your total contribution in terms of knowledge documents to the portal?
3. How often you document your experiences and make it available to other members of the
organisation?
4. How often you share your experiences in formal/informal knowledge sharing
communities?
5. How far you are satisfied with the reward & recognition scheme for knowledge sharing?
6. How often you seek/ you get help from knowledge officers of your group?
7. How often you mentor your colleagues/ you are mentored by your colleagues?
8. How far you are satisfied with KM policy & strategy of the organisation?
9. How the various activities related to knowledge preservation, knowledge creation,
knowledge sharing etc. can be improved?
10. How far you are satisfied with the knowledge management portal and KM activities of
the organisation?

189
APPENDIX – D
QUESTIONNAIRE – INHIBITING FACTORS
Dear Colleagues,
The following questionnaire is to identify the areas of improvement in knowledge management
practices at IGCAR.
I request you to fill up the details in an unbiased way and hand over the same to me.
Thank you very much for your time and effort.
K.K.Kuriakose, CD/EIG, 22906, [email protected]
Knowledge Management ( KM ) Questionnaire
I. Complete the following sentence and TICK ( ) the appropriate column, indicating the extent
to which the phrases hold true for you,

190
‘I am willing to share more of my work, experiences, ideas, expertise, etc. with other members
of the organisation as my contribution to the organisational knowledge repository:
SA-Strongly agree; A-Agree; NA/DA-Neither Agree Nor Disagree; D-
Disagree; SD-Strongly Disagree
No SA A
NA/
DA D SD
1 If I have more time
2 If I know what knowledge other people are
interested in
3
If someone helps me to get my contributions
organized
4 If I know where to put or send my contributions
5 If someone else takes care of the details of
submitting my contributions
6
If the submitting system was more streamlined and
user friendly
7 If the process of contributing was more integrated
with the work already I do
8 If I know how people will use my contributions
9 If I get some tangible reward for my contributions
10 If I get more credit for my contributions
11 If more people thank me for my contributions
12 If I get feedback on my contributions
13 If I know that my contributions are considered in
my CR grading
14 If I am assured that no one else is going to take
credit for my work
15
If I am assured that my contributions will not affect
me negatively
16 If I feel that my colleagues will not laugh at me
17 If I feel that my contributions will make a
difference to the organisation
18 If my boss explicitly tells me to contribute
19 If other people also contribute
20
If I get the required knowledge whenever I need
from the total contributions made by everyone to
the organisational knowledge repository
21
If the contribution is made compulsory as an
organisational policy

191
II . Suggestions for improving KM Practices of your GROUP/CENTRE :
III. Personal Data: Please TICK ( ) the blank column near to the option
1 Type of
work Research
Design/
Development Project
Technical
Services/
O&M
2 Qualification Diploma Graduate
Post-
Graduate Ph.D
3 Discipline Science Engineering
4 Grade
Upto
So/B SO/C-E SO/F-G
SO/H &
Above
5 Gender Male Female
6 Age (Years) < 30 30 - 39 40 - 50 > 50
7 Service
(Years) < 10 10- 19 20 - 30 > 30

192
APPENDIX –E
QUESTIONNAIRE - SEMI-STRUCTURED INTERVIEW AT GROUP G9
1. What are the current practices of socialization in your group?
Weekly / Monthly meetings
Informal meetings
Others
2. Do you have specific place and time for meetings?
3. Do you record the discussions of the meeting or prepare the minutes of meeting
4. What are the current practices of externalization?
Creation of documents
Giving talks
Interview
Others
5. What are the current practices of combination?
Monthly/Annual reports
Publications
Book
Others
6. What are the current practices of internalization?
Attending lectures
Discussion
On the job training
Others
7. Can you give some examples of knowledge assets, skills, know-how etc?

193
REFERENCES
1. Ackoff, R. L. (1989) From Data to Wisdom, Journal of Applied Systems Analysis, Vol.
16, pp. 3-9.
2. Alavi, M. and Leinder, D.E. (2001) Knowledge Management and Knowledge
Management Systems: Conceptual Foundations and Research Issues, MIS Quarterly, Vol.
25 No 1. pp 107-136
3. Alavi, M. and Leidner, D.E. (1999) Knowledge Management Systems: Issues,
Challenges and benefits, Communications of AIS, Vol.1, No.7, pp.1-37
4. Anantatmula, V. and Kanungo, S. (2007) Modeling enablers for successful KM
Implementation, Proceeding of the 40th
Annual Hawaii International Conference on
System Sciences (HICSS’07).
5. APQC, (2000)Successfully Implementing Knowledge Management, Best Practice Report.
6. APQC, (2010a) Who‘s the Boss?: 10 Leadership behaviors that inspire teamwork and
collaboration, APQC
7. APQC, (2010b) Are You a Member of the Dirty Dozen? 12 Leadership behaviors that
stifle teamwork and collaboration, APQC
8. Austin, R.D (1996) Measuring and Managing Performance in Organisations, Dorset
House Publishing.
9. Bhara, N. (2001) Competitive Knowledge Management, Palgrave, New York.
10. Bonanno, K. (2003) Knowledge Management : a people process, in Nimon,M.(ed),
Connecting Challenges ; Issues for teacher and children’s librarians, Auslib Press,
Adelaide
11. Boyles, J.E., Cairns,G., de Grosbois,J., Jackson, A., Kosilov, A., Pasztory, Z., Yanev,
Y. And Mazour, T.(2009) Assessment of organisation‘s knowledge management
maturity, International Journal of Nuclear Knowledge Management, Vol.3., N0.2, pp.
170-182
12. Bryant, S.E. (2003) The Role of Transformational and Transactional Leadership in
Creating, Sharing and Exploiting Organisational Knowledge, Journal of Leadership &
Organisational Studies, Vol. 9 No.4, pp.32-44.
13. Chirissis, M.B., Konard, M. and Shrum,S. (2007) CMMI Second Edition, Addison
Wesley, Boston
14. Coutu, D.L.(2003) The Anxiety of Learning, Harvard Business Review, March

194
15. Chong Siong Chag, Choi Yong Suk (2005) Critical Factors in the Successful
Implementation of Knowledge Management , Journal of Knowledge Management
Practice, June.
16. Davenport T and Probst,G. (2002) Knowledge Management Case Book : Siemens Best
Practices ,(Ed), John Wiley / Publications, Corporate Publishing
17. Davenport T., Delong D.W and Beer M.C (1998) Successful Knowledge Management
Projects, Sloan Management Review, Winter
18. Davenport,T. and Prusak.L. (1998), Working Knowledge – How Organizations manage
what they know, Harvard Business School Press, Boston, MA.
19. De Grosbois, J. and Kumar.V. (2009) . The role of Knowledge Management in NPP
Organizational Performance – Int.J.Nuclear Knowledge Management Vol.3 No.2, pp. 137-
156.
20. Drucker, P.A. (1993) A Post Capitalist Society, New York, Harper Collins
21. Earl, M.J. (1999) Opinion : What is a Chief Knowledge Officer, Sloan Management
Review, Winter, pp. 29-38
22. Ehms,K. and Langen.M. (2002) Holistic Development of Knowledge Management with
KMMM available at: http://www.kmmm.org (Accessed 11, February, 2009).
23. Eppler, M. J. (2006) The Concept of Knowledge Communication and Its Relevance to
Management USI Research note. Version 2.2.
24. Fahey, L. and Prusak.L. (1998) The eleven deadliest sins of Knowledge Management,
California Management Review – Vol. 40, No.3 pp. 265-276
25. Farson R. and Keyes R. (2002) The failure – Tolerant Leader, The Innovative Enterprise
– August, pp. 64-71.
26. Feigenbaum.E. (1977) The art of artificial intelligence: Themes and case studies in
knowledge engineering, 5th
IJCAI.
27. Gallangher, S and Hazlett.S (2004) Using the Knowledge Management Maturity Model
(KM3) As an Evaluation Tool, available at :
http://cc.shu.edu.tw/~yjliu/%AA%BE%C3%D1%BA%DE%B2z/%B0%D1%A6%D2%B
E%5C%C5%AA%B8%EA%AE%C6/km028.pdf ( Accessed 26 November,2009)
28. Gopalakrishnan.K. and Ganesh.L.S (2004) Enabling knowledge creation in
organizations – A Review of SEC1 Frame Work, Proceedings of Second AIMS
International Conference on Management, pp. 819-825.
29. Gottschalk,P. (2002) Toward a Model of Growth Stages for Knowledge Management
Technology in Law Firms, Informing science, Vol. 5, No.2, pp. 79-93.

195
30. Gupta A.K. and Govindarajan.V. (2000) Knowledge Management‘s Social Dimensions
: Lessons From the Nucor Steel, Sloan Management Review, Fall, pp.72-78
31. Hansen, M.T., Nohria, N. and Tierney, T (1999) What is you strategy for managing
knowledge? Harvard Business Review, March-April, pp. 106-116.
32. Hendricks, P. (1999) Why Share Knowledge ? The Influence of ICT on the Motivation
for Knowledge Sharing, Knowledge and Process Management Vol. 6, No.2 pp. 91-100
33. Hendricks, P.H.J. and Vriens, D.J. (1997) Knowledge-based systems and knowledge
management: Friends or foes?, Elsevier, Information & Management , Vol.35, pp.113-125
34. Hibbard, J. (1997) Knowing what one know, Information week, Vol.653, pp.46-64.
35. Holthouse,D.(2003) KM at Xerox : Seeding Communities across key domains pp. 503-
533, In Rao, M.(ed) Leading with knowledge, Tata McGraw – Hill Publishing Company
Limited, New Delhi
36. Hosaple, C.W. and Joshi, K.D.(1999) An Investigation of Factors that Influence the
Management of Knowledge in Organizations, Journal of Strategic Information Systems,
Vol.9, 235-261.
37. Hubert.C and Lemons.D, (2010) APQC‘s Level of Knowledge Management Maturity,
available at: http://www.apqc.org/knowledge-
base/download/33020/a%3A1%3A%7Bi%3A1%3Bs%3A1%3A%222%22%3B%7D/inlin
e.pdf?destination=node/33020
38. IAEA(2006) Knowledge Management for Nuclear Industry Operating Organizations,
IAEA-TECDOC-1510, Vienna, Austria.
39. IGCAR (2010), Fast Breeder Test Reactor – An Exciting Journey through a new
technology, IGCAR, Kalpakkam.
40. IGCAR (2011),Indira Gandhi Centre for Atomic Research- Annual Reoprt, 2011
41. IGCAR (2007)-Excellence with Relevance-High Impact Breakthroughs, Significant
Achievements(2004-2007), available at : http://www.igcar.gov.in/benchmark/index.pdf
(Accessed 11, January, 2011)
42. Introna, L., (2011) Phenomenological Approaches to Ethics and Information Technology,
The Stanford Encyclopedia of Philosophy (Summer 2011 Edition), Edward N. Zalta (Ed.),
available at :http://plato.stanford.edu/archives/sum2011/entries/ethics-it-phenomenology
43. Jain, R.K and Triandis, H.C. (1990) Management of research and development
organizations-managing the unmanageable, Wiley, New York
44. Jennex, M.E. and Olfman, M. (2003) Organizational Memory, in Holsapple C.W.(Ed.),
Handbook, on Knowledge Management , Springer-verlag.

196
45. Kaplan, R.S. and Norton, D.P.(1992) The Balanced Score Card: Measures that Drive
Performance, Harvard Business Review, January – February, pp. 71-79
46. Kruger, C.J. and Snyman, M.M.M. (2007) Formulation of a Strategic Knowledge
Management Maturity Model, available at:
https://www.up.ac.za/dspace/bitstream/2263/8083/1/Kruger_Principles%282005%29.pdf (
Accessed 12, May, 2009)
47. Keen.P and Mackintosh, R (2001) The Freedom Economy : Gaining the m commerce
Edge in the Era of the Wireless Internet, McGraw Hill, New York.
48. Kendal, S.L. and Creen,M. (2007) An Introduction to Knowledge Engineering,
Springer-Verlag, London
49. Kim, L. (1997), Imitation to Innovation : The Dynamics of Korea’s Technological
Learning, Harvard Business School Press, Boston, USA.
50. Kochikar, V.P. (2000) The Knowledge Management Maturity Model: A Staged
Framework for Leveraging Knowledge, KM World 2000, Santa Clara, CA.
51. Kogut, P. and Zander, U. (1992) Knowledge of the Firm, Combinative Capabilities and
the Replication of Technology, Organization Science Vol.3, No.3, pp.383-397.
52. Klimko.G. (2001) Knowledge Management and Maturity Models: Building Common
Understanding, In proceeding of the 2nd
European Conference on Knowledge
Management, pp. 269-278.
53. Kluge,J., Stein, W., and Licht T. (2001) Knowledge unplugged. The McKinsey and
Company, Global Survey on Knowledge Management, Pal Grave, New York.
54. Kochikar. V.P and Suresh, J.K (2003) The Infosys KM Experience, In Rao, M.(ed)
Leading with knowledge, Tata McGraw – Hill Publishing Company Limited, New Delhi.
55. KPMG Consulting (2000) Knowledge Management Research Report available at
http://www.providersedge.com/docs/km_articles/KPMG_KM_Research_Report_2000.pdf
(Accessed 10, November, 2009)
56. Kulkarni.U and Freeze.R (2004) Development and Validation of a Knowledge
Management Capability Assessment Model, Proceeding of Twenty fifth International
Conference on Information Systems, pp. 657-670.
57. Leobecke, C., Van Fenema, P. and Powell, P. (1999), Co-opertition and knowledge
transfer, The DATABASE FOR Advances in Information Systems, Vol. 30, No.2, pp. 14-
25.
58. Leonard-Barton.D. (1995) Wellsprings of Knowledge, Building and Sustaining the
Sources of Innovation, Harvard Business School Press, Boston.

197
59. Lochhead, D. (1994) Technology and Interpretation: A Footnote to McLuhan, ,Available
online at http://www.religion-research.org/irtc/martin.htm (accessed 15,July, 20011)
60. Maslow, A.H. (1943) A Theory of Human Motivation, Psychological Review, Vol. 50,
pp 370-396 Available at http://psychclassics.yorku.ca/Maslow/motivation.htm, (Accessed
25 November, 2009
61. Mayo, E (1933) The human problems of an industrial civilization, MacMillan, New York
62. McCabe, S.M (2003) Knowledge Management at Unisys pp.465-502, In Rao, M.(ed)
Leading with knowledge, Tata McGraw – Hill Publishing Company Limited, New Delhi.
63. Mc Dermott, R and Carla O’ Dell (2000) Overcoming the Cultural Barriers to sharing
knowledge, APQC,. Available at
:http://www.apqc.org/portal/apqc/ksn/Overcoming%20Cultural%20Barriers.pdf?paf_gear
_id=contentgearhome&paf_dm=full&pageselect=contentitem&docid=106967 (accessed
9, February, 2009).
64. Mohanty, S.K. and Chand,M. (2005) ―5iKM3 Knowledge Management Maturity
Model‖ Tata Consultancy Services, Mumbai. Available at :
http://www.tcs.com/SiteCollectionDocuments/White%20Papers/5iKM3%20Knowledge%
20Management%20Maturity%20Model.pdf ( accessed 16, February, 2009).
65. Nahapiet, J. and Ghoshal, S.(1999) Social Capital, Intellectual Capital and the
Organizational Advantage, Academy of Management Review, Vol23, pp.242-266.
66. Natarajan, G. (2005) A KM Maturity Model for the Software Industry, KM Review,
Vol.8, Issue 2, pp 20-23.
67. Natarajan, G. and Shekhar,S. (2000) Knowledge Management : Enabling Business
Growth, Tata McGraw – Hill Publishing Company Limited, New Delhi
68. Nonaka, I. (1991) The knowledge creating company, Harward Business Review,
.November-December. pp. 96-104.
69. Nonaka, I. (1994), A Dynamic Theory of Organizational Knowledge Creation,
Organization Science .Vol. 5, pp. 14-37.
70. Nonaka, I and Takeuchi, H. (1995), The knowledge creating company, Oxford
University Press, New York
71. Nonanka, I. and Konno, N. (1998) The Concept of Ba: Building a Foundation for
Knowledge Creation, California Management Review, Vol.40, pp. 40-54.
72. Nonanka, I., Toyama,R. and Konno, N.(2000) ―SECI, Ba and Leadership : A Unified
Model of Dynamic Knowledge Creation‖, Long Range Planning, Vol.33, 5-34

198
73. O’Dell, C and Grayson, J. (1998) If Only We Knew What We Know: Identification and
Transfer of Internal Best Practices, California Management Review, Vol. 40, N0.3,
pp.154-174.
74. Osama, A. (2006) Multi-Attribute Strategy and Performance Architectures in R&D: The
Case of The Balanced Scorecard, Dissertation , Pardee RAND Graduate School, RAND
Corporation, Santa Monica, CA
75. Page-Shipp,R. (2000) Knowledge Management – an Approach Tailored to Knowledge
Based Organization, 9th
International Conference on the Management of Technology,
February 21-25, Miami, Florida.
76. Paulzen, O. & Perc, P. (2002) A Maturity Model for Quality Improvement in Knowledge
Management, Proceedings of ACIS 2002- available at http://aisel.aisnet.org/cgi.
(Accessed 9, December, 2009)
77. Pee, L.G. and Kankanhalli, A. (2009) A Model of Organizational Knowledge
Management Maturity Based on People, Process and Technology, Journal of Information
& Knowledge Management Vo.8, No.2, PP 79-99.
78. Pfeffer J. and Sutton, R.I (1999) Knowing ―What to Do is Not Enough‖: Turning
Knowledge into action. California Management Review, Vol.4. No.1. Fall, pp.83-108.
79. Polanyi, M. (1966) The Tacit Dimension, Routledge and Kegan Paul, London.
80. Prasad, B. and Nadessin, J. (2003) Continuous Knowledge based Innovation at EDS, pp.
61-93 , In Rao, M.(ed) Leading with knowledge, Tata McGraw – Hill Publishing Company
Limited, New Delhi
81. Pryakhin, A. Stanculescu, A., and Yanev, Y. (2009) Fast reactor knowledge inventory,
Int.J.Nuclear Knowledge Management, Vol.3., No.2, pp. 199-209.
82. Rao, M. (2003), Leading with knowledge, Tata McGraw Hill Publishing Company
Limited, New Delhi.
83. Ribiere, V.M. (2001) Assessing Knowledge Management Initiative Successes as a
function of Organizational Culture, Doctoral Dissertation, George Washington,
University. Available at
http://www.gwu.edu/~iki/documents/VincentRibiere_Dissertation.pdf (accessed 5
November, 2008)
84. Ritchey, T. (2006) General Morphological Analysis, A general method for non-qualified
modeling, available at http://www.swemqph.com/pdf/gma.pdf. (Accessed 10,
February 2010).
85. Rouse, W.B. and Boff, K.R. (2004) Value-Centered R&D Organizations: Ten Principles
for Characterizing , Assessing, and Managing Value, Systems Engineering, Vol. 7, No. 2.,
pp.167-185

199
86. Ruggles, R. (1998) The State of the Notion: Knowledge Management in practice,
California Management Review, Vol.40, No.3, pp. 80-89.
87. Srinivasan, G., Suresh Kumar, K.V., Rajendran, B., Ramalingam, P.V. (2006), The
Fast Breeder Test Reactor- Design and operating experiences, Nuclear Engineering and
Design, Vol. 236, pp. 796-811
88. Subramaniam, M. and Youndt, M.A. (2005) The Influence of Intellectual Capital on
the Types of Innovative Capabilities, Academy of Management Journal, Vol. 48, pp. 450-
463.
89. Suri Babu, G., Mohan Rao, T.,Ahmed, S., Gupta K.S. (2008) Relationship Between
Leadership Capability and Knowledge Management: A Measurement Approach, Journal
of Information and Knowledge Management, Vol.7, N0.2, pp. 83-92.
90. Sveiby, K.E. (1996), What is Knowledge Management? available at
http://www.sveiby.com/articles/KnowledgeManagement.html
91. Szulanski, G. (1994), Intra Firm Transfer of Best Practices Project, American
Productivity and Quality Centre, Houston Tx.
92. Taylor, F.W. (1911) The Principles of Scientific Management Harper and Row.
Available at http:www.
marxists.org/references/subject/economics/taylor/principles/index.htm (accessed 23
February 2009)
93. Tobias, M.P. (2006) Leveraging Knowledge Communication for Innovation: Framework,
Methods and Applications of Social Network Analysis in Research and Development,
Peter Lang.
94. Trochim, W.M.K. (2000) Research Methods Knowledge Base Avaialable at
http://www.socialresearchmethods.net/kb/measval.php, (Accessed 10, February,2011)
95. Tusi, E. (2003) Tracking the Role and Evolution of Commercial Knowledge Management
Software, pp.5-27 , In Holsapple, C.W.(Ed), Handbook on Knowledge Management-
Knowledge Directions, Springer , London
96. Weerdmeester, R.,Pocaterra, C. and Hefke, M. (2003) VISION: Next Generation
Knowledge Management : Knowledge Management Maturity Model, Information
Societies Technology Programme,. Available at
http://km.aifb.kit.edu/fzi/vision/vision/docs/D5.2-KM-Final.pdf (Accessed 5, January,
2009)
97. Wolford, D. (1999) Ford‘s Best Practice Replication Process – A value based KM
Process that works, Knowledge Management Review, Issue 10, September / October pp12-
15
98. Wiig, K.M. (1997) Knowledge Management : An Introduction and perspective, The
Journal of Knowledge Management Vol. 1 No.1 pp. 6-14

200
99. Wisdom Source (2004) K3M:The Knowledge Management Maturity Model, Wisdom
Source News, Vol.2, No.1, available at :
http://www.wisdomsource.com/K3Moverview.pdf. (Accessed 9, February, 2010)
100. Yanev, Y. (2009) Nuclear Knowledge Management, International Journal of Nuclear
Knowledge Management, Vol.3, No.2 pp 115-124.
101. Yin, R.K. (2009) Case Study Research Design and Methods, Sage Publications,
California.
102. Zack, M.H (1999), Developing a Knowledge strategy, California Management Review,
Vo.41, No.3, Spring, pp.125-145.
103. Zhongzhi, S. (2011) Advanced Artificial Intelligence, World Scientific Publishing Co.
Pvt Ltd.
104. Zwicky, F. (1969) Discovery, Invention, Research – Through the Morphological
Approach, The Macmillan Company, Toronto.

Thank You