STOCHASTIC INTEREST RATES AND PRICE DISCOVERY IN SELECTED COMMODITY MARKETS
24
University of Wisconsin-Madison Department of Agricultural Economics Staff Paper Series Staff Paper No. 383 March 1995 Stochastic Interest Rates and Price Discovery in Selected Commodity Markets by Hector O. Zapata and T. Randall Fortenbery Copyright (c) 1995 by Hector O. Zapata and T. Randall Fortenbery. All rights reserved. Readers may make verbatim copies of this document for non-commercial purposes by any means, provided that this copyright notice appears on all such copies.
Transcript of STOCHASTIC INTEREST RATES AND PRICE DISCOVERY IN SELECTED COMMODITY MARKETS

University of Wisconsin-MadisonDepartment of Agricultural Economics
Staff Paper Series
Staff Paper No. 383March 1995
Stochastic Interest Rates and Price Discovery inSelected Commodity Markets
by
Hector O. Zapata and T. Randall Fortenbery
Copyright (c) 1995 by Hector O. Zapata and T. Randall Fortenbery.All rights reserved. Readers may make verbatim copies of thisdocument for non-commercial purposes by any means, provided thatthis copyright notice appears on all such copies.

STOCHASTIC INTEREST RATES AND PRICE DISCOVERYIN SELECTED COMMODITY MARKETS
SUMMARY
The temporal relationship between Chicago corn and soybean cash prices, nearby futures prices, andinterest rates is examined using daily 1980-1989 data. Johansen cointegration tests suggest joint movementof the three series over the data period considered. In addition, analyses of individual crop years, whichis consistent with previous work, shows co-movement between cash, futures, and interest rates in years whenbivariate cointegration between cash and futures prices was not found. The results provide initial empiricalevidence that a potential limitation of previous research in the study of cash-futures simple efficiency hasbeen the exclusion of the interest rate as a common stochastic factor explaining equilibrium in models ofcash and futures prices.
1. INTRODUCTION
One important role of a futures market is to serve as a risk management vehicle for
businesses facing price risk in a cash market. The success of a specific futures contract in
providing price risk protection, however, is dependent on the ability of a potential hedger to
accurately anticipate the future relationship between cash and futures prices. Attempts to quantify
and forecast futures/cash price relationships have received considerable attention in the futures
market literature.
Recent developments in cointegration theory have provided a new basis from which to
examine the explicit relationships between cash and futures commodity markets. Bessler and
Covey studied U.S. cattle markets and found marginal support for the cointegration hypothesis
between cash prices and futures contracts closest to delivery. Schroeder and Goodwin failed to
find cointegration for cash and futures markets for U.S. live hogs. Fortenbery and Zapata
examined markets for storable commodities (corn and soybeans) and found support for the
cointegration hypothesis in some crop years but not others. Although it is well known from
cointegration theory that non-cointegration does not imply a lack of causation between cash and
futures prices (Granger), it is not clear what has contributed to the inconsistency of previous

2
results. Further, it is not clear what the previous cointegration tests imply about market
performance. Is it reasonable, for example, to believe that the live cattle markets operate
efficiently, but that the live hog markets do not, as has been suggested by previous research?
If cointegration tests do hold implications for market efficiency, what would cause the grain
markets to operate efficiently in some crop years but not in others?1
This article reviews alternative specifications of futures and cash price relationships
advanced in the theoretical literature and applies cointegration theory to test whether the
seemingly inconsistent results of previous work are a function of asymmetric performance across
markets, or whether model specification may influence cointegration results, and thus
interpretations of specific market efficiencies. It examines cash and nearby futures prices (that
is, futures prices for the contract closest to maturity) for U.S. corn and soybean markets to
empirically test whether the observed nonstationarity in the cash/futures relationship can be
explained by the omission of a common stochastic element in the empirical model specification
used in previous research.
In general, theory suggests that the current cash price and the current futures price for a
deferred delivery date are linked by a market carrying charge (Blank, Carter, and Schmiesing).
The carrying charge represents the potential compensation available to a market participant who
forgoes making a cash market transaction at the current cash price in favor of making the same
transaction at a later date. If the carrying charge is itself nonstationary, then we would expect
bivariate cointegration tests between a cash and futures price to be biased against a finding of
cointegration.
The carrying charge observed in the market is made up of several components. These

3
include a possible risk premium, a convenience yield, the prevailing interest rate, physical storage
costs, and insurance costs. The existence and measurement of risk premiums and convenience
yields has received considerable attention in the literature (Dusak; Carter, Rausser, and Schmitz;
Fortenbery and Hauser; and Wright and Williams). Neither risk premiums nor convenience
yields are directly observable, however, and there is no clear consensus from the literature as to
whether either exists.
Interest rates are directly observable. They represent the opportunity costs associated with
holding inventory between the current period and the period in which a specific futures contract
matures. It has been shown that identifying the correlation between changes in interest rates and
changes in cash and futures prices is an important component in measuring intertemporal hedging
effectiveness (Chang and Fang), and in describing the relative efficiencies of cash and futures
markets (Baillie and Myers). If interest rates are nonstationary, then it can be assumed that
carrying charges are nonstationary and critical in describing the dynamic relationship between
cash and futures prices. If inclusion of interest rates in a cointegration type model affects the
identified cointegration relation between cash and futures, then it can be concluded that failure
to explicitly account for at least this component of the market carrying charge does in fact bias
cointegration test results, and previous work which has not accounted for this should be viewed
as suspect.
This paper proceeds as follows. Section 2 introduces a compact summary of the previous
economic modeling efforts focused on commodity price discovery. Section 3 introduces the
econometric methodology of cointegration analysis, followed by a discussion of the data used in
the current empirical investigation. Next, results and implications of the work are discussed. The

4
paper concludes with a discussion of the role of interest rates in identifying cash/futures
relationships for storable commodities, with implications for the importance of explicitly
considering carrying charges.
2. PRICE DISCOVERY AND COINTEGRATION
The hypothesis (associated with market efficiency) that futures prices are unbiased
predictors of future cash (spot) prices implies a hypothesis of joint equilibrium between the two
price series (and rationality of expectations) (Gardner). Initial efforts to test this hypothesis
consisted of estimating a static regression between cash and futures prices given by
(1) St = α + βFt + et
where the S is the spot price, F is a futures price, and et measures the stochastic difference
between cash and futures. This relationship assumes that new information will affect both cash
and futures markets instantaneously (i.e., one market does not lead the other one) and that new
information will affect both markets in the same way. However, it can be shown under some
plausible assumptions that particular changes in information, such as a decline in interest rates,
can cause changes in cash prices that move in the opposite direction of those for futures prices
(Dewbre). Further, movement to long run equilibrium may not occur instantaneously. The
realization that prices may take some time to adjust to a new long run equilibrium after the
introduction of new market information has led to the application of cointegration theory to
market relationships.
The cointegration model most often used in the study of agricultural commodity markets
has been a bivariate regression between cash and futures prices (Bessler and Covey, Fortenbery
and Zapata). The model specifies a relationship between cash price (St) and futures (Ft) that,

5
when solved for the price difference results, in:
(2) Ft - St = α + δ(Ft-1 - St-1) + εt.
The largerδ in the above equation the greater the range of allowed disparity between futures and
cash price changes before the two series are brought back to equilibrium. Ifδ is close to one,
then cash and futures prices do not converge rapidly, and their difference is assumed to be stable.
If δ is small, prices will converge quickly because only a small fraction of the price difference
on day t-1 will persist to day t.
Equation (2) is based on the theoretical market relationship outlined by Garbade and
Silber. Garbade and Silber, however, specified the cash/futures relationship as being between a
cash price and the cash equivalent futures price. The cash equivalent futures price is measured
as:
(3) Ft’ = Ft - rτk
where r is the prevailing interest rate andτk represents the interval between the current time
period and the maturity date of the futures contract. In their work on price discovery, Garbade
and Silber assume that r is flat and stationary. Cointegration applications based on equation (2)
have implicitly made the same assumption. If interest rates are flat and stationary, then failure
to discount the observed futures price to its cash equivalent would have no effect on the finding
of a cointegrating vector between cash and futures, although it might be argued that some
information has been lost. However, the validity of the interest rate stationarity assumption has
not been tested in previous work. If interest rates are not stationary, then failure to explicitly
account for their influence on commodity prices will bias cointegration results against a finding
of cointegration. This may lead to a conclusion of cash and/or futures market inefficiency when

6
in fact the real problem is one of model mis-specification.
The potential importance of interest rates on commodity prices has been addressed by
other research (Schuh and Frankel (1984,1986); Racer; and Kitchen and Denalby). Unfortunately,
however, cointegration applications in commodity price analysis have not directly accounted for
interest rate behavior.
3. COINTEGRATION AND ERROR-CORRECTION REPRESENTATION
If an equilibrium relationship between cash, futures, and interest rates exists then yt = (lnSt
lnFt-k lnrt-k)’ is cointegrated with Cyt = zt, where zt is a stationary error term about a mean of
zero, suggesting that in equilibrium Cyt = 0. Using Granger’s representation theorem, an error-
correction model (ECM) can be specified. By the recent asymptotic results in cointegration
theory (Johansen (1988), and Phillips), the vector autoregressive model with Gaussian errors is
given by
(4) yt = µ + Π1yt-1 + . . . + Πp-1yt-p+1 - Πpyt-p + et,
where t=1,2, ...,T, and e1,...,eT are independent Gaussian variables in k dimensions with mean zero
and varianceΩ . This model can be re-parameterized in ECM form as
(5) ∆yt = Γ1∆yt-1 + . . . + Γp-1∆yt-p+1 - B[C, η][y’ t-p 1]’ + et,
where
(6) Γi = -( IK - Π1 - . . . - Πp), i=1,2, . . ., p-1,
and
(7) Π = -I + Π1 + . . . + Πp.
These specifications are convenient since the hypothesis of cointegration implies

7
restrictions on theΠ matrix leaving the other parameters free. The hypothesis of at most r
cointegrating relations is formulated as the restriction
(8) Hr* = Π = BC and µ=BC0
which we test using the trace test:
Trace Test =-TΣiln(1 - λi), i=r+1,..., K
and theλmax statistic:
λmax Test = -Tln(1 - λr+1),
Critical values for testing the number of cointegrating relations are tabulated in Johansen and
Juselius (see Appendix tables A2 and A3).
The Data and Estimation Procedure
The data used in this analysis consists of daily closing futures prices for corn and soybean
futures contracts from 1980-89, daily Chicago corn and soybean cash prices for the period 1980-
89, and the 90-day U.S. T-bill rates for the same period. Consistent with previous cointegration
work, the futures contract observed is the one closest to maturity. Corn futures contracts are
traded for delivery in March, May, July, September and December. Soybean futures contracts
are for January, March, May, July, August, September and November delivery. On first notice
day (i.e. the first day on which physical delivery can be made against a given futures contract)
the expiring contract is dropped and the next contract closest to maturity is observed. By always
observing the futures contract closest to maturity, the temporal span between the cash price
(which is for immediate delivery) and the futures price for later delivery is minimized. This has
the effect of minimizing the impact of interest rates on the relationship between cash and futures
prices. If interest rates are significant in explaining co-movement between nearby futures and

8
cash prices, they must be important in explaining the relationship between cash and futures prices
for more distant delivery.
The Cash and futures commodity prices were collected from Knight Ridder’s CRB
Infotech data bases. The daily 90-day T-bill rates were collected from various issues of The Wall
Street Journal.
The cointegration tests have been conducted two ways. The first approach tests for
cointegration between the three series (cash prices, futures prices, and interest rates) over the
entire data period. This is consistent with the traditional notion of attempting to approximate the
long run by employing a relatively long time series. In general, it is assumed that the longer the
time span considered, the closer one comes to approximating long run dynamics.
As suggested by Hakkio and Rush, however, measuring the long run for economic time
series may not be as trivial as collecting the longest time series available. For some economic
variables, the long run may be defined very specifically. Fortenbery and Zapata have suggested
that agricultural futures contracts for seasonally produced commodities may be an important
example. The role of futures contracts for grains and soybeans are to essentially allocate the
current year’s production through to the next production period. As such, the relationship
between a specific futures contract and cash prices may be crop year unique, reflecting specific
supply and demand conditions expected to persist only through the given crop year. This implies
that the appropriate definition of the long run for commodity futures contracts may simply be the
period over which they allocate supply. For corn and soybeans, this would be the relevant crop
year. To account for this, we also examine cointegrating relations on a crop year basis. Corn
and soybean crop years begin on September 1. This corresponds generally with the new crop

9
harvest. The data are divided into 10 individual crop years, and the importance of interest rates
is examined on a crop year basis. While the appropriate definition of the long run is debatable,
the crop year results are generally consistent with those from the entire sample period, and allow
for a specific comparison of the results generated here with those of previous work.
4. RESULTS
Nonstationarity
Chicago terminal cash and nearby futures prices, and the 90 day T-bill rate behave as
nonstationary series. Phillips-Perron tests for unit roots suggest2 that cash and futures prices are
nonstationary of order one; the T-bill rate is nonstationary of order one at the 5 % level for the
aggregate data period and in all individual crop years except 82-83, 83-84, and 86-87 when it is
nonstationary at the 10 % level. This suggests that Chicago cash prices and nearby futures prices
behave as stochastic trend variables during all ten years, and that the 90-day T-bill rate has a
stochastic trend during most years. To accommodate stochastic behavior, equation (5) is
specified as a three variable system for both the corn and soybean markets. Results from the
trivariate model specification are reported for both the aggregate period, and on a crop year basis.
The crop year results are compared to those generated with the standard bivariate model specified
in previous work.
Cointegration
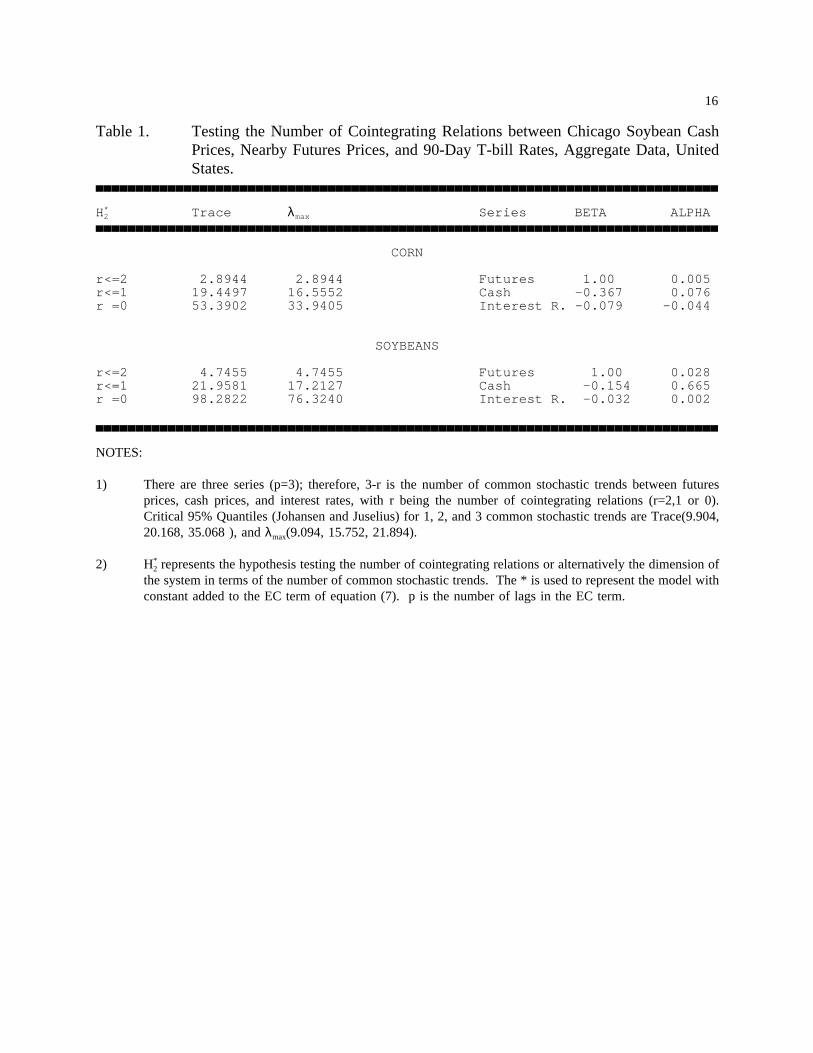
The results of the cointegration tests between corn and soybean cash prices, nearby futures
prices, and T-bill rates for the period 1980-1989 are reported in table 1. Following a suggestion
in Johansen, the residuals for each series were tested for serial correlation using the Box-Ljung
Q statistic. The trace andλmax tests of Johansen are reported for the hypotheses of no-

10
cointegration (r=0), at most one cointegrating relation (r <= 1), and at most two cointegrating
relations (r=2). The tests find cointegration between cash, futures, and T-bill rates suggesting
that interest rates are indeed critical in describing basis behavior in both corn and soybean
markets. This result suggests that at least some of the inconsistent and weak results of previous
work may reflect less on individual market performance than an inappropriate specification of
cash and futures price relationships in empirical model formulations.
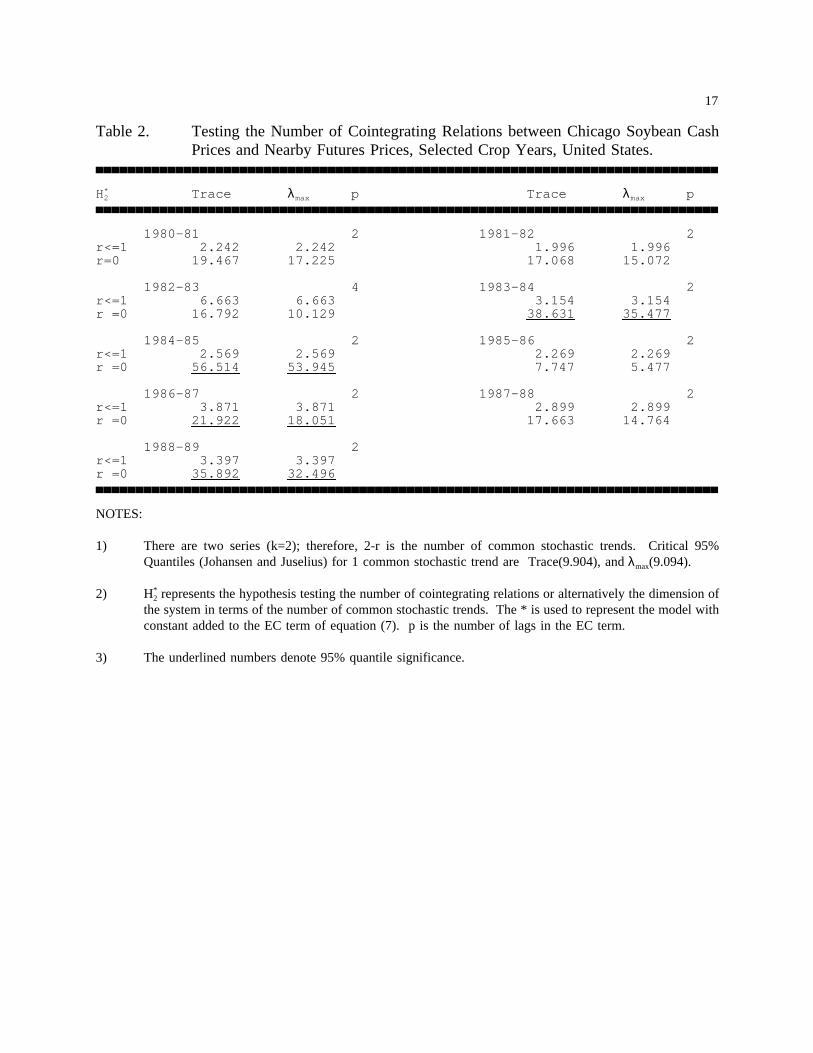
Table 2 reports cointegration tests for individual crop years for both the bivariate model
used in previous work, and the trivariate model proposed here.3 The test statistics are as defined
in table 1, and P is the lag in the error correction model for which the residuals act as white
noise. The bivariate tests detect cointegration between cash and futures prices in 1983-84, 1984-
85, 1986-87, and 1988-89, but not other crop years. In the years when there is bivariate
cointegration it takes about two days for cash and futures to return back to equilibrium. Except
in the 1988-89 crop year, the cointegrating relation between cash and futures is close to the
expected (1,-1) cointegrating vector when cointegration is found (table 3). The speed of
adjustment towards equilibrium in the years when there is cointegration is faster for the cash
market than for the futures markets, except for the 1983-84 crop year.
The results of the cointegration tests for cash prices, nearby futures prices and interest
rates, by crop year, are reported in table 4. The trace andλmax tests of Johansen are reported
for the hypotheses of no-cointegration (r=0), at most one cointegrating relation (r <= 1) and at
most two cointegrating relations (r <= 2) corresponding to the trivariate system. The results
suggest that Chicago cash prices for soybeans, the nearby futures price, and the interest rate
followed each other in most crop years, except during 1985-86, 1986-87 and 1987-88. The lag

11
in the error correction term (p) suggests that the cash market for soybeans is not necessarily just
a satellite market responding to changes in futures prices since it takes about 2 days (except for
1982-83 when it takes about a week) for the futures market to completely adjust back to
equilibrium.
The estimated cointegrating vectors and speed of adjustment towards equilibrium are
reported in Table 5. An important observation concerns the sign and magnitude of the estimated
coefficients. Except for 1984-85 and 1985-86, the estimated cointegrating vectors have the
expected signs (+,-,-). At first glance, the magnitudes of the cointegrating vectors are not as
predicted by the equilibrium relation of cash-futures-interest rates, that is (1,-1,-1). However,
since futures and cash prices are measured as levels, and interest rates are measured as rates of
return the expectation of (1,-1,-1) is not appropriate. A second observation of note is for the
years when the three variables do not appear to be cointegrated. In these years the estimated
cointegrating coefficient between cash and futures is basically (1,-1). The speed of adjustment
towards equilibrium in cash prices is consistently negative (except for 1987-88), however, its
magnitude varies across years, from very low speed of adjustment in 1985-86 (-0.035) to
relatively fast adjustment in 1984-85 (-0.508). Observe that B in table 5 measures the speed with
which the cointegration relation (the residuals from the estimated equilibrium relation) enters the
equation for each of the three series. The speed of adjustment in the futures price equation is
negative during 1981-82, 1982-83 and 1988-89, but positive for the other crop years.
Also note that during the early 1980s the results from the bivariate system suggest no
cointegration between soybean cash and nearby futures markets whereas the trivariate results
indicate a strong long-term co-movement for cash-futures-interest rates. The early 1980s were

12
years of high and volatile interest rates. The U.S. federal reserve system was beginning to
experience the effects of variable interest rates, the U.S. economy in general was experiencing
a historical high level of inflation, and it appears that commodity prices were responsive to
changes in interest rates. Cointegration in the trivariate model is also found during the years
when there was bivariate cointegration, except during 1986-87.
5. IMPLICATIONS
The empirical evidence presented here lends support to the proposition that interest rates
tend to affect, and move together with, cash and futures prices for storable commodities. Interest
rates appear to have had a significant effect on cash and futures prices for both corn and
soybeans in the early 1980s. These results support the findings of Fortenbery and Zapata, and
suggest that bivariate cointegration tests for storables may be fragile.
An important implication of the results presented here is that market efficiency
conclusions for commodity markets based on bivariate cointegration analysis may in many cases
be inappropriate. A lack of bivariate cointegration does not constitute a finding of market
inefficiency if the relationship between the two examined series is being impacted by a third
stochastic component. This suggests that the inconsistency of cointegration results from previous
studies of commodity markets may result from model mis-specification rather than be indicative
of actual market performance. This is an important point. In most cases where researchers have
examined the pricing relationship of futures and cash markets, the markets studied have been
separated by both a spatial and temporal component not explicitly accounted for in the
cointegration analysis. If there are pricing components in either the temporal or spatial market
links which are themselves nonstationary, then a bivariate cointegration model is biased in favor
13
of finding no cointegration between the cash and futures markets, even though they both may be
efficient markets for like assets. A more complete model specification would then be necessary
before drawing meaningful conclusions related to overall market efficiency. The results here
suggest that in at least some crop years temporal relationships between futures and cash prices
are non-stationary, and must therefore be explicitly considered in a cointegration framework.
Results presented above support the hypothesis that futures markets provide a price
discovery function, and suggest that cash markets are not merely a derivative market of the
futures. The finding of cointegration over the aggregate data period, as well as in 7 of the 9
years studied (either through the bivariate or the trivariate model) suggests that there is long-run
causation either from the futures to the cash market or vice versa; this results directly from the
fact that if there is cointegration between two or more series then there is also causation in at
least one direction (Granger, 1986). As can be seen from the results, failure to explicitly account
for the role of interest rates in the cointegration model would bias a researcher away from the
above observations since bivariate cointegration is found in less than half of the crop years
studied. It appears that independent of the direction of causation, interest rates do play a role in
the way cash and futures prices relate to each other. Or, in the rational expectations framework,
the effect of economic information contained in interest rates is important in explaining the co-
movement of futures and cash prices, and therefore their interrelationship. We note that the
question of whether the relationship between cash and futures is better explained by incorporating
the response in cash and futures prices to interest rate changes can be challenged during the years
(1985-86, 1986-87 and 1987-88) when cointegration tests fail to find expected co-movement
between the three series. However, a lack of long-term co-movement does not preclude a

14
response in cash and futures to interest rates in the sense that interest rates can Granger cause
cash and/or futures prices (in a forecasting sense), and yet not have a long-term co-movement
with either series.
6. CONCLUSIONS
This paper presents credible evidence of potential errors which can be made in drawing
market performance conclusions from bivariate cointegration estimates which do not adequately
recognize the theoretical relationships between the two data series being examined. However,
the results here are still not definitive from a market efficiency perspective. There are several
assumptions that should be more closely examined before making any definite conclusions about
the efficiency of soybean and corn markets in the U.S. The first relates to the omission of
storage costs in the above analysis, and the second, and perhaps more importantly, the role of
convenience yields. If returns to storage are non-stationary in a given crop year, then under an
assumption of efficient markets we would expect no cointegration to exist given the models used
here.4 As noted by Hakkio and Rush, efficient markets for different commodities should not
be cointegrated. For the data sets used in this study (crop year data), it is not possible to study
storage cost data. We have implicitly assumed that any stochastic behavior in the cost of storage
data is incorporated in the interest rates if in fact storage cost data follows a stochastic process.
The effects of convenience yields is perhaps the most problematic factor to explain
because it cannot be directly measured in a cointegration context. The cointegration results,
however, appear to suggest that nonstationary behavior in convenience yields is unlikely because
when there is no cointegration for the three series, cash and futures are cointegrated (except in
the 1985-86 crop year) suggesting that in equilibrium, the residuals from the cointegrating
15
equation are I(0), eliminating, in this context, the possibility for a fourth stochastic trend.
Perhaps the main challenge emerging from this discussion is the development of a
cointegration theory formally explaining the dynamics of the expected interrelationships similar
to that developed in Chang and Fang whereby stochastic interest rates are included in measuring
intertemporal hedging effectiveness. A somewhat similar interpretation is developed in Brenner
and Kroner who explain the evolution of cash (spot) prices by a Brownian motion process which,
under given assumptions, explains the stochastic trend behavior of cash, and, as a result of the
identity in equation (2) , of futures prices. They also assume that the interest rate follows a mean
reverting process that seems consistent with the empirical properties of interest rate data.
Whether these stochastic models provide valuable insight to understanding the dynamics of cash-
futures interrelationships for storable commodities remains an open question. The original work
of Garbade and Silber recognized the role of interest rates but assumed that the term structure
of interest rates is flat and stationary and that the cash market value of a commodity follows a
Gaussian diffusion process. It remains an open question whether their partial equilibrium analysis
can be expanded to allow for a less restrictive process in interest rate behavior. Other researchers
(Baillie and Myers) have suggested that cash and futures prices for various commodities can be
well described as martingales with near-integrated GARCH innovations and find some empirical
support for this hypothesis. It is not clear to what degree the inclusion of interest rates may
affect the results from GARCH specifications. Perhaps the results presented here will motivate
a closer evaluation of the role of interest rates in determining dynamic relationships between and
cash and futures prices for storable commodities.
16
Table 1. Testing the Number of Cointegrating Relations between Chicago Soybean CashPrices, Nearby Futures Prices, and 90-Day T-bill Rates, Aggregate Data, UnitedStates.
H2* Trace λmax Series BETA ALPHA
CORN
r<=2 2.8944 2.8944 Futures 1.00 0.005r<=1 19.4497 16.5552 Cash -0.367 0.076r =0 53.3902 33.9405 Interest R. -0.079 -0.044
SOYBEANS
r<=2 4.7455 4.7455 Futures 1.00 0.028r<=1 21.9581 17.2127 Cash -0.154 0.665r =0 98.2822 76.3240 Interest R. -0.032 0.002
NOTES:
1) There are three series (p=3); therefore, 3-r is the number of common stochastic trends between futuresprices, cash prices, and interest rates, with r being the number of cointegrating relations (r=2,1 or 0).Critical 95% Quantiles (Johansen and Juselius) for 1, 2, and 3 common stochastic trends are Trace(9.904,20.168, 35.068 ), andλmax(9.094, 15.752, 21.894).
2) H2* represents the hypothesis testing the number of cointegrating relations or alternatively the dimension of
the system in terms of the number of common stochastic trends. The * is used to represent the model withconstant added to the EC term of equation (7). p is the number of lags in the EC term.
17
Table 2. Testing the Number of Cointegrating Relations between Chicago Soybean CashPrices and Nearby Futures Prices, Selected Crop Years, United States.
H2* Trace λmax p Trace λmax p
1980-81 2 1981-82 2r<=1 2.242 2.242 1.996 1.996r=0 19.467 17.225 17.068 15.072
1982-83 4 1983-84 2r<=1 6.663 6.663 3.154 3.154r =0 16.792 10.129 38.631 35.477
1984-85 2 1985-86 2r<=1 2.569 2.569 2.269 2.269r =0 56.514 53.945 7.747 5.477
1986-87 2 1987-88 2r<=1 3.871 3.871 2.899 2.899r =0 21.922 18.051 17.663 14.764
1988-89 2r<=1 3.397 3.397r =0 35.892 32.496
NOTES:
1) There are two series (k=2); therefore, 2-r is the number of common stochastic trends. Critical 95%Quantiles (Johansen and Juselius) for 1 common stochastic trend are Trace(9.904), andλmax(9.094).
2) H2* represents the hypothesis testing the number of cointegrating relations or alternatively the dimension of
the system in terms of the number of common stochastic trends. The * is used to represent the model withconstant added to the EC term of equation (7). p is the number of lags in the EC term.
3) The underlined numbers denote 95% quantile significance.

18
Table 3. Estimated Cointegrating Vectors (C) and Speed of Adjustment (B) among ChicagoSoybean Cash Prices and Nearby Futures Prices, Selected Crop Years, UnitedStates.
C B p C B p
1980-81 2 1981-82 2Cash 1.000 -0.226 1.000 -0.160Futures -0.784 -0.087 -0.837 -0.027
1982-83 4 1983-84 2Cash 1.000 -0.110 1.000 -0.129Futures -1.053 -0.018 -0.892 0.151
1984-85 2 1985-86 2Cash 1.000 -0.507 1.000 -0.067Futures -0.963 0.068 -0.631 -0.040
1986-87 2 1987-88 2Cash 1.000 -0.074 1.000 0.180Futures -1.079 0.003 -0.998 0.269
1988-89 2Cash 1.000 -0.433Futures -0.838 -0.228
NOTES:1. The normalization is on cash prices. For 1980-81, for instance, the C column represents the cointegrating
equation given by lnSt = 0.784lnFt, with the constant term omitted. The residuals from this equation, thatis zt, are given by zt = lnSt - constant - 0.78lnFt and is often referred to as the cointegrating relation. TheB column is the speed with which the cointegrating relation enters the equation for each series. For 1980-81the B column suggests that the speed of adjustment towards equilibrium in cash prices is about 2.6 timesfaster (.226/.087) than that in futures.
2. The underlined years denote significant cointegration at the 95 % quantile.

19
Table 4. Testing the Number of Cointegrating Relations for Chicago Soybeans Cash Prices,Nearby Futures Prices, and 90-day Treasury bill, Selected Crop Years, UnitedStates.
H2* Trace λmax p Trace λmax p
1980-81 2 1981-82 2r<=2 9.699 9.699 3.048 3.048r<=1 20.182 10.483 15.702 12.654r =0 43.714 23.532 45.086 29.384
1982-83 5 1983-84 2r<=2 1.960 1.960 2.461 2.461r<=1 9.860 7.899 9.883 7.422r =0 39.438 29.579 49.179 39.295
1984-85 2 1985-86 2r<=2 3.575 3.575 3.058 3.051r<=1 14.227 10.651 7.836 4.778r =0 69.046 54.891 24.749 16.913
1986-87 2 1987-88 2r<=2 3.938 3.938 3.562 3.562r<=1 8.788 4.849 9.519 5.958r =0 28.366 19.578 23.121 13.601
1988-89 2r<=2 1.169 1.169r<=1 8.528 7.359r =0 41.119 32.590
NOTE: 1) There a three series (k=3); therefore, 3-r is the number of common stochastic trends. Critical 95%Quantiles (Johansen and Juselius) for 1, 2, and 3 common stochastic trends are, respectively,Trace(9.904, 20.168, 35.068), andλmax(9.094, 15.752, 21.894).
2) See note 2 in table 2.
3) The underlined numbers denote 95% quantile significance.

20
Table 5. Estimated Cointegrating Vectors (C) and Speed of Adjustment (B) among ChicagoSoybean Cash Prices, Nearby Futures Prices, and 90-day Treasury bill, SelectedCrop Years, United States.
C B p C B p
1980-81 2 1981-82 2Cash 1.000 -0.088 1.000 -0.131Futures -0.853 0.070 -0.783 -0.022I. Rate -0.094 0.218 -0.021 0.603
1982-83 5 1983-84 2Cash 1.000 -0.381 1.000 -0.114Futures -0.955 -0.323 -0.906 0.198I. Rate -0.366 0.091 -0.053 -0.080
1984-85 2 1985-86 2Cash 1.000 -0.508 1.000 -0.035Futures -0.970 0.070 -1.006 0.014I.Rate 0.010 -0.023 0.099 -0.107
1986-87 2 1987-88 2Cash 1.000 -0.069 1.000 0.108Futures -1.007 0.012 -0.967 0.160I. Rate -0.171 0.047 -0.103 0.221
1988-89 2Cash 1.000 -0.436Futures -0.840 -0.233I. Rate -0.017 0.037
NOTE: See notes 1 and 2 in table 2.

22
REFERENCES
Baillie, R. T. and R. J. Myers (1991), "Bivariate GARCH Estimation of the Optimal CommodityFutures Hedge", Journal of Applied Econometrics, 6, 109-124.
Bessler, D. and T. Covey (1991), "Cointegration: Some Results on U.S. Cattle Prices", TheJournal of Futures Markets, 11, 461-474.
Blank, S.C., C. A. Carter, and B. H. Schmiesing (1991) Futures and Options Markets:Trading in Financials and Commodities, Englewood Cliffs, New Jersey.
Brenner, R. J. and K. F. Kroner (1993), "Arbitrage, Cointegration and Testing for SimpleEfficiency in Financial Markets", Department of Economics, University of Arizona,Tucson, AZ.
Chang, J. S. K. and H. Fang (1990), "An Intertemporal Measure of Hedging Effectiveness",The Journal of Futures Markets, 10, 307-321.
Dewbre, J. H. (1981), "Interrelationships between Spot and Futures Markets: Some Implicationsof Rational Expectations", American Journal of Agricultural Economics, 926-933.
Dornbusch, R. (1976), "Expectations and Exchange Rate Dynamics", Journal of PoliticalEconomy, 84,1161-1176.
Engle, R. F., and C. W. J. Granger (1987), "Co-integration and Error Correction:Representation, Estimation, and Testing", Econometrica, 55, 251-276.
Fortenbery, T. R. and H. O. Zapata (1993), "An Examination of Cointegration BetweenFutures and Local Grain Markets", The Journal of Futures Markets, Forthcoming.
Frankel, J. A. (1984), "Commodity Prices and Money: Lessons from International Finance",American Journal of Agricultural Economics, 66, 560-566.
Frankel, J. A. (1986), "Expectations and Commodity Price Dynamics: The OvershootingModel", American Journal of Agricultural Economics, 68, 344-348.
Garbade, K. D. and W. L. Silber (1983), "Price Movements and Price Discovery in Futuresand Cash Markets", Review of Economics and Statistics, 65, 289-297.
Granger, C. W. J. (1986), "Developments in the Study of Cointegrated EconomicVariables", Oxford Bulletin of Economics and Statistics, 48, 213-228.

23
Hakkio, C. S. and M. Rush (1991), "Cointegration: How Short is the Long Run?", Journalof International Money and Finance, 10, 571-581.
Johansen, S. (1988), "Statistical Analysis of Cointegration Vectors", Journal of EconomicDynamics and Control, 12, 231-234.
Johansen, S. and K. Juselius (1990), "Maximum Likelihood Estimation and Inference onCointegration - with Applications to the Demand for Money", Oxford Bulletin ofEconomics and Statistics, 52, 169-211.
Kitchen, J. and M. Denalby (1987), "Arbitrage Conditions, Interest Rates, and CommodityPrices", Journal of Agricultural Economics Research, 39, 3-11.
Naik, G. and R. M. Leuthold (1991), "A Note on the Factors Affecting Corn BasisRelationships", Southern Journal of Agricultural Economics, 147-153.
Phillips, P. C. B. (1988), "Optimal Inference in Cointegrated Systems", Cowles FoundationDiscussion Paper No. 866.
Phillips, P. C. B. and P. Perron (1988), "Testing for a Unit Root in Time Series Regression",Biometrika, 75, 335-346.
Racer, G. C. (1985), "Macroeconomics and U.S. Agricultural Policy", in B. L. Gardner (ed).U.S. Agricultural Policy: The 1985 Farm Legislation, Washington, DC: AmericanEnterprise Institute for Public Policy Research, 207-257.
Schroeder, T. C. and B. K. Goodwin (1991), "Price Discovery and Cointegration for LiveHogs", The Journal of Futures Markets, 11, 685-696.
Schuh, G. E. (1974), "The Exchange Rate and U.S. Agriculture", American Journal ofAgricultural Economics, 56, 1-13.
Stoll, H. R. (1979), "Commodity Futures and Spot Price Determination and Hedging inCapital Market Equilibrium", Journal of Financial and Quantitative Analysis, ProceedingsIssue, XIV, 873-904.
Working, H. (1958), "A Theory of Anticipatory Prices", American Economic Review, 48,188-199.

21
ENDNOTES
1. A potential answer, of course, is that cointegration measures long-run relationships and individual crop years maynot be sufficient to approximate the long run. This is discussed in more detail later.
2. Tabulated results for Phillips-Perron test statistics are available from the authors.
3. In the interest of brevity, we only report soybean results for individual crop years. Results for corn are similarto soybeans, and are available from the authors.
4. This would also be true of transport costs if the two markets were for delivery in different locations. We haveavoided that problem here by choosing a cash and futures market which both bid for delivery in Chicago.