Steffen Mischke Editor Natural State and Human Impact
266
Springer Water Steffen Mischke Editor Large Asian Lakes in a Changing World Natural State and Human Impact
-
Upload
khangminh22 -
Category
Documents
-
view
2 -
download
0
Transcript of Steffen Mischke Editor Natural State and Human Impact

Springer Water
Steffen Mischke Editor
Large Asian Lakes in a Changing WorldNatural State and Human Impact

Springer Water
Series Editor
Andrey Kostianoy, Russian Academy of Sciences, P. P. Shirshov Institute ofOceanology, Moscow, Russia

The book series Springer Water comprises a broad portfolio of multi- andinterdisciplinary scientific books, aiming at researchers, students, and everyoneinterested in water-related science. The series includes peer-reviewed monographs,edited volumes, textbooks, and conference proceedings. Its volumes combine allkinds of water-related research areas, such as: the movement, distribution andquality of freshwater; water resources; the quality and pollution of water and itsinfluence on health; the water industry including drinking water, wastewater, anddesalination services and technologies; water history; as well as water managementand the governmental, political, developmental, and ethical aspects of water.
More information about this series at http://www.springer.com/series/13419

Steffen MischkeEditor
Large Asian Lakesin a Changing WorldNatural State and Human Impact
123

EditorSteffen MischkeInstitute of Earth SciencesUniversity of IcelandReykjavík, Iceland
ISSN 2364-6934 ISSN 2364-8198 (electronic)Springer WaterISBN 978-3-030-42253-0 ISBN 978-3-030-42254-7 (eBook)https://doi.org/10.1007/978-3-030-42254-7
© Springer Nature Switzerland AG 2020This work is subject to copyright. All rights are reserved by the Publisher, whether the whole or partof the material is concerned, specifically the rights of translation, reprinting, reuse of illustrations,recitation, broadcasting, reproduction on microfilms or in any other physical way, and transmissionor information storage and retrieval, electronic adaptation, computer software, or by similar or dissimilarmethodology now known or hereafter developed.The use of general descriptive names, registered names, trademarks, service marks, etc. in thispublication does not imply, even in the absence of a specific statement, that such names are exempt fromthe relevant protective laws and regulations and therefore free for general use.The publisher, the authors and the editors are safe to assume that the advice and information in thisbook are believed to be true and accurate at the date of publication. Neither the publisher nor theauthors or the editors give a warranty, expressed or implied, with respect to the material containedherein or for any errors or omissions that may have been made. The publisher remains neutral with regardto jurisdictional claims in published maps and institutional affiliations.
This Springer imprint is published by the registered company Springer Nature Switzerland AGThe registered company address is: Gewerbestrasse 11, 6330 Cham, Switzerland

Preface
Lakes represent important ecosystems which are often biodiversity hotspots andimportant habitats for aquatic organisms and migratory birds. They representeconomic resources for local fishery sectors and tourism activities, and provideinvaluable ecosystem services. Concerns about biodiversity loss due to degradedwater quality, shrinking lake areas and ecological consequences of species intro-ductions inspired systematic and intensive monitoring programmes to support theirsustainable use, improved management and more efficient conservation.
However, human impacts on lakes are almost omnipresent now, and there areonly few regions on Earth left where lakes are not directly affected by local humanactivities. Even lakes in remote areas cannot be considered as pristine and in a fullynatural state anymore due to anthropogenic changes of climate and biogeochemicalcycles through emissions of greenhouse gases and reactive nitrogen which becameapparent since the middle of the last century (Wolfe et al. 2013; Zalasiewicz et al.2017).
Significant human impacts on lakes may have started much earlier than in themiddle of the last century or even long before the Industrial Revolution in theeighteenth and nineteenth century, and it is not trivial to define a desired lake statemore or less representing natural conditions as a baseline for the assessment of lakerestoration measures (Kostianoy et al. 2004).
This book describes large lakes in Asia and their present state as a result ofman-made alterations and conditions assumed as their natural state. Examples frommostly closed-basin lakes examine cases which are especially prone to humanimpacts on their catchment’s water balance (Fig. 1). Past anthropogenic alterationsof the lake systems may have been as dramatic as the included Aral and Dead seas.Described is also an oppositional example of a large closed-basin lake in Mongoliawhich experienced relatively minor impacts on the lake ecosystem so far.
The book provides a reference for the natural state of some of the largest lakes inAsia. Information on the natural states of lakes was collected from many sourcesincluding hardly accessible reports and data collections. Observational data frompre-impact periods were gathered, and proxy data from drilled or exposed lakesediment records were assessed to describe the natural state of lakes. Information
v

with respect to human impacts in the catchment of lakes such as water withdrawalfrom tributaries and concerning direct impacts on lakes (e.g. due to fishery activitiesand the introduction of alien species) were assembled. Both types of information,on the natural state of a lake and its alteration history as a result of human activities,will be crucial for the assessment of lake conditions in future and for endeavours oflake ecosystem restorations.
Reykjavík, Iceland Steffen Mischke
Acknowledgements The original manuscripts of the different chapters were carefully examinedby the following reviewers who provided constructive assessments, detailed suggestions andcorrections: Ian P. Wilkinson, Nicolas Waldmann, Siegmar W. Breckle, Philippe Sorrel, BrigitteNixdorf, Ulrich Kamp, Hamid Alizadeh Lahijani, Suzanne Leroy, Anja Schwarz, Peter Frenzel,Tamara Yanina, Frank Neumann, Omid Beyraghdar Kashkooli and one anonymous reviewer.Their most valuable contributions to the improvements of chapter drafts are highly acknowledged.
Fig. 1 Lakes included in this book: (1) the Dead Sea, (2) Lake Sevan, (3) the Caspian Sea, (4) theAral Sea, (5) Lake Balkhash, (6) Lake Issyk-Kul, (7) Lake Lop Nur and (8) Lake Uvs Nuur
vi Preface

References
Kostianoy AG, Zavialov PO, Lebedev SA (2004) What do we know about dead, dying andendangered lakes and seas? In: Nihoul JCJ, Zavialov PO, Micklin P (eds) Dying and DeadSeas. Climatic versus Anthropic Causes. NATO ARW/ASI Series. Kluwer Acad. Publ.,Dordrecht, pp 1–48
Wolfe AP, Hobbs WO, Birks HH et al. (2013) Stratigraphic expressions of the Holocene-Anthropocene transition revealed in sediments from remote lakes. Earth Sci Rev 116:17–34
Zalasiewicz J, Waters CN, Summerhayes CP et al. (2017) The working group on theAnthropocene: summary of evidence and interim recommendations. Anthropocene 19:55–60
Preface vii

Contents
1 The Dead Sea and Its Deviation from Natural Conditions . . . . . . . . 1Revital Bookman
2 Lake Sevan: Evolution, Biotic Variability and EcologicalDegradation . . . . . . . . . . . . . . . . . . . . . . . . . . . . . . . . . . . . . . . . . . . 35Ian P. Wilkinson
3 Past and Current Changes in the Largest Lake of the World:The Caspian Sea . . . . . . . . . . . . . . . . . . . . . . . . . . . . . . . . . . . . . . . . 65Suzanne A. G. Leroy, Hamid A. K. Lahijani, Jean-Francois Crétaux,Nikolai V. Aladin and Igor S. Plotnikov
4 The Aral Sea: A Story of Devastation and Partial Recoveryof a Large Lake . . . . . . . . . . . . . . . . . . . . . . . . . . . . . . . . . . . . . . . . 109Philip Micklin, Nikolai V. Aladin, Tetsuro Chida, Nikolaus Boroffka,Igor S. Plotnikov, Sergey Krivonogov and Kristopher White
5 Geological History and Present Conditions of Lake Balkhash . . . . . 143Renato Sala, Jean-Marc Deom, Nikolai V. Aladin, Igor S. Plotnikovand Sabyr Nurtazin
6 Lake Issyk-Kul: Its History and Present State . . . . . . . . . . . . . . . . . 177Andrei O. Podrezov, Ari J. Mäkelä and Steffen Mischke
7 Lop Nur in NW China: Its Natural State, and a Long Historyof Human Impact . . . . . . . . . . . . . . . . . . . . . . . . . . . . . . . . . . . . . . . 207Steffen Mischke, Chenglin Liu and Jiafu Zhang
8 Uvs Nuur: A Sentinel for Climate Change in EasternCentral Asia . . . . . . . . . . . . . . . . . . . . . . . . . . . . . . . . . . . . . . . . . . . 235Michael Walther, Wolfgang Horn and Avirmed Dashtseren
Index . . . . . . . . . . . . . . . . . . . . . . . . . . . . . . . . . . . . . . . . . . . . . . . . . . . . . . 259
ix

Chapter 1The Dead Sea and Its Deviationfrom Natural Conditions
Revital Bookman
Abstract The Dead Sea is a hypersaline terminal lake located in a tectonic depres-sion along the Dead Sea Transform. The regional paleogeographic setting began totake shape in the Miocene, and by the late Neogene fluvio-lacustrine sequences con-fined to the basin announced a new subsidence regime. Marine intrusion flooded thetectonic valley in the Pliocene, leading to the accumulation of a thick sequence ofevaporites and initiated the development of the unique Ca-chloride brine of the basin.Rapid tectonic movements during the Pleistocene, or even earlier, disconnected theopen sea and the valley became a deep, landlocked depression that hosted a seriesof lacustrine phases. The lakes deposited fine-laminated sequences during relativelywet phases and precipitated gypsum and halite during arid periods. The uppermostsedimentary fill comprises the Late Pleistocene Lisan Formation and the HoloceneZe’elim Formation. Lake Lisan existed during the last glacial period and in its higheststand extended from the Sea of Galilee to south of the Dead Sea, more than 200 mabove the current level. The transition to the Holocene began with a dramatic dry-uprecorded as a series of retreat strands on the margins of the basin and deposition ofa thick halite unit. The Holocene Dead Sea was restricted to the deepest depressionand its level fluctuated around 400 m below sea level in pace with climatic fluctua-tions dictated mostly by precipitation over the northern headwaters. The lake-waterbalance is a proxy for regional freshwater availability that influenced cultural trans-formations and demographic patterns during historical periods. The modern DeadSea is being altered by intensified human activities. Water diversion and dammingof freshwater for domestic and agricultural use, and brine evaporation for the potashindustry have resulted in a level drop of over 1 m yr−1. The negative water balancehas led to erosion of the exposed margins and development of sinkholes due to sub-surface evaporite dissolution. The stable stratification of the lake-water column hasdiminished, and seasonal halite deposition characterizes the modern lake. The leveldrop has also resulted in drying and migration of spring seepages, putting uniqueecosystems under threat. Currently, diversion of sea water from the Red Sea to theDead Sea is viewed as a comprehensive solution for stabilizing the level as well as for
R. Bookman (B)The Dr. Moses Strauss Department of Marine Geosciences, Leon H. Charney School of MarineSciences, University of Haifa, 199 Aba Khoushy Ave., Mt. Carmel, 31905 Haifa, Israele-mail: [email protected]
© Springer Nature Switzerland AG 2020S. Mischke (ed.), Large Asian Lakes in a Changing World, Springer Water,https://doi.org/10.1007/978-3-030-42254-7_1
1

2 R. Bookman
producing hydroelectric power and desalinated water. However, this ambitious ini-tiative must hurdle diplomatic tensions and financing difficulties, as well as intensiveenvironmentalists’ objections.
Keywords Dead Sea Basin · Lisan Formation · Ze’elim Formation ·Waterdiversion · Lake-level drop · Red Sea–Dead Sea Water Conveyance
1.1 Introduction
The Dead Sea, the lowest place on land, is one of the saltiest lakes on the earth. Thelake is a terminal basin at the border between Israel and Jordan in the Middle East(Fig. 1.1). The current lake volume is ~132 km3, with a surface area of ~630 km2,and a surface level elevation of ~430 meters below sea level (mbsl). The modernDead Sea is a remnant of a series of water bodies that resided thought time in thecentral tectonic depression of the Dead Sea Transform, a plate boundary runningfrom the East Anatolian Fault in southeastern Turkey to the northern end of the RedSea (Garfunkel 1981; Garfunkel and Ben-Avraham 1996).
The tectonic inland valley, comprising lakes and freshwater environments, hasbeen a major corridor for biological dispersal and hominin migration out of Africa(Goren-Inbar et al. 2000; Ben-Avraham et al. 2005). Despite its extreme, harsh envi-ronment during recent millennia, multiple accounts have shown that the hypersalineDead Sea attracted humans during the course of history. The lake is mentioned inbiblical stories and historical documentation and is enrichedwith archaeological sitesthat are a testimony to the wealth of the region’s culture and economy (Hirschfeld2006). However, in modern times the lake has been drastically altered by waterdiversion projects, industrial activities and landscape development in its watershedand along its shores. The changes are dramatic and are reflected in the lake’s waterbalance and chemistry and the exposure of its shores. The rapid lake retreat acceler-ates environmental deterioration, including soft sediment erosion that results in rapidstream head-cut migration and widespread development of collapse sinkholes. Theseprocesses threaten coastal infrastructure and daily human life and have an impact onthe natural environment. The lake’s unique natural conditions have probably beenirreversibly altered, although proposals are constantly being suggested to “save” theDead Sea.
1.1.1 Geological Setting
The topography of the Dead Sea Basin has been shaped mostly by its tectonicnature and is bounded on the east and west by fault escarpments (Ben-Avrahamand Lazar 2006; Shamir 2006). The tectonic depression is the central in a chain ofgrabens located at the plate boundary between the African and Arabian plates that

1 The Dead Sea and Its Deviation from Natural Conditions 3
(a)
(b)
(d)
(c)
Fig. 1.1 a Location map of the Dead Sea. b The Dead Sea Basin watershed with major tributaries.In red, isohyets of average annual rainfall over the watershed. Lake Lisan at its highest stand of 165mbsl (Bartov et al. 2003) is marked along the Jordan Valley. c Detailed location map of the DeadSea. d North-south cross section of the Dead Sea Basin. During Holocene lowstands, the lake isrestricted to the northern sub-basin (blue), while the southern shallow sub-basin is flooded duringhighstands (pale blue)

4 R. Bookman
runs from the Red Sea to the continental collision at the Taurus-Zagros Mountains(Garfunkel 1981). Dating of fault surfaces along the transform indicates that theoceanic-to-continental plate boundary was initiated between 20.8 and 18.5 millionyears (Ma) ago, propagated northward around 17.1–12.7 Ma, and was established asa well-developed >500-km-long, plate-bounding fault at 3 Ma (Nuriel et al. 2017).The transform accommodated a left lateral movement of ~100 km along the Aravaand Jordan valleys, which also initiated the development of deep tectonic depres-sions, with the Dead Sea Basin as the deepest one. The depression is asymmetric,with the mountains to the east being higher. The difference in elevation between theshoulders of the rift and the present shores of the lake is 300–500 m in the west and400–1000 m in the east, while the southern and northern margins are almost flat.
The Dead Sea Basin is divided into two sub-basins separated by a topographicsill at the elevation of ~400 mbsl at Lynch Strait (Fig. 1.1). In 1979, the lake leveldropped below the strait’s elevation, dividing the lake into two separate water bodies;the northern deep sub-basin, and the southern shallow sub-basin that operates asevaporation ponds for the potash industries. While the southern sub-basin is flat andabove the lake level, the northern sub-basin, the current terminal lake, is 300 m deep.This shrunken lake is ~50 km in length by ~15 km in width, with a flat floor at 730mbsl (Hall 1996).
1.1.2 Climate and Hydrology
The Dead Sea watershed is located at the transition between the Mediterranean anddesert climatic zones, reflected by sharp precipitation and temperature gradients.This climatic boundary follows the topography of the basin and stretches as a narrowtongue of semi-desert to desert conditions northward along the Lower Jordan Valleyup to the Sea of Galilee. Mean winter and summer temperatures increase from thenorthern drainage (10–25 °C) southward to the Arava Valley (15–35 °C), and in theDeadSea the recordedmaximumtemperaturewas above50 °C (IsraelMeteorologicalService).
Average annual precipitation decreases from the northern sub-humid Mediter-ranean climate headwaters (100 to >1000 mm yr−1) to less than 50 mm yr−1 overthe southern hyperarid watershed. The lake surface receives less than 75 mm yr−1,and its natural water balance is controlled mostly by the northern watershed. A rainshadow effect and low topography of the basin control the decrease in precipita-tion from west (Jerusalem, ~540 mm yr−1) to east (Ein Gedi, ~75 mm yr−1) andincrease again towards the Jordanian Plateau (Amman, ~300 mm yr−1) due to thehigh topography of the Edom and Moav mountains (Greenbaum et al. 2006). Thewet season is from October to April, with most of the precipitation falling during thewintermonths (December-February).During the rainy season, cold, upper-level, low-pressure troughs migrate eastward over southern Europe and the Mediterranean Seaand drive cold and relatively dry airmasses over thewarm sea surface (Ziv et al. 2006;Trigo 2006). This process leads to the formation of surface low-pressure cyclones,

1 The Dead Sea and Its Deviation from Natural Conditions 5
which lift the moistened marine air to produce clouds and precipitation that feed theJordan River and its tributaries, and subsequently the Dead Sea. During the other halfof the year (May to September) the area is dry due to the strong regional atmosphericsubsidence induced by the remote influence of the Indian summer monsoon system(Ziv et al. 2004).
The Dead Sea has one of the largest drainage systems in the Levant, covering~42,000 km2 (Fig. 1.1) and drainingmajor tributaries to the Upper Jordan River fromMt. Hermon and the eastern Yarmouk and Zarka rivers and smaller-scale westernwatersheds that merge with the Jordan River south of the Sea of Galilee. The Wala,Mujib and Hasa watersheds drain directly to the Dead Sea from the east, while fromthe west a dense net of smaller tributaries drains the Judean Desert. From the south,the lake receives runoff occasionally from the Arava Valley watershed that spreadsup to 100 km south of the Dead Sea. A water divide in the central Arava Valleyseparates the Dead Sea drainage basin from the Gulf of Aqaba (Greenbaum et al.2006). This large hydrological system transfers sediment and runoff to the lake. Themean annual natural discharge at the outlet of the Jordan River to the Dead Seawas estimated at over one billion cubic meters prior to human intervention. Since1932 when the Degania Dam was established, and particularly after the 1950s whenwater diversion from the Sea of Galilee and Yarmouk River intensified, the annualdischarge was reduced to a few tens of millions of cubic meters (Hassan and Klein2002; Gavrieli et al. 2011; Lensky and Dente 2015).
Freshwater to saline springs discharge to the Dead Sea Basin (Katz and Starinsky2009). The main source of fresh groundwater that flows from the marginal aquifersis precipitation in the mountains to the west and east with groundwater residencetime on a scale of tens of years (Kiro et al. 2014). Their overall contribution tothe water balance is small; however, the springs have been shown to be a sensitivesubsurface system that is strongly connected to changes in lake level and precipitation(Yechieli et al. 1995; Weber et al. 2018). The deep subsurface system is a density-driven flow that supports migration of brines from the Dead Sea Basin via deepaquifers (Stanislavsky and Gvirtzman 1999). Groundwater flows into the lake fromthe surrounding aquifers either subterraneously or through springs that dischargesurficially along the margins. Submerged springs also discharge directly from thelake floor (Siebert et al. 2014); some are presently located above the water level dueto the recession of the shores.
1.2 The Dead Sea Basin Lacustrine History
The Dead Sea Basin has been an effective sediment trap since the initiation of itstectonic subsidence during the Miocene and has acquired a thick sedimentary fillin the northern and southern sub-basins, where ~6–8 km and ~14 km of sedimentsaccumulated, respectively (ten Brink and Flores 2012). The sedimentary history ofthe basin took place through the Oligocene and most of theMiocene when the regionwas a single morphological unit with low relief that drained northwestward to the

6 R. Bookman
Mediterranean Sea (Garfunkel and Horowitz 1966). Fluvio-lacustrine sediments ofthe Hazeva Formation accumulated a >2-km thick sequence in the basin. The pre-riftpaleogeographic settings were disrupted by uplifting of the rift margins in the latestMiocene; and a series of estuarine-lagoonar sequences announced a new syn-riftsedimentary regime. The Sedom Lagoon, a marine estuary that filled the tectonicdepression (Starinsky 1974; Stein 2001), dated to 5–3 Ma (Belmaker et al. 2013),deposited a sequence of halite beds that are several kilometers thick (Zak 1967).The evaporitic sequence is exposed on the surface at the Sedom Diapir (Fig. 1.1)and its later partial dissolution during high lake levels had an important effect on thechemistry of Ca-chloride brines in the basin (Levy et al. 2018).
After the disconnection from the open sea and drying of the lagoon, the rift valleywas occupied by a series of terminal lakes thatwere controlled by climatic conditions.These lakes deposited coarse to laminated fine-grained lacustrine sequences, andduring arid periods evaporated and precipitated gypsum and halite (Stein 2014).Rapid tectonic subsidence began during the Pleistocene (ten Brink andBen-Avraham1989) and the basin became a deep, landlocked depression into which drainage ofa large area was diverted. The new configuration resulted in the accumulation ofthe Amora Formation exposed on the eastern flanks of the Sedom Diapir and datedbetween ~740 and 70 thousand years (ka), covering seven glacial–interglacial cycles(Torfstein et al. 2009). The uppermost Quaternary fill in the basin comprises the LatePleistocene Lisan Formation and the Holocene Ze’elim Formation (Bookman et al.2006). Lake Lisan extended from the Sea of Galilee to Hazeva in the northern Aravaduring its maximum highstand (Neev and Emery 1967; Begin et al. 1974). The lake’sexistence has been dated to 70–14 ka (Schramm et al. 2000; Torfstein et al. 2013),corresponding in time to the last glacial period.
Lake Lisan operated between two distinct modes. The first was characterized byan extensive supply of freshwater that resulted in a rise in the lake’s level, a densitylayered water column structure, and precipitation of fine laminations of alternatingaragonite and clay-silt detritus. The second mode was marked by a decrease infreshwater input, resulting in mixing or complete overturn of the upper water columnand precipitation of gypsum. These two modes reflect the climatic evolution of theregion in the Late Pleistocene which fluctuated between drier and wetter periods(Stein et al. 1997) related toNorthernHemisphere climate (Bartov et al. 2003; Haase-Schramm et al. 2004; Torfstein et al. 2013). The transition to the Holocene wasinitiated with a dramatic level fall of Lake Lisan, recorded as massive deposition ofgypsum (Schramm et al. 2000), a series of retreat level strands on the margins ofthe basin (Bookman et al. 2014) and its contraction below 465 mbsl, the lowest LatePleistocene stands (Bartov et al. 2003). A short level rise above 400 mbsl duringthe Younger Dryas interval and a decline at 11–10 ka resulted in the deposition of athick salt unit, which was recovered in cores drilled along the Dead Sea shores tensof meters below the surface (Stein et al. 2010).

1 The Dead Sea and Its Deviation from Natural Conditions 7
1.3 The Holocene Dead Sea
1.3.1 Sediments of the Ze’elim Formation
The term “Dead Sea” relates to the water body that fills the Dead Sea Basin since thebeginning of theHolocene.After the termination of the salt deposition event ca. 10 ka,the level of the Dead Sea rose and fluctuated around 400 mbsl, alternately floodingor withdrawing from the southern sub-basin (Migowski et al. 2006) in pace withclimatic fluctuations mostly dictated by precipitation over the northern headwaters(Enzel et al. 2003). The northern extension of the Jordan Valley was occupied by theSea of Galilee (Hazan et al. 2005), and the Lower Jordan River, a recent geomorphicfeature, formed on the exposed Lisan lakebed (Marder et al. 2018); since then itdelivers water from the wetter north to the Dead Sea.
The Holocene Ze’elim Formation, which was deposited on top of the salt unit(Yechieli et al. 1993), comprises fine-grained sequences of laminated detritus (ld) andalternating aragonite and detritus (aad) facies (Haliva-Cohen et al. 2012; Fig. 1.2).The ld facies appears with intercalated synchronous intervals of coarse sand, repre-senting shallow coastal environments, or halite in the deep basin (Neugebauer et al.2014). The facies consists of a mixture of regional dust inputs, mostly recycled fromthe loess surface cover of the Negev Desert, and local runoff erosion products fromthe catchment area. The ld mineralogy comprises quartz and calcite grains withminor feldspars and clays (Haliva-Cohen et al. 2012). The ld units are a few cmto meters thick; their thickness is not necessarily related to the humid conditionsand increased runoff, but might be connected to drier conditions when the lake levelwas lower and more erodible material from older marginal lacustrine unconsolidatedsediments were exposed to erosion, increasing the volume of suspended material inrunoff (Migowski et al. 2006; Lu et al. 2017; 2020).
Although the aad facies is associatedmainly with the Last GlacialMaximum (e.g.the upper member of the Lisan Formation; 26.2–17.7 ka; Prasad et al. 2004), it alsoappears in the Holocene formation, especially after 3.6 ka (Migowski et al. 2006;Waldmann et al. 2007). The detrital laminae are similar inmineralogy to the ld facies,however, their aeolian provenance is more distant and reflects enhanced transport ofSaharan dust to the vicinity of the lake (Haliva-Cohen et al. 2012). The detrital andaragonite laminae represent discrete flashflood events that transported suspendedsediments and dissolved bicarbonate in the rainy season to the lake (López-Merinoet al. 2016). In the hypersaline Dead Sea, the aragonite precipitation is an inorganicprocess resulting from mixing of freshwater runoff and brine in the surface layerof the lake during the rainy season (Barkan et al. 2001). Aragonite deposition isalso enhanced during dust storms that are often associated with Mediterranean rainfronts. The carbonate fraction in the dust dissolves in the runoff and increases theavailability of bicarbonate for aragonite deposition (Belmaker et al. 2019). In parts ofthe Ze’elim Formation, a primary gypsum lamina formed instead of or additionallyto the aragonite (Heim et al. 1997; Migowski et al. 2006; Torfstein et al. 2008) and

8 R. Bookman
Fig. 1.2 Environments and sediments of the Dead Sea Basin. a The Dead Sea modern shore.View along the western shore towards the south. Notice the abandoned shorelines on the mud plainthat used to be the lake floor. b Gully development on the retreating mud flats. The rapid lakeretreat accelerates environmental deterioration, including soft sediment erosion that results in rapidstream head-cut migration. c Salt deposition on the Dead Sea modern shore. d The Ein Feshkhaspring system, the largest on the western Dead Sea coast. The Dead Sea level drop resulted indrying and migration of spring seepages, development of gullies that drain the spring outflow andincise the exposed mud flats. e Flashflood plume of runoff water laden with suspended detritalsediments entering the Dead Sea. These suspended sediments will later spread and settle on the lakefloor. f Southward view of the Ze’elim Plain on the western coast of the Dead Sea. Shore terracesabandoned by the shrinking lake run parallel to the shore. Sinkholes can be seen near the shore andon the mud plain. Notice the Dead Sea works pumping station on the top left corner. Picture byRotem Shachal

1 The Dead Sea and Its Deviation from Natural Conditions 9
represents drier years with lower water input and enhanced evaporation (Stein et al.1997).
In the Holocene, prior to the modern human-induced limnological conditions,halite deposits occurred only in the deep environment of the northern sub-basin(Heim et al. 1997; Neugebauer et al. 2015), or in the shallow southern sub-basinwhen it became disconnected from the main lake (Neev and Emery 1967, 1995).These deposits are a proxy for extreme dry conditions and a negative water balanceand were used to determine the periods when the Dead Sea level shrank below thesill elevation (Bookman (Ken-Tor) et al. 2004).
1.3.2 The Holocene Dead Sea Level: Climatic and HumanImplications
The Dead Sea level curve (Fig. 1.3) was reconstructed from deep-cut exposures inthe Ein Qedem steep shores (Stern 2010), the Darga fan delta (Kadan 1997; Bartov2004), David fan delta in the proximity of Ein Gedi, and Ze’elim Plain (Bookman(Ken-Tor) et al. 2004; Kagan et al. 2015). These outcrops were exposed due to theanthropogenic retreat of the Dead Sea in recent decades. The early Holocene recordwas recovered from sediment cores from the lake margins and the deep basin floor(Yechieli et al. 1993; Heim et al. 1997; Migowski et al. 2006; Neugebauer et al.2014).
Near-shore sections on the margins of the Dead Sea include shore ridges, evap-oritic crusts, lagoonar deposits, and ripple marks that are all indicators for lake levelelevation (Fig. 1.4). A detailed discussion of their sedimentological use as absolutelevel indicators is available inMachlus et al. (2000), Bookman (Ken-Tor) et al. (2004)and Bartov et al. (2006). The record from sediment cores could only yield a relativelake-level reconstruction, as the level was above their location most of the time. Nev-ertheless, the level reconstruction is based on stratigraphic correlation between coresand lithological comparison with the exposed sections in near-shore environments(Migowski et al. 2006). This comparison allows integration of information from thedeeper-lacustrine environment with that of the near-shore to give the fullest and mostdetailed reconstruction.
The Dead Sea level is a sensitive proxy for changes in Holocene climate that canbe used to explore the connection between environmental-hydrological conditionsand human social changes. As freshwater availability and agriculture are highlyconnected to climate, high dependency of human activities upon climatic factors isexpected, and climatic conditions were discussed in association with transformationsin settlement and demographic patterns (Migowski et al. 2006;Neumann et al. 2007a;Litt et al. 2012; Langgut et al. 2013, 2015; Roberts et al. 2019).
The deposits overlying the late Pleistocene–Holocene transition salt unit weredated roughly between 10 and 8 ka. A marginal shore ridge from the beginning of

10 R. Bookman
Fig. 1.3 The compositeHoloceneDeadSea lake-level curve reconstructed fromdeep-cut exposuresin the Ein Qedem steep shores, the Darga and David fan delta, and the Ze’elim Plain (Bookman(Ken-Tor) et al. 2004; Bartov 2004; Stern 2010; Kagan et al. 2015). The chronology is based onover 100 radiocarbon ages of organic debris. Main climatic and cultural shifts are presented belowthe curve. The southern sub-basin of the Dead Sea dries at a lake level below 402 mbsl
the Holocene marked an elevation of 380 mbsl meaning the shallow southern sub-basin was flooded, after the dramatic desiccation (Migowski et al. 2006). The earlyHolocene climate amelioration reflected in the Dead Sea highstands can be linked tothe onset of sedentary cultures, belonging to the Pre-Pottery Neolithic culture in theNear East (Bar-Yosef 2000), such as Jericho in theLower JordanRiverValley andAinGhazal in the Jordanian highlands (Migowski et al. 2006). This period representeda major transformation in prehistoric societies from small bands of mobile hunter–gatherers to large settled farming and herding villages in the Mediterranean zone(Barker and Goucher 2015).
After 9 ka the lake level dropped below the sill elevation separating the Dead Seasub-basins, which resulted in halite deposition at the southern sub-basin (Neev andEmery 1995; Charrach 2018). Evaporite crusts from on-shore exposures and a hiatusin sediment cores suggest a rapid drop of lake level ca. 8.1 ka to below 430 mbsl(Migowski et al. 2006; Stern 2010). This level drop, which lasted only a few hundredyears, was the lowest stand of the Dead Sea level during the Holocene. Within the

1 The Dead Sea and Its Deviation from Natural Conditions 11
Fig. 1.4 Sedimentary lake-level indicators. a Shore ridges that build-up as a respond to waveaction during the winter are abandoned with the level retreat (>1 m yr-1), leaving annual steps onthe lakemargins. They are composed of well-rounded, clast-supported gravels commonlywith platypebbles. The shore ridge is ~1 m high. b Holocene lacustrine sediments composed of alternatingaragonite and silt- to clay-size detrital laminae (aad facies). Laminations are less than a mm toa couple of cm thick. c An outcrop that consists of shore-ridge deposits interlayered within finelaminated lacustrine sediments in a Holocene fan-delta. The shore deposit is composed of roundedcobbles some covered with aragonite crusts, and represent deposition at the waterfront. Scale baris 0.5 m. d Symmetric ripple marks at the exposed lake floor. The ripples are covered by coarse saltcrystals that characterize the shore environment. Scale bar is 0.1 m
dating uncertainties, this lowstand correlates with the 8.2 ka cold event (Rohling andPälike 2005), the globally most extreme cooling event during the Holocene (Alleyand Ágústsdóttir 2005). The sudden cooling and simultaneous decrease in rainfallintensity was also inferred from a southeastern Mediterranean Sea pollen record(Langgut et al. 2011) and the Soreq Cave speleothem record (Bar-Matthews et al.1999). In the following two millennia the lake fluctuated around 410 mbsl and wasrestricted to the northern sub-basin.
The arid phase that began after 9 ka is synchronous with a major environmentaland societal change of the first farmer and last hunter-gatherer communities overthe entire Mediterranean area. Frequent cultural gaps as redistribution of sites andchanges in material culture are observed in the northern Mediterranean, and a socio-economic rupture is associated with a spatial redistribution of sites in the Near East

12 R. Bookman
(Berger and Guilaine 2009). In the Dead Sea area, the degeneration of the first city-like settlement of Jericho into a village during the Pre-Pottery Neolithic B (Bar-Yosef2000) was temporarily associated with the climatic shift within the dating limits.With the continuation of climatic deterioration, the Ain Ghazal population and itsactivity dropped sharply within only a few generations ca. 8 ka. This change hasbeen observed at many Neolithic sites throughout the Levant, where once thrivingPre-Pottery Neolithic B villages were abandoned and often replaced by new, butless sophisticated, settlements. Ain Ghazal stands out as it was never reoccupied,probably because it is a climatically and environmentally sensitive location at thesteppe-forest boundary close to the 250mm isohyetwhich is considered theminimumamount of precipitation required for non-irrigation farming (Simmons et al. 1988).This explanation is supported by evidence from the sites located along the JordanValley with access to freshwater even during droughts (Bar-Yosef and Kra 1995).
In theMiddle Holocene, after 6 ka, the level rose again above the sill elevation andfluctuated with large amplitudes between 370 and 415 mbsl (Migowski et al. 2006;Bartov 2004), flooding and receding from the southern sub-basin, respectively. Thisclimate amelioration peaked in theEarlyBronzeAge andwas associatedwith culturalblossoming in the entire region. This was a humid phase (Langgut et al. 2015) withan increase in settlement activity (Finkelstein and Gophna 1993; Neev and Emery1995; Amiran and Ilan 1996; Finkelstein et al. 2006) and a developed olive orchardeconomy (Neumann et al. 2007b; Langgut et al. 2013). Bitumen exploitation fromthe lake was an important driving force behind the emergence of maritime activityincluding the use of watercraft on the Dead Sea; lumps of archaeological bitumenfound in excavations of Canaan and Egypt have been geochemically linked to naturalasphalts of the Dead Sea area (Oron et al. 2015). One of them, the Early Bronze ITel Irani bitumen, has been shown to be identical to floating asphalt blocks on theDead Sea (Connan et al. 1992).
A lowstand dated between 4.4 and 4.1 ka (Kagan et al. 2015), probably cor-responds to the broader framework of the 4.2 ka event, a phase of environmentalstress characterized by severe and prolonged drought in the Levant (Kaniewski et al.2018). This dry period is consistent with the onset of sudden aridification that ledto a cultural collapse of the Akkadian civilization in Mesopotamia (Cullen et al.2000; DeMenocal 2001). In the Dead Sea region, pollen-based reconstructions alsosuggest drier climate conditions during that period (Neumann et al. 2007a; Langgutet al. 2014, 2016). This climatic shift corresponds to archaeological finds of lowsettlement activity at the end of the Intermediate Bronze Age that continued in theJudean Highlands into the Middle Bronze Age I (Ofer 1994; Finkelstein 1995). Thedry phase in the very late Intermediate Bronze Age and the Middle Bronze Age Ihad a significant impact on settlement patterns in the entire Levantine region. Duringthat time, the 400-mm rainfall isohyet, marking the boundary between the Mediter-ranean and Irano–Turanian vegetation zones, probably shifted to the north and west(Langgut et al. 2015). As a result, permanent settlements withdrew from the southernmargins of Canaan, while populations in northeastern semi-arid zones, such as theBeq’a of Lebanon and the Jezirah in Syria, shrank in size, and communities movedto “greener” parts of the Levant. Wetter climatic conditions in the Middle Bronze

1 The Dead Sea and Its Deviation from Natural Conditions 13
Age II–III caused the settlement system to recover and re-expand in the south inareas such as the Beer Sheva Valley in the northern Negev (Finkelstein and Langgut2014).
However, this re-expansion due to improved climatic conditions did not last long,and the Dead Sea level record soon points toward broader climatic deterioration.This climatic shift, reflected by a large lake-level drop of ~40 m to ~415 mbsl inless than 200 years, was dated to ca. 3.5–3.3 ka. The most pronounced evidence forthis lowstand is an anomalously thick (>1 m) beach ridge made of shore depositsand aragonite crusts in the Ze’eim outcrops (Bookman (Ken-Tor) et al. 2004; Kaganet al. 2015). Pollen records from that time, the end of the Late Bronze Age fromthe thirteenth century BCE to the end of the twelfth century BCE, show extremelysparse arboreal vegetation and evidence for the low settlement activity. This suggeststhat the shrinkage ofMediterranean forestswasmost probably not the result of humanpressure, but due to a dry spell that took place across a vast geographic area (Litt et al.2012; Langgut et al. 2015). By the end of the Bronze Age, harsh, long-term droughtshad a major effect on the sociopolitical collapse in the Eastern Mediterranean (Weiss1982; Neumann and Parpola 1987; Alpert and Neumann 1989;Ward and Joukowsky1992; Issar 1998). The crisis years are represented by destruction of urban centers,shrinkage of major sites, and an overall change in the settlement pattern. Textualevidence from several places in the ancient Near East attests to drought and faminebeginning in the mid-thirteenth century BCE and continuing until the second halfof the twelfth century BCE (Astour 1965; Na’aman 1994; Zaccagnini 1995; Singer1999, 2000).
After this major level drop, the Dead Sea never rose again to theMiddle Holocenehighstands and an increase in the aad facies is evident (Migowski et al. 2006).It has been suggested that the aragonite-laminae deposition became dominant dueto enhanced precipitation and penetration of moist air into the Judean Mountains(Waldmann et al. 2007). However, this suggestion is in conflict with the moderateDead Sea levels that did not rise above 390 mbsl in the Late Holocene (Ken-Tor(Bookman) et al. 2004).Results frommodernflashflood sampling show that aragoniteprecipitation is probably not controlled solely by the input of freshwater but alsorequires high dust fluxes that increase carbonate saturation in the lake-surface water(Belmaker et al. 2019). It appears that the Late Holocene Dead Sea recorded theLevant aridification, which is evident as a decrease in the overall water balance ofthe lake, accompanied by an increase in dust storms (Frumkin and Stein 2004).
The Late Holocene landscape is anthropogenised by increased agricultural andherd-based communities. It is also when the demographic trends appear to decouplefrom the climatic shifts given the advancements in technology and the extensivesocial networks of empires that geared the capability of local communities to dealwith environmental stress (Palmisano et al. 2019). Along the Late Holocene period,the Dead Sea level fluctuated around 400 mbsl, rising above the sill and flooding thesouthern sub-basin for short periods (Bookman (Ken-Tor) et al. 2004). Highstandsoccurred in the second and first centuries BCE and the fourth century CE during theRoman and early Byzantine periods, respectively. Although the age resolution of thereconstructed lake level is not as high as archaeological chronologies from that time,

14 R. Bookman
it is clear that the wet climate occurred during a period of cultural prosperity in theregion. These periods are characterized by an increase in population, and settlementof desert margins (Issar et al. 1992; Hirschfeld 2004; Palmisano et al. 2019). Isotopicanalysis of archaeological wood remains from the Roman siege rampart at Masadasupports the evidence for wetter climatic conditions for the region (Yakir et al. 1994),and annual rainfall in Jerusalem was calculated to be above the modern mean annualrainfall (Orland et al. 2009). The longest Dead Sea lowstand during historical timesoccurred after the Byzantine period and continued at least until the ninth centuryCE. Aridity during early Medieval times and droughts in the southern Levant andother regions, notably Anatolia, may be one of the main factors behind the graduallong-term decline of settlement on the marginal lands in the Levant following theIslamic conquest (Izdebski et al. 2016). Although proximate causes such as invasionsby the Roman Empire and altered imperial fiscal policies probably had a significantimpact as well, an economic downturn evidenced by numismatic trends was shownto coincide with palaeoclimatic evidence for drought in the fifth century CE (Fukset al. 2017).
A short-term highstand occurred in the 11th and 12th centuries CE during theCrusader period. Comprehensive archaeological evidence from this period suggestswidespread agricultural development in the region (Ellenblum 1991), which couldreflect favorable hydrologic conditions, as indicated by the reconstructed lake-levelcurve. The enhanced rainfall during this period did not directly lead to culturalflourishing, but it certainly could have reinforced and stabilized communities whichwere highly dependent on water resources and local agriculture.
The youngest highstand, which is also the last time the aad facies was depositedin the Dead Sea Basin (the upper laminated unit; Bookman (Ken-Tor) et al. 2004),lasted from the late 19th century CE to the first two decades of the 20th century. Thishighstand was instrumentally measured at 390 mbsl (Klein 1986) and marks a sig-nificant change in the annual rainfall in the region that exceeded the modern average.During this highstand the southern sub-basin was flooded for a few decades, givingthe impression for the first modern expeditions and European Jewish immigrants thatthis was the natural surface area of the lake, although the lake level was lower andthe lake restricted to the northern sub-basin during most of the historical period.
1.4 The Modern Dead Sea
1.4.1 Lake Level Records Since the Commencementof Scientific Research
Although historical references for Dead Sea levels are available from travelers’books and pilgrims’ notes, instrumental lake-level measurements began only at theend of the 19th century (Klein 1986; Fig. 1.5) with the arrival of scientific expe-ditions to the area (Goren 2002). In 1865, on behalf of the Palestine Exploration

1 The Dead Sea and Its Deviation from Natural Conditions 15
Fig. 1.5 Dead Sea level since 1850. Evidence for the natural level was recorded in historicaldocumentations describing Rujm el-Bahr, a mound of rocks that functioned as an ancient mooringsite at the northern shore of the Dead Sea in the second and first century BCE. Later, the levelwas recorded by a benchmark engraved on a rock used by the Palestine Exploration Fund in thebeginning of the twentieth century. Since the completion of the Israel National Water Carrier wateris diverted from the Sea of Galilee, resulting inmuch-reduced flows to the Dead Sea. By 1976–1977,the Dead Sea level fell to 402 mbsl, exposing the sill in the Lynch Strait and separating the lakeinto its two sub-basins. The rate of level drop that intensified after the 1980s was interrupted twiceafter the exceptionally rainy winters of 1979–1980 and 1991–1992. Sinkholes were first describedin the 1980s, however, their rate of occurrence has increased dramatically since 2000
Fund, founded that year, the absolute Dead Sea level was determined to be ~400mbsl (Klein 1961; Underhill 1967). During the latter part of that century, the levelstarted to rise after a lowstand that exposed the southern basin floor (Klein 1961,1986) as is also evident in historical maps (Fig. 1.6). By the 1880s, Rujm el-Bahr(Fig. 1.7), an ancient mooring site (Bar-Adon 1989), was disconnected from thenorthern shore, and by the 1890s, the lake level covered the site reaching ~390 mbsl.In 1900, a horizontal mark with the initials “P.E.F.” (Palestine Exploration Fund)was engraved on a rock at Ein Feshkha (also known as Einot Tzukim) marking thishighstand, which prevailed with minor fluctuations between 1896 and 1929 (Klein1982). In 1932, Degania Dam was built on the Jordan River immediately down-stream its outlet from the Sea of Galilee. Its influence on the Dead Sea level wasnegligible, and during the 1930s, the 4–5 m level drop resulted mostly from severedroughts. Between 1937 and 1954, the lake level stabilized around 395 mbsl, andstarted dropping again in the late 1950s due to several years of drought. In 1964, theIsrael National Water Carrier was completed, and water was diverted from the Sea ofGalilee, resulting in much-reduced flows to the Dead Sea. Since the late 1960s–early1970s, Jordan has diverted a large volume of flow from the second largest water

16 R. Bookman
Fig. 1.6 The southern sub-basin of the Dead Sea in a map from “Travels in Egypt and Nubia, Syriaand Asia Minor: during the years 1817 and 1818” by Irby, Charles Leonard and Mangles James.The historical map is compared with the Dead Sea bathymetry for a level at around 402 mbsl duringthe map drawing. The water depth at the strait was very shallow and a ford was connecting betweenthe western and eastern shores

1 The Dead Sea and Its Deviation from Natural Conditions 17
Fig. 1.7 The northern shore of the Dead Sea with the island of Rujm el-Bahr, ca. 1867–96 byBonfils Studio PEF Catalogue PEF-P-1898
source to the Dead Sea, the Yarmouk River (Klein 1990), withdrawing additionalwater from the Dead Sea catchment. By 1976–1977, the Dead Sea level fell to 402mbsl, exposing the sill in the Lynch Strait and separating the lake into its two sub-basins for the first time in more than a century. Since then, the Dead Sea has beenconfined to the northern sub-basin, reducing its surface area by >30%.
The level-drop rate increased with time, from 0.7 m yr−1 in the 1970–80s to1.2 m yr−1 in 2015, although the rate of evaporation was supposed to decrease bymore than 20% due to the reduction in the lake’s surface and increase in its salinity(Lensky andDente 2015). A seasonal examination of the level-drop found that duringthe summers no change in the level-drop ratewas detected. Thus, the deficit cannot beattributed to the brine pumping and evaporation by the potash industries.However, thelevel-drop rate increased during the winter months, and since no significant changewas observed in the annual precipitation, it is attributed to increase in effectiveutilization of runoff in reservoirs (Lensky and Dente 2015).
1.4.2 Limnology of a Lake with a Negative Water Balance
The 300-m-deep Dead Sea is unique in its lacustrine configuration, as all the otherknown, modern, hypersaline waterbodies are shallow continental basins or coastallagoons (Sirota et al. 2016). The Ca-chloridic nature of the saline waters in theDead Sea evolved from the relicts of the Sedom Lagoon waters and evaporites, andthe subsequent ancient lacustrine phases (Katz and Starinsky 2009). The Dead Sea

18 R. Bookman
brine is presently found within deep boreholes, in saline springs along the DeadSea shores, and in the Dead Sea itself, reaching a salinity of ~340 g l−1. Extremesalinities of up to 550 g l−1 have been measured in sinkholes along the Dead Seacoast (Zilberman-Kron 2008).
Indigenous microbial communities, adapted to the extremely harsh conditionsand unique ionic composition of the Dead Sea, have been documented since theearly surveys of the lake. These organisms live at or near the upper limit of theirtolerance (Wilkansky 1936; Elazari-Volcani 1943). Enrichment cultures and quanti-tative assessments of the microbial community densities in the Dead Sea water andsediment samples have revealed a variety of photosynthetic microorganisms, includ-ing eukaryotic flagellate algae and different types of cyanobacteria (Volcani 1944;Kaplan and Friedmann 1970). The diversity and abundance of biota is extremelypoor and dominated by the unicellular green alga Dunaliella parva, as the primaryproducer, and various species of halophilic Archaea from the Halobacteriaceae fam-ily as the main consumers, appearing only during exceptionally rainy years whenextensive rain and floods cause a significant dilution of the upper layer of the watercolumn by at least 10% (Oren 2003).
The first in-depth studies of the properties of the Dead Sea water column showedthat the lake was stratified (meromictic) and the shallow southern sub-basin wasflooded at least from the late 19th century until the 1960s. A less saline upper watermass (epilimnium) floated over a denser water mass of brine (hypolimnium; Neevand Emery 1967). In 1959, the pycnocline was at a depth of about 40 m. The averagedensity of the surface layer was 1.205 g cm−3, compared with an in-situ density of1.233 g cm−3 in the bottom layer. The long-term stability of the water column weak-ened with the drop in lake level, and successive deepening of the pycnocline from70 m to beyond 200 m was recorded between 1975 and 1978. Complete overturnwas observed during the winter of 1978–1979 (Steinhorn et al. 1979), and the lowerwater mass was estimated to have been disconnected from the atmosphere for about300 years (Stiller and Chung 1984). This decline was accompanied by shrinkage ofthe shallow southern basin, which was finally disconnected in 1976. The completeoverturn resulted in homogenization and oxidation of the entire water column (Stein-horn and Gat 1983). The Dead Sea waters were also continuously pumped by theDead Sea Potash Works into the southern sub-basin that serves as evaporation pondsabove the declining level until today (Fig. 1.1). The highly concentrated industrialend-brines, spilled back into the northern sub-basin, added to the gradual increase inthe density of the mixolimnion that resulted in the end of the stratified water-columnperiod (Gavrieli and Oren 2004). Currently, a thin upper layer with relatively lowsalinity develops in the winter and is separated by a halocline from an anaerobichypolimnion. However, at least once a year, the density of the upper layer equalsthat of the deep water, causing destruction of the stratification by vertical mixing(Anati and Stiller 1991). As a result, the deep layers of the lake become exposed tothe atmosphere and change from anaerobic to aerobic.
The holomictic state has been interrupted twice since the overturn, after the excep-tionally rainy winters of 1979–1980 and 1991–1992. The runoff inflows led to dilu-tion of the surface water and development of a stabilized halocline that maintained

1 The Dead Sea and Its Deviation from Natural Conditions 19
the stratification for 3–4 years (Anati and Stiller 1991). These events, and in par-ticular, the anomalous winter that followed the volcanic eruption of Mt Pinatubo in1991 (Bookman et al. 2014), served as a modern analogue for discussing the DeadSea Basin limnological system during the last glacial highstands. Thermodynamiccalculations based on the changes in the carbonate system in the surface-mixed-layerduring this anomalouswinter showed that 10%Dead Sea brinewith a highCa contentmixed with 90% freshwater runoff with high bicarbonate content triggered aragonitedeposition (Barkan et al. 2001).
The modern thermohaline stratification of the Dead Sea results in seasonal anddepth variations in the chemistry of the water column. Monthly observations of thethermohaline epilimnion and hypolimnion evolution along with the anthropogeniclevel drop have shown that during the winter, the water column cools to a uniformtemperature of ~23 °C, andwith the onset of summer, the epilimnionwarms, reachinga maximum temperature of ~35 °C in August. The salinity peak of the epilimnionlags a few weeks behind its temperature maximum and then declines toward fall andwinter (Sirota et al. 2016). This seasonal variation controls the characteristics of halitedeposition (Sirota et al. 2017). During summer, the epilimnion is undersaturated andhalite is dissolved due to the high temperature, whereas the entire water column issupersaturated and crystallizes halite during winter. Although the variations in thewater balance suggest the opposite since summer is associated with a higher lossof water by evaporation from the lake compared to the winter, the thermal effectovercomes the hydrological balance effect and thus governs the seasonal saturationcycle. In addition, precipitation of halite on the hypolimnetic lake floor at the expenseof dissolution of halite from the epilimnetic floor, results in lateral focusing andthickening of halite deposits in the deeper part of the basin (Sirota et al. 2018).
1.4.3 Responses to the Anthropogenic Level Drop
Following the level drop and shrinkage of theDead Sea surface area, a rapidwideningof the lake margin occurred, particularly on the western coasts (Fig. 1.2). Coastalflats composed of coarse sediments developed at the proximal parts of the alluvialfans, and fine-grained muds at their distal parts, in places reaching up to 3 km fromthe coast of the last natural highstand at the beginning of the last century. On theseflats, beach ridges that accumulated in response to wave action during the winter(Bartov 2004) are deserted annually, leaving steps that follow the dropping lakelevel (Fig. 1.4). The newly exposed areas that were the lake floor just a few decadesago are prone to erosion processes. Gullies begin to develop as soon as the previouslake floor is exposed (Fig. 1.2), particularly after exposure of the distal parts of thealluvial fans that are characterized by steep slopes (Filin et al. 2014).
The level drop forced the fluvial system to adjust. Decades of water diversionreduced the flows of the Jordan River to the Dead Sea, while the base level continueddropping. The greatest changes in the channel width near the mouth of the JordanRiver were recorded between 1930 and 1980 as the base-level drop was relatively
20 R. Bookman
slow (Hassan and Klein 2002). However, after the 1980s, the increase in level dropresulted in upstream incision, bank collapses and a decline in channel width. Near therivermouth, largefloods exert high shear stresswithin the confined channel increasingsinuosity (Dente et al. 2019). Channels draining across the western escarpment alsopresent intensive incisionwithmean vertical entrenchment rates of 0.4–0.8my−1 andmuch higher widening rates of 2.1–24 m y−1 (Bowman et al. 2010). The measuredandmodeled annual sediment yield in these alluvial channels in response to the rapid,ongoing base-level drop has been estimated between 4.5 and 152 tons y−1 km−2, alsodepending on the streamwatershed characteristics and rainfall regime (Laronne et al.2003; Ben Moshe et al. 2008).
As a result of the Dead Sea coastline withdrawal, the shallow groundwater systemwas altered, and spring migration was detected. In the Ein Feshkha spring system(Fig. 1.1), the largest on the western Dead Sea coast, the level drop resulted indrying and migration of spring seepages, development of gullies that drain the springoutflows and incise the exposedmud flats, and an enlargement of thewet, swamp-likezone (Fig. 1.2). Although the overall water balance of the lake is negative, the springsystem maintained the groundwater discharge volume during the last century (Galili2011), with only a slight change of mostly climate-induced variability (Burg et al.2016). The hydrological and morphological changes also altered the aquatic habitatsin Ein Feshkha and threaten its ecological systems and inhabitants, such as the fishAphafnius richarsoni, which is endemic to the Dead Sea (Goren and Ortal 1999). Anintegrated intervention, using artificial habitat development, ensured the preservationof these unique fish communities that thrived in the spring system. This interventionwas an unusual action; but it was needed due to the deviation in natural conditionsresulting from the high rate of level drop (Millstein et al. 2017).
The most pronounced geomorphic response of the Dead Sea level retreat is thedevelopment of thousands of collapse sinkholes (Yechieli et al. 2006). The sinkholesdeveloped along a narrow strip of severalmeters to over one kmwidth along the coastsand result from dissolution of a thick salt layer buried below the surface (Abelsonet al. 2003, 2006; Yechieli et al. 2003; Shalev et al. 2006; Ezersky 2008; Frumkinet al. 2011). This evaporite unit comprises salt that was deposited at the transition ofthe last glacial to the Holocene, during a dry spell dated to 11–10 ka (Yechieli et al.1993; Stein et al. 2010). The elevation of the unit top in the subsurface varies between415 and 443 mbsl and it probably remained submerged below the lake water duringits deposition. During the Holocene, the adjacent shallow groundwater system wassufficiently saline to inhibit salt dissolution, and as the salt unit was covered by theHolocene sediment sequence it was not exposed to freshwater runoff prior to themodern level drop. The sinkholes started to appear in the 1980s (Frumkin and Raz2001). However their rate of occurrence has increased dramatically since 2000 withthe Dead Sea level-drop-rate increase (Abelson et al. 2017).
Seaward migration of the Dead Sea shoreline also drives subsurface brine migra-tion. Topography-driven fresh groundwater that flows from the surrounding high-lands (Stanislavsky and Gvirtzman 1999) penetrates the coastal shallow aquifer andreplaces the retreating brine. Fault lines that ruptured the underlying silt and clayaquitard serve as conduits for the unsaturated groundwater, enabling access across

1 The Dead Sea and Its Deviation from Natural Conditions 21
the aquiclude layers (Abelson et al. 2003, 2006; Closson and Karaki 2009) that dis-solve the salt layer that was previously immersed in theDead Sea brine (Yechieli et al.2006). The development of sinkholes is further enhanced in tributaries of alluvialfans, after flash-flood waters drain into existing sinkholes and enhance sub-surfacesalt dissolution (Shviro 2015; Avni et al. 2016).
Since the sinkhole phenomenon has hazardous consequences for the local indus-trial and tourist infrastructure, and for agriculture and daily human life (Fig. 1.8), ithas been monitored intensively (Nof et al. 2013). The collapse of a sinkhole is oftenassociated with gradual land subsidence that can precede the collapse by periodsthat range from days to a few years. Recently, systematic interferometric syntheticaperture radar observations, combined with detailed light detection and rangingmea-surements, are being used to sense minute precursory subsidence and alert beforethe catastrophic collapse (Nof et al. 2019). In addition, seismic monitoring by bore-hole geophones, which has been used to identify subsurface instabilities precedingsinkhole collapse, has shown that the hypocenter depths range from the base of thesalt layer upwards. Mapping of the plan-view distribution provides evidence for thepropagation of the salt-unit-front dissolution in the subsurface even in areas whereno land subsidence was detected (Abelson et al. 2018). Examination of sinkholeevolution along the western shore of the Dead Sea in recent decades has revealedthat although themain trigger for their development is the human-induced level drop,natural variations of precipitation in the recharge-source region, the Judean Moun-tains, ~25 km to the west, dominate their evolution rate with a lag period of 5–6 years(Abelson et al. 2017).
Fig. 1.8 Recent sinkhole development at Mineral Beach, a touristic site on the western shore ofthe Dead Sea. Picture by Rotem Shachal

22 R. Bookman
1.4.4 The Dead Sea Water Projects — A Future Perspective
Geopolitical issues, scarcewater resources, and the JordanValley Rift topography setthe background for a variety of projects that have been suggested to connect the DeadSea with the Mediterranean and Red seas for human uses. The incentives changedduring the last 150 years from the unrealistic proposal to dig a navigable waterwaythat connects the Red Sea and the Mediterranean Sea (Vardi 1990; Al-Rubaiy 2000),to suggestions for the use of the topographic differences to generate an alternativehydroelectric energy source (Beyth 2007).
In the early 20th century, the Zionist movement advanced the Dead Sea Canalproject. Various proposals were presented including the proposal for hydroelectricuse by Theodore Herzl, first president of the World Zionist Organization (Powell2005). Walter Clay Lowdermilk, an American soil conservation expert, outlineda vision for the economic rejuvenation of Palestine after a visit in the region in1939. His proposal primarily concentrated on developing the Jordan River Valleyand diverting the upper Jordan water to irrigate the Jezreel Valley, the coastal plainand the northern Negev, together with diversion of the Yarmouk and other tributariesinto valley-side canals to facilitate irrigation of the surrounding areas. Mediterraneanwater would then be led by a tunnel and canal system from the vicinity of Haifa tohydroelectricity stations at the eastern edge of the valley, and then south to maintainthe levels of the Dead Sea for its loss of the freshwater diverted from the Jordan River(Miller 2003). The outline became known as the “Lowdermilk plan” and althoughit was not implemented, the vision held importance for the later development of theNational Water Carrier of Israel that was established in 1964.
The 1970s energy crisis revived the idea of the canal for generating hydroelectricpower using the topographic gradient between the Mediterranean Sea and the DeadSea, and led the Israeli government to establish the Mediterranean–Dead Sea Com-pany Ltd. However, the project failed since Jordan, which did not have any formalrelations with Israel at that time, filed complaints to the U.N. (Rauschning et al.1997). It was recognized that the construction of the canal that will introduce seawater to the Dead Sea would violate the principals of international law and causedirect, irreparable damage to Jordanian potash production.
Following the Israel–Jordan peace treaty in 1994, both sides agreed to cooperatein activities related to the Dead Sea environment. This agreement together with aninterim agreement between the Palestinians and Israelis lead to a pre-feasibility studyon integrated development in the Jordan Rift Valley, which considered the Red Sea–Dead Sea Canal as the prominent alternative (Harza JRVGroup 1996) and turned themain focus from energy production to desalination and halting of the chronic DeadSea level drop (Beyth 2007). Negotiations between the three parties finally led to anagreement in 2005 on the terms of reference for conducting a feasibility study onone particular route of the proposed Red Sea–Dead Sea Canal (Fischhendler et al.2015).
Despite the bureaucratic hurdles, financing difficulties, and intensive environmen-talists’ objections, as well as diplomatic tensions between the countries, this project

1 The Dead Sea and Its Deviation from Natural Conditions 23
is considered to be a comprehensive solution for stabilizing the Dead Sea level andproducing desalinated water (Hussein 2017). The proposal calls for a transfer of upto 2000 million cubic meters of seawater a year from the Red Sea through the AravaValley to the Dead Sea (Husein and Tsur 2016). The project would incorporate ahydroelectric power plant exploiting the elevation difference of 425 m between theRed and Dead seas, and a desalination plant with an output capacity of up to 800 mil-lion cubic meters a year. Jordan, the Palestinian Authority, and Israel, together withthe World Bank, which guides the project, drafted terms of reference for a feasibilitystudy and an environmental evaluation to assess whether the project was feasible anddetermine the environmental implications (Markel et al. 2013).
The expected physical, chemical and biological changes in the Dead Sea withdifferent inflow volumes and brine concentrations (seawater and rejected brine fromdesalination) were delineated in a report submitted to theWorld Bank (Gavrieli et al.2011). A main conclusion of the study program was that inflow of over 400 millioncubic meters is needed to stabilize and raise the Dead Sea level and that over 1500million cubic meters will result in flooding of the evaporation ponds in the southernsub-basin (Fig. 1.9). Meromictic conditions that will develop in the event of highinflow volumes have the potential to affect groundwater flow patterns adjacent to theimpending stratified lake. Numerical simulations showed that intrusion of Dead Seawaters into the freshwater aquifer are possible if a thick mixolimnion (>30 m) witha relatively large density difference between the Dead Sea and regional groundwaterdevelops (Oz et al. 2011). The diluted water may flow into the aquifer, dissolvethe subsurface salt unit and increase sinkhole formation. Groundwater dischargemay temporarily decrease due to a rise in lake level and landward migration of theshore before reaching a new controlled surface-lake elevation (Gavrieli et al. 2011)(Fig. 1.9).
Stratification can also affect biological blooming of the unicellular green algaDunaliella and halophilic Archaea (Oren 2003). Mesocosm simulations showed thatdevelopment of Dunaliella was possible only when Dead Sea water (340 g l−1 totaldissolved salts) was diluted with a minimum of 10% of Red Sea water (40 g l−1
total dissolved salts). However, the availability of PO43− is essential for the algae to
grow, and growth rates and yields increased with increasing phosphate concentrationand decreasing salinity. Field simulation showed that the development of algae wasrapidly followed by development of dense blooms of red halophilic Archaea, whichremained high for over two years in some scenarios, raising the concern that thebiological properties may have important environmental implications for the lake(Oren et al. 2009).
An additional environmental concern related to the seawater or rejected brineinflow and stratification is massive nucleation and growth of gypsum crystals due tomixing of the SO4
2−—rich Red Sea water and Ca2+—rich Dead Sea brine (Rezniket al. 2009a). Mixing of Dead Sea and Red Sea waters resulted in precipitationof minute gypsum crystals that could lead to “whitening” of the surface waters ofthe Dead Sea (Reznik et al. 2009b). Gypsum precipitation may also remove essen-tial nutrients, which will be no longer available for biological interactions and thusprevent algae blooms (Gavrieli et al. 2011).

24 R. Bookman
Fig. 1.9 Schematic illustration presenting the expected physical, chemical and biological changesin the Dead Sea with different inflow volumes and brine concentrations of seawater (SW) andrejected brine (RB) from desalination (Modified from Gavrieli et al. 2011)
Alternatives to the Red Sea–Dead Sea Water Conveyance have also been sug-gested, such as the Mediterranean Sea–Dead Sea southern and northern gravity tun-nels, although the economic costs and risks are larger than for the Red Sea–Dead Seaproject (Allan et al. 2014). Transfer of desalinated Mediterranean Sea water throughthe Jordan Valley for the restoration of the Jordan River flow was rejected (Markel2017), however inflow of treated wastewater into the Jordan River from the widerregion around the Jordan Valley was suggested within a regional NGO master planfor the year of 2050 (EcoPeace 2015). A “No Action Alternative” was also discussed(et Bellier 2014) and it was concluded that this scenario involves substantial, adversechanges to the Dead Sea and its surrounding environment. Under this alternative, thechemical industries would also eventually close and the Dead Sea would stabilize.
The future of the Dead Sea under a negative water balance and present climaticconditions was also studied by examining the extremely hypersaline brines in sink-holes along the western coast and in evaporation experiments. It was concluded that

1 The Dead Sea and Its Deviation from Natural Conditions 25
the level dropmay continue down to 516–537mbsl, corresponding to a water activityrange of 0.46–0.39 in its brine, in equilibrium with the overlying median air humid-ity. This suggests that the lake level will drop more than 100 m from its present levelin about 400 yrs before a new equilibrium is likely to be reached. The increase insalinity and the associated decrease in water activity will decrease the rate of evapo-ration (Yechieli et al. 1998; Zilberman et al. 2017). Even though, the Dead Sea willstill be relatively deep (~200 m) and its surface area will not change dramatically asmost of its previous shallow lake floor is already exposed. However, the topographicgradient will probably enhance marginal erosional processes that can compete withthe tectonic subsidence and eventually can fill the basin with sediments.
Acknowledgements The writing of this paper was made possible through the support of the IsraelScience Fund grant (ISF, Grant # 1093/10) to R. Bookman.
References
Abelson M, Yechieli Y, Baer G, Lapid G, Behar N, Calvo R, Rosensaft M (2017) Natural versushuman control on subsurface salt dissolution and development of thousands of sinkholes alongthe Dead Sea coast. J Geophys Res-Earth 122(6):1262–1277
Abelson M, Aksinenko T, Kurzon I, Pinsky V, Baer G, Nof R, Yechieli Y (2018) Nanoseismicityforecasts sinkhole collapse in the Dead Sea coast years in advance. Geology 46(1):83–86
Abelson M, Yechieli Y, Crouvi O, Baer G, Wachs D, Bein A, Shtivelman V (2006) Evolution ofthe Dead Sea sinkholes. Geol S Am Spec Pap 401:241–254
Abelson M, Baer G, Shtivelman V, Wachs D, Raz E, Crouvi O, Kurzon I, Yechieli Y (2003)Collapse-sinkholes and radar interferometry reveal neotectonics concealed within the Dead SeaBasin. Geophys Res Lett 30(10) https://doi.org/10.1029/2003gl017103
Alley RB, Ágústsdóttir AM (2005) The 8k event: cause and consequences of a major Holoceneabrupt climate change. Quat Sci Rev 24(10–11):1123–1149
Allan JA, Malkawi AH, Tsur Y (2014) Red Sea–Dead Sea water conveyance study program, studyof alternatives. Final Report Executive Summary and Main Report. The World Bank, 186pp
Alpert P, Neumann J (1989) An ancient “correlation” between streamflow and distant rainfall in theNear East. J Near Eastern Stud 48:313–314
Al-Rubaiy S (2000)Water security, and the concept of sovereignty and peace in Jordan River ValleyStates. Dar al Hasad, Damascus, Syria
Amiran R, Ilan O (1996) Early Arad II. The chalcolithic and Early Bronze IB settlements and theEarly Bronze II city—architecture and town planning. Israel Museum and Israel ExplorationSociety, Jerusalem
Anati DA, Stiller M (1991) The post-1979 thermohaline structure of the Dead Sea and the role ofdouble-diffusive mixing. Limnol Oceanogr 36(2):342–353
Astour MC (1965) New evidence on the last days of Ugarit. Am J Archaeol 69(3):253–258Avni Y, Lensky N, Dente E, Shviro M, Arav R, Gavrieli I, Yechieli Y, Abelson M, Lutzky H, FilinS, Haviv I (2016) Self-accelerated development of salt karst during flash floods along the DeadSea Coast, Israel. J Geophys Res-Earth 121(1):17–38
Bar-Adon P (1989) Excavations in the Judean Desert. In: Zusman A, Straws D (eds) Antiquities.Israel Antiquities Authority, Jerusalem (in Hebrew)
Barker G, Goucher C (2015) The Cambridge world history Volume II: a world with agriculture,12,000 BCE–500 CE. Cambridge University Press, Cambridge

26 R. Bookman
Bar-Matthews M, Ayalon A, Kaufman A, Wasserburg GJ (1999) The Eastern Mediterraneanpaleoclimate as a reflection of regional events: Soreq cave, Israel. Earth Planet Sci Lett166(1–2):85–95
Barkan E, Luz B, Lazar B (2001) Dynamics of the carbon dioxide system in the Dead Sea. GeochimCosmochim Ac 65(3):355–368
Bartov Y (2004) Sedimentary fill analysis of a continental basin - the Late Pleistocene Dead Sea.Ph.D. thesis, Hebrew University of Jerusalem, Israel (in Hebrew with English abstract)
Bartov Y, Goldstein SL, Stein M, Enzel Y (2003) Catastrophic arid episodes in the EasternMediterranean linked with the North Atlantic Heinrich events. Geology 31(5):439–442
Bartov Y, Bookman R, Enzel Y (2006) Current depositional environments at the Dead Sea marginsas indicators of past lake levels. Geol S Am Spec Pap 401:127–140
Bar-Yosef O (2000) The impact of radiocarbon dating on old world archaeology: past achievementsand future expectations. Radiocarbon 42(1):23–39
Bar-Yosef O, Kra RS (eds) (1995) Late Quaternary chronology and paleoclimates of the EasternMediterranean. University of Arizona, Tucson
Belmaker R, Lazar B, Beer J, Christl M, Tepelyakov N, Stein M (2013) 10Be dating of Neogenehalite. Geochim Cosmochim Ac 122:418–429
Belmaker R, Lazar B, Stein M, Taha N, Bookman R (2019) Constraints on aragonite precipitationin the Dead Sea from geochemical measurements of flood plumes. Quat Sci Rev 221:105876
Ben Moshe LB, Haviv I, Enzel Y, Zilberman E, Matmon A (2008) Incision of alluvial channels inresponse to a continuous base level fall: field characterization, modeling, and validation alongthe Dead Sea. Geomorphology 93(3–4):524–536
Ben-Avraham Z, Lazar M (2006) The structure and development of the Dead Sea Basin: recentstudies. Geol S Am Spec Pap 401:1–13
Ben-Avraham Z, Lazar M, Schattner U, Marco S (2005) The Dead Sea fault and its effect oncivilization. In: Wenzel F (ed) Perspectives in modern seismology. Springer, Heidelberg
Berger JF, Guilaine J (2009) The 8200 cal BP abrupt environmental change and the Neolithictransition: a Mediterranean perspective. Quat Int 200(1–2):31–49
Begin ZB, Erlich A, Nathan I (1974) Lisan lake, the representative of the Pleistocene age in thedead sea. Geol Surv Isr Bull 63:1–30
Beyth M (2007) The Red Sea and the Mediterranean-Dead Sea canal project. Desalination 214(1–3):365–371
Bookman (Ken-Tor) R, Enzel Y, Agnon A, Stein M (2004) Late Holocene lake levels of the DeadSea. Geol Soc Am Bull 116(5–6):555–571
Bookman R, Bartov Y, Enzel Y, Stein M (2006) Quaternary lake levels in the Dead Sea Basin: twocenturies of research. Geol Soc Am Spec Pap 401:155–170
Bookman R, Filin S, Avni Y, Rosenfeld D, Marco S (2014) Possible connection between largevolcanic eruptions and level rise episodes in the Dead Sea Basin. Quat Sci Rev 89:123–128
Bowman D, Svoray T, Devora S, Shapira I, Laronne JB (2010) Extreme rates of channel incisionand shape evolution in response to a continuous, rapid base-level fall, the Dead Sea, Israel.Geomorphology 114(3):227–237
Burg A, Yechieli Y, Galili U (2016) Response of a coastal hydrogeological system to a rapid declinein sea level; the case of Zuqim springs–the largest discharge area along the Dead Sea coast. JHydrol 536:222–235
Charrach J (2018) Investigations into the Holocene geology of the Dead Sea Basin. CarbonateEvaporite 34:1415–1442
ClossonD,KarakiNA (2009)Human-induced geological hazards along theDeadSea coast. EnvironGeol 58(2):371–380
Connan J, Nissenbaum A, Dessort D (1992) Molecular archaeology: export of Dead Sea asphaltto Canaan and Egypt in the Chalcolithic-Early Bronze Age (4th-3rd millennium BC). GeochimCosmochim Ac 56(7):2743–2759

1 The Dead Sea and Its Deviation from Natural Conditions 27
Cullen HM, deMenocal PB, Hemming S, Hemming G, Brown FH, Guilderson T, Sirocko F (2000)Climate change and the collapse of the Akkadian empire: evidence from the Deep Sea. Geology28(4):379–382
DeMenocal PB (2001) Cultural responses to climate change during the late Holocene. Science292(5517):667–673
Dente E, Lensky NG, Morin E, Dunne T, Enzel Y (2019) Sinuosity evolution along an incisingchannel: new insights from the Jordan River response to the Dead Sea level fall. Earth Surf ProcLandforms 44(3):781–795
EcoPeace (2015) Regional NGO master plan for sustainable development in the Jordan valley,181pp
Elazari-Volcani B (1943) Bacteria in the bottom sediments of the Dead Sea. Nature 152(3853):274EllenblumR (1991) Frankish rural settlement in crusader Palestine. Ph.D. thesis, HebrewUniversityof Jerusalem, Israel (in Hebrew)
Enzel Y, Bookman R, Sharon D, Gvirtzman H, Dayan U, Ziv B, Stein M (2003) Late Holoceneclimates of the Near East deduced from Dead Sea level variations and modern regional winterrainfall. Quat Res 60(3):263–273
et Bellier C (2014) Red Sea–Dead Sea water conveyance study program, feasibility study. FinalFeasibility Study Report - Summary of Final FS Report. Accessed 14 Jan 2015
Ezersky M (2008) Geoelectric structure of the Ein Gedi sinkhole occurrence site at the Dead Seashore in Israel. J Appl Geophys 64(3–4):56–69
Filin S, Avni Y, Baruch A, Morik S, Arav R, Marco S (2014) Characterization of land degrada-tion along the receding Dead Sea coastal zone using airborne laser scanning. Geomorphology206:403–420
Finkelstein I (1995) The great transformation: the “conquest” of the highlands frontiers and the riseof the territorial states. In: Levy TE (ed) The Archaeology of society in the Holy Land. LeicesterUniversity Press, London
Finkelstein I, Halpern B, Lehmann G, Niemann HM (2006) The Megiddo hinterland project. In:Finkelstein I, Ussishkin D, Halpern B (eds) Megiddo IV: the 1998–2002 seasons. Institute ofArchaeology, Tel Aviv, pp 1998–2002
Finkelstein I, Gophna R (1993) Settlement, demographic, and economic patterns in the highlandsof Palestine in the Chalcolithic and Early Bronze periods and the beginning of urbanism. B AmSch Orient Res 289:1–22
Finkelstein I, Langgut D (2014) Dry climate in the middle Bronze I and its impact on settlementpatterns in the Levant and beyond: new pollen evidence. J Near Eastern Stud 73(2):219–234
Fischhendler I, Cohen-Blankshtain G, Shuali Y, Boykoff M (2015) Communicating mega-projectsin the face of uncertainties: Israeli mass media treatment of the Dead Sea Water Canal. PublicUnderst Sci 24(7):794–810
Frumkin A, Stein M (2004) The Sahara–East Mediterranean dust and climate connection revealedby strontium and uranium isotopes in a Jerusalem speleothem. Earth Planet Sci Lett 217(3–4):451–464
Frumkin A, Ezersky M, Al-Zoubi A, Akkawi E, Abueladas AR (2011) The Dead Sea sinkholehazard: geophysical assessment of salt dissolution and collapse. Geomorphology 134(1–2):102–117
Frumkin A, Raz E (2001) Collapse and subsidence associated with salt karstification along the DeadSea. Carbonate Evaporite 16(2):117–130
Fuks D, Ackermann O, Ayalon A, Bar-Matthews M, Bar-Oz G, Levi Y, Maeir AM, Weiss E,ZilbermanT, Safrai Z (2017)Dust clouds, climate change and coins: consiliences of palaeoclimateand economy in the Late Antique southern Levant. Levant 49(2):205–223
Galili E (2011) Summary of hydrometric measurements in Einot Zukim, 2003–2011. Hydro Report:1/2012, Gilat, Israel
Garfunkel Z (1981) Internal structure of the Dead Sea leaky transform (rift) in relation to platekinematics. Tectonophysics 80(1–4):81–108
28 R. Bookman
Garfunkel Z, Ben-Avraham Z (1996) The structure of the Dead Sea Basin. Tectonophysics 266(1–4):155–176
Garfunkel Z, Horowitz A (1966) The upper Tertiary and Quaternary morphology of the Negev,Israel. Isr J Earth Sci 15(3):101–117
Gavrieli I, Lensky N, Abelson M, Ganor J, Oren A, Brenner S, Lensky I, Shalev E, Yechieli Y,Dvorkin Y, Gertman I, Wells S, Simon E, Rosentraub Z, Reznik I (2011) Dead Sea study. FinalReport, August 2011. Isr Geol Surv Rep. GSI/10/2011. Tel Aviv: TAHAL, Il-201280-R11-218(Red Sea - Dead Sea Water Conveyance Study Program)
Gavrieli I, Oren A (2004) The Dead Sea as a dying lake. In: Nihoul JCJ, Zavialov PO, Micklin PP(eds) Dying and Dead Seas: climatic versus anthropogenic causes. Springer, New York
Goren-Inbar N, Feibel CS, Verosub KL, Melamed Y, Kislev ME, Tchernov E, Saragusti I (2000)Pleistocene milestones on the out-of-Africa corridor at Gesher Benot Ya’aqov, Israel. Science289(5481):944–947
Goren H (2002) Sacred, but not surveyed: nineteenth-century surveys of Palestine. Imago Mundi54(1):87–110
Goren M, Ortal R (1999) Biogeography, diversity and conservation of the inland water fishcommunities in Israel. Biol Conserv 89(1):1–9
Greenbaum N, Ben-Zvi A, Haviv I, Enzel Y (2006) The hydrology and paleohydrology of the DeadSea tributaries. Geol Soc Am Spec Pap 401:63–93
Haase-Schramm A, Goldstein SL, Stein M (2004) U-Th dating of Lake Lisan (late PleistoceneDead Sea) aragonite and implications for glacial East Mediterranean climate change. GeochimCosmochim Ac 68(5):985–1005
Haliva-Cohen A, Stein M, Goldstein SL, Sandler A, Starinsky A (2012) Sources and transportroutes of fine detritus material to the Late Quaternary Dead Sea Basin. Quat Sci Rev 50:55–70
Hall JK (1996) Digital topography and bathymetry of the area of the Dead Sea depression.Tectonophysics 266(1–4):177–185
Hassan MA, Klein M (2002) Fluvial adjustment of the Lower Jordan River to a drop in the DeadSea level. Geomorphology 45(1–2):21–33
Harza JRV Group (1996) Red Sea–Dead Sea Canal Project: draft prefeasibility report. Jordan RiftValley Integrated Development Study
Hazan N, Stein M, Agnon A, Marco S, Nadel D, Negendank JFW, Schwab MJ, Neev D (2005)The late Quaternary limnological history of Lake Kinneret (Sea of Galilee), Israel. Quat Res63(1):60–77
HeimC,NowaczykNR,Negendank JF, Leroy SA,Ben-AvrahamZ (1997)Near East desertification:evidence from the Dead Sea. Naturwissenschaften 84(9):398–401
Hirschfeld Y (2006) The archaeology of the Dead Sea valley in the Late Hellenistic and EarlyRoman periods. Geol S Am Spec Pap 401:215–229
HirschfeldY (2004)Aclimatic change in the earlyByzantine period?Somearchaeological evidence.Palest Explor Q 136(2):133–149
Hussein H (2017) Politics of the Dead Sea Canal: a historical review of the evolving discourses,interests, and plans. Water Int 42(5):527–542
Issar AS, Govrin Y, Geyh MA, Wakshal E, Wolf M (1992) Climate changes during the UpperHolocene in Israel. Isr J Earth Sci 40:219–223
Issar A (1998) Climate change and history during the Holocene in the easternMediterranean region.In: Issar A, Brown N (eds) Water, environment and society in times of climate change. KluwerAcademic, Dordrecht, pp 113-128
Izdebski A, Pickett J, Roberts N, Waliszewski T (2016) The environmental, archaeological andhistorical evidence for regional climatic changes and their societal impacts in the EasternMediterranean in Late Antiquity. Quat Sc Rev 136:189–208
Kadan G (1997) Evidence for Dead Sea Lake-level fluctuations and recent tectonism from theHolocene Fan-Delta of Nahal Darga, Israel. M.Sc. thesis, Ben Gurion University of the Negev,Israel (in Hebrew with English abstract)

1 The Dead Sea and Its Deviation from Natural Conditions 29
Kagan EJ, Langgut D, Boaretto E, Neumann FH, SteinM (2015) Dead Sea levels during the Bronzeand Iron ages. Radiocarbon 57(2):237–252
Kaniewski D, Marriner N, Cheddadi R, Guiot J, Van Campo E (2018) The 4.2 ka BP event in theLevant. Clim Past 14(10):1529–1542
Kaplan IR, Friedmann A (1970) Biological productivity in the Dead Sea Part I. Microorganisms inthe water column. Isr J Chem 8(3):513–528
KatzA, StarinskyA (2009)Geochemical history of theDeadSea.AquatGeochem15(1–2):159–194Kiro Y, Weinstein Y, Starinsky A, Yechieli Y (2014) The extent of seawater circulation in theaquifer and its role in elemental mass balances: a lesson from the Dead Sea. Earth Planet Sci Lett394:146–158
Klein C (1961) On the fluctuations of the level of the Dead Sea since the beginning of the 19thcentury. Hydrological Service, Jerusalem, Hydrological Paper 7, revised edition
Klein C (1986) Fluctuations of the level of the Dead Sea and climatic fluctuations in Israel duringhistorical times. Ph.D. thesis, Hebrew University of Jerusalem, Israel (in Hebrew with Englishabstract)
Klein C (1982) Morphological evidence of lake level changes, western shore of the Dead-Sea. IsrJ Earth Sci 31(2–4):67–94
Klein M (1990) Dead Sea level changes. Isr J Earth Sci 39:49–50Langgut D, Almogi-Labin A, Bar-Matthews M, Weinstein-Evron M (2011) Vegetation and climatechanges in the South Eastern Mediterranean during the Last Glacial-Interglacial cycle (86 ka):new marine pollen record. Quat Sci Rev 30(27–28):3960–3972
Langgut D, Finkelstein I, Litt T (2013) Climate and the Late Bronze Collapse: new evidence fromthe Southern Levant. J Inst Archaeol Tel Aviv 40(2):149–175
Langgut D, Neumann FH, SteinM,Wagner A, Kagan EJ, Boaretto E, Finkelstein I (2014) Dead Seapollen record and history of human activity in the JudeanHighlands (Israel) from the IntermediateBronze into the Iron Ages (~2500–500 BCE). Palynol 38(2):280–302
Langgut D, Adams MJ, Finkelstein I (2016) Climate, settlement patterns and olive horticulture inthe southern Levant during the Early Bronze and Intermediate Bronze Ages (c. 3600–1950 BC).Levant 48(2):117–134
Langgut D, Finkelstein I, Litt T, Neumann FH, Stein M (2015) Vegetation and climate changesduring the Bronze and IronAges (~3600–600BCE) in the southern Levant based on palynologicalrecords. Radiocarbon 57(2):217–235
Laronne J, Lekach J, Cohen H, Alexandrov Y (2003) Experimental drainage basins in Israel: rain-fall, runoff, suspended sediment and bedload monitoring. Proceedings of the First InteragencyConference on Research in the Watersheds, October 2003, Benson, Arizona
Lensky NG, Dente E (2015) The hydrological processes driving the accelerated Dead Sea leveldecline in the past decades. Geol Surv Isr Rep, GSI/16/2015, Jerusalem
Levy EJ, Yechieli Y, Gavrieli I, Lazar B, Kiro Y, Stein M, Sivan O (2018) Salt precipitation anddissolution in the late Quaternary Dead Sea: evidence from chemical and δ37Cl composition ofpore fluids and halites. Earth Planet Sci Lett 487:127–137
Litt T, Ohlwein C, Neumann FH, Hense A, Stein M (2012) Holocene climate variability in theLevant from the Dead Sea pollen record. Quat Sci Rev 49:95–105
López-MerinoL, LeroySA,EshelA, EpshteinV,BelmakerR,BookmanR (2016)Using palynologyto re-assess the Dead Sea laminated sediments – indeed varves? Quat Sci Rev 140:49–66
Lu Y, Waldmann N, Nadel D, Marco S (2017) Increased sedimentation following the NeolithicRevolution in the Southern Levant. Glob Planet Change 152:199–208
Lu Y, Bookman R, Waldmann N, Marco S (2020) A 45 kyr laminae record from the Dead Sea:Implications for basin erosion and floods recurrence. Quat Sci Rev 229:106143
Machlus M, Enzel Y, Goldstein SL, Marco S, Stein M (2000) Reconstructing low levels of LakeLisan by correlating fan-delta and lacustrine deposits. Quat Int 73:137–144
Malkawi AIH, Tsur Y (2016) Reclaiming the Dead Sea: alternatives for action. Society-Water-Technology. Springer, Cham, pp 205–225

30 R. Bookman
Marder E, Bookman R, Filin S (2018) Geomorphological response of the lower Jordan River basinto active tectonics of the Dead Sea transform. Geomorphology 317:75–90
Markel D, Alster J, BeythM (2013) The Red Sea-Dead Sea conveyance feasibility study. In: BeckerN (ed) Water policy in Israel. Springer, Dordrecht, pp 2008–2012
Markel D, Sagiv M, Gavrieli I, Goldstein N, Cohen G, Arieli N (2011) Discussion on the Dead Searehabilitation. Ecol Environ 1:55–67 (in Hebrew)
Migowski C, Stein M, Prasad S, Negendank JF, Agnon A (2006) Holocene climate variability andcultural evolution in theNearEast from theDeadSea sedimentary record.QuatRes 66(3):421–431
Miller R (2003) Bible and Soil:Walter Clay Lowdermilk, the Jordan valley project and the Palestinedebate. Middle Eastern Stud 39(2):55–81
Millstein D, Uzon A, Hazan E, Lidar N, Sabah A, Nesher R, Keshet N (2017) Development ofwet habitats in Zukim nature reserve as a tool for nature preservation values. Ecol Environ8(1):354–360 (in Hebrew)
Na’aman N (1994) The ‘Conquest of Canaan’ in the Book of Joshua and in history. In: FinkelsteinI, Na’aman N (eds) From nomadism to monarchy: archaeological and historical aspects of earlyIsrael. Israel Exploration Society, Jerusalem
Neev D, Emery KO (1967) The Dead Sea: depositional processes and environments of evaporates.Isr Geol Surv B 41:1–147
Neev D, Emery KO (1995) The destruction of Sodom, Gomorrah, and Jericho: geological,climatological, and archaeological background. Oxford University Press, Oxford
Neugebauer I, Brauer A, Schwab MJ, Dulski P, Frank U, Hadzhiivanova E, Kitagawa H, Litt T,Schiebel V, Taha N, Waldmann ND (2015) Evidences for centennial dry periods at ~3300 and~2800 cal. yr BP from micro-facies analyses of the Dead Sea sediments. Holocene 25(8):1358–1371
Neugebauer I, Brauer A, Schwab MJ, Waldmann ND, Enzel Y, Kitagawa H, Torfstein A, Frank U,Dulski P, AgnonA,Ariztegui D, Ben-AvrahamZ,Goldstein SL, SteinM,DSDDPScientific Party(2014) Lithology of the long sediment record recovered by the ICDP Dead Sea Deep DrillingProject (DSDDP). Quat Sci Rev 102:149–165
Neumann FH, Kagan EJ, Schwab MJ, Stein M (2007a) Palynology, sedimentology and palaeoe-cology of the Late Holocene Dead Sea. Quat Sci Rev 26(11–12):1476–1498
Neumann F, Schölzel C, Litt T, Hense A, Stein M (2007b) Holocene vegetation and climate historyof the northern Golan Heights (Near East). Veg Hist Archaeobot 16(4):329–346
Neumann J, Parpola S (1987) Climatic change and the eleventh-tenth-century eclipse of Assyriaand Babylonia. J Near Eastern Stud 46(3):161–182
Nof RN, Baer G, Ziv A, Raz E, Atzori S, Salvi S (2013) Sinkhole precursors along the Dead Sea,Israel, revealed by SAR interferometry. Geology 41(9):1019–1022
Nof R, Abelson M, Raz E, Magen Y, Atzori S, Salvi S, Baer GSAR (2019) Interferometry forsinkhole early warning and susceptibility assessment along the Dead Sea, Israel. Remote Sens-Basel 11(1):89
Nuriel P, Weinberger R, Kylander-Clark AR, Hacker BR, Craddock JP (2017) The onset of theDead Sea transform based on calcite age-strain analyses. Geology 45(7):587–590
Ofer A (1994) ‘All the hill country of Judah’: from a settlement fringe to a prosperous monarchy.In: Finkelstein I, Na’aman N (eds) From nomadism to monarchy: archaeological and historicalaspects of early Israel. Israel Exploration Society, Jerusalem
Oren A (2003) Biodiversity and community dynamics in the Dead Sea: archaea, bacteria andeucaryotic algae. In: Nevo E, Oren A, Wasser SP (eds) Fungal life in the Dead Sea Ruggell. ARGGantner Verlag
Oren A, Gavrieli J, KohenM, Lati J, Aharoni M, Gavrieli I (2009) Long-termmesocosm simulationof algal and archaeal blooms in the Dead Sea following dilution with Red Sea water. Nat ResourEnv Iss 15(1):27
Orland IJ, Bar-Matthews M, Kita NT, Ayalon A, Matthews A, Valley JW (2009) Climate deterio-ration in the Eastern Mediterranean as revealed by ion microprobe analysis of a speleothem thatgrew from 2.2 to 0.9 ka in Soreq Cave, Israel. Quat Res 71(1):27–35

1 The Dead Sea and Its Deviation from Natural Conditions 31
Oron A, Galili E, Hadas G, Klein M (2015) Early maritime activity on the Dead Sea: bitumenharvesting and the possible use of reed watercraft. J Marit Archaeol 10(1):65–88
Oz I, Shalev E, Gvirtzman H, Yechieli Y, Gavrieli I (2011) Groundwater flow patterns adjacent toa long-term stratified (meromictic) lake. Water Resour Res 47(8):W08528
Palmisano A, Woodbridge J, Roberts CN, Bevan A, Fyfe R, Shennan S, Cheddadi R, Greenberg R,Kaniewski D, Langgut D, Leroy SAG, Litt T, Miebach A (2019) Holocene landscape dynamicsand long-term populations trends in the Levant. Holocene 29(5):708–727
Powell JM (2005) The empire meets the new deal. Geograph Res 43(4):337–360Prasad S, Vos H, Negendank JFW,Waldmann N, Goldstein SL, SteinM (2004) Evidence from LakeLisan of solar influence on decadal-to centennial-scale climate variability during marine oxygenisotope stage 2. Geology 32(7):581–584
Rauschning D, Wiesbrock Katja, Lailach M (eds) (1997) Key resolutions of the United NationsGeneral Assembly 1946–1996. CUP Archive
Reznik IJ, Ganor J, Gal A, Gavrieli I (2009a) Gypsum saturation degrees and precipitation potentialsfrom Dead Sea–seawater mixtures. Environ Chem 6(5):416–423
Reznik IJ, Gavrieli I, Ganor J (2009b) Kinetics of gypsum nucleation and crystal growth from DeadSea brine. Geochim Cosmochim Ac 73(20):6218–6230
Roberts N, Woodbridge J, Palmisano A, Bevan A, Fyfe R, Shennan S (2019) Mediterranean land-scape change during the Holocene: synthesis, comparison and regional trends in population, landcover and climate. Holocene 29(5):923–937
Rohling EJ, Pälike H (2005) Centennial-scale climate cooling with a sudden cold event around8,200 years ago. Nature 434(7036):975–979
SchrammA,SteinM,Goldstein SL (2000)Calibration of the 14C time scale to >40 ka by 234U–230Thdating of Lake Lisan sediments (last glacial Dead Sea). Earth Planet Sci Lett 175(1–2):27–40
Shalev E, Lyakhovsky V, Yechieli Y (2006) Salt dissolution and sinkhole formation along the DeadSea shore. J Geophys Res-Sol Earth 111(B3)
Simmons AH, Köhler-Rollefson I, Rollefson GO, Mandel R, Kafafi Z (1988) ‘Ain Ghazal: a majorNeolithic settlement in central Jordan. Science 240(4848):35–39
Siebert C, Rödiger T, Mallast U, Gräbe A, Guttman J, Laronne JB, Storz-Peretz Y, Greenman A,Salameh E, Al-Raggad M, Vachtman D (2014) Challenges to estimate surface-and groundwaterflow in arid regions: the Dead Sea catchment. Sci Total Environ 485:828–841
Singer I (1999) A political history of Ugarit. In: Watson GEW,Wyatt N (eds) Handbook of UgariticStudies. Brill, Leiden
Singer I (2000) New evidence on the end of the Hittite empire. In: Oren ED (ed) The Sea peoplesand their world: a reassessment. University of Pennsylvania Press, Philadelphia
Sirota I, Arnon A, Lensky NG (2016) Seasonal variations of halite saturation in the Dead Sea.WaterResour Res 52(9):7151–7162
Sirota I, Enzel Y, Lensky NG (2017) Temperature seasonality control on modern halite layers inthe Dead Sea: in situ observations. GSA Bull 129(9–10):1181–1194
Sirota I, Enzel Y, Lensky NG (2018) Halite focusing and amplification of salt layer thickness: fromthe Dead Sea to deep hypersaline basins. Geology 46(10):851–854
Shamir G (2006) The active structure of the Dead Sea depression. Geol S Am Spec Pap 401:15–32Shviro M (2015) The influence of flash-floods on subsidence rates in sinkholes sites along the DeadSea: insights from high-resolution InSAR. Ph.D. thesis, Ben-Gurion University of the Negev,Israel
Starinsky A (1974) Relationship between Ca chloride brines and sedimentary rocks in Israel. Ph.D.thesis, The Hebrew University of Jerusalem, Israel (in Hebrew)
Stanislavsky E, Gvirtzman H (1999) Basin-scale migration of continental-rift brines: paleohydro-logic modeling of the Dead Sea Basin. Geology 27(9):791–794
SteinM (2001) The sedimentary and geochemical record ofNeogene-Quaternarywater bodies in theDead Sea Basin-inferences for the regional paleoclimatic history. J Paleolimnol 26(3):271–282

32 R. Bookman
Stein M, Starinsky A, Katz A, Goldstein SL, Machlus M, Schramm A (1997) Strontium isotopic,chemical, and sedimentological evidence for the evolution of Lake Lisan and the Dead Sea.Geochim Cosmochim Ac 61(18):3975–3992
Stein M, Torfstein A, Gavrieli I, Yechieli Y (2010) Abrupt aridities and salt deposition in thepost-glacial Dead Sea and their North Atlantic connection. Quat Sci Rev 29(3–4):567–575
Stein M (2014) The evolution of Neogene-Quaternary water-bodies in the Dead Sea rift valley.In: Garfunkel Z, Ben-Avraham Z, Kagan E (eds) Dead Sea Transform Fault System: Reviews.Springer, Dordrecht, pp 279–316
Steinhorn I, Assaf G, Gat JR, Nishry A, Nissenbaum A, Stiller M, Beyth MT, Neev D, GarberR, Friedman GM, Weiss W (1979) The Dead Sea: deepening of the mixolimnion signifies theoverture to overturn of the water column. Science 206(4414):55–57
Steinhorn I, Gat JR (1983) The Dead Sea. Sci Am 249(4):102–111, C1–C8Stern O (2010) Geochemistry, hydrology and paleo-hydrology of Ein Qedem spring system. GeolSurv Isr Rep, GSI/17/2010, Jerusalem
StillerM,ChungYC (1984) Radium in theDead Sea: a possible tracer for the duration ofmeromixis.Limnol Oceanogr 29(3):574–586
ten Brink US, Ben-Avraham Z (1989) The anatomy of a pull-apart basin: seismic reflectionobservations of the Dead Sea Basin. Tectonics 2:333–350
ten Brink US, Flores CH (2012) Geometry and subsidence history of the Dead Sea Basin: a casefor fluid-induced mid-crustal shear zone? J Geophys Res-Sol Earth 117(B1)
Torfstein A, Gavrieli I, Katz A, Kolodny Y, Stein M (2008) Gypsum as a monitor of the paleo-limnological–hydrological conditions in Lake Lisan and the Dead Sea. Geochim Cosmochim Ac72(10):2491–2509
Torfstein A, Haase-Schramm A, Waldmann N, Kolodny Y, Stein M (2009) U-series and oxygenisotope chronology of the mid-Pleistocene Lake Amora (Dead Sea Basin). Geochim CosmochimAc 73(9):2603–2630
Torfstein A, Goldstein SL, Kagan EJ, Stein M (2013) Integrated multi-site U-Th chronology of thelast glacial Lake Lisan. Geochim Cosmochim Ac 104:210–231
Trigo IF (2006) Climatology and interannual variability of torm-tracks in the Euro-Atlantic sector:a comparison between ERA-40 and NCEP/NCAR reanalyses. Clim Dynam 26 (2–3):127–143
Underhill HW (1967) Dead Sea levels and the P.E.F. mark. Palest Explor Quarterly 99(1):45–53Vardi J (1990) Mediterranean–Dead Sea Project – historical review. In: Arad V, Beyth M, Vardi J(eds) Geol Surv Isr Rep, GSI/9/90, Jerusalem
Volcani B (1944) Studies on the microflora of the Dead Sea. Ph.D. thesis, The Hebrew Universityof Jerusalem (in Hebrew)
Waldmann N, Starinsky A, Stein M (2007) Primary carbonates and Ca-chloride brines as monitorsof a paleo-hydrological regime in the Dead Sea Basin. Quat Sci Rev 26(17–18):2219–2228
Ward WA, Joukowsky M (1992) The crisis years: the 12th century BC: from beyond the Danube tothe Tigris. Kendall Hunt, Dubuque
Weber N, Yechieli Y, Stein M, Yokochi R, Gavrieli I, Zappala J, Mueller P, Lazar B (2018) Thecirculation of the Dead Sea brine in the regional aquifer. Earth Planet Sci Lett 493:242–261
Weiss B (1982) The decline of Late Bronze Age civilization as a possible response to climaticchange. Clim Change 4(2):173–198
Wilkansky B (1936) Life in the Dead Sea. Nature 138(3489):467Yakir D, Issar A, Gat J, Adar E, Trimborn P, Lipp J (1994) 13C and 18O of wood from the Romansiege rampart in Masada, Israel (AD 70–73): evidence for a less arid climate for the region.Geochim Cosmochim Ac 58(16):3535–3539
Yechieli Y, Magaritz M, Levy Y, Weber U, Kafri U, Woelfli W, Bonani G (1993) Late Quaternarygeological history of the Dead Sea area, Israel. Quat Res 39(1):59–67
Yechieli Y, RonenD, Berkowitz B, DershowitzWS, HadadA (1995) Aquifer characteristics derivedfrom the interaction between water levels of a terminal lake (Dead Sea) and an adjacent aquifer.Water Resour Res 31(4):893–902
Yechieli Y, Gavrieli I, Berkowitz B, RonenD (1998)Will theDead Sea die?Geology 26(8):755–758

1 The Dead Sea and Its Deviation from Natural Conditions 33
Yechieli Y, AbelsonM, Bein A, Crouvi O, Shtivelman V (2006) Sinkhole “swarms” along the DeadSea coast: reflection of disturbance of lake and adjacent groundwater systems. Geol Soc Am Bull118(9–10):1075–1087
Yechieli Y, Abelson M, Wachs D, Shtivelman V, Crouvi O, Baer G (2003) Formation of sinkholesalong the shore of the Dead Sea - preliminary investigation. In: Beck BF (ed) Sinkholes andthe Engineering and Environmental Impacts of Karst. Americal Society of Civil Engineers, SanAntonio, Texas
Zaccagnini C (1995) War and famine at Emar. Orientalia 64:92–109Zak I (1967) The geology of Mount Sedom. Ph.D. thesis, The Hebrew University of Jerusalem,Israel (in Hebrew with English abstract)
Zilberman T, Gavrieli I, Yechieli Y, Gertman I, Katz A (2017) Constraints on evaporation and dilu-tion of terminal, hypersaline lakes under negative water balance: the Dead Sea, Israel. GeochimCosmochim Ac 217:384–398
Zilberman-Kron T (2008) The source and geochemical evolution of the brines in sinkholes alongthe western shore of the Dead Sea. M.Sc. thesis, The Hebrew University of Jerusalem, Israel
Ziv B, Dayan U, Kushnir Y, Roth C, Enzel Y (2006) Regional and global atmospheric patternsgoverning rainfall in the southern Levant. Int J Climatol 26:55–73
Ziv B, Saaroni H, Alpert P (2004) The factors governing the summer regime of the easternMediterranean. Int J Climatol 24(14):1859–1871

Chapter 2Lake Sevan: Evolution, Biotic Variabilityand Ecological Degradation
Ian P. Wilkinson
Abstract Lacustrine conditions in the Sevan Basin, Armenia, have a history thatextends back to the lateMiocene (Pontian), although themodernmorphology of LakeSevan was established after volcanic activity during the Pleistocene and Holocene. Adiverse fauna and florawas established in this high-altitude lake during theHolocene,but profound anthropogenic pressures commenced in the mid-twentieth century. Themodel of ecological degradation predicts a phase of inception, followed by a phaseof accelerated degradation which reaches an apogee. In some circumstances, this isfollowed by a phase of recovery. In Lake Sevan, the phase of inception was relativelyshort lived, confined to the 1930s, with the phase of acceleration commencing in the1940s and continuing through the 1950s and 1960s resulting in significant changesin water depth, temperature, sedimentation, pellucidity and water quality, causingprofound changes in the trophic structure and diversity. The phase of recovery wasinitiated in 2002 and it remains to be seen whether this will return the lake to itsformer condition and the biota to its former diversity.
Keywords Armenia · Holocene · Anthropocene · Biotic variability ·Anthropogenic change
2.1 Introduction
Lake Sevan is situated in Gegharkounik Province, in the eastern part of Armenia, atan altitude of 1900 m above sea level (asl) and surrounded by peaks that rise up to3598 m asl (Figs. 2.1 and 2.2). It is one of the largest high-mountain lakes with amaximum length of about 70 km and amaximumwidth of about 50 km. TheArtanishand Noraduz peninsulas reduce the width of Lake Sevan at one point to only 7 kmand the two parts of the lake have been named Great and Little Sevan. The lake isfed by 28 rivers and two large springs and is drained by the River Hrazdan, which
I. P. Wilkinson (B)British Geological Survey, Nicker Hill, Keyworth, Nottinghamshire NG12 5GG, UKe-mail: [email protected]
School of Geography, Geology and the Environment, University of Leicester, University Road,Leicester LE1 7RH, UK
© Springer Nature Switzerland AG 2020S. Mischke (ed.), Large Asian Lakes in a Changing World, Springer Water,https://doi.org/10.1007/978-3-030-42254-7_2
35

36 I. P. Wilkinson
Fig. 2.1 The regional position of Armenia (coloured black)
leaves at the northern end, joins the River Arax on the Armenian/Turkish border andflows south and east into the Caspian Sea.
Lake Sevan is of vital importance toArmenia in providingwater for hydroelectric-ity generation, irrigation and human consumption, as well as providing a source offood (90% of the country’s fish and 80% of the crayfish). Water quality and pollutionin the lake and its tributaries are, therefore, of great concern.
The ecology of Lake Sevan underwent continuous natural evolution throughoutthe Neogene and into the early twentieth century (Hakobyan and Djomin 1982;Filatov 1983; Gulakyan and Wilkinson 2002). The pristine ecology of Lake Sevanis seen in the preserved Holocene archive through to about 1927–1933 AD, but theinception of anthropogenic ecological degradation then began, accelerating duringthe 1940s and 1950s (Table 2.1). It became a significant problem during the latetwentieth century, coincidingwith the global phenomenonwhich is regarded by someas defining the Anthropocene Epoch (e.g. Waters et al. 2014, 2016; Wilkinson et al.2014; Zalasiewicz et al. 2018, 2019). It seems likely, therefore, that the profound andaccelerating environmental degradation, which began in approximately 1950, marksthe start of the Anthropocene in the Sevan Basin.
The so-called “Sevan Problem”, was caused predominantly by mistaken politicaldecisions during the Soviet period together with over-exploitation and pollution ofthe lake and its catchment area (Babayan et al. 2006).
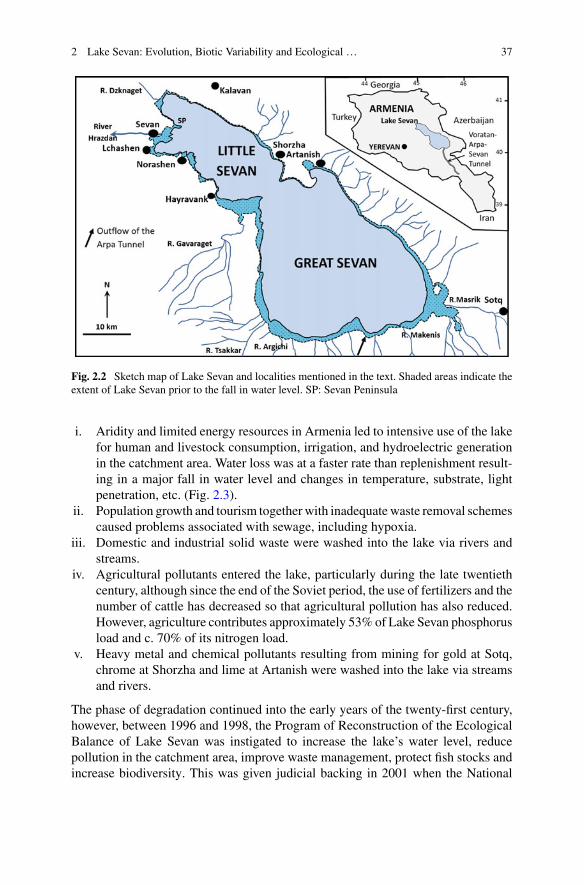
2 Lake Sevan: Evolution, Biotic Variability and Ecological … 37
Fig. 2.2 Sketch map of Lake Sevan and localities mentioned in the text. Shaded areas indicate theextent of Lake Sevan prior to the fall in water level. SP: Sevan Peninsula
i. Aridity and limited energy resources in Armenia led to intensive use of the lakefor human and livestock consumption, irrigation, and hydroelectric generationin the catchment area. Water loss was at a faster rate than replenishment result-ing in a major fall in water level and changes in temperature, substrate, lightpenetration, etc. (Fig. 2.3).
ii. Population growth and tourism together with inadequate waste removal schemescaused problems associated with sewage, including hypoxia.
iii. Domestic and industrial solid waste were washed into the lake via rivers andstreams.
iv. Agricultural pollutants entered the lake, particularly during the late twentiethcentury, although since the end of the Soviet period, the use of fertilizers and thenumber of cattle has decreased so that agricultural pollution has also reduced.However, agriculture contributes approximately 53% of Lake Sevan phosphorusload and c. 70% of its nitrogen load.
v. Heavy metal and chemical pollutants resulting from mining for gold at Sotq,chrome at Shorzha and lime at Artanish were washed into the lake via streamsand rivers.
The phase of degradation continued into the early years of the twenty-first century,however, between 1996 and 1998, the Program of Reconstruction of the EcologicalBalance of Lake Sevan was instigated to increase the lake’s water level, reducepollution in the catchment area, improve waste management, protect fish stocks andincrease biodiversity. This was given judicial backing in 2001 when the National
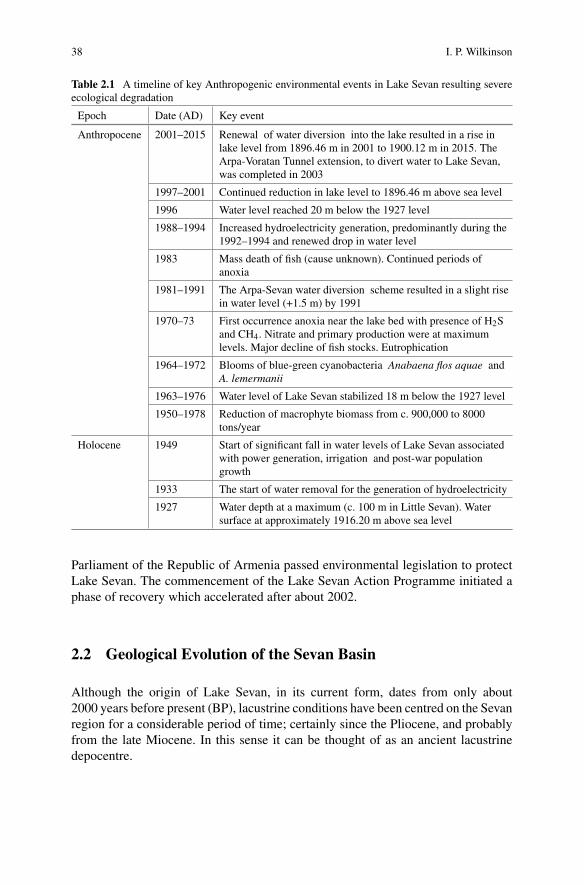
38 I. P. Wilkinson
Table 2.1 A timeline of key Anthropogenic environmental events in Lake Sevan resulting severeecological degradation
Epoch Date (AD) Key event
Anthropocene 2001–2015 Renewal of water diversion into the lake resulted in a rise inlake level from 1896.46 m in 2001 to 1900.12 m in 2015. TheArpa-Voratan Tunnel extension, to divert water to Lake Sevan,was completed in 2003
1997–2001 Continued reduction in lake level to 1896.46 m above sea level
1996 Water level reached 20 m below the 1927 level
1988–1994 Increased hydroelectricity generation, predominantly during the1992–1994 and renewed drop in water level
1983 Mass death of fish (cause unknown). Continued periods ofanoxia
1981–1991 The Arpa-Sevan water diversion scheme resulted in a slight risein water level (+1.5 m) by 1991
1970–73 First occurrence anoxia near the lake bed with presence of H2Sand CH4. Nitrate and primary production were at maximumlevels. Major decline of fish stocks. Eutrophication
1964–1972 Blooms of blue-green cyanobacteria Anabaena flos aquae andA. lemermanii
1963–1976 Water level of Lake Sevan stabilized 18 m below the 1927 level
1950–1978 Reduction of macrophyte biomass from c. 900,000 to 8000tons/year
Holocene 1949 Start of significant fall in water levels of Lake Sevan associatedwith power generation, irrigation and post-war populationgrowth
1933 The start of water removal for the generation of hydroelectricity
1927 Water depth at a maximum (c. 100 m in Little Sevan). Watersurface at approximately 1916.20 m above sea level
Parliament of the Republic of Armenia passed environmental legislation to protectLake Sevan. The commencement of the Lake Sevan Action Programme initiated aphase of recovery which accelerated after about 2002.
2.2 Geological Evolution of the Sevan Basin
Although the origin of Lake Sevan, in its current form, dates from only about2000 years before present (BP), lacustrine conditions have been centred on the Sevanregion for a considerable period of time; certainly since the Pliocene, and probablyfrom the late Miocene. In this sense it can be thought of as an ancient lacustrinedepocentre.

2 Lake Sevan: Evolution, Biotic Variability and Ecological … 39
2.2.1 Eocene-Oligocene
During the Palaeogene, deposition in Armenia was controlled by the evolutionof the Paratethys Sea in which foraminifera and molluscs were indicative of theMediterranean palaeogeographic province. Calcareous siltstones and mudstones,which accumulated in openmarine conditions, are rich in nannofossils and planktonicforaminifera, whereas the shallow marine larger benthonic foraminifera are foundmainly in the interbedded limestones. Temporal variability can also be observed withseveral internationally recognised biostratigraphical zones being represented in theEocene to Oligocene successions.
Eocene planktonic foraminifera include common species of Subbotina, Turboro-talia, Globigerinatheka, Dentoglobigerina and Pseudohastigerina (Krasheninnikovet al. 1986; Cotton et al. 2017). A number of biostratigraphical zones have beenrecognised including the Eocene Truncorotaloides rohri, Globigerinatheka semiin-voluta and Globigerinatheka index zones through to the Lower Oligocene Globige-rina tapuriensis andGlobigerina sellii zones. Larger benthonic foraminifera are alsopresent, notably the Eocene Nummulites millecaput-group, Nummulites fabianii andHeterostegina reticulata lineages and, in the Oligocene, Nummulites intermedius.Calcareous nannofossil assemblages are dominated by the placoliths Reticulofen-estra, Cyclicargolithus floridanus, Coccolithus and Dictyococcites, but nannolithssuch as species of Lanternithus and Zygrablithus are common. The presence of Chi-asmolithus oamaruensis, Isthmolithus recurvus and Cribrocentrum isabellae, Dis-coaster barbadiensis and Ericsonia subdisticha occur in the late Eocene (Cottonet al. 2017; Shcherbinina et al. 2017).
2.2.2 Miocene
The evolution of the Sevan region during the Neogene was outlined by Aslanianand Vehuni (1984) and Aslanian and Sayadian (1984). It was during the Miocenethat the environment of deposition began to change from essentially marine tonon-marine. The Eastern Paratethys, which covered the Sevan Depression dur-ing the Late Sarmatian (c. 12 Ma), regressed during the Meotian (c. 8 Ma) ulti-mately resulting in the formation of a large lake during the Pontian (c. 5.5 Ma;Nevesskaya et al. 2003). This is demonstrated by the change from the globigerine-and nummulites-dominated foraminiferal faunas of the Eocene and Oligocene toshallow marine and lagoonal faunas, including smaller foraminifera and ostracodsdating to theMid-Miocene. Aslanian andVehuni (1984) recorded foraminifera (Non-ion subgranosus, Streblus beccarii) and ostracods (Cyprideis sarmatica, C. torosaand Candonella schubinae) from the Sarmatian; molluscs (Mactra (Sarmatimac-tra) caspia, M. (S.) podolica, M. (S.) timida, M. (S.) bulgarica) and plant remainsin the Upper Sarmatian; and bryozoa (Membranipora and Nitcheina (Membrani-pora) kirschenevensis) in the Meotian reefal deposits. These are in turn overlain by

40 I. P. Wilkinson
Pontian freshwater clays characterised by molluscsDreissena, Limnaea and Planor-bis together with diatomaceous oozes including species of Cyclotella and Stephan-odiscus (Poretzky 1953; Milanovskii 1968; Golovenkina 1977; Aleshinskaya andPirumova 1982; Sayadyan 2006). Bubikyan (1984) recorded several non-marineostracods from the Pontian of the Sevan region, including Darwinula stevensoni,Ilyocypris bradyi, Ilyocypris gibba, Neglecandona neglecta, Pseudocandona albi-cans and Cyprideis torosa, suggesting the development of fluviatile and lacustrineenvironments (Fig. 2.4).
2.2.3 Pliocene
By the Pliocene there was a complete absence of marine conditions in the Sevanregion, and lignite-bearing volcanogenic successions are present (Aslanian and Saya-dian 1984). Tectonic uplift in the Lesser Caucasus and Armenian Highland (Neillet al. 2015) was accompanied by episodes of volcanism, resulting in the damming ofthe River Hrazdan and the establishment of Lake Sevan in the intermontane depres-sion. During the Early Pliocene 45 lacustrine and fluviatile diatom species (includ-ing Cyclotella and Stephanodiscus) inhabited the basin and, in the Late Pliocene,the lacustrine bivalves Mactra subcaspia, Avicardium nikitini and Cerastodermadombra were present (Sayadyan 2006). In addition to those ostracods recoveredfrom the late Miocene (listed above), Bubikyan (1984) recorded common Neglecan-dona neglecta, Candona candida (asC. kirgizica) and Limnocythere inopinata in thePliocene lacustrine deposits of the Sevan intermontane basin (Fig. 2.4).
2.2.4 Pleistocene
Pleistocene through toHolocene sedimentationwithin the Sevan intermontaine basinwas dominated by volcanogenic sediments and lavas which dammed the River Hraz-dan resulting in the modern lacustrine environment (Aslanian and Sayadian 1984).Middle Pleistocene lacustrine sediments yield molluscs such as Dreissena diluviaand Micromelania caspia and oligotrophic diatoms including species of Melosira,Fragilaria, Navicula, Amphora andDiploneis (Sayadyan 2006). The ostracod assem-blages in Lake Sevan during the Pleistocene were essentially similar to those of thePliocene, but Bubikyan (1984) also recorded the first occurrence of Prionocypriszenkeri together with Limnocythere inopinata (including males which were recordedas L. fontinalis).

2 Lake Sevan: Evolution, Biotic Variability and Ecological … 41
2.3 The Holocene of Lake Sevan
Water level of Lake Sevan varied considerably during the Holocene. However, LakeSevan was an important resource for water and food throughout much of that time,attracting human occupation around its margins. Archaeological remains are foundaround the lake, includingBronzeAge “cyclopean” castles (e.g. Lchashen andHayra-vank),medieval buildings (e.g. Sevanavank andHayravank), stone crosses, etc. Exca-vations at Lchashen and Norashen (Fig. 2.3b–c) have revealed Bronze Age woodenwagons (giving radiocarbon dates of 3500 and 3630 ± 100 years BP), and Iron Ageboulders with cuneiform writing (Fig. 2.3d) dating to the time of the Urartian KingArgishti (785–760BC) andKingRusa II (730–714BC), and ceramics dating to about300 BC (Aslanian and Sayadian 1984). There is also evidence of Bronze and Iron
Fig. 2.3 The decline in the water level during the late twentieth century, resulted in the exposureof the former lake bed and the presence of many archaeological remains. a ‘Sevan Island’ is nowconnected to the mainland to form the Sevan Peninsula, the low-lying area in the middle distanceonce formed the lake bed. b Several hundred stone Bronze Age graves (or ‘box houses’) wererevealed in the exposed land surface surrounding the lake, such as this one at Lchashen. c A mid-Bronze Age Dolman, near Lchashen, can also be seen on the shore of Lake Sevan, with the 1927 ADlake terrace behind. d A large stone at Lchashen bears cuneiform writing which dates to the timeof the Urartian King, Argishti I (r. 786–764 BCE) and mentions the capture of ‘Ishtikuni’ (possiblythe early name of Lchashen)

42 I. P. Wilkinson
Age agricultural practices around the lake such as at Sotq, wherewheat (Triticum aes-tivum), barley (Hordeum vulgare) and emmer (Triticum dicoccum) were cultivated(Hovsepyan 2013).
The final phase of lacustrine development began c. 2000 years BP when volcanicactivity led to the damming of the River Hrazdan by lava flows and the lake adoptedits modern morphology; molluscs overlying the Bronze Age archaeological horizongave radiocarbon dates of 2020 ± 120 and 2090 ± 70 years BP (Aslanian andSayadian 1984). The warm and wet climatic conditions at this time were replacedby more arid conditions throughout the eastern Mediterranean region, Turkey andArmenia by c. 1000 years BP (Eastwood et al. 2007).
TheHolocene ecology of LakeSevan is best demonstrated by reference to the sedi-mentary successions at Norashen, Dzknaget and boreholes in Great Sevan (Sayadyan
Fig. 2.4 The temporal distribution of freshwater ostracods from the Miocene to the Anthropoceneof Lake Sevan. After 1Bubikyan (1984); 2Wilkinson et al. (2005); 3Bronshtein (1928; the recordof ‘Limnocythere sp.’ is considered to be L. inopinata); 4Bronshtein (1947; data given appearsto be essentially a repetition of his 1928 paper, although he includes the first record of the deepwater species Fabaeformiscandona dorsobiconcava); 5Fridman (1950); 6Wilkinson and Gulakyan(2010); 7Jenderedjian et al. (2012)

2 Lake Sevan: Evolution, Biotic Variability and Ecological … 43
Fig. 2.5 Holocene stratigraphy and palaeoenvironments. a Exposures at Norashen and Dzknagetand b A transect of boreholes in the western part of Great Sevan (after Sayadyan et al. 1977;Aleshinskaya 1980; Aslanian and Sayadian 1984; Sayadyan 1991; Wilkinson et al. 2005)
et al. 1977; Aslanian and Sayadyan 1984; Wilkinson et al. 2005; Wilkinson andGulakyan 2010; Fig. 2.5).
Late Pleistocene and post-glacial conditions resulted in the formation of deep waterlacustrine conditions at Norashen, which was followed by four cycles of oscillatingwater levels:
The deep water basal clay (c. 12,800 and 9300 years BP) passes up into peaty soilwith plant remains and Cyperaceae pollen, culminating in medium-grained sandwith a mollusc assemblage, dominated by Lymnaea stagnalis, characteristic of thelittoral zone. An increase in water depth followed this phase of low lake level (c.9300–8900 years BP).A second fall in water level led to littoral environments and the accumulation ofsandy clay andmedium-grained sandwithmolluscs dating to c. 8500 to 6200 yearsBP. The overlying unit contains early (3rd millennium BC) and late (2nd millen-niumBC)BronzeAge archaeological artefacts of a similar age to those at Lchashen(Sayadyan et al. 1977; Sayadyan 1978; Aleshinskaya 1980). The absence of themiddle Bronze Age archaeology at both Norashen and Lchashen may suggest ashort lived increase in lake level at that time. The overlying sand with abundantmolluscs (dominated by Planorbis planorbis and Lymnaea (Radix) auricularia),pollen of Cyperaceae and Sparganium and abundant planktonic diatoms such asCyclotella ocellata and C. kuetzingiana radiosa indicates an increase in waterdepth between 3400 and 2900 years BP.The third drop in lake level began c. 2950 years BP, and the peaty soil associatedwith low water level is estimated to date to c. 2500–2350 years BP before over-lying transgressive sand accumulated, with molluscs and the abundant planktonic

44 I. P. Wilkinson
diatoms indicating increased depth between about 2350 and 1700–900 years BP(Aleshinskaya 1980).The uppermost unit, comprising lava blocks and rock fragments, indicates a fourthfall in lake level after c. 900 years BP.
Sayadyan et al. (1977) and Aslanian and Sayadyan (1984) discussed the Holocenesuccession of the Dzknaget River delta, on the northwestern margin of Lake Sevan(Fig. 2.5).
The lower unit, comprising clayey silt and sandy clay, was deposited at a time ofdeeper water (c. 2150 and 1700 years BP) as indicated by the presence of abundantplanktonic diatoms including Stephanodiscus astraea, Cyclotella kuetzingianaradiosa and C. ocellata, together with sparse pollen of aquatic plants (Typha,Sparganium and species of Cyperaceae). This transgressive interval correlateswith high lake-level phase indicated by the Norashen record.The sand and sandy silt with pebble and gravel interbeds accumulated duringa phase of shallowing between c. 1700 and 950 years BP. Aquatic plant pollen(Cyperaceae, Typha and Sparganium) occurs more commonly whereas the plank-tonic diatoms are much reduced in proportion and poorly preserved, but ben-thonic epiphytic taxa (Meridion circulare, Cocconeis placentula, Amphora ovalis,Epithemia turgida and Rhopalodia gibba) are abundant. Towards the top of thesuccession, unstable conditions seem to be indicated by the alternation of sand andorganic-rich silts, together with variable proportions of aquatic plant pollen andof planktonic (Cyclotella kuetzingiana, C. ocellata, Stephanodiscus atraea, Aula-coseira italica) and benthonic (Epithemia turgida, Meridion circulare, Fragilariaintermedia, Synedra ulna, Cocconeis placentula) diatoms.The surface gravelly sand with abundant soil and aerophilic diatoms (Naviculamutica and Hantzschia amphioxys) accumulated at the time of the Anthropogenicfall in water level since 1927 AD.
Shallow water Holocene sands, argillaceous and silty sands together with clays inGreat Sevan, were penetrated by a series of boreholes (Fig. 2.5), which are believed,on the basis of sedimentation rates and geochemical evidence, to date from about5000 years before present to the Holocene/Anthropocene transition (Aslanian andSayadian 1984;Gulakyan andWilkinson 2002;Wilkinson andGulakyan 2010). LakeSevan is crossed by several major geological faults along which seismic activity tookplace from time to time and there appears to have been an inverse relationship betweenorganic carbon content of the lacustrine silts and seismic activity. It is postulated thatthiswas caused by the agitation of the silts and release of the organic richmaterial intothe water column. Gulakyan andWilkinson (2002) attempted to use this to recognisethe signatures of historical earthquakes preserved within the lake silts penetrated byboreholes. During the Holocene, sedimentation rate of silts was estimated at about0.8–1 mm per year (Ljatti 1932; Afanasev 1933) and using sedimentation rate as anapproximate time equivalence Gulakyan and Wilkinson (2002) postulated that thefall in the percentage of organic material observed within the sediment cores in thesouth-western part of Great Sevan were signatures of, respectively, the 1319 AD,

2 Lake Sevan: Evolution, Biotic Variability and Ecological … 45
995 AD and 782 BC earthquakes. The earliest was the strongest earthquake when,according to Urartuian cuneiform inscriptions, the underground god, Teisheba, killedand burnt many people and destroyed cities and mountains (Satian and Chilingaryan1994).
Wilkinson and Gulakyan (2010) indicated that ostracod diversity within LakeSevan was low during the latest Atlantic-early Sub-Boreal, rarely exceeding three orfour species, but it then increased to between seven and ten species probably reflect-ing ameliorating conditions and environmental heterogeneity during the Sub-Borealclimate. A total of 15 species were recorded from Holocene deposits, although asixteenth species, Fabaeformiscandona dorsobiconcava, may have been present inprofundal areas (Wilkinson et al. 2005; Wilkinson and Gulakyan 2010). However, ofthese, two, Prionocypris zenkeri and Ilyocypris bradyi, tend to favour spring watersand were probably introduced into the lake from surrounding fluviatile environmentsand a third, Herpetocypris chevreuxi, may have been derived from marshy areasaround the lake margins. Species of Candoninae were common in the Holoceneof Lake Sevan, particularly Neglecandona neglecta and N. angulata, but Pseudo-candona albicans and Fabaeformiscandona caucasica were also present. The lastnamed, is worthy of note as its distribution appears to be restricted to the Caucasusand Crimea (Bronshtein 1947). Limnocythere inopinata is one of the more commonspecies having entered the Lake Sevan region during the Pliocene (Bubikyan 1984)and retained a sexual population throughout the Holocene (Wilkinson and Gulakyan2010), unlike northern Europe where only females are known. Cyprideis torosa,Cytherissa lacustris, Darwinula stevensoni, Ilyocypris gibba and Cyclocypris ovumcomplete the ostracod community, although they were rare. Limnocythere inopinata,Neglecandona neglecta and Ilyocypris bradyi, three of the more common species,show a preference for shallow water less than about 20 m. However, at times waterdepths might have beenmuch shallower (perhaps as shallow as c. 5–6m) as indicatedby the presence ofDarwinula stevensoni.Neglecandona neglecta shows a preferencefor cool water.
2.4 The Inception of Ecological Degradation in Lake Sevan
2.4.1 Ecological Parameters
During the early twentieth century, when ‘natural’ oligotrophic conditions prevailed,the water level of Lake Sevan wasmore or less stable between c. 1915 and 1916m asl(Fig. 2.6) and the maximum depths of Little and Great Sevan was 98.6 and 58.7 mrespectively (Hovanesian and Bronozian 1994). As a result of the restricted lakebasin area and the dry continental climate, renewal of the lake water is very slow atc. 50 years in its natural state. Themain component ofwater losswas evaporation, andit was not until the 1950s that outflow via the River Hrazdan (1383 million m3/yearon average) exceeded evaporation (1041 million m3/year on average; Babayan et al.

46 I. P. Wilkinson
Fig. 2.6 Water levels (solid line) and rate of outflow (broken line) during Anthropocene (afterHovanesian and Bronozian 1994; Babayan et al. 2006)
2006). During the 1940s, with increased pressures from irrigation and industry, waterlevel dropped by c. 0.2–0.3 m per year (Hovanisian and Bronozian 1994). Sedimen-tation in the littoral zone of Lake Sevan comprised silts (15–18%), sand (22–25%)and gravel (c. 60%), whereas calcareous, shelly muds and silts predominated furtheroffshore and muds were characteristic of the profundal zone (Ljatti 1932). In a fewareas in the deeper parts of the lake, calcium carbonate precipitated onto the lakefloor.
Between 1927 and 1933 surface water temperatures averaged about 3–4 °C inLittle Sevan and 4–5 °C in Great Sevan (Hovhannissian 1994), but there was sea-sonal variability. The seasonal increase in water temperatures during spring, whenthe young of many species appear, was slower than in the modern lake so that April-June surface temperatures were as much as 5 °C lower (Fig. 2.7). Summer sur-face waters reached their maximum temperature of about 16–17 °C during August,the hypolimnion being at 25–30 m depth (Gezalyan 1979). In Great Sevan thetemperature of bottom waters during August and September was about 5 °C in1938 (Barsukov et al. 1992). From September (until early January) water temper-atures fell more slowly than in the modern lake. In Great Sevan, the hypolimnionbegan to break down in the early autumn and water started to mix in November,about a month later than in the modern lake and at a temperature 3–4 °C lower(Fig. 2.7). In Little Sevan, the low temperature (4–6 °C) hypolimnion which iso-lated the bottom of the lake from active circulation, was an important aspect in theecosystem. During the winter, surface temperatures were such that the lake was

2 Lake Sevan: Evolution, Biotic Variability and Ecological … 47
Fig. 2.7 A comparison of the average monthly surface water temperatures of Little a and GreatSevan b to demonstrate the effect of the fall in water level across the Holocene/Anthropocenetransition. (1927–1933: dashed line and 1982–1985: solid line; afterHovhannissian 1994;Wilkinsonand Gulakyan 2010)
Table 2.2 Concentration of major ions (mg/l) in the water of the Lake Sevan between 1893 and2001
Epoch Years Ca2+ Mg2+ Na+
+ K+HCO3
− CO32− Cl− SO4
2−
Anthropocene 2001f 32.5 63.2 113.0 402.6 – 76.6 19.4
1976–1984d 24.6 57.3 76.7 425.5 40.3 66.2 16.4
1976e 31.3 59.6 – 422.3 42.1 65.1 14.9
1950–1970d 39.0 56.0 92.8 399.3 45.0 64.0 19.9
Holocene 1947–1948c 37.4 52.4 101.5 416.6 38.3 61.9 15.7
1928–1929b 33.9 55.9 98.7 414.8 36.0 62.3 16.9
1893–1894a 37.8 56.9 101.0 435.8 – 65.1 17.0
After aStakhovski in Ljatti (1932); bLjatti (1932); cSlobodchikov (1951); dParparova (1979);eHovhannissian (1994); fWilkinson and Gulakyan (2010)
covered by ice only once every 15–20 years in the early twentieth century; heatcapacity of the lake was 700 × 1012 kcal (Gezalyan 1979).
During the mid-twentieth century, Ljatti (1932) recorded the average dissolvedoxygen content to between 5.6 and 11.8 mg/l, although there was seasonal variation,being highest during the spring, when the water column was mixed, and lowest inautumn. Table 2.2 illustrates some of the hydrochemical components of the water ofLake Sevan. Between 1893 and 1948 (the latest part of the Holocene as interpretedherein) there was only slight variation in water chemistry, although there is a trendfor Mg to decline slightly during that time (Ljatti 1932; Slobodchikov 1951).
2.4.2 Biotas
Prior to the drop in water level, Lake Sevan was colonised by a diverse bioticcommunity.

48 I. P. Wilkinson
Macrophytes play an important role in the ecosystem of Lake Sevan, as theyprovide a food source, spawning habitat, substrate and refuge for many benthonicorganisms. The biomass of macrophytes in the lake was 600,000 tons comprisingmore than 20 common species (Hovhannissian 1994). At this time there was a veryhigh light pellucidity and macrophytes reached depths of 17 m. Stonewort (Chara)and moss dominated the lake bottom vegetation down to c. 14 m depth.
Phytoplankton andalgaewere represented by 26 species inLakeSevan.Diatomswere particularly common, including Asterionella formosa, Stephanodiscus astraeaand S. hantzschii, and green algae were also well represented, particularly Gloeo-coccus schroeteri and Oocystis spp. (Hovhannisyan et al. 2010). Hovhanissian andGabrielyan (2000) reported that phytoplankton biomass was 0.3 g/m3 and produc-tivity was high, at approximately 100 gC/m2 per year, due to the greater depth of theeuphotic zone and the constant presence of algae.
Zooplankton comprised ten species of rotifers, cladocerans and copepods duringthe latest Holocene, all of which were common, although the total biomass was low.Copepods formed the largest part of the total biomass (about 60%) and the cladoceranDaphnia formed a large proportion (Savvaitova and Petr 1999).
Zoobenthos biomass was between 3.4 and 4.2 g/m−2 (wet weight) during thelatest Holocene with a total of 170 species recorded in Lake Sevan (Arnoldi 1929;Domrachev 1940; Fridman 1950). Between 1928 and 1948 Oligochaeta made upabout 50% of the total biomass, Amphipoda 14–18%, Chironomidae 11–17%,Hirudinea 8–12%, mollusks 5–13%, and the remaining zoobenthos 1–2%. Thesegroups peaked in waters shallower than 15 m, although the last two groups werealso abundant at, respectively, 25–30 m and 40–60 m. Jenderedjian et al. (2012)calculated that species that formed in excess of 80% of the total biomass of theirtaxonomic group wereMonhystera paludicola (Nematoda), Candona caucasica andNeglecandona neglecta (Ostracoda), Ilyocryptus sordidus (Cladocera), Potamothrixalatus paravanicus (Oligochaeta),Glossiphonia complanata andHerpobdella octoc-ulata (Hirudinea), Lymnaea stagnalis and Valvata piscinalis (Gastropoda), Gam-marus lacustris (Amphipoda), Agrypnetes crassicornis (Trichoptera) and Chirono-mus plumosus andProcladius sp. (Chironomidae). The profundal zonewas inhabitedby 22 species of Cnidaria, Turbellaria, Ostracoda, Hirudinea, Gastropoda, Bivalvia,Amphipoda, and Chironomidae.
The latest Holocene ostracod community, which was first recorded by Bron-shtein (1928), comprised (by original designation): Cypris pubera, Cypridopsisnewtoni, Cyclocypris laevis, Cyclocypris ovum, Cypria lacustris [=C. ophtalmica],Candona neglecta, Candona candida, Candona elpatiewskyi v. caucasica [=Fabae-formiscandona caucasica], Ilyocypris sp. [?=Ilyocypris bradyi and possibly I. gibba],Cytherissa lacustris,Cyprideis littoralis (=C. torosa) and Limnocythere sp. [?Limno-cythere inopinata]. The first three species have not been recognised by other authorsand may be misidentified. Candona dorsobiconcava (now placed into Fabaeformis-candona)was added to this list byBronshtein (1947). Fridman (1950) foundonly ninespecies living in the lake (Fig. 2.4) and Wilkinson and Gulakyan (2010) recordedthat the latest Holocene community (now considered to be Anthropocene) to be

2 Lake Sevan: Evolution, Biotic Variability and Ecological … 49
dominated by Neglecandona neglecta and Limnocythere inopinata with subordinateCandona candida and Fabaeformiscandona caucasica.
Fish were abundant in Lake Sevan during the Holocene including four subspeciesof the endemic Sevan Trout (Salmo ischchan):
The “Winter” Sevan Trout (Salmo ischchan ischchan), which fed principally onGammmarus formed two morphotypes; the shallow water morphotype spawnedin the north-western part of the lake and the deeper water morphotype spawned inthe south-eastern part of Great Sevan (Fortunatov et al. 1932; Dadikyan 1986).The “Summer” Sevan Trout (Salmo ischchan aestivalis), was present throughoutthe lake (Fortunatov 1927; Leshchinskaya 1950; Pavlov 1951).The Gegarkuni Sevan Trout (Salmo ischchan gegarkuni) spawned in the riversGavaraget, Tsakkar, Makenis and Masrik from September to January and in theupper reaches of the rivers Argichi and Gezal in autumn (Fortunatov 1927).The Bodzhak Sevan Trout (Salmo ischchan danilewskii) spawned in littoral watersof Little Sevan and western Great Sevan during the autumn (Fortunatov 1927;Pavlov 1951).
Of the other fish, the Sevan Khramulya (Capoeta capoeta sevangi) was commonin some parts of the lake and larger rivers where they fed on aquatic macrophytesand detritus (Dadikyan 1986). The Sevan Barbel (Barbus lacerta goktchaicus) wasnot common, but inhabited the travertine and stony areas of the lake bed, spawningbetween June and August and fed on zooplankton, gammarids, insects and trout eggs(Dadikyan 1986). In 1924, the Ladoga whitefish (Coregonus lavaretus ladoga) andLake Chudwhitefish (Coregonus lavaretus maraenoides), were introduced into LakeSevan for human consumption. They hybridised into the Sevan whitefish (Coregonuslavaretus sevanicus), which rapidly established itself and became common by themid-twentieth century (Pavlov 1947; Mailyan 1957; Yuzhakova 1985). Armenianriffle minnow (Alburnoides bipunctatus armeniensis) and gudgeon (Pseudorasboraparva) also occupied the lake.
2.5 Ecological Degradation During the Anthropocene
2.5.1 Ecological Parameters and Anthropogenic Change
During the early twentieth century, water loss was predominantly by evaporation, buta plan to reduce this by lowering the water level by 50 m was proposed by SoukiasManasserian in 1910 (Mikirtitchian 1962; Meybeck et al. 1997). This plan woulddrain Great Sevan entirely and leave a reduced Little Sevan, but it was believedthat the Sevan trout yield would increase by 8–10 times in the smaller lake. WhilstGeneral Secretary of the Central Committee of the Communist Party of the SovietUnion, Stalin initiated this project with the dredging of the River Hrazdan in 1933

50 I. P. Wilkinson
and the construction of a tunnel, which opened in 1949. As a result, and exacerbatedby increased irrigation and population pressure, during the 1950s (i.e. early in theAnthropocene) the fall in water level accelerated to over 1 m per year (Fig. 2.6).Stalin’s project was questioned in the mid-1950s and the Soviet government, underKhrushchev, ordered that the lake level should be maintained as high as possible, notfor environmental reasons, but to increase energy generation. However, the rate ofextraction reduced and, during the 1960s, water level stabilised at about 18 m belowthe original level. The average depth of Little Sevan had dropped from 50.9 to 39.5 mand that of Great Sevan had fallen from 37.8 to 22.8 m (Hovanesian and Bronozian1994). Although slowed, and occasionally reversed, water level continued to drop.By the 1970s and 1980s the fall in water level and volume had the effect of changingthe annual temperature regime and water chemistry, which had a knock-on influenceon the food chain and trophic structure. By 2001 the lake surface had fallen to itslowest level, some 20 m lower than its 1927 level (Fig. 2.3a), the surface area wasreduced by 12%, the average depth by 34.2% and the volume by 42.2%.
Sedimentation and water pellucidity during the Anthropocene are noticeably dif-ferent compared to those of the Holocene. At the end of the twentieth century, fol-lowing the fall in water level, sedimentation changed so that 85% of the lake bed areabecame blanketed by mud and silt (Resnikov 1984). Sands were confined to a verynarrow zone along the shoreline and small embayments, whilst coarser gravels wererestricted to the foot of the high mountain chain along the northern shore of LittleSevan. The widespread mud and silt has resulted in a decrease of pellucidity by 3.7times for Little Sevan and 3.9 times for Great Sevan, with transparency falling from14.3 m in 1930–1935 to 3.0 m in 1976–1978 and 4.5 m in 1985–1996 (Hovhannis-sian 1994). Pellucidity has been seen to deteriorate further when seismic activity andstorms agitate the lake bed.
As a consequence of shallowing, the average water temperature increased to 4.2–5.0 °C in Little Sevan and 8–12 °C in Great Sevan by 1982–1985 (Hovhannissian1994) and the heat capacity fell from 700 × 1012 kcal during the late Holocene (theearly twentieth century) to 460 × 1012 kcal during the Anthropocene (in the latetwentieth century). The seasonal temperature regime also changed (Fig. 2.7). Watertemperatures start to increase in early March, although thermally the lake remainsunstratified; a thermocline begins to develop at a depth of about 10 m in late Mayand reached about 15–20 m in June. The increase in water temperature during springis much more rapid in the modern lake compared to that of 1927–1933; April-Junesurface temperatures are up to 5 °C higher (Fig. 2.7). By 1982–1985 maximumsummer temperatures were reached a month earlier than in 1927–1933 with Julysurface temperatures being about 19 °C. In Great Sevan the temperature of bottomwaters during August and September rose from 1938 levels (5 °C) so that after 1961temperatures rarely fell to 7 °C and were generally 9 to 12 °C and up to 14 °C insome years (Barsukov et al. 1992; Fig. 2.7). Autumn water temperatures now fallmore rapidly compared to 1927–1933, mixing commences about a month earlierand at temperatures 3–4 °C higher than previously. During the late twentieth centurycomplete stratification breakdown took place in Great Sevan between October andDecember, with water temperatures averaging 11–12 °C (Gezalyan 1979). In Little

2 Lake Sevan: Evolution, Biotic Variability and Ecological … 51
Sevan the drop of water level caused a 50% decrease of the hypolimnion volume.Winter-surface temperatures were such that the lake became ice covered every 3–4 years, but since 1971 it has had an ice cover most winters between late Januaryand early April (when the ice was up to 30–40 cm thick). Winter bottom watertemperatures drop to a low of 2 °C in Little Sevan and 1 °C in Great Sevan (Gezalyan1979).
The pH of Lake Sevan was 9.25 in 1937, but Hovhannissian (1994) showed thatit was generally about 8.7–8.8 between 1950 and 1991, although abrupt decreasestook place in 1983 (pH 8.5) and 1988 (pH 8.2). These abrupt falls coincide with highmagnitude earthquakes, 6.9 and 7.0 respectively, in Lake Sevan when agitation oflow pHwaters at the water-sediment interface (generally 8.0–8.5) mixed with higherpH waters in the rest of the water column. The drop in pH was accompanied by anincrease in the proportion of compounds such as H2S and CH4 and the enrichment of,for example, V, Mn and Cu, perhaps as a result of the agitated sediment (Danielyanet al. 2011).
In 1928, although poorly circulating, Lake Sevan was oligotrophic with a highdissolved oxygen content throughout the year. The dissolved oxygen content showedseasonal variation with highest levels in spring and although it declined in autumn,the average oxygen minimum was between 5.6 and 11.8 mg/l (Ljatti 1932). Intenseanthropogenic eutrophication resulted in a sharp decrease in dissolved oxygen con-centrations (Fig. 2.8) heralded by the first bloom of cyanobacteria in 1964. However,by the 1970s the dissolved oxygen concentration in the bottom waters had becomeextremely low throughout the lake and between 1970 and 1973, anoxia was reachedin the profundal zone during the late summer, when stratificationwaswell established(Parparov 1990). Towards the end of the decade, dissolved oxygen concentrationswere between 6.23 and 11.08 mg/l in the littoral zone of the lake and between 4.56and 11.60 mg/l in the central part (Gezalyan and Khorlashko 1979).
Water pollution in Lake Sevan is a combination of anthropogenic factors such asagriculture, industry and population pressures, including sewage (Simonyan et al.2016) and, to a lesser extent, natural pressures related to seismic activity (Gulakyanand Wilkinson 2002; Danielyan et al. 2011). Climate change is also felt in termsof reduced flow of the rivers and streams entering the lake and the increased airtemperatures result in higher rates of evaporation. Thesemay have deleterious effectson water quality in the future.
Anthropogenic pollution has also contributed to variations in water chemistry(Fig. 2.8). Although the quantity of NH4
+, NO2− and NO3
− varies throughout theyear and from depth to depth, between 1929 and 1982–1989, mineral nitrogen flow-ing into the lake had increased from 229 to about 2290 tons. Between 1965 and1994 the average annual inflow of nitrogen was 7000 tons and total mineral nitrogenconcentration increased from 0.01 to 0.03 g/m3 (Hovhannissian 1994; Hovanesianand Bronozian 1994; Simonyan et al. 2016). The concentration of mineral phospho-rus, which washes into the lake from the catchment area decreased from 0.320 to0.015 g/m3, probably by its combination with calcium and its capture within thesedimentary succession (Hovanesian and Bronozian 1994). There are other con-cerns, for example, the Ministry of Nature Protection reported in 2000 that near the

52 I. P. Wilkinson
Fig. 2.8 Variations in water chemistry of Lake Sevan across the Holocene/Anthropocene transitionto demonstrate the effects of anthropogenic change. a The major collapse in oxygen concentrationin the deeper waters of Little (dashed line) and Great Sevan (solid line) during the late twentiethcentury. b The annual concentration of mineral nitrogen in surface (solid line) and bottom (dashedline) waters. c The annual concentration mineral phosphorus in surface (solid line) and bottom(dashed line) waters. Data from Hovhannissian (1994, 1996); Hovanesian and Bronozian (1994),Simonyan et al. (2016)

2 Lake Sevan: Evolution, Biotic Variability and Ecological … 53
Sevan Peninsula, the admissible level of copper pollution was exceeded by 32 times,oil derivatives by 90 times; and there are concerns over other pollutants includingmicroplastics and mercury in the river Masrik, a major tributary flowing into LakeSevan.
Heavy metal accumulation within the lake is not only a risk to the environment,but also human health via the food chain and drinking water. The distribution andquantity of heavy metal pollution in the water and sediment of Lake Sevan variesaccording to, for example, water depth, season and the occurrence and magnitude ofearthquakes. Since 1965, an average of 135 tons of heavy metals have entered LakeSevan each year (Hovhannissian 1994; Simonyan et al. 2016). Fe formed the highestconcentration in the lake, followed by Zn and (in the order of concentration) Mn, Cu,Co, Pb, Ni and Cd, together with small quantities of Cr (Hovhannissian 1994). A veryhigh anomaly of Cl, SO4, Mg and Cr occurred in the sediments of the central part ofGreat Sevan and very high Mo, Zn and Mn concentrations in the south-western part(Satian and Chilingarian 1994). The decreasing volume of lake water may accountfor the high concentration of heavy metals, which in 2005 comprised, in order ofconcentration, Fe, Mn, Zn, Ti, Cu, Cr, Co, Ni, Pb and Cd (Vardanyan and Ingole2006).
Many rivers entering Lake Sevan flow through rural rather than industrial ordensely inhabited areas so that they bear low concentrations of heavy metals. Incontrast, the waters of the Sotq and Masrik rivers have high concentrations of V, Fe,Cu, Ni, As, Mo and Pb related to gold mining, in some places exceeding admissiblelevels (Gevorgyan et al. 2016). These are particularly concerning as they are knownto cause deformities and malignant tumors in mammals.
Lake Sevan, and most rivers flowing into it, contain only low levelsof persistent organic pollutants such as α-Hexachlorocyclohexane (α-HCH),Dichlorodiphenyldichloroethylene (DDE) and polychlorinated biphenyl (PCB).There has been a significant reduction in agricultural activities requiring the useof large quantities of pesticides, although an average of about 13 tons have beenadded annually since 1965 (Hovanesian and Bronozian 1994; Simonyan et al. 2016).The presence of α-HCH is a reflection of the agricultural use of the insecticide Lin-dane. During the Soviet period DDT was widely used in the Sevan catchment area,residues ofwhich have degraded intoDDE,which is washed into the lake during peri-ods of raised precipitation and run-off. PCBs are present only in low concentrationsbecause there is little large-scale industrial activity in the catchment area.
2.5.2 Anthropocene Biotas
The physical changes in the morphology of the Lake Sevan during the second halfof the twentieth century resulted in considerable ecological degradation which isreflected in the trophic structure. The changewasprincipally causedby anthropogeniccauses, although natural phenomena also played a role. For example, seismic eventsresulted in changes in the biomass of zooplankton and encouraged “blooms” of

54 I. P. Wilkinson
blue-green cyanobacteria by increasing water circulation and enriching of surfacewaters with organic material (Legovich 1979; Simonyan 1991; Hovhannissian 1994;Gulakyan and Wilkinson 2002).
Anthropogenic change is demonstrated by the variability in the community struc-ture of the zoobenthos. The anoxic phase of the 1970s caused changes in the verticaldistribution, energy budgets and community structure.Detritivores formed the largestproportion of the total biomass of zoobenthos since records began, but their relativeproportion increased from an average of about 80% during 1928–1971 to about 98%by 2004. The trophic groups that were particularly affected by anoxia, were theherbivores and predators which remained at low levels between 1970 and 2010 (Jen-deredjian et al. 2012). Oligochaetes, particularly the dominant species Potamothrixalatus paravanicus, were more resistant to hypoxia compared to other zoobenthicgroups and thrived in the lake (Jonasson and Thorhauge 1976; Jenderedjian 1990).Amongst the nematodes, those characteristic of the late Holocene of Lake Sevan(Punctodora ratzeburgensis, Chromadorita leucarti and species of Chromadoridae)were replaced by hypoxia- and pollution-tolerant Tripyla glomerans andMonhysterapaludicola (Fridman 1950; Tsalolikhin 1976; Gagarin and Hakobyan 1991, 1992).
Macrophyte biomass collapsed during the late twentieth century from 900,000tons per year between 1930 and 1935 to 8000 tons per year in 1976–1978 (Hov-hanissian and Gavrielyan 2000). Diversity also collapsed from 20 common speciesto one common and 14 rare species as a result of habitat loss related to drainageof the littoral area and deteriorating water quality. By 1976 Potamogeton natans,P. pusillus, P. densus and Zannichellia palustris had reached a point of extirpation(Gambaryan 1979).
The reduction in the macrophyte community in the littoral zone is felt throughoutthe food chain and trophic structure causing a negative impact on the distribution ofthe biotas that used them for a food source, substrate, spawning ground and shelter.Chara and moss stands were particularly affected, and are confined mainly to shel-tered bays (Babayan et al. 2006). This in turn caused a decline in the oligochaeteRhyacodrilus coccineus, which is particularly associated with organic matter derivedfrommacrophytes, from28% in1938 (Fridman1950) to 9% in1984–1986 (Jendered-jian and Poddubnaya 1987). Hirudinea, gastropods and freshwater shrimps, whichfeed mainly on Chara and moss were also adversely affected (Stroykina 1957).Muds and silts now blanket areas that were once stone and sand substrates so thatTrichoptera and Ephemeroptera larvae, which show a preference for these substrates,were also adversely affected. While some biotas were in decline, others, notably fila-mentous green alga such as species of Zygnemataceae spread during the mid-1980s,becoming abundant at depths of 7–12 m.
Phytoplankton are important indicators of eutrophication in Lake Sevan, theirbiomass being related to increased levels of nitrogen and decreased phosphorus inthe lake water, which in turn encouraged the increase in phytoplankton from 0.2to 0.5 g/m3 between 1937 and 1962, to 2.0–3.0 g/m3 throughout the remainder oftwentieth century, and reaching 3.8 g/m3 in 2005 (Kazaryan 1979; Legovich 1979;Mnatsakanyan 1984; Hovhannisian et al. 2010). However there is seasonal varia-tion related to the Chlorine-a concentration and the nitrogen/phophorous ratio as

2 Lake Sevan: Evolution, Biotic Variability and Ecological … 55
shown by Hovhannisyan et al. (2010) who found that in 2005 there was a domi-nance of Chlorophyta in early summer, Cyanophyta in mid- and late summer andBacillariophyta in autumn.
Diatoms were particularly common in the lake between 1947 and 1982. How-ever, after 1983 green algae became the most abundant group, changes in the phy-toplankton community being brought about by the anthropogenic alteration of theecosystem. Species of eutrophication-tolerant Melosira entered the lake in the mid-1960s, formed a common element of the community by the 1970s and dominatedthe phytoplankton by 2005 (Kazaryan 1979; Hambaryan et al. 2007; Hovhannisyanet al. 2010). Melosira granulata is particularly abundant at a water depth of about20 m during the autumn when its vegetative phase begins, and Tabellaria sp. hasalso been recorded (Hovhannisyan et al. 2010). Amongst the green algae, numerousmembers of the order Volvocales (e.g. Ankistrodesmus, Hyaloraphidium, Lager-heimia, Golenkiniopsis, Treubaria and Tetrastrum) appeared in the shallow watersand Euglena colonised the pelagic zone. Newly introduced unicellular green algaeClosterium sp. andMougeotia sp. became particularly abundant and the dinoflagel-late Peridinium was also recorded (Kazaryan 1979). Hyaloraphidium rectum, whichis considered a green algae by some and a lower fungus by others, is also abundant(Ustinova et al. 2000). Since 2002, water level has been rising and Hovsepyan et al.(2014) recorded that by 2010, 96 taxa of phytoplankton were recorded in Lake Sevan(42% diatoms, 33% green algae and 15% cyanobacteria).
Cyanobacteria have increased in number during the Anthropocene formingblooms particularly between 1964 and 1972. Anabaena flosaquae bloomed in 1964,but Anabaena lemmermannii became the main contributor to the blooms between1966 and 1972 (Legovitch 1979). The raised bacterial concentration is in part a func-tion of water temperature and partly enrichment of the surface waters with organicmatter as a result of wind-induced water circulation in the shallower parts of the lakeand occasional agitation by seismic activity (Gulakyan and Wilkinson 2002).
Zooplankton comprised ten common species during the early twentieth century,after which a gradual and then a more rapid change took place, so that between 1972and 1980 biomass increased and rotifers became dominant (80% of the biomass).Further evolution of the ecosystem resulted in a decrease in biomass between 1981and 1985 with rotifers forming about 60-65%, although that ofDaphnia andCyclopsincreased in proportion (Simonyan 1988). The reduction in phytoplankton and zoo-plankton communities caused perturbations throughout the food web and, in 1983,resulted in a major decline in numbers, size and reproduction of whitefish (Simonyan1991).
By 2011, the national programme to raise the water level in Lake Sevan causedflooding of the coastal strip, rejuvenation of wetlands and the establishment ofrenewed habitats, resulting in increased diversity and biomass of the zooplankton,including the first record of 16 species of rotifers (including Trichocerca stylata andLecane (Monostyla) cornuta) and eight cladoceran species (e.g. Acanthodiaptomusdenticornis, Arctodiaptomus bacilifer, Diaphanosoma brachyurum, and Keratellaquadrata; Krylov et al. 2013). The cladoceran Daphnia (Ctenodaphnia) magna,which had been recorded very rarely in the first half of the twentieth century, became

56 I. P. Wilkinson
abundant (Krylov et al. 2007, 2010, 2013; Gerasimov and Krylov 2012) and dur-ing 2012 common rotifers (e.g. Conochilus unicornis and Synchaeta grandis) andcopepods (such as Acanthodiaptomus denticornis) were also recorded (Krylov et al.2015).
There appears to be a close relationship between the biomass of fish and that ofzooplankton. In 2004, the number of whitefish decreased sharply due to overfishingand infection of crucian carp by the parasite Ligula intestinalis and remained lowthrough to 2011. The reduced number of fish were unable to consume the daphnia,the remains of which accumulated on the lake floor in huge numbers after 2011. Thisresulted in elevated levels of nitrogen and phosphorus encouraging the increase incyanobacteria.
The zoobenthos of Lake Sevan has been studied many times so that a detaileddata base has been built up (Jenderedjian et al. 2012 and references therein). Thetotal biomass has varied considerably during the twentieth century; between 1948and 1971 the biomass had increased to 15.1 g/m2 (wet) and during the late 1970sit had reached 30.5–36.6 g/m2 (wet), but declined rapidly to 9.9–10.9 g/m2 (wet) in1989–1991 (Jenderedjian et al. 2012).Diversity has always been observed to decreasefrom littoral to profundal depths, although this was particularly pronounced between1984 and 2004 (Jenderedjian et al. 2012). Severe hypoxia had a huge impact on thezoobenthos, particularly between 1976 and 2004, when anoxia became an annualevent. Between 1928 and 1948 there were at least 20 more species living at depthsof 10–50 m compared to 1984–2004. The 22 species that inhabited the profundalzone between 1928 and 1948 comprised Cnidaria, Turbellaria, Ostracoda, Hirudinea,Gastropoda, Bivalvia, Amphipoda, and Chironomidae, whereas during the period ofacute hypoxia this was reduced to six species (one species of Oligochaeta, twoNema-toda and three Cyclopoida). The Anthropocene has been characterised by a numberof extirpations within the biota of Lake Sevan. One such amongst the gastropod com-munity isPlanorbis carinatus, empty shells ofwhich litter the beaches of Lake Sevan,yet no living specimens have been found since the drop in water level, although theyhave been found living in the Argichi River (Aghababyan et al. 2010). This speciesis particularly associated with aquatic macrophytes and its extirpation was probablycaused by the loss of habitat.
The Oligochaete community of Lake Sevan forms excellent indices for dysaero-bia as their vertical distribution is controlled by oxygenation of the water (Jendered-jian and Poddubnaya 1987; Jenderedjian 1996). Under the oligotrophic conditionsof 1937 to 1939, Potamothrix alatus paravanicus was found in 85% of the samplesexamined by Fridman (1950),Trichodrilus tubifex in 1%andRhyacodrilus coccineusand Limnodrilus hoffmeisteri in 2% of samples. During 1938–1948 oligochaetes rep-resented 36.2% of the total biomass (Fridman 1950), which remained comparativelystable (2.0–4.3 g/m2 wet) between 1955 and 1971, but increased to over 10 g/m2
(wet) between 1978 and 1985, before decreasing again to 7.6 g/m2 (wet) in 1989–1991. The acute hypoxia of the lake during the 1970s resulted in a major declinesuch that by 1984–1991 an almost monospecific assemblage comprising Potamoth-rix alatus paravanicus occupied the lake; the combined proportion of the other fourmembers of the community at that time (L. claparedeianus, T tubifex, R. coccineus

2 Lake Sevan: Evolution, Biotic Variability and Ecological … 57
and L. hoffmeisteri) amounted to about 2%. Jenderedjian et al. (2012) recorded thatduring 1984–2004 the zoobenthos biomass peaked at 20–25 m water depth, and thatOligochaetamade up 70–75%of the total.Of the remainderChironomidae comprised22–27%, mollusks 2%, and the remaining groups less than 1%.
Ostracods are considered in a little more detail as the preservation of their biomin-eralised carapace can be used to compare the community throughout the evolution ofLake Sevan and the impact of the Anthropocene changes of water depth and associ-ated environmental parameters including water temperature, oxygenation, changesof substrate, decline in macrophytes, and anthropogenic eutrophication on the Ostra-coda. Jenderedjian et al. (2012) listed nine species in Lake Sevan during 1976–2004: Neglecandona neglecta, C. candida, Fabaeformiscandona caucasica, F. dor-sobiconcava, Cyprideis torosa (as C. littoralis), Cytherissa lacustris, Limnocythereinopinata, Cyclocypris ovum andCypria ophtalmica (asC. lacustris).Wilkinson andGulakyan (2010) recorded eight species in a similar ostracod community in 1999–2000, although Cytherissa lacustris was not found living at that time, only deadspecimens being present, and Darwinula stevensoni was found living amongst thevegetation in the littoral zone, although it was very rare.
Two species,Cytherissa lacustris and Ilyocypris gibba,may have undergone extir-pation as a consequence of the eutrophication of the lake. Cytherissa lacustris iswidespread throughout Europe, Asia and North America, where it favours oligo-mesotrophic lakes, but oxygenation appears to be significant in its distribution as it isbadly affected by eutrophication (Danielopol et al. 1985, 1990). That appears to bethe case in Lake Sevan because living specimens were recorded during the 1920s and1940s (Bronshtein 1928; Fridman 1950) and it was listed as present 1976–2004 (Jen-deredjian et al. 2012). However, Wilkinson and Gulakyan (2010) found no evidenceof it living in the lake in 1999–2000, although well preserved, but empty carapaceswere found, sometimes in moderately large numbers. If the specimens recorded byJenderedjian et al. (2012) were living, then this may be a sign of ecological recovery.
Wilkinson and Gulakyan (2010) recorded dead carapaces of Ilyocypris gibbafrom Lake Sevan, but found no evidence that the species was living in the lakein 1999–2000. In addition, several species that populated the lake during the lateHolocene were not found living, although dead carapaces occur, very rarely, in mod-ern sediments: Ilyocypris bradyi, Pseudocandona cf. albicans, Prionocypris zenkeriand Herpetocypris chevreuxi. It is concluded that these dead specimens were eitherderived from older sediments, possibly reworked during seismic events disturbingthe lake-bed sediments, or introduced into the lake from neighbouring fluviatile envi-ronments. Ilyocypris bradyi, for example, shows a preference for water bodies fedby springs, and Meisch (2000) suggested that when present in lakes, it is probablyderived from nearby sources of spring water. Wilkinson and Gulakyan (2010) postu-lated that Fabaeformiscandona dorsobiconcava, which inhabited the deeper parts ofthe lake during theHolocene/Anthropocene transition, may have gone into extinctionas a result of the acute hypoxia established during the 1970s, although Jenderedjianet al. (2012) has since listed it amongst their assemblages.

58 I. P. Wilkinson
2.6 Ecological Recovery
Recent attempts to improve and at least partially reverse the ecological degradationof Lake Sevan began in 2002 with the introduction of legislation and managementpolicies (Lind and Taslakyan 2005). Schemes to increase water levels by transferringwater into the lake via the Arpa-Sevan Tunnel had begun in the 1980s with littlesuccess, but with the Arpa-Voratan extension in 2003, water levels began to increase.It was calculated that the lake would recover from its eutrophic condition if waterlevels were raised by c. 6 m at which level the hypolimnion should be re-established(Garibyan 2007). By 2014 water level had risen by 3.84 m from 1896.32 m to1900.16 m asl. Between 2002 and 2015, water transparency improved to 15.0 m inGreat Sevan and 13.5 m in Little Sevan during the summer and, respectively, 12.5and 11.0 m during the autumn, although there is seasonal variability caused by, forexample, springhomothermyandmixingofwater layers (Hakobyan and Jenderedjian2016). The increased water level broadened the littoral zone, increased the biospaceavailable for macrophytes which grow down to a depth of c. 10 m and reintroducedmarginal wetland habitats. Improvements in the environment of Great Sevan are seenin the wider distribution and increased biomass of bivalves by 2015. The biomass ofchironomids increased considerably exceeding oligochaetes (in terms of the averagebiomass of zoobenthos) in the shallower waters of Great Sevan during the springand autumn of 2015. Amphipods and mayflies are more common and new taxa havealso been introduced including the damselflies Ischnura pumilio and Coenagrionpulchellum and the gastropodCostatella (Physa) acuta. In the deeper waters of LittleSevan, oligochaetes (as a proportion of the total biomass of zoobenthos) increasedfrom 52.5% in 2012 to 75.9% in October 2013 and 93.8% in 2014, although inNovember 2015 there was a decrease to 69.4%. There are encouraging signs that thephase of recovery is progressing, although the political will is required for this tocontinue. However, this is only part of the problem because aspects such as sewage,chemical and heavy metal concentration must be controlled and problems associatedwith the pollution and rotting vegetation in the newly flooded areas have also to beovercome.
2.7 Conclusions
The Palaeogene Paratethys Sea shallowed during the Oligocene and Miocene so thatfluviatile and lacustrine conditions were established in the Sevan Basin during thePontian and throughout the Pliocene. However, the modern morphology of LakeSevan did not evolve until the Pleistocene and Holocene when periods of volcanicactivity dammed the basin.
The diverse biota which had been established in the pristine, oligotrophic,Holocene lake thrived through to at least 1928. Anthropogenic ecological degrada-tion, the inception of which began in the 1930s, accelerated rapidly during the second

2 Lake Sevan: Evolution, Biotic Variability and Ecological … 59
half of the twentieth century when water extraction for hydroelectric power genera-tion, irrigation and consumption exceeded replenishment, leading to changes inwaterlevel, water temperatures, dissolved oxygen concentrations, sedimentation, etc. Theprofound and accelerating environmental degradation,which began in approximately1950, marks the start of the Anthropocene in the Sevan Basin. The degradation ofthe physical environment was felt throughout the trophic web resulting in a declinein richness and diversity, and an increase in extinction and extirpation of macro-phytes, zoobenthos and zooplankton. Higher in the food chain, fish stocks declinedand introduced ‘exotic’ species out-competed elements of the endemic population. Aphase of recovery commenced in 2002, when the Government of Armenia adoptedthe EU Water Framework Directive’s approaches in water resource management,monitoring and planning.
Acknowledgements The author wishes to thank Dr S. Z. Gulakyan for his collaboration duringthe original project on Lake Sevan, and his assistance with the translation of the Armenian andRussian data sets. The author publishes with the permission of the Executive Director of the BritishGeological Survey (U.K.R.I.)
References
Afanasev GD (1933) Sediment of Lake Sevan. The basin of Lake Sevan (Geokcha), vol 3, part 2,pp 53–154, Leningrad (in Russian)
AghababyanK, AnanianV, AvetisyanA, Badalyan J, DanchenkoA, HakobyanN, HambardzumyanA, Harutyunova L, Hovhannesyan V, Kalashian M, Karagyan G, Khachatryan MM, MirumyanL, Aghasyan A, Aghasyan L, Amiryan S, Danielyan F, Eghiazaryan E, Gabrielyan B, YavruyanE (2010) The red book of animals of the Republic of Armenia. Ministry of Nature Protection ofthe Republic of Armenia, Yerevan
Aleshinskaya ZV (1980) Results of the radiocarbon dating of the Sevan Lake Holocene deposits.Isotopic and geochemical methods in biology, geology and archaeology, Abstracts, Tartu, pp 5–7
Aleshinskaya Z, Pirumova L (1982) Morphological studies of diatoms from Pliocene lacustrinedeposits of Armenia. In: Menner B, Druschiza B (eds) The nature of the historical developmentof fossil organisms. University of Moscow, Moscow, pp 97–109 (in Russian)
Arnoldi LV (1929) Bottom productivity in Lake Sevan. Trudy Sevanskoi GidrobiologicheskoiStantsii 1:1–96 (in Russian)
Aslanian AT, Sayadian YV (1984) Excursion 010: Neotectonics of Armenia. In: Aslanian AT (ed)Excursions to the Armenian Soviet Socialist Republic. Guide Book for the 27th InternationalGeological Congress, pp 53–86
Aslanian AT, Vehuni AT (1984) General geological features of the Armenian SSR: stratigraphy.In: Aslanian AT (ed) Excursions to the Armenian Soviet Socialist Republic. Guide Book for the27th International Geological Congress, pp 8–24
Babayan A, Hakobyan S, Jenderedjian K,Muradyan S, VoskanovM (2006) Lake Sevan: experienceand lessons learned brief. Lake Basin management initiative regional workshop for Europe,Central Asia and the Americas, Saint Michael’s College in Vermont, USA, 18–21 June 2003, pp347–362
Barsukov VL, Beliaev AA, Bakalin VA, Igumnov VA, Ibragimova TL, Serebrennikov VS, Sul-tankhojaev AN (1992) Geochemical methods for earthquake prediction. Moscow, Nauka, 213pp(in Russian)

60 I. P. Wilkinson
Bronshtein ZS (1928) Contribution to the identification of the ostracod fauna of the Caucuses andPersia.Works North-Caucuses Hydrobiol Station 2:67–119 (in Russian with a German summary)
Bronshtein ZS (1947) Faune de l’URSS. Crustacés, volume 2, numéro 1: Ostracodes des eauxdouces. Zoologicheskiy Institut Akademii Nauk SSSR, n.s. 31, 1–339 (English translation, Fresh-water Ostracoda, 1988, Oxonian Press, New Delhi)
Bubikyan SA (1984) Recent Ostracoda from the bottom beds of the south-western part of LakeSevan. Izvestiya Akademii Nauk Armyanskoi SSR, Nauki o Zemle 37:10–24 (in Russian)
Cotton LJ, Zakrevskaya EY, van der Boon A, Asatryan G, Hayrapetyan F, Israyelyan A, KrijgsmanW, Less G, Monechi S, Papazzoni CA, Pearson PN, Razumovskiy A, Renema W, ShcherbininaE, Wade BS (2017) Integrated stratigraphy of the Priabonian (upper Eocene) Urtsadzor section,Armenia. Newsl Stratigr 50(3):269–295
Dadikyan MG (1986) Fishes of Armenia. AN Arm. SSR, Erevan 245pp (in Russian)Danielopol DL, Geiger W, Tölderer-Farmer M, Orellana CP, Terrat MN (1985) The Ostracoda ofMondsee: spatial and temporal changes during the last 50 years. In: Danielopol DL, Schmidt R,Schultz E (eds) Contributions to the paleolimnology of the Trumer Lakes (Salzburg) and the LakesMondsee, Attersee and Traunsee (Upper Austria). Limnologisches Institut der ÖsterreichischenAkademie der Wissenschaften, Mondsee, pp 99–121
Danielopol DL, Olteanu R, Löffler H, Carbonel P (1990) Present and past geographical ecologicaldistribution of Cytherissa lacustris (Ostracoda, Cytherideidae). In: Danielopol DL, Carbonel P,Colin JP (eds) Cytherissa (Ostracoda) - The Drosophila of Paleolimnology. Bulletin de l’Institutde Géologie du Bassin d’Aquitaine 47:97–118
Danielyan K, Gabrielyan B, Minasyan S, Chilingaryan L, Melkonyan G, Karakhanyan A, Toza-lakyan P, Vanyan A, Pirumyan G, Ghukasyan E, Sarksyan L (2011) Integral evaluation ofenvironmental status of Lake Sevan, Yerevan. “SHD”/UNEPCom, pp 1–42 (in Russian)
Domrachev PF (1940) The influence of the drop of water level of Lake Sevan (Goktcha) on itsbiological productivity. Proc All-Union Geogr Soc 42:395–399 (in Russian)
EastwoodWJ, LengMJ, RobertsN,Davis B (2007)Holocene climate change in the easternMediter-ranean region: a comparison of stable isotope and pollen data from a lake record in southwestTurkey. J Quat Sci 22:327–341
Filatov NN (1983) Dynamics of lakes. Gidrometeoizdat, Leningrad 166pp (in Russian)Fortunatov MA (1927) Lake Sevan trout co-species Salmo ischchan Kessler. Trudy SevanskoiGidrobiologicheskoi Stantsii 1:1–131 (in Russian)
Fortunatov MA, Fortunatova KR, Kulikova EV (1932) Evaluation of natural resources in LakeSevan. Trudy Sevanskoi Gidrobiologicheskoi Stantsii 3:1–182 (in Russian)
Fridman GM (1950) Benthonic fauna of Lake Sevan. Trudy Sevanskoi Gidrobiologicheskoi Stantsii10:7–92 (in Russian)
Gagarin VG, Hakobyan SH (1991) On the Nematoda fauna of Lake Sevan. Biol Bull InternalWatersLeningrad 90:25–28 (in Russian)
Gagarin VG, Hakobyan SH (1992) Ecological review of free living Nematoda of Lake Sevan. BiolBull Internal Waters Leningrad 92:36–38 (in Russian)
Gambaryan MG (1979) Temperature regime of Lake Sevan. Trudy Sevanskoi GidrobiologicheskoiStantsii 17:123–129 (in Russian)
Garibyan M (2007) In: Agyemang TK (ed) Lake Sevan water levels. Hydrometeorological Agency,Ministry of Nature Protection, Sevan, Armenia
Gerasimov YV, Krylov AV (2012) Effect of fish on the zooplankton of Lake Sevan (Armenia).Kaliningrad, pp 90–91 (in Russian)
Gevorgyan GA, Mamyan AS, Hambaryan LR, Khudaverdyan SK, Vaseashta A (2016) Environ-mental risk assessment of heavy metal pollution in Armenian river ecosystems: case study ofLake Sevan and Debed River catchment basins. Polish J Environ Stud 25:2387–2399
Gezalyan MG (1979) Temperature regime of Lake Sevan. Trudy Sevanskoi GidrobiologicheskoiStantsii 17:5–23 (in Russian)
Gezalyan MG, Khorlashko LI (1979) Oxygen regime of Lake Sevan. Trudy Sevanskoi Gidrobio-logicheskoi Stantsii 17:24–37 (in Russian)

2 Lake Sevan: Evolution, Biotic Variability and Ecological … 61
Golovenkina N (1977) Microscopical investigation of diatomites from the Sisian region, ArmenianSSR. Leningrad University News 3:39–47 (in Russian)
Gulakyan SZ, Wilkinson IP (2002) The influence of earthquakes on large lacustrine ecosystems,with particular emphasis on Lake Sevan, Armenia. Hydrobiologia 472:123–130
Hakobyan SH, Jenderedjian KG (2016) Current state of the zoobenthos community of Lake Sevan.Armenia Nat. Acad. Sci., Nat Sci 2:18–22
Hakobyan MA, Djomin YL (1982) Numerical modeling currents of the Lake Sevan. Metrol Hydrol8:68–74 (in Russian)
Hambaryan LH,Hovhannisyan RH,HovsepyanAA (2007) Dynamics of Lake Sevan phytoplanktonabundance in 2005. Agroscience 7:355–360 (in Russian)
Hovanesian R, Bronozian H (1994) Restoration and management of Lake Sevan in Armenia:problems and prospects. Lake Reserv Manage 9:178–182
Hovhannissian RH (1996) Evolution of eutrophication processes of Lake Sevan and how to controlthem. Proceedings of International Conference, Lake Sevan: problems and strategies of action.Sevan, Armenia, 13–16 October 1996, Yerevan, pp 81–85
Hovsepyan R (2013) First archaeobotanical data from the basin of Lake Sevan. Veröffentlichungendes Landesamtes für Denkmalpflege und Archäologie Sachsen-Anhalt 67:93–105
Hovhanissian R, Gabrielyan B (2000) Ecological problems associated with biological resource useof Lake Sevan, Armenia. Ecol Eng 16:175–180
Hovhannissian RO (1994) Lake Sevan Yesterday, Today. Armenia Nat. Acad. Sci., Yerevan, 478pp(in Russian with extended summaries in English and Armenian)
Hovhannisyan RH, Hovsepyan AA, Hambaryan LR (2010) Phytoplankton distribution and abun-dance in relation to physico-chemical factors in Lake Sevan, Armenia. Armenia Nat. Acad. Sci.,Nat Sci 2:28–37
Hovsepyan AA, Khachikyan TG, Hambaryan LR (2014) Influence of Lake Sevan catchment basinphytoplankton community structure on the same of the lake. In: Shin H-S, Nalbandyan M (eds)Sustainable management of water resources and conservation of mountain lake ecosystemsof Asian countries. Proceedings of AASSA regional workshop, 25–29 June 2014. Institute ofGeological Sciences, Armenia Nat. Acad. Sci., Yerevan, pp 102–112
Jenderedjian KG (1990) Seasonal dynamic of Potamothrix hammoniensis in model semi-transectof Lake Sevan. Biology, ecology and productivity of water invertebrates. Navuka i Technika,Minsk, pp 214–217 (in Russian)
JenderedjianK (1996)Energybudget ofOligochaeta and its relationshipwith the primary productionof Lake Sevan, Armenia. Hydrobiologia 334:133–140
Jenderedjian KG, Poddubnaya TL (1987) Species composition and distribution of Oligochaetes inLake Sevan. Biol J Armenia 40:36–42 (in Russian)
JenderedjianK,Hakobyan S, StapanianMA (2012) Trends in benthicmacroinvertebrate communitybiomass and energy budgets in Lake Sevan, 1928–2004. Environ Monit Assess 184:6647–6671
Jonasson PM, Thorhauge F (1976) Population dynamics of Potamothrix hammoniensis in the pro-fundal of Lake Esrom with special reference to environmental and competitive factors. Oikos27:193–203
Kazaryan AG (1979) Phytoplankton of Lake Sevan. Trudy Sevanskoi Gidrobiologicheskoi Stantsii17:75–87 (in Russian)
Krasheninnikov VA, Grigorian SM, Martirosian YA, Ptuchian AE, Zaporozhets NI (1986) SectionLandzhar (USSR, Armenia). In: Pomerol C, Premoli-Silva I (eds) Terminal Eocene events.Developments in Palaeontology and Stratigraphy vol 9, pp 133–136
Krylov AV, Akopyan SA, Nikogosyan AA (2007) Modern species composition of the zooplanktonof Lake Sevan in Autumn. Inland Water Biol 4:48–54
Krylov AV, Akopyan SA, Nikogosyan AA, Hayrapetyan AO (2010) Zooplankton of Lake Sevanand its tributaries. In: Ecology of Lake Sevan in the period of high water level. The Resultsof Research of the Russian–Armenian Biological Expedition on the Hydroecological Survey ofLake Sevan (Armenia) (2005–2009)). Nauka, Makhachkala, pp 168–200

62 I. P. Wilkinson
Krylov AV, Gerasimov YV, Gabrielyan BK et al (2013) Zooplankton in Lake Sevan during theperiod of high water level and low fish density. Inland Water Biol 6:203–210
Krylov AV, Romanenko AV, Gerasimov YV, Borisenko ES, Hayrapetyan AO, Ovsepyan AA,Gabrielyan BK (2015) Distribution of plankton and fish in Lake Sevan (Armenia) during theprocess of mass growth of cladocerans. Inland Water Biol 8:54–64
Ljatti SJ (1932) The lake bed of Sevan. Materials on the investigation of Lake Sevan and its basin.Tiflis, 42pp
Legovich NA (1979) “Blooms” in the water of Lake Sevan (Observations 1964–1972). TrudySevanskoi Gidrobiologicheskoi Stantsii 17:51–74 (in Russian)
Leshchinskaya AS (1950) Reproductive biology of trout in Lake Sevan. Trudy SevanskoiGidrobiologicheskoi Stantsii 10:93–175 (in Russian)
Lind D, Taslakyan L (2005) Restoring the fallen Blue Sky: management issues and environmentallegislation for Lake Sevan, Armenia. Environs 29:31–103
Mailyan RA (1957) Whitefish of Lake Sevan. Trudy Sevanskoi Gidrobiologicheskoi Stantsii15:136–196 (in Russian)
Meisch C (2000) Freshwater Ostracoda of Western and Central Europe. Süßwasserfauna vonMitteleuropa, 8/3 Crustacea: Ostracoda. Spektrum Akademischer Verlag, Heidelberg, 521pp
Meybeck M, Akopian M, Andréassian V (1997) What happened to Lake Sevan? SILNews 23Mikirtitchian L (1962) Lake Sevan development projects in Soviet Armenia. Studies on the SovietUnion, New Series, Munich II:92–106
Milanovskii EE (1968) Recent Tectonics of the Caucasus. Nedra, Moscow, 484pp (in Russian)Mnatsakanyan AT (1984) Limnology of mountainous lakes. Acad. Sci. Armenian SSR, Yerevan,pp 172–173 (in Russian)
Neill I, Meliksetian K, Allen MB, Navasardyan G, Kuiper K (2015) Petrogenesis of mafic collisionzone magmatism: the Armenian sector of the Turkish–Iranian Plateau. Chem Geol 403:24–41
Nevesskaya LA, Goncharova IA, IÍina LB, Paramonova NP, Khondkarian SO (2003) The Neogenestratigraphic scale of the Eastern Paratethys. Stratigr Geol Correl 11:105–127
Parparov AS (1990) Some characteristics of the community of autotrophs of Lake Sevan inconnection with its eutrophication. Hydrobiologia 191:15–21
Parparova RM (1979) Hydrochemical conditions in Lake Sevan in 1976. Trudy Sevanskoi GidrobiolStantsii 17:38–50 (in Russian)
Pavlov PI (1947) Spawning grounds and the impact of the fall in water level on trout population inLake Sevan. Trudy Sevanskoi Gidrobiologicheskoi Stantsii 12:93–140 (in Russian)
Pavlov PI (1951) Contribution to the Sevan trout biology. Trudy Sevanskoi GidrobiologicheskoiStantsii 12:93–140 (in Russian)
Poretzky W (1953) Fossil diatoms from Nurnus and Arzni, Erevan region, Armenian SSR. DiatomSymposium, Leningrad, pp 55–107 (in Russian)
Resnikov SA (1984) Biogenic elements of sediments in Lake Sevan. Exp Field Res HydrobiontsLake Sevan 19:1–17
Satian MA, Chilingaryan GV (eds) (1994) Geology of Sevan. Armenia Nat. Acad. Sci., Yerevan,181pp (in Russian)
Savvaitova KA, Petr T (1999) Fish and fisheries in Lake Sevan, Armenia, and in some other highaltitude lakes ofCaucasus. In: Petr T (ed) Fish andfisheries at higher altitudes:Asia. FAOFisheriesTechnical Paper 385, Rome, pp 279–304
Sayadyan YV (1978) Postglacial times in Armenia and adjacent regions. Studia GeomorphologicaCarpatho-Balcanica 12:77–93
Sayadyan YV, Aleshinskaya ZV, Khanzadyan EV (1977) Late glacial deposits and archaeology ofthe Sevan Lake. In: Sayadyan YV (ed) Geology of the Quaternary period (Pleistocene). Acad.Sci. Armenian SSR, Yerevan, pp 91–109
Sayadyan YV (1991) Archaeological relic and Sevan Lake history. The history of lakes Sevan,Issyk-Kul, Balkhash, Zaisan, and Aral, Leningrad, Nauka, pp 31–37
Sayadyan, YV (2006) Upper Miocene, Pliocene, and Quaternary stratigraphic reference sectionsof large intermontane depressions in Armenia. Dokl Earth Sci 407:217–219

2 Lake Sevan: Evolution, Biotic Variability and Ecological … 63
Shcherbinina EA, Iakovleva AI, Zakrevskaya, EY (2017) Middle Eocene to Early Oligocene nan-nofossils and palynomorphs from the Landzhar Section, Southern Armenia: zonal stratigraphyand palaeoecology. Stratigr Geol Correl 25:557–580
SimonyanAA (1988) Zooplankton in changing conditions of awater body (case study: Lake Sevan).Ph.D. thesis, Leningrad, pp 43 (in Russian)
Simonyan (1991) Zooplankton of Lake Sevan. Yerevan, 298pp (in Russian)Simonyan A, Gabrielyan B, Minasyan S, Hovhannisyan G, Aroutiounian R (2016) Genotoxicityof water contaminants from the basin of Lake Sevan, Armenia Evaluated by the Comet Assayin Gibel Carp (Carassius auratus gibelio) and Tradescantia Bioassays. Bull Environ ContamToxicol 96:309–313
Slobodchikov BY (1951) Hydrochemical regime of Sevan Lake according to the data of 1947–1948.Trudy Sevan. Gidrobiologicheskoi Stantsii 12:5–28
Stroykina VG (1957) Nourishment of Gammarus in Lake Sevan. Trans Sevan Hydrobiol Station15:89–107 (in Russian)
Tsalolikhin SY (1976) Free living Nematodes as indicators of pollution in freshwaters. MethodsBiol Anal Freshwaters 50:84–86 (in Russian)
Ustinova I, Krienitz L, Huss VAR (2000)Hyaloraphidium curvatum is not a green alga, but a lowerfungus;Amoebidiumparasiticum is not a fungus, but amember of theDRIPs. Protist 151:253–262
Vardanyan LG, Ingole B (2006) Studies on heavymetal accumulations in aquatic macrophytes fromSevan (Armenia) and Carambolim (India) lake systems. Environ Int 32:208–218
Waters CN, Zalasiewicz JA, Williams M, Ellis MA, Snelling AM (eds) (2014) A stratigraphicalbasis for the Anthropocene? Geological Society, London, Special Publications, vol 395, 309pp
Waters CN, Zalasiewicz J, Summerhayes C, Barnosky AD, Poirier C, Gałuszka A, Cearreta A,Edgeworth M, Ellis EC, Ellis M, Jeandel C, Leinfelder R, McNeill JR, Richter D de B, SteffenW, Syvitski J, Vidas D, Wagreich M, Williams M, Zhisheng A, Grinevald J, Odada E, OreskesN, Wolfe AP (2016) The Anthropocene is functionally and stratigraphically distinct from theHolocene. Science 351(6269), https://doi.org/10.1126/science.aad2622
Wilkinson IP, Gulakyan SZ (2010) Holocene to recent Ostracoda of Lake Sevan, Armenia:biodiversity and ecological controls. Stratigraphy 7:301–315
Wilkinson IP, Poirier C, Head MJ, Sayer CD, Tibby J (2014) Microbiotic signatures of the Anthro-pocene in marginal marine and freshwater palaeoenvironments. In: Waters CN, ZalasiewiczJA, Williams M, Ellis MA, Snelling AM (eds) A stratigraphical basis for the Anthropocene?Geological Society, London, Special Publications, vol 395, pp 185–219
Wilkinson IP,BubikyanSA,GulakyanSZ (2005)The impact of lateHolocene environmental changeon lacustrine Ostracoda in Armenia. Palaeoecol Palaeogeogr Palaeoclimatol 225:187–202
Yuzhakova GG (1985) Growth and sexual maturation of Sevan whitefish. Trudy SevanskoiGidrobiologicheskoi Stantsii 20:188–198 (in Russian)
Zalasiewicz J, Waters C, Williams M, Aldridge DC, Wilkinson IP (2018) The stratigraphicalsignature of the Anthropocene of England and its wider context. Proc Geol Assoc 120:482–491
Zalasiewicz J, Williams M, Barnosky T, Wilkinson IP (2019) Late Quaternary extinctions. In:Zalasiewicz J, Waters C, Summerhayes C, Williams M (eds) The Anthropocene as a geologictime unit. Cambridge University Press, Cambridge, pp 115–119

Chapter 3Past and Current Changes in the LargestLake of the World: The Caspian Sea
Suzanne A. G. Leroy, Hamid A. K. Lahijani, Jean-Francois Crétaux,Nikolai V. Aladin and Igor S. Plotnikov
Abstract The Caspian Sea (CS), located between Europe and Asia, is the largestlake in the world; however, its physical environment and its floor have oceanic char-acteristics. The CS is composed of a very shallow north sub-basin with a very lowsalinity mostly below 5 psu. The middle and southern sub-basins are deep and havea salinity of c. 13 psu. To the east, the Kara-Bogaz-Gol, a hypersaline lagoon, is con-nected to the middle sub-basin. The CS is endorheic and therefore very sensitive tochanges in hydrography and climate. Because of its long history of isolation follow-ing the disconnection of the Caspian Sea from the Paratethys c. 6 million years ago,this ancient lake has many endemic species. The harsh environment of its brackishwaters and the repeated salinity changes over the millennia, however, do not allowfor a high biodiversity. The benthos is more varied than the plankton. The historyof water-level changes remains poorly known even for the last centuries. Neverthe-less, the amplitude was of >150 m in the Quaternary, several tens of meters in theHolocene and several meters in the last century. Many factors affect its natural state,such as petroleum pollution (an industry dating back to Antiquity), nutrient increase
S. A. G. Leroy (B)Aix Marseille Univ, CNRS, Minist Culture, LAMPEA, UMR 7269, 5 rue du Château del’Horloge, 13094 Aix-en-Provence, Francee-mail: [email protected]; [email protected]
H. A. K. LahijaniIranian National Institute for Oceanography and Atmospheric Science, #3, Etamadzadeh St.,Fatemi Ave, 1411813389 Tehran, Irane-mail: [email protected]
J.-F. CrétauxLaboratoire d’Etudes en Géophysique et Océanographie Spatiale, UMR5566, Université deToulouse, LEGOS/CNES, 14 Ave. Edouard Belin, 31400 Toulouse, Francee-mail: [email protected]
N. V. Aladin · I. S. PlotnikovLaboratory of Brackish Water Hydrobiology, Zoological Institute, Russian Academy of Sciences,Universitetskaya nab. 1, 199034 St. Petersburg, Russiae-mail: [email protected]
I. S. Plotnikove-mail: [email protected]
© Springer Nature Switzerland AG 2020S. Mischke (ed.), Large Asian Lakes in a Changing World, Springer Water,https://doi.org/10.1007/978-3-030-42254-7_3
65

66 S. A. G. Leroy et al.
(alongside >14 million inhabitants along the coast), invasive species (e.g. the combjelly Mnemiopsis leidyi), overfishing (including sturgeon) and modifications of itscoastline (e.g. sand extraction). In comparison to other ancient lakes, the CS surfacetemperature has suffered from the fastest increase on record. Owing to the complexnatural state of the CS, it is not easy to identify the Holocene-Anthropocene transi-tion, although it may be suggested that is was approximately AD1950 when intensehuman activity started to modify the lake.
Keywords Hydrography · Brackish water ·Water-level change · Endemism ·Anthropogenic impact
3.1 Introduction
The Caspian Sea (CS) is currently the largest lake on Earth with an area slightlygreater than Germany. It lies at the geographical border between Europe and Asia(Fig. 3.1). Originally it was created tectonically when the Paratethys Sea startedsplitting in smaller water bodies some 5.6 million years ago (Hinds et al. 2004). Itmay therefore be counted as an ancient lake. It can be considered to have been anendorheic water body for the last c. 2.6 million years, with only occasional outflow tothe Black Sea and inflow from the Aral Sea. This situation has led to the developmentof endemism in many groups of animals and plants, living in the water or dependingon it (e.g. the seals; Dumont 1998). The close nature of its water body also favourswide changes in water levels in reaction to changes in climate and in themain feedingrivers, such as the Volga (from the North) and the Amu-Darya (from the South-East,with decreasing frequency until perhaps the fifteenth century). The CS water level(CSL) has often changed dramatically: during its geological lifetime by more than150 m, possibly several hundreds of metres (Kroonenberg et al. 1997; Mayev 2010;Forte and Cowgill 2013), during the Holocene by several tens of meters (Kakroodiet al. 2012), during the last millennium by >10 m (Naderi Beni et al. 2013) andduring the last century by >3 m (Arpe and Leroy 2007; Chen et al. 2017; Fig. 3.2).However, CSL changes remain poorly identified, and their reasons not completelyunderstood, even for the last decades.
Humans have lived along the shores of the CS since the Late Pleistocene at least,e.g. no less than four sites of Neanderthal occupation with Mousterian tools areknown (Dolukhanov et al. 2010). Recently increasing human pressure is felt aroundtheCS, as economic development is taking place. Nowadays the impact on the coastalenvironment and economical activities around and in the CS cause significant socio-economic problems. For many years, the main activity in the area was related tothe fishery industry, as the CS holds the most appreciated sturgeon species in theworld, with the export of caviar. In the last decades, the petroleum (oil and gas)industry has boomed, especially with large offshore infrastructures, e.g. offshoreBaku (Azerbaijan’s capital) and in the Kashagan offshore oil field (N CS).

3 Past and Current Changes in the Largest Lake of the World … 67
Fig. 3.1 Location map with bathymetry. The black lines through the Caspian Sea show the limitbetween its three sub-basins. The green contour is the zero in the Baltic datum

68 S. A. G. Leroy et al.
3.2 Modern Setting
3.2.1 Physical Geography
The CS is the largest endorheic water body of the world. It has an area of~386,400 km2, excluding the Kara-Bogaz-Gol (Fig. 3.1; Table 3.1). It is made ofthree sub-basins, deepening from very shallow in the north (5–10 m deep) to thedeepest sub-basin in the south (maximal water depth 1025 m). The middle sub-basinhas a maximum depth of 788 m (Kostianoy and Kosarev 2005) and is separatedfrom the north by the Mangyshlak Threshold and from the south sub-basin by the
Table 3.1 The Caspian Sea in numbers
Caspian Sea Information Additionalexplanation
Source
Size 386,400 km2 in 2017 Slightly larger thanGermany
Arpe et al. (2018)
Level At present 28 m bsl Over last 21 ka, fromc. +50 to c. −113 m
Several sources, seetext
Depth Maximum in South:1025 m
North: max. 25 mMiddle: max 788 m
Kostianoy andKosarev (2005)
Volume 78,200 km3 Dumont (1998)
Catchment ~3,500,000 km2
(with E. drainage)Catchment/surfacearea ratio: from ~7:1to 10:1
Kostianoy andKosarev (2005),Chen et al. (2017)
Length of coastline 7500 km At water level of27 m bsl
Kostianoy andKosarev (2005)
N-S length and W-Ewidth
Length 1200 km Width 200–450 km,average 350 km
Kostianoy andKosarev (2005)
Surface watertemperature
Summer 28 °C in theS and 23 °C in the N
Winter 0 °C in the Nwith ice cover and10 °C in the S
Kostianoy andKosarev (2005)
Salinity Summer 3 in the Nand 13 in the S
Winter 5 in the N and13 in the S
Kostianoy andKosarev (2005)
Surface pH anddissolved oxygen
Summer pH 8, DO6 ml/l
Winter pH 8, DO10 ml/l in N to 7 ml/lin S
Kostianoy andKosarev (2005)
pH and dissolvedoxygen at 100 m
Summer pH 8, DO6 ml/l in N, 4 ml/l inS
Winter, pH 8, DO7 ml/l in N, 4 ml/l inS
Kostianoy andKosarev (2005)
River inflow 290 km3/year 84% Volga Lahijani et al. (2008;this paper)
Number ofinhabitants in thecatchment
>80 millions In five countries Lahijani et al. (2008)

3 Past and Current Changes in the Largest Lake of the World … 69
Apsheron Sill (150 m; Kuprin 2002). An ecogeographical classification of the CSbased on its physical parameters shows the justification of the division into threesub-basins, as well as the role of the distance to the shore (Fendereski et al. 2014).The volume of the CS is 78,200 km3 and this makes it three times larger than LakeBaikal (Messager et al. 2016). The north sub-basin is very shallow, and any smallvertical change is translated in vast inundation or emersion along the north coast (theCaspian Depression) reaching a horizontal amplitude of c. 1000 km during the lastglacial-interglacial cycle.
The CS is located in a depression bordered by the Caucasian mountains in theWest, the central Asian plateaus and desert in the East, the Russian and Kazakhplains in the north, and by the Alborz Mountains in the south (Figs. 3.1 and 3.3).The CS watershed is approximately 3.5 million km2 and it covers nine countries:Armenia, Azerbaijan, Georgia, Iran, Kazakhstan, Russia, Turkey, Turkmenistan andUzbekistan.
The CSL was at 28 m below world sea level (bsl), geodetical station Kronstadt,Baltic, Russia, in 2018.1 Recent CSL changes are not only rapid, e.g. a hundredtimes faster than global ocean level rise in the twentieth century, but also large(Kroonenberg et al. 1997). The instrumental record, starting in 1837, shows a 3-mamplitude with a minimum in 1977 and maxima in 1929 and 1995 (Voropayev 1997;Leroy et al. 2006), thus ranging between 26 and 29 m below sea level (Fig. 3.2a).Changes of the CSL can, moreover, be very abrupt as observed after 1930 whenthe level dropped by 2 m in approximately ten years and also when the water levelincreased by 2 m between 1979 and 1996. Since then, the CSL has dropped again by1 m (June 2018). Between 1996 and 2016, the water level fell by 7–10 cm per year(Arpe et al. 2014; Chen et al. 2017). Since 2016, the CSL seems to have stabilizedto equilibrium at ~−28 m (Fig. 3.2b). As it is an endorheic lake, the CSL variationsare mostly controlled by water discharge from the rivers, the direct precipitation andevaporation over the CS and the discharge to the Kara-Bogaz-Gol (Kosarev et al.2009).
Around 130 rivers flow into the CS from the north, west and southern coasts.They supply annually 250 km3 of water and 70 million tons of sediments. The Volgadischarge into the CS is highly variable and in total, it represents between 80 and90% of the surface water inflow (Fig. 3.2c).
Because of its great meridional extension, the CS straddles several climatic zones(Fig. 3.3). The northern part of the drainage basin lies in a zone of temperate con-tinental climate with the Volga catchment well into the humid mid-latitudes. Theemerged Volga delta (the Caspian Depression) forms a low-lying area and is themost arid region of European part of the Russian Federation (UNEP 2004). Thewestern coast features a moderately warm and dry climate, while the southwesternand the southern regions fall into a subtropical humid climatic zone. The easterncoast is desert.
1Since 1961, the water level reference is the Kronstadt gauge in the Baltic Sea. It is a historicalreference for all former Soviet Union regions.

70 S. A. G. Leroy et al.
Fig. 3.2 a Instrumental data of Caspian Sea levels since AD1900 from in-situ average gauge data.bMonthlyCaspian Sea level variations from 1992 to 2016 from in-situ gauge data collected in Baku,Makhashkala, Port Shevchenko and Krasnovodsk, and from radar altimetry using a constellationof Topex/Poseidon, Jason-1, Jason-2, Jason-3 and Sentinel-3A satellites. c Volga River dischargein percent of the total surface inflow. d Discharge in km3 for each river excluding the Volga

3 Past and Current Changes in the Largest Lake of the World … 71
Fig. 3.2 (continued)

72 S. A. G. Leroy et al.
Fig. 3.3 Precipitation in mm per month (colour scale) and drainage basins (bold black line) overthe Volga (VB) and the Amu-Darya and Syr-Darya (ASB) basins (provided graciously by K. Arpe)
At present, precipitation received over the drainage basin of the Volga River driveschanges in the CSL, especially summer precipitation (Arpe and Leroy 2007; Arpeet al. 2012; Fig. 3.3). Nowadays, it is possible to forecast to some extent the CSLbased mainly on the precipitation across the catchment area, considering that it takesa few months for the water to come down the Volga and feed the CS (Arpe et al.2014).
Explanation of long-term CSL change has puzzled the scientists of many coun-tries: Shiklomanov et al. (1995), Arpe and Leroy (2007), Arpe et al. (2000, 2012,2018), Lebedev and Kostianoy (2008), Ozyavas and Khan (2008), Ozyavas et al.(2010) and Chen et al. (2017). Their objective was often to forecast future evolutionof the CSL. The link between CSL and climate can be seen in two ways. Firstly theanalysis of the causes of the observed CSL is made in terms of the inter-annual vari-ability of the water-balance components (Ozyavas et al. 2010; Chen et al. 2017). Sec-ondly the relationship between global large-scale phenomena like El-Niño southernOscillation (ENSO) and atmospheric circulation in general (Arpe et al. 2000; Arpeand Leroy 2007), or extreme phenomena like drought events (Arpe et al. 2012),including feedback mechanisms from the CSL (Arpe et al. 2018), is analysed. It has,for example, been demonstrated in Arpe et al. (2000) that CSL long-term changeshave been attributed partly to ENSO enhancing the teleconnection between regional

3 Past and Current Changes in the Largest Lake of the World … 73
water-level variability with a global index such as the Southern Oscillation Indexcalculated from sea surface temperature (SST) over the Pacific Ocean.
3.2.2 Physical Limnology
The modern salinity of the surface waters shows a gradient from freshwater in thelarge Volga delta to 13 psu in the middle and southern sub-basins (Kostianoy andKosarev 2005). The Kara-Bogaz-Gol, a small basin connected to the east of the CS,serves as an overflow and is hypersaline, up to 20 times that of the CS (Giralt et al.2003; Leroy et al. 2006). The shallow gulfs of Mertviy Kultuk and Kaidak in the eastof the northern sub-basin also have a high salinity in the range of 30 psu (Fig. 3.1).
The chemical composition of the CS water is largely similar to that of oceanicwater although with some differences (Kosarev and Yablonskaya 1994). The CSwater is poorer in sodium and chlorine ions and is richer in calcium and sulphateions. This difference in the ratio of salts has arisen due to the isolation of the CSfrom the world ocean and transformation under the influence of river runoff.
The surface water temperature gradients are from 23 to 30 °C in summer andfrom 0 to 10 °C in winter, with c. three months of ice cover in the north sub-basin(Kostianoy and Kosarev 2005). Beyond the complex surface and bottom currents,the overall water transfer is from the north to the south, as a result of the inflow ofthe Volga in the north and evaporation in the south. Satellite altimetry has indeedobserved an amplitude of annual change of the CS water topography which variesby approximately 10 cm from north to south, and a CSL rise which is higher in thenorth than in the south by 3 cm/year (Cazenave et al. 1997; Lebedev and Kostianoy2008; Kouraev et al. 2011).
TheCS, as a large lake, has the biodiversity andbioproductivity of a lake.However,the physical water environment behaves as that of an open water due to its size anddepth. The CS currents and water-mass circulations are strong and wave patterns arecomplex. The rate of the CS deep-water circulation has changed significantly duringwater-level fluctuations (Kostianoy and Kosarev 2005; Sapozhnikov et al. 2010).The physiography of the CS, riverine input, geographical distribution of salinityand temperature determine the formation of water masses and circulation processes(Terziev et al. 1992). The differences in water masses, mainly created by climate,lead to relatively distinctive physical and chemical specifications. To a lesser extent,geological forces may cause a mixing of water masses, e.g. caused by the dispenseof materials and energy through the water column. Four water masses encompass theCS water column: (1) north CS water mass, (2) surface-water mass of the middle andsouth Caspian sub-basins, (3) deep-water mass of the middle Caspian sub-basin and(4) deep-water mass of south Caspian sub-basin (Fig. 3.4b; Lahijani et al. 2018a).The shallow water of north Caspian sub-basin and the huge freshwater influx ofthe Volga River form a relatively small water mass that is nevertheless crucial forcirculation. This water mass has considerable annual variability in terms of salinityand temperature (Terziev et al. 1992). Theupper layer of themiddle and southCaspian
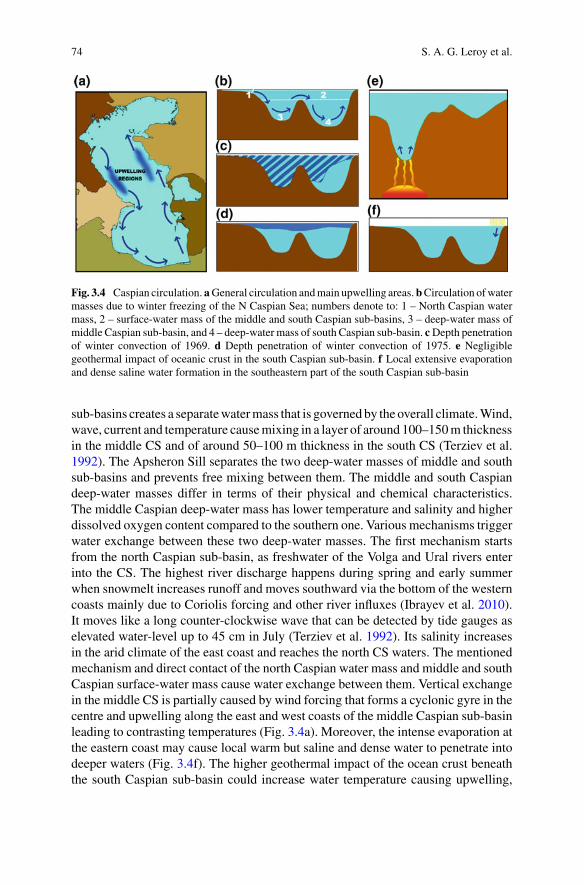
74 S. A. G. Leroy et al.
Fig. 3.4 Caspian circulation. aGeneral circulation andmain upwelling areas.bCirculation ofwatermasses due to winter freezing of the N Caspian Sea; numbers denote to: 1 – North Caspian watermass, 2 – surface-water mass of the middle and south Caspian sub-basins, 3 – deep-water mass ofmiddle Caspian sub-basin, and 4 – deep-water mass of south Caspian sub-basin. cDepth penetrationof winter convection of 1969. d Depth penetration of winter convection of 1975. e Negligiblegeothermal impact of oceanic crust in the south Caspian sub-basin. f Local extensive evaporationand dense saline water formation in the southeastern part of the south Caspian sub-basin
sub-basins creates a separatewatermass that is governedby the overall climate.Wind,wave, current and temperature causemixing in a layer of around 100–150m thicknessin the middle CS and of around 50–100 m thickness in the south CS (Terziev et al.1992). The Apsheron Sill separates the two deep-water masses of middle and southsub-basins and prevents free mixing between them. The middle and south Caspiandeep-water masses differ in terms of their physical and chemical characteristics.The middle Caspian deep-water mass has lower temperature and salinity and higherdissolved oxygen content compared to the southern one. Various mechanisms triggerwater exchange between these two deep-water masses. The first mechanism startsfrom the north Caspian sub-basin, as freshwater of the Volga and Ural rivers enterinto the CS. The highest river discharge happens during spring and early summerwhen snowmelt increases runoff and moves southward via the bottom of the westerncoasts mainly due to Coriolis forcing and other river influxes (Ibrayev et al. 2010).It moves like a long counter-clockwise wave that can be detected by tide gauges aselevated water-level up to 45 cm in July (Terziev et al. 1992). Its salinity increasesin the arid climate of the east coast and reaches the north CS waters. The mentionedmechanism and direct contact of the north Caspian water mass and middle and southCaspian surface-water mass cause water exchange between them. Vertical exchangein the middle CS is partially caused by wind forcing that forms a cyclonic gyre in thecentre and upwelling along the east and west coasts of the middle Caspian sub-basinleading to contrasting temperatures (Fig. 3.4a). Moreover, the intense evaporation atthe eastern coast may cause local warm but saline and dense water to penetrate intodeeper waters (Fig. 3.4f). The higher geothermal impact of the ocean crust beneaththe south Caspian sub-basin could increase water temperature causing upwelling,

3 Past and Current Changes in the Largest Lake of the World … 75
although this is negligible in comparison to other mixing mechanisms (Kosarev1975; Fig. 3.4e).
Extensive water exchange among the water masses occurs during the cold seasonthrough two mechanisms: winter convection and north Caspian freezing. The winterconvection mixes the water column vertically, the extent of which depends on theseverity, distribution, frequency and duration of the driving cold air masses. Duringmild winters, the winter convection penetrates down to around 200 m in the middleand100m in the southCaspian sub-basins,which is not strong enough tomix allwatermasses (Fig. 3.4d). During severe winters, it reaches down to the middle Caspianbottom waters and to the depth of around 400 m in the south Caspian sub-basin,which enables vertical mixing of oxygen and other biochemical elements (Terzievet al. 1992; Ghaffari et al. 2010; Fig. 3.4c). The vertical mixing is forced by wind,evaporation and winter convection; this however, is not affected by the current water-level fluctuations. The Arctic-type mixing occurs annually in the CS and it affectsthe whole Caspian water mass (Kostianoy and Kosarev 2005). The strength of thistype of mixing is closely related to the severity of winter and the Caspian water-levelstatus (Fig. 3.4b).
During water-level lowstand, mixing would be stronger and deeper; however, inthe highstand, it could hardly reach deep-water masses. The Caspian water-levelsduring highstands and lowstands are correlated to the increase and decrease of VolgaRiver inflow, respectively. The salinity of north Caspian water mass increases duringwater-level fall (decrease of Volga discharge) and decreases during water-level rise(increase of Volga discharge).
In winter, when the surface water of the north CS is frozen, salt is released to thedeeper water mass and a saline water plume flows southwards to mix with the middleCaspian water mass (Kosarev 1990). Cold (c. 0 °C) and saline water becomes denserclose toσT=11 toσT=11.5 and sinks downward into themiddleCaspianwatermass.The plume pushes the middle Caspian deep-water mass into the south Caspian deep-watermasswherewater flowing from the south, via the eastern coast, further increasessalinity. The depth penetration is strongly controlled by water level. In the courseof water-level rise, dense water formation is weaker inhibiting downwelling. Duringwater-level fall, the north Caspianwatermass is saltier. It can releasemore salt duringfreezing which makes the adjacent water denser, which thus penetrates deeper. Highnutrient and oxygen-bearing north Caspian water mass triggers a circulation patternthat engages the whole CS water (Kosarev and Tuzhilkin 1995). This mechanismenhances the biochemical condition for marine productivity and favours off-shorefishery after a few years of stabilized lowstand.
3.3 The Past of the CS and CS Level Changes
3.3.1 Geological Background
The geological structure of the CS basement is heterogeneous, including the southRussian platform and the Scythian-Turanian Plate to the north and the Alpine folded

76 S. A. G. Leroy et al.
zone to the south. Three-layer structure of the crust under the CS was disconnectedby rifting since the Late Triassic when thick sedimentary sequences overlaid thebasaltic rocks (Ulmishek 2001; Brunet et al. 2007). The crust of the south Caspiansub-basin shows more oceanic characteristics. Rifting and extensive subsidence pro-vided accommodation space for sediments with an estimated thickness of c. 25 km(Brunet et al. 2003). The geological setting of the CS and the past water-level changesare reflected in themorphology of CS floor and coastal areas. The CSwas a part of theParatethys Sea until the Pliocene and experienced a common history with the Black,Azov, Mediterranean and Aral seas. The Alpine Orogeny during the Cenozoic led touprising of the Caucasian territory and consequently separated the CS and Black Seaat the Manych Valley (between north Caucasian Mountains and southern Don River,Fig. 3.1) around five million years ago. The CS began its independent geological,hydrological, and biological history as an enclosed basin during the Pliocene (Forteand Cowgill 2013). The CSL has changed drastically since the isolation from theworld ocean. Old river valleys and deltas are preserved on the CS bottom morphol-ogy, which represents extreme lowstand conditions. Throughout the Quaternary, theCSL changed widely, possibly in relation with Milankovich cycles, but with a clearoverprint of large changes in river palaeogeography. During the Akchagylian trans-gression (very late Pliocene and very Early Pleistocene), a brief connection to theArctic has been highlighted (Agalarova et al. 1940; Richards et al. 2018; Hoyle et al.2020).
Mud volcanoes of the CS are mainly concentrated in the southern part and arevery active due to a high sedimentation rate associatedwith compressional forces andseismicity. Their eruptions bring old sediments, gas and water into the CS and formdome-shaped features up to 400 m in height on the CS lake bed and in the coastalarea (Huseynov and Guliyev 2004). Annually around 2 million tons of sedimentsassociated with 0.001–0.01 km3 of fossil water and 0.36 km3 of gas is brought to thelake floor by mud volcanoes and gas is released to the atmosphere (Glazovsky et al.1976). If the onshore-mudvolcanoes are included, the total annual gas emission by themud volcanoes reaches 1 km3 (Huseynov and Guliyev 2004). Offshore mud-volcanoeruptions have environmental consequences including high amounts of hydrocarbonsand heavy metal concentration around the cone and mass death of biotas (Glazovskyet al. 1976; Ranjbaran and Sotohian 2015).
Bottom sediments of the CS have different origins including terrigenous, biolog-ical and chemical. The terrigenous sediments are supplied mainly through riverinedischarge as well as by aeolian transport, coastal erosion and mud volcanoes. Bio-logical components comprise calcareous and siliceous shells and organic materials.Chemical sediments are mainly formed by precipitation of calcium carbonate andsulphur minerals (in deep anoxic environments during early diagenesis). Rates ofsedimentation are closely related to the proximity of the sink and source areas ofsediments and the hydrodynamics of the environment. The highest sedimentationrate is measured around the river mouths of the Kura (23 mm per year) and Sefidrud(14 mm per year) in the south Caspian sub-basin (Lahijani et al. 2008). In con-trast, the deep middle and south Caspian sub-basins have the lowest sedimentationrate (0.1 mm per year). The areas with strong wave and current actions experiencecontinuous erosion that exposes bedrocks. The sedimentation rate in the geological

3 Past and Current Changes in the Largest Lake of the World … 77
past was strongly dependent on the synsedimentary tectonics such as subsidence,rifting and closure from and connection to the adjacent basins. The past geologicalhistory of the CS is a key issue to determine the rich hydrocarbon resources that aredistributed in the three sub-basins. The north CS hydrocarbon resources originatedfrom the Palaeozoic, while the south CS resources are attributed to the Late Cenozoic(Ulmishek 2001).
3.3.2 Changes Since the Last Glacial Maximum
Transgressions are usually accompanied by freshening of water masses and coldclimate; while regressions primarily correspond to increased salinities and warmclimate (Chalié et al. 1997), although many exceptions exist. For example, duringglacial periods, this simple relationship is complicated by a large influx of meltwater(including via rivers that are now dry) originating from the North and East of the CScatchment area (Grosswald 1993) and climatic feedbacks (Arpe et al. 2018).
No agreed terminology and stratigraphy exist for the CSL, but common pointscan be summarised broadly as follows. The Khvalynian is a highstand in the LatePleistocene (Fig. 3.5). A large part of the Holocene equates roughly to the inter-mediate levels of the Neocaspian (or Novocaspian). However, no consensus existsabout the exact date for the transition between the Khvalynian and the Neocaspian.In addition, the Khvalynian and the Neocaspian (separated by a deep lowstand) wereboth interrupted by several lowstands, some very deep (>100m), with an inconsistentterminology.
3.3.2.1 The Last Glacial Maximum
Available CSL change reconstructions from the Last Glacial Maximum (LGM) tothe present have been compiled and compared (Fig. 3.5). Most of the dates are withuncalibrated radiocarbon 14C dates, as many dates are from before the calibrationera (Table 3.2). The CSL in the LGM is poorly known and reconstructions differamongst investigations.
A lowstand, named theAtelian (or Enotayevian), which reached 50 to 113mbsl, isreconstructed by several authors around the LGM; and this is when the Early Khvaly-nian is nowmostly recognised to have started rather thanmuch earlier (Varushchenkoet al. 1987; Chepalyga 2007; Svitoch 2009; Yanina et al. 2018). In addition, a levellower than the modern CSL has been reconstructed by climate modelling for theLGM (Arpe et al. 2011, 2018). However, higher than present-day water levels areproposed by other authors: 15 m above sea level (asl) by Klige (1990) and 25 masl by Toropov and Morozova (2010). If we accept very low levels for the Atelianlowstand, the transition to the highstand of the Early Khvalynian had to have beenextremely rapid with a rise of 2.5 cm per year (Svitoch 2009), resulting in dramatic

78 S. A. G. Leroy et al.
Fig. 3.5 Different Caspian Sea level reconstructions since the Last Glacial Maximum. In black,water levels above the sill causing flow to the Black Sea (upper two panels)

3 Past and Current Changes in the Largest Lake of the World … 79
Table 3.2 Published Caspian Sea level curves (shown in Fig. 3.5), the reconstruction methods andthe availability of metadata
Authors Proxy for water level
Chepalyga (2007) Geomorphology and dating of mollusc shells,scheme largely theoretical for thepre-Holocene part
Svitoch (2009, 2012) Geomorphology and dating of mollusc shells,mostly collected in the 1960s, but somerecently. Onshore and offshore areas
Varushchenko et al. (1987) Compilation and integration of geology,geomorphology and archaeology. >35 pointsdated using shells with metadata (in theirTables 6 and 7)
Klige (1990) Not documented
Rychagov (1997) Original data. Levelling of terraces forhighstands and base of alluvium in rivermouths for lowstands. Dating of molluscshells
Mamedov (1997) Critical review of dating methods.Archaeological evidence and radiometricdating for the last four millennia. Theoreticalscheme based on 450–500 year long cycles
Kroonenberg et al. (2005), Hoogendoorn et al.(2005, 2010), Kakroodi et al. (2012), Richardset al. (2014)
Geomorphology of coastal outcrops, seismicprofiles and offshore cores. With metadata
flooding in the north of the north sub-basin with an horizontal advance of as muchas 5–10 km per year (Chepalyga 2007).
3.3.2.2 The Deglaciation
After the LGM, the deglaciation brought a large amount of Eurasian ice-sheet melt-water to the CS through the Volga drainage basin (Tudryn et al. 2016), althoughpart of the meltwater may also have flown through the Aral Sea and then to the CS(Chepalyga 2007). Large ice-dammed freshwater lakes formed along the southernedge of the Eurasian ice sheet (Mangerud et al. 2004). The timing of this palaeolakedevelopment is poorly known. Their drainage into the CS caused the Late Pleis-tocene Khvalynian highstand, especially high in the Early Khvalynian (Chepalyga2007; Kroonenberg et al. 1997; Rychagov 1997) when the CS filled up to c. 50 masl and the Precaspian plain was flooded (Fig. 3.5).
This means that the CSL was above the Manych sill (between the CS and theBlack Sea; Fig. 3.1), which is at c. 26 m asl nowadays, but this sill is consideredto have been higher in the Late Pleistocene (Mamedov 1997; Svitoch 2008, 2009).Water that spilled over the sill flowed into the Black Sea, where the inflow from the

80 S. A. G. Leroy et al.
CS is marked by red clay layers (16.3–15 calibrated kiloyears before present (cal. kaBP)), although a debate still exists regarding their origin (Bahr et al. 2008; Tudrynet al. 2016). By 13.8 cal. ka BP the Eurasian ice-sheet had become so reduced that itsmeltwater failed to reach the Volga drainage basin (Tudryn et al. 2016). This is whenthe meltwater channels were finally abandoned and the meltwater moved north-west,i.e. through the English Channel as a river (Tudryn et al. 2016).
3.3.2.3 The Mangyshlak Lowstand
After the Younger Dryas climatic deterioration, an important regression, usuallycalled the Mangyshlak lowstand, has been reconstructed in many records. This low-stand was perhaps as far down as 113 m bsl, although its water level reconstructionvaries significantly among authors. It caused the Volga River to carve deeply incisedvalleys into the emerged shelf, and formed a lowstand delta in the middle CS. TheMangyshlak lowstand may have lasted between c. 3000 years (on the shelf of theshallow north sub-basin at c. 12.5–9.5 cal. ka BP; Bezrodnykh and Sorokhin 2016)and c. 1000 years (recorded in deep-water cores at 11.5-10.5 cal. ka BP; Leroy et al.2013c, 2014).
The causes of the rapid regression and following rapid transgression are unknown,but factors other than climate alone must have been involved, such as changes inhydrography (Leroy et al. 2013c). Mayev (2010) suggests a rise of 20 cm/year at theend of this period, i.e. twice the rate of the end of the twentieth century. It is duringthis lowstand that the Amu-Darya would have switched its flow from the south CSsub-basin to the Aral Sea (Boomer et al. 2000).
3.3.2.4 The Neocaspian Phase
Around 10.5 cal. ka BP, the CS filled up again to the present intermediate level oreven higher (Leroy et al. 2013c, 2014). Some authors consider that the Neocaspianperiod started at this time (Varushchenko et al. 1987); others consider that the highlevels can only be part of a later final phase of the Khvalynian highstand lastinguntil c. 7 14C ka BP and the subsequent lowstand is a “late” Mangyshlak dating ofc. 6.5 14C ka BP (Svitoch 2009). Svitoch (2009, 2012), after reviewing radiocarbondates of coastal deposits, suggests that the Neocaspian phase (characterized by themolluscCerastoderma glaucum) starts after 3.9 14C ka BP, with an earlier high level,the Gousan at 6.4–5.4 14C ka BP. Thus, the preceding high phase (8.6–7.3 14C kaBP) is still attributed to the Late Khvalynian on the basis of its mollusc assemblages.Dinoflagellate-cyst analyses tend to confirm this. The latter have highlighted a majorassemblage change at 4 ka (Leroy et al. 2007, 2013a, c, 2014). Most authors agreethat the Neocaspian period began no later than 6.5 14C ka BP. During this period,the water levels are generally moderately high with some fluctuations, although theirnumber and their dates are equivocal (Varushchenko et al. 1987; Mamedov 1997;Rychagov 1997).

3 Past and Current Changes in the Largest Lake of the World … 81
Fig. 3.6 Caspian Sea level curve based on historical data and instrumental measurements modifiedfrom Naderi Beni et al. (2013)
A more consensual reconstruction exists around the highstand of 2.6–2.3 cal.ka BP (Kroonenberg et al. 2007; Kakroodi et al. 2012). The last important regressionis the Derbent regression that was relatively pronounced, down to 34 m bsl at leastwhich corresponds roughly to the Late Antiquity-early Middle Ages (Sauer et al.2013; Fig. 3.6). During the Little Ice Age, the levels were generally, but not con-tinuously, high (Naderi Beni et al. 2013; Fig. 3.6). Since a maximum in the earlynineteenth century at−22 m, the CSL decreased with a minimum at−29 m in 1977.
The lastmajor connexionwith theAral Sea, via theUzboy (nowdry) and theAmu-Darya, took place c. 5 ka ago when C. glaucum invaded the Aral Sea (Boomer et al.2000). Much more recently, the flow of the Amu-Darya has been briefly divertedto the CS due to human activities: in the thirteenth century by Gengiskan troupsdestroying the dam built in the tenth century, again in the fourteenth and finally inthe fifteenth century by others (Herzfeld 1947; Naderi Beni et al. 2013; Krivonogovet al. 2014).
3.3.2.5 Limitations to Reconstruct CS Level
It is important to be aware of the following: (1) that most of the published CSL curvesdo not match with each other (Fig. 3.5), (2) that usually no metadata on levels anddates are available to check the validity of the points on the curves with the noticeableexceptions of Varushchenko et al. (1987) and Kakroodi et al. (2012; Table 3.2), (3)thatmany schemes are based on theoretical assumptions rather than based on real data(existence of a cyclicity, e.g. Mamedov 1997; Chepalyga 2007), and (4) that most ofthe records have been obtained from the coast, hence it is impossible to estimate thedepth and duration of the lowstands precisely and from the south sub-basin with theconfounding influence of basin subsidence and mountain uplift.
Only a transect of long cores from the coast to depths below the lowest standwould provide clear information, but this is far from reach at the moment. In brief, areliable record of water-level changes in the CS since the LGM is not yet available.This situation is changing nowwith amodest increase in the number of offshore coresproviding continuous records (Ferronsky et al. 1999; Kuprin et al. 2003; Leroy et al.

82 S. A. G. Leroy et al.
2013c, 2014; Bezrodnykh and Sorokhin 2016).Moreover, no stratotypes2 are definedfor themain highstands and lowstands. So, confusion is easily introducedwith nameshaving differentmeanings, as no rules govern the use of terms such as theMangyshlaklowstand. Moreover, chronozones and biozones are often mixed up. This is partiallydue to the continued difficulty of using and calibrating radiocarbon dates in the CS.The correct identification of the reservoir effect with a range currently between 290and 747 years is plagued with problems due to, for example, the changing sources ofwater in space and time, and the hard-to-constrain influences from methane seepagein this zone of petroleum production (Leroy et al. 2018).
3.4 The Biota of the Caspian Sea
3.4.1 Biodiversity and Endemism
The CS has a high diversity of biotopes, biotic and abiotic conditions (Zenkevich1963); the main cause is the range of salinity that varies from fresh in deltas tohypersaline in the Kara-Bogaz-Gol. Due to this large salinity range, freshwater,brackish, euryhaline and hyperhaline hydrobionts can inhabit the water. Owing tothe similarity of chemical compositions between marine and Caspian waters, manymarine organisms thrive. As a result of the complexity of its geological origin andconnexion with other water bodies, the modern fauna and flora of the CS consists offive main components: (1) Caspian origin (species that survived the closure of theParatethys Sea), (2) freshwater reservoirs of the pre-glacial and the glacial periods, (3)Mediterranean origin, (4) Arctic origin (overlap between the edge of the Eurasianice-sheet and the drainage basin of the Volga; Tudryn et al. 2016), and (5) a fewrecent Atlantic and freshwater invaders (Fig. 3.7a; Zenkevich 1963; Kosarev andYablonskaya 1994). The total biodiversity of the CS is nevertheless lower than thatof the Black Sea and of the Barents Sea (Zenkevich 1963).
The main reason for the relatively low biodiversity is probably the salinity changeover time: for freshwater species the salinity is often too high, for marine speciesit is often too low. Only brackish-water species from both marine and continentalwater bodies are favoured (Mordukhai-Boltovskoy 1979). Most aquatic biota have agreat plasticity to salinity: marine species that can tolerate low salinities (down to 13psu) and freshwater and very low salinity species that can tolerate high salinities (upto 13 psu). In comparison to freshwater lakes, the diverse salinity conditions in theCS serve to increase biodiversity rather than reduce it (Aladin and Plotnikov 2004;Plotnikov et al. 2006). The fauna and flora belong to the Pontocaspian biota: i.e.found in parts of the current Caspian, Black and Aral seas, satellite lakes and rivermouths. They are mostly remnants of the larger Paratethys Sea and are characterisedby unusual and fluctuating salinities. Fish and Crustacea (especially benthos) have
2The type section of a layered stratigraphic unit that serves as the standard of reference for thedefinition and characterization of the unit (www.stratigraphy.org).

3 Past and Current Changes in the Largest Lake of the World … 83
Fig. 3.7 Faunal composition of free-living Metazoa of the Caspian Sea in percentages (redrawnfrom Kosarev and Yablonskaya 1994). a by origin: 1—Autochthonous, 2—Freshwater, 3—Mediterranean, 4—Arctic. b by systematic groups: 1—Turbellaria, 2—Nematodes, 3—Rotatoria,4—Annelida, 5—Crustacea, 6—Mollusca, 7—Pisces and Cyclostomata, 8—others
the largest species numbers with 63% of all modern species (Fig. 3.7b). This isbecause of their osmoregulation capacities that allow them to live in a wide range ofsalinities, from fresh to hypersaline waters (Zenkevich 1963). Owing to its isolationsince the beginning of the Quaternary, the CS shows a high endemism level (Dumont1998; Grigorovich et al. 2003; Marret et al. 2004). This is due to a complicated andlong history of formation of the Caspian fauna and flora with successive episodesof isolation and connections. Nowadays, descendants of many ancient organisms,whose ancestors had penetrated into the region some millions of years ago, inhabitthe CS.
The phytoplankton of the northern CS includes more than 400 species (Chryso-phycea – 1, Euglenophycea – 7,Dinoflagellata – 58, Cyanobacteria – 90, Chlorophyta– 138, Bacillariophycea – 149; Aladin et al. 2001). However, only a few species pre-dominate. Diatoms are widespread all over the CS. They take a leading place bynumber of species. Marine diatom Pseudosolenia calcaravis represents the basicpart of the phytoplankton. In the CS, this alga is an invader that appeared before1935 (Karpevich 1975; Karpinsky 2010). Thirteen Caspian endemics were previ-ously recognised in the phytoplankton (Proshkina-Lavrenko and Makarova 1968),but in recent years only Thalassiosira inserta, Th. caspica and Chaetoceros subtiliswere found. More recent investigations on dinoflagellates have highlighted a rangeof forms, species and even genera, typical of the CS (Marret et al. 2004; Leroyet al. 2018; Mudie et al. 2017). The species composition of periphyton amounts tosome 200 species of algae (Phaeophycea – 8, Rhodophyta – 11, Chlorophyta – 12,Cyanobacteria – 33, Bacillariophycea – 126). Of the 87 species of algal macrophytes

84 S. A. G. Leroy et al.
recorded (Zaberzhinskaya 1968), green algae (Cladophoraceae – 11, Ulvaceae – 10,including Enteromorpha – 9) and charophytes (Characeae – 10) dominate.
According to Derzhavin (1951) and Zenkevich (1963), 476 species of free-livingMetazoa inhabit the CS (Fig. 3.7b). The fauna of Arctic origin is represented by onespecies of Polychaeta, one of Copepoda, four of Mysidacea, one of Isopoda, four ofAmphipoda, two of fish and one species of mammal. The fauna of Atlantic–Mediter-ranean origin is represented by one species of Turbellaria, one of Coelenterata, twoof Polychaeta, one of Copepoda, two of Cirripedia, three of Decapoda, three ofMollusca, two of Bryozoa and six species of fish. The endemic fauna is the mostdiverse. It comprises four species of Porifera, two of Coelenterata, 29 of Turbellaria,three of Nematoda, two of Rotifera, two of Oligochaeta, four of Polychaeta, 19 ofCladocera, three of Ostracoda, 23 of Copepoda, 20 of Mysidacea, one of Isopoda, 68of Amphipoda, 19 of Cumacea, one of Decapoda, two of Hydracarina, 53 of Mol-lusca, 54 of fish and one mammal species. Many species are of freshwater origin,particularly from the Rotifera, Cladocera, Copepoda and Insecta (Derzhavin 1951;Mordukhai-Boltovskoy 1960; Zenkevich 1963). According to the more recent dataof Chesunov (1978), the number of species of free-livingMetazoa in the CS is larger,up to 542.
In the zooplankton, 315 species and subspecies are registered, 135 species ofthem are ciliates (Agamaliev 1983; Kasimov 1987, 1994). The main part of the zoo-plankton population comprises species of Caspian origin. Crustaceans Eurytemoragrimmi,E. minor, Limnocalanus grimaldii, Acartia clausi, Heterocope caspia, Cala-nipeda aquaedulcis, Evadne anonyx, Podonevadne camptonyx, P. angusta, P. trigona,Polyphemus exiguus, Apagis spp., Cercopagis spp., and Pleopis (Podon) polyphe-moides are common in the zooplankton. Freshwater complex – rotifers Brachionusand cladoceransMoina,Diaphanosoma, andBosmina occupy low salinity areas. Lar-vae of benthic organisms – of barnacles Balanus spp. and molluscs – are abundantespecially in spring and summer plankton of coastal zone (Bagirov 1989). AccordingtoDerzhavin (1951) and Zenkevich (1963), the Crustacea include 114 autochthonousspecies. The Mysidae include one species of Diamysis, one of Limnomysis, four ofMysis, one of Hemimysis, one of Katamysis, one of Caspiomysis, one of Schistomy-sis, and 12 of Paramysis (Stepanjants et al. 2015). Of them, 13 species are endemicsof the CS. In the Pseudocumatidae are 19 species. Isopods have three species, includ-ing Mesidothea entomon of Arctic origin. In the amphipods, the Gammaridae have60 species and the Corophiidae have eight species. The Decapoda have five species(Vinogradov 1968; Karpevich 1975; Aladin et al. 2002), including ancient nativecrayfishes Astacus leptodactylus and A. pachypus, prawns Palaemon elegans andP. adspersus introduced incidentally by humans in the 1930s during acclimatiza-tion of mullets, and one species of small crab Rhithropanopeus harrisii that wasinadvertantly introduced by vessels in the 1950s.
The diversity of Mollusca species is also large: according to Bogutskaya et al.(2013), the unusual number of 124 species and subspecies, including 101 endemics,are recorded from the CS. Four families of gastropods are present: Neritidaewith two species of Theodoxus, Hydrobiidae with 85 species, including species ofgenera Andrusovia, Pseudamnicola, Caspia, Caspiohydrobia, Turricaspia with 17
3 Past and Current Changes in the Largest Lake of the World … 85
endemics, and 38 endemic species of Pyrgula,Bythiniidae with one endemic speciesand Planorbidae with three endemics from genus Anisus. The bivalves include sev-eral species and subspecies from two families. The Dreissenidae have five species:Dreissena polymorpha (subspeciesD. p. polymorpha and endemicD. p. andrusovi),endemics D. rostriformis (subspecies D. r. compressa, D. r. distincta, D. r. grimmi,D. r. pontocaspica), D. caspia and D. elata (the last two have become extinct inthe last century) and the invader D. bugensis that was introduced relatively recentlywith ballast waters. The Cardiidae have up to 21 species: Adacna with nine species(invader A. colorata, endemics A. acuticosta, A. albida, A. caspia, A. laeviuscula, A.minima, A. polymorpha, A. semipellucida, A. vitrea), Monodacna with one species(endemic M. caspia), Didacna with eight species (endemics D. baeri, D. barbot-demarnii, D. longipes, D. parallela, D. profundicola, D. protracta, D. pyramidata,D. trigonoides), Hypanis with one species (H. plicata) and Cerastoderma with twospecies (C. glaucum, C. rhomboides; Bogutskaya et al. 2013; Leroy et al. 2018).
Four species of Porifera are recorded: two species ofMetschnikovia,Protoschmid-tia flava and Amorphina caspia. The coelenterate Moerisia pallasi is an endemicspecies. Three species of Polychaeta belonging to the Ampharetidae are recorded.
Derzhavin (1951) and Zenkevich (1963) stated that the ichthyofauna consistedof 78 species in the middle of the twentieth century. The family Petromyzonidaehad one species, Acipenseridae five, Clupeidae nine, Salmonidae two, Esocidaeone, Cyprinidae 15, Cobitidae two, Siluridae one, Gadida one, Gasterosteidae one,Syngnathidae one, Atherinidae one, Percidae four, Gobiidae 30, Mugilidae two,Pleuronectidae one, and Poeciliidae one species. According to more recent data ofKazancheev (1981), the total ichthyofauna amounts to 76 species and 47 subspecies,referring to 17 families and 53 genera. In comparison with other southern seas (Azov,Black, Mediterranean), the ichthyofauna of the CS is extremely poor and consistsof representatives of autochthonous (63 species and subspecies), Mediterranean (5),Arctic (2) and freshwater (56) faunistic complexes. Some species have populated theCaspian because of human activities. The distinctive feature of the Caspian ichthy-ofauna is its high endemism, observed from the category of genus down to thesubspecies level. Early separation of the CS from the world ocean has ensured ahigh level of endemism of its ichthyofauna. According to Kazancheev (1981), thenumber of endemics at the genus level account for 8.2%, at species level for 43.6%,and at subspecies level for 100%. The greatest number of endemic forms belongs toClupeidae and Gobiidae. In general, the CS is inhabited by four endemic genera, 31endemic species and 45 endemic subspecies.
Sturgeons –Acipenser gueldenstaedtii,A. nudiventris, A. persicus, A. stellatus andHuso huso – are the most valuable commercial fish species in the CS. In the 1950s,the main dams blocking migratory routes of anadromous fish species were built onmany rivers of the Caspian basin. Main estuaries and deltas are also now heavilypolluted. The total area of the spawning grounds of all sturgeons shrank by around90%. In order to compensate for losses of natural spawning and to protect sturgeonstocks, special sturgeon-rearing stations were built. From the early 1960s, sturgeoncatches steadily increased for almost 20 years. After 1980, a sharp decline in catchestook place. This was caused both by the increased catch of previous years and by a
86 S. A. G. Leroy et al.
decrease in the number of mature fish as a result of a decrease in natural reproductiondue to loss of spawning grounds. By the early 1990s, the catches were almost halvedand they continue to decline. Poaching significantly increased (Bogutskaya et al.2013).
The Caspian seal, Pusa caspica, is the only aquatic mammal. It is a small species(Goodman and Dmitrieva 2016) that is almost exclusively fish-eating. In winter,seals concentrate in the northern CS along the margins of the ice cover. Almostall of whelping, mating and molting take place on ice. In summer, seals migrate tofeed in the middle and southern CS, with some part of the population remainingin the northern CS (Aladin et al. 2001). Phylogenetic studies indicate that the sealsoriginated from the Arctic during past connections 3–2 million years ago (Palo andVäïnolä 2006). At the end of the nineteenth century, the seal population exceededone million. During the twentieth century, hunting pressure increased and the popu-lation declined, being halved by the 1950s. Since that time, sealing quotas have beenreduced, but population decline has continued due to many factors. At the end of thetwentieth century, about 25% of Caspian seal population had died out due to variousdiseases. By 2005, the population was estimated at 34,000 (Goodman and Dmitrieva2016).
Thus the CS has a high level of endemism, but is not especially biodiverse. Themain characteristic of many species is their great plasticity to salinity.
3.4.2 Recent Changes in the Caspian Sea Biota
Although there is evidence for the anthropogenic introduction of species during theMiddle Holocene, greater change took place in the twentieth century. For example,widespread invasion from the Black Sea to the CS by the mollusc Cerastoderma,occurred in the Middle Holocene (Grigorovich et al. 2003), although earlier dateswere suggested (8–6 14C ka BP; Tarasov and Kazantseva 1994). Some researchers(Starobogatov 1994) deny the natural colonization of the CS by this species, since astrong current in the Manych Gulf was only directed away from the CS. Thus, theyassume that the penetration was associated with the activities of ancient humans.
In the twentieth century, many invertebrate and fish species were introduced tothe CS due to anthropogenic activity (Aladin et al. 2002). In the 1920s, algae Pseu-dosolenia calcar-avis and bivalve Mytilaster lineatus were accidentally introduced.This mollusc was introduced (Bogutskaya et al. 2013) by unusual manner – withbiofouling of military vessels transported to the CS by railway. Bivalve Mytilasterlineatus is unwanted in the CS. It forces out native bivalves and is not much con-sumed by fish. Later, people deliberately introduced several species into the CSincluding mullets Mugil auratus, M. saliens and polychaete worm Hediste diversi-color (in the 1930s), flounderPleuronectes flesus luscus and bivalveAbra segmentum(in the 1940s). Hediste diversicolor and Abra segmentum were introduced deliber-ately for consumption by fish because for them these invertebrates are valuable food.Together with mullets, two species of shrimps – Palaemon elegans and P. adspersus

3 Past and Current Changes in the Largest Lake of the World … 87
were introduced accidentally. All these species have adapted to the conditions of theCS.
In the middle of the twentieth century, after the Volga-Don channel had been built,a new group of species was introduced into the CS. Some of them were transportedin ballast water of vessels; others were attached to their bottom. Barnacles Balanusimpovisus, B. eburneus and bryozoan Membranipora crustulenta, were introducedwith biofouling. Planktonic crustaceanPleopis polyphemoides, jelly fishBlackfordiavirginica, algae – Ceramium diaphanum, C. tenuissimum, Ectocarpus confervoidesf. fluviatilis, Polysiphonia variegata and crab Rhithropanopeus harrisi were intro-ducedwith ballastwaters. The introduction of invasive species into theCS through theVolga-Don channel continues. At the end of the twentieth century planktonic cope-pods Calanipeda aquaedulcis, Acartia clausi, A. tonsa and ctenophore Mnemiopsisleidyi were introduced with ballast waters. As for the ctenophore, this species isa clear example of a negative impact on the biodiversity of the CS (Ivanov et al.2000; Nasrollahzadeh et al. 2014). It consumes zooplankton and hence outcompeteszooplankton-feeding fish. The decrease of zooplankton thus encourages the bloomof phytoplankton. This is probably the most dangerous alien species for the CSecosystem.
An increase in the dinocyst Lingulodinium machaerophorum has been observedsince the late 1960s and it has been attributed to the increase in the temperature ofsurface waters (Leroy et al. 2013b). Since 2005, harmful algal blooms, includingpotentially toxic dinoflagellates, have been observed owing to a combination ofhigher temperatures and increased nutrient availability.
3.5 The Changing Physical World
The Caspian deep-water environment has benefited from the water-level fall until2016 and the consequent accelerated circulation that causes deep-water ventilationand nutrient exchange. However, most changes are felt at the surface.
3.5.1 Recent Changes to the Lake Surface
3.5.1.1 CSL Changes from in-situ to Satellite-Altimetry Observations
The first measurement of water level was made in Baku in 1837, followed bymany other sites around the margins of the CS during the nineteenth–twentieth cen-tury. Annual water-level variations of four base stations, Baku, Makhashkala, PortShevchenko and Krasnovodsk, were then averaged to provide the “official” CSL(Figs. 3.1 and 3.2a, b; Terziev et al. 1992).
Figure 3.2a shows the CSL from 1900 to 2016. It was obtained using level gaugesinstalled around the CS. Initially the measurements were made in different datum

88 S. A. G. Leroy et al.
systems (Black Sea, Baltic Sea, local relative system). However, due to improvedaccuracy in levelling, particularly in the 1970s, allowing vertical crustal movements(~2.5 mm/year) to be determined, new zero marks have been defined, with differentheight systems for the east and west coasts (Pobedonostsev et al. 2005). This ledto some differences in recorded water-level changes between gauges that causedambiguities in the water-level-time series between one gauge and another. Even therecent data over the four historical gauges are not coherent all the time (Fig. 3.2b).For this reason, satellite altimetry offers an interesting complementary source ofinformation.3
Over the first period between 1900 and 1929, the CSL slightly decreased withan average level around −26 m (Fig. 3.2a). In the 1930s, several large reservoirsalong the Volga were filled. It led to a sharp decrease of 1.8 m by 1941, then moreslowly until 1977 when the CS reached its lowest level over the last hundred years at−29 m. However, not all of this decline can be assigned to the building of dams. Agood deal of the CSL variation can be simulated from the mean precipitation over theCS catchment area (Arpe and Leroy 2007a). Between 1977 and 1995 the CSL roserapidly by 2.5m, after which it again fell; so that by 2016 it had stabilized at a level ofapproximately −28 m. In such a large inland sea, the water-level changes observedover the last decades represent a very large amount of water-storage change. Thetwo and half meter of increase between 1977 and 1995 is equivalent to additionalwater storage of ~900 to 1000 km3. Such variability needs to be analyzed and under-stood since it has serious consequences. Understanding the mechanism behind thesechanges would allow forecasting the rise or fall of the level in the future, which is atopic of serious public concern for riparian countries (Arpe et al. 2014).
3.5.1.2 Water Balance of CS
3Since the middle of the 1990s, a noticeable progress occurred in the use of radar and laser altimetryfor continental hydrology. It is important to note that this technique was initially designed foroceanography; but it very quickly became clear that satellite altimetry is an attractive technique formonitoring the water levels of lakes (Crétaux et al. 2016). Essentially, this technique has benefitedfrom a continuous service since the launch of the satellite Topex/Poseidon in 1992, and this willcontinue in the years to come with various new missions.
The combined global altimetry data set has more than 2-year-long history and is intended to becontinuously updated in the coming decade. A given lake can be flown over by several satellites,with potentially several passes, depending on its surface area. Thus, combining altimetry data fromseveral in-orbit altimetry missions increases the temporal resolution and the accuracy of the water-level estimation which depends on several factors: range, orbit and correction errors (Crétaux et al.2009). Comparisons of average water level from satellite altimetry and in-situ data for a set of24 lakes of various locations and sizes have been established by Crétaux et al. (2016). Accuracyhas been estimated by the calculation of the Root Mean Square (RMS) of the differences betweenboth types of data: it ranges from 3 cm for large lakes to few tens of cm for small lakes, currentlyachievable using nadir altimeters.

3 Past and Current Changes in the Largest Lake of the World … 89
Analysing the CSL changes is generally interpreted as balance between water budgetcomponents of the CS and the Kara-Bogaz-Gol resulting from dynamical responseto the variations in inflow (precipitation P, river and underground discharge R andG) and output (evaporation E and discharge to the Kara-Bogaz-Gol, K). It can beexpressed by the following equation (Eq. 1):
dV
dt= R + (P − E)+ (G − K ) (1)
Many past studies were performed to analyse the water balance of the CS. It isgenerally based on in-situ data for some components (P, R, K) and/or model based onglobal climatological data (P, E, R, G) and/or remote sensing data (P, dV/dt). G is notmeasured or modelled in the most recent studies and is assumed to be a constant of4 km3/year (Shiklomanov et al. 1995). Ozyavas et al. (2010) however demonstratedthat groundwater inflow could cause significant errors in the water balance and ispresumably not constant year over year.
Discharge of the rivers is principally driven by the P-E ratio over theCSwatershed.It can also be obtained from direct measurement. The calculation of evaporation overthe CS can be inferred from a model based on the generalized Penman equation(Van Bavel 1966); but needs a large number of additional variables not always easyto measure (air and water temperature, air humidity, wind speed, wave height, netradiation, latent heat of vaporization).Ozyavas et al. (2010) used thismodel and foundan average value of approximately 1100 mm/year of direct evaporation, while inKouraev et al. (2011), average evaporation over the twentieth century is estimated to970 mm/year. For many studies, the size of the CS, used to calculate the evaporation,is kept constant. However, as shown by Arpe et al. (2018) due to the high levelvariation of the CS and the high variability of its extent, in particular in the shallownorthern part, the total evaporation over time can also significantly vary. Moreover,feedback of the change of CS size in the local precipitation should also be taken intoaccount as shown by Arpe et al. (2018). Indeed, E-P is controlled by the presence ofthe CS itself since precipitation over the CS region is partially generated by waterevaporated from the CS. In the context of CSL drop (as observed since 1995), apositive feedback (reduction of humid air in the CS watershed due to lower totalevaporation) is combining with a negative feedback (lower size implies lower directevaporation) and could reach an equilibrium state where gains are equal to losses(Mason et al. 1994). The volume change of the CS can be measured using water levelchanges from satellite altimetry and average lake extent.
In the paper of Chen et al. (2017), similar to Arpe et al. (2014), a modelof water balance was setup using the climate model Climate Forecast Systembased on the National Centers for Environmental Prediction datasets. Consideringonly R+ (E − P) components of the right member of Eq. 1, using the Climate Fore-cast System model and in-situ discharge data of the Volga River, Chen et al. (2017)reconstructed the volume change of the CS. Then they compared it to the volumevariations inferred from in-situ data and satellite altimetry. Their conclusion was thatover the 37 years of analysis, the increased evaporation rate is the main cause of

90 S. A. G. Leroy et al.
CSL changes; while precipitation changes and river discharge play a secondary role,although not negligible. In that study however, the inter-annual variability of smallriver discharge, of Kara-Bogaz-Gol outflow and of underground water inflow havenot been considered. This conclusion in Chen et al. (2017) seems to contradict thestudy made by Arpe and Leroy (2007a), which showed that CSL changes are at firstorder driven by the discharge over the Volga River basin, which is directly linked andcorrelated to total rainfall over the watershed of this river. However, it is also shownby Arpe and Leroy (2007a) that the post-1995 drop in CSL cannot be attributed toa drop in the Volga River discharge. Arpe and Leroy (2007a), Chen et al. (2017)and Arpe et al. (2018) consider the relationship between evaporation and CSL to besignificant.
The link between CSL change and Kara-Bogaz-Gol is an important contributionto the water balance and is not always considered in literature as a specific waterbody with its own variability. For example, Chen et al. (2017) did not take the Kterm into account. Ozyavas et al. (2010) calculated the water balance of the CS from1998 to 2005. They considered that the quasi-constant value ofK, corresponding to awater balance of ~5 cm/year, is insignificant. This was partly due to the resolution ofthe model-generated data, being too low to resolve the Kara-Bogaz-Gol. In Arpe andLeroy (2007a), discharge to the Kara-Bogaz-Gol is considered as a constant outflow~5% of the total surface runoff to the CS.
In most studies, the Volga River discharge to the CS is considered to be 80% ofthe total from all rivers. A recent dataset (www.caspcom.com) gives a discharge-timeseries of the eight main rivers inflowing in the CS (Volga, Ural, Terek, Kura, Sulak,Sefidrud, Polrud and Chalous; Fig. 3.1). It is obvious that discharge is not stable(Fig. 3.2d). Indeed, surface inflow from the Volga over the last 40 years has variedbetween 80 and 90%, and the total inflow from other rivers is very irregular fromyear to year (Fig. 3.2c, d). From wet to dry years, inter-annual variability of riversexcluding the Volga ranges from ~10 to ~20 cm of equivalent CSL. So, it is clearthat the accurate calculation and understanding of the water balance of the CS canonly be done with exhaustive data on small rivers (Arpe et al. 2014).
The Kara-Bogaz-Gol depression is shallow and at the beginning of the twentiethcentury when the CSL was high, the difference in water level between the CS andthe Kara-Bogaz-Gol was low (c. <1 m). The long-term fall of the CS between 1930and 1977 resulted in a decline of the discharge to the Kara-Bogaz-Gol. From 1930to 1980, it decreased from ~30 km3/year to 0. It therefore accounted for ~7 cm ofdecrease of the CS in 1930 to zero in 1980. In March 1980, in order to stop the fillingof the Kara-Bogaz-Gol from the CS, the narrow strait between them was blockedby a solid and sandy dam. It immediately resulted in a full evaporation of the bay inonly four years. At the end of 1984, the dam was broken and the water came backvery rapidly to its full extent. From 1993 to 1995, the annual water flow reached37–52 km3/year (Kosarev et al. 2009) and the level rose by 5 m in three years toreach its maximum value around −27 m. Then the Kara-Bogaz-Gol level variationsslightly decreased down to−28.5 m in 2017 with small annual oscillations linked toseasonal climate change.

3 Past and Current Changes in the Largest Lake of the World … 91
By some assumption on the E-P term over the Kara-Bogaz-Gol (~800 mm/year,Kosarev et al. 2009), and using size and volume change of Kara-Bogaz-Gol extractedfrom satellite altimetry and imagery available in Hydroweb (n. d.), the inflow fromthe CS to the Kara-Bogaz-Gol can be recalculated. Therefore, one may calculatethe corresponding water-equivalent changes of the CS, which is the opposite of theterm K in Eq. 1. From 1993 to 1996, the total discharge K is 9 cm/year, and after1996 it is only 4 cm/year. If we calculate the total loss of water from the CS to theKara-Bogaz-Gol, it represents the significant number of >1 m from 1993 to 2017.
3.5.1.3 Caspian Sea Ice and Surface-Water Temperature
Ice formation4 over large areas on the northern CS occurs every winter and ice staysfor several months. Ice over the middle CS can also form to a smaller extent. Thepresence of ice has several impacts on navigation, fisheries and oil industries espe-cially in the Russian and Kazakh coastal areas. Using active and passive microwaveremote sensing data has allowed measuring time series of ice formation, break-upand duration of ice period, in the eastern and western parts of the northern CS, aswell as estimating the mean and maximum ice extent over this area. Kouraev et al.(2011) reported results with remote sensing data, which exhibited a warming trendsince themid-1980s followed by a short cooling period in 1993–1994, and then againa warming trend characterised by diminution of ice duration and of maximum icecoverage for the western and eastern parts of the northern CS.
The same trend was observed in the CS SST (Ginzburg et al. 2005; Leroy et al.2013b). Seasonal and inter-annual variability of SSTweremeasured over four distinctregions (North, Middle, South and Kara-Bogaz-Gol) in that study. Trends for theperiod 1982–2000 were calculated for each hydrological season (February, April,August, and October) and compared to historical period from 1940 to 1980. Theirresults exhibited a significant global-warming signal withmuch higher rate of changein the recent period of time. In the middle and southern CS, warming trends of 0.05
4The study of ice cover in this region started in the nineteenth century using observations fromcoastal stations. It then became a monitoring system of the Soviet Union and measurements werecollected on a regular basis using aerial surveys. After 1970s, ice-cover observations from airplanehave drastically decreased for financial reason. It has then been compensated by using satelliteimageries in the visible and infrared parts of the spectrum (Buharizin et al. 1992). However, thesesurveys from satellite imagery in the visible spectrum are strongly affected by cloud formationand cover, particularly in winter, and these types of information were consequently not denseenough to perform a full survey of ice presence over the CS. Since the mid-1980s, microwave-satellite observations, providing reliable, regular data on ice without masking from cloud, havebeen used. Since 1992, another source of data was from a synergy between active (radar altimetry)and passive (radiometer used to correct altimetry measurements) instruments. A discriminationmethod, developed and tested over the CS and the Aral Sea in Kouraev et al. (2003, 2004), wasapplied on the data of Topex/Poseidon, Jason-2, Jason-3 and Envisat missions. Combining resultsfrom this technique after 1992 (when the Topex/Poseidon satellite was launched) with microwaveobservation on SMMR and SSM/I missions allowed better spatial and temporal resolution thanusing satellite altimetry alone. This method has been successfully validated using independentin-situ measurements (Kouraev et al. 2003).

92 S. A. G. Leroy et al.
Fig. 3.8 Sea surface temperature at the station of Makhashkala in Russia on the western coast ofthe CS. Data from in-situ gauge over the period from 1960 to 2016. The arrow shows the 0.01 °Cincrease per year. Source http://www.caspcom.com
and 0.1 °C/year were observed respectively. SST was also compared with the ENSOand NAO phases. A strong correlation between SST in the central Pacific and theCSL has been observed, which is the sign of a linkage between ENSO and the CSL.No influence from NAO has been found (Arpe et al. 2000).
In a more recent paper (Khoshakhlagh et al. 2016), using 30 years of AdvancedVery High Resolution Radiometre measurements, the SST over the four regions ofthe CS was analysed and trends investigated using a Mann-Kendall test. Based onthis study, it can be unambiguously stated that increasing SST trend has been seenin all the four regions, mostly during March to November months. In the middle andthe southern CS however, it has also been shown that no trends at all are observedin wintertime. Nazemosadat and Ghasemi (2005) have moreover shown that SSTfluctuations have direct impact on winter and spring rainfalls, and that warm SSTcauses increasing rainfall in spring and, in contrast, cold SST causes low rainfall inspring, especially in the western areas of the CS. As an example, increasing rate oftemperature in the middle part of the CS from data at the station of Makhashkalafrom 1961 to 2018 exhibits a trend of ~+0.012° C/year (Fig. 3.8).
3.5.2 Pollution of the Caspian Sea
The CS and its bottom sediments are the final destination for a wide variety of con-taminants originating from the coast and the water itself through natural processesand anthropogenic activities. Sediments from the catchment basin mainly by riverine

3 Past and Current Changes in the Largest Lake of the World … 93
influx (particularly the Volga), water-bottom-mud volcanoes, submarine groundwa-ter discharge, wind-blown sediments, and biological and biochemical activities arethe main natural sources. However, offshore-and onshore-oil industries, agriculturalactivities and coastal urban areas are the main anthropogenic sources of the contam-inants. Many contaminants could have both a natural and an anthropogenic source,while others, i.e. persistent organic compounds, only originate from human activi-ties. Their concentration and distribution in the water column and bottom sedimentare related to the proximity to source area and hydroclimatic conditions of the CS.
3.5.2.1 Heavy Metals
Heavy metal investigations demonstrate that fine-grained sediments are enrichedcompared to coarse sediments (de Mora et al. 2004a; Kholodov and Lisitsina 1989;Lahijani et al. 2018b). Their relationship to the sediment grain-size could be groupedas follows: the first group (Cr, Zr) displays association with silty sediments. Theyare mainly accompanied with Piconite and Zircon. The second group (Cu, Co, Ni,Ga, Mo, Mn, Fe) and, in some regions, Pb demonstrate a relationship with claysediments. The third group (Ti, V, Ge) have mutual dependence, either with fine-grained or coarser-grained sediments. They are present in a wide variety of mineralsthat originate from the catchment basin (Klenova et al. 1962; Lahijani et al. 2018b).
Elevated amounts of some heavy metals are attributed to the natural source ofmineral-rich bottom sediments (Kholodov and Lisitsina 1989). Higher concentrationof Ba in the middle Caspian sub-basin is likely due to oil industry. Higher amountof Ag, Cd and Pb in west, south and north Caspian coastal sediment might be thesignature of mining in the catchment basin. Baku Bay has the highest pollution levelof Hg in bottom sediments (de Mora et al. 2004a).
3.5.2.2 Oil Pollution
Oil pollution is a major concern in the modern CS. Although exploitation datesback to Antiquity, natural leakage of oil and gas into the CS were higher than thosedue to exploitation until mid-nineteenth century. Deep wells started to be dug onlyin the nineteenth century, with a boom around AD1872 following a change in thelaw and improved technology. Since that time, both extensive oil exploitation andtransportation throughVolgaRiver caused drastic change in theCSpollution (Tarasov1996). During the Soviet period, the oil and gas industries were mainly limited inthe west and north Caspian coasts, while after the dissolution of the Soviet Union,all riparian countries engaged in this industry.
Contaminants from petroleum industry are preserved in the bottom sediments aspolycyclic aromatic hydrocarbons that have similar characters as those from biolog-ical activities. They can be classified in three groups based on their origins: pyrolytic(from combustion), fossil (as raw petroleum) and natural (diagenesis from biological

94 S. A. G. Leroy et al.
activities). However, the limits between the three groups are not sharp. Pyrolytic com-pounds have elevated amounts in the Baku Bay and the north-west CS, whereas fossilcompounds are very high in Baku Bay and diagenetic compounds in the southernCaspian lake bed (Tolosa et al. 2004).
3.5.2.3 Nuclear Pollution
Some pollution from nuclear experiments on the Mangyshlak Plateau (Kazakhstan)in 1969 and 1970 is felt in the CS (Nordyke 2000). For example, radiocarbon datingof surface sediment shows a distinct modification in 14C activity (Leroy et al. 2018).
3.5.2.4 Organic Compounds
The production of many organic compounds including plastics, surfactants, drugs,fertilizers and organochlorinated compounds such as PCB, HCB, HCH and DDT,started at an industrial scale during the twentieth century. The PCB and DDT areamong the persistent organic compounds that have severe and adverse impacts onthe environment. Some components of DDT and HCH have elevated amounts in thenorth, west and south Caspian coastal sediments; the total amounts of PCB andHCB,however, are much lower than the world standards (de Mora et al. 2004b). The CSis the final receptacle for the agricultural, industrial, rural and urban wastewater thatcauses elevated nutrient levels in the CS water (Ivanov 1986).
Events of blue-green cyanobateria blooms in the last 20 years have been observedin the CS and can be attributed to the extra nutrient flux by rivers (Karpinsky et al.2005; Leroy et al. 2013b; Naghdi et al. 2018). The status of the CS is oligotrophic,but in some coastal and shallow areas, owing to the input of nutrients, it has becomemeso-eutrophic (Nasrollahzadeh et al. 2014).
3.5.2.5 Extreme Impact on Environment and Humans
Finally, environmental degradation has created dead zones such as in the Baku Bay(Zonn 2005; Zonn et al. 2010). Contaminants transfer to the biota through dietary andnon-dietary mechanisms. Accumulation of contaminants higher in the food chain ofthe Caspian biota directly impacts upon human health. Indeed, contaminants havebeen detected in the CS fish, some of which are used for human consumption, e.g.kutum (Nejatkhah-Manavi and Mazumder 2018).

3 Past and Current Changes in the Largest Lake of the World … 95
3.5.3 Changes to the Coast Line
Rapid CSL changes impose various impacts on coastal and offshore environments.Shoreline migration, river mouth avulsion, disappearance of old wetlands and emer-gence of new ones (Leontiev et al. 1977; Kaplin and Selivanov 1995; Kroonenberget al. 2000; Haghani et al. 2016; Haghani and Leroy 2016, 2020), and modificationin the rate of deep-water exchange are some examples of impacts (Lahijani et al.2018a). The setting and the origin of lagoons determine their final fate. Accord-ingly, the lagoons that formed under highstand conditions (such as the maximumin 1995) desiccated due to the current sea-level fall (post-1995). They are shallow-water lagoons that form behind beach ridges along sandy beaches with gentle tomoderate slopes, where a low-lying area is fed by freshwater, groundwater and/orseawater inlets. They are strongly governed by water level. The shallow depth (1–2 m) is sensitive to water-level changes. Shortage of freshwater from agriculturalfields and higher evaporation due to increasing temperature are superimposed on thewater-level falling trend that cause drying up of almost all shore-parallel lagoonsafter the last rise. A good example is the Gomishan Lagoon, a wetland mentioned inthe Ramsar convention,5 situated in a low-lying area on the southeastern flank of theCS, which is almost dry since 2015 (Fig. 3.1).
The bar and spit-lagoon complexes that have weak water connection to the CS,or a connection in only one direction, are intensely influenced by freshwater inputs.The inlets provide limited exchange of offshore water or are incapable of transferringoffshore water into lagoons. Extensive freshwater exploitation for agricultural usesalong with dam construction on rivers lead to changes in hydrological regime aroundthese lagoons and consequently accelerate lagoon shrinking and desiccation. Rapidsea-level fall facilitated freshwater outflow by not supporting surface-water leveland groundwater table stabilization. They are undergoing major shrinkage, whichrequires water-resources management.
Other anthropogenic changes to the coastline include sandmining in spits, coastaldunes and islands, modifications of the coast for touristic purposes such as the canalsin theAZAWAresort in Turkmenistan, the large-scale infrastructures recently erectedor planned on Baku’s waterfront and the damming of the Kara-Bogaz-Gol inlet in1980–1983 (Leroy et al. 2006).
Thus, the impacts of natural water-level changes may be mitigated or exacerbatedby human intervention and current global warming.
3.6 Discussion
In light of these considerable environmental and water-level changes, a deep investi-gation of their causes and impacts on coastal zones and water masses is still needed.
5International treaty for the protection and sustainable use of wetlands.

96 S. A. G. Leroy et al.
Only limited observational, instrumental and geological data are available, however,which reduces the capacity of forecasting models.
3.6.1 Critical Appraisal
3.6.1.1 Long-Term Data
Most CSL research has been made onshore, not only because of the easier access,but also because offshore sediment often enters the domain of petroleum exploration,which is under a certain degree of confidentiality. In addition, offshore coring requiresthe collaboration of large research teams, large budgets and planning in countries toooften affected by political volatility. Academic research and its need for open-accessinformation to the scientific community are incompatible with this situation commonalong large parts of the CS coast.
As an example, seismic profiles are rarely made available (Hoogendoorn et al.2010; Putans et al. 2010), although at times they were obtained before coring, e.g.the European INCO-Copernicus project “Understanding the Caspian Sea erratic fluc-tuations” of the 1990s, but could not be published (Leroy et al. 2014). Also moreresearch should be undertaken into dating of sediment, not only on the reservoireffect on radiocarbon dates, but also in tephrochronology that offers an excellentregional potential (Leroy et al. 2018).
3.6.1.2 Observational Data
The network of operating stations along the coast has sharply declined after a peak inthe mid-1950s (Osmakov 2009). Furthermore in the last decades, the situation is notimproving. No stations aremaintained to international standards and no transnationaluniform geodetic levelling network exists along the coasts, with the consequence thatthe measurements of water level at different sites are not comparable (Fig. 3.2b).
The satellite-altimetry technique demonstrates a great potential in this type ofapplication to theCS, since thewater-level variability can bemeasured over thewholebasin beyond political barriers (Kostianoy et al. 2019). Moreover, satellite altimetryprovides continuous measurements over open-water regions that have never beencovered by direct water-level observations.
3.6.1.3 Models and Forecasts
In 1977 and the following years, the increase in CSL is linked to an increase in thenumber of ENSO events. Also, recently the recognition of the role of the small riversand especially of rivers from the South, such as Kura and Sefidrud, is taking place,but not implemented yet in the models. In brief, one can say that the fluvial influx

3 Past and Current Changes in the Largest Lake of the World … 97
to the CS, hydrometeorological conditions over the water and catchment and to alesser extent bottom-morphology changes are the main factors that control the watercharacteristics (Arpe et al. 2014).
With this in mind, the short-term water-level forecast seems relatively successful(Arpe et al. 2014), although, the longer-term forecast remains difficult (Arpe andLeroy 2007a). This is a real societal challenge for the riparian countries.
3.6.2 Threats to the Caspian Sea
Threats to the CS are numerous and some changes occur very rapidly, making itdifficult to adapt. The following five are the most important.
Firstly, the regulation of rivers has an anthropogenic impact on the biodiversity bythe construction of reservoirs, damming for hydroelectricity generation and irriga-tion. Every year ~3% of the annual flow of the Volga is lost due to evaporation fromthe surface of reservoirs (Zonn 2001). Used for irrigation, water from the rivers isalso a loss to the CS if precipitation is not falling over its catchment. Shallower deltasand obstacles such as dams hinder fishmigration, a particular problem in springwhenspawning begins. Thus, many anadromous and semi-anadromous fish species losetheir natural spawning habitats. This affects sturgeons and salmonids most severely.Populations of salmonids have disappeared almost completely. Fish farms maintainpopulations of sturgeons and salmons in Iran and Russia (http://sturgeon.areeo.ac.ir;Vassilieva 2004). Natural spawning grounds are available only in the Ural River andthe Iranian rivers where dams are absent (Aladin et al. 2001).
Secondly, overfishing and illegal fishing in the CS strongly affect the populationsof most commercial fish species. Sturgeons are endangered most of all. After theUSSRcollapse, fish such asCaspian lamprey,Volga shad, Caspian trout andwhitefishwere included in theRedBooks;whereas in the 1920–1940s, theywere still importantcommercial species. For species with a short life cycle, e.g. sprats, overfishing isless dangerous because their reduced abundance can recover within a few years(Aladin et al. 2001). Anthropogenic water pollution negatively influences sturgeonfish causing toxicoses (Aladin et al. 2001).
Artificial canals have connected the CS via the Volga and then, via other rivers,with the Sea of Azov, Baltic and White seas. They are a route for the third mainthreat: uncontrolled penetration of many alien species by shipping, either in ballastwater or by biofouling. The influence of alien species on the CS biota and ecosystemsis often negative. For example, the invasive bivalve mollusc Mytilaster lineatus isa competitor for the autochthonous Dreissena and cannot be used as food for fishbecause of its thick shell. The most dangerous alien species in the CS is clearlyctenophore Mnemiopsis leidyi.
Fourthly, the CSL changes are often rapid, e.g. water-level changes of 10 cm/yearin the last century. For comparison, the rate was perhaps up to 20 cm/year in theHolocene. They have a clear influence on biodiversity (Dumont 1995). Followingthe high levels of the late Little Ice Age, the CSL decrease of 1920s–1970s (Fig. 3.6)
98 S. A. G. Leroy et al.
had a negative impact on aquatic life. Shallow waters of the north CS and deltas ofrivers suffered the most. Shallow bays, such as Kaidak and Mertviy Kultuk, driedand the populations died. The increase of 1978–1996 had a negative impact bothon the biodiversity and coastal facilities such as those for industry and agriculture.Many pollutants were discharged into the CS. First of all, flooding of oil productionand transportation facilities had a damaging effect on the biodiversity. Nevertheless,the positive impacts of long-term CSL rise are the improvement of spawning-groundconditions, increased spawning-ground areas, reinforced water exchange betweendifferent sections of the CS, extension of freshwater buffer zone and increase ofpotential productivity in the north CS.
Lastly the impact of climate changes on the biological diversity of the CS is notwell studied. Studies of past climatic-change impacts have been only based on bioticproxies. Climatic changes impacted on the biodiversity of the ancient CS signif-icantly, although indirectly, through impact on water level and salinity (Rodionov1994). These changes nevertheless significantly altered the biodiversity. DuringQua-ternary transgressions, freshwater species dominated, while the abundance of marinespecies reduced. Marine species survived only in the most saline parts of the CS.During regressions, the situation was the opposite. Marine species dominated, whilefreshwater species survived only in deltas and areas adjacent to rivers. However insome periods of the Quaternary history, changes of climate caused such extreme orfast changes of the CSL, salinity and temperature that many ancient species werelost. At present, climate change also has an indirect impact on the CS biodiversity.This impact is very weak and less obvious compared to those of earlier geologicalperiods (Aladin et al. 2001), although the human factor may considerably acceleratenatural changes.
3.6.3 An Ideal Baseline?
If one wishes to restore the CS to its pristine state before human influence, it isimportant to choose a realistic baseline. The start in the rise of the water temperaturewould be a good place to put this baseline. Indeed, the rate of 0.1 °C/year places theCS amongst the lakes with the strongest warming (Hampton et al. 2018). However,we do not knowwhen it started as the oldest instrumental informationwe have is onlyfrom 1982. An increase in the number of phytoplankton cysts of the potentially toxicdinoflagellate Lingulodinium machaerophorum in the late 1960s has been suggestedto be due to warming (Leroy et al. 2013b).
A point in water level during the twentieth century cannot be chosen as an idealsituation to return to, as fluctuations have been wider just before the start of instru-mental measurement, i.e. during the natural state of the lake (Fig. 3.6). Thus, theCSL seems to be in permanent flux, never in a stable state. Other factors, developedhereafter, have significantly altered the CS and should be considered to define thestart of the Anthropocene in the CS (Zalasiewicz et al. 2017).

3 Past and Current Changes in the Largest Lake of the World … 99
TheCaspian catchment has experiencedhumanoccupation sinceLatePleistocene.However the signature of human impact on the CS is negligible until nineteenth cen-tury. A milestone is the start of the pollution by hydrocarbons in c. 1872 in Azerbai-jan when improved technology led to higher well production and when legislationchanged. Intensive petroleum exploitation and transport through the Volga-Balticas well as forest removal for shipping fuel are key points in the Caspian environ-ment. They caused hydrocarbon pollution, changed sediment discharge and in 1920s,introductions of alien species. Human activity intensified with industrialization andwater regulation in Russia-Soviet Union mainly in the first half of the twentieth cen-tury. Despite the century-long human impact on the CS, the environment damage isrecoverable, and its biological resources are well preserved.
The main turning point in the CS started after World War II when the catchmentbasin and its north, south and west coasts were subject of water regulation, agricul-tural development and urbanization. They led to water shortage in river mouths thatprevented fish reproduction and released more nutrients and pollutants into the sea.Discharge of nitrogen and phosphorus by catchment population became significant(Hampton et al. 2018). Physical changes in the rivers, e.g. dams, barriers beneathbridges, sand excavation and overfishing, affected natural fish reproduction. Intensiveoccupation of the coastal environment for agriculture and urbanization drasticallyrestricted the environment for the Caspian endemic species and wildlife refuges. Itthus seems that the physical changes in the Caspian catchment and coast since themid-twentieth century are the main concern about the Caspian environment.
Finally, as it is difficult to influence CS water levels and water temperature; it ismore realistic to aim at environmental remediation by controlling pollution, biologi-cal invasions and the impact of dam construction. If a base level has to be suggested,the middle of the twentieth century would be the best candidate. It moreover fits withthe definition of the Anthropocene by Zalasiewicz et al. (2017).
3.7 Conclusions
Many changes have been experienced by the CS in the past. However, the currentenvironmental changes are faster and more profound as a result of the multipleaspects of human intervention. The environment receives anthropogenic stressesthat are superimposed to natural ones.
The CS is a fascinating topic of study owing to its complexity and the manysurprises it reveals. It is however foremost the source of living for more than 14million people (Rekacewicz 2007) and its catchment has 43 urban centres largerthan 300,000 inhabitants (Hampton et al. 2018). It is important to preserve its statefor a sustainable future. The CS Anthropocene could be suggested to have started inthe middle of the twentieth century as in the rest of the world.

100 S. A. G. Leroy et al.
Acknowledgements We would like to thank S. Kroonenberg for advice on Russian literature onCSL and K. Arpe for information on climate and providing Fig. 3.3. We are grateful to L. López-Merino for the preparation of Fig. 3.5. The work on modern biota by NVA and ISP was supportedby the program of the Presidium of the Russian Academy of Sciences “No. 41. Biodiversity ofnatural systems and biological resources of Russia”. We are grateful to the three reviewers whohave contributed to improve the manuscript.
References
Agalarova DA, Djafarov DI, Khalizov DH (1940) Atlas of microfauna from Tertiary deposits of theApsheron Peninsula. Azgostoptekhizdat Baku (in Russian)
Agamaliev FG (1983) Infusoria of the Caspian: taxonomy, ecology and zoogeography. Nauka,Leningrad (in Russian)
Aladin NV, Plotnikov IS (2004) Hydrobiology of the Caspian Sea. In: Nihoul JCJ, Zavialov PO,Micklin PP (eds) Dying and Dead Seas. Climatic versus anthropic causes. NATO Science SeriesIV: Earth and Environmental Sciences, vol 36. Springer, Dordrecht, pp 185–225
Aladin N, Plotnikov I, Bolshov A, Pichugin A (2001) Biodiversity of the Caspian Sea. https://www.zin.ru/projects/caspdiv/biodiversity_report.html. Last accessed 7 July 2018
Aladin NV, Plotnikov IS, Filippov AA (2002) Invaders in the Caspian Sea. In: Leppakoski E, Gol-lasch S,Olenin S (eds) Invasive aquatic species of Europe.Distribution, impacts andmanagement.Kluwer, Dordrecht, pp 351–359
ArpeK, Leroy SAG (2007) TheCaspian Sea level forced by the atmospheric circulation, as observedand modelled. Quat Int 173–174:144–152
Arpe K, Bengtsson L, Golitsyn GS, Mokhov II, Semenov VA, Sporyshev PV (2000) Connectionbetween Caspian sea level variability and ENSO. Geoph Res Lett 27:2693–2696
ArpeK, Leroy SAG,MikolajewiczU (2011) A comparison of climate simulations for the last glacialmaximumwith three different versions of the ECHAMmodel and implications for summer-greentree refugia. Clim Past 7:91–114
Arpe K, Leroy SAG, Lahijani H, Khan V (2012) Impact of the European Russia drought in 2010on the Caspian Sea level. Hydrol Earth System Sci 16:19–27
ArpeK,LeroySAG,Wetterhall F,KhanV,HagemannS, LahijaniH (2014) Prediction of theCaspianSea level using ECMWF seasonal forecast and reanalysis. Theor Appl Climat 117:41–60
Arpe K, Tsuang B-J, Tseng Y-H, Liu X-Y, Leroy SAG (2018) Quantification of climatic feed-backs on the Caspian Sea Level variability and impacts from the Caspian Sea on the large scaleatmospheric circulation. Theor Appl Climat 136(1–2):475–488
Bagirov RM (1989) The Azov and Black Sea species introduced to the Caspian benthos andbiofouling. Abstract of Ph.D. thesis, Baku: Institute of Zoology (in Russian)
Bahr A, Lamy F, Arz HW, Major C, Kwiecien O, Wefer G (2008) Abrupt changes of temperatureand water chemistry in the late Pleistocene and early Holocene Black Sea. Geochem GeophysGeosyst 9:Q01004
Bezrodnykh YP, Sorokhin VM (2016) On the age of the Mangyshlakian deposits of the northernCaspian Sea. Quat Res 85:245–254
Bogutskaya NG, Kijashko PV, Naseka AM, Orlova MI (2013) Identification keys for fish andinvertebrates, vol 1. KMK, Moscow (in Russian)
Boomer I, Aladin N, Plotnikov I, Whatley R (2000) The palaeo-limnology of the Aral Sea: a review.Quat Sci Rev 19:1259–1278
Brunet MF, Korotaev MV, Ershov AV, Nikishin AM (2003) The South Caspian Basin: a review ofits evolution from subsidence modelling. Sed Geol 156:119–148

3 Past and Current Changes in the Largest Lake of the World … 101
Brunet MF, Shahidi A, Barrier E, Muller C, Saidi A (2007) Geodynamics of the South CaspianBasin southern margin now inverted in Alborz and Kopet Dagh (Northern Iran). Geophys ResAbstracts 9:08080 (European Geosciences Union)
Buharizin PI, Vasyanin MF, Kalinichenko LA (1992) A method for short-term forecasting of thepack ice boundary in the northern Caspian. Meteorol Hydrol 4:74–81. Moscow (in Russian)
CASPCOM, no date. http://www.caspcom.com/. Last accessed 18 June 2018Cazenave A, Bonnefond P, Dominh K, Schaeffer P (1997) Caspian sea level fromTOPEX/POSEIDON altimetry: level now falling. Geophys Res Lett 24:881–884
Chalié F, Escudié A-S, Badaut-Trauth D, Blanc G, Blanc-Valleron M-M, Brigault S, DesprairiesA, Ferronsky VI, Giannesini P-J, Gibert E, Guichard F, Jelinowska A, Massault M, MélièresF, Tribovillard N, Tucholka P, Gasse F (1997) The glacial-postglacial transition in the southernCaspian Sea. CRAS Paris 324(IIa):309–316
Chen JL, Pekker T, Wilson CR, Tapley BD, Kostianoy AG, Crétaux J-F, Safarov ES (2017) Long-term Caspian Sea level change. Geophys Res Lett 44:6993–7001
ChepalygaAL (2007) The late glacial great flood in the Ponto-Caspian basin. In:Yanko-HombachV,Gilbert AS, Panin N, Dolukhanov PM (eds) The Black Sea flood question. Springer, pp 119–148
Chesunov AV (1978) New species of free-living nematodes from the Caspian Sea. Zool Zhurnal57(4):505–511 (in Russian)
Crétaux JF, Calmant S, Romanovski V, Shabunin A, Lyard F, Berge-Nguyen M, Cazenave A,Hernandez F, Perosanz F (2009) An absolute calibration site for radar altimeters in the continentaldomain: Lake Issykkul in Central Asia. J Geodesy 83(8):723–735
Crétaux J-F, Abarca Del Rio R, Berge-Nguyen M, Arsen A, Drolon V, Clos G, Maisongrande P(2016) Lake volume monitoring from space. Surv Geophys 37:269–305
De Mora S, Sheikholeslami MR, Wyse E, Azemard S, Cassi R (2004a) An assessment of metalcontamination in coastal sediments of the Caspian Sea. Mar Poll Bull 48:61–77
de Mora S, Villeneuve JP, Sheikholeslami MR, Cattini C, Tolosa I (2004b) Organochlorinatedcompounds in Caspian Sea sediments. Mar Poll Bull 48:30–43
Derzhavin AN (1951) Animal world of Azerbaijan. Izdatelstvo AN Azerbaydzhanskoy SSR, Baku(in Russian)
Dolukhanov PM, Chepalyga AL, Lavrentiev NV (2010) The Khvalynian transgressions and earlyhuman settlement in the Caspian basin. Quat Int 225:152–159
Dumont H (1995) Ecocide in the Caspian Sea. Nature 337:673–674Dumont HJ (1998) The Caspian lake: history, biota, structure, and function. Limn Ocean 43:44–52Fendereski F, Vogt M, Payne MR, Lachkar Z, Gruber N, Salmanmahiny A, Hosseini SA (2014)Biogeographic classification of the Caspian Sea. Biogeosciences 11:6451–6470
Ferronsky VI, Polyakov VA, Kuprin PN, Lobov AL (1999) The nature of the fluctuation of CaspianSea level (based on results of the study of bottom sediments). Water Res 26(6):652–666
Forte AM, Cowgill E (2013) Late Cenozoic base-level variations of the Caspian Sea: a review of itshistory and proposed driving mechanisms. Palaeogeogr Palaeoclimatol Palaeoecol 386(15):392–407
Ghaffari P, Lahijani HAK, Azizpour J (2010) Snapshot observation of the physical structure andstratification in deep-water of the South Caspian Sea (western part). Ocean Sci 6:877–885
Ginzburg AI, Kostianoy AG, Sheremet NA (2005) Sea surface temperature. In: Kostianoy AG,Kosarev AN (eds) The Caspian Sea environment. Springer, Berlin, Heidelberg, New York, pp59–81
Giralt S, Julià R, Leroy S, Gasse F (2003) Cyclic water level oscillations of the KaraBogazGol-Caspian Sea system. Earth Plan Sci Lett 212(1–2):225–239
Glazovsky NF, Batoyan VV, Brusilovsky SA (1976) Mud volcanism as a source of supply of matterto the Caspian Sea. In: Complex study of the Caspian Sea 5. Moscow State University, Moscow,pp 189–200 (in Russian)
Goodman S, Dmitrieva L (2016) Pusa capsica. The IUCN Red List of Threat-ened Species 2016: e.T41669A45230700. http://dx.doi.org/10.2305/IUCN.UK.2016-1.RLTS.T41669A45230700.en. Last accessed 7 July 2018

102 S. A. G. Leroy et al.
Grigorovich IA, Therriault TW, MacIsaac HJ (2003) History of aquatic invertebrate invasions inthe Caspian Sea. Biol Inv 5:103–115
Grosswald M (1993) Extent and melting history of the late Weichselian ice sheet, the Barents-Karacontinental margin. In: Peltier WR (ed) Ice in the Climate System. NATO ASI Subseries I, vol12. Springer, Berlin, 1–20
Haghani S, Leroy SAG (2016) Differential impact of long-shore currents on coastal geomorphologydevelopment in the context of rapid sea level changes: the case of the Old Sefidrud (Caspian Sea).Quat Int 408:78–92
Haghani S, Leroy SAG (2020) Recent avulsion history of Sefidrud, South West of the Caspian Sea.Quat Int 540:97–110
Haghani S, LeroySAG,WesselinghFP,RoseNL (2016)Rapid evolution of aRamsar site in responseto human interference under rapid sea level change: a south Caspian Sea case study. Quat Int408:93–112
Hampton SE, McGowan S, Ozersky T, Virdis SGP, Vu TT, Spanbauer TL, Kraemer BM, SwannG, Mackay AW, Powers SM, Meyer MF, Labou SG, O’Reilly CM, DiCarlo M, Galloway AWE,Fritz SC (2018) Recent ecological change in ancient lakes. Limnol Oceanog 63:2277–2304
Herzfeld E (1947) Zoroaster and his world. Princeton University Press 2:411–851Hinds DJ, Aliyeva E, Allen MB, Davies CE, Kroonenberg SB, Simmons MD, Vincent SJ (2004)Sedimentation in a discharge dominated fluvial-lacustrine system: the Neogene Productive Seriesof the South Caspian Basin, Azerbaijan. Mar Pet Geol 21:613–638
Hoogendoorn RM,Boels JF, Kroonenberg SB, SimmonsMD,Aliyeva E, BabazadehAD,HuseynovD (2005) Development of the Kura delta, Azerbaijan; a record of Holocene Caspian sea-levelchanges. Mar Geol 222–223:359–380
Hoogendoorn RM, Levchenko O, Missiaen T, Lychagin M, Richards K, Gorbunov A, KasimovN, Kroonenberg SB (2010) High resolution seismic stratigraphy of the modern Volga delta,Russia. In: Proceedings of the International Conference on the Caspian region: environmentalconsequences of the climate change. Moscow, pp 32–37
Hoyle TM, Leroy SAG, Lopez-Merino L, Miggins D, Koppers A (2020) Vegetation successionand climate change across the Plio-Pleistocene transition in eastern Azerbaijan, central Eurasia(2.77–2.45 Ma). Palaeogeogr Palaeoclimatol Palaeoecol 538. https://doi.org/10.1016/j.palaeo.2019.109386
Huseynov DA, Guliyev SI (2004) Mud volcanic natural phenomena in the South Caspian Basin:geology, fluid dynamics and environmental impact. Environm Geol 46:1012–1023
Hydroweb, no date. Time series of water levels in the rivers and lakes around the world. http://hydroweb.theia-land.fr/hydroweb. Last accessed 18 June 2018
Ibrayev RA, Özsoy E, Svhrum C, Sur HI (2010) Seasonal variability of the Caspian Sea three-dimensional circulation, sea-level and air-sea interaction. Ocean Sci 6:311–329
Ivanov TA (1986) Caspian Sea: hydrometeorological conditions on shelf zone of the soviet seas,vol 2. Gidrometeoizdat, Leningrad (in Russian)
Ivanov VP, Kamakin AM, Ushivtzev VB, Shiganiva T, Zhukova O, Aladin N, Wilson SI, HarbisonRG, Dumont H (2000) Invasion of the Caspian Sea by the comb jellyfish Mnemiopsis leidyi(Ctenophora). Biol Inv 2:255–258
Kakroodi AA, Kroonenberg SB, Hoogendoorn RM, Mohammed Khani H, Yamani M, GhassemiMR, Lahijani HAK (2012) Rapid Holocene sea-level changes along the Iranian Caspian coast.Quat Int 263:93–103
Kaplin PA, Selivanov AO (1995) Recent coastal evolution of the Caspian Sea as a natural modelfor coastal responses to the possible acceleration of global sea-level rise. Mar Geol 124:161–175
Karpevich AF (1975) Theory and practice of aquatic organism acclimatization. Pischevayapronyshlennost, Moscow (in Russian)
Karpinsky MG (2010) On peculiarities of introduction of marine species into the Caspian Sea.Russian J Biol Inv 1(1):7–10
Karpinsky MG, Katunin DN, Goryunova VB, Shiganova TA (2005) Biological features andresources. In: Kostianoy A, Kosarev A (eds) The Caspian Sea environment. Springer, Berlin

3 Past and Current Changes in the Largest Lake of the World … 103
Kasimov AG (1987) Wildlife of the Caspian Sea. Elm, Baku (in Russian)Kasimov AG (1994) Ecology of the Caspian Lake. Azerbaijan, Baku (in Russian)Kazancheev EN (1981) Fishes of the Caspian Sea. Lyogkaya i pishchevaya promyshlennost,Moscow (in Russian)
Kholodov VN, Lisitsina NA (1989) The Caspian Sea: Sedimentology. Nauka, Moscow (in Russian)Khoshakhlagh F, Katigari AS, Saboori SH, Mojtahedi NF, Pour FM, Oskuee EA (2016) Trend ofthe Caspian Sea surface temperature changes. Nat Env Change 2:57–66
Klenova MV, Solovev VF, Aleksina IA, Vikhrenko NM, Kulakova LS, Maev EG, Rikhter VG,Skornyakava NS (1962) Geological structure of the Caspian bottom. Acad Sci USSR, Moscow
Klige RK (1990) Historical changes of the regional and global hydrological cycles. GeoJournal20:129–136
Kosarev AN (1975) Hydrology of the Caspian and Aral seas. Moscow State University, 372 ppKosarev AN (ed) (1990) The Caspian Sea. Water structure and dynamics. Nauka, Moscow (inRussian)
Kosarev AN, Tuzhilkin VS (1995) Climatic thermohaline fields of the Caspian Sea. Sorbis,Moscow(in Russian)
Kosarev AN, Yablonskaya EA (1994) The Caspian Sea. The HagueKosarevAN,KostianoyAG,Zonn IS (2009)Kara-Bogaz-GolBay: physical and chemical evolution.Aquat Geochem 15:223–236
Kostianoy A, Kosarev A (2005) The Caspian Sea environment. Springer, BerlinKostianoy AG, Ginzburg AI, Lavrova OY, Lebedev SA, Mityagina MI, Sheremet NA, SolovievDM (2019) Comprehensive satellite monitoring of Caspian Sea conditions. In: Barale V, GadeM (eds) Remote sensing of the Asian Seas. Springer, Berlin, pp 505–521
Kouraev AV, Papa F, Buharizin PI, Cazenave A, Crétaux J-F, Dozortseva J, Remy F (2003) Ice covervariability in the Caspian and Aral seas from active and passive microwave satellite data. PolarRes 22(1):43–50
Kouraev AV, Papa F, Mognard NM, Buharizin PI, Cazenave A, Crétaux J-F, Dozortseva J, Remy F(2004) Synergy of active and passive satellite microwave data for the study of first-year sea icein the Caspian and Aral Seas. IEEE Trans Geosci Remote Sens (TGARS) 42(10):2170–2176
Kouraev AV, Crétaux J-F, Lebedev SA, Kostianoy AG, Ginzburg AI, Sheremet NA, Mamedov R,Zhakharova EA, Roblou L, Lyard F, Calmant S, Bergé-Nguyen M (2011) The Caspian Sea. In:Vignudelli S, Kostianoy AG, Cipollini P, Benveniste J (eds) Handbook on Coastal altimetry, vol19. Springer, pp 331–366
Krivonogov KS, Burr GS, Kuzmin YV, Gusskov SA, Kurmanbaev RK, Kenshinbay TI, VoyakinDA (2014) The fluctuating Aral Sea: a multidisciplinary-based history of the last two thousandyears. Gondwana Res 26:284–300
Kroonenberg SB, Rusakov GV, Svitoch AA (1997) The wandering of the Volga delta: a responseto rapid Caspian sea-level change. Sed Geol 107:189–209
Kroonenberg SB, Badyukova EN, Storms JEA, Ignatov EI, Kasimov NS (2000) A full sea-levelcycle in 65 years: barrier dynamics along Caspian shores. Sed Geol 134:257–274
Kroonenberg SB, Simmons MD, Alekseevski NI, AIiyeva E, Allen MB, Aybulatov DN, Baba-Zadeh A, Badyukova EN, Davies CE, Hinds DJ, Hoogendoorn RM, Huseynov D, Ibrahimov B,Mamedov P,Overeem I, RusakovGV, Suleymanova S, SvitochAA,Vincent SJ (2005) Two deltas,two basins, one river, one sea: the modern Volga delta as an analogue of the Neogene ProductiveSeries, South Caspian Basin. In: Giosan L, Bhattacharya J (eds) River deltas—concepts, modelsand examples, SEPM Spec Publ 83, pp 231–256
Kroonenberg SB, Abdurakhmanov GM, Badyukova EN, van der Borg K, Kalashnikov A, KasimovNS, Rychagov GI, Svitoch AA, Vonhof HB, Wesselingh FP (2007) Solar-forced 2600 BP andLittle Ice Age highstands of the Caspian Sea. Quat Int 173–174:137–143
Kuprin PN (2002) Apsheron threshold and its role in the processes of sedimentation and formationof hydrological regimes in the Southern and Middle Caspian basins. Water Res 29(5):473–484
104 S. A. G. Leroy et al.
Kuprin PN, FerronskyVI, PopovchakVP, ShlykovVG, Zolotaya LA, KalishevaMV (2003) Bottomsediments of the Caspian Sea as an indicator of changes in its water regime.Water Res 30(2):136–153
Lahijani HAK, Tavakoli V, Amini AH (2008) South Caspian rivermouth configuration under humanimpact and sea level fluctuation. Env Sci 5(2):65–86
Lahijani H, Abbasian H, Naderi–Beni A, Leroy SAG, Haghani S, Habibi P, Hosseindust M,Shahkarami S, Yeganeh S, Zandinasab Z, Tavakoli V, Vahabi-Asil F, Azizpour J, Sayed-ValizadehM, PourkermanM, Shah-HosseiniM (2018a) Sediment distribution pattern of South Caspian Sea:possible hydroclimatic implications. Can J Earth Sci 56, https://doi.org/10.1139/cjes-2017-0239
Lahijani H, Naderi BeniM, Tavakoli V (2018b) Heavymetals in coastal sediments of South CaspianSea: natural or anthropogenic source? Caspian J Envir Sci 16:35–43
Lebedev SA, Kostianoy AG (2008) Integrated using of satellite altimetry in investigation of meteo-rological, hydrological and hydrodynamic regime of the Caspian Sea. J Terr Atmos Oceanic Sci19(1–2):71–82
LeontievOK,MaevNG,RichagovGI (1977)Geomorphology of theCaspian coast and sea.MoscowState University Moscow (In Russian)
Leroy SAG, Marret F, Giralt S, Bulatov SA (2006) Natural and anthropogenic rapid changes in theKara-Bogaz Gol over the last two centuries by palynological analyses. Quat Int 150:52–70
Leroy SAG, Marret F, Gibert E, Chalié F, Reyss J-L, Arpe K (2007) River inflow and salinitychanges in the Caspian Sea during the last 5500 years. Quat Sci Rev 26:3359–3383
Leroy SAG, Kakroodi AA, Kroonenberg SB, Lahijani HAK, Alimohammadian H, Nigarov A(2013a) Holocene vegetation history and sea level changes in the SE corner of the Caspian Sea:relevance to SW Asia climate. Quat Sci Rev 70:28–47
Leroy SAG, Lahijani HAK, Reyss J-L, Chalié F, Haghani S, Shah-Hosseini M, Shahkarami S,Tudryn A, Arpe K, Habibi P, Nasrollahzadeh HS, Makhlough A (2013b) A two-step expan-sion of the dinocyst Lingulodinium machaerophorum in the Caspian Sea: the role of changingenvironment. Quat Sci Rev 77:31–45
Leroy SAG, Tudryn A, Chalié F, López-Merino L, Gasse F (2013c) From the Allerød to the mid-Holocene: palynological evidence from the south basin of theCaspian Sea.Quat SciRev 78:77–97
Leroy SAG, López-Merino L, Tudryn A, Chalié F, Gasse F (2014) Late Pleistocene and Holocenepalaeoenvironments in and around the Middle Caspian Basin as reconstructed from a deep-seacore. Quat Sci Rev 101:91–110
Leroy SAG, Chalié F, Wesselingh F, Sanjani S, Lahijani HAK, Athersuch J, Struck U, Plunkett G,Reimer PJ, Habibi P, Kabiri K, Haghani S, Naderi Beni A, Arpe K (2018) Multiproxy indicatorsin a Pontocaspian system: a depth transect of surface sediment in the S-E Caspian Sea. Geol Belg21:143–165
Mamedov AV (1997) The late Pleistocene-Holocene history of the Caspian Sea. Quat Int 41–42:161–166
Mangerud J, Jakobsson M, Alexanderson H, Astakhov V, Clarke GKC, Henriksen M, Hjort C,Krinner G, Lunkka J-P, Moller P, Murray A, Nikolskaya O, Saarnisto M, Svendsen JI (2004)Ice-dammed lakes and rerouting of the drainage of northern Eurasia during the last glaciation.Quat Sci Rev 23:1313–1332
Marret F, Leroy S, Chalié F, Gasse F (2004) New organic-walled dinoflagellate cysts from recentsediments of Central Asian seas. Rev Palaeobot Palynol 129(1–2):1–20
Mason IM, Guzkowska MAJ, Rapley CG, Street-Perrot FA (1994) The response of lake levels andareas to climate change. Clim Change 27:161–197
Mayev EG (2010) Mangyshlak regression of the Caspian Sea: relationship with climate. In: Pro-ceedings of the International Conference on the Caspian region: environmental consequences ofthe climate change. Moscow, pp 107–109
Messager ML, Lehner B, Grill G, Nedeva I, Schmitt O (2016) Estimating the volume and age ofwater stored in global lakes using a geo-statistical approach. Nat Commun 13603
Mordukhai-Boltovskoy FD (1960) Caspian Fauna in the Azov and Black Sea Basin. Moscow-Leningrad: Izdatelstvo AN SSSR (in Russian)

3 Past and Current Changes in the Largest Lake of the World … 105
Mordukhai-Boltovskoy PD (1979) Composition and distribution of Caspian fauna in the light ofmodern data. Int Rev Gesamten Hydrobiol 64:383–392
Mudie P, Marret F, Mertens K, Shumilovikh L, Leroy SAG (2017) Atlas of modern dinoflagellatecyst distributions in the Black Sea Corridor, including Caspian and Aral Seas. Mar Micropaleont134:1–152
Naderi Beni A, Lahijani H, Mousavi Harami R, Arpe K, Leroy SAG, Marriner N, Berberian M,Ponel VA, Djamali M, Mahboubi A, Reimer PJ (2013) Caspian sea level changes during thelast millennium: historical and geological evidences from the south Caspian Sea. Clim Past9:1645–1665
Naghdi K, Moradi M, Kabiri K, Rahimzadegan M (2018) The effects of cyanobacterial blooms onMODIS-L2 data products in the southern Caspian Sea. Oceanologia 60:367–377
Nasrollahzadeh SH, Makhlough A, Eslami F, Leroy SAG (2014) Features of the phytoplanktoncommunity in the southern Caspian Sea, a decade after the invasion ofMnemiopsis leidyi. Iran JFish Sci 13(1):145–167
NazemosadatMJ, Ghasemi AR (2005) The effect of surface temperature fluctuations of the CaspianSea in winter and spring seasons precipitation in northern and southwestern areas of Iran. J SciTechn Agric Nat Resour 4:1–14 (in Persian)
Nejatkhah-Manavi P,Mazumder A (2018) Potential risk ofmercury to human health in three speciesof fish from the southern Caspian Sea. Mar Pollut Bull 130:1–5
Nordyke MD (2000) The Soviet program for peaceful uses of nuclear explosions. Lawrence Liver-more National Laboratory, 1 September 2000. https://e-reports-ext.llnl.gov/pdf/238468.pdf. Lastaccessed 29 July 2018
Osmakov A (2009) Caspian Sea level change. observation network and methods, quality and useof data. M.Sc. thesis, Brunel University, UK
Ozyavas A, Khan DS (2008) Assessment of recent short-term water level fluctuations of CaspianSea using Topex/Poseidon. IEEE Geosc Remote Sens L 5:720–724
Ozyavas A, Shuhab DK, Casey JF (2010) A possible connection of Caspian Sea level fluctuationswith meteorological factors and seismicity. Earth Planet Sci Lett 299:150–158
Palo JU,Väïnolä R (2006) The enigma of the landlockedBaikal andCaspian seals addressed throughphylogeny of phocine mitochondrial sequences. Biol J Linn Soc 88:61–72
Plotnikov I, Aladin N, Crétaux J-F, Micklin P, Chuikov Yu, Smurov A (2006) Biodiversity andrecent exotic invasions of the Caspian Sea. Verh Int Ver Limnol 29(5):2259–2262
Pobedonostsev SV, Abuzyarov ZK, Kopeikina TN (2005) On the quality of the Caspian Sea levelobservations. In: Proceedings of the State Hydrometeorological Center of the Russian Federation,339, Sea and river hydrological calculations and forecasts (in Russian)
Proshkina-Lavrenko AI,Makarova IV (1968) Algae of the Caspian Sea plankton. Nauka, Leningrad(in Russian)
Putans VA, Merklin LR, Levchenko OV (2010) Sediment waves and other forms as evidence ofgeohazards in Caspian Sea. Int J Offshore Pol Eng 20(4):241–246
RanjbaranM,SotohianF (2015)Environmental impact and sedimentary structures ofmudvolcanoesin southeast of the Caspian Sea basin Golestan, Province Iran. Caspian J Env Sci 13:391–405
Rekacewicz P (2007) Population by administrative region, Caspian Sea region. UNEP/GRID-Arendal. https://www.grida.no/resources/6129. Last accessed 14 June 2018
Richards K, Bolikhovskaya NS, Hoogendoorn RM, Kroonenberg SB, Leroy SAG, Athersuch J(2014) Reconstructions of deltaic environments from Holocene palynological records in theVolga delta, northern Caspian Sea. Holocene 24(10):1226–1252
Richards K, van Baak CGC, Athersuch J, Hoyle TM, Stoica M, Austin WEN, Cage AG, WondersAAH, Marret F, Pinnington CA (2018) Palynology and micropalaeontology of the Pliocene-Pleistocene transition in outcrop from the western Caspian Sea, Azerbaijan: potential links withthe Mediterranean, Black Sea and the Arctic Ocean? Palaeogeogr Palaeoclimatol Palaeoecol511:119–143
Rodionov SN (1994) Global and regional climate interaction: the Caspian Sea experience. WaterSci Technol Libr, Springer

106 S. A. G. Leroy et al.
Rychagov GI (1997) Holocene oscillations of the Caspian Sea, and forecasts based on palaeogeo-graphical reconstructions. Quat Int 41(42):167–172
Sapozhnikov VV, Mordasova NV, Metreveli MP (2010) Transformations in the Caspian Seaecosystem under the fall and rise of the sea-level. Oceanology 50:488–497
Sauer EW, Wilkinson TJ, Nokandeh J, Omrani Rekavandi H (2013) Persia’s imperial power in lateAntiquity. The great wall of Gorgan and frontier landscapes of Sasanian Iran. British Institute ofPersian Studies. Archaeological Monographs series ii. Oxbow books. Oxford and Oakville
Shiklomanov IA,GeorgievskyV,Kopaliani ZD (1995)Water balance of theCaspian Sea and reasonsof water level rise in the Caspian Sea, IOC Workshop report No 108, Paris, pp 1–28
Starobogatov YI (1994) Systematics and paleontology. In: Starobogatov YI (ed) Species of faunaof Russia and neighboring countries. Zebra mussel Dreissena polymorpha (Pall.) (Bivalvia,Dreissenidae). Nauka, Moscow (in Russian)
Stepanjants SD, Khlebovich VV, Aleksees VR, Daneliya ME, Petryshev VV (2015) Identificationkeys for fish and invertebrates, vol 2. KMK, Moscow (in Russian)
Svitoch AA (2008) The Khvalynian transgression of the Caspian Sea and the New-Euxinian basinof the Black Sea. Water Res 35(2):165–170
Svitoch AA (2009) Khvalynian transgression of the Caspian Sea was not a result of water overflowfrom the Siberian Proglacial lakes, nor a prototype of the Noachian flood. Quat Int 197:115–125
Svitoch AA (2012) The Caspian Sea shelf during the Pleistocene regressive epochs. Oceanology52(4):526–539
Tarasov AG (1996) Biological consequences of the Caspian basin pollution. Water Res 23(4):448–456
Tarasov AG, Kazantseva SZ (1994) Post-mortem transport of freshwater mollusc shells in thenorthern Caspian Sea: a cautionary note on the implications for palaeoecological reconstructions.Int J Salt Lake Res 3:49–52
Terziev FS, Kosarev AN, KerimovAA (eds) (1992) Hydrometeorology and hydrochemistry of seas,vol 6, Caspian Sea, no. 1: Hydrometeorological conditions. Gidrometeoizdat, St. Petersburg (inRussian)
Tolosa I, de Mora S, Sheikholeslami MR, Villeneuve JP, Bartocci J, Cattini C (2004) Aliphatic andaromatic hydrocarbons in coastal Caspian Sea sediments. Mar Poll Bull 48:44–60
Toropov PA, Morozova PA (2010) Evaluation of Caspian Sea level at Late Pleistocene period (onthe base of numeral simulation adjusted for Scandinavian glacier melting). In: Proceedings ofthe International Conference on the Caspian region: environmental consequences of the climatechange. Moscow, pp 134–137
Tudryn A, Leroy SAG, Toucanne S, Gibert-Brunet E, Tucholka P, Lavrushin YA, Dufaure O, MiskaS,BayonG (2016) The Ponto-Caspian basin as a final trap for southeastern Scandinavian ice-sheetmeltwater. Quat Sci Rev 148:29–43
Ulmishek GF (2001) Petroleum geology and resources of the North Caspian Basin, Kazakhstan andRussia. USGS Bull 2201-B:25
UNEP (2004) Freshwater in Europe. http://www.grid.unep.ch/products/3_Reports/freshwater_atlas.pdf. Last accessed 9 Aug 2018
Van Bavel CHM (1966) Potential evaporation: the combination concept and its experimentalverification. Water Res 2:455–467
Varushchenko S, Varushchenko A, Klige R (1987) Changes in the regime of the Caspian Sea andclosed basins in time. Nauka, Moscow
VassilievaLM(2004) http://web.worldbank.org/archive/website00983A/WEB/OTHER/9E807689.HTM?Opendocument. Last accessed 9 August 2018
Vinogradov LG (1968) Order Decapoda. In: Birstein YaA, Vinogradov LG, Kondakov NN, KunMS, Astahova TV, Romanova NN (eds) Atlas of invertebrates of the Caspian Sea. Pischevayapronyshlennost, Moscow, pp 291–300 (in Russian)
VoropayevGV(1997)Theproblemof theCaspianSea level forecast and its control for the purpose ofmanagement optimization. In: Glantz MH, Zonn IS (eds) Scientific, environmental, and politicalissues in the circum-Caspian region. Cambridge University Press, Cambridge, pp 105–118

3 Past and Current Changes in the Largest Lake of the World … 107
YaninaY, SorokinV,BezrodnykhYu,RomanyukB (2018) Late Pleistocene climatic events reflectedin the Caspian Sea geological history (based on drilling data). Quat Int 465(Part A):130–141
Zaberzhinskaya EB (1968) Flora of algae-macrophytes of the Caspian Sea. Ph.D. thesis Fac. Biol.,Baku State University (in Russian)
Zalasiewicz J, Waters CN, Summerhayes CP, Wolfe AP, Barnosky AD, Cearreta A, Crutzen P,Ellis E, Fairchild IJ, Gałuszka A, Haff P, Hajdas I, Head MJ, Assunção JA, Sul I, Jeandel C,Leinfelder R, McNeill JR, Neal C, Odada E, Oreskes N, SteffenW, Syvitski J, Vidas D,WagreichM, Williams M (2017) The Working Group on the Anthropocene: summary of evidence andinterim recommendations. Anthropocene 19:55–60
Zenkevich LA (1963) Biology of the seas of the USSR. Interscience Publishers, New YorkZonn IS (2001) Three hundred years in the Caspian (Chronology of the main historical events ofthe XVIII-XX centuries). Edel-M, Moscow (in Russian)
Zonn IS (2005) Environmental issues of the Caspian Sea. In: Kostianoy AG, Kosarev AN (eds)Handbook of Environmental Chemistry. Springer, Berlin, pp 223–242
Zonn IS, Kostianoy AG, Kosarev AN, Glantz M (2010) The Caspian Sea Encyclopedia. Springer,Berlin

Chapter 4The Aral Sea: A Story of Devastationand Partial Recovery of a Large Lake
Philip Micklin, Nikolai V. Aladin, Tetsuro Chida, Nikolaus Boroffka,Igor S. Plotnikov, Sergey Krivonogov and Kristopher White
Abstract The Aral Sea was a huge brackish-water lake lying in a tectonic depres-sion amidst the deserts of Central Asia. Water bodies of various dimensions haverepeatedly filled this depression over the past several million years. Its modern incar-nation is thought to be somewhat more than 20,000 years in age. In modern times,the sea supported a major fishery and functioned as a key regional transportationroute. But since the 1960s, the Aral has undergone rapid desiccation and saliniza-tion, overwhelmingly the result of unsustainable expansion of irrigation that largelydried up its two tributary rivers, the AmuDar’ya and Syr Dar’ya (dar’ya in the Turkiclanguages of Central Asia means river) before they reached the Aral Sea. The des-iccation of the Aral Sea has had severe negative impacts, including, among others,
P. Micklin (B)Department of Geography, Western Michigan University, Kalamazoo, MI 49008 5424, USAe-mail: [email protected]
N. V. Aladin · I. S. PlotnikovLaboratory of Brackish Water Hydrobiology, Zoological Institute, Russian Academy of Sciences,Universitetskaya nab. 1, St. Petersburg 199034, Russiae-mail: [email protected]
I. S. Plotnikove-mail: [email protected]
T. ChidaSchool of Global Governance and Collaboration, Nagoya University of Foreign Studies, 57Takenoyama, Iwasaki, Nissin Aichi 470-0197, Japane-mail: [email protected]
N. BoroffkaEurasia Department, German Archaeological Institute, Im Dol 2-6, 14195 Berlin, Germanye-mail: [email protected]
S. KrivonogovInstitute of Geology and Mineralogy, Siberian Branch of Russian Academy of Sciences,Novosibirsk State University, 3 Koptyug Ave., 630090 Novosibirsk, Russiae-mail: [email protected]
K. WhiteKIMEP University, 4 Abai Ave., Almaty 050010, Kazakhstane-mail: [email protected]
© Springer Nature Switzerland AG 2020S. Mischke (ed.), Large Asian Lakes in a Changing World, Springer Water,https://doi.org/10.1007/978-3-030-42254-7_4
109

110 P. Micklin et al.
the demise of commercial fishing, devastation of the floral and faunal biodiversityof the native ecosystems of the Syr and Amu Deltas, and increased frequency andstrength of salt/dust storms. However, efforts have been and are being made to par-tially restore the sea’s hydrology along with its biodiversity, and economic value.The northern part of the Aral has been separated from the southern part by a dikeand dam, leading to a level rise and lower salinity. This has allowed native fishes toreturn from the rivers and revitalized the fishing industry. Partial preservation of theWestern Basin of the southern Aral Sea may be possible, but these plans need muchfurther environmental and economic analysis.
Keywords Lake history · Lake level · Irrigation ·Water diversion · Dust · Salt
4.1 Introduction
The Aral Sea, in Russian “Aralskoye more” and in the Turkic languages of CentralAsia “Aral Tengizi” (Kazak) or “Arol Dengizi” (Uzbek) is a terminal or closed-basin (endorheic) lake, lying amidst the vast deserts of Central Asia (Fig. 4.1). Fromthe mid-seventeenth century until the 1960s, lake level variations were less than4.5 m (Micklin 2016). During the first six decades of the twentieth century, the sea’swater balance was remarkably stable and its annual average level fluctuated less
Fig. 4.1 Location of the Aral Sea in Central Asia. Source Micklin (2007)

4 The Aral Sea: A Story of Devastation and Partial Recovery … 111
Fig. 4.2 The changing Aral Sea: 1960–2018
than a meter. At 67,500 km2 in 1960, the Aral Sea was the world’s fourth largestlake in surface area (Micklin 2010; Zonn et al. 2009). A brackish lake with salinityaveraging near 10 grams/liter (g/l), less than a third of the ocean, it was inhabitedby both freshwater and brackish-water fish species (Kostianoy and Kosarev 2010).The sea supported a major fishery and functioned as a key regional transportationroute. The extensive deltas of the Syr Dar’ya and Amu Dar’ya sustained a diversityof flora and fauna, including endangered species. The deltas also had considerableeconomic importance supporting irrigated agriculture, animal husbandry, huntingand trapping, fishing, and harvesting of reeds, which served as fodder for livestockas well as building materials.
Post 1960, the Aral has undergone rapid desiccation and salinization, overwhelm-ingly the result of unsustainable expansion of irrigation that largely drained the twoinfluent rivers (Fig. 4.2; Table 4.1). By June 2018 the Aral Sea consisted of five sep-arate water bodies that at times are connected (Fig. 4.3). In summer 2014 the EasternBasin of the Aral entirely dried. Its aggregate area and volume at that time were only10% and 4%, respectively, of 1960 (Micklin 2016). Subsequently, the Eastern Basinhas expanded and shrunk on a seasonal rhythm depending on inflow from tributaryrivers. By June 2018, the level of the deeper Western Basin of the Aral Sea had fallento a record low of a bit more than 23 m above the Kronstadt gauge (situated on theGulf of Finland near St. Petersburg, Russia which has a zero 20 cm above oceanlevel), while owing to significant winter and spring inflow from the Amu Dar’ya andSyr Dar’ya, the very shallow Eastern Basin was somewhat higher (Table 4.1).
In the sections that followwe give a basic characterization of the Aral Sea in termsof basin history, natural state prior to the modern desiccation, human impacts on thelake, and future of the water body.

112 P. Micklin et al.
Table4.1
Hydrologicaland
salin
itycharacteristicsof
theAralS
ea,1960–2018
Yearand
portionof
sea
Level(m
eters
aboveBaltic
Sea)
Area(km
2)
%1960
area
Volum
e(km
3)
%1960
volume
Average
depth
(meters)
Avg
.salinity
(g/l)
%19
60salin
ity
1960
(all)
53.4
67,499
100
1089
100
16.1
10100
Large
53.4
61,381
100
1007
100
16.4
10100
Small
53.4
6118
100
82100
13.4
10100
1971
(all)
51.1
60,200
89925
8515.4
12120
1976
(all)
48.3
55,700
83763
7013.7
14140
1989
(all)
39,734
59364
339.2
Large
39.1
36,930
60341
349.2
30300
Small
40.2
2804
4623
288.2
30300
Sept
22,2
009
(all)
7146
10.6
837.7
10.8
W.B
asin
Large
273588
26.2
5617.9
15.1
>100
>1000
E.B
asin
Large
27516
1.1
0.64
0.07
0.7
>150
>1500
Tshche-bas
Gulf
28292
0.51
7.1
1.4
~85
850
Small
423200
5227
338.4
8100–130
8/29
and11/25,
2014
(all)
6990
10.4
81.7
4.4
6.9
W.B
asin
Large
25.0
3120
22.8
5417.2
15.4
>150
>1000 (c
ontin
ued)
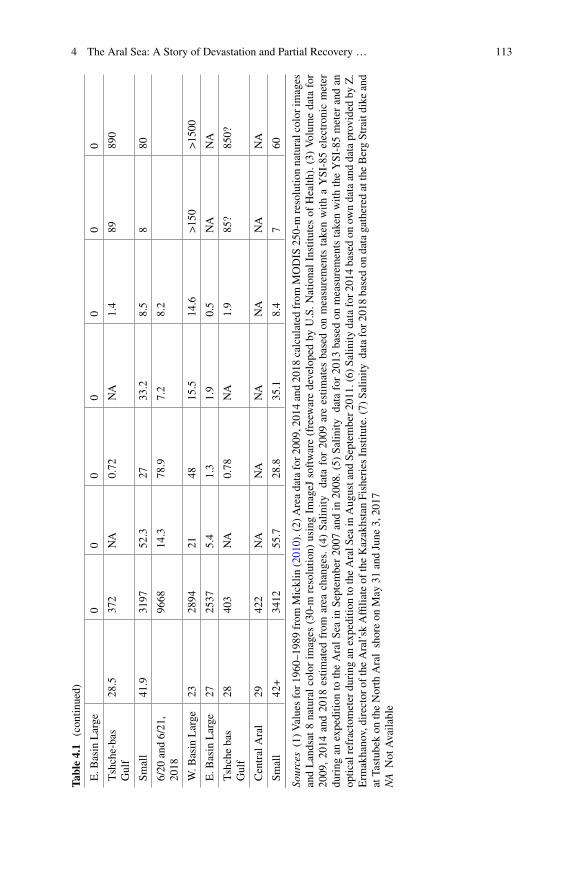
4 The Aral Sea: A Story of Devastation and Partial Recovery … 113
Table4.1
(contin
ued)
E.B
asin
Large
00
00
00
0
Tshche-bas
Gulf
28.5
372
NA
0.72
NA
1.4
89890
Small
41.9
3197
52.3
2733.2
8.5
880
6/20
and6/21,
2018
9668
14.3
78.9
7.2
8.2
W.B
asin
Large
232894
2148
15.5
14.6
>150
>1500
E.B
asin
Large
272537
5.4
1.3
1.9
0.5
NA
NA
Tshchebas
Gulf
28403
NA
0.78
NA
1.9
85?
850?
CentralAral
29422
NA
NA
NA
NA
NA
NA
Small
42+
3412
55.7
28.8
35.1
8.4
760
Sources(1)Valuesfor1960–1989from
Micklin
(2010).(2)
Areadatafor2009,2014and2018
calculated
from
MODIS
250-m
resolutio
nnaturalcolor
images
andLandsat
8naturalcolorim
ages
(30-m
resolutio
n)usingIm
ageJ
software(freew
aredevelopedby
U.S.N
ationalInstitu
tesof
Health
).(3)Volum
edata
for
2009
,20
14and20
18estim
ated
from
area
changes.(4)Salin
itydata
for20
09areestim
ates
basedon
measurements
takenwith
aYSI-85electron
icmeter
during
anexpeditio
nto
theAralSeain
Septem
ber2007
andin
2008.(5)
Salin
itydata
for2013
basedon
measurementstakenwith
theYSI-85meter
andan
opticalrefractometer
during
anexpeditio
nto
theAralS
eain
Augustand
Septem
ber2011.(6)
Salin
itydatafor2014
basedon
owndataanddataprovided
byZ.
Erm
akhanov,director
oftheAral’skAffilia
teof
theKazakhstanFisheriesInstitu
te.(7)
Salin
itydatafor20
18basedon
datagathered
attheBergStraitdike
and
atTastubek
ontheNorth
Aralshoreon
May
31andJune
3,2017
NA
Not
Availa
ble

114 P. Micklin et al.
Fig. 4.3 MODIS 250-m resolution natural color image of the Aral Sea on June 20, 2018. Numbersindicate: 1—North Aral; 2—Central Aral; 3—Tshche-Bas Gulf; 4—Western Basin of Large Aral;5—Eastern Basin of Large Aral. Source MODIS Rapid Response System (https://lance-modis.eosdis.nasa.gov/cgi-bin/imagery/realtime.cgi)
4.2 Basin History
Over the past three million years the Aral region was part of the Neogene Ponto-Caspian ancient seas (Akchagyl and Apsheron) and became a separate depressionin the Pleistocene. Most experts believe that it began as a small depression, whichcollected local surface water. This runoff was slightly saline due to the dissolutionof local salt deposits. When the water evaporated, it left behind a thin veneer ofsalts. The surface layer was highly sensitive to wind erosion. The process eventuallydeepened and enlarged the depression. The area was dry during a major part of thePleistocene but geological data (Kes 1969, 1995; Rubanov et al. 1987) suggest largerivers reached the depression by the end of the middle to the beginning of the latePleistocene, i.e., approximately 140,000 years before present (BP).
There have been several age estimates for the Aral Sea initiation. Lopatin (1957)calculated 18,000 years for the age of the Amu Dar’ya delta from its total volumeand sedimentation rate. Chalov (1968), based on Uranium-isotope-ratio dating, con-cluded that the Aral Sea is as old as 139,000± 12,000 years, and that the Syr Dar’yawas the solewater source at that time. TheAmuDar’ya started to dischargewater into

4 The Aral Sea: A Story of Devastation and Partial Recovery … 115
the Aral Sea not earlier than 22,000 years ago. Kes (1995) believed that the highestlevel of the Aral Sea, up to 72 m above Kronstadt gauge occurred during the LastGlacial Maximum (LGM), and she referred to a terrace-derived 14C date of 24,820± 820 years BP (Pshenin et al. 1984). Other experts, based on the bottom-sedimentrecords, concluded the Aral is very young, up to 10,000 years, and the sedimentsreflect two shallow and deep-water stages in the middle Holocene (Nikolaev 1991,1995). The most recent drilling data imply age of the deepest subbase layers of thelake sediments coarsely extrapolated to 19,000 years BP (Boomer 2012). The non-lacustrine substratum was dated to 23,800 years BP (Krivonogov 2014; Krivonogovet al. 2010). These ages were obtained from a cluster of boreholes to the south andnorth from Barsakelmes Island. The farthest to the south and the deepest boreholeB-05-2009 is 15 m deep and includes 11 m of the Aral Sea sediments with a basalage of ca. 17,600 years BP (Burr et al. 2019). The previously published boreholedepth (B-2008-01) east of Barsakelmes, where the sediments have been dated to24,000 years BP, includes only 7 m of lacustrine sediments.
In general, researchers have placed the original filling stage of the Aral to20,000 years BP (Oreshkin 1990, pp. 3–4). At this time and for a considerableperiod afterward, the Amu Dar’ya flowed westward into the Caspian Sea rather thannorthward into the Aral. The lake did not attain significant size until the Amu Dar’yaswitched its course northward into the Aral Sea. This increased inflow to the lakeby some threefold. It is believed to have occurred 10,000–20,000 years BP and wasmost likely due to a wetter climate that increased river discharge (Aladin et al. 1996).The Small (North) Aral only filled after the addition of the Amu’s flow.
Approximately the last 10 millennia (corresponding with the Holocene Epoch)constitute the modern geological history of the Aral Sea (Micklin 2014a). Sovietscientists during the post-World War II era (from the late 1940s to 1991) intensivelystudied the evolution of the Aral over this time-period. Dating of relict shore terraces,fossils and deposits of various salts precipitating from the sea contained in sedimentcores from the sea bottom, and of archeological sites, along with historical recordspoint to repeated major recessions and transgressions of the sea.
Kes (1978), based on studies of terraces, believed lake level could have been ashigh as 57–58, 62–63 or even 70–73 m, measured above the Kronstadt gauge. Thehighest reliable standings of the sea discussed in early literature (e.g., Lymarev 1967;Rubanov et al. 1987) are the “Ancient Aral Transgression” that reached an estimated57–58mand lasted fromapproximately 2800–2000 yearsBP, “NewAral” at 54–55mreached around 1000 years ago and the pre-1960 level around 53 m that dates fromaround the middle seventeenth century (350 years BP). More recent investigationsusing GIS and GPS techniques indicate the highest level the Aral reached over thelast 10,000 years was no more than 54–55 m above sea level (Boomer et al. 2009;Boroffka et al. 2006; Reinhardt et al. 2008) and confirm the idea of Berg (1908) thatthe Aral never overflowed into the Sarykamysh Lake and Uzboy channel leading tothe Caspian Sea. Feeding of the Sarykamysh and Uzboy was from direct diversionsof the Amu Dar’ya. Diversions of the Amu Dar’ya westward toward the Caspian Seacaused regressions of the Aral. The change from a wetter to dryer climate leading

116 P. Micklin et al.
to less flow into the Aral from both the Syr Dar’ya and Amu Dar’ya no doubt alsoaffected lake levels.
Researchers from Moscow State University (Mayev et al. 1983, 1991; Mayevaand Mayev 1991) were the first who investigated and dated the Aral Sea sedimentcores. They believed there were nine major regression/transgression cycles duringthe Holocene and showed that deep regressions were typical features in the Aralhistory. The deepest regression recorded by these authors was the so-called stage ofthe “Oxus swamp” that occurred about 1600 years BP (the radiocarbon dates werecalibrated by Krivonogov et al. 2014), when the delta of the Syr Dar’ya was situatednear the central part of the LargeAral Basin. The early transgressions and regressionsof the sea are still not as well-known as later events. The level history for the secondhalf of the Holocene (6000 years BP to the beginning of the modern drying in the1960s) is better understood and the history of the last 2000 years is even more fullycomprehended (Boroffka et al. 2006; Oberhänsli et al. 2007).
Regressions of the sea are related to the partial or full diversion of the AmuDar’yawestward into the Sarykamysh Depression and from there via the Uzboy channel tothe Caspian Sea. The change from a wetter to dryer climate leading to less flow intothe Aral from both the Syr Dar’ya and Amu Dar’ya no doubt also played a role butcannot account for the size and rapidity of the most significant level declines.
Ancient civilizations also affected Aral levels. Human impacts included sizableirrigation withdrawals and periodic diversions of the Amu Dar’ya westward intothe Sarykamysh Depression and Uzboy Channel. The first evidence of irrigationalong the Amu dates to 3000 years ago (Kes 1978; Lunezheva et al. 1987, 1988)and irrigation may have covered five million hectares at times during the fourthcentury B.C. to fourth century A.D. (Micklin 2014b). However, the impact of ancientirrigation on river inflow to the sea was probably not as significant as it might seem(Kes 1978). Fields were small and withdrawals per hectare irrigated were muchless than modern. Also, a much larger percentage of water withdrawn was returnedvia drainage flows to the rivers rather than being “lost” to evaporation in the aridsurrounding deserts. Finally, canals were built and abandoned over time so that thearea irrigated in a specific yearwas far smaller than the area covered by canal systems.
Human-caused diversions were by far the most important influence on levels overthe past millennium. Some of these were accidental, caused by breaching of dikesand dams constructed for irrigation purposes during heavy flows of the river. Othersoccurred during wars and were purposeful with the intent to deprive an enemy ofboth water for drinking and irrigating crops. Thus, in 1221 the forces of GenghisKhan wrecked irrigation systems in Khorezem Khanate (Bartold 1902; Berg 1908).This caused the Amu to turn its course from northward to the Aral to westward intothe Sarykamysh Depression and the Caspian Sea. A similar story is reported aboutTimur (Tamerlane) who is reputed to have diverted the Amu Dar’ya westward in1406 to flood the city of Urgench in order to force its surrender. There is amplearcheological and historical evidence of repeated settlement and agriculture aroundthe Sarykamysh Depression and along the Uzboy, which would only be possiblewhen the former was flooded and the latter contained a river (Vainberg 1999).

4 The Aral Sea: A Story of Devastation and Partial Recovery … 117
Research on historic level fluctuations of the Aral diminished greatly after thecollapse of the USSR in 1991. The lake was no longer of great interest to researchinstitutions in Moscow and Leningrad that had studied it both during Tsarist andSoviet times. Since the late 1990s, however, there has been resurgent interest inthe topic. Motivating factors have been the need to better understand the modernregression by delving into past drying events and the fact that the receding seais uncovering shoreline terraces, former river beds, archeological finds, and otherevidence whose analysis provides a much clearer picture of past regressions thanhad hitherto been possible.
The most ambitious effort was developed within the CLIMAN Project (HoloceneClimatic Variability and Evolution of Human Settlement in the Aral SeaBasin) in 2002–2005, funded by the European Union’s INTAS Project (1993–1993–2007). The Aral-related program was intended as an interdisciplinary studyto help distinguish between climatic variations and anthropogenically controlledenvironmental changes in the past (Boroffka et al. 2006; Oberhänsli et al. 2007).The focus was on previous lake levels and the evolution of human settlement andagriculture in the Aral Sea Basin. Differential GPS elevation measurements ofshorelines around the sea convincingly argued against the Aral’s level standing anyhigher than about 55 m for at least the past 35,000 years (Reinhardt et al. 2008).Based on archeological evidence, relict shorelines, and sediment core analyses, theCLIMAN group delineated seven transgressions and six regressions over the past5,000 years. However, the best documented of these (by sediment cores analysesand shoreline traces) are four regressions dated to 350–450, 700–780, around 1400,and 1600–2000 years BP (Austin et al. 2007; Huang et al. 2011; Oberhänsli et al.2011; Sorrel et al. 2006, 2007a, b).
The second post-Soviet effort to reveal changes of the Aral Sea level was thejoint US CRDF—Russian RFBR project “Environmental history of the Aral Sea inthe last 10,000 years: natural and anthropogenic components” in 2008–2010. Thekey activity was drilling and dating the sediments in the dry bottom of the LargeAral Basin. A series of high and low stands were identified through the Holocene(Krivonogov 2014; Krivonogov et al. 2010). Special attention was paid to the last2000 years, for which two large regressions and two transgressions (prior to themodern technogenic regression) were substantiated by multiproxy data both originaland published by predecessors (Krivonogov et al. 2014). Special attention was paidto the extent and timing of the last major desiccation of the Aral prior to the moderndrying (Krivonogov 2009; Krivonogov et al. 2014).
The regression occurred from the 11th to sixteenth centuries when the level mayhave fallen below29mabove the zero level of theKronstadt gauge.Historical recordsas well as archeological sites, preserved tree stumps, and relict river channels on thedried bottom of the Aral attest to this event. The most convincing evidence wasthe discovery by Kazakh hunters at the end of the twentieth century of a mazar(Islamic holy gravesite) on the dried bottom of the Eastern Large Aral, northeastof the former Island of Barsakelmes, which in the early 1960s was 19 m belowthe surface of the Aral (Boroffka et al. 2005, 2006; Micklin 2007; Smagulov 2001,2002). The gravesite is known as Kerdery #1. Consequently, two other archeological

118 P. Micklin et al.
sites were found at about ten kilometers from Kerdery #1: Aral-Asar settlement andKerdery #2 gravesite (Catalogue 2007). Archeologists date the sites in the range fromlate 13th to early fifteenth centuries. Radiocarbon dating of wood and bones fromthe sites (Krivonogov et al. 2010, 2014) gave a range of 500–1000 years BP.
Themajor cause of this recession very likelywas an anthropogenic diversion of theAmu westward toward the Caspian Sea prior to the Mongol invasion of Central Asiain the thirteenth century. The Mongol intrusion probably increased this effect. TheAmu returned (or was returned) to the Aral and the sea recovered by the mid-1600s.The sea was generally in a relatively stable “high” phase until the modern regressionbegan in the early 1960s. Level fluctuations were no more than 4–4.5 m and werechiefly related to climatic variation with, perhaps, some effects from irrigation.
4.3 Natural State of the Aral Sea Prior to the ModernDesiccation
The Aral Sea, as nearly all the earth’s large lakes, has suffered significantly fromhuman actions for some time. So, to speak of its “natural state” we would need to goback several thousand years as made clear in the section above on the lake’s history.The discussion below is focused primarily on the condition of the lake during thefirst six decades of the twentieth century prior to the modern desiccation that startedin the 1960s.
4.3.1 Geographical Setting of the Aral Sea
The Aral Sea is in the heart of Central Asia on the Eurasian continent (Fig. 4.1).Its drainage basin covers 2.2 million km2 (World Bank 1998, p. 1). The basin ismainly lowland desert (Micklin 2014a). The climate is desert and semi-desert withcold winters and hot summers in the north and central parts and very hot summersand cool winters in the south (Goode’s World Atlas 1982, pp. 8–9). High mountainsring the basin on the east and south (Tian Shan, Pamir, Kopet-Dag), with peaks inthe Pamirs over 7000 m.
Annual precipitation in the lowland deserts ranges from less than 100 mm tothe south and east of the Aral Sea to near 200 mm approaching the foothills of thesoutheasternmountains (Atlas of the USSR 1983, p. 102) The foothills and valleys ofthe mountainous south and southeast are substantially more humid with precipitationranging from 200 to over 500mm. The high Pamir and Tian Shan ranges are wet withaverage annual precipitation from 800 to 1600 mm giving this zone a marked surplusof moisture. This, in turn, has created large permanent snow-fields and glaciers thatfeed the twomajor rivers, the AmuDar’ya and Syr Dar’ya, flowing across the desertsto the Aral Sea.

4 The Aral Sea: A Story of Devastation and Partial Recovery … 119
4.3.2 Hydrology of the Aral Sea Basin
Although the majority of the Aral Sea Basin is desert, it has substantial waterresources. The mountains on the south and southeast capture the plentiful precipita-tion, storing most of it in snowfields and glaciers (Micklin 2014a, c). Runoff fromthese, heaviest during the spring-early summer thaw, feeds the region’s rivers. Esti-mated average annual river flow in the Aral Sea Basin is 116 km3, including flow ofthe drainage basins of the Amu Dar’ya and Syr Dar’ya.
The Amu is the most important river within the Aral Sea Basin. Originatingprimarily among the glaciers and snowfields of the Pamir Mountains of Tajikistan,its drainage basin covers 465,000 km2. The river flows 2620 km from the mountainsacross theKara-KumDesert and into theAral Sea. During this journey, the river flowsalong the borders and across four Central Asian nations: Tajikistan, Afghanistan,Turkmenistan, and Uzbekistan, entering, leaving, and reentering the last two statesseveral times (Fig. 4.1).
Average annual flow from the drainage basin of the Amu is around 79 km3. Thisincludes not only the flow of the Amu Dar’ya and its tributaries but several “ter-minal” rivers that disappear in the deserts (Micklin 2000, pp. 6–7). The Amu is“exotic,” which, hydrologically means that essentially all its flow originates in thewell-watered PamirMountains, but that this flow is substantially diminished by evap-oration, transpiration from vegetation growing along its banks, and bed exfiltrationas the river passes across the Kara–Kum Desert to the Aral Sea. The Amu Deltaaccounted for very large flow losses owing to evaporation and transpiration. Prior tothe Aral Sea’s modern desiccation, average annual inflow of the river to it decreasedto 40 km3 from the 62 km3 coming out of the Pamir Mountains on to the desert plainof Turkmenistan.
The Syr Dar’ya flows from the Tian Shan Mountains, located to the north of thePamirs. The melt of glaciers and snowfields are its main source of water. Its drainagebasin covers 462,000 km2. With a length of 3078 km, it is longer than the Amu(Micklin 2014a). Average annual flow of the Syr at 37 km3, is considerably lessthan that of the Amu. Prior to the 1960s, flow diminution was substantial during itslong journey across the Kyzyl-Kum Desert with less than half (around 15 km3 onan average annual basis) of the water coming from the mountains reaching the AralSea.
4.3.3 Physical Characteristics of the Aral Sea Beforethe Modern Desiccation
The Aral Sea lies at the bottom of the Turan Depression by the eastern edge of theUst-Urt Plateau (Bortnik and Chistyayeva 1990, p. 6). Its name derives from theword Aral, which means “island” in the Turkic languages of Central Asia. It mayhave been thusly named because it was an “island of water” in the vastness of the

120 P. Micklin et al.
Central Asian deserts. The name may also be connected to the many islands presentin the sea prior to its modern desiccation (Ashirbekov and Zonn 2003, p. 6).
TheAral Sea occupies the lowest part of a vast erosional-tectonic hollowofmiddleCenozoic age (Micklin 2016). It is geologically young, having arisen at the end ofthe Quaternary period, coincident with the last glacial epoch about 20,000 years BP(Boomer 2012; Burr et al. 2019; Krivonogov 2014). The lake’s level in 1960 was53.4 mwith an area of 67,499 km2, making it the world’s fourth largest lake in extentat that time after the Caspian Sea in Eurasia (371,000 km2), Lake Superior in NorthAmerica (82,414 km2) and Lake Victoria in Africa (69,485 km2; Micklin 2014a;Table 4.1). The Aral in 1960 had a maximum depth of 69 m, average depth of 16 m,volume of 1089 km3, and shoreline stretching for more than 4430 km. More than1100 islands, with an aggregate area of 2235 km2 dotted the sea. The largest wereKok-Aral (311 km2), Barsakelmes (170 km2) and Vozrozhdeniya (170 km2; Kosarev1975, p. 23).
The Aral was divided into a so-called “Small Sea” (or “North Aral”) on the northand “Large Sea” (or “South Aral”) to the south, which were connected by the BergStrait. The Small Aral had an area of 6118 km2, volume of 82 km3, maximum depthof 29m and average depth of 13.4 m (Table 4.1). It consisted of a deeper central basinand several shallower gulfs. The largest town and most important port and fishingcenter (Aral’sk) was situated at the northern end of the Gulf of Saryshaganak.
The Large Aral had a considerably greater surface area and volume (61,381 km2
and 1007 km3). It was divided into two basins by a north-south stretching underwaterridge that protruded through the surface to form a chain of small islands, the largestof which was named Vozrozhdeniye (“Resurrection”). This island became famous,perhaps better to say “infamous” as the location of the USSR’s most important,super-secret testing grounds for biological weapons. The Eastern Basin had an areaof 47,461 km2 and the Western Basin 13,920 km2. However, the former was shallow(maximum depth of 28.4 m and average depth of 14.7 m) whereas theWestern Basinwas considerably deeper with a maximum depth of 69m and average depth of 22.2 m(Micklin 2014a).
The estimated average annual water balance for the Aral Sea for 1911–1960(considered the quasi-stationary period for the Aral’s level) is below (Bortnik andChistyayeva 1990, Table 4.1, p. 36, Fig. 2.5, p. 20, pp. 34–39).
1. Gain: river inflow (56 km3) + sea-surface precipitation (9.1 km3) = 65.1 km3
2. Loss: sea-surface evaporation = 66.1 km3
3. Volume change = (−1.0 km3)
The main elements determining the Aral’s level, area, and volume were riverinflow and surface evaporation, with sea-surface precipitation playing a secondaryrole on the gain side of the balance. There was also a net groundwater inflow, but itwas believed small (up to 3.4 km3) and ignored in calculating the sea’s water budget.
The Aral Sea was brackish with an average salinity around 10 g/l, slightly lessthan one-third that of the open ocean. Salinity was lower than the average near theentrance of the two main rivers, particularly during peak-river inflow in spring/earlysummer when it could fall below 4 g/l near the mouth of the Amu. High salinity

4 The Aral Sea: A Story of Devastation and Partial Recovery … 121
levels (17–18 g/l) were reached during summer and winter in the gulfs of the east andsoutheast part of theLargeAral owing to high rates of evaporation during summer andice formation (which concentrates salts in the remaining water volume thus raisingsalinity) in winter (Kosarev 1975, p. 228). Levels of salinity in isolated portions ofthe Gulf of Saryshaganak could reach 80–150 g/l.
Researchers considered Aral water exceptionally transparent (Zenkevich 1963,p. 510). On average, a Secchi disk, used to determine this, could be seen at 8.2 m,with maximum readings of 23.5 m in the central part of the Large Aral, 24 m in theSmall Aral, and 27 m in Chernishov Gulf at the northern end of the Western Basinof the Large Sea (Bortnik and Chistyayeva 1990, p. 95).
Maximumwater temperatures were reached in July and August, when the surfacelayer along the shoreline could reach 29 °C and 24–26 °C in the open sea (Bortnikand Chistyayeva 1990, pp. 43–49; Zenkevich 1963, Table 236, p. 510). As heating ofthe water mass progressed, a significant thermocline and temperature discontinuityformed in the deep Western Basin of the Large Sea, where the surface temperaturewould average around 24 °C while at depths below 30 m it would range from 2 to6 °C. The shallower Eastern Basin of the Large Sea, on the other hand, had relativelyuniform temperatures throughout the water column, with a difference of only a fewdegrees between the surface and bottom.
Vertical stability was primarily determined by temperature and only in the south-ern parts of the sea by both temperature and salinity (Bortnik and Chistyayeva 1990,pp. 82–85; Kosarev 1975, pp. 237–240, 247–260). Intensive heating of the Aral’ssurface waters in spring and summer led to the formation of a stable surface layer(down to the temperature discontinuity) and a stable bottom layer below that. Hencemixing between the surface and bottom layers was prevented. With the onset ofcooling in fall, the surface to bottom temperature gradient weakened considerably,sometimes turning negative, leading to greatly diminished stability and convectivemixing. During winter, ice formation and the resulting salt concentration increasedsurface water layer density and further enhanced convective mixing. The fall-winterconvective mixing, which affected all parts of the sea and encompassed all water lay-ers was considered the most important process determining the hydrologic structureof the Aral waters, particularly for the deeper parts of the sea.
4.3.4 Biology of the Aral Sea Prior to the Modern Desiccation
The aboriginal faunaof theAral Seawas represented bymore than200 species of free-living invertebrates (Mordukhai-Boltovskoi 1974; Plotnikov 2016), over 200 speciesof parasitic invertebrates (Osmanov et al. 1976) and 20 species of fish (Nikolsky1940). Among the species of free-living invertebrates, the inhabitants of freshwater,brackish-water and saline continental waterbodies composed 78% Ponto-Caspianspecies (species originating from the Black and Caspian seas that are relict fauna ofthe ancient Paratethys Ocean—these seas are its remnants). In modern times, most

122 P. Micklin et al.
Ponto-Caspian species are endemics living primarily in the Black Sea, Sea of Azovand Caspian Sea; only a few lived in the Aral prior to its modern drying.
The abundance of only a few species of free-living invertebrates in the Aral washigh. Among the zooplankton, the most numerous copepod Arctodiaptomus sali-nus represented fauna of continental saline water bodies. Ponto-Caspian cladocer-ans Cercopagis pengoi aralensis, Evadne anonyx, Podonevadne camptonyx and P.angustawere also numerous. Among the freshwater euryhaline Cyclopoida, themostcommon was Mesocyclops leuckarti. The highest diversity of zooplankton was inthe freshened parts of the sea due to freshwater species (Andreev 1989; Kortunova1975).
Freshwater and Caspian species prevailed in the aboriginal benthic fauna of theAral Sea. Its basis was mollusks, oligochaetes, higher crustaceans and larvae of Chi-ronomidae (Mordukhai-Boltovskoi 1974). Bivalve mollusks were numerous, includ-ing Dreissena spp. and Hypanis spp., oligochaetes Nais elingius and Paranais sim-plex, ostracod Cyprideis torosa, amphipod Dikerogammarus aralensis, larval chi-ronomids Chironomus behningi and caddis fliesOecetis intima.Mollusks accountedfor 63% of zoobenthos biomass, and chironomid larvae for 33% (Karpevich 1975).
Almost all aboriginal ichthyofauna of the Aral Sea consisted of generativelyfreshwater (usually breeding in freshwater) species. In it, 60% were cyprinids(Ermakhanov et al. 2012; Nikolsky 1940). The best places for spawning were fresh-ened bayside deltas, rivers and deltaic lakes. All aboriginal fish, except for thestickleback, Pungitius platygaster aralensis, whose main food was zooplankton,were benthophagous (feeding on bottom-dwelling organisms) or predators (Nikolsky1940).
Vegetation and flora of aquatic and coastal-aquatic plants were monotonous andpoor by species. Only two species and two plant communities dominated—reeds incoastal shallow waters and eelgrass (Zostera) at depths of up to 11 m on silty sands.In the central part on muds charophytes were found at depths of 11–22 m, and in theshallows—watermilfoil Myriophyllum sp. and pondweed Potamogeton perfoliatus.By the 1960s in the Aral Sea flora 24 species of higher plants, six species of charo-phytes and about 40 other species of macroalgae were known. Aquatic vegetationformed zones of helophytes (plants rooted in the bottom, but with leaves above thewaterline) and zones of hydrophytes (plants that complete their entire life cycle sub-merged, or with only their flowers above the waterline). Along the shore reed-bedsof Phragmites australis dominated. In the northern part of the sea beyond the reedzone often was a zone of bulrush Scirpus kasachstanicum. Other helophytes did notform large thickets (Plotnikov et al. 2014a).
Communities of hydrophytes presented diverse associations that formed vastunderwater meadows. Extensive deep-water thickets of Charophyta existed at thebeginning of the twentieth century but were absent by the 1950s. In their place,yellow-green algae Vaucheria dichotoma were found. In freshened bays, the basisof macrophytobenthos was higher flowering plants. In closed saline bays and inletscharophytes dominated (Plotnikov et al. 2014a).

4 The Aral Sea: A Story of Devastation and Partial Recovery … 123
4.4 Human Impact on the Aral in the Modern Era (MainlyPost 1960)
Humans have affected the Aral Sea in important ways for millennia as has beendiscussed above in Sect. 4.2 on Basin History. However, the human touch has beenespecially dramatic, powerful and far reaching since the 1960s. The subsections thatfollow provide a description and discussion of the major changes that have and areunfolding.
4.4.1 The Changing Physical Character of the Seaand Surrounding Region
The physical character of the Aral has undergone unprecedented changes since1960. Sadly, these have not been as well studied, documented and analyzed as onewould wish as the well-developed and pursued research and monitoring effort on theAral Sea in the years 1925–1941 and after World-War II faltered in the 1970s and1980s as the sea shrank and shallowed at a rapid pace, hydrometeorological stationsclosed and cruises by research ships became more difficult and infrequent (Bortnikand Chistyayeva 1990). The situation worsened after the Soviet Union collapsedat the end of 1991, and the Aral Sea became part of the two new riparian coun-tries Kazakhstan and Uzbekistan. But since the mid-1990s matters have somewhatimproved as research on the Aral has been renewed and revitalized by funding fromnational, regional, and international organizations and conducted by both nationaland international research teams.
Since the early 1960s, the sea has steadily shrunk and salinized (Table 4.1). Themain causative factor has been expanding irrigation that greatly diminished dischargefrom the two tributary rivers Amu Dar’ya and Syr Dar’ya (Micklin 2014c, 2016).Irrigationhas beenpracticed in theAral SeaBasin for at least threemillennia.Until the1960s this did not substantially diminish inflow to the sea, owing to substantial returnflows from irrigated fields to theAmuDar’ya and SyrDar’ya and other compensatoryfactors such as reduced losses to transpiration from phreatophytes (water-lovingplants) along the lower courses of the rivers and in the deltas as well as loweredevaporation from reduced spring flooding in the deltas of these rivers. However,growth in the irrigated area from around 5 million ha in 1960 to 8.2 million by2010 pushed irrigation development beyond the point of sustainability reducing oreliminating these compensatory effects and leading to a marked reduction of riverdischarge to the Aral.
River inflow to the Aral began declining in the 1960s and accelerated in the 1970sand 1980s.More precipitation in themountains and some reduction in irrigationwith-drawals increased river discharge during the 1990s and reduced the water balancedeficit, slowing the sea’s recession (Cretaux et al. 2019). There was a severe droughtin 2000–2001 and, consequently, river inflow was very low (Micklin 2014c). Higher

124 P. Micklin et al.
inflows on the Amu Dar’ya characterized the period 2002 through 2005 and waterbalance deficits for the Large Aral were significantly lessened. However, dry condi-tions returned from 2006 to the middle of 2009 resulting in rapid drop of lake level,reduction of surface area and volume accompanied by rising salinity (Table 4.1).
The Aral separated into two water bodies in 1987–1989—a “Small” Aral Sea inthe north, also known as the North Aral Sea and a “Large” Aral Sea in the south(Micklin 2014e). The Syr Dar’ya flows into the Small Aral, and the Amu Dar’yainto the Large Aral. A channel formed connecting the two lakes, allowing water toflow from the former to the latter. Local authorities constructed an earthen dike in1992 to block outflow to raise the level of the Small Sea, lower salinity, and improveecological and fishery conditions. This makeshift construction breached and wasrepaired several times. In April 1999 after the level of the Small Aral had risen wellover 43 m, the dike was overtopped, breached and destroyed during a wind storm,with the death of two people.
Under study and design since 1993, the World Bank and the Government ofKazakhstan funded construction of an engineeringly sound 13-km earthen dike witha concrete, gated outflow-control structure to regulate the flow from the Small toLarge seas. Construction was completed from 2003 to 2005 (Aladin 2014; Dam ofthe North Aral Sea and the hydrocomplex Aklak 2017; Micklin 2014e, 2016; WorldBank 2001, 2014). The structure raised and stabilized the level of the Small Aral atnear 42 m above the Baltic Sea in early 2006. The total cost of this project was 23.2million USD, but other related infrastructure projects along the Syr Dar’ya addedanother 62.6 million USD to project costs for a total of 85.8 million. The WorldBank provided a loan of 64.5 million and the Government of Kazakhstan funded theremaining 21.3 million.
The desiccation of the Aral Sea has had severe negative impacts (Micklin 2007,2014d, 2014f, 2016; Micklin and Aladin 2008). The vibrant commercial fishingindustry ended in the early 1980s as the brackish-water indigenous species thatprovided the basis for thefishery disappearedowing to their inability to adjust to risingsalinity. The more salinity-tolerant Black Sea flounder (Platichthys flesus lulscus)was introduced to the Aral in the 1970s. It flourished in the Small Aral and provideda sizable non-commercial catch. But it disappeared from the Large Aral as salinityrose. Tens-of-thousands of people were thrown out of work because of the loss ofthe commercial fishery and associated activities. Employment in these occupationstoday, although rising owing to the partial recovery of the North Aral Sea (discussedbelow), remains only a fraction of what it was.
The level-stabilization project reinvigorated the fishery in the North Aral by low-ering average salinity below the 10 g/l level of the early 1960s (Ermakhanov et al.2012; Plotnikov et al. 2014a, b; Toman et al. 2015; White 2016). This has allowedthe return and flourishing of commercially valuable indigenous species such as theSudak or Pike-perch (Lucioperca lucioperca), Sazan (Cyprinus carpio) and Lyeshchor Bream (Abramis brama orientalis), types of carp, Plotva or Roach (Rutilis rutilisaralensis) as well as several other species. The North Aral catch rose from 695 met-ric tons in 2005 to 6000 metric tons in 2016 (Micklin et al. 2018). Unfortunately,millions of fish are being carried over the discharge gates of the Kok-Aral dam and

4 The Aral Sea: A Story of Devastation and Partial Recovery … 125
ending up in the Central Aral where they perish from higher salinity and temperaturesand lower dissolved oxygen than in the North Aral.
The formerly biologically diverse and rich ecosystems of the deltas of the AmuDar’ya and Syr Dar’ya have suffered considerable harm from reduced river flows,elimination of spring floods, and declining groundwater levels leading to spreadingdesertification (Micklin 2000, pp. 13–23; 2014d; Novikova 1999). Salts have formedpans (solonchak) on the surface where practically nothing will grow. Expanses ofunique Tugay forests along the main and secondary watercourses have drasticallyshrunk. Desiccation of the deltas has significantly diminished the area of lakes,wetlands, and their associated reed communities. These changes caused the numberof species of mammals and birds to drop precipitously. Strong winds blow sand, saltand dust from the dried bottom of the Aral Sea onto surrounding lands causing harmto natural vegetation, crops, and wild and domestic animals (Indoitu et al. 2015;Novikova 1996, 1999). As most of the sea has dried and more of the bottom hasbeen exposed, dust storms with entrained salts in particulate and aerosol (a colloidof fine solid particles or liquid droplets in air) form have become more frequent andintense, covering at times more than 100,000 km2 and extending downwind morethan 500 km.
Owing to the sea’s shrinkage, climate has significantly changed in a band up to100 km wide along the former shoreline in Kazakhstan and Uzbekistan (Micklin2014a). Summers have warmed and winters cooled, spring frosts are later and fallfrosts earlier, humidity is lower, and the growing season shorter. The populationliving around the sea suffers acute health problems (Micklin 2007, 2014d). Some ofthese are direct consequences of the sea’s recession such as respiratory and digestiveafflictions from inhalation of blowing salt and dust and poorer diets from the loss ofAral fish as a major protein source.
The darkest consequence of the Aral’s modern shrinkage is what has happened toVozrozhdeniya Island (Micklin 2007, 2014d). The Soviet military in the early 1950sselected this, at the time, tiny, isolated island in the middle of the Aral Sea, as the pri-mary testing ground for its super-secret bioweapons program. This program stoppedwith the collapse of the USSR in 1991. As the sea shrank, Vozrozhdeniya grew andin 2001 united with the mainland to the south as a peninsula. There was concern thatweaponized organisms survived decontamination measures by the departing Rus-sian military and could escape to the mainland via infected rodents or that terroristsmight gain access to them. The U.S. government worked with the Government ofUzbekistan to ensure the destruction of any survivingweaponized pathogens in 2000.
By September 2009, the Aral had shrunk to a small remnant of its 1960 sizeand separated into four parts (Table 4.1). The dike and dam constructed to regulateflow from the Small to Large Aral had raised and stabilized the level of the formerleading to greatly improved ecological conditions and a revitalized fishery. The LargeSea in the south was not so fortunate. The level of the deeper Western Basin (max.depth 69 m in 1960) had fallen 26 m and salinities reached over 100 g/l, creatingconditions where fishes could not survive. The Eastern Basin became a shallowpond with salinity likely above 150 g/l. It appeared that it would dry up completelyduring the summer of 2010. However, a heavy flow year on the Amu in 2010 partially

126 P. Micklin et al.
revitalized the basin. In summer 2014 theEasternBasin dried completely for probablythe first time in 600 years. Since then, the Eastern Basin has expanded and shrunkon a seasonal rhythm related to the annual hydrologic flow pattern combined withlonger-term cycles of wet and dry years in the Aral Sea Basin. Table 4.1 and Fig. 4.2show the physical characteristics of the Aral in June 2018.
The physical and chemical character of theAral Sea has also changed dramaticallyas the unitary water body shrunk, salinized and separated into multiple lakes withdifferent hydrologic parameters. A dearth of primary field work has made a compre-hensive picture of changes impossible. But according to scientists from the ShirshovInstitute of Oceanology inMoscow who along with an international team studied theAral (mainly the deeperWestern Basin, of the Large Aral) in 12 expeditions between2002 and 2010 (Zavialov et al. 2012, p. 212.):
The shallowing of the sea and accompanying changes of its morphometric characteristics,mainly the catastrophic salinization led to deep transformations of its physical and chemicalregimes, all processes determining its condition and dynamics – from large-scale circulationto turbulent mixing and from the variability of the ionic-salt composition to the energyexchange with the atmosphere.
Among other findings, instrumental measurements found a strong vertical stratifica-tion in temperature, salinity and density that resulted in hydrogen sulfide contam-ination of the deeper portions of the basin owing to lack of exchange with upperlayers.
Other international teamsof investigators concentratedmainlyon theNorthAral inexpeditions in 2005, 2007 and 2011, chiefly focusing onmeasuring salinity, dissolvedoxygen, and temperature at shoreline and shallow water locations (Micklin 2014e).These showed that salinities around this water body were steadily falling and were inthe range favorable for the native brackish-water fish species. High dissolved oxygenlevels were also found – another positive sign for fish and other desirable aquaticspecies.
4.4.2 Changes in the Biological Character of the Sea
By the 1950s, it became clear to fishery experts that given irrigation-expansion plansfor the basin of the Aral Sea, river runoff would be significantly reduced, and thesalinity of theAral Seawould increase. Itwas anticipated the freshwater and brackish-water species that formed the basis of the biota would gradually disappear and thesea would lose its fishery importance. Therefore, it was necessary in advance to forma salt-tolerant biota by acclimating suitable species. First, it was necessary to createa phytoplankton, then zooplankton and then zoobenthos food base, and only thenintroduce fish, but only benthophagous and predators. However, this was not donecarefully, and several unwanted species of invertebrates and fish were introduced(Karpevich 1975).
In 1954–1956 during unsuccessful introduction of the mullets Liza aurata andL. saliens from the Caspian Sea, unwanted non-commercial fishes were introduced:

4 The Aral Sea: A Story of Devastation and Partial Recovery … 127
atherine Atherina boyeri caspia, pipefish Syngnatus abaster caspius and six speciesof gobies:Knipowitschia caucasicus, Neogobius fluviatilis,N.melanostomus, N. syr-man and N. kessleri, and Proterorhinus marmoratus (Ermakhanov et al. 2012). Inaddition, the shrimpPalaemon eleganswas brought to the sea (Karpevich 1975). Thisnaturalized shrimp became a competitor with the aboriginal amphipod Dikerogam-marus aralensis and even ate it. This, but not salinization, caused the disappearanceof the amphipod by 1973 (Aladin and Kotov 1989; Aladin and Potts 1992; Andreeva1989; Mordukhai-Boltovskoi 1972).
The most profound consequences were caused by the planktophage Baltic herringClupea harengus membras introduced in 1954–1956 (Karpevich 1975). Because ofthe introduction of this alien species, as well as atherine and gobies, the abundanceand biomass of zooplankton crustaceans sharply decreased. This led to the massdeath of herring and atherine from starvation in ensuing years (Kortunova 1975;Kortunova and Lukonina 1970; Osmanov 1961).
The first purposely introduced invertebrates in the Aral Sea (1958–1960) werePonto-Caspian misyds—a valuable food for fish and able to tolerate salinity of 17–20 g/l (Karpevich 1960). Of the three species—Paramysis lacustris, P. intermediaand P. baeri—taken from the delta of the Don, only the first two were naturalized.A fourth species, Paramysis ullskyi, migrated independently from reservoirs on theSyr Dar’ya where it was introduced earlier (Kortunova 1970). The next plannedinvertebrate species to be introduced (1960–1961) was the euryhaline polychaeteworm Hediste diversicolor from the Sea of Azov. This worm quickly naturalizedand settled (1973–1974) the whole Aral (Karpevich 1975). The euryhaline bivalveSyndosmya segmentum was introduced from the Azov Sea in 1960–1963. By 1973,it settled all over the sea and became the main component of zoobenthos (Karpevich1975).
The euryhaline marine planktonic copepod Calanipeda aquaedulcis was intro-duced from the Sea of Azov in 1965 and 1970. By 1971 this crustacean becameone of the species dominating the zooplankton (Andreev 1989; Karpevich 1975).By 1974, C. aquaedulcis displaced Arctodiaptomus salinus (Mordukhai-Boltovskoi1972) and the latter species became extinct in the Aral Sea.
In the deltaic areas of the Syr Dar’ya and Amu Dar’ya, commercial freshwaterfishes were acclimatized in 1958–1960: macro-phytophage grass carp Ctenopharyn-godon idella, phyto-planktophague silver carp Hypophtalmichthys molifrix, zoo-planktophage bighead carp Aristichtys nobilis and introduced inadvertently ben-thophage black carp Mylopharyngodon piceus. Except for bighead carp, all weresuccessfully naturalized and became commercially important (Karpevich 1975).
Another cause of changes in the composition of the biota has been anthropogenicchange in the hydrological regime of the Aral Sea, its desiccation and salinization.During the period 1961–1970 the Aral Sea desiccation and increase of its salinityoccurred very slowly. Over these 10 years salinity increased only by 1.5 g/l, and by1971 it reached 11.5 g/l. At this early stage of the Aral Sea’s modern regression,changes in the species composition of its fauna were mostly the result of the intro-duction of new fishes and invertebrate species and to a lesser extent were the resultof increasing salinity.

128 P. Micklin et al.
Throughout the period 1961–1971 the species composition of larval Chironomi-dae fauna in the Aral Sea remained unchanged. A small increase in salinity of theAral Sea caused a very significant reduction in the total number of bivalvesDreissenaafter 1964. It should be noted that this slight salinization was unfavorable only forD. polymorpha aralensis andD. p. obtusecarinata but not forD. caspia pallasi, moreresistant to salinity and not numerous (Andreeva 1989).
In the 1970s the rate of Aral Sea desiccation and salinity rise increased. Sincethat time, the main factor influencing the fauna of the Aral Sea has been continuedincrease in salinity of its waters. In 1971–1976 invertebrate fauna of the Aral Seapassed through the first crisis period caused by salinization over 12–13 g/l (Plotnikovet al. 1991). Increasing salinity became an obstacle for further existence of freshwaterspecies.
During this first crisis period the most species-rich, freshwater component offauna disappeared. Only eight species of rotifers remained. From them only a fewspecies of the genus Synchaeta were common and numerous. With increasing salin-ity Ceriodaphnia reticulata and Alona rectangula disappeared by 1974. By 1975,of Cladocera species in the fauna only representatives of the Ponto-Caspian faunaEvadne anonyx, Podonevadne camptonyx, P. angusta andCercopagis pengoi aralen-sis remained. Instead of freshwaterMesocyclops leuckarti themost numerous speciesbecame euryhaline marine Halicyclops rotundipes aralensis (Andreev 1989).
All mollusks from the genus Hypanis – H. vitrea bergi, H. minima minima andH. m. sidorovi disappeared after 1977. Further increases in salinity affected the seaforms of Dreissena inhabiting the sea differently. It was unfavorable for Dreissenapolymorpha aralensis and D. p. obtusicarinata, but favorable for D. caspia pallasithat tolerates higher salinities. The growth of salinity led to the reduction in the areaand number of the bivalve Cerastoderma rhomboides rhomboides, and converselywas favorable forC. isthmicum. After 1978C. rhomboides rhomboideswas no longerfound and C. isthmicum took its place. Rising of salinity above 12–14 g/l favored themollusk Syndosmya segmentum. The abundance of the halophilic gastropods Caspi-ohydrobia spp. began to grow. Since 1973, when the salinity of the sea reached 12 g/l,Oligochaeta were no longer found. By 1974 most of larval Chironomidae specieshad disappeared and only Chironomus salinarius and Ch. halophilus remained inthe salinized bays (Andreeva 1989). By 1980, the leading forms of zoobenthos wereSyndosmya segmentum, Cerastoderma isthmicum, Hediste diversicolor and Caspio-hydrobia spp. After 1977when the salinity had reached 15 g/l, all mysids were absentfrom the sea but were preserved in the rivers and their deltas (Andreeva 1989).
As a result of this first crisis, freshwater and brackish-water species of freshwaterorigin disappeared from the free-living invertebrate fauna of the Aral Sea. This pro-vided an advantage to Caspian and marine euryhaline species and halophilic species(Andreev 1989). Despite the continuing salinity growth, the first crisis period for thefree-living invertebrate fauna of the Aral Sea transitioned into a period of relativestability between 1977 and 1985.
By 1987 salinity of the Aral Sea rose to 27 g/l. Crossing this boundary meantfree-living invertebrate fauna of the Aral Sea entered the period of the second crisisduring which occurred the next reduction of species diversity (Plotnikov et al. 1991).

4 The Aral Sea: A Story of Devastation and Partial Recovery … 129
Because of this all the Ponto-Caspian cladocerans of the family Podonidae disap-peared by 1990. After the second crisis period, of the native zooplankton species inthe sea, remained only the rotifers Synchaeta spp., Notholca squamula, N. acumi-nata, Keratella quadrata, Brachionus plicatilis, B. quadridentatus and perhaps a fewspecies of copepods (Calanipeda aquaedulcis and Halicyclops rotundipes aralen-sis), as well as several species of Harpacticoida. Among aboriginal species in thebenthic fauna only the mollusks Cerastoderma isthmicum, Caspiohydrobia spp. andostracod Cyprideis torosa survived. Among introduced species only the polychaeteHediste diversicolor, mollusk Syndosmya segmentum, crabRhithropanopeus harrisiitridentata and the shrimp Palaemon elegans remained. After this crisis period, in thefree-living invertebrate fauna of the Aral Sea were marine species and euryhalinespecies of marine origin as well as representatives of euryhaline halophilic fauna ofinland saline waters. This crisis was followed by a new period of relative stability(Plotnikov 2016).
Soon after the separation of the Aral Sea into two parts (North or Small Aral andSouth or Large Aral) in 1987–1989, when the decrease in salinity in the Small Aralbegan, reappeared Podonevadne camptonyx from dormant eggs. In 1999 were larvaeof Chironomidae found in the benthos again (Aladin et al. 2000).
Salinity in the separated Large Aral grew and it was transformed into a hyper-saline water body. In the mid-1990s when salinity exceeded 47–52 g/l cameanother period of crisis. A rapid change in the composition of all the LargeAral biota occurred. By 2004, when salinity became 100–105 g/l, most inver-tebrates disappeared. Only rotifers Hexarthra fennica and Brachionus plicatilis,ostracod Cyprideis torosa, Turbellaria Mecynostomum agile, and some species ofForaminifera, Nematoda and Harpacticoida remained. But by this time in the LargeAral appeared somehalophilous invertebrates such as ciliatesFabrea salina andFron-tonia marina, copepod Apocyclops dengizicus, ostracod Eucypris mareotica, brineshrimp Artemia parthenogenetica, and larval chironomids Beotendipes noctivaga(Aladin and Plotnikov 2008; Mokievsky and Miljutina 2011).
4.4.2.1 Aral Fishery
Freshened deltaic bays and lakes were the best places for fish spawning (Bervald1964). Decline in the Aral Sea water level, salinization and drying of deltas sig-nificantly altered the living conditions for fishes, especially for their reproduction(Ermakhanov et al. 2012). This sharply affected the state of commercial fish pop-ulations. The first signs of the negative impacts of salinization on the ichthyofaunaoccurred in the mid-1960s, as salinity reached 12–14 g/l. Salinity increased fasterin shallow spawning areas than in the open sea, exceeding 14 g/l in 1965–1967. Atthe end of the 1960s, spawning conditions for semi-anadromous fishes significantlyworsened.
Beginning in 1971, when average salinity in the open sea reached 12 g/l, thefirst signs of negative effects of salinity on adult fishes appeared. The rate of growthslowed for many fish species, with their numbers falling sharply. By themiddle of the

130 P. Micklin et al.
1970s, when the average salinity of the sea exceeded 14 g/l, the natural reproductionof Aral fishes was destroyed. As a result, in the second half of the 1970s, recruitmentof newmembers was absent for the populations of many fish species. By 1981, whensalinity exceeded 18 g/l, the Aral Sea had completely lost its fishery. The remainingichthyofauna consisted of nine-spined stickle-back, as well as gobies, atherine andBaltic herring. Aboriginal commercial fishes survived only in the Syr Dar’ya andAmu Dar’ya rivers and deltaic lakes (Ermakhanov et al. 2012).
To restore the Aral Sea fishery, the flounder-gloss Platichthys flesus luscus fromthe Sea of Azov was successfully introduced in 1979–1987 (Lim 1986). This marinefish can reproduce at salinities from 17 to 60 g/l. A fishery was established by theearly 1990s. Acclimatized flounder-gloss remained the only commercial fish speciesin the Aral Sea from 1991 to 2000 (Ermakhanov et al. 2012).
After construction of the Kok-Aral dike, freshening of the Small Aral Sea began,and the zone with lower salinity began increasing. Aboriginal fish, including Aralroach, bream, carp, zander, and asp began to be found again in the SmallAral Sea aftermany years. The fish fauna expanded their spawning and feeding zones to almost theentire area of the Small Aral Sea, except Butakov Bay, where the salinity remainedtoo high (Ermakhanov et al. 2012). By the end of the 1990s, the salinity of the LargeAral reached 60–70 g/l, resulting in the complete disappearance of all fish. It hasbecome a lake without fishes since that time (Ermakhanov et al. 2012).
4.4.2.2 Aral Aquatic Vegetation
Regression and salinization of the Aral Sea caused the destruction of the majorityof vegetational complexes. Freshwater and freshwater-brackish water submergedhigher plants were not able to survive. During the 1970s, the species compositionwas depleted and a few euryhaline species became dominant. Reed-beds in the 1980sdisappeared completely owing to rising salinity. By the end of the 1980s there wasonly Ruppia spp. tolerating salinity of 50 g/l (Plotnikov et al. 2014b).
In the Small Aral in the 1990s, the bulk of macrophytobenthos productionbelonged to the macroalgae Chaetomorpha linum, Cladophora glomerata andCl. fracta. Macrophyte communities were formed of flowering plants Phragmitesaustralis, Ruppia cirrhosa, Ruppia maritima, Zostera noltii, and charophytes Lam-prothamnium papulosum andChara aculeolata. Near the Syr Dar’ya delta reed-bedsbegan to form. At present, the salinity of the Small Aral Sea continues to graduallydecrease, and this water body is being settled widely by species of hydrophytes andhelophytes coming from other continental brackish water bodies (Plotnikov et al.2014b).
In the hypersaline Large Aral microphytobenthos (diatoms and blue-green algae)dominates. Amongmacrophytobenthos onlyCladophora andVaucheriawere found.From higher plants sterile specimens of Ruppia sp. were found (Plotnikov et al.2014b; Zavialov et al. 2012).

4 The Aral Sea: A Story of Devastation and Partial Recovery … 131
4.5 Future of the Aral Sea
The view by some that theAral Sea is destined to dry up completely in the twenty-firstcentury is false (Micklin 2010, 2014f). Even if river inflow from the AmuDar’ya andSyr Dar’ya were reduced to zero, a very improbable scenario, there would still beresidual input of irrigation drainage water, groundwater, and snow melt and rain thatwould maintain at least two substantial lakes: the deeper western (Shevchenko Gulf)and deeper parts of the central Small Aral Sea in the north, and the Western Basin ofthe Large Sea in the south. These lakes would be hypersaline and of little ecologicalor economic value, except, perhaps for the commercial production of brine shrimp(Artemia) eggs.
Return of the sea to its early 1960s state is possible but very unlikely in theforeseeable future. Based on a spreadsheet fill-time model developed by Micklin(2016), it would necessitate restoring average annual river inflow to 56 km3 andtake more than 100 years. Restoration would follow a logistic curve: rapid at first asinflow greatly exceeded net evaporation, then slowing and approaching zero as netevaporation grew and approached inflow. However, the sea would reach an area of60,000 km2 (91% of stability area) and level of 50 m in 45 years. Estimated averageannual inflow to the entire sea from 1992 to 2011 is 8.8 km3−16% of what wouldbe needed for realization of this scenario. The only realistic means for substantiallyincreasing inflow to the Aral is reducing the use of Aral Sea Basin river flow forirrigation as it accounts for 92% of water withdrawals (Micklin 2014b, c). Irrigationefficiency in this region is low and certainly could be raised to free more water forthe Aral. But the cost would be huge and the time to implement long. Hence, to freethe large amount of water needed would also require a substantial reduction in thearea irrigated. Given the dependence of Aral Sea Basin nations’ economies on thisactivity, such a reduction is improbable, if not impossible, any time soon.
It is engineeringly possible to bring water to the Aral Sea from outside CentralAsia (Micklin 2014g). The Soviet government developed plans in the 1960s and1970s to divert up to 60 km3 from the Siberian rivers Irtysh and Ob’ to the AralSea Basin as the best means to solve regional water problems for the long-term. Theinitial phase (27 km3) was near implementation when stopped in 1986 byGorbachev,then head of the USSRGovernment and Communist Party. Attempts have beenmadeto revitalize the project, but they appear futile.
4.5.1 Further Restoration of the North (Small) Aral
On the other hand, various partial rehabilitation scenarios for the Aral Sea holdconsiderable promise (Micklin 2014f, 2016). About 3.24 km3/year, on average, isthe inflow needed from the Syr Dar’ya to maintain the current nominal level of theSmall Aral (42 m above the Kronstadt gauge) with an area of 3200–3300 km2 andallow sufficient outflow through the Berg Strait (Kok-Aral) Dam to regulate salinity.

132 P. Micklin et al.
For 1992–2016 the average annual inflowwas around 5.9 km3 indicating there ismorethan enough water available to maintain the current stabilized hydrologic status ofthe Small Aral Sea.
The Kazakhstan Government, with World Bank support, is planning a secondphase of the Small Aral restoration project (Micklin 2016; World Bank 2014). Oneof the two alternatives is to raise the level of water only in the Gulf of Saryshaganak,which extends northeast off the eastern part of the Small Sea, to 50 m above theKronstadt gauge (Figs. 4.4 and 4.5). For this a new dike and dam, with an outflowstructure and navigation locks for ingress and egress, would be necessary at theGulf’s mouth. Part of the flow of the Syr Dar’ya would be diverted northward via acanal into Saryshaganak to maintain its level. The gulf now converted into a reservoirwith an area of 825 km2, volume of 6.3 km3, and average depth of 7.6 m, would bebrought back very near the town of Aral’sk the former main port at the northern endof the Aral Sea. This would allow fishing vessels via a short canal direct access to thenew and rebuilt fish processing plants in that town. Cost of this project is estimatedat 150 million USD (World Bank 2014).
Fig. 4.4 Saryshaganak Gulf Reservoir Plan. Black line shows position of proposed dike and dam.Blue line is 1960 level (53 meters above Kronstadt gauge), red line is level at 50 meters as proposedin 2nd stage of Saryshaganak Plan, green line is 2019 level (42 m). Base map is digitized versionof 1:500,000 bathymetric map of the Aral Sea produced by the Institute of Water Problems, SovietAcademy of Sciences in 1981. Source Micklin (2016)

4 The Aral Sea: A Story of Devastation and Partial Recovery … 133

134 P. Micklin et al.
�Fig. 4.5 Optimistic Scenario of the Future Aral Sea (after 2030). Legend (figures are averageannual values). Small Aral Sea: level – 8 m, surface area – 4927 km2, volume 54 km3, river inflow– 5.0 km3, net groundwater inflow – 0.1 km3, outflow – 1.0 km3, salinity – 6–7 g/l. Western Basinof Large Aral Sea: level – 3 m, surface area – 6200 km2, volume – 85 km3, river inflow – 6.4 km3,net groundwater influx 2.0 km3, outflow to Eastern Basin – 3.6 km3, salinity steadily decreasingreaching 42 g/l by 2055 and 15 g/l by 2110. Eastern Basin of Large Aral Sea: level ~28.0 m,surface area ~3800 km2, volume ~7.6 km3, inflow from Western Basin Aral 3.6 km3, inflow fromCentral Aral highly variable, salinity >200 g/l. Adzhibay Gulf Reservoir: level – 53 m, surface area– 1147 km2, volume – 6.43 km3, inflow – 8 km3, outflow to Western Basin of Aral Sea – 6.6 km3,salinity – 2 g/l. Level in meters above the Kronstadt gauge on the Baltic Sea near St. Petersburg,Russia. Source Micklin (2016)
The other alternative would rebuild the Kok-Aral dike and dam, raising the levelof the entire lake to 48 m above the Kronstadt gauge (Fig. 4.5). At this level, thearea of the Small Aral would be 4927 km2. Inflow from the Syr Dar’ya to maintainsuch a level, including outflow to manage salinity, is 4.85 km3. This alternativewould likely provide more economic and ecological benefits than the SaryshaganakReservoir plan but would also require more discharge from the Syr Dar’ya. The lakecould be filled to 48 m in 17 years with average annual inflow of 5.0 km3. Afterreaching design level, releases, on average, of about 1 km3/year would maintain arelatively stable level. Salinity, over time, would reach about 6 g/l, which would beideal for the 11 most important commercially caught fish in the North Aral Sea in2016 (Micklin et al. 2018; White 2016).
As the salinity of the North Aral decreases, the species diversity will rise as aresult of natural reintroduction of many species that disappeared due to the earliersalinity growth. Reintroduction of planktonic invertebrates can occur by waterfowltransfer or by wind from fresh or brackish water bodies. It is also possible to takethese organisms for reintroduction from the Syr Dar’ya and from associated lakes inits lower reaches, which act as refugia. Further decrease in the salinity of the NorthAral Sea can cause new changes in the composition of its fauna. Strong fresheningwill be unfavorable for marine species and representatives of the fauna of salinewater bodies of arid zone, favored by the salinization of the Aral Sea, as well as forbrackish-water species.
4.5.2 Fate of the Large Aral
The future for the Large (Southern) Aral Sea is more problematic (Micklin 2014f).The Eastern Basin, depending on inflow from the outflow over the Berg Strait Damand inflow from the Amu Dar’ya, is at times an extensive, very shallow lake or a dryplaya basin contributing to salt/dust storms arising from the dried Aral Sea bottom(also often called simply Aralkumwhich means Aral Desert). The lake when presenthas high salinity and limited ecological value except to mitigate salt/dust stormsby reducing the area of dry bottom subject to wind deflation. The Eastern Basin

4 The Aral Sea: A Story of Devastation and Partial Recovery … 135
also has some potential for raising brine shrimp and harvesting their eggs, but thecommercial promise of this is limited. The deeper Western Basin depends largely onnet groundwater inflow, direct runoff from rain and snowmelt, and some input fromthe Central Aral (via the connecting channel) when that water body is sufficientlyfilled by outflow from the Small Aral. TheWestern Basin also receives inflow via theconnecting channel from the Eastern Basin when that water body is sufficiently filledby inflow from the Amu Dar’ya. On June 20–21, 2018, its level was around 23 mabove the Kronstadt gauge and its area was about 2894 km2 (Table 4.1). The EasternBasin on those dates was a few meters higher and had an area about 2537 km2.
Given a continuation of present trends, the level of theWesternBasinwill continueto decrease for some time, perhaps stabilizing around 21 m above the Kronstadtgauge. At that level its area would be 2560 km2. It would continue toward hyper-salinization. As salinity of the Western Basin grows, a new reduction in the speciesdiversity of its fauna will begin. Ostracod Cyprideis torosa and all rotifers willdisappear. When salinity exceeds 250 g/l, only Artemia, which can tolerate up to350 g/l, would remain, If the salinity exceeds this limit, the remainder of the LargeAral will become like the Dead Sea (Oren et al. 2010; Plotnikov 2016).
But there are more optimistic scenarios for the Western Basin of the Large Aral(Micklin 2016). Figure 4.5 shows a more hopeful future and is based on earlier workby two Soviet experts (Lvovich and Tsigelnaya 1978). It would require an averageannual inflow in the lowest reaches of the AmuDar’ya of around 12.5 km3, a bit morethan double recent estimated average annual flow (5.4 km3/year for 1992–2011),which could be accomplished via feasible improvements in irrigation efficiency inthe Amu Dar’ya River Basin. This alternative would likely cost more than the 85million USD expended on the first stage of the Small Aral restoration. The greatestobstacles to implementation of this plan are political and economic related to thefact that the plan would complicate the ongoing exploration for and exploitation ofoil and gas deposits from parts of the now dried bottom of the southern part of theWestern Basin of the Aral Sea.
Rehabilitation and preservation of the lower Amu Dar’ya delta through creationof artificial ponds and wetlands and rehabilitation of former lakes and wetlandsin the delta and on the dry bed of the Aral Sea has been a priority since the late1980s (Micklin 2016; Novikova 1999). Benefits are enhanced biodiversity, improvedfisheries, greater forage production, treatment of wastewater by aquatic vegetation,and some reduction in salt and dust transfer from the dried sea bottom. Efforts toimprove wetlands and lakes in the lower Syr Dar’ya delta have also been made.
Since the early 1990s efforts have been made to stabilize the dried bottom ofthe Large Aral in Uzbekistan and to lower the deflation potential with planting ofsalt-tolerant shrubs, grasses and trees. The largest scale project in this regard is the“Stabilization of the desiccated Aral Sea bottom in Central Asia” (Dukhovny et al.2007). This program has been managed by the German foreign aid agency (GTZ)and the Forestry Research Institute of Uzbekistan. Between 1995 and 2007 drought-resistant tree and shrub species, primarily Black Saksaul were planted on 300 km2.Since 2005 the project has also included an integrated remote sensing/GIS and sea

136 P. Micklin et al.
bed-based monitoring component to assess surficial dynamics, desertification risks,and other negative impacts of the continuing drying.
4.6 Conclusions
The Aral Sea is geologically a relatively young large lake, no more than 20 thousandyears old. As a terminal water body, strongly impacted by human actions, its historyhas been turbulent. Levels have risen and fallen significantly accompanied by majortransgressions and recessions of the shoreline, changes in salinity and accompanyingalterations in biotic communities. Early fluctuations owed to natural forces of climatechange and diversions of theAmuDar’ya away from the sea. But for severalmillenniaman has had a growing influence through irrigation related reductions of inflow andinadvertent and purposeful diversions of the Amu westward toward the Caspian Seaand away from the Aral.
The most dramatic human-caused impacts occurred in the twentieth century, par-ticularly after 1960, and have continued into the twenty-first century. Invertebratesand fishes (and their parasites) were introduced both consciously and inadvertentlybeginning early in the 1920s. Some of these substantially and negatively affectednative species. But by far the most damaging action was the major expansion ofirrigation beyond the point of hydrologic sustainability that began in the 1950s andthat led to the modern desiccation of the Aral after 1960. This ongoing process, by2018, has likely led to the greatest level drop, most dramatic shoreline retreat andhighest salinities experienced by the Aral in the past several millennia. These physi-cal changes have devasted and simplified the biologic communities of most of whatwas formerly the Large Aral and destroyed their ecologic and economic value.
But is all lost? The answer is clearly “no”. The partial restoration project forthe North Aral has, so far, been a resounding success with major positive ecologicand economic impacts. A further stage of restoration for this water body is contem-plated that could bring even greater benefits. The picture for the South Aral is muchgloomier. Major restoration would require additional flow from the Amu Dar’yathat is not in the cards in the short or medium term but might be possible in thelong perspective. Somewhat raising, stabilizing, and bringing back into ecologic andeconomic use the deeper Western Basin is possible by realizable improvements inirrigation efficiency to increase the Amu’s inflow, but economic justification andpolitical will for this seems absent.
Acknowledgements The work of SK was supported by a State assignment of the IGM SB RAS,and those of NVA and ISP by the theme of the State assignment for 2019-2021 “AAAA-A19-119020690091-0. Studies of biological diversity and themechanisms of the impact of anthropogenicand natural factors on the structural and functional organization of ecosystems of continental waterbodies. Systematization of the biodiversity of salt lakes and brackish-water inland seas in the zoneof critical salinity, study of the role of brackish water species in ecosystems”.

4 The Aral Sea: A Story of Devastation and Partial Recovery … 137
References
Aladin N (2014) The dam of life or dam lifelong. The Aral Sea and the construction of the dam inBerg Strait. Part one (1988–1992). El Alfoli Boletin Semestral de IPAISAL IPAISAL’s BiyearlyJ 15:3–17
Aladin NV, Kotov SV (1989) The Aral Sea ecosystem original state and its changes underanthropogenic influences. Proc Zool Inst USSR Acad Sci 199:4–25 (in Russian)
Aladin N, Plotnikov I (2008) Modern fauna of residual water bodies formed on the place of theformer Aral Sea. Proc Zool Inst Russ Acad Sci 312(1/2):145–154 (in Russian)
Aladin NV, Potts WTW (1992) Changes in the Aral Sea ecosystem during the period 1960–1990.Hydrobiologia 237:67–79
Aladin NV, Plotnikov IS, Orlova MI, Filippov AA, Smurov AO, Piriulin DD, Rusakova OM,Zhakova LV (1996) Changes in the form and biota of the Aral Sea over time. In: Micklin P,Williams W (eds) The Aral Sea Basin (Proceedings of an Advanced Research Workshop, May2–5, 1994, Tashkent, Uzbekistan), NATO ASI series, vol 12. Springer, Heidelberg, pp 33–55
Aladin NV, Filippov AA, Plotnikov IS, Egorov AN (2000) Modern ecological state of the SmallAral Sea In: Ecological research and monitoring of the Aral Sea deltas: a basis for restoration,Book 2. UNESCO Aral Sea Project 1997–1999: Final Scientific Report, pp 73–81
Andreev NI (1989) Zooplankton of the Aral Sea in the initial period of its salinization. Proc ZoolInst USSR Acad Sci 199:26–52 (in Russian)
Andreeva SI (1989) Zoobenthos of the Aral Sea in the initial period of its salinization. Proc ZoolInst Acad Sci USSR 199:53–82 (in Russian)
Ashirbekov U, Zonn I (2003) History of a disappearing sea. Dushanbe, Tadjikistan: ExecutiveCommittee of the International Fund for Saving the Aral Sea (in Russian). Available at http://www.cawater-info.net/library/icc.htm
Atlas of the USSR (1983) Moscow, Soviet Union: GUGK (in Russian)Austin P, Mackay A, Palagushkina O, Leng M (2007) A high-resolution diatom-inferred palaeo-conductivity and lake level record of the Aral Sea for the last 1600 yr. Quat Res 67:383–393
Bartold VV (1902) Records on the Aral Sea and the lower stream of the Amudarya since the earliesttimes to the XVIIth Century. Turkestan Branch of the Russian Geographic Society, Tashkent (inRussian)
Berg LS (1908) The Aral Sea. Attempt at a physical–geographical monograph. StasyulevichPublisher, St. Petersburg (in Russian)
Bervald EA (1964) Ways of organizing a rational fish economy on inland water bodies. RostovState University, Rostov-on-Don, p 148 (in Russian)
Boomer I (2012) Ostracoda as indicators of climatic and human-influenced changes in the LateQuaternary of the Ponto-Caspian region (Aral, Caspian and Black Seas). In: Horne DJ, HolmesJ, Rodriguez-Lazaro J, Viehberg FA (eds) Ostracoda as proxies for Quaternary climate change.Elsevier Science, Amsterdam, pp 205–215
Boomer I, Wünnemann B, Mackay A, Sustin P, Sorrel P, Reinhardt C, Keyser D, Guichard F,Fontugne M (2009) Advances in understanding the late Holocene history of the Aral Sea region.Quat Int 194:79–90
Boroffka N, Oberhänsli H, Achatov G, Aladin N, Baipakov K, Erzhanova A, Hörnig A, KrivonogovS, Lobas D, Savel’eva T, Wünnemann B (2005) Human settlements on the northern shores ofLake Aral and water level changes. Mitig Adapt Strat Glob Change 10:71–85
Boroffka N, Oberhänsli H, Sorrel P, Demory F, Reinhardt C, Wünnemann B, Alimov K, Baratov S,Rakhimov K, Saparov N, Shirinov T, Krivonogov S (2006) Archaeology and climate: settlementand lake-level changes at the Aral Sea. Geoarchaeol Int J 21:721–734
Bortnik V, Chistyaevaya S (eds) (1990) Hydrometeorology and Hydrochemistry of the Seas of theUSSR, vol 7. Gidrometeoizdat, Aral Sea, Leningrad (in Russian)
Burr GS, Kuzmin YV, Krivonogov SK, Gusskov SA, Cruz RJ (2019) A history of the modern AralSea (Central Asia) since the Late Pleistocene. Quat Sci Rev 206:141–149

138 P. Micklin et al.
Catalogue of monuments of the Kazakhstan Republic history and culture (2007). Aruna, Almaty(in Russian)
Chalov PI (1968) Non-equilibrium uranium dating. Ilim, Frunze (in Russian)Cretaux J-F, Kostianoy A, Bergé-Nyuyen M, Kouraev A (2019) Present-day water balance of theAral Sea seen from satellite. In: Barale V, Gade M (eds) Remote Sensing of the Asian Seas.Springer, Berlin, pp 523–539
Damof theNorthAral Sea and hydrocomplexAklak (2017)Brochure distributed at the InternationalForum on Sustainable development of the Aral Region, Kyzyl-Orda, Kazakhstan, May 30–31,2017 (in Russian)
Dukhovny V, Navratil P, Rusiev I, Stulina G, Rushenko Y (eds) (2007) Comprehensive remote andground studies of the dried Aral Sea bed. SIC ICWC, Tashkent
Ermakhanov Z, Plotnikov I, Aladin N, Micklin P (2012) Changes in the Aral Sea ichthyofauna andfishery during the period of ecological crisis. Lakes Reservoirs Res Manag 17:3–9
Goode’s World Atlas (1982) Edited by E. Espenshade Jr. Rand McNally and Company, ChicagoHuang X, Oberhänsli H, von Suchodoletz H, Sorrel P (2011) Dust deposition in the Aral Sea:implications for changes in atmospheric circulation in Central Asia during the past 2000 years.Quat Sci Rev 30:3661–3674
Indoitu R, Kozhoridze K, Batyrbaeva M, Vitkovskaya I, Orlovsky N, Blumberg D, Orlovsky L(2015) Dust emission and environmental changes on the dried bottom of the Aral Sea. Aeol Res17:101–115
Karpevich AF (1960) Biological bases of aquatic organisms’ acclimatization in the Aral Sea. TrudyVNIRO 43(1):76–115 (in Russian)
Karpevich AF (1975) Theory and practice of aquatic organisms acclimatization. PischevayaPromyshlennost, Moscow (in Russian)
Kes AS (1969) The main stages in the development of the Aral Sea. In: Geller SY (ed) Problem ofthe Aral Sea. Nauka, Moscow, pp 160–172 (in Russian)
Kes AS (1978) Reasons for the level changes of the Aral during the Holocene. Izv Akad NaukSSSR Ser Geog 4:8–16 (in Russian)
Kes AS (1995) Chronicle of the Aral Sea and the Sub-Aral region. GeoJournal 35:7–10Kortunova TA (1970) Some data on food organisms introduced to the Aral Sea. Proc. VNIRO76(3):178–184 (in Russian)
Kortunova TA (1975) On the changes in the Aral Sea zooplankton in 1959–1968. Zool Zhurnal54(5):567–669 (in Russian)
Kortunova TA, Lukonina NK (1970) Quantitative characteristic of the Aral Sea zooplankton. In:Rybnye resursy vodoemov Kazakhstana i ikh ispolzovanie, vol 6. Nauka, Alma-Ata, pp 52–60(in Russian)
Kosarev AN (1975) Hydrology of the Caspian and Aral seas. Moscow University, Moscow (inRussian)
Kostianoy AG, Kosarev AN (eds) (2010) The Aral Sea Environment. The Handbook of Environ-mental Chemistry. Springer, Berlin
Krivonogov S (2009) Extent of the Aral Sea drop in the Middle Age. Dokl Earth Sci 428(1):1146–1150
Krivonogov S (2014): Changes of the Aral Sea level. In: Micklin P, Aladin N, Plotnikov I (eds) TheAral Sea: the Devastation and Partial Rehabilitation of a Great Lake. Springer, Heidelberg, pp77–111
Krivonogov S, Burr G, Gusskov S, Khazin L, Kuzmin Y, Kurmanbaev R, Kenshinbay T, Nurgizari-nov A, Zhakov E (2010) Environmental changes of the Aral Sea (Central Asia) in the Holocene— major trends. Radiocarbon 52:555–568
Krivonogov S, Burr G, Gusskov S, Kenshinbay T, Kurmanbaev R, KuzminY, Voyakin D (2014) Thefluctuating Aral Sea: a multidisciplinary-based history of the last two thousand years. GondwanaRes 25:284–300
Lim RM (1986) About acclimatization of flounder-gloss in the Aral Sea. In: Biologicheskie osnovyrybnogo khozyaistva vodoemov Sredney Azii i Kazakhstana. Ashhabad, pp 249–250 (in Russian)

4 The Aral Sea: A Story of Devastation and Partial Recovery … 139
Lopatin GV (1957) Structure of the Amu Darya delta and its formation history. Proc Lake Res LabUSSR Acad Sci 4:5–34 (in Russian)
Lunezheva MS, Kiyatkin AK, Polischuk V (1987) Central Asia and Kazakhstan – ancient regionsof irrigation. Reclam Water Manag 10:65–70 (in Russian)
Lunezheva MS, Kiyatkin AK, Polischuk V (1988) Central Asia and Kazakhstan - ancient regionsof irrigation. Reclam Water Manag 8:60–63 (in Russian)
Lvovich M, Tsigelnaya I (1978) Management of the Aral Sea water balance. Izv Akad Nauk SSSRSer Geog 1:42–54 (in Russian)
Lymarev VI (1967) Shores of the Aral Sea an inland basin of the arid zone. Nauka (in Russian),Leningrad
Mayev EG, Mayeva SA, Nikolaev SD, Parunin OB (1983) New data on the Holocene history of theAral Sea. In: Mayev EG (ed) Paleogeography of the Caspian and Aral Seas in the Cenozoic. vol2. Moscow, MGU, pp 119–133 (in Russian)
Mayev E, Mayeva S, Karpychev Y (1991) The Aral Sea in the Holocene. In: Aral crisis. Acad SciUSSR, Moscow, pp 76–86 (in Russian)
Mayeva SA, Mayev YG (1991) Changes of the level of the Aral Sea for the recent millennia.Geodesia i Aerofotosemka 1:124–132 (in Russian)
Micklin P (2000) Managing water in Central Asia. The Royal Institute of International Affairs,London
Micklin P (2007) The Aral Sea disaster. Annual Review of Earth and Planetary Sciences. Ann Rev35:47–72
Micklin P (2010) The past, present, and future Aral Sea. Lakes Reservoirs Res Manag 15:193–213Micklin P (2014a) Introduction to the Aral Sea and its Region. In: Micklin P, Aladin N, PlotnikovI (eds) The Aral Sea: the Devastation and Partial Rehabilitation of a Great Lake. Springer EarthSystem Sciences. Springer, Heidelberg, pp 15–40
Micklin P (2014b) Irrigation. In:Micklin P,AladinN, Plotnikov I (eds) TheAral Sea: theDevastationand Partial Rehabilitation of a Great Lake. Springer Earth System Sciences. Springer, Heidelberg,pp 207–232
Micklin P (2014c) Aral Sea Basin water resources and the changing Aral water balance. In: MicklinP, Aladin N, Plotnikov I (eds) The Aral Sea: the Devastation and Partial Rehabilitation of a GreatLake. Springer Earth System Sciences. Springer, Heidelberg, pp 111–137
Micklin P (2014d) Introduction. In: Micklin P, Aladin N, Plotnikov I (eds) The Aral Sea: theDevastation and Partial Rehabilitation of a Great Lake. Springer Earth System Sciences. Springer,Heidelberg, pp 1–11
Micklin P (2014e) Efforts to revive the Aral Sea. In: Micklin P, Aladin N, Plotnikov I (eds) The AralSea: the Devastation and Partial Rehabilitation of a Great Lake. Springer Earth System Sciences.Springer, Heidelberg, pp 361–380
Micklin P (2014g) The Siberian water transfer schemes. In: Micklin P, Aladin N, Plotnikov I (eds)The Aral Sea: the Devastation and Partial Rehabilitation of a Great Lake. Springer Earth SystemSciences. Springer, Heidelberg, pp 381–404
Micklin P (2016) The future Aral Sea: hope and despair. Environ Earth Sci 75 (9):1–15Micklin P, Aladin N (2008) Reclaiming the Aral Sea. Sci AM 98(4):64–71Micklin P, Aladin N, Plotnikov I (2014) An Expedition to the Northern Part of the Small Aral Sea.In:Micklin P, Aladin N, Plotnikov I (eds) TheAral Sea: the Devastation and Partial Rehabilitationof a Great Lake. Springer Earth System Sciences. Springer, Heidelberg, pp 337–351
Micklin P, White K, Alimbetova Z, Ermakhanov Z (2018) Partial Recovery of the North Aral Sea:a Water Management Success Story in Central Asia. Presentation at the IGU Thematic Meeting,Moscow, Russia, June 4–7, 2018 (www.researchgate.net/profile/Philip_Micklin2/publications)
MokievskyVO,MiljutinaMA (2011)Nematodes inmeiofauna of the LargeAral Sea during the des-iccation phase: taxonomic composition and redescription of common species. Russ J Nematology19(1):31–43 (in Russian)
Mordukhai-Boltovskoi FD (1972) Modern state of the Aral Sea fauna. Gidrobiol Zhurnal 3:14–20(in Russian)

140 P. Micklin et al.
Mordukhai-Boltovskoi FD (ed) (1974) Atlas of the Aral Sea invertebrates. Fishing Industry,Moscow, p 272 (in Russian)
Nikolsky GV (1940) Fishes of the Aral Sea. MOIP, Moscow, p 216 (in Russian)Nikolaev SD (1991) The development of the Aral Sea from oxygen isotope data. In: SevastyanovDV, Mamedov ED, Rumyantsev VA (eds) History of the Lakes Sevan, Issyk Kul, Balkhash,Zaysan and Aral. Nauka, Leningrad, pp 246–249 (in Russian)
Nikolaev SD (1995) Isotope paleogeography of intracontinental seas. VNIRO Publishers, Moscow(in Russian)
Novikova N (1996) The Tugai of the Aral Sea is dying: can it be restored? Russ Conserv News6:22–23
Novikova N (1999) Priaralye ecosystems and creeping environmental changes in the Aral Sea. In:Glantz M (ed) Creeping environmental problems and sustainable development in the Aral SeaBasin. Cambridge University Press, Cambridge, pp 100–127
Oberhänsli H, Boroffka N, Sorrel P, Krivonogov S (2007) Climate variability during the past2,000 years and past economic and irrigation activities in the Aral Sea Basin. Irrig Drain Syst21:167–183
Oberhänsli H, Novotna K, Piskova A, Chabrillat S, Nourgaliev DK, Kurbaniyazov AK, Grygar TM(2011) Variability in precipitation, temperature and river runoff inWCentral Asia during the past~2000 years. Glob Planet Change 76:95–104
Oren A, Plotnikov IS, Sokolov SB, Aladin NV (2010) The Aral Sea and the Dead Sea: disparatelakes with similar histories. Lakes Reservoirs Res Manag 15:223–236
Oreshkin DB (1990) Aral catastrophe. EarthScience, 2. Znanie, Moscow (in Russian)Osmanov SO (1961) On the death of atherine in the Aral Sea. Annals of the Karakalpak Branch.Uzbekistan Rep Acad Sci 3(5):95–96 (in Russian)
Osmanov SO, Arystanov EA, Ubaidullayev K, Yusupov OY, Teremuratov TA (1976) Problems ofAral Sea parasitology. Fan, Tashkent (in Russian)
Plotnikov IS (2016) Long-term changes of the free-living aquatic invertebrate fauna of the AralSea. Zoological Institute, Russ Acad Sci, St. Petersburg, Russia (in Russian)
Plotnikov IS, Aladin NV, Filippov AA (1991) The past and present of the Aral Sea fauna. Zool J70(4):5–15 (in Russian)
Plotnikov I, Aladin N, Ermakhanov Z, Zhakova L (2014a) Biological Dynamics of the Aral SeaBefore its Modern Decline (1900–1960). In: Micklin P, Aladin N, Plotnikov I (eds) The AralSea: the devastation and partial rehabilitation of a Great Lake. Springer Earth System Sciences.Springer, Heidelberg, pp 131–171
Plotnikov I, Aladin V, Ermakhanov Z, Zhakova L (2014b) The new aquatic biology of the Aral Sea.In:Micklin P, Aladin N, Plotnikov I (eds) TheAral Sea: the Devastation and Partial Rehabilitationof a Great Lake. Springer Earth System Sciences. Springer, Heidelberg, pp 131–171
Pshenin GN, Steklenkov AP, Cherkinskii AE (1984) Origin and age of pre-Holocene terraces ofthe Aral Sea. Reports Acad Sci USSR 276:675–677 (in Russian)
Reinhardt C, Wünnemann B, Krivonogov SK (2008) Geomorphological evidence for the LateHolocene evolution and the Holocene lake level maximum of the Aral Sea. Geomorphology93(3–4):302–315
Rubanov IV, Ischniyazov DP, Baskakova MA (1987) The geology of the Aral Sea. Fan, Tashkent(in Russian)
Smagulov E (2001) The discovery and study of the mazar on the Aral Sea bottom. Otan Tarikhy4:77–81 (in Russian)
Smagulov E (2002) A mausoleum on the sea bottom. Qumbez 4:50–52 (in Russian)Sorrel P, Popescu S-M, Head MJ, Suc JP, Klotz S, Oberhänsli H (2006) Hydrographic developmentof the Aral Sea during the last 2000 years based on a quantitative analysis of dinoflagellate cysts.Palaeogeogr Palaeoclimatol Palaeoecol 234:304–327
Sorrel P, Oberhänsli H, Boroffka N, Nourgaliev D, Dulski P, Röhl U (2007a) Control of windstrength and frequency in the Aral Sea basin during the late Holocene. Quat Res 67(3):371–382

4 The Aral Sea: A Story of Devastation and Partial Recovery … 141
Sorrel P, Popescu S-M, Klotz S, Suc J-P, Oberhänsli H (2007b) Climatic variability in the Aral Seabasin (Central Asia) during the late Holocene based on vegetation changes. Quat Res 67:357–370
Toman M, Plotnikov I, Aladin N, Micklin P, Ermakhanov Z (2015) Biodiversity, the presentecological state of the Aral Sea and its impact on future development. Ac Biol Slovinica 58:45–59
Vainberg BI (1999) Ethnogeography of Turan in the past. VII c. BC–VIII c. CE. “Eastern Literature”Russ Acad Sci Publ House, Moscow (in Russian)
White K (2016) Kazakhstan’s Northern Aral Sea today: partial ecosystem restoration and economicrecovery. In: Friedman E, Neuzil M (eds) Environmental Crises in Central Asia (from steppes toseas, from deserts to glaciers), New York, Routledge, pp 127–138
World Bank (1998, May) Aral Sea Basin Program (Kazakhstan, Kyrgyz Republic, Tajikistan, Turk-menistan, and Uzbekistan). Water and Environmental Management Project. Washington, DC,World Bank
World Bank (2001) Project Appraisal Document on a Proposed Loan in the Amount of U.S. $64.5Million to the Republic of Kazakhstan for the Syr Dar’ya Control and Northern Aral Sea Phase-1Project, Report No. 22190-KZ, 98 pages including annexes and maps (PDF format)
World Bank (2014) Project Information Document (PID), Concept Stage, Syr Dar’ya Control andNorthern Aral Sea Project, Phase 2 (P15200), Report No.: PIDC12697, September 24, 2014, pp1-9
Zavialov P, Arashkevich E, Bastida I, Ginsburg A, Dikarev S, Zhitina A, Izhitskiy A et al (2012)The Large Aral Sea at the beginning of the XXI Century: physics, biology, chemistry. ShirshovOceanology Institute, Nauka, Moscow (in Russian)
Zenkevich LA (1963) Biology of the Seas of the USSR. Acad Sci USSR, Moscow (in Russian)Zonn IS, GlantzM,KostianoyAG,KosarevAN (2009) TheAral Sea Encyclopedia. Springer, Berlin

Chapter 5Geological History and PresentConditions of Lake Balkhash
Renato Sala, Jean-Marc Deom, Nikolai V. Aladin, Igor S. Plotnikovand Sabyr Nurtazin
Abstract Lake Balkhash is a large endorheic water body, the third largest by size inEurasia and the second largest salt lake of the world. With its half-moon elongatedmorphology and 78% of inflows provided by the Ili River from the West, the lakehas a freshwater basin in the West and saline water basin in the East, separated bythe 4-km narrow and 6-m deep Uzunaral Strait. The average bathymetry is shallow,with a maximum water depth of 11 m in the West and 26 m in the East. Accordingto investigations of the geological history of the lake in Soviet times and in inter-national projects during the last 15 years, a large lake was formed by the Ili Riverin the Balkhash region encompassing the present area of the Kapchagai Reservoirduring the Middle Pleistocene. The large lake basin was subsequently transformedby a series of tectonic deformations. Around 300 kiloyears before present (ka BP)the Ili River was diverted to the North where it formed a large megalake, the AncientBalkhash, in the Balkhash-Alakol Depression. Around 110 ka BP, the lake becamedivided into two basins forming the Alakol Lake in the East and the modern LakeBalkhash in the West. Hydrological conditions mostly controlled by precipitation,evaporation and meltwater discharge caused three different lake-level stages in theLate Pleistocene and Holocene: lake levels between 349 and 355 m above sea level(asl) prevailed during glacial periods, between 341 and 348 m asl during the pluvialearly and middle Holocene, and between 335 and 348 m asl during the arid late
R. Sala (B) · J.-M. DeomLaboratory of GeoArchaeology, Faculty of History Archaeology Ethnology, Al-Farabi KazakhNational University KazNU, 71 Ave. Al-Farabi, 050040 Almaty, Kazakhstane-mail: [email protected]
N. V. Aladin · I. S. PlotnikovLaboratory of Brackish Water Hydrobiology, Zoological Institute, Russian Academy of Sciences,Universitetskaya nab. 1, 199034 St. Petersburg, Russiae-mail: [email protected]
I. S. Plotnikove-mail: [email protected]
S. NurtazinDepartment of Biodiversity and Bioresources, Faculty of Biology, Al-Farabi Kazakh NationalUniversity, 71 Ave. Al-Farabi, 050040 Almaty, Kazakhstane-mail: [email protected]
© Springer Nature Switzerland AG 2020S. Mischke (ed.), Large Asian Lakes in a Changing World, Springer Water,https://doi.org/10.1007/978-3-030-42254-7_5
143

144 R. Sala et al.
Holocene when extreme regressions at ca. 5.0, 1.2 and 0.8 ka BP divided the lakeinto more than one basin. The present lake water balance results from amajor regres-sion due to a recent phase of aridization and the filling of the Kapchagai Reservoirin the 1970s and 1980s and the compensation of lower precipitation by increasedmeltwater discharge from glaciers. However, meltwater runoff will diminish withrapidly shrinking glaciers in the next 50 years. This alarming perspective requirescareful water-basin management which was not yet implemented. Lake Balkhash isexposed to the threat of exaggerated anthropogenic water subtraction due to an accel-erated infrastructural and demographic boost that doubled the irrigated farmlands inthe Chinese part of the catchment in less than 20 years. Due to the lake’s hydrology,catchment rock and hydrochemical conditions, the water of the Eastern Balkhash hashigh concentrations of potassium and magnesium, unfavorable for hydrobionts. Anyfurther increase in salinity will soon cause a considerable diminution of the lake’sbiomass. The ichthyofauna of the lake has been intensively manipulated during thetwentieth century, with the introduction of new species and the decline of the originalones. The substitution of the native fish fauna by introduced species caused a decreaseof valuable commercial fish in the lake and a decrease of the total fish catch. Thus,Lake Balkhash faces serious environmental risks today and its near future dependson the collective will and decisions of the responsible agencies.
Keywords Balkhash-Alakol depression · Ili River · Kapchagai Reservoir · Waterbalance · Salinity
5.1 Geographical and Hydrological Features of ModernBalkhash
The Balkhash is a permanent, endorheic (terminal, closed, athalassic), large, shal-low, and slightly saline lake, 588–614 km long and 9–74 km wide, covering anarea of 18,210 km2 between 44°57′–49°19′ N and 73°24′–79°14′ E. The lake repre-sents an oasis in the Saryesik-Atyrau Desert and lowest part of the Balkhash-AlakolDepression. Lake Balkhash drains waters from a 413,000 km2 large region of which153,000 km2 actively contribute water to the lake. Salinity of the terminal lake is ina range from 0.2 to 5.0 g/L (Fig. 5.1).
The climate of the Balkhash region is arid continental (BWk) with a mean annualtemperature of 5.8 °C (mean January temperature −15.2 °C, mean July temperature24.3 °C), continentality index of 39.5, diurnality index of 11.1, mean annual precipi-tation of 142 mm (maximum in May 17 mm, minimum in September 4 mm), annualevapotranspiration of 668 mm, aridity index of 4.7, and an arid season from 15 Aprilto 30October (Algazimeteorological station, data series 1936–1960). LakeBalkhashreceives the highest river inflow between May and August, peaking in July, and itswater surface is frozen from November-December to March-April. Predominatingwinds are from the East and Northeast, inducing waves up to 3.0–3.5 m in the Eastand no more than 2.5 m in the West, and currents along the lake’s longitudinal axis.

5 Geological History and Present Conditions of Lake Balkhash 145
Fig. 5.1 Hydrological basin of the modern Lake Balkhash (outlined in white)
The mean hydrological characteristics of Lake Balkhash in the years 1939–1969and similarly during 2000-2020 are: water volume of 106 km3, water surface of18,210 km2, water level at 342 m asl (with seasonal variation between 340.8 and343.1 m asl) and average depth of 5.7 m (Fig. 5.2a).
The equation of the average lake-water balance includes a total yearly waterinput of 18 km3 which represents river inflow (15.1 km3, 83.9%), local precipi-tation (2.1 km3, 11.7%), and shore-spring runoff (0.8 km3, 4.4%), balanced by acorresponding water output as evaporation (−17.2 km3, 95.6%) and groundwaterinfiltration (−0.8 km3, 4.4%; Fig. 5.2b, c). The annual river inflow volume wouldbe 3.0 km3 higher without water withdrawal from tributaries of Lake Balkhash forirrigation farming (Shnitnikov 1973; Kezer and Matsuyama 2006; Dostay 2009).
The lake is characterized by high and accelerated variability under changing cli-mate conditions.1 The sedimentary deposits carried by rivers into the lake do notaccount for more than 0.005 km3 per year. Ice-melt water is variable, depending fromglaciological parameters. Annual meltwater discharge accounted for ca. 0.8 km3, i.e.,ca. 4.4% of the annual inflow, in the last decades. Of the 15.1 km3 of river inflow,11.8 km3 come from the Ili River (78%) and 3.2 km3 (21%) from the rivers Karatal,Aksu-Lepsy and Ayaguz (Figs. 5.1 and 5.2c).
The quantity of natural and anthropogenicwater subtraction above the lake’s basinis more or less equivalent to the amount of actual river inflow: 15.1 km3 per yearconsisting of 7.0 km3 of water subtraction by riparian vegetation and of 7.9 km3 forhuman use (values of 2014). Without riparian and anthropogenic water subtraction,
1During the pluvial years 1958–1961 the total annual river inflow in the lake rose to 23.88 km3,which with evaporation levels of 17.63 km3, supported a sensible increase of water level to 343 masl (Shnitnikov 1973, 134).

146 R. Sala et al.
Fig. 5.2 Hydrological parameters of Lake Balkhash. aRelationship of water level (m asl) andwatervolume (km3) at left and area (km2) at right. Triangular marks indicate three water-level stages:average at 342 m in 1939–1969 and today (orange), high at 343.5 m in 1908 (magenta), criticallylow at 337 m at the end of the 18th century (green). bWater balance volumes (km3) for 1939–1969:1 river inflow, 2 precipitation, 3 groundwater and shore springs, 4 evaporation, 5 infiltration. c IliRiver mean monthly discharge (m3/s): low in 1918 (blue), average in 1958 (red), high in 1921(green). Adapted from Atlas (1982)
the virtual water volume of Lake Balkhash would be 123 km3, the surface area of thelake 22,000 km2, and its water level at 343.5 m asl. This high lake level was reachedfor the last time during the transgressive phase in 1908 (Fig. 5.2a).
In order to discuss the hydrological balance of Lake Balkhash, it must be under-lined that its average water volume of 106 km3 in the year 2000 corresponds to lessthan seven years of water input (or evaporation, i.e., ca. 17.2 km3 per year) and toan almost similar amount of water stored as ice in the mountain glaciers of the basin(ca. 90 km3 per year). Therefore, the hydrological balance of the lake is very sensi-tive to temperature-driven changes of ice volumes in the uppermost reaches of thetributaries. Effects of climate change on lake-water volumes, levels, salinity, etc.,might be delayed. At the start of an arid and warm phase as it occurs at present, theincrease of ice melting will postpone the decrease of the lake level by a few tens ofyears until glaciers reached a new equilibrium or disappeared. In contrast, at the startof a cold pluvial phase, the additional accumulation of ice would postpone the riseof Lake Balkhash’s level for more than one century until glaciers grew and reacheda new equilibrium.2
2The high salinity levels of Lake Balkhash reconstructed for the period from 2.4 to 2.2 ka BP in spiteof the cold and moist climate phase between 2.5 and 2.0 ka are attributed by Feng et al. (2013) to

5 Geological History and Present Conditions of Lake Balkhash 147
The hydrological regime of Lake Balkhash is strongly determined by its shape:latitudinally outstretched as a narrow crescent of 600 km length, with a shallowbottom progressively sloping West to East from 333 to 316 m asl, and with itswestern and eastern parts separated by the 4-km wide and 6-m deep Uzunaral Strait(Fig. 5.3).
The Western Balkhash Basin is larger (10,600 km2, 58% of the total lake area)and wider (74 km) but shallower (average depth of 4.8 m, maximum depth of 11 m at331 m asl) and less voluminous (47.8 km3). The Eastern Balkhash Basin is smaller(7500 km2) and narrower (9–19 km) but significantly deeper (average depth 9.0 m,maximum depth 26 m at 316 m asl) and holding 56.6 km3, i.e., 54% of the total watervolume.
The Western Balkhash is mostly fed by the Ili River (78%), which carries sed-iments responsible for its turbidity and yellow-gray colour (visibility 5–10 m) andfor its even silty-sandy lake bottom. The Ili River inflow causes the low mineral-ization rates (0.8–1.8 g/L) of the western basin. The Eastern Balkhash receives asignificantly lower input from smaller rivers that all together constitute only 21.1%of the total river inflow. It experiences a yearly water deficit of 1.15–2.80 km3 thatrequires an equivalent amount of water inflow from the western basin and makes itswater five times saltier (3.5–4.2 g/L) with emerald-blue waters of higher turbidity(visibility 0.4–1.0 m) and an undulatory lake bottom covered by light-grey limy siltsincluding authigenic dolomite.
Besides the Ili River, the other tributaries Karatal, Aksu and Lepsy were and arestill discharging into the Eastern Balkhash. Their discharge alone does not supportthe actual water level of the eastern basin, which is co-fed by water inflow fromthe Ili and Western Balkhash. The Ayaguz River used to enter the lake from theNorth, but is has no surface inflow today. As a whole the sediments of all tributarydeltas contributed to the partition of the Balkhash basin in five different subbasinsof different depth (Fig. 5.3).3
reduced runoff from glacial meltwater. Similarly, the water-level rise (+8.1 cm per year) during theperiod 1992–2010 under increasing temperature (+0.08 °C per year) and precipitation (+11.6 mmper year) is largely attributed to the increasing contribution of glacial meltwater by Propastin (2012).3The modern Balkhash is divided in five basins: West-South, West-North, Middle, Lepsinsky andBurly-Tyubin, with depth increasing from West to East, i.e., lake bottom at 334, 333, 327, 326 and316 m asl, respectively (corresponding to water depths of 10, 11, 15, 16 and 26 m today).
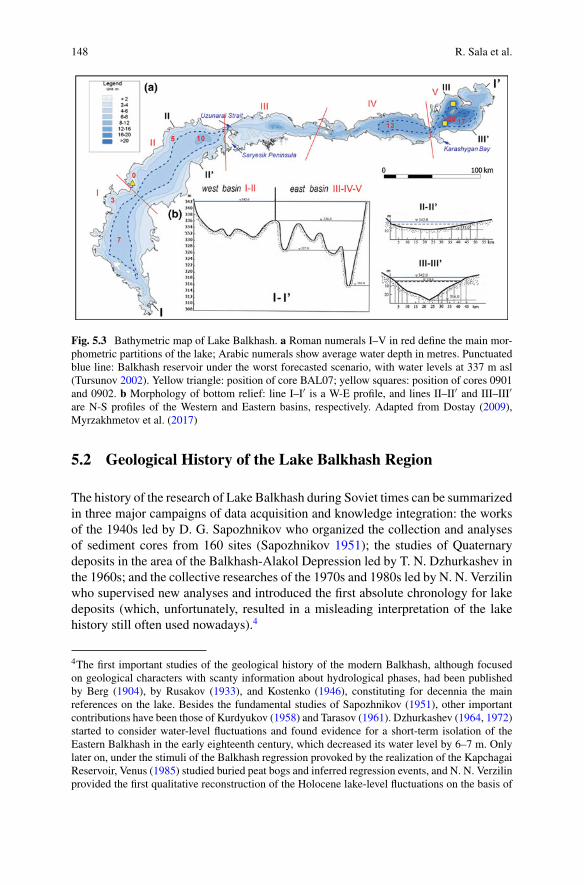
148 R. Sala et al.
Fig. 5.3 Bathymetric map of Lake Balkhash. a Roman numerals I–V in red define the main mor-phometric partitions of the lake; Arabic numerals show average water depth in metres. Punctuatedblue line: Balkhash reservoir under the worst forecasted scenario, with water levels at 337 m asl(Tursunov 2002). Yellow triangle: position of core BAL07; yellow squares: position of cores 0901and 0902. b Morphology of bottom relief: line I–I′ is a W-E profile, and lines II–II′ and III–III′are N-S profiles of the Western and Eastern basins, respectively. Adapted from Dostay (2009),Myrzakhmetov et al. (2017)
5.2 Geological History of the Lake Balkhash Region
The history of the research of Lake Balkhash during Soviet times can be summarizedin three major campaigns of data acquisition and knowledge integration: the worksof the 1940s led by D. G. Sapozhnikov who organized the collection and analysesof sediment cores from 160 sites (Sapozhnikov 1951); the studies of Quaternarydeposits in the area of the Balkhash-Alakol Depression led by T. N. Dzhurkashev inthe 1960s; and the collective researches of the 1970s and 1980s led by N. N. Verzilinwho supervised new analyses and introduced the first absolute chronology for lakedeposits (which, unfortunately, resulted in a misleading interpretation of the lakehistory still often used nowadays).4
4The first important studies of the geological history of the modern Balkhash, although focusedon geological characters with scanty information about hydrological phases, had been publishedby Berg (1904), by Rusakov (1933), and Kostenko (1946), constituting for decennia the mainreferences on the lake. Besides the fundamental studies of Sapozhnikov (1951), other importantcontributions have been those of Kurdyukov (1958) and Tarasov (1961). Dzhurkashev (1964, 1972)started to consider water-level fluctuations and found evidence for a short-term isolation of theEastern Balkhash in the early eighteenth century, which decreased its water level by 6–7 m. Onlylater on, under the stimuli of the Balkhash regression provoked by the realization of the KapchagaiReservoir, Venus (1985) studied buried peat bogs and inferred regression events, and N. N. Verzilinprovided the first qualitative reconstruction of the Holocene lake-level fluctuations on the basis of

5 Geological History and Present Conditions of Lake Balkhash 149
Concerning more recent international researches following the perestroika, sig-nificant investigations of themodern Lake Balkhash were conducted during the years2007–2012 in the frame of the Kazakh-Japanese research project “Historical inter-action between multi-cultural societies and the natural environment in a semi-aridregion in Central Asia”5 (hereafter shortened as “Ili Project”). The accumulated dataenabled the quantitative evaluation of the historical scenario already drawn by N. N.Kostenko and T. N. Dzhurkashev. Among the main results of the fieldwork surveysand laboratory analyses are reconstructions of transgressive hydrological events dur-ing the last 35 ka BP based on dating of gravel bars exposed on the northern shore,and a detailed reconstruction of the Balkhash history for the last 8000 years decodedfrom three cores of bottom sediments (Watanabe andKubota 2010; Sala et al. 2016).6
5.2.1 History of the Ancient and Modern Balkhash BasinsSince 300 ka BP
Lake Balkhash did not exist until ca. 300 ka BP. The tectonic Balkhash-AlakolDepression was already established ca. 10–15 millions years ago as a lacustrinelandscape made of ponds fed by little streams flowing down the Dzungarian Alatauand the northern Pre-Balkhash hillocks. The largest water body of the basin was theIli Lake, which was extendingWest of the present Chinese border, occupying the bed
mineralogical, hydrochemical and biotic analyses of sediment cores (Sevastyanov 1991; Tursunov2002; Dostay 2009). Y. P. Khrustalev andY.G. Chernousov published an article in 1992 reproducingtheir historical reconstruction of the lake already included in Sevastyanov (1991) which constitutestoday the main (and unfortunately partly confusing) reference concerning the Holocene lake history(see also note 8).5The “Ili Project” was based on the cooperation between the “Research Institute for Humanityand Nature” (RIHN) of Kyoto and three organizations based in Almaty: the “Institute of Geo-logical Sciences named after KI Satpaev”, the “Kazakh State Research Institute of the CulturalHeritage of the Nomads” and the “Laboratory of Geoarchaeology”. The researches of the Ili Projectfocused on the Ili-Balkhash basin (Semirechie) and included several fields: the reconstruction ofpalaeoclimate-environmental changes, historical fluctuations of Balkhash’s lake levels and of icedeposits, archaeological traces of land and water use, Late Medieval historical accounts concerningthe territory, and Soviet documents and post-Soviet interviews about the pastoralist and agriculturalactivities in the basin.6The investigation of lake sediments was initiated in 2007 by two international teams workingin cooperation with the Satpaev Institute of Geological Sciences of Kazakhstan (B. Aubekerov):a Chinese team led by Zhaodong Feng and Chengjun Zhang, and a Japanese team of the RHINInstitute led by Jumpei Kubota. That year, both teams drilled sediment cores at short distance fromeach other in the lake near the Tasaral Island in the western basin of Lake Balkhash. The preliminaryanalyses of the ‘Japanese’ core BAL07 were published in 2010 (Endo et al. 2010) and more detailedresults based on fossil diatom assemblages were issued in 2016 (Chiba et al. 2016). The pollen-based study of the ‘Chinese’ core BK-A was published with incorrect location of the coring site byFeng et al. (2013) and an additional study of the ostracod record of the same core by Mischke et al.(2020). In 2009, the Japanese team drilled two additional cores (0901 and 0902) in the easternmostpart of Lake Balkhash, and preliminary analyses of the cores were published by Endo et al. (2012;Sect. 5.2.2).

150 R. Sala et al.
of the modern Kapchagai Reservoir and proceeding further West as Ili River until itsconfluence with the Chu River and reaching the Aral Sea.
Under the tectonic rise of the Zailisky Alatau, the water inflow increased progres-sively and a critical deformation uplifted the Karaoi Plateau (700 m asl), all togetherprovoking a northward deviation of the Ili Lake thatwas displaced into the southwest-ern part of the Balkhash-Alakol Depression (at the time at 200–250 m asl, 200 mlower than today) and formed here its first Ili Delta (Akdala Delta; Dzhurkashev1972).
As shown in Fig. 5.4b, the Paleozoic substratum of the Balkhash-Alakol Depres-sion has a cup-like profile with a central depression at -100 m asl in the region
Fig. 5.4 Hydrogeological map and longitudinal section of the South Balkhash Depression. a Mapof the region showing the successive historical deltas of the Ili River (dotted fans numbered 1–5) crossed by the transect I-I’ (black line); 1–4 Quaternary deposits, 5 Neogene, 6–10 Paleozoic,11–12 aquiferous fissures, 13 freshwater lake, 14 slightly saline lake. b Hydrogeological sectionalong transect I-I’ from the southern shore of the Western Balkhash to the Malaisary Range (North-western piedmonts of Dzungarian Alatau); 1–4 Quaternary deposits, 5–6 Neogene, 7 Upper Creta-ceous, 8 Mesozoic, 9 Paleozoic, 10–19 soil and rock features, aquiferous faults, 20 shallow aquifer.Acronyms inside the section refer to locations: il Ili Suite, al alluvial lake, dp deluvial-proluvialdeposits. (Adapted from Akhmedsafin et al. 1973; http://www.water.unesco.kz/bal_ch_5_e.htm;and Abdrasilov 1996)

5 Geological History and Present Conditions of Lake Balkhash 151
of Bakanas village rising to +250 m asl on both sides against the Zhungarian andthe northern Pre-Balkhash pre-mountain zones. Middle Pleistocene deposits (QII)between +230 to +330 m asl, suggest that, following the Ili diversion, at first alake (Bakanas Lake) or a system of several lakes was formed in depressions aroundBakanas, which then had been filled and displaced North-East by the accumulationof Ili River sediments and the formation of the Ili Delta. Gradually, between 300and 100 ka BP, a huge lake called Ancient Balkhash was ‘sediment-dammed’ andseized the entire northeastern part of the depression unifying the present Balkhash,Sasykkol, Alakol and Aibi basins.
This mega-lake was reshaped at the very beginning of the last glacial period (ca.110 ka BP) following intensive orogeny of the Dzungarian Alatau that hoisted theArkarly Mountains at 780 m asl dividing the Ancient Balkhash in two differentwater bodies: the Alakol Lake in the East (today at 347 m asl) and the modern LakeBalkhash (inclusive of its eastern and western parts) in the West (today at 342 m asl;Kurdyukov 1958; Dzhurkashev 1972; Aubekerov et al. 2009a, 2010).7,8
The configuration of the shorelines of themodern Lake Balkhash is determined bya 20–30-m high, tectonically disturbed rocky terrain in theWest andNorth and by flatsandy alluvial and aeolian deposits in the South. The lake as a whole is lying on themost elevated and faulted northern slopes of the Paleozoic depression which favorsgroundwater circulation between the lake bottomand the vertical overflowof pressurewaters of the southern Pre-Balkhash artesian basin, across a few hundred metres ofsemi-permeable sediments. The lowest reaches of a huge accumulation of alluvial
7The average sediment thickness in the area of the modern Western Balkhash is 70 m, parted as44 m of Neogene and 26 m of Quaternary deposits, the latter with distinct 2–3 horizons (the secondhorizon uneven and eroded). Total sediments’ thickness decreases from 70 m in Western Balkhashto 50 m in Eastern Balkhash on the account of the lesser river and sediment input of the easternbasin (Sevastyanov 1991).8The reconstruction of the history of the lake provided by Khrustalev and Chernousov (1992)is relatively different and confusing. Using a chronological framework established by Maksimov(1961) for the glacial stages of the Dzungarian Alatau, the authors attribute the appearance of anAncient Balkhash (“Balkhash-Alakol”) basin outrivaling the Aral Sea in size, even if not reachedyet by the Ili River inflow to the post-glacial early Holocene period. The disappearance of the IliLake by Ili River diversion is assigned to the end of the Atlantic period (5.6 ka BP) and is quotedas responsible for the formation of the “Balkhash”, so that, in the view of the authors, the entireformation and rotation of the Ili deltas occurred during the last 5 ka.
Then, ignoring geological reports and only referring to lithological and chemical data fromcore samples provided by N. N. Verzilin’s fieldwork in 1979–1981, Khrustalev and Chernousovreconstructed the succession of four stages of the lake during the Holocene, each stage startingwith a transgression (T) and ending with a regression (R). These fluctuations are named by fourspecific toponyms and approximate chronological boundaries (all in ka BP) were provided: (I)-Ancient Balkhash (T 10.3, R 8.3–5.6), (II)-Balkhash (T 5.6, R 4.4–3.5), (III)-New Balkhash (T3.5, R 2.6–1.9), (IV)-Modern Balkhash (T 1.9, R intermittent). The present authors infer that threeof these regressive events reduced the Eastern Balkhash into a series of “isolated or semi-isolatedpools”: between 8.3 and 5.6, at 3.8 and 0.75 ka BP (quoted from Venus 1985).
The described middle-late Holocene history of the modern Balkhash, by being the most recentand best furnished in terms of radiometric ages, has been diffused and adopted as reference by manyscientists (e.g., Tursunov 2002; Solomina and Alverson 2004; Krylov et al. 2014; etc.) against thereliable geochronology of the basin established by geologists before.
152 R. Sala et al.
sediments in its South favor the water input from rivers and from shallow aquifers.The resulting groundwater dynamics, accompanied by seepage of ion-enriched lakewaters, contribute with other processes such as the dispersion of coastal salt depositsbywind, to themaintenance of a relatively low salinity of the endorheic lake (Smolyarand Mustafaev 2007).9
The Ili Delta has always been the principal feeder of the lake by freshwaterand biomass during the late Pleistocene and Holocene, and it continuously evolved,changing its morphology, location and size. Arid phases, through diminishing thedischarge of delta distributaries, favor the lowering and erosion of the existing riverchannels, the formation of terraces and, in general, the stabilization of the existingdelta morphology. The establishment of a new delta typically coincides with pluvialphases that enhance the energy levels of the distributaries and promote diversions invarious directions.
The Late Pleistocene, postglacial and Holocene evolution of the Ili Delta occurredin five stages (Fig. 5.4a), featuring as a whole a gradual northern and anticlockwiserotary displacement under the forcingof sedimentary and tectonic factors (Abdrasilov1996; Deom et al. 2019):
(I) The first stage, barely detectable, refers to the Akdala Delta (possibly severalsuperposed deltas): the head was around Bakbakty village, and the delta areawas huge, with distributaries feeding the eastern part of the modern LakeBalkhash during the glacial period.
(II) The Bakbakty Delta was created during the postglacial period: it was fed bythe so-called Palaeo-Ili River course with head at Birlyk, 30 km North of theformer one and an anticlockwise rotation of the distributaries.
(III) With the start of the Holocene, ca. 10 ka BP, the Uzunaral Delta (or OlderBakanas Delta) was created, with head displaced further North-West (30 kmsoutheast of Bakanas village, at 500 m asl) and the delta front reaching thepresent lake shore in correspondence with the Saryesik Peninsula. The lastconsists of alluvial sediments of 30–50 m thickness, shaping the connectionbetween the Western and Eastern Balkhash into a narrow and shallow strait(the Uzunaral Strait, today 6 m deep).
(IV) Only ca. 2 ka BP, the new Ili course became activated, parallel to the Palaeo-Iliin theWest, and opening a delta with head at Bereke (30 kmNorth of Bakanas).It further rotated anticlockwise, and in that way, the BakanasDelta (or YoungerBakanas Delta) was established, significantly reduced in size and dischargingin the western part of the lake.
(V) Only recently, during the pluvial phase of the sixteenth to eighteenth centuries,the delta rotated furtherWest to form themodern Ili Delta (Dzhurkashev 1964).
9Especially aeolian processes promote the relatively low salinity of the lake’s water: “The stockof salt reserves in the lake’s area amounts to only 260–300 million tons, which is not large since,in addition to their consumption in the process of carbonate formation, some of them are lost byentering the numerous bays of the winding coastline. During phases of water level recession, thebays separate from the lake, dry out, and their salt deposits are blown by the wind, thus reducingthe salt’s reserve of the lake” (Sevastyanov 1991).

5 Geological History and Present Conditions of Lake Balkhash 153
5.2.2 Hydrological Stages of Lake Balkhash During the LatePleistocene and Holocene
The most recent changes of the modern Balkhash across the Last Glacial Maximumup to now occurred mostly under the activity of rivers and changing climate, asa result of sediment accumulation and transgression-regression cycles, because nomajor tectonic events arose anymore. In that sense, the “Ili Project” focused on theanalysis of Balkhash’s water level changes during the last 40 ka; and significant studyobjects became the tracers of water-level variations, such as the absolute heights ofsand bars on the shore and the physical, chemical and biotic composition of the lakesediments.
The study and optically stimulated luminescence (OSL) dating of exposed gravelbars at the shore of the Karashygan Bay in the southeastern part of the lake (Fig. 5.3)revealed the presence of very relevant transgressions, the oldest to 354 m asl (+13 mhigher than today’s water level), dated to 36 kaBP, ascribed to the interstadial stage ofMarine Isotope Stage 3. Two successive transgressions of lesser entity were detectedat ca. 10 m above the present lake and dated to the LGM between 25 and 17 ka BP.The early Holocene lake level had decreased significantly ca. 8.4 ka BPwhen the lakereached for the first time its present level at 342 m asl. These events attest a tendencyto very high lake levels during the very cold phases with minimal evaporation of theLast Glacial Maximum and postglacial period, followed by lower water levels duringthe drier middle and late Holocene.
Analyses of the lake sediments of two cores drilled in the deepest part of theeastern basin (cores 0901 and 0902) and one core from the shallow western basin(BAL07; Fig. 5.3) allow the quantitative reconstruction of Balkhash’s water-levelfluctuations during the last 8 ka BP.
The sedimentary columns of cores 0901 and 0902 have been recovered at a waterdepth of 20 m in the easternmost Burlyutyubin Basin of the Eastern Balkhash, witha length of 6 m and a chronology of the last 8 ka BP (Fig. 5.5). The sediments weredated using the radiocarbon technique, and examined by complex analyses includinglithology, geochemistry, magnetic susceptibility, fossil diatoms (siliceous algae) andostracods (micro-crustaceans), pollen and sporeswhich are partly still not completed.The recorded data indicate a transgressive mode during the pluvial Atlantic period(7.0–5.5 ka BP) and three main regressions at 5.5–5.0, 2.7–2.4 and 1.3–0.8 ka BP. Ifthe second and third regressions were severe but presumably not falling below 336 masl, the first regression at 5.5–5.0 ka BP definitely went below 336 m asl which is thelevel of the Uzunaral Strait floor at which the Western and Eastern Balkhash becomeseparated water bodies. Thus, the two basins were disconnected and isolated lakesformed in the Eastern Balkhash in the middle Holocene.
At 3.7–3.0 m of their columns (the sediments at 2.9 m depth in core 0901 have anage of 4.7 ka BP), both cores revealed sediments characteristic of an arid or semiaridenvironment. Core 0902 contains a layer of abundant gypsum at 3.67 m, indicatingstrong evaporation effects on the lake waters. Core 0901 includes laminated sedi-ments rich in Fe and Si at 3.50 m which are overlain by silt and fluvial sand (Sugai

154 R. Sala et al.
Fig. 5.5 Lithological profiles and age-depth plot (approximate accumulation rate 0.5 m/ka; Endoet al. 2012) of cores 0901 and 0902 from the Eastern Balkhash (original figure published in Endoet al. 2012, Fig. 5)
et al. 2011). The depth of the gypsum layer in core 0902 corresponds to ca. 318–319 m asl, i.e., 23–24 m below the present water surface of the lake, suggesting anextreme lake-level drop of 24 m in the Burlyutyubin Basin and the reduction of thelake to a small brackish pond ca. 5.5–5.0 ka BP.10
A similar inference is confirmed by the biotic proxies: palynological spectra,ratios of benthic saline and planktonic freshwater diatoms, and the contraction anddiversity change of different ostracod species (Endo et al. 2012, 46).
Several peat layers have also been recorded by Soviet geologists (Sapozhnikov1951; Dzhurkashev 1972; Venus 1985) but a significant lake-level drop as those inthe middle Holocene was not detected previously, not even suspected, underliningthe vulnerability of the Eastern Balkhash Basin and the importance of this discovery.
The core BAL07 was drilled in the shallow western part of the lake near theTasaral Island at a water depth of 3 m. The core is 6 m long and covers the timespan of the last 2000 years. Its lithology and biotic content disclosed two major
10Taking into account sedimentation rates, such pond could have been 4–5 m deep.

5 Geological History and Present Conditions of Lake Balkhash 155
medieval regressions dated to 750 and 1150 AD, roughly the start and the end ofthe Medieval Warm Period (MWP).11 The water level dropped by ca. 5 m duringthe earlier backset and the Uzunaral Strait might have desiccated (which at thattime was supposedly crossed by a caravan road linking the delta to the northernshore). The later regression was less intense but longer (Fig. 5.6). Afterwards, thelake experienced a long transgressive phase under the pluvial climate of the LittleIce Age, between 1300–1800 AD, interrupted by three regressions at the start andthe end of the sixteenth century and around the late eighteenth century.
Twomain factors are regarded as the causes of the historical lake-level regressions:climatic aridification diminishing the river inflow and enhancing evaporation, andanomalous transmission losses, natural or anthropogenic.
Fig. 5.6 Synoptic reconstruction of thewater level of LakeBalkhash during the last 36 ka. Sources 1OSLdata of gravel bars of theKarashyganBay (earliest transgressions dated to 36, 25 and 17 kaBP),and 14C data of cores 0901, 0902 and BAL07 (Endo et al. 2012; Chiba et al. 2016); 2 14C data fromY. P. Khrustalev’s lithological analyses (10.3, 8.3, 5.6, 4.4, 3.6, 2.7 ka BP) extended by the datingof an additional peat layer by N. N. Verzilin (3.97 ka BP; Sevastyanov 1991), 3 14C data from B. G.Venus’ analyses of peat layers (5.05, 3.86, 0.75 ka BP; Venus 1985); 4 palynological data of coreBAL07 (Aubekerov et al. 2009b); 5 inferred climatic phases: multi-secular long minimum (~1.25ka BP) at 335.5 m, multi-secular long maximum (0.7–0.5 ka BP) at 348.5 m, secular maximum(0.27 ka BP) at 346 m, secular minimum (0.16 ka BP) at 338 m (Kurdin 1976; Shnitnikov 1957);6 14C, pollen and ostracod data from the core BK-A (Feng et al. 2013; Mischke et al. 2020) 7Gauge measurements of water levels for the period 1879–1967 (Semenov and Kurdin 1970). Thedecreasing intensity of gray shading refers to four different chronological scales, from left to right:10 ka, 1 ka, 0.1 ka, 0.05 ka
11Using diatom assemblages correlated with Ca content in ostracods radiometrically dated, theJapanese team placed the two low-level stands in a series of seven regressive periods: 0–300,330–360, 750–790, 1060–1260, 1560–1600, 1780–1840, 1950–1990 AD (Chiba et al. 2016). Thepollen-based reconstruction by Feng and co-authors confines itself to the outline of three climaticstages in the basin: cool-wet (500BC–200AD),moderatelywarm-dry (200–1350AD) and cool-wetfor the past 650 years with a last warm-dry century (Feng et al. 2013).

156 R. Sala et al.
The climate of the Balkhash region is under the influence of the northern Atlanticatmospheric circulation, which evolves over the northern Atlantic Ocean in responseto sea surface temperature fluctuations driven by the Atlantic Multidecadal Oscilla-tion (AMO), and to atmospheric pressure changes of the North Atlantic Oscillation(NAO). In western Central Asia, the late Holocene and in particular the Subatlanticperiod was characterized by the alternation of hot-dry and cold-wet climate phases.Arid phases were detected at 5.4–5.2, 4.6–3.9, 3.2–2.8, 2.0–1.6 and 1.3–0.8 ka BP,intercalated by moist phases (Chen et al. 2008; Hill 2018). Moreover, the effects offluctuations between arid and humid phases on decreasing or increasing levels ofLake Balkhash are postponed by negative or positive changes in glacial ice volumes(Footnote 3; Feng et al. 2013).
The tributary rivers of Lake Balkhash are flowing on broad flat plains with dis-charges significantly decreasing downstream, particularly in the very variable deltaiccourses with dense riparian vegetation partly crossing isolated evaporation pans.Delta distributaries can be diverted into isolated evaporation basins, or instead theycan widen and merge, in both cases increasing the wetlands surface with significanttransport losses by ponding in terminal storages, infiltration and evapotranspiration.The first case is suggested by the geomorphological study of the palaeo-terraces ofthe Lepsy River where large Late Holocene regressions of Eastern Balkhash couldhave been enhanced by switches of the very unstable Lepsy River bed, divertingits waters southwestward in separate depressions (Dzhurkashev 1972; Endo et al.2012, 44). The second case is represented by some apparently not climatically trig-gered lake-level regressions of the sixteenth and late eighteenth century attributed byDzhurkashev (1964) to the widening of the deltaic surface due to the contemporaryactivation of both the Bakanas and Ili deltas.
The Late Pleistocene and Holocene hydrological regime of Lake Balkhash can besummarized as three successive stages, each correlated to specific climate conditionsand lake-level ranges (Fig. 5.6):
• the first stage, with high water levels between 355 and 349 m asl, is connectedwith glacial and postglacial conditions with very low evaporation;
• the second stage, with water levels between 348 and 341 m asl, occurred duringthe early and middle Holocene, and is characterized by warm and moderately wetconditions and still significant accumulation of glacier ice in the mountains of thecatchment;
• the third and present stage, with water levels between 348 and 335 m asl, existssince the late Holocene, and is characterized by an arid climate and small volumesof glacier ice, and by relevant lake-level fluctuations between arid and humidphases. Henceforth, three main phases can be distinguished within this third stage:regressive (5.0, 1.2, 0.8 ka BP), transgressive (0.7–0.1 ka BP), and regressive (0.2,0.1, 0 ka BP).

5 Geological History and Present Conditions of Lake Balkhash 157
5.3 Modern Balkhash: Present Hydrological ConditionsUnder Increasing Climate Warming and WaterSubtraction
The history of Lake Balkhash is significantly better known for the last 120 yearsthanks to gauge stations introduced in 1879. Today, quantified data concerning thelake level, water quality and biological environment are regularly collected, analyzedand used formonitoring by threemain institutes based inAlmaty: the Hydrometeoro-logical Institute “Kazhydromet”, the Department of Water Resources of the Instituteof Geography, and the Akmedsafin Institute of Hydrogeology and Geoecology.
According to their annual measurements, Lake Balkhash, like most Central Asianlakes,manifests a tendency of progressive desiccation during the last century,with theexception of two high stands in 1908–1912 (343.7m) and in 1960–1972 (343m). Thelake level increase after 2000 (342.5m) is attributed tomelting of glaciers (Fig. 5.7a).
During the period 1960–1986, the lakewas confrontedwith threemajor regressivefactors: the continuation of the secular dry climate trend, the filling of the KapchagaiReservoir (1970–1986), and the increase of the irrigation area within the basin from300,000 to 550,000 ha and of anthropogenic water withdrawal from 3.5 to 5.5 km3.The total river inflow decreased by 3.8 km3 per year (−23%), of which 62% wereattributed to natural variability and 38% to anthropogenic subtraction; andBalkhash’swater level fell from 343 m asl in 1970 to 340.6 m in 1986 when the Kapchagai crisisculminated. This lake-level decrease was accompanied by a very sensible decreaseof the water surface by 25% with shorelines receding 2–8 km, and by a reduction ofthe water volume by 40% (Kezer and Matsuyama 2006).
Balkhash’s lake level regained to 341.5 m asl between 1986 and 2008, followingthe reduction of the active capacity of the Kapchagai Reservoir to 6.64 km3 (23.7%of the originally projected capacity)12 and the post-perestroika economical crisis inKazakhstan which was, anyhow, counterbalanced by an increasing use of Ili Riverwaters on the territory of the People’s Republic of China (Shaporenko 1995; Fig. 5.7).
During the period from 1955 to 2000, the accelerated melting of the glacier icein Balkhash’s catchment basin exceeded the global average ice melting by a factorof four. Thus, the meltwater surplus compensated the increased evaporation lossesfrom the lake as a result of the warming trend. Ice volume in Balkhash’s catchmentdecreased from 122 to 90 km3, i.e., −26% between 1955 and 2000 (−0.8 km3 onaverage per year; Bolch 2015; Severskiy et al. 2016). The corresponding surfacedecreased from 2000 to 1500 km2, i.e., −25% between 1960 and 2007 (−0.6 km2
per year; Xu et al 2015; Severskiy et al. 2016). The persisting glacier shrinkageprovides a significant 5–10% excess of yearly river inflow that will disappear underongoing climate trends and glacier retreat within less than 50 years.
The shallow bathymetry of Lake Balkhash with an average depth of 5.7 m makesit sensitive to inflow changes. The ratio between water surface (18,210 km2) and
12Awater volume of 6.6 km3 in theKapchagai Reservoir corresponds to awater surface of 1250 km2
(7.1% of Lake Balkhash’s surface) and an annual evaporation of 1.2 km3.

158 R. Sala et al.
Fig. 5.7 Historical development of Lake Balkhash’s level (left axis) and area (right axis) since1880 and of water consumption in the Ili River Basin after 2000. a Water-level and area fluctu-ations between 1880 and 2016 (based on data from Semenov and Kurdin 1970; Propastin 2012;Myrzakhmetov et al. 2017). b Water consumption (km3) in the Ili River Basin in 2000 (37% inChina, 63% in Kazakhstan) and in 2014 (43% in China, 57% in Kazakhstan). Legend: China 1Agriculture, 2 Riparian vegetation, 3 Lakes and reservoirs; Kazakhstan 4 Agriculture, 5 Riparianvegetation (including delta vegetation), 6 Lakes and reservoirs (Balkhash excluded; data fromThevset al. 2017)
water volume (106 km3) is very high and implies a correspondingly large volume ofevaporated water (yearly 17.2 km3). Thus Balkhash’s resilience is very low; the lakewould disappear without water inflows in less than seven years.
Today, a mean annual water input of 18 km3 ensures a lake level at 342 m aslbut future decreases of meltwater discharge and increasing aridification with higherevaporation will result in a lower lake level. Moreover, demands for anthropogenicwater withdrawal are rising, mostly through the expansion of irrigated surfaces.Thus, Lake Balkhash requires a strict water management system for its catchmentarea including common rules for all water consumers because the current state of thelake can only be secured with a reduced and better use of the Ili River water.
The most recent change in the complex hydrological system of Lake Balkhashresulted from plans prepared in the 1990s to multiply the area of irrigated fields

5 Geological History and Present Conditions of Lake Balkhash 159
in the upper Ili Basin in Xinjiang by three to four times accompanied by a dras-tic demographic increase.13 Today, the resulting irrigation farming and establishedinfrastructure and population density reached the alarming capacity of a yearly sub-traction of a few km3 of water that may soon cause a drop of Balkhash’s level belowthe critical height at 336 m asl and eventually the disappearance of the EasternBalkhash.
The size of irrigated areas on the Chinese side grew between 2000 and 2014 from400,000 to 500,000 ha and the water retention from 5.0 to 5.6 km3, reaching thelevel of the implementations on the Kazakh side during Soviet times. On the Kazakhside, irrigated areas and water use were slowly increased after the collapse whichfollowed perestroika. In 2014, an area of 250,000 ha was irrigated and 2.3 km3 ofwater was used (Thevs et al. 2017).
The combined water withdrawal for irrigation purposes in Balkhash’s catchmentinKazakhstan andChina amounts to a total of 7.9 km3 (52%of the river inflow) todaywhich will further increase in the future (Fig. 5.7b). If the annual water consumptiongrows by additional 3 km3, the lake level of Balkhash will drop to 340.2 m asl and thelake surface will shrink to 15,000 km2. A higher increase of the consumed water byadditional 6 km3 would cause a lake-level fall to 338 m asl and a corresponding lakesurface of 10,000 km2. An even higher increase by additional 9 km3 would resultin a lake-level drop to less than 336 m asl and a division of the lake in three to sixdifferent basins of which some would completely desiccate (Propastin 2013).
5.4 Modern Balkhash: Lithology of the Sedimentsand Hydrochemistry of the Water Column
5.4.1 Types of Sediments
The geological features and hydrological conditions of the Balkhash Basin determinethe character of the lake-bottom sediments and of the water (Sect. 5.4.2) and thecharacter of its biotic components (Sect. 5.5).
The sediments of Lake Balkhash, suspended or dissolved14 in the water columnand precipitated to the lake bottom, consist of allochthonous materials transportedby rivers, waves and winds, and of autochthonous materials produced within thelake itself by chemical processes and biotic activity. They consist of suspended inor-ganic and organic debris and of dissolved chemical particles differently distributedwithin the lake according to the location and discharge of the individual river deltas,
13Chinese authorities do not provide information about their hydraulic plans in the region and, upto now, did not respond to repeated requests for the establishment of an international consortiumfor the management of the trans-boundary hydrological system of the Ili-Balkhash Basin.14A solution is the homogeneous mixture of a solute and a liquid where, in contrast to a suspension,the solute cannot be separated from the solvent by filtration.

160 R. Sala et al.
the lithological and chemical characteristics of the water inflow, and the peculiarelongated morphometry and resulting water circulation in the basin (Fig. 5.8).
Within the total transported sediments, the clastic terrigenous materials, mainlyin the form of sand, are by far the most abundant (ca. 4–6 million tons per year,0.005 km3), accounting for 92–93%of the annual total. They aremade ofmineral par-ticles of quartz, feldspar, volcanic rock fragments, limestone and shale, sized between
Fig. 5.8 Lithological and hydrochemical characteristics of Lake Balkhash. a Location of 36 sedi-ment cores (6 m long) retrieved at regular intervals along the lake’s long axis. Main granulometricconcentration: 1 silt; 2 silty sand; 3 sandy silt; 4 pebbles, gravel; 5 dolomite; 6 sandbank; 7 Neogeneclay. b Above: West-to-East profile of lake depth. Below: West-to-East profiles of ratios in percentof lithological composition of bottom sediments (calcite, aragonite, dolomite, etc.). c Hydrochem-ical composition of the water column (ratios of Ca2+/Mg2+, pH, salinity �ν, Mg2+; from AtlasKazakhskoi SSR 1982: 59 and Sevastyanov 1991, Fig. 32)

5 Geological History and Present Conditions of Lake Balkhash 161
clay and gravel. The mineral composition of the lake deposits highly depends on thetransport mechanism and size of the sediment particles (Fig. 5.8a). Granulometricanalyses of the bottom sediments (Fig. 5.8a) show that sands, mainly carbonaceous,constitute the absolute majority around delta mouths and account for more than 50%of the deposits in the middle part of the lake. The mineral composition of the lakedeposits highly depends on the size of the sediment particles. Wind-transported aeo-lian silts, mainly siliceous, abound all along the dunes near the southern coast. Claysof different color and composition (mainly green chlorites and hydromicas) accumu-late abundantly in the western basin and in the bays along the northern coast wherethey constitute more than 70% of the surficial lake-bottom sediments (Sapozhnikov1951).
The mineralogy of the bottom sediments is dominated by rock-forming compo-nents from the same terrigenous geochemical province, i.e. mainly as a result ofsuspended materials carried by the Ili River to the lake (Fig. 5.8b). Carbonate min-erals [calcite and aragonite CaCO3, dolomite CaMg(CO3)2] are the most abundantcomponents and also those reacting fastest and precipitating earliest from the waters,so that their portion is >50% in bottom sediments around the delta mouths (Ili, Aksu,Lepsy) and between 10 and 20% in the remote central regions of the basin, balancedhere by an increase of more stable silica and sodium oxide. Iron concentration variesbetween 3 and 9% and is evenly distributed in high concentration along the northerncoast. In contrast, sediments in the easternmost basin fed by the Lepsy and Ayaguztributaries represent an anomalous mineralogical composition with a tenfold higherconcentration of magnesium and manganese oxides, and a decrease of iron, result-ing in a significantly different province of authigenic geochemical sediments there(Sevastyanov 1991).
Chemogenic sediments consist of solid and gaseous undissociated compounds,molecules and ions dissolved in water, from which a part precipitates by chemicalreactions. Their yearly input from rivers represents a small fraction (less than 2–3%)of the yearly total sedimentary budget but they represent by far the main sedimentarycomponents dissolved in thewater column.A totalmass of 13million tons (i.e., a totalvolume of 0.025 km3) precipitates per year from the water column. Their dissolvedmass and composition result from thousands of years of chemogenic processes and,together with water inflow and evaporation, control the hydrochemical conditions ofBalkhash’s biotic system.
Biogenic materials consist of terrestrial macrofossils, phytoliths, pollen and char-coal from fires. They are suspended in low quantity in the water and practicallyabsent in most bottom deposits. A larger fraction of the sediments is represented bycalcareous and siliceous skeletal elements of aquatic organisms in the lake. Theseare mostly ostracod valves and diatom tests, and to a lesser degree also bivalve andgastropod shells. Organic carbon concentration of bottom sediments is ca. 1% inthe proximity of delta mouths and less than 0.5% in the central parts of the lake(Sapozhnikov 1951).

162 R. Sala et al.
5.4.2 Composition of the Water Column
Lake Balkhash’s water is almost isothermal and isochemical without verticalstratification due to the shallow depth of the lake and the action of wind and currents.
Mean annual surface-water temperature is +1.1 °C, mean December surface-water temperature is−3.3 °C, and mean July surface-water temperature is+23.0 °C.Summer-water temperatures are close to ambient air temperatures (Sect. 5.1) butwinter surface-water temperatures are significantly higher than air temperatures.
The solid particles suspended in the water are clay- and silt-sized, carried by flow-ing waters until they settle out when flow is insufficient to keep them in suspension.Together with dissolved chemical particles, they determine the moderate turbidity inthewestern basin (visibility 5–10m) and the increasing turbidity to the East enhancedby winds, currents and salinity until a visibility of 1 m or less.
Among gases, dissolved oxygen (O2) as the most critical indicator of a lake’senvironment and of a healthy aquatic ecosystem, is in a range from 6 to 10 mg/Lin Lake Balkhash. Dissolved oxygen saturation is typically 100% at the surface and90% at the lake bottom with variations due to local water temperature, salinity anddepth.
Total Dissolved Solids (TDS) is defined as all substances contained in water (met-als, minerals, salts, calcium and other compounds which can be both inorganic andorganic) that can pass through a 2 micron filter. Thus, TDS is a measure of thesum of the amount of dissolved ions (as mg/L).15 The relatively larger and mostabundant ions or macro-components in Lake Balkhash are carbonates (hydrocarbon-bicarbonate HCO−
3 and carbonate CO2−3 ) and calcium (Ca2+) in equal proportions
(together accounting for ca. 68% of dissolved ions); magnesium Mg2+, sulphateSO2−
4 , sodium Na+, chloride Cl− (together ca. 27%), and potassium K+ (which isrelatively abundant in Balkhash, 2%).16 In addition, silicon Si4+ represents an impor-tant dietary requirement for various organisms with a concentration of 2–3 mg/L,in spite of its low reactivity. Micro-components or substances occurring in very lowconcentrations (1 μg/L < x < 1 mg/L) represent 3% of the total ionic mass in LakeBalkhash. However, they are very significant as most important nutrients includingvarious inorganic and organic nitrogen compounds such as ammonium NH+
4 , nitriteNO−
2 and nitrate NO−3 (0.01–0.7mg/L), phosphorus (phosphate PO3−
4 ), and iron Fe3+
(0.1–0.5 mg/L).Salinity of Balkhash’s watersmainly depends on the concentrations of Ca2+,Mg2+
and HCO−3 and thus, on water hardness. Salinity increases from 0.2 to 5.0 g/L from
151 mg/L is equivalent to 1 ppm (parts per million).16The ionic composition of Lake Balkhash’s water is relatively distinct if waters of different basinsare compared: “The proportion of chloride (9–21 equiv. percent) is 2–3 times lower than the propor-tion of chloride in the sea. However, the proportions of potassium, calcium, magnesium, sulphateand carbonate/bicarbonate ions are significantly higher. In Eastern Balkhash, the proportion ofpotassium ions (2.9 equiv. percent) is very high in comparison to other waters (e.g., 0.6 equiv. per-cent in the ocean and the Aral Sea). The lower proportion of calcium ions, especially in comparisonwith the Aral and Caspian seas, is also notable” (Aladin and Plotnikov 1993, 5).

5 Geological History and Present Conditions of Lake Balkhash 163
West to East (Fig. 5.8c).17 The Ca2+/Mg2+ ratio is a good indicator of salinity in LakeBalkhash (Fig. 5.8c).18
The water of Lake Balkhash is alkaline, with acidity (pH, power of hydrogen)decreasing from a pH of 8.65 in the West to 9.15 in the East.
In the Balkhash water, carbonate anions dominate over chloride (14%) and sul-phate (18%) anions; and their concentration increase fromWest to East together withchanges of associated cations (Ca, Mg, Na, K).
Among carbonates, the ratio of bicarbonate (HCO−3 ) and carbonate (CO2−
3 )depends on acidity: bicarbonate dominates in the Western Balkhash with pH val-ues of 7–8.5, and carbonate dominates in the Eastern Balkhash at pH values > 8.In Western Balkhash bicarbonate associates with calcium and precipitates as calcite(CaCO3), resulting in decreasing concentrations of both ions from West to East inLake Balkhash. Bicarbonate concentrations decrease from 35–57 to 8%, and calciumconcentrations from11.8 to 1.2mg/L fromWest to East. In EasternBalkhash, carbon-ate associates mainly withmagnesium, andmagnesium concentrations increase from40 to 400 mg/L from the West in the lake to its East due to the different sedimentaryloads of the eastern river inflows and the higher effects of evaporative concentrationin the East. The carbonate-magnesium combination favors the formation of dolomite[CaMg(CO3)2] and aragonite (CaCO3). Similarly towards the East, salinity increasesfrom 0.7–1.1 to 3.2–5.2 g/L.
The hydrochemical conditions are reflected by the mineralogy of the respectivesediments on the lake floor (Fig. 5.8b) which contain 50% of calcite in the WesternBalkhash, calcite and dolomite in similar proportions in the western basin of theEastern Balkhash (i.e., in the Middle Basin; basin III in Fig. 5.3a), and 60% ofdolomite and 7% of aragonite in the central basin of the Eastern Balkhash (i.e., inthe Lepsinsky Basin; basin IV in Fig. 5.3a).
5.5 Modern Balkhash: Biota
5.5.1 Biological Productivity
Lake Balkhash has favorable temperature ranges and dissolved oxygen levels, buta low productivity. The low productivity results from the high concentrations of
17The amount of salts in the waters of the endorheic lake would be significantly higher given thesedimentary inputs if geological processes would not partly remove salts (Sect. 5.2.1 and Footnote9).18The amount of ions is directly correlatedwith the electrical conductivity (EC) of thewater,which isalso agood indicator of salinity (TDS=ECx0.64),moreover by the fact that it keeps in considerationtemperature gradients. EC is expressed in Siemens/metre (S/m ormho/m), conventionally calibratedat 25 °C, with 1 S/m equivalent to a salinity of 5 g/L. Going from West to East in Lake Balkhash,EC values at T = 1.1 °C increase from 1 S/m to more than 15 S/m. EC values increase 3% per1 °C temperature increase and at a maximum water temperature of 26 °C reach up to 2 S/m in thewesternmost and up to 27 S/m in the easternmost part of the lake.

164 R. Sala et al.
potassium and magnesium in the Eastern Balkhash which are unfavorable for itsbiota (Karpevich 1975). Further increases in salinity and the concentrations of theseions will directly cause considerable reductions of biomass (Aladin and Plotnikov1993, 6). Also other factors such as the relative isolation of the lake and the adaptationstress induced on organisms by frequent fluctuations of lake level and salinity reduceBalkhash’s productivity to a medium-low rate, decreasing from West to East withincreasing turbidity and salinity.
5.5.2 Floral and Faunal Species
5.5.2.1 Aquatic Flora
The aquatic flora of Lake Balkhash consists of microphytes (microalgae) living in thewater column (planktonic) or on or in sediments (benthic), andmacrophytes growingin or near the water. Phytoplankton and phytobenthos are represented by 350 speciesand varieties, including: 200 species of diatommicroalgae,mainly benthic and almostconstituting the totality of the benthic algae; ca. 65 species of green algae; ca. 50 ofblue-green algae; eight of dinoflagellates; four of golden algae; one of yellow-greenalgae; six of euglenids; 18 of zygnematophyceans and some species of charophyceans(Fig. 5.9). Most of the algae forms are freshwater types (oligohalobionts) or adapted
Fig. 5.9 Typical aquatic ecosystem of Lake Balkhash. Bottom sediments: 1 limy dolomitic whitesilt (upper strata of the lake-bottom cores of Eastern Balkhash; Sapozhnikov 1951); 2 silty sandwith a peat layer, at depths between 8–60 cm in the central-western basin. Phytoplankton: 3 Dino-phyte Peridinium, the most widespread dinoflagellate in the western basin; 4 Cyanophyte Snowellalacustris (blue-green algae). Macrophytes: 5a hydrophytic plants; 5b Charophyta green algae; 5cChlorophyta green algae. Zoobenthos: 6 Chironomus salinarius (bloodworm midge); 7 bivalvePisidium henslowanum; 8 gastropod Radix ovata; 9 amphipod Gammarus lacustris. Zooplankton:10 Daphnia galeata, a common micro-crustacean in Eastern Balkhash. Ichtyofauna: 11 Balkhashperch, an endemic fish previously dominant that became rare (Red List IUCN) after the introductionof the bream
5 Geological History and Present Conditions of Lake Balkhash 165
to a wide range of salinities (euryhaline). Benthic algae are mainly diatoms (Abrosov1973; Karpevich 1975; Alekin 1984).
The basis of phytoplankton is made of a low number of species (Abrosov1973). Before the 1950s, they were the blue-green algae Microcystis flosaquae,Snowella lacustris, Planktolyngbya contorta, P. limnetica, Nodularia spumigena;the dinoflagellatesCeratium hirundinella, Peridiniopsis borgei; the green algaePedi-astrum duplex, Pseudopediastrum boryanum; and the diatoms Aulacoseira granu-lata, Campylodiscus clypeus, Coscinodiscus lacustris, Cymatopleura elliptica andEntomoneis paludosa. In theEasternBalkhash, diatoms such asChaetoceros spp. andthe dinoflagellates Chrysosporum bergii and Glenodinium berghii were common.
Later, changes occurred in the phytoplankton assemblage. In 1973–1985, thecommon species were the blue-green algae Merismopedia minima, M. tenuissima,Snowella lacustris, Microcystis pulverea, Coelosphaerium dubium, the diatomsCyclotella comta and C. meneghiniana, and the green alga Oocystis submarina.In Eastern Balkhash, species of genera Cyclotella, Snowella and Chaetocerosdominated (Abrosov 1973).
In the 2000s, the most common phytoplankton were the dinoflagellate Peridiniumsp., the diatomsCyclotellameneghiniana andNavicula sp., the euglenophyteTrache-lomonas sp., the green algaFranceia sp., and the blue-green algae Snowella lacustris,Gomphosphaeria aponina and Gloeocapsa sp. (Barinova et al. 2017).
Diatoms dominate in spring and autumn, green algae during periods of increasingtemperature, blue-green algae in summer. Freshwater and euryhaline forms dominatein thewestern part of the lakewhilst freshwater forms disappear in the eastern part andbecome replaced by halophiles and mixed assemblages (holobionts) which spreadto the West in phases of increasing salinity.
By the end of the 1970s, the average biomass of the phytoplankton in WesternBalkhash fell by more than 50% as a result of increased salinity. Freshwater speciesbecame rare and substituted by more salt-resistant forms (Alekin 1984).
The variety of macrophyte flora in Lake Balkhash is relatively low. If the aquaticplants of the Ili River Delta are included, 35 species of higher plants and sevenspecies of charophytic macroalgae occur. The causes for this low species number arethe relatively high and variable salinity with macrophyte numbers decreasing withincreasing salinity (Abrosov 1973), the relatively high turbidity of the water, thestrong impact of coastal waves and the geographic isolation from other basins. Highturbidity of water prevents the development of charophytic macroalgae. Charophytesare only found in those parts of the lakewhere thewater transparency is high (Abrosov1973). These parts are mainly in the Western Balkhash.
The hydrophytic plants restricted to low salinities in Lake Balkhash are the whitewater lily Nymphaea candida, the arrowhead Sagittaria sagittifolia and the duck-weeds Lemna minor and L. trisulca. The higher plants most resistant to high salin-ity are the reed Phragmites australis, the sago pondweed Stuckenia pectinata, thehorned pondweed Zannichellia palustris, the watermilfoil Myriophyllum spicatum,the bulrush Scirpus kasachstanicus and the beaked tasselweed Ruppia maritima.The charophytic macroalgae Chara tomentosa and Nitellopsis obtusa also toleraterelatively high salinities (Abrosov 1973; Barinova et al. 2017; Krupa et al. 2017).

166 R. Sala et al.
Thickets of hydrophytes diminished in Lake Balkhash due to the increasing shal-lowing and salinization. Reed covered a 250-km long and 10–20-km wide stretch inthe Western Balkhash in the past which was reduced to a 1–2 km wide reed belt inthe 1970s (Abrosov 1973).
5.5.2.2 Zooplankton
The natural fauna of Lake Balkhash is considered as qualitatively and quantita-tively poor due to its geographical isolation. Several allochthonous species havebeen artificially introduced during the last century.
The basic original zooplankton consisted of ciliates (Codonella cratera), rotifers(Synchaeta spp., Filinia longiseta, F. longiseta var. limnetica, Polyarthra platypiera,Pompholyx sulcata, Keratella quadrata, K. quadrata var. valga, K. cochlearis, K.cochlearis var. tecta, Chromogaster ovalis, Hexarthra oxyuris), copepods (Arctodi-aptomus salinus, Thermocyclops crassus, Mesocyclops leuckarti), and cladocerans(Daphnia galeata, Diaphanosoma lacustris, Chydorus sphaericus and Leptodorakindtii; Rylov 1933; Fig. 5.9). Leading were rotifers, andK. quadrata predominated.Among copepods, the leading form was A. salinus which was more abundant in theEastern Balkhash.Widespread, though not very abundant, wasM. leuckarti (Abrosov1973).
By 1978–1980, significant changes in the zooplankton had occurred due to thefalling lake level and the increasing salinity, accompanied by a sharp decrease innutrient inputs from river runoff. The number of freshwater and brackish-waterrotifer species decreased, and to a lesser degree also the numbers of cladoceransand copepods. Of the latter two, A. salinus and D. lacustris became the dominatingspecies.
By 1983–1985,with the continuously falling lake level and rising salinity, the totalnumber of zooplankton species declined by more than a half compared to the end ofthe 1960s. Small forms or “fine” detritophages filter-feeders disappeared completely,reducing the number of species most valuable as food for juvenile commercial fish.Instead, the “rough” filter-feeders D. lacustris and A. salinus, characterized by rel-atively low nutritional values for juvenile fish, began to dominate. The cladoceranSida cristallina became abundant and the typical inhabitant of the brackish waters.
By the end of the 1990s, the zooplankton composition of Lake Balkhash stabi-lized. The main species were Brachionus calyciflorus, Euchlanis dilatata, Keratellacochleans tecta, K. quadrata quadrata, Hexarthra oxyuris, Daphnia galeata, D.cucullata Sars, Diaphanosoma lacustris, Eucyclops vicinus, Mesocyclops leuckartiand Arctodiaptomus salinus.
The current zooplankton of the lake includes 123 species and subspecies of inver-tebrates: 82 rotifers, 22 cladocerans and 19 copepods (without harpacticoids). Onlya few are found in high numbers: Polyarthra dolichoptera dolichoptera, Euchla-nis dilatata dilatata, Keratella cochlearis cochlearis and K. quadrata quadrataamong the rotifers; Diaphanosoma lacustris and Daphnia galeata, especially in
5 Geological History and Present Conditions of Lake Balkhash 167
Eastern Balkhash, among the cladocerans; and Arctodiaptomus salinus, Mesocy-clops leuckarti and Thermocyclops crassus among the copepods (Rylov 1933; Sadu-akasova 1972; Karpevich 1975; Krupa et al. 2013). The three cladocerans Leptodorakindtii, Ceriodaphnia reticulata and Polyphemus pediculus are rare. A few species ofthe cladoceran families Chydoridae and Macrothricidae and of the copepod generaEucyclops, Microcyclops and Macrocyclops occur near the river mouths.
The specific ionic composition of Balkhash’s water, especially the higher con-centration of potassium and magnesium compared to other large saline lakes isunfavorable for hydrobionts. Potassium and magnesium are toxic to organisms buttheir toxicity is weakened by calcium and sodium. The abundance of planktoniccrustaceans is largely controlled by the concentrations of these ions in the EasternBalkhash. It decreases with increasing K+/Na+ and K+/Ca2+ ratios.Daphnia galeatais the most resistant to higher potassium concentrations among the dominant species(Krupa et al. 2008).
5.5.2.3 Zoobenthos
The original zoobenthos of Lake Balkhash initially had a very poor species composi-tion,mainly represented by larvae of terrestrial insects, especially chironomids (morethan 30 forms), dragonflies, mayflies, stoneflies, caddisflies and oligochaete worms(Abrosov 1973; Karpevich 1975). Gastropods, bivalves and malacostraca (shrimpsand amphipods) were also relatively abundant members of the native benthic fauna.
Oligochaetes are widespread in the lake. Nine species were recorded: Potamoth-rix hammoniensis, P. bavaricus, Limnodrilus profundicola, L. hoffmeisteri, Tubifextubifex, Uncinais uncinata, Nais pardalis, Spirosperma ferox and Stylaria lacustris(Abrosov 1973). Leeches are represented by the three species Piscicola geome-tra, Protoclepsis meyeri and Glossiphonia complanata (Abrosov 1973). The free-living nematodes of Lake Balkhash did not receive proper studies and also only fewinformation was gathered with respect to aquatic mites (Abrosov 1973).
The native mollusks included only freshwater species. The most common specieswere the bivalve Pisidium henslowanum and the gastropods Valvata piscinalis andPlanorbis planorbis in the past, but their biomass is low today and their presencelimited to the shallow fresher areas of the lake and the proximity of the river mouths(Samonov 1966; Karpevich 1975). Pisidium henslowanum is the only native bivalvein LakeBalkhash, but the native gastropods include the pond snailLimnaea stagnalis,Radix auricularia, R. ovata andGalba truncatula, the ramshorn snailGyraulus albus,and the lake limpet Acroloxus lacustris in addition to the predominating V. piscinalisand P. planorbis (Fig. 5.9).19
Today, crustaceans are mostly represented by the shrimp Palaemon superbus andtwo species of amphipods—Rivulogammarus lacustris and, in Western Balkhash,Dikerogammarus haemobaphes.
19A number of researchers reported the presence of the gastropod Bithynia caerulans, but thisendemic gastropod became apparently extinct (Zhadin 1952; Tyutenkov 1959).

168 R. Sala et al.
Ostracods are represented by the six species Ilyocypris sp., Neglecandonaneglecta, Candona sp., Darwinula stevensoni, Cyprideis torosa and Limnocytheredubiosa (Abrosov 1973). However, this list might be incomplete as crustaceans havebeen insufficiently investigated.
In 1953–1966, several species of invertebrates were introduced from the Caspianand the Azov seas as valuable food for fishes. The anellid polychaetesHypania inval-ida and Hypaniola kowalevski, the bivalve mollusk Monodacna colorata, and thecrustacean amphipod Corophium curvispinum and mysids (shrimp-like crustaceans)Paramysis lacustris, P. intermedia, P. ullskyi and P. baeri were naturalized. In addi-tion to these intentional introductions, the freshwater bivalves Anodonta cygnea andA. cellensis were accidentally introduced together with the zander fish from the UralRiver in 1957–1958 because their glochidia larvaewere on the gills of fish (Karpevich1975).
Since 1996, the zoobenthos biomass began to increase sharply as a resultof the explosive development of the bivalve Monodacna colorata which is nowunderutilized by benthophagous fishes.
A total of 93 native and introduced invertebrate species are recorded for today’smacro-zoobenthos of Lake Balkhash. During 2009–2013, the main taxonomic grouprepresented native larval and adult insects including the large native larval chirono-midsChironomus salinarius andC.plumosus, followedby introduced representativesof the Ponto-Caspian fauna.
The composition of the benthic fauna differs significantly in the Western andEastern Balkhash due to the different salinity levels. Species diversity is lower in themore saline Eastern Balkhash, and the amphipod Dikerogammarus haemobaphesand some native and introduced freshwater mollusks such as Monodacna coloratado not occur anymore. With the exception of chironomids and other Diptera, insectsare also less diverse in the Eastern Balkhash. Moving from West to East, mysidswhich are sensitive towater pollution and sometimes used as bioindicators tomonitorwater quality, progressively disappear. At first, Paramysis baeri disappears, then P.lacustris, further East in the lake follows P. ullsky, and finally P. intermedia whichis not found in the easternmost part of the lake anymore (Alekin 1984).
5.5.2.4 Ichthyofauna
The ichthyofauna of Lake Balkhash has been intensively manipulated during thetwentieth century with the introduction of species from other hydrological basins ofthe Soviet Union. Introductions caused major changes in the dominating species,replacing native ones by imported taxa. In general, the fish-species diversitydecreased, and benefits of the substitution of native species by alien species on thepotential total catch are doubtful (Mitrofanov and Petr 1999).
The modern ichthyofauna of Lake Balkhash includes 26 species. The Balkhashmarinka Schizothorax argentatus, the Ili marinka Sch. pseudaksaiensis pseudak-saiensis, the Balkhash perch Perca schrenkii, the spotted stone loach Triplophysastrauchi, the plain thicklip loach Barbatula labiata and the Balkhash minnow

5 Geological History and Present Conditions of Lake Balkhash 169
Lagowskiella poljakowi are native.20 All other fishes are recent introductions orinvaders.
Commercially valuable among native fishes are the Balkhashmarinka, Ili marinkaand Balkhash perch (Abrosov 1973; Karpevich 1975). The Balkhash marinka main-tained commercial value and was found throughout the lake until the mid-1960s; butit is now, together with spotted stone loach, absent in the lake and only remaining insome rivers. The Balkhash perch is now found in small numbers, occurring only inthe deltaic lakes of the Ili River, in some bays of Lake Balkhash, and in the AyaguzRiver (Mamilov et al. 2013).
The ichthyofauna of the Balkhash and of the rivers of the basin was enhanced by22 fish species during the twentieth century as a result of human activities, intention-ally introduced or incidentally brought in together with intentionally introduced fish(Karpevich 1975).
• The first invader was the carp Cyprinus carpio. Originally (1905), it entered acci-dentally into the Ili River from a fish pond and then appeared in the lake. By theend of the 1920s, it became the main commercial species of the Balkhash.
• The Siberian dace Leuciscus leuciscus is also an auto-acclimatizant. It was initiallybrought into the Ayaguz River where it was discovered in 1928, and it appearedin the lake in 1950.
• In 1931, the Aral barbel Barbus brachycephalus was brought from the Syr Daryainto the Ili from where it soon penetrated and settled into the lake (Karpevich1975). The Aral barbel is currently not found in the lake anymore (Mamilov et al.2013).
• In 1933–1934, the ship sturgeon Acipenser nudiventris was introduced from theAral Sea. It became one of the widespread commercial species prior to the con-struction of the Kapchagai Reservoir (Karpevich 1975), but it is relatively raretoday (Mamilov et al. 2013).
• In 1948, the tench Tinca tinca, although not recommended for introduction, wasbrought from the Zaisan Lake into the Ili River Basin.
• In 1949, the eastern bream Abramis brama orientalis (also not recommended) wasintroduced from the Syr Darya. It became a mass and commercial species. It is afood competitor of carp and marinka.
• In 1954, the Prussian carp Carassius auratus gibelio (also not recommended) wasreleased into Karatal River and it then entered and settled in the lake, becoming acommercial species (Karpevich 1975).
• In 1957–1958, the zander Sander luciopercawas introduced as the first fish speciesrecommended for acclimatization.
• Together with the zander, the predators wels Silurus glanis, asp Aspius aspiusand the Volga zander Sander volgensis were accidentally also brought. Theyacclimatized successfully and became commercial fish species.
• In 1958 and in 1962, the recommended herbivorous grass carp Cthenopharhyn-godon idella was introduced. This fish settled across the lake and penetrated intorivers, mostly in their deltas overgrown with aquatic vegetation (Karpevich 1975).
20The Ili marinka, Balkhash perch and spotted stone loach are endemics of Balkhash-Alakol Basin.

170 R. Sala et al.
• Together with the grass carp, a coarse fish, the Chinese freshwater sleeperMicrop-ercops cinctus, was brought into Balkhash (Seleznev 1974; Karpevich 1975;Reshetnikov 2010).
• In 1965, the not recommended voblaRutilus caspicus and the Talas dace Leuciscuslindbergi were introduced accidentally.
5.5.3 Development of Fishery in Lake Balkhash Duringthe Last 100 Years
Fisheries in Lake Balkhash developed in the early 1930s with the introduction ofallochthonous species and the organization of collective fishing brigades. Catches,negligible during the 1920s (68–106 tons per year), soon increased and reached14,650 tons in 1932, with common carp (Cyprinus carpio, accidentally introducedin 1905) accounting for 58–86% of the catch and the native perch and marinka for4–30%, varying over the years.
During the 1940s and 1950s, following a natural reduction of the lake level andthe lake’s productivity, the average annual capture decreased by 40%. It recoveredand reached former high numbers by the early 1960s. Then, the introduced commoncarp represented 76% of the total catch, native species such as perch and marinka 12and 11%, respectively, and the freshwater bream the remaining 1%.
The building of the Kapchagai Reservoir (1970–1986) did not significantly affectthe total catch but it changed the natural cycle of re-occurring spring floods. Thehydrological regime of the Ili River was especially altered during the filling of thereservoir, and spawning and feeding areas of the commercially valuable Cyprinuscarpio were reduced. Its populations consequently shrank by more than 90% andits yearly catch decreased from 12,000 to less than 2000 tons without recovery tohigh levels afterwards. The loss in catch of Cyprinus carpio was compensated by ahigher catch of the freshwater bream which is a very adaptable and competitive butless valuable cyprinid. Its harvest grew from 100 to 8000 tons per year over the sameperiod (Pueppke et al. 2018).
A clear drop of the annual catch accompanied the economical crisis that fol-lowed the end of the Soviet regime, attributed to several factors: (1) the decreaseof lake productivity and reduction of spawning areas provoked by non-compliancewith discharge schedules from the Kapchagai Reservoir; (2) the uncontrolled over-exploitation of the fish stocks; and possibly (3) unregistered and unofficial catchesby recreational trophy fishing. The re-establishment of controls and regulations tem-porarily improved the situation and the total catch recovered to 12,000 tons per yearbetween 2002 and 2006. Afterwards, it fell again and the decline continued in mostrecent years. Between 2010 and 2017, the fish harvest decreased by 17%, mainly asa result of lower catches of the most valuable species (Pueppke et al. 2018).
5 Geological History and Present Conditions of Lake Balkhash 171
5.6 Outlook
Lake Balkhash is facing serious risks in the near future totally depending on thecollective will and decisions of the responsible agencies in Kazakhstan and China.
The most disastrous scenario would be an increase of the total water withdrawalfrom tributary rivers by 9 km3, which would cause a lake-level drop to below 336 masl and the division of Lake Balkhash in three to six different and partly dry basinsand unbearable levels of salinization in the remaining water bodies.
Intermediate levels of water subtraction would also induce serious stress to thelake’s ecosystem because the related increase of water salinity would restructurethe ecological communities and deteriorate the reproduction conditions of aquaticorganisms. The total gross production of phytoplankton, zooplankton and zoobenthoswould be reduced (Krupa et al. 2013), and the overall decline in trophic state wouldhave a devastating impact on the fish productivity of the lake.
Additionalwaterwithdrawal from the IliRiver andnon-compliancewith dischargeschedule from the Kapchagai Reservoir would inevitably affect the fish spawningareas. In the fresher western part of the lake, spawning areas would move followingthe retreat of the water, but in the eastern part, they would be reduced to the estu-arine freshwater areas of the Karatal and Lepsy rivers with increasing lake-watermineralization.
The degradation of Lake Balkhash’s ecosystem would favor the development ofnon-commercial and low-value fish species, while the number of fast-growing formsof carp, bream, asp and other commercial species would rapidly decline. As a result,fish resources of the lake would rapidly decline.
The water deficit will also lead to the degradation of the Ili River Delta (Dostayet al. 2012), which will lose most of its value for fishery. Shoaling and swampingof deltaic water bodies would be accompanied by overgrowth of tough vegetation,salinization and increasing concentration of humic acids with detrimental effects onthe development of fish and other aquatic organisms.
Acknowledgements The study of Lake Balkhash in the frame of the “Ili Project” (2007–2012) wasfunded by theResearch Institute forHumanity andNature (Kyoto), Japan. Thework ofNVAand ISPwas supported by the theme of the State assignment for 2019–2021 “AAAA-A19-119020690091-0: Studies of biological diversity and the mechanisms of the impact of anthropogenic and naturalfactors on the structural and functional organization of ecosystems of continental water bodies.Systematization of the biodiversity of salt lakes and brackish-water inland seas in the zone ofcritical salinity, study of the role of brackish-water species in ecosystems”.
References
Abdrasilov SA (1996) Formirovanie i dinamika vnutrikontinental’nykh delt (na primere reki Ilii ozera Balkhash) [Formation and dynamics of intracontinental deltas (on the example of theRiver Ili and Balkhash Lake)]. Doctorate dissertation, Almaty: Institute of Geography, 39p. (in

172 R. Sala et al.
Russian) Available online: http://earthpapers.net/formirovanie-i-dinamika-vnutrikontinentalnyh-delt-na-primere-reki-ili-i-ozera-balhash
Abrosov VN (1973) Ozero Balkhash [Lake Balkhash]. Leningrad, Nauka (in Russian)Akhmedsafin UM, Dzhabasov MK, Oshlakov GG (1973) Southern-Pribalkhashski artesian basin.In: Formation and hydrodynamics of artesian waters of Southern Kazakhstan. Alma-Ata, Nauka,18–22 (inRussian) Translated in English and re-published online at the Econetwebsite (UNESCOCentral Asia and Institute of Hydrogeology and Hydrophysics of the Ministry of Science andHigher Education of the Republic of Kazakhstan) at http://www.water.unesco.kz/bal_ch_5_e.htm
Aladin NV, Plotnikov IS (1993) Large saline lakes of former USSR: a summary review.Hydrobiologia 267:1–12
AlekinOA (ed) (1984) Prirodnye resursy bol’shikh ozer SSSR i veroyatnye ikh izmeneniya [Naturalresources of large lakes of the USSR and their probable changes]. Leningrad, Nauka (in Russian)
Atlas Kazakhskoi SSR (1982) T.1 Prirodnye usloviya i resursy [Atlas of Kazakh SSR. T.1 Naturalconditions and resources]. Moscow, p 59 (in Russian)
Aubekerov B, Koshkin V, Sala R, Nigmatova S, Deom JM (2009a) Prehistorical andhistorical stages of development of lake Balkhash. In: Watanabe M, Kubota J (eds)Reconceptualizing cultural and environmental change in Central Asia. RIHN, Kyoto, pp49–76. Available online: http://www.chikyu.ac.jp/ilipro/page/18-publication/workshop-book/workshop-book_individual%20files/2-1_Aubekerov.pdf
Aubekerov BZ, Nigmatova SA, Sala R, Deom JM, Endo K, Haraguchi T (2009b) Complex analysisof the development of the Balkhash lake during the last 2000 years. In: Watanabe M, Kubota J(eds) Reconceptualizing cultural and environmental change in Central Asia. RIHN, Kyoto, pp77–92
Aubekerov BZ, Yerofeeva IV, Sala R, Nigmatova SA, Deom JM (2010) Geoarkheologicheskoeizuchenie ozera Balkhash kak geograficheskogo tsentra kochevykh kultur Kazahstana [Geoar-chaeological studies of the Balkhash Lake as geographical centre of nomadic culture of Kaza-khstan]. In: Rol’ nomadov v formirovanii kul’turnogo naslediya Kazakhstana. Nauchnyye cht-eniya pamyati N.E. Masanova. Sbornik materialovMezhdunarodnaya nauchhnaya konferentsiya[Role of the nomads in shaping the cultural heritage of Kazakhstan. Scientific readings in mem-ory of NE Masanov. International scientific conference material collection]. Almaty: Print-S, pp37–45 (in Russian)
Barinova S, Krupa E, Kadyrova U (2017) Spatial dynamics of species richness of phytoplankton ofLake Balkhash (Kazakhstan) in the gradient of abiotic factors. Transylvanian Rev SystematicalEcol Res 19(2):1–18
Berg LS (1904) Predvaritel’nyy otchet ob issledovanii ozera Balkhash letom 1903 g. [Prelim-inary report on research of the Balkhash lake during summer 1903]. Izvestiya Russkogogeograficheskogo obshchestva 40(4) (in Russian)
Bolch T (2015) Glacier area and mass changes since 1964 in Ala Archa Valley, Kyrgyz Ala-Too,northern Tien Shan. Led i Sneg [Snow and Ice] 1(129):28–39
Chen F, Yu Z, Yang M, Ito E, Wang S, Madsen DB, Huang X, Zhao Y, Sato T, Birks HJB, BoomerI (2008) Holocene moisture evolution in arid central Asia and its out-of-phase relationship withAsian monsoon history. Quat Sci Rev 27(3–4):351–364
Chiba T, Endo K, Sugai T, Haraguchi T, Kondo R, Kubota J (2016) Reconstruction of LakeBalkhash levels and precipitation/evaporation changes during the last 2000 years from fossildiatom assemblages. Quat Int 197:330–341
Deom JM, Sala R, Laudisoit A (2019) The Ili River Delta: Holocene Hydrogeological Evolutionand Human colonization. In: Yang LE, Bork H-R, Fang X, Mischke S (eds) Socio-EnvironmentalDynamics along the Historical Silk Road. Springer, pp 69–97
Dostay ZD (2009) Upravlenie ghidroekosistemoy basseyna ozera Balkhash [Management of thehydro-ecosystem of the lake Balkhash basin]. Almaty (in Russian)
Dostay Z, Alimkulov A, Tursunova A, Myrzakhmetov A (2012) Modern hydrological status of theestuary of Ili river. Appl Water Sci 2:227–233

5 Geological History and Present Conditions of Lake Balkhash 173
Dzhurkashev TN (1964) ProlivUzunaral i nekotorye noveishei istorii ozera Balkhash [TheUzunaralstrait and some questions about the recent history of the Balkhash lake]. Izvestiya, AN Kaz SSR,Geological Series, vol 4 (in Russian)
Dzhurkashev TN (1972) Antropogenovaya istoriya Balhash-Alakolskoi vpadiny [The anthro-pogenic history of the Balkhash-Alakol depression]. Alma-Ata, Nauka (in Russian)
Endo K, Chiba T, Sugai T, Haraguchi T, Yamazaki H, Nakayama Y, Yoshinaga Y, Miyata K, OginoS, Arakawa K, Nakao Y, Komori J, Kondo R, Matsuoka H, Aubekerov BZ, Sala R, Deom JM,Sohma H, Kubota J (2010) Reconstruction of lake level and paleoenvironmental changes from acore fromBalkhash lake, Kazakhstan. In:WatanabeM,Kubota J (eds) Reconceptualizing culturaland environmental change in Central Asia, Kyoto, RIHN, pp 93–104
Endo K, Sugai T, Haraguchi T, Chiba T, Kondo R, Nakao Y, Nakayama Y, Suzuki S, Shimizu I, SatoA, Montani I, Yamasaki I, Matsuoka H, Yoshinaga Y, Miyata K, Minami Y, Komori J, Hara Y,Nakamura A, Kubo N, Sohma I, Deom J-M, Sala R, Nigmatova SA, Aubekerov BZ (2012) Lakelevel change and environmental evolution during the last 8000 years mainly based on BalkhashLake cores in Kazakhstan, Central Eurasia. In: Kubota J, Watanabe M (eds) Toward a sustainablesociety in Central Asia: An historical perspective on the future. RIHN, Kyoto, pp 35–48
Feng ZD, Wu HN, Zhang CJ, Ran M, Sun AZ (2013) Bioclimatic change of the past 2500 yearswithin the Balkhash Basin, eastern Kazakhstan, Central Asia. Quat Int 311:63–70
Hill DJ (2018) Climate Change and the Rise of the Central Asian Silk Roads. In: Yang LE, BorkH-R, Fang X, Mischke S (eds) Socio-Environmental Dynamics along the Historical Silk Road.Springer, pp 69–97
Karpevich AF (1975) Teoriya i praktika akklimatizatsii vodnykh organizmov [Theory and practiceof aquatic organisms acclimatization]. Moscow: Pischevaya promyshlennost (in Russian)
Kezer K, Matsuyama H (2006) Decrease of river runoff in the Lake Balkhash basin in Central Asia.Hydrol Proc Int J 20(6):1407–1423
Khrustalev YP, Chernousov YG (1992) K golotsenovoi istorii razvitiya ozera Balkhash [On theHolocene history of the Balkhash lake]. Izvestia Russ Geogr Soc 124(2):164–171 (in Russian)
Kostenko NN (1946) K istorii Balkhasha [About the Balkhash history]. Izvestiya Kaz fil AN SSSR,ser. Geologiya [News of the Kazakh Filial of Academy of science SSSR] 8(26):96–104 (inRussian)
KrupaEG,StugeTS,LoparevaTY,ShaukharbaevaDS (2008)Distributionof planktonic crustaceansin Lake Balkhash in relation to environmental factors. J Inland Water Biol 1(2):150–157
Krupa EG, Tsoy VN, Lopareva TY, Ponomareva LP, Anureva AN, Sadyrbaeva NN, AssylbekovaSZ, Isbekov KB (2013) Mnogoletnyaya dinamika gidrobiontov ozera Balkhash i ee svyaz sfaktorami sredy [Long-term dynamics of hydrobionts in Lake Balkhash and its connection withenvironmental factors]. Vestnik AGTU Ser Rybnoe Khoz 2:85–96 (in Russian)
Krupa EG, Barinova SS, Tsoy VN, Sadyrbaeva NN (2017) Formirovaniye fitoplanktona ozeraBalkhash (Kazakhstan) pod vliyaniyem osnovnykh regional’noklimaticheskikh faktorov [For-mation of phytoplankton of lake Balkhash (Kazakhstan) under the influence of major regional-climatic factors]. Adv Biol Earth Sci 2(2):204–213 (in Russian)
Krylov S, Nurgaliyev DK, Yasonov PG (2014) Ob istorii razvitiya ozera Balkhash (Kaza-khstan) po seysmoakusticheskim dannym [History of the Balkhash lake development based onseismo-acoustic data. Uchenye zapiski Kazanskogo universiteta [Scientific reports of the KazanUniversity], Nat Sci 156(1):128–136 (in Russian)
Kurdin RD (1976) O vekovykh kolebaniyakh urovnya vody krupnykh yestestvennykh vodoyemovKazakhstana i Sredney Azii [About the secular water level fluctuations of large natural basinsof Kazakhstan and Central Asia]. In: Trudy IV Vsesoyuz. gidrol. s”yezda [Works of the IV allUnion Hydrological summit], T.5. Gidrometeoizdat, Leningrad, pp 98–107 (in Russian)
KurdyukovKV (1958) K geologicheskomu razvitiyu Pribalkashya v pozdnem kainozoe [About thegeological development of the Pre-Balkhash during late Cenozoic]. BMOIP, New Series, seriesGeology 33(3) (in Russian)
Maksimov EV (1961) Stadialnyi kharakter otstupaniya vyurmskikh lednikov v DzhungarskomAlatau i v nekotorykh drugikh gornykh sistemakh Azii. [Stadial character of melting of Wurm

174 R. Sala et al.
glaciers in the Jungarian Alatau and some other Asian mountain systems]. Doklady AN SSSR[Reports of the Academy of Sciences SSSR], 136(1) (in Russian)
Mamilov NS, Balabieva GK, Mitrofanov IV (2013) Problemy sokhraneniya aborigennoy ikhtio-fauny Ili-Balkhashskogo basseina [Problems of preservation of aboriginal ichthyofauna in Ili-Balkhash basin] (in Russian). Published online by Green Salvation: http://esgrs.org/wp-content/uploads/2015/01/2011fishMamilov.pdf. Accessed 17 May 2018
Mischke S, Zhang CJ, Plessen B (2020) Lake Balkhash (Kazakhstan): Recent human impact andnatural variability in the last 2900 years. J Great Lakes Res 46:267–276
Mitrofanov VP, Petr T (1999) Fish and fisheries in the Altai, Northern Tien Shan and Lake Balkhash(Kazakhstan). Fish and fisheries at higher altitudes: Asia. Rome: FAO Fisheries Technical Paper,vol 385, pp 149–167
Myrzakhmetov A, Dostay Z, Alimkulov S, Madibekov A (2017) Level regime of Balkhash Lakeas the indicator of the state of the environmental ecosystems of the region. Int J Adv Res Sci EngTechnol 4(9):4554–4563
Propastin P (2012) Patterns of Lake Balkhash water level changes and their climatic correlatesduring 1992–2010 period. Lakes Reservoirs Res Manag 17(3):161–169
Propastin P (2013) Assessment of climate and human induced disaster risk over shared waterresources in the Balkhash Lake drainage basin. In: Climate change and disaster risk management.Springer, Berlin, Heidelberg, pp 41–54
Pueppke SG, IklasovMK, Beckmann V, Nurtazin ST, Thevs N, Sharakhmetov S, Hoshino B (2018)Challenges for sustainable use of the fish resources from Lake Balkhash, a fragile lake in an aridecosystem. Sustainability 10(4):1234
Reshetnikov AN (2010) The current range of Amur sleeper Perccottus glenii Dybowski, 1877(Odontobutidae, Pisces) in Eurasia. Russ J Biol Invasions 1(2):119–126. https://doi.org/10.1134/S2075111710020116
RusakovMP (1933) Geologicheskii ocherk Pribalkhashiya i ozero Balkhash, poleznye iskopaemyeraiona [Geological treatise concerning the Pre-Balkhash region and Balkhash Lake, mineralresources district]. Moscow, Leningrad: Tsvetmetizdat (in Russian)
Rylov VM (1933) K svedeniyam o planktone ozera Balkhash [Information on the Lake Balkhashzooplankton]. Issledovaniya ozer SSSR 4:57–70 (in Russian)
Saduakasova RE (1972) Zooplankton ozera Balkhash [Zooplankton of Lake Balkhash]. Rybnyeresursy vodoemov Kazakhstana i ih ispolzovaniye 7:97–100 (in Russian)
Sala R, Deom JM, Nigmatova S, Endo K, Kubota J (2016) Soviet, recent and planned studies of thebehavior of the Balkhash lake. News of the Academy of Sciences of the Republic of Kazakhstan.Series of Geology and Technical Sciences 2(416):76–86
Samonov AM (1966) Molluski ozera Balkhash [Mollusks of Lake Balkhash]. In: Biologicheskieosnovy rybnogo khozyaistva na vodoemah Sredney Azii i Kazakhstana, pp 131–144 (in Russian)
Sapozhnikov DG (1951) Sovremennye osadki i geologiya ozera Balkhash [Balkhash Modern sedi-ments and geology of Lake Balkhash]. Trudy Inst Geol Nauk [Works of the Institute of GeologicalSciences] (132) Moscow, AN SSSR (in Russian)
Seleznev VV (1974) Malotsennyye i sornyye vidy ryb kitayskogo kompleksa v Kapchagayskomvodokhranilishche [Low-value and coarse fish species of Chinese complex in the KapchagaiReservoir]. Rybnye resursy vodoemov Kazakhstana i ikh ispolzovanie. 8:143–148 (in Russian)
Semenov VA, Kurdin RD (eds) (1970) Resursy poverkhnostnykh vod SSSR. Tsentral’nyi i yuzhnyiKazakhstan. Vypusk. 2. Bassein oz. Balkhash [Surface water resources SSSR, vol 13. Centraland South Kazakhstan. Issue 2. Balkhash lake basin]. Leningrad: Gydrometeoizdat (in Russian)
Sevastyanov DV (ed) (1991) Istoriya ozer Sevan, Issyk-Kul’, Balkhash, Zaysan i Aral [History ofthe lakes Sevan, Issyk-Kul, Balkhash, Zaisan and Aral]. Leningrad, Nauka (in Russian)
Severskiy I, Vilesov E, Armstrong R, Kokarev A, Kogutenko L, Usmanova Z, Morozova V, RaupB (2016) Changes in glaciation of the Balkhash-Alakol basin, Central Asia, over recent decades.Ann Glaciol 57(71):382–394
Shaporenko SI (1995) Balkhash Lake. In: Mandych AF (ed) Enclosed Seas and Large Lakes ofEastern Europe and Middle Asia. SPB Academic Publisher, Amsterdam, pp 155–197

5 Geological History and Present Conditions of Lake Balkhash 175
Shnitnikov AV (1957) Izmenchivost’ obshchey uvlazhnennosti materikov Severnogo polushariya[Variability of total moisture of the Northern Hemisphere]. Zapis Vsesoyuz Geograficheskoiobschestva, new series 16 (in Russian)
Shnitnikov AV (1973) Water balance variability of lakes Aral, Balkhash, Issyk-Kul and Chany.In: Proceedings of the International Symposim on the Hydrology of Lakes, Helsinki. IAHSPublication 109:130–140. https://iahs.info/uploads/dms/iahs_109_0130pdf
Smolyar VA, Mustafaev S (2007) Gidrogeologiya basseyna ozera Balkhash [Hydrogeology of thebasin of Balkhash lake]. Almaty (in Russian)
Solomina O, Alverson K (2004) High latitude Eurasian paleoenvironments: introduction andsynthesis. Palaeogeogr Palaeoclimatol Palaeoecol 209(1–4):1–18
Sugai T, Montani H, Endo K, Haraguchi T, Shimizu H, Chiba T, Reisuke K (2011) Holocene envi-ronment changes in Lake Balkhash reconstructed by high-resolution XRF core analysis and geo-morphic survey. Japan Geoscience Union Meeting. http://www2.jpgu.org/meeting/2011/yokou/HQR023-17_E.pdf
TarasovMN (1961) Gidrochimiya ozera Balkhash [Hydrochemistry of Balkhash lake]. Moscow (inRussian)
ThevsN,NurtazinS,BeckmannV,SalmyrzauliR,KhalilA (2017)Water consumptionof agricultureand natural ecosystems along the Ili River in China and Kazakhstan. Water 9(3):207
Tursunov AA (2002) Ot Arala do Lobnora. Gidroekologiya besstochnykh basseinov TsentralnoiAzii [From the Aral to the Lob Nor. Hydroecology of inland basins of Central Asia]. Almaty, pp238–253 (in Russian)
Tyutenkov SK (1959) Bentos ozera Blakhash i ego znachenie v pitanii ryb [Benthos of LakeBalkhash and its importance in the diet of fish]. Sbornik rabot po ikhtiologii i gidrobiologii2:45–79 (in Russian)
Venus BG (1985) Osobennosti razvitiya ozernykh kotlovin v gummidnoy i aridnoy zone [Particu-larities of the development of lacustrine depressions in humid and arid zones]. In: Martison GG(ed) Paleolimnologiya ozer v aridnykh i gumidnykh usloviyakh [Paleolimnology of lakes in aridand humid zones]. Leningrad, Nauka, pp 5–29 (in Russian)
WatanabeM,Kubota J (eds) (2010)Reconceptualizing cultural and environmental change inCentralAsia. RIHN, Kyoto
Xu JL, Liu SY, Guo WQ, Zhang Z, Wei JF, Feng T (2015) Glacial area changes in the Ili Rivercatchment (Northeastern Tian Shan) in Xinjiang, China, from the 1960s to 2009. Adv Meteorol2015:(847257)
Zhadin VI (1952) Molluski presnykh i solonovatykh vod SSSR [Mollusks of fresh and brackishwaters of the USSR]. Moscow, Leningrad, AN SSSR (in Russian)

Chapter 6Lake Issyk-Kul: Its History and PresentState
Andrei O. Podrezov, Ari J. Mäkelä and Steffen Mischke
Abstract Lake Issyk-Kul in Kyrgyzstan is one of the deepest and largest mountainlakes of theworld. The closed-basin lake is slightly brackish andwaters are dominatedby sodium, and chlorite and sulphate.Although large tourism resorts andmany campswithout appropriate sanitary facilities were established on Lake Issyk-Kul’s shoresafter the Soviet era, the lake is still oligotrophic with high concentrations of dissolvedoxygen down to its great depths. The large volumeof the lake in comparison to surfaceand groundwater inflows inhibitedmajor reductions of thewater quality in the centraland deep part of the lake so far. However, decreasing lake levels since the beginningof systematic observations in the year 1927, contamination of littoral waters due toinefficient or lacking wastewater treatment, and the influx of fertilizers and pesticidesfrom farmlands on the lakeshore plain are major concerns for sustaining the fragileecosystem of Lake Issyk-Kul during times of ongoing global warming and economicdevelopment in the region.
Keywords Brackish water · Mountain lake · Lake depth · Lake mixing · Pollution
A. O. PodrezovDepartment of Meteorology, Ecology and Environmental Protection, Kyrgyz-Russian SlavicUniversity, 6 Chui Ave., 720000 Bishkek, Kyrgyzstane-mail: [email protected]
A. J. Mäkelä (B)Finnish Environment Institute, Freshwater Centre, Latokartanonkaari 11, 00790 Helsinki, Finlande-mail: [email protected]
S. MischkeUniversity of Iceland, Institute of Earth Sciences, Sturlugata 7, 101 Reykjavík, Icelande-mail: [email protected]
© Springer Nature Switzerland AG 2020S. Mischke (ed.), Large Asian Lakes in a Changing World, Springer Water,https://doi.org/10.1007/978-3-030-42254-7_6
177

178 A. O. Podrezov et al.
6.1 General Information About Lake Issyk-Kul and ItsBasin
6.1.1 Geographical Characteristics of the Issyk-Kul Basin
Lake Issyk-Kul is a closed-basin lake in Kyrgyzstan, Central Asia (Fig. 6.1). It is theseventh deepest lake in the world and the tenth largest lake in the world by volume(Table 6.1). The lake fills a fault-controlled intramontane basin which resulted fromfar-field effects of the Cenozoic India-Eurasia collision on the reactivated tectonics ofthe northern Tien ShanMountain range. Lake sediments were probably accumulatedin the basin duringmost of theMiocene and Pliocene, although the lake in its modernform possibly exists since the middle Pleistocene (Trofimov 1990). The catchmentarea of Lake Issyk-Kul covers 22,080 km2 at moderate altitude in the northern TienShan. The main mountain chains surrounding the basin are the Terskei Ala-Too(also Terskey Alatau) in the south and the Kungei Ala-Too (also Küngöy Ala-Tooor Kungey Alatau) in the north which have highest peaks at 5216 m and 4770 m,respectively (Fig. 6.2). Mean elevations are 4300 m and 4200 m, respectively. At analtitude of ca. 2 km, the Issyk-Kul Basin has relatively low mountain bulkheads atits western (Boom Gorge) and eastern (Santash Passage) ends. The lowest parts ofbulkheads have the form of narrow wind gorges. The rivers Chu (also Chui or Chuy)and Tyup flow through these gorges that prevent free air exchange with surroundingregions.
The current water level of Lake Issyk-Kul lies at ca. 1606 m above sea level.The lake’s surface-water area is 6236 km2 (28% of drainage basin) and the lengthof its shoreline is 688 km (Table 6.1). The average sounding depth is 278 m and thedeepest point reaches 668 m below the lake surface. In total, the lake-water volumeis 1738 km3 with comparatively little annual variation.
Fig. 6.1 Location of Lake Issyk-Kul (red arrow) in Central Asia

6 Lake Issyk-Kul: Its History and Present State 179
Table 6.1 Main characteristics of Lake Issyk-Kul
Parameter Data Source
Catchment area 22,080 km2 Lyons et al. 2001
Lake area 6236 km2 Lyons et al. 2001
Volume 1738 km3 Lyons et al. 2001
Altitude 1606 m Vollmer et al. (2002)
Mean depth 278 m Lyons et al. 2001
Maximum depth 668 m Lyons et al. 2001
pH 8.00–8.75 Giralt et al. (2004)
Surface water temperaturerange
2 °C (January) to 20 °C (July) Giralt et al. (2004)
Secchi depth in open lake 15–20 m (up to 53 m) Romanovsky and Shabunin(2002)
Salinity ~6 g/kg Vollmer et al. (2002)
Major anions Cl− ≥ SO2−4 � HCO−
3 Lyons et al. 2001; Vollmeret al. (2002)
Major cations Na+ > Mg2+ > Ca2+ > K+ Lyons et al. 2001; Vollmeret al. (2002)
Fig. 6.2 Lake Issyk-Kul and its catchment area (white) in the Tien Shan Mountains. Letters marklocations mentioned in text: A Ananievo, B Barskoon, C Choktal, G Grigorievka, i Bosteri, KKyzyl-Choku Mountains, P Pokrov Gulf, S Kadji Sai, T Tamga, Y Chyrpykty, 8 Station 8
Five areas are differentiated in Lake Issyk-Kul due to specific geomorphologicalcharacteristics:
(1) The western terminus, the Balykchy Gulf, is relatively shallow with 0.5–30 mdepth and weakly indented coastline. The water is permanently affected by

180 A. O. Podrezov et al.
winds that cause full mixing and high contents of suspended particles and highturbidity.
(2) The northern coastline has relatively small bays which are not deeper than40–50 m. The most indented coastline here is the Cholpon-Ata Gulf (Fig. 6.2).
(3) The southern coastline includes large gulfs representing flooded river valleyswhich formed during lake-level lowstand periods in the past. The bays are morethan 50 m deep and morphologically separated from the lake basin.
(4) Less brackish estuary-like gulfs in the eastern part of the lake form a deeplyindented coastline with narrow backwater areas. The depth of Tyup Gulf is 35 mand those of Dzhergalan Gulf is 45 m. The submerged channels are 0.7–1.2 kmand ca. 2 km wide, and 52 km and 43 km long, respectively (Savvaitova andPetr 1992).
(5) The central part of the lake has a depth of 50–668 m and represents 95% of itsvolume.
The surface of Lake Issyk-Kul lies currently 14m below the ‘Kutemaldinsky Thresh-old’ (1620 m) which separates the lake from a potential outlet to the Chu River inthe west. Ancient shorelines at 1620, 1640 and 1660 m suggest that Lake Issyk-Kulexperienced significant lake-level rises, and that the outlet threshold must have beenhigher in the past (Rosenwinkel et al. 2017). The higher shorelines and submergedriver deltas and channels indicate that the lake level fluctuated above and below itspresent level in the past most likely in response to changing climate, tectonic andhydrological conditions.
6.1.2 Climate
The geographic situation of the Issyk-Kul Basin is unique in Kyrgyzstan with aspecific nature of climate conditions. The western Ulan and eastern Santash windsenter the basin through topographically low regions in thewest and east ofLake Issyk-Kul with velocities reaching 40 m/s (Podrezov 1985; Podrezov and Pavlova 2003).These winds are associated with the intrusion of Arctic air from the north. As a result,a unique nature phenomenon can occur: two wind channels with opposite directions.The western wind channel Ulan is typically more powerful; it covers the wholewestern basin plain and western part of the lake from Boom Gorge to Chyrpyktyvillage and sometimes as far east as to Cholpon-Ata at the central-northern shore(Fig. 6.2). The eastern wind channel, Santash, covers the eastern part of the basinfrom Santash Passage extending up to 10–20 km over the lake. The winds controlthe local climate by creating arid conditions in the western part of the basin wheremean annual precipitation is only slightly higher than 100 mm. Air moving fromwest to east over the 182 km long axis of the lake collects water due to evaporationfrom its surface, and then rises convectively or near the basin slopes to often formcumulonimbus (thunder) clouds. As a result, mean annual precipitation increasessignificantly up to 500–600 mm towards the east.

6 Lake Issyk-Kul: Its History and Present State 181
The deep and permanently unfrozen Lake Issyk-Kul (“Issyk-Kul” means “warmlake” in the Kyrgyz language) acts as a large local heat exchanger. It significantlymitigates temperature conditions in the basin in comparison to other regions far fromworld oceans and at similar altitude. Summer temperatures are relatively low andwinter temperatures relatively high resembling properties of marine climate.
The main feature of Issyk-Kul’s local climate specifics is the presence of differentclimate types within a relatively small region: (1) desert or semi-desert conditionswhich are common inCentralAsia, (2) alpine conditions supportingmountain forests,and (3)marine climate in a narrow lakeside zone. Such diversity of climate conditionsresults from the orographic isolation, the large altitudinal gradient and the presenceof a large and permanently unfrozen lake. There are four areas with clearly differenttemperature conditions, precipitation amounts and other meteorological parametersin the ca. 3100-km2 large lakeside-plain region.
Climate area 1: Thewestern part of the basin is the climatically most unfavourableregion. The precipitation is lowest in this area with mean annual amounts rangingfrom ca. 100–150 mm. Only a minor fraction, ca. 10 mm, arrives during the coldperiod of the year. In some years, there is no precipitation at all during the coldseason.
Climate area 2: The northern shore region forms a distinct climate zone betweenthe villages Chyrpykty and Ananievo, almost equivalent to the entire northern shore-line of the lake (Fig. 6.2). It receives more precipitation and wind speed is typicallylower, favouring agricultural development and land cultivation. Mean annual precip-itation is ca. 300–350 mm, with up to 50% occurring in June to August. A stablethin (<3 cm) snow cover usually forms by the end of November and remains for30–40 days. The average length of the frost-free season is about 180 days per year.The climate here is mild, without hot summers and with moderately cold winters.The most intense cloud coverage occurs during spring months, and the least occursin September.
Climate area 3: The eastern shoreline section differs climatically from the otherareas notably by the larger amount of precipitation. Mean annual precipitation is420–450 mm near the shoreline and up to 700–800 mm or even higher in the easternmountains.Winters typically bringmore snow than in other parts of the basin.A stablesnow cover usually forms by the end of October and prevails for about 110 days; itsaverage thickness achieves 18 cm by the beginning of February. The average durationof the frost-free period is about 145 days per year. The predominant wind comes fromthe east funnelled through the gap of the latitudinal intermountain valley between theKungei and Terskei Ala-Too mountain ranges. Western winds are rarely observedwith a frequency of less than 10%. The mean July temperature is ca. 16 °C. Theabsolute maximum temperature can be as high as 35 °C, and minimum temperaturesin winter decrease to −22 °C. The most dense cloud coverage occurs in spring fromMarch to June, and the least cloud cover exists in August and September.
Climate area 4: The fourth climate area is the southern shoreline region betweenthe Akterek River in the west and the Chon-Kyzyl-Suu River in the east. The cli-matic conditions are characterized by moderately cold winters, comparable to thosein the northern shoreline area, and relatively warm summers with typically higher

182 A. O. Podrezov et al.
precipitation in a range from 260 to 300 mm. In the area of Tamga resort, the annualrange of mean monthly temperatures is ca. 20 °C which is typical for a transitionalclimate between continental and marine conditions. The lake breeze and mountain-and-valley winds are predominant in this area. Winds often blow along the gorgestoward the lake basin or in the reversed direction. However, the average wind speedis low with ca. 2 m/s.
6.1.3 Glaciation in the Lake Catchment and River Runoff
The Issyk-Kul Basin includes 834 glaciers with total area of 650.4 km2 or 3% ofthe total catchment area. The glaciated area in the Issyk-Kul Basin represents 6.4%of total glaciated area of the Tien Shan. The glaciers are located at elevations of3000–5000 m.
Repeated aerosurveys showed that the area of 179 glaciers from 210 glaciers ofthe northern Tien Shan decreased during the period from 1943 to 1977 (Bakov 1983;Podrezov et al. 2001). During the same period, 28 glaciers were stable and three wereadvancing. The glaciation reduction intensified in recent years. The investigation of22 glaciers in the region between the rivers Tossor and Chon-Kyzyl-Suu revealed thatseven glaciers retreated 90–110 m, six glaciers 60–89 m and nine glaciers 25–59 m.
The number of rivers and temporary streams feeding Issyk-Kul is estimatedbetween 84 and 118. Of these, 30 rivers are permanent. Most rivers of the Issyk-Kul Basin are fed by snow and ice with highest runoff occurring in July. Meltwaterfrom snow and glaciers contributes ca. 30% to total annual runoff in the basin, andthe meltwater contribution can be as high as 61% during summer months. The north-facing slopes of the Terskei Ala-Too include ca. 80% of all glaciers in the catchmentof Lake Issyk-Kul. Thus, they generate the majority of glacial meltwater in the basin.Issyk-Kul’s largest tributary is the Dzhergalan (also Dzhirgalan, Jergalan, Jyrgalan,Djyrgalan)which drains its southeastern catchment area (Fig. 6.2). The second largestriver, the Tyup River, drains its northeastern catchment. A first flood period occursin spring due to snow melt, and a second period in summer as a result of meltwaterdischarge from glaciers. The flood season is dominated by snow melt, and highestdischarge is recorded in spring. Mean annual water discharge of the Dzhergalan andTyup rivers are 22.6 and 11.5 m3/s, corresponding to 0.71 and 0.36 km3, respectively.The two rivers contribute more than half of the total surface discharge to the lake.Runoff of the Dzhergalan and Tyup rivers together can be as high as 67.4 m3/s insummer, and as low as 9.4 m3/s in winter. The large runoff seasonality results fromaccelerated glacier melting during summer which was generally recorded for therivers of the Issyk-Kul Basin after 1972. For example, July discharges of Dzhuuku(also Zauka) and Ak-Suu rivers increased by 3.8 and 3.3 m3/s during 1973–1991in comparison to preceding years. As a result, mean annual discharge of the tworivers grew from 6.2 up to 7.0 m3/s for the Dzhuuku River and from 2.9 up to4.1 m3/s for the Ak-Suu River. Mean annual discharge of all rivers feeding LakeIssyk-Kul increased from 117 m3/s (3.69 km3/a) between 1935 and 1972 to 129 m3/s

6 Lake Issyk-Kul: Its History and Present State 183
(4.07 km3/a) between 1973 and 1991. This discharge increase is equivalent to a riseof direct precipitation onto the lake surface from an annual amount of 590 mm toas much as 650 mm if all incoming water was provided as direct precipitation. Thedischarge increase resulted from the melting of ca. 4 km3 of glacier ice which repre-sents a decrease of the catchment’s total ice volume by 8.3%. The timing of runoffmaxima changed accordingly. The snow-melt flood of the Tyup River shifted fromMay to April after 1972. With diminishing glacier ice resources, continuing climatewarming will lead to decreasing summer-water discharges of rivers. This threat ismore relevant for the southern slope of the Kungei Ala-Too mountain range whereglaciated regions are relatively small and where summer-water discharge to LakeIssyk-Kul will first decrease and will first impact the agricultural sector based onirrigated crop cultivation.
6.1.4 Landscapes in the Issyk-Kul Catchment, and TerrestrialFlora and Fauna
6.1.4.1 Landscapes
According to the geomorphologist E. K. Azykova, the Issyk-Kul catchment includessteppe landscape (1800–2500 m), forest-meadow-steppe landscape (1800–2900 m),subalpine-meadow and meadow-steppe landscapes (2900–3100 m), alpine-meadowandmeadow-steppe landscapes (3100–3400m), and highmountain tundra landscape(3400–4300 m; Azykova 1991). Due to the more pronounced dryness in the west ofthe basin, desert landscape exists on the lakeside plains, followed by semi-desert andforestless meadow-steppe higher up. In contrast, forest-meadow-steppe is the lowestunit in the wetter eastern part of the basin. Thus, a transition from deserts to semi-deserts and steppe exists along the west-east oriented shorelines. Desert landscapeextents as far east as Choktal village on the northern shore of Lake Issyk-Kul and asfar as the Kyzyl-Choku Mountains in the south of the lake.
6.1.4.2 Flora
The low precipitation (130–150 mm per year) and high evaporation (>1000 mmper year) at the arid northwestern shoreline of the lake lead to the accumulationof carbonates and other salts in soils which are not frequently leached by percolat-ing water. As a result, halophilous (salsuginous) plants such as niterbush (Nitrariasibirica) and glasswort (Salicornia europaea) dominate. The vegetation is poor onthe hammadas in the western part of the Issyk-Kul Basin and represented by Reau-muria songarica, Sympegma regelii, Kalidium caspicum, Artemisia tianschanica,Stipa caucasica, Halimodendron and Achnatherum splendens. Sea-buckthorn (Hip-pophae rhamnoides), clematis (Clematis orientalis), rosehip (Rosa albertii), false

184 A. O. Podrezov et al.
tamarix (Myricaria alopecuroides) and reed (Phragmites communis) grow at thesemiarid northern shores of the lake, on sandy and pebbly beaches. Farther awayfrom the shoreline, sheep’s fescue (Festuca sulcata), tarragon (Artemisia dracuncu-lus), ziziphora (Ziziphora clinopodioides), sedge (Carex stenophylloides) and gum-succory (Chondrilla) grow on the sandy and pebbly Holocene lake terraces.Wild rut-tishness (Elymus), liquorice (Glycyrrhiza), thermopsis (Thermopsis) and bromegrass(Bromus) grow on sandy substrates of the higher parts of Holocene terraces.
The grassy meadows of the steppe regions on the lakeside plain are dominated byalpine bistort (Bistorta vivipara), astragalus (Astragalus tibetanus), bluegrass (Poa),tarragon (Artemisia dracunculus), hicory (Cichorium) and other weeds.
Spruce forests occupy one third of the forest-meadow-steppe belt with plantedspruce forests mostly growing in the lower part of this belt. The larger part of thisbelt is mostly covered by rosehip, barberry, spirea and representatives of gramineousmeadows such as heath false brome (Brachypodium pinnatum), cattail grass (Phleumpratense) and airy oat grass (Avena pubescens). The Russian blue flag (Iris), rockgeranium (Geranium), bedstraw (Galium) andmeadow rue (Thalictrum vulgaris andT. foetidum) grow on the meadows.
The middle part of the forest-meadow-steppe belt is dominated by spruce forestswith a moss cover on the soils and with relatively few shrubs in the understorey. Twotypes ofmosses,Hylocomium splendens andRhytidiadelphus triquetrum,and variouslichens are characteristic.Open space between spruce trees is covered by honeysuckle(Lonicera), rosehip (Rosa canina), whitebeam (Sorbus), currant (Ribes) and spirea(Spiraea).
Spruce forests in the upper part of the belt form a parkland vegetation. Shrubberyon the southern slopes consists of Turkestan juniper (Juniperus turcomanica) and onnorthern slopes of willow (Salix) and pea shrubs (Caragana).
Meadow-grass vegetation communities of the subalpine belt are dominated byshort (<20 cm) grasses and geranium (Geranium) and lady’s-mantle (Alchemilla).Ziziphora, Kobresia, sheep’s fescue (Festuca sulcata), edelweiss (Leontopodiumalpinum), thermopsis (Thermopsis) and starwort (Aster) occur in summer.
The cryophilic cushion plant formation of the high mountain tundra consists ofgentian (Gentiana), oxytrope (Oxytropis) and spearwort (Ranunculus), growing onmoraines in the glacial-nival belt. Alpine motley grasses represented by globeflower(Trollius), Altaic violet (Viola) and marsh gilled (Coronaria flos-cuculi) grow on thewarmer slopes with southern exposition.
6.1.4.3 Fauna
The different landscapes and large climatic gradients in the catchment of the lakecause a high faunal diversity. The permanently unfrozen Lake Issyk-Kul is an impor-tant waterfowl habitat (Vereschagin 1991). Birds such as pheasants (Phasianidae),grebe (Colymbus spp.), dabbling ducks, ruddy shelduck (Tadorna ferruginea), mer-ganser (Mergus), baldicoot (Fulica atra), red-crested pochard (Netta rufina), bittern(Ixobrychus), moorhen (Gallinula), rail (Rallus), grass-drake (Crex crex), demoiselle
6 Lake Issyk-Kul: Its History and Present State 185
(Anthropoides virgo), peewit (Vanellus), redshank (Tringa totanus), black-wingedstilt (Himantopus), fantail snipe (Gallinago gallinago), black-headed gull (Larusridibundus), common tern (Sterna hirundo), kingfishers (Alcedinidae), bank swal-low (Riparia riparia) andwagtail (Motacilla) build nests on the lake shore (DDWSSD2018). Eurasian whitethroat (Sylvia communis), scarlet grosbeak (Carpodacus ery-thrinus), great reed warbler (Acrocephalus arundinaceus), eastern turtle dove (Strep-topelia orientalis), turtle dove (Streptopelia turtur), great tit (Parus major), beardedtit (Panurus), Eurasian long-tailed titmouse (Aegithalos caudatus), azure tit (Paruscyanus), common blackbird (Turdusmerula), kestrel (Falco tinnunculus), long-earedowl (Asio otus), cuckoo (Cuculus), common nightingale (Luscinia megarhynchos),goldfinch (Carduelis carduelis), starling (Sturnus vulgaris), magpie (Pica), sparrowhawk (Accipiter nisus) andmarsh harrier (Circus aeruginosus) inhabit sea-buckthornbrushwoods and wetlands (DDWSSD 2018).
Mammals of these habitats are represented by common field mouse (Apode-mus sylvalicus), narrow-headed vole (Microtus gregalis), common red fox (Vulpesvulpes), common weasel (Mustela erminea), least weasel (Mustela nivalis),shrewmice (Soricidae), badger (Meles meles), tolai hare (Lepus tolai) and muskrat(Ondatra zibethicus; Shukurov 1991).
The tesselated snake (Natrix tessellata), Dione’s ratsnake (Elaphe dione), andsand lizard (Lacerta agilis) are found on pebbly or rocky shores.
Themammal fauna of desert and semi-desert regions in the basin is represented bythe eared hedgehog (Hemiechinus), tolai hare (Lepus tolai), Tien Shan souslik (Citel-lus relictus), and steppe polecat (Mustela eversmannii). Reptiles are represented thereby copperhead snake (Agkistrodon), multi-ocellated racerunner (Eremias multiocel-lata) and racerunner (Eremias arguta); amphibians by green toad (Bufo viridis); andbirds by Pallas’s sandgrouse (Syrrhaptes paradoxus), black-bellied sandgrouse (Pte-rocles orientalis), little owl (Athene noctua), Daurian partridge (Perdix dauurica),dorhawk (Caprimulgus), trumpeter bullfinch (Bucanetes githagineus), rock sparrow(Petronia petronia), gray-hooded bunting (Emberiza buchanani), larks (Alaudidae),Richard’s pipit (Anthus novaeseelandiae), wheatear (Oenanthe) and black redstart(Phoenicurus ochruros).
The mammals of the forests include shrewmice (Soricidae), tolai hare (Lepustolai), squirrel (Sciurus), large-eared pika (Ochotonamacrotis), grey hamster (Crice-tulus migratorius), common field mouse (Apodemus sylvalicus), common wolf(Canis lupus), common red fox (Vulpes vulpes), common weasel (Mustela erminea),badger (Meles meles), wild pig (Sus scrofa), roe deer (Capreolus capreolus) and rockmarten (Martes foina). Forests are inhabited by birds such as kite (Milvus), spar-row hawk (Accipiter nisus), goshawk (Astur palumbarius), buzzard (Buteo), hobby(Falco subbuteo), kestrel (Falco tinnunculus), grouse (Lyrurus), ring dove (Columbapalumbus), rufous turtle dove (Streptopelia orientalis), cuckoo (Cuculus), hawk owl(Surnia ulula), three-toed woodpecker (Picoides tridactylus), tree pipit (Anthus triv-ialis), common magpie (Pica pica), nutcracker (Nucifraga), carrion crow (Corvuscorone), wren (Troglodytes) and tit-warbler (Leptopoecile).
Forestless slopes, flood plains and rocks are inhabited by pale harrier (Cir-cus macrourus), golden eagle (Aquila chrysaetos), partridge (Alectoris), quail

186 A. O. Podrezov et al.
(Coturnix), ibis-bill (Ibidorhyncha) pigeon (Columba), eagle owl (Bubo), swifts(Apodidae), larks (Alaudidae), water ouzel (Cinclus), wheatear (Oenanthe), wallcreeper (Tichodroma muraria) and rock thrush (Monticola saxatilis).
The muflon (Ovis ammon) and wild mountain goat (Capra ibex) are found inthe alpine meadow and tundra belts. The relatively high abundance of mammals inthese belts results from favourable forage resources and the rough terrain that inhibitsaccessibility. The true “landlord” of high mountain regions is the snow leopard (Pan-thera uncia). Its seasonal migration follows those of its main prey, the Alpine ibex.The avian fauna of the high mountain ranges is characterized by the Himalayansnowcock (Tetraogallus himalayensis), ruddy shelduck (Tadorna ferruginea), lam-mergeier (Gypaetus barbatus), black vulture (Aegypius monachus), griffon vulture(Gyps fulvus), Himalayan griffon (Gyps himalayensis), horned lark (Eremophilaalpestris), rock pipit (Anthus spinoletta petrosus), red-billed chough (Pyrrhocoraxpyrrhocorax), Alpine chough (Pyrrhocorax graculus), accentor (Prunella), red-start (Phoenicurus), finchs (Fringillidae) including the white-winged snow finch(Montifringilla nivalis), and the mountain linnet (Acanthis flavirostris).
6.2 Lake Issyk-Kul in the Past and Its Current Conditions
6.2.1 History of Lake-Level Changes Prior to the TwentiethCentury
The investigated lake-level history of Issyk-Kul can be divided into five phasesaccording to the work of Sevastianov (1991) and subsequent studies.
1. Highest lake-levels existed at Lake Issyk-Kul in the late Pleistocene. Paleolithiclandmarks were recorded on a lake terrace 30–35m above the present lake (abso-lute elevation 1640 m; Sevastianov 1991). Radiocarbon dating of lacustrine sed-iments at this position above the lake yielded an age of ca. 26 thousand years (ka;Romanovsky 2002a). Correspondingly, geomorphological and dating analysesby Rosenwinkel et al. (2017) suggest that higher lake levels existed in the latePleistocene ca. 45–22 ka ago, and that a catastrophic dam break (or breaks) andoutburst floods occurred ca. 20.5–18.5 ka.
2. A significant regression of Lake Issyk-Kul occurred at the end of the late Pleis-tocene and during the earlyHolocene as a result of dry and cold climate conditionsaccompanied by the accumulation of snow and ice in the Tien Shan Mountainsand the reduction of meltwater discharge (Sevastianov 1991). Submerged ter-races and channels which reach down to 110 m below Issyk-Kul’s current levelare possibly associated with this regression (De Batist et al. 2002). The signifi-cantly lowered lake level caused the exposure of a 3–5 km wide area along thelake’s northern shore, of a 0.5–2.0 kmwide area along its southern shore and of a35–40 km wide section in the west and east of the lake in comparison to today’sarea. Desert and semidesert vegetation with members of the goosefoot family

6 Lake Issyk-Kul: Its History and Present State 187
(Chenopodiaceae) and sagebrush (Artemisia) as dominant plants spread widelyin the Issyk-Kul Basin during this period. Brushwood cover in river-valleys andregions with spruce forests in the mountains were reduced (Sevastianov 1991).
3. Issyk-Kul experienced a transgression in the first half of the Holocene causedby climate warming and the decrease of mountain glaciation generating highmeltwater discharge. The maximum lake level reached the terrace at ca. 30–35 mabove its current level. Humidity was significantly higher during this period witha mean annual precipitation of up to 400 mm in the southern part of the basinand of up to 600 mm in its northeastern part (Sevastianov 1991). Brushwood andforests spread again due to higher humidity and temperatures in the mountainsaround Lake Issyk-Kul.
Based on the study of lake sediment cores by Ricketts et al. (2001), higher lakelevels and open-lake conditions with the establishment of an outlet were inferredfor the period from 8.3 to 6.9 ka. Following a transitional period until 4.9 ka,closed-basin conditions similar to the situation today prevailed afterwards. Thisnew regression was probably caused by the increasing aridification of the regionin the middle-late Holocene and the Bronze Era. A low lake level existed untilca. 3 ka ago.
4. A significant increase in humidity led to a new transgression of Lake Issyk-Kulca. 2 ka ago. The lake reached a position between its present level and a terraceca. 10–12 m above its current position (absolute elevation 1620 m). Ancientchronicles and maps suggest that Lake Issyk-Kul was an open-basin lake with anoutlet ca. 3–2 ka ago (Romanovsky 2002a). However, the increase in availablemoisture caused the widespread development of steppe vegetation in the lakebasin. A relatively short open-basin period existed probably 1.4–1.2 ka (Rickettset al. 2001). In contrast, levels 3–6 m below its present level in the thirteenthto fifteenth century as a result of drier climate conditions were inferred fromsubmerged soil, tree and settlement remains (Ricketts et al. 2001; Romanovsky2002a).
5. The most recent open-basin period of Lake Issyk-Kul existed in the eighteenthcentury. Historical maps show the lake in the years 1698, 1724, 1756, 1760 andsometime in one of the years before 1823; and all apart from the one for the year1724 include an inflow of the Chu River and an outlet in its north (Romanovsky2002a;Narama et al. 2010). The lake level apparently started to decline during thesecond part of the nineteenth century. This regression lasted until the beginningof the twenty-first century. A slight increase is recorded since that time.
A seismic survey of Lake Issyk-Kul’s sediments revealed river delta depositsas deep as 500 m below the present lake level and provided evidence for fourdifferent regression periodswhich all caused lake-level declines beneath 200m incomparison to its present surface. However, the timing of these major lake-levelfalls remains elusive (Gebhardt et al. 2017).

188 A. O. Podrezov et al.
6.2.2 Thermal Regime, Currents and Mixing of LakeIssyk-Kul
The mean annual surface water temperature of Lake Issyk-Kul is ca. 11 °C. Meanannual surface water temperatures are slightly lower in the western and eastern partsof the lake with ca. 10.3 °C, and slightly higher with 11.4 °C near the northern shore.
Measurements of bottom water temperatures between 1928 and 1932 were con-ducted during expeditions of the Academy of Science of the USSR led by L. S.Berg. Temperatures at 200 m and 600 m depth were 4.3 and 4.2 °C in 1928, 4.0 and3.7 °C in 1930, and 4.2 and 3.7 °C in 1932, respectively. Bottom water temperatureswere regularly monitored on board of the research vessel “Moltur” by the KyrgyzAdministration on Hydrometeorology during the period from 1981 to 1988. Watertemperatures at 650 m depth were in a range from 3.7 to 4.1 °C. Significant temper-ature deviations in comparison to those measured between 1928 and 1932 were notrecorded at 200 m depth. Following a gap in Issyk-Kul surveys due to the economicdecline after the collapse of the Soviet Union, water temperature measurements in2001 and 2003 revealed increased values of up to 4.4 °C at 650 m depth. Comparedwith data for the 1980s, temperatures rose by 0.4 °C at 650 m, by 0.6 °C at 200 mand by 0.8 °C at 100 m depth. This deep-water temperature increase likely resultsfrom global warming in recent decades (Peeters et al. 2003; Salamat et al. 2015).
The current system of Lake Issyk-Kul is mostly controlled by thermal conditionsand the winds blowing in the basin. In winter, surface water cooling is typicallyaccompanied by an anticyclonic current with clockwise water movement in the lake.In contrast, the western (Ulan) and eastern (Santash) winds cause a counterclockwisewater movement due to the southward turn of the western wind and the northwardturn of the eastern wind after entering the basin. As a result, a cyclonic water currentforms in the shoreline area of the lake, and an anticyclonic circulation in its centralpart with a zone of water convergence in between. In the western and eastern partsof the lake, the convergence zone aligns with the position of a steep thermal bar withcolder waters closer to the lake shore (Bulin and Romanovsky 1975; Romanovskyand Shabunin 2002). Measurements of current velocities at 10, 15 and 25 m waterdepth of buoy-based stations showed decreasing velocities at greater depth. Averagecurrent velocity is in a range from 20 to 38 cm/s, and maximum velocity at 10 mdepth is 65 cm/s. Current velocities of 32, 13 and 10 cm/s were measured duringperiods of unstable conditions in the lake at 100, 150 and 300 m depth, respectively.
The vertical stability of the water column and possible mixing mechanisms anddeep-water renewal processes were most recently studied by Vollmer et al. (2002)in September 2000. They identified a thin well-mixed surface water layer with tem-peratures between 16.5 and 18.5 °C, a sharp thermocline between 10 and 60 mwater depth, and a nearly isothermal hypolimnion with temperature variations of<0.7 °C between 150 m and the maximum depth (Fig. 6.3). Lowest temperatureswere 4.29 °C near the lake floor at several stations. Tracer analyses by Hofer et al.(2002) and Kipfer and Peeters (2002) revealed that deep-water renewal in Issyk-Kulis rapid and that residence time of deep water is <13 years. Measurements of vertical

6 Lake Issyk-Kul: Its History and Present State 189
Fig. 6.3 High-resolution depth readings of salinity, temperature and dissolved oxygen concentra-tion at central positions in Lake Issyk-Kul in March 2001 (Hofer et al. 2002; Peeters et al. 2003).Salinity changes, although minor, result from different water masses due to deep-water formationby cooling of surface waters in the shallow bays in winter
transects in the lake in March and August 2001 showed that deep-water renewalresults from differential cooling of surface waters and accumulation of cold water indeeply incised channels in the shallower parts of the lake basin in winter that movesthen down the channels to greater depth (Peeters et al. 2003). These results extentearlier suggestions that cold river water moves down in the deeply incised channelstowards to centre of the lake and displaces warmer waters above (Stavissky 1977).
Salinity differences are generally small in lake waters of Issyk-Kul and not con-sidered to contribute significantly to mixing processes (Peeters et al. 2003; Fig. 6.3).Salinity measurements for 19 water samples collected in September 2000 at sta-tion 8 of the study by Vollmer et al. (2002) between 655.1 and 2.7 m depth in thelake ranged from 5.89 to 6.21 g/kg with a mean and standard deviation of 6.06 ±0.07 g/kg. Lake-water mixing as a result of surface-water cooling in the shallow partsof the lake will be possibly reduced in the future if winter air temperatures continueto increase (Salamat et al. 2015).
So far, lake waters in Issyk-Kul generally have high concentrations of dissolvedoxygen. Depth profiles do not show large vertical gradients (Fig. 6.3). For exam-ple, high-resolution dissolved oxygen-depth profiles measured in March 2001 at thedeepest part of the lake revealedmaximum concentrations of ca. 10mg/l in the upper-most 20 m of the water column and minimum concentrations of ca. 7.5 mg/l beneath600 m depth (Hofer et al. 2002; Peeters et al. 2003; Fig. 6.3). Surface waters in theshallower parts of the lake (above 50m depth) can be significantly oversaturated withrespect to dissolved oxygen especially in summer due to the high phytoplankton andmacrophyte productivity. Highest oxygen saturation values were measured for sur-face waters by V. L. Kadyrov and V. P. Matveev in the Tyup Gulf (121.5 and 185.9%,respectively; Matveev 1935). Dissolved oxygen saturation of surface (0–10 m) water

190 A. O. Podrezov et al.
is typically 112% in summer, 106–108% in autumn, 99% in winter, and 107–109%in spring, reflecting the seasonal temperature variations and the related growth ofphytoplankton. Oxygen saturation is typically not lower than ca. 70% even in thedeepest part of the lake.
The wave disturbance of lake sediments in Issyk-Kul ranges from negligible ripcurrents driven by weak winds and waves of few centimeters height to major resus-pension and wave-erosion events during storms. Waves of up to 4 m height weremeasured during storms of >20 m/s wind speed at the wave-height pole 2.5 km fromthe Kara-Bulun headland located at 10 m water depth.
6.2.3 Hydro-Physics and Hydrochemistry of the Lake
Water transparency, measured by Secchi Disk, is generally relatively high in LakeIssyk-Kul. Average transparency is 12.4 m near the northern shore and 13.9 m nearthe southern shore. The higher transparency near the southern shore results fromthe steeper bathymetry in the south with a narrower shallow-water zone (Fig. 6.2).The littoral zone is widest in the eastern part of the lake basin starting at the KaraBulan headland where transparency is typically in a range from 8 to 12 m. The twolargest rivers, Dzhergalan and Tyup, transport suspended particles to the eastern partof the basin where transparencies drop after glacier meltwater pulses and heavy rains.Transparency is only 0.2 to 1.0m in the proximal part of the Dzhergalan Rivermouth,it increases to 2 m 120 m farther away and up to 8 m in a distance of 17 km.
In Balykchy Bay in the western part of the lake, water transparency is typicallyhigher than 12 m in spite of the wide shallow zone in the bay and the occurrence ofstorm waves as a result of western winds. Transparency is mostly in a range from 15to 17 m. Close to the shore, in a distance of 1.5 to 2.0 km, transparency is reducedto 7.5–10.0 m. The higher transparency in the western shallow part of Issyk-Kul incomparison to its eastern analogue results from the lack of major inflows and thedense cover of charophytes down to 40 m water depth.
Water transparency in the central part of the lake is only controlled by phyto-plankton concentration and typically in a range from 15 to 20 m in summer.
Water with deep blue color or colors I-III on the Forel-Ule (FU) color scaletypically occurs in the winter in Issyk-Kul when transparencies are in a range from25 to 53 m. According to V. P. Matveev’s observations in 1928, blue water color(I–III) was registered in Issyk-Kul even during summer (Matveev 1935). Currently,water in summer has mostly FU colors IV–VI that also have blue tints. In the TyupGulf, where Tyup River delivers large quantities of suspended sediments and wherethe phytoplankton population reaches densities ca. 8–9 times higher than in the openlake, water predominantly has green color complying with FU colors VII–X. Somebackwater regions of the Tyup Gulf are characterized by a green-brown water color(FU color XI–XVI) in summer.
According to Kadyrov (1986), the density of Issyk-Kul water in the open partof the lake is 1005.2 kg/m3. The density decreases to 1003.2–1004.0 kg/m3 in the

6 Lake Issyk-Kul: Its History and Present State 191
east of the lake near the Tyup and Dzhergalan inflows. The water density increaseswith depth in the gulfs of the two main tributaries below ca. 10 m showing that theinflows form a lighter surficial water layer on the lake water prior to mixing. Thetemperature of maximum density of 2.6 °C is typically never reached in the openlake area due to the large heat capacity of the lake and the mild winters in the region(Kipfer and Peeters 2002; Vollmer et al. 2002). Cooling of waters to 2.6 °C and evenbelow occurs in the littoral zone of the lake in winters (Vollmer et al. 2002). Thewater-ice transition temperature is −0.3 °C.
The salinity distribution in the lake is controlled by the two large inflows in theeastern part of the basin. Runoff of Dzhergalan and Tyup rivers has a salinity of0.6 g/kg. Salinity in the Tyup Gulf is between 2.6 and 2.8 g/kg at 3 km distance tothe river mouth. At 9 km distance, surface waters have a salinity of 4.3 g/kg, water at10m depth has a salinity of 5.6 g/kg andwater at 25m depth has a salinity of 5.8 g/kg.Salinity in the Dzhergalan Gulf is mostly in a range from 3.1 to 5.9 g/kg. In contrastto the eastern part of the lake, the Balykchy Gulf in its western part is not affectedby major inflows, and salinity is 5.8–6.0 g/kg, similar to the open central part of thelake. Salinity in the Cholpon-Ata Gulf at the northern shore and in the gulfs along thesouthern shore (e.g., Tamga, Ton, Akterek) is between 5.5 and 5.8 g/kg. Salinity inthe central part of the lake is ≥5.8 g/kg. A homogenous salinity distribution patternis also recorded on a vertical scale (Table 6.3). Salinity in the central part of the lakeat Cholpon-Ata’s longitude (77.1° E) is 5.8 g/kg at 50 m water depth and 5.9 g/kgat 650 m depth, or 6.0 and 5.9 g/kg at 50 and 290 m depth, respectively, ca. 30 kmfurther to the east at 77.5° E. The horizontal and vertical homogeneity of the salinityvalues in Lake Issyk-Kul reflects the efficient exchange of water between differentparts of the lake. However, the ratio of the relatively small annual total runoff volumeto the total lake volume is 1/530 resulting in relatively minor effects of inflows onthe salinity distribution in Lake Issyk-Kul.
The salinity of Lake Issyk-Kul increased since the measurements of V. P.Matveevin 1928 who determined an average (n= 34) of 5.823 g/kg (Matveev 1935; Fig. 6.4).Average salinity was increased to 5.968 g/kg in the early 1960s (Kadyrov and Kar-manchuk 1964). Measurements of the Kyrgyz Meteorology Agency in the middle ofthe 1980s yielded an average salinity of 6.01 g/kg. In 2000, the average salinity of thewater column in the center of the lake was 6.06 g/kg (Vollmer et al. 2002). Kadyrov’s(1986) measurement of a high salinity of 6.11 g/kg for near-bottom waters in 1947 isbased on a different methodological approach (either the dry residue or the sum-ofions method) and is possibly not comparable with the other data (Fig. 6.4). However,the observed steady salinity increase of Lake Issyk-Kul reflects diminishing runoffentering the lake and continuous climate warming in the region since the 1930s,resulting in higher evaporation effects on a closed-basin lake (Salamat et al. 2015).
According to the salinity balance of Issyk-Kul determined by the NovocherkasskHydrochemical Institute, the majority of dissolved salts in Lake Issyk-Kul reachesthe lake as groundwater inflow (959 thousand tons of dissolved salts per year equalto 72% of its total influx; Romanovsky et al. 2004). The remaining portion arriveswith runoff (296 thousand tons per year, 22%) and direct precipitation (75 thousandtons per year, 6%). About half (50.2%) of the total influx of dissolved salts of 1330

192 A. O. Podrezov et al.
Fig. 6.4 Observed level changes of Lake Issyk-Kul for the period of 1927–2012, and salinitiesmeasured in the lake (Abuduwaili et al. 2019). Salinity data marked red are based on either the dryresidues or sum-of ions whilst others are mostly calculated from measured temperature, electricconductivity and pressure
thousand tons per year is removed from the water column by precipitation whichis dominated by the formation of monohydrocalcite and calcite (Giralt et al. 2004).The other half of the annual influx of dissolved salts to the lake results in an annualsalinity increase by 0.4mg/kg. The relatively low salinity of Lake Issyk-Kul indicatesthat the present lake without an outlet is geologically young. Geomorphological andarchaeological data confirm that the lake in its present closed-basin state is a generallyyoung phenomenon (Bondarev 1978; Sevastianov 1991; Rosenwinkel et al. 2017).According to maps of Jesuit missionaries, the present closed-basin conditions werenot established before the 1820s (Romanovsky 1990; Narama et al. 2010).
First reliable hydrochemical data for the water of Lake Issyk-Kul were providedfor Matveev’s survey of the lake in 1928 (Matveev 1935). More systematic hydro-chemical analysis started in 1966. Dominating anions in Lake Issyk-Kul are Cl− andSO2−
4 , dominating cations are Na+ and Mg2+ (Table 6.2). Thus, Issyk-Kul water ischaracterized as sodium chloride and sulfate water (Kutzeva 1980). The water col-umn of Lake Issyk-Kul shows only insignificant variations of the concentrations ofmajor ions with depth providing additional evidence for the well-mixedwater masses(Table 6.3). With respect to the dominating cations Na+ and Mg2+, Issyk-Kul wateris similar to ocean water. In contrast, the dominance and similar concentrations ofCl− and SO2−
4 are typical for an inland saline lake.The pH value of Issyk-Kul water is 8.00–8.75 (Giralt et al. 2004). Alkalinity of
lake water (content of bicarbonate and carbonate ions) is high in comparison to otherlarge water bodies with ca. 5.8 meq/l (Vollmer et al. 2002).
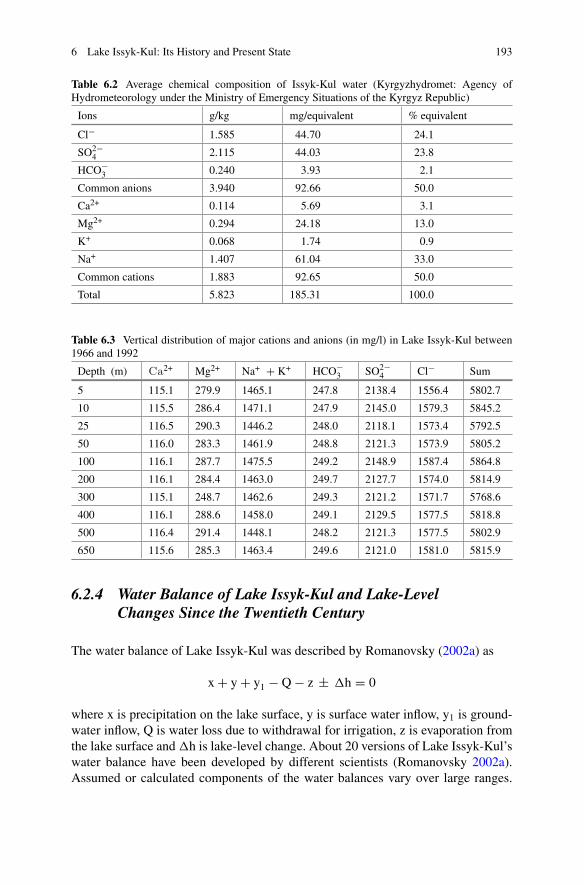
6 Lake Issyk-Kul: Its History and Present State 193
Table 6.2 Average chemical composition of Issyk-Kul water (Kyrgyzhydromet: Agency ofHydrometeorology under the Ministry of Emergency Situations of the Kyrgyz Republic)
Ions g/kg mg/equivalent % equivalent
Cl− 1.585 44.70 24.1
SO2−4 2.115 44.03 23.8
HCO−3 0.240 3.93 2.1
Common anions 3.940 92.66 50.0
Ca2+ 0.114 5.69 3.1
Mg2+ 0.294 24.18 13.0
K+ 0.068 1.74 0.9
Na+ 1.407 61.04 33.0
Common cations 1.883 92.65 50.0
Total 5.823 185.31 100.0
Table 6.3 Vertical distribution of major cations and anions (in mg/l) in Lake Issyk-Kul between1966 and 1992
Depth (m) Sa2+ Mg2+ Na+ + K+ HCO−3 SO2−
4 Cl− Sum
5 115.1 279.9 1465.1 247.8 2138.4 1556.4 5802.7
10 115.5 286.4 1471.1 247.9 2145.0 1579.3 5845.2
25 116.5 290.3 1446.2 248.0 2118.1 1573.4 5792.5
50 116.0 283.3 1461.9 248.8 2121.3 1573.9 5805.2
100 116.1 287.7 1475.5 249.2 2148.9 1587.4 5864.8
200 116.1 284.4 1463.0 249.7 2127.7 1574.0 5814.9
300 115.1 248.7 1462.6 249.3 2121.2 1571.7 5768.6
400 116.1 288.6 1458.0 249.1 2129.5 1577.5 5818.8
500 116.4 291.4 1448.1 248.2 2121.3 1577.5 5802.9
650 115.6 285.3 1463.4 249.6 2121.0 1581.0 5815.9
6.2.4 Water Balance of Lake Issyk-Kul and Lake-LevelChanges Since the Twentieth Century
The water balance of Lake Issyk-Kul was described by Romanovsky (2002a) as
x + y + y1 − Q − z ± �h = 0
where x is precipitation on the lake surface, y is surface water inflow, y1 is ground-water inflow, Q is water loss due to withdrawal for irrigation, z is evaporation fromthe lake surface and �h is lake-level change. About 20 versions of Lake Issyk-Kul’swater balance have been developed by different scientists (Romanovsky 2002a).Assumed or calculated components of the water balances vary over large ranges.

194 A. O. Podrezov et al.
Annual direct atmospheric precipitation on the surface of the lake varies in thesecalculations in a range from 230 to 350 mm. The annual surface water inflow coversa range from 184 to 567 mm, i.e. highest assumed values are as high as three timesthe lowest assumed discharge numbers. Annual groundwater inflow varies from 241to 330 mm in the water balances, and annual evaporation from the surface of the lakeranges from 700 to 910 mm.
Gronskaya (1983) andKrivoshei andGronskaya (1986) suggested awater balanceof Lake Issyk-Kul for the period from 1935 to 1978 which is considered as mostreliable. Based onmany observational data, they used 274mmas annual precipitationon the lake surface, 295 mm as surface water inflow, 299 mm as groundwater inflow,836 mm as evaporation from the lake, 78 mm as water loss for irrigation and 50 mmfor the lake-level change. The resulting residual is 4 mm.
A water balance for the period from 1979 to 2000 uses 306 mm as annual pre-cipitation on the lake surface, 627 mm as surface and groundwater inflow, 910 mmas evaporation from the lake, 46 mm as water loss for irrigation and 18 mm for thelake-level decline. The resulting residual is −5 mm. All climate-controlled compo-nents of the water balance increased in comparison to the balance for the period from1935 to 1978, and the increase is higher for the income components precipitationand inflows, resulting in a significantly lower lake-level decline during 1979–2000(Fig. 6.4).
The level of Lake Issyk-Kul fluctuates ca. 20 cm annually due to higher precipita-tion and runoff including meltwater during spring and summer, and lower precipita-tion and runoff in autumn and winter. During the period of instrumental observationsfrom 1927 to 2012, the lake level decreased by 249 cm (Fig. 6.4). The average annualdecline is 2.9 cm. The maximum annual decline was recorded with 20 cm in 1948,and the highest rise occurred with 18 cm in 2003.
The highest average annual level of 1609.52mwas recorded in 1929, and the low-est level of 1606.17 m occurred in 1998. The general decline was mostly caused byregional climate warming and increasing evaporation from the lake, and the increas-ing withdrawal of water from tributaries for irrigation farming (Salamat et al. 2015).However, the decline was punctuated by wetter periods and related lake-level risesin the years 1929, 1935–1936, 1941–1942, 1956–1960, 1970–1971, 1981–1982,1987–1989, 1993–1994, and 1999–2003 (Fig. 6.4). The longest periods of lake-levelincreasewere observed in 1956–1960 and 1999–2003.Higher precipitation andmelt-water discharge caused lake-level rises of 32 and 55 cm over a period of five years,respectively. The first longer period of increasing lake levels was preceded by a longcontinues lake-level decline from 1943 to 1955 when the lake’s level fell 110 cm dueto lower precipitation and higher air temperatures in the Issyk-Kul Basin.
The lowest water level of Lake Issyk-Kul at 1606.08 m was registered in the endof 1997 and in the beginning of 1998. The level reached 1606.80 m in the end of2003 after a rise by 72 cm since the beginning of 1998. This last significant lake-levelrise caused intensive shore abrasion. Sand beaches near the Sukhoi Bereg Peninsulawhich were 100–250 m wide in the 1980s were washed away in September 2003,and sea-buckthorn shrubs destroyed by waves. Future global warming and stronger

6 Lake Issyk-Kul: Its History and Present State 195
evaporation, together with diminishing meltwater runoff due to decreasing glacier-ice resources in the upper reaches of the lake and continuing withdrawal of waterfrom tributaries for irrigation farming represent a major threat for the stability ofLake Issyk-Kul’s ecosystem in the future.
6.2.5 Plankton, Benthos, and Fish of Lake Issyk-Kul
Phytoplankton in a lake is crucial for its ecosystemdue to its role as primary producersin the food web. The first comprehensive study of Issyk-Kul’s phytoplankton wasconducted by I. A. Kiselev. The results of Kiselev’s (1932) studies showed thatthe algae composition of Lake Issyk-Kul is more diverse than those of many otherwater bodies. A total of 309 algae taxa were identified in the phytoplankton of thelake. Most algae taxa were recorded in the more shallower parts near the shoresof the lake. The less diverse phytoplankton in the open part of the lake is mainlyrepresented by Botryococcus braunii, Peredinium borgei and Amphiprora paludosavar. issykkulentis. Botryococcus is associated with upper waters in the water columnwhilst Amphiprora dominates at greater water depth. T. G.Matukova studied benthicalgae of the Tyup Gulf in the end of 1950s. She identified 240 taxa and forms ofdiatoms of which only 13 taxa are planktonic (Matukova 1958). In the beginning ofthe 1960s, S. M. Mambetalieva conducted investigations of the benthic algal floraof the northern shore of Lake Issyk-Kul. She listed 346 taxa and forms of algae inIssyk-Kul’s waters. The phytoplankton in the open lake was studied in more detailby A. A. Kulumbaeva in the years 1972–1975. According to her work, 111 speciesand forms of phytoplankton were determined: 44 taxa are blue-green algae, twotaxa are yellow-green algae, 19 taxa are diatomic algae, 40 taxa are green algae,and six taxa are dinoflagellates (Kulumbaeva 1982). Phytoplankton concentrationsin the open lake are 166–488 thousand cells/l, corresponding to a biomass in a rangefrom 73 to 153 mg/l. Concentrations and corresponding biomass are higher in theTyupGulf: 1513–4126 thousand cells/l and 207–398mg/l, respectively (Kulumbaeva1982). Blue-green algae such as Merismopedia punctata are most abundant amongthe phytoplankton (44% of total cell numbers), and concentrations up to 12,356thousand cells/l were determined in the open lake during the summer season.
The maximum phytoplankton concentration and highest biomass in Lake Issyk-Kul occurs at 15–50 m water depth. However, algae concentrations are also highduring most of the year in a depth range of 100–150 m. In contrast to many otherwater bodies with a significant seasonal change of the algae composition, seasonalchanges are minor in Lake Issyk-Kul. In addition, the majority of the phytoplanktonin Lake Issyk-Kul are small or nannoplanktonic forms of blue-green and green algaethat represent the major part of lake productivity. The cell diameter of these algaeis typically not exceeding 2–3 µm resulting in a relatively low biomass in spite ofrelatively high phytoplankton concentrations in the lake. Very likely, the dominanceof nannoplanktonic algae is an adaptive response to low concentrations of nutrientsin Lake Issyk-Kul.

196 A. O. Podrezov et al.
The list of Issyk-Kul’s zooplankton prepared by L. A. Folian in 1973 consists of154 species and forms, 76 ofwhich are protozoans, 59 are rotifers, 11 are cladocerans,and eight are copepods. The zooplankton predominates in the shallow coastal zone,and only three rotifer taxa and two copepods (Arctodiaptomus salinus and A. viridis)are abundant in the open lake (Folian 1981). Most abundant in Lake Issyk-Kul arenine rotifers, two cladocerans and four copepods, and it is the copepod A. salinuswhich produces mass occurrences and dominates the zooplankton in all areas of thelake (Savvaitova and Petr 1992). During the year A. salinus amounts to 75–95% ofthe total zooplankton population and 95–99% of the total zooplankton biomass. Themaximum density of A. salinus populations is typically reached with 6–8 thousandindividuals/m3 (equal to a biomass of 0.17–0.22 g/m3) in the upper water layer (0–100 m) in the end of August and beginning of September. The minimum density ofthe A. salinus population (ca. 2.0–2.5 thousand individuals/m3, biomass ca. 0.12–0.15 g/m3) typically occurs in the end of February and beginning of March.
According to Pavlova (1964), the zoobenthos of Lake Issyk-Kul comprises 224species and forms. Included are three taxa of shellfish, 35 taxa of chironomid larvae,two other dipterous larvae taxa, two water beetles, five water bugs (Gerromorphaand Nepomorpha), seven caddisfly larvae, one stone fly larva, four dragonfly larvae,five acarians, five amphipods, 12 ostracods, five leeches, five oligochaetes, and 35protozoans. In addition, turbellarian and nematode worms occur. Zoobenthos is mostabundant in the spring season. It is reduced in autumn due to the emergence of the chi-ronomids and predation by fish. Zoobenthos biomass in Pokrov Gulf was 22.14 g/m2
in spring, 8.8 g/m2 in summer, 5.5 g/m2 in autumn and 11.9 g/m2 in winter (Pavlova1964). Near the shoreline, representatives of the Chironominae family are abundant,dominated by Strictochironomus pictulus andMicropsectra sp. Lake floor covered bystoneworts (macro-algae) is mostly inhabited by Orthocladiini larvae. The amphipodGammarus ocellatus M. is typically also very abundant among stoneworts, whilstG. bergi M. is abundant over gravelly and rocky substrates. Among shellfishes, themost important representative with respect to biomass is Radix auricularia (Pavlova1983). The average biomass of zoobenthos in the “stonewort belt” of the littoralarea is 8–10 g/m2. The zoobenthos diversity and biomass is decreasing to a half ora third from the “stonewort belt” to a depth of 60–70 m. In this depth range, fourtaxa of the Chironominae family predominate: Chironomus anthracinus, Ch. plumo-sus, Strictochironomus pictulus andMicropsectra sp. In addition, Radix auriculariais abundant at this depth. The average annual biomass in this depth belt is 2.5–3.5 g/m2. At water depth exceeding 70 m, the zoobenthos diversity and biomass arelow. Zoobenthos mainly consists here of the two endemic oligochaetes Enchytraeusprzewalskii Hrabe and E. issykulensis Hrabe, and the amphipod IssykkogammarushamatusChevreux (Romanovsky 2002b). The average annual biomass of zoobenthosin this zone is ≤0.2–0.3 g/m2.
Radix auricularia, which is widely spread in the coastal zone down to ca. 60 mwater depth, is the main food source of fish in Lake Issyk-Kul. In contrast, the mainfood source in the Tyup Gulf are chironomid larvae that account for ca. 60% ofthe zoobenthos’ biomass there. The high caloric value of these invertebrate larvaeenables high growth rates of gold fish and carp in the Tyup Gulf.

6 Lake Issyk-Kul: Its History and Present State 197
In addition to her research work on the algae of Lake Issyk-Kul, T. G. Matukovastudied also its macrophyte flora in detail. Plant associations including emerged andsubmerged macrophytes show especially large differences in the gulf regions suchas the Tyup Gulf due to different hydrochemical conditions and substrate types.The emergent flora of Lake Issyk-Kul consists of common reed grass (Phragmitescommunis Trin.), blackamoor (Typha latifolia L.), reed (Scirpus tabernaemontaniGmel.), and clubroot (Bolboschoenus affinis Drob. and B. compactus Drob.).
Common submerged macrophytes are fennel-leaved pondweed (Potamogetonpectinatus L.), amblyophyllous (P. otusifolius M.K.), amplexicauline (P. perfolia-tus L.), sea naiad (Najas marina L.), meakin (Myriophyllum spicatum), hornweed(Ceratophyllum demestrum), common bladderwort (Urticularja vulgaris L.), butter-cup (Ranunculus natansC.A.M.), poolmate (Zannichellia palustrisL.), and sea-grass(Ruppia maritima L.).
Stoneworts (charophytes) grow in the littoral belt of the lake between 6–8 and35–40 m or sometimes even 50 m depth. They occupy large areas and produce thelargest phytomass, and form the main type of aquatic vegetation in Lake Issyk-Kul.Charophytes are included in all associations of water vegetation and most oftendominate the plant and macro-algae associations (Savvaitova and Petr 1992). Thus,Issyk-Kul is a charophyte lake. The “stonewort belt” along the shore of the lake iswider in the north in comparison to the south as a result of the steeper slope in thesouth. The belt is as wide as 15 km in the flat littoral zone of the Balykchy Gulf,near Prishyb Mountain and Tsor village, or as narrow as 200 m in regions with steepslopes. Bays protected from waves and far from inflows as sources of suspendedsediments are most densely covered by charophytes. In contrast, the sandbanks ofthe peninsulas Dolinsk, Bosteri, Kara-Bulun and the Sukhoi Mountain range are notcovered by charophytes above a water depth of 5–10 m due to their exposure to largestorm waves. Due to the lower water transparency in the Tyup Gulf and the steepestuary-like bathymetry, charophytes grow here at the depth of 6–8m and form a 20–30 m narrow belt. Charophytes are not found near inflows with water transparenciesof ≤0.5 m.
Charophytes in Lake Issyk-Kul are represented by 17 species: Nitellopsis obtusa(Desv.) Groves, Tolypella nidifica (Müll.) Leonh., Chara altaica A. Br., Ch. aspera(Dethard.) Willd., Ch. aspera (Dethard.) Willd. var. brevispinaMig., Ch. tomentosaL., Ch. connivens Salzm., Ch. contraria A. Br., Ch. contraria A. Br. hispidula A.Br., Ch. crinita Wallr., Ch. delicatula Ag. var. bulbillifera A. Br., Ch. fischeri Mig.,Ch. intermedia A. Br., Ch. schaffneri (A. Br.) Robinson, Ch. crinitoides Hollerb.,Ch. vulgaris L., and Ch. fragifera Durun (Romanovsky 2002b). The tallest (up to2 m height) macro-alga in Lake Issyk-Kul which is also most widely distributed isChara tomentosa. It grows both in less brackish shallow zones of gulfs and in theopen lake. In general, Ch. tomentosa forms dense vegetation at a depth range from6–8 to 25–30 m with high cover (90–100%). Its phytomass reaches 35 kg/m2. Atlarger depth down to 50 m, Ch. tomentosa grows in isolated spots.
The fish fauna of Lake Issyk-Kul includes 12 or 13 native species and morethan ten introduced taxa. The most diverse native fish family in the lake are the

198 A. O. Podrezov et al.
carps (Cyprinidae; Pivnev 1990). The native members are Schmidt’s dace (Leucis-cus schmidti (Herzenstein)), the Issyk-Kul dace (L. bergi Kaschkarov), the Issyk-Kul minnow (Phoxinus issykkulensis Berg), the Issyk-Kul gudgeon (Gobio gobiolatus Anikin), the Issyk-Kul marinka (Schizothorax issykkulensis Berg), the scalyosman (Diptychus maculatus Steindachner), and the naked osman (Gymnodiptychusdybowskii (Kessler)). The origin of the common carp (Ciprinus carpio L.) in LakeIssyk-Kul is not known (Mikkola 2012). Other native taxa are four stone loaches(Nemacheilidae: the Tibetan stone loach Triplophysa stolickai (Steindachner), thegray loach T. dorsalis (Kessler), the spotted thick-lip loach T. strauchii (Kessler) andthe Issyk-Kul naked loach T. ulacholica (Anikin), and one catfish (Sisoridae), theTurkestan catfish Glyptosternon reticulatum McClelland (Mikkola 2012).
The Sevan trout Salmo ischchanKessler was introduced as early as in the 1930s toestablish commercial trout fishery in Lake Issyk-Kul (Alamanov andMikkola 2011).The zander Sander lucioperca (L.) and the oriental bream Abramis brama orientalisBerg were introduced in the lake in 1954–1956. Grass carp (Ctenopharyngodonidella (Valenciennes)) and tench (Tinca tinca (L.)) followed soon afterwards. Thecommon whitefish (Coregonus lavaretus (L.)) and the Arctic cisco (C. autumnalis(Pallas)) were introduced in Lake Issyk-Kul in the 1970s (Alamanov and Mikkola2011). Additional introduced carps are the striped bystranka (Alburnoides taeniatus(Kessler)), the stone moroko (Pseudorasbora parva Temm. & Schleg.), the silvercarp (Hypophthalmichthys molitrix (Valenciennes)), and the golden carp (Carassiusauratus gibelio (Bloch)). The rainbow trout (Oncorhynchus mykiss (Walbaum)), theValaamwhitefish (Coregonus widegreniMalmgren), the plain thicklip loach (Triplo-physa labiata (Kessler)), and the freshwater sleeper (Micropercops cinctus (Dabryde Thiersant)) were also successfully introduced in the lake. Not fully confirmed yetis the successful establishment of the introduced Caucasian scraper (Capoeta capo-eta (Güldenstädt)), the asp (Leuciscus aspius (L.)), the vendace (Coregonus albula(L.)), and the peled (C. peled (Gmelin)) in the lake (Mikkola 2012). As a result ofthe successful establishment of alien predatory fish in Lake Issyk-Kul such as therainbow trout Oncorhynchus mykiss, the endemic fish fauna is largely endangeredtoday (Alamanov andMikkola 2011). The alien fish taxa in Lake Issyk-Kul represent73% of the total fish fauna of the lake today.
6.3 Population, Natural Resources and EnvironmentalIssues of the Issyk-Kul Basin
6.3.1 Population in Lake Issyk-Kul’s Catchment
Archaeological evidence suggests that man became active in the Issyk-Kul regionsometime in the Middle Paleolithic (ca. 300–40 ka; Vishnyatsky 1999). Petroglyphsfrom the Bronze Age and later periods are especially abundant along the northernlake shore and show that relatively dense human occupation of the region dates back

6 Lake Issyk-Kul: Its History and Present State 199
to more than 3000 years (Hermann 2017). Medieval (tenth to thirteenth century CE)remains of settlements in the Issyk-Kul region including caravanserai and fortifica-tion buildings indicate the importance of trading along one of the ancient Silk Roadroutes (Vinnik et al. 1978; Mokrynin and Ploskikh 1988). However, today’s settle-ments in the basin were established in the second half of the nineteenth century andafterwards. The foundation of modern Karakol is dated to the summer of 1869. Thefirst permanent settlement of people in the area of modern Balykchy was establishedin 1871 due to the creation of a postal station. In 1913, the population of the Issyk-Kul Basin was not exceeding 250 thousand people. Kyrgyz people predominated,and minorities accounted for ca. 25% of the population.
In the year 2014, the Issyk-Kul Basin was inhabited by 458.5 thousand people(Abuduwaili et al. 2019). Themajority of the population is distributed on the lakesideplainwhere the average population density is 130 people per km2 (average populationdensity in Kyrgyzstan is ca. 30 people per km2). Most important urban centres inthe basin are the three cities Karakol (population of 74.1 thousand), Balykchy (46.0thousand) and Cholpon-Ata (12.4 thousand) where 33% of the basin’s populationlives.
6.3.2 Natural Resources of the Issyk-Kul Basin
The Issyk-Kul Basin has rich natural resources with respect to recreational condi-tions, fisheries, fertile arable land, and mineral resources (gold, uranium). Recre-ational resources clearly have priority in the Issyk-Kul region. The combination ofa diverse and fascinating landscape including the sandy beaches of the lake andsteep mountains in its catchment, and favourable weather conditions near the lake(long sunshine duration, mild air temperatures without large fluctuations, low vari-ations of atmospheric pressure) provides a unique setting for recreational purposes.In addition, clean mountain air and lake water, large mineral water reserves and ther-apeutic muds make Lake Issyk-Kul a unique sanatorium in the Central Asian regionand Siberia. For example, natural thermal springs in the eastern part of the TerskeiAla-Too range have great potentials for the growing tourism sector in the Issyk-KulBasin.
In 1990, 135 recreation facilities for rest, tourism and sanatorium treatment witha total capacity of ca. 40 thousand people existed in the Issyk-Kul region. Amongthem were nine sanatoria, 12 rest houses and 30 pioneer camps (summer camps foradolescents in Soviet times). The annual number of holidaymakers exceeded 350thousand people which is comparable with the total number of permanent residentsin the region. Today, ca. 400 thousand travellers visit the lake per year, mostly usingtourism resorts in and near Cholpon-Ata on the northern shore of the lake (Fig. 6.5).
The Issyk-Kul State Reservewas established as the first nature reserve inKyrgyzs-tan in 1948. In 1975, the lake became Kyrgyzstan’s first internationally recognizedand protected habitat for wintering of waterfowl with its declaration as a Ramsar site.

200 A. O. Podrezov et al.
Fig. 6.5 The seaside resort Bosteri east of Cholpon-Ata, the peaks of the Kungei Ala-Too in theback
The Biosphere Reserve Issyk-Kul with an area of 43 km2 was established as admin-istrative entity of the Issyk-Kul Oblast (province) in 1998. It joined the UNESCOWorld Network of Biosphere Reserves in 2001, and is currently considered as Pro-tectedNatureArea at national level. The reserve is divided into core, buffer, transitionand rehabilitation zones.
6.3.3 Current Environmental Issues of the Issyk-Kul Basin
Lake Issyk-Kul received increased attention in recent years due to two reasons: thedeclining lake level and pollution issues. The lake level decreases steadily as a resultof global warming and enhanced evaporation from the lake, and the agriculturaldevelopment in the region and related increasing diversion of water from the tribu-taries of the lake (Salamat et al. 2015). In 1966, 9% of the total river discharge inthe Issyk-Kul Basin was diverted for agricultural purposes. This number increasedto 34% in 1982 and 43% in 1998. Ca. 65 km2 of farmland were irrigated in the catch-ment of Lake Issyk-Kul in the beginning of the twentieth century, whilst 500 km2
were irrigated in the 1930s and ca. 1600 km2 in the beginning of the twenty-firstcentury (Lyons et al. 2001; Mikkola 2012). Water losses from irrigation farmingare large due to the prevailing furrow irrigation and the lack of more sophisticatedtechniques (Romanovsky 1990).

6 Lake Issyk-Kul: Its History and Present State 201
The agricultural development was accompanied by pollution of water resourcesfrom irrigated fields (pesticides and nutrients in return flow) and as a result of inten-sified cattle breading, and by pollution due to the increasing construction and sub-sequent maintenance of recreational facilities. Lake Issyk-Kul’s northern shore isa particularly problematic region now because it became popular as unregulatedcamping site with temporary canteens and food stands lacking appropriate sanitaryfacilities. Illegal poaching and cutting of bushes and trees became serious threatsfor the local fauna and flora, and are causes of soil erosion in other regions of thecatchment area too.
Organic compounds such as hydrocarbons, detergents and phenols, and heavymetals accumulate in the closed-basinLake Issyk-Kul as a result of improperly treatedwastewaters, diffuse and subtle influxes from farmlands and accidental spillages.
Issyk-Kul is an oligotrophic lake with low productivity. Nutrients which definethe biological productivity of the lake arrive mostly with river waters. Analyses oflake water samples in the years 1998–2000 revealed nitrite-nitrogen concentrationsbetween 0.0 (Cholpon-Ata Gulf) and 0.082 mg/l (Balykchy Gulf), nitrate-nitrogenconcentrations between 0.09 (Tyup Gulf) and 0.26 mg/l (Balykchy Gulf), and phos-phorus concentrations between 0.0 (Balykchy Gulf) and 0.046mg/l (Ton Gulf). Con-centrations of nutrients in the open part of the lake are low. Nitrite-nitrogen concen-trations were 0.0 mg/l, nitrate-nitrogen concentrations between 0.09 and 0.16 mg/l,and phosphorus concentrations between 0.0 and 0.009 mg/l.
Ammonia-nitrogen concentrations in water samples collected from the coastlineof Lake Issyk-Kul were between 0.0 and 0.12 mg/l (Balykchy Gulf) in 1998–2000.Between 2015 and 2018, increased ammonia-nitrogen concentrations between 0.35and 0.84 mg/l were recorded near the ship repair facility in the Balykchy Gulf. High-est ammonia-nitrogen concentrations were up to 2.2 times its maximum allowableconcentration (MAC). Nitrite-nitrogen concentrations were 1.8–7.5 times its MACof 0.024 mg/l near the ship repair facility and 5.0 times the MAC near the petroleumstorage depot in 2015. Pollution near the ship repair facility in the Balykchy Gulfprobably originated from the old fertilizer storage place “Selkhozhimiya” nearbywhere fertilizer reserves for the Issyk-Kul und Naryn Oblasts are stored. Heavy rainscaused the contamination of runoff which entered the lake. However, ammonia-nitrogen concentrations remained below detection limit in the deep open part of thelake during 2015–2018, and MACs for nitrite nitrogen, nitrate nitrogen and phos-phorus were not exceeded. Thus, the local contamination did not affect the main partof the lake due to its large volume in comparison to relatively minor inflow volumes.
However, the main pollutants of water in Lake Issyk-Kul are hydrocarbons andheavymetals. Contamination by oil productsmostly results from refuelling of heatingsystems near the lake, and refuelling of vehicles and other equipment near and on thelake. Boating on Lake Issyk-Kul does not require permissions and is not efficientlycontrolled. According to data for 1975–1982, accidental spillage of hydrocarbonscaused pollution in the shoreline zone of the lake where average concentrations ofoil products ranged from 0.0 to 0.69 mg/l. Seasonal fluctuations varied from 0.0 to1.87 mg/l (Karmanchuk and Kadyrov 1986). The concentrations of oil products inthe deep-water region of the lake were lower with averages in a range from 0.05 to

202 A. O. Podrezov et al.
0.20 mg/l, and seasonal maxima not exceeding 0.50 mg/l. Highest concentrations ofoil products were recorded in the Balykchy Gulf (1.4–37 times higher than the MACof 0.05 mg/l), in the Tyup Gulf (1.2–9.6 times MAC), the eastern Cholpon-Ata Bay(1.4–15 times MAC) and in the Kadji Sai River mouth (1.4–6.4 times MAC).
During the period from 1985 to 1992, the contamination of lake waters by oilproducts had decreased due to thewide introduction ofwastewater treatment facilitiesin resorts and other recreational housing complexes, the establishment of sanitationzones near the lake, the ban of hydrocarbon shipment by water-borne transportationmeans, and the movement of oil storage facilities away from the shoreline.
During 1998–2000, concentrations of oil products had decreased to 0.001–0.005mg/l in the Balykchy Gulf, to 0.0–0.003mg/l at the northern shore of Cholpon-Ata, to 0.0–0.18 mg/l at the southern shoreline, and to 0.0–0.02 mg/l in the Tyupand Dzhergalan gulfs. The decreasing contamination by oil products was mainlysubstantiated by economic difficulties of the Kyrgyz Republic following the inde-pendence from the Soviet Union in 1991. The termination of operational activitiesof industrial enterprises and the reduction in tourist numbers caused a decrease ofdischarged wastewaters and fostered the lake rehabilitation.
Monitoring during 2015–2018 showed that oil-product concentrationswere belowthe MAC across the whole lake area apart from the Balykchy Gulf. There, concen-trations of oil products ranged from 0.07 to 0.14 mg/l (or 1.4–2.8 timesMAC). In theCholpon-Ata Bay near the Choktal and Grigorievka villages, the oil-product concen-trations increased, even during the period prior to the tourism season. Concentrationsof oil products exceeded the MAC after the tourism season when values of 1.3–2.4times the MAC were recorded in coastal waters. The increase of oil-product concen-trations during and after the tourism season mostly results from the more intensiveoperation of water-born transportation means using leaded petrol and diesel.
Phenols in near-shore waters have concentrations between 0.0 and 0.014 mg/l.Concentrations of phenols were below detection limit in the open part of the lake.
According to monitoring data during the years 2015–2018, the biological oxygendemand (BOD) as proxy of the degree of organic pollution of water is within norms(MAC 3.0 milligrams of oxygen consumed per litre of sample during five days ofincubation at 20 °C (mg/l)) in Lake Issyk-Kul. The BOD is in a range from 0.19 to2.88 mg/l. Values are 0.30–1.29 mg/l along the southern shore, 0.12–1.71 mg/l nearthe northern shore, 0.55–1.86 mg/l in the Balykchy Gulf, and 2.10–2.54 mg/l in theTyup Gulf and near Karakol city.
Concentrations of heavy metals such as copper, zinc, lead, mercury and cadmiumwere monitored in surface waters (upper 0.5 m) in the year 2000. Analysis of surfacewaters in the shoreline zone of Kadji Sai village and in the eastern bay of Cholpon-Ata revealed maximum copper concentrations of 0.009 and 0.008 mg/l, respectively,clearly exceeding the MAC of 0.001 mg/l. Higher concentrations of copper wereobserved in the deeper part of the lake where concentrations of 0.004 mg/l wererecorded on average and 0.026 mg/l at maximum.Monitoring results from the period2015–2018 have shown that concentrations of heavy metals such as zinc, cobalt,cadmium, lead, chromium and arsenic in the water of Lake Issyk-Kul are belowMACs.

6 Lake Issyk-Kul: Its History and Present State 203
One of the country’s largest dump sites for radioactive waste originating fromuranium mining during the Soviet era is situated at the Kadji Sai village on thesouthern shore of Lake Issyk-Kul. Remediation of the uranium mining tailing dumpcontinues until today to reduce the radiation load on the local population. Accordingto Mikkola (2012), monitoring of the uranium contamination of water is not done ina consistent way and the potential contamination of fish stocks was not assessed yet.
A major accident related to the gold mining at the Kumtor gold mine ca. 80 kmsouth of Issyk-Kul occurred on May 20, 1998. A truck overturned on the road to themine and caused a major spill of some 1700–1800 kg of highly poisonous sodiumcyanide, used for gold extraction, in the Barskoon River. Approximately 4000 res-idents of the Barskoon village some 8 km downstream of the spillage and near thesouthern shore of Lake Issyk-Kul had to be evacuated of which 2000 sought medicalcare afterwards. Following clean-ups with hypochlorite, analyses by a laboratory ofthe national sanitary-epidemiological station under the Agency for Geology and Nat-ural Resources revealed that cyanide concentrations in the river, in irrigation channelsand Lake Issyk-Kul were below the MAC on May 27, 1998, and later on. However,the accident highlights the vulnerability of Lake Issyk-Kul and its surroundings tosources of potential severe pollution.
Long-termmonitoring of water pollution in the periods from 1975–1982 to 1985–1992 showed that anthropogenic activities in the Issyk-Kul Basin affected the chem-ical composition of lake water in the coastline area. Negative effects of insufficientwastewater treatment and accidental spillages caused increased concentrations of oilproducts, detergents and phenols, and heavy metals. Most affected regions of thelake are the Balykchy Gulf, the eastern bay of Cholpon-Ata, and the waters near theKadji Sai village and in the Ton Gulf on the southern shore. Higher concentrationsof pollutants occur also in the eastern part of the lake in the Tyup and Dzhergalangulfs.
So far, Issyk-Kul waters are mostly affected by anthropogenic activities in thecoastal region of the lake with depth not exceeding 50 m. Lake water in its centraland deep parts is not significantly impacted yet, as a result of the slow dynamicsin a large and deep lake. However, better wastewater treatment, better controls ofpotential contamination with respect to households and industrial and agriculturalsources, improved monitoring and the better implementation of existing environ-mental regulations are required to inhibit the slow and continuous degradation ofLake Issyk-Kul’s environmental status.
References
Abuduwaili J, Issanova G, Saparov G (2019) Hydrographical and physical-geographical character-istics of the Issyk-Kul Lake Basin and use of water resources of the basin, and impact of climatechange on it. In: Abuduwaili J, Issanova G, Saparov G (eds) Hydrology and limnology of centralAsia, Springer, pp 297–357
AlamanovA,MikkolaH (2011) Is biodiversity friendly fisheriesmanagement possible on Issyk-KulLake in the Kyrgyz Republic? Ambio 40:479–495

204 A. O. Podrezov et al.
Azykova EK (1991) Landscapes. Issyk-Kul, Naryn. Encyclopedia. GRKSE, Frunze, pp 56–62 (inRussian)
Bakov EK (1983) Trends of movement and dynamics of glaciers of the Central Tien Shan. Ilim,Frunze 157pp (in Russian)
Bondarev LG (1978) Fluctuations of level based on archaeological and historical data. In: KoralevVG (ed) Lake Issyk-Kul. Frunze, Ilim, pp 112–117 (in Russian)
Bulin VM, Romanovsky VV (1975) Thermal bar of Lake Issyk-Kul. The problems of Kyrgyzstan’sgeography. Llim, Frunze, pp 122–123 (in Russian)
DDWSSD (Department of Drinking Water Supply and Sewerage Development under the StateAgency for Architecture, Construction and Public Utilities under the Government of KyrgyzRepublic), 2018. Issyk-Kul Wastewater Management Project (RRP KGZ 50176). Report for thethe Asian Development Bank, 194pp
De Batist M, Imbo Y, Vermeesch P, Klerkx J, Giralt S, Delvaux D, Lignier V, Beck C, Kalugin I,Abdrakhmatov KE (2002) Bathymetry and sedimentary environments of Lake Issyk-Kul, Kyr-gyz Republic (Central Asia): a large, high-altitude, tectonic lake. In: Klerkx J, ImanackunovB (eds) Lake Issyk-Kul: its natural environment. Springer NATO Science Series IV, Earth andEnvironmental Sciences, vol 13, pp 101–123
Folian LA (1981) Zooplankton of Lake Issyk-Kul. Biological basis of fishery of Central Asia andKazakhstan water bodies. Thesis of XVII scientific conference. Llim, Frunze, pp 389–390
Gebhardt AC, Naudts L, De Mol L, Klerkx J, Abdrakhmatov K, Sobel ER, De Batist M (2017)High-amplitude lake-level changes in tectonically active Lake Issyk-Kul (Kyrgyzstan) revealedby high-resolution seismic reflection data. Clim Past 13:73–92
Giralt S, Julià R, Klerkx J, Riera S, Leroy S, Buchaca T, Catalan J, De Batist M, Beck C, BobrovV, Gavshin V, Kalugin I, Sukhorukov F, Brennwald M, Kipfer R, Peeters F, Lombardi S, Maty-chenkov V, Romanovsky V, Podsetchine V, Voltattorni N (2004) 1000-year environmental historyof lake Issyk-Kul. In: Nihoul JCJ, Zavialov PO, Micklin PP (eds) Dying and dead seas climaticversus anthropic causes. Springer NATO Science Series IV, Earth and Environmental Sciences,vol 36, pp 253–285
Gronskaya TP (1983) Water balance and anticipated water levels in Lake Issyk Kul. Abstract,Dissertation thesis, Leningrad, 16p (in Russian)
Hermann L (2017) Rock art sites on the northern bank of Lake Issyk-Kul, in Kirghizstan. INORA78:1–10
HoferM, Peeters F, Aeschbach-HertigW, BrennwaldM, Holocher J, Livingstone DM, RomanovskiV, Kipfer R (2002) Rapid deep-water renewal in Lake Issyk-Kul (Kyrgyzstan) indicated bytransient tracers. Limnol Oceanogr 47:1210–1216
KadyrovVK (1986)Hydrochemistry of Lake Issyk-Kul and its basin. Ilim, Frunze 212p (inRussian)Kadyrov VK, Karmanchuk AR (1964) About content of some elements in Lake Issyk-Kul water.Microelement in water of Lake Issyk-Kul. Frunze (2):101–106 (in Russian)
Karmanchuk AR, Kadyrov VK (1986) Influence of anthropogenic activities on water quality inthe shoreline zone of Lake Issyk-Kul. Study of natural water’s chemical composition formationprocess under conditions of anthropogenic impacts. Hydrometisdat, Leningrad, 71pp (in Russian)
Kipfer R, Peeters F (2002) Using transient conservative and environmental tracers to study waterexchange in Lake Issyk-Kul. In: Klerkx J, Imanackunov B (eds) Lake Issyk-Kul: its naturalenvironment. Springer NATO Science Series IV, Earth and Environmental Sciences vol 13, pp89–100
Kiselev IA (1932) In the phytoplankton of Lake Issyk-Kul. Mémoires de l’Institut Hydrologique7:65–94 (in Russian)
Krivoshei ML, Gronskaya TP (1986) Water balance of Lake Issyk Kul. In: Shnitnikov AV (ed)Studies of Large Lakes in the USSR. Nauka, Leningrad, pp 276–280 (in Russian)
Kulumbaeva AA (1982) Phytoplankton of Lake Issyk-Kul. Llim, Frunze, 106pp (in Russian)Kutzeva PP (1980) Balance of chemical elements in Lake Issyk-Kul. Studies of water balance,thermal and hydrochemical regime of Lake Issyk-Kul. Hydrometisdat, Leningrad, pp 71–77 (inRussian)

6 Lake Issyk-Kul: Its History and Present State 205
Lyons WB, Welch KA, Bonzongo J-C, Graham EY, Shabunin G, Gaudette HE, Poreda RJ (2001)A preliminary assessment of the geochemical dynamics of Issyk-Kul Lake, Kirghizstan. LimnolOceanogr 46:713–718
Matukova TG (1958) Stonewort of Lake Issyk-Kul. Transactions of Biology and Soil Departmentof the Kyrgyz State University. Issue 7, Frunze, pp 43–49 (in Russian)
Matveev VP (1935) Hydrochemical studies of Lake Issyk-Kul in 1932. Lake Issyk-Kul. Materialson hydrology, ichthyology and fishery. Published by AS USSR, T. 111(2):7–56 (in Russian)
MikkolaH (2012) Implication of alien species introduction to loss of fish biodiversity and livelihoodson Issyk-Kul Lake in Kyrgyzstan. In: Lameed GSA (ed) Biodiversity enrichment in a diverseworld, IntechOpen. https://doi.org/10.5772/48460
Mokrynin VP, Ploskikh VM (1988) Issyk-Kul: Sunken towns. Ilim, Frunze, 190pp (in Russian)Narama C, Kubota J, Shatravin VI, Duishonakunov M, Moholdt G, Abdrakhmatov K (2010) Thelake-level changes in central Asia during the last 1000 years based on historicalmap. In:WatanabeM, Kubota J (eds) Reconceptualizing cultural and environmental change in central Asia: anhistorical perspective on the future. Ili Project, Research Institute for Humanity and Nature,Kyoto, pp 11–27
PavlovaMV (1964) Zoobenthos of Lake Issyk-Kul gulfs and its consumption by fishes. Ilim, Frunze,84pp (in Russian)
Pavlova MV (1983) Biology and production of Limnaea (Radix auricularia (L.)) var. obliquataMartens in Lake Issyk-Kul. Limnological investigations in Kyrgyzstan. Ilim, Frunze, pp 34–47(in Russian)
Peeters F, Finger D, HoferM, BrennwaldM, Livingstone DM, Kipfer R (2003) Deep-water renewalin Lake Issyk-Kul driven by differential cooling. Limnol Ocean 48:1419–1431
Pivnev IA (1990) Fishes of Kyrgyzstan. Ilim, Frunze, 138pp (in Russian)Podrezov OA (1985) The strong wind regime in Issyk-Kul, Kochkor and Karakufjur basins. TransSANIGMI 23:48–53
Podrezov AO, Pavlova IA (2003) The dangerous meteorological phenomena on the territory ofKyrgyzstan. Book 1. The strong wind regime. Published by KRSU, Bishkek, 114pp (in Russian)
Podrezov OA, Dikikh AN, Bakirov KB (2001) Instability of climatic conditions and glaciation ofTien Shan for the last 100 years. Newsletter of KRSU, Chapter 1. Bishkek, pp 33–40
Ricketts RD, Johnson TJ, Brown ET, Rasmussen KA, Romanovsky VV (2001) The Holocenepaleolimnology of Lake Issyk-Kul, Kyrgyzstan: Trace element and stable isotope compositionof ostracodes. Palaeogeogr Palaeoclimatol Palaeoecol 176:207–227
Romanovsky VV (1990) The Natural Complex of Lake Issyk-Kul. Ilim, Frunze 168pp (in Russian)Romanovsky VV (2002a) Water level variations and water balance of Lake Issyk-Kul. In: KlerkxJ, Imanackunov B (eds) Lake Issyk-Kul: its natural environment. NATO Science Series (SeriesIV: Earth And Environmental Sciences), vol 13, Springer, Dordrecht, pp 45–59
RomanovskyVV (2002b)Hydrobiology of Lake Issyk-Kul. In: Klerkx J, ImanackunovB (eds) LakeIssyk-Kul: its natural environment. NATO Science Series (Series IV: Earth And EnvironmentalSciences), vol 13, Springer, Dordrecht, pp 27–45
Romanovsky VV, Shabunin G (2002) Currents and vertical water exchange in Lake Issyk-Kul. In:Klerkx J, Imanackunov B (eds) Lake Issyk-Kul: its natural environment. Springer NATO ScienceSeries IV, Earth and Environmental Sciences vol 13, pp 77–89
Romanovsky VV, Kuzmichonok VA,Mamatkanov DM, Podrezov SA (2004) All about Lake Issyk-Kul: Questions and answers. Kyrgyz-Russian Slavic University Bishkek, 407pp (in Russian)
Rosenwinkel S, Landgraf A, Schwanghart W, Volkmer F, Dzhumabaeva A, Merchel S, Rugel G,Preusser F, Korup O (2017) Late Pleistocene outburst floods from Issyk Kul, Kyrgyzstan? EarthSurf Proc Land 42:1535–1548
SalamatA,Abuduwaili J, ShaidyldaevaN (2015) Impact of climate change onwater level fluctuationof Issyk-Kul Lake. Arab J Geosci 8:5361–5371
Savvaitova K, Petr T (1992) Lake Issyk-Kul, Kirgizia. Int J Salt Lake Res 1:21–46

206 A. O. Podrezov et al.
Sevastianov DV (1991) Historical and archaeological data about alteration of shores and lake levelfluctuations. In: Treshnikov AF (ed) The History of Lakes Sevan, Issyk-Kul, Balkhash, Zaisan,and Aral. Nauka, Leningrad, pp 90–96 (in Russian)
Shukurov ED (1991) Fauna of Issyk-Kul basin in connection with its environmental status. Faunaand ecology of terrestrial vertebrates of Kyrgyzstan. Ilim, Bishkek, pp 37–48 (in Russian)
Stavissky YS (1977) Water temperature dynamics of Lake Issyk-Kul. Papers of the Central-Asian Scientific Research Institute of Hydrometeorology, vol 50, pp 75–80. The dangerousmeteorological phenomena on the territory of Kyrgyzstan
Trofimov AK (1990) Quaternary deposits of the Issyk-Kul depression related to its tectonics. ProcAcad Sci, Kirghiz SSR 1:87–95 (in Russian)
Vereschagin AP (1991) Wintering birds of the eastern part of Issyk-Kul basin. Fauna and ecologyof terrestrial vertebrate species of Kyrgyzstan. Ilim, Bishkek pp 69–85 (in Russian)
Vinnik DF, Lesnichenko NS, Sanarova AV (1978) Works at Issyk-Kul: archaeological findings in1977. Nauka, Moscow (in Russian)
Vishnyatsky LB (1999) The Paleolithic of Central Asia. J World Prehistory 13:69–122Vollmer MK, Weiss RF, Williams RT, Falkner KK, Qiu X, Ralph EA, Romanovsky VV (2002)Physical and chemical properties of the waters of saline lakes and their importance for deep-waterrenewal: Lake Issyk-Kul, Kyrgyzstan. Geochim Cosmochim Acta 66:4235–4246

Chapter 7Lop Nur in NW China: Its Natural State,and a Long History of Human Impact
Steffen Mischke, Chenglin Liu and Jiafu Zhang
Abstract Lop Nur is a large salt-crust covered playa in the eastern part of the TarimBasin in northwestern China. Its centre was filled by a lake with a surface area ofmore than 2000 km2 in the early 1930s for the last time. Geological evidence andhistorical documents indicate that a large hyperhaline lake existed in the Lop NurBasin until ca. 2000 years ago. Most regions of the former lake basin desiccatedwhen the Chinese Empire was extended towards the arid and semi-arid regions inthe west during the Han Dynasty as a result of water withdrawal from the tributariesof Lop Nur for irrigation farming. Surface water inflow in Lop Nur is probablymostly controlled by the intensity of farming activities in the catchment of the lakesince that time. Current trends in population increase, claiming of arable land andindustrialization upstream of Lop Nur imply that the ancient lake region will remaindry in the future.
Keywords Xinjiang · Tarim Basin · Lake history · Irrigation farming · Desiccation
7.1 Introduction
Lop Nur is a large groundwater-discharge playa and the base level of China’s largestendorheic river system. The Tarim River is the largest river of the Tarim Basinwhich covers a vast area of 530,000 km2 (Ma et al. 2010; Fig. 7.1). The river flows
S. Mischke (B)Institute of Earth Sciences, University of Iceland, Sturlugata 7, 101 Reykjavík, Icelande-mail: [email protected]
C. LiuInstitute of Mineral Resources, Chinese Academy of Geological Sciences, 26 BaiwanzhuangRoad, Beijing 100037, Chinae-mail: [email protected]
J. ZhangMOE Laboratory for Earth Surface Processes, Department of Geography, College of Urban andEnvironmental Sciences, Peking University, Shaw Building No. 2, Haidian District, Beijing100871, Chinae-mail: [email protected]
© Springer Nature Switzerland AG 2020S. Mischke (ed.), Large Asian Lakes in a Changing World, Springer Water,https://doi.org/10.1007/978-3-030-42254-7_7
207

208 S. Mischke et al.
Fig. 7.1 Physiography of Central and Eastern Asia and location of Lop Nur (black dot) in theeastern Tarim Basin
eastwards along the northern margin of the Tarim Basin supported by numeroustributaries which drain the Tianshan (shan = mountains) in the north (Figs. 7.1 and7.2). Mountain ranges in the west (the Pamirs Plateau), south (the Kunlunshan) andsoutheast (the Altun Mountains) are partly higher than 4000 m above sea level (asl).Together with lower ranges in the east (Beishan) and northeast (Kuruk Tagh, part ofthe eastern Tianshan), they shield the basin from moist air masses of oceanic origin.A lake existed in the eastern part of the basin until the late 1930s or early 1940s whendiminishing inflows resulted in the formation of a mostly salt-covered playa in anarea of 20,000 km2 (Li et al. 2008; Fig. 7.3). The lowest region in the centre of theremarkable earlike structure when seen from space lies at ca. 780 m asl. The centraland western parts of the Tarim Basin are occupied by the second largest sand sea onEarth, the Taklamakan Desert (Fig. 7.2). Dunes and gravel plains cover wide regionsalso in the southern vicinity of the playa whilst wind-eroded remnants of alluvialand lacustrine sediments (called yardangs) occur in its northern vicinity (Shao et al.2012).
The Lop Nur region is located in a hyperarid part of Central Asia far from the seasand shaded by highmountain ranges.Mean annual precipitation forRuoqiang 230 kmto the southwest of the Lop Nur playa was 22.9 mm in the observational period from1953 to 1990 (WorldClimate, www.worldclimate.com). Potential evaporation is ashigh as 3500 mm per year. Mean annual, January and July temperatures in Ruoqiangare 11.6, −8.0 and 27.4 °C, respectively.
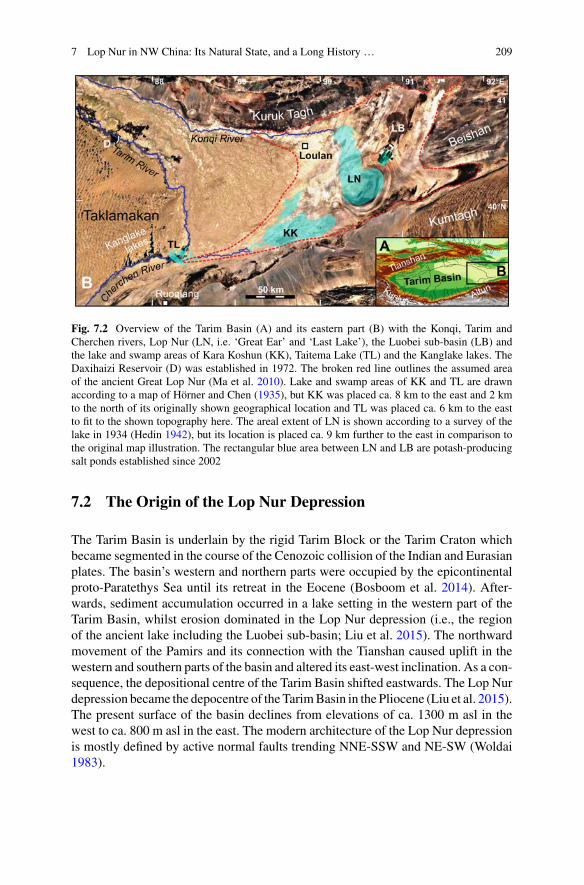
7 Lop Nur in NW China: Its Natural State, and a Long History … 209
Fig. 7.2 Overview of the Tarim Basin (A) and its eastern part (B) with the Konqi, Tarim andCherchen rivers, Lop Nur (LN, i.e. ‘Great Ear’ and ‘Last Lake’), the Luobei sub-basin (LB) andthe lake and swamp areas of Kara Koshun (KK), Taitema Lake (TL) and the Kanglake lakes. TheDaxihaizi Reservoir (D) was established in 1972. The broken red line outlines the assumed areaof the ancient Great Lop Nur (Ma et al. 2010). Lake and swamp areas of KK and TL are drawnaccording to a map of Hörner and Chen (1935), but KK was placed ca. 8 km to the east and 2 kmto the north of its originally shown geographical location and TL was placed ca. 6 km to the eastto fit to the shown topography here. The areal extent of LN is shown according to a survey of thelake in 1934 (Hedin 1942), but its location is placed ca. 9 km further to the east in comparison tothe original map illustration. The rectangular blue area between LN and LB are potash-producingsalt ponds established since 2002
7.2 The Origin of the Lop Nur Depression
The Tarim Basin is underlain by the rigid Tarim Block or the Tarim Craton whichbecame segmented in the course of the Cenozoic collision of the Indian and Eurasianplates. The basin’s western and northern parts were occupied by the epicontinentalproto-Paratethys Sea until its retreat in the Eocene (Bosboom et al. 2014). After-wards, sediment accumulation occurred in a lake setting in the western part of theTarim Basin, whilst erosion dominated in the Lop Nur depression (i.e., the regionof the ancient lake including the Luobei sub-basin; Liu et al. 2015). The northwardmovement of the Pamirs and its connection with the Tianshan caused uplift in thewestern and southern parts of the basin and altered its east-west inclination. As a con-sequence, the depositional centre of the Tarim Basin shifted eastwards. The Lop Nurdepression became the depocentre of the TarimBasin in the Pliocene (Liu et al. 2015).The present surface of the basin declines from elevations of ca. 1300 m asl in thewest to ca. 800 m asl in the east. The modern architecture of the Lop Nur depressionis mostly defined by active normal faults trending NNE-SSW and NE-SW (Woldai1983).

210 S. Mischke et al.
Fig. 7.3 Geomorphological sketch map of the Lop Nur region simplified following Wang et al.(2005), and locations of dug pits and drilled sediment cores (1 ZKD0014, 2 CK-2, 3 ZK95-6, 4section Ma, 5 K1, 6 F4, 7 YKD0301, 8 L07-10, 9 Luo4). Cemented sands occur in discharge areasof springs. Location of springs in south according toMa et al. (2010). The ‘Last Lake’ represents anarea where a topographic map from 1942 indicated an open water surface (Li et al. 2008), however,its underlying evidence is unclear
7.3 The Ancient Pleistocene and Holocene Lake
Drilled sediment cores from the Lop Nur region provide evidence that a large lakeexisted from the early Pleistocene and prevailed until the earliest stage of the middlePleistocene (Liu and Wang 1999). A 1050-m core from the western margin of theTaitema Lake area shows that predominantly fluviolacustrine silts, clays and argilla-ceous limestones were deposited at a relatively constant sediment accumulation ratesince at least ca. 7 million years (Chang et al. 2012). Clay and silt dominate the sed-iments but the lack of preserved pollen since ca. 6 million years possibly indicatesprevailing playa or fluvial depositional settings in the Taitema Lake area (Hao et al.2012). Clayey and silty sediments in the 100-m long core K1 in the northern partof the ‘Great Ear’ (also called East Lake) suggest that a lake existed in the Lop Nurarea since at least 1.2 million years (Wang et al. 2000). Drilled cores from the Luobeiregion indicate that shallow lacustrine, fluvial and aeolian sediments accumulatedfurther to the northeast since the early Pleistocene (Lü et al. 2015). Research of

7 Lop Nur in NW China: Its Natural State, and a Long History … 211
yardangs mainly composed of fine-grained fluvial and lacustrine sediments in theKumtagh Desert in the east of Lop Nur also suggests that a large lake existed in theregion in the early and middle Pleistocene (Qu et al. 2004; Lin et al. 2005).
Geomorphological evidence for a large ancient lake in the Lop Nur region inthe late Pleistocene is present as wave-cut platforms and gravelly shoreline bars.Erosional platforms and shoreline bars are well preserved in the NE section of theancient lake (Ma et al. 2010). Wang et al. (2008) inferred that a lake of >55,000 km2
size occupied the region ca. 130,000–90,000 years ago. A size of ca. 20,000 km2
was suggested for a period ca. 30,000 years ago and of 9250 km2 for the middleHolocene ca. 7500–7000 years ago (Wang et al. 2008). Analyses of sediment coreCK-2 (50.14 m length) from the Luobei sub-basin indicate that deposits were appar-ently continuously formed in a relatively stable lake in the sub-basin between 32 and9 ka (Luo et al. 2009). Holocene sediments recovered from dug sections and drilledcores in the ‘Great Ear’ region are generally dominated by fine-grained deposits thatcontain gypsum and other soluble salts (Sect. 7.5; Fig. 7.4). There is no evidence fordesiccation periods earlier than ca. 1800 years ago, supporting the reconstruction ofa large perennial and mostly hyperhaline lake in the Lop Nur region in the early andmiddle Holocene (Liu et al. 2016; Mischke et al. 2019).
Fig. 7.4 Early Holocene clastic sediments from core ZKD0014 (lower part) in the northernmostpart of the Luobei sub-basin overlain by middle and late Holocene salt deposits (upper part; Liuet al. 2008). Sediment core location shown in Fig. 7.3

212 S. Mischke et al.
7.4 Early Human Impact on the Hydrology of Lop Nur
Lop Nur developed into a salt-crust covered playa since its final desiccation in thelate 1930s or early 1940s (Li et al. 2008). Direct evidence for stagnant surface waterin the Lop Nur region for the last time before its desiccation originates from detailedreports of SvenHedinwho explored the lake in a canoe in the summer of 1934 (Hedin1942). He reported that the lake was large but mostly very shallow with a depth ofonly 20 cm (Fig. 7.2). Freshwater filled its northern part near the inflow of the KonqiRiver whilst the main water body was saline (Hörner 1932; Hörner and Chen 1935;Hedin 1942). The lake floor was dry in the years 1900 and 1901whenHedin exploredthe region. Corona and Landsat imagery from 1961 and starting in 1972, respectively,captured the astonishing ‘Great Ear’ structure in the lowermost part of the basin butalso showed that the region was dry (Li et al. 2008). The existence of surface watersin the western part of the Lop Nur Basin and a ‘Last Lake’ stage was suggested ina topographic map published in 1942 in the Soviet Union which was later adoptedby many authors (Li et al. 2008; Fig. 7.3). However, the underlying evidence for theinference of the ‘Last Lake’ stage of Lop Nur is unclear.
In contrast to short-lived and very shallow (<1 m) water bodies in the Lop NurBasin in the twentieth century, Han Shu, the historical book of the Han Dynasty(Han Dynasty: 206 BCE–220 CE) described a large water body in the region whichwas called ‘Puchang Sea’ (Ban, 92; i.e., originally published in 92 CE). This ‘sea’covered an estimated area of 18,000–31,000 km2 and, as the name implies,was a largebrackish or salinewater body (Yang et al. 2006). Themodern topographyof the ‘GreatEar’ region suggests that the ‘Puchang Sea’ had a maximum depth of at least 5.2 m(Li et al. 2008). The ancient Silk Road oasis Loulan flourished during these days, andbranches of the Tarim River ran to the north and south of the oasis and entered thelake farther in the east (Figs. 7.2 and 7.3). The assessment of historical documentsand archaeological data led to the conclusion that the Tarim River had changed itsprevious flow fromwest to east between 330 and 400CE towards a southern direction(Fig. 7.2; Hedin 1942; Zhao andXia 1984;Wang 1996). As a consequence, the TarimRiver branches near Loulan were left dry. Near-desiccation of the ‘Puchang Sea’ ca.1800 years ago was reconstructed from the first occurrence of a sand layer in theYKD0301 section following the relatively uniform accumulation of silty sedimentssince the onset of sediment formation at the section base ca. 9400 years ago (Liuet al. 2016; Mischke et al. 2017). The Loulan oasis became abandoned between ca.230 ± 66 CE (youngest dated organic material from the ruined city; Lü et al. 2009)and 645 CE when the monk Xuanzang travelled the region (Xuanzang, 645; Qinet al. 2012; Mischke et al. 2017). However, the river-course change between 330and 400 CE likely resulted in the abandonment of Loulan. Increasing aridity due toregional climate change was discussed as the most likely reason of the fall of theLoulan Kingdom and of other desert oases in the region, and of the expansion ofaeolian sands (Zhang et al. 2003, 2011; Yang et al. 2006; Lü et al. 2009; Dong et al.2012; Qin et al. 2012). In contrast, a recent assessment of palaeoclimate studies fromnorthwestern China, southern Mongolia and adjoining regions further to the west

7 Lop Nur in NW China: Its Natural State, and a Long History … 213
by Mischke et al. (2017, 2018) showed that regional climate was relatively wetterduring the time of Loulan’s fall. As a consequence, Mischke et al. (2017, 2018)argued that water withdrawal from tributaries of Lop Nur caused diminishing run-off farther downstream and eventually led to the collapse of the Loulan Kingdom andnear-desiccation of Lop Nur. Water withdrawal from these tributaries was used forintensifying irrigation farming practices which probably reached maximum activityduring the westward expansion of the Chinese Empire of the Han Dynasty. Remainsof intensive irrigation farming such as channels, dams and reservoirs were reportedfrom the region and river water was probably distributed on large cultivated fieldsduring the HanDynasty (Yang et al. 2006; Lü et al. 2009; Zhang et al. 2011; Qin et al.2012). Pollen grains and phytoliths of cereal grasses and Vitaceae were recorded ingypsum-encrusted B horizons of soils in the region suggesting that common millet,foxtail millet and possibly naked barley, and grapes were intensively cultivated ca.2000 years ago (Qin et al. 2012; Zhang et al. 2012a). Thus, the ‘natural’ state ofLop Nur cannot be assessed based on descriptions from the last century or even thelast millennium if the history of significant human impacts on Lop Nur’s hydrologystarted already during the Han Dynasty 2000 years ago. Geological proxy recordsfrom the Lop Nur region have to be assessed to reconstruct the more or less naturalconditions of the lake during times without significant man-made alterations of itshydrology.
7.5 The Natural State of Lop Nur Before the Han Dynasty
Sediments of dug sections or drilled cores from the ‘Great Ear’ region pre-datethe Han Dynasty a few decimetres or a metre beneath the surface and probablyrepresent lake conditions without significant human impact on Lop Nur (Ma et al.2008; Liu et al. 2016). Unfortunately, the chronological control of shallow sectionsand cores from the Lop Nur region is only poorly constrained by typically one tothree radiocarbon dating results per location. The only exception is the YKD0301pit in the western part of the ‘Great Ear’ where four radiocarbon samples and tenoptically stimulated luminescence (OSL) samples yielded Holocene ages (Fig. 7.3;Zhang et al. 2012b). The YKD0301 section and also other sections in the ‘Great Ear’and ‘Last Lake’ region of Lop Nur (sections or cores F4, K1, L07-10, Luo4, Ma,ZK95-6; Fig. 7.3) are composed of fine-grained sediments described as silt and clayor mud (Yan et al. 1983; Zheng et al. 1991; Wang et al. 2000; Liu et al. 2003, 2016;Ma et al. 2008; Hua et al. 2009). Detailed grain-size data available for the Holoceneparts of the sections or cores YKD0301, ZK95-6, Ma and K1 show that the detritalsediments have a relatively uniform mean or median grain size in the fine to mediumsilt range (8–31 µm; Wang et al. 2000; Liu et al. 2003, 2016; Ma et al. 2008).Carbonate, gypsum or relatively high concentrations of soluble salts are reportedfrom these sediments (Liu et al. 2003, 2016; Hua et al. 2009). Mischke et al. (2019)inferred hyperhaline conditions with salinities exceeding 100‰ during the middleand late Holocene based on the abundance of ooids and gypsum minerals. Thus, a

214 S. Mischke et al.
permanent saline lake and significant distances between section or core locations andcontemporaneous delta and shore regions can be inferred for the Holocene prior tothe Han Dynasty. Detrital sediment accumulation was apparently dominated by fine-grained suspension load from inflowing rivers and fine dust particles. The presenceof gypsum and more soluble salts indicates a high salinity of ca. five times of thoseof sea-water, or even higher (Fig. 7.4). Modern brines of gypsum-bearing sedimentsin the region indicate the beginning of gypsum formation at a salinity of ca. 188‰(Sun et al. 2016). Accordingly, most sediments of these sections do not containfossils that are typically found in the deposits of freshwater to slightly brackish lakessuch as gastropod or bivalve shells, ostracod valves or fish remains (Mischke andWünnemann 2006; Mischke and Zhang 2011; Mischke et al. 2019).
In contrast, valves of the highly salt-tolerant brackish water ostracods Eucyprismareotica (reported as Eucypris inflata in Wang et al. (1999) or as ‘Eucypsis inflata’in Zheng et al. (1991), i.e., Eucypris inflata, a younger synonym of E. mareotica)and Cyprideis torosa (reported as Cyprideis littoralis in Zheng et al. (1991) andWang et al. (1999) which is the unnoded form of C. torosa, i.e., C. torosa formalittoralis) were reported from early Holocene sediments of the sections YKD0301,F4 and core K1 (Liu et al. 2016). In addition, tests of the foraminifer Ammoniatepida morphotype were recorded in the sediments of the YKD0301 section and theK1 core (as A. beccarii in the latter). A brackish to hyperhaline lake with a salinity ina range from ca. 20–100‰ in the early Holocene was inferred from the wide salinitytolerance ranges of the two ostracod species, the lack of typical freshwater (sensulato - s.l.) ostracods and the observation of living Ammonia tepida in a hyperhalinepool with seasonal salinity fluctuations between 40 and 55‰ in Israel (Almogi-Labinet al. 1992; Meisch 2000; Mischke et al. 2019). This inference is supported by theoccurrence of elongate in addition to subspherical ooids which were likely formedaround fecal pellets of brine shrimps (Mischke et al. 2019). In addition to theseearly Holocene remains of a brackish to hyperhaline lake, valves of freshwater (s.l.)ostracodswere reported from a few earlyHolocene samples of sectionYKD0301 anda single sample of presumably late Holocene age of the section Ma (Ma et al. 2008;Liu et al. 2016). However, the absence of similar fossils from most parts of middleand late Holocene sediments in the Lop Nur region, the presence of gypsum and/ormore soluble salts in these sediments and those of subspherical and elongate ooids inthe YKD0301 section imply that salinities were mostly higher than levels supportingA. tepida in Lop Nur after the early Holocene. Salinities were probably continuouslyor at least from time to time higher than ca. 188‰ to enable gypsum formation in thelake. Accordingly, sediment cores from the Luobei region and its vicinity indicatethat Lop Nur was a brackish lake in the early Holocene and a highly saline lake withthe massive formation of halite starting in the middle Holocene (Fig. 7.4; Liu et al.2008).

7 Lop Nur in NW China: Its Natural State, and a Long History … 215
7.6 Reported Fauna and Flora of the Lake Before the Onsetof Significant Human Impact
Organism remains from water bodies in the Lop Nur region before the Han Dynastywere reported for sections YKD0301 and F4 and for core K1. These locations arewithin the ‘Great Ear’ region and regarded to represent the ancient Great Lop Nur(Figs. 7.2 and 7.3).
7.6.1 Gastropoda
A single shell ofGyraulus sp. was recorded in sediments of section YKD0301 whichwere formed ca. 8500 years ago (Table 7.1; Mischke et al. 2019). Lymnaea shells(‘Limnæa, at least three species’; Hörner 1932)were reported forQuaternary exposedsediments in the Lop Nur region.
7.6.2 Ostracoda
Valves of Eucypris mareotica and Cyprideis torosa were recorded in early Holocenesediments of sections YKD0301, F4 and core K1 (Table 7.1; Zheng et al. 1991;Wang et al. 1999; Liu et al. 2016). Valves of Cyprinotus sp. (likely Heterocypris,possiblyHeterocypris salina) were recorded in addition toE.mareotica andC. torosaat the F4 site, indicating meso- or polyhaline conditions. Holocene sediments fromYKD0301which were formed ca. 8000 years ago also contain abundant valves of thespeciesLimnocythere inopinata,Cypridopsis vidua and Ilyocypris sp.whilst valves ofDarwinula stevensoni, Pseudocandona sp., C. torosa, E. mareotica, Neglecandonaneglecta and Herpetocypris sp. were only occasionally recorded (Table 7.1). Theassemblage probably represents the Holocene period with most diluted, only slightlybrackishwaters inLopNur.A fewvalves and fragments ofL. inopinata and Ilyocyprisbradyi were also recorded in early and middle Holocene sediments of core ZK95-6(Wang et al. 2001). In addition, some valves of N. neglecta and Cypricercus werealso found in a late Holocene sediment bed of 6 cm thickness at the ZK95-6 location(Table 7.1; Wang et al. 2001).
7.6.3 Foraminifera
Ammonia tepida (reported as Ammonia beccarii) was recorded in late Quaternarysediments of the K1 core by Wang et al. (1999; Table 7.1). The foraminifera inthe sediments of the K1 core were discussed to originate from the relict fauna of

216 S. Mischke et al.
Table 7.1 Organism remains from Holocene pre-human impact sediments of Lop Nur (n.d. nodata)
Taxon Location Reported as Source
Gastropoda
Gyraulus sp. YKD0301 Mischke et al. (2019)
Lymnaea sp. 1 n.d. Limnæa, three species Hörner (1932)
Lymnaea sp. 2 n.d. Limnæa, three species Hörner (1932)
Lymnaea sp. 3 n.d. Limnæa, three species Hörner (1932)
Ostracoda
Neglecandona neglecta YKD0301 Mischke et al. (2019)
ZK95-6 Wang et al. (2001)
Cypricercus sp. ZK95-6 Wang et al. (2001)
Cyprideis torosa YKD0301 Liu et al. (2016)
F4 Cyprideis littoralis Zheng et al. (1991)
K1 Cyprideis littoralis Wang et al. (1999)
Cypridopsis vidua YKD0301 Liu et al. (2016)
Cyprinotus sp. F4 Zheng et al. (1991)
Darwinula stevensoni YKD0301 Liu et al. (2016)
Eucypris mareotica YKD0301 Liu et al. (2016)
F4 Eucypsis inflata Zheng et al. (1991)
K1 Eucypris inflata Wang et al. (1999)
Herpetocypris sp. YKD0301 Mischke et al. (2019)
Ilyocypris bradyi ZK95-6 Wang et al. (2001)
Ilyocypris sp. YKD0301 Liu et al. (2016)
Limnocythere inopinata YKD0301 Liu et al. (2016)
ZK95-6 Wang et al. (2001)
Pseudocandona sp. YKD0301 Mischke et al. (2019)
Foraminifera
Ammonia tepida K1 Ammonia beccarii Wang et al. (1999)
YKD0301 Mischke et al. (2019)
Macrophyta
Ruppia maritima YKD0301 Mischke et al. (2019)
Typha F4 Zheng et al. (1991)
YKD0301 Liu et al. (2016)
Charophyta
Chara sp. K1 Wang et al. (1999)
Charophyta indet. YKD0301 Mischke et al. (2019)
Hornichara cf.kasakstanica
K1 Wang et al. (1999)
(continued)

7 Lop Nur in NW China: Its Natural State, and a Long History … 217
Table 7.1 (continued)
Taxon Location Reported as Source
Lamprothamnium cf.papulosum
K1 Wang et al. (1999)
the Eocene sea in the Tarim Basin region. Abundant tests of Ammonia tepida werealso recorded in the early Holocene sediments of the YKD0301 section. The taxonwas probably also recorded in late Quaternary sediments of salt lakes of the TibetanPlateau (from Lakes Tianshuihai and Xiao Qaidam, identified as Elphidium? sp. orElphidium sp., respectively) and from sub-recent surface sediment samples fromGahai Lake in the Qaidam Basin (Tibetan Plateau) and the Heiyenur Pool in InnerMongolia (asAmmonia) together with valves of the brackishwater ostracodEucyprismareotica (reported as E. inflata; Sun et al. 1992, 1997; Li et al. 1997). Livingspecimens of Ammonia tepida were recorded in an artificially created hyperhalinepool in Israel (salinity 39.7–54.5‰) which was colonized by means of migratorybirds (Almogi-Labin et al. 1992). Thus, the monospecific occurrence of Ammoniatepida in Lop Nur in the early Holocene probably resulted from the colonization ofthe lake during a favourable stable brackish to saline water period.
7.6.4 Sub- and Emerged Macrophytes
Seeds of the aquatic macrophyte Ruppia maritima were recovered from earlyHolocene sediments of section YKD0301 in the western ‘Great Ear’ region(Table 7.1; Mischke et al. 2019). Ruppia maritima has a wide salinity range from0.6 to 390‰ and a salinity optimum between ca. 5–22‰ (Kantrud 1991). Relativelyhigh abundances of Typha pollen in early Holocene sediments of sections YKD0301and F4 probably indicate local origins and suggest that marginal and shallow partsof the lake were covered by bulrush.
7.6.5 Charophyta
Remains ofLamprothamnium cf.papulosum,Hornichara cf. kasakstanica andCharasp. were also recorded in the late Quaternary sediments of core K1 (Table 7.1;Wang et al. 1999). Charophyte oogonia and gyrogonites were also recorded in earlyHolocene sediments of the YKD0301 section but were not further identified yet(Mischke et al. 2019).

218 S. Mischke et al.
7.6.6 Inference of lake conditions based on organism remains
Holocene sediments of the YKD0301 section contain abundant valves ofE. mareotica and C. torosa, Ammonia tests and a few Ruppia seeds and charo-phyte remains in the lower part of the sediment sequence deposited earlier than ca.9000 years. A similar ostracod assemblage was recorded at the F4 and K1 loca-tions with the latter similarly representing evidence for the wide-spread occurrenceof Ammonia tepida in the brackish to saline lake. The subsequently deposited mid-dle and late Holocene sediments which were formed before the onset of significanthuman impact only occasionally contain fossil ostracod valves or other remains ofaquatic organisms. The lake was likely too saline to support a higher aquatic faunaand flora. Thus, hyperhaline conditions are inferred as the ‘natural’ state of Lop Nurfor most of the middle and late Holocene.
7.7 Lop Nur Since the Onset of Significant Human Impact
7.7.1 Lop Nur During the Period from Han to Qing Dynasties
Historical documents suggest that a large lake existed in the Lop Nur region twomillennia ago (Ban, 92; Yang et al. 2006). The first occurrence of a sand layer indeposits of the YKD0301 section ca. 1800 years ago, the fall of the Loulan Kingdomsometime between 230 and 645CE and the contemporary and stepwise abandonmentof the desert oasis along the Keriya and Niya rivers in the Tarim Basin starting inthe basin’s centre were used to argue that water withdrawal for irrigation farmingupstream Lop Nur caused an environmental crisis similar to the modern Aral Seadisaster already almost two millennia ago (Qin et al. 2012; Mischke et al. 2017). LopNur apparently experienced a period of man-made near-desiccation ca. 1800 yearsago. Historical books such as the History of the Former Han (Han Shu,汉书), theHistory of the Later Han (Hou Han Shu, 后汉书), Shui Jing Zhu (水经注) fromthe Northern Wei Dynasty (386–534 CE) and Geography of Shazhou (Sha ZhouTu Jing,沙州图经残卷) from the Tang Dynasty (618–907 CE) were examined byYang (2004) who showed that Lop Nur covered a relatively small area in the firstmillennium of the common era (Fig. 7.5). The lake area was between ca. 50 and110 km2 which is similar to 1/20 or 1/10 of the size of Xinjiang’s largest Lake Bosten(ca. 1000 km2) today (Yang 2004). The Geography of the Source Region of theYellow River (He Yuan Ji Lue, 河源纪略) and Records and Maps of the WesternRegions (Xi Yu Tu Zhi, 西域图志) provide contrary information for the reign ofEmperor Qianlong (1735–1796 CE) in the earlier part of the Qing Dynasty (1636–1912 CE) with reported areas of ca. 6700 and 120 km2, respectively (Yang 2004).The discrepancy in passed on lake-area information does not necessarily result fromerroneous estimations but possibly reflects a large variability over time. Accordingto the assessment of the Records of Water Channels in Western Territories (Xi Yu

7 Lop Nur in NW China: Its Natural State, and a Long History … 219
Fig. 7.5 Reported area of Lop Nur (LN) based on historical documents assessed by Yang (2004)and Yang et al. (2006) since Han Dynasty times. Near-desiccation periods were inferred from sandlayers in section YKD0301 (Liu et al. 2016; Mischke et al. 2017). Desiccation of the ‘Great Ear’occurred in the late 1930s or early 1940s (Li et al. 2008). The large lake areas reported for the 1930sand 1940s and tagged by question marks are probably misleading estimates (Xia 1987)
Shui Dao Ji,西域水道记) and theGeneral Introduction of the Great Qing (Da QingYi Tong Zhi,大清一统志), and archaeological data by Yang et al. (2006), the formerlarge ‘Puchang Sea’ of Han Dynasty times was replaced by the smaller Lop Nur anda number of additional lakes in the region during the Qing Dynasty. Lop Nur as thelargest lake covered an area of several thousand km2, and the total area covered bywater may have still amounted ca. 11,000 km2 which is ca. eleven times the size ofLake Bosten (Yang et al. 2006). Historic sources also imply that irrigated farmlandswere significantly smaller during the Qing Dynasty in comparison with Han Dynastytimes. Thus, the increase in the area of Lop Nur during Qing times probably resultedat least partly from reduced water withdrawal from its tributaries (Yang et al. 2006).A relatively small area of ca. 50 km2 is reported in the Illustrated Handbook ofInspection (Tan Cha Tu Shuo,探查图说) for the late Qing Dynasty between 1874and 1911 (Fig. 7.5).
Sediments believed to have accumulated between ca. 1100 and 300 years agoat the section Ma location contain valves of freshwater (s.l.) ostracods, gastropodshells and remains of sub- and emerged macrophytes (Ma et al. 2008; Table 7.3).The ostracod andmollusc fauna and plant assemblage indicate oligohaline to slightlyor moderately mesohaline conditions, and remains of wetland plants suggest near-shore or generally very shallow conditions. These inferences are consistent with the

220 S. Mischke et al.
described replacement of the large ‘Puchang Sea’ of the Han Dynasty by a numberof smaller and probably shallower lakes. The location of the section Ma in the ‘LastLake’ region of Lop Nur is close to potential positions of the Konqi and Tarim Riverdeltas implying relatively fresh to slightly brackish conditions at the section locationeven if the main water body of the lake was more brackish or even saline (Fig. 7.3).
7.7.2 The Shrinkage of Lop Nur and Its Final Desiccationin the Twentieth Century
A large body of stagnant water in the Lop Nur Basin was eyewitnessed for the lasttime in 1934 when the lake covered an area of ca. 2400 km2 in the ‘Great Ear’and ‘Last Lake’ region (Hörner and Chen 1935; Hedin 1942; Figs. 7.2, 7.3 and 7.5;Table 7.2). The water depth was mostly 0.2 m although ca. 1 m were occasionallymeasured. The area became probably flooded since ca. 1921 (Hörner and Chen 1935;Hedin 1942; Table 7.2). The Lop Nur region was found dry in 1900, 1901 and 1906(Table 7.2). However, according to Xia (1987), a relatively large water body mayhave already existed in the basin in 1914 (Fig. 7.5).
A detailed topographic survey and assessment of aerial and satellite images of the‘Great Ear’ region by Li et al. (2008) showed that the ‘Great Ear’ represents a formerlake basin with maximum depth of 5.2 m near its centre, which dried between the late1930s and early 1940s. The concentric rings of the ‘Great Ear’ region were identifiedas trails of former shorelines characterized by differences in surface roughness ofthe salt crust, groundwater-controlled moisture content of surficial sediments and theratio of salt and detrital sediments (Fig. 7.6; Li et al. 2008; Dong et al. 2012). Earlierviews that these rings represent morphologically distinct recessional shoreline bars(beach bars) and thus, significant changes in surface relief are not supported by fielddata (Zhou 1978;Dong et al. 2012).Ma et al. (2010) suggested that a permanentwaterbody in the Lop Nur Basin eventually dried after 1952 when the Tarim River inflowwas dammed and turned towards the south. Geomorphological maps of the Lop Nurregion produced in the Soviet Union and China suggest that the lake still covered alarge area in 1942 (Xia 1987). However, it is unclear whether the drawing of thesemaps was based on the descriptions of the lake from the early 1930s by Hörner andChen (1935) and Hedin (1942) or whether they actually reflect a later state (Fig. 7.5).An ephemeral water body may have occasionally formed in the ancient terminal fanand ‘Last Lake’ regions when the Konqi River flooded these parts of the Lop NurBasin during extraordinarily wet years. However, since Landsat imagery becameavailable in 1972, significant flooding was recorded only once in the terminal fanregion of the Konqi River in June 1973 (Ma et al. 2010).
A salt crust covers the lowest region in Lop Nur since its final desiccation whichbuilds up a playa surrounded by dry saline mudflats (Fig. 7.6). Pore space of uncon-solidated clastic sediments beneath the salt crust in the centre is filled with concen-trated brines and the sediments contain primary and secondary gypsum. Discharging

7 Lop Nur in NW China: Its Natural State, and a Long History … 221
Table7.2
Reportedwater
bodies
intheLop
Nur
region
during
thelastca.1
50years.The
‘GreatEar’structurewas
notrecognizedas
such
before
theuseof
airborne
imagery
Region
Area(km
2)
Max.D
epth
(m)
Salin
ityTim
eReferences
Taite
maLakea
~375
1.2
Prob.F
reshwater
Febr
1877
Prejevalsky(1879)
KaraKoshunb
~1500
4.0
freshw
ater
Febr
1877
Prejevalsky(1879)
KaraKoshun
n.d.
n.d.
n.d.
1876–1877
HörnerandChen(1935)
‘GreatEar’
0(dry)
n.d.
n.d.
Mar
1900
andMar
1901
Hedin
(1942)
KaraKoshun
n.d.
0.8
n.d.
1900
and1901
Hedin
(1942)
KaraKoshun
n.d.
Reedy
swam
pandponds
n.d.
Dec
1905
Huntin
gton
(1907)
‘GreatEar’
0(dry,saltcovered)
n.d.
n.d.
Jan1906
Huntin
gton
(1907)
KaraKoshun
n.d.
n.d.
Freshw
ater
Before1921
HörnerandChen,
1935
‘LastL
ake’
and‘G
reat
Ear’
2375
1m
Salty
but0
.3‰
inN
1930,1
931and1934
HörnerandChen(1935),
Lietal.(2008)
‘GreatEar’
3006
n.d.
n.d.
1942
Xiaetal.(2002)
‘GreatEar’
Partly
filledc
n.d.
n.d.
Aug
1958
Maetal.(2008)
‘GreatEar’
0(dry)
n.d.
n.d.
1958
Lietal.(2008)
‘LastL
ake’
Partly
filled
n.d.
n.d.
1958
Shao
etal.(2012)
(contin
ued)

222 S. Mischke et al.
Table7.2
(contin
ued)
Region
Area(km
2)
Max.D
epth
(m)
Salin
ityTim
eReferences
Eph
emerallake
atno
rth
bank
ofLNbasin
900
0.5
0.5‰
Fall1959
Zhou(1978)
inMaetal.
(2010)
Taite
maLake
880.8
n.d.
1959
ZhaoandXia(1984)
‘GreatEar’
0(dry)
n.d.
n.d.
Dec
1961
Maetal.(2008)
‘LastL
ake’
Smallareain
Sn.d.
n.d.
Dec
1961
Maetal.(2008)
‘LastL
ake’
d660
n.d.
n.d.
1962
Xiaetal.(2002)
Mouth
ofKonqi
River
n.d.
n.d.
n.d.
June
1973
Maetal.(2010)
a calledKaraBuran
inoriginalrepo
rtbregarded
asLop
Nur
inoriginalreport
c apparently
wrong
accordingto
Lietal.(2008)
andevidence
ofairphotographsfrom
1958
dregion
notindicated
butlakedescribedas
N-S-alig
nedwater
body

7 Lop Nur in NW China: Its Natural State, and a Long History … 223
Fig. 7.6 High micro-relief of salt crust in the central part of the ‘Great Ear’ region (photo by HuaZhang, Nov. 2015)
groundwater supports numerous moist salt pans in the playa where formation ofevaporites resulted in a 30–120 cm thick salt crust above lacustrine sediments (Wanget al. 2001). According to the study of the radioactive hydrogen isotope tritium insubsurface brines in the Lop Nur region by Jiao et al. (2004), the Na+ and Cl−ions dominated shallow brine aquifer in the region mostly represents modern watersrecharged in recent decades. At present, groundwater recharge occurs as a result ofoccasional local atmospheric precipitation and flood events in the adjacent mountainregions. Some small springs at the southern margin of the basin are fed by watersfrom the Altun Mountains and contribute slightly mesohaline water to the ‘GreatEar’ region (Fig. 7.3).
7.8 Fauna and Flora of Lop Nur Since the Han Dynasty
Information with respect to organisms in the waters of the Lop Nur region duringthe last two millennia is very rare. Organism remains are only reported from theuppermost 80–30 cm of section Ma in the centre of the ‘Last Lake’ and are assumed

224 S. Mischke et al.
to represent deposition between 1100 and 300 years ago (Ma et al. 2008). However,the chronology of the 3.3-m thick section Ma is based on three radiocarbon ageswithout an assessment of the commonly occurring lake-reservoir effect, and the agedata should be therefore regarded with caution. Additional information about livingorganisms in waters of the Lop Nur region was provided in reports starting in thelate nineteenth century.
7.8.1 Gastropoda
Shells of the gastropods Radix auricularia, Lymnaea stagnalis (reported as Lymnacascaynalis) and of Planorbidae were recorded in the upper 80–30 cm of the sedimentsof section Ma in the ‘Last Lake’ but more detailed information with respect totheir position within the section and related age was not provided (Ma et al. 2008;Fig. 7.3; Table 7.3). The assemblage indicates oligohaline to very slightlymesohalineconditions (<7‰) consistent with a shallow lake and the river inflow near the locationof the section (Glöer 2002).
7.8.2 Ostracoda
Sediments from section Ma which are believed to have formed 800–400 years agorevealed ostracod valves of Eucypris mareotica (reported as E. inflata; Ma et al.2008; Table 7.3). A single sample possibly formed 500 years ago contained valves ofCyprideis torosa. In addition, valves of Limnocythere inopinata, Darwinula steven-soni, Candoniella albicans (possibly juvenile candonid valves sometimes reportedas Candoniella albicans valves in Chinese sources), Pseudocandona compressa(reported as Candona compressa but placed into Pseudocandona today) and Can-dona sp. were recovered from uppermost sediments in the section which were prob-ably accumulated ca. 300 years ago (Ma et al. 2008). Valves of Eucypris mareoticawere the only ones found in five of the examined six samples indicating that waterin the ‘Last Lake’ region was mostly brackish to saline during the last ca. 900 years.Only a single sample from 33 cm depth (possibly accumulated ca. 300 years ago)contained valves of the other taxa listed above, suggesting a period of relatively freshconditions at the section location (Ma et al. 2008).
7.8.3 Fish
Abundant fish was reported from the shallow waters of Lop Nur in 1934 (Hedin1942). Possibly, thefishwith described lengths of up to110 cmrepresent specimensofCoregonus maraenawhichwere earlier described fromKara Koshun (misinterpreted

7 Lop Nur in NW China: Its Natural State, and a Long History … 225
Table 7.3 Organisms and remains recorded during the human-impact period of Lop Nur
Taxon Location Reported as Source
Gastropoda
Lymnaea stagnalis section Ma Lymnaca scaynalis Ma et al. (2008)
Planorbidae section Ma Ma et al. (2008)
Radix auricularia section Ma Ma et al. (2008)
Ostracoda
Candona sp.a section Ma Candoniella albicans Ma et al. (2008)
Cyprideis torosa section Ma Ma et al. (2008)
Darwinula stevensoni section Ma Ma et al. (2008)
Eucypris mareotica section Ma Eucypris inflata Ma et al. (2008)
Limnocythere inopinata section Ma Ma et al. (2008)
Pseudocandonacompressa
section Ma Candona compressa Ma et al. (2008)
Pisces
Coregonus maraenab Kara Koshun Prejevalsky (1879)
Lop Nur Hedin (1942)
Cyprinidae Kara Koshun Prejevalsky (1879)
Triplophysa yarkandensis Kanglake lakes Jiang et al. (2011)
Macrophyta
Butomus Kara Koshunc Prejevalsky (1879)
Hippuris Kara Koshunc Prejevalsky (1879)
Phragmites?d Kara Koshunc Prejevalsky (1879)
Potamogeton lucens section Ma Ma et al. (2008)
Schoenoplectustabernaemontani
section Ma Scirpus tabernaemontani Ma et al. (2008)
Stuckenia pectinata section Ma Potamogeton pectiatus Ma et al. (2008)
Typha Kara Koshunc Prejevalsky (1879)
Charophyta
Chara spp. section Ma Ma et al. (2008)
Bacillariophyceae
Navicula sp. section Ma Ma et al. (2008)
aValves reported as Candoniella albicans are often juvenile valves of Candona. Ma et al. (2008)recorded also one broken valve of Candona sp., possibly belonging to the same species as theassumed juvenile valves. However, one specimen illustrated by Ma et al. (2008) and termed‘Condoniella sp.’ is actually a valve of D. stevensonibdescribed as fish with lengths of up to 110 cm, probably C. maraenacoriginally reported as Lop Nur but considered as Kara Koshun by Hörner and Chen (1935) andothersdreported as ‘reed’, taxonomic assessment not clear

226 S. Mischke et al.
as Lop Nur) by Prejevalsky (1879; Tables 7.2 and 7.3). In addition to Coregonusmaraena, another unidentified taxon of the carp (Cyprinidae) family was reportedby Prejevalsky for Kara Koshun in 1877 (Prejevalsky 1879). Jiang et al. (2011)reported that Triplophysa (Hedinichthys) yarkandensis occurs in the Kanglake lakes(Fig. 7.2).
7.8.4 Sub- and Emerged Macrophytes
Seeds of the aquatic submerged macrophytes Stuckenia pectinata (reported as Pota-mogeton pectiatus but placed into Stuckenia today) and Potamogeton lucens, andof the sedge Schoenoplectus tabernaemontani (reported as the younger synonymScirpus tabernaemontani) were recorded in sediments of the section Ma regardedto have formed 1100–300 years ago (Ma et al. 2008; Table 7.3). The occurrenceof P. lucens suggests a shallow water depth of 0.5-2.0 m whilst emerged wetlandsedges indicate very shallow depth or patches of open-water surfaces and exposedregions (van Geest et al. 2005). The presence of Stuckenia pectinata suggests oligo-to moderately mesohaline waters (Kantrud 1990). Dense patches of reed accompa-nied by other emerged aquatic plants (Hippuris, Typha and Butomus) were reportedfor the Kara Koshun in 1877 (Prejevalsky 1879).
7.8.5 Charophyta
Charophyte oogonia or gyrogonites, assigned to Chara spp., were recorded in twosediment samples of section Ma believed to have formed ca. 500 and 300 years ago(Ma et al. 2008; Table 7.3).
7.8.6 Diatoms
Frustules of the diatom Navicula sp. were recorded in sediments of section Ma withan assumed age of ca. 400 years (Table 7.3).

7 Lop Nur in NW China: Its Natural State, and a Long History … 227
7.9 Impacts on the Catchment Hydrology After Lop Nur’sDesiccation
Hydrological changes in the catchment of Lop Nur during recent decades are causedby the population increase and the associated intensification of farming and recla-mation of newly irrigated farmlands since the foundation of the PR of China in 1949(Hao et al. 2008; Chen et al. 2011). The population of the Tarim Basin has increasedfive times between 1950 and 1995 (Xu et al. 2010). The area of cultivated farmlandalong the Tarim River was almost doubled between 1949 (349,820 ha) and 1994(607,050 ha; Chen et al. 2011). Canals of more than 1000 km lengths and more than70 reservoirs of various sizes were built (Xu et al. 2008). The total irrigated area inthe Tarim Basin reached 1.63 million ha in 2008 (Chen et al. 2011). A water vol-ume of ca. 5 billion m3 was diverted for irrigation in the 1950s which was increasedto 20.2 billion m3 in 2008. As a consequence of such significant increase in waterconsumption for irrigation and other urban and industrial purposes, discharge in thelower section of the Tarim River decreased in the 1990s to ca. 25% of the runoffwhich was recorded in the late 1950s, although discharge in its headwaters increasedduring the same period of time (Hao et al. 2008). Runoff in headwaters increased as aresult of global warming. A slight precipitation increase was accompanied by highertemperatures which caused enhancedmeltwater discharge. Thus, the largest tributaryof the Tarim River, the Aksu River experienced a runoff increase by ca. 50% betweenthe late 1950s and the end of the twentieth century (Thevs 2011). However, this sig-nificant increase of runoff in the upper reaches of the Tarim River in recent decadeswas by far not sufficient to compensate for the water withdrawal in the middle andlower reaches. Following the construction of the Daxihaizi Reservoir with a capacityof 228 million m3 and surface area of 104 km2 in 1972, the lowermost 321 km of theTarim River desiccated (Zhao and Xia 1984; Chen et al. 2011; Fig. 7.2). The pointof zero flow moved ca. 100 km upstream until the 1990s and to the upper reaches ofthe river in 2009. As a result, the ca. 1200 km long section of the middle and lowerreaches of the Tarim River desiccated seasonally or permanently.
The runoff decrease in the middle and lower reaches of the Tarim River wasaccompanied by a salinity increase due to evaporative concentration of river water inreservoirs and salinization of irrigated fields resulting from inadequate drainage sys-tems of irrigated farmlands. Consequently, the salinity of the Tarim River increasedfrom less than 1‰ before 1958 to 2.9‰ on average or even 6.8‰ at maximum mea-sured in the years 1999 and 2000 downstream of the Daxihaizi Reservoir (Xu et al.2008).
The decrease of the runoff of the Tarim River had also negative impacts on thegroundwater level in the lower reaches. Following the establishment of the DaxihaiziReservoir, groundwater levels close to the reservoir fell to ca. 5 m below the surfaceand to a depth of ca. 12 m farther downstream (Xu et al. 2008).
The area ofmany riparian forests such as the ‘GreenCorridor’ north of the TaitemaLake region between the Taklamakan Desert in the west and the Kuluke Desertin the east decreased causing the mobilization of aeolian sands and damages to

228 S. Mischke et al.
infrastructure such as roads. The total area covered by Populus euphratica along thelower reaches of the Tarim River decreased from 5.4× 10⁴ ha in the 1950s to 1.64×10⁴ ha in the 1970s and to 0.67× 10⁴ ha in the 1990s (Xu et al. 2008). The programme“Comprehensive Governing and Managing on Tarim River” was established in June2001 by the Central and Provincial Governments which led to the recovery of runoffin the lower reaches of the Tarim River and the re-establishment and expansion ofTaitema Lake. However, highly variable annual discharge in the lower reaches ofthe Tarim River causes large areal changes of Taitema Lake (Ablekim et al. 2014).Discharge of the Cherchen River was also relatively high in the first years of thetwenty-first century which led to the significant expansion of the Kanglake lakes andwetlands farther in the west of Taitema Lake (Ablekim et al. 2014). As a result of theexpansion of these lakes andwetlands in the lower reaches of the Tarim andCherchenrivers, sand and dust storm impacts in the Ruoqiang County in the southwest of LopNur were effectively reduced in recent years.
The salt-crust covered playa of Lop Nur is exploited for potash production since2004. Potassium-rich brines are pumped to the surface and further concentrated inartificially created evaporation ponds in the northeastern part of the Lop Nur region(Figs. 7.2 and 7.7). The SDIC (State Development& Investment Corp. Ltd.) XinjiangLuobupo Hoevellite Co. Ltd has established a system for the annual production of1.3 million tons of potassium sulfate from the underground brines in Lop Nur (Sunand Ma 2018). However, the natural balance between groundwater recharge and
Fig. 7.7 Evaporation pond for potash production in the northeast of the ‘Great Ear’ (photo by HuaZhang, Nov. 2015)
7 Lop Nur in NW China: Its Natural State, and a Long History … 229
brine formation and composition is negatively affected by the mining activity now.Groundwater depression cones have formed as a result of the water extraction andthe slow lateral flow of brines towards pumping stations. Thus, long-term potashproduction perspectives are uncertain.
The salt crust in the Lop Nur region covers a vast area and sand storms potentiallycause erosion and mobilization of salt particles (Fig. 7.3). Volumes of exported salts,main dispersal paths and potential damages to farmlands were not investigated sofar but lessons from other large salt-covered regions and nearby farmlands provideevidence for severe effects of wind-blown salts on crop production and health oflocal people (Razakov and Kosnazarov 1996).
A possible return of Lop Nur to its lake state as it was experienced in the early1930s is not realistic. Given a continuation of present trends of population growthand associated farming activities and industrialization in the region, the Lop NurBasin will remain a salt-crust covered playa without the re-establishment of naturalperennial lacustrine conditions in the envisaged near future. Current focus of environ-mental protection and ecological preservation is laid on Lop Nur’s former tributariesand associated riparian vegetation. The Tarim River BasinWater Resource Commis-sion (TRBWRC) was founded in 1997 in order to implement an integrated waterresource management system and to allocate quotas for river water diversion in theTarim River catchment. Water management measures with the aim to restore riparianenvironments and promote sustainable development in the lower reaches of the TarimRiver were established with the Regulation Scheme of the Tarim River in the year2002 (Thevs 2011). Two canals were built in 2002 to divert water from the KonqiRiver to the lower Tarim River. They led to the partial restoration of vegetation alongriver branches in the lower reaches of the Tarim River (Xu et al. 2008). However,water withdrawal for cotton farming in the upper reaches of the Tarim River (alongits main tributary, the Aksu River) is not controlled by the TRBWRC but by the Xin-jiang Production and Construction Corps (XPCC). Thus, water withdrawal for theXPCC farms along the Aksu River and uncontrolled drilling of wells and groundwa-ter extraction along the entire course of the Tarim River by local farmers inhibits theyear-round flow of the river in the middle and lower reaches (Thevs 2011). Strength-ening of the position of the TRBWRC and a stricter allocation of water quotas, andbetter control of groundwater extraction are required for a sustainable development offarming in the Tarim Basin and maintenance of a unique riparian ecosystem within ahyperarid desert. Efforts to preserve and partly restore the vegetation along the lowerTarim River will require permanent adjustments of water quotas, improvements ofwater-saving irrigation techniques and the partial replacement of cotton as the majorcrop by the utilization of naturally occurring plants due to the continuously increas-ing water demand, the large natural variability of precipitation and generated runoff,and also due to expected meltwater reductions of diminishing ice and snow resourcesin coming years of global warming.

230 S. Mischke et al.
7.10 Summary and Conclusions
Lop Nur was a perennial, large and brackish to saline lake with a few metres waterdepth until ca. two millennia ago. Diversion of water for irrigation-based agriculturein the upper and middle reaches of its tributaries during the expansion of the Chineseempire in the Han Dynasty caused a significant reduction of inflows and probablyresulted in the near-desiccation of the lake ca. 1800 years ago. Afterwards, floodingof the lake basin or of depressions in its vicinity highly depended on irrigationfarming activities on the one hand side and precipitation and flood events in wetteryears, meltwater discharge in warmer summers, and river course changes due tosediment accumulation and wind erosion of exposed dry surfaces. The case of LopNur impressively shows that the human degradation of lakes in northwestern Chinais not only confined to relatively recent centuries but may have started already ca.2000 years ago.
Acknowledgements We are indebted to Hua Zhang who kindly provided photos from the LopNur region and to Li Zhang for translation of Chinese publications. Research work on Lop Nur wasfunded by grants from China’s NSF (projects 40830420, 41771004) and the Ministry of Scienceand Technology of China (the National 305 Project 2003BA612A-06-15).
References
Ablekim A, Kasimu A, Kurban A, Jappar T, Fan Z (2014) Monitoring the water area changes inTetima-Kanglayka lakes region over the past four decades by remotely sensed data. J Lake Sci26:46–54
Almogi-Labin A, Perelis-Grossovicz L, Raab M (1992) Living Ammonia from a hypersaline inlandpool, Dead Sea area, Israel. J Foramin Res 22:257–266
Ban G (92) Han Dynasty. 92. Reprinted in 1962 by Zhonghua Book Company, BeijingBosboom R, Dupont-Nivet G, Grothe A, Brinkhuis H, Villa G, Mandic O, Stoica M, Huang W,Yang W, Guo Z, Krijgdman W (2014) Linking Tarim Basin sea retreat (west China) and Asianaridification in the late Eocene. Basin Res 26:621–640
ChangH,AnZ,LiuW,QiangX,SongY,AoH (2012)Magnetostratigraphic andpaleoenvironmentalrecords for aLateCenozoic sedimentary sequencedrilled fromLopNor in the easternTarimBasin.Glob Planet Change 80–81:113–122
Chen Y, Ye Z, Shen Y (2011) Desiccation of the Tarim River, Xinjiang, China, and mitigationstrategy. Quat Int 244:264–271
Dong Z, Lv P, Qian G, Xia X, Zhao Y, Mu G (2012) Research progress in China’s Lop Nur. EarthSci Rev 111:142–153
Glöer P (2002) Die Süßwassergastropoden Nord- und Mitteleuropas. Hackenheim, ConchBooks,327pp (in German)
Hao H, Ferguson DK, Chang H, Li C-S (2012) Vegetation and climate of the Lop Nur area, China,during the past 7 million years. Clim Change 113:323–338
Hao X, Chen Y, Xu C, Li W (2008) Impacts of climate change and human activities on the surfacerunoff in the Tarim River Basin over the last fifty years. Water Resour Manage 22:1159–1171
Hedin S (1942) Der wandernde See. Brockhaus, Leipzig, p 295 (in German)Hörner N, Chen PC (1935) Alternating lakes. Some river changes and lake displacements in CentralAsia. Geogr Ann 17:145–166
7 Lop Nur in NW China: Its Natural State, and a Long History … 231
Hörner NG (1932) Lop-nor. Topographical and geological summary. Geografiska Annaler 14:297–321
Hua YS, Jiang PA, Wu HQ, Zhong JP, Ma LC, Li BG (2009) The sedimentary characteristics ofProfile L07-10 and its environmental indicator in Lop Nor “Great Ear” area. J Xinjiang AgricUniv 32:36–39 (in Chin with Engl abstract)
Huntington E (1907) Lop-Nor. A Chinese lake. Part I. The unexplored salt desert of Lop. Bull AmGeogr Soc 39:65–77
Jiang R, Lei M, Xiong J (2011) Observation on the reproductive characteristic of Triplophysa(Hedinichthgs) yarkandensis (Day) in kanglakes. J Aquaculture 32:30–34
Jiao P, Wang M, Liu C (2004) Characteristics and origin of tritium in the potassium-rich brine inLop Nur, Xinjiang. Nucl Tech 27:710–715 (in Chin with Engl abstract)
Kantrud HA (1990) Sago pondweed (Potamogeton pectinatus L.): a literature review. U.S. Fish andWildlife Service, Resource Publication 176, Washington DC, 89pp
Kantrud HA (1991) Wigeongrass (Ruppia maritima L.): a literature review. U.S. Fish and WildlifeService, Fish and Wildlife Research 10, 58pp
Li B, Ma L, Jiang P, Duan Z, Sun D, Qiu H, Zhong J, Wu H (2008) High precision topographicdata on Lop Nor basin’s Lake “Great Ear”? and the timing of its becoming a dry salt lake. ChinSci Bull 53:905–914
Li Y, Li B, Wang G, Li S, Zhu Z (1997) Quaternary foraminiferal fossil in the Tianshuihai are ofthe Qinghai-Xizang Plateau. Chin Sci Bull 42:1011–1014
Lin J, Zhang J, Ju Y, Wang Y, Lin F, Zhang J, Wang S, Wei M (2005) The lithostratigraphy,magnetostratigraphy, and climatostratigraphy in the Lop Nur region, Xinjiang. J Stratigr 29:317–322 (in Chin with Engl abstract)
Liu C, Jiao P, Chen Y, Wang M (2008) Late Pleistocene mirabilite deposition in the Lop Nur salinelake, Xinjiang, and its paleoclimate implications. Acta Geosci Sin 29:397–404 (in Chin with Englabstract)
Liu C, Jiao P, Lü F,WangY, Sun X, Zhang H,Wang L, Yao F (2015) The impact of the linked factorsof provenance, tectonics and climate on potash formation: an example from the potash depositsof Lop Nur depression in Tarim Basin, Xinjiang, Western China. Acta Geol Sin 89:2030–2047
Liu C, Zhang J, Jiao P, Mischke S (2016) The Holocene history of Lop Nur and its palaeoclimateimplications. Quat Sci Rev 148:163–175
Liu CL,WangML (1999) Evolution of quaternary depositional environments and forming of potashdeposits in Lop lake, Xinjiang, China. Acta Geosci Sin Suppl 20, 264–270 (in Chin with Englabstract)
Liu CL,WangML, Jiao PC, Li S, Chen YZ (2003) Holocene yellow silt layers and the paleoclimateevent of 8200 a BP in Lop Nur, Xinjiang, NW China. Acta Geol Sin (Engl Ed) 77:514–518
Lü F, Liu C, Jiao P, Yan H, Zhang H, Zhao Y, Wang L (2015) The discussion on sedimentarycharacteristics, phased evolution and controlling factors of saline lake in Asia interior: recordsfrom deep drill cores of LDK01 in Lop Nur, Xinjiang, northwestern China. Acta Petrol Sin31:2770–2782 (in Chin with Engl abstract)
Lü H, Xia X, Liu J, Qin X, Wang F, Yidilisi A, Zhou L, Mu G, Jiao Y, Li J (2009) A preliminarystudy of chronology for a newly discovered ancient city and five archaeological sites in Lop Nor,China. Chin Sci Bull 55:63–71
Luo C, Peng Z, Yang D, Liu W, Zhang Z, He J, Chou C (2009) A lacustrine record from Lop Nur,Xinjiang, China: implications for paleoclimate change during Late Pleistocene. J Asian Earth Sci34:38–45
Ma C, Wang F, Cao X, Li S, Li X (2008) Climate and environment reconstruction during theMedieval warm period in Lop Nur of Xinjiang, China. Chin Sci Bull 53:3016–3027
Ma L, Lowenstein TK, Li B, Jiang P, Liu C, Zhong J, Sheng J, Qiu H, Wu H (2010) Hydrochemicalcharacteristics and brine evolution paths of Lop Nor Basin, Xinjiang Province, Western China.Appl Geochem 25:1770–1782
Meisch C (2000) Freshwater Ostracoda of Western and Central Europe. Spektrum, Heidelberg,522pp

232 S. Mischke et al.
Mischke S, Liu C, Zhang J, Zhang C, Zhang H, Jiao P, Plessen B (2017) The world’s earliestAral-Sea type disaster: the decline of the Loulan Kingdom in the Tarim Basin. Sci Rep 7:43102
Mischke S, Wünnemann B (2006) The Holocene salinity history of Bosten Lake (Xinjiang,China) inferred from ostracod species assemblages and shell chemistry: possible palaeoclimaticimplications. Quat Int 154–155:100–112
Mischke S, Zhang C (2011) Ostracod distribution in Ulungur Lake (Xinjiang, China) and areassessed Holocene record. Ecol Res 26:133–145
Mischke S, Zhang C, Liu C, Zhang J, Jiao P, Plessen B (2019) The Holocene salinity history ofLake Lop Nur (Tarim Basin, NW China) inferred from ostracods, foraminifera, ooids and stableisotope data. Glob Planet Change 175:1–12
Mischke S, Zhang C, Liu C, Zhang J, Lai Z, Long H (2018) Landscape response to climate andhuman impact in western China during the Han Dynasty. In: Yang LE, Bork H-R, Fang X,Mischke S (eds) Socio-environmental dynamics along the historical Silk Road. Springer-NaturePress, Heidelberg, 45-66pp
Prejevalsky NM (1879) From Kulja, across the Tian Shan to Lob-Nor. Translated by E.D. Morgan.Including notices of the lakes of Central Asia. Sampson Low, Marston, Searle, & Rivington,London, 251pp
Qin X, Liu J, Jia H, Lu H, Xia X, Zhou L, Mu G, Xu Q, Jiao Y (2012) New evidence of agriculturalactivity and environmental change associated with the ancient Loulan kingdom, China, around1500 years ago. Holocene 22:53–61
Qu J, Zheng B, Yu Q, Zhao A (2004) The yarding landform of Aqik Valley in the east of Lop-Nurand its relationship with the evolution of the Kumtagh Desert. J Desert Res 24:294–300 (in Chinwith Engl abstract)
Razakov RM, Kosnazarov KA (1996) Dust and salt transfer from the exposed bed of the Aral Seaand measures to decrease its environmental impact. In: Micklin PP, Williams WD (eds) The AralSea Basin. NATO ASI Series (Series 2. Environment), vol 12. Springer, Berlin, 95–102pp
Shao Y, Gong H, Gao Z, Liu L, Li L, Zhang T (2012) SAR data for subsurface saline lacustrinedeposits detection and primary interpretation on the evolution of the vanished Lop Nur Lake. CanJ Remote Sens 38:267–280
Sun M, Ma L (2018) Potassium-rich brine deposit in Lop Nor basin, Xinjiang, China. Sci Rep8:7676
Sun X, Liu C, Jiao P, Yan H, Chen Y, Ma L, Zhang Y, Wang C, Li W (2016) A further discussion ongenesis of potassium-rich brine in Lop Nur: evaporating experiments for brine in gypsum-bearingclastic strata. Mineral Deposits 35:1190–1204 (in Chin with Engl abstract)
Sun Z, Yang F, Zhang Z, Li S, Li D, Peng L, Zeng X, Xu Y, Mao S, Wang Q (1997) Sedimentaryenvironments and hydrocarbon generation ofCenozoic salified lakes inChina. Petroleum IndustryPress, Beijing, 363pp
Sun Z, Zeng X, Chen K (1992) Discovery of foraminifera in the salt lake, Chaidamu Basin and itsgeological significance. Acta Petrolei Sin 13:252–257
Thevs N (2011)Water scarcity and allocation in the Tarim Basin: decision structure and adaptationson the local level. J Curr Chin Aff 40:113–137
van Geest GJ, Coops H, Roijackers RMM, Buijse AD, Scheffer M (2005) Succession of aquaticvegetation driven by reduced water-level fluctuations in floodplain lakes. J Appl Ecol 42:251–260
Wang F, Ma C, Xia X, Cao Q, Zhu Q (2008) Environmental evolution in Lop Nur since latePleistocene and its response to the global changes. Quat Sci 28:150–153
WangM, Huang X, Liu C, Li H, Zhao Z (1999) The discovery of foraminiferal fossils in cores fromhole KI in Lop Nur, Xinjiang. Geol Rev 45:158–162 (in Chin with Engl abstract)
Wang ML, Liu CL, Jiao PC, Han WT, Song SS, Chen YZ, Yang ZC, Fan WD, Li TQ (2001) Saline3 Lop Nur. Geological Publishing House, Beijing, Xinjiang (in China)
WangM, Liu C, Jiao P, Yang Z (2005)Minerogenic theory of the superlarge LopNur potash deposit,Xinjiang, China. Acta Geol Sin 79:53–65
WangM, PuQ, LiuC, ChenY (2000)Quaternary climate and environment in the LopNur, Xinjiang.Acta Geol Sin 74:273–278

7 Lop Nur in NW China: Its Natural State, and a Long History … 233
Wang S (1996) The changes of lower course of Tarim River in historical period. Arid Land Geogr19:10–17 (in Chin with Engl abstract)
Woldai T (1983) Lop-Nur (China) studied from Landsat and SIR-A imagery. ITC J 3:253–257Xia X (ed) (1987) The scientific expedition in Lop Nur. Science Press, Beijing, 325pp.夏训诚主编.罗布泊科学考察与研究.北京:科学出版社 (in Chinese)
Xia X, Mu G, Lei J (2002) Some new progress in scientific research on the Lop Nur Lake region,Xinjiang, China. Sci China (Ser D) 45:148–156
Xu H, Ye M, Li J (2008) The water transfer effects on agricultural development in the lower TarimRiver, Xinjiang of China. Agric Water Manage 95:59–68
Xu Z, Liu Z, Fu G, Chen Y (2010) Trends of major hydroclimatic variables in the Tarim River basinduring the past 50 years. J Arid Environ 74:256–267
Xuanzang (645) Datangxiyuji (Tang Dynasty). Reprinted in 1985 by Zhonghua Book Company,Beijing
Yan F, Ye Y, Mai X (1983) The sporo-pollen assemblage in the Luo-4 drilling of Lop Lake in UygurAutonomous Region of Xinjiang and its significance. Seismol Geol 5:75–80 (in Chin with Englabstract)
Yang Q (2004) Lop Nur is not a wandering lake: views from the evolution of Lop Nur. J Lake Sci16:1–9 (in Chin with Engl abstract)
Yang X, Liu Z, Zhang F, White PD, Wang X (2006) Hydrological changes and land degradation inthe southern and eastern Tarim Basin, Xinjiang, China. Land Degrad Dev 17:381–392
Zhang F,Wang T, Yimit H, Shi Q, Ruan Q, Sun Z, Li F (2011) Hydrological changes and settlementmigrations in the Keriya River delta in central Tarim Basin ca. 2.7–1.6 ka BP: inferred from 14Cand OSL chronology. Sci China Earth Sci 54:1971–1980
Zhang H, Wu JW, Zheng QH, Yu YJ (2003) A preliminary study of oasis evolution in the Tarimbasin, Xinjiang, China. J Arid Environ 55:545–553
Zhang J, Lu H,WuN, Qin X,Wang L (2012a) Palaeoenvironment and agriculture of ancient Loulanand Milan on the Silk Road. Holocene 23:208–217
Zhang JF, Liu CL, Wu XH, Liu KX, Zhou LP (2012b) Optically stimulated luminescence andradiocarbon dating of sediments from Lop Nur (Lop Nor), China. Quat Geochronol 10:150–155
Zhao S, Xia X (1984) Evolution of the Lop Desert and the Lop Nor. Geogr J 150:311–321Zheng M, Qi W, Wu Y (1991) Sedimentary environment since the Late Pleistocene and prospectof potash development in the Lop Nur Salt Lake. Chin Sci Bull 36:1810–1813 (in Chin)
Zhou T (1978) On the migration of Lop Nur. J Beijing Normal Univ (Nat Sci) 3:34–41 (in Chin)

Chapter 8Uvs Nuur: A Sentinel for ClimateChange in Eastern Central Asia
Michael Walther, Wolfgang Horn and Avirmed Dashtseren
Abstract The Uvs Nuur is located in Northwest Mongolia bordering with Russia. Itis the largest lake ofMongolia (5.5 times larger thanLakeConstance in SouthernGer-many), but not the deepest. The diameter of this round-shaped lake is ca. 80 km and itseastern shoreline is located 1300 km west-northwest of the capital city Ulaanbaatar.Studies in the Uvs Nuur Basin show that past lake-level fluctuations may have beentriggered by climate change and/or by changes in the catchment hydrology such asthe damming of tributaries by mobile dunes. Direct human impacts on the lake leveland water quality of Uvs Nuur due to recent mining or other industrial activities werenot identified till now. Increasing pasture load by livestock breeding in the lake-nearareas, withdraws of river water for irrigation and increasing tourism infrastructurewith insufficient wastewater management need to be under control in the futureto maintain the pristine state of Uvs Nuur. The Holocene lake development showsremarkable higher and lower lake levels. There were higher lake levels at Uvs Nuurand Bayan Nuur in the middle Holocene in accordance with most Mongolian lakes.Late Holocene lower levels were identified at Uvs Nuur at -8 m and lower. The recent(2018) tendency of the lake level is slightly negative after a high level at the begin-ning of the new century (2000). The biological and hydrological data for Uvs Nuurconfirm its natural status as a hyposaline, temperate dimictic lake with sometimespolymictic periods in the summer. The investigations show a fully adapted biologicalinventory of organisms and natural physical and chemical attributes for lake and riverwaters in accordance with the specific climate and drainage area conditions.
M. Walther (B) · A. DashtserenMongolian Academy of Sciences, Institute of Geography and Geoecology, Baruun Selbe 15,Chingeltei District, 4th Khoroo, Ulaanbaatar 15170, Mongoliae-mail: [email protected]
A. Dashtserene-mail: [email protected]
W. HornSaxon Academy of Sciences at Leipzig, Research Group “Limnology of Reservoirs”, Leipzig,Germanye-mail: [email protected]
© Springer Nature Switzerland AG 2020S. Mischke (ed.), Large Asian Lakes in a Changing World, Springer Water,https://doi.org/10.1007/978-3-030-42254-7_8
235

236 M. Walther et al.
Keywords Hydrology · Paleolimnology · Lake levels · Lake deposits · LateQuaternary
8.1 Introduction
The Uvs Nuur Basin is located in northwestern Mongolia (Fig. 8.1) and representsthe northernmost part of the Gobi Desert (lake centre: 50.349843° N, 92.653940° E).Ulaangom, the capital city of the Uvs Aimag (“Aimag” mong. = province), is thecoldest Aimag Centre of Mongolia due to its orographic location with winter inver-sion in the Uvs Nuur Basin (Fig. 8.2). The mean annual temperature is −3.5 °C, andthe annual amplitude of 86 °C as well as the mean annual precipitation of 130 mmcharacterize the extreme continental climate.
The Uvs Nuur („Nuur“ mong. = lake) has a water surface of 3650 km2 (1997),an average water depth of 11.9 m (maximum depth 22 m), and a catchment areaof 71,100 km2. The lake is located in the western part of its catchment area witha lake-level altitude of 760 m above sea level (asl; 1997). The comparison of thehydrographic data with Lake Urmia (5470 km2, 16 m max. depth, altitude 1280 masl), Van Lake (3522 km2, 451 m max. depth, altitude 1648 m asl) and the Aral Sea(8300 km2 in 2015, altitude 27.5 m asl) shows the peculiarities of the Uvs Nuur. Itis the largest lake in Mongolia, located in the south Siberian border zone near theRussian border. However, it is not the deepest lake in Mongolia.
Tes Gol („Gol“ mong. = river) with a length of 568 km, an average discharge of56 m3/s and a river basin of ca. 33,400 km2 is the main tributary river of Uvs Nuur.
Fig. 8.1 Location of the lake Uvs Nuur in eastern Central Asia

8 Uvs Nuur: A Sentinel for Climate Change in Eastern Central Asia 237
Fig. 8.2 Location, sampling sites, rivers and lakes of Uvs Nuur Basin (Locations see Table 8.1)
Smaller tributaries are the Turgen Gol and Kharkhiraa Gol in the west, rivers fromthe south Khan Khukhiin Mountain Range and from the north (Russian) Tannu OlaMountain Range (Fig. 8.2). The Tes Gol delivers 85% of the total runoff to the lake(Davaa et al. 1991).
The vegetation cover is characterized by semi-desert and steppe vegetation in thebasin, and forest steppe (north exposed forests) in the surrounding mountain ranges.
In order to investigate the Quaternary lake history, several sediment cores wereobtained between 1995 and 1997 near the lake shore and from Bayan Nuur 30 kmeast of Uvs Nuur (Walther 1999; Walther et al. 2000), which is separated from UvsNuur by a large dune belt (a part of Boorog Deliin Els; Fig. 8.2).
Beside the lake location in the western part of the catchment, its central part ischaracterized by four geomorphological units: lacustrine sediments and landforms(i), eolian forms with extended dune fields (ii), pediments and river deltas (iii), andalluvial fans and estuaries (iv). Walther (1999) pointed out that these units are partlyintercalated and were formed in different periods of time.
8.2 The History of Uvs Nuur Basin
According to the review of the tectonic setting and history during the Mesozoic andCenozoic era in Central Asia by Dobretsov et al. (1996), the Altai-Sayan area andMongolian Altai represented a zone of elevations and erosion during the Triassic.Tectonic activities increased west of the Mongolian Altai during the Lower Jurassicand intramontane and foremontane troughs developed in the Mongolian Altai andits forelands. The intramontane basins partially inherited Triassic rift depressions.
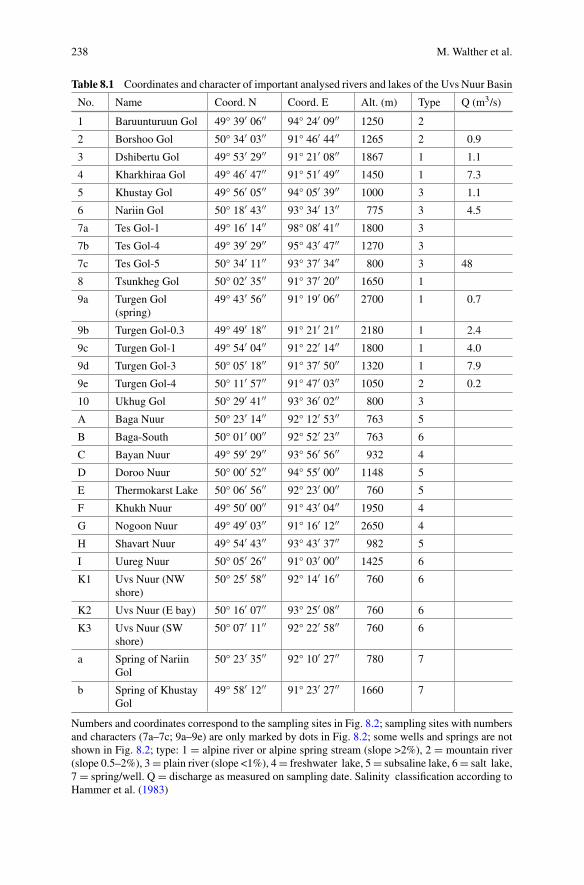
238 M. Walther et al.
Table 8.1 Coordinates and character of important analysed rivers and lakes of the Uvs Nuur Basin
No. Name Coord. N Coord. E Alt. (m) Type Q (m3/s)
1 Baruunturuun Gol 49° 39′ 06′′ 94° 24′ 09′′ 1250 2
2 Borshoo Gol 50° 34′ 03′′ 91° 46′ 44′′ 1265 2 0.9
3 Dshibertu Gol 49° 53′ 29′′ 91° 21′ 08′′ 1867 1 1.1
4 Kharkhiraa Gol 49° 46′ 47′′ 91° 51′ 49′′ 1450 1 7.3
5 Khustay Gol 49° 56′ 05′′ 94° 05′ 39′′ 1000 3 1.1
6 Nariin Gol 50° 18′ 43′′ 93° 34′ 13′′ 775 3 4.5
7a Tes Gol-1 49° 16′ 14′′ 98° 08′ 41′′ 1800 3
7b Tes Gol-4 49° 39′ 29′′ 95° 43′ 47′′ 1270 3
7c Tes Gol-5 50° 34′ 11′′ 93° 37′ 34′′ 800 3 48
8 Tsunkheg Gol 50° 02′ 35′′ 91° 37′ 20′′ 1650 1
9a Turgen Gol(spring)
49° 43′ 56′′ 91° 19′ 06′′ 2700 1 0.7
9b Turgen Gol-0.3 49° 49′ 18′′ 91° 21′ 21′′ 2180 1 2.4
9c Turgen Gol-1 49° 54′ 04′′ 91° 22′ 14′′ 1800 1 4.0
9d Turgen Gol-3 50° 05′ 18′′ 91° 37′ 50′′ 1320 1 7.9
9e Turgen Gol-4 50° 11′ 57′′ 91° 47′ 03′′ 1050 2 0.2
10 Ukhug Gol 50° 29′ 41′′ 93° 36′ 02′′ 800 3
A Baga Nuur 50° 23′ 14′′ 92° 12′ 53′′ 763 5
B Baga-South 50° 01′ 00′′ 92° 52′ 23′′ 763 6
C Bayan Nuur 49° 59′ 29′′ 93° 56′ 56′′ 932 4
D Doroo Nuur 50° 00′ 52′′ 94° 55′ 00′′ 1148 5
E Thermokarst Lake 50° 06′ 56′′ 92° 23′ 00′′ 760 5
F Khukh Nuur 49° 50′ 00′′ 91° 43′ 04′′ 1950 4
G Nogoon Nuur 49° 49′ 03′′ 91° 16′ 12′′ 2650 4
H Shavart Nuur 49° 54′ 43′′ 93° 43′ 37′′ 982 5
I Uureg Nuur 50° 05′ 26′′ 91° 03′ 00′′ 1425 6
K1 Uvs Nuur (NWshore)
50° 25′ 58′′ 92° 14′ 16′′ 760 6
K2 Uvs Nuur (E bay) 50° 16′ 07′′ 93° 25′ 08′′ 760 6
K3 Uvs Nuur (SWshore)
50° 07′ 11′′ 92° 22′ 58′′ 760 6
a Spring of NariinGol
50° 23′ 35′′ 92° 10′ 27′′ 780 7
b Spring of KhustayGol
49° 58′ 12′′ 91° 23′ 27′′ 1660 7
Numbers and coordinates correspond to the sampling sites in Fig. 8.2; sampling sites with numbersand characters (7a–7c; 9a–9e) are only marked by dots in Fig. 8.2; some wells and springs are notshown in Fig. 8.2; type: 1 = alpine river or alpine spring stream (slope >2%), 2 = mountain river(slope 0.5–2%), 3= plain river (slope <1%), 4= freshwater lake, 5= subsaline lake, 6= salt lake,7 = spring/well. Q = discharge as measured on sampling date. Salinity classification according toHammer et al. (1983)
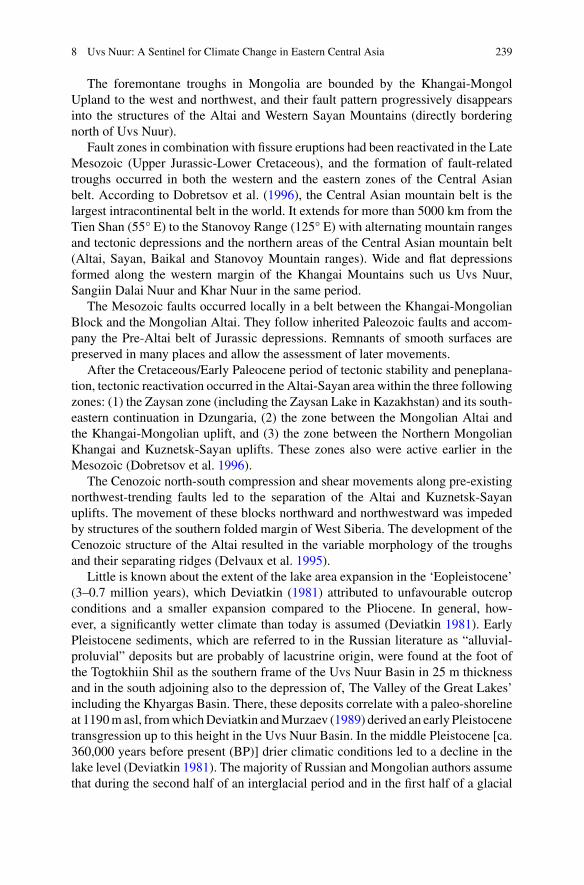
8 Uvs Nuur: A Sentinel for Climate Change in Eastern Central Asia 239
The foremontane troughs in Mongolia are bounded by the Khangai-MongolUpland to the west and northwest, and their fault pattern progressively disappearsinto the structures of the Altai and Western Sayan Mountains (directly borderingnorth of Uvs Nuur).
Fault zones in combination with fissure eruptions had been reactivated in the LateMesozoic (Upper Jurassic-Lower Cretaceous), and the formation of fault-relatedtroughs occurred in both the western and the eastern zones of the Central Asianbelt. According to Dobretsov et al. (1996), the Central Asian mountain belt is thelargest intracontinental belt in the world. It extends for more than 5000 km from theTien Shan (55° E) to the Stanovoy Range (125° E) with alternating mountain rangesand tectonic depressions and the northern areas of the Central Asian mountain belt(Altai, Sayan, Baikal and Stanovoy Mountain ranges). Wide and flat depressionsformed along the western margin of the Khangai Mountains such us Uvs Nuur,Sangiin Dalai Nuur and Khar Nuur in the same period.
The Mesozoic faults occurred locally in a belt between the Khangai-MongolianBlock and the Mongolian Altai. They follow inherited Paleozoic faults and accom-pany the Pre-Altai belt of Jurassic depressions. Remnants of smooth surfaces arepreserved in many places and allow the assessment of later movements.
After the Cretaceous/Early Paleocene period of tectonic stability and peneplana-tion, tectonic reactivation occurred in the Altai-Sayan area within the three followingzones: (1) the Zaysan zone (including the Zaysan Lake in Kazakhstan) and its south-eastern continuation in Dzungaria, (2) the zone between the Mongolian Altai andthe Khangai-Mongolian uplift, and (3) the zone between the Northern MongolianKhangai and Kuznetsk-Sayan uplifts. These zones also were active earlier in theMesozoic (Dobretsov et al. 1996).
The Cenozoic north-south compression and shear movements along pre-existingnorthwest-trending faults led to the separation of the Altai and Kuznetsk-Sayanuplifts. The movement of these blocks northward and northwestward was impededby structures of the southern folded margin of West Siberia. The development of theCenozoic structure of the Altai resulted in the variable morphology of the troughsand their separating ridges (Delvaux et al. 1995).
Little is known about the extent of the lake area expansion in the ‘Eopleistocene’(3–0.7 million years), which Deviatkin (1981) attributed to unfavourable outcropconditions and a smaller expansion compared to the Pliocene. In general, how-ever, a significantly wetter climate than today is assumed (Deviatkin 1981). EarlyPleistocene sediments, which are referred to in the Russian literature as “alluvial-proluvial” deposits but are probably of lacustrine origin, were found at the foot ofthe Togtokhiin Shil as the southern frame of the Uvs Nuur Basin in 25 m thicknessand in the south adjoining also to the depression of‚ The Valley of the Great Lakes’including the Khyargas Basin. There, these deposits correlate with a paleo-shorelineat 1190masl, fromwhichDeviatkin andMurzaev (1989) derived an early Pleistocenetransgression up to this height in the Uvs Nuur Basin. In the middle Pleistocene [ca.360,000 years before present (BP)] drier climatic conditions led to a decline in thelake level (Deviatkin 1981). The majority of Russian andMongolian authors assumethat during the second half of an interglacial period and in the first half of a glacial

240 M. Walther et al.
period, increased precipitation must have occurred together with declining tempera-tures. In this context,Murzaev (1952) andDeviatkin (1981) refer to pluvial conditionsin the intramontane depressions during the further course of the middle Pleistocene,whereas the westernmost range of the Mongolian and Gobi Altai, the KhuvsgulMountains, the Khentii and the Khentii mountains were glaciated. Increased rainfallwith reduced evaporation and inflow ofmeltwater caused a pronounced transgressionof the lakes, so that Murzaev (1954) reconstructed a Middle-Pleistocene lake stage.Therefore, a closed body ofwater in theGreat LakesDepressionwith an absolute lakelevel at 1500 m asl and a water depth of ca. 140 m is assumed. Due to thermolumi-nescence dating of laminated clays, located in a lakeside terrace between Khar Nuurand Khar Us Nuur in the central part of the Great Lakes Valley south of the Uvs NuurBasin, this transgression occurred in the period between 280,000 and 177,000 yearsBP (Deviatkin and Murzaev 1989). Evidence for the former establishment of a lakewith ca. 140 m water depth mostly comes from morphographic studies. Accordingto this work, both lakes—the Uvs Nuur and the southern bordering Khyargas NuurBasin—show paleo-lake bottoms covered by proluvial debris and eolian sands (Glu-chowskaja 1989). For the late middle Pleistocene, strong tectonic activities weredescribed, which brought about significant changes in the fluvial drainage system.As a result of the uplift of the Khan Khukhiin and Togtokhiin Shil mountains, theUvs Nuur Basin became separated from the southern Khyargas Basin, whereas therewas already a regressive stage at the same time in the lakes of the Great Lakes Valleysouth of Uvs Nuur (Sevastianov et al. 1993, 1994).
8.3 The Late Quaternary Landscape History of Uvs NuurBasin
Late Glacial carbonatic limnopsammites were found only in few places in the south-ern shoreline area of Uvs Nuur, on the pediment and in the dunes at the eastern bay.Lacustrine authigenic carbonate sands were recorded up to an elevation of 30–35 mabove the present lake level; they were radiocarbon-dated to the Late Glacial of thelast ice age. On this basis, a maximum high stand of 800 m asl was calculated in theentire basin. Lacustrine authigenic carbonate precipitation in the past can be com-pared with recent conditions at the eastern shore of Uvs Nuur on the western frontside of the Boorog Deliin Els dune field. The principal genesis of carbonate is basedon a strong summer biomass production (algae) with colonization by submergedmacrophytes and also emersed species in past and present times. Flooded shore-nearinterdune valleys provide an aquatic habitat during rising groundwater tables, whichfinally lead to shallow water habitats with the presence of gastropods and bivalves.The Late Glacial lake carbonates of the eastern bay contain hollow stipe fragments ofreed (Phragmites), indicating a littoral paleoenvironment supported by the recordedmolluscs (Walther 1999).

8 Uvs Nuur: A Sentinel for Climate Change in Eastern Central Asia 241
The formation and location of dunes in the UvsNuur Basin are strongly connectedwith lake development; and their distribution, genesis and chronostratigraphy hadbeen the subject of detailed studies by Grunert et al. (1999) and Grunert (2000).Sparse or no vegetation and exposed sandy dry surfaces as source areas of eolianmaterial are generally conditions required for dune formation. Grunert et al. (1999)distinguished three generations of dune development in different locations in the dunefields: (a) active dunes (barchans and barchanoid landforms) with little or no plantcover and no soil formation; (b) partially active duneswith a plant cover of up to 50%,which are parabolic in shape and in places incorporated remains of ancient dunes;and (c) inactive dunes with fully developed soils (Kastanozems) and a plant coverin excess of 70%. Hence, the dunes are major paleoclimatic indicators, especiallyin view of the fact that they are connected with lake deposits and with fossil andrelict soils. The thermoluminescence dates reported by Grunert et al. (1999) supportthe conclusion that the youngest phase of distinct dune migration probably occurredduring the Younger Dryas. More recent optically stimulated luminescence (OSL)dates by Grunert (2000) confirm this inferred phase of dune formation. However,further OSL dates from the Bayan Nuur area show that the main phase of duneformation was considerably older than the last ice age, probablymiddle or even EarlyPleistocene. Accordingly, evidence is convincing that higher lake levels flooded an“old” dune relief at Bayan Nuur in the same way as it is happening today on theeastern shore of Uvs Nuur. This observation supports the inferences of Walther(1999), Naumann (1999), Naumann and Walther (2000) and Grunert et al. (2000)that lake sediment had been deposited in an older dune relief.
Pediments with alluvial cover beds were mostly formed during the cold semi-humid to semi-arid phases of the last ice age. Older and higher-located eroded pedi-ments are observed in the foreland of the Turgen Mountain Range west of Uvs Nuur.Nevertheless, the pediments directly adjacent to the present-day Uvs Nuur shorelinewere formed in the last glacial stage. They have been described, partly mapped, anddated byWalther and Naumann (1997), Walther (1998), Lehmkuhl (1999, 2000) andGrunert et al. (2000). Periglacial cryogenic features in the pediments show that thegenesis of pediments is based on alternating active accumulation periods and episodicor rhythmic cold-dry sections with sufficient soil moisture for freezing with reducedaccumulation. The extensive pediments to the south and west of Uvs Nuur receivedtheir modern shape during the Last Glacial Maximum, yet they represent a polyge-netic chronosequence. Older and generally higher-lying units [P2 and P3 pediments;Walther and Naumann (1997)] were described in the foreland of west- (Turgen) andsouth-bordering (Togtokhiin Shil) mountain ranges covering larger continuous areas(Grunert et al. 2000).
To date, field studies indicate that the Late Glacial highstand of Uvs Nuur coveredthe lowermost quarter of the Uvs Nuur Basin to ca. 30 m above the present-day waterlevel at maximum. AsWalther (1998) andWalther et al. (2016) have shown for moresoutherly regions of Mongolia (Valley of the Gobi Lakes), wave abrasion of the lakeeroded the youngest Late Glacial pediments and cut cliff edges into it.
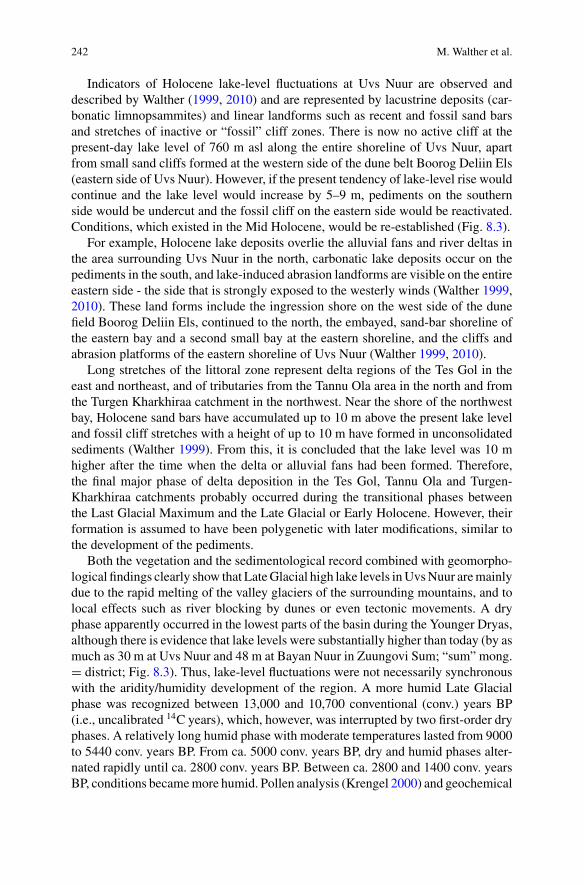
242 M. Walther et al.
Indicators of Holocene lake-level fluctuations at Uvs Nuur are observed anddescribed by Walther (1999, 2010) and are represented by lacustrine deposits (car-bonatic limnopsammites) and linear landforms such as recent and fossil sand barsand stretches of inactive or “fossil” cliff zones. There is now no active cliff at thepresent-day lake level of 760 m asl along the entire shoreline of Uvs Nuur, apartfrom small sand cliffs formed at the western side of the dune belt Boorog Deliin Els(eastern side of Uvs Nuur). However, if the present tendency of lake-level rise wouldcontinue and the lake level would increase by 5–9 m, pediments on the southernside would be undercut and the fossil cliff on the eastern side would be reactivated.Conditions, which existed in the Mid Holocene, would be re-established (Fig. 8.3).
For example, Holocene lake deposits overlie the alluvial fans and river deltas inthe area surrounding Uvs Nuur in the north, carbonatic lake deposits occur on thepediments in the south, and lake-induced abrasion landforms are visible on the entireeastern side - the side that is strongly exposed to the westerly winds (Walther 1999,2010). These land forms include the ingression shore on the west side of the dunefield Boorog Deliin Els, continued to the north, the embayed, sand-bar shoreline ofthe eastern bay and a second small bay at the eastern shoreline, and the cliffs andabrasion platforms of the eastern shoreline of Uvs Nuur (Walther 1999, 2010).
Long stretches of the littoral zone represent delta regions of the Tes Gol in theeast and northeast, and of tributaries from the Tannu Ola area in the north and fromthe Turgen Kharkhiraa catchment in the northwest. Near the shore of the northwestbay, Holocene sand bars have accumulated up to 10 m above the present lake leveland fossil cliff stretches with a height of up to 10 m have formed in unconsolidatedsediments (Walther 1999). From this, it is concluded that the lake level was 10 mhigher after the time when the delta or alluvial fans had been formed. Therefore,the final major phase of delta deposition in the Tes Gol, Tannu Ola and Turgen-Kharkhiraa catchments probably occurred during the transitional phases betweenthe Last Glacial Maximum and the Late Glacial or Early Holocene. However, theirformation is assumed to have been polygenetic with later modifications, similar tothe development of the pediments.
Both the vegetation and the sedimentological record combined with geomorpho-logical findings clearly show that LateGlacial high lake levels inUvsNuur aremainlydue to the rapid melting of the valley glaciers of the surrounding mountains, and tolocal effects such as river blocking by dunes or even tectonic movements. A dryphase apparently occurred in the lowest parts of the basin during the Younger Dryas,although there is evidence that lake levels were substantially higher than today (by asmuch as 30 m at Uvs Nuur and 48 m at Bayan Nuur in Zuungovi Sum; “sum” mong.= district; Fig. 8.3). Thus, lake-level fluctuations were not necessarily synchronouswith the aridity/humidity development of the region. A more humid Late Glacialphase was recognized between 13,000 and 10,700 conventional (conv.) years BP(i.e., uncalibrated 14C years), which, however, was interrupted by two first-order dryphases. A relatively long humid phase with moderate temperatures lasted from 9000to 5440 conv. years BP. From ca. 5000 conv. years BP, dry and humid phases alter-nated rapidly until ca. 2800 conv. years BP. Between ca. 2800 and 1400 conv. yearsBP, conditions becamemore humid. Pollen analysis (Krengel 2000) and geochemical

8 Uvs Nuur: A Sentinel for Climate Change in Eastern Central Asia 243
Fig. 8.3 Lake level fluctuations of Uvs Nuur (black) and Bayan Nuur (Zuungovi Sum; gray) afterWalther (1999, 2010) and Krengel (2000)
analysis of sediment profiles provide confirming evidence for dry phases of varyinglength and magnitude characterized by stagnating or falling lake levels during thelater Holocene (from the Sub-Boreal onwards and then in the early Sub-Atlantic;Fig. 8.3).

244 M. Walther et al.
8.4 Recent Lake Conditions
A recent lake-level rise is observed by a series of satellite images in two differentregions of Uvs Nuur between 1984 and 2016: at the permafrost-dominated westernshores (i) and at the southern Lido-Laguna shoreline (ii; Fig. 8.4). The transgressivetendency of the lake level results from a positive precipitation balance in the catch-ment area of Uvs Nuur, especially in the large Tes Gol Basin. Satellite images forone specific test plot of the southern shoreline of Uvs Nuur recorded the lake-levelrise in the last three decades (Fig. 8.4). The lake level of Uvs Nuur is rising since
Fig. 8.4 Comparison of the shoreline constellation at the southern side of Uvs Nuur in the yearsbetween 1989 and 2018 based on satellite imagery

8 Uvs Nuur: A Sentinel for Climate Change in Eastern Central Asia 245
1984 or possibly a few years earlier. Lake-level data before 1984 are very uncertainand suggest minor lake level-fluctuations.
Batnasan and Batima (2000) pointed out that the sub-recent and recent lake-levelrise is caused by increasing precipitation showing a synchronous alternation of lake-level rise and precipitation at the station Ulaangom between 1957 and 1996. TheTes Gol with a river basin of 33,358 km2 has the second largest catchment areain northwestern Mongolia only outmatched by the larger Khovd Gol River Basin(50,149 km2) originating in the high mountain area of the Altai south and southwestof the study area. The Tes Gol has a low load of total suspended solids (TSS; annualload 18,420 t) and low catchment erosion (0.552 t/km2/year; Batnasan and Batima2000). The reason for the low catchment erosion and low sediment load of the riveris the forest cover of the South Siberian Taiga of most of the river basin. Based ona first water-surface calculation by Tserensodnom 1971 (3350 km2) the lake levelfirst dropped until 1984 and then continuously rose to a maximum in 2011. TheLido-Laguna Shoreline of the southern Uvs Nuur had been flooded rapidly in thefirst half of the 1990s due to the rising lake level. The lake level slightly fell after2011 until 2015, and former strand bars became more and more visible although thelow level of 1989 was not reached (Fig. 8.5). The lake level is rising again since 2015as recorded by satellite images (Figs. 8.4 and 8.5).
Fig. 8.5 Lake-surface-area changes between 1971 and 2018 (Table 8.2); the black columns showthe lake surface, the dotted line shows the moving average of the lake surfaces

246 M. Walther et al.
Table 8.2 Surface-area changes of Uvs Nuur between 1971 and 2018 based on satellite images(modified after Batnasan andBatima (2000) and own results) and lake levels between 1965 and 2000[m asl approximately, data source: gauging station Davst, Institute of Meteorology and Hydrology,Ulaanbaatar; provided lake-level data based on an illustration of Horn et al. (2016)]
Sources and year Lake surface (km2) Altitude [m asl (appr.)]
1965 No data 759.50
Tserensodnom (1971, 2000)(data from 1971)
3350.00 760.25
Landsat-4 1984 No data 759.75
Landsat-5 1989 3476.10 No data
NOAA-14 1992 3599.50 760.75
Landsat-5 1995 3637.10 No data
NOAA-14 1997 3641.30 761.50
Landsat-7 2000 3616.40 761.50
Landsat-7 2011 3683.90 No data
Landsat-8 2013 3586.97 No data
Landsat-5 2015 3562.40 No data
Landsat-8 2016 3565.75 No data
Sentinel 2 2018 3628.70 No data
8.4.1 General Conditions of Lakes in the Uvs Nuur Basin
Lakes in large, closed tectonic depressions tend to be terminal salt lakes if the climateis semiarid or arid (Hammer 1986), as it is in the case of the hyposaline (3–20‰)lake Uvs Nuur. Lakes with an outlet are typically fresh (<0.5‰) unless they are fedby saline waters. Two typical examples for such freshwater lakes are the NogoonNuur - an alpine lake formed by glacial erosion and a moraine dam, and the probablytectonically originated Bayan Nuur amid the dunes east of Uvs Nuur which is fed bygroundwater. In case of the subsaline (0.5–3‰) Doroo Nuur, which is exclusivelyfed by groundwater from the dunes without any surface outflow, an undergroundoutflow apparently exists. A stronger salt accumulation would be expected, if theinflow is only compensated by evaporation. The morphometric data of these threelakes and of Uvs Nuur are shown in Table 8.3. The provided parameters of Uvs Nuurand Bayan Nuur are partly based on bathymetric maps (Walther 1999; Naumann andWalther 2000). The shape of Uvs Nuur resembles a shallow bowl: the flat central lakebottom with a maximum water depth of 22 m starts to ascend at a distance of ca. 2 to10 km from the shore. The shores in the southwest and northeast have wide shallowareas with extended reed belts, but major parts of the lake are encircled by surf shoreswith sand and gravel bars such as the Lido-Laguna shoreline. Bayan Nuur, amid atectonic Southwest-Northeast oriented fault line, is shaped like a wide graben withits western shore descending steeply to a maximal depth of 29 m. Maximum depthsof lakes in the Uvs Nuur Basin is not explicitly related to altitude or lake area. The

8 Uvs Nuur: A Sentinel for Climate Change in Eastern Central Asia 247
Table8.3
Morph
ometricparametersof
theselected
lakes(H
ornetal.2016)
Lake(=
Nuur)
AL
(km
2)
AC
(km
2)
z max
(m)
V(km
3)
z r(%
)l m
ax(km)
l sho
re(km)
IBP
Alt.
(m)
Bayan
32730
29a
0.33
f/a
0.46
12.3
3111
932
Doroo
72900
29e
0.5*
0.40
1563
1148
Nogoon
0.09
4.5
35*
0.0014*
100.6
1.5
0.9
2650
Uvs
3600
70,220
22b
48.4b/c/d/f
0.03
85.5
415
116
760
AL:lake
area,A
C:catchm
entarea,z
max:maxim
umdepth,
V:volume,z r:relativ
edepth(z
r=
50%
z max
[π/area]
1/2),l m
ax:maxim
umlength
ofcontinuous
open-w
ater
area,l sho
re:shorelinelength,IBP:
Indexof
Basin
Perm
anence
(IBP
=1000
volume(km
3)/l sho
re);Hutchinson(1957),Keller(1962).a N
aumann
andWalther
(2000),bWalther
(1999),cSh
il’krot
etal.(1993),
dDulmaa
(1979),eSv
iridenko
etal.(2007),
f owncalculations
basedon
a’b
and
c respectively;
*estim
ation/extrapolationfrom
ownfie
ldmeasurements

248 M. Walther et al.
local geomorphology determines the relative lake depth; it is highest in the alpinelake and lowest in mountain-foreland lakes. The Index of Basin Permanence (IBP)is used to assess the importance of littoral areas for the whole lake’s volume and canbe taken as a rough measure of ageing and “life expectancy” of a lake. The lake UvsNuur is the largest and has the highest value (116; Table 8.3).
8.4.2 Hydrological Conditions of Uvs Nuur
Davaa (1996) modelled the water balance of Uvs Nuur for the years 1964through 1989 based on precipitation, runoff of the important tributaries, calculatedevaporation data and lake level. From the data, a mean residence time of 19 yearswas calculated. More recent calculations of Davaa et al. (2007) yielded 14.7 years.Hebert (2004) estimated a residence time twice as high on the basis of the averagetritium content (for details see Horn et al. 2016). The lake-level fluctuations of UvsNuur have been recorded since 1964, and they show a mean annual variation of ca.16 cm with the maximum in July, caused by the periodicity of precipitation (to 2/3)and thermal expansion (to 1/3). The increase of ca. 2m in the years between 1965 and1999 reflects a tendency to more humid conditions against the trend of decreasinglake levels of many other large saline lakes (Williams 1993). Salinity measurementsfrom the first half of the twentieth century yielded significantly higher values (up to19.7 g/l in 1941; Davaa 1996) than those of more recent surveys (mean 1996–1998:13.6 g/l; Horn et al. 2016). Lower lake levels in the first half of the twentieth cen-tury and increasing levels afterwards, sometimes interrupted by phases of lake-leveldeclines, are implied. The lake’s hydrograph resembles an ascending sine functionwith a period of ca. 20 years. Parallels of water-level changes and annual runoff ofnorthwestern Russian rivers with solar activity were found (Zaretskaya et al. 1992;Batjargal et al. 1993).
8.4.3 Physical Water Properties of the Lakes
Water temperature and its temporal and spatial changes are an important factor ofthe lakes’ physical structure, as well as pH, oxygen, nutrients, conductivity, andtransparency. The processes of heat exchange of lakes are regulated by local climaticconditions.Decreasing temperatures in autumnand the very coldwinters ofMongoliaresult in a long ice cover. Uvs Nuur has a full ice cover of more than 150 days andan ice thickness of 98 cm on average (data for the years 1980–1997; Institute ofMeteorology and Hydrology, Ulaanbaatar). In Bayan Nuur, ice thickness is 150 cm,in Doroo Nuur 125 cm.
The spring is characterized by strong winds and rapidly increasing air tempera-tures. The consequence is a low thermal stability leadingwith intensive solar radiationto ice break-up at the end of April, and to high hypolimnion temperatures between 8

8 Uvs Nuur: A Sentinel for Climate Change in Eastern Central Asia 249
and 12 °C. During summer, periods of stagnation are interrupted by stronger winds;epilimnic mixing processes and thus multiple thermoclines can be found in thestratified lakes. A distinct linear temperature profile in Uvs Nuur in August 1999resulted from strong winds before and during the measurements, when large parts ofthe lake underwent mixing. Thus, Uvs Nuur is classified as a temperate dimictic lake,but sometimes also as a temperate pleomictic lake, i.e. with periods of full mixing inthe summer (Hutchinson and Löffler 1956; Uhlmann and Horn 2001). The dimicticalpine lake Nogoon Nuur has a relatively deep thermocline due to the high altitude;Bayan and Doroo Nuur are dimictic too. In large lakes like Uvs Nuur also significanthorizontal temperature differences can be found (Horn et al. 2016).
The vertical distribution of the oxygen content of lake water depends on mix-ing regime and trophic conditions. The stratified Uvs Nuur shows the profile of anoligotrophic lake; the oxygen saturation is always around 100% in the epilimnion.It dropped to about 70% in the hypolimnion in August 1997 whilst the thermoclinereached the lake bottom at themeasuring station in the other years. TheNogoonNuurhas an orthograde profile like an oligotrophic lake and a slight oxygen oversaturation,while Bayan Nuur shows a metalimnic oxygen-content maximum and a saturationdeficit of 75% in the hypolimnion - both are characteristics of mesotrophic lakes.
The optical characteristics of the water are significantly depending on the lakes’morphometry; shallow lakes with a maximum depth less than 2 m as well as shallowareas of Uvs Nuur are mostly very turbid due to resuspension. Secchi depths lessthan 0.5 m are common. In the case of Uvs Nuur, the predominant northwesternwind causes a high turbidity along the whole eastern shoreline visible on satelliteimages. The water is most transparent in the deep central and southern areas. In thedeep northwestern bay, Secchi depths of 3.8–5.7 m were measured. Bayan Nuur as adeep lake is better protected from wind and Secchi depths reach values of 4.8–6.0 malthough its trophic index is higher than that of Uvs Nuur. In Doroo Nuur, the Secchidepth is only 2 m due to the dominance of picoplanktic cyanobacteria and strongcalcite precipitation. Only 3.8 m were measured in Nogoon Nuur, possibly becauseof the inflow of glacier milk.
8.4.4 Chemical Water Properties of the Lakes
The conductivity range shows large differences between the lakes mainly caused bythe vertical climatic gradient and the open or closed lake-basin setting. While thewater of the alpine lake Nogoon Nuur has a conductivity of 0.05 mS/cm similar tothat of rain water, the salt accumulation increases along the flow to the terminal lake(Bayan Nuur 0.44 mS/cm, Doroo Nuur 0.71 mS/cm, Uvs Nuur 19.3 mS/cm). ThepH value of the surface water in all lakes exceeds 8.2 even in the very soft watersof Nogoon Nuur. The high alkalinity is a general property of the surface waters inthe Uvs Nuur Basin. The pH of hypolimnic waters of Bayan Nuur is with 7.7 lower,which indicates the accumulation of CO2 typical for productive lakes. Groundwater

250 M. Walther et al.
inflow can be also significant indicated by the formation of calcareous tufa in BayanNuur.
The chemical composition of the lakes’ water ranges from Ca-HCO3 dominancevia Mg/Na-HCO3 to Na–Cl/SO4 dominance with increasing salinity. While NogoonNuur is a typical freshwater lake, Bayan Nuur can be classified as a “hard water” lakeof the transition type (no clear dominance of one cation-anion pair) and Uvs Nuur isa hyposaline Na–Cl/SO4 lake (Paul and Horn 2000; Paul 2012a; Horn et al. 2016).Horizontal differences in the chemical composition of Uvs Nuur are significant, asthe most important tributaries flow into the lake in the east where large shallow areaspredominate.
The reliability of nutrient analysis is low due to the long transport of samplesto the lab. Nevertheless, the available data suggest that there is a lack of dissolvedinorganic nitrogen (N) in some of the lakes. An indication for this is the trophicstate index [TSI; after Carlson (1977) with a modification for N-limited lakes byKratzer and Brezonik (1981)]. The concept of TSI assumes that the partial indicesfor chlorophyll, Secchi depth and total phosphorus (TP) should not differ significantlyfrom each other in normal P-limited lakes. N limitation is indicated if the index for TPis significantly higher than the other two indices (chlorophyll, Secchi depth). Ideally,the smaller one of the indices for TP and total nitrogen (TN) should represent thelimiting nutrient. The index for TN was smaller than that for TP in Doroo Nuur andthe eastern bay of Uvs Nuur, which possibly indicates N limitation. However, it mustbe noticed that the index for Secchi depth in these lakes is significantly higher thanthat of chlorophyll due to the high mineralization of the water, and light might be alimiting factor, at least in parts. The micronutrient Fe2+ was not analysed due to theconditions of sample treatment. Growth limitations may occur in alkaline salt lakeswith high P content (Evans and Prepas 1997). A further source of uncertainty is thechlorophyll concentration and cyanobacteria dominance in many lakes, which waslikely underestimated by Fluorometer measurements. As a result, seemingly moreoligotrophic conditions might have been inferred. However, significantly more datafor the whole summer are required for a reliable assessment of the lakes’ nutrientsituation and trophic state. For these reasons, a definite statement about the limitingresources for the growth of phytoplankton in these lakes is not possible.
The trophic state of the lakes shows a distinct dependence on the lakes’ depth.Lakes with a depth of <3 m have a strong tendency to be eutrophic. The deeperlakes (Bayan, Doroo, Nogoon, and the deep northwestern part of Uvs Nuur) are olig-otrophic, some with the tendency to mesotrophy. The internal nutrient load as resus-pended sediments is probably a major source for phytoplankton growth. Shil’krotet al. (1993) identified Uvs Nuur as a meso- to eutrophic lake, whilst the Limnolog-ical Catalog of Mongolian Lakes describes the lake as mesotrophic (LcoMl 2018).This is similar to the findings presented here for the southwestern shore and easternbay of Uvs Nuur and can be seen as a sign of the spatial heterogenity of this largelake. These authors investigated the shallow northeastern part of Uvs Nuur in Russianear the mouth of Tes Gol and other regions of the lake.

8 Uvs Nuur: A Sentinel for Climate Change in Eastern Central Asia 251
8.4.5 Lake Biology
The phytoplankton community is more or less dominated by cyanobacteria, espe-cially in lakes with pH ≥ 9 and possible N limitation. The cyanobacteria dominancecan be explained by their high competitive strength for inorganic carbon at high pHand their capability to grow at low N/P proportions. This dominance is apparentlyindependent of the trophic state. Planktolyngbya contorta Lemm., a cyanobacteriumwith coiled filaments, is typical for many sub- and mesosaline lakes of the region. Inthe less saline, eutrophic lakes, nanoplanktic coccal cyanobacteria forminggelatinouscolonies, are dominant and Chlorophyceae (mostly Chlorococcales) are importantalso. Especially Ankistrodesmus, Lagerheimia and Oocystis spp. are often found.Another important group in the eutrophic, hyposaline lakes are the Dinophyceae,represented by Ceratium, different Gymnodinium and Peridinium species. Diatomsthat play a major role in many lakes of the temperate climatic zone are only ofsecondary importance. This is, however, only true for the phytoplankton biomass;the number of species is highest in diatoms and Chlorococcales.
In zooplankton, that rarely attains high densities (dry weight >1 mg/l), calanoidCopepoda with a few species (mainly Arctodiaptomus salinus Daday) are dominantin the large lakes. Cyclopoids of the species Mesocyclops leuckarti Claus, Megacy-clops viridis Jurine and Cyclops vicinus Uljanin live in many lakes, but are mostlysubdominant. From Nogoon Nuur, a hitherto unknown species - Cyclops glacialis(Flößner 2001) is described. Cladocera are found with more species, especially inthe shallow lakes.Moina mongolica Daday has been found in the salt lakes, whereasBosmina longirostris O.F.M., Daphnia spp., Ceriodaphnia pulchella Sars and someother species are typical for the less saline lakes. Flößner et al. (2005) gives a completelist of all planktic and benthic Cladocera and Copepoda. In the eutrophic shallowlakes of this area, the crustacean plankton is sparse; here rotifers are the major con-stituent of the zooplankton. Typical salt lake species areBrachionus plicatilisO.F.M.,B. quadridentatus Hermanns and Hexarthra spp. Many other species like Keratellaspp., Polyarthra spp., Filinia longiseta Ehrenberg, Trichocerca sp., Lecane lunaO.F.M. and Asplanchnella sp. live in the less saline lakes. The crustacean Leptodorakindtii Focke found in Bayan Nuur is the only representative of large-sized predatoryinvertebrates. Branchinecta orientalis Sars, an Anostraca, was identified in a smallnameless alpine lake (Horn and Paul 2004). Among the few determined plankticprotozoa, most remarkable is the newly described choanoflagellate Acanthocorbismongolica (Paul 2012b). It belongs to the mainly marine order Acanthoecida thatform delicate, species-specific loricae of siliceous costae, and it is the first of thisgroup found in freshwater.
The pelagic food web is completed by fish (Oreoleuciscus spp. in all lakes exceptNogoon; in Doroo also Esox lucius L.) and water birds: Phalacrocorax carbo L.,Larus argentatus Pont., Tadorna ferruginea Pall., Podiceps cristatus L., Ardea albaL. and many other benthivorous, planktivorous and piscivorous birds. The Altaiosman (Oreoleuciscus sp.) is a predatory cyprinid especially distributed in the AltaiMountain lakes and river deltas in northwestern Mongolia including deltas of Uvs

252 M. Walther et al.
Nuur. The fecundity of the genera Oreoleuciscus especially in the Uvs Nuur areahad been investigated by Dulmaa et al. (2000).Oreoleuciscus humilisWarpachowski1889, Oreoleuciscus potanini (Kessler 1879) and Oreoleuciscus pewzowi Herzen-stein 1883 had been observed in the lakes of the Uvs Nuur Basin. These fishes haveonly a minor economic importance until today and there is no commercial fishingactivity so far.
The littorals of many lakes are colonized by Potamogeton pectinatus L., Charasp., Cladophora sp. and other filamentous algae; Hippuris sp. and Utricularia sp.are often found in the shallow water next to stocks of Phragmites australis Steudel.The absence of reed belts in some lakes of the lower catchment (Bayan Nuur, east-ern bay of Uvs Nuur, etc.) is apparently mainly caused by cattle trampling, but alsostrong wave action and moving ice are possible reasons. Typical representatives ofthe bottom fauna in the salt lakes are Gammaridae, Corixidae, Chironomidae, Culi-cidae, Ephydridae and Stratiomyiidae. Molluscs are virtually absent in the salt lakes;they are numerous in the freshwater lakes, where also Ephemeroptera, Trichoptera,Odonata, Coleoptera, Hirudineae and some other groups are found.
8.4.6 Rivers of Uvs Nuur Basin
The morphological, hydrological, physico-chemical and biological investigations ofthe rivers reveal four main river types in the Uvs Nuur region: alpine spring streams(i), alpine rivers (ii), mountain (iii) and plain rivers (iv). The distribution of aquaticorganisms reflects these four river types.
The main river and tributary of Uvs Nuur is the Tes Gol with a length of 568 km(Great Soviet Encyclopedia, 3rd ed.; 757 km according to the Russian Water Inven-tory), an average discharge of 56 m3/s and a river basin of ca. 33,400 km2. It is themain tributary river besides some local basins of Turgen Gol and Kharkhiraa Golin the west. Rivers from the south Togtokhiin Shil-Khan Khukhiin Mountain Rangeand from the north (Russian) Tannu Ola Mountain Range and the Tes Gol deliver85% of the total amount of surface water into the lake (Davaa et al. 1991).
There are a total of 25,000 km of dry river channels in the Uvs Nuur Basin,corresponding to 0.35 km/km2 (Dorj et al. 1991). Numerous gullies (Mong. Sair)existmainly in the foothill regions and at the edge of the low-lying plain.Dry channelsare also abundant in the extensive delta of the Tes Gol. It is not permanently filledwith water; many river courses are commonly dry. The mountain brooks in the areaof runoff formation in the upper and middle reaches are continuously filled withwater. They often divide farther downstream into many branches and seep away intothe gravelly ground of the debris cones after 10–20 km and reach the terminal lakeUvs Nuur only during periods of flood in spring or following heavy rainfall events.The groundwater flowing towards Uvs Nuur emerges again at places with decreasedgradient and/or lower water permeability near the lake forming springs and extendedwetlands. Tes Gol and Nariin Gol have permanent discharge all over the year. TesGol is perennial because of its large catchment area which covers 47% of the Uvs

8 Uvs Nuur: A Sentinel for Climate Change in Eastern Central Asia 253
Nuur Basin including water-rich tributaries from Siberia. The lowland river NariinGol, which is fed by the huge groundwater body of the dunes east of Uvs Nuur, hasa relatively steady discharge and no infiltration losses.
Most of the runoff originates in the precipitation-rich mountain areas and thebasins surroundingmountain ranges. However, some rivers (e.g. Nariin Gol, KhustayGol) drain the dune areas of the arid lower part of the basin too. Their springs aremainly fed by groundwater. which originates frommountain rivers blocked by dunessuch as the Khustay Gol, which is the continuation of the seeped Baruunturuun Gol(Grunert and Klein 1998).
The annual course of discharge in most of the rivers reflects the precipitationpeak in the summer months and the dry, cold winter conditions with low dischargeand complete freezing. The time of the snowmelt runoff depends on the catchmentaltitude. The maximum can be distinct for rivers of the lower mountains (Borshoo,Tes) or superimposed by the rain peak for high alpine rivers such as Kharkhiraa Goland Turgen Gol (Horn and Paul 2000; Paul 2012a; Horn et al. 2016).
8.5 Relevance of Human Impact
Despite the lake’s unique location in the midst of surrounding mountain ranges, withan outstanding importance of flora and fauna, its economic and touristic importanceis still very low, with increasing tendency in recent years. Agricultural land use ismainly focused on alluvial plains near settlements such as Ulaangom due to theavailability of water for irrigation. Land is mostly cultivated as horticulture. Center-pivot irrigation with water withdrawal especially from Kharkhiraa Gol was usedduring socialism times before 1992. The areas with sea buckthorn plantations grewin the last ten years near the city of Ulaangom. The number of livestock increasedrapidly and overgrazing occurs in the steppe areas of the lower locations near the lakeareas as well as in the upper regions of summer pasture in the mountains. Between1990 and 2017, the number of animals doubled from 1,666,600 to 3,130,000 withtwo reduction periods between 2000 and 2003, and between 2009 and 2011 due tosevere Zud events (i.e., severe winters; Statistical Office Report 2018).
An increasing number of national and international tourists, Ger Camp construc-tions with insufficient water and sanitation management and an inefficient wastemanagement in the countryside outside the settlements stresses the landscape. TheUvs Nuur Strictly Protected Area (7125.45 km2) was established in 1994 and com-bined with an UNESCOBiosphere Reserve in 2000 including the TurgenMountainsin the west, the sand fields of Boorog Deliin Els in the east, and the Khan KhukhiinNational Park (2205.5 km2) and Khyargas Nuur National Park (3320.8 km2) in thesouth. These protected areas attracted domestic and international tourists in the pastten years with increasing tendency. Being the water towers for Uvs Nuur, the parkshave a high importance for the future water quality and quantity of the lake.
Fishery in the lakes and rivers is so far insignificant because there are nocommercial fisheries; even anglers are unimportant.

254 M. Walther et al.
The central aimag center Ulaangom with its insufficient wastewater managementand sanitation is a problem for the water quality of the rivers receiving polluted water.Otherwise, the distance between the discharge of the pollutants and the confluenceswith the lake Uvs Nuur is relatively large, so that the self purification in the nat-ural water courses eliminates nutrients and other pollutants. Thus, impacts on UvsNuur are relatively low. If the pollution pressure will increase due to an increasingpopulation and intensification of industrial and other commercial activities withoutappropriatewastewatermanagementmeasures, environmental problemswill becomerelevant. However, present and past pollution levels were not specifically investigatedresulting in a lack of reference data.
Human impacts caused by increasing livestock breeding and some mining activ-ities in the upper reaches of tributary rivers (e.g. in the Turgen Gol watershed) areapparently still without impacts on the lake-water quality of Uvs Nuur.
Lake-level oscillations are caused by climate change in the river basins of TesGol as the main tributary, and other smaller rivers of the surrounding Turgen, Tog-tokhiin Shil, Khan Khukhiin and Tannu Ola Mountain ranges. Water withdrawal fordrinking-water purposes, industry and irrigation is still of minor significance due tolow volumes of diverted water.
8.6 Future Perspective and Challenges
If the present status of Uvs Nuur can be conserved in the future, the lake will remaina remarkable rare example of a large natural lake ecosystem without severe humanimpact. The present rising lake level suggests that water withdrawal is not a signif-icant issue in the river basins of the main tributaries. However, touristic pressure,water withdrawal for agricultural use and mining activities are a potential threat forthe lake and its water quality and quantity. Therefore, the early protection statusas Biosphere Reserve (1992) of a shore-near zone around the lake and the StrictlyProtected Area Turgen-Kharkhiraa bears a certain warranty for conservation andprotection against exploitation of natural/mineral resources with unsustainable tech-niques. The Uvs Nuur Basin and the adjacent mountain ranges have an outstandingimportance as different untouched ecosystems. Nevertheless, the landscape stress ispresent by overgrazing of livestock, breeding and insufficient wastewater manage-ment and sanitation in the aimag and sum centers. Especially the increase of domestictourism in times of growing economy requires an improved waste management inand outside the settlements.
Lake-level fluctuations in historical and recent times were and are mainly drivenby runoff changes of the main tributaries. Hydrological changes in the headwaterregions and middle courses of the tributaries as result of human impacts can still beneglected.
Acknowledgements The authors thank the German Research Foundation (DFG) to be membersof the Research Group Uvs Nuur between 1995 and 1999 in order to find out most of the presented

8 Uvs Nuur: A Sentinel for Climate Change in Eastern Central Asia 255
results and for financial support of the expeditions. We thank the Mongolian Academy of Sciences,Institute of Geography and Geoecology, namely Academician Prof. Dr. D. Dordschgotov and MsA. Tschimegsaikhan, the Institute of Biology, namely Prof. Dr. A. Dulmaa, and the former Instituteof Hydrology, namely Dr. G. Davaa, for their logistic and scientific support.
References
Batjargal Z, Yadamsuren K, Davaa G (1993) K voprosu o svyazi mezhdu urovnem besstochnogoozeraUbsu-Nur i zentrom tyazhesti solnechnoj sistemy. In: Theses of the international conference.Experiment Uvs Nuur, Kyzyl pp 17–21 (in Russian)
Batnasan N, Batima P (2000) Hydrological regime and water quality of lakes in the Great LakesDepression, Mongolia. In: Walther M et al. (eds) State and dynamics of geosciences and humangeography of Mongolia. extended abstracts of the lnternational Symposium Mongolia 2000, vol205. Berliner Geowissenschaftliche Abhandlungen, Reihe 4, Berlin, pp 100–106
Carlson R (1977) A trophic state index for lakes. Limnol Ocean 22:361–369DavaaG (1996) Gidrologo-ekologicheskaya osobennost’ osjorMongolii i tendentsiya ikh razvitiya.Dissertation, Ulaanbaatar (in Mongolian with Russian abstract)
Davaa G, Dashdeleg N, Tsugar T, Tseveendorj N (1991) Dynamics of water balance of Uvs Lake.In: Global Change and Uvs Nuur. State Committee for Nature and Environmental Protectionof MPR, National Ecological Center. Thesis of presentations. Ulaanbaatar-Ulaangom, 12–19August, 1991 pp 18–19
Davaa G, Oyunbaatar D, Sugita M (2007) Surface water of Mongolia. Interpress, Ulaanbaatar, pp55–68
Delvaux D, Theunissen K, Van der Meer R, Berzin NA (1995) Dynamics and paleostress of theCenozoic Kurai-Chuya Depression of Gorny Altai (South Siberia): tectonic and climatic control.Russ Geol Geophys 36:31–51
Deviatkin EV (1981) Cenozoic of Inner Asia. Nauka, Moskow (in Russian)Deviatkin EV, Murzaev EM (1989) The late Cenozoic of Mongolia. The Mongolian Altai. Nauka,pp 42–47 (in Russian)
Dobretsov NL, Bulsov MM, Delvaux D (1996) Meso- and Cenozoic tectonics of the Central AsianMountain belt: effects of lithospheric plate interaction and mantle plumes. Int Geol Rev 38:430–466
Dorj S, Dashdeleg N, Bayaraa Z, Amarsanaa Y (1991) The resources of surface waters in Uvs lakebasin. In: Global Change and Uvs Nuur. Thesis, Intern Scient Conference (12.-19. 08. 1991).State Committee for Nature and Environmental Protection of MPR National Ecological Center,Ulaanbaatar—Ulaangom, pp 27–28
Dulmaa A (1979) Hydrobiological outline of the Mongolian lakes. Int Rev Gesamten Hydrobiol64:709–736
Dulmaa A, Horn W, Paul M (2000) Fecundity of OreoleuciscusWarpachowski (Pices, Cyprinidae)from the Uvs Nuur hollow. ln: Walther M et al. (eds) State and dynamics of geosciences andhuman geography of Mongolia. Extended abstracts of the lnternational Symposium Mongolia2000, vol 205. Berliner Geowissenschaftliche Abhandlungen, Reihe 4, pp 139–147
Evans JC, Prepas EE (1997) Relative importance of iron and molybdenum in restrictingphytoplankton biomass in high phosphorus saline lakes. Limnol Oceanogr 42(3):461–472
Flößner D (2001) Cyclops glacialis n. sp. (Copepoda: Cyclopoida) from a high mountain lake innorthwestern Mongolia. Limnologica 31:303–306
Flößner D, Horn W, Paul M (2005) Notes on the cladoceran and copepod fauna of the Uvs NuurBasin (northwest Mongolia). Int Rev Hydrobiol 90:580–595
Gluchowskaja NB (1989) Late Cenozoic of Mongolia. Ubsunurskaja w padina (in Russian)

256 M. Walther et al.
Grunert J (2000) Paleoclimatic implications of dunes in the Uvs Nuur-Basin, Western Mongolia.ln: Walther M et al. (eds) State and dynamics of geosciences and human geography of Mon-golia. Extended abstracts of the lnternational Symposium Mongolia 2000, vol 205. BerlinerGeowissenschaftliche Abhandlungen, Reihe 4, pp 2–8
Grunert J, Klein M (1998) Binnendünen im nördlichen Zentralasien (Uws Nuur, westlicheMongolei). Berliner Geographische Abhandlungen 63:45–66
Grunert J, Klein M, Stumböck M, Dash D (1999) Bodenentwicklung auf Altdünen im Uvs NuurBecken. Die Erde 2:97–115
Grunert J, Lehmkuhl F, Walther M (2000) Paleoclimatic evolution of the Uvs Nuur Basin andadjacent areas (Western Mongolia). Quat Int 65-66:171–192
Hammer UT (1986) Saline lake ecosystems of the world. Monographiae Biologicae, vol 59. Seriesed.: Dumont, H.J. Dr W. Junk Publishers, 616pp
Hammer UT, Shamess J, Haynes RC (1983) The distribution and abundance of algae in salinewaters of Saskatchewan, Canada. Hydrobiologia 105:1–26
Hebert D (2004) Tritium in Wässern des Uws-Nuur-Beckens (Mongolei). WissenschaftlicheMitteilungen des Instituts für Geologie, TU Bergakademie Freiberg 27:5–12
HornW,PaulM(2000)Abiotic andbiotic features of typical rivers in theUvsNuurBasin. In:WaltherM et al. (eds) State and dynamics of geosciences and human geography ofMongolia. In: Extendedabstracts of the lnternational SymposiumMongolia 2000, vol 205. Berliner GeowissenschaftlicheAbhandlungen, Reihe 4, pp 122–130
HornW, Paul M (2004) Occurrence and distribution of the Eurasian Branchinecta orientalis (Anos-traca) in Central Asia (Northwest Mongolia, Uvs Nuur Basin) and in other holarctic areas.Lauterbornia 49:81–91
Horn W, Paul M, Dulmaa A, Davaa G, Tseveendorj N, Uhlmann D (2016) The recent surface andsubsurface waters in the endorheic Uvs Nuur Basin (Northwest Mongolia). Abhandlungen derSächsischen Akademie der Wissenschaften zu Leipzig, Mathematisch-NaturwissenschaftlicheKlasse 66(2): 1-32
HutchinsonGE (1957) ATreatise on Limnology, vol 1. Geography, Physics, and Chemistry, 1015ppHutchinson GE, Löffler H (1956) The thermal classification of lakes. Proc Natl Acad Sci 42:84–86Keller R (1962) Gewässer und Wasserhaushalt des Festlandes, Haude & Spener, 520ppKratzer CR, Brezonik PL (1981) A Carlson-type trophic state index for nitrogen in Florida Lakes.Water Resour Bull 17(4):713–715
Krengel M (2000) Discourse on history of vegetation and climate in Mongolia—palynologicalreport of sediment core Bayan Nuur I (NW-Mongolia). ln: Walther M et al. (eds) State anddynamics of geosciences and human geography of Mongolia. Extended Abstracts of the lnterna-tional SymposiumMongolia 2000, vol 205. Berliner Geowissenschaftliche Abhandlungen, Reihe4, 80–84
LcoMl (Limnological catalog of Mongolian lakes) (2018). http://oslo.geodata.es/mongolian_lakes/index.php?page=home&lang=en
Lehmkuhl F (1999) Rezente und jungpleistozäne Formungs- und Prozeßregionen im Turgen-Charchira, Mongolischer Altai. Die Erde 130:151–172
Lehmkuhl F (2000) Alluvial fans and pediments in Western Mongolia and their implications forneotectonic events and climatic change. ln: Walther M et al. (eds) State and dynamics of geo-sciences and human geography of Mongolia. Extended abstracts of the lnternational SymposiumMongolia 2000, vol 205. Berliner Geowissenschaftliche Abhandlungen, Reihe 4, pp 14–21
Murzaev EM (1952) Mongolian People’s Republic: Physical Geography of Mongolia (in Russian)Murzaev EM (1954) Mongolian People’s Republic: Physical Geography of Mongolia (in Mongo-lian)
Naumann S (1999) Spät- und postglaziale Landschaftsentwicklung im Bayan Nuur Becken(Nordwestmongolei). Die Erde 130(2):151–172
Naumann S, Walther M (2000) Mid-Holocene Lake-Level Fluctuations of Bayan Nuur (NWMongolia). Marburger Geographische Schriften 35:15–27

8 Uvs Nuur: A Sentinel for Climate Change in Eastern Central Asia 257
Paul M (2012a) Limnological aspects of the Uvs Nuur Basin in northwest Mongolia. Dissertation,Fakultät Umweltwissenschaften, TU Dresden, 198pp
Paul M (2012b) Acanthocorbis mongolica nov. spec. Description of the first freshwater loricatechoanoflagellate (Acanthoecida) from a Mongolian lake. Eur J Protistol 48(1):1–8
Paul M, HornW (2000) Lakes in the Uvs Nuur Basin: ecosystem features and typology. In: WaltherM et al. (eds) State and dynamics of geosciences and human geography of Mongolia. Extendedabstracts of the lnternational SymposiumMongolia 2000, vol 205. Berliner GeowissenschaftlicheAbhandlungen, Reihe 4, pp 131–138
SevastianovDV, Seliverstov JP, CernovaGM (1993) Landscape development in the UvsNuur basin.Vestnik SPbGU Ser 7:71–81 (in Russian)
Sevastianov DV, Schuwalow WF, Neutrujeva IJU (1994) Limnology and Paleolimnology ofMongolia. Nauka, Sankt-Petersburg (in Russian)
Shil’krot GS, Kretova SP, Smirnova EV (1993) Ecosystem of the Ubsu Nuur Lake - Potential andWater Quality. In: Informational problems of biosphere investigations: experiment “Ubsu-Nur”.Russian Academy of Sciences, Siberian Division, Pushchino
Sviridenko B, Pyak A, Sviridenko T (2007) Occurrences of Charophycean algae in Mongolia,Tuva and Khakassia. In: Problems of Botany of South Siberia and Mongolia. Proceedings of6th international scientific-practical conference (Barnaul, 25–28 October 2007), pp 299–302 (inRussian)
Tserensodnom J (1971) Lakes ofMongolia.Ulaanbaatar, Academyof Science,MPR (inMongolian)Tserensodnom, J (2000) Catalogue of the Mongolian Lakes. Ulaanbaatar, 69p (in Mongolian)Uhlmann D, Horn W (2001) Hydrobiologie der Binnengewässer, 528ppWalther M (1998) Paläoklimatische Untersuchungen zur jungpleistozänen Landschaftsentwick-lung im Changai Bergland und in der nördlichen Gobi (Mongolei). Petermanns GeographischeMitteilungen 142:205–215
Walther M (1999) Befunde zur jungquartären Klimaentwicklung rekonstruiert am Beispiel derSeespiegelstände des Uvs Nuur-Beckens (NW-Mongolei). Die Erde 130(2):131–150
Walther M (2010) Paleo-environmental changes in the Uvs Nuur basin (Northwest Mongolia).Erforschung Biologischer Ressourcen in der Mongolei 11:267–279
Walther M, Naumann S (1997) Beobachtungen zur Fußflächenbildung im ariden bis semiari-den Bereich der West- und Südmongolei (Nördliches Zentralasien). Stuttgarter GeographischeStudien 126:154–171
Walther M, Janzen J, Riedel F, Keupp H (eds) (2000) State and dvnamics of geosciences and humangeography of Mongolia. In: Extended Abstracts of the lnternational SymposiumMongolia 2000,vol 205. Berliner Geowissenschaftliche Abhandlungen, Reihe A
Walther M, Enkhjargal V, Gegeensuvd T, Odbaatar E (2016) Environmental changes of Orog Nuur(BayanKhongorAimag, SouthMongolia). Lakedeposits, paleo-shorelines andvegetationhistory.Erforschung biologischer Ressourcen der Mongolei 13:37–57
WilliamsWD(1993)Theworldwide occurrence and limnological significance of fallingwater levelsin large, permanent saline lakes. Verhandlungen der Internationalen Vereinigung für Theoretischeund Angewandte Limnologie 25:980–983
Zaretskaya IP, LobasenkoGV, PtitsinaNG, RumyantsevVA, TyastoMI (1992) River runoff changesduring solar-activity cycles. Biofizika 37(3):517–523
Index
Aaad facies, 7, 11, 13, 14Acarians, 196African plate, 2Ain Ghazal, 10, 12Akdala Delta, 150, 152Akkadian civilization, 12Aksu River, 227, 229Ak-Suu River, 182Akterek River, 181Alakol Lake, 143, 151Algae, 18, 23, 48, 55, 83, 86, 87, 122, 153,
165, 195, 197, 240, 252Alkalinity, 192, 249Altun Mountains, 208, 223Amora Formation, 6Amphipoda (amphipods), 48, 56, 58, 84,
167, 196Amu-Darya, 66, 72, 80, 81Ananievo village, 181Anellid polychaetes, 168Anthropocene, 36, 38, 42, 44, 46, 47, 50, 52,
55–59, 98, 99Anthropogenic change, 49, 52, 54, 95, 127Anthropogenic impact, 97Apsheron, 69, 74, 114Aquatic macrophytes, 49, 56Aquatic organisms, 161, 171, 218, 252Aquifer, 5, 20, 23, 152, 223Arabian plate, 2Aragonite, 6, 7, 11, 13, 19, 160, 161, 163Aral Sea, 66, 76, 79–82, 109–111, 114–119Arava Valley, 4, 5, 23Archaea, 18, 23Arkarly Mountains, 151Armenia, 35–39, 42, 59, 69Artanish, 35, 37
Artanish peninsula, 35Asphalt, 12Atlantic Multidecadal Oscillation (AMO),
156Avulsion, 94Ayaguz River, 147, 169Azov Sea, 127, 168
BBacillariophyceae, 225Bakanas Lake, 151Bakbakty Delta, 152Balkhash-Alakol Depression, 143, 144,
148–150Balykchy, 179, 190, 191, 197, 199, 201–203Barskoon village, 203Bathymetry, 16, 67, 143, 157, 190, 197Beer Sheva Valley, 13Beishan, 208Bereke, 152Biodiversity, 37, 65, 73, 82, 87, 97, 98, 110,
135Biological Oxygen Demand (BOD), 202Biosphere Reserve Issyk-Kul, 200Birds, 125, 184, 185, 217, 251Birlyk, 152Bitumen, 12Bivalvia (bivalves), 48, 56Black Sea, 66, 76, 78, 79, 82, 86, 87, 122,
124Blue-green algae, 130, 165, 195Boom Gorge, 178, 180Bosteri, 179, 197, 200Brackish, 82, 111, 120, 154, 177, 180, 197,
212, 214, 217, 218, 220, 224, 230
© Springer Nature Switzerland AG 2020S. Mischke (ed.), Large Asian Lakes in a Changing World, Springer Water,https://doi.org/10.1007/978-3-030-42254-7
259

260 Index
Brackish water, 65, 109, 111, 126, 128, 130,134, 166, 214, 215, 217
Brine, 1, 5–7, 17, 18, 20, 23–25, 129, 131,135, 214, 220, 223, 228, 229
Brine shrimps, 214Bronze Age (Bronze Era), 13, 41–43, 187,
198Bryozoa, 87Burlyutyubin Basin, 153, 154
CCaddisflies, 167Calcite, 7, 160, 161, 163, 192, 249Canaan, 12Carbonates, 162, 163, 183, 240Caspian Sea (CS), 36, 65–68, 70, 78, 79,
81, 83, 86, 92, 96, 97, 115, 116, 118,120–122, 126, 136
Caspian seal, 86Central Asia, 109, 110, 118–120, 131, 135,
149, 156, 178, 181, 208, 236, 237Charophyceans (charophytes), 83, 122, 130,
164, 165, 190, 197Chironomidae (chironomids), 48, 56, 57,
122, 128Chlorite, 161, 177Choktal village, 183Cholpon-Ata, 180, 191, 199–203Chon-Kyzyl-Suu River, 181Chu River, 150, 180, 187Chyrpykty village, 180Ciliates, 84, 129, 166Cladocerans, 48, 84, 122, 129, 166, 167, 196Clay, 7, 20, 40, 43, 44, 79, 93, 160–162, 210,
213, 240Climate, 4, 6, 9, 10, 12, 14, 45, 51, 65, 66,
69, 72–74, 77, 80, 89, 90, 98, 99, 115,116, 118, 125, 136, 144–146, 153,155–157, 180–183, 186, 187, 191,194, 212, 213, 235, 236, 239, 246,254
Cnidaria, 48, 56Coastal lagoon, 17Coastline, 20, 66, 68, 95, 179, 180, 201, 203Copepods, 48, 56, 87, 129, 166, 167, 196Cyanobacteria, 18, 38, 51, 54–56, 83, 249–
251Cyprinidae, 85, 198, 225, 226
DDams, 85, 88, 97, 99, 116, 213Daxihaizi Reservoir, 209, 227
Dead Sea Transform, 1, 2Deep-water renewal, 188, 189Deglaciation, 79Density, 6, 18, 23, 121, 126, 159, 190, 191,
196, 199Depth, 18, 19, 44–46, 48, 50, 51, 55, 56,
58, 68, 73–75, 81, 95, 112, 115, 120–122, 132, 147, 153, 154, 157, 162,177–180, 188, 189, 191–193, 195–197, 203, 212, 220, 226, 227, 236,246, 247, 249, 250
Desiccation, 10, 95, 109, 111, 117–120, 124,125, 127, 128, 136, 157, 211, 212,219, 220
Detergents, 201, 203Diatoms, 40, 43, 44, 48, 55, 83, 130, 153,
154, 165, 195, 226, 251Dinoflagellates, 83, 87, 165, 195Dissolved oxygen, 46, 51, 59, 68, 74, 125,
126, 162, 163, 177, 189Dragonflies, 167Dust, 7, 13, 110, 125, 134, 135, 214, 228Dzhergalan River, 190Dzhuuku River, 182Dzknaget River, 44Dzungarian Alatau, 149
EEast Anatolian Fault, 2Eastern Paratethys, 39Edom Mountains, 4Egypt, 12, 16Ein Feshkha, 15Einot Tzukim, 15El-Niño Southern Oscillation (ENSO), 72,
73, 91, 96Emperor Qianlong, 218Endemism, 66, 82, 85, 86Endorheic, 65, 66, 68, 69, 110, 143, 144, 152,
207Eocene, 39, 209, 217Epilimnion, 19, 249Euglenids, 164Evaporation, 1, 4, 9, 17–19, 23–25, 45,
49, 51, 69, 73–75, 88–90, 95, 97,116, 119–121, 123, 131, 143, 145,153, 155–158, 161, 180, 183, 191,193–195, 200, 208, 228, 240, 246,248
Evaporites, 1, 17, 223

Index 261
FFauna, 35, 39, 82–84, 110, 111, 121, 122,
127–130, 134, 135, 144, 166–168,184–186, 197, 198, 201, 215, 218,219, 223, 252, 253
Fecal pellets, 214Feldspars, 7Fertilizers, 37, 94, 177Fish, 20, 36, 37, 49, 56, 59, 82, 84–87, 94,
97, 99Flora, 35, 82, 83, 110, 111, 122, 165, 183,
195, 197, 201, 215, 218, 223, 253Foraminifera, 39, 129, 215, 216Forel-Ule color scale, 190Freshwater, 1, 2, 5–7, 9, 12, 13, 19, 20, 22,
23, 40, 54, 73, 74, 79, 82–85, 95, 98,121, 122, 126–128, 130, 143, 152,154, 164–168, 170, 171, 198, 212,214, 219, 221, 238, 246, 250–252
GGastropoda (gastropods), 48, 54, 56, 84, 128,
167, 215, 216, 224, 225, 240Geology, 79, 203Geomorphology, 79, 248Golden algae, 164Great Ear, 209–213, 215, 217, 219–223, 228Green algae, 48, 55, 83, 165, 195Green Corridor, 227Grigorievka village, 202Groundwater, 5, 20, 23, 89, 92, 95, 120, 131,
134, 135, 145, 151, 152, 177, 191,193, 194, 207, 223, 227–229, 240,246, 249, 252, 253
Gulf of Aqaba, 5Gypsum, 1, 6, 7, 23, 153, 211, 213, 214, 220Gyrogonites, 217, 226
HHalite, 1, 6, 7, 9, 10, 19, 214Han Dynasty, 207, 212–215, 219, 220, 230Harmful algal bloom, 87Hayravank, 41Hazeva, 6Hazeva Formation, 6Heavy metals, 53, 93, 201–203Hirudinea, 48, 54, 56, 252Holocene, 1, 6, 7, 9–11, 13, 20, 35, 36,
40–45, 47–50, 54, 57, 59, 65, 66,77, 86, 97, 115–117, 143, 144, 152–154, 156, 184, 186, 187, 210, 211,213–218, 235, 242, 243
Hominin migration, 2Human Impact, 98, 99, 111, 116, 123, 207,
212, 213, 215, 218, 235, 253, 254Hydrocarbons, 76, 93, 98, 201Hydroelectric power, 2, 23, 59Hydrography, 65, 80Hydrology, 4, 110, 119, 144, 212, 213, 227,
235, 246, 248Hypersaline lake, 1Hypolimnion, 18, 19, 46, 51, 58, 188, 249
IIce, 46, 51, 68, 73, 79, 86, 91, 121, 146, 156,
157, 182, 183, 186, 229, 240, 241,248, 249, 252
Ichthyofauna, 85, 122, 129, 130, 144, 168,169
Ili River, 143, 145, 147, 150, 151, 157, 158,161, 165, 169–171
Invasive species introduction, 66, 87Invertebrates, 86, 121, 122, 126, 127, 129,
134, 136, 166, 168, 251Irano–Turanian vegetation, 12Iron Age, 41, 42Irrigation, 22, 36–38, 46, 50, 59, 97, 109,
111, 116, 118, 123, 126, 131, 135,136, 157, 159, 193, 194, 200, 203,207, 227, 229, 253, 254
Irrigation farming, 12, 145, 159, 194, 195,200, 207, 213, 218, 230
Israel National Water Carrier, 15Issyk-Kul State Reserve, 199
JJericho, 10, 12Jezreel Valley, 22Jordan, 2, 15, 22, 23Jordanian Plateau, 4Jordan Valley, 3, 4, 7, 12, 22, 24Judean Desert, 5
KKadji Sai village, 202, 203Kanglake lakes, 209, 225, 226, 228Kapchagai Reservoir, 143, 144, 150, 157,
169–171Kara-Bogaz-Gol, 65, 68, 69, 73, 82, 88–91,
95Karakol, 199, 202Kara Koshun, 209, 221, 224–226Karaoi Plateau, 150

262 Index
Karatal River, 169Keriya River, 218Khvalynian, 77, 79, 80Konqi River, 212, 220, 222, 229Kuluke Desert, 227Kumtagh Desert, 211Kumtor gold mine, 203Kungei Ala-Too, 178, 183, 200Kunlun Shan, 208Kuruk Tagh, 208Kutemaldinsky Threshold, 180Kyzyl-Choku Mountains, 179, 183
LLake Bosten, 218, 219Lake deposits, 148, 161, 241, 242Lake level, 4–7, 9, 10, 13–15, 18, 19, 23, 25,
43, 44, 50, 110, 115, 116Lake mixing, 7, 188, 189, 191Large Aral, 112, 114, 116, 117, 120, 121,
124–126, 129, 130, 133–136Last Lake, 210, 212, 213, 220–224Late Quaternary, 215, 217, 240Late Sarmatian, 39Lchashen, 41, 43Ld facies, 7Lebanon, 12Leeches, 167, 196Lepsy River, 156, 171Levant, 5, 12–14Lisan Formation, 1, 6, 7Little Ice Age, 81, 97, 155Loulan, 212, 213, 218Luobei, 209–211, 214Lynch Strait, 4, 15, 17
MMacrophytes, 48, 54, 57–59, 83, 197, 217,
219, 226, 240Malacostraca, 167Mammals, 53, 125, 185, 186Mangyshlak, 68, 80, 82, 94Masada, 14Maximum Allowable Concentration
(MAC), 201–203Mayflies, 58, 167Mediterranean Sea, 4, 6, 22, 24Meotian, 39Mesopotamia, 12Microplastics, 53Miocene, 1, 5, 35, 38–40, 42, 59, 178
Mixing, 6, 7, 18, 23, 51, 58, 73–75, 121, 126,180, 188, 189, 191, 249
Mixolimnion, 18, 23Moav Mountains, 4Molluscs, 39, 40, 42, 43, 84, 240, 252Monk Xuanzang, 212Mountain lake, 35, 177, 251
NNannofossils, 39National Water Carrier of Israel, 22Negev Desert, 7Nemacheilidae, 198Nematoda (nematodes), 48, 56, 83, 84, 129Neocaspian, 77, 80Neolithic, 10, 12Niya River, 218Noraduz Peninsula, 35Norashen, 41–44North Aral, 113, 114, 124–126, 134, 136North Atlantic Oscillation (NAO), 156Northern Wei Dynasty, 218Northwest Mongolia, 235Nutrients, 23, 94, 99, 162, 195, 201, 248, 254
OOil and gas, 66, 93, 135Oligocene, 5, 39, 59Oligochaeta (oligochaetes), 48, 54, 56–58,
84, 122, 128, 167, 196Oogonia, 217, 226Organic nitrogen, 162Organic pollutants, 53Ostracods, 39, 40, 57, 153, 168, 196, 214,
219Overfishing, 66, 97, 99Oxygen saturation, 189, 190, 249
PPalaeogene, 39, 59Paleolithic, 186, 198Paleozoic, 150, 239Palestine Exploration Fund (PEF), 15Palestinian Authority, 23Pamirs, 118, 119, 208, 209Paratethys, 39, 59, 65, 66, 76, 82, 121, 209Pesticides, 53, 177, 201Phenols, 201–203Phosphorus, 37, 52, 53, 55, 56, 99, 162, 201,
250pH value, 163, 192, 249

Index 263
Phytoplankton, 48, 55, 83, 87, 98, 126, 165,171, 189, 190, 195, 250, 251
Playa, 134, 207, 208, 210, 212, 220, 223,228, 229
Pleistocene, 1, 6, 9, 35, 40, 43, 59, 66, 76,77, 79, 98, 114, 143, 151, 152, 156,178, 186, 210, 211, 239–241
Pliocene, 38, 40, 45, 59, 76, 178, 209, 239Pollution, 36, 37, 51, 53, 58, 65, 92–94,
97–99, 168, 200–203, 254Pontian, 35, 39, 40, 59Potash industry, 1Potassium sulfate, 228Pre-Pottery Neolithic culture, 10Protozoans, 196Puchang Sea, 212, 219, 220Pycnocline, 18
QQing Dynasty, 218, 219Quartz, 7, 160Quaternary, 6, 65, 76, 82, 98, 120, 148, 215,
237
RRamsar site, 199Red Sea, 1, 2, 4, 22–24Reed, 122, 125, 165, 166, 184, 185, 197, 225,
226, 240, 246, 252Regulation, 97, 99, 229Riparian forests, 227River Amu, 119, 125River Arax, 36River discharge, 70, 74, 89, 90, 115, 123, 200River Hrazdan, 35, 40, 42, 45, 50Rivermouth, 20, 76, 79, 82, 94, 99, 167, 191,
202River Syr, 119Roman Empire, 14Romans, 13, 14, 148Rotifers, 48, 55, 56, 84, 128, 129, 135, 166,
196, 251
SSalinity, 17–19, 23, 25, 65, 68, 73–75, 82, 84,
86, 98, 110, 113, 120, 121, 124–131,134–136, 144, 146, 152, 160, 162–166, 168, 171, 179, 189, 191, 192,214, 217, 221, 222, 227, 238, 248,250
Salt, 6–9, 11, 20, 21, 23, 75, 114, 121, 125,135, 143, 152, 209, 211, 217, 220,221, 223, 229, 238, 246, 249–252
Sand bars, 153, 242Santash Passage, 178, 180Santash winds, 180Saryesik Peninsula, 152Satellite, 73, 82, 88–90, 96, 220, 244–246,
249SDIC Xinjiang Luobupo Hoevellite Co. Ltd,
228Sea of Galilee, 1, 4–7, 15Secchi Disk, 121, 190Sedom Diapir, 6Sedom lagoon, 17Seeds, 217, 218, 226Sevanavank, 41Shorzha, 37Sinkholes, 1, 8, 15, 18, 20, 21, 24Sisoridae, 198Sodium, 73, 161, 162, 167, 177, 192, 203Soreq Cave, 11Sotq, 37, 42, 53Spit, 95Station 8, 179, 189Stoneflies, 167Stonewort, 48, 196, 197Sturgeon, 66, 85, 97, 169Sulphate, 73, 162, 163, 177Syria, 12, 16
TTaitema Lake, 209, 210, 221, 222, 227, 228Taklamakan, 208, 227Tamga Resort, 182Tang Dynasty, 218Tarim Basin, 207–209, 217, 218, 227, 229Tarim River, 207, 212, 220, 227–229TarimRiver BasinWater Resource Commis-
sion (TRBWRC), 229Tasaral Island, 154Taurus-Zagros Mountains, 4Tectonics, 76, 178Terskei Ala-Too, 178, 181, 182, 199Thermocline, 50, 121, 188, 249Tianshan (Tien Shan), 178, 179, 182, 185,
186, 208, 209, 239Ton Gulf, 201, 203Tossor River, 182Total Dissolved Solids (TDS), 162Transparency, 50, 58, 165, 190, 197, 248Turbellaria (turbellarians), 48, 56, 83, 84,
129, 196

264 Index
Tyup River, 182, 183, 190, 191
UUlan winds, 180, 188UNESCO World Network of Biosphere
Reserves, 200Upwelling, 74Uvs Nuur Basin, 235–241, 246, 249, 252–
254Uzboy, 81, 115, 116Uzunaral Strait, 143, 152, 153, 155
VVolga, 66, 68–70, 72–75, 79, 80, 82, 88–90,
92, 93, 97, 169
WWarming, 91, 95, 98, 157, 177, 183, 187,
188, 191, 194, 200, 227, 229Wastewater, 94, 135, 177, 201–203, 235, 254Water balance, 1, 2, 4, 5, 9, 13, 19, 20, 24,
89, 90, 110, 120, 123, 124, 144, 145,193, 194, 248
Water beetles, 196Water bugs, 196Water chemistry, 47, 50–52
Water diversion, 1, 2, 5, 19, 38, 229Water-level change, 65, 76, 81, 95, 248Waves, 11, 19, 73, 74, 76, 89, 144, 159, 165,
190, 194, 197, 241, 252World Bank, 23, 118, 124, 132
XXinjiang, 159, 218, 228, 229Xinjiang Production andConstructionCorps
(XPCC), 229
YYardangs, 208, 211Yarmouk River, 5, 17Younger Dryas, 6, 80, 241, 242
ZZailisky Alatau, 150Zarka River, 5Ze’elim Formation, 1, 7Zoobenthos, 48, 54, 56–59, 122, 126–128,
167, 168, 171, 196Zooplankton, 48, 49, 54–56, 59, 84, 87, 122,
126, 127, 129, 166, 171, 196, 251Zygnematophyceans, 164