Statistics Syllabus for B.Sc. - Mount Carmel College, Bangalore
32
Statistics Syllabus for B.Sc. Mount Carmel College, Autonomous 2018 onwards 1 MOUNT CARMEL COLLEGE, AUTONOMOUS, BENGALURU DEPARTMENT OF STATISTICS & ANALYTICS REGULATIONS AND SYLLABUS IN STATISTICS FOR THE THREE YEAR B.Sc. DEGREE (CBCS) COURSE (2018 onwards) OBJECTIVES OF THE COURSE To impart education in Statistics, to give an in-depth knowledge of Statistics and applied topics like time series, demography, etc. It is said that, “Knowledge of Statistics………… may prove to be of use at any time under any circumstance”. Be it Medicine, Psychology, Astronomy, Industry, Finance, Management or any other field, Statistics plays a very important role to make inferences about sampled populations, to inculcate logical reasoning in students and improve their analytical skills. In the present era of Data Science and Analytics a good grounding in Statistics is a much desired pre-requisite. OPPORTUNITIES Statistics with Mathematics and Economics combination is an excellent course for students taking up CAT exam, career in management. Software giants like Infosys, Wipro prefer Computer Science students with a background in Statistics. The field of Actuaries requires youngsters with a good background in Statistics. Those who desire to serve their country can take up UPSC‟s a) Indian Statistical Service examination, b) Statistical officer in National Sample Survey Organisation. Clinical trials are conducted by the medical fraternity to find new and effective treatment for diseases. The knowledge of Statistics has a vital role to play in designing the trial and in answering medical questions effectively. A thorough grounding in Statistics is necessary for a career in any experimental science. When numerical data regarding any biological topic is collected, interpretation of the data can be done only with the help of Statistics. Statistics is used to process complex problems in the real world so that Data Scientists and Analysts can look for meaningful trends and changes in Data. ELIGIBILITY 1. Candidate seeking admission should have passed the Pre-University or an equivalent course with Basic Mathematics / Business Mathematics / Applied Mathematics as one of the optional subjects. 2. Candidates taking Statistics as one of the subjects in the B. Sc. course should study Mathematics as another optional subject.
-
Upload
khangminh22 -
Category
Documents
-
view
0 -
download
0
Transcript of Statistics Syllabus for B.Sc. - Mount Carmel College, Bangalore
Statistics Syllabus for B.Sc. Mount Carmel College, Autonomous
2018 onwards
1
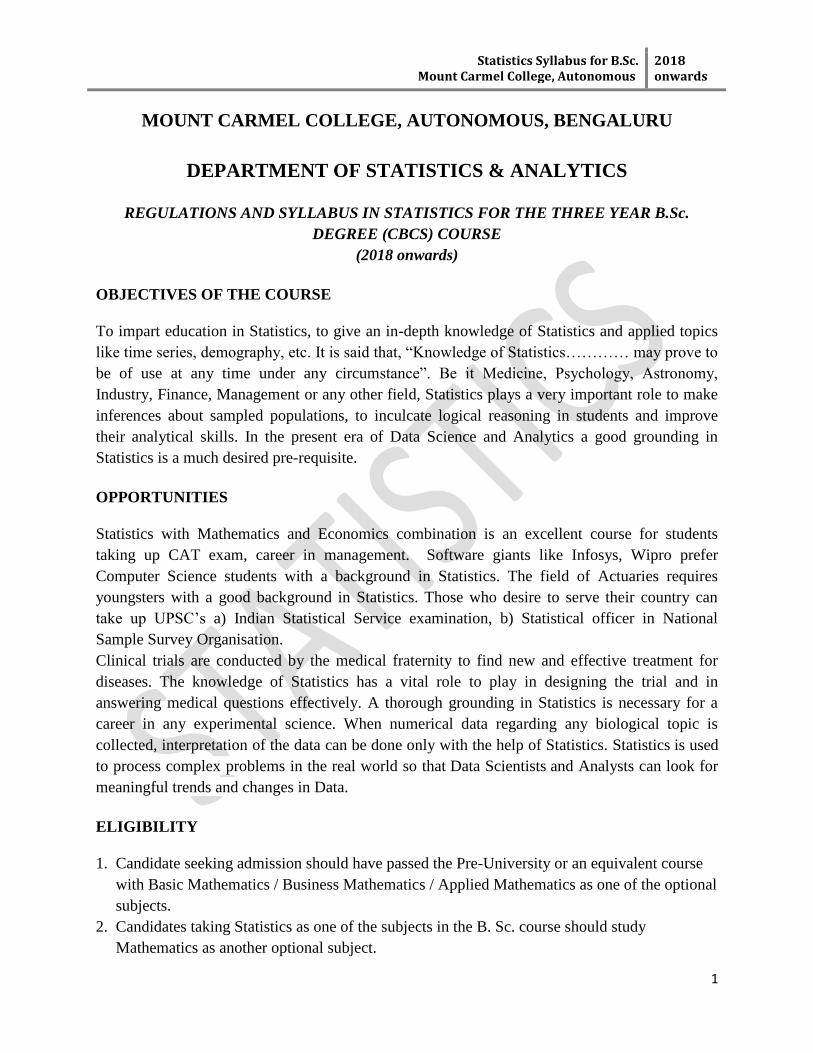
MOUNT CARMEL COLLEGE, AUTONOMOUS, BENGALURU
DEPARTMENT OF STATISTICS & ANALYTICS
REGULATIONS AND SYLLABUS IN STATISTICS FOR THE THREE YEAR B.Sc.
DEGREE (CBCS) COURSE
(2018 onwards)
OBJECTIVES OF THE COURSE
To impart education in Statistics, to give an in-depth knowledge of Statistics and applied topics
like time series, demography, etc. It is said that, “Knowledge of Statistics………… may prove to
be of use at any time under any circumstance”. Be it Medicine, Psychology, Astronomy,
Industry, Finance, Management or any other field, Statistics plays a very important role to make
inferences about sampled populations, to inculcate logical reasoning in students and improve
their analytical skills. In the present era of Data Science and Analytics a good grounding in
Statistics is a much desired pre-requisite.
OPPORTUNITIES
Statistics with Mathematics and Economics combination is an excellent course for students
taking up CAT exam, career in management. Software giants like Infosys, Wipro prefer
Computer Science students with a background in Statistics. The field of Actuaries requires
youngsters with a good background in Statistics. Those who desire to serve their country can
take up UPSC‟s a) Indian Statistical Service examination, b) Statistical officer in National
Sample Survey Organisation.
Clinical trials are conducted by the medical fraternity to find new and effective treatment for
diseases. The knowledge of Statistics has a vital role to play in designing the trial and in
answering medical questions effectively. A thorough grounding in Statistics is necessary for a
career in any experimental science. When numerical data regarding any biological topic is
collected, interpretation of the data can be done only with the help of Statistics. Statistics is used
to process complex problems in the real world so that Data Scientists and Analysts can look for
meaningful trends and changes in Data.
ELIGIBILITY
1. Candidate seeking admission should have passed the Pre-University or an equivalent course
with Basic Mathematics / Business Mathematics / Applied Mathematics as one of the optional
subjects.
2. Candidates taking Statistics as one of the subjects in the B. Sc. course should study
Mathematics as another optional subject.
Statistics Syllabus for B.Sc. Mount Carmel College, Autonomous
2018 onwards
2
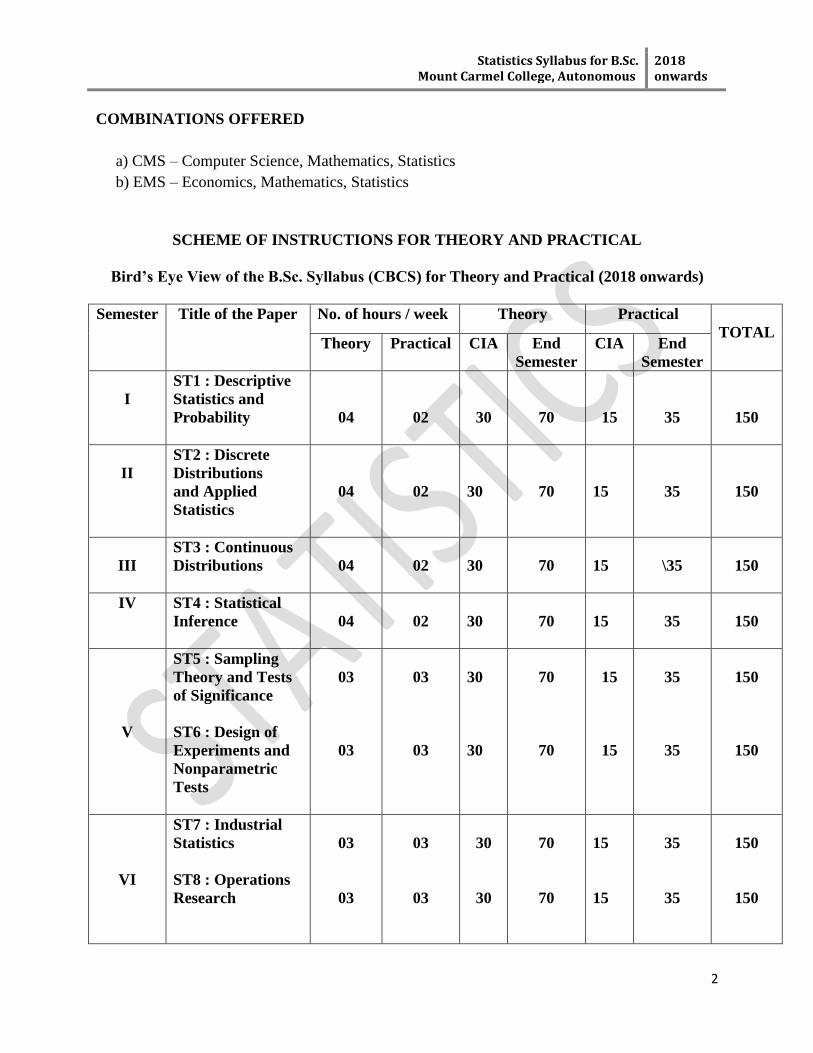
COMBINATIONS OFFERED
a) CMS – Computer Science, Mathematics, Statistics
b) EMS – Economics, Mathematics, Statistics
SCHEME OF INSTRUCTIONS FOR THEORY AND PRACTICAL
Bird’s Eye View of the B.Sc. Syllabus (CBCS) for Theory and Practical (2018 onwards)
Semester Title of the Paper No. of hours / week Theory Practical
TOTAL Theory Practical CIA End
Semester
CIA End
Semester
I
ST1 : Descriptive
Statistics and
Probability
04
02
30
70
15
35
150
II
ST2 : Discrete
Distributions
and Applied
Statistics
04
02
30
70
15
35
150
III
ST3 : Continuous
Distributions
04
02
30
70
15
\35
150
IV ST4 : Statistical
Inference
04
02
30
70
15
35
150
V
ST5 : Sampling
Theory and Tests
of Significance
ST6 : Design of
Experiments and
Nonparametric
Tests
03
03
03
03
30
30
70
70
15
15
35
35
150
150
VI
ST7 : Industrial
Statistics
ST8 : Operations
Research
03
03
03
03
30
30
70
70
15
15
35
35
150
150
Statistics Syllabus for B.Sc. Mount Carmel College, Autonomous
2018 onwards
3
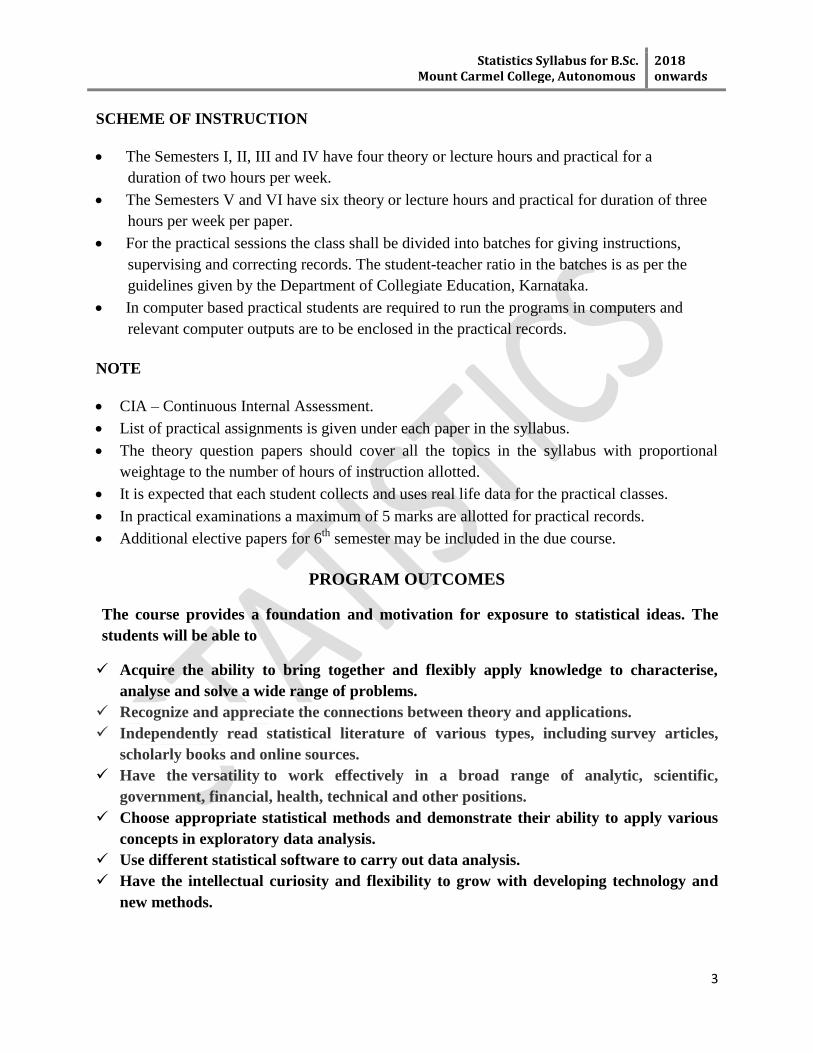
SCHEME OF INSTRUCTION
The Semesters I, II, III and IV have four theory or lecture hours and practical for a
duration of two hours per week.
The Semesters V and VI have six theory or lecture hours and practical for duration of three
hours per week per paper.
For the practical sessions the class shall be divided into batches for giving instructions,
supervising and correcting records. The student-teacher ratio in the batches is as per the
guidelines given by the Department of Collegiate Education, Karnataka.
In computer based practical students are required to run the programs in computers and
relevant computer outputs are to be enclosed in the practical records.
NOTE
CIA – Continuous Internal Assessment.
List of practical assignments is given under each paper in the syllabus.
The theory question papers should cover all the topics in the syllabus with proportional
weightage to the number of hours of instruction allotted.
It is expected that each student collects and uses real life data for the practical classes.
In practical examinations a maximum of 5 marks are allotted for practical records.
Additional elective papers for 6th
semester may be included in the due course.
PROGRAM OUTCOMES
The course provides a foundation and motivation for exposure to statistical ideas. The
students will be able to
Acquire the ability to bring together and flexibly apply knowledge to characterise,
analyse and solve a wide range of problems.
Recognize and appreciate the connections between theory and applications.
Independently read statistical literature of various types, including survey articles,
scholarly books and online sources.
Have the versatility to work effectively in a broad range of analytic, scientific,
government, financial, health, technical and other positions.
Choose appropriate statistical methods and demonstrate their ability to apply various
concepts in exploratory data analysis.
Use different statistical software to carry out data analysis.
Have the intellectual curiosity and flexibility to grow with developing technology and
new methods.
Statistics Syllabus for B.Sc. Mount Carmel College, Autonomous
2018 onwards
4
SEMESTER I
THEORY PAPER I
ST1: DESCRIPTIVE STATISTICS AND PROBABILITY
Learning Outcomes
Introductory Concepts
Students will be able to
recognise different types of data and scales of measurement.
represent the data using graphs and diagrams.
Univariate Data Analysis
Students will be able to
compute and interpret measures of centre and spread of data.
construct and analyze graphical displays to summarised data.
Bivariate Data Analysis
Students will be able to
calculate, interpret and communicate the simple correlation and simple linear regression.
fit different types of curves to the respective data.
Probability
Students will be able to
utilize basic concepts of probability including independence and conditional probability.
calculate, interpret and communicate event probabilities.
evaluate probabilities of events from two-way tables.
Module I (8 hours)
Introductory Concepts
Unit 1
Introduction to the subject of Statistics, population and sample, variables and attributes.
Unit 2
Types of data – qualitative, quantitative, univariate, multivariate, cross sectional, time series,
discrete, continuous, primary, secondary. Scales of measurement – nominal, ordinal, interval,
ratio.
Unit 3
Construction of frequency distributions (univariate and bivariate).
Organisation and presentation of data through diagrams (bar and pie) and graphs (frequency
curve, histogram, cumulative frequency curves), stem and leaf plot.
Statistics Syllabus for B.Sc. Mount Carmel College, Autonomous
2018 onwards
5
Module II (18 hours)
Univariate Data Analysis
Unit 1
Measures of location or central tendency - arithmetic mean, median, mode, geometric mean,
harmonic mean – properties, positional averages or quantiles – quartiles, deciles, percentiles and
their interpretations. Comparison of the different averages.
Unit 2
Measures of dispersion - absolute measures - range, mean deviation, quartile deviation, standard
deviation - properties with proof, relative measures.
Unit 3
Moments – about origin, about an arbitrary point, central moments, relationship between
moments about origin and moments about mean, skewness and kurtosis - concept and measures,
box and whisker plot – construction and applications.
Module III (10 hours)
Bivariate Data Analysis
Unit 1
Linear Correlation - Scatter diagram, product moment correlation coefficient - properties,
Spearman‟s rank correlation coefficient.
Unit 2
Regression - Dependent and independent variables, objectives of regression, derivation of linear
regression model by the method of least squares, estimation of regression coefficient and
coefficient of determination and their interpretations.
Module IV (16hours)
Probability
Unit 1
Introduction to probability, sample space and events, various approaches to probability –
classical, empirical and axiomatic approach
Unit 2
Addition theorem, conditional probability, multiplication theorem, independent events,
Theorems related to the different concepts, Bayes‟ theorem, rule of total probability.

Statistics Syllabus for B.Sc. Mount Carmel College, Autonomous
2018 onwards
6
PRACTICAL – STP1
1. Data Presentation
2. Measures of Central Tendency
3. Measures of Dispersion, Skewness, Kurtosis
4. Correlation and Regression for Ungrouped Data
5. Probability 1
6. Probability 2
BOOKS FOR STUDY
1. Medhi J - Statistical Methods - An Introductory Text, Second Edition, New Age
Publishers (2006)
2. Goon A M, Gupta M K and Das Gupta B - Fundamentals of Statistics - Volume I, Sixth
Edition, World Press, Calcutta (1986)
3. Gupta S C and Kapoor V K - Fundamentals of Mathematical Statistics, Sultan Chand and
Sons (2017)
4. Kapoor J N and Saxena H C - Mathematical Statistics, Sultan Chand and Company (2014)
5. Roger E Kirk - Statistics: An Introduction, Fifth Edition, Wadsworth Publishing Company
(2007)
6. Bhat B R, Srivenkataramana T and Rao Madhava K. – Statistics : A Beginner's Text,
Volume I and II, New Age International Pvt Ltd (1996)
7. Mukhopadhyay P - Mathematical Statistics, New Central Book Agency (1996)
BOOKS FOR REFERENCE
1. Agarwal B L - Basic Statistics, Sixth Edition, New Age International Pvt Ltd (2013)
2. Stirzaker, David - Elementary Probability, Second Edition, Cambridge University Press
(2003)
3. Snedecor G W and Cochran - Statistical Methods, Eighth Edition, Affiliated East West Press
Ltd (1989)
4. Sheldon M Ross - Introductory Statistics, Second Edition, Academic Press(2010)
5. Freund J E and Walpole - Mathematical Statistics, New Edition, Prentice Hall India (2012)
Statistics Syllabus for B.Sc. Mount Carmel College, Autonomous
2018 onwards
7
SEMESTER II
THEORY PAPER II
ST2: DISCRETE DISTRIBUTIONS AND APPLIED STATISTICS
Learning Outcomes
Discrete Random Variables and Theoretical Discrete Probability Distributions
Students will be able to
construct probability distribution of a discrete random variable.
determine the appropriate theoretical probability distribution based on experimental
conditions and assumptions.
calculate, interpret and communicate probabilities.
Applied Statistics
Index Numbers
Students will be able to
understand and identify the problems in the construction of various types of index numbers.
appreciate various tests of adequacy and the uses of index numbers.
understand the concept of Consumer Price Index and identify the limitations of index
numbers.
Time Series
Students will be able to
understand and apply the concepts and methods underlying the analysis of univariate time
series and the context for interpretation of results.
decompose a time series into trend, seasonal, cyclical and irregular components.
understand the theoretical basis of different methods of time series analysis including
decomposition.
Official Statistics
Students will know
about the Ministry of Statistics and Programme Implementation (MoSPI).
about the functions of NSSO and CSO.
Demography
The students will be able to
Understand basic demographic measures.
Identify alternative sources of demographic data.
Analyse and interpret basic demographic measures.
Statistics Syllabus for B.Sc. Mount Carmel College, Autonomous
2018 onwards
8
Demand Analysis
The students will be able to
define and explain the utility analysis.
define supply and demand analysis and explain the associated functions.
explain how supply and demand are related.
Module I (12 hours)
Discrete Random Variables
Unit 1
Concept of a random variable, distribution function and its properties, discrete random variable
and its probability function, mathematical expectation of a random variable - mean, variance and
higher moments. Properties of expectation and variance.
Unit 2
Bivariate probability distribution, marginal and conditional distributions, covariance,
independence, conditional expectation and variance, mean and variance of linear combination of
random variables.
Unit 3
Moment generating function (mgf) and its properties, methods of generating moments from mgf.
Module II (15 hours)
Theoretical Discrete Distributions
Unit 1
Uniform distribution- mean and variance.
Unit 2
Bernoulli distribution- probability mass function (pmf), mean, variance, moment generating
function.
Binomial distribution- derivation of the pmf, mean, variance, moments, moment generating
function, recurrence relation for moments and probabilities, coefficients of skewness and
kurtosis, additive property, fitting.
Poisson distribution- derivation of pmf, mean, variance, moments, moment generating function,
recurrence relation for moments and probabilities, additive property, fitting.
Unit 3
Hyper-geometric distribution- mean, variance, limiting form.
Unit 4
Geometric distribution- mean, variance, moments, moment generating function, additive
property, lack of memory property.
Negative binomial distribution – mean, variance, moments, moment generating function,
recurrence relation for moments.
Statistics Syllabus for B.Sc. Mount Carmel College, Autonomous
2018 onwards
9
Module III (10 hours)
Applied Statistics - I
Unit 1
Index Numbers
Meaning, uses, problems in the construction of index numbers, price and quantity relatives,
simple aggregative and weighted price and quantity index numbers, Laspeyre, Paasche,
Marshall - Edgeworth and Fisher index numbers – their inter-relationships, tests for index
numbers, consumer price index number and methods of constructing them.
Unit 2
Time Series
Components of time series, additive and multiplicative models, measurement of trend – method
of semi averages, method of least squares and method of moving averages, measurement of
seasonal variation- method of simple averages, method of ratio to moving averages; applications
of time series.
Module IV (15 hours)
Applied Statistics - II
Unit 1
Official Statistics
Ministry of Statistics and Programme Implementation (MoSPI), Chief Statistician of India,
indices of economic growth, functions of NSSO and CSO and their principle findings, national
income, per capita income, gross domestic product.
Unit 2
Demography
Sources of demographic data, measures of morbidity and mortality - crude, specific and
standardised death rates, maternal mortality rate, infant mortality rate, measurement of fertility-
crude, age-specific, general and total fertility rates, reproductive rates - gross and net, life tables
– cohort, components, construction, uses.
Unit 3
Demand Analysis
Law of demand and supply, elasticity of demand and supply, Giffen‟s paradox, Utility function,
marginal utility function, statement of law of diminishing marginal utility, statement of law of
equi-marginal utility.
Statistics Syllabus for B.Sc. Mount Carmel College, Autonomous
2018 onwards
10
PRACTICAL – STP2
1. Computation of Characteristics for Discrete Probability Distributions
2. Computation of Characteristics for Bivariate Probability Distributions
3. Evaluation of Probabilities involving Discrete Theoretical Distributions
4. Fitting of Binomial, Poisson and Negative Binomial Distributions
5. Time Series
6. Construction of Index Numbers
7. Demography
8. Data Analysis using Statistical Software ( MSEXCEL, SPSS )
a) Diagrams and Graphs
b) Measures of Central Tendency and Dispersion
c) Correlation and Regression for Ungrouped Data
BOOKS FOR STUDY
1. Irwin Miller, Marylees Miller - John E Freund‟s Mathematical Statistics, Eighth Edition,
Prentice Hall India (2012)
2. Harry Frank and Steven C Althoen, Statistics - Concepts and Application, Cambridge
Low Price Edition (1994)
3. Gupta. S C and Kapoor V K - Applied Statistics, Sultan Chand and Sons (2014)
4. Sheldon M Ross - Introductory Statistics, Second Edition, Academic Press (2010)
5. Hogg R V, Tanis E A - Probability and Statistical Inference, Eighth Edition (2010)
6. Goon A M, Gupta M K and Dasgupta B - Fundamentals of Statistics - Volume II,
World Press (2016)
7. Bhuyan K C - Probability Distribution Theory and Statistical Inference, NCBA(2010)
BOOKS FOR REFERENCE
1. Neil A Weiss - Elementary Statistics, Ninth Edition, Addison Wesley (2016)
2. Spiegel M R and Stephens L J - Theory and Problems of Statistics, Third Edition,
Schaum‟s Publishing Company (1999)
3. Richard A Johnson - Miller & Freund‟s Probability and Statistics for Engineers,
Eighth Edition, Prentice Hall (2011)
4. Parimal Mukhopadyay - Applied Statistics, Books and Allied Pvt Ltd (1999)
5. Peter Dalgaard - Introductory Statistics for R, Second Edition, Springer (2013)
Statistics Syllabus for B.Sc. Mount Carmel College, Autonomous
2018 onwards
11
SEMESTER III
THEORY PAPER III
ST3: CONTINUOUS DISTRIBUTIONS
Learning Outcomes
Continuous Random Variables
Students will be able to
understand different probability functions with respect to univariate and bivariate continuous
random variables.
prove the properties and theorems on expectation and variance.
derive the distribution of functions of univariate random variables using appropriate
techniques.
Theoretical Continuous Distributions
Students will be able to
determine the appropriate areas under a normal curve.
prove important properties of normal distribution including the preservation of normality
under a linear transformation.
derive the properties of other theoretical continuous distributions like uniform, exponential,
beta and gamma.
Sampling Distributions
Students will be able to
describe the abstract idea of a sampling distribution and how it reflects the sample to sample
variability of a statistic.
explain how it is a measure of the precision of a point estimate (sampling variability).
know about chi-square, t and F distributions – their genesis and properties.
Limit Theorems
Students will be able to
apply the central limit theorem to problems involving sums and averages of variables from
arbitrary distributions.
understand the applications of Chebychev‟s inequality.
Statistics Syllabus for B.Sc. Mount Carmel College, Autonomous
2018 onwards
12
Module I (13 hrs)
Continuous Random Variables
Unit 1
Concept of a random variable, continuous random variable and its probability density function,
distribution function and its properties.
Unit 2
Expectation of a random variable - mean, variance skewness and kurtosis, transformation of
univariate random variables using cdf and transformation techniques.
Unit 3
Bivariate probability distribution, marginal and conditional distributions, independent random
variables, conditional expectation, conditional variance and proof of the associated theorems,
covariance, correlation, moment generating function.
Module II (18 hrs)
Theoretical Continuous Distributions
Unit 1
Uniform, beta (type 1 and type 2), exponential and gamma distributions – definition through
probability density function, mean, variance, moments and moment generating function, additive
property of exponential and gamma variates, lack of memory property of exponential
distribution. Normal distribution and its properties –median, mode, m.g.f, moments, area and
additive property, points of inflexion. Cauchy distribution- definition, statement of properties.
Unit 2
Bivariate normal distribution- definition through p.d.f, marginal and conditional distributions.
Module III (16 hrs)
Sampling Distributions
Unit 1
Concepts of population, parameter, random sample, statistic, sampling distribution and standard
error, sampling distributions of sample mean, biased and unbiased estimators of population
variance, statement of theorem on independence of sample mean and variance in random
sampling from normal distribution, sampling distribution of sample variance.
Unit 2
Chi-square, t and F distributions - definition through probability density function and important
properties.
Statistics Syllabus for B.Sc. Mount Carmel College, Autonomous
2018 onwards
13
Module IV (05 hrs)
Limit Theorems
Unit 1
Chebychev‟s inequality – proof with respect to continuous random variable, applications.
Unit 2
Convergence in probability and convergence in distribution
Central limit theorem – Statement in its general form and applications, proof of De'Moivre -
Laplace and Levy - Lindeberg theorems.
PRACTICAL – STP3
1. Computation of Characteristics of Continuous Probability Distribution
2. Computation of Characteristics of Bivariate Probability Distribution
3. Transformation of Univariate Random Variables
4. Evaluation of Probabilities of Normal Distribution
5. Evaluation of Probabilities of Exponential, Uniform, Beta and Gamma distributions
6. Fitting of Normal Distribution
7. Construction of Sampling Distribution of Sample Mean and Sample Variance
8. Applications of Chebychev‟s Inequality and Central Limit Theorem
9. Computer aided Data Analysis (MSEXCEL, SPSS)
a) Correlation and Regression (for 2018 and 2019 batches only)
b) Evaluation of Probabilities of Theoretical Discrete and Continuous Distributions
(from 2019 batch onwards)
BOOKS FOR STUDY
1. Sharma A K - Text Book of Probability and theoretical Distributions, Discovery Publishing
House, New Delhi (2005)
2. Hogg, Tanis, Rao - Probability and Statistical Inference - Seventh Edition, Pearson Education
(2011)
3. Bhuyan K C – Probability, Distribution Theory and Statistical Inference , NCBA (2010)
4. Ball Alan, Buckwell Geoff - A Level Statistics, Macmillan Work out Series (2016)
5. Miller Irwin, Miller Marylees - John E Freund‟s Mathematical Statistics and Applications,
Eighth Edition, Pearson (2018)
6. Gupta S C, Kapoor V K - Fundamentals of Mathematical Statistics, Sultan Chand & Sons
(2017)
7. Goon A M , Gupta M K , Das Gupta B - Fundamentals of Statistics, Volume I, World Press,
Calcutta(1991)
8. Hogg R V and Craig A T - Introduction to Mathematical Statistics, Fifth Edition, Prentice
Hall, New Jersey, USA (1995)
Statistics Syllabus for B.Sc. Mount Carmel College, Autonomous
2018 onwards
14
9. Medhi J - Statistical Methods: An Introductory Text, New Age International, New Delhi
(1992)
10. Mukhopadhyay P - Mathematical Statistics, Books and Allied Pvt Ltd., Kolkata (2015)
11. Spiegel M R - Probability and Statistics, Fourth Edition, Schaum‟s Outline Series, McGraw
Hill, London (2001)
12. Walpole R E , Myers R H , and Myers, S L - Probability and Statistics for Engineers and
Scientists, Ninth Edition, Pearson, New Delhi (2017)
BOOKS FOR REFERENCE
1. Spatz Chris - Basic Statistics: Tales of Distributions, Tenth Edition, Wadsworth Cengage
Learning (2010)
2. DeCoursey W J - Statistics and Probability for Engineering Applications with Microsoft
Excel , Elsevier Science (USA) ( 2003)
3. Krishnamoorthy K - Handbook of Statistical Distributions with Applications, Chapman and
Hall/CRC (2006)
4. Beaver Barbara M, Beaver Robert J, Mendenhall William - Introduction to Probability
and Statistics, Twelfth Edition, Cengage Learning
5. Lipschutz Seymour, Schiller John J - Introduction to Probability and Statistics (Schaum‟s
Outlines), Tata McGraw Hill (2014)
6. Fricker Jr. Ronald D -Introduction to Probability and Statistics for Data Scientists(with R):
Chapters 1-3, CreateSpace Independent Publishing Platform (2014)
7. Bhattacharya G K and Johnson R A - Statistical Concepts and Methods, John Wiley, New
York (1986)
8. Dudewicz E J and Mishra S N - Modern Mathematical Statistics, John Wiley, New York
(1980)
9. Rohatgi V K and Saleh A K Md. E. - An Introduction to Probability Theory and
Mathematical Statistics, Third Edition, John Wiley, New York (2002)
10. Ross S M - Introduction to Probability Models, Tenth Edition, Academic Press, UK(2003)
Statistics Syllabus for B.Sc. Mount Carmel College, Autonomous
2018 onwards
15
IV SEMESTER
THEORY PAPER IV
ST4: STATISTICAL INFERENCE
Learning Outcomes
Point Estimation and Methods of Estimation
Students will be able to
appreciate the need for statistical inference and point estimation of the parameters.
compute point estimates of the parameters of theoretical discrete and continuous
distributions.
utilise the of method of maximum likelihood function and method of moments of obtaining
point estimators.
Testing of Hypothesis and Most Powerful (MP) Tests
Students will be able to
identify the appropriate null and alternative hypotheses, including one or two sided, simple or
composite for a given study objective.
identify correctly what the type I and type II errors would be when presented with the results
of a statistical study.
apply Neyman-Pearson lemma for constructing most powerful tests.
Uniformly Most Powerful (UMP) and Likelihood Ratio (LR) Tests
Students will be able to
identify families of distributions that possess the monotone likelihood ratio(MLR) property.
apply the MLR property in the construction of uniformly most powerful tests.
Interval Estimation
Students will be able to
understand the informal and formal explanations of any confidence interval.
understand how factors like sample size, confidence level, estimated standard deviation of
estimator (i.e., standard error) and margin of error affect the width and precision of a
confidence interval.
distinguish between one-sided and two-sided confidence intervals.
construct intervals for common population parameters (means, proportions, variances and
population correlation coefficient).
Statistics Syllabus for B.Sc. Mount Carmel College, Autonomous
2018 onwards
16
Module I (18 hrs)
Point Estimation and Methods of Estimation
Unit 1
Concepts of parameter, estimator, estimate and standard error of an estimator, unbiasedness,
asymptotic unbiasedness, mean squared error, bias, relationship between bias, mean squared
error and variance, consistency, statement of sufficient conditions for consistency of an
estimator, invariance property of consistent estimators, sufficient statistic, factorisation theorem,
invariance property of sufficient estimators, efficiency, relative efficiency, Fisher information
function, statement of Frechẻt - Cramer – Rao inequality, minimum variance bound (MVB)
estimator, minimum variance unbiased estimator (MVUE), difference between MVU and MVB
estimators. Identifying unbiased, consistent, efficient, sufficient and minimum variance bound
estimators of parameters of standard theoretical discrete and continuous probability distributions.
Unit 2
Maximum likelihood and moment methods of estimation, examples, statement of properties.
Module II (14 hrs)
Testing of Hypothesis and Most Powerful Tests
Unit 1
Statistical hypotheses - null and alternative, simple and composite, one and two sided; critical
and acceptance regions and critical (test) function, randomized and non-randomized tests, type-I
and type-II errors, level of significance, size and power of a test, p-value.
Unit 2
Most powerful (MP) test, statement of Neyman-Pearson lemma and its uses in the construction of
most powerful tests, applications.
Module III (10 hrs)
Uniformly Most Powerful and Likelihood Ratio Tests
Unit 1
Monotone likelihood ratio (MLR) property, uniformly most powerful (UMP) test, statement of
the theorem on uniformly most powerful tests for testing one sided hypotheses for distributions
with monotone likelihood ratio property, applications.
Unit 2
Likelihood ratio tests (LRT), likelihood ratio tests for testing the mean of univariate normal
distribution (case of simple null against a two sided alternative).
Statistics Syllabus for B.Sc. Mount Carmel College, Autonomous
2018 onwards
17
Module IV (10 hrs)
Interval Estimation
Unit 1
Meaning, confidence coefficient, margin of error, length and precision of confidence intervals,
pivotal quantity, one and two sided confidence intervals, central and shortest confidence
intervals.
Unit 2
Confidence interval for mean, difference of means, variance, ratio of variances, proportion,
difference between proportions and correlation coefficient.
PRACTICAL – STP4
1. Estimation of Parameters by the Method of Maximum Likelihood and Method of Moments
2. Evaluation of Probabilities of Type I and Type II Errors and Power of Tests (Discrete
Distributions)
3. Evaluation of Probabilities of Type I and Type II Errors and Power of Tests
(Continuous Distributions)
4. Construction of MP test – I (Discrete Distributions)
5. Construction of MP test – II (Continuous Distributions)
6. Construction of UMP Tests and Power Curve for Exponential and Normal Distributions
7. Interval Estimation
8. Computer Aided Data Analysis (MS EXCEL, R, SPSS) – Interval Estimation
BOOKS FOR STUDY
1. Hogg, Tanis, Rao - Probability and Statistical Inference - Seventh Edition, Pearson
Education (2011)
2. Hogg, McKean and Craig - Introduction to Mathematical Statistics - Seventh Edition,
Pearson Education (2013)
3. Miller Irwin, Miller Marylees - John E Freund‟s Mathematical Statistics and Applications,
Eighth Edition, Pearson (2018)
4. Goon A M , Gupta M K and Das Gupta B - Outline of Statistical Theory - Vol.1, World
Press, Calcutta (1991)
5. Gupta S C, Kapoor V K - Fundamentals of Mathematical Statistics - Sultan
Chand &Sons (2017)
6. Medhi J - Statistical Methods: An Introductory Text, New Age International, New Delhi
(1992)
7. Miller Irwin, Miller Marylees - John E Freund‟s Mathematical Statistics and Applications,
Eighth Edition, Pearson (2018)
8. Rajagopalan M, Dhanavanthan P – Statistical Inference –PHI Learning Pvt Ltd (2012)
Statistics Syllabus for B.Sc. Mount Carmel College, Autonomous
2018 onwards
18
BOOKS FOR REFERENCE
1. Tucker H G - An Introduction to Probability and Mathematical Statistics, Academic Press
(2014)
2. Casella G, Berger R L – Statistical Inference, Duxbury Thomson Learning (2002)
3. Panik Michae J – Statistical Inference : A short Course, Wiley (2012)
4. DeCoursey W J - Statistics and Probability for Engineering Applications with Microsoft
Excel, Elsevier Science, USA (2003)
5. Gupta Bhisham C and Guttman Irwin - Statistics and Probability with Applications for
Engineers and Scientists, Wiley (2013)
6. Wackerly Dennis D, Mendenhall William III, Scheaffer Richard L – Mathematical Statistics
with Applications, Seventh Edition, Cengage Learning (2008)
7. Mood AM, Greybill FA and Boes D C - Introduction to the Theory of Statistics – McGraw
Hill, Third Edition, Seventh Reprint (2001)
8. Rohatgi V K and Saleh A K Md E - An Introduction to Probability and Statistics, Third
Edition, Wiley (2015)
9. Bijma F, Jonker M, Vaart A – An Introduction to Mathematical Statistics, Second Edition,
Amsterdam University Press (2017)
10. Kandethody M Ramachandran, Chris P Tsokos - Mathematical Statistics with Applications
in R, Second Edition, Elsevier (2015)
Statistics Syllabus for B.Sc. Mount Carmel College, Autonomous
2018 onwards
19
V SEMESTER
THEORY PAPER V
ST5: SAMPLING THEORY AND TESTS OF SIGNIFICANCE
Learning Outcomes
Basic Concepts and Survey Methods
Students will be able to
identify the population of interest, individuals, parameter, sample and statistics from a study.
distinguish between (i) an observational study and an experiment. (ii) probability and non
probability sampling methods – the methodology of each of the types considered.
identify whether a probability sampling method or a non-probability sampling method was
used to obtain the study data.
distinguish between the accuracy and precision of estimates.
Simple Random Sampling, Stratified Random Sampling and Systematic Random Sampling
Students will be able to
learn about a variety of sampling methods, namely, simple random sampling, stratified
random sampling and systematic sampling.
understand how results from samples can be used to provide estimates of population
characteristics such as population mean, population total, population standard deviation and
/or population proportion.
calculate the interval estimates of the parameters.
compare and recognize the best method of sampling.
Tests of Significance
Students will be able to
recognise the similarity among all test statistics of the standardized score variety; exploit this
similarity to derive test statistics for common tests involving proportions and means.
use p-values to make decisions about hypotheses under test.
correctly identify the appropriate statistical test that should be applied to analyze a study,
choosing from proportion(s), mean(s), variance(s) correlation/linear regression,
independence of attributes and goodness of fit and also use statistical software for this
analysis.
Statistics Syllabus for B.Sc. Mount Carmel College, Autonomous
2018 onwards
20
Module I (5 hours)
Basic Concepts and Survey Methods
Unit 1
Concept of finite population and sample, need for sampling – complete enumeration versus
sample surveys, non- probability and probability sampling – meaning , need and illustrations
with respect to different techniques; methods of drawing random samples – lottery system , use
of random numbers; bias, accuracy and precision of the estimates.
Unit 2
Sample design – its meaning and importance, principle steps in a survey, sampling and non –
sampling errors and simple methods of controlling them, requisites of a good questionnaire,
drafting of questionnaires and schedules, pilot survey.
Module II (10 hours)
Simple Random Sampling
Unit 1
Simple random sampling with and without replacement, unbiased estimators of population mean
and total, derivation of sampling variances and their estimation, confidence limits for population
mean, population total, derivation of formulae for sample size in sampling for means using
SRSWOR.
Unit 2
Simple random sampling for attributes, unbiased estimators of population proportion and total
number of units possessing the attribute in the population, derivation of their standard errors and
confidence limits for the true values; derivation of formula for sample size in sampling for
proportions.
Module III (10 hours)
Stratified Random Sampling and Systematic Random Sampling
Unit 1
Need for stratification, unbiased estimators of population mean and total, allocation of sample
sizes under proportional, optimum and Neyman allocations, derivation of standard errors and
their estimation under proportional and Neyman‟s allocations, proof of the theorem under
optimum allocation with a fixed sample size, comparison of Vopt , Vprop and Vsrs . Expressions for
gain in precision due to stratification over SRSWOR.
Unit 2
Linear and circular systematic sampling, advantages and limitations, estimation of population
mean and standard error of the estimator, comparison of systematic sampling with simple
random sampling, systematic sampling as a particular case of stratified random sampling.
Statistics Syllabus for B.Sc. Mount Carmel College, Autonomous
2018 onwards
21
Module IV (15 hours)
Tests of Significance
Unit 1
Revision of basic terms (types of hypotheses, errors, tests, critical and acceptance regions). Tests
for mean and equality of two means, tests for variance and equality of two variances, large
sample tests for proportion and equality of two proportions.
Unit 2
Tests for linear correlation coefficient and regression coefficient in simple linear regression, chi-
square tests for goodness of fit and for independence of attributes in a contingency table.
PRACTICAL – STP5
PART A
1. Design of Questionnaires. (Their pretest and subsequent modifications, if required)
2. Simple Random Sampling
3. Stratified Random Sampling
4. Systematic Random Sampling
5. Tests concerning Population Mean and Equality of Two Population Means
6. Tests concerning Population Proportion and Equality of Two Population Proportions
7. Tests concerning Population Variance and Equality of Two Population Variances
8. Tests concerning Population Correlation and Regression Coefficients
9. Chi-square Test for Goodness of Fit
10. Chi-square Test for Independence of Attributes
11. Computer Aided Data Analysis - Tests of Significance
{The numerical examples with 'sample data given' are handled using the following software:
Test for single mean, two means independent samples & paired t test - EXCEL, R and SPSS
Test for two variances – EXCEL and Test for proportions – R}
PART B
FIELD/PROJECT WORK
The students shall divide themselves into smaller groups. They shall decide on a topic of
interest, give a survey proposal , conduct pilot survey, modify questions if necessary, collect
data , analyze and write a report, using a public domain software, like „R‟.
Statistics Syllabus for B.Sc. Mount Carmel College, Autonomous
2018 onwards
22
BOOKS FOR STUDY
1. Cochran W G - Sampling Techniques, Third Edition, Wiley Student Edition (2014)
2. Singh Daroga, Chaudhary F S - Theory and Analysis of Sample Survey Designs, First
Edition, New Age International Private Limited (2018)
3. Mukhopadhyay Parimal - Theory and Methods of Survey Sampling, Second Edition,
Prentice Hall India Learning Private Limited (2008)
4. Casella George, Berger Roger L - Statistical Inference, Second Edition, Cengage Learning
(2001)
5. Hogg R V, Tanis E A and Zimmerman D L - Probability and Statistical Inference, Ninth
Edition, Pearson Education (2015)
6. Mood A M, Graybill F A and Boes D C - Introduction to the Theory of Statistics, Third
Edition, McGraw Hill (2001)
BOOKS FOR REFERENCE
1. Raj D, Chandak P – Sample Survey Theory, Createspace Independent Publishing Platform
(2013)
2. Sampath S - Sampling Theory and Methods, Illustrated Edition, Alpha Science
International (2005)
3. Sukhatme P V et.al - Sampling Theory of Surveys with Applications, Third Revised
Edition, Iowa State University Press (1984)
4. Ross S M - Introduction to Probability and Statistics for Engineers and Scientists, Fifth
Edition, Academic Press (2014)
5. Rao C R - Linear Statistical Inference and its Applications, Second Edition, Wiley (2002)
6. Rohatgi V K and Saleh A K Md E - An Introduction to Probability and Statistics, Third
Edition, Wiley (2015)
Statistics Syllabus for B.Sc. Mount Carmel College, Autonomous
2018 onwards
23
V SEMESTER
THEORY PAPER VI
ST6: DESIGN OF EXPERIMENTS AND NONPARAMETRIC TESTS
Learning Outcomes
Analysis of Variance (ANOVA)
Students will be able to
recognise the situation in which analysis of variance (ANOVA) is appropriate and be able to
perform one-way and two-way ANOVA with the assistance of computer software.
explain the partitioning of the total sum of squares into the “within” and “between” group
components and identify the degrees of freedom associated with each sum of squares.
perform the F test in ANOVA, evaluating or approximating the p-value of the test statistic.
Design of Experiments
Students will be able to
identify features common in experiments, like the experimental unit, treatment, factors,
control groups, randomisation and blocking.
understand the importance of statistical design of experiments and its benefits; to choose an
appropriate experimental design based on the study objectives.
design and conduct appropriate experiments, as well as analyse and interpret appropriate
experimental data.
understand the concept of efficiency of an experimental design.
Factorial Experiments
Students will be able to
understand the need and the procedure of conducting factorial experiments.
analyse two factor and three factor factorial experiments at two levels.
appreciate the need for confounding a factorial experiment, identify the confounded effect.
Nonparametric Tests
Students will be able to
compare and contrast parametric and nonparametric tests and to identify applications where
nonparametric approaches are appropriate.
explain in detail and demonstrate the conduct of some non-parametric tests (in the framework
of large sample approximation of the test statistic).
Statistics Syllabus for B.Sc. Mount Carmel College, Autonomous
2018 onwards
24
Module I (10 hours)
Analysis of Variance (ANOVA)
Unit 1
Introduction - Meaning and assumptions, various mathematical models used in analysis of
variance.
Unit 2
Analysis of fixed effect model – one-way and two-way classified data - discussion through
examples, complete analysis, expected mean squares, least significant difference. Two way
classified data with interaction effect (only discussion with examples).
Module II (10 hours)
Design of Experiments
Unit 1
Introduction of basic terms: experimental material, experimental units, treatments, response,
blocks, etc., principles of randomization, replication and local control.
Unit 2
Completely Randomized Design (CRD), Randomized Block Design (RBD) and Latin Square
design (LSD) - layout and analysis, advantages, limitations and applications; efficiency of a
design, relative efficiency of RBD over CRD and LSD over CRD and RBD; missing plot
technique for RBD and LSD- estimation of single missing observation followed by analysis.
Module III (10 hours)
Factorial Experiments
Factorial experiments- meaning and need; 2² and 23 factorial experiments conducted as CRD and
RBD – complete statistical analysis - main effects and interactions, their estimates, contrast and
orthogonal contrasts, Yates‟ method of computing factorial effect totals; confounding in factorial
experiments - complete and partial confounding in a 23 experiment with RBD layout- analysis
and inference.
Module IV (10 hours)
Nonparametric Tests
Need, advantages and limitations of nonparametric tests, comparison with parametric tests;
discussion of the large sample approximation, construction of the test statistic and inference with
respect to the following tests - sign, run, median, signed rank, Wilcoxon rank sum, Mann-
Whitney -Wilcoxon U, Spearman‟s rank correlation coefficient, Kolmogorov-Smirnov test for
goodness of fit .
Statistics Syllabus for B.Sc. Mount Carmel College, Autonomous
2018 onwards
25
PRACTICAL – STP6
1. Analysis of Variance for a One Way Classified Data
2. Analysis of Variance for a Two Way Classified Data
3. Analysis of CRD, RBD and LSD
4. Analysis of a RBD and LSD with a Single Missing Observation
5. Analysis of 2² Factorial Experiment
6. Analysis of 23 Factorial Experiment
7. Analysis of a Confounded 23 Factorial Experiment
8. Computer Aided Data Analysis (SPSS, R and MSEXCEL) – ANOVA
9. Nonparametric Tests
BOOKS FOR STUDY
1. Cochran W G and Cox G M - Experimental Designs, Second Edition, John Wiley (2003)
2. Das M N and Giri N C - Design and Analysis of Experiments, Second Edition, New Age
International Pvt Ltd (2011)
3. Agarwal B L – Theory and Analysis of Experimental Designs –Cbs Publishers & Distributors
(2011)
4. Panneerselvam R - Design And Analysis Of Experiments – Prentice Hall of India (2012)
5. Montgomery D C - Applied Statistics and Probability for Engineers, Fourth Edition, Wiley
India Pvt. Ltd. (2009)
6. Conover W J - Practical Nonparametric Statistics, Third Edition, Wiley (2006)
BOOKS FOR REFERENCE
1. Montgomery D C - Design and Analysis of Experiments, Eighth Edition, John Wiley
(2012)
2. Joshi D D- Linear Estimation and Design of Experiments, New Age International (2009)
3. Walpole RE, Myers RH, Myers SL and Ye K - Probability and Statistics for Engineers and
Scientists, Ninth Edition, Pearson (2016)
4. Johnson, R A and Bhattacharya G K - Statistical Principles and Methods, Seventh Edition,
Wiley India Pvt. Ltd. (2015)
5. Dean Angela, Voss Daniel and Draguljic Daniel - Design and Analysis of Experiments,
Second Edition, Springer (2017)
6. Ross S M - Introduction to Probability and Statistics for Engineers and Scientists, Fifth
Edition, Academic Press (2014)
7. Berger P D and Maurer R E - Experimental Design with Applications in Management,
Engineering and the Sciences, First Edition, Duxbury Press (2001)
8. Zappe Christopher , Albright S C , Winston W L - Data Analysis and Decision Making
with Microsoft Excel, Brooks/Cole (2010)
9. Wackerly Dennis D, Mendenhall William III, Scheaffer Richard L – Mathematical Statistics
with Applications, Seventh Edition, Cengage Learning (2008)
Statistics Syllabus for B.Sc. Mount Carmel College, Autonomous
2018 onwards
26
VI SEMESTER
THEORY PAPER VII
ST7: INDUSTRIAL STATISTICS
Learning Outcomes
Introduction to Statistical Quality Control (SQC)
Students will be able to understand
the aims and objectives of SQC.
the different quality tools and quality standards.
Process Control
Students will be able to
construct control charts for variables and attributes.
interpret the results of process capability studies.
Product Control
Students will be able to
understand the meaning of product control and the role of sampling plans.
evaluate the different characteristics of single sampling plans and interpret them.
Reliability
Students will
learn the basic reliability concepts.
be able to calculate failure rate assuming different probability distributions.
get exposed to practical applications – real life situations where these probability models are
used.
Module I (6 hours)
Introduction to Statistical Quality Control (SQC)
Aims and objectives of statistical quality control, chance and assignable causes of variation,
process control, product control, importance of statistical quality control in industry, seven
quality control tools, total quality management, quality standards - BIS, ISO and six sigma.
Statistics Syllabus for B.Sc. Mount Carmel College, Autonomous
2018 onwards
27
Module II (14 hours)
Process Control
Unit 1
Theoretical basis and practical background for control charts, 3σ control limits, probability
limits, warning limits, natural tolerance and specification limits, rational subgroups.
Unit 2
Control chart for variables - derivation of limits and construction of X -R and X -s charts and
interpretation, process capability studies. OC and ARL functions of X -R charts.
Unit 3
Control chart for attributes- charts for number of defectives and fraction defective (d and p),
charts for number of defects (c and u) – basis, construction and interpretation, applications.
Model III (10 hours)
Product Control
Unit 1
Sampling inspection and 100 % inspection, acceptance sampling, Single Sampling Plan(SSP) for
attributes, AQL, LTPD, producer‟s risk and consumer‟s risk, derivation of OC, AOQ, ASN and
ATI functions for a single sampling plan, construction of a single sampling plan using Dodge -
Romig tables.
Unit 2
Double sampling plan (DSP) for attributes - description, advantages over single sampling plan,
derivation of the OC function, expressions for ASN, ATI and AOQ functions for a double
sampling plan
Module IV (10 hours)
Reliability
Reliability concepts, reliability of components and systems, reliability function, hazard rate, life
distributions- exponential, gamma and Weibull, system reliability-series and parallel systems,
Discussion on real-life applications/examples.
Statistics Syllabus for B.Sc. Mount Carmel College, Autonomous
2018 onwards
28
PRACTICAL – STP7
1. Construction of X -R Control Charts
2. Construction of X -s Control Charts
3. Construction of OC and ARL curves for X -R charts
4. Construction of d and p Control Charts
5. Construction of c and u Control Charts
6. Single Sampling Plan – Characteristics and Construction
7. Reliability
8. Computer Aided Data Analysis - Construction of Control Charts (SPSS, R)
BOOKS FOR STUDY
1. Grant E L and Leavenworth R S - Statistical Quality Control, Sixth Edition, Mc Graw
Hill (2017)
2. Montgomery D C - Introduction to Statistical Quality Control : A Modern Introduction,
Wiley Student Edition (2015)
3. Gupta R C - Statistical Quality Control, Ninth Edition, Khanna Publishing Company (2001)
4. Mahajan M - Statistical Quality Control, Dhanpat Rai & Company Pvt. Ltd (2016)
5. Gupta S C and Kapoor V K - Applied Statistics, Sultan Chand and Sons (2014)
6. Bilal M Ayyub and Richard H McCuen - Probability, Statistics and Reliability for
Engineers and Scientists, Second Edition, Chapman and Hall (2010)
BOOKS FOR REFERENCE
1. Eugene L Grant and Richard S Leavenworth - Statistical Quality Control, Sixth Edition,
McGraw Hill Book Company (2017)
2. John, S Oakland and Followel R F - Statistical Process Control, Sixth Edition, John Oakland
(2012)
3. Rowland Caplen - A Practical Approach to Quality Control, Second Edition (1988)
4. Gerald M Smith - Statistical Process Control and Quality Improvement, Fifth Edition,
Pearson (2003)
5. Wetherill G B and Brown D W - Statistical Process Control: Theory and practice, Springer
(2013)
6. William Grant Ireson, Clyde F. Coombs and Richard Y. Moss - Handbook of Reliability
Engineering and Management, Second Edition, Mc Graw Hill (1996)
7. Sankaran Mahadevan and Achintya Haldar - Probability, Reliability and Statistical Methods
in Engineering Design, Wiley (2000)
Statistics Syllabus for B.Sc. Mount Carmel College, Autonomous
2018 onwards
29
VI SEMESTER
THEORY PAPER VIII
ST8: OPERATIONS RESEARCH
Learning Outcomes
Introduction to Operations Research (OR) and Linear Programming Problem (LPP)
Students will be able to
appreciate the meaning and scope of OR.
distinguish between the different types of models used in OR.
formulate a linear programming problem and solve it using graphical, simplex and big M
methods.
identify the feasible region if it exists; identify the nature of the solution.
Transportation and Assignment problems
Students will be able solve transportation and assignment problems and give the optimal
solution.
Decision Theory and Game Theory, PERT and CPM, Decision Trees
Students will be able to
solve simple decision and game problems using different techniques.
to construct a simple network diagram; perform critical path calculation and PERT.
learn how to define a project in terms of activities such that a network can be used to describe
the project.
draw simple decision trees.
Inventory Theory, Queueing Theory and Simulation
Students will be able to
describe an inventory system, simple inventory models and obtain mathematical solutions.
understand a queueing system and its different components; derive the characteristics of a single
server queue.
generate observations from different probability distributions.
appreciate the central limit theorem and law of large numbers.
Module I (08 hours)
Introduction to Operations Research and Linear Programming Problem
Unit 1
Definition and scope of operations research, phases and models in operations research, different
methods of deriving solution to the models.
Statistics Syllabus for B.Sc. Mount Carmel College, Autonomous
2018 onwards
30
Unit 2
Definition of a linear programming problem (LPP), formulation and graphical solution of a LPP,
simplex procedure and Charnes‟ big M methods of solving a LPP, criteria for unique,
unbounded, multiple and infeasible solutions.
Module II (6 hours)
Transportation and Assignment Problems
Unit 1
Methods of finding initial basic feasible solution to a transportation problem by north-west
corner, matrix minima and Vogel‟s method, test for optimality by U-V method.
Unit 2
Introduction to assignment problem - mathematical formulation and Hungarian method of
finding the optimal solution; transportation and assignment problems as particular cases of LPP.
Module III (14 hours)
Decision Theory, Game Theory, PERT and CPM
Unit 1
Statistical decision problem, decision making under certainty, risk and uncertainty, maximin,
minimax, Laplace and expected payoff criteria, regret function, opportunity loss and expected
value of perfect information; construction of simple decision trees.
Unit 2
Introduction to game theory, basic terminology, two-person zero sum game, pure and mixed
strategies, solution of games with saddle point – minimax and maximin, dominance principle.
Graphical solutions for (2xn) and (mx2) games.
Unit 3
Project planning with CPM and PERT, drawing of project network, critical path calculations,
slack time and floats, PERT three estimate approach, calculation of probabilities of completing a
project within a specified period.
Module IV (12 hours)
Inventory Theory, Queueing Theory, Simulation
Unit 1
Description of an inventory system, need, discussion of various inventory costs, demand and lead
time, buffer stock, reorder level; EOQ model with and without shortages, EOQ model with
quantity discounts (price breaks) – discussion of one price break.
Statistics Syllabus for B.Sc. Mount Carmel College, Autonomous
2018 onwards
31
Unit 2
General description of a queueing system, elements and operating characteristics of a queueing
system, probability distributions used in M/M/1 queueing system, statement of steady state
probabilities of (M/M/1: ∞/FIFO) queueing system, derivation of expressions for queue length
and system size, waiting time in system and queue using Little‟s formula.
Unit 3
Introduction to simulation, advantages and limitations, Monte Carlo method, generation of random
observations from different theoretical distributions like binomial, Poisson, uniform, exponential,
gamma, normal and Cauchy and also from a given frequency distribution.
PRACTICAL - STP8
1. Formulation and Solution of LPP by Graphical Method
2. Solution of LPP by Simplex and Big M Methods
3. Transportation Problems
4. Assignment Problems
5. Decision Problems
6. Game Problems
7. Problems on CPM and PERT
8. Problems on EOQ Inventory Model
9. Problems on M|M|1 Queueing Model
BOOKS FOR STUDY
1. Goel B S, Mittal S K and Pundir S K - Operations Research, Thirtieth Edition, Pragathi
Prakashan (2018)
2. Taha H A – Operations Research : An Introduction, Tenth Edition, Pearson (2018)
3. Swarup Kanti, Gupta P K and Manmohan - Operations Research, Nineteenth Edition, Sultan
Chand & Sons (2017)
4. Natarajan A M, Balasubramani P, Tamilarasi A - Operations Research, Second Edition,
Pearson education (2014)
5. Mariappan P - Operations Research An Introduction, Pearson Education (2013)
6. Sharma J K - Operations Research Theory & Applications, Fifth Edition, Macmillan India
Limited (2012)
7. Sharma J K - Operations Research Problems and Solutions, Third Edition, Macmillan India
Limited (2012)
8. Sharma S D - Operations Research Theory, Methods & Applications, Fifteenth Edition
reprint, Kedar Nath Ram Nath (2017)
Statistics Syllabus for B.Sc. Mount Carmel College, Autonomous
2018 onwards
32
BOOKS FOR REFERENCE
1. Anderson D R, Sweeney D J et al - Quantitative Methods for Business, Thirteenth
Edition, Cengage Learning Custom Publishing (2015)
2. Gillett B E - Introduction to Operations Research, Tata McGraw Hill Publishing
Company Limited (2012)
3. Hillier F S, Lieberman G J et al – Introduction to Operations Research, Tenth Edition,
McGraw Hill Education (2017)
4. Hira D S, Gupta P K – Operations Research, Revised Edition, Sultan Chand & Company
Ltd (2015)
5. Kapoor V K, Kapoor Sumant – Operations Research Quantitative Technique for
Management, Ninth Edition, Sultan Chand & Sons (2014).
6. Ravindran A, Phillips D T and Solberg J J- Operations Research: Principles and Practice,
Second Edition, Wiley India (2007)
7. Broson Richard, Naadimuthu Govindasami – Operations Research, Schaum‟s Outline
Series, Second Edition, McGraw Hill Education (2017)
8. Gass S I - Linear Programming: Methods and Applications, Fifth Edition, Dover
Publications (2010)
9. Mustafi C K - Operations Research Methods and Practice, Revised Third Edition, New
Age international Publishers (2006)
__________________________