Statistical analysis on ancient mortars: A case study of the Balivi Tower in Aosta (Italy)
8
Statistical analysis on ancient mortars: A case study of the Balivi Tower in Aosta (Italy) Elena Arizio a,⇑ , Rossano Piazza a,b , Warren R.L. Cairns b , Lorenzo Appolonia c , Alessandra Botteon a a Department of Environmental Sciences, Informatics and Statistics, Ca’ Foscari University of Venice, Dorsoduro 2137, 30123 Venice, Italy b Institute for the Dynamics of Environmental Processes (CNR-IDPA), Dorsoduro 2137, 30123 Venice, Italy c Analytical Scientific Laboratory of the Department for the Conservation of Regional Cultural Heritage of Aosta Valley, Narbonne square 3, 11100 Aosta, Italy highlights The statistical analyses distinguished mortars of different rebuilding periods. The role of variables was studied to select the most suitable technique. Different degradation agents in different heights and facades were found. graphical abstract article info Article history: Received 3 February 2013 Received in revised form 14 May 2013 Accepted 17 June 2013 Available online 12 July 2013 Keywords: Mortar Principal Components Analysis Cluster Analysis Ionic Chromatography Thermogravimetric and differential thermal analysis abstract This study proposes a first approach to the characterization of the composition and degradation products of historical mortars and their classification through chemometric analysis. This work also aimed at com- paring the usefulness and applicability of analytical techniques that are commonly used for mortar exam- ination. Calcimetry, Thermogravimetric Analysis (TGA) and Differential Thermal Analysis (DTA), Ionic Chromatography (IC) and Fourier Transform Infrared Spectroscopy (FT-IR) were used to analyse a number of samples collected from the quadrangular Tower of the Balivi Complex in Aosta (Italy). Cluster Analysis and Principal Components Analysis (PCA) were carried out on the analytical results, and the accordance and the relevance of the results were evaluated. The role of the variables on the samples description and their correlation were evaluated. The results showed the division of the samples into groups that were probably due to the presence of different mortar types manufactured in different periods. Furthermore, an irregular degradation pattern on the four facades and at different heights of the tower was highlighted. Ó 2013 Elsevier Ltd. All rights reserved. 1. Introduction Mathematical and statistical methods are widely used in studies on cultural heritage. Chemometric analyses support dating and provenancing of the raw materials of archeological and historical objects such as glasses [1–6], ceramics [7–10], organic binders [11] and stones [12]. A chemometric approach allows the user to extract relevant information from a large number of data set that has to be managed after a research study [13]. Despite the widespread application of chemometrics to the con- servation of cultural heritage, only few a statistical studies aimed at mortar characterization have been made. All of these studies were only concerned about the grouping and the classification of samples, and nothing has been published that directly compares 0950-0618/$ - see front matter Ó 2013 Elsevier Ltd. All rights reserved. http://dx.doi.org/10.1016/j.conbuildmat.2013.06.026 ⇑ Corresponding author. Address: via Circonvallazione 12, 11026 Pont-Saint- Martin, Italy. Tel.: +39 3491061323. E-mail address: [email protected] (E. Arizio). Construction and Building Materials 47 (2013) 1309–1316 Contents lists available at SciVerse ScienceDirect Construction and Building Materials journal homepage: www.elsevier.com/locate/conbuildmat
Transcript of Statistical analysis on ancient mortars: A case study of the Balivi Tower in Aosta (Italy)
Construction and Building Materials 47 (2013) 1309–1316
Contents lists available at SciVerse ScienceDirect
Construction and Building Materials
journal homepage: www.elsevier .com/locate /conbui ldmat
Statistical analysis on ancient mortars: A case study of the Balivi Towerin Aosta (Italy)
0950-0618/$ - see front matter � 2013 Elsevier Ltd. All rights reserved.http://dx.doi.org/10.1016/j.conbuildmat.2013.06.026
⇑ Corresponding author. Address: via Circonvallazione 12, 11026 Pont-Saint-Martin, Italy. Tel.: +39 3491061323.
E-mail address: [email protected] (E. Arizio).
Elena Arizio a,⇑, Rossano Piazza a,b, Warren R.L. Cairns b, Lorenzo Appolonia c, Alessandra Botteon a
a Department of Environmental Sciences, Informatics and Statistics, Ca’ Foscari University of Venice, Dorsoduro 2137, 30123 Venice, Italyb Institute for the Dynamics of Environmental Processes (CNR-IDPA), Dorsoduro 2137, 30123 Venice, Italyc Analytical Scientific Laboratory of the Department for the Conservation of Regional Cultural Heritage of Aosta Valley, Narbonne square 3, 11100 Aosta, Italy
h i g h l i g h t s
� The statistical analyses distinguishedmortars of different rebuildingperiods.� The role of variables was studied to
select the most suitable technique.� Different degradation agents in
different heights and facades werefound.
g r a p h i c a l a b s t r a c t
a r t i c l e i n f o
Article history:Received 3 February 2013Received in revised form 14 May 2013Accepted 17 June 2013Available online 12 July 2013
Keywords:MortarPrincipal Components AnalysisCluster AnalysisIonic ChromatographyThermogravimetric and differential thermalanalysis
a b s t r a c t
This study proposes a first approach to the characterization of the composition and degradation productsof historical mortars and their classification through chemometric analysis. This work also aimed at com-paring the usefulness and applicability of analytical techniques that are commonly used for mortar exam-ination. Calcimetry, Thermogravimetric Analysis (TGA) and Differential Thermal Analysis (DTA), IonicChromatography (IC) and Fourier Transform Infrared Spectroscopy (FT-IR) were used to analyse a numberof samples collected from the quadrangular Tower of the Balivi Complex in Aosta (Italy). Cluster Analysisand Principal Components Analysis (PCA) were carried out on the analytical results, and the accordanceand the relevance of the results were evaluated. The role of the variables on the samples description andtheir correlation were evaluated. The results showed the division of the samples into groups that wereprobably due to the presence of different mortar types manufactured in different periods. Furthermore,an irregular degradation pattern on the four facades and at different heights of the tower was highlighted.
� 2013 Elsevier Ltd. All rights reserved.
1. Introduction
Mathematical and statistical methods are widely used instudies on cultural heritage. Chemometric analyses support datingand provenancing of the raw materials of archeological and
historical objects such as glasses [1–6], ceramics [7–10], organicbinders [11] and stones [12]. A chemometric approach allows theuser to extract relevant information from a large number of dataset that has to be managed after a research study [13].
Despite the widespread application of chemometrics to the con-servation of cultural heritage, only few a statistical studies aimedat mortar characterization have been made. All of these studieswere only concerned about the grouping and the classification ofsamples, and nothing has been published that directly compares
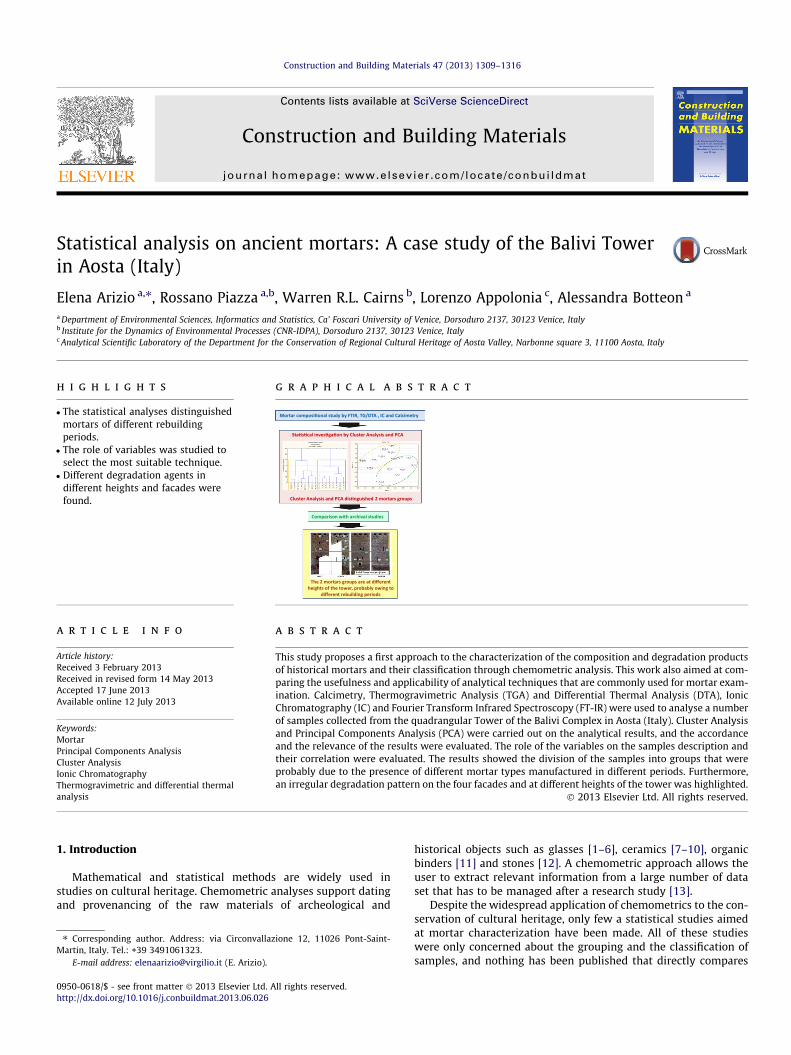
Fig. 1. The Balivi Tower Complex in Aosta (Italy).
1310 E. Arizio et al. / Construction and Building Materials 47 (2013) 1309–1316
the various analytical techniques that can be used for characteriz-ing mortars.
Rampazzi et al. [13] used PCA to investigate specimens andsamples of historical mortars. A PLS (Partial Least Squares regres-sion for one y-variable) was needed to create a statistical methodfor estimating the binder/aggregate ratio (B/A). Using a SIMCAmethod (Soft Independent Models of Class Analogy), Musumarraet al. [14] distinguished Gothic and Flemish mortars used for muralpaintings in Chiaravalle Abbey. The test results from thermal anal-ysis, mercury porosimetry and mechanical strength analysis wereused by Moropoulou et al. [15,16] for the classification of historicalmortars in Byzantine and Ottoman monuments using PCA. Princi-pal component analysis (PCA) was also used by Giuffrida et al.[17] to distinguish between painted plasters and wall coveringplasters. Alvarez et al. [18] proposed a method based on hot hydro-chloric acid attack of mortars to carry out a separation of the bin-der and the aggregate, while Sanjurjo-Sánchez et al. [19] used amultivariate statistical analysis of the chemical data obtained byX-ray diffraction and neutron activation analysis for the differenti-ation of mortars groups from the Santa Eulalia de Bóveda temple(Spain).
This study is thus one of the firsts chemometrical studies onmortars and is, in particular, the first chemometric study compar-ing analytical techniques that are currently used for theirexamination.
This research aims to classify and date mortar samples collectedfrom the quadrangular tower of the Balivi Complex in Aosta. Theinformation acquired was compared with archive data of previousstudies [20–22] to distinguish the different mortar mixtures and todetermine the various rebuilding periods and restorations.
This study also aims to evaluate the validity and the actual needfor the most common analytical techniques used for mortar charac-terization such as Calcimetry, Thermogravimetric Analysis (TGA),Differential Thermal Analysis (DTA), Ionic Chromatography (IC)and Fourier Transform Infrared Spectroscopy (FT-IR) [23–25], thatin some cases provide comparable information.
A statistical investigation of the results of such analytical tech-niques should result in a reduction in the number of analysesneeded to characterize mortars.
2. Materials and methods
2.1. Mortar samples
Sixteen samples in total were taken using a scalpel from all four facades at dif-ferent heights of the Balivi tower (Fig. 1). The sampling locations are shown in Fig. 2.The samples were finely ground using an agate mortar, to obtain a particles size ofabout 230 mesh. The powdered samples were analyzed by Calcimetry, TG/DTA, ICand FTIR.
The calcimetry was performed using the UNI 11140:2004 procedure [26].For TG/DTA analysis, a Pyris Diamond TG/DTA Differential Thermal Analyzer
was used, with data acquisition with the proprietary software. About 5–10 mg ofpowder were analyzed in a ceramic sample holder, in a temperature range between50 and 1000 �C and with a heating rate of 20 �C for minute in a nitrogen atmo-sphere. The flow rate of nitrogen for the TG/DTA analysis was 3.5 ml/s.
For IC, the soluble fraction of 1 g of sample was extracted into deionized waterby ultrasound. For anions analysis a 8 mM of Na2CO3 and 1 mM of NaHCO3 elutingsolution was used. For cation analysis, a 20 mM of metanesulfonic acid (CH3SO3H)eluting solution was used. A DX A 120 Dionex chromatograph equipped with AS4A-SC column for anions analysis and a CS12A column for cations analysis was used.The chromatograms were acquired and manipulated using the ChromeleonTM
software.FTIR spectra were acquired by a Perkin Elmer Spectrum 2000 FTIR Spectrometer
in transmission mode (using powder samples mixed with KBr) in the 4000–400 cm�1 range, with a resolution of 0.5 cm�1 with at least 500 scans per spectrum.
All the results are shown and discussed by Appolonia et al. [20]. They are thenstudied by statistical analyses such as Cluster Analysis and Principal ComponentAnalysis (PCA).
The mortar samples were found to be traditional non-hydraulic lime mortars,with different carbonatic binder percentages. In every sample a small fraction ofgypsum (0.5–1.5%) was found.
2.2. Data treatment
Cluster Analysis and PCA were carried out on the results obtained from theanalyses described above.
The data were statistically elaborated using the Cluster Analysis Package in-cluded in the statistical software STATISTICA 6.0 (StartSoft, Inc, 2001, Tulsa, OK,USA). Auto-scaling procedures and hierarchical agglomerative methods were used.The dissimilarity between objects was measured with Euclidean or 1-r Pearson dis-tances. The objects were clustered using Ward’s and Single Linkage methods for thestudy of their composition and degradation products respectively.
To carry out the statistical analysis it was assumed that the calcareous fractionin the aggregate was negligible as was the gypseous content in the raw limestone.
The variables related to the samples composition are: the binder fraction, ob-tained from Calcimetry (%CA) and TG/DTA (%TG); the gypsum fraction detectedwith TG/DTA (%GES); sulfates (ANIDR) and silica (SiO2) were determined by FT-IRafter the TG/DTA analysis; sulfates (SO¼4 ), and Magnesium (Mg2+) and Calcium(Ca2+) were quantified by IC. Since different techniques gave the same type of infor-mation, the variables were chosen to evaluate the accordance between these resultsand to detect if substances such as dolomite and gypsum were intentionally addedto the initial mixture. The statistical approach can link the results of the calcimetricanalysis and the Thermogravimetric Analysis, as both provide information aboutthe calcium carbonate fraction. Any differences that we obtain can contribute toimproving the quality of results obtained by these two different analyticaltechniques.
Gypsum can either be introduced in the mixture on purpose or it may be a deg-radation product due to the formation of calcium sulfate from the carbonate. Thevariables related to gypsum (ANIDR, SO¼4 and %GES) were determined to understandwhich was the case in our samples.
The variable Mg2+ was included to try to evaluate if the magnesium was presentin the mortar as an impurity of the carbonatic binder or as a component of the inertfraction.
The variables selected for the characterization of degradation products were:the gypsum fraction detected with TG/DTA (%GES); the quantity of sulfates (ANIDR)obtained from FT-IR measurements after the TG/DTA analysis; chloride (Cl�), ni-trate (NO�3 ) and sulfate (SO¼4 ), ammonium ion (NHþ4 ), calcium ion (Ca2+), potassiumion (K+), and sodium (Na+) ions, were quantified by IC. These variables were chosento study any correlations between the ions, and to evaluate the presence of differenttypes of soluble salts and trace their spatial distribution on the tower surface.
3. Results and discussion
3.1. Analysis on mortars composition
3.1.1. VariablesAll the variables for the study of mortars composition were used
for both Q-mode Cluster Analysis and PCA using a matrix of 16objects by 8 variables. In this study case only the first two principalcomponents were considered, as their cumulative explained vari-ance reached 79% (52% and 27% for the first and second principal
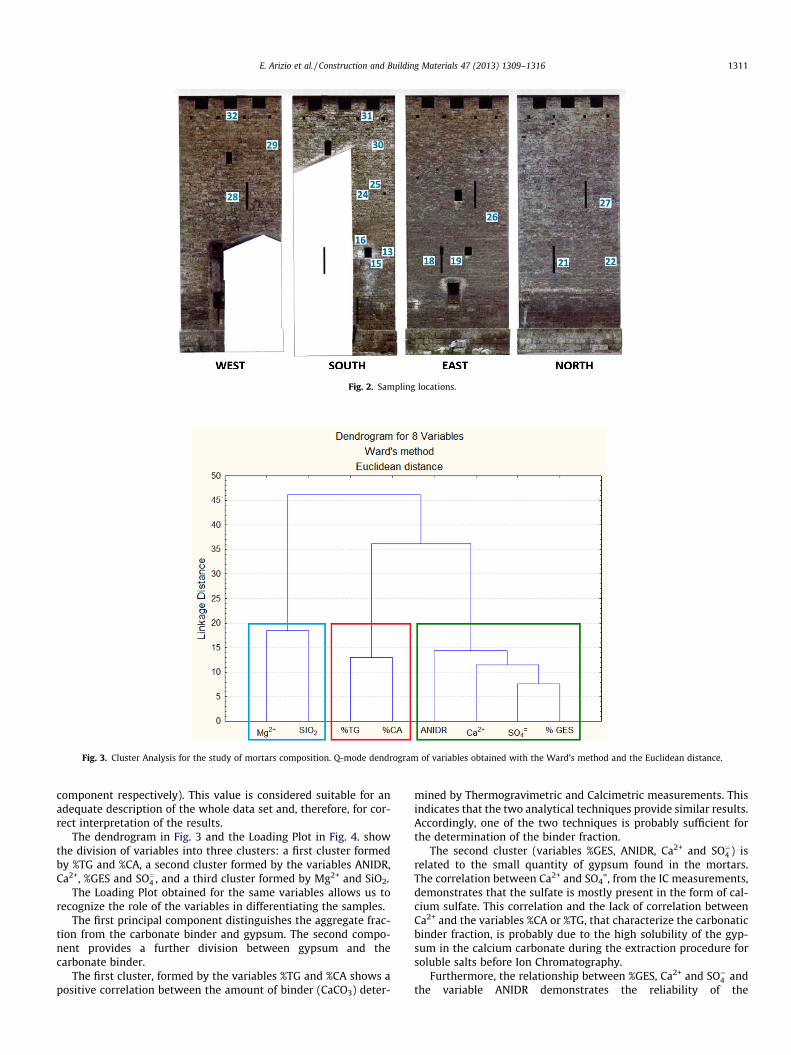
Fig. 3. Cluster Analysis for the study of mortars composition. Q-mode dendrogram of variables obtained with the Ward’s method and the Euclidean distance.
Fig. 2. Sampling locations.
E. Arizio et al. / Construction and Building Materials 47 (2013) 1309–1316 1311
component respectively). This value is considered suitable for anadequate description of the whole data set and, therefore, for cor-rect interpretation of the results.
The dendrogram in Fig. 3 and the Loading Plot in Fig. 4. showthe division of variables into three clusters: a first cluster formedby %TG and %CA, a second cluster formed by the variables ANIDR,Ca2+, %GES and SO¼4 , and a third cluster formed by Mg2+ and SiO2.
The Loading Plot obtained for the same variables allows us torecognize the role of the variables in differentiating the samples.
The first principal component distinguishes the aggregate frac-tion from the carbonate binder and gypsum. The second compo-nent provides a further division between gypsum and thecarbonate binder.
The first cluster, formed by the variables %TG and %CA shows apositive correlation between the amount of binder (CaCO3) deter-
mined by Thermogravimetric and Calcimetric measurements. Thisindicates that the two analytical techniques provide similar results.Accordingly, one of the two techniques is probably sufficient forthe determination of the binder fraction.
The second cluster (variables %GES, ANIDR, Ca2+ and SO¼4 ) isrelated to the small quantity of gypsum found in the mortars.The correlation between Ca2+ and SO4
=, from the IC measurements,demonstrates that the sulfate is mostly present in the form of cal-cium sulfate. This correlation and the lack of correlation betweenCa2+ and the variables %CA or %TG, that characterize the carbonaticbinder fraction, is probably due to the high solubility of the gyp-sum in the calcium carbonate during the extraction procedure forsoluble salts before Ion Chromatography.
Furthermore, the relationship between %GES, Ca2+ and SO¼4 andthe variable ANIDR demonstrates the reliability of the
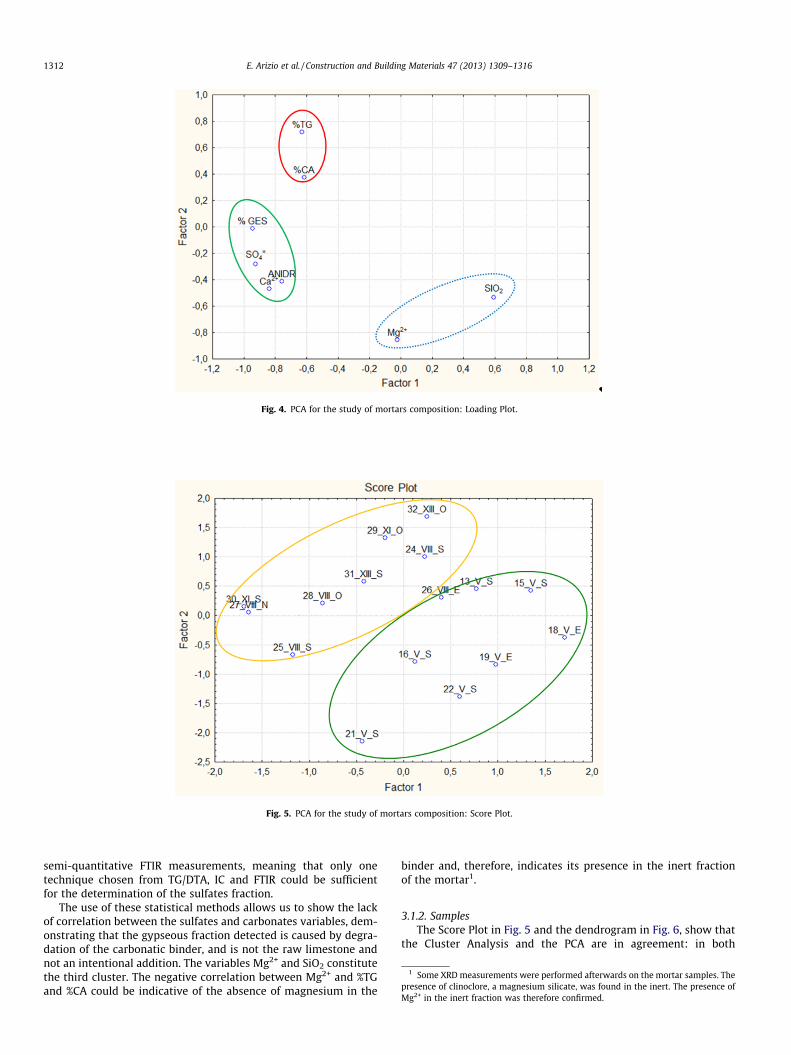
Fig. 5. PCA for the study of mortars composition: Score Plot.
Fig. 4. PCA for the study of mortars composition: Loading Plot.
1 Some XRD measurements were performed afterwards on the mortar samples. Thepresence of clinoclore, a magnesium silicate, was found in the inert. The presence ofMg2+ in the inert fraction was therefore confirmed.
1312 E. Arizio et al. / Construction and Building Materials 47 (2013) 1309–1316
semi-quantitative FTIR measurements, meaning that only onetechnique chosen from TG/DTA, IC and FTIR could be sufficientfor the determination of the sulfates fraction.
The use of these statistical methods allows us to show the lackof correlation between the sulfates and carbonates variables, dem-onstrating that the gypseous fraction detected is caused by degra-dation of the carbonatic binder, and is not the raw limestone andnot an intentional addition. The variables Mg2+ and SiO2 constitutethe third cluster. The negative correlation between Mg2+ and %TGand %CA could be indicative of the absence of magnesium in the
binder and, therefore, indicates its presence in the inert fractionof the mortar1.
3.1.2. SamplesThe Score Plot in Fig. 5 and the dendrogram in Fig. 6, show that
the Cluster Analysis and the PCA are in agreement: in both
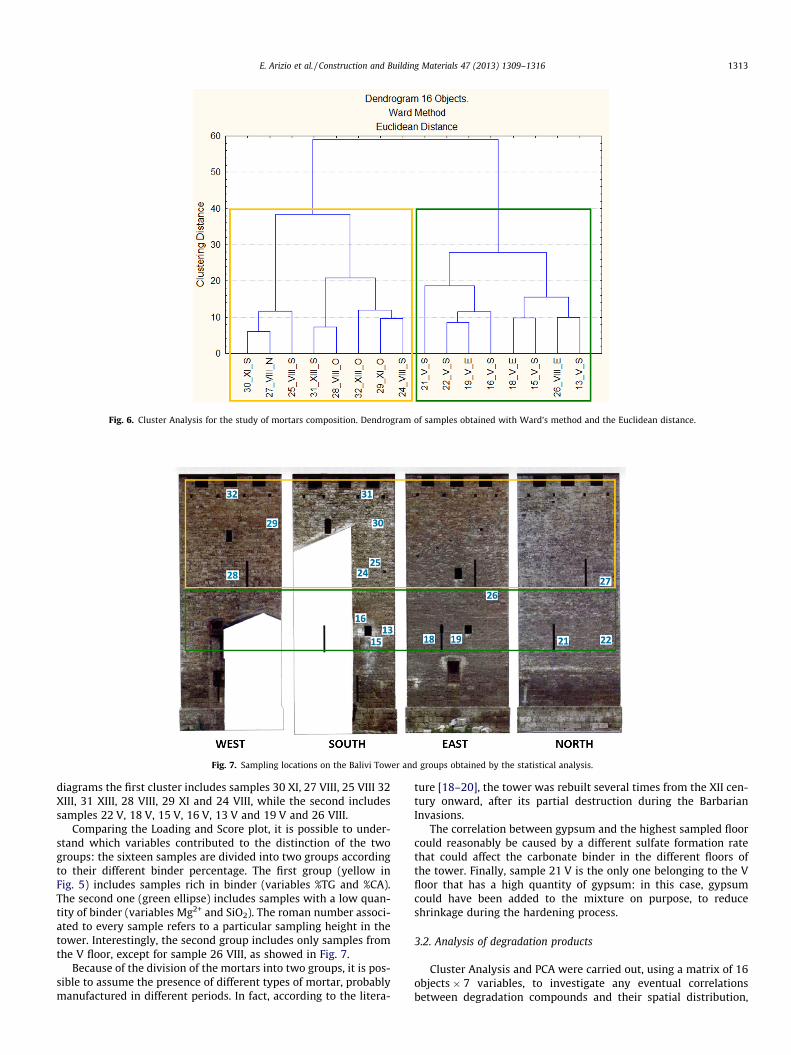
Fig. 6. Cluster Analysis for the study of mortars composition. Dendrogram of samples obtained with Ward’s method and the Euclidean distance.
Fig. 7. Sampling locations on the Balivi Tower and groups obtained by the statistical analysis.
E. Arizio et al. / Construction and Building Materials 47 (2013) 1309–1316 1313
diagrams the first cluster includes samples 30 XI, 27 VIII, 25 VIII 32XIII, 31 XIII, 28 VIII, 29 XI and 24 VIII, while the second includessamples 22 V, 18 V, 15 V, 16 V, 13 V and 19 V and 26 VIII.
Comparing the Loading and Score plot, it is possible to under-stand which variables contributed to the distinction of the twogroups: the sixteen samples are divided into two groups accordingto their different binder percentage. The first group (yellow inFig. 5) includes samples rich in binder (variables %TG and %CA).The second one (green ellipse) includes samples with a low quan-tity of binder (variables Mg2+ and SiO2). The roman number associ-ated to every sample refers to a particular sampling height in thetower. Interestingly, the second group includes only samples fromthe V floor, except for sample 26 VIII, as showed in Fig. 7.
Because of the division of the mortars into two groups, it is pos-sible to assume the presence of different types of mortar, probablymanufactured in different periods. In fact, according to the litera-
ture [18–20], the tower was rebuilt several times from the XII cen-tury onward, after its partial destruction during the BarbarianInvasions.
The correlation between gypsum and the highest sampled floorcould reasonably be caused by a different sulfate formation ratethat could affect the carbonate binder in the different floors ofthe tower. Finally, sample 21 V is the only one belonging to the Vfloor that has a high quantity of gypsum: in this case, gypsumcould have been added to the mixture on purpose, to reduceshrinkage during the hardening process.
3.2. Analysis of degradation products
Cluster Analysis and PCA were carried out, using a matrix of 16objects � 7 variables, to investigate any eventual correlationsbetween degradation compounds and their spatial distribution,
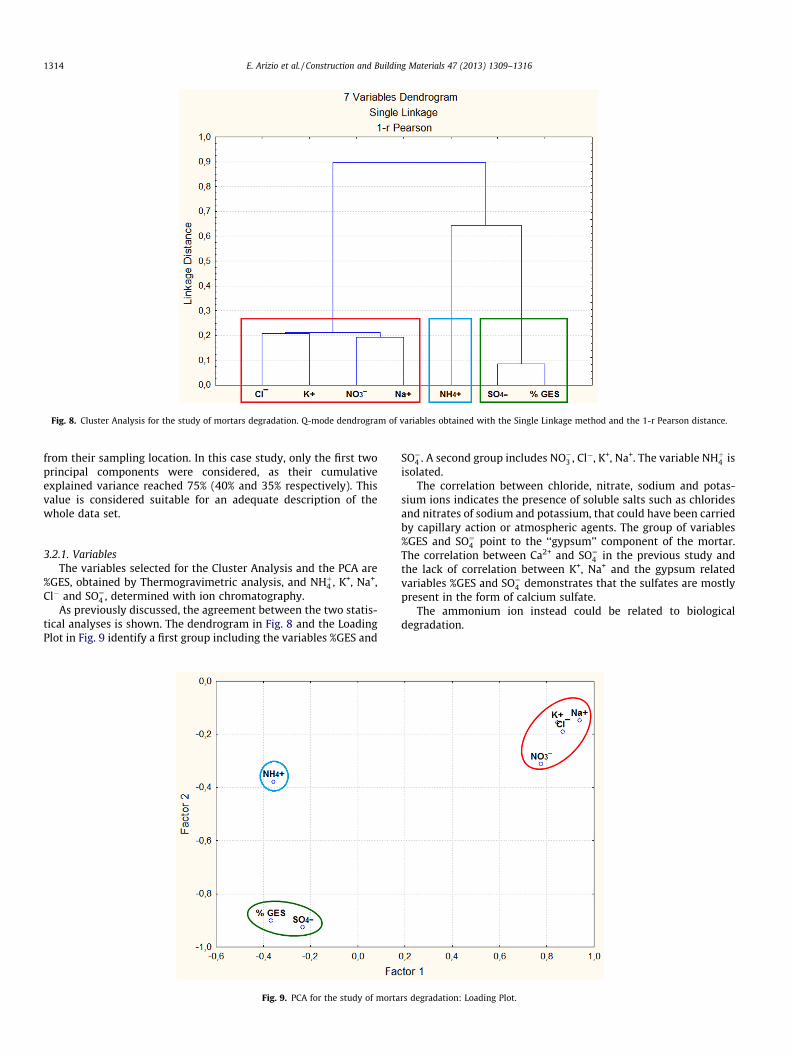
Fig. 8. Cluster Analysis for the study of mortars degradation. Q-mode dendrogram of variables obtained with the Single Linkage method and the 1-r Pearson distance.
1314 E. Arizio et al. / Construction and Building Materials 47 (2013) 1309–1316
from their sampling location. In this case study, only the first twoprincipal components were considered, as their cumulativeexplained variance reached 75% (40% and 35% respectively). Thisvalue is considered suitable for an adequate description of thewhole data set.
3.2.1. VariablesThe variables selected for the Cluster Analysis and the PCA are
%GES, obtained by Thermogravimetric analysis, and NHþ4 , K+, Na+,Cl� and SO¼4 , determined with ion chromatography.
As previously discussed, the agreement between the two statis-tical analyses is shown. The dendrogram in Fig. 8 and the LoadingPlot in Fig. 9 identify a first group including the variables %GES and
Fig. 9. PCA for the study of morta
SO¼4 . A second group includes NO�3 , Cl�, K+, Na+. The variable NHþ4 isisolated.
The correlation between chloride, nitrate, sodium and potas-sium ions indicates the presence of soluble salts such as chloridesand nitrates of sodium and potassium, that could have been carriedby capillary action or atmospheric agents. The group of variables%GES and SO¼4 point to the ‘‘gypsum’’ component of the mortar.The correlation between Ca2+ and SO¼4 in the previous study andthe lack of correlation between K+, Na+ and the gypsum relatedvariables %GES and SO¼4 demonstrates that the sulfates are mostlypresent in the form of calcium sulfate.
The ammonium ion instead could be related to biologicaldegradation.
rs degradation: Loading Plot.
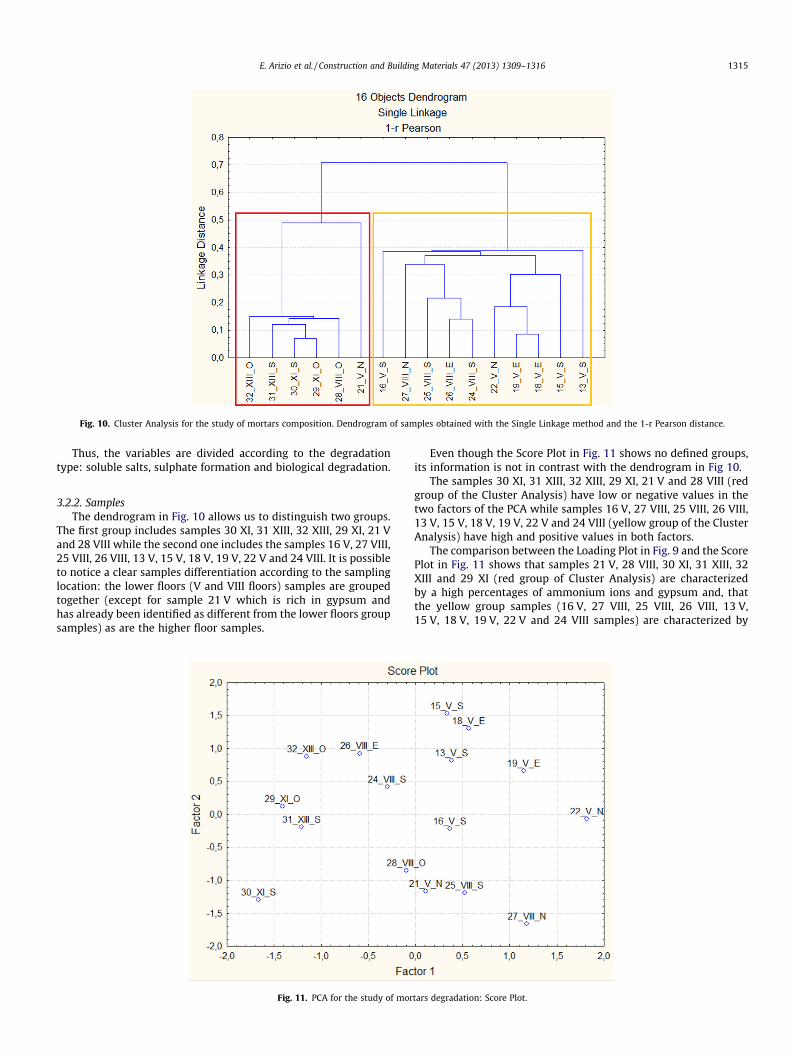
Fig. 10. Cluster Analysis for the study of mortars composition. Dendrogram of samples obtained with the Single Linkage method and the 1-r Pearson distance.
E. Arizio et al. / Construction and Building Materials 47 (2013) 1309–1316 1315
Thus, the variables are divided according to the degradationtype: soluble salts, sulphate formation and biological degradation.
3.2.2. SamplesThe dendrogram in Fig. 10 allows us to distinguish two groups.
The first group includes samples 30 XI, 31 XIII, 32 XIII, 29 XI, 21 Vand 28 VIII while the second one includes the samples 16 V, 27 VIII,25 VIII, 26 VIII, 13 V, 15 V, 18 V, 19 V, 22 V and 24 VIII. It is possibleto notice a clear samples differentiation according to the samplinglocation: the lower floors (V and VIII floors) samples are groupedtogether (except for sample 21 V which is rich in gypsum andhas already been identified as different from the lower floors groupsamples) as are the higher floor samples.
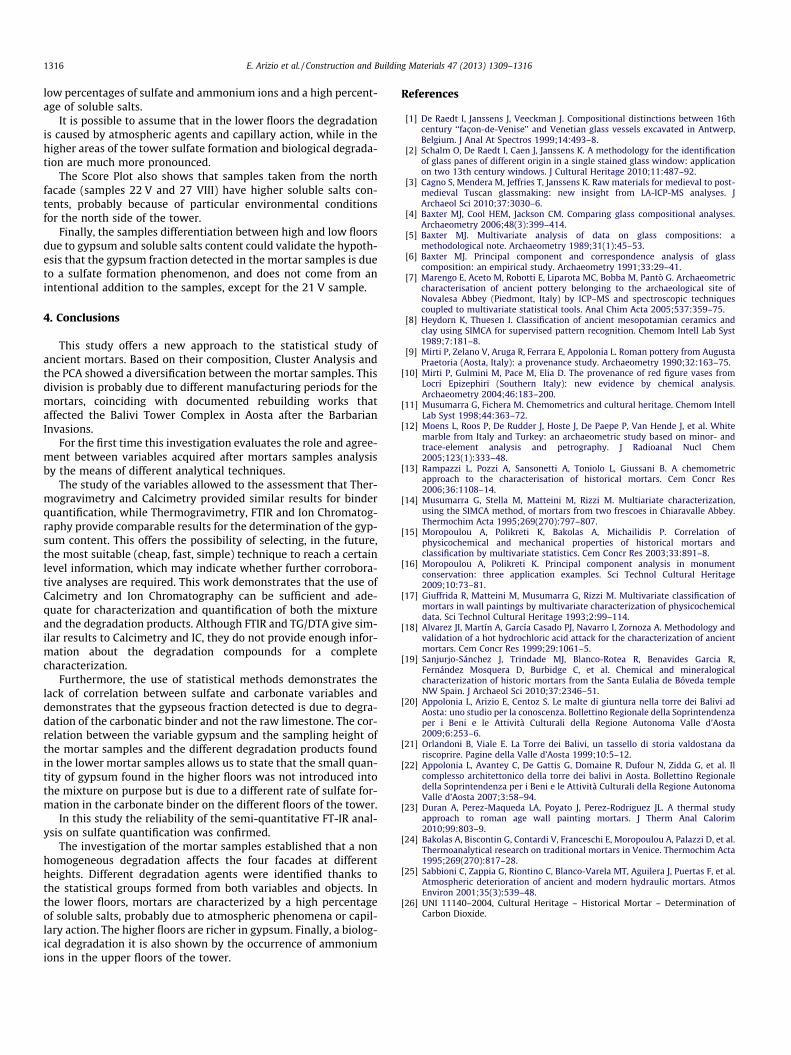
Fig. 11. PCA for the study of mor
Even though the Score Plot in Fig. 11 shows no defined groups,its information is not in contrast with the dendrogram in Fig 10.
The samples 30 XI, 31 XIII, 32 XIII, 29 XI, 21 V and 28 VIII (redgroup of the Cluster Analysis) have low or negative values in thetwo factors of the PCA while samples 16 V, 27 VIII, 25 VIII, 26 VIII,13 V, 15 V, 18 V, 19 V, 22 V and 24 VIII (yellow group of the ClusterAnalysis) have high and positive values in both factors.
The comparison between the Loading Plot in Fig. 9 and the ScorePlot in Fig. 11 shows that samples 21 V, 28 VIII, 30 XI, 31 XIII, 32XIII and 29 XI (red group of Cluster Analysis) are characterizedby a high percentages of ammonium ions and gypsum and, thatthe yellow group samples (16 V, 27 VIII, 25 VIII, 26 VIII, 13 V,15 V, 18 V, 19 V, 22 V and 24 VIII samples) are characterized by
tars degradation: Score Plot.
1316 E. Arizio et al. / Construction and Building Materials 47 (2013) 1309–1316
low percentages of sulfate and ammonium ions and a high percent-age of soluble salts.
It is possible to assume that in the lower floors the degradationis caused by atmospheric agents and capillary action, while in thehigher areas of the tower sulfate formation and biological degrada-tion are much more pronounced.
The Score Plot also shows that samples taken from the northfacade (samples 22 V and 27 VIII) have higher soluble salts con-tents, probably because of particular environmental conditionsfor the north side of the tower.
Finally, the samples differentiation between high and low floorsdue to gypsum and soluble salts content could validate the hypoth-esis that the gypsum fraction detected in the mortar samples is dueto a sulfate formation phenomenon, and does not come from anintentional addition to the samples, except for the 21 V sample.
4. Conclusions
This study offers a new approach to the statistical study ofancient mortars. Based on their composition, Cluster Analysis andthe PCA showed a diversification between the mortar samples. Thisdivision is probably due to different manufacturing periods for themortars, coinciding with documented rebuilding works thataffected the Balivi Tower Complex in Aosta after the BarbarianInvasions.
For the first time this investigation evaluates the role and agree-ment between variables acquired after mortars samples analysisby the means of different analytical techniques.
The study of the variables allowed to the assessment that Ther-mogravimetry and Calcimetry provided similar results for binderquantification, while Thermogravimetry, FTIR and Ion Chromatog-raphy provide comparable results for the determination of the gyp-sum content. This offers the possibility of selecting, in the future,the most suitable (cheap, fast, simple) technique to reach a certainlevel information, which may indicate whether further corrobora-tive analyses are required. This work demonstrates that the use ofCalcimetry and Ion Chromatography can be sufficient and ade-quate for characterization and quantification of both the mixtureand the degradation products. Although FTIR and TG/DTA give sim-ilar results to Calcimetry and IC, they do not provide enough infor-mation about the degradation compounds for a completecharacterization.
Furthermore, the use of statistical methods demonstrates thelack of correlation between sulfate and carbonate variables anddemonstrates that the gypseous fraction detected is due to degra-dation of the carbonatic binder and not the raw limestone. The cor-relation between the variable gypsum and the sampling height ofthe mortar samples and the different degradation products foundin the lower mortar samples allows us to state that the small quan-tity of gypsum found in the higher floors was not introduced intothe mixture on purpose but is due to a different rate of sulfate for-mation in the carbonate binder on the different floors of the tower.
In this study the reliability of the semi-quantitative FT-IR anal-ysis on sulfate quantification was confirmed.
The investigation of the mortar samples established that a nonhomogeneous degradation affects the four facades at differentheights. Different degradation agents were identified thanks tothe statistical groups formed from both variables and objects. Inthe lower floors, mortars are characterized by a high percentageof soluble salts, probably due to atmospheric phenomena or capil-lary action. The higher floors are richer in gypsum. Finally, a biolog-ical degradation it is also shown by the occurrence of ammoniumions in the upper floors of the tower.
References
[1] De Raedt I, Janssens J, Veeckman J. Compositional distinctions between 16thcentury ‘‘façon-de-Venise’’ and Venetian glass vessels excavated in Antwerp,Belgium. J Anal At Spectros 1999;14:493–8.
[2] Schalm O, De Raedt I, Caen J, Janssens K. A methodology for the identificationof glass panes of different origin in a single stained glass window: applicationon two 13th century windows. J Cultural Heritage 2010;11:487–92.
[3] Cagno S, Mendera M, Jeffries T, Janssens K. Raw materials for medieval to post-medieval Tuscan glassmaking: new insight from LA-ICP-MS analyses. JArchaeol Sci 2010;37:3030–6.
[4] Baxter MJ, Cool HEM, Jackson CM. Comparing glass compositional analyses.Archaeometry 2006;48(3):399–414.
[5] Baxter MJ. Multivariate analysis of data on glass compositions: amethodological note. Archaeometry 1989;31(1):45–53.
[6] Baxter MJ. Principal component and correspondence analysis of glasscomposition: an empirical study. Archaeometry 1991;33:29–41.
[7] Marengo E, Aceto M, Robotti E, Liparota MC, Bobba M, Pantò G. Archaeometriccharacterisation of ancient pottery belonging to the archaeological site ofNovalesa Abbey (Piedmont, Italy) by ICP–MS and spectroscopic techniquescoupled to multivariate statistical tools. Anal Chim Acta 2005;537:359–75.
[8] Heydorn K, Thuesen I. Classification of ancient mesopotamian ceramics andclay using SIMCA for supervised pattern recognition. Chemom Intell Lab Syst1989;7:181–8.
[9] Mirti P, Zelano V, Aruga R, Ferrara E, Appolonia L. Roman pottery from AugustaPraetoria (Aosta, Italy): a provenance study. Archaeometry 1990;32:163–75.
[10] Mirti P, Gulmini M, Pace M, Elia D. The provenance of red figure vases fromLocri Epizephiri (Southern Italy): new evidence by chemical analysis.Archaeometry 2004;46:183–200.
[11] Musumarra G, Fichera M. Chemometrics and cultural heritage. Chemom IntellLab Syst 1998;44:363–72.
[12] Moens L, Roos P, De Rudder J, Hoste J, De Paepe P, Van Hende J, et al. Whitemarble from Italy and Turkey: an archaeometric study based on minor- andtrace-element analysis and petrography. J Radioanal Nucl Chem2005;123(1):333–48.
[13] Rampazzi L, Pozzi A, Sansonetti A, Toniolo L, Giussani B. A chemometricapproach to the characterisation of historical mortars. Cem Concr Res2006;36:1108–14.
[14] Musumarra G, Stella M, Matteini M, Rizzi M. Multiariate characterization,using the SIMCA method, of mortars from two frescoes in Chiaravalle Abbey.Thermochim Acta 1995;269(270):797–807.
[15] Moropoulou A, Polikreti K, Bakolas A, Michailidis P. Correlation ofphysicochemical and mechanical properties of historical mortars andclassification by multivariate statistics. Cem Concr Res 2003;33:891–8.
[16] Moropoulou A, Polikreti K. Principal component analysis in monumentconservation: three application examples. Sci Technol Cultural Heritage2009;10:73–81.
[17] Giuffrida R, Matteini M, Musumarra G, Rizzi M. Multivariate classification ofmortars in wall paintings by multivariate characterization of physicochemicaldata. Sci Technol Cultural Heritage 1993;2:99–114.
[18] Alvarez JI, Martín A, García Casado PJ, Navarro I, Zornoza A. Methodology andvalidation of a hot hydrochloric acid attack for the characterization of ancientmortars. Cem Concr Res 1999;29:1061–5.
[19] Sanjurjo-Sánchez J, Trindade MJ, Blanco-Rotea R, Benavides Garcia R,Fernández Mosquera D, Burbidge C, et al. Chemical and mineralogicalcharacterization of historic mortars from the Santa Eulalia de Bóveda templeNW Spain. J Archaeol Sci 2010;37:2346–51.
[20] Appolonia L, Arizio E, Centoz S. Le malte di giuntura nella torre dei Balivi adAosta: uno studio per la conoscenza. Bollettino Regionale della Soprintendenzaper i Beni e le Attività Culturali della Regione Autonoma Valle d’Aosta2009;6:253–6.
[21] Orlandoni B, Viale E. La Torre dei Balivi, un tassello di storia valdostana dariscoprire. Pagine della Valle d’Aosta 1999;10:5–12.
[22] Appolonia L, Avantey C, De Gattis G, Domaine R, Dufour N, Zidda G, et al. Ilcomplesso architettonico della torre dei balivi in Aosta. Bollettino Regionaledella Soprintendenza per i Beni e le Attività Culturali della Regione AutonomaValle d’Aosta 2007;3:58–94.
[23] Duran A, Perez-Maqueda LA, Poyato J, Perez-Rodriguez JL. A thermal studyapproach to roman age wall painting mortars. J Therm Anal Calorim2010;99:803–9.
[24] Bakolas A, Biscontin G, Contardi V, Franceschi E, Moropoulou A, Palazzi D, et al.Thermoanalytical research on traditional mortars in Venice. Thermochim Acta1995;269(270):817–28.
[25] Sabbioni C, Zappia G, Riontino C, Blanco-Varela MT, Aguilera J, Puertas F, et al.Atmospheric deterioration of ancient and modern hydraulic mortars. AtmosEnviron 2001;35(3):539–48.
[26] UNI 11140–2004, Cultural Heritage – Historical Mortar – Determination ofCarbon Dioxide.