State Updates – Papers Table of Contents - Prayas, Pune
73
State Updates – Papers Table of Contents 1. Andhra Pradesh 2. Delhi 3. Gujarat 4. Harayana 5. Karnataka 6. Kerala 7. Maharashtra 8. Orissa 9. Tamil Nadu
-
Upload
khangminh22 -
Category
Documents
-
view
1 -
download
0
Transcript of State Updates – Papers Table of Contents - Prayas, Pune

State Updates – Papers
Table of Contents
1. Andhra Pradesh
2. Delhi
3. Gujarat
4. Harayana
5. Karnataka
6. Kerala
7. Maharashtra
8. Orissa
9. Tamil Nadu

Andhra Pradesh
Power Sector Status and Issues
Reform Milestones
Andhra Pradesh was the first state in the country to take up comprehensive structural
reform programme with the financial and policy support of the World Bank. In this
reform programme restructuring the power sector in the state is an important part. The
table below gives the chronology of events leading to the restructuring of the power
sector in Andhra Pradesh:
1995 June Hiten Bhayya Committee Report
1996 September World Bank's Agenda for Economic Reforms in Andhra Pradesh
1997 March AP State Government’s Policy Statement on Power Sector
Reforms
1998 April Passing of AP Electricity Reforms Bill in the State Legislative
Assembly
1998 May World Bank’s PAD on AP Economic Restructuring Project
1999 January World Bank’s PAD on AP Power sector Reforms Programme
(APPSRP)
1999 February AP Electricity Reforms Act 1998 comes into force
1999 February APSEB unbundled into APGENCO and APTRASCO
1999 February Agreement between the World Bank and Go AP on APERP
signed
1999 March Agreement between the World Bank and Go AP on APERP
signed
1999 April AP Electricity Regulatory Commission starts functioning
1999 November First Public hearing conducted by the APERC on Tariff
Philosophy
2000 March APTRANSCO further unbundled into APTRANSCO and four
DISCOMs
2000 May First Tariff Order by APERC
2000 May People’s Movement against tariff hike starts
2000 August Police firing on demonstrators in the centre of Hyderabad city
2000 October High Court Judgment upholding the APERC order on tariff hike
2001 April Regular licenses to DISCOMs
2002 April Financial autonomy to DISCOMs
2002 August Employee division (option process) among APGENCO,
APTRANSCO and DISCOMs on permanent basis
2003 June Enactment of Electricity Act, 2003.
2003 August Suspension of the World Bank loan after the first stage itself
quoting high interest rate and unacceptable conditions.
2004 May Change in Government and the announcement of free power to
the agricultural sector.
2004 Tariff
order
Direction by the APERC to APTRANSCO to review the PPAs
with IPPs
2005 June Transfer of PPAs to the four DISCOMs.
2005 December 7th
ARR filing made as per Act’ 03
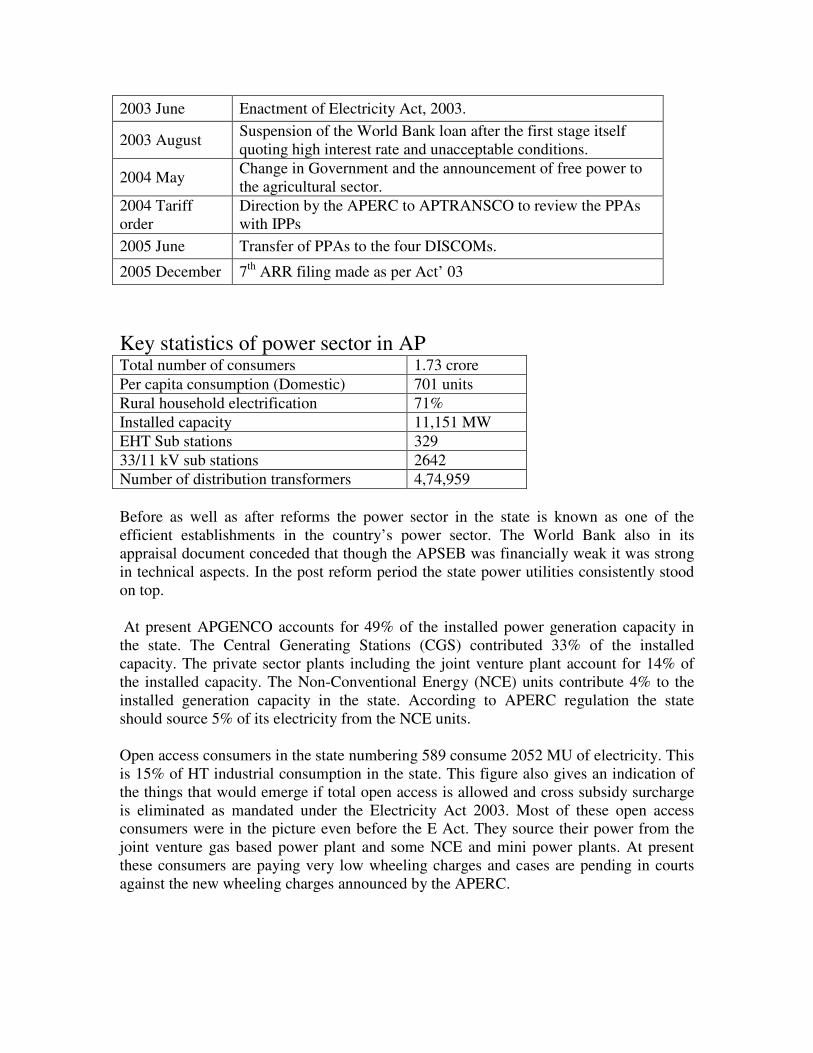
Key statistics of power sector in AP Total number of consumers 1.73 crore
Per capita consumption (Domestic) 701 units
Rural household electrification 71%
Installed capacity 11,151 MW
EHT Sub stations 329
33/11 kV sub stations 2642
Number of distribution transformers 4,74,959
Before as well as after reforms the power sector in the state is known as one of the
efficient establishments in the country’s power sector. The World Bank also in its
appraisal document conceded that though the APSEB was financially weak it was strong
in technical aspects. In the post reform period the state power utilities consistently stood
on top.
At present APGENCO accounts for 49% of the installed power generation capacity in
the state. The Central Generating Stations (CGS) contributed 33% of the installed
capacity. The private sector plants including the joint venture plant account for 14% of
the installed capacity. The Non-Conventional Energy (NCE) units contribute 4% to the
installed generation capacity in the state. According to APERC regulation the state
should source 5% of its electricity from the NCE units.
Open access consumers in the state numbering 589 consume 2052 MU of electricity. This
is 15% of HT industrial consumption in the state. This figure also gives an indication of
the things that would emerge if total open access is allowed and cross subsidy surcharge
is eliminated as mandated under the Electricity Act 2003. Most of these open access
consumers were in the picture even before the E Act. They source their power from the
joint venture gas based power plant and some NCE and mini power plants. At present
these consumers are paying very low wheeling charges and cases are pending in courts
against the new wheeling charges announced by the APERC.

Important APERC orders/regulations Under the AP Electricity Reforms Act 1998 the erstwhile APSEB was unbundled in to
six entities: APGENCO for power generation, APTRANSCO for transmission and four
DISCOMs for distribution. This Act also gave shape to AP Electricity Regulatory
Commission (APERC). Earlier bulk power purchase/trading was vested with
APTRANSCO. Under the E Act this was transferred to DISCOMs. The APERC since its
inception in 1999 issued a number of Orders/Regulations. Some of the important ones
issued after 2003 are listed below:
� Regulation 7 of 2007: Regulation on Transmission Standards of Performance.
� Regulation 5 of 2005: Terms and conditions for determination of Transmission Tariff
including the procedure for calculating the expected revenue.
� Regulation 4 of 2005: Terms and conditions for determination of tariff for wheeling
and retail sale of electricity including the procedure for calculating the expected
revenue.
� Regulation 3 of 2005: Regulation providing for the treatment of Other Businesses of
Transmission Licensees and Distribution Licensees, the proportion of revenues from
Other Business to be utilised for Licensed Business and the matters incidental and
ancillary thereto.
� Regulation 2 of 2005: Terms and conditions of Open Access to Intra-State
Transmission and Distribution networks.
� Regulation 7 of 2004: Licensees' Standards of Performance and repeal of Regulation
6 of 2000. This regulation has since been amended in 2005.
� Regulation 5 of 2004: Electricity Supply Code. Matters connected with recovery of
electricity charges, intervals for billing of electricity charges, disconnection of supply
for non-payment, restoration of supply, tampering, distress or damage to electrical
plant, electric lines or meter, entry of Licensee's officials for disconnecting supply and
removing the meter, and entry for replacing, altering or maintaining of electric lines,
or electric plant or meter. This regulation is since amended on 4th of March 2006. A
new clause 7A is added in the Regulation.
� Regulation 2 of 2004: Constitution of State Advisory Committee and its functioning.
This regulation also repealed Regulation 1 of 1999, which constituted the
Commission Advisory Committee.
� Regulation 1 of 2004: Establishment of Forum and Vidyut Ombudsman for redressal
of grievances of consumers.
Performance During Reform Period During the reform period financial health of all the utilities improved. The utilities were
consistently ranked by CRISIL as No. 1 for the last three years. While in FY 2000 the
utilities incurred a deficit of Rs. 1720 crore, in FY 2006 they recorded a profit of Rs. 291
crore. All utilities are in profit for the third consecutive year. The improvement in
performance of the utilities also brought down financial burden on the state government.
The subsidy support provided by the state government declined from Rs. 3064 crore in
FY 2000 to Rs. 1599 crore in FY 2006. As a proportion of revenues of the utilities
subsidy provision declined from 49.21 percent in FY 2000 to 13.94 percent in FY 2006.
This was achieved in the absence of tariff hike during the last four years. Further, HT

industrial tariff was reduced from Rs. 4.26 per unit in FY 2002 to Rs. 3.70 in FY 2006.
During this period HT industrial consumption increased by more than 20 percent every
year. Despite tariff reduction of 13% between FY 2002& 2006, cross subsidy
contribution has increased by Rs.447 crore.
This improvement in the financial health of the utilities was made possible by increase in
per unit revenue realisation and reduction in cost per unit. Revenue realisation increased
from Rs. 2.41 per unit in FY 2000 to Rs. 2.88 in FY 2006. During the same period cost of
power supply declined form Rs. 3.08 per unit to Rs. 2.95.
Cost reduction has been driven by significant reduction in T&D losses. These losses
declined form 37.1 percent in FY 2000 to 20.2 percent in FY 2006. To achieve this
concerted initiatives were undertaken. As a part of it comprehensive Energy Audit of
high revenue areas was undertaken. 1,038 industrial feeders have been segregated so that
they can be provided with uninterrupted supply and closely monitored. 115 town feeders
and 1,126 Mandal headquarter feeders have been separated from rural feeders. With the
exception of Hyderabad(S) circle losses in town feeders is maintained at between 5% to
12%. In the case of Mandal HQ feeders losses are between 10% to 15%.
Table-1: Sector Turnaround
Year Deficit /
Surplus (Rs in
Cr)
1999-2000 -1720
2000-2001 -1310
2001-2002 -1262
2002-2003 -125
2003-2004 +76
2004-2005 +57
2005-2006 +291
Table – 2: Dependence on Government Support
Year GoAP
Revenue
Subsidy
Support (Rs.
Cr.)
1999-2000 3064
2000-2001 2936
2001-2002 2457
2002-2003 1876
2003-2004 1513
2004-2005 1715
2005-2006 1599

2006-2007 1351
Table – 3: Financial Recovery
Year Revenue (Rs./Unit) Cost (Rs./Unit) Revenue (Rs. crs)
1999-2000 2.41 3.08 6226
2000-2001 2.8 3.28 7617
2001-2002 2.67 3.1 7860
2002-2003 2.97 3.01 9628
2003-2004 3.01 3.04 10877
2004-2005 2.84 2.85 11473
2005-2006 2.88 2.95 12291
Table – 4: T&D Losses
Year Collection
Efficiency (%)
T & D Loss
(%)
Distribution
Losses (%)
1999-2000 37.1
2000-2001 95.75 34.8 26.04
2001-2002 30.2 23.6
2002-2003-- 26.1 19.5
2003-2004-- 22.3 17.8
2004-2005 97.07 21.4 16.9
2005-2006 100.01 20.2 15.8
Table – 5: HT Industrial Tariff and Sales Growth
Year HT Industrial
Tariff (Rs./
Units)
Sales Growth
(%)
2001-2002 4.26 -4.0
2002-2003 4.06 27.0
2003-2004 3.96 28.7
2004-2005 3.86 22.1
2005-2006 3.70 23.4

Reforms - Concerns
Total Neglect of APGENCO In the name of promoting private sector participation Telugu Desam Party led state
government in the past totally neglected APGENCO, which contributed more than 50%
of the power consumed in the state. There is no proper and long term PPA with
APGENCO. As a result of this and in the absence of any escrow cover it gets payments
only after all other generators. It was not allowed any incentives though it came to the
rescue of the grid in the state quite often. During the first three years of reform it was also
not allowed minimum returns as well as depreciation recovery. As a result of it lost a
revenue of Rs. 1800 crore. As a part of the unbundling the debt burden towards terminal
benefits of all employees of erstwhile APSEB amounting to Rs. 4,500 crore was totally
placed on APGENCO. As a result of this discriminatory treatment it net worth was
considerably eroded and it was on the verge of bankruptcy. Even in this dismal financial
background it was directed by the present state government under the Congress party to
take up 7 new projects with the capacity of 3,196 MW costing Rs. 14,971 crore. But it
was not provided with any budgetary support.
Coal prices Coal constitutes a significant part of power cost and even small increases put significant
pressure due to inability to increase power tariffs correspondingly. During the last few
years coal prices have been rising sharply and this is putting pressure on power costs.
Besides this, the central government is putting pressure on the state utilities to source a
part of their coal from foreign countries. Rate per tonne from Mahanadi Coalfields has
increased at CAGR of 8% from 2001 to 2005. Rate per tonne from Singareni Collieries
has increased at CAGR of 2% from 2000 to 2004. NTPC plants have also used imported
coal, which has a projected impact of Rs. 123 Cr in the current year. During FY 2006 the
impact of this high coal prices on AP was to the tune of Rs.142 crore.
Gas availability & price are major issues At the present juncture gas availability and its pricing have become very crucial issues.
The existing gas based power plants with a capacity of more than 1000 MW are working
at less than 60% PLF. Four new plants with the combined capacity of 1500 MW are lying
idle for lack of gas. Added to this the private gas producers are demanding market prices
for gas supply, which is very high compared to the price at which ONGC is supplying at
present. This will nearly double the cost of power from these gas based power plants.
Other Issues
Separation of Trading: Under the E Act the transmission entity shall not involve in
power trading. Accordingly in AP trading is separated from TRANSCO and the PPA
were transferred to DISCOMs in June 2005. Each plant is allocated to each DISCOM in
proportion to its share in power demand in state at the time of this transfer. Under this
arrangement CPDCL’s share is 43.48%, SPDCL’s share is 22.90%, NPDCL’s share is
16.92% and EPDCL’s share is 16.70%. This allotment has created confusion. No one
vested with powers to take initiative to deal the issues arising from these PPAs. Many of
the PPAs are entangled in one or the other legal battle. Besides this, DISCOMS lack of
experience and expertise in dealing with power purchases. To address this AP Power
Coordination Committee was formed. But its mandate ends in June 2007.
To T&D losses in rural areas HVDS was taken up with an investment of Rs. 5,500 crore.
Though such a huge investment was contemplated it was not discussed in the public.
Already considerable amount was spent on this without commensurate outcomes.
NCE Costs: Currently 4% of the power in the state is being sourced from NCE units.
The APERC has mandated 5% of power to be purchased from these sources. Average
cost of NCE sources is Rs.3.11/kwh against Rs.1.72/kwh overall. This puts an additional
cost of Rs.145 crore on power sector. Purchase of additional amount of power from NCE
sources in order to meet APERC Order will put additional pressure on tariffs.
Outsourcing: Outsourcing of services has become an important trend in the sector in the
wake of reforms. Spot billing is outsourced. Customer service centers are outsourced.
80% of EHT 33/11 KV Substations manning and maintenance is outsourced. 80% of Low
Tension (LT) service collections are outsourced. 90% of transformer repairing is
outsourced. This has resulted neither in cost reduction nor in service improvement. While
earlier cost of bill collection was less than one rupee per connection now utilities are
paying five rupees. In the case of substation maintenance the contractors are employing
less qualified personnel. Because of lack of coordination in line maintenance at times it is
leading to fatal accidents. After taking cognizance of the outsourced services more than
20% of the sanctioned technical posts at the ground level are lying vacant. Worst
sufferers because of this are rural consumers. Nearly 50% of the line men and other posts
in the rural areas are lying vacant.
Regulatory process is brought in to the picture to address and balance the interests of all
the stakeholders. APERC was formed in February 1999 following the enactment of AP
Electricity Reforms Act in 1998. Its functioning is characterised by lack of public
participation, complicated procedures, lack of public awareness on latest developments,
and apathy among Regulators. Hurdles were also placed in public participation. Hearings
on tariffs were held in a few places in the state. The documents were voluminous, very
technical and in English; effectively keeping them away from the general public. Even
for those who are willing and ready to struggle to understand these documents they are
not easily available.
[Note prepared by People’s Monitoring Group on Electricity Regulation, Hyderabad,
Andhra Pradesh]

1
Power reforms in Delhi- A Critical Review
by
Society for Protection of Culture, Heritage,
Environment, Traditions and Promotion of National
Awareness (Regd) CHETNA
Contact Persons: Anil Sood- 9810514696
Anil Sharma- 9811320203
A-417, Somdutt Chambers-1 5-Bhikaji Cama Place,
New Delhi-110066
Telefex: 011-26173573,
011- 26191594
Website: www.chetna.org.in
E mail: [email protected]
P.S. Donations to the Society are exempt from u/s 80- G of Income Tax effective
from 1st April 2006 up to 31-03-2009 vide letter no. DIT (E) 2005-2006/S-
2560/1100 dated 24th August 2006

2
Background:
In 1987 when I shifted from South (Andhra Pradesh) to Faridabad (Haryana), for the first
time we had felt the heat of summer when there was undeclared power cut ranging from 4
to 8 hours a day. That time I did hear stories about power position in Delhi and yes once in a
while when we stayed with our relatives at Delhi we found the difference as the frequency
of power cuts or failure of power supply was almost unheard.
Once in 1992 there was a choice for me to stay either at Delhi or at Faridabad, the choice
was obviously Delhi. But this time initial one year the power position was satisfactory but
soon the undeclared power cuts and power failures started surfacing. I had no clue about
the power supply, power sector and problems related to Demand and supply of power. The
reaction was normal like any other common citizens.
During this period I just had informal interaction with some of the cable manufacturers who
were supplying cable to the then DESU. To my horror most of them were making money by
supplying sub standard cables to DESU i.e. less number of strands in the cable or the
thickness of the strands was thinner than the prescribed thickness or the recycled plastic
was used for insulating the cable instead of fresh. This evoked my interest in power sector
and the reasons for frequent cable faults and cable bursting came to knowledge. It was just
a beginning.
It seems at that point of time some where in 1991 the Group of Chief Ministers met and
discussed the power Sector and undertook to initiate process reforms in Power Sector.
Precisely this was the time in 1992 when T & D Losses in Delhi shot up from 20% to 50% in
1998 gradually. The most interesting aspect of the episode is that the person responsible
for abnormal increase in T & D losses became the champion of reforms when the Delhi
Electricity Regulatory Commission was constituted in 1999.
Genesis of reforms:
By this time I too had realized the fact the Power Sector in Delhi was in shambles. The
reliability of power supply was at its lowest ebb. The rampant corruption ensured that the
interest of powers that be or the connected individuals are protected and the general
public is taken for a ride.
The political vote bank was protected by ensuring virtually free power supply directly from
the cable without any meter. It was free for all situations. No complaint was ever heard or
addressed. The Steel/Furnace and other industry in Delhi especially in non conforming
areas virtually enjoyed unlimited power supply with limited payment in connivance with the
DESU/DVB field formations. The JJ clusters too enjoyed freedom of using water heaters
or other heaters for cooking, TV’s, coolers and other gadgets free of cost at the cost the
cost of State exchequer, honest tax payer and the consumer who was footing the bill.

3
The only saving grace was that if one could muster up courage to reduce his/her complaint in
writing and follow up the same by taking down the telephone number of the senior most
official of the DESU or thereafter DVB and bother them at odd hours some action was
taken. But how many could actually exercise this option- a very few. The DVB was victim of
vote bank politics, inefficient work culture and greed of corrupt bureaucracy.
Since the situation was beyond redemption, accounts were not available and the assets in
hand could not be verified in absence of asset register, the government in its wisdom had no
option but to resort to “Power Reforms”.
The thrust of power reforms was to invite bids from private power distribution companies
and hand over the distribution to them with certain incentives like assured return on capital
employed, sharing of revenue generated out of T & D losses contained with consumers and
of course contain the blatant fraudulent abstraction of power by the political vote bank.
Thus the idea was to stop annual drainage of Rs. 1200 crores app. out of State exchequer –
honest tax payer’s money that was pumped in to keep the ailing DVB afloat.
Finally once the Electricity Reforms Commission Act 1998 (Act) came into force, the Delhi
Electricity Regulatory Commission (DERC) was constituted in December 1999 with Skelton
staff and small accommodation. The DERC has also been conferred with judicial powers. The
mandate of DERC was to:-
1. To determine the tariffs both for retail and bulk supply;
2. To promote competition, efficiency and economy amongst distribution companies;
3. To regulate the power purchase for Transco;
4. To protect consumer’s interest;
5. To put in place the concept of Quality of Service;
6. To advise and assist the Government;
7. To require licensees to formulate plans;
8. To adjudicate disputes between the licensees.
Post Privatisation:
As a first step towards tariff adjustment exercise the DERC had issued Concept paper in
September 2000 with a view to seek public participation in the tariff setting process,
introduce transparency and public participation in the vital exercise. The first order on the
concept paper was passed on 16th January 2001 whereby various contentious issues other
than tariff setting were settled.
Thereafter the Commission passed first order on 21st May 2001 whereby after analyzing
the ARR submitted by the DVB the tariff was increased by about 22.5% in case of domestic
consumers and overall tariff increase was about 15.75%. The DERC rejected multi-year
tariff determination principles for the years 2002-03 to 2005-06.

4
Subsequently, in February 2002 the DVB was unbundled and the AT & C losses were
determined for various DISCOMS. The Government of NCT of Delhi in order to encourage
the granted loan of Rs. 3450 crores. The DERC issued order for tariff determination for
the years 2002-03, 2003-04, 2004-05, 2005-06 and 2006-07. The DERC in order to
incentivise the DISCOMS and avoid “Tariff Shock” to the consumers introduced the
innovative concept of “Regulatory Asset”. Once the system of “Regulatory Asset” was put in
place there was pressure on DISCOMS to perform.
All said and done with DERC despite all the constraints, limitations in terms of staff
assistance and infrastructure, by involving general public at large could rationalize tariffs
by adopting the policy of incentives so as to encourage the DISCOMS to perform. The
DERC at the same time also introduced Delhi Electricity Regulatory Commission
(Performance Standards) Regulations, 2002 that were revised in 2004 but yet to be
notified.
The DERC has also directed establishment of Ombudsman and establishment of Consumer
Grievance Cells by the DSICOMS.
The NDPL has proven its ability to handle the situation by bringing down the T & D losses to
desirable level. The performance of NDPL had been satisfactory, transparent and consumer
friendly.
The performance by BSES had been and is far from satisfactory. The culture of arrogance
and taking the consumers for granted continues to prevail in the organisation. None of the
Officers are available for interaction with the consumers as their telephone numbers
though having assured have not been posted on web site. The loss reduction is another
mystery that needs to be looked into as it has been observed that the losses in the first
nine months are very high but all of a sudden there is an overachievement in the last three
months.
Strangely, if BSES can perform in the last quarter of the year why can’t the same
performance be demonstrated in the first three quarters of the year is a matter of
concern. The tariff determination order for the year 06-07 while mentioning about
Regulatory Information Management System (RIMS) is silent about the report of RIMS.
There is no mention order dated 10th October 2004 passed by the DERC directing
constitution of Committee to streamline the AT & C loss level reporting.
It’s a matter of record that BSES had resorted to mass replacement of all the existing
functional Analogue meters armed under the garb of replacing meters with connected load
of 10KW in compliance with the order passed by the DERC. We at CHETNA had been
espousing the cause of modernization of the infrastructure but were opposed in the manner
it was carried out by the BSES. The BSES staff started dropping photocopies of the
notices in the letter boxes of the residents of DDA flats alleging non-co-operation and
invoked the provisions of Section 163 of the Electricity Act 2003. Once we asked for the
literature of the meters that were being installed it was found that neither the name of the
manufacturer nor of the Importer or of the Distributor was mentioned anywhere in the
5
catalogue provided to us. Verbally we were informed that the meters have been imported
from CHINA. Strangely for us, we could not understand the logic of importing meters from
CHINA once the Electronic Meters are being manufactured in India with established brand
names and are freely available in abundance. We had series of meetings but the outcome
was zero as all the assurances that were held out were flouted more in violation than
compliance. This finally led to mass scale agitation at RWA level. Subsequently the meters
were withdrawn.
Despite all the shortcomings there is flow of investment from DISCOMS to the Sector and
there are improvements in terms of Reliability of Power Supply, less dependence on
Domestic Gen-sets, inverters in NDPL area , less power cuts, reduction in T & D Losses,
improvement of infrastructure, metering, billing & collection and improvement in Power
factor. As per CRISIL and ICRA Rating submitted to the Central Government in June 2006
the position emerges as under:-
Strength:
1. All DISCOMS are recovering operational expenses without Government subsidy;
2. Strong Financial position of the State Government.
Weaknesses:
1. High systemic Losses with Transco-37.78 billion
2. High A T & C losses even in 2006
3. Low Power factor
4. Generating companies operating at low plant load factor of 65% -2004-05
5. Open access policy yet to be framed by DERC.
ISSUES FOR CONSIDERATION
The Planning Commission in it 10th Report on Power Reforms in para 10.33 has observed that
:-
Quote:
“Distribution reforms “However experience so far in Orissa and Delhi suggest that privatisation is not a guaranteed solution”
Unquote
It is strange but true. The Politics of pleasing vote Bank policy continues to haunt the
honest consumer. The high T & D losses in BSES-RPL-YPL areas demonstrate this fact.
Moreover, in absence of addition in generation capacity which is stagnant since 2002-03
whereas the consumption has multiplied many folds the reforms become meaningless
6
Therefore, it is evident that despite the power reforms in place and visible improvement in
the supply and distribution still there is a room for further improvements particularly in
case of BSES-RPL and YPL areas. The High T & D losses continue to haunt the honest
consumer. The inflated costs continue to effect the Tariff determination. Instead of
spending money on strengthening distribution system and containing the T & D Losses, the
BSES is more concerned about construction of Corporate Office at huge cost. The
employment of Key personnel with fat salaries is the mantra in BSES. The high manpower
ration to per MW distributed (231: 1MW) in another cause of concern.
The other key issues that merit attention are:-
1. There is a need to address the issue of Quality of Supply i.e. billing, metering,
consumer grievance redressal mechanism, power factor. Though the DERC had been
discussing this issue almost in every Tariff determination order but the impact of
the same in case of BSES is yet to be seen. Both the BSES and DERC have
communicated to us vide letter dated 22nd November 2006 and 245th November
2006 that the telephone numbers of the jurisdictional officers have been posted on
web site. It is a blatant lie till date the telephone numbers of various jurisdictional
officers have not been posted on web site. On top of it the telephone numbers keep
on changing and every time one cannot go back to the Bill. Majority of the consumers
do not access to internet at home as such cannot lodge online complaint. The
efficacy of complaint lodged with the call centers does not serve any purpose
except of creation of data as the consumer does not have any record of complaint
except for one number. Unfortunately, the DERC despite having been informed has
taken no action in this regard.
2. The installation of capacitors for maintaining the power factor continues to be the
bone of contentions even after the decision rendered by Delhi High Court in the
case of Suresh Jindal vs. BRPL declaring that the maintenance of power factor is
the DISCOM’S responsibility. Who cares for the High Court Order?
3. Reporting of A T & C Losses: There is a reasonable apprehension that the T & D
losses are not correctly reported. The BSES fails to reduce the T & D losses in first
nine months then all of a sudden in the last quarter the targets are achieved. The
question arise- How n why? The DERC must enforce and implement its order dated
10th October 2004 and appoint the Committee
4. The Delhi Electricity Regulatory Commission (Performance Standards) Regulations,
2002 though in place, revised in 2004 are yet to be notified. Further, the benefit to
the consumers in BSES –RPL-YPL area is yet to be seen.
5. Though DERC has discussed RIMS in its Tariff determination order for the year
06-07 but the role of RIMS has not been explained. Therefore, it emerges that
there is a need to enforce RIMS effectively.
7
6. There is an urgent need to address the issue of addition in Generating capacity
which has not been addressed at all even at the National level. The performance in
this regard continues to be dismal. In absence of addition in the generating capacity
the reforms become meaningless.
7. All the aforesaid assume more importance in view of the order passed by the Apex
Court with regard to allowance of Higher Depreciation to the DISCOMS and the
fast approaching Multi Year Tariff (MYT). Once the Apex Court order is implement
it might translate into tariff increase- “Tariff Shock” for the consumers. Unless
the losses are reduced the shock shall have to be borne either by the honest
consumer or by the honest Taxpayer as the State Government even if provides
subsidy it would be out of State Exchequer as such in any case the looser is the
honest taxpayer/consumer. It is your and my money that would be squandered.
There is a need to understand the Apex Court Order and if need be review
application should be filed against the said order before Apex Court.
8. The much touted “Time of Day” supply concept catches every body imagination
little realising that in our Country the concept of flexible office timing does not
exist. The office/shop timings are governed under the Shop & Establishment Acts
of the States and also by the Labour laws. The timings are fixed predominantly from
9.00 am to 5.30 p.m. Therefore the consumption is bound to increase in the morning
and evening. It is therefore necessary first to address and implement the issue of
“flexi timing” and then think of the introducing “Time of Day Supply” concept
9. All the orders passed by DERC are not available on its web site. The DERC should
post all the orders on its web site so that the same are available.
10. Even the response from the G.N.C.T of Delhi with regard to action taken on failures
of the DISCOMS to contain high T & D Losses, establishment of Special Courts for
disposal of theft cases is far from Satisfactory. The office of the Principal
Secretary (Power) does not posses the details of actions taken by the DISCOMS as
well as by its won department against the erring DISCOMS- BSES-RPL-YPL.
11. Last but not the least under Section 2(h)(d)(i) of the Right to Information Act
2005 the DISCOMS are covered under the provisions of the Act as the State
Government is holding 49% of the stake and substantial public interest is involved.
It may not be out of place to mention here CHETNA was the first and last to get
the district wise Energy Audit Report from DERC thereafter the said information
has been denied to one and all. The DISCOMS have not provided the details
mandated under the RTI Act on its web site and are not likely to do so despite
having been order by the Chief Central Information Commissioner. Once the
DISCOMS are covered under RTI many skeletons may tumble out.
SUGGESTIONS
8
a) We place on record the appreciations NDPL deserves for having displayed the
Transformer wise T & D Losses in area under its operations. The BSES-RPL-YPL
must take a clue from this and start similar exercise in the area under its control.
b) The BSES-RPL-YPL must make suo motto disclosure of T & D Losses RWA wise so as
to sensitize the common citizens and make them aware of the fact.
c) BSES while disconnecting supply of all the consumers in theft prone area reminds
me of my school teacher who used to beat the entire row of the students if he
found one student involved in any mischief. It is unfair. The BSES should
immediately install poll mounted load limiters on poles in such areas where the load
limiter trip in case of there is over load on the Pole/ transformer due to fraudulent
abstraction of power. Thus the honest consumer is not put to inconvenience.
d) Additionally the DISCOM should also publish monthly transformer wise details of
power supplied and power billed to each RWA in its area. The beginning may be
difficult but would be a step in right direction.
e) There is an urgent need to address the issue of manpower ratio per MW and also
the fat salaries that are being paid at times to accommodate political and
bureaucratic bosses.
f) Since the protection period of five years is over and no we are heading towards
multi-year tariff regime it is all the more necessary to reduce the T & D losses and
in particular the theft or fraudulent abstraction of power. There is an urgent need
to put in place the system to enforce the provisions of Electricity Act 2003 dealing
with power theft. The DISCOMS being independent business houses have no
business to succumb to political and bureaucratic pressure. They are not supposed
to practice the populist vote bank pleasing policy.
g) The right step in this direction would be to eliminate the policy of having uniform
tariff across the capital city of Delhi. Let the benefit of efficient in non theft
prone area is passed on to the consumer as NDPL had intended to and the tariff is
higher in theft prone areas.
h) Though DERC had been discussing the issue of Quality of Supply in almost in each of
the tariff determination orders but the impact is yet to be seen on ground. The
BSES has miserably failed to address this issue. There is need to fix the
responsibility. The technical data of meters that were being installed in 2005 by
BSES –RPL provided to CHETNA, indicates the policy of making fast buck by
DISCOM under the garb of installation of Electronic meters. That finally led to
mass agitation in the City of Delhi. Those meters were being tampered with by the
DISCOM staff itself for a consideration. This fact was placed before DERC at the
time of public hearing for the year 2005-06 but has not been discussed at all in the
final order passed by DERC.
9
i) Last but not the least the DISCOMS should take NGO’s in confidence to hold
awareness campaigns, interactive discussions and disputer resolution at local level
before resorting to the consumer grievance mechanism at the first instance. The
DISCOMS shall have to fund these activities as very few of the genuine NGO’S
receive grants from the Government and are run purely by personal contributions by
the members and friends. The NGO’s can also play a vital link between the
DISCOMS and the RWA’s.
Anil Sood
Hony Secretary

1
ELECTRICITY SECTOR OF GUJARAT
NOTE PREPARED BY : SHRI K K BAJAJ, HON DIRECTOR Consumer Education and Research Centre, “Suraksha Sankool” Thaltej, Sarkhej-Gandhinagar Highway, Ahmedabad – 380 054
Phone : 079-27489945-46, 27450528, 30121001-2-3 Fax :079-27489947 Email : [email protected] Website : www.cercindia.org
Workshop on Power Sector Reforms and Regulations in India
Organised by Prayas Energy Group, Pune on March 22-23, 2007 Gujarat Electricity Board (GEB) was set up in 1960 after bifurcation of Bombay State into Maharashtra and Gujarat and existed till 31.03.2005. As per provisions of Electricity Act-2003 GEB was unbundled into seven companies with effect from 1st April 2005. The seven entities included one Holding Company, one Generation Company, one Transmission Company and four Distribution Companies. These Seven entities are headed by Managing Director for each and reporting to Chairman of Gujarat Urja Vikas Nigam Ltd (Holding Company). The demand of Power increased rapidly from 7500 MW to 10,500 MWS within last three years creating a shortfall of almost 12-13 % during normal hours and 24-25 % during peak hours. The deficit further increased due to transfer of Central Share of 200 MW for Gujarat to existing power starved Maharashtra. This has put additional burden on these companies, as power has to be purchased at higher cost ranging from Rs.4.50 to 5.30/unit from Independent Power Producers. Financial Status: - Gujarat Electricity Board was in financial crisis with a loss of Rs.3200 crores in 2002-03. The main reason of this loss being un-metered power supply to agricultural Sector, high transmission and distribution losses and high cost of power purchased from Independent Power Producers which were using Naptha as fuel. The agricultural consumption being more than 45 % against the revenue collection of 15-16 % made GEB almost bankrupt. CERC was against the free un-metered power supply to agricultural Sector. The Electricity Act-2003 also made it mandatory with no new connection to be provided without a meter and 100% metering to be completed by December 2005. The State Government protected these farmers as vote bank and ultimately Gujarat Electricity Regulatory Commission taking shelter of Section 55(1) of Electricity Act extended this time limit up to December 2007 but till today more than 70% of the connections are un-metered and how GERC and all DISCOMS are going to meet this deadline is a million dollar question. After unbundling of State Utility the performance of all six entities started improving and at one time loss making utility started making profit for the first time which can be observed from the following table. Financial Year Loss (-) Profit (+) in Crores 2002-2003 - -3200 2003-2004 - -1622 2004-2005 - -1378 2005-2006 - + 206

2
The actual profit in 2006-07 will reduce by Rs.650 crores as expenditure has incurred due to transfer of 200 MW to Maharashtra in this financial year.
POWER AVAILABLE IN GUJARAT
SOURCE MWS STATE OWNED COMPANIES 5802 CENTRAL OWNED COMPANIES 2191 PRIVATE COMPANIES 2277
TOTAL 10270 MWS
FUEL BASED GENERATION COAL 4429 76.4 % GAS 496 8.5 % HYDRO 778 13.4 % RES 99 1.7 % 5802 MWS 100 %
Most of the State Electricity Boards did not opt for capacity addition for last ten years due to poor financial condition. Neither any Renovation and Maintenance was carried out on ageing plants where some of them are more than 40 years old. This has brought down the plant load factor of these Utilities which is nowhere comparable with Central and Private Plants. All India Plant Load Factor - % FY State Central Private 2003-04 68.8 78.69 80.79 2004-05 69.77 81.45 85.12 2005-06 67.30 81.91 85.37 Due to non-addition of capacity and non-purchase of power from IPPS the power shortage in Gujarat remained through out the year ranging from 8.4 % to 24.8 %.
POWER SHORTAGE IN GUJARAT Shortage
Period Demand During
Peak hours in MWs Supply during Peak hours in MWs MWS %
October – 2005 8553 7240 1313 15.35 November - 2005 8159 7306 853 10.45 December -2005 8293 7610 683 8.24 January - 2006 8774 7264 1510 17.21 February - 2006 8780 7355 1425 16.23 March - 2006 8898 7491 1407 15.81
April – 2006 8993 7510 1483 16.49 May - 2006 8856 7579 1277 14.42 June - 2006 8820 7611 1209 13.71 July - 2006 8121 6677 1444 17.78 August - 2006 7808 6460 1340 17.26 September - 2006 8967 7374 1593 17.77 October - 2006 10203 7670 2533 24.80
3
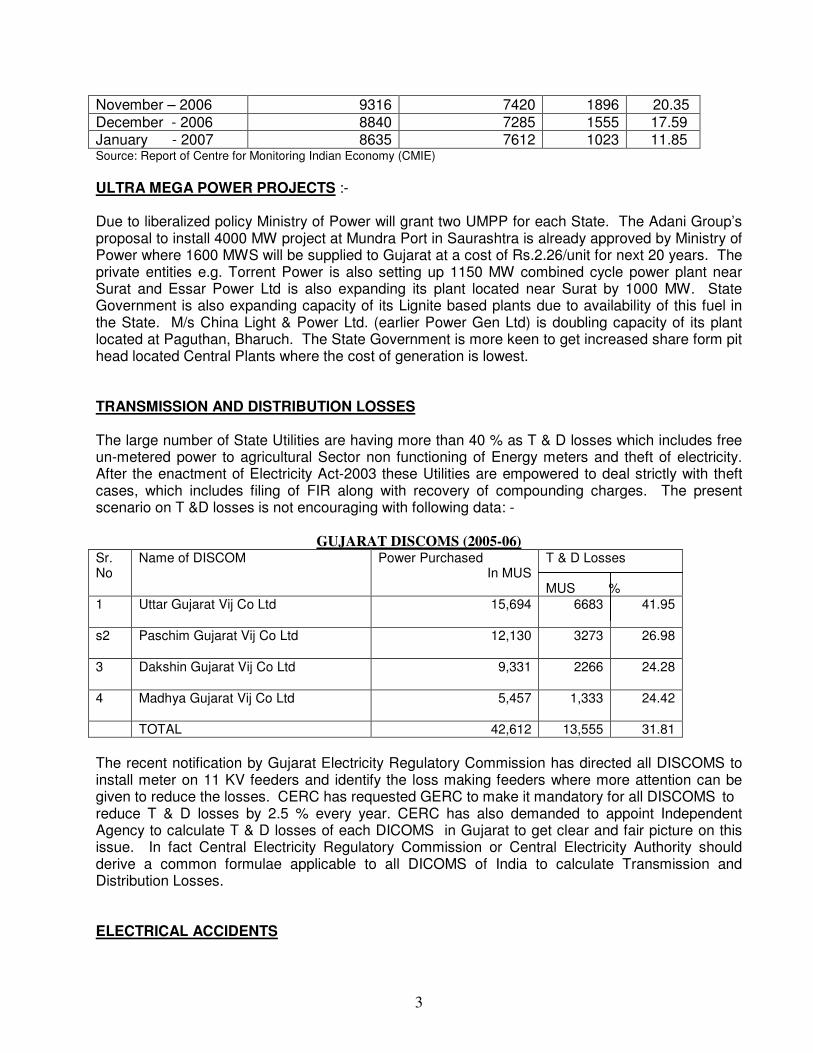
November – 2006 9316 7420 1896 20.35 December - 2006 8840 7285 1555 17.59 January - 2007 8635 7612 1023 11.85 Source: Report of Centre for Monitoring Indian Economy (CMIE)
ULTRA MEGA POWER PROJECTS :- Due to liberalized policy Ministry of Power will grant two UMPP for each State. The Adani Group’s proposal to install 4000 MW project at Mundra Port in Saurashtra is already approved by Ministry of Power where 1600 MWS will be supplied to Gujarat at a cost of Rs.2.26/unit for next 20 years. The private entities e.g. Torrent Power is also setting up 1150 MW combined cycle power plant near Surat and Essar Power Ltd is also expanding its plant located near Surat by 1000 MW. State Government is also expanding capacity of its Lignite based plants due to availability of this fuel in the State. M/s China Light & Power Ltd. (earlier Power Gen Ltd) is doubling capacity of its plant located at Paguthan, Bharuch. The State Government is more keen to get increased share form pit head located Central Plants where the cost of generation is lowest. TRANSMISSION AND DISTRIBUTION LOSSES The large number of State Utilities are having more than 40 % as T & D losses which includes free un-metered power to agricultural Sector non functioning of Energy meters and theft of electricity. After the enactment of Electricity Act-2003 these Utilities are empowered to deal strictly with theft cases, which includes filing of FIR along with recovery of compounding charges. The present scenario on T &D losses is not encouraging with following data: -
GUJARAT DISCOMS (2005-06) Sr. No
Name of DISCOM Power Purchased In MUS
T & D Losses
MUS %
1 Uttar Gujarat Vij Co Ltd 15,694 6683 41.95
s2 Paschim Gujarat Vij Co Ltd 12,130 3273 26.98
3 Dakshin Gujarat Vij Co Ltd 9,331 2266 24.28
4 Madhya Gujarat Vij Co Ltd 5,457 1,333 24.42
TOTAL 42,612 13,555 31.81
The recent notification by Gujarat Electricity Regulatory Commission has directed all DISCOMS to install meter on 11 KV feeders and identify the loss making feeders where more attention can be given to reduce the losses. CERC has requested GERC to make it mandatory for all DISCOMS to reduce T & D losses by 2.5 % every year. CERC has also demanded to appoint Independent Agency to calculate T & D losses of each DICOMS in Gujarat to get clear and fair picture on this issue. In fact Central Electricity Regulatory Commission or Central Electricity Authority should derive a common formulae applicable to all DICOMS of India to calculate Transmission and Distribution Losses. ELECTRICAL ACCIDENTS

4
CERC filed a petition before Gujarat Electricity Regulatory Commission for death of human beings and animals in Gujarat due to dropping of live overhead wires. The Hon’ble Commission disposed off the petition by giving directives to DISCOMS of Gujarat. More than 1000 people/animals die every year due to dropping of overhead wires. CERC has filed case before Gujarat High Court making GERC, Chief Electrical Inspector and DISCOMS of Gujarat as parties. The matter is pending before Hon’ble High Court since last one year. The details of electrical accidents in last six years are as follows: -
STATISTICS OF ELECTRICAL ACCIDENTS
%
Type of Accident 2000-01 2001-02 2002-03 2003-04 2004-05 2005-06 Increase Total
from 2002
HUMAN BEINGS
Fatal 293 289 346 386 398 422 22 2134
Non Fatal 267 274 267 321 321 363 36 1813
Sub Total 560 563 613 707 719 785 28 3947
ANIMALS
Fatal 472 466 403 542 542 583 45 3008
Non Fatal 1 1 0 2 1 2 … 7
Sub Total 473 467 403 544 543 585 45 3015
Grand Total 1033 1030 1016 1251 1262 1370 35 6962
ROLE OF CERC
Gujarat Electricity Regulatory Commission has notified various regulations as per the provisions of Electricity Act-2003. CERC has actively participated in helping GERC to notify these regulations. The most important regulations on Supply Code and Standard of Performance are consumer friendly. The Regulation on Electricity Tariff is also very strict where Standard Parameters have been specified by GERC where Utilities have to perform very close to these Standards. CERC has demanded performance based Tariff and accordingly the following parameters have been specified.
PARAMETERS FOR PERFORMANCE BASED TARIFF:
Sr. No Category Particular 1. Plant Load Factor 80% 2 Station Heat Rate
Coal based 2500 Kcal/Kwh Gas based 1950 Kcal/Kwh Lignite based 2675 Kcal/Kwh (40% Moisture)
3. Secondary fuel oil consumption

5
Coal based 2.0 Ml/Kwh Lignite based 3.0 Ml/Kwh
4. Auxiliary Energy Consumption Coal based 9 %
Gas based 3 % 5. Capital Cost Coal/lignite based 2.5 % Gas based 4 % 6. Operation & Maintenance Cost Coal/Lignite based Rs.11.25 Lakhs/MW Gas based Rs. 8.44 Lakhs/MW 7. Coal Loss in Transit Pit –Head Plants 0.3 % Non-Pit Head Plants 0.8 % Aggregate Revenue Requirement (ARR) demand filed by State own generation company, CERC has strongly representated before GERC not to allow any relaxed technical parameters e.g. Station heat Rate, Auxiliary Consumption, Specific Fuel Oil Consumption, Plant Load Factor and Coal Transit Losses. The Hon’ble Commission did not allow any relaxed parameter demanded by Generating Company due to ageing of the plants. The Generation Company filed an appeal before Appellate Tribunal for Electricity making GERC and CERC as Respondents. The matter is still pending before Hon’ble Tribunal. CERC apart from appearing before GERC also resolves complaints of electricity consumers. CERC files cases before consumer Dispute Redressal Forum constituted under Consumer Protection Act-1986 and does not approach Redressal Forum constituted by Distribution companies where all three members are from utility. CERC has filed 16 cases before Consumer Dispute Redressal Forum where four orders have been passed all in favour of Consumer and CERC. The Distribution Companies have appealed against these orders and approached State Commission where the matter is still pending. CERC receives more than 200 complaints from electricity consumers of Gujarat and around 40-50 from other States of India. More than 80 % of the complaints are resolved by correspondence and meeting. CERC does not charge any fees while resolving the complaints but complainants are directed to become member of our Centre for either three or fiver years. RANDOM METER CHECKING Consumer Education And Research Centre has signed an agreement with M/s Ahmedabad Electricity Co Ltd where representatives of AEC, CERC and Chief Electrical Inspector’s Office visit consumer’s premises once a week to check/test the meter for accuracy, with the help of “Accucheck”. The meter beyond the permissible limits of accuracy are changed within 24 hours under information to CERC. Many times tempered meters are found during these random visits. The meter testing reports are jointly signed by all three representatives. The meters are tested at no load, normal load and 100 % load by switching on all lights, gadgets etc. During this random checking procedure our representative educates consumers on conservation of energy by demonstration of CFL lamps and tube lights, use of electronic chokes and electronics
6
regulators for fans. This unique arrangement is first of its kind in India and approved by Hon’ble Gujarat Electricity Regulatory Commission. This practice is being continued since last four years. INDPENDENT MEMBER IN CONSUMER FORUM The Electricity Act-2003 where Section 42(5) mandates all Distribution Companies to constitute Consumer Grievance Redressal Forum to resolve consumer complaints. Gujarat Electricity Regulatory Commission notified the Regulations on this provision on 25th August 2004 directing DISCOMS to include one member from consumer organisation. The State owned DISCOMS aggrieved with this provision approached Ministry of Power, Government of India. MoP succumbed under political pressure and brought an amendment dated 8th June 2005 allowing Distribution Companies to appoint all three members from utility. CERC along with GERC wrote number of letters to Ministry of Power stating that how consumers will get justice from a Forum which have all the three members from Utility itself. CERC also directed electricity consumers not to approach such Forums and helped them to file cases before Consumer Dispute Redressal Forums constituted under Consumer Protection Act-1986. Finally Ministry of Power brought new amendment on 26.10.2006 authorizing State Electricity Regulatory Commission to depute one member who is familiar with consumer affairs. GERC by its order dated 28.02.2007 deputed three Retired Judges, three Retired Professors from Engineering College/Polytechnic and one each from Mill Textile Association and Gujarat Productivity Council in all Distribution Companies of Gujarat for a period from 1st March 2007 to 31st March 2008.
~ 0 ~

1
Power Sector Reforms in Haryana
Rajesh Kumar, Hindu College Sonepat
The State Assembly passed the Haryana Electricity Reform Bill, 1997 to reform the power
sector in the state on 07.07.1997. Gazette notification of this Act was issued on 03.10.1998
after getting approval from the President of India on 02.02.1998. Haryana Electricity Reform
Act, 1997 (Hereafter referred as HER Act. Subsequently, the state government initiated
restructuring process in the Electricity Supply Industry (ESI) in the State. The main
institutional changes brought about were:
• Unbundling of HSEB into generation, transmission and distribution businesses.
• Creation of an Independent Regulatory Agency (IRA) at state level-Haryana
Electricity Regulatory Commission (HERC).
One of the important objectives behind unbundling was to create competition among
private participants and to ensure accountability in the system. This objective is incorporated
in the functions of regulatory commission under Section 11 1(f) of the HER Act which states
that one of the functions was “to promote competitiveness and progressively involve the
participation of private sector”. For this unbundling was considered to be necessary to ensure
accountability in the system. Haryana State Electricty Board (HSEB) has been unbundled
into the following corporations: -
1. Haryana Power Generation Corporation Limited (HPGCL)
2. Haryana Vidyut Prasaran Nigam Limited (HVPNL)
3. Dakshin Haryana Bijli Vitran Nigam Limited (DHBVN)
4. Uttar Haryana Bijli Vitran Nigam Limited (UHBVN)
All these corporations are incorporated under the Companies Act 1956. Earlier
HPGCL was solely responsible for the generation business in the state. Keeping the
provisions the Electricity Act 2003 in view, the HPGCL was authorised for bulk purchase
from the other sources of power in June 2005. HPGCL purchases power from Central Power
Undertakings (CPUs) mainly NTPC and NHPC, Bakhra Beas Management Board (BBMB)
and some other sources. HVPNL was created to run the Transmission & Bulk Supply
(T&BS) business in the state. Now it is only transmission utility. UHBVN and DHBVN have
been created to run the Distribution & Retail Supply (D&RS) businesses in the north and
south zones of the state respectively. Initially, DHBVNL and UHBVN were constituted as
subsidiaries of HVPNL. In Oct. 2004, HERC issued independent licenses to both companies.
All these four corporations have been working under the ownership of the state government.
Haryana does not have any significant share of Independent Power Producers (IPPs) in
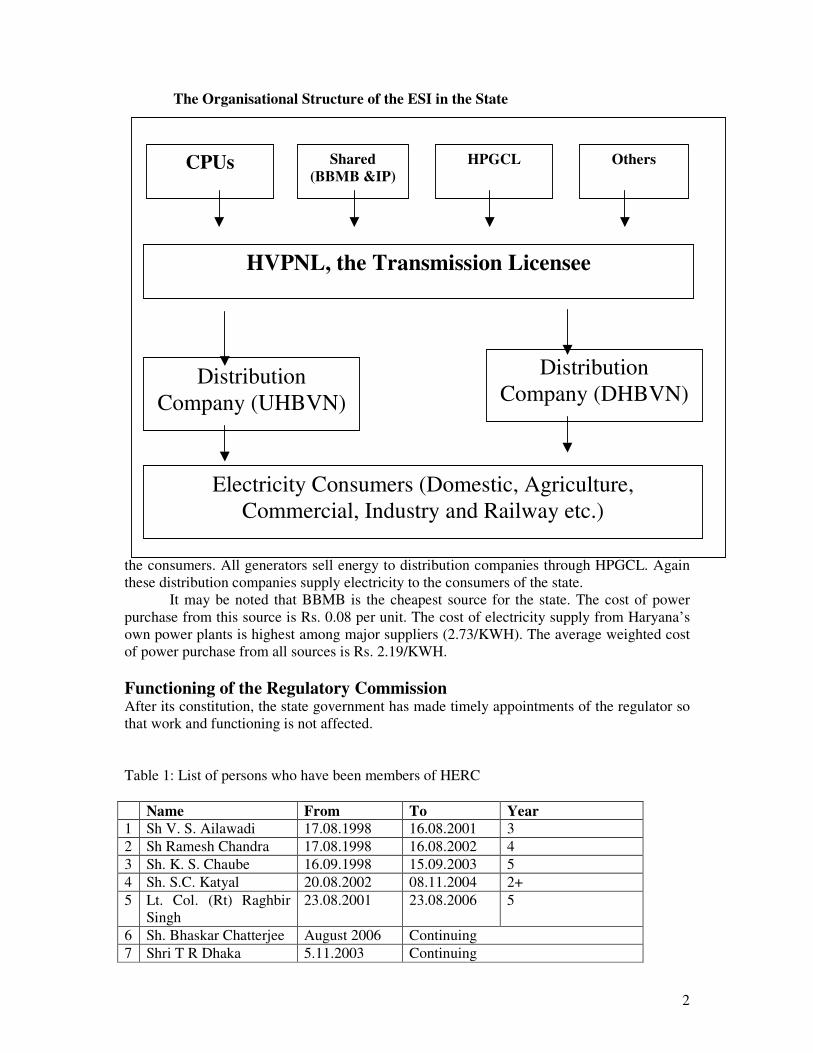
generation. The Organisational structure of the ESI in the state is given in the Diagram
2
The Organisational Structure of the ESI in the State
This diagram shows the transactions of energy from the power generating plants to
the consumers. All generators sell energy to distribution companies through HPGCL. Again
these distribution companies supply electricity to the consumers of the state.
It may be noted that BBMB is the cheapest source for the state. The cost of power
purchase from this source is Rs. 0.08 per unit. The cost of electricity supply from Haryana’s
own power plants is highest among major suppliers (2.73/KWH). The average weighted cost
of power purchase from all sources is Rs. 2.19/KWH.
Functioning of the Regulatory Commission
After its constitution, the state government has made timely appointments of the regulator so
that work and functioning is not affected.
Table 1: List of persons who have been members of HERC
Name From To Year
1 Sh V. S. Ailawadi 17.08.1998 16.08.2001 3
2 Sh Ramesh Chandra 17.08.1998 16.08.2002 4
3 Sh. K. S. Chaube 16.09.1998 15.09.2003 5
4 Sh. S.C. Katyal 20.08.2002 08.11.2004 2+
5 Lt. Col. (Rt) Raghbir
Singh
23.08.2001 23.08.2006 5
6 Sh. Bhaskar Chatterjee August 2006 Continuing
7 Shri T R Dhaka 5.11.2003 Continuing
CPUs Shared
(BBMB &IP)
HPGCL Others
HVPNL, the Transmission Licensee
Distribution
Company (UHBVN)
Distribution
Company (DHBVN)
Electricity Consumers (Domestic, Agriculture,
Commercial, Industry and Railway etc.)
3
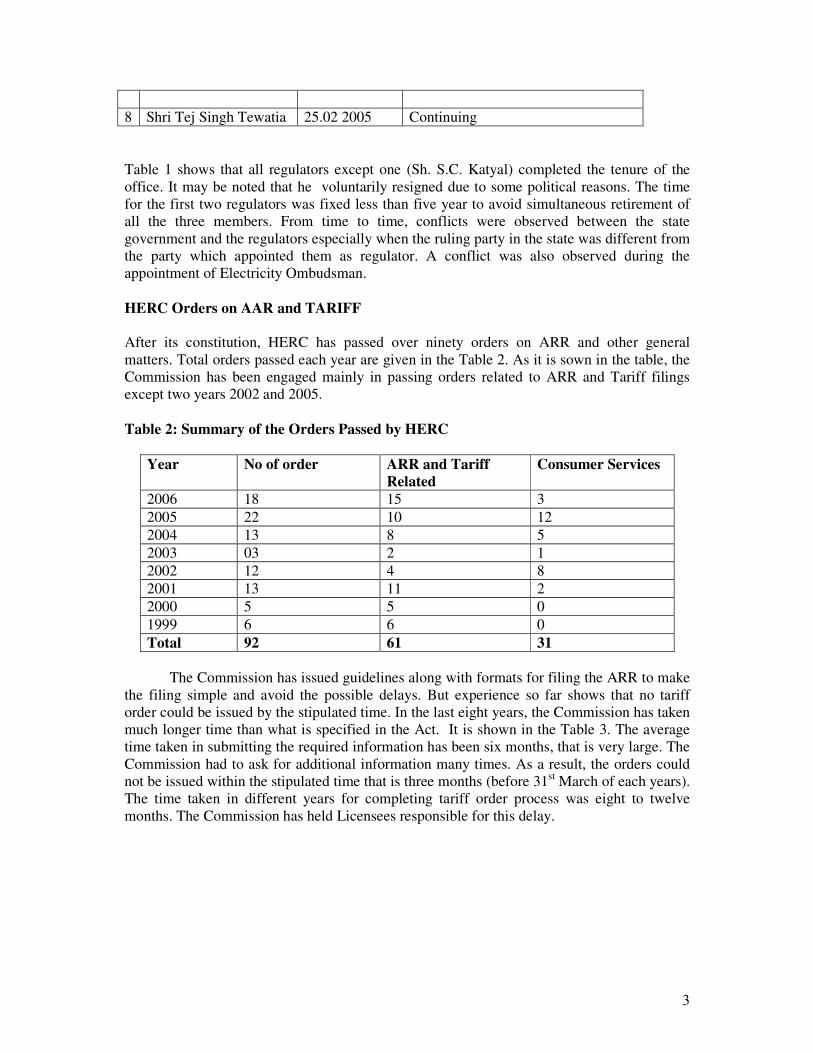
8 Shri Tej Singh Tewatia 25.02 2005 Continuing
Table 1 shows that all regulators except one (Sh. S.C. Katyal) completed the tenure of the
office. It may be noted that he voluntarily resigned due to some political reasons. The time
for the first two regulators was fixed less than five year to avoid simultaneous retirement of
all the three members. From time to time, conflicts were observed between the state
government and the regulators especially when the ruling party in the state was different from
the party which appointed them as regulator. A conflict was also observed during the
appointment of Electricity Ombudsman.
HERC Orders on AAR and TARIFF
After its constitution, HERC has passed over ninety orders on ARR and other general
matters. Total orders passed each year are given in the Table 2. As it is sown in the table, the
Commission has been engaged mainly in passing orders related to ARR and Tariff filings
except two years 2002 and 2005.
Table 2: Summary of the Orders Passed by HERC
Year No of order ARR and Tariff
Related
Consumer Services
2006 18 15 3
2005 22 10 12
2004 13 8 5
2003 03 2 1
2002 12 4 8
2001 13 11 2
2000 5 5 0
1999 6 6 0
Total 92 61 31
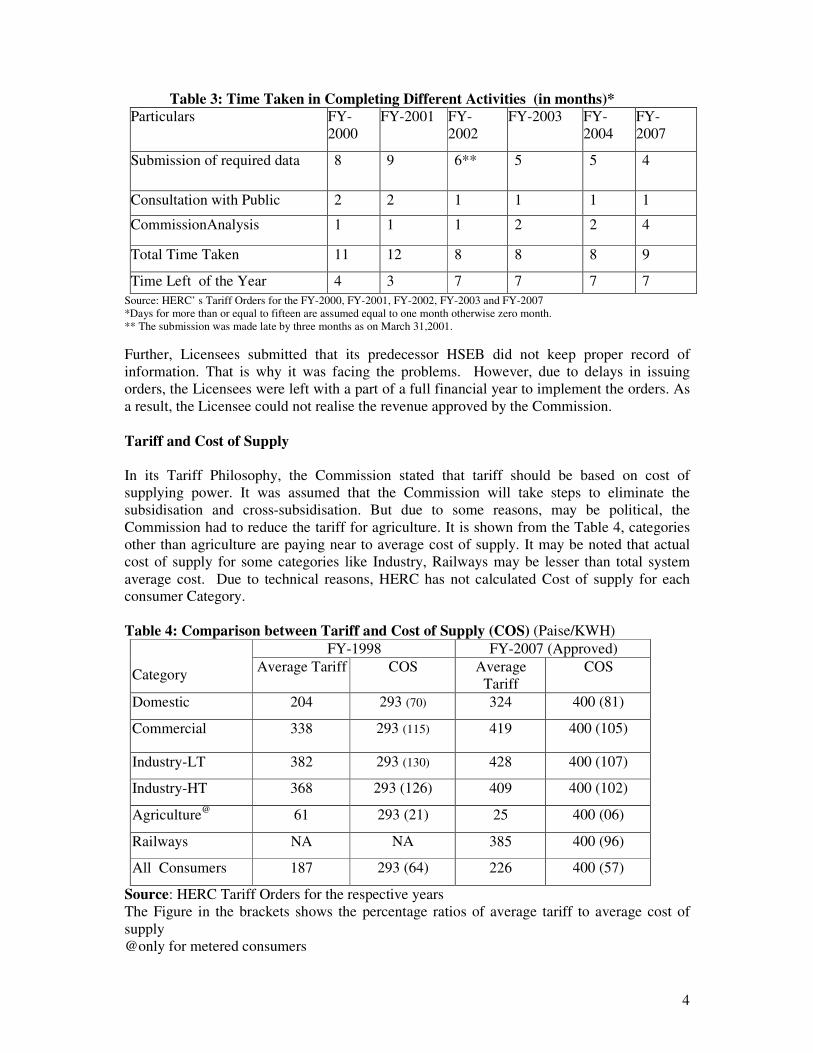
The Commission has issued guidelines along with formats for filing the ARR to make
the filing simple and avoid the possible delays. But experience so far shows that no tariff
order could be issued by the stipulated time. In the last eight years, the Commission has taken
much longer time than what is specified in the Act. It is shown in the Table 3. The average
time taken in submitting the required information has been six months, that is very large. The
Commission had to ask for additional information many times. As a result, the orders could
not be issued within the stipulated time that is three months (before 31st March of each years).
The time taken in different years for completing tariff order process was eight to twelve
months. The Commission has held Licensees responsible for this delay.
4
Table 3: Time Taken in Completing Different Activities (in months)*
Particulars
FY-
2000
FY-2001 FY-
2002
FY-2003 FY-
2004
FY-
2007
Submission of required data 8 9 6** 5 5 4
Consultation with Public 2 2 1 1 1 1
CommissionAnalysis 1 1 1 2 2 4
Total Time Taken 11 12 8 8 8 9
Time Left of the Year 4 3 7 7 7 7
Source: HERC’ s Tariff Orders for the FY-2000, FY-2001, FY-2002, FY-2003 and FY-2007
*Days for more than or equal to fifteen are assumed equal to one month otherwise zero month.
** The submission was made late by three months as on March 31,2001.
Further, Licensees submitted that its predecessor HSEB did not keep proper record of
information. That is why it was facing the problems. However, due to delays in issuing
orders, the Licensees were left with a part of a full financial year to implement the orders. As
a result, the Licensee could not realise the revenue approved by the Commission.
Tariff and Cost of Supply
In its Tariff Philosophy, the Commission stated that tariff should be based on cost of
supplying power. It was assumed that the Commission will take steps to eliminate the
subsidisation and cross-subsidisation. But due to some reasons, may be political, the
Commission had to reduce the tariff for agriculture. It is shown from the Table 4, categories
other than agriculture are paying near to average cost of supply. It may be noted that actual
cost of supply for some categories like Industry, Railways may be lesser than total system
average cost. Due to technical reasons, HERC has not calculated Cost of supply for each
consumer Category.
Table 4: Comparison between Tariff and Cost of Supply (COS) (Paise/KWH)
FY-1998 FY-2007 (Approved)
Category Average Tariff COS Average
Tariff
COS
Domestic 204 293 (70) 324 400 (81)
Commercial 338 293 (115) 419 400 (105)
Industry-LT 382 293 (130) 428 400 (107)
Industry-HT 368 293 (126) 409 400 (102)
Agriculture@
61 293 (21) 25 400 (06)
Railways NA NA 385 400 (96)
All Consumers 187 293 (64) 226 400 (57)
Source: HERC Tariff Orders for the respective years
The Figure in the brackets shows the percentage ratios of average tariff to average cost of
supply
@only for metered consumers

5
T&D Losses
Inaccurate Estimation of the Power consumption
As it is revealed that Agriculture sector is the major consuming sector (around 30% of the
total consumption of the total consumption) In Haryana approximate 70% of the power
supply to the agriculture continues to be un-metered. As a result, the Discos were able to
overestimate the agricultural power consumption. So the Commission has argued that in
absence of 100% metering, it is not possible to estimate the actual consumption as well as T&
D losses level in the state. Therefore, there have been different opinions regarding estimates
of Energy Losses. The Commission has estimated total T&D losses above 45% for the period
from 1999 to 2006 against the 40% claimed by Discos. One positive point on behalf of the
Commission is that it has reduced the approved Transmission Losses from 10% in 1999 to
4.4% in 2006
Promotion of Renewable Energy Sources
Haryana does not have any source of power from renewable energy sources. But there are
provisions in the Electricity Act 2003 that Regulatory Commission must promote these
sources of energy. Haryana Renewable Energy Development Agencies (HREDA) requested
HERC to fix tariff for these sources of power. In the same process, HERC has passed an
order on 31.01.2007 for fixing the rates for these sources. The rates approved by HERC are
given in the Table 5.
Table 5: Rates for Renewable Energy Sources
Sr. Name of the Source Rs./KWH
1. Small Hydro 2.81
2. Wind 3.36
3. Bio-Mass 3.32
4. Bagasse 3.28
Concluding Remarks
The Commission was constituted about nine year back to protect the consumers’ interest
while ensuring financial viability of the power utilities. The Commission has identified some
problems inherent in the system like high T&D losses and overestimation of the agricultural
consumption. The Commission has put a pressure on the utilities for better performance. The
regulatory Commission has provided a platform to consumers to participate in the decision-
making process through Public Hearings. But High T&D losses and poor public participation
reveal weakness of the system. There were some procedural delays but ultimately the state
government has paid the committed subsidy on account of lower tariff for agriculture. Now
the major challenge before the regulator is to force the licensees to reduce high T&D losses
and ensure improved quality of service.
~ 0 ~
1
Overview of Karnataka Power Sector - Gautam Menon, CISED
State Background:
Karnataka is divided into 27 districts with 66% of the population living in rural areas. As
per the 2001 Census, the state’s population is about 52.9 million with a density of 275
persons per square kilometer. The urban versus rural growth rate is 28.8% and 12.5%
respectively.
The growth rate for the state is 7.8% over the last year and the Planning Commission has
set a growth rate of 10.1% by 2006-07 (GOK, 2005).
Status of Electricity sector:
The power sector in Karnataka has gone undergone many changes in the last decade. The
major changes began in 1999 with the passing of the Karnataka Electricity Reforms Act
and the setting up of the Karnataka Electricity Regulatory Commission (KERC). Around
the same time KPTCL was formed and entrusted with T&D in the sector. Subsequently in
2002 KPTCL unbundled to form 4 distribution companies (with MESCOM splitting to
form MESCOM and CHESCOM) commonly called Electricity Supply companies
(ESCOMS). KPTCL now controls only transmission in the power sector.
Following the unbundling of the sector privatization has been recommended in the EAct,
2003 to introduce competition. Many sections of this Act (such as 7, 9, and 12) facilitate
competition. A consortium of consulting firms has been hired to work out the modalities
of the privatization process. Privatization in generation has already started; Tannir Bavi,
Rayalseema and Tata Power have been the major projects. As of 31st March, 2005
following was the installed capacity in above plants:
Tannir Bavi: 220 MW
Rayalseema: 27 MW
Tata Power: 81 MW
Tenders for privatisation had been invited in 2001-2002 from private parties interested in
the distribution of electricity in Karnataka. However since then the status of privatisation
and tenders received is unknown.
The electricity source for Karnataka is primarily a mix of thermal and hydro.
Table1: Electricity Statistics from 2001-02 to 2006-07
Units 2001-02 2002-03 2003-04 2004-
05
2005-
06
2006-
07 Installed capacity MW 5217 5526 5908 5872 6063 7678*
Central Share MW 619 722 1133 1170 1450 -
Generation MUs 18222 17127 18426 18990 19889 -
Source: KPCL and ERC of ESCOMs
* KPTCL presentation
2
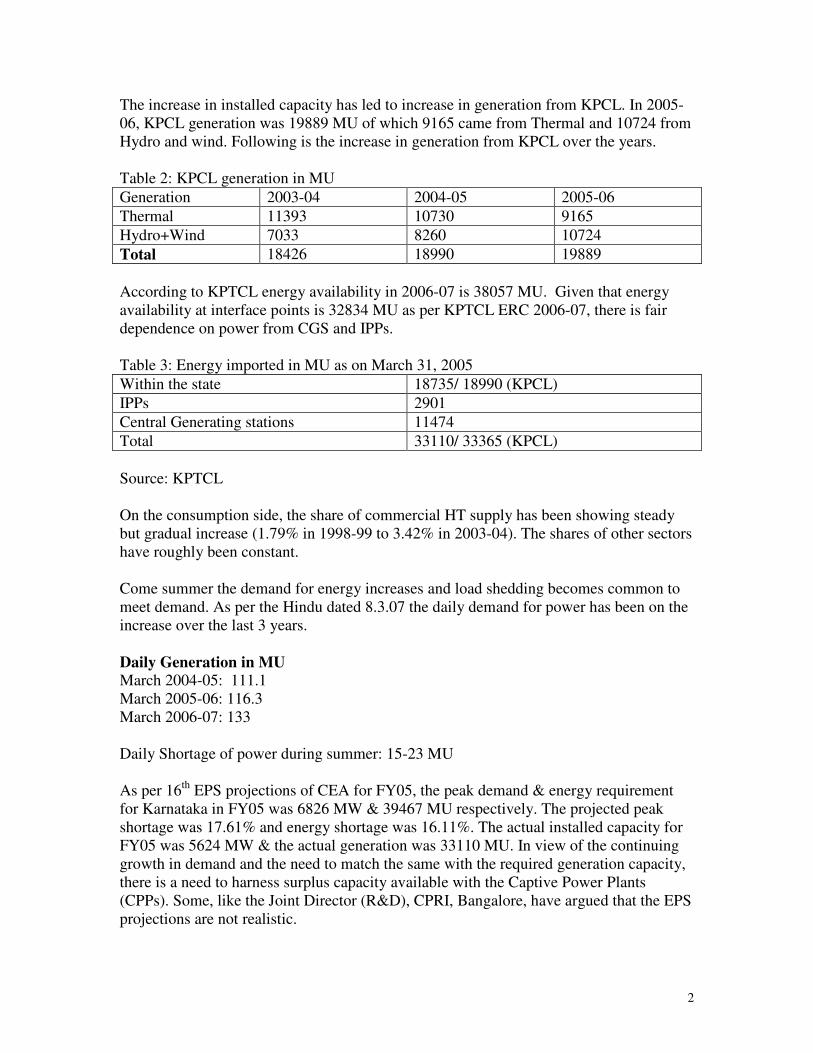
The increase in installed capacity has led to increase in generation from KPCL. In 2005-
06, KPCL generation was 19889 MU of which 9165 came from Thermal and 10724 from
Hydro and wind. Following is the increase in generation from KPCL over the years.
Table 2: KPCL generation in MU
Generation 2003-04 2004-05 2005-06
Thermal 11393 10730 9165
Hydro+Wind 7033 8260 10724
Total 18426 18990 19889
According to KPTCL energy availability in 2006-07 is 38057 MU. Given that energy
availability at interface points is 32834 MU as per KPTCL ERC 2006-07, there is fair
dependence on power from CGS and IPPs.
Table 3: Energy imported in MU as on March 31, 2005
Within the state 18735/ 18990 (KPCL)
IPPs 2901
Central Generating stations 11474
Total 33110/ 33365 (KPCL)
Source: KPTCL
On the consumption side, the share of commercial HT supply has been showing steady
but gradual increase (1.79% in 1998-99 to 3.42% in 2003-04). The shares of other sectors
have roughly been constant.
Come summer the demand for energy increases and load shedding becomes common to
meet demand. As per the Hindu dated 8.3.07 the daily demand for power has been on the
increase over the last 3 years.
Daily Generation in MU
March 2004-05: 111.1
March 2005-06: 116.3
March 2006-07: 133
Daily Shortage of power during summer: 15-23 MU
As per 16th
EPS projections of CEA for FY05, the peak demand & energy requirement
for Karnataka in FY05 was 6826 MW & 39467 MU respectively. The projected peak
shortage was 17.61% and energy shortage was 16.11%. The actual installed capacity for
FY05 was 5624 MW & the actual generation was 33110 MU. In view of the continuing
growth in demand and the need to match the same with the required generation capacity,
there is a need to harness surplus capacity available with the Captive Power Plants
(CPPs). Some, like the Joint Director (R&D), CPRI, Bangalore, have argued that the EPS
projections are not realistic.

3
KERC has passed an order calling for purchase of power from captive generation sources
As per the Report dated 25.8.2005 of the CEA on ‘Tapping of surplus power from
Captive power plants’, surplus power of 63 MW of the CPP capacity has already been
utilized. Karnataka State has a total installed capacity of about 800 MW of Captive
Power (1MW and above). About 54% of these CPPs run on diesel, 21% on Fuel oil and
the remaining on other fuels.
Tariff for firm power (capacity factor of 70% or more) – contract for less than 3 years –
2.28 – 3.45 Rs/kWh; contract for 3 or more years – Rs. 2.87 /kWh
Infirm power: Rs. 2.05-3.10/kWh
Financial Issues:
Tariff:
Tariff has an impact on almost every consumer in Karnataka. Over the years tariff has
been increasing for certain categories vis a vis other categories. However, efforts are
being made to rationalize tariffs by getting more consumers to pay equal to the average
cost of supply or higher. In Tariff Order 2003 except BJ and IP set customers, others paid
tariff equal to or higher than the average cost of supply (CoS). Most importantly, power
purchase accounts for a large part of the costs of the utility. In 2006-07 according to
KPTCL,
Average Delivery Cost: Rs.3.55/unit
Average Rate of Realization: Rs. 2.90/unit
Average Power Purchase cost:Rs.1.82/unit
Every year KPTCL and ESCOMs publish their Expected Revenue from Charges
document which is a financial statement of their costs and expenditures. ERC filed by
November 30 of every year. This year being the year when MYT comes into effect the
ESCOMs are preparing for the same.
Table 4: Increase in tariff between 2000-03
Tariff Orders Average increase in consumer tariff (%)
Tariff Order dated 18.12.2000 16.29%
Tariff Order dated 8.5.2002 16.07%
Tariff Order dated 10.3.2003 2.00%
Tariff Amendment Order dated 15.12.03 2.89%
Cumulative increase in tariff 41.65%
Note: Base tariff of 100 in the year 2000 has increased to 141.65 in the year 2003
considering the above revisions.

4
Given below are the tariff changes across different customer categories from 2000-05.
Tariff change
0
1
2
3
4
5
6
LT4a(i) LT2b(i) HT2b(ii) HT1
Customer Category
Ta
riff
(R
s./u
nit
)
2000
2002
2003
2005
LT4a (i) -Irrigation pumpsets
LT2b (i) - educational institutions
HT2b (ii) - commercial consumers
HT1 - water supply and sewerage pumping stations
This is just a sample of the customer categories that exist. Tariff rationalization has
resulted in some categories merging with others. The above categories have been fairly
consistent during the tariff rationalization process and also reflect the tariff changes from
2000-05. For Bangalore Water Supply and Sewerage Board and other water suppliers,
tariffs increased sharply and consistently whereas for others, such as commercial
establishments and academic institutions, tariffs went up slowly. For some categories,
like irrigation pumpsets under specific schemes, the tariff remained constant.
Subsidy: Government agreed in 2000 to pay SEB a subsidy amount so that the
SEB/ESCOM could have a 3% ROR on net fixed assets. The amount promised was 6750
crores from FY01-05 on which it has delivered. But subsidy request has gone up and so
there is an unpaid balance.
Year O.B.of
subsidy
due
Provision
for
subsidy
in the
approve
d FRP
Subsidy
claimed
for the
year
Subsidy
released by
the
Government
Balance
at the end
of the
year
1999-00 256 1213 769 700
2000-01 700 709 1821 1246 1275
2001-02 1274 1788 2231 1872 1634
2002-03 1633 1796 1904 1699 1839
5
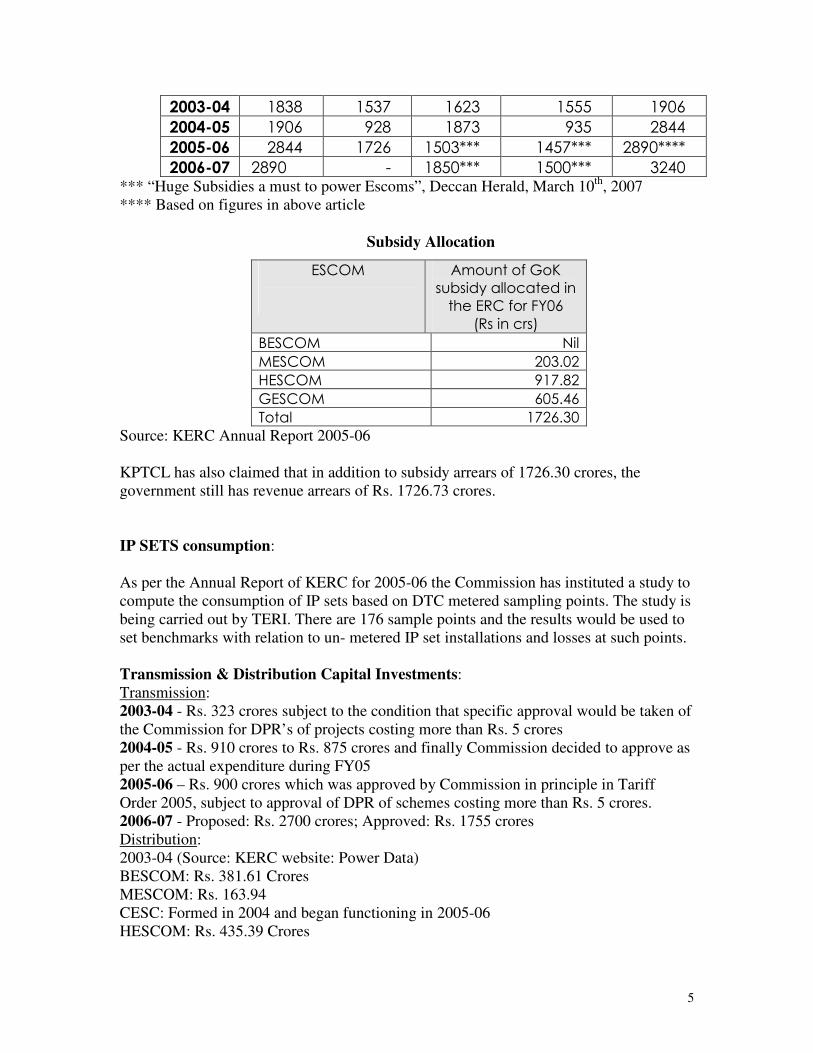
2003-04 1838 1537 1623 1555 1906
2004-05 1906 928 1873 935 2844
2005-06 2844 1726 1503*** 1457*** 2890****
2006-07 2890 - 1850*** 1500*** 3240 *** “Huge Subsidies a must to power Escoms”, Deccan Herald, March 10
th, 2007
**** Based on figures in above article
Subsidy Allocation
ESCOM
Amount of GoK
subsidy allocated in
the ERC for FY06
(Rs in crs)
BESCOM Nil
MESCOM 203.02
HESCOM 917.82
GESCOM 605.46
Total 1726.30
Source: KERC Annual Report 2005-06
KPTCL has also claimed that in addition to subsidy arrears of 1726.30 crores, the
government still has revenue arrears of Rs. 1726.73 crores.
IP SETS consumption:
As per the Annual Report of KERC for 2005-06 the Commission has instituted a study to
compute the consumption of IP sets based on DTC metered sampling points. The study is
being carried out by TERI. There are 176 sample points and the results would be used to
set benchmarks with relation to un- metered IP set installations and losses at such points.
Transmission & Distribution Capital Investments:
Transmission:
2003-04 - Rs. 323 crores subject to the condition that specific approval would be taken of
the Commission for DPR’s of projects costing more than Rs. 5 crores
2004-05 - Rs. 910 crores to Rs. 875 crores and finally Commission decided to approve as
per the actual expenditure during FY05
2005-06 – Rs. 900 crores which was approved by Commission in principle in Tariff
Order 2005, subject to approval of DPR of schemes costing more than Rs. 5 crores.
2006-07 - Proposed: Rs. 2700 crores; Approved: Rs. 1755 crores
Distribution:
2003-04 (Source: KERC website: Power Data)
BESCOM: Rs. 381.61 Crores
MESCOM: Rs. 163.94
CESC: Formed in 2004 and began functioning in 2005-06
HESCOM: Rs. 435.39 Crores
6
GESCOM: Rs. 107.70 Crores
2005-06 (As per ERC) - KERC figures don’t match with these
BESCOM: Rs. 832.42 Crores (Approved)
MESCOM: Rs. 178.52 Crores (Approved)
CESC: Rs. 189.92 Crores (Approved)
HESCOM: Rs. 341.78 Crores (Approved)
GESCOM: Rs. 330.80 Crores (Approved)
2006-07
BESCOM: Rs. 1085 Crores (Approved)
MESCOM: Rs. 490.49 Crores
CESC: 368.72 Crores
HESCOM: Rs. 1317.61 Crores
GESCOM: Rs. 626.25 Crores
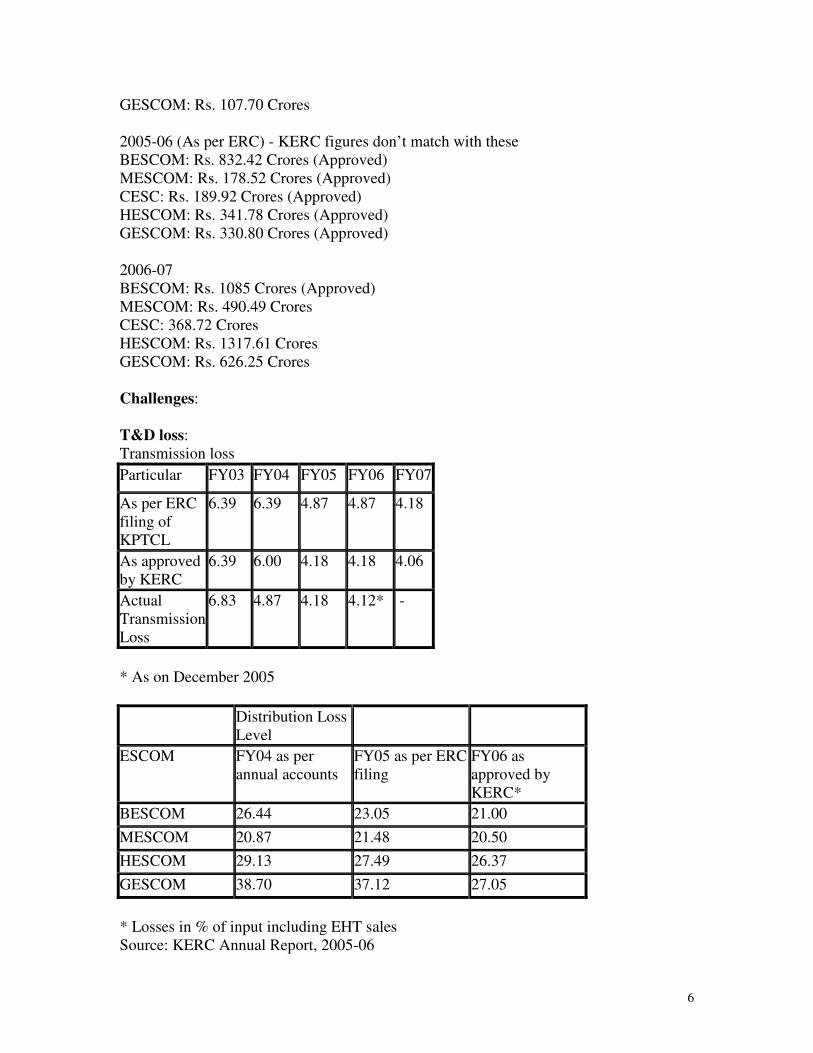
Challenges:
T&D loss:
Transmission loss
Particular FY03 FY04 FY05 FY06 FY07
As per ERC
filing of
KPTCL
6.39 6.39 4.87 4.87 4.18
As approved
by KERC
6.39 6.00 4.18 4.18 4.06
Actual
Transmission
Loss
6.83 4.87 4.18 4.12* -
* As on December 2005
Distribution Loss
Level
ESCOM FY04 as per
annual accounts
FY05 as per ERC
filing
FY06 as
approved by
KERC*
BESCOM 26.44 23.05 21.00
MESCOM 20.87 21.48 20.50
HESCOM 29.13 27.49 26.37
GESCOM 38.70 37.12 27.05
* Losses in % of input including EHT sales
Source: KERC Annual Report, 2005-06

7
Regulatory Developments:
1999- 2002:
The GOK as per the Karnataka Electricity Reform Act 1999 established in the Karnataka
Electricity Regulatory Commission (KERC) in August 1999. The Commission consists
of three members, one of whom is a Chairman. Beginning in 1999 the restructuring of the
electricity sector in Karnataka began with the formation of KPTCL and VVNL. KPTCL
was entrusted with transmission and distribution functions whereas VVNL was a
generating company to handle the existing generating stations with the associated units.
In 2003-04 VVNL merged with KPCL which is an exclusive generating company
operating in the state since 1970.
With effect from June 2002, KPTCL further unbundled into a transmission and 4
distribution companies headquartered in Bangalore, Mangalore, Hubli and Gulbarga. In
August 2004 vide an order Mangalore Electricity Supply Company bifurcated into
Mangalore Electricity Supply Company and Chamundeshwari Electricity Supply
Company.
The privatization initiative was handed over to the Financial and Distribution
Privatisation Consultants of the government who had proposed a ‘Distribution Margin
approach’ to privatization of distribution sector. Commission sent its comments in 2001
and following which on its insistence; GOK conducted a workshop around the same
issue. A final strategy paper came through as a result of the workshop which invited
private sector participation in distribution and in the 4 companies. As part of the
privatization strategy it was suggested by FDP consultants to amend the KER Act. In
February 2004 FDP consultants were asked to provide an ‘Options paper’ regarding
alternative privatization models. They suggested three options 1) DM approach 2)
privatizing concentrated cities/zones and 3) maintain the status quo.
In 2001, GOK had authorized the Financial Restructuring Plan for the power sector in
KA and Balance Sheet Restructuring Plan for the KEB. The 10 year plan envisages
providing Rs. 8999 crores to strengthen the finances of the sector. BRP 1&2 aimed at
taking over the liabilities of both KPTCL and the ESCOMs to provide them with a clean
Balance Sheet. The main feature of the BRP was to write off KPTCL’s receivables of Rs.
866 crores and the take over of debt of Rs. 1050 crores. The Commission on reviewing
the FRP commented that many of the assumptions made in the approved FRP had gone
haywire in the initial years itself and KPTCL had already incurred revenue shortfalls
which meant that they needed more subsidy than planned for as part of the FRP. GOK
has proposed a revised FRP which is yet to be finalized.
2003-04:
During this year an important order passed was relating to the Tanir Bavi project which
was one of the earlier large scale private generation projects. In 2003-04, arbitral award
8
was passed in favour of TBPCL which amounted to Rs. 453 Crores for two years –
FY02-FY04. In response the Commission turned down this order partly to protect
consumers interest. Following this decision by the Commission KPTCL/ESCOMS
appealed in the High Court as a result of which the case had to be further deliberated by
the Commission. The Commission decided that it was unfair to pass on the additional
fixed charges ($ 0.04/kwh) burden onto consumers and hence on 20th
April, 2006
concluded the same.
In 2003-04, the Special Incentive scheme for HT consumers was reintroduced where they
paid Rs. 3.80/unit for units consumed above their normal consumption. In the same year
123 NCE Power purchase agreements were received of which 87 were approved by the
Commission. If the 123 projects were approved they would result in 427.87 MW
additional capacity.
2004-05:
During this year one of the important developments was the Determination of Tariff for
Renewable energy sources, which finally was approved in 2005-06. Most of the issues
discussed in the earlier order have been incorporated in the final order. During FY05
Commission received for review PPA’s of 99 NCE projects which if approved would add
an additional 507.49 MW.
During the same year they began considering issues of System charges for use of T&D
system and cross-subsidy surcharge. According to KERC (Terms and Conditions of Open
Access), Regulations 2004 , phase-1 of Open Access comes into effect on 10.6.05 under
which HT consumers with a contracted demand of 15 MW and above with a voltage of
66 KV and above are eligible for open access. Commission has issued a draft discussion
paper on transmission charges, wheeling charges and cross-subsidy surcharge in FY05
which was open to comments from stakeholders. In the matter of cross-subsidy surcharge
the Forum of Indian Regulators had constituted a group to study this issue and it was
suggested that Avoided cost method be used in computation of cross subsidy. However,
Commission felt differently and suggested Cost of Service methodology to calculate
cross subsidy surcharge.
ESCOMs responded by saying that cost of service data was difficult to ascertain and so
average cost of service would be better for calculating the surcharge. The Commission
has accepted this suggestion put forth by KPTCL/ESCOMs though it may result in loss of
revenue for the present. An order to this effect was passed by KERC on 9.6.05.
During the same year there was also further discussion on Multi Year Tariff. In April
2003 Commission had floated a discussion paper on MYT and invited comments; which
were received from experts. Similarly there was a proposal by GoK to amend the KER
Act in relation to the MYT Act. These proposals were reviewed by KERC and comments
were sent to GoK. However, the details were to be deliberated.

9
During the same year comments were sent by KERC in response to the draft versions of
the National Electricity Plan and National Tariff Policy issued by GOI.
2005-06:
As per regulations MYT should come into effect from 1.4.07 with the first control period
for 3 years. In the case of transmission and distribution tariff need to be decided at the
beginning of the 3 years period and the same should be reflected annually in their
respective ERC’s. First filing of ERC under MYT framework should have been done in
November 2006.
There is also a growing realization of the potential in Captive Power generation. In light
of which a discussion paper ‘Harnessing captive power generation’ was floated in April
2006 inviting comments from stakeholders. The Commission came out with the final
order on 27.2.07. The detailed order is available on the KERC website.
As for retail competition, KERC had prepared a discussion paper on retail competition in
electricity sector during 2005 and asked for comments. There is a suggestion to separate
the distribution wire business and retail supply business to enable competition. In this
respect, Commission has sent a letter to MOP dated January 3, 2007 to further examine
the matter and to amend the EAct to bring about competition in retail supply.
For FY06 Commission received 62 PPA’s which if approved would an additional 204.05
MW to the grid.
Consumer Issues:
With the establishment of KERC, the Office of Consumer Advocacy (OCA) was
setup to protect consumer interests. OCA is headed by a consultant Mr.
Y.G.Muralidharan. There is also a Grievance Redressal Officer and the list of
complaints are easily available on the KERC website.
The OCA has been active in publishing newsletters and pamphlets on different
aspects of the power sector which is very useful to consumers and groups alike. Some
of these documents are Review of Standards of Performance for various ESCOMS,
Consumer Guide to Electricity Terms and Consumer Survey Report. Under Mr.
Muralidharan’s guidance Electricity Consumers Network (ECON) was started which
complements OCA’s work. The Ombudsman at KERC is Mr. Shaikh Ahmed since
May 17, 2006. Cases before the Ombudsman are listed on the KERC website. One of
the more relevant studies published in September 2002 was by ECON. It was a
Consumer Survey report with the focus on rural customers though urban customers
are part of the survey too. Areas covered by the questionnaire were: service related
matters, quality of power supply, billing related issues, meter related issues and
general awareness. Some of the findings suggested that consumers did not feel that
quality of service has improved after the formation of ESCOMs. Similarly, many felt
that privatization was welcome and they were aware of the KERC.
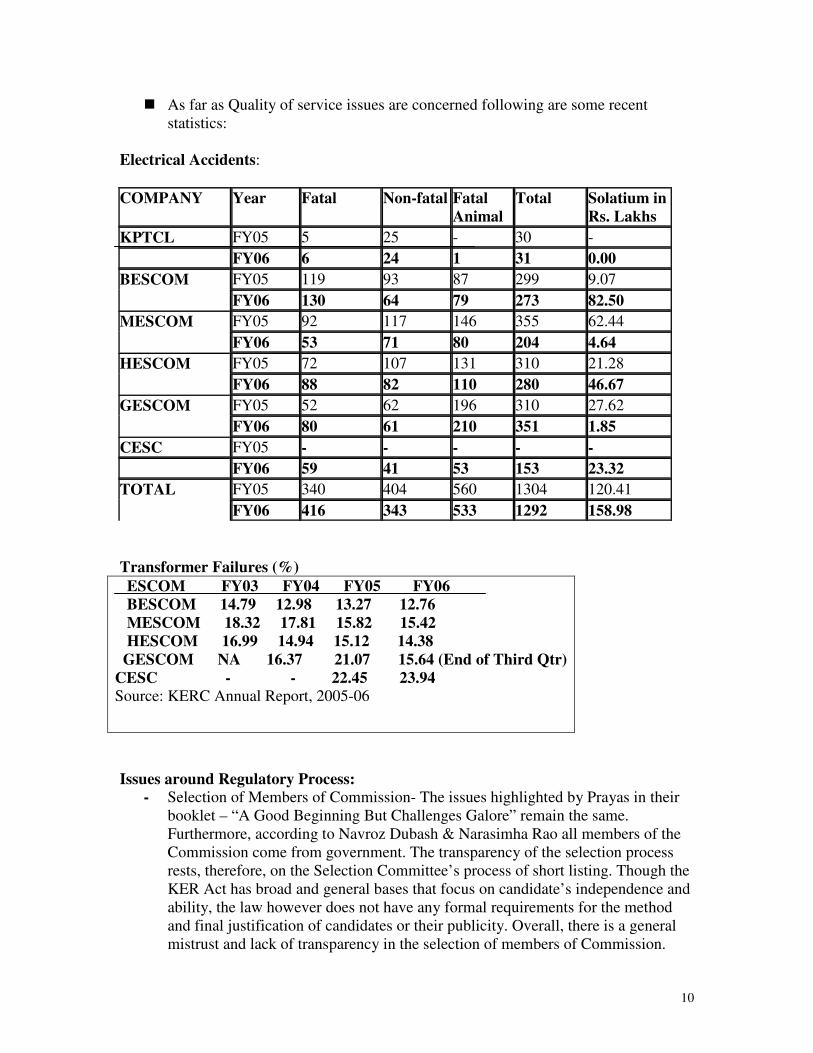
10
� As far as Quality of service issues are concerned following are some recent
statistics:
Electrical Accidents:
COMPANY Year Fatal Non-fatal Fatal
Animal
Total Solatium in
Rs. Lakhs
KPTCL FY05 5 25 - 30 -
FY06 6 24 1 31 0.00
FY05 119 93 87 299 9.07 BESCOM
FY06 130 64 79 273 82.50
FY05 92 117 146 355 62.44 MESCOM
FY06 53 71 80 204 4.64
FY05 72 107 131 310 21.28 HESCOM
FY06 88 82 110 280 46.67
FY05 52 62 196 310 27.62 GESCOM
FY06 80 61 210 351 1.85
CESC FY05 - - - - -
FY06 59 41 53 153 23.32
FY05 340 404 560 1304 120.41 TOTAL
FY06 416 343 533 1292 158.98
Transformer Failures (%)
ESCOM FY03 FY04 FY05 FY06
BESCOM 14.79 12.98 13.27 12.76
MESCOM 18.32 17.81 15.82 15.42
HESCOM 16.99 14.94 15.12 14.38
GESCOM NA 16.37 21.07 15.64 (End of Third Qtr)
CESC - - 22.45 23.94
Source: KERC Annual Report, 2005-06
Issues around Regulatory Process:
- Selection of Members of Commission- The issues highlighted by Prayas in their
booklet – “A Good Beginning But Challenges Galore” remain the same.
Furthermore, according to Navroz Dubash & Narasimha Rao all members of the
Commission come from government. The transparency of the selection process
rests, therefore, on the Selection Committee’s process of short listing. Though the
KER Act has broad and general bases that focus on candidate’s independence and
ability, the law however does not have any formal requirements for the method
and final justification of candidates or their publicity. Overall, there is a general
mistrust and lack of transparency in the selection of members of Commission.

11
- At the same time it is fairly evident that transparency and self reliance are the two
hallmarks of KERC. Their Annual Reports are open to public scrutiny and their
website is regularly updated. KERC is perhaps the only regulator in India to have
set up an Office of Consumer Advocacy and is also famously known for using
very few external consultants. Currently as per their website they have hired three
consultants.
- However, based on hearings attended and other sources there is feeling that the
Commission has already made up its mind on some crucial issues such as MYT,
Differential tariff irrespective of the comments received. Moreover the format of
public hearings does not allow for any interaction between the consumer
representatives, utilities and others. According to Dubash & Rao except for
Tannir Bavi and the proposed capital investment program of KPTCL (FY07) of
Rs 2700 crores, KERC as an institution has not been very proactive on other
issues.
- However, it must be said that consumer participation has been increasing over the
years. If we take the ERC process by itself we find that in 2000, 244 petitions
were filed followed by 9312 in 2002 and recently in 2006 it had reached 11,748.
How many of these petitions raise relevant issues and create an impact on the
regulatory process are difficult to judge. In Bangalore it is commonly known that
individuals/groups well versed with the ERC file petitions and subsequently
copies of the same are distributed among resident associations which submit these
copies as their own to KERC.
Energy Efficiency and Renewable Energy:
Energy Conservation Act, 2001 was passed to address issues of energy efficiency and
management. As part of this Act the Bureau of Energy Efficiency (BEE) was instituted.
BEE took over the responsibilities of the Energy Management Centre. As part of the
ECA, 2001 there is an Appellate Tribunal for Energy Conservation.
As far as energy efficiency is concerned USAID and ECO project was launched to
commercialize energy efficient technologies and services in India. In September 2004
energy efficient lighting was launched in BESCOM urban district covering 1.68 million
customers. There is a minimum of 12 months warranty on CFL’s and facility to pay in
installments through BESCOM billing system. There is a full-time DSM cell at
BESCOM to administer this program.
- OTHER SCHEMES: Solar Water Heaters
As for renewable energy the tariff order was passed on 18th
January, 2005. As part of this
order the issues around tariff determination have been explained and approved tariffs
have been mentioned.
� Mini-Hydel: Rs. 2.80/unit
� Wind: Rs.3.40/unit
� Co-Generation: Rs. 2.80/unit
� Biomass: Rs.2.85/unit
12
The above tariffs are for the first 10 years (from the date of operation) of the project.
However, for Co-generation and biomass the tariff is applicable for the first year beyond
which there is a 2% escalation till the tenth year. After the tenth year the tariffs may be
revised to account for change in costs.
Role of State Government:
According to Navroz Dubash and Narasimha Rao, government control of utilities
remained strong due to structural aspects of state-owned utilities and their operating
relationship with government, with fair overlap in oversight with KERC. The
Government’s proposed privatization structure and the lack of proactive efforts to orient
the incumbent government agencies and utilities to the KERC sent mixed signals on the
importance government placed in KERC. Taken together, a combination of symbolic and
actual infringements on KERC’s powers at the outset weakened KERC’s legitimacy and
alienated them from the rest of the sector. The first Chairperson’s perception of his tenure
sums up this impact: “the regulatory system is an unwanted child”.
Rural Electrification/ Special Issues:
As per 2001 Census, total number of rural households in the state is 6.67 million and
households electrified are 4.81 million which constitutes 72.16% of electrified rural
households. However, as per the presentation by MOP in October 2005 revealed that
Karnataka is one of the few states with 95% and more village electrification.
As per the earlier definition of village electrification, a village was deemed to be
electrified if the electricity was used in the inhabited locality, within the revenue
boundary of the village, for any purpose whatsoever. The new definition states that basic
infrastructure such as distribution transformer and distribution lines are provided in the
inhabited locality as well as the dalit basti/ hamlet where it exists. (For electrification
through non-conventional energy sources a Distribution Transformer may not be
necessary)
As part of the E Act, 2003 guidelines have been drafted for decentralized distribution
schemes. In 2002 Karnataka began experimenting with the use of the panchayati raj
system to improve revenue realisation in rural areas so that the marketability of the rural
power sector would improve under privatisation. At that time USAID offered to support
the capacity building process of Karnataka’s Gram Panchayat (GPs) by leveraging the
agency’s own experience in South Asia under the effort called “Participatory Rural
Energy Services in Karnataka (PRESK)”.
The programme helped in understanding that rural people are not averse to new
technologies or responsibilities. They only need to be educated in their language and
allowed sufficient time to understand and react. They require friendly approach and an
interactive mode of communication. They do not refuse to pay for the services rendered
to meet their needs as long as the government does not stop them from doing so as they
look for sustainable options.

13
In 2005-06, the Rajiv Gandhi Grameen Vidyutikaran Yojana (RGGVY), a new rural
electrification scheme which was launched by the Government of India has an aim to
provide electricity to all households in villages. Like PRESK, a participatory model of
improved rural electricity services, it is hoped that RGGVY scheme will lead to an
overall benefit of rural electrification in the country. As of September 2005 of the 170
projects sanctioned under this scheme, 17 of them are being implemented in Karnataka.
District wise details of projects under RGGVY scheme (all India) are available on the
MOP website. As per the Hindu, in their article “Move to improve rural power scheme”,
dated 12.3.07 the Power Ministry has now made it mandatory for deployment of
franchisee for management of rural distribution networks. States have been asked to
deploy such franchisees especially in town/cities where AT&C losses are on the higher
side.
~ 0 ~

Status of Power Sector: Kerala
March 2007
Prepared by
C.G. Madhusoohanan & S.P. Ravi
River Research Centre &
Chalakudy Puzha Samrakshana Samithi
2
Status of the Power Sector: Kerala Institutional status: Status of unbundling of the sector State Govt. had managed to extend date of unbundling of the sector until June 2007 from Central Electricity Authority. The State Govt. appointed a three member expert committee to explore ways to keep the KSEB in Public Sector. It is learned that the state is dividing the sector into three public Ltd companies. The unbundling of the sector will be depending upon the expert committee opinion, State and CEA decisions. Privatisation In the generation sector there are a few private investors and independent power producers who produce electricity and sell to the KSEB through power purchase agreements eg. Maniyar & Kuthungal HEPs and Thermal plants like BSES-Kochi, NTPC - Kayamkulam, and KCPL- Kasaragod. Bids are called for a few mini hydel projects in the private sector. Transmission and distribution sector are now totally under the control of KSEB except in Thrissur Municipal Corporation in which Corporation is distributing power in its territory. Electricity Generation The Kerala power system consists of 13 hydel stations, 11 small hydel stations, 2 captive power plants, 2 thermal stations, 3 IPPs, and 1 wind mill (Table. 1, 2). The total installed hydro power capacity in the state is 1878.6 MW which produces about 7174 MU of electricity annually. The total installed capacity of private hydro power projects in the state is 33 MW which produces about 116 MU annually. There are seven augmentation / diversion projects which augment water into the existing projects and enhance the generation capacity. There are two diesel power plants with a total installed capacity of 234.6 MW which can generate 1431 MU of electricity annually. There are three thermal IPPs, in which Kayamkulam is owned by NTPC. The installed capacity of the Kayamkulam Plant is 359.58 MW which can produce 2039 MU annually. The BSES Kochi and KPCL Kasaragod are the two other thermal IPPs with a total installed capacity of 177.44 MW which can produce 1239 MU annually. The fuel used in Kayamkulam and BSES Kochi plants is Naphtha. There is one wind farm located in Kanjikode in Palakkad district which houses 9 wind turbines with a total installed capacity of 2.03 MW which produces about 5 MU annually. The total installed capacity in the state is 2652 MW from which 11,943 MU can be produced annually. Apart from this, there is a fixed allocation from the Centre Generating Station to the state which amounts to an installed capacity of 1182 MW equivalent to 7114 MU annually. The Total installed capacity available to Kerala is 3834.25 MW which can produce 19,057 MU annually. The grid is connected to the Southern Region Transmission System through two 400kV double circuit lines at Madakkathara and Trivandrum
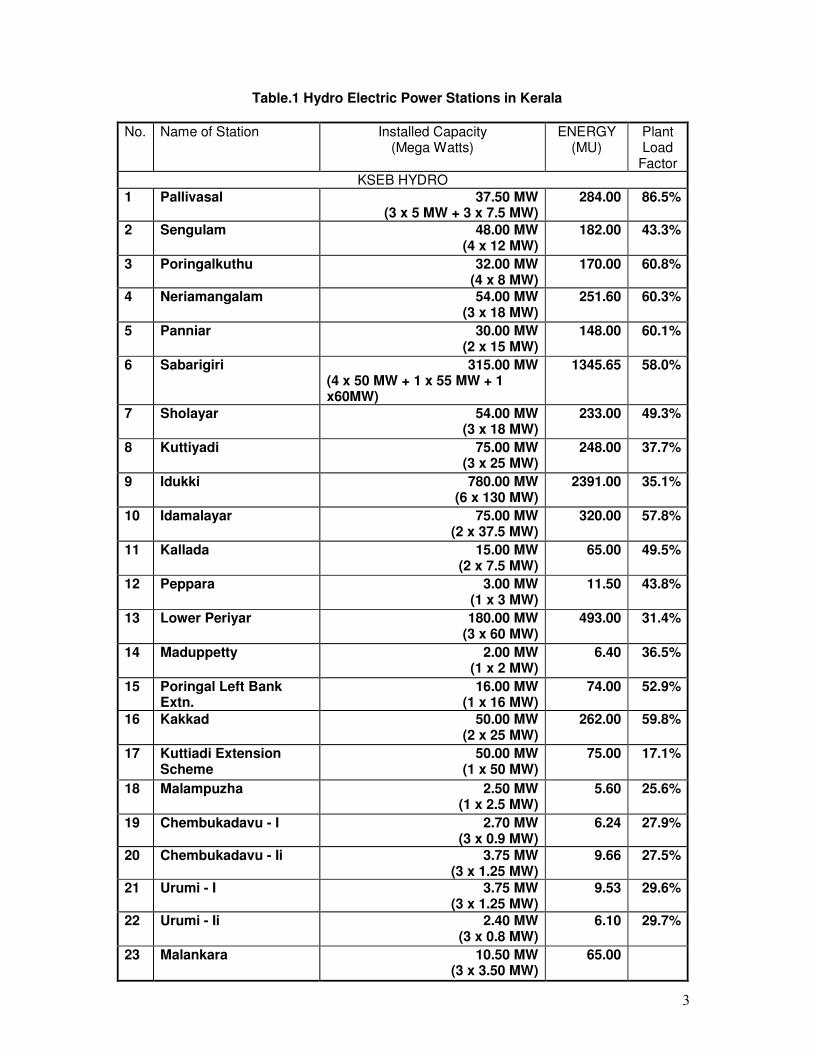
3
Table.1 Hydro Electric Power Stations in Kerala
No. Name of Station Installed Capacity (Mega Watts)
ENERGY (MU)
Plant Load
Factor
KSEB HYDRO
1 Pallivasal 37.50 MW (3 x 5 MW + 3 x 7.5 MW)
284.00 86.5%
2 Sengulam 48.00 MW (4 x 12 MW)
182.00 43.3%
3 Poringalkuthu 32.00 MW (4 x 8 MW)
170.00 60.8%
4 Neriamangalam 54.00 MW (3 x 18 MW)
251.60 60.3%
5 Panniar 30.00 MW (2 x 15 MW)
148.00 60.1%
6 Sabarigiri 315.00 MW (4 x 50 MW + 1 x 55 MW + 1 x60MW)
1345.65 58.0%
7 Sholayar 54.00 MW (3 x 18 MW)
233.00 49.3%
8 Kuttiyadi 75.00 MW (3 x 25 MW)
248.00 37.7%
9 Idukki 780.00 MW (6 x 130 MW)
2391.00 35.1%
10 Idamalayar 75.00 MW (2 x 37.5 MW)
320.00 57.8%
11 Kallada 15.00 MW (2 x 7.5 MW)
65.00 49.5%
12 Peppara 3.00 MW (1 x 3 MW)
11.50 43.8%
13 Lower Periyar 180.00 MW (3 x 60 MW)
493.00 31.4%
14 Maduppetty 2.00 MW (1 x 2 MW)
6.40 36.5%
15 Poringal Left Bank Extn.
16.00 MW (1 x 16 MW)
74.00 52.9%
16 Kakkad 50.00 MW (2 x 25 MW)
262.00 59.8%
17 Kuttiadi Extension Scheme
50.00 MW (1 x 50 MW)
75.00 17.1%
18 Malampuzha 2.50 MW (1 x 2.5 MW)
5.60 25.6%
19 Chembukadavu - I 2.70 MW (3 x 0.9 MW)
6.24 27.9%
20 Chembukadavu - Ii 3.75 MW (3 x 1.25 MW)
9.66 27.5%
21 Urumi - I 3.75 MW (3 x 1.25 MW)
9.53 29.6%
22 Urumi - Ii 2.40 MW (3 x 0.8 MW)
6.10 29.7%
23 Malankara 10.50 MW (3 x 3.50 MW)
65.00

4
24 Lower Meenmutty 3.50 MW (2 x 1.50 MW + 1 x 0.50 MW)
3.00
Diversion/Augmentation Schemes
No. Name of scheme Energy
(MU)
1 Vazhikkadavu 24.00
2 Panniar Augmentation
10.00
3 Narakakkanam (To Idukki)
7.00
4 Poringal (To Idamalayar)
60.00
5 Azutha 57.00
6 Vadakkepuzha 12.00
7 Kuttiadi Augmentation
223.00
KSEB Hydro Total 1845.60 MW 7058.28
Captive Hydro Power Plants
1 Maniyar 12.00 MW (3 x 4 MW)
37.00
2 Kuthungal 21.00 MW (3 x 7 MW)
79.00
PRIVATE HYDRO TOTAL
33.00 MW 116.00
TOTAL HYDRO
1878.60 MW
7174.28
KSEB has proposed to add about 608 MW of new hydel capacity during the 11th plan period. A large number of hydel projects with an anticipated capacity of (about 950 MW) were also identified for 12th plan period and they are in the stages of detailed investigation and preparation of Detailed Project Report (DPR).

5
Table 2. Thermal Power stations in Kerala
KSEB Thermal
Brahmapuram DPP 106.60 MW
(5 x 21.32 MW) 535.00 MU
KDPP, Kozhikode 128.00 MW
(8 x 16 MW) 896.00 MU
KSEB Thermal Total 234.60 MW 1431.00 MU
CENTRAL PUBLIC SECTOR-THERMAL
Kayamkulam (N.T.P.C.) * 359.58 MW
(2 x 116.60 MW + 1 x 126.60 MW)
2094.00 MU
THERMAL- IPP’s
B.S.E.S. Kerala Power Limited, Kochi
157.00 MW (3 x 40.5 MW + 1 x 35.5 MW)
1099.00 MU
KPCL, Kasaragod 20.44 MW 140.00 MU
IPP Thermal Total 177.44 MW 1239.00 MU
Thermal Total 771.62 MW 4764.00 MU
WIND ENERGY (KSEB)
Wind Farm, Kanjikode 2.03 MW
(9 x 0.225 MW)
5.00 MU
Grand Total 2652.24 MW 11,943.28 MU
* 180 MW is allocated to Tamil Nadu NTPC Kayamkulam was conceived as a station entirely dedicated to Kerala. Due to the high price and surplus availability this plant became a financial burden to KSEB. To avoid this to some extent, 180 MW of power from NTPC Kayamkulam is allocated to TNEB and this arrangement shall continue in the next two years or till NTPC- Kayamkulam power station is converted to LNG based station. The variable cost of energy of BSES, NTPC- Kayamkulam and KPCL are very high and hence KSEB has not been scheduling any generation from these stations since June 2005. KSEB stopped availing power from these stations during 2006-07 except in the event of contingencies. Even though KSEB is not availing power, the Board has to pay the fixed charges agreed to these IPPs. Presently, KSEB is not scheduling generation also from BDPP and KDPP except under exigencies. But in order to meet the peak load requirement and to increase the system reliability, KSEB has been scheduling about 40 MW from BDPP and about 60 MW from KDPP during peak hours. KSEB proposes to generate 43.80 MU from BDPP and 65.70 MU from KDPP during 2006-07. If the variable cost of generation from BSES and NTPC Kayamkulam are continued to be as high as of now, KSEB would be constrained to stop availing power from these stations during 2006-07 too except in the event of contingencies. Allocations from Central Generating Stations to KSEB

6
Table.3 Allocation to KSEB from CGS with effect from 1-11-2005
No. Name of the Power Plant
Total installed Capacity
(MW)
Firm Allocation
Allocation including
unallocated share
Allocated Capacity to KSEB
(MW)
Allocation in MU
excluding external losses
1 TALCHER - II 2000 23.00% 23.00% 460 2838
2 NLCII - Stage I 630 10.00% 11.63% 73 427.9
3 NTPC (RSPTS) 2100 11.70% 14.74% 310 1910
4 NTPC- RSTPS- NEW
500 12.20% 15.77% 79 486.4
5 NLC – Expansion 420 14.00% 18.53% 78 454.6
6 NLCII - Stage II 840 10.70% 12.32% 103 604.4
7 MAPS 340 5.30% 6.27% 21 64.7
8 KAIGA 440 8.60% 13.12% 58 328.4
9 Eastern region (Un allocated portion) 0
Total 7270 1182 7114
In addition to the existing CGS, the ongoing nuclear stations Kaiga Stage-II (Allocation to KSEB - 57.7MW) and Kudamkulam (Allocation to KSEB-160 MW) Nuclear stations are expected to start commercial operation during 2007-08.
Table.4 Total Annual Electricity Availability in Kerala
No Stations Installed Capacity Available (MW)
Annual Generation
(MU)
1 Hydel stations 1878.60 7174.0
2 Own Thermal Stations 234.60 1431.0
3 Independent Power Producers
537.02 3333.0
4 Central Generating Stations 1182.00 7114.0
5 Wind Energy 2.03 5.0
Total 3834.25 19057.0
Electricity Consumption The Domestic consumers accounts for 79% of the total number of consumers and consumes 45.5% of the total consumption. There are only 2004 HT & EHT consumers amounts to 0.03%, who consumes 32% electricity sold by the Board. Thus, the Domestic consumers, though constitute the largest group and avail power at low voltage, consume about 46% of the total energy, contribute to greater loss of electricity and peak hour demand to the electricity system and account for only 25% of the total revenue of the Board. The HT & EHT consumers consuming 32% of the electricity account for 39% of the revenue. The growth of consumption in the Industrial sector is meager in the State. LT industries segment consumes 8.5% of total consumption and accounts for 11% of the revenue. LT commercial sector is the major contributor to the revenue with respect to its consumption. LT commercial amounts to 15 % of the total number of consumers and consumes about 11% of the total electricity sold in the State accounts for 23% of the revenue. The category wise electricity consumption in the State over the years is given in Table 5. Electricity consumption for Agricultural purposes
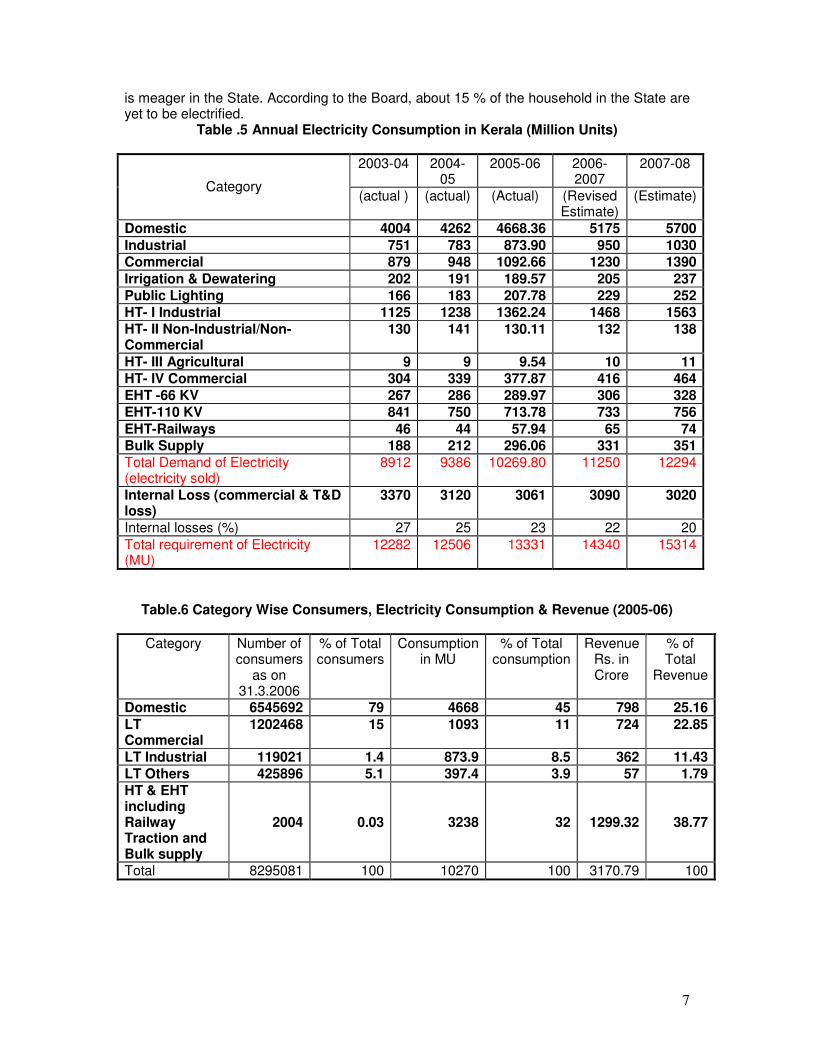
7
is meager in the State. According to the Board, about 15 % of the household in the State are yet to be electrified.
Table .5 Annual Electricity Consumption in Kerala (Million Units)
2003-04 2004-05
2005-06 2006-2007
2007-08
Category (actual ) (actual) (Actual) (Revised
Estimate) (Estimate)
Domestic 4004 4262 4668.36 5175 5700
Industrial 751 783 873.90 950 1030
Commercial 879 948 1092.66 1230 1390
Irrigation & Dewatering 202 191 189.57 205 237
Public Lighting 166 183 207.78 229 252
HT- I Industrial 1125 1238 1362.24 1468 1563
HT- II Non-Industrial/Non-Commercial
130 141 130.11 132 138
HT- III Agricultural 9 9 9.54 10 11
HT- IV Commercial 304 339 377.87 416 464
EHT -66 KV 267 286 289.97 306 328
EHT-110 KV 841 750 713.78 733 756
EHT-Railways 46 44 57.94 65 74
Bulk Supply 188 212 296.06 331 351
Total Demand of Electricity (electricity sold)
8912 9386 10269.80 11250 12294
Internal Loss (commercial & T&D loss)
3370 3120 3061 3090 3020
Internal losses (%) 27 25 23 22 20
Total requirement of Electricity (MU)
12282 12506 13331 14340 15314
Table.6 Category Wise Consumers, Electricity Consumption & Revenue (2005-06)
Category Number of consumers
as on 31.3.2006
% of Total consumers
Consumption in MU
% of Total consumption
Revenue Rs. in Crore
% of Total
Revenue
Domestic 6545692 79 4668 45 798 25.16
LT Commercial
1202468 15 1093 11 724 22.85
LT Industrial 119021 1.4 873.9 8.5 362 11.43
LT Others 425896 5.1 397.4 3.9 57 1.79
HT & EHT including Railway Traction and Bulk supply
2004 0.03 3238 32 1299.32 38.77
Total 8295081 100 10270 100 3170.79 100

8
Fig.1 Category Wise Electricity Consumption
Domestic
45%
LT Commercial
11%
HT & EHT including
Railway Traction and
Bulk supply
32%
LT Others
4%
LT Industrial
8%
Fig.2 Category Wise Revenue
Domestic
25%
LT Commercial
23%LT Industrial
11%
LT Others
2%
HT & EHT including
Railway Traction and
Bulk supply
39%
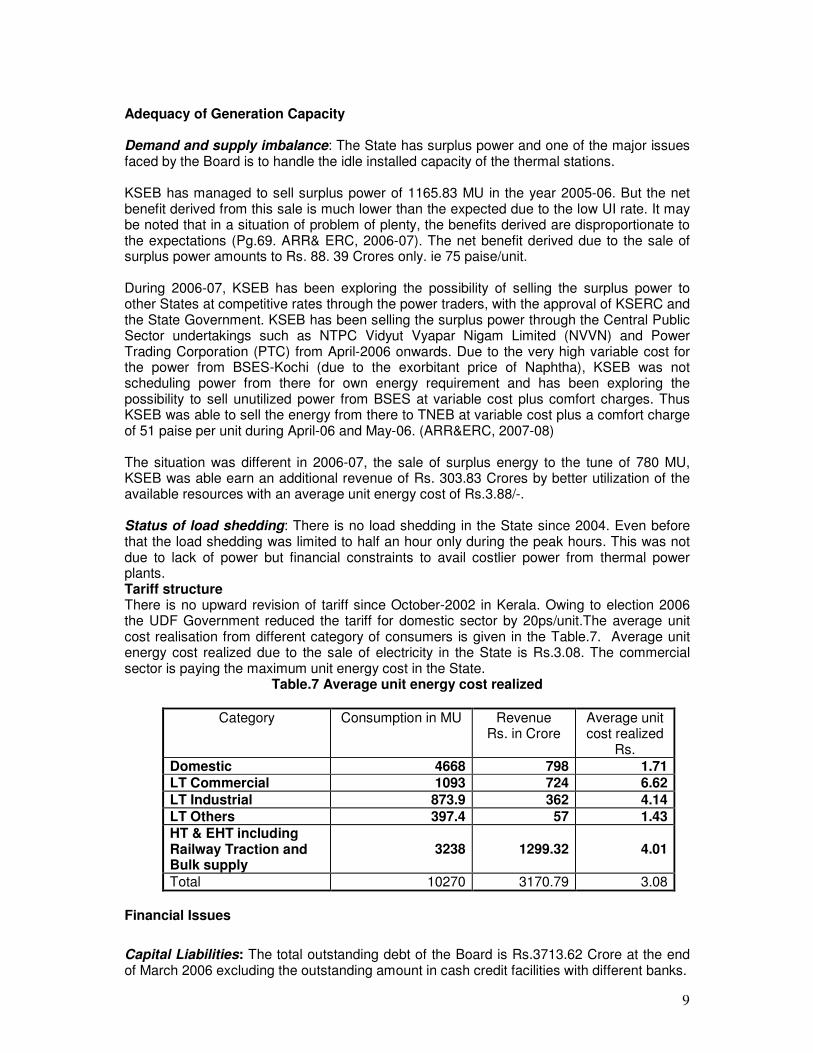
9
Adequacy of Generation Capacity Demand and supply imbalance: The State has surplus power and one of the major issues faced by the Board is to handle the idle installed capacity of the thermal stations. KSEB has managed to sell surplus power of 1165.83 MU in the year 2005-06. But the net benefit derived from this sale is much lower than the expected due to the low UI rate. It may be noted that in a situation of problem of plenty, the benefits derived are disproportionate to the expectations (Pg.69. ARR& ERC, 2006-07). The net benefit derived due to the sale of surplus power amounts to Rs. 88. 39 Crores only. ie 75 paise/unit. During 2006-07, KSEB has been exploring the possibility of selling the surplus power to other States at competitive rates through the power traders, with the approval of KSERC and the State Government. KSEB has been selling the surplus power through the Central Public Sector undertakings such as NTPC Vidyut Vyapar Nigam Limited (NVVN) and Power Trading Corporation (PTC) from April-2006 onwards. Due to the very high variable cost for the power from BSES-Kochi (due to the exorbitant price of Naphtha), KSEB was not scheduling power from there for own energy requirement and has been exploring the possibility to sell unutilized power from BSES at variable cost plus comfort charges. Thus KSEB was able to sell the energy from there to TNEB at variable cost plus a comfort charge of 51 paise per unit during April-06 and May-06. (ARR&ERC, 2007-08) The situation was different in 2006-07, the sale of surplus energy to the tune of 780 MU, KSEB was able earn an additional revenue of Rs. 303.83 Crores by better utilization of the available resources with an average unit energy cost of Rs.3.88/-. Status of load shedding: There is no load shedding in the State since 2004. Even before that the load shedding was limited to half an hour only during the peak hours. This was not due to lack of power but financial constraints to avail costlier power from thermal power plants. Tariff structure There is no upward revision of tariff since October-2002 in Kerala. Owing to election 2006 the UDF Government reduced the tariff for domestic sector by 20ps/unit.The average unit cost realisation from different category of consumers is given in the Table.7. Average unit energy cost realized due to the sale of electricity in the State is Rs.3.08. The commercial sector is paying the maximum unit energy cost in the State.
Table.7 Average unit energy cost realized
Category Consumption in MU Revenue Rs. in Crore
Average unit cost realized
Rs.
Domestic 4668 798 1.71
LT Commercial 1093 724 6.62
LT Industrial 873.9 362 4.14
LT Others 397.4 57 1.43
HT & EHT including Railway Traction and Bulk supply
3238 1299.32 4.01
Total 10270 3170.79 3.08
Financial Issues
Capital Liabilities: The total outstanding debt of the Board is Rs.3713.62 Crore at the end of March 2006 excluding the outstanding amount in cash credit facilities with different banks.
10
Swapping of High Cost Loans: The Board, by taking advantage of the prevailing interest rates in the financial market has swapped the high cost outstanding loans by borrowing fresh loans at low interest rates. So far, KSEB has swapped Rs.1733.40 Crore of loans, saving an interest liability of Rs.241.08 Crore payable during the rest of the repayment period of the loans and an annual savings of Rs.39.54 Crore.
Fixed Charges to IPPs : This is one of the important area of concern related to the financial aspects of the Board. The fixed cost commitment of the three IPPs ie. BSES Kochi (Rs.102 cr.), Kayamkulam (Rs.98.34 Cr.) and KPCL (Rs.16.48 cr.) amounts to Rs. 216. 82 crores annually. Since the State is not availing power from these stations the financial burden due to this stations are intolerable. Key Challenges and Way Forward Transmission and distribution losses The Transmission and Distribution Losses (T&D) of a system can be classified in to two components. (1) Technical Losses and (2) Commercial losses. The technical losses include the inherent losses in the transmission and distribution systems upto the point of supply at the’ premises of consumers. Commercial losses include losses such as theft of power, errors in billing and collection etc other than technical factors. The internal energy loss in the system was 30.76% in 2001- 2002 which is reduced to 23% in 2005-06 (Table.5). As a part of the Commercial T& D loss reduction Board has replaced 24.63 lakh faulty meters between 2002 - Sep.2006. Anti Power Theft Squad inspected about 60,000 premises during 2002- Sep.2006 and assessed electricity theft which amount to Rs.105 crores, of which Rs. 37 crores realized. The Board has not yet assessed the electricity loss due to commercial losses and Technical losses. Without proper assessment of losses and its causes in any section of the T&D system the Board takes haphazard measures to overcome the issue. The consumers are constantly demanding the Board to take up studies to understand the extent of losses and causes for it in each circle and to have a comprehensive plan to tackle the causes and go for target oriented T&D loss reduction for each circle. By stating the no. of new transformers and substations installed each year, length of extended LT & HT lines etc. It is not possible to understand effectiveness of the measures taken by the Board in reducing T&D losses. In the absence of scientific studies the Board is escaping from its responsibilities by stating that T & D loss reduction is unviable and uneconomical in Kerala. It requires huge investment and acquisition of around 68,000 ha. of land for that purpose. Capacity additions and power purchases Capacity addition without proper demand assessments is a major problem in the State. The Board has planned to add more than 2000 MW in the 11th and 12th five year plan without conducting proper need assessment. The liability induced due to this approach is going to be a major problem in the near future. In the case of captive mini hydel plants it is learned that the Board has signed PPAs with the developers on the condition that the Board will purchase the power produced by the developers at the rate of Rs.2.9 per unit for the initial 10 year and Rs.1.50 per unit for the next 15 years. There after the plant will be handed over to KSEB. It should be remembered that the generation from these plants will be confined to the monsoon months when there is no need. Moreover the life of the plants will be about 25

11
to 30 years and there will not much benefit to the KSEB. No public discussions or consultations are initiated by the KSERC before the decision. Important Regulatory Developments Key Regulatory Orders: Important tariff orders: Nil Decisions regarding new power purchases: Public have no access to PPAs and not consulted in this matter. Implementation of the requirements of EAct (cross-subsidy surcharge, open-access, and development of captive power): As per news paper reports a few captive power plants are initiated for implementation. Consumer Issues: Formation of consumer grievance redressal forums and ombudsmen; quality of service. The consumer grievance redressal forum and ombudsmen are in place. The effectiveness of the consumer grievance redressal forum is yet to be assessed. Issues Regarding Regulatory Process, Selection of regulators; staffing issues; transparency, accountability, and public participation (TAP); public hearings. Less transparent, the commission is less interested in making the demanded data available to the consumers. Public actively participates in the hearings, The effectiveness of the commission is questioned in the hearings. Energy Efficiency and Renewables Energy Efficiency and Demand-Side Management Programs Public constantly demands in the public hearings to the Board to implement energy conservation and demand side management along with peak load reduction measures. But the Board is taking no creative steps to implement the same. Renewable Energy: Tariffs for renewable energy; implementation and development of renewable energy technologies There is less emphasis and interest in the part of the KSEB to develop renewable energy technologies Role of State Government Government-Regulator Relationship: Supportive or adversarial Not much evident Special Issues Status of Key Policy Initiatives Rajiv Gandhi Grameen Vidyutikaran Yojana Under Rajiv Gandhi Grameen Vidyuthikaran Yojana (RGGVY) Scheme covered in the seven districts of Idukki, Palakkad, Malappuram, Kozhikode, Wayanad, Kannur and Kasargod, about 2440 Nos distribution transformers, 2653.7 kms of 11 kV lines, 895.4km of LT single phase lines, 209.1km of LT three phase lines are targeted for implementation. Also, under these schemes, 61094 Nos. of BPL connections and 52567 Nos. of APL connections are targeted during 2007-08.
12
Franchisees - Not initiated References 1. http:// www.kseboard.com (date 19/03/2007) 2. Anonymous. 2005. Aggregate Revenue Requirement & Expected Revenue from Charges
for 2006-07, Kerala State Electricity Board 3. Anonymous. 2006. Aggregate Revenue Requirement & Expected Revenue from Charges
for 2007-08, Kerala State Electricity Board 4. Ravi S.P. & C.G. Madhusoodhanan.2003. Response on the Petition for Approval of
Aggregate Revenue Requirement for the year 2003-2004.submitted to Hon. Kerala State Electricity Regulatory Commission.
5. Ravi S.P. & C.G. Madhusoodhanan.2004. Response on the Petition for Approval of
Aggregate Revenue Requirement for the year 2004-2005.submitted to Hon. Kerala State Electricity Regulatory Commission
6. Madhusoodhanan C.G.2007. Response on the Petition for Approval of Aggregate
Revenue Requirement for the year 2007-2008.submitted to Hon. Kerala State Electricity Regulatory Commission

Update on Maharashtra’s Power Sector
Prepared for the workshop on **, Pune
Organized by Prayas Energy Group
22-23 March 2007
Nikit Abhyankar
Prayas Energy Group
1. Overview
Maharashtra State Electricity Board (MSEB) was established in 1961. It soon acquired
(after expiry of licenses) many small private power companies in the state. Since then,
MSEB has monopoly over the generation, transmission, and distribution of electricity in
the state (except the Mumbai metropolitan region). In June 2005, in accordance with the
Electricity Act 2003, MSEB was unbundled into four state-owned companies viz.
o MSEB Holding Company
o Maharashtra State Power Generation Company Ltd (MSPGCL)
o Maharashtra State Electricity Transmission Company Ltd (MSETCL)
which is also the State Transmission Utility (STU) and
o Maharashtra State Electricity Distribution Company Ltd (MSEDCL)
Mumbai is served by three utilities, viz., Bombay Electricity Supply and Transport
(BEST), Reliance Energy Ltd (REL), and Tata Power Company (TPC). BEST is Mumbai
Municipal Corporation’s undertaking and has a license to distribute power to a part of the
city of Mumbai. REL has taken over BSES in 2004 and distributes power to suburban
area of Mumbai and also owns and operates a 500 MW coal thermal power plant at
Dahanu. TPC supplies bulk power to BEST and REL from its 1774 MW power plants
(coal, hydro, oil and gas). TPC also purchases power from MSEDCL/traders/other
sources to supplement its own generation for meeting Mumbai's demand. Mula Pravara
Electric Co-operative Society is the only co-operative electricity distribution utility in the
state. Mula Pravara serves nearly 200 villages in Ahmadnagar district. Thus, it can be
seen that Maharashtra has a mix of different patterns of utility ownership since four
decades. The following table indicates these salient features of Maharashtra’s power
sector.
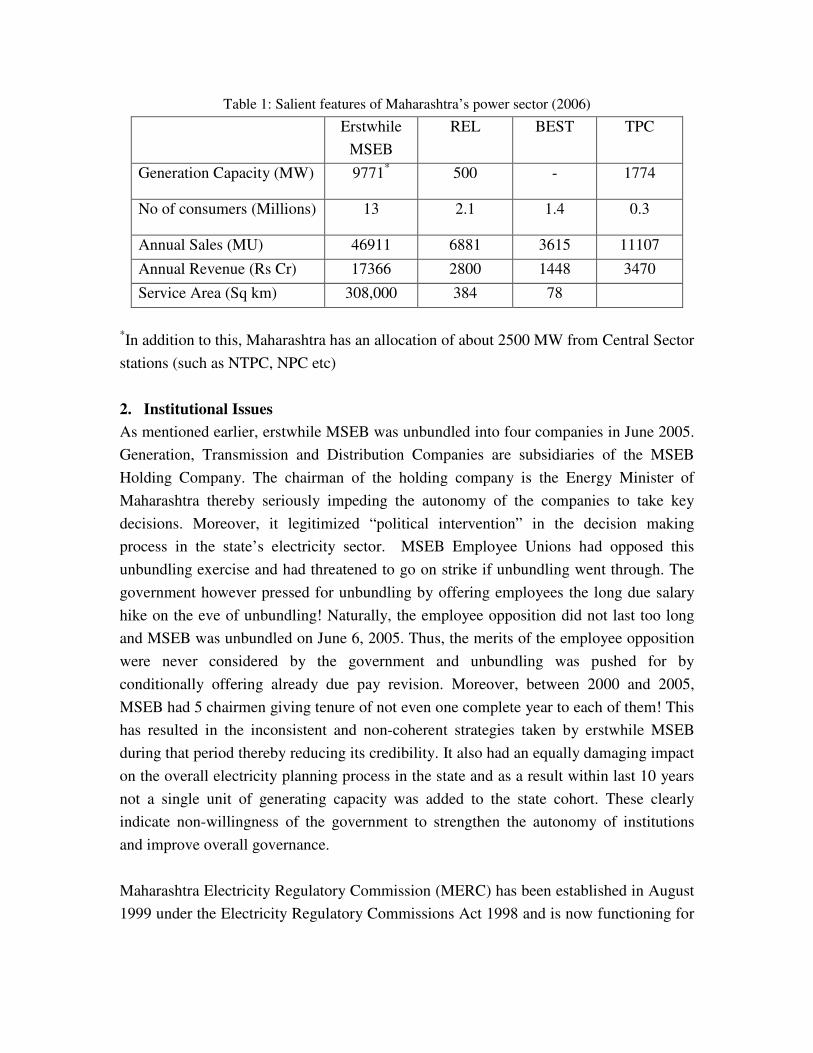
Table 1: Salient features of Maharashtra’s power sector (2006)
Erstwhile
MSEB
REL BEST TPC
Generation Capacity (MW) 9771* 500 - 1774
No of consumers (Millions) 13 2.1 1.4 0.3
Annual Sales (MU) 46911 6881 3615 11107
Annual Revenue (Rs Cr) 17366 2800 1448 3470
Service Area (Sq km) 308,000 384 78
*In addition to this, Maharashtra has an allocation of about 2500 MW from Central Sector
stations (such as NTPC, NPC etc)
2. Institutional Issues
As mentioned earlier, erstwhile MSEB was unbundled into four companies in June 2005.
Generation, Transmission and Distribution Companies are subsidiaries of the MSEB
Holding Company. The chairman of the holding company is the Energy Minister of
Maharashtra thereby seriously impeding the autonomy of the companies to take key
decisions. Moreover, it legitimized “political intervention” in the decision making
process in the state’s electricity sector. MSEB Employee Unions had opposed this
unbundling exercise and had threatened to go on strike if unbundling went through. The
government however pressed for unbundling by offering employees the long due salary
hike on the eve of unbundling! Naturally, the employee opposition did not last too long
and MSEB was unbundled on June 6, 2005. Thus, the merits of the employee opposition
were never considered by the government and unbundling was pushed for by
conditionally offering already due pay revision. Moreover, between 2000 and 2005,
MSEB had 5 chairmen giving tenure of not even one complete year to each of them! This
has resulted in the inconsistent and non-coherent strategies taken by erstwhile MSEB
during that period thereby reducing its credibility. It also had an equally damaging impact
on the overall electricity planning process in the state and as a result within last 10 years
not a single unit of generating capacity was added to the state cohort. These clearly
indicate non-willingness of the government to strengthen the autonomy of institutions
and improve overall governance.
Maharashtra Electricity Regulatory Commission (MERC) has been established in August
1999 under the Electricity Regulatory Commissions Act 1998 and is now functioning for
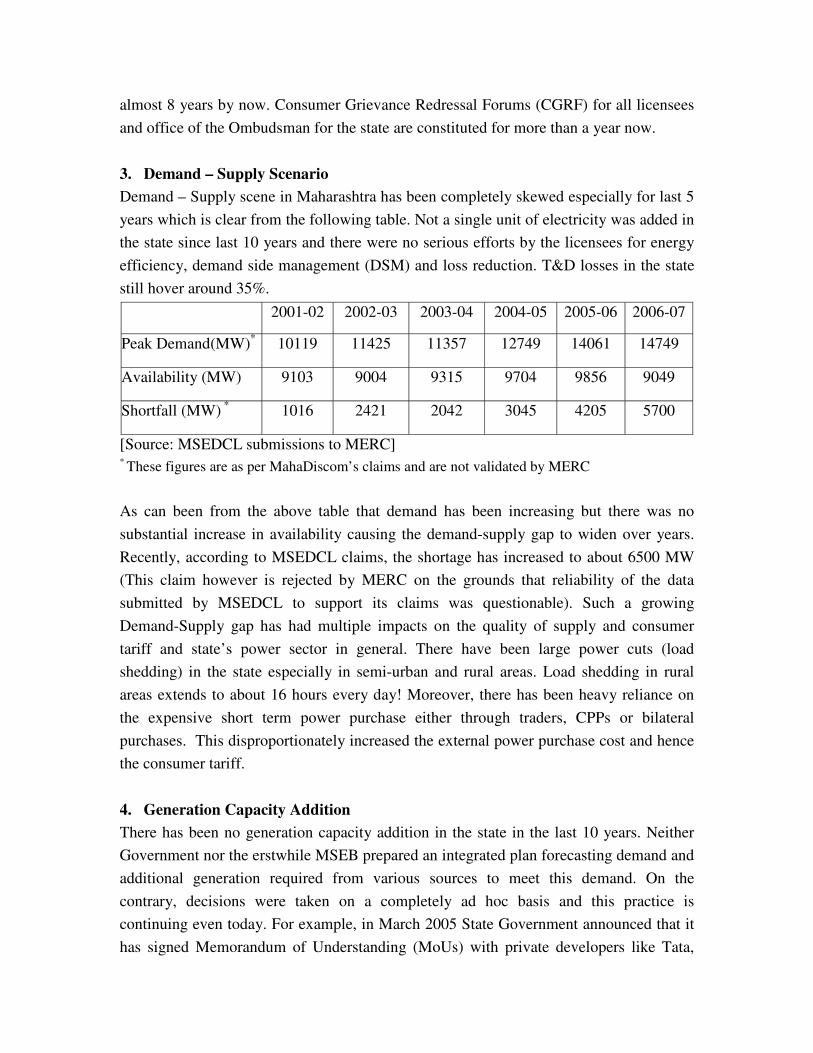
almost 8 years by now. Consumer Grievance Redressal Forums (CGRF) for all licensees
and office of the Ombudsman for the state are constituted for more than a year now.
3. Demand – Supply Scenario
Demand – Supply scene in Maharashtra has been completely skewed especially for last 5
years which is clear from the following table. Not a single unit of electricity was added in
the state since last 10 years and there were no serious efforts by the licensees for energy
efficiency, demand side management (DSM) and loss reduction. T&D losses in the state
still hover around 35%.
2001-02 2002-03 2003-04 2004-05 2005-06 2006-07
Peak Demand(MW)* 10119 11425 11357 12749 14061 14749
Availability (MW) 9103 9004 9315 9704 9856 9049
Shortfall (MW) *
1016 2421 2042 3045 4205 5700
[Source: MSEDCL submissions to MERC] * These figures are as per MahaDiscom’s claims and are not validated by MERC
As can been from the above table that demand has been increasing but there was no
substantial increase in availability causing the demand-supply gap to widen over years.
Recently, according to MSEDCL claims, the shortage has increased to about 6500 MW
(This claim however is rejected by MERC on the grounds that reliability of the data
submitted by MSEDCL to support its claims was questionable). Such a growing
Demand-Supply gap has had multiple impacts on the quality of supply and consumer
tariff and state’s power sector in general. There have been large power cuts (load
shedding) in the state especially in semi-urban and rural areas. Load shedding in rural
areas extends to about 16 hours every day! Moreover, there has been heavy reliance on
the expensive short term power purchase either through traders, CPPs or bilateral
purchases. This disproportionately increased the external power purchase cost and hence
the consumer tariff.
4. Generation Capacity Addition
There has been no generation capacity addition in the state in the last 10 years. Neither
Government nor the erstwhile MSEB prepared an integrated plan forecasting demand and
additional generation required from various sources to meet this demand. On the
contrary, decisions were taken on a completely ad hoc basis and this practice is
continuing even today. For example, in March 2005 State Government announced that it
has signed Memorandum of Understanding (MoUs) with private developers like Tata,
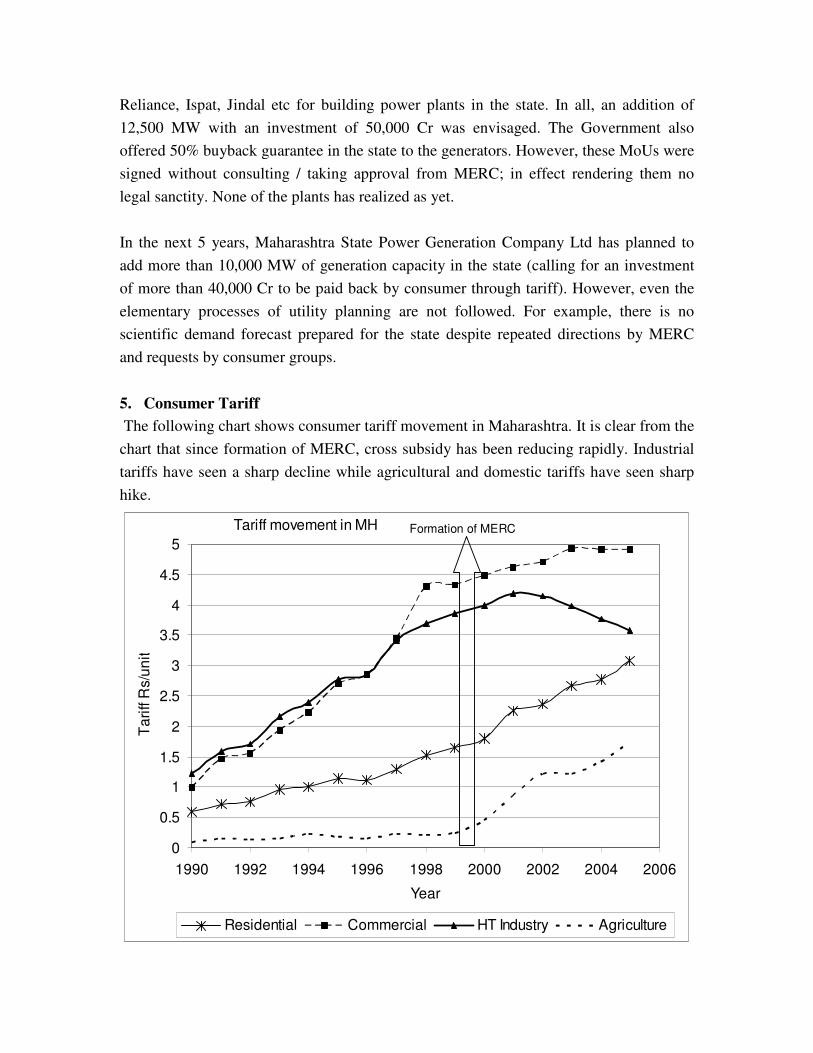
Reliance, Ispat, Jindal etc for building power plants in the state. In all, an addition of
12,500 MW with an investment of 50,000 Cr was envisaged. The Government also
offered 50% buyback guarantee in the state to the generators. However, these MoUs were
signed without consulting / taking approval from MERC; in effect rendering them no
legal sanctity. None of the plants has realized as yet.
In the next 5 years, Maharashtra State Power Generation Company Ltd has planned to
add more than 10,000 MW of generation capacity in the state (calling for an investment
of more than 40,000 Cr to be paid back by consumer through tariff). However, even the
elementary processes of utility planning are not followed. For example, there is no
scientific demand forecast prepared for the state despite repeated directions by MERC
and requests by consumer groups.
5. Consumer Tariff
The following chart shows consumer tariff movement in Maharashtra. It is clear from the
chart that since formation of MERC, cross subsidy has been reducing rapidly. Industrial
tariffs have seen a sharp decline while agricultural and domestic tariffs have seen sharp
hike.
Tariff movement in MH
0
0.5
1
1.5
2
2.5
3
3.5
4
4.5
5
1990 1992 1994 1996 1998 2000 2002 2004 2006
Year
Ta
riff R
s/u
nit
Residential Commercial HT Industry Agriculture
Formation of MERC

At present, all consumer categories in Maharashtra (except agriculture) have tariffs in the
band of ±20% of average cost of supply (as mandated by the National Tariff Policy to be
completed by 2011). Agricultural consumers are charged at nearly 50% of average cost
of supply.
As far as Tariff Structure is concerned (fixed charge, energy charge etc), MERC has
adopted a different structure in all its tariff orders since 2002. In 2002 tariff order, MERC
introduced an additional charge called “T&D Loss Charge” to be charged on all
consumer categories for the excessive T&D losses. In the 2004 order, “Regulatory
Liability Charge (RLC)” was introduced on all subsidizing categories of erstwhile MSEB
@ 50 p/unit. RLC was as if a loan given to the licensee by consumers for reducing the
excessive T&D loss. RLC was supposed to be returned back to these consumer categories
once the losses come down. In the tariff order for FY 2007, the regulator introduced a
concept of Additional Supply Charge (ASC) which is targeted at recovering the cost of
expensive power purchase that MSEDCL has to do to reduce load shedding of certain
consumer categories. ASC is related to the hours of load shedding in an inverse
proportion i.e. if load shedding is low, then ASC levied would be higher and vice versa.
ASC is applicable to all categories except agricultural and BPL domestic consumers.
ASC for domestic consumers consuming below 300 units per month is quite small.
However, the tariff structure in general is becoming increasingly complicated and
difficult to decipher especially for small consumers. For example, current components of
electricity bills of a typical small domestic consumer are: fixed charge, energy charge,
FAC, FAC2, ASC, Incremental ASC, Electricity Duty, prior arrears/Deposits etc. At
times even the licensees find it difficult to understand the tariff structure correctly which
gives rise to incorrect billing practices. Therefore, there is a need for simplified and
straight forward tariff structure especially for small consumers.
6. Capital Investments
There are huge capital investments planned in the state in the next few years. The
following table indicates capital expenditures planned by different utilities in the state.
MahaDiscom 20,000 Cr in next 3 years
MahaTransco 13,000 Cr in next 3 years
MahaGenco 32,000 Cr in next 5 years
It is apparent from the table that the three companies together are going to invest about
65,000 Cr in the state in the next 3-5 years. This alone translates to an increase in revenue
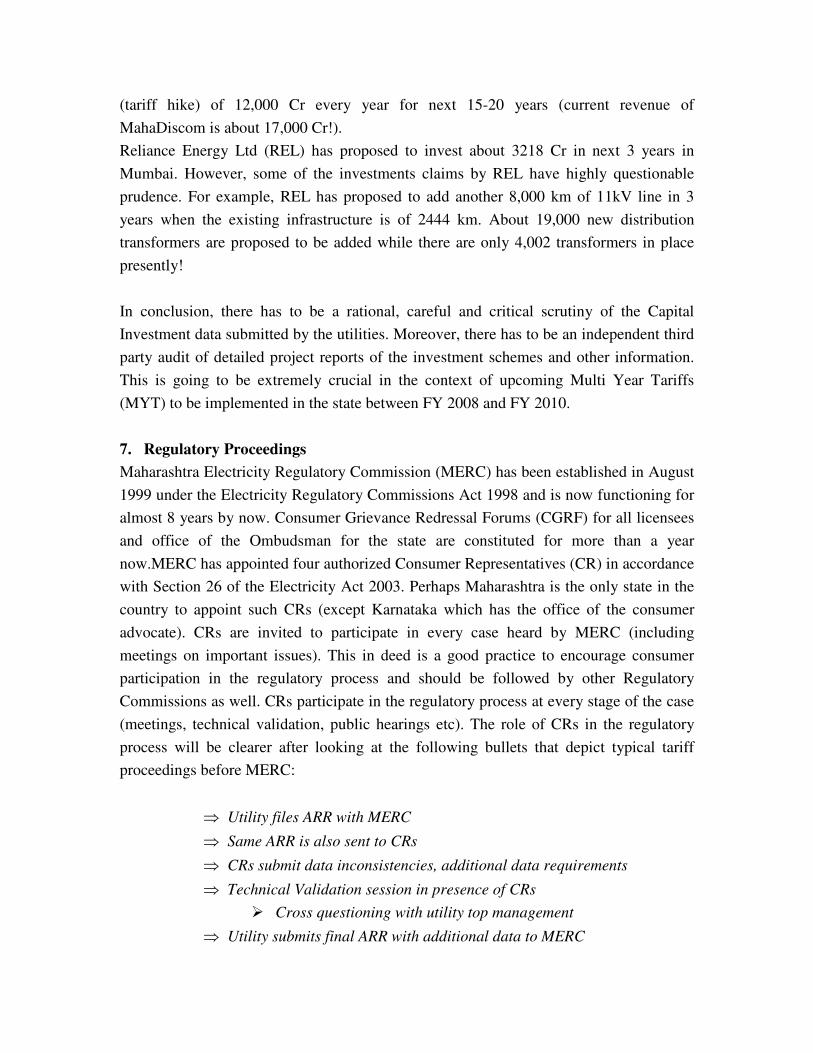
(tariff hike) of 12,000 Cr every year for next 15-20 years (current revenue of
MahaDiscom is about 17,000 Cr!).
Reliance Energy Ltd (REL) has proposed to invest about 3218 Cr in next 3 years in
Mumbai. However, some of the investments claims by REL have highly questionable
prudence. For example, REL has proposed to add another 8,000 km of 11kV line in 3
years when the existing infrastructure is of 2444 km. About 19,000 new distribution
transformers are proposed to be added while there are only 4,002 transformers in place
presently!
In conclusion, there has to be a rational, careful and critical scrutiny of the Capital
Investment data submitted by the utilities. Moreover, there has to be an independent third
party audit of detailed project reports of the investment schemes and other information.
This is going to be extremely crucial in the context of upcoming Multi Year Tariffs
(MYT) to be implemented in the state between FY 2008 and FY 2010.
7. Regulatory Proceedings
Maharashtra Electricity Regulatory Commission (MERC) has been established in August
1999 under the Electricity Regulatory Commissions Act 1998 and is now functioning for
almost 8 years by now. Consumer Grievance Redressal Forums (CGRF) for all licensees
and office of the Ombudsman for the state are constituted for more than a year
now.MERC has appointed four authorized Consumer Representatives (CR) in accordance
with Section 26 of the Electricity Act 2003. Perhaps Maharashtra is the only state in the
country to appoint such CRs (except Karnataka which has the office of the consumer
advocate). CRs are invited to participate in every case heard by MERC (including
meetings on important issues). This in deed is a good practice to encourage consumer
participation in the regulatory process and should be followed by other Regulatory
Commissions as well. CRs participate in the regulatory process at every stage of the case
(meetings, technical validation, public hearings etc). The role of CRs in the regulatory
process will be clearer after looking at the following bullets that depict typical tariff
proceedings before MERC:
⇒ Utility files ARR with MERC
⇒ Same ARR is also sent to CRs
⇒ CRs submit data inconsistencies, additional data requirements
⇒ Technical Validation session in presence of CRs
� Cross questioning with utility top management
⇒ Utility submits final ARR with additional data to MERC
⇒ The ARR is made public
� Public Hearing at 6 locations in the state
Though public participation has been very good in number of objections raised, there is a
need for more informed participation with more analytical input and thrust on wider
issues.
Quality of Service related regulations – Supply Code and Standards of Performance
Regulations, are enacted by MERC in January 2005. However, ensuring their
implementation is seriously marred by weak data collection and performance monitoring
systems. It is these systems / processes those need substantial improvement. As already
mentioned, CGRFs and Ombudsman have started functioning in the state and some
CGRFs have proactively taken up consumer issues.
MERC has given two important orders regarding the crucial consumer issue of billing.
One order was passed in the Amendment / Supplementary Bills case where Consumers
received supplementary bills for past period (ranging from 2 years to 8 years) based on
readings of the new meter. MERC however disallowed thus and licensees were directed
to refund about 200 Cr back to consumers. In the other case of Average Billing, MSEB
consumers were receiving Average Bills without a meter reading on a continuous basis
(from a few months to few years). In this case, MSEB was directed to refund about 275
Cr back to consumers. However, utilities appealed against these orders in the Appellate
Tribunal for Electricity (ATE) which overturned the MERC decisions. ATE ruled that
these are basically billing disputes and MERC does not have jurisdiction over such
disputes when other competent forum (CGRF) is already established to look into these
matters. In effect, ATE order implies that every consumer would have to file a separate
complaint with CGRF for incorrect billing! Consumer groups (including Prayas) and
MERC have challenged this ATE order in the Supreme Court where the matter is still
pending.
8. Other Issues
a. Renewable Energy in Maharashtra
MERC has offered promotional tariffs to renewable sources to encourage generation.
For example, wind generators are offered a tariff of Rs 3.5 per unit increasing at 15
paise per unit every year. MERC has also notified the Renewable Portfolio Standards
where aggressive targets are set for Renewable Energy Generation. It is envisaged to
increase from 1700 MUs in 2006 to 6900 MUs in 2010. Moreover, every utility
(including open access consumers) are required to purchase at least 6% of their total
power purchases from renewable sources by 2010.
b. Akshay Prakash Yojana
It is a community initiative of demand management with support from MahaDiscom
staff to tackle with the power shortages. Under this scheme, consumers in the village
decide not to steal electricity and stop all unauthorized usage of electricity such as
heaters. Villagers also decide to not use their agricultural pump sets and other heavy
electrical loads (such as motors etc) in a specified time period (usually of 10-12 hours
per day). In return the village is assured by MahaDiscom of uninterrupted power
supply. Therefore, during the “Akshay Prakash” hours, villagers use only light and
use of the heavy electrical equipments is shifted to non-peak hours. About 4000
villages in Maharashtra have participated in this scheme giving a total load relief of
about 1000 MW. This scheme surely has a great potential to be replicated in other
states.
c. Pune-CII model of zero load shedding
Industries around Pune generate about 100 MW from their diesel generating sets and
not draw this quantum from MahaDiscom grid. This relieves MahaDiscom of 100
MW which is diverted to other consumer categories in Pune which face load
shedding. As the shortage for Pune city is also 100 MW, there is no load shedding in
Pune. Cost of Diesel based generation is very high (about 11.5 Rs per unit).
Consumers in Pune compensate these industries of this cost by paying an extra charge
through tariff. Though it is a welcome initiative showing community participation,
this model raises certain issues of concern as follows:
⇒ It sets a precedent for high cost power purchase.
⇒ It diverts the policy focus from long-term planning to such short term ad
hoc solutions
⇒ Other low cost alternatives are not considered while finalizing the diesel
based generation
⇒ It adds to the already existing stark urban-rural divide where we create
urban islands of zero load shedding while rural areas facing power cuts
of 16-18 hours a day.
@@@

1
NOTE ON THE POWER SECTOR IN THE STATE OF ORISSA : By
Er. Biswaranjan Mishra, General Secretary (GRIDCO POWER ENGINEERS ASSOCIATION BHUBANESWAR, ORISSA)
Presented at Prayas Workshop on Power Sector Reforms,
Pune 22-23 March 2007
INTRODUCTION
When we talk of power sector reforms and regulations in India, two names immediately catch one’s imagination.
1. The World Bank who authored, sponsored and bulldozed the entire programme.
2. The State of Orissa who embraced such radical programme before any state could even think about it. It is also ironical that the failure saga was scripted at the same venue though neither the sponsorer nor the perpetrators accept it.
THE GENESIS
It needs no discussion or elaboration about the agenda of the World Bank in devastating the Indian power sector, but it really needs an introduction as to how Orissa fell into the trap laid by the bank. In the nineties Govt. of Orissa was executing a 600 MW hydropower plant at Upper Indravati the district of Kalahandi with the assistance of the World Bank. In 1992 there was a major tunnel accident which stopped work and the project suffered huge loss. Subsequently W.B. suspended the loan and prematurely withdrew from the project. (The project was finally completed with P.F.C. assistance). Thereafter W.B. proposed another loan for upgradation of the transmission and distribution network and put forth the restructuring of the Orissa State Electricity Board and pushed forward the in famous Power Sector Reforms.
STATUS OF THE STATE POWER SECTOR
Pre Reforms
• Orissa State Electricity Board – established in 1961 managing generation, transmission and distribution of Electricity.
• Department of Power (later renamed as Energy) was constructing all new power projects and handing over there after to OSEB for operation and maintenance.
• Orissa Power Generation Corporation (OPGC) established in the year 1986 to construct a major thermal power station (2 x 210 MW) at Ib and some mini/micro hydel projects. The Ib Thermal Power Station was commissioned in the year 1994.
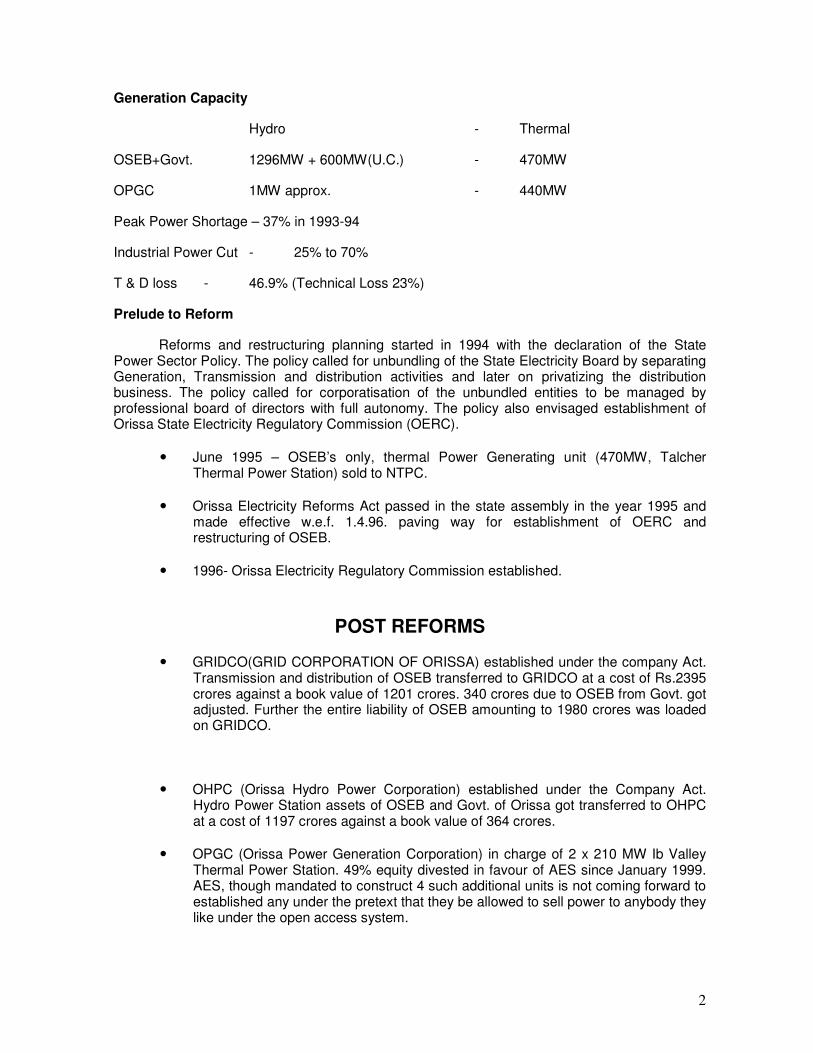
2
Generation Capacity
Hydro - Thermal
OSEB+Govt. 1296MW + 600MW(U.C.) - 470MW
OPGC 1MW approx. - 440MW
Peak Power Shortage – 37% in 1993-94
Industrial Power Cut - 25% to 70%
T & D loss - 46.9% (Technical Loss 23%)
Prelude to Reform
Reforms and restructuring planning started in 1994 with the declaration of the State Power Sector Policy. The policy called for unbundling of the State Electricity Board by separating Generation, Transmission and distribution activities and later on privatizing the distribution business. The policy called for corporatisation of the unbundled entities to be managed by professional board of directors with full autonomy. The policy also envisaged establishment of Orissa State Electricity Regulatory Commission (OERC).
• June 1995 – OSEB’s only, thermal Power Generating unit (470MW, Talcher Thermal Power Station) sold to NTPC.
• Orissa Electricity Reforms Act passed in the state assembly in the year 1995 and made effective w.e.f. 1.4.96. paving way for establishment of OERC and restructuring of OSEB.
• 1996- Orissa Electricity Regulatory Commission established.
POST REFORMS
• GRIDCO(GRID CORPORATION OF ORISSA) established under the company Act. Transmission and distribution of OSEB transferred to GRIDCO at a cost of Rs.2395 crores against a book value of 1201 crores. 340 crores due to OSEB from Govt. got adjusted. Further the entire liability of OSEB amounting to 1980 crores was loaded on GRIDCO.
• OHPC (Orissa Hydro Power Corporation) established under the Company Act. Hydro Power Station assets of OSEB and Govt. of Orissa got transferred to OHPC at a cost of 1197 crores against a book value of 364 crores.
• OPGC (Orissa Power Generation Corporation) in charge of 2 x 210 MW Ib Valley Thermal Power Station. 49% equity divested in favour of AES since January 1999. AES, though mandated to construct 4 such additional units is not coming forward to established any under the pretext that they be allowed to sell power to anybody they like under the open access system.
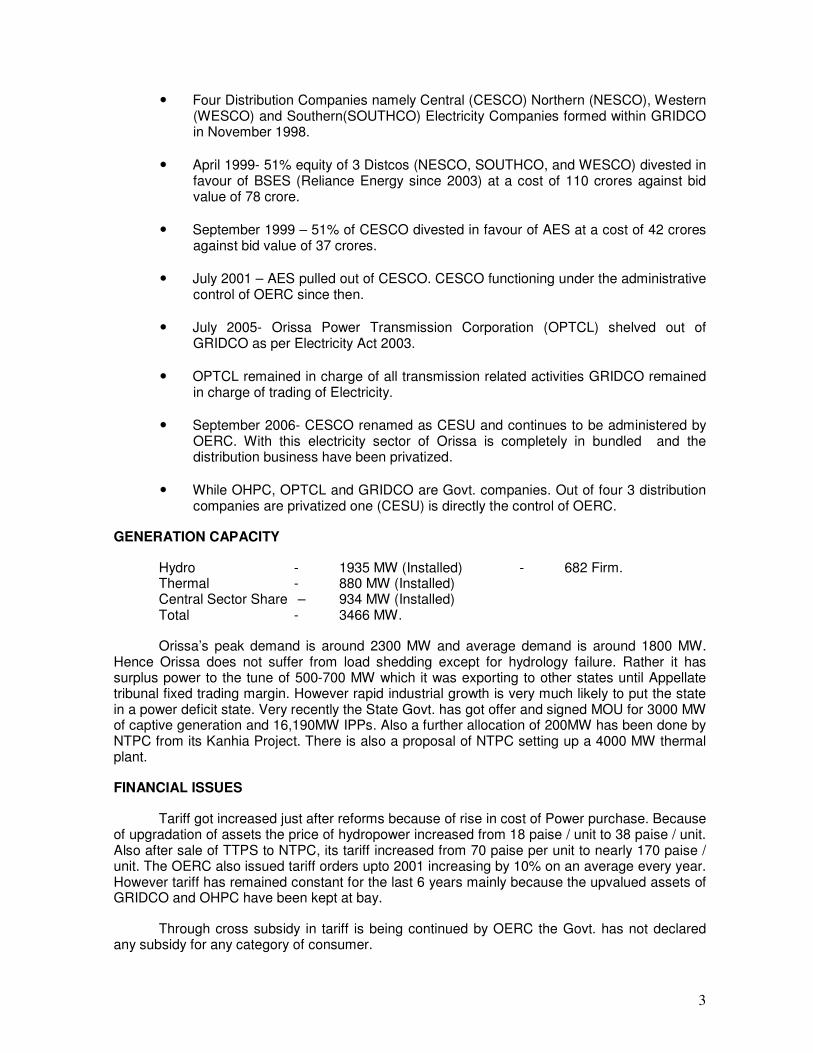
3
• Four Distribution Companies namely Central (CESCO) Northern (NESCO), Western (WESCO) and Southern(SOUTHCO) Electricity Companies formed within GRIDCO in November 1998.
• April 1999- 51% equity of 3 Distcos (NESCO, SOUTHCO, and WESCO) divested in favour of BSES (Reliance Energy since 2003) at a cost of 110 crores against bid value of 78 crore.
• September 1999 – 51% of CESCO divested in favour of AES at a cost of 42 crores against bid value of 37 crores.
• July 2001 – AES pulled out of CESCO. CESCO functioning under the administrative control of OERC since then.
• July 2005- Orissa Power Transmission Corporation (OPTCL) shelved out of GRIDCO as per Electricity Act 2003.
• OPTCL remained in charge of all transmission related activities GRIDCO remained in charge of trading of Electricity.
• September 2006- CESCO renamed as CESU and continues to be administered by OERC. With this electricity sector of Orissa is completely in bundled and the distribution business have been privatized.
• While OHPC, OPTCL and GRIDCO are Govt. companies. Out of four 3 distribution companies are privatized one (CESU) is directly the control of OERC.
GENERATION CAPACITY
Hydro - 1935 MW (Installed) - 682 Firm. Thermal - 880 MW (Installed) Central Sector Share – 934 MW (Installed) Total - 3466 MW.
Orissa’s peak demand is around 2300 MW and average demand is around 1800 MW. Hence Orissa does not suffer from load shedding except for hydrology failure. Rather it has surplus power to the tune of 500-700 MW which it was exporting to other states until Appellate tribunal fixed trading margin. However rapid industrial growth is very much likely to put the state in a power deficit state. Very recently the State Govt. has got offer and signed MOU for 3000 MW of captive generation and 16,190MW IPPs. Also a further allocation of 200MW has been done by NTPC from its Kanhia Project. There is also a proposal of NTPC setting up a 4000 MW thermal plant.
FINANCIAL ISSUES
Tariff got increased just after reforms because of rise in cost of Power purchase. Because of upgradation of assets the price of hydropower increased from 18 paise / unit to 38 paise / unit. Also after sale of TTPS to NTPC, its tariff increased from 70 paise per unit to nearly 170 paise / unit. The OERC also issued tariff orders upto 2001 increasing by 10% on an average every year. However tariff has remained constant for the last 6 years mainly because the upvalued assets of GRIDCO and OHPC have been kept at bay.
Through cross subsidy in tariff is being continued by OERC the Govt. has not declared any subsidy for any category of consumer.

4
There is no free power available for farmers. The tariff for agriculture is Re.1/- unit, the consumption is hardly 2 to 3%. As a matter of fact the agricultural consumption has reduced from about 6% in pre reform era to 2-3% in post reform era.
The capital investment in the distribution sector was done out of the WB loan. After privatization the distribution companies (REL) have not invested even a single rupee. Even though as per the share holders agreement they are obliged to do so. This is seriously hindering the efficiency and performance. Though one of the major objective of reform was to attract private investment, the concept has miserably failed.
Transmission and distribution loss.
Reduction of T & D loss was high on agenda of the reforms programme and infact the key factor which would have helped consumers getting power at lesser price and also help in augmenting the generation virtual capacity. But going by the records the reduction in T & D loss in far from satisfactory. Though losses in the EHT sector is within controllable limit and is around 4%, the distribution companies have failed to reduce the same. Though the W.B. calculated the T & D loss to be at 43% just before privatization, the figure was disputed by the private companies after one year of operation. A comparative study of the data shall show that neither the distribution loss and AT & C loss have reduced nor has there been any substantial improvement in collection efficiency.
Important Regulatory Developments
The OERC has issued two important orders.
1. Multi year tariff strategy valid from 2003-2008.
2. Business Plan for DISTCOS.
Multi year tariff strategy fixes the norms based on which tariff shall be fixed. This enables licensees to forecast their tariff in advance helping them to make their detailed financial appraisal. This even provides a mechanism to fix tariff in force major conditions like natural calamity and also in case of purchase of high out power.
Business Plan
By which the commission asks the licensee’s particularly the Distco’s to project their loss reduction, AT & C loss and collection efficiency figures and other such important parameters and fix targets. This helps the commission to monitor their performances.
Power Purchase
Every power purchase deal arrived between parties need to be velted by the commission through public hearing.
Open Access
The commission has issued open access terms and conditions in 2005 and regulation in 2006 but yet to finalise cross subsidy surcharge and other open access charges. This is proposed to be done in public hearing soon.

5
TABLE
PERFORMANCE INDICATOR OF DISTCOS
1999-2000 2000-2001 2001-2002 2002-2003 2003-2004 2004-2005 2005-2006 2006-07 (Estimated)
2007-2008 (Estimated)
Dist. Loss (%) 44.89 44.89 48.81 43.03 39.76 41 43 43 39
Collection Efficiency (%) 69.72 74.5 71.17 78.92 81.18 84 89 89 92
AT&C Loss (%) 61.58 58.94 63.57 55.04 51.10 51 49.4 49 44
CESU
OERC Target (AT&C Loss %) - - - - - 49.37 44.96 40.37 35.60
Dist. Loss (%) 43.35 44.44 51.0 41.38 43.66 39.40 37.08 32.53 29.99
Collection Efficiency (%) 79.37 82.12 74.34 81.46 85.47 91 92 94 94
AT&C Loss (%) 55.04 54.38 63.57 52.25 51.85 45.00 42.11 36.58 34.19
NESCO
OERC Target (AT&C Loss %) - 42.96 39.55 36.08 33.26
Dist. Loss (%) 41.84 42.52 40.74 39.14 42.45 40.5 41.07 42.32 40.16
Collection Efficiency (%) 78.75 83.2 79.29 83.37 88.16 91 91 93 94
AT&C Loss (%) 54.2 52.1 52.8 49.26 49.27 45.86 46.37 46.36 43.75
SOUTHCO
OERC Target (AT&C Loss %) 45.71 41.76 37.69 34.20
Dist. Loss (%) 44.17 43.20 46.44 38.29 39.02 36.38 37.8 34.78 31
Collection Efficiency (%) 83.36 74.32 79.95 85.4 87.96 92.06 94 94 95
AT&C Loss (%) 53.46 54.94 57.18 47.3 46.36 41.43 41.53 38.69 34.45
WESCO
OERC Target (AT&C Loss %) 40.60 36.52 32.32 28
6
Consumer Issues
Though commission invites objection in every issue from general public the participation has been far from satisfactory except a few individuals and consumer groups may be because of lack of awareness.
Grievance redressal forums have been created in every circle and functioning since 2004. The functioning of GRF as independent units of distribution licensee has not been satisfactory in all places. Even though regulatory commission have appointed ombudsmen in all four distribution licensees, very few representation are being made to them by the consumer. May be because, people are not aware or are not very sure of the mechanism and hence less confidence on the system.
Even though OERC have made regulations for standards of performance there is hardly any implementation. The private companies take people for ride. The quality of power supply has deteriorated particularly in rural and semi urban areas.
Issues regarding regulatory process
The commission is supposed to consist of professionals. But year after year burocrats are capturing the commission making it in effective. Though the selection is being made through open process the quality is not ensured. Even if the regulators deal subject of high public interest there is hardly any accountability.
Energy Efficiency
During the initial phase of reform some activity pertaining to energy efficiency and demand side management was done by DFID funding. Thereafter nothing is being done by the Distcos. The OERC however has provided certain incentives in its tariff order 2005-06 to promote DSM by
1. Industrial loads over drawing upto 20% during off peak hours will not charged with over drawal penalty.
2. TOD tariff introduced 10 paisa concession on tariff rate for drawls during off peak.
Renewable Energy Tariff
There is no CAP on renewable energy tariff. OERC has determined that power will be sourced from non conventional sources to achieve 5% of the total consumption by 2012. However not a single KW of energy is generated yet. Proactive policy is essential.
Role of State Government.
The State after undertaken reforms seems to have withdrawn from the power sector and observes a hands off strategy. This type of attitude has further complicated the sector. For example the boards of OHPC, OPTC, GRIDCO hardly get professionals appointed. The posts of technical director is lying vacant for the last 5 years for which Govt. has not taken serious interest to fill up. Even though through reforms govt. is committed to give autonomy to the sector for its day to day management it still interferes is every issue. The Govt. even does not allow its companies to recruit bare essential but most vital technical man power. The companies are neither permitted to recruit nor make a suitable policy to retain manpower. As a result, good, quality people are leaving for greener pastures. The Govt. has shunned responsibility but clinging to power.
7
Even in regulatory commission hearing the Govt. representative hardly participates in debate. There is no definite intervention by Govt. nor have any policy directives been so far.
Even in a critical, issues like whether from this year the up valued asset shall be considered for tariff or not, the Govt. maintain a sturdid silence.
Status of Key Policy Initiatives
Rajiv Gandhi Grameen Vidyutikaran Yojana, out of total 51,657 revenue villages, 9392 nos. are yet to be electrified.
The State Govt. have signed in quadripartite agreement on 5th October 2005 with REC and CPSUs like PGCIL, NTPC and NHPC and CESCO, NESCO, WESCO and SOUTHCO for implementation of Rajiv Gandhi Gramya Vidyutkaran Yojana. But nothing much has been achieved.
The state is also not able to take advantage of the APDRP scheme because of non cooperation of DISTOCS by not providing the 25% matching grant.
Special Issues
With one private investor AES abandoning CESCO and the performance of the other 3 (SOUTHCO, NESCO AND WESCO) not improving, OERC issued notice to Reliance Energy Ltd. for its alleged non performance and non adherence to shareholders agreement and asking to show cause why its license shall not be cancelled. The appellate tribunal has rejected OERC’s plea on technical ground, both OERC and the petitioner have approached the supreme court. Thus the uncertainty over private management of electricity distribution continues.
Appellate tribunal fixing trading margin over sale of power by GRIDCO (inter state) has put the latter in a fix. With the tribunal ordering for recovery of excess charges on the power already traded, GRIDCO was forced to stop trade power. Even though GRIDCO has moved to supreme court. Orissa’s only silver lining of reforms (trading of surplus power) is under clouds.
With AES abandoning the distribution business with a huge arrear to GRIDCO, but continuing in generation remains a bane for Orissa Govt. AES after continuously dilly dalling to start construction of 3,4,5,6 units at Ib plant got permission to construct a plant at Chhatisgarh. It is a big question as to how could AES obtain a permission from Union Govt. without the NOC from Orissa Govt.
Unless the trading issue is amicably resolved the IPPs shall remain non starter. Because no state shall agree to risk its resources and environment without being suitably compensated.
The power sector is slowly but steadily becoming a platform of endless legal battles. Let everybody take notice.
~ 0 ~
1
Tamil Nadu Power Sector – Status and Options for the Future
- R.Hema, Madras School of Economics.
Introduction
Tamil Nadu is one of the few states in India which has not yet unbundled its power
sector, nominally or otherwise. The Tamil Nadu Electricity Board, a statutory monopoly
established under the Electricity (Supply) Act, 1948, continues to be responsible for the
distribution, transmission and a good part of the generation within the state. Pursuant to
the Electricity Regulatory Commissions Act 1998, the Tamil Nadu Electricity Regulatory
Commission (TNERC) was set up in 1999. However, TNERC became fully functional
only in 2002 when it got its Chairman. The TNERC has assumed all the responsibilities
assigned to State Electricity Regulatory Commissions as per the Electricity Act 2003.
TNEB’s Performance
Capacity: Tamil Nadu had a total of 13,656 MW of installed capacity available at its
disposal as on Oct 2006. TNEB’s share in this is 41%, capacity contracted with central
government and others is 25% and private sector share accounts for 34%. Renewable
sources account for 26% of this total installed capacity, with private sector wind power
capacity contributing 90% of this renewable share. During 2005-06, TN was estimated to
have a peak demand shortage of 8.6% and an energy shortage of 0.6%. It is generally
claimed that there no major demand-supply imbalance in Tamil Nadu’s power sector –
there are no scheduled power cuts or load shedding. A lot of unscheduled power cuts do
occur though, particularly in rural areas, but these are not disruptive enough to make
consumers raise a hue and cry. Moreover, given that Tamil Nadu has a long history of
supplying to agricultural pumps only for about eight hours each day, many non-urban
consumers have got used to living with limited hours of power supply each day. Hence
even though there is a shortage of supply it is not ‘perceived’ as being disruptive. TNEB
is slated to significantly expand its thermal (coal) generating capacity as also its share in
NTPC and NPC projects during the Eleventh Plan.
Technical Efficiency: The performance of the thermal power plants in the state has been
good with an average plant load factor of 74% between 1999 and 2005. The Indian
Institute of Public Administration (IIPA) Report on the “Impact of Restructuring of
SEBs” records that the state has a good and highly reliable (99%) transmission system.
Its distribution system is quite large covering the entire state of Tamil Nadu. About
94.9% of all the villages in the state and about 71.1% of households have been electrified
as on March 2006. The estimated Aggregate Technical and Commercial (AT&C) losses
in energy is about 20% according to the State Power Sectors Ratings 2006, Ministry of
Power (MoP). The IIPA report also states that TNEB implements an energy audit of all
22/11 KV feeders having line losses of more than 10%, does 100% metering on 11 KV
feeders, has an excellent system for monitoring interruptions in supply and has taken
measures to improve the system power factor.
2
Financial Performance: The financial status of TNEB is cause for concern. During the
five year period 2000-2005 the average losses incurred by the Board have been around
Rs. 1100 crores, after taking into account the government subsidy. This is in spite of the
TNEB’s strong ‘financial discipline’. It services its borrowings on time. TNEB can also
take pride for 100% consumer metering, billing and collection. However, only 60% of its
energy inputs are metered. This is on account of the free power policy (of the state
government) to all agricultural consumers and to very low income domestic consumers.
Although it has been mandated by the TNERC that the state government must fully
compensate the utility for these losses, the government has not been able to do so. Hence,
there is a high degree of cross-subsidization from industrial and commercial consumers.
Industrial consumers who account for about one-third of the energy consumption provide
70% of the revenue to the utility. This is seriously eroding the competitiveness of
industry in the state. The utility is also forced to borrow heavily to bridge its revenue gap
and the interest burden is rising.
Renewable energy & Energy efficiency: Tamil Nadu has a long history of wind based
electricity. TNEB has been a pioneer in the country in tapping the wind potential for
power generation and the state government has also given various incentives to the
private sector to tap this potential for captive use. As of October 2006, renewable
resource based electricity accounted for 26% of the installed capacity in the state and
90% of this came from the private sector’s wind-based installed capacity. Also, in 2005-
06 the energy generated from renewable sources accounted for 10% of the total energy
consumption in the state. TNERC, in its May 2006 Order, has required that every
distribution licensee must purchase 10% of its energy from renewable sources. As for
energy efficiency there has been no proactive approach either by the utility or by the
regulatory commission to promote it. In fact, the free power policy of the state for
agriculture pumps is encouraging energy inefficiency. Farmers are not concerned about
conserving something that is available for free. There is no incentive to install energy
efficient motors, or energy saving devises or to go in for water saving crops. This has
resulted not only in energy inefficiency but has also reduced the water table to
dangerously low levels in many parts of the state.
Regulatory Issues
The regulatory process in Tamil Nadu could be classified as being non-descript. After the
setting up of the TNERC it was almost three years before a Chairman was appointed and
the Commission became fully functional. TNERC has issued only one tariff order (in
2003) and parts of this has also been subsequently reversed by the state government. The
TNERC is not able to ensure that the TNEB submits the Annual Revenue Requirement
every year without fail. The TNERC has mandated that the state government pay the
subsidy due to the TNEB, on account of the government’s subsidy policy for agriculture
and domestic consumers, in advance. However, the subsidy amount transferred by the
government meets only a part of the impact and the utility is forced to borrow heavily at
high interest rates to bridge the revenue gap. This further undermines its financial
viability.
3
A study conducted by the Citizen Consumer and Civic Action Group on the regulatory
process in Tamil Nadu, has given TNERC an overall 70% rating. The ratings for the
individual components were as follows: governance capacity (77%), accountability and
redress (90%), participation (53%) and transparency and information (51%).
Evaluation of the Problem
By all accounts (internal and external) TNEB has been rated as a technically efficient
entity, with efficiency levels above the average for the nation. Its ‘financial discipline’ is
also commended by the state power sector ratings report 2006 of the MoP. There is a
State Electricity Regulatory Commission in place. In spite of all this the entity has been
continuously incurring unsustainable financial losses and all fingers point to the state
government’s policy of free power supply to agriculture pumps combined with its
inability to fully compensate TNEB for the related losses, in spite of the SERC’s mandate
to do so. Lack of incentives and lack of autonomy to function efficiently have been the
source of the problem. And to tackle this problem the state is being pressurized to seek
remedy by unbundling and making the unbundled units corporate entities. So far it has
avoided doing so and gets counted among a minority of states that have not unbundled.
In the opinion of this author, it would not be advisable to unbundle the TNEB at this
stage. Theoretical arguments for unbundling a statutory monopoly and converting the
unbundled units into profit-making entities (under private or public ownership) that
operate under competitive conditions to improve technical and financial efficiencies are
of course valid. But to achieve the desired efficiency levels, enabling conditions have to
be in place. The sector must be financially viable to start with and should not have
significant shortages in supply. Otherwise true competition cannot be introduced.
Unbundling in some form or the other has or is taking place in many power sector
industries across the world. However, analysis of the results, give very unclear and mixed
signals. From being a regulated or state owned monopoly these sectors could be moving
towards oligopolistic markets which are much tougher to regulate and enforce
“competitive conditions”. It is not clear whether the inefficiency costs of regulated
monopolies are higher than the transaction costs involved in regulating markets with
strong oligopolistic tendencies. Given existing technology for the power sector, network
externalities are significant and these are likely to sustain oligopolistic market tendencies.
It is also not clear whether overall social welfare increases, because that depends on the
specific categories of society which end up as winners and losers as a result of the
restructuring.
In the Indian context, the first state (Orissa) that decided to go the unbundle-corporatise-
privatise route has landed its power sector in doldrums. Most other states that have
unbundled their power sectors are yet to see dramatic improvements in their efficiencies.
A couple of states that have in fact seen significant improvements are operating the
unbundled entities almost like integrated units, either by virtue of their institutional
arrangement (e.g. Gujarat’s Holding Company model) or by virtue of state government
fiat. In all these cases it is not clear if unbundling and increasing the related transaction
costs was necessary to achieve these efficiency gains. These could probably have been
4
achieved even by keeping the utility as a vertically integrated entity, with complete
autonomy, incentives to raise performance efficiencies and making it accountable to a
strong regulatory authority.
Alternative Option for Tamil Nadu
I would hence like to argue in favour of not mandatorily requiring that TNEB be
unbundled within an arbitrarily defined time frame. The entity has the expertise and the
potential to realize significant performance (financial) efficiency gains and it would be
able to achieve this faster and in a sustainable manner by staying vertically integrated and
realizing the economies of scope and economies of vertical integration. The crucial
requirement would be to make it truly autonomous and this can be done by a state
government mandate. It could be made a regulated public trust utility on contract with the
state government. The contractual agreement may allow this independent entity to
operate on commercial principles and earn profits subject to regulation by the SERC. The
contract could provide incentives for the entity to earn profits (by giving the management
and staff a significant share in these profits) and penalties for violating quality
requirements, unreasonably denying access to consumers and so on. This vertically
integrated entity would be subject to regulation by the SERC as provided in the EA 2003.
The only requirement would be an amendment to the EA which would enable the public
trust utility to operate as a vertically integrated entity in charge of generation,
transmission and distribution functions within the state. If the SERC adopts a “price-cap”
form of regulation it would provide better incentives to the utility to increase
performance efficiencies and the monitoring and enforcement cost for the SERC would
be minimal.
Finally and most importantly, the issue of the agricultural subsidies has to be tackled if
any efficiency gains are to be achieved and sustained. What is important here is not just
the magnitude of subsidies but also the manner in which they are given. The SERC must
require compulsory metering and billing of all consumers regardless of whether they
receive any subsidy or not. It should then allow the state government to pay for a
proportion of this bill. This proportion could vary from 0% to 90% but it is important to
require the consumer to bear a part of it, however small. Otherwise no effective energy
conservation or water conservation can be achieved. Such a system would bring much
needed transparency to the subsidies and provide the right signals. It would also be able
to effectively target the subsidy to the truly needy categories of consumers. Though it is a
phenomenal and costly task at this point to meter and bill the huge number of agricultural
consumers it is imperative to do this in order to reduce the much higher externality costs.
5
References
Hema, R, 2005 - ‘Empowering the Indian Power Sector: A Road Map’, in the edited
volume Topics in Applied Economics: Tools, Issues and Institutions, (eds) G. Mythili
and R. Hema, Academic Foundation, New Delhi, 2005
Hema, R, 1996 - ‘Regulated Public Trust Utilities: a case for Restructuring the State
Electricity Boards’ in Review of Development and Change, 1&2, July-Dec
Indian Institute of Public Administration, 2006 – Impact of Power Sector Reforms on
SEBs.
Ministry of Power, GOI, 2006 – State Power Sector Performance Ratings