State-Toolkit.pdf - Performance Improvement Council
179
-
Upload
khangminh22 -
Category
Documents
-
view
0 -
download
0
Transcript of State-Toolkit.pdf - Performance Improvement Council
ii
Program Design and Performance Management Toolkit Introduction cas.state.gov/managingforresults
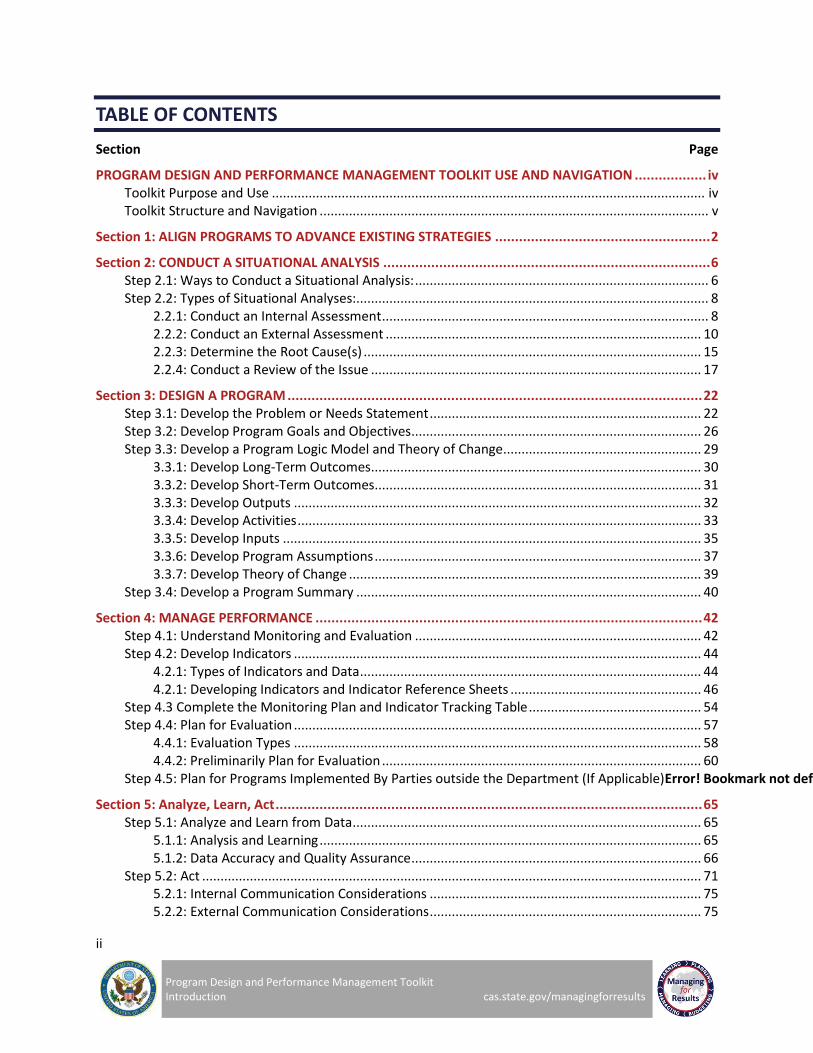
TABLE OF CONTENTS
Section Page
PROGRAM DESIGN AND PERFORMANCE MANAGEMENT TOOLKIT USE AND NAVIGATION .................. iv Toolkit Purpose and Use ...................................................................................................................... iv Toolkit Structure and Navigation .......................................................................................................... v
Section 1: ALIGN PROGRAMS TO ADVANCE EXISTING STRATEGIES ...................................................... 2
Section 2: CONDUCT A SITUATIONAL ANALYSIS .................................................................................. 6 Step 2.1: Ways to Conduct a Situational Analysis: ................................................................................ 6 Step 2.2: Types of Situational Analyses:................................................................................................ 8
2.2.1: Conduct an Internal Assessment ......................................................................................... 8 2.2.2: Conduct an External Assessment ...................................................................................... 10 2.2.3: Determine the Root Cause(s) ............................................................................................ 15 2.2.4: Conduct a Review of the Issue .......................................................................................... 17
Section 3: DESIGN A PROGRAM ........................................................................................................ 22 Step 3.1: Develop the Problem or Needs Statement .......................................................................... 22 Step 3.2: Develop Program Goals and Objectives ............................................................................... 26 Step 3.3: Develop a Program Logic Model and Theory of Change...................................................... 29
3.3.1: Develop Long-Term Outcomes .......................................................................................... 30 3.3.2: Develop Short-Term Outcomes ......................................................................................... 31 3.3.3: Develop Outputs ............................................................................................................... 32 3.3.4: Develop Activities .............................................................................................................. 33 3.3.5: Develop Inputs .................................................................................................................. 35 3.3.6: Develop Program Assumptions ......................................................................................... 37 3.3.7: Develop Theory of Change ................................................................................................ 39
Step 3.4: Develop a Program Summary .............................................................................................. 40
Section 4: MANAGE PERFORMANCE ................................................................................................. 42 Step 4.1: Understand Monitoring and Evaluation .............................................................................. 42 Step 4.2: Develop Indicators ............................................................................................................... 44
4.2.1: Types of Indicators and Data ............................................................................................. 44 4.2.1: Developing Indicators and Indicator Reference Sheets .................................................... 46
Step 4.3 Complete the Monitoring Plan and Indicator Tracking Table ............................................... 54 Step 4.4: Plan for Evaluation ............................................................................................................... 57
4.4.1: Evaluation Types ............................................................................................................... 58 4.4.2: Preliminarily Plan for Evaluation ....................................................................................... 60
Step 4.5: Plan for Programs Implemented By Parties outside the Department (If Applicable)Error! Bookmark not defined.
Section 5: Analyze, Learn, Act ........................................................................................................... 65 Step 5.1: Analyze and Learn from Data ............................................................................................... 65
5.1.1: Analysis and Learning ........................................................................................................ 65 5.1.2: Data Accuracy and Quality Assurance ............................................................................... 66
Step 5.2: Act ........................................................................................................................................ 71 5.2.1: Internal Communication Considerations .......................................................................... 75 5.2.2: External Communication Considerations .......................................................................... 75
iii
Program Design and Performance Management Toolkit Introduction cas.state.gov/managingforresults
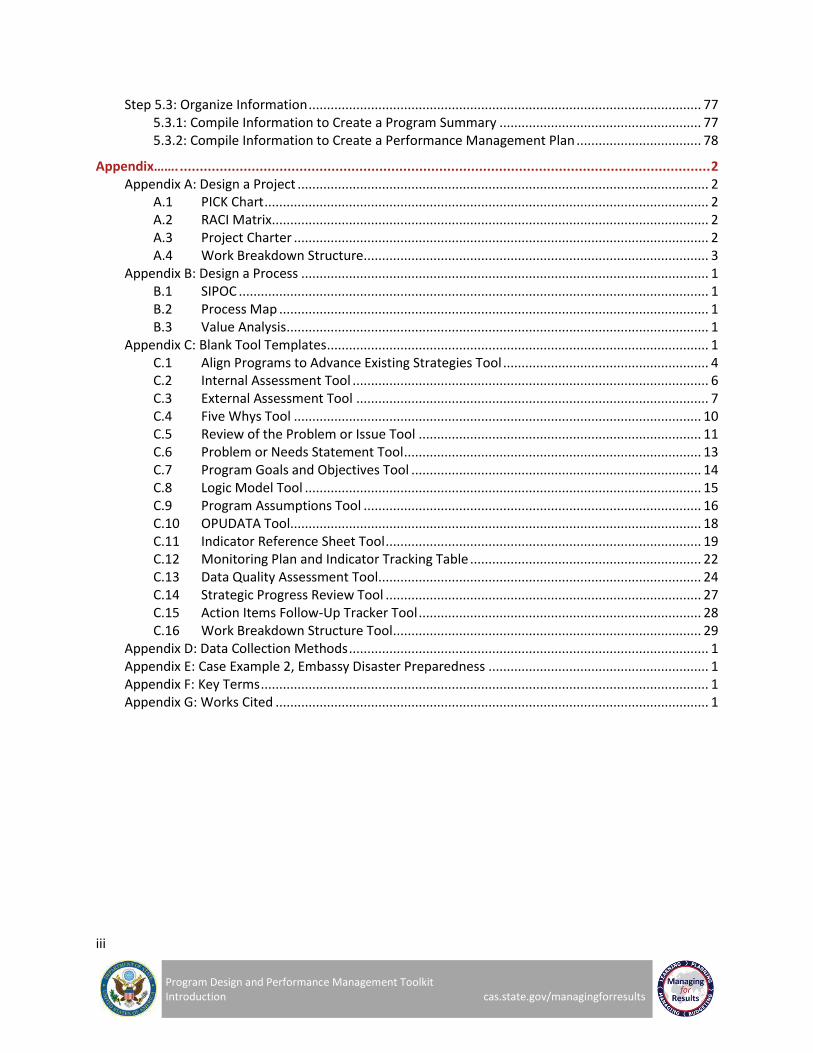
Step 5.3: Organize Information ........................................................................................................... 77 5.3.1: Compile Information to Create a Program Summary ....................................................... 77 5.3.2: Compile Information to Create a Performance Management Plan .................................. 78
Appendix……. ..................................................................................................................................... 2 Appendix A: Design a Project ................................................................................................................ 2
A.1 PICK Chart ......................................................................................................................... 2 A.2 RACI Matrix ....................................................................................................................... 2 A.3 Project Charter ................................................................................................................. 2 A.4 Work Breakdown Structure .............................................................................................. 3
Appendix B: Design a Process ............................................................................................................... 1 B.1 SIPOC ................................................................................................................................ 1 B.2 Process Map ..................................................................................................................... 1 B.3 Value Analysis ................................................................................................................... 1
Appendix C: Blank Tool Templates ........................................................................................................ 1 C.1 Align Programs to Advance Existing Strategies Tool ........................................................ 4 C.2 Internal Assessment Tool ................................................................................................. 6 C.3 External Assessment Tool ................................................................................................ 7 C.4 Five Whys Tool ............................................................................................................... 10 C.5 Review of the Problem or Issue Tool ............................................................................. 11 C.6 Problem or Needs Statement Tool ................................................................................. 13 C.7 Program Goals and Objectives Tool ............................................................................... 14 C.8 Logic Model Tool ............................................................................................................ 15 C.9 Program Assumptions Tool ............................................................................................ 16 C.10 OPUDATA Tool................................................................................................................ 18 C.11 Indicator Reference Sheet Tool ...................................................................................... 19 C.12 Monitoring Plan and Indicator Tracking Table ............................................................... 22 C.13 Data Quality Assessment Tool ........................................................................................ 24 C.14 Strategic Progress Review Tool ...................................................................................... 27 C.15 Action Items Follow-Up Tracker Tool ............................................................................. 28 C.16 Work Breakdown Structure Tool .................................................................................... 29
Appendix D: Data Collection Methods .................................................................................................. 1 Appendix E: Case Example 2, Embassy Disaster Preparedness ............................................................ 1 Appendix F: Key Terms .......................................................................................................................... 1 Appendix G: Works Cited ...................................................................................................................... 1

iv
Program Design and Performance Management Toolkit Introduction cas.state.gov/managingforresults
PROGRAM DESIGN AND PERFORMANCE MANAGEMENT TOOLKIT USE AND NAVIGATION
TOOLKIT PURPOSE AND USE
Sound program design and performance management is the basis for the effective and efficient use of State Department resources to achieve our strategic goals. Program design details how we plan to achieve the strategic goals for a sector, region or country, and performance management enables us to assess the extent to which our efforts are working and why. Steps and tools provided in the Program Design and Performance Management (PD/PM) Toolkit can be applied to new and ongoing State Department programs, projects, and processes across diplomatic engagement, administration, and foreign assistance. This Toolkit is designed to be applicable to all bureaus, offices, and posts and the templates can be customized to fit your needs.
The PD/PM Toolkit will help bureaus, offices, and posts design their activities in a way that effectively advances broader strategic goals, utilizes useful monitoring and evaluation, and enables learning to occur that can inform future decisions. It can be used as a manual for creating and executing a new program, or can be employed mid-program to determine if the effort is on track.
The PD/PM Toolkit outlines the major steps of program design and performance management along with suggested tools and templates for completing each step. Completing each step will provide bureaus, offices, and posts with a program summary as well as a performance management plan that can be used for knowledge management, accountability, and to communicate about the program internally to leadership and staff and externally to partners, implementers, or other stakeholders.
The PD/PM Toolkit was jointly developed by the Office of U.S. Foreign Assistance Resources (F) and the Bureau of Budget and Planning (BP). Because some State programs are coordinated with USAID, to encourage congruence and a common lexicon, concepts from the USAID Automated Directives System (ADS) are incorporated where possible. It replaces the Department’s Performance Management Guidebook, Program and Project Management Guidebook, and Project Design Guidebook.
Sound Program Design
Useful Monitoring & Evaluation Plans
Better Data and Learning
Effective Implementation
Meet Goals & Objectives
v
Program Design and Performance Management Toolkit Introduction cas.state.gov/managingforresults
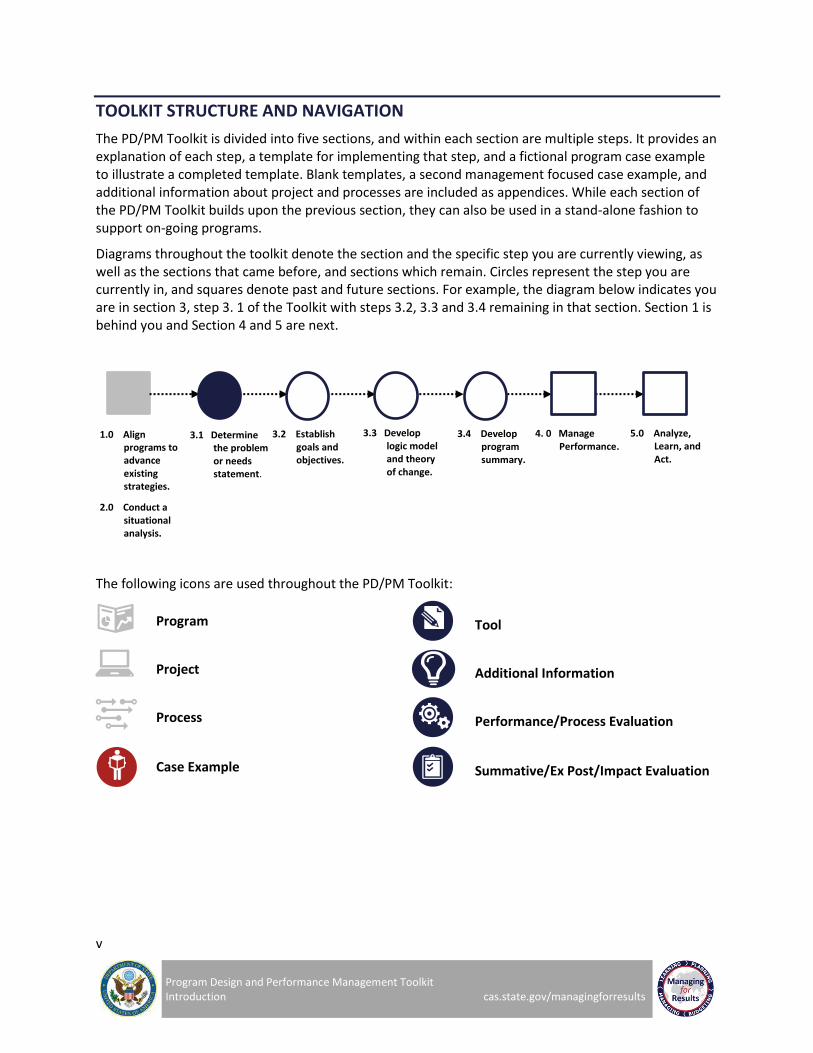
TOOLKIT STRUCTURE AND NAVIGATION
The PD/PM Toolkit is divided into five sections, and within each section are multiple steps. It provides an explanation of each step, a template for implementing that step, and a fictional program case example to illustrate a completed template. Blank templates, a second management focused case example, and additional information about project and processes are included as appendices. While each section of the PD/PM Toolkit builds upon the previous section, they can also be used in a stand-alone fashion to support on-going programs.
Diagrams throughout the toolkit denote the section and the specific step you are currently viewing, as well as the sections that came before, and sections which remain. Circles represent the step you are currently in, and squares denote past and future sections. For example, the diagram below indicates you are in section 3, step 3. 1 of the Toolkit with steps 3.2, 3.3 and 3.4 remaining in that section. Section 1 is behind you and Section 4 and 5 are next.
The following icons are used throughout the PD/PM Toolkit:
Program
Tool
Project
Additional Information
Process
Performance/Process Evaluation
Case Example
Summative/Ex Post/Impact Evaluation
1.0 Align programs to advance existing strategies.
2.0 Conduct a situational analysis.
3.1 Determine the problem or needs statement.
3.3 Develop logic model and theory of change.
3.4 Develop program summary.
5.0 Analyze, Learn, and Act.
4. 0 Manage Performance.
3.2 Establish goals and objectives.

vi
Program Design and Performance Management Toolkit Introduction cas.state.gov/managingforresults
More about the Case Example: The case example throughout PD/PM Toolkit follows the fictional South Bureau as it develops a new clean energy program in the fictional country of Freedonia. For each concept and tool introduced, the Toolkit provides a completed case example using this fictional program, which is intended to illustrate the types of information you could include in the blank tool templates as they follow the instructions for each section and step. Another case example, which can be found in Appendix E, highlights program design for management/infrastructure efforts. This case example follows the fictional Management office in Embassy Capital City as it develops a disaster preparedness program for State Department personnel.
Identifying Program, Project, or Process: The PD/PM Toolkit can be used by managers of programs, projects, and processes. In section 3 of the Toolkit, project and process managers may want to turn to additional resources outside of the main Toolkit before returning to sections 4 and 5. The graphic map on page ix is intended to guide users through a series of questions to help determine if you are designing and implementing a program, project, or a process and should make use of the additional resources (project managers are guided to Appendix A and processes are guided to Appendix B). The graphic map on page ix shows which sections of the Toolkit are applicable to programs, projects, and processes.
2
3
4
Align to Existing Strategies
Situational Analysis
Design Program
Manage Performance
1
5 Analyze, Learn, Act
Pro
gram
Su
mm
ary
Per
form
ance
Man
agem
en
t P
lan

vii
Program Design and Performance Management Toolkit Introduction cas.state.gov/managingforresults
Is this endeavor detailed, specific, and time-bound or
high-level and evolving?
Process A process is a series of actions or steps taken to achieve a particular end.
Program
A set of activities, projects, or processes aimed at achieving a goal or objective that are typically implemented by several parties over a specified period of time.
Project A project is a temporary endeavor undertaken to create a unique product, service, or result.
Am I Conducting a Program, Project, or Process?
What is the scope? Cross-functional One-dimensional
Repeatedly performing a
task
Is this endeavor repeatedly performing a task or
creating something new?
Creating something new
Detailed, specific, and time-bound
High-level and evolving
viii
Program Design and Performance Management Toolkit Introduction cas.state.gov/managingforresults
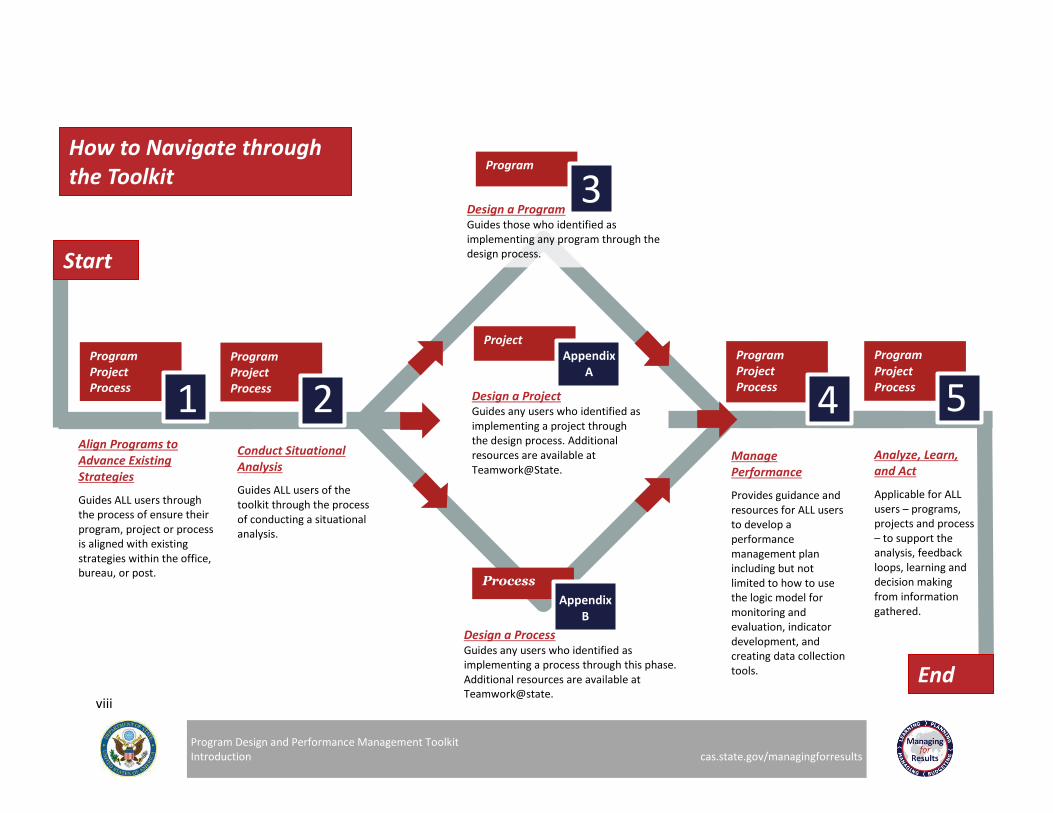
Analyze, Learn, and Act
Applicable for ALL users – programs, projects and process – to support the analysis, feedback loops, learning and decision making from information gathered.
How to Navigate through the Toolkit
Design a Program Guides those who identified as implementing any program through the design process.
Program Project Process
Align Programs to Advance Existing Strategies
Guides ALL users through the process of ensure their program, project or process is aligned with existing strategies within the office, bureau, or post.
Program Project Process
Program Project Process
4 5
Program
3
Program Project Process 1
Process
Appendix B
Design a Process Guides any users who identified as implementing a process through this phase. Additional resources are available at Teamwork@state.
2
Start
Project
Design a Project Guides any users who identified as implementing a project through the design process. Additional resources are available at Teamwork@State.
Appendix A
Conduct Situational Analysis
Guides ALL users of the toolkit through the process of conducting a situational analysis.
Manage Performance
Provides guidance and resources for ALL users to develop a performance management plan including but not limited to how to use the logic model for monitoring and evaluation, indicator development, and creating data collection tools.
2
End
Program Design and Performance Management Toolkit
Section 1: Align Programs to Advance Existing Strategies
By the end of this section, offices, bureaus, or posts will:
Align programs to advance existing strategies
1
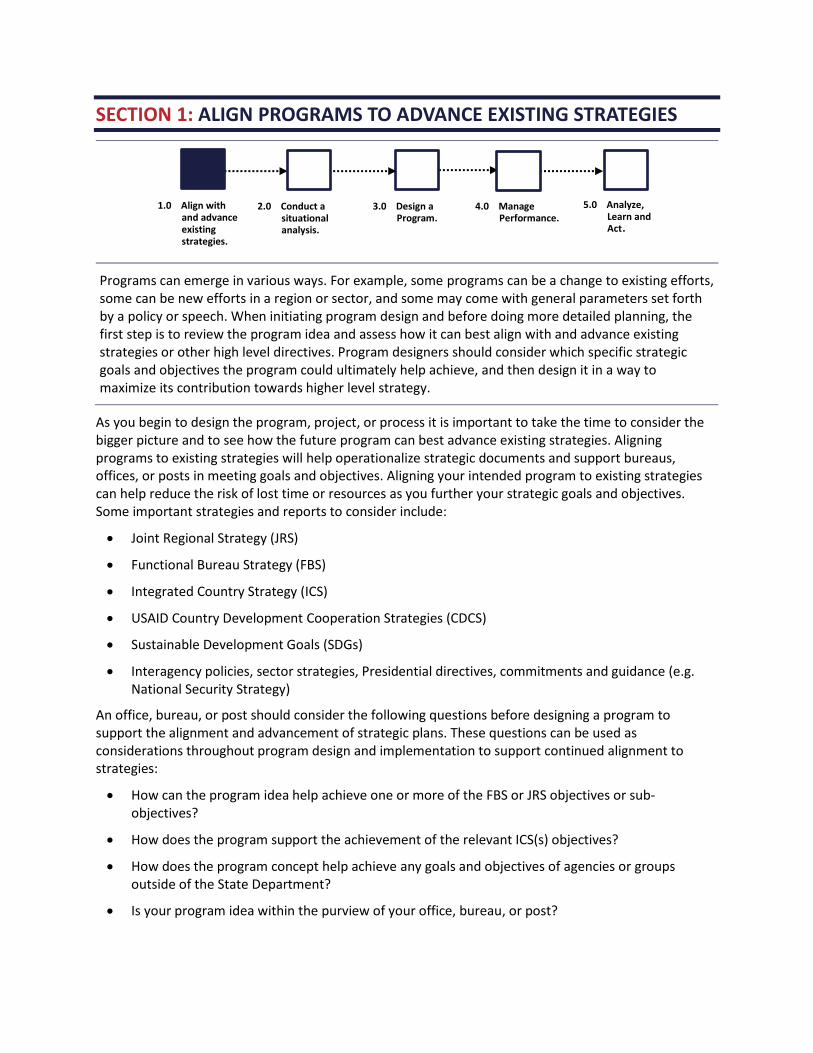
SECTION 1: ALIGN PROGRAMS TO ADVANCE EXISTING STRATEGIES
Programs can emerge in various ways. For example, some programs can be a change to existing efforts, some can be new efforts in a region or sector, and some may come with general parameters set forth by a policy or speech. When initiating program design and before doing more detailed planning, the first step is to review the program idea and assess how it can best align with and advance existing strategies or other high level directives. Program designers should consider which specific strategic goals and objectives the program could ultimately help achieve, and then design it in a way to maximize its contribution towards higher level strategy.
As you begin to design the program, project, or process it is important to take the time to consider the bigger picture and to see how the future program can best advance existing strategies. Aligning programs to existing strategies will help operationalize strategic documents and support bureaus, offices, or posts in meeting goals and objectives. Aligning your intended program to existing strategies can help reduce the risk of lost time or resources as you further your strategic goals and objectives. Some important strategies and reports to consider include:
Joint Regional Strategy (JRS)
Functional Bureau Strategy (FBS)
Integrated Country Strategy (ICS)
USAID Country Development Cooperation Strategies (CDCS)
Sustainable Development Goals (SDGs)
Interagency policies, sector strategies, Presidential directives, commitments and guidance (e.g. National Security Strategy)
An office, bureau, or post should consider the following questions before designing a program to support the alignment and advancement of strategic plans. These questions can be used as considerations throughout program design and implementation to support continued alignment to strategies:
How can the program idea help achieve one or more of the FBS or JRS objectives or sub-objectives?
How does the program support the achievement of the relevant ICS(s) objectives?
How does the program concept help achieve any goals and objectives of agencies or groups outside of the State Department?
Is your program idea within the purview of your office, bureau, or post?
2.0 Conduct a situational analysis.
4.0 Manage Performance.
5.0 Analyze, Learn and Act.
3.0 Design a Program.
1.0 Align with and advance existing strategies.
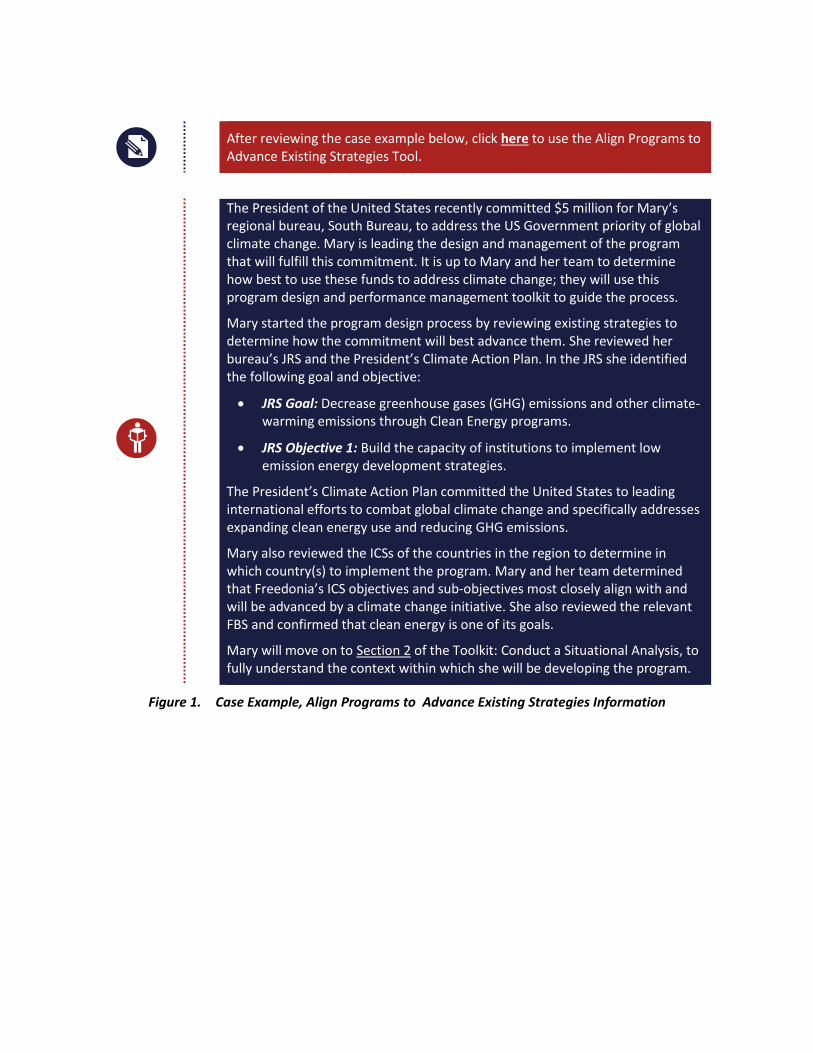
After reviewing the case example below, click here to use the Align Programs to Advance Existing Strategies Tool.
The President of the United States recently committed $5 million for Mary’s regional bureau, South Bureau, to address the US Government priority of global climate change. Mary is leading the design and management of the program that will fulfill this commitment. It is up to Mary and her team to determine how best to use these funds to address climate change; they will use this program design and performance management toolkit to guide the process.
Mary started the program design process by reviewing existing strategies to determine how the commitment will best advance them. She reviewed her bureau’s JRS and the President’s Climate Action Plan. In the JRS she identified the following goal and objective:
JRS Goal: Decrease greenhouse gases (GHG) emissions and other climate-warming emissions through Clean Energy programs.
JRS Objective 1: Build the capacity of institutions to implement low emission energy development strategies.
The President’s Climate Action Plan committed the United States to leading international efforts to combat global climate change and specifically addresses expanding clean energy use and reducing GHG emissions.
Mary also reviewed the ICSs of the countries in the region to determine in which country(s) to implement the program. Mary and her team determined that Freedonia’s ICS objectives and sub-objectives most closely align with and will be advanced by a climate change initiative. She also reviewed the relevant FBS and confirmed that clean energy is one of its goals.
Mary will move on to Section 2 of the Toolkit: Conduct a Situational Analysis, to fully understand the context within which she will be developing the program.
Figure 1. Case Example, Align Programs to Advance Existing Strategies Information

CASE EXAMPLE: Align Program to Advance Existing Strategies
Considerations List1 Answers
How does the program idea help achieve the goals or objectives from the relevant JRS or FBS?
The program is focused on climate change and the goals and objectives of the JRS involve reducing GHG emissions.
How does the program help achieve one or more ICS objectives or sub-objectives?
The sub-objectives of Freedonia’s ICS align with reducing GHG emissions thereby this program can be designed to advance these existing strategies.
Does the scope of the program idea fit within the purview of your office, bureau, or post?
Yes, as it is in South Region. But Mary’s team will collaborate with the appropriate functional bureau.
How have you determined what is necessary for the program to achieve the goals and objectives of higher level strategy?
The program should be designed to focus on reducing GHG emissions in some capacity because climate change is a large sector for the program to advance existing strategies.
How does the program concept help achieve any goals and objectives of agencies or groups outside of the State Department?
The program will also advance the President’s Climate Action Plan committed the United States to leading international efforts to combat global climate change and specifically addressed expanding clean energy use and reducing GHG emissions.
How has the program implemented a plan to ensure continued alignment and advancement of strategy throughout program design and implementation?
The program will review the JRS, ICS, FBS, and President’s Climate Action Plan when the program design is completed after each year of implementation, and when these documents are updated.
Table 1. Case Example, Align Programs to Advance Existing Strategies
1 http://cas.state.gov/managingforresults/planning/

Program Design and Performance Management Toolkit
Section 2: Conduct a Situational Analysis
By the end of this section, offices, bureaus, and posts will
conduct:
Internal Assessment
External Assessment
Root Cause Analysis
Review of the Issue
2
Section 2: Conduct a Situational Analysis
6
Program Design and Performance Management Toolkit Section 2: Conduct a Situational Analysis cas.state.gov/managingforresults
1 2 3 4 5
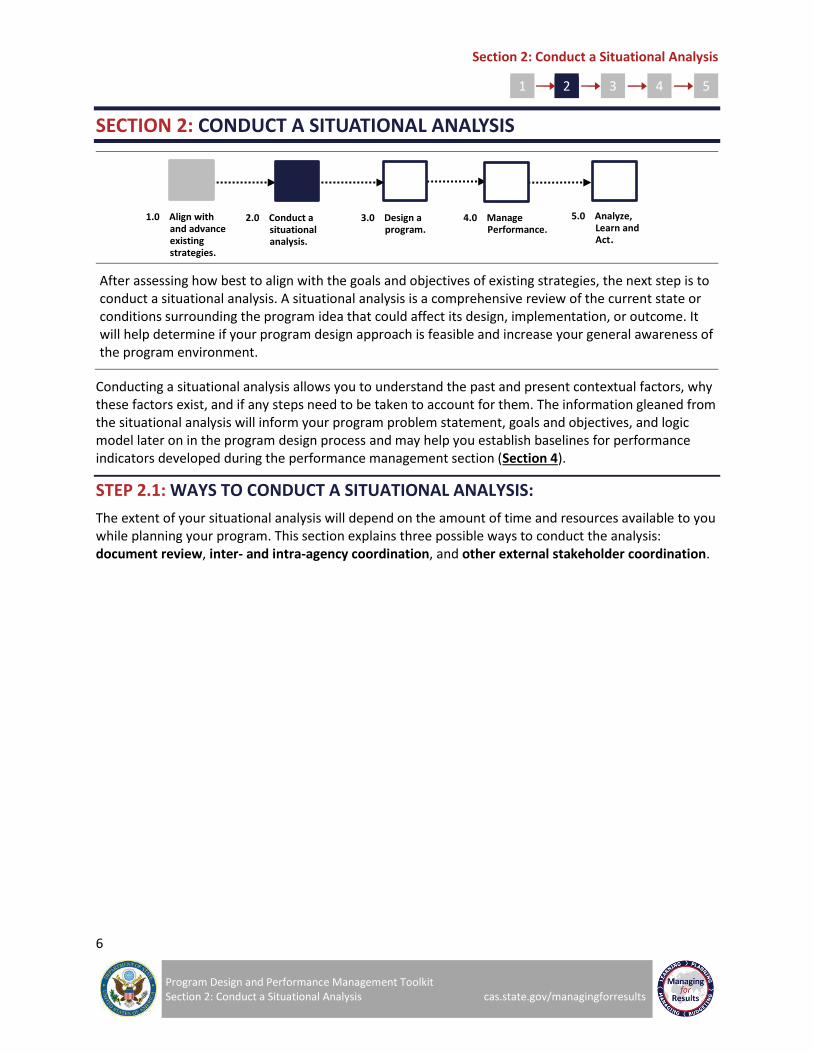
SECTION 2: CONDUCT A SITUATIONAL ANALYSIS
After assessing how best to align with the goals and objectives of existing strategies, the next step is to conduct a situational analysis. A situational analysis is a comprehensive review of the current state or conditions surrounding the program idea that could affect its design, implementation, or outcome. It will help determine if your program design approach is feasible and increase your general awareness of the program environment.
Conducting a situational analysis allows you to understand the past and present contextual factors, why these factors exist, and if any steps need to be taken to account for them. The information gleaned from the situational analysis will inform your program problem statement, goals and objectives, and logic model later on in the program design process and may help you establish baselines for performance indicators developed during the performance management section (Section 4).
STEP 2.1: WAYS TO CONDUCT A SITUATIONAL ANALYSIS:
The extent of your situational analysis will depend on the amount of time and resources available to you while planning your program. This section explains three possible ways to conduct the analysis: document review, inter- and intra-agency coordination, and other external stakeholder coordination.
2.0 Conduct a situational analysis.
4.0 Manage Performance.
5.0 Analyze, Learn and Act.
3.0 Design a program.
1.0 Align with and advance existing strategies.
Section 2: Conduct a Situational Analysis
7
Program Design and Performance Management Toolkit Section 2: Conduct a Situational Analysis cas.state.gov/managingforresults
1 2 3 4 5
1 2 3
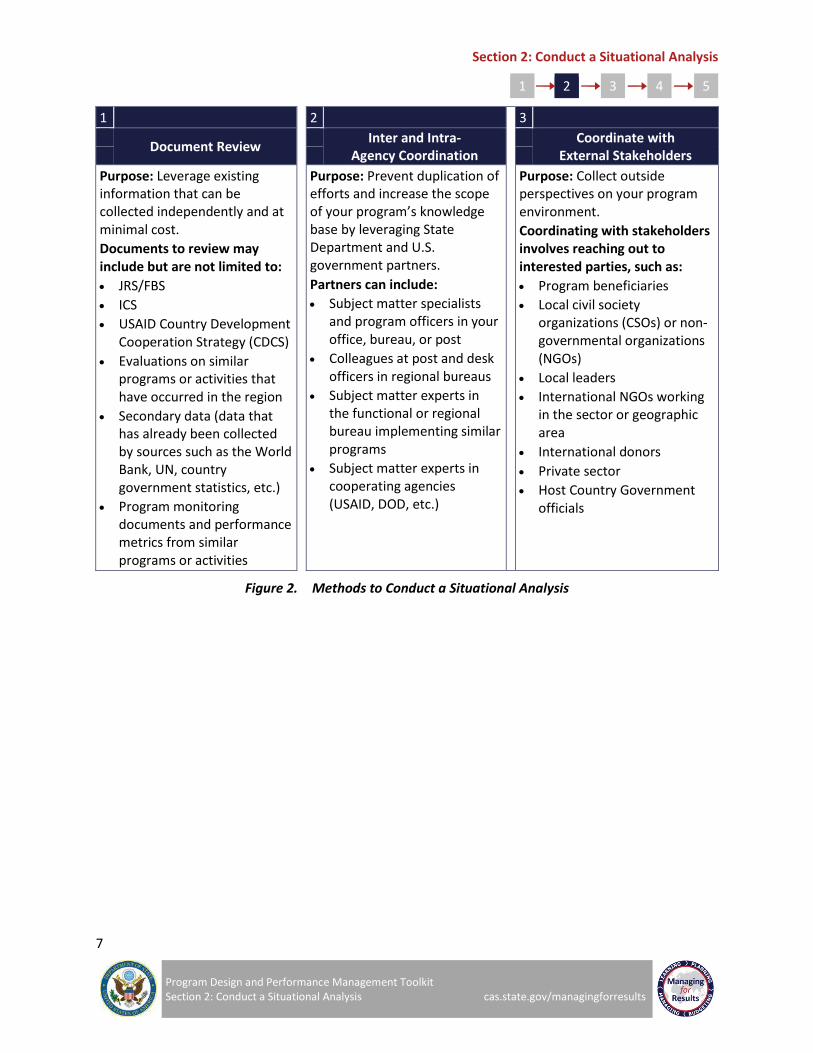
Document Review
Inter and Intra- Agency Coordination
Coordinate with External Stakeholders
Purpose: Leverage existing information that can be collected independently and at minimal cost.
Documents to review may include but are not limited to:
JRS/FBS
ICS
USAID Country Development Cooperation Strategy (CDCS)
Evaluations on similar programs or activities that have occurred in the region
Secondary data (data that has already been collected by sources such as the World Bank, UN, country government statistics, etc.)
Program monitoring documents and performance metrics from similar programs or activities
Purpose: Prevent duplication of efforts and increase the scope of your program’s knowledge base by leveraging State Department and U.S. government partners.
Partners can include:
Subject matter specialists and program officers in your office, bureau, or post
Colleagues at post and desk officers in regional bureaus
Subject matter experts in the functional or regional bureau implementing similar programs
Subject matter experts in cooperating agencies (USAID, DOD, etc.)
Purpose: Collect outside perspectives on your program environment.
Coordinating with stakeholders involves reaching out to interested parties, such as:
Program beneficiaries
Local civil society organizations (CSOs) or non-governmental organizations (NGOs)
Local leaders
International NGOs working in the sector or geographic area
International donors
Private sector
Host Country Government officials
Figure 2. Methods to Conduct a Situational Analysis

Section 2: Conduct a Situational Analysis
8
Program Design and Performance Management Toolkit Section 2: Conduct a Situational Analysis cas.state.gov/managingforresults
1 2 3 4 5
STEP 2.2: TYPES OF SITUATIONAL ANALYSES:
Not every program must undergo the same level of analysis depending on its nature and complexity, but key pieces of information should be obtained to understand if the program approach is possible and necessary. Using the three methodologies in Step 2.1, there are four types of assessments and reviews that should be conducted in your situational analysis:
2.2.1 Internal Assessment reviews what is happening within your own office, bureau, or post.
2.2.2 External Assessment reviews contextual factors that could affect your issue or problem.
2.2.3 Root Cause(s) Analysis looks at causes that are not immediately observable.
2.2.4 Review of the Issue or Problem examines the concern the program is designed to address.
2.2.1: Conduct an Internal Assessment
An internal assessment2 allows you to understand the capabilities within your own office, bureau, or post. It is important to understand the financial, time, and human capital resources of your office, bureau, or post prior to designing a program to validate it is within your capabilities and capacity. Important factors to consider include:
Program budget
Number of personnel available
Amount of time each person has available to dedicate to the program, and available dates
Workforce skills required to design and manage the program
Availability of skills within your office, bureau, or post
Method to procure the desired skills, if unavailable in your office, bureau, or post and where they can be found
Additional training required to design and manage the program, if applicable
Necessary Information Technology (IT) systems are in place within your organization to manage the program, if applicable
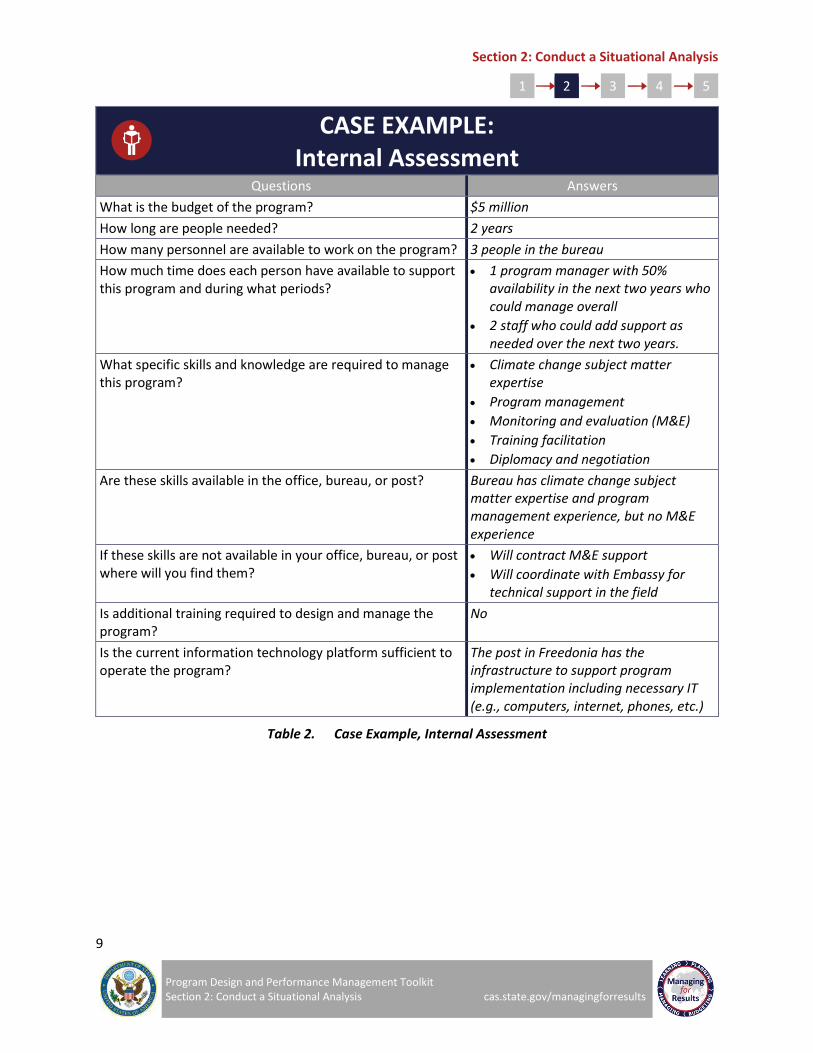
After reviewing the case example below, click here to use the Internal Assessment Tool.
Mary started to design the program by conducting an internal assessment of South Bureau. Her internal assessment was designed to identify the resources and skills her team possesses and to be aware of any potential gaps prior to designing the program. Using the Internal Assessment Tool in Table 2, Mary asked a series of questions to bureau leadership and staff and found that the necessary resources are available to implement the program idea.
Figure 3. Case Example, Internal Assessment Information
2 http://www.thesustainablengo.org/general-management-skills/conducting-an-organizational-situation-analysis
Section 2: Conduct a Situational Analysis
9
Program Design and Performance Management Toolkit Section 2: Conduct a Situational Analysis cas.state.gov/managingforresults
1 2 3 4 5
CASE EXAMPLE: Internal Assessment
Questions Answers
What is the budget of the program? $5 million
How long are people needed? 2 years
How many personnel are available to work on the program? 3 people in the bureau
How much time does each person have available to support this program and during what periods?
1 program manager with 50% availability in the next two years who could manage overall
2 staff who could add support as needed over the next two years.
What specific skills and knowledge are required to manage this program?
Climate change subject matter expertise
Program management
Monitoring and evaluation (M&E)
Training facilitation
Diplomacy and negotiation
Are these skills available in the office, bureau, or post? Bureau has climate change subject matter expertise and program management experience, but no M&E experience
If these skills are not available in your office, bureau, or post where will you find them?
Will contract M&E support
Will coordinate with Embassy for technical support in the field
Is additional training required to design and manage the program?
No
Is the current information technology platform sufficient to operate the program?
The post in Freedonia has the infrastructure to support program implementation including necessary IT (e.g., computers, internet, phones, etc.)
Table 2. Case Example, Internal Assessment

Section 2: Conduct a Situational Analysis
10
Program Design and Performance Management Toolkit Section 2: Conduct a Situational Analysis cas.state.gov/managingforresults
1 2 3 4 5
2.2.2: Conduct an External Assessment
An external assessment is the process of surveying the environmental surroundings where the program will take place to establish baseline context and understand potential opportunities and threats. Certain portions of the external assessment may not apply to domestic programs, to conduct an external assessment use Table 3. Resources to use for an external assessment include but are not limited to:
National or international regularly published surveys and indices
Government statistics
Secondary data (e.g., vulnerability analysis, analytical reports from other agencies, etc.)
Coordination with external stakeholders (e.g., interviews, focus groups, surveys, etc.)
ICS and country-specific strategies from other US and international agencies
F Country Data Analytics packages, F Interagency Network Databank (FIND), or other available data analytics
Factors to consider include but are not limited to:
1. Political/Legal Factors: These are the government actions at any level (e.g., federal, local, municipal, district-wide, regional, national, etc.) that could affect a program, including any law(s) that prohibit or inhibit similar programs.
2. Security Factors: These are the factors that involve information security considerations for processing classified program information, or threat to personnel associated with the program (i.e. State Department employees, implementers, or the stakeholders/recipients of the program). This is a wide range of considerations that may include but are not limited to war or instability in the region, high or critical technical threat location, violent crime rate (e.g., assault, robbery, kidnapping, hate crimes, etc.).
3. Environmental Factors: These are the natural surroundings that may influence the implementation of the planned program including, but not limited to:
– Geography and the cost considerations related to implementing in the planned geographic location (e.g., mountainous, desert, landlocked, rural vs. urban, etc.)
– Health factors (e.g., infectious disease that may inhibit implementation of the program)
– Natural disaster factors (e.g., flooding, hurricane, blizzard, drought, etc.)
– Climate (i.e., seasonal considerations)
These factors may influence the size or scope of the program, cost of the program, or time of year the program can be implemented. The environment may be a major obstacle to implementing the program, but it could also be the very reason the program exists; for example it may be a response to an economic crisis or to a natural disaster.
4. Cultural Factors: These are the societal norms and customs that will influence the implementation of the program. This includes but is not limited to considerations for religion, gender, LGBT issues, ethnicity, language, general cultural expectations, etc.
Section 2: Conduct a Situational Analysis
11
Program Design and Performance Management Toolkit Section 2: Conduct a Situational Analysis cas.state.gov/managingforresults
1 2 3 4 5
5. Economic Factors: These are the external economic factors that should be considered when implementing this program. These include, but are not limited to:
– Costs of operating in the location
– Poverty levels in the location
– Economic differences among ethnicities
– Economic differences among gender
– Factors influencing economic disparities/economic development
– Economic factors influencing participation
6. Institutional Factors: This includes an analysis of specific organizations with whom you may be working and how the program, project, or process may complement or compete with other programs and activities. This may include the processes, attitudes, customs, and behaviors of organizations that may influence the implementation of the program.
7. Infrastructure Factors: This includes the physical infrastructure that the program will be operating in and the access to necessary amenities such as water, power, electricity, physical office space and technology (e.g., cell phones, computers, internet, etc.).
Note: Remember to consider risk throughout the program design process. Please refer to the Teamwork@State website for additional information on risk assessment and management.
After reviewing the case example below, click here to use the External Assessment Tool.
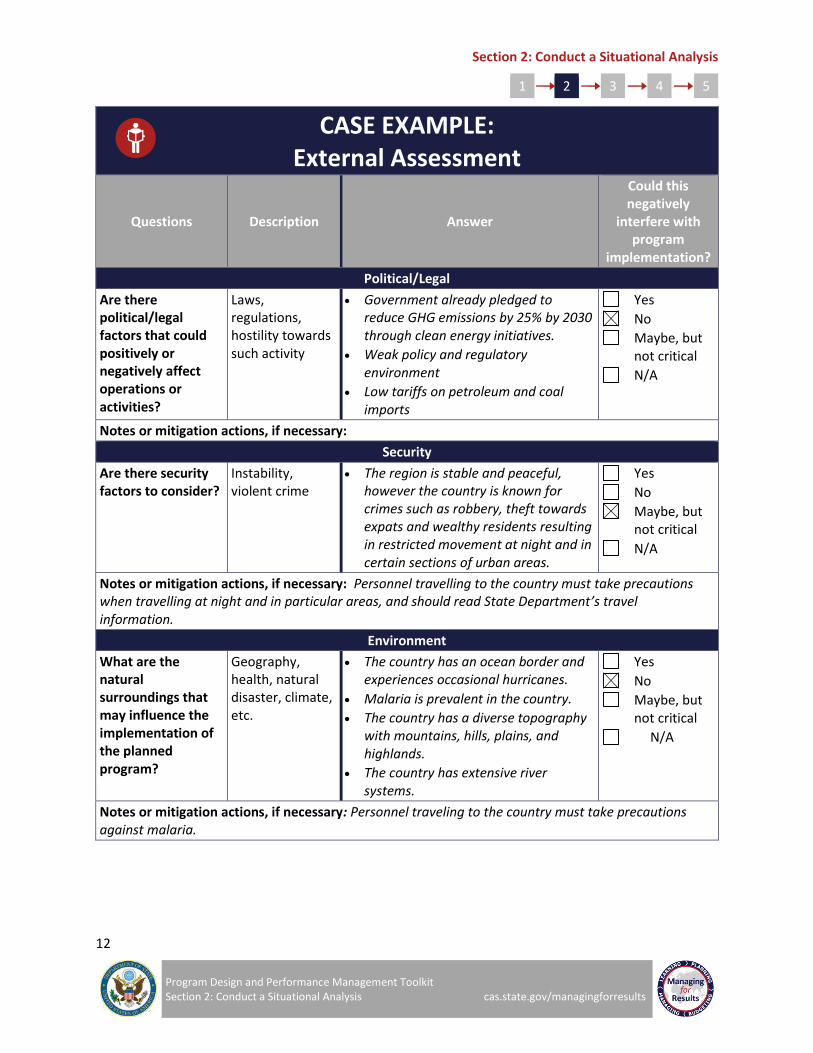
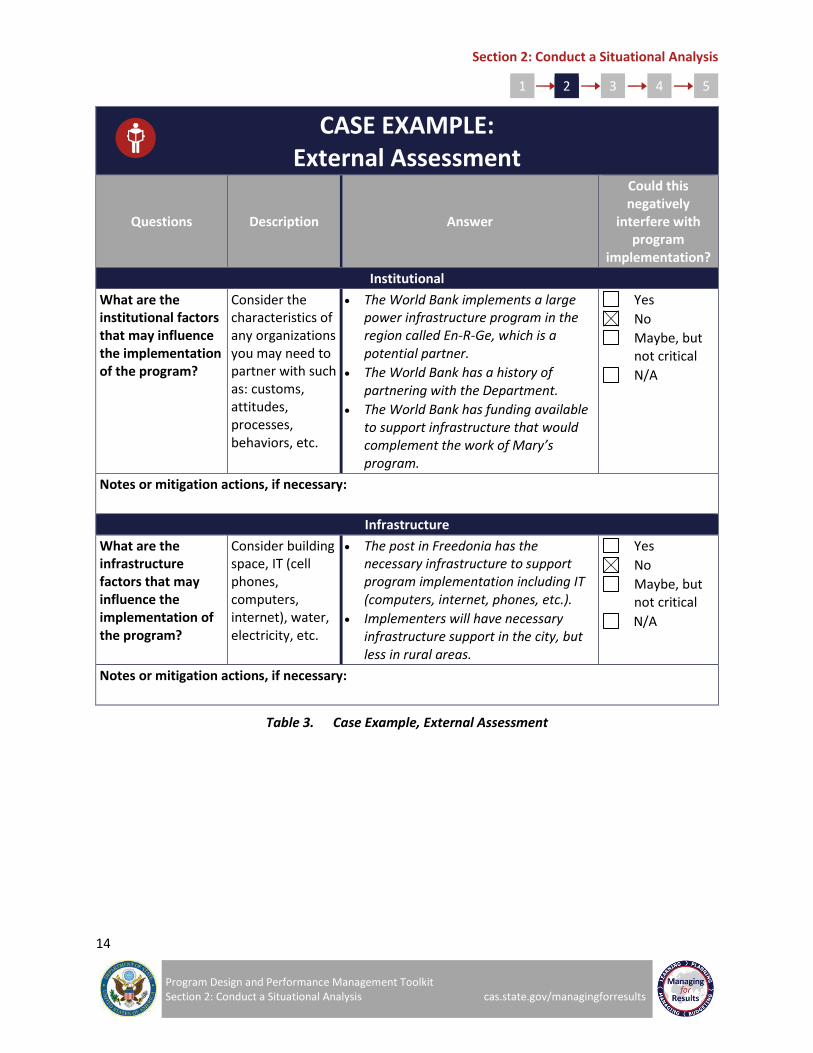
Mary conducted an External Assessment to learn about the environment in which the program would operate, and any key contextual factors that could affect later design steps. She considered each of the factors listed above in her assessment and included the information in Table 3.
Figure 4. Case Example, External Assessment Information
Section 2: Conduct a Situational Analysis
12
Program Design and Performance Management Toolkit Section 2: Conduct a Situational Analysis cas.state.gov/managingforresults
1 2 3 4 5
CASE EXAMPLE: External Assessment
Questions Description Answer
Could this negatively
interfere with program
implementation?
Political/Legal
Are there political/legal factors that could positively or negatively affect operations or activities?
Laws, regulations, hostility towards such activity
Government already pledged to reduce GHG emissions by 25% by 2030 through clean energy initiatives.
Weak policy and regulatory environment
Low tariffs on petroleum and coal imports
Yes
No
Maybe, but not critical
N/A
Notes or mitigation actions, if necessary:
Security
Are there security factors to consider?
Instability, violent crime
The region is stable and peaceful, however the country is known for crimes such as robbery, theft towards expats and wealthy residents resulting in restricted movement at night and in certain sections of urban areas.
Yes
No
Maybe, but not critical
N/A
Notes or mitigation actions, if necessary: Personnel travelling to the country must take precautions when travelling at night and in particular areas, and should read State Department’s travel information.
Environment
What are the natural surroundings that may influence the implementation of the planned program?
Geography, health, natural disaster, climate, etc.
The country has an ocean border and experiences occasional hurricanes.
Malaria is prevalent in the country.
The country has a diverse topography with mountains, hills, plains, and highlands.
The country has extensive river systems.
Yes
No
Maybe, but not critical
N/A
Notes or mitigation actions, if necessary: Personnel traveling to the country must take precautions against malaria.

Section 2: Conduct a Situational Analysis
13
Program Design and Performance Management Toolkit Section 2: Conduct a Situational Analysis cas.state.gov/managingforresults
1 2 3 4 5
CASE EXAMPLE: External Assessment
Questions Description Answer
Could this negatively
interfere with program
implementation?
Culture
What are the cultural factors that may influence the implementation of the program?
Consider the societal norms and customs that will influence the implementation of the program.
General population and economic sector is heavily reliant on coal sector.
Yes
No
Maybe, but not critical
N/A
Notes or mitigation actions, if necessary:
Economics
What are the economic factors that may influence the implementation of the program?
Consider the factors external to your office, bureau, or post such as the economy of the country in which the program will be implemented, economic well-being of the customers/ recipients, the costs of operating, etc.
Clean energy sector is extremely underdeveloped. In addition to a policy framework, the country needs private investment to support new clean energy infrastructure, operations, and maintenance.
Per-capita income is low and many existing businesses do not have spare capital so costs will need to be comparable to the cost of existing energy sources.
Coal sector is highly integrated into economic fabric, so there could be resistance to new energy sources.
People are unaware of business opportunities clean energy development could bring to region.
Yes
No
Maybe, but not critical
N/A
Notes or mitigation actions, if necessary: In addition to helping the government establish a policy framework for clean energy, the program must help attract investors and local entrepreneurs.
Section 2: Conduct a Situational Analysis
14
Program Design and Performance Management Toolkit Section 2: Conduct a Situational Analysis cas.state.gov/managingforresults
1 2 3 4 5
CASE EXAMPLE: External Assessment
Questions Description Answer
Could this negatively
interfere with program
implementation?
Institutional
What are the institutional factors that may influence the implementation of the program?
Consider the characteristics of any organizations you may need to partner with such as: customs, attitudes, processes, behaviors, etc.
The World Bank implements a large power infrastructure program in the region called En-R-Ge, which is a potential partner.
The World Bank has a history of partnering with the Department.
The World Bank has funding available to support infrastructure that would complement the work of Mary’s program.
Yes
No
Maybe, but not critical
N/A
Notes or mitigation actions, if necessary:
Infrastructure
What are the infrastructure factors that may influence the implementation of the program?
Consider building space, IT (cell phones, computers, internet), water, electricity, etc.
The post in Freedonia has the necessary infrastructure to support program implementation including IT (computers, internet, phones, etc.).
Implementers will have necessary infrastructure support in the city, but less in rural areas.
Yes
No
Maybe, but not critical
N/A
Notes or mitigation actions, if necessary:
Table 3. Case Example, External Assessment

Section 2: Conduct a Situational Analysis
15
Program Design and Performance Management Toolkit Section 2: Conduct a Situational Analysis cas.state.gov/managingforresults
1 2 3 4 5
2.2.3: Determine the Root Cause(s)
A Root Cause Analysis is a method used to take a closer look at the source of the problem(s) or issue(s) your program will address. Often, the symptoms of a problem are observable, but the problem itself is not. In order to effectively address the true problem, one must engage in deeper analysis to uncover its root cause(s).
One way to do a root cause analysis is through the Five Whys Approach as seen in Table 4. The Five Whys Approach is a technique where you ask a series of “why” questions starting with an undesirable symptom you would like to address. From there, ask why that particular situation is happening. Continue asking why each situation is happening until you reach what you believe to be the original cause of the undesirable symptom. You may not find it necessary to complete all five “Whys” or may find it necessary to ask more questions.
For additional information on using the Five Whys Tool – visit the Teamwork@State website.
The Five Whys to access root causes helps you dig deeper than what is observable.
Observable Symptoms of the Problem
Use the Five Whys to access Root Cause of the Problem
Figure 5. Root Causes Analysis Tree
After reviewing the case example below, click here to use the Five Whys Tool.
Mary and her team used the Five Whys Tool to understand the root cause of Freedonia’s high rates of GHG emissions. Understanding the root cause will allow Mary’s team to design a program that addresses the correct issues. They started by asking, “Why are there high rates of GHG emissions?” and kept asking why. Table 4 shows how Mary’s team used the Five Whys Tool.
Figure 6. Case Example, Five Whys Information

Section 2: Conduct a Situational Analysis
16
Program Design and Performance Management Toolkit Section 2: Conduct a Situational Analysis cas.state.gov/managingforresults
1 2 3 4 5
CASE EXAMPLE: Five Whys
Component Description Answer
What is the undesirable symptom you would like to address?
The visible result of the underlying root cause. The problem we would like to solve.
The country has high rates of GHG emissions.
First Why:
Why is this happening?
Why does the country have high rates of GHG emissions?
The country has a high dependence on coal-burning energy.
Second Why:
Why is this happening?
Why does the country have high dependence on coal energy?
The country lacks the infrastructure for clean energy.
Third Why:
Why is this happening?
Why does the country lack the infrastructure for clean energy?
The government does not have the funding for large-scale infrastructure projects and lacks the necessary frameworks, regulations, and policies to implement a clean energy program.
The private sector and general population do not demand clean energy.
Fourth Why:
Why is this happening?
Why does the government lack the necessary frameworks, regulations, and policies?
Why does the private sector and population not demand clean energy?
Historically, the country’s energy has come from coal; its policies and infrastructure reflect this. Most people in Freedonia are more concerned with the cost of energy than its source.
Fifth Why:
Why is this happening?
Why don’t the people of Freedonia care where their energy comes from?
The people of Freedonia are unconcerned or unaware of the harmful health effects of burning coal or the economic possibilities new businesses could bring to the area.
Team Discussion
Does the answer to the fifth why reveal a root cause to address?
Yes. Increasing the capacity of Freedonia’s government is critical to implementing a clean energy program and decreasing GHG emissions. It is also critical to raise awareness in the private sector and the general population about the health and economic benefits of clean energy.
Table 4. Case Example, Five Whys

Section 2: Conduct a Situational Analysis
17
Program Design and Performance Management Toolkit Section 2: Conduct a Situational Analysis cas.state.gov/managingforresults
1 2 3 4 5
2.2.4: Conduct a Review of the Issue
The review of the issue is a close examination of the problem you would like to solve that takes into account the larger context of the external assessment and a greater understanding of the root causes. This step allows for deeper understanding of stakeholders and/or beneficiaries and what efforts are occurring in the geographic area related to this problem.
Information includes but is not limited to:
1. Beneficiaries or customers of the program
After learning the root causes and perpetuating factors of the problem, you can understand who the beneficiaries or customers of your program should be. Asking questions such as:
– Who is the relevant audience for the program? (e.g., group, age, gender, ethnicity, location, etc.)
– What are their needs?
– Why do those needs exist? (referring to external assessment and root cause analysis)
– How can their needs be met considering the root cause(s) and available resources?
2. The systems, culture, and behaviors that keep the problem in existence
Using information from the external assessment, consider the systems, behaviors, culture, beliefs, power structures, economics, security, and other factors that perpetuate an issue or problem.
3. Other actors and potential partners and relevant stakeholders
– It is important to ask if there are other organizations (federal agencies, NGOs, CSOs, local leaders, private sector partners, etc.) working in this area. Knowing this information can help you prevent a duplication of efforts, discover potential partners with whom you can work, and how you can learn from the other programs.
– Stakeholders include anyone who may be affected during or after the program implementation.
4. Unmet need for existing programs
In the process of identifying other factors, it is beneficial to assess the strengths and weakness of the programs in place. This can help you learn what programs have been successful and why. This analysis can help identify where there are gaps in current and past programs and where your program can fill a void.

Section 2: Conduct a Situational Analysis
18
Program Design and Performance Management Toolkit Section 2: Conduct a Situational Analysis cas.state.gov/managingforresults
1 2 3 4 5
After reviewing the case example below, click here to use the Review of the Issue or Problem Tool.
Mary conducted a document review and coordinated with interagency stakeholders to review the issue of GHG emissions in Freedonia. This information is important as it will inform the development of the problem statement, the goal(s) and objectives, the program logic, etc. The information from this analysis can be found in Table 5.
Figure 7. Case Example, Review of the Issue or Problem Information
“One of the great mistakes is to judge policies and programs by their intentions rather than their results.”
– Milton Friedman

Section 2: Conduct a Situational Analysis
19
Program Design and Performance Management Toolkit Section 2: Conduct a Situational Analysis cas.state.gov/managingforresults
1 2 3 4 5
CASE EXAMPLE: Review of the Issue or Problem
Questions Description Answers
What are the root causes of the problem?
The underlying systemic causes of the problem inserted from Step 2.2.
Lack of infrastructure
Lack of capacity to develop frameworks, regulations, and policies needed to implement a clean energy program
Lack of funds
Lack of awareness of health and economic benefits of clean energy
What are the systems and behaviors that keep the problem in existence?
The systems, behaviors, culture, beliefs, power structures, economics, instability, etc. that perpetuate an issue/problem.
Existing frameworks, regulations, and policies do not promote clean energy and reinforce coal as a primary energy source.
Reliance on coal for commercial and residential energy needs
Who are the beneficiaries/ customers of the program?
Who will benefit most from the program? Who is in greatest need?
Freedonia Government
People of Freedonia
Businesses in Freedonia
What are the needs of those recipients?
Consider the population you would like to target. What are their greatest needs?
Improved infrastructure
New frameworks, regulations, and policies
Funding and investment
Decreased health risks from poor air quality
How can these needs be met?
Taking into account the root causes of the problem, immediate and long-term needs, how can the program address the needs of the recipients?
Support the building of hydro and wind power infrastructure by:
– Building capacity and providing technical assistance to create sound frameworks, regulations, and policies and generate funding and investments;
– Raising public awareness of the benefits of clean energy.
Who are the other actors or potential partners working in the area?
Consider other actors in the area and sector who may be implementing similar programs.
During the external assessment Mary and her team learned that the World Bank was implemented the En-R-Ge program, a power infrastructure program in Red and Blue Districts that focused on clean energy sources.
Table 5. Case Example, Review of the Issue or Problem
Section 2: Conduct a Situational Analysis
20
Program Design and Performance Management Toolkit Section 2: Conduct a Situational Analysis cas.state.gov/managingforresults
1 2 3 4 5
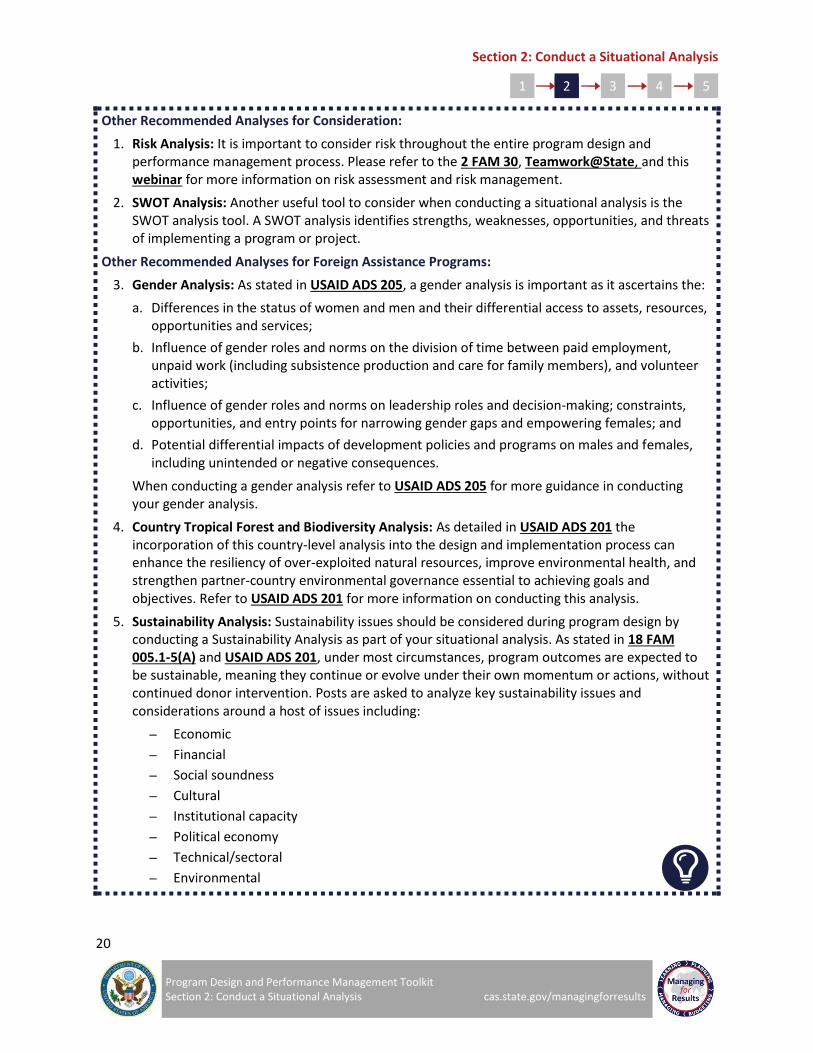
Other Recommended Analyses for Consideration:
1. Risk Analysis: It is important to consider risk throughout the entire program design and performance management process. Please refer to the 2 FAM 30, Teamwork@State, and this webinar for more information on risk assessment and risk management.
2. SWOT Analysis: Another useful tool to consider when conducting a situational analysis is the SWOT analysis tool. A SWOT analysis identifies strengths, weaknesses, opportunities, and threats of implementing a program or project.
Other Recommended Analyses for Foreign Assistance Programs:
3. Gender Analysis: As stated in USAID ADS 205, a gender analysis is important as it ascertains the:
a. Differences in the status of women and men and their differential access to assets, resources, opportunities and services;
b. Influence of gender roles and norms on the division of time between paid employment, unpaid work (including subsistence production and care for family members), and volunteer activities;
c. Influence of gender roles and norms on leadership roles and decision-making; constraints, opportunities, and entry points for narrowing gender gaps and empowering females; and
d. Potential differential impacts of development policies and programs on males and females, including unintended or negative consequences.
When conducting a gender analysis refer to USAID ADS 205 for more guidance in conducting your gender analysis.
4. Country Tropical Forest and Biodiversity Analysis: As detailed in USAID ADS 201 the incorporation of this country-level analysis into the design and implementation process can enhance the resiliency of over-exploited natural resources, improve environmental health, and strengthen partner-country environmental governance essential to achieving goals and objectives. Refer to USAID ADS 201 for more information on conducting this analysis.
5. Sustainability Analysis: Sustainability issues should be considered during program design by conducting a Sustainability Analysis as part of your situational analysis. As stated in 18 FAM 005.1-5(A) and USAID ADS 201, under most circumstances, program outcomes are expected to be sustainable, meaning they continue or evolve under their own momentum or actions, without continued donor intervention. Posts are asked to analyze key sustainability issues and considerations around a host of issues including:
– Economic
– Financial
– Social soundness
– Cultural
– Institutional capacity
– Political economy
– Technical/sectoral
– Environmental
Program Design and Performance Management Toolkit
Section 3: Design a Program
By the end of this section, offices, bureaus, and posts will
develop:
Problem Statement
Program Goals and Objectives
Logic Model and Theory of Change
Program Summary
3
Section 3: Design a Program
22
Program Design and Performance Management Toolkit Section 3: Design a Program cas.state.gov/managingforresults
1 2 3 4 5
SECTION 3: DESIGN A PROGRAM
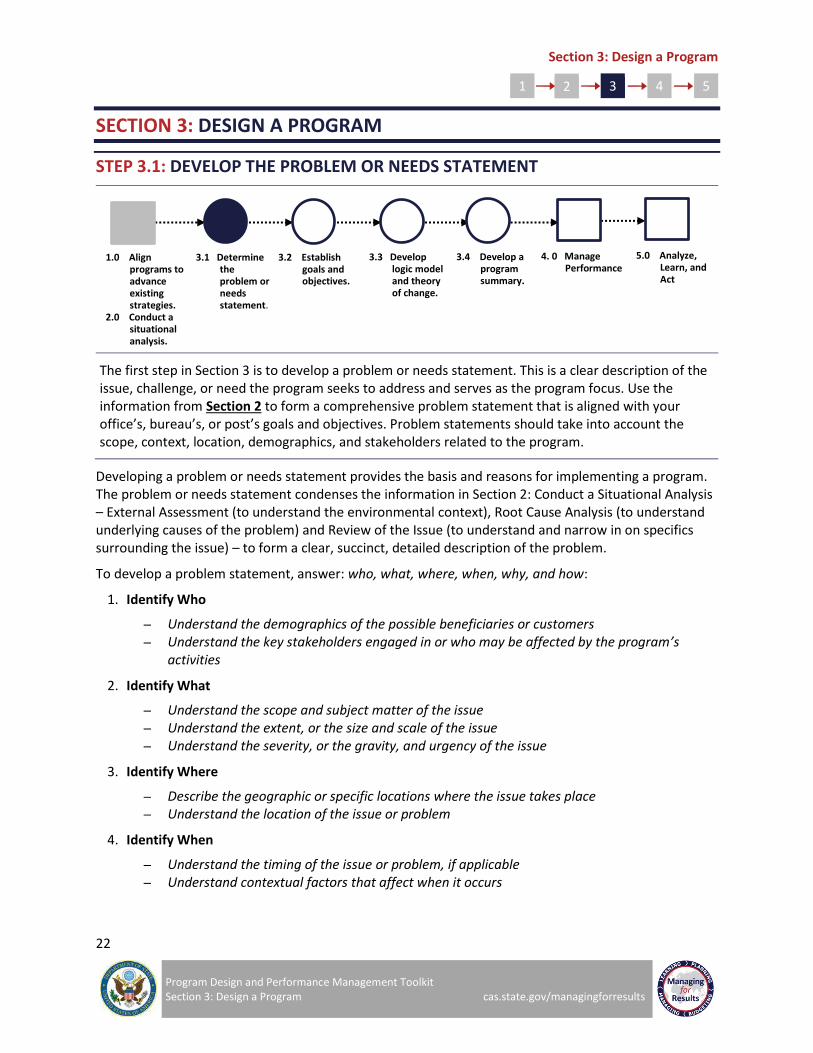
STEP 3.1: DEVELOP THE PROBLEM OR NEEDS STATEMENT
The first step in Section 3 is to develop a problem or needs statement. This is a clear description of the issue, challenge, or need the program seeks to address and serves as the program focus. Use the information from Section 2 to form a comprehensive problem statement that is aligned with your office’s, bureau’s, or post’s goals and objectives. Problem statements should take into account the scope, context, location, demographics, and stakeholders related to the program.
Developing a problem or needs statement provides the basis and reasons for implementing a program. The problem or needs statement condenses the information in Section 2: Conduct a Situational Analysis – External Assessment (to understand the environmental context), Root Cause Analysis (to understand underlying causes of the problem) and Review of the Issue (to understand and narrow in on specifics surrounding the issue) – to form a clear, succinct, detailed description of the problem.
To develop a problem statement, answer: who, what, where, when, why, and how:
1. Identify Who
– Understand the demographics of the possible beneficiaries or customers – Understand the key stakeholders engaged in or who may be affected by the program’s
activities
2. Identify What
– Understand the scope and subject matter of the issue – Understand the extent, or the size and scale of the issue – Understand the severity, or the gravity, and urgency of the issue
3. Identify Where
– Describe the geographic or specific locations where the issue takes place – Understand the location of the issue or problem
4. Identify When
– Understand the timing of the issue or problem, if applicable – Understand contextual factors that affect when it occurs
1.0 Align programs to advance existing strategies.
2.0 Conduct a situational analysis.
3.1 Determine the problem or needs statement.
3.3 Develop logic model and theory of change.
3.4 Develop a program summary.
5.0 Analyze, Learn, and Act
4. 0 Manage Performance
3.2 Establish goals and objectives.
Section 3: Design a Program
23
Program Design and Performance Management Toolkit Section 3: Design a Program cas.state.gov/managingforresults
1 2 3 4 5
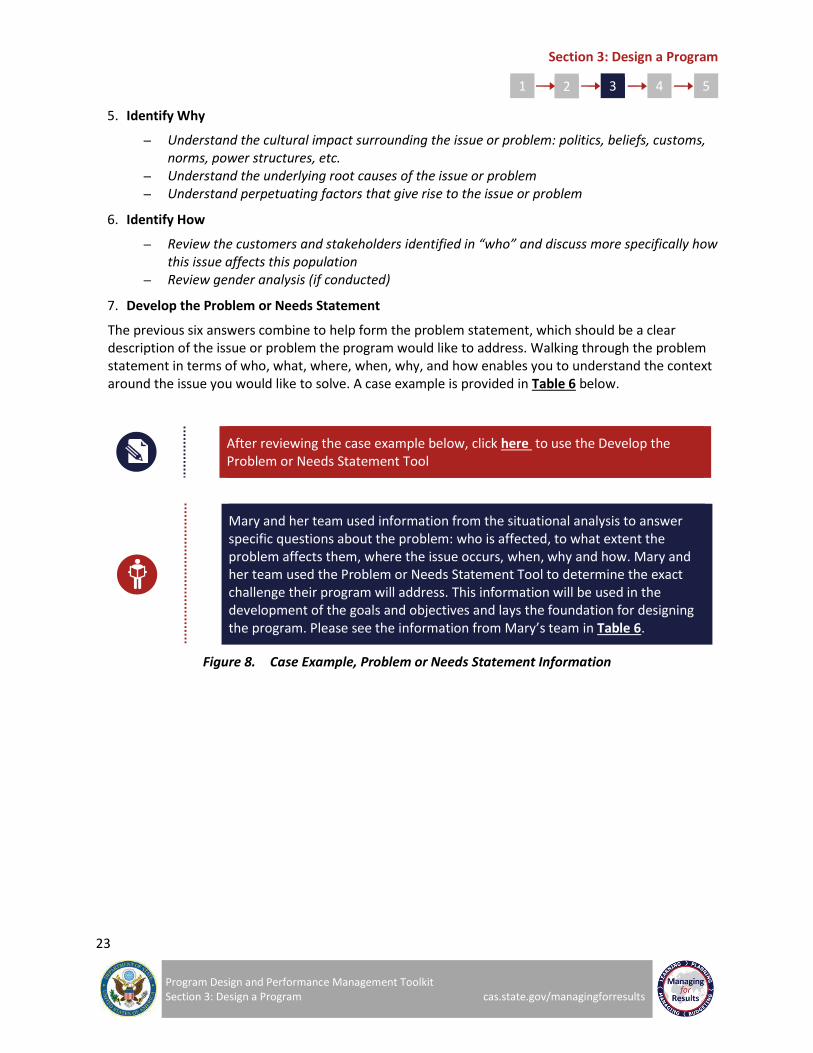
5. Identify Why
– Understand the cultural impact surrounding the issue or problem: politics, beliefs, customs, norms, power structures, etc.
– Understand the underlying root causes of the issue or problem – Understand perpetuating factors that give rise to the issue or problem
6. Identify How
– Review the customers and stakeholders identified in “who” and discuss more specifically how this issue affects this population
– Review gender analysis (if conducted)
7. Develop the Problem or Needs Statement
The previous six answers combine to help form the problem statement, which should be a clear description of the issue or problem the program would like to address. Walking through the problem statement in terms of who, what, where, when, why, and how enables you to understand the context around the issue you would like to solve. A case example is provided in Table 6 below.
After reviewing the case example below, click here to use the Develop the Problem or Needs Statement Tool
Mary and her team used information from the situational analysis to answer specific questions about the problem: who is affected, to what extent the problem affects them, where the issue occurs, when, why and how. Mary and her team used the Problem or Needs Statement Tool to determine the exact challenge their program will address. This information will be used in the development of the goals and objectives and lays the foundation for designing the program. Please see the information from Mary’s team in Table 6.
Figure 8. Case Example, Problem or Needs Statement Information
Section 3: Design a Program
24
Program Design and Performance Management Toolkit Section 3: Design a Program cas.state.gov/managingforresults
1 2 3 4 5
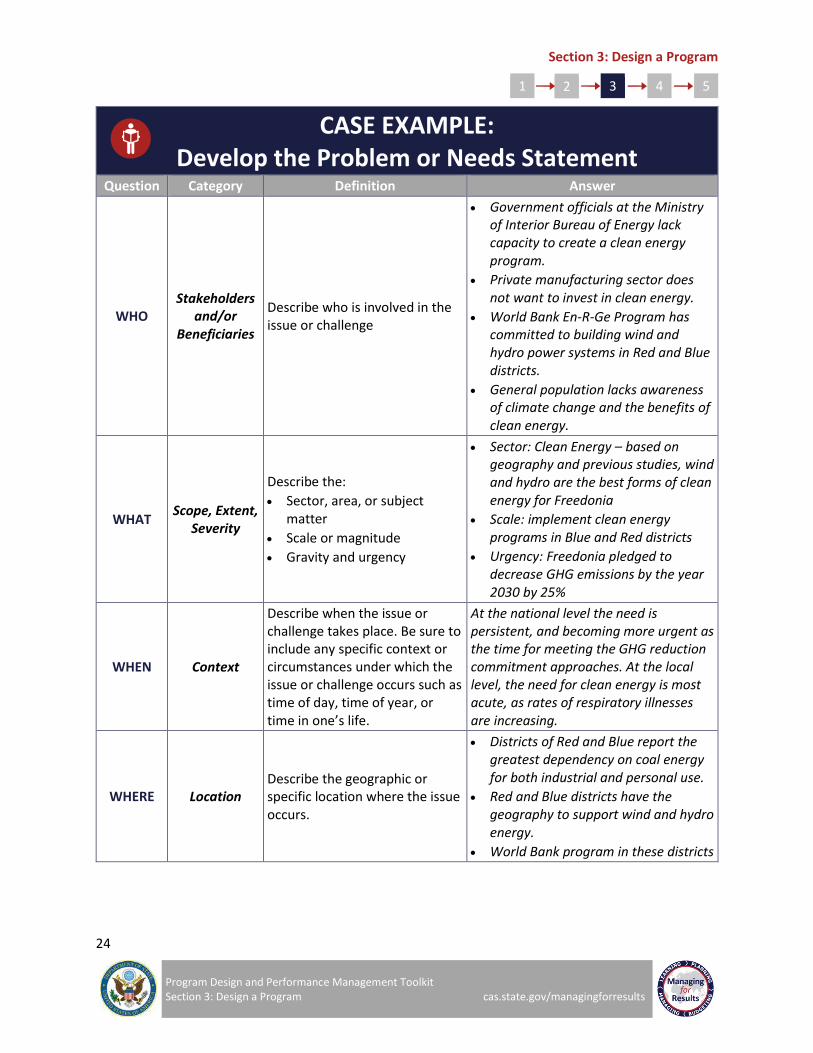
CASE EXAMPLE: Develop the Problem or Needs Statement
Question Category Definition Answer
WHO Stakeholders
and/or Beneficiaries
Describe who is involved in the issue or challenge
Government officials at the Ministry of Interior Bureau of Energy lack capacity to create a clean energy program.
Private manufacturing sector does not want to invest in clean energy.
World Bank En-R-Ge Program has committed to building wind and hydro power systems in Red and Blue districts.
General population lacks awareness of climate change and the benefits of clean energy.
WHAT Scope, Extent,
Severity
Describe the:
Sector, area, or subject matter
Scale or magnitude
Gravity and urgency
Sector: Clean Energy – based on geography and previous studies, wind and hydro are the best forms of clean energy for Freedonia
Scale: implement clean energy programs in Blue and Red districts
Urgency: Freedonia pledged to decrease GHG emissions by the year 2030 by 25%
WHEN Context
Describe when the issue or challenge takes place. Be sure to include any specific context or circumstances under which the issue or challenge occurs such as time of day, time of year, or time in one’s life.
At the national level the need is persistent, and becoming more urgent as the time for meeting the GHG reduction commitment approaches. At the local level, the need for clean energy is most acute, as rates of respiratory illnesses are increasing.
WHERE Location Describe the geographic or specific location where the issue occurs.
Districts of Red and Blue report the greatest dependency on coal energy for both industrial and personal use.
Red and Blue districts have the geography to support wind and hydro energy.
World Bank program in these districts

Section 3: Design a Program
25
Program Design and Performance Management Toolkit Section 3: Design a Program cas.state.gov/managingforresults
1 2 3 4 5
CASE EXAMPLE: Develop the Problem or Needs Statement
Question Category Definition Answer
WHY Causes Describe the root causes of the issue or challenge.
Lack of infrastructure
Lack of capacity to develop frameworks, regulations, and policies needed to implement a clean energy program
Lack of funds
Lack of awareness of health and economic benefits of clean energy
HOW Effect How does the issue affect the
customer or beneficiary?
Burning coal has polluted the air and led to a high incidence of respiratory illness.
The pollution has made it unfeasible to develop a tourist industry.
There are no clean energy jobs in Freedonia.
Problem Statement
Using the information described in the six categories above, write a detailed problem statement to guide the program design process.
Current GHG emission levels should be curbed or reduced to improve long-term health and economic outcomes in Freedonia, but the government lacks the capacity to create and implement the policy and regulatory frameworks necessary to develop a Clean Energy sector and citizens are not aware of the benefits of clean energy sources.
Table 6. Case Example, Problem or Needs Statement
Section 3: Design a Program
26
Program Design and Performance Management Toolkit Section 3: Design a Program cas.state.gov/managingforresults
1 2 3 4 5
STEP 3.2: DEVELOP PROGRAM GOALS AND OBJECTIVES
The terms goals and objectives are often used interchangeably, as both point toward the anticipated results of the program, but each serves a different purpose. Goals are broad and indicate overarching aims that the program contributes to, but may not necessarily be achieved within the timeframe of the program. Objectives are narrower, more specific, and should be realized within the program timeframe. Program objectives should articulate desired results that will help accomplish program goals. There are usually two to five program objectives per program goal. Note that goals and objectives can be created separately, or as part of your logic model exercise described in Step 3.3 of the Toolkit.
Program Goal(s) explain the overall intent or purpose of the program to which program objectives and subsequent activities are expected to contribute. Goal(s) focus on the desired outcomes. Program goal(s) should be:
Broad and visionary: Program goals are ambitious in nature but also realistic. They should be specific enough to clearly communicate program aims, express future direction and vision by using active or directional verbs, and avoid overly technical terms or acronyms.
Long-term: Program goals may extend beyond the timeframe of the program.
Not program resource-dependent: Program goals should not be limited by program resources because they represent a broader desired end state to which the program is contributing.
Strategy alignment: Program goals should align with and advance existing strategies.
Objectives are the highest level result the program can affect or achieve towards accomplishment of the program goal(s). They are statements of the condition(s) or state(s) the program is expected to achieve within the timeframe and resources of the program. To enable sound performance management, objectives should ideally incorporate SMART principles: Specific, Measureable, Achievable, Relevant, and Time-bound.
Specific: Describes the desired result in concrete and clear terms such that anyone reading it should interpret it in the same way
Measurable: Can be evaluated and/or assessed against some standard such that it is possible to know when the objective is met
Achievable: Attainable within allotted time and resources
Relevant: Linked to achieving the program goals
1.0 Align programs to advance existing strategies.
2.0 Conduct a situational analysis.
3.1 Determine the problem or needs statement.
3.3 Develop logic model and theory of change.
3.4 Develop a program summary.
5.0 Analyze, Learn, and Act
4. 0 Manage Performance
3.2 Establish goals and objectives.
Section 3: Design a Program
27
Program Design and Performance Management Toolkit Section 3: Design a Program cas.state.gov/managingforresults
1 2 3 4 5
Time-Bound: If applicable, describes when the objective will be complete and any check points relevant to program goals, activities, or resources
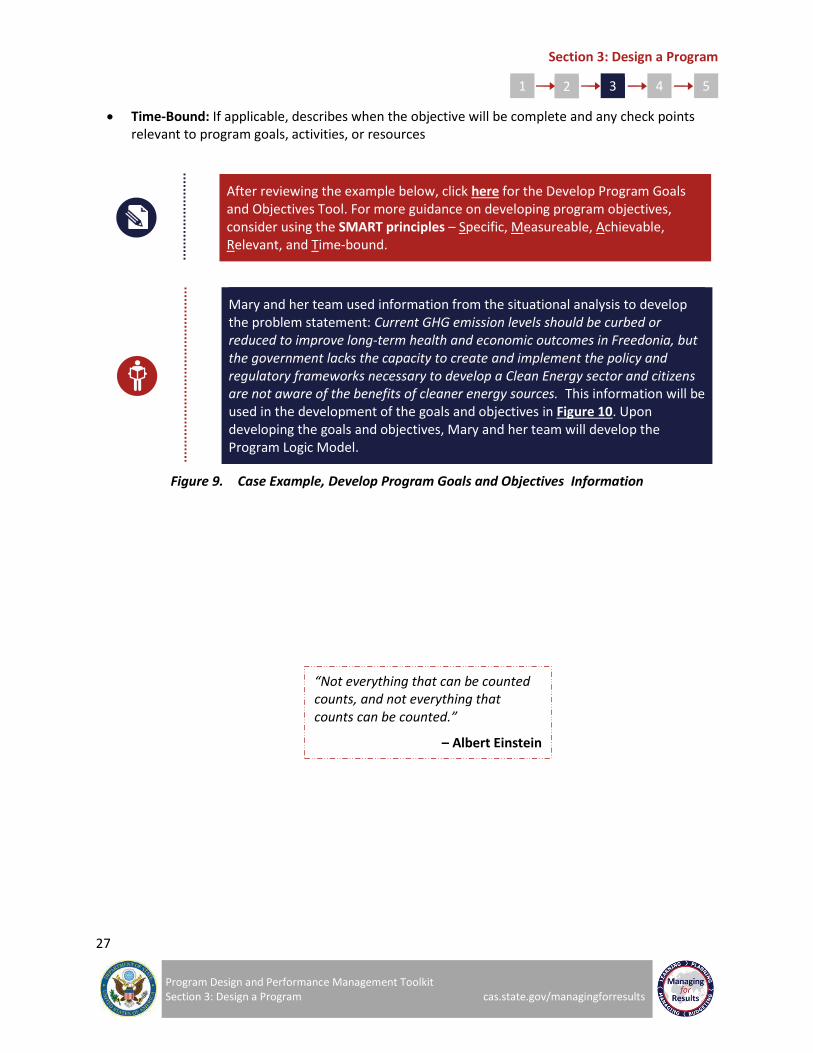
After reviewing the example below, click here for the Develop Program Goals and Objectives Tool. For more guidance on developing program objectives, consider using the SMART principles – Specific, Measureable, Achievable, Relevant, and Time-bound.
Mary and her team used information from the situational analysis to develop the problem statement: Current GHG emission levels should be curbed or reduced to improve long-term health and economic outcomes in Freedonia, but the government lacks the capacity to create and implement the policy and regulatory frameworks necessary to develop a Clean Energy sector and citizens are not aware of the benefits of cleaner energy sources. This information will be used in the development of the goals and objectives in Figure 10. Upon developing the goals and objectives, Mary and her team will develop the Program Logic Model.
Figure 9. Case Example, Develop Program Goals and Objectives Information
“Not everything that can be counted counts, and not everything that counts can be counted.”
– Albert Einstein

Section 3: Design a Program
28
Program Design and Performance Management Toolkit Section 3: Design a Program cas.state.gov/managingforresults
1 2 3 4 5
CASE EXAMPLE: Develop Program Goals and Objectives
Problem Statement
Current GHG emission levels should be curbed or reduced to improve long-term health and economic outcomes in Freedonia, but the government lacks the capacity to create and implement the policy and regulatory frameworks necessary to develop a clean energy sector and citizens are not aware of the benefits of cleaner energy sources.
Program Goal
Increase the supply of and demand for clean forms of energy as a means to decrease GHG emissions and improve health and economic outcomes.
Objective 1 Objective 2
Increase capacity of the national government to create and implement regulatory frameworks and policies to promote and sustain a clean energy sector.
Increase public awareness of and demand for clean energy.
Figure 10. Case Example, Program Goals and Objectives
A
1 2
Section 3: Design a Program
29
Program Design and Performance Management Toolkit Section 3: Design a Program cas.state.gov/managingforresults
1 2 3 4 5
STEP 3.3: DEVELOP A PROGRAM LOGIC MODEL AND THEORY OF CHANGE
A logic model is a tool to systematically document and visually represent program investments, activities, desired results, and the relationship between them. The process of creating a logic model is one of the most critical steps in both program design as well as performance management. It allows the program team and key stakeholders to work through how and why they think the program will work to achieve established goals and objectives and it becomes the basis for designing monitoring and evaluation plans. Establishing what the program is expected to achieve sets the foundation for what to monitor and evaluate progress against. This section describes each logic model component and how to work through its completion. A theory of change is a brief statement that ties your logic model together by summarizing why, based on available evidence and consideration of other possible paths, and the changes described in your logic model that are expected to occur.
One of the key benefits of creating a logic model is that it gets all program stakeholders on the same page in terms of how and why the program will be implemented. When creating a logic model, it is therefore critical that all key stakeholders are involved or consulted, including program implementers, managers, key decision-makers, monitoring and evaluation staff, and possibly even intended program beneficiaries or customers.
The components of a logic model include:
Short- and Long-Term Outcomes – what we achieve
Outputs – what we get
Activities – what we do
Inputs – what we invest
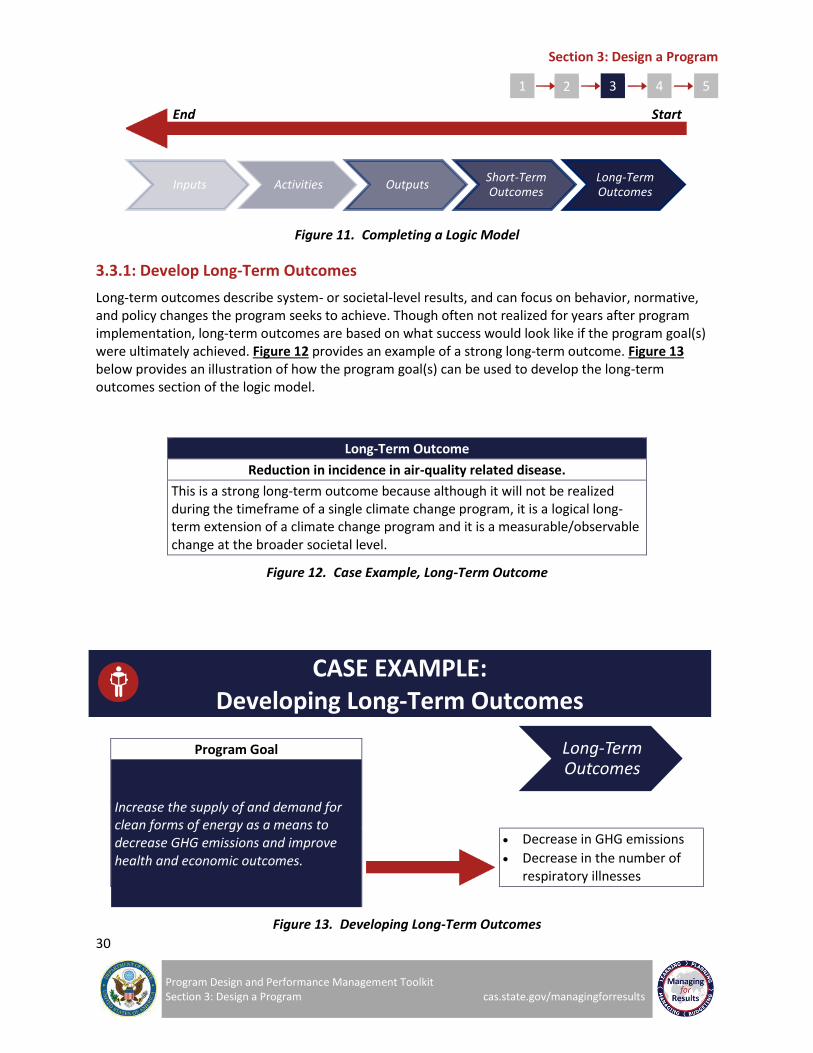
Using the diagram in Figure 11 as a reference point, each component from left to right is intended to build on or result from the previous one. Outcomes are the intermediate and long-term results of the outputs. Outputs are the results of the activities and activities are based on the planned program inputs. When initially creating a logic model, however, it is most helpful to start from right to left whereby stakeholders first discuss and agree upon the intended outcomes so the other components lead to these desired long-term results.
1.0 Align programs to advance existing strategies.
2.0 Conduct a situational analysis.
3.1 Determine the problem or needs statement.
3.3 Develop logic model and theory of change.
3.4 Develop a program summary.
5.0 Analyze, Learn, and Act.
4. 0 Manage Performance.
3.2 Establish goals and objectives.
Section 3: Design a Program
30
Program Design and Performance Management Toolkit Section 3: Design a Program cas.state.gov/managingforresults
1 2 3 4 5
Figure 11. Completing a Logic Model
3.3.1: Develop Long-Term Outcomes
Long-term outcomes describe system- or societal-level results, and can focus on behavior, normative, and policy changes the program seeks to achieve. Though often not realized for years after program implementation, long-term outcomes are based on what success would look like if the program goal(s) were ultimately achieved. Figure 12 provides an example of a strong long-term outcome. Figure 13 below provides an illustration of how the program goal(s) can be used to develop the long-term outcomes section of the logic model.
Long-Term Outcome
Reduction in incidence in air-quality related disease.
This is a strong long-term outcome because although it will not be realized during the timeframe of a single climate change program, it is a logical long-term extension of a climate change program and it is a measurable/observable change at the broader societal level.
Figure 12. Case Example, Long-Term Outcome
Program Goal
Increase the supply of and demand for clean forms of energy as a means to decrease GHG emissions and improve health and economic outcomes.
Decrease in GHG emissions
Decrease in the number of respiratory illnesses
Figure 13. Developing Long-Term Outcomes
Inputs Activities Outputs Short-Term Outcomes
Long-Term Outcomes
Long-Term Outcomes
CASE EXAMPLE: Developing Long-Term Outcomes
End Start

Section 3: Design a Program
31
Program Design and Performance Management Toolkit Section 3: Design a Program cas.state.gov/managingforresults
1 2 3 4 5
3.3.2: Develop Short-Term Outcomes
Short-term outcomes describe the immediate effects of the program and often focus on changes to the knowledge and attitudes of the program’s beneficiaries or customers, such as a change in attitude as a result of an awareness campaign or a change in behavior due to a training program. The short-term outcomes of the program should be linked to the program objectives. Figure 14 provides an example of a strong short-term outcome. Figure 15 provides an illustration of how the program objectives can be used to develop the outcomes section of the logic model.
Short-Term Outcome
New clean energy policies, plans, regulations and frameworks implemented.
This is a strong short-term outcome because this is the result of the capacity building program and indicates a behavioral change among the participants and can be accomplished within the timeframe of the program. It is directly tied to Objective 1 of the Case Example: Increase capacity of the national government to create and implement regulatory frameworks and policies to promote and sustain a clean energy sector.
Figure 14. Case Example, Short-Term Outcome
“Without information things are done arbitrarily, and one becomes unsure of whether a policy or programme, will fail or succeed. If we allow our policies to be guided be empirical facts and data, there will be noticeable change in the impact of what we do”
– Director of Policy, National Action Committee on AIDS (Nigeria) 2003

Section 3: Design a Program
32
Program Design and Performance Management Toolkit Section 3: Design a Program cas.state.gov/managingforresults
1 2 3 4 5
Objective 1
Increase capacity of the national government to create and implement regulatory frameworks and policies to promote and sustain a clean energy sector.
New clean energy policies, plans, regulations or frameworks implemented
Increased energy production from clean energy sources
New business established in the clean energy sector
Objective 2
Increase public awareness of and demand for clean energy.
Increased public understanding of the harm caused by coal-burning energy and the benefits of clean energy
Increased public demand for clean energy
Figure 15. Developing Short-Term Outcomes
3.3.3: Develop Outputs
Outputs are the direct, tangible results of program activities. They are often easy to count, such as number of people trained or number of awareness campaigns conducted, and generally measure the amount or quantity of the activities or beneficiaries/customers. Figure 16 provides an example of a strong output.
Output
Government personnel receive technical assistance on clean energy policy, plans, regulations, and/or frameworks.
This is a strong example of an output because it is a direct result of the program activity. This output is measurable; it is specific and relevant to the program activities and long-term outcomes.
Figure 16. Case Example, Output
Short-Term Outcomes
CASE EXAMPLE: Developing Short-Term Outcomes

Section 3: Design a Program
33
Program Design and Performance Management Toolkit Section 3: Design a Program cas.state.gov/managingforresults
1 2 3 4 5
3.3.4: Develop Activities
Activities are the actions or events undertaken by the program or partners to ultimately produce desired outcomes. Activities identify measurable action steps to achieve the program’s goals or objectives, such as conducting outreach, providing training, or developing a communication campaign. They should be feasible from an economic, social, and political perspective, and should have a clear link to addressing the intended issue or challenge identified in the problem statement. Figure 17 provides an example of a strong activity.
Activity
Exchange programs for members of the Ministry of Interior Bureau of Energy to visit the US Department of Energy and Department of Agriculture to learn about clean energy programs.
This is a strong example of an activity because explains who will receive technical assistance and what type of technical assistance. It directly relates to Objective 1: Increase capacity of the national government to create and implement regulatory frameworks and policies to promote and sustain a clean energy sector.
Figure 17. Case Example, Activity
Additional examples of activities include the following: developing curriculum, handling customer inquiries, delivering workshops, generating media stories, coordinating stakeholder meetings, making grant applications, providing technical assistance, producing brochures, delivering trainings, implementing awareness campaigns, or conducting educational exchanges. Figure 18 shows how activities should align with program objectives so objectives can be achieved.
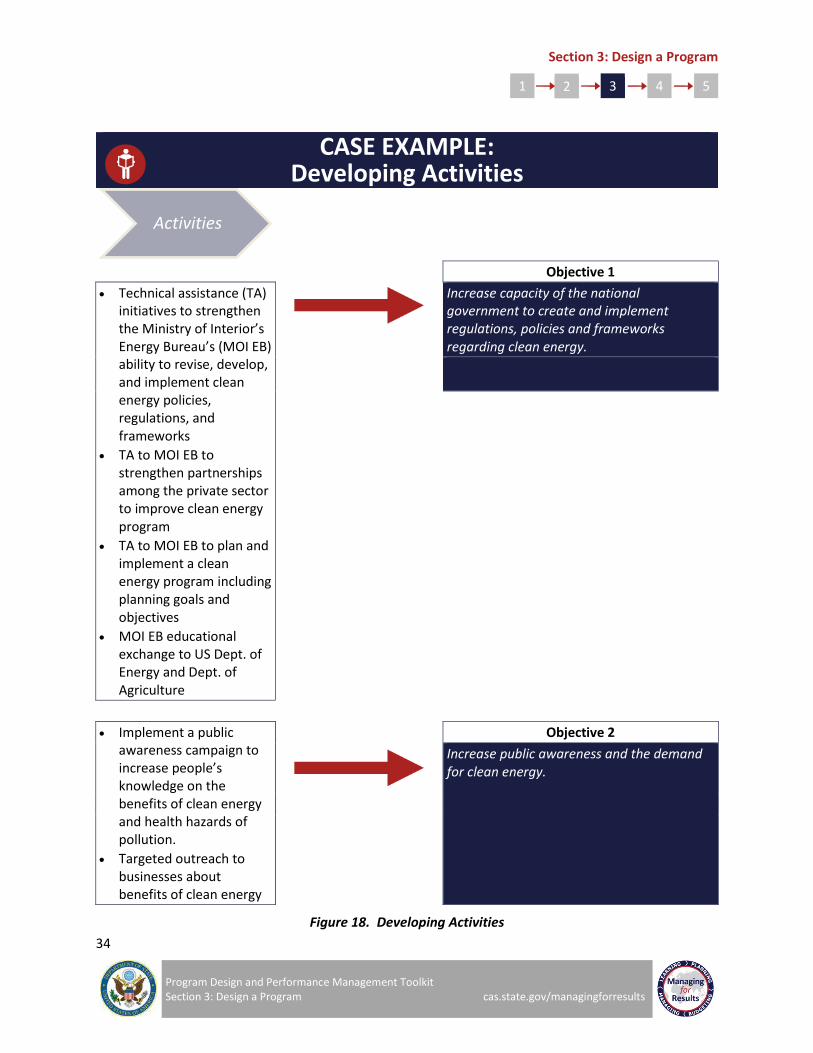
Section 3: Design a Program
34
Program Design and Performance Management Toolkit Section 3: Design a Program cas.state.gov/managingforresults
1 2 3 4 5
CASE EXAMPLE: Developing Activities
Objective 1
Technical assistance (TA) initiatives to strengthen the Ministry of Interior’s Energy Bureau’s (MOI EB) ability to revise, develop, and implement clean energy policies, regulations, and frameworks
TA to MOI EB to strengthen partnerships among the private sector to improve clean energy program
TA to MOI EB to plan and implement a clean energy program including planning goals and objectives
MOI EB educational exchange to US Dept. of Energy and Dept. of Agriculture
Increase capacity of the national government to create and implement regulations, policies and frameworks regarding clean energy.
Implement a public awareness campaign to increase people’s knowledge on the benefits of clean energy and health hazards of pollution.
Targeted outreach to businesses about benefits of clean energy
Objective 2
Increase public awareness and the demand for clean energy.
Figure 18. Developing Activities
Activities

Section 3: Design a Program
35
Program Design and Performance Management Toolkit Section 3: Design a Program cas.state.gov/managingforresults
1 2 3 4 5
3.3.5: Develop Inputs
Inputs are the resources invested to start and maintain program implementation. They include, but are not limited to, financial resources, time, personnel, materials, equipment, and monetary or in-kind contributions of your or any other organization. It is important to consider how program inputs may affect the scope of your program, the size or number activities, and what outputs and outcomes can be achieved. Figure 19 provides an example of a strong activity.
Input
Flyers for awareness campaign
This is a strong example of an input because it shows how this will be used to implement an activity of the program.
Figure 19. Case Example, Input
At this point in the program design process you have successfully reviewed the key components of developing a program logic model. Figure 21 illustrates the completed logic model for the case example.
After reviewing the case example below, click here to use the Logic Model Tool.
Now that the goals and objectives of the program are developed, Mary and her team can develop the program logic using the Program Logic Model Tool. In doing so she can determine how the program’s inputs will lead to the long-term outcomes of the program. See the case example of the Program Logic Model in Figure 21.
Figure 20. Case Example, Logic Model Information
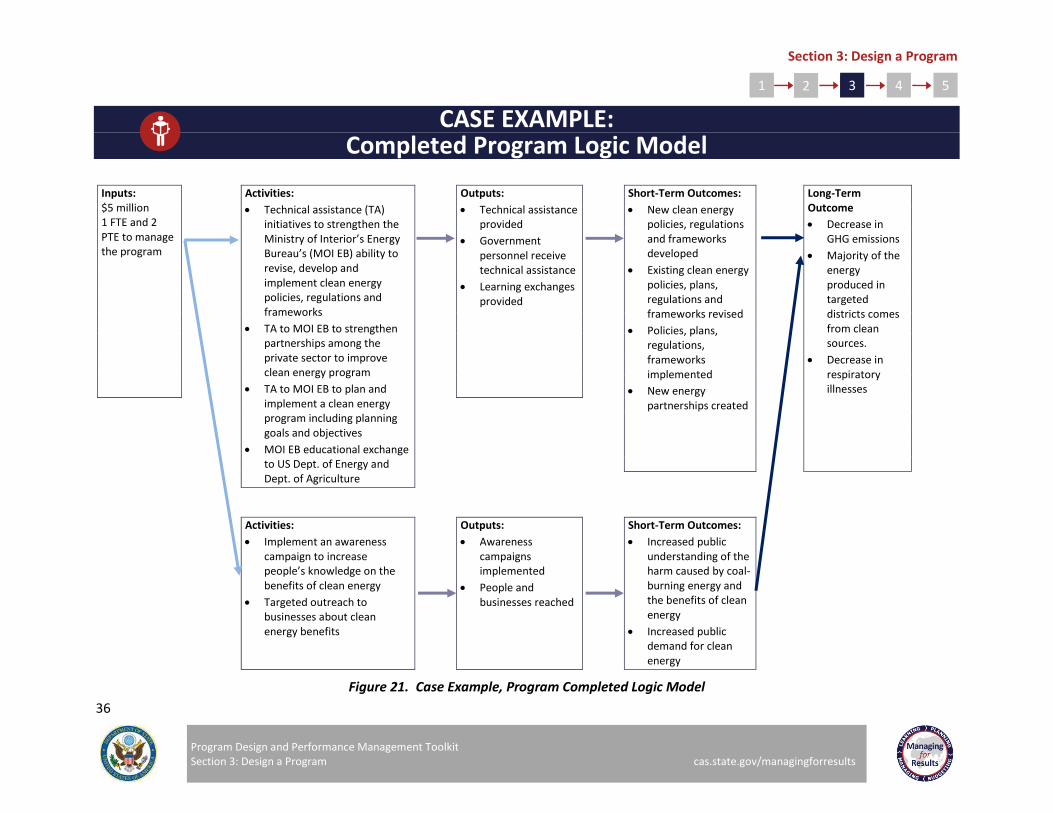
Section 3: Design a Program
36
Program Design and Performance Management Toolkit Section 3: Design a Program cas.state.gov/managingforresults
1 2 3 4 5
CASE EXAMPLE: Completed Program Logic Model
Inputs: $5 million 1 FTE and 2 PTE to manage the program
Activities:
Technical assistance (TA) initiatives to strengthen the Ministry of Interior’s Energy Bureau’s (MOI EB) ability to revise, develop and implement clean energy policies, regulations and frameworks
TA to MOI EB to strengthen partnerships among the private sector to improve clean energy program
TA to MOI EB to plan and implement a clean energy program including planning goals and objectives
MOI EB educational exchange to US Dept. of Energy and Dept. of Agriculture
Outputs:
Technical assistance provided
Government personnel receive technical assistance
Learning exchanges provided
Short-Term Outcomes:
New clean energy policies, regulations and frameworks developed
Existing clean energy policies, plans, regulations and frameworks revised
Policies, plans, regulations, frameworks implemented
New energy partnerships created
Long-Term Outcome
Decrease in GHG emissions
Majority of the energy produced in targeted districts comes from clean sources.
Decrease in respiratory illnesses
Activities:
Implement an awareness campaign to increase people’s knowledge on the benefits of clean energy
Targeted outreach to businesses about clean energy benefits
Outputs:
Awareness campaigns implemented
People and businesses reached
Short-Term Outcomes:
Increased public understanding of the harm caused by coal-burning energy and the benefits of clean energy
Increased public demand for clean energy
Figure 21. Case Example, Program Completed Logic Model
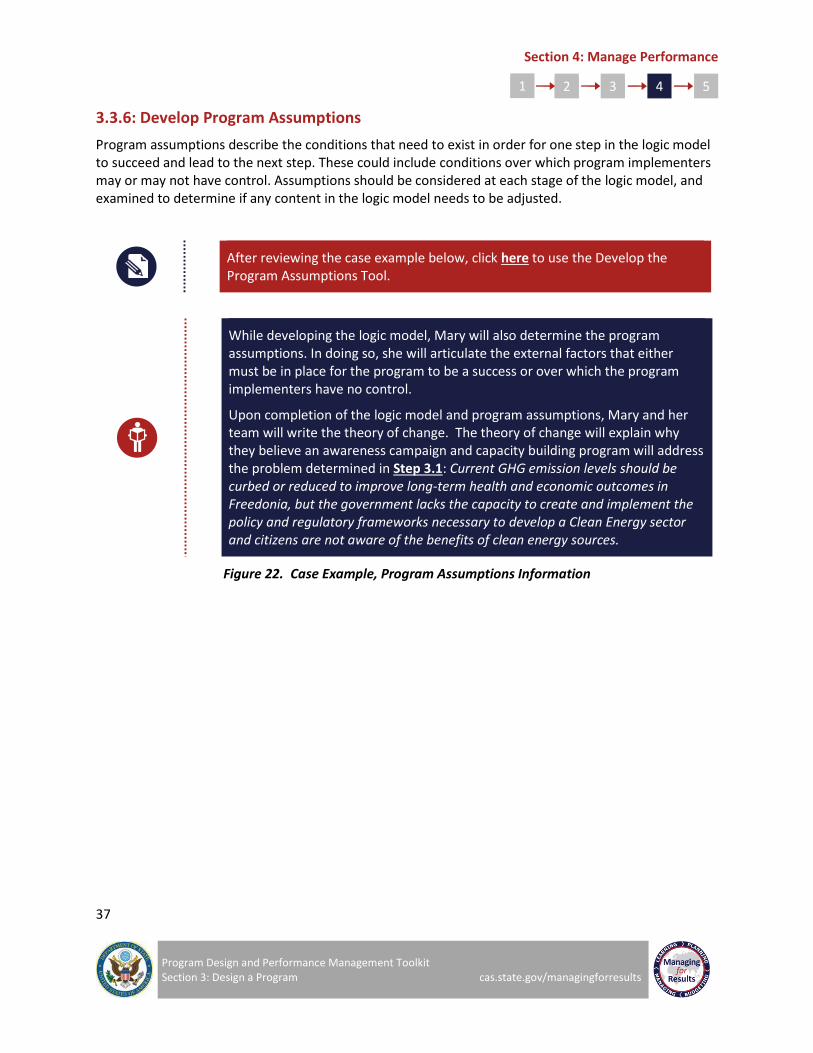
Section 4: Manage Performance
37
Program Design and Performance Management Toolkit Section 3: Design a Program cas.state.gov/managingforresults
1 2 3 4 5
3.3.6: Develop Program Assumptions
Program assumptions describe the conditions that need to exist in order for one step in the logic model to succeed and lead to the next step. These could include conditions over which program implementers may or may not have control. Assumptions should be considered at each stage of the logic model, and examined to determine if any content in the logic model needs to be adjusted.
After reviewing the case example below, click here to use the Develop the Program Assumptions Tool.
While developing the logic model, Mary will also determine the program assumptions. In doing so, she will articulate the external factors that either must be in place for the program to be a success or over which the program implementers have no control.
Upon completion of the logic model and program assumptions, Mary and her team will write the theory of change. The theory of change will explain why they believe an awareness campaign and capacity building program will address the problem determined in Step 3.1: Current GHG emission levels should be curbed or reduced to improve long-term health and economic outcomes in Freedonia, but the government lacks the capacity to create and implement the policy and regulatory frameworks necessary to develop a Clean Energy sector and citizens are not aware of the benefits of clean energy sources.
Figure 22. Case Example, Program Assumptions Information
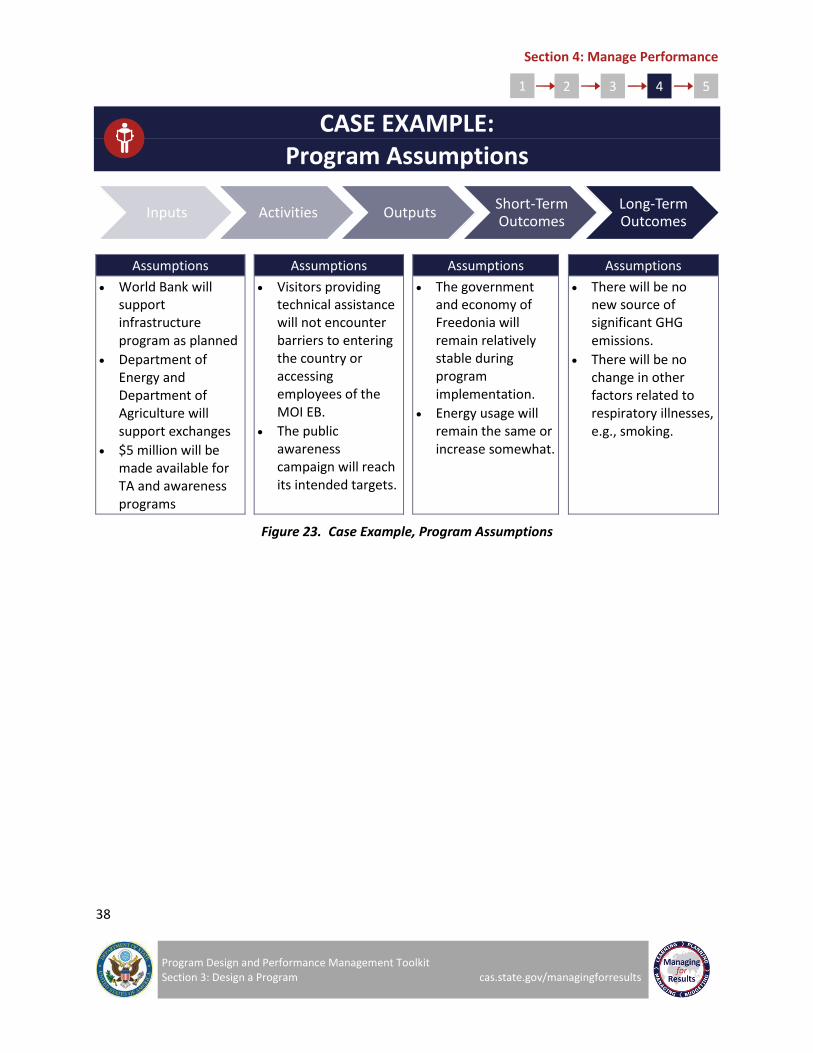
Section 4: Manage Performance
38
Program Design and Performance Management Toolkit Section 3: Design a Program cas.state.gov/managingforresults
1 2 3 4 5
CASE EXAMPLE: Program Assumptions
Assumptions Assumptions Assumptions Assumptions
World Bank will support infrastructure program as planned
Department of Energy and Department of Agriculture will support exchanges
$5 million will be made available for TA and awareness programs
Visitors providing technical assistance will not encounter barriers to entering the country or accessing employees of the MOI EB.
The public awareness campaign will reach its intended targets.
The government and economy of Freedonia will remain relatively stable during program implementation.
Energy usage will remain the same or increase somewhat.
There will be no new source of significant GHG emissions.
There will be no change in other factors related to respiratory illnesses, e.g., smoking.
Figure 23. Case Example, Program Assumptions
Inputs Activities Outputs Short-Term Outcomes
Long-Term Outcomes
Section 4: Manage Performance
39
Program Design and Performance Management Toolkit Section 3: Design a Program cas.state.gov/managingforresults
1 2 3 4 5
3.3.7: Develop Theory of Change
A Theory of Change (TOC) is an evolving set of theories about how and why a specific program will work that can be tested and improved over time. TOCs often include narrative statements that describe why it is believed one step will lead to another (e.g., what is the basis for asserting increased knowledge leads to behavior change in this program context?). A TOC can be made more robust when based on literature, research findings, past evaluations, policy, or leading practices such as anything uncovered in your situational analysis.3 TOCs may be established theories pulled from existing sources; they can be customized based on evidence related to your particular program context, or a combination of both. Depending on how the TOC evolves over time, you may need to consider requisite changes to the program design and/or logic model. It is recommended to work with a representative team of stakeholders, including consultations with anticipated beneficiaries or customers if possible, when developing both the TOC and logic model. Consider the following when developing a TOC:
Changes: What needs to occur to move from the problem that currently exists, to achieving program goals and objectives?
Theory of Change Hypotheses: Overarching statements of how you believe change will occur to solve the problem. These can be written as “If____, then____ because ______” statements to link existing conditions and desired changes.
Source/Evidence: Any source or evidence that supports these theories. This could include examination of well-established theories, previous program evaluations, discussions with stakeholders, input from program beneficiaries or customers, and research or literature review. If there is no current evidence to support the theory or assumption, note that, but continue and consider whether support for your theory could be explored as part of your monitoring and evaluation plan.
Consideration of these factors allows the program team to summarize why, based on available evidence and consideration of other possible paths, the particular changes described and predicted in your logic model are expected to occur. The theory of change can be noted on your logic model document, or separately, and should be reviewed periodically to determine if it should be modified as any new information becomes available.
3 https://assets.publishing.service.gov.uk/media/57a08a5ded915d3cfd00071a/DFID_ToC_Review_VogelV7.pdf

Section 4: Manage Performance
40
Program Design and Performance Management Toolkit Section 3: Design a Program cas.state.gov/managingforresults
1 2 3 4 5
STEP 3.4: DEVELOP A PROGRAM SUMMARY
All of the tools you have completed in sections 1-3 of the Toolkit combine to comprise your program summary and provides a high level overview of your program’s key considerations, plus its goals and objectives and plans for achieving them.
Align Program to Advance Existing Strategies
Internal and External Assessments
Root Cause Analysis
Review of the Issue or Problem
Program Goals and Objectives
Logic Model
Use the program summary to share and communicate the program internally among leadership and staff, as well as with external stakeholders, interagency or non-governmental partners, or implementers. The program summary can also be used as a knowledge management and orientation tool during times of staff or partner movement or turnover.
Your program summary, combined with the performance management plan you will create using the tools in Section 4 and Section 5 of the Toolkit will comprise your complete program information documentation.
1.0 Align programs to advance existing strategies.
2.0 Conduct a situational analysis.
3.1 Determine the problem or needs statement.
3.3 Develop logic model and theory of change.
3.4 Develop program summary.
5.0 Analyze, Learn, and Act.
4. 0 Manage Performance.
3.2 Establish goals and objectives.
“What gets measured gets managed.”
- Peter Drucker
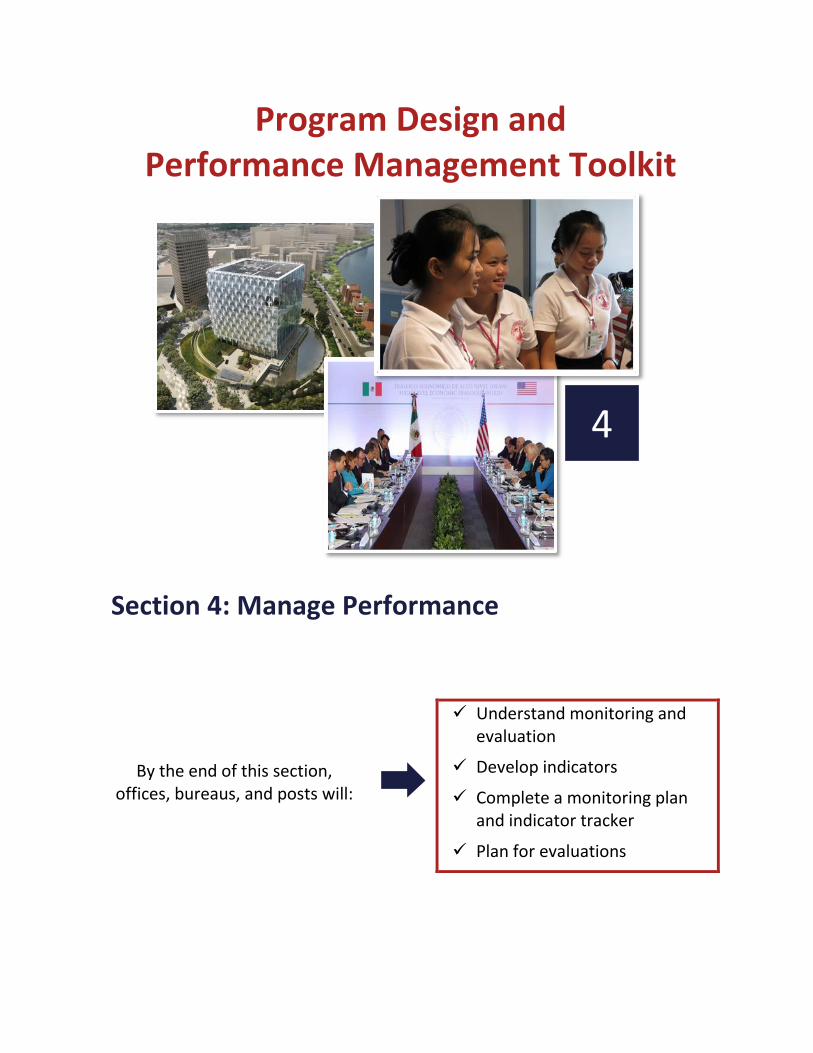
Program Design and Performance Management Toolkit
Section 4: Manage Performance
By the end of this section, offices, bureaus, and posts will:
Understand monitoring and evaluation
Develop indicators
Complete a monitoring plan and indicator tracker
Plan for evaluations
4
1.0 Align programs to advance existing strategies.
2.0 Conduct a situational analysis.
3.1 Determine the problem or needs statement.
3.3 Develop logic model and theory of change.
5.0 Analyze, Learn, and Act
4. 0 Manage Performance
3.2 Establish goals and objectives.

Section 4: Manage Performance
42
Program Design and Performance Management Toolkit Section 4: Manage Performance cas.state.gov/managingforresults
1 2 3 4 5
SECTION 4: MANAGE PERFORMANCE
STEP 4.1: UNDERSTAND MONITORING AND EVALUATION
Completing sections 4 and 5 of the Toolkit will provide program managers with a Performance Management Plan (PMP), which establishes how program progress and results will be measured and assessed through monitoring, evaluation, and the analysis and use of performance information. Performance management is the ongoing process of collecting and analyzing information to monitor program performance against established goals and objectives and using the information to make any necessary adjustments to improve efficiency or effectiveness. Sound performance management begins in program design, is conducted throughout program implementation, and is used on an ongoing basis to make informed decisions for current and future programs. PMPs are useful not only for internal management purposes, but also for coordinating and communicating program efforts and accountability measures with implementing partners.
Monitoring and evaluation, often referred to as “M&E”, are key components of performance management. Monitoring data generally describe what is happening throughout the program, and evaluations can help determine how or why. Monitoring and evaluation provide the data necessary to assess ongoing progress and results, conduct internal learning and accountability, and respond to external reporting and communication requirements.
Monitoring involves ongoing data collection against key performance indicators or milestones to gauge the direct and near-term effects of program activities and whether desired results are occurring as expected during program implementation. Monitoring data tell us what is happening and help us determine if implementation is on track or if any timely corrections or adjustments may be needed to improve efficiency or effectiveness. Monitoring data can also indicate when an evaluation is needed to understand how or why certain results are being observed and can provide useful inputs into an evaluation.
Evaluation is the systematic collection and analysis of information about the characteristics and outcomes of programs, projects, or processes as a basis for making judgements, improving effectiveness, and informing decision-makers about current and future activities. Evaluation is distinct
1.0 Align programs to advance existing strategies.
2.0 Conduct a situational analysis.
3.0 Design a Program.
4.1 Understand monitoring and evaluation.
4.3 Complete monitoring plan and indicator tracking table.
4.4 Plan for evaluations.
5.0 Analyze, Learn, and Act.
4. 5 Work with external entities.
4.2 Develop indicators.
Section 4: Manage Performance
43
Program Design and Performance Management Toolkit Section 4: Manage Performance cas.state.gov/managingforresults
1 2 3 4 5
from assessment, which may be designed to examine country or sector context to inform project design.4
Evaluations can not only help determine what a program has achieved, but also provide insight into how and why. Evaluations are designed to answer questions that address efficiency, effectiveness, impact, sustainability, and relevance and are undertaken with the intent to improve the performance of existing programs or policies, assess their effects and impacts, or to inform decisions about future programming.
Combined, monitoring and evaluation can answer questions about progress and results at all stages of the program logic model (developed in Section 3), the project work breakdown structure (developed in Appendix A) or the process map (developed in Appendix B). Monitoring and indicator data are typically more useful to asses ongoing activities, outputs, and some near-term outcomes of the program, but are less useful in answering questions about how or if the program itself contributed to the desired long-term outcomes, and why. Evaluations often use mixed methods of data collection that are much broader in scope than performance indicators. In doing so, evaluations are better suited to address questions about the extent to which a program contributed to desired outcomes and causation.
4 http://cas.state.gov/evaluation/files/2014/05/2016-Evaluation-Guidance.pdf
“Planning without action is futile, action without planning is fatal.”
– Anonymous
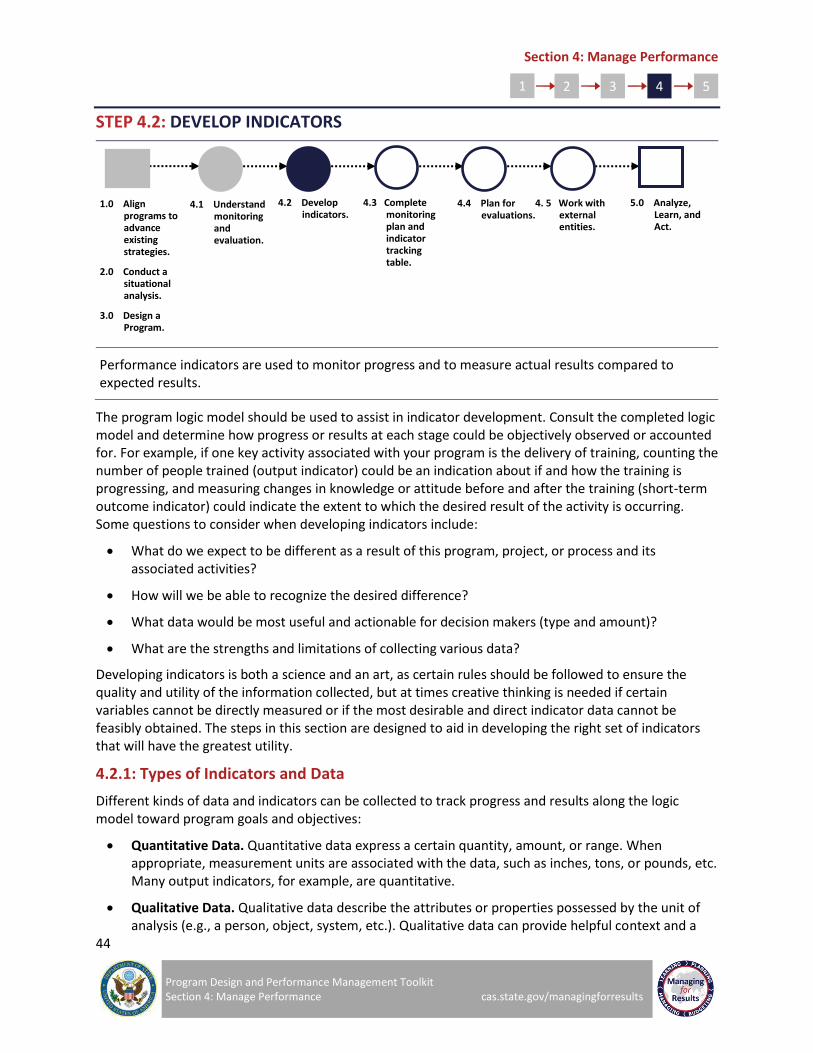
Section 4: Manage Performance
44
Program Design and Performance Management Toolkit Section 4: Manage Performance cas.state.gov/managingforresults
1 2 3 4 5
STEP 4.2: DEVELOP INDICATORS
Performance indicators are used to monitor progress and to measure actual results compared to expected results.
The program logic model should be used to assist in indicator development. Consult the completed logic model and determine how progress or results at each stage could be objectively observed or accounted for. For example, if one key activity associated with your program is the delivery of training, counting the number of people trained (output indicator) could be an indication about if and how the training is progressing, and measuring changes in knowledge or attitude before and after the training (short-term outcome indicator) could indicate the extent to which the desired result of the activity is occurring. Some questions to consider when developing indicators include:
What do we expect to be different as a result of this program, project, or process and its associated activities?
How will we be able to recognize the desired difference?
What data would be most useful and actionable for decision makers (type and amount)?
What are the strengths and limitations of collecting various data?
Developing indicators is both a science and an art, as certain rules should be followed to ensure the quality and utility of the information collected, but at times creative thinking is needed if certain variables cannot be directly measured or if the most desirable and direct indicator data cannot be feasibly obtained. The steps in this section are designed to aid in developing the right set of indicators that will have the greatest utility.
4.2.1: Types of Indicators and Data
Different kinds of data and indicators can be collected to track progress and results along the logic model toward program goals and objectives:
Quantitative Data. Quantitative data express a certain quantity, amount, or range. When appropriate, measurement units are associated with the data, such as inches, tons, or pounds, etc. Many output indicators, for example, are quantitative.
Qualitative Data. Qualitative data describe the attributes or properties possessed by the unit of analysis (e.g., a person, object, system, etc.). Qualitative data can provide helpful context and a
1.0 Align programs to advance existing strategies.
2.0 Conduct a situational analysis.
3.0 Design a Program.
4.1 Understand monitoring and evaluation.
4.3 Complete monitoring plan and indicator tracking table.
4.4 Plan for evaluations.
5.0 Analyze, Learn, and Act.
4. 5 Work with external entities.
4.2 Develop indicators.

Section 4: Manage Performance
45
Program Design and Performance Management Toolkit Section 4: Manage Performance cas.state.gov/managingforresults
1 2 3 4 5
more in-depth description of something. It can be an important tool for contextualizing quantitative trends, such as program participants’ feedback about why they could not participate in a program activity, and also for communicating program outcomes. Examples include observations collected at a program site or opinion, attitude, or perception data obtained via interviews, focus groups, or surveys.
Outcome Indicators. Outcome indicators focus on measuring the desired results of the program, or what we achieve. They should be indications of progress toward, or achievement of, program goals or objectives, and they should relate to the short- and long-term outcomes in your logic model. There are two key types of outcomes: short-term and long-term. Note that depending on specific program context, results that represent short-term outcomes for one program might be considered long-term outcomes for another, and vice-versa, but the key is that the program team thinks through the useful outcome indicators for their particular program.
– Short-Term Outcome Indicators capture and measure the effects of the activities undertaken in the program and often focus on changes in the knowledge and attitudes of the program’s intended beneficiaries. Depending on the program context, short-term outcomes can also include behavior, policy, or normative changes, but for some programs these may be considered long-term outcomes.
Creation of a country-wide clean energy framework
Number of media outlets featuring public awareness campaign information
Change in public’s knowledge of clean energy
– Long-Term Outcome Indicators, sometimes called impact, refer to the desired end-state or ultimate results of the program you hope to achieve. They can take years to realize and may be observed outside the timeframe of your program. These are linked to the overarching results that could stem from achieving program goals. Examples may include:
Percent decrease in air-quality related disease
Output Indicators. Output indicators measure the direct, tangible results of program activities. They answer the question, “What was the immediate product of the activity – what did we get?” Output indicators measure the outputs in the program logic model. Examples of output indicators include:
– Number of government officials completing exchange programs
– Number of contacts made to news outlets about a public awareness campaign
Contextual Indicators. Contextual indicators measure the environment within which the program is implemented. They provide additional context about factors that may influence program implementation or results but are often beyond the control of program implementers. Contextual indicators are useful to illustrate and track the operating environment of a country, sector, or program, but not to describe the effects or impacts of the program activities.
– Percent of the population living on less than $1.25 per day
– Ease of doing business rank
– Growth in real gross domestic product per capita

Section 4: Manage Performance
46
Program Design and Performance Management Toolkit Section 4: Manage Performance cas.state.gov/managingforresults
1 2 3 4 5
Milestones. Milestones measure progress toward a desired outcome by dividing the progress into a series of defined steps, or by defining a single desired end state to mark a key achievement (e.g., policy adopted). Milestones require a clear definition of each step or milestone, criteria for assessing whether the step or the milestone has been achieved, and an expected timeline for when each step will be achieved (if appropriate). Below is an example of a set of milestone indicators:
– Development of regulation, policy, or framework for clean energy program by Year 3
– Establishment of oversight committee or agency in Year 1
– Implementation of regulation, policy, or framework for clean energy program in Year 3
Rating Scale. This is a measurement device that quantifies a range of subjective, and often qualitative, responses on a single issue or single dimension of an issue. One example of a simple rating scale is when survey respondents are asked to provide a quantified response to a survey question (such as overall satisfaction with an activity on a Likert scale of 1 to 5). Use of complex rating scales that require respondents to possess technical expertise to choose the appropriate response require a clear definition of each number on the scale, and how respondents should rank their answers.
4.2.1: Developing Indicators and Indicator Reference Sheets
To the extent practicable, program indicators should be objective, practical, useful, direct, attributable, timely, and adequate (OPUDATA)5. The OPUDATA tool and indicator reference sheet tool are designed to help the program team work through and address these considerations when designing indicators. Some of these considerations require tradeoffs, such as trading the most direct indicator for one that is more practical to collect data against, and it is up to the program team to determine what set of indicators will best suit their data needs and uses. An example of a weak and strong indicator can be seen in Figure 25.
Objective. Performance indicators should only measure one thing and be unambiguous about what is being measured. All subjective terms that could be interpreted differently by various stakeholders should be clearly defined in the indicator reference sheet so the program team as well as any partners use and interpret the indicator correctly and consistently.
Practical. Consider the feasibility of collecting the data. Certain indicator data that, on their face, could be extremely useful to gauge progress or results may be impossible to obtain due to budget, geography, time, availability, quality, or other constraints.
Useful. Data collection can require considerable time and resources. Consider what questions and decisions could arise during program implementation and beyond, and validate the data captured in your indicators. Have a clear utility for learning, tracking, informing decisions, or addressing ongoing program needs.
5 https://www.usaid.gov/sites/default/files/documents/1870/203.pdf
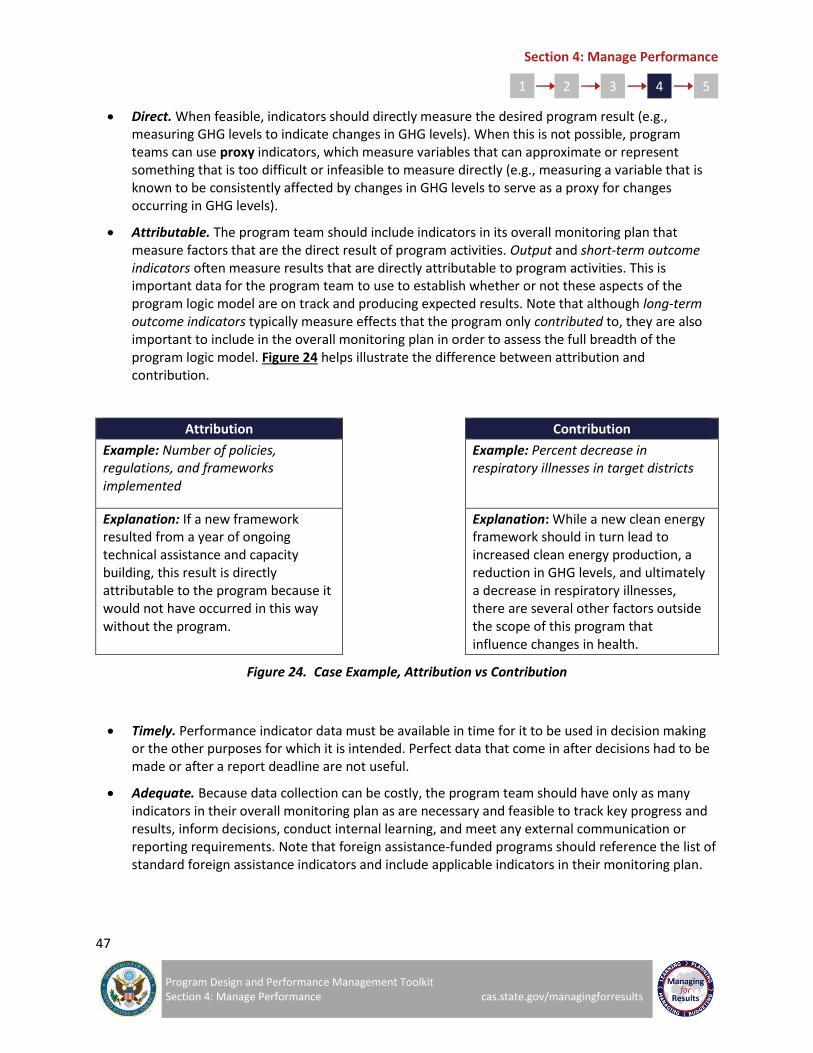
Section 4: Manage Performance
47
Program Design and Performance Management Toolkit Section 4: Manage Performance cas.state.gov/managingforresults
1 2 3 4 5
Direct. When feasible, indicators should directly measure the desired program result (e.g., measuring GHG levels to indicate changes in GHG levels). When this is not possible, program teams can use proxy indicators, which measure variables that can approximate or represent something that is too difficult or infeasible to measure directly (e.g., measuring a variable that is known to be consistently affected by changes in GHG levels to serve as a proxy for changes occurring in GHG levels).
Attributable. The program team should include indicators in its overall monitoring plan that measure factors that are the direct result of program activities. Output and short-term outcome indicators often measure results that are directly attributable to program activities. This is important data for the program team to use to establish whether or not these aspects of the program logic model are on track and producing expected results. Note that although long-term outcome indicators typically measure effects that the program only contributed to, they are also important to include in the overall monitoring plan in order to assess the full breadth of the program logic model. Figure 24 helps illustrate the difference between attribution and contribution.
Attribution
Contribution
Example: Number of policies, regulations, and frameworks implemented
Example: Percent decrease in respiratory illnesses in target districts
Explanation: If a new framework resulted from a year of ongoing technical assistance and capacity building, this result is directly attributable to the program because it would not have occurred in this way without the program.
Explanation: While a new clean energy framework should in turn lead to increased clean energy production, a reduction in GHG levels, and ultimately a decrease in respiratory illnesses, there are several other factors outside the scope of this program that influence changes in health.
Figure 24. Case Example, Attribution vs Contribution
Timely. Performance indicator data must be available in time for it to be used in decision making or the other purposes for which it is intended. Perfect data that come in after decisions had to be made or after a report deadline are not useful.
Adequate. Because data collection can be costly, the program team should have only as many indicators in their overall monitoring plan as are necessary and feasible to track key progress and results, inform decisions, conduct internal learning, and meet any external communication or reporting requirements. Note that foreign assistance-funded programs should reference the list of standard foreign assistance indicators and include applicable indicators in their monitoring plan.
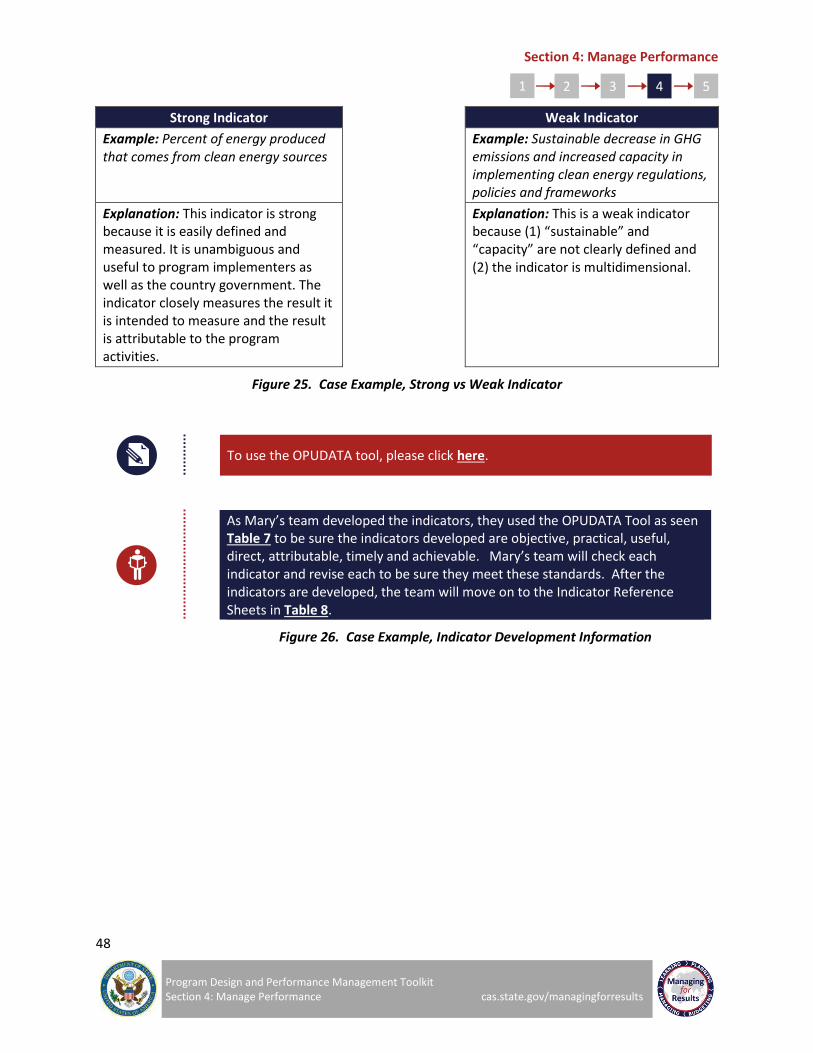
Section 4: Manage Performance
48
Program Design and Performance Management Toolkit Section 4: Manage Performance cas.state.gov/managingforresults
1 2 3 4 5
Strong Indicator
Weak Indicator
Example: Percent of energy produced that comes from clean energy sources
Example: Sustainable decrease in GHG emissions and increased capacity in implementing clean energy regulations, policies and frameworks
Explanation: This indicator is strong because it is easily defined and measured. It is unambiguous and useful to program implementers as well as the country government. The indicator closely measures the result it is intended to measure and the result is attributable to the program activities.
Explanation: This is a weak indicator because (1) “sustainable” and “capacity” are not clearly defined and (2) the indicator is multidimensional.
Figure 25. Case Example, Strong vs Weak Indicator
To use the OPUDATA tool, please click here.
As Mary’s team developed the indicators, they used the OPUDATA Tool as seen Table 7 to be sure the indicators developed are objective, practical, useful, direct, attributable, timely and achievable. Mary’s team will check each indicator and revise each to be sure they meet these standards. After the indicators are developed, the team will move on to the Indicator Reference Sheets in Table 8.
Figure 26. Case Example, Indicator Development Information
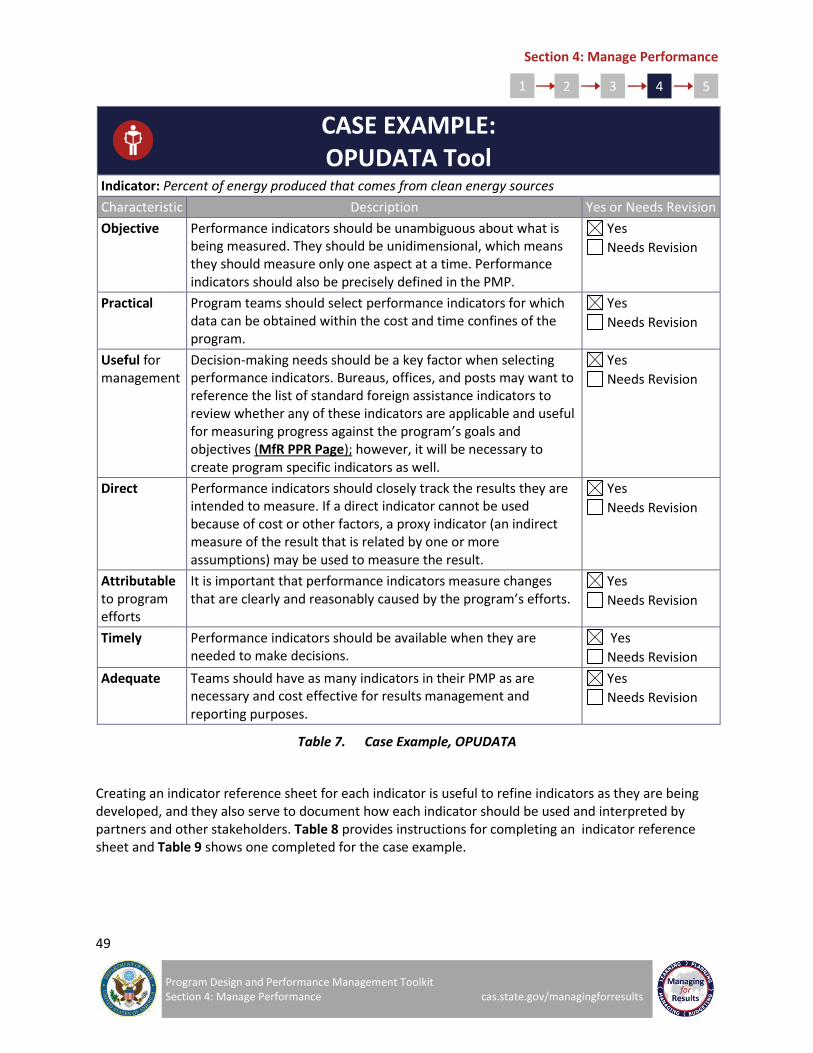
Section 4: Manage Performance
49
Program Design and Performance Management Toolkit Section 4: Manage Performance cas.state.gov/managingforresults
1 2 3 4 5
CASE EXAMPLE: OPUDATA Tool
Indicator: Percent of energy produced that comes from clean energy sources
Characteristic Description Yes or Needs Revision
Objective Performance indicators should be unambiguous about what is being measured. They should be unidimensional, which means they should measure only one aspect at a time. Performance indicators should also be precisely defined in the PMP.
Yes
Needs Revision
Practical Program teams should select performance indicators for which data can be obtained within the cost and time confines of the program.
Yes
Needs Revision
Useful for management
Decision-making needs should be a key factor when selecting performance indicators. Bureaus, offices, and posts may want to reference the list of standard foreign assistance indicators to review whether any of these indicators are applicable and useful for measuring progress against the program’s goals and objectives (MfR PPR Page); however, it will be necessary to create program specific indicators as well.
Yes
Needs Revision
Direct Performance indicators should closely track the results they are intended to measure. If a direct indicator cannot be used because of cost or other factors, a proxy indicator (an indirect measure of the result that is related by one or more assumptions) may be used to measure the result.
Yes
Needs Revision
Attributable to program efforts
It is important that performance indicators measure changes that are clearly and reasonably caused by the program’s efforts.
Yes
Needs Revision
Timely Performance indicators should be available when they are needed to make decisions.
Yes
Needs Revision
Adequate Teams should have as many indicators in their PMP as are necessary and cost effective for results management and reporting purposes.
Yes
Needs Revision
Table 7. Case Example, OPUDATA
Creating an indicator reference sheet for each indicator is useful to refine indicators as they are being developed, and they also serve to document how each indicator should be used and interpreted by partners and other stakeholders. Table 8 provides instructions for completing an indicator reference sheet and Table 9 shows one completed for the case example.

Section 4: Manage Performance
50
Program Design and Performance Management Toolkit Section 4: Manage Performance cas.state.gov/managingforresults
1 2 3 4 5
INDICATOR REFERENCE SHEET INSTRUCTIONS
Information Instructions: To Be Completed
Indicator The indicator language should be concise and very clear about what exactly is being counted or measured and should spell out acronyms.
Definition The definition explains how you will calculate the data collected to measure the change expected. Clarify everything the program design team needs to know to understand how to use this indicator:
Define all potentially subjective terms in the indicator (e.g., what specifically counts as being “trained” or not for purposes of this indicator)
Define all technical terms so non- subject matter experts can understand
Clarify how frequently the subject of the indicator should be counted (e.g., count each person once even if they receive multiple interventions, or count each instance of the intervention)
For “percent” indicators, define what should be counted toward the Numerator and what should be counted toward the denominator
Clarify any minimum or maximum values or scales that are relevant for this indicator
For milestone indicators, clarify who and what is expected to be entered in response to the indicator, such a completion date or a qualitative response about the milestone.
Linkage to Long-Term Outcomes
Briefly describe the relationship of the indicator to the desired long-term outcome or impact it supports. Answers might describe the indicator’s role in the underlying theory of change, the anticipated effect on longer-term outcomes resulting from a positive or negative shift in this indicator, and/or why the indicator represents a good proxy of progress toward desired goals.
Reporting Type Specify one of the following units of reporting for this indicator:
“Number”
“Percent”
“Date” (Specify if it is a 2-digit month and/or a 4-digit year)
“Qualitative Response” (Specify set response options if applicable, or very specific instructions for the desired response; note that these are for short qualitative responses of a few words with a maximum limit of 15 characters and not intended for capturing lengthy narratives.)
Use of Indicator Briefly identify how this indicator will be used to monitor progress in achieving program goals and objectives. Also note if this indicator will be used to monitor progress in achieving bureau or office strategic objectives in the Functional Bureau Strategy (FBS) or Joint Regional Strategy (JRS) (or other such ongoing bureau meetings or progress reviews) and/or how this indicator is used to meet external reporting requirements (such as the name of the report in which it is used.)
Reporting Frequency
Frequency for reporting results and setting targets (i.e., quarterly, annually, every two/three/etc. years).

Section 4: Manage Performance
51
Program Design and Performance Management Toolkit Section 4: Manage Performance cas.state.gov/managingforresults
1 2 3 4 5
INDICATOR REFERENCE SHEET INSTRUCTIONS
Information Instructions: To Be Completed
Data Source In order to track progress and to properly set baselines and targets, data will need to be collected. Specify how and when data for this indicator will be generated in very practical terms. Include the specific acceptable method(s) by which data for this indicator are/will be/should be collected. There are two different types of data sources, including those that are specific to your program (primary data) and secondary data sources:
Data collection tools should be easy to use for both the participant and the person responsible for analyzing the data. Suggested primary data collection tools include, but are not limited to:
Pre- and post-tests
Informal pre- and post- intervention surveys/questionnaires
Formal pre- and post- intervention surveys/questionnaires
Meeting minutes
Attendance sheets
Site visit checklists
Interviews (key informant and community)
Direct observation
Focus groups
Program reports
Examples of secondary data sources include, but are not limited to:
Host country government reports/data
UN, World Bank, and other relevant data
Document review (reports, studies, evaluations of similar programs, etc.
Official government records
Official reports from implementing partner(s)
Bureau Owner(s)
Bureau, Office, or Post: (provide as much organizational detail as possible, starting with the bureau and drilling down).
POC: Provide at least one point of contact and their name, phone, and email from the owner bureau(s) for consultation and records management purposes.
Disaggregate(s) To disaggregate data means to break it down by subgroups. It is important to consider only the information that you need to know, as there are infinite ways to disaggregate information. Note that all people-level indicators must be sex-disaggregated. Bureaus, offices, and posts are encouraged to limit disaggregates to what is reasonable and feasible to obtain in the field.
Table 8. Indicator Reference Sheet Instructions
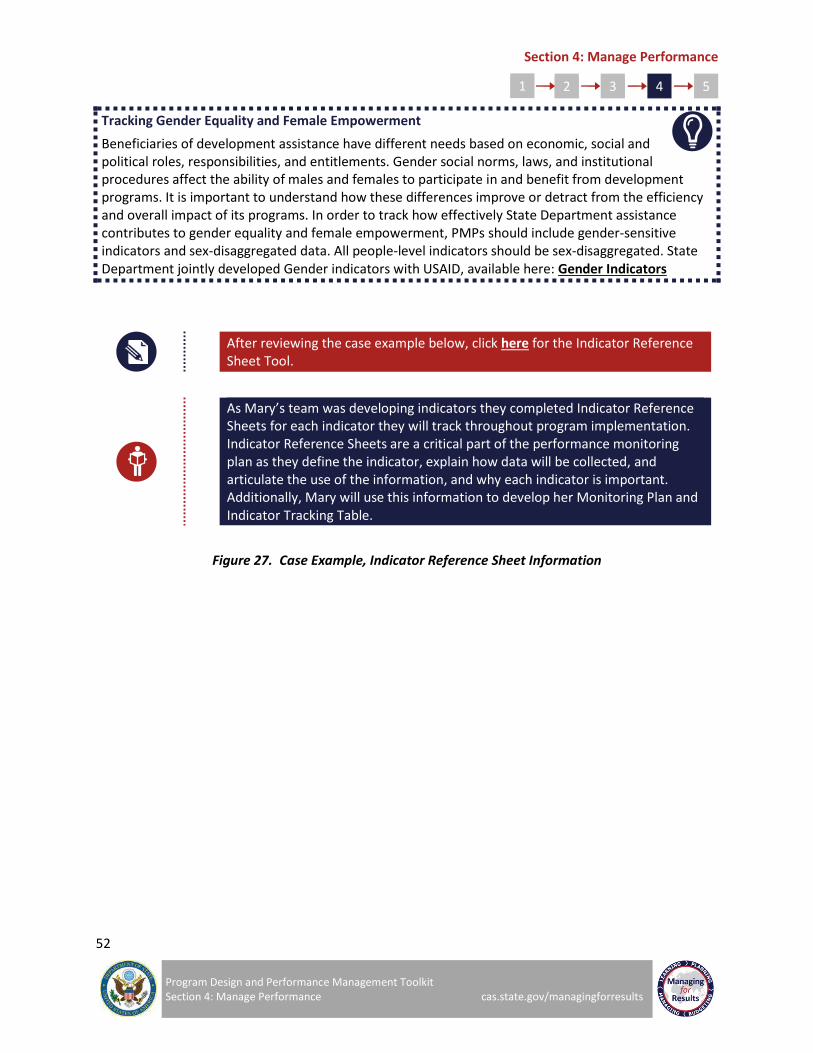
Section 4: Manage Performance
52
Program Design and Performance Management Toolkit Section 4: Manage Performance cas.state.gov/managingforresults
1 2 3 4 5
Tracking Gender Equality and Female Empowerment
Beneficiaries of development assistance have different needs based on economic, social and political roles, responsibilities, and entitlements. Gender social norms, laws, and institutional procedures affect the ability of males and females to participate in and benefit from development programs. It is important to understand how these differences improve or detract from the efficiency and overall impact of its programs. In order to track how effectively State Department assistance contributes to gender equality and female empowerment, PMPs should include gender-sensitive indicators and sex-disaggregated data. All people-level indicators should be sex-disaggregated. State Department jointly developed Gender indicators with USAID, available here: Gender Indicators
After reviewing the case example below, click here for the Indicator Reference Sheet Tool.
As Mary’s team was developing indicators they completed Indicator Reference Sheets for each indicator they will track throughout program implementation. Indicator Reference Sheets are a critical part of the performance monitoring plan as they define the indicator, explain how data will be collected, and articulate the use of the information, and why each indicator is important. Additionally, Mary will use this information to develop her Monitoring Plan and Indicator Tracking Table.
Figure 27. Case Example, Indicator Reference Sheet Information
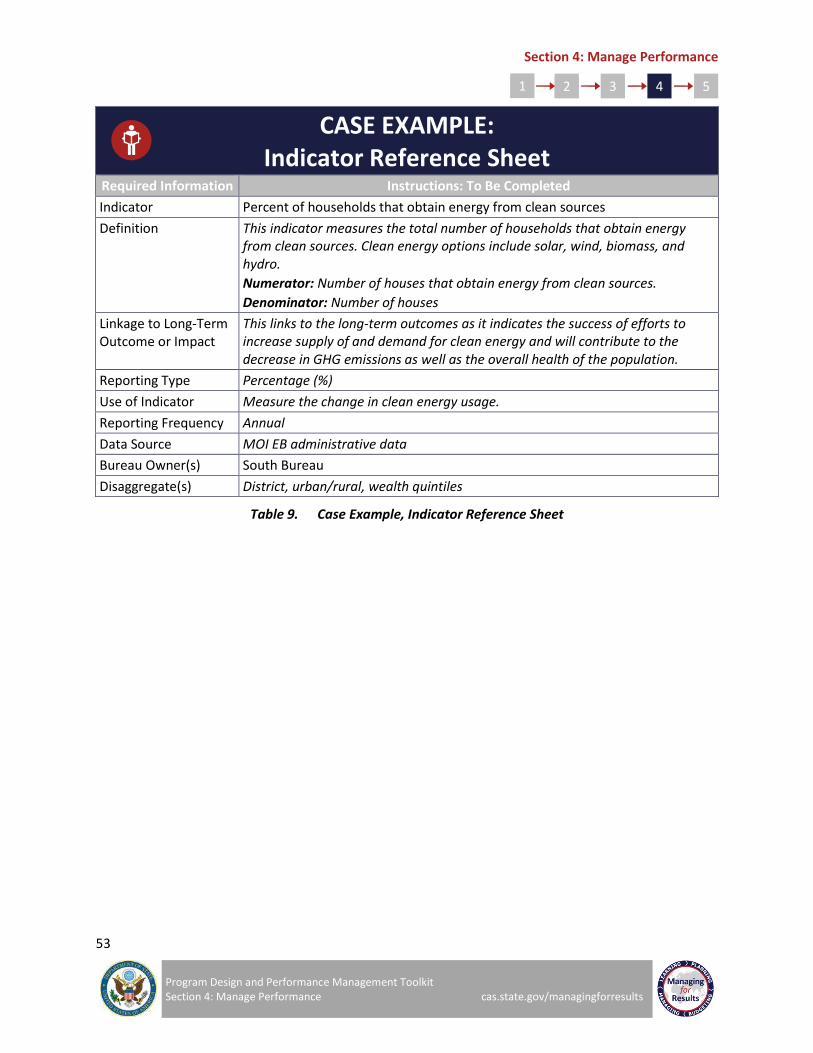
Section 4: Manage Performance
53
Program Design and Performance Management Toolkit Section 4: Manage Performance cas.state.gov/managingforresults
1 2 3 4 5
CASE EXAMPLE: Indicator Reference Sheet
Required Information Instructions: To Be Completed
Indicator Percent of households that obtain energy from clean sources
Definition This indicator measures the total number of households that obtain energy from clean sources. Clean energy options include solar, wind, biomass, and hydro.
Numerator: Number of houses that obtain energy from clean sources.
Denominator: Number of houses
Linkage to Long-Term Outcome or Impact
This links to the long-term outcomes as it indicates the success of efforts to increase supply of and demand for clean energy and will contribute to the decrease in GHG emissions as well as the overall health of the population.
Reporting Type Percentage (%)
Use of Indicator Measure the change in clean energy usage.
Reporting Frequency Annual
Data Source MOI EB administrative data
Bureau Owner(s) South Bureau
Disaggregate(s) District, urban/rural, wealth quintiles
Table 9. Case Example, Indicator Reference Sheet
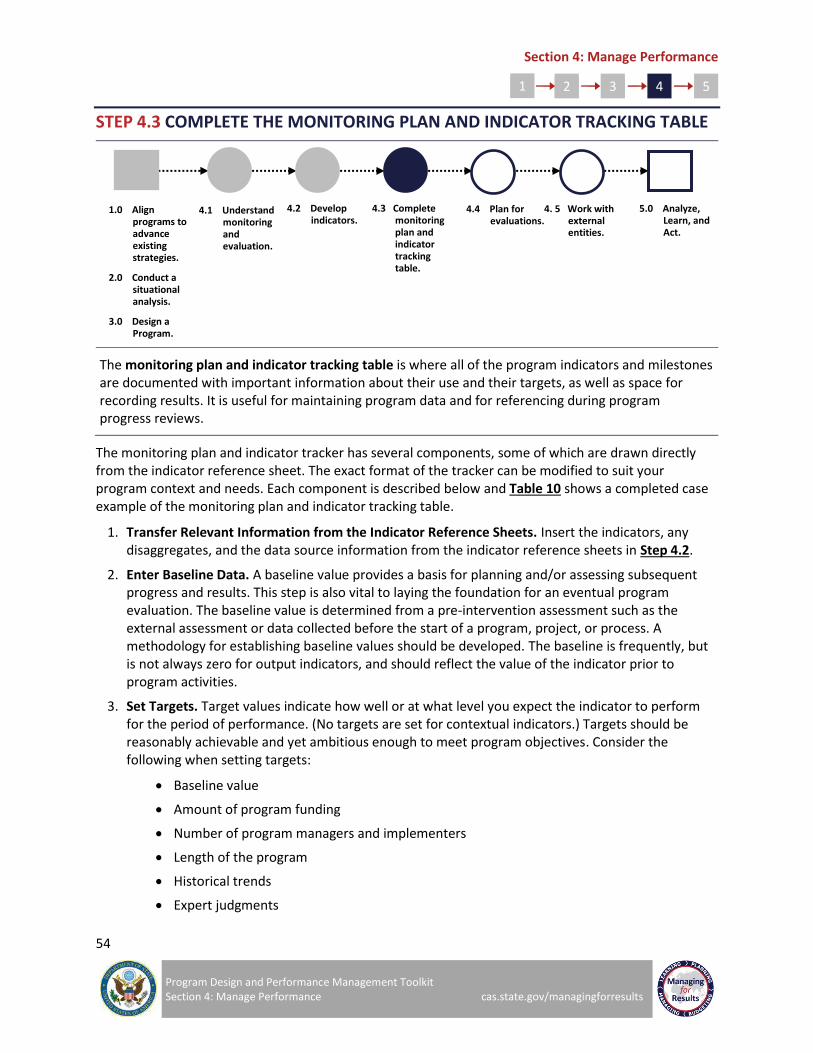
Section 4: Manage Performance
54
Program Design and Performance Management Toolkit Section 4: Manage Performance cas.state.gov/managingforresults
1 2 3 4 5
STEP 4.3 COMPLETE THE MONITORING PLAN AND INDICATOR TRACKING TABLE
The monitoring plan and indicator tracking table is where all of the program indicators and milestones are documented with important information about their use and their targets, as well as space for recording results. It is useful for maintaining program data and for referencing during program progress reviews.
The monitoring plan and indicator tracker has several components, some of which are drawn directly from the indicator reference sheet. The exact format of the tracker can be modified to suit your program context and needs. Each component is described below and Table 10 shows a completed case example of the monitoring plan and indicator tracking table.
1. Transfer Relevant Information from the Indicator Reference Sheets. Insert the indicators, any disaggregates, and the data source information from the indicator reference sheets in Step 4.2.
2. Enter Baseline Data. A baseline value provides a basis for planning and/or assessing subsequent progress and results. This step is also vital to laying the foundation for an eventual program evaluation. The baseline value is determined from a pre-intervention assessment such as the external assessment or data collected before the start of a program, project, or process. A methodology for establishing baseline values should be developed. The baseline is frequently, but is not always zero for output indicators, and should reflect the value of the indicator prior to program activities.
3. Set Targets. Target values indicate how well or at what level you expect the indicator to perform for the period of performance. (No targets are set for contextual indicators.) Targets should be reasonably achievable and yet ambitious enough to meet program objectives. Consider the following when setting targets:
Baseline value
Amount of program funding
Number of program managers and implementers
Length of the program
Historical trends
Expert judgments
1.0 Align programs to advance existing strategies.
2.0 Conduct a situational analysis.
3.0 Design a Program.
3.0 Program
4.1 Understand monitoring and evaluation.
4.3 Complete monitoring plan and indicator tracking table.
4.4 Plan for evaluations.
5.0 Analyze, Learn, and Act.
4. 5 Work with external entities.
4.2 Develop indicators.
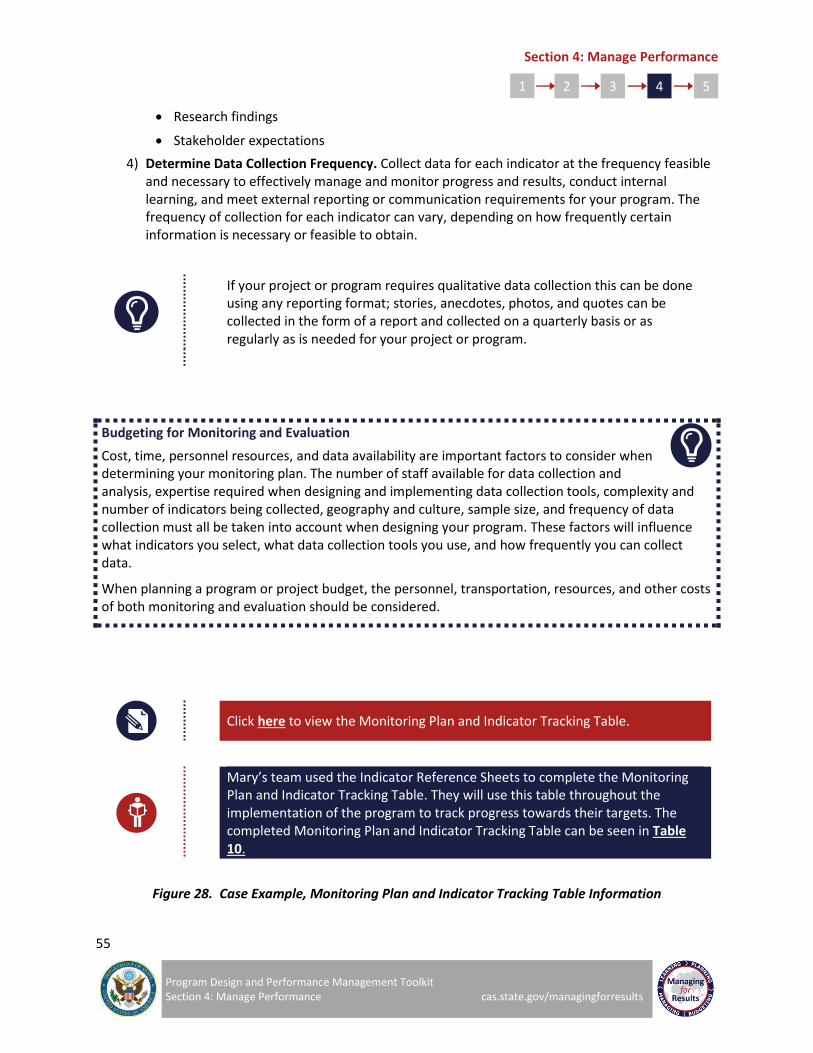
Section 4: Manage Performance
55
Program Design and Performance Management Toolkit Section 4: Manage Performance cas.state.gov/managingforresults
1 2 3 4 5
Research findings
Stakeholder expectations
4) Determine Data Collection Frequency. Collect data for each indicator at the frequency feasible and necessary to effectively manage and monitor progress and results, conduct internal learning, and meet external reporting or communication requirements for your program. The frequency of collection for each indicator can vary, depending on how frequently certain information is necessary or feasible to obtain.
If your project or program requires qualitative data collection this can be done using any reporting format; stories, anecdotes, photos, and quotes can be collected in the form of a report and collected on a quarterly basis or as regularly as is needed for your project or program.
Budgeting for Monitoring and Evaluation
Cost, time, personnel resources, and data availability are important factors to consider when determining your monitoring plan. The number of staff available for data collection and analysis, expertise required when designing and implementing data collection tools, complexity and number of indicators being collected, geography and culture, sample size, and frequency of data collection must all be taken into account when designing your program. These factors will influence what indicators you select, what data collection tools you use, and how frequently you can collect data.
When planning a program or project budget, the personnel, transportation, resources, and other costs of both monitoring and evaluation should be considered.
Click here to view the Monitoring Plan and Indicator Tracking Table.
Mary’s team used the Indicator Reference Sheets to complete the Monitoring Plan and Indicator Tracking Table. They will use this table throughout the implementation of the program to track progress towards their targets. The completed Monitoring Plan and Indicator Tracking Table can be seen in Table 10.
Figure 28. Case Example, Monitoring Plan and Indicator Tracking Table Information

Section 4: Performance Management
56
Program Design and Performance Management Toolkit Section 4: Manage Performance cas.state.gov/managingforresults
1 2 3 4 5
CASE EXAMPLE Monitoring Plan and Indicator Tracking Table
Indicator Baseline Data Source Data
Disaggregation
Frequency of Data
Collection
Cu
mu
lati
ve
Targ
et
Cu
mu
lati
ve
Act
ual
(to
Dat
a)
Q1
Tar
get
Q1
Act
ual
Q2
Tar
get
Q1
2 A
ctu
al
Q3
Tar
get
Q3
Act
ual
Q4
Tar
get
Q4
Act
ual
Program Goal: Increase the supply of and demand for clean forms of energy as a means to decrease GHG emissions and improve health and economic outcomes. 1.1 Percent of energy produced that comes from clean sources
TBD after baseline assessment
Government Documents
Hydro, solar, wind, biomass
Annual TBD
1.2 GHG emissions TBD after baseline assessment
Government Documents
N/A Annual TBD
1.3 Number of respiratory related health issues
TBD after baseline assessment
Red Cross Data Male/Female 0-5, 6-11, 12-18, 19-35, 36+
Annual TBD
Objective 1: Increase capacity of the national government to create and implement regulatory frameworks and policies to promote and sustain a clean energy sector. 1.4 Number of MOI EB personnel who complete educational exchanges
0 Program Documentation
Male/Female Position
Bi-Annual 8
1.5 Number of MOI EB personnel who received technical assistance
0 Attendance Sheets
Male/Female Position
Quarterly 50
1.6 Number of partnerships established
2 Signed MOUs Civil Society, Government, Private Sector
Annual 5
1.7 Number of policies, regulations, frameworks implemented
0 Government Documents
N/A Annual 1
Table 10. Case Example, Monitoring Plan and Indicator Tracking Table

Section 4: Performance Management
57
Program Design and Performance Management Toolkit Section 4: Manage Performance cas.state.gov/managingforresults
1 2 3 4 5
STEP 4.4: PLAN FOR EVALUATION
Evaluation is the systematic collection and analysis of information about the characteristics and outcomes of programs, projects, and processes as a basis for judgments, to improve effectiveness, and/or inform decision-makers about current and future activities. Evaluations are designed to determine relevance, effectiveness, efficiency, sustainability, or impact. For a basic overview on evaluation, visit 10 Things to Know About Evaluation at the Department of State. Evaluations should be planned for during the design process and considered throughout implementation. Since they are usually conducted at mid-term and end-line, data must be collected at the beginning (baseline) of the program for comparison purposes. This section provides information on developing evaluation questions and explains the necessary information for conducting midline evaluations.
The State Department Evaluation Policy states: All bureaus and independent offices are encouraged to conduct evaluations to improve their programs, projects, management processes, service delivery, or performance at a rate commensurate with the scale of their work, scope of their portfolio, size of their budget, etc. At a minimum, all bureaus and independent offices should undertake at least one evaluation per fiscal year. However, those who receive and directly manage program funds must conduct evaluations of their large programs once in their lifetime. Additionally, pilot programs should be evaluated before replicating. Bureaus and independent offices directly implementing programs should first and foremost have a program management plan in place (Evaluation Policy).
The policy stipulates that a “large program” is one whose dollar value is equal to or exceeds the median program level for the bureau.
1.0 Align programs to advance existing strategies.
2.0 Conduct a situational analysis.
3.0 Design a Program.
4.1 Understand monitoring and evaluation.
4.3 Complete monitoring plan and indicator tracking table.
4.4 Plan for evaluations.
5.0 Analyze, Learn, and Act.
4. 5 Work with external entities.
4.2 Develop indicators.
Section 4: Performance Management
58
Program Design and Performance Management Toolkit Section 4: Manage Performance cas.state.gov/managingforresults
1 2 3 4 5
4.4.1: Evaluation Types
There are two main types of evaluations that can be relevant to your programs, projects, or processes.6
Performance/Process. These evaluations focus on the performance of an intervention, diplomatic activity, management process or program, and examine its implementation, inputs, outputs, and likely outcomes. Performance evaluations focus on descriptive and normative questions:
Did the program take off as planned?
What problems and challenges, if any, did it face?
Was it or is it being effectively managed?
Did it provide planned goods and services in a timely fashion? If not, why not?
Were the original cost estimates realistic?
Did it meet its targets or is it likely to meet them?
What are its expected effects and impacts?
Is it sustainable?
Summative/Ex- Post/Impact. They differ from performance/process evaluations in that their focus is primarily on outcomes and impacts, and they are conducted when a program has ended or is soon to end. The essence of summative/ex-post evaluations lies in establishing that the changes have occurred as a result of the program, or at least the latter has substantially contributed to them. Summative/ex-post evaluations answer questions such as:
What changes were observed in targeted populations, organizations or policies during and at the end of the program?
To what extent can the observed changes be attributed to it?
Were there unintended effects that were not anticipated at the planning stage? Were they positive or negative?
What factors explain the intended and unintended impacts?
Sometimes impact evaluations only refer to those evaluations which use counterfactuals to measure the net impacts of a project or program. In such evaluations, two groups – treatment and control – are established either at the launch of a project or program or by using baseline data if it is available. One group receives the services and goods from the project or program (such as technical assistance, training, advice and/or financial assistance or material support) while the other does not. The overall impacts are measured by comparing the performance, conditions, or status of the two groups. Establishing control groups to generate counterfactual data must be done at the beginning with comparable groups. It is not always feasible or practical because of the advance planning required and the additional expense.
6 http://cas.state.gov/evaluation/files/2014/05/2016-Evaluation-Guidance.pdf

Section 4: Performance Management
59
Program Design and Performance Management Toolkit Section 4: Manage Performance cas.state.gov/managingforresults
1 2 3 4 5
Other types of evaluations include:
Experience Reviews, also known as Desk Reviews, involve systematic analysis of past experience mostly based on the review of documents, reports, evaluations, and studies.
Meta-Evaluations involve reviewing evaluations against a set of professional standards.
Organizational Assessments document the current state and include an analysis of the bureau’s business operations, policies, procedures, and personnel resources as appropriate.
Sector Evaluations occur at the country, regional, or global levels. The objective of such evaluations is to examine the performance and outcomes of major projects and programs in a sector or sub-sector to draw general findings, conclusions, and recommendations.
Evaluations can be conducted internally by someone who is in the office or bureau but who does not report to anyone in the line of management of the program under evaluation or externally by a hired organization outside the office, bureau or post that is not engaged in implementation of the program under evaluation. In instances where there is mutual interest, they may be undertaken collaboratively or jointly by more than one office, bureau, other USG agency, or other external entity.
For more information on types of evaluations visit the Department of State Evaluation Guidance (Evaluation Guidance). For additional evaluation training, resources, and information visit the Evaluation Page at Resources or the Evaluation Wiki.
“The most serious mistakes are not being made as a result of wrong answers. The truly dangerous thing is asking the wrong question.”
– Peter Drucker
Section 4: Performance Management
60
Program Design and Performance Management Toolkit Section 4: Manage Performance cas.state.gov/managingforresults
1 2 3 4 5
4.4.2: Preliminarily Plan for Evaluation
Whether the evaluation is internal or external, bureaus and offices should be actively involved in evaluation planning to ensure the final product is useful. Stakeholders should be consulted to assist in prioritizing the evaluation questions. Regardless of an evaluation’s scope, the planning process should involve the following steps:
Clarify the evaluation purpose including:
– What will be evaluated,
– Who wants the information,
– What they want to know, and
– How the information will be used.
Consider information attained from the program summary and performance management plan, such as:
– Problem statement,
– Goals and objectives,
– Logic model,
– The TOC hypotheses as a basis for identifying evaluation questions and,
– Monitoring plan and indicator tracking table;
Identify a small number of key questions and specific issues;
Consider past evaluations and research that could inform project design and evaluation planning;
Select evaluation methods that are rigorous and appropriate to the evaluation questions; they should be based on verifiable data and information that have been gathered using the standards of professional evaluation organizations;
Plan for data collection and analysis; and
Consider time and budgetary constraints.
Evaluation Questions:
Evaluation questions focus on a limited number of key points and establish the scope of an evaluation, communicating to others what the evaluation will and will not address. They guide the evaluation process and define what should be assessed. The questions the evaluation will seek to answer are aligned with clearly articulated goals and objectives of a program, project, or process and can increase the accuracy and objectivity of the evaluation by keeping it focused. Evaluation questions are answered through data collection and analysis in order to assess whether or not expected results of the program were achieved.

Section 4: Performance Management
61
Program Design and Performance Management Toolkit Section 4: Manage Performance cas.state.gov/managingforresults
1 2 3 4 5
Generally speaking, evaluation questions are intended to address the relevance, effectiveness, efficiency, sustainability and/or impact of the intended program.7
Relevance. To what extent are the intended outcomes of the effort still valid?
Effectiveness. To what extent were the intended outcomes achieved or likely to be achieved?
Efficiency. Were activities cost-efficient? Were intended outcomes achieved on time?
Sustainability. To what extent are the benefits of the effort likely to continue after donor funding ceases?
Impact. What happened as a result of the effort? What difference has it made in people’s lives?
For more information on conducting evaluations visit the Evaluation Page at Evaluation Questions Resource.
Strong Evaluation Question
Weak Evaluation Question
Example: According to stakeholder perception, to what degree has the project contributed to the observed change in GHG emissions in Freedonia?
Example: Are the interventions sustainable?
Explanation: This evaluation question is strong because it is researchable, it is specific to the program, and it is clearly defined.
Explanation: This is a weak evaluation question because it is not specific. Sustainable is not clearly defined and the researcher may not know what interventions the question is referring to or what is meant by sustainable.
Strong Evaluation Question
Weak Evaluation Question
Example: To what degree do the educational exchanges contribute to the capacity of government officials to create and implement relevant policies and regulatory frameworks that promote and sustain a clean energy sector?
Example: Are the educational exchanges worthwhile?
Explanation: This evaluation question is strong because it is researchable, it is specific to the program, and it is clearly defined.
Explanation: This is a weak evaluation question because it is not specific.
Figure 29. Case Example, Strong vs Weak Evaluation Questions
7 http://ctb.ku.edu/en/table-of-contents/evaluate/evaluate-community-interventions/choose-evaluation-questions/main

Section 4: Performance Management
62
Program Design and Performance Management Toolkit Section 4: Manage Performance cas.state.gov/managingforresults
1 2 3 4 5
STEP 4.5: USING THE TOOLKIT WITH EXTERNAL IMPLEMENTERS
This section explains how the Toolkit can be used to work with implementers outside of the Department and describes various mechanisms for hiring an implementer, the timelines to do so, and resources available within the Department to assist in this process. For more information on federal assistance or contract policy support, contact A/OPE. For more information on executing an assistance award or contract, contact A/LM/AQM. For additional evaluation contracting support visit the State Department Evaluation Page.
Using the Toolkit when Working with External Entities
You may use an external partner/vendor to conduct your project or program. The completed templates from this toolkit can be used as resources to work with these implementers/external vendors in the early stages of designing a statement of work or at the end stages of evaluating progress and achievements toward program objectives.
A solicitation is used to define project/program specific activities, deliverables, and timelines for a vendor/partner providing services or implementing a program for an office or bureau. Solicitations can come in the form of a Request for Proposal (RFP), a Notice of Funding Opportunity (NOFO), or other variants. When drafting one of these documents, information from this toolkit can be applied to create a strong document that will clearly express your expectations for proposal submissions.
If you would like additional information or clarification on capabilities of suppliers or implementing partners for contracts, you can publish a Request for Information (RFI). RFIs are used to collect information about the capabilities of various suppliers/implementing partners. Normally it follows a format that can be used for comparative purposes and is used to inform solicitations. Many times the external entities may have valuable subject matter expertise and you may want their thoughts on how to best solve a problem. It is still important to provide them with as much information as possible to get the best responses. The same tools mentioned above can help form an RFI.
Part of the solicitation process is to develop selection criteria to select a partner/vendor in a fair, unbiased, and informed manner. The tools in this toolkit are one way to supplement information provided by A/OPE to help develop selection criteria to see which candidates met the requirements stated in your funding announcement.
1.0 Align programs to advance existing strategies.
2.0 Conduct a situational analysis.
3.0 Design a Program.
4.1 Understand monitoring and evaluation.
4.3 Complete monitoring plan and indicator tracking table.
4.4 Plan for evaluations.
5.0 Analyze, Learn, and Act.
4. 5 Work with external entities.
4.2 Develop indicators.
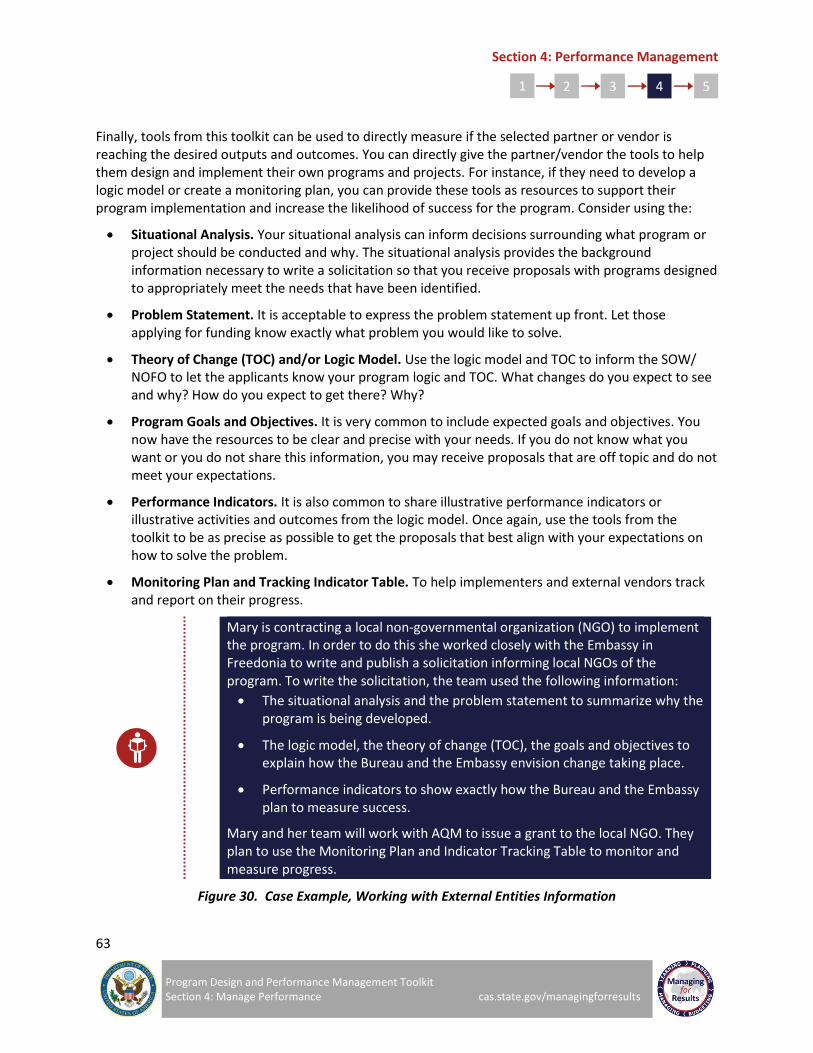
Section 4: Performance Management
63
Program Design and Performance Management Toolkit Section 4: Manage Performance cas.state.gov/managingforresults
1 2 3 4 5
Finally, tools from this toolkit can be used to directly measure if the selected partner or vendor is reaching the desired outputs and outcomes. You can directly give the partner/vendor the tools to help them design and implement their own programs and projects. For instance, if they need to develop a logic model or create a monitoring plan, you can provide these tools as resources to support their program implementation and increase the likelihood of success for the program. Consider using the:
Situational Analysis. Your situational analysis can inform decisions surrounding what program or project should be conducted and why. The situational analysis provides the background information necessary to write a solicitation so that you receive proposals with programs designed to appropriately meet the needs that have been identified.
Problem Statement. It is acceptable to express the problem statement up front. Let those applying for funding know exactly what problem you would like to solve.
Theory of Change (TOC) and/or Logic Model. Use the logic model and TOC to inform the SOW/ NOFO to let the applicants know your program logic and TOC. What changes do you expect to see and why? How do you expect to get there? Why?
Program Goals and Objectives. It is very common to include expected goals and objectives. You now have the resources to be clear and precise with your needs. If you do not know what you want or you do not share this information, you may receive proposals that are off topic and do not meet your expectations.
Performance Indicators. It is also common to share illustrative performance indicators or illustrative activities and outcomes from the logic model. Once again, use the tools from the toolkit to be as precise as possible to get the proposals that best align with your expectations on how to solve the problem.
Monitoring Plan and Tracking Indicator Table. To help implementers and external vendors track and report on their progress.
Mary is contracting a local non-governmental organization (NGO) to implement the program. In order to do this she worked closely with the Embassy in Freedonia to write and publish a solicitation informing local NGOs of the program. To write the solicitation, the team used the following information:
The situational analysis and the problem statement to summarize why the program is being developed.
The logic model, the theory of change (TOC), the goals and objectives to explain how the Bureau and the Embassy envision change taking place.
Performance indicators to show exactly how the Bureau and the Embassy plan to measure success.
Mary and her team will work with AQM to issue a grant to the local NGO. They plan to use the Monitoring Plan and Indicator Tracking Table to monitor and measure progress.
Figure 30. Case Example, Working with External Entities Information
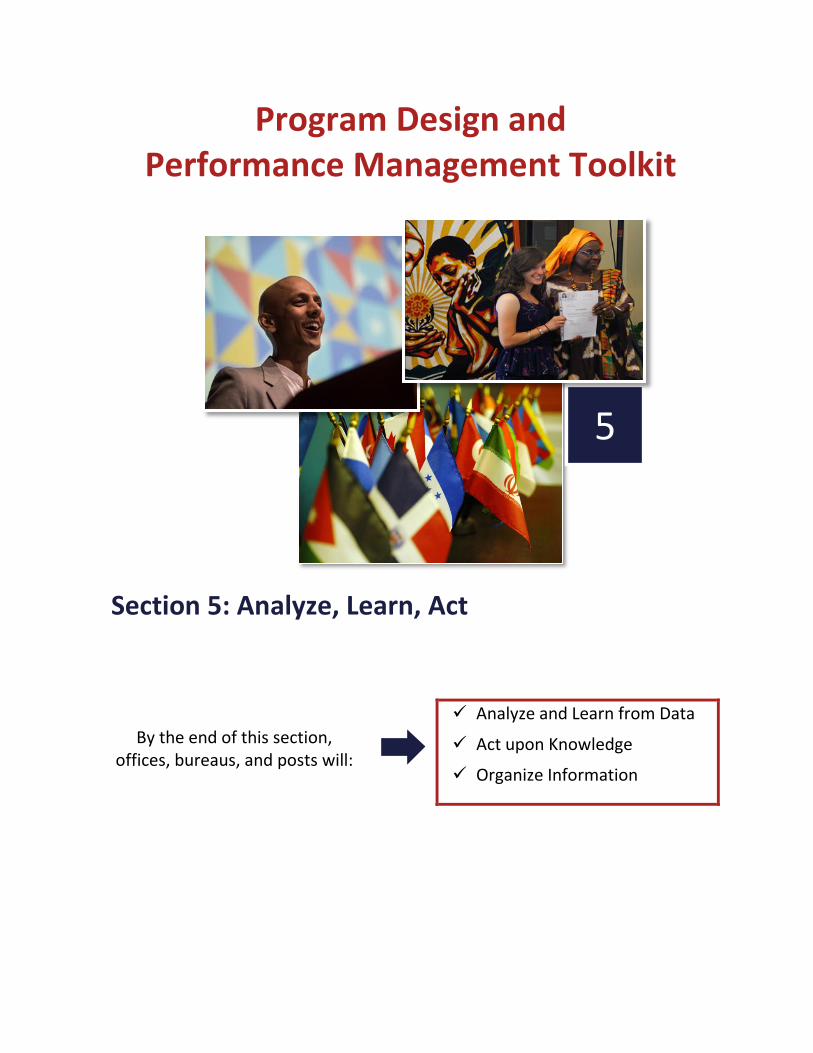
Program Design and Performance Management Toolkit
Section 5: Analyze, Learn, Act
By the end of this section, offices, bureaus, and posts will:
Analyze and Learn from Data
Act upon Knowledge
Organize Information
5
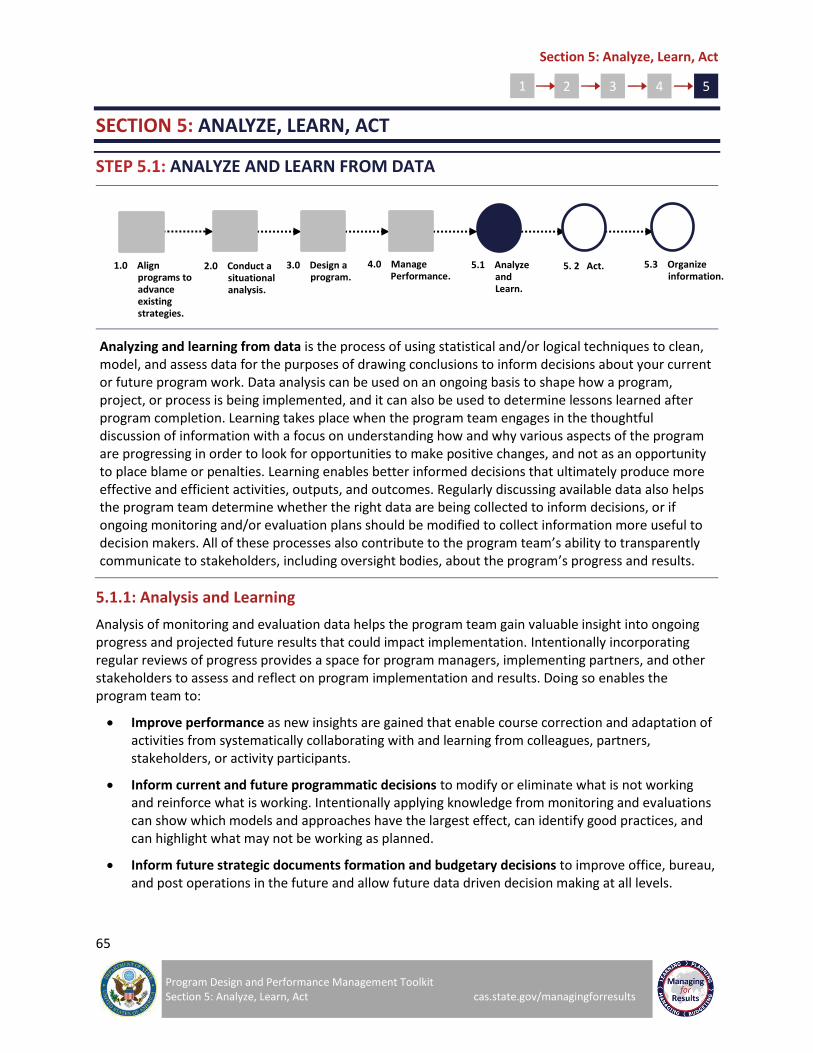
Section 5: Analyze, Learn, Act
65
Program Design and Performance Management Toolkit Section 5: Analyze, Learn, Act cas.state.gov/managingforresults
1 2 3 4 5
SECTION 5: ANALYZE, LEARN, ACT
STEP 5.1: ANALYZE AND LEARN FROM DATA
Analyzing and learning from data is the process of using statistical and/or logical techniques to clean, model, and assess data for the purposes of drawing conclusions to inform decisions about your current or future program work. Data analysis can be used on an ongoing basis to shape how a program, project, or process is being implemented, and it can also be used to determine lessons learned after program completion. Learning takes place when the program team engages in the thoughtful discussion of information with a focus on understanding how and why various aspects of the program are progressing in order to look for opportunities to make positive changes, and not as an opportunity to place blame or penalties. Learning enables better informed decisions that ultimately produce more effective and efficient activities, outputs, and outcomes. Regularly discussing available data also helps the program team determine whether the right data are being collected to inform decisions, or if ongoing monitoring and/or evaluation plans should be modified to collect information more useful to decision makers. All of these processes also contribute to the program team’s ability to transparently communicate to stakeholders, including oversight bodies, about the program’s progress and results.
5.1.1: Analysis and Learning
Analysis of monitoring and evaluation data helps the program team gain valuable insight into ongoing progress and projected future results that could impact implementation. Intentionally incorporating regular reviews of progress provides a space for program managers, implementing partners, and other stakeholders to assess and reflect on program implementation and results. Doing so enables the program team to:
Improve performance as new insights are gained that enable course correction and adaptation of activities from systematically collaborating with and learning from colleagues, partners, stakeholders, or activity participants.
Inform current and future programmatic decisions to modify or eliminate what is not working and reinforce what is working. Intentionally applying knowledge from monitoring and evaluations can show which models and approaches have the largest effect, can identify good practices, and can highlight what may not be working as planned.
Inform future strategic documents formation and budgetary decisions to improve office, bureau, and post operations in the future and allow future data driven decision making at all levels.
1.0 Align programs to advance existing strategies.
2.0 Conduct a situational analysis.
4.0 Manage Performance.
5.1 Analyze and Learn.
5.3 Organize information.
5. 2 Act.
3.0 Design a program.
Section 5: Analyze, Learn, Act
66
Program Design and Performance Management Toolkit Section 5: Analyze, Learn, Act cas.state.gov/managingforresults
1 2 3 4 5
Test theory of change hypotheses by filling knowledge gaps and resolving uncertainties in the hypotheses with new research or syntheses of existing analyses.
Identify and monitor assumptions and context that may be conditions beyond your control, but could impede project or program implementation if not assessed.
Build awareness or advocate for a cause through public diplomacy and advocacy campaigns around a particular issue or the Department’s efforts to resolve a particular problem.
Reduce the challenges associated with staff turnover and transition when the capture of knowledge gained by staff about the local context, past and present activities, and key relationships is done effectively and documented.
Advocate for support with increased information and knowledge about the program, project, or process implementation and results to defend and support Department resource requests.
Facilitate coordination, collaboration, communication, and exchange of experiential knowledge internally and with external stakeholders.
Maintain accountability with implementers and key stakeholders by establishing regular reviews.
Measure progress towards bureau, office, and post strategic goals and objectives by using program and project performance data as part of regular reviews of progress toward the strategic goals and objectives of the bureau, office, or post.
Assessing these questions allows program managers to learn the extent to which the program is progressing according to plan, apply accountability measures, and identify any possible adjustments to inputs, activities, or overall implementation of the program to mitigate any issues identified.
5.1.2: Data Accuracy and Quality Assurance
Before data analysis and learning can begin, the program team should take steps to check the data for accuracy and quality, and make adjustments as necessary. Checking for the following types of issues can tell you if there are missing or incorrect data and if data collection tools are being used accurately:
Data that are too perfect or consistent – Data that are exactly the same over a period of time or perfectly match every target may indicate a problem. For example, data indicating 100 percent attendance at a training over a 5 year period may suggest that data were inaccurately recorded or falsified.8
Gaps in data – Check to be certain that all data were recorded and that an explanation is provided for missing data. Certain circumstances such as floods in a region or Embassy closures could result in data not being recorded for a period of time, but teams should also look for any signs that a partner or vendor skipped required reporting without justification.9
Incorrect data – Making errors while transcribing data is possible, and instituting controls over how and when data entry occurs could decrease the likelihood of human error. Team members should cross-check each other’s work to be sure data are correctly entered. For example, systems should be in place to check that decimals are in the right place, that numerators and denominators are correctly reported, that information is entered into the correct columns, and
8 http://usaidlearninglab.org/sites/default/files/resource/files/36-pmp_toolkit_complete_final_14_aug_2014.pdf
9 http://usaidlearninglab.org/sites/default/files/resource/files/36-pmp_toolkit_complete_final_14_aug_2014.pdf
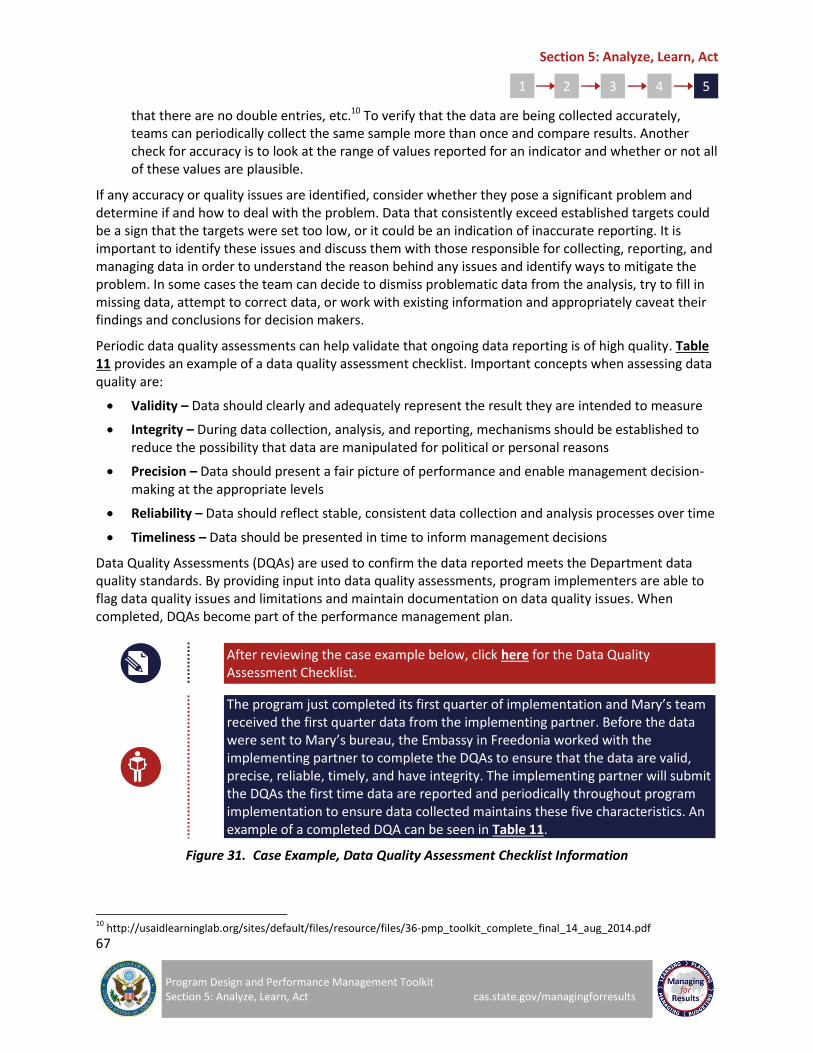
Section 5: Analyze, Learn, Act
67
Program Design and Performance Management Toolkit Section 5: Analyze, Learn, Act cas.state.gov/managingforresults
1 2 3 4 5
that there are no double entries, etc.10 To verify that the data are being collected accurately, teams can periodically collect the same sample more than once and compare results. Another check for accuracy is to look at the range of values reported for an indicator and whether or not all of these values are plausible.
If any accuracy or quality issues are identified, consider whether they pose a significant problem and determine if and how to deal with the problem. Data that consistently exceed established targets could be a sign that the targets were set too low, or it could be an indication of inaccurate reporting. It is important to identify these issues and discuss them with those responsible for collecting, reporting, and managing data in order to understand the reason behind any issues and identify ways to mitigate the problem. In some cases the team can decide to dismiss problematic data from the analysis, try to fill in missing data, attempt to correct data, or work with existing information and appropriately caveat their findings and conclusions for decision makers.
Periodic data quality assessments can help validate that ongoing data reporting is of high quality. Table 11 provides an example of a data quality assessment checklist. Important concepts when assessing data quality are:
Validity – Data should clearly and adequately represent the result they are intended to measure
Integrity – During data collection, analysis, and reporting, mechanisms should be established to reduce the possibility that data are manipulated for political or personal reasons
Precision – Data should present a fair picture of performance and enable management decision-making at the appropriate levels
Reliability – Data should reflect stable, consistent data collection and analysis processes over time
Timeliness – Data should be presented in time to inform management decisions
Data Quality Assessments (DQAs) are used to confirm the data reported meets the Department data quality standards. By providing input into data quality assessments, program implementers are able to flag data quality issues and limitations and maintain documentation on data quality issues. When completed, DQAs become part of the performance management plan.
After reviewing the case example below, click here for the Data Quality Assessment Checklist.
The program just completed its first quarter of implementation and Mary’s team received the first quarter data from the implementing partner. Before the data were sent to Mary’s bureau, the Embassy in Freedonia worked with the implementing partner to complete the DQAs to ensure that the data are valid, precise, reliable, timely, and have integrity. The implementing partner will submit the DQAs the first time data are reported and periodically throughout program implementation to ensure data collected maintains these five characteristics. An example of a completed DQA can be seen in Table 11.
Figure 31. Case Example, Data Quality Assessment Checklist Information
10
http://usaidlearninglab.org/sites/default/files/resource/files/36-pmp_toolkit_complete_final_14_aug_2014.pdf
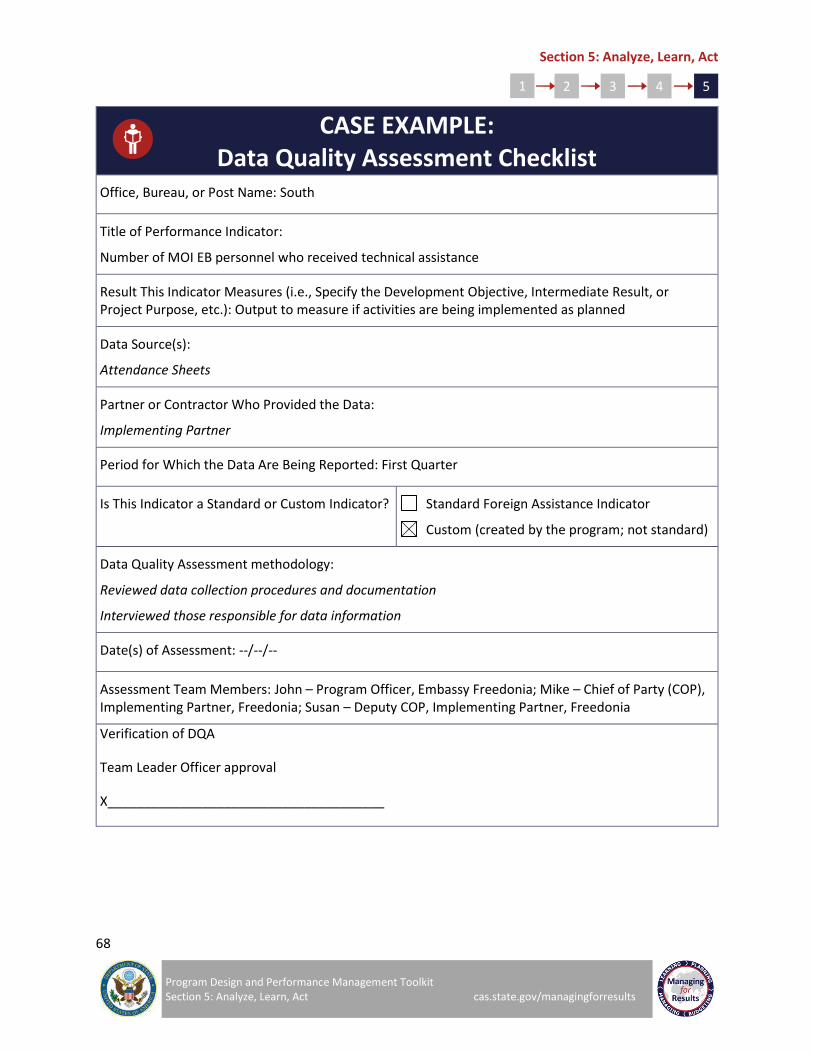
Section 5: Analyze, Learn, Act
68
Program Design and Performance Management Toolkit Section 5: Analyze, Learn, Act cas.state.gov/managingforresults
1 2 3 4 5
CASE EXAMPLE: Data Quality Assessment Checklist
Office, Bureau, or Post Name: South
Title of Performance Indicator:
Number of MOI EB personnel who received technical assistance
Result This Indicator Measures (i.e., Specify the Development Objective, Intermediate Result, or Project Purpose, etc.): Output to measure if activities are being implemented as planned
Data Source(s):
Attendance Sheets
Partner or Contractor Who Provided the Data:
Implementing Partner
Period for Which the Data Are Being Reported: First Quarter
Is This Indicator a Standard or Custom Indicator? Standard Foreign Assistance Indicator
Custom (created by the program; not standard)
Data Quality Assessment methodology:
Reviewed data collection procedures and documentation
Interviewed those responsible for data information
Date(s) of Assessment: --/--/--
Assessment Team Members: John – Program Officer, Embassy Freedonia; Mike – Chief of Party (COP), Implementing Partner, Freedonia; Susan – Deputy COP, Implementing Partner, Freedonia
Verification of DQA
Team Leader Officer approval
X______________________________________
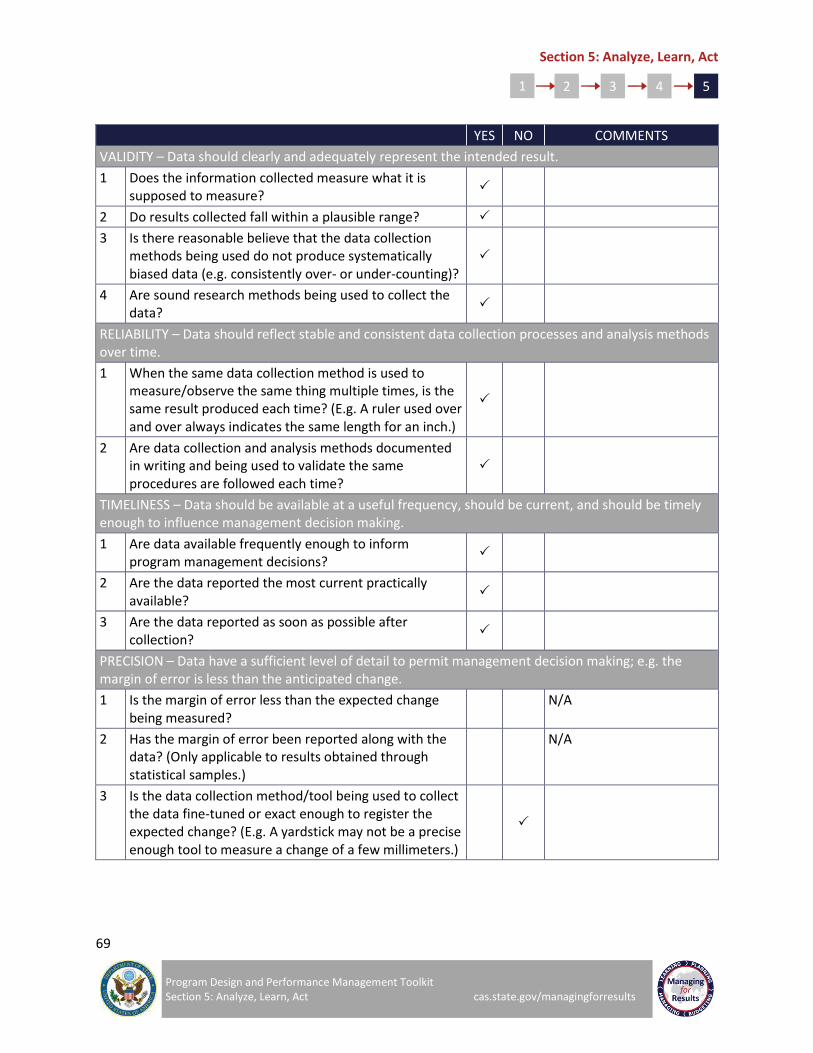
Section 5: Analyze, Learn, Act
69
Program Design and Performance Management Toolkit Section 5: Analyze, Learn, Act cas.state.gov/managingforresults
1 2 3 4 5
YES NO COMMENTS
VALIDITY – Data should clearly and adequately represent the intended result.
1 Does the information collected measure what it is supposed to measure?
2 Do results collected fall within a plausible range?
3 Is there reasonable believe that the data collection methods being used do not produce systematically biased data (e.g. consistently over- or under-counting)?
4 Are sound research methods being used to collect the data?
RELIABILITY – Data should reflect stable and consistent data collection processes and analysis methods over time.
1 When the same data collection method is used to measure/observe the same thing multiple times, is the same result produced each time? (E.g. A ruler used over and over always indicates the same length for an inch.)
2 Are data collection and analysis methods documented in writing and being used to validate the same procedures are followed each time?
TIMELINESS – Data should be available at a useful frequency, should be current, and should be timely enough to influence management decision making.
1 Are data available frequently enough to inform program management decisions?
2 Are the data reported the most current practically available?
3 Are the data reported as soon as possible after collection?
PRECISION – Data have a sufficient level of detail to permit management decision making; e.g. the margin of error is less than the anticipated change.
1 Is the margin of error less than the expected change being measured?
N/A
2 Has the margin of error been reported along with the data? (Only applicable to results obtained through statistical samples.)
N/A
3 Is the data collection method/tool being used to collect the data fine-tuned or exact enough to register the expected change? (E.g. A yardstick may not be a precise enough tool to measure a change of a few millimeters.)

Section 5: Analyze, Learn, Act
70
Program Design and Performance Management Toolkit Section 5: Analyze, Learn, Act cas.state.gov/managingforresults
1 2 3 4 5
YES NO COMMENTS
INTEGRITY – Data collected should have safeguards to minimize the risk of transcription error or data manipulation.
1 Are procedures or safeguards in place to minimize data transcription errors?
2 Is there independence in key data collection, management, and assessment procedures?
3 Are mechanisms in place to prevent unauthorized changes to the data?
SUMMARY
Based on the assessment relative to the five standards, what is the overall conclusion regarding the quality of the data?
Significance of limitations (if any):
Actions needed to address limitations prior to the next DQA (given level of USG control over data):
IF NO DATA ARE AVAILABLE FOR THE INDICATOR COMMENTS
If no recent relevant data are available for this indicator, why not?
What concrete actions are now being taken to collect and report these data as soon as possible?
When will data be reported?
Table 11. Case Example, Data Quality Assessment Checklist11
11
https://usaidlearninglab.org/sites/default/files/resource/files/4-data_quality_assessment_checklist.pdf

Section 5: Analyze, Learn, Act
71
Program Design and Performance Management Toolkit Section 5: Analyze, Learn, Act cas.state.gov/managingforresults
1 2 3 4 5
STEP 5.2: ACT
Acting upon changes in knowledge is critical to turn the information into practical adjustments that promote successful program implementation, accountability, and improve overall results. Findings, conclusions, and any programmatic changes stemming from data analysis and learning should be communicated to all stakeholders so all are informed and on the same track.
Figure 32. How Program Design and Performance Management Relate to MfR
Findings from performance monitoring and evaluation should be presented to various stakeholders in a way that addresses the specific needs and interests of the audience, enables everyone to understand why and how any changes to the program will be implemented, and garners buy-in. Effective communication can be a means of facilitating coordination, strengthening implementation, defending resource requests, showing accountability, and sharing information on final results or interim progress.
Table 12 and Table 13 provide a Strategic Progress Review Framework and Action Item Tracker that can be used to plan for regular reviews of progress. In planning for the reviews, senior leaders should identify their priority review questions and discussion topics a few weeks in advance so program managers and those accountable can begin compiling the information that will be used to address each question (e.g. indicators, milestone status, relevant evaluations, and other relevant information sources). The review framework and action item tracker below can be used to document and communicate discussion topics, key findings from the review, notes about whether the right data were available or if the PMP should be modified to capture more useful or relevant information, and also note any action items or changes stemming from the review. This suggested framework can be modified to best suit the needs of your office, bureau, or post.
1.0 Align programs to advance existing strategies.
2.0 Conduct a situational analysis.
4.0 Manage Performance.
5.1 Analyze and Learn.
5.3 Organize information.
5. 2 Act.
3.0 Design a program.
Section 5: Analyze, Learn, Act
72
Program Design and Performance Management Toolkit Section 5: Analyze, Learn, Act cas.state.gov/managingforresults
1 2 3 4 5
After reviewing the case example below, click here for the Strategic Progress Review Framework and here for the Action Item Follow-Up Tracker.
Mary and her team will analyze the data. Then her team will assemble all stakeholders to meet and assess the information collected and discuss relevant topics that are of greatest use for decision-makers at the time – such as questions of overall implementation, performance of a particular activity, etc. Her team will use the Strategic Progress Review Framework to record topics of discussion and the Action Item Follow-Up Tracker to assign a point of contact for each action item as a way to track progress of each one. An example of the Strategic Progress Review Framework can be found in Table 12 and the Action Item Follow-Up Tracker can be found in Table 13.
Figure 33. Case Example, Strategic Progress Review Framework and Action Item Follow-Up Tracker Information
The important question is not how assessment is defined but whether assessment information is used…
– Palomba & Banta

Section 5: Analyze, Learn, Act
73
Program Design and Performance Management Toolkit Section 5: Analyze, Learn, Act cas.state.gov/managingforresults
1 2 3 4 5
CASE EXAMPLE: Strategic Progress Review Framework
Attendees: Mary – Program Manager; Steve – Assistant Manager; Alice – Climate Change Specialist; John – Program Officer, Embassy Freedonia; Mike – Chief of Party (COP), Implementing Partner, Freedonia; Susan – Deputy COP, Implementing Partner, Freedonia
Date: --/--/-- Completion of First Quarter
Review Question/ Discussion Topic
Data Used Findings Did we have the right data? Action Items
(Use the review to address questions that are of greatest use for decision-makers at the time – such as questions about the overall progress of a program objective, status of an activity, questions of interagency coordination, etc.)
(List the information that will be used to inform the discussion topic or question, such as indicators, milestone status, relevant evaluations, studies, key informants, etc.)
(Note key findings from the review such as were expected results achieved on pace, what obstacles were presented that need addressed, etc.)
(Note whether the data were sufficient to answer the question, or if different/more/ less data are needed. Make an action item to change your monitoring plan accordingly, if necessary.)
(Based on the findings, note any follow-up action items including any adjustments to your program summary components or the performance management plan.)
1) Have we met the indicator targets and milestones in Year 1 of the program?
Indicator data Results achieved on pace Yes Continue as planned
2) Will there be any issues coordinating with the World Bank due to timing of their program.
Program Partners World Bank has started constructing hydro power infrastructure in Blue District, but program is not ready to begin awareness campaign and government is not prepared to manage or operate systems.
Yes Work with World Bank to put construction on hold for six months to be sure the government is ready to support the infrastructure when the time comes and the community is ready to support the change.
Table 12. Case Example, Strategic Progress Review Framework
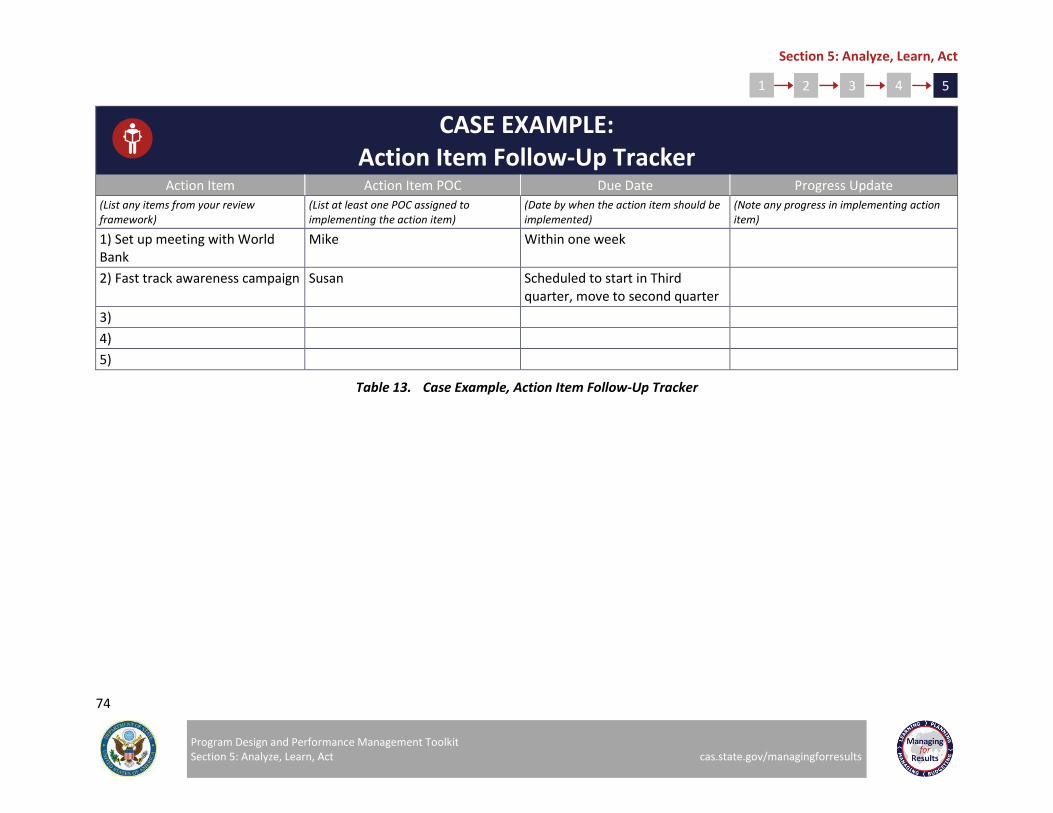
Section 5: Analyze, Learn, Act
74
Program Design and Performance Management Toolkit Section 5: Analyze, Learn, Act cas.state.gov/managingforresults
1 2 3 4 5
CASE EXAMPLE: Action Item Follow-Up Tracker
Action Item Action Item POC Due Date Progress Update
(List any items from your review framework)
(List at least one POC assigned to implementing the action item)
(Date by when the action item should be implemented)
(Note any progress in implementing action item)
1) Set up meeting with World Bank
Mike Within one week
2) Fast track awareness campaign Susan Scheduled to start in Third quarter, move to second quarter
3)
4)
5)
Table 13. Case Example, Action Item Follow-Up Tracker
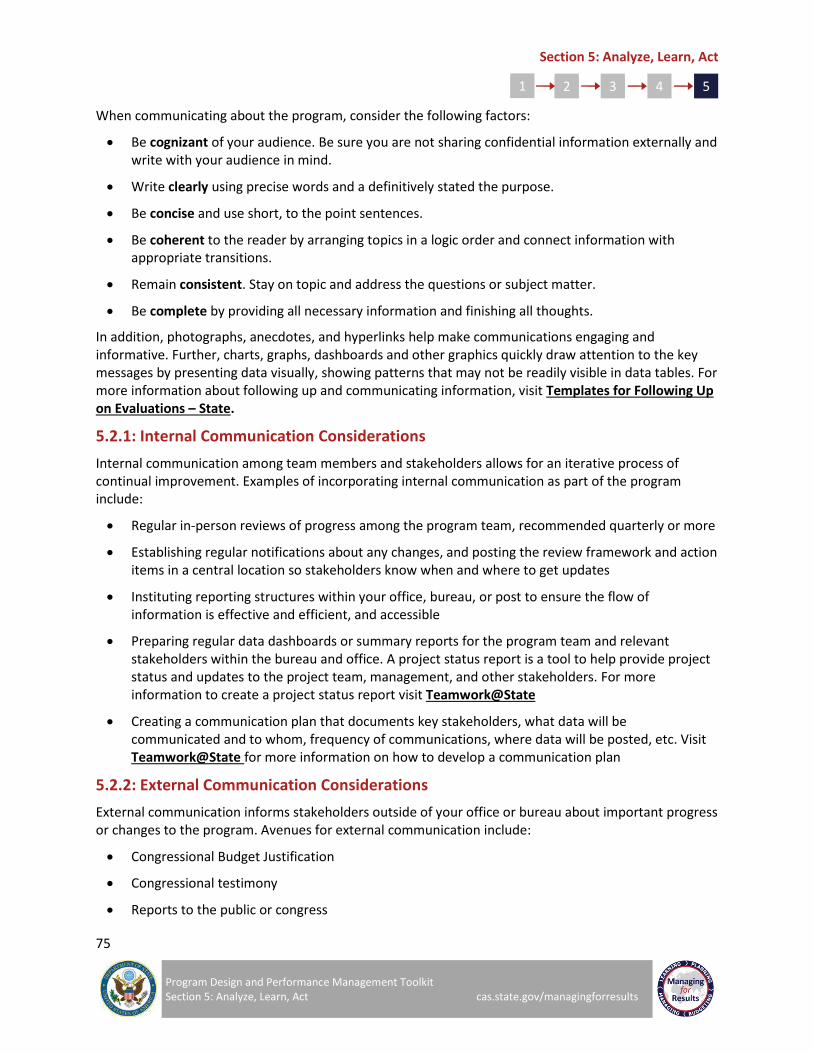
Section 5: Analyze, Learn, Act
75
Program Design and Performance Management Toolkit Section 5: Analyze, Learn, Act cas.state.gov/managingforresults
1 2 3 4 5
When communicating about the program, consider the following factors:
Be cognizant of your audience. Be sure you are not sharing confidential information externally and write with your audience in mind.
Write clearly using precise words and a definitively stated the purpose.
Be concise and use short, to the point sentences.
Be coherent to the reader by arranging topics in a logic order and connect information with appropriate transitions.
Remain consistent. Stay on topic and address the questions or subject matter.
Be complete by providing all necessary information and finishing all thoughts.
In addition, photographs, anecdotes, and hyperlinks help make communications engaging and informative. Further, charts, graphs, dashboards and other graphics quickly draw attention to the key messages by presenting data visually, showing patterns that may not be readily visible in data tables. For more information about following up and communicating information, visit Templates for Following Up on Evaluations – State.
5.2.1: Internal Communication Considerations
Internal communication among team members and stakeholders allows for an iterative process of continual improvement. Examples of incorporating internal communication as part of the program include:
Regular in-person reviews of progress among the program team, recommended quarterly or more
Establishing regular notifications about any changes, and posting the review framework and action items in a central location so stakeholders know when and where to get updates
Instituting reporting structures within your office, bureau, or post to ensure the flow of information is effective and efficient, and accessible
Preparing regular data dashboards or summary reports for the program team and relevant stakeholders within the bureau and office. A project status report is a tool to help provide project status and updates to the project team, management, and other stakeholders. For more information to create a project status report visit Teamwork@State
Creating a communication plan that documents key stakeholders, what data will be communicated and to whom, frequency of communications, where data will be posted, etc. Visit Teamwork@State for more information on how to develop a communication plan
5.2.2: External Communication Considerations
External communication informs stakeholders outside of your office or bureau about important progress or changes to the program. Avenues for external communication include:
Congressional Budget Justification
Congressional testimony
Reports to the public or congress

Section 5: Analyze, Learn, Act
76
Program Design and Performance Management Toolkit Section 5: Analyze, Learn, Act cas.state.gov/managingforresults
1 2 3 4 5
Feedback to beneficiaries and stakeholders
Coordination with the interagency
Coordination with implementers or other program partners
Forms of publicity for programs or projects:
– Newsletters
– Fact sheets
– Website updates
– Blog posts
– Speeches
– Cables
– Press releases
– Posting success stories on cas.state.gov/managing for results
“Extraordinary claims require extraordinary evidence.”
– Carl Sagan
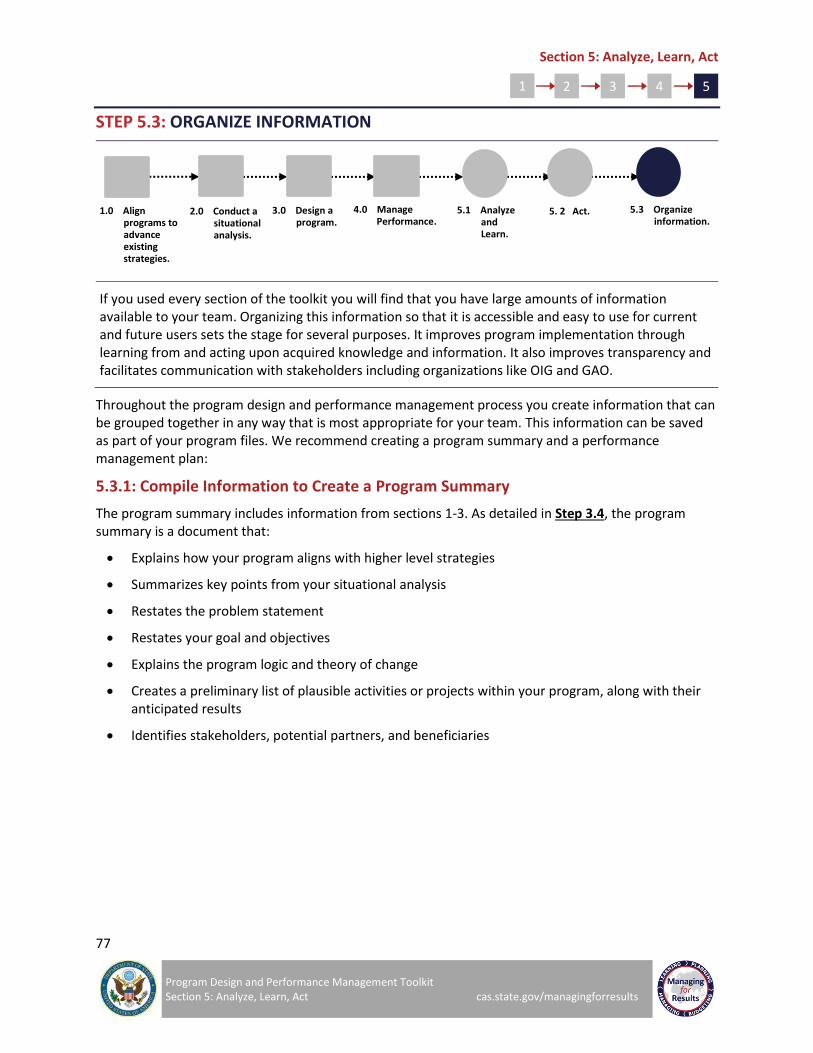
Section 5: Analyze, Learn, Act
77
Program Design and Performance Management Toolkit Section 5: Analyze, Learn, Act cas.state.gov/managingforresults
1 2 3 4 5
STEP 5.3: ORGANIZE INFORMATION
If you used every section of the toolkit you will find that you have large amounts of information available to your team. Organizing this information so that it is accessible and easy to use for current and future users sets the stage for several purposes. It improves program implementation through learning from and acting upon acquired knowledge and information. It also improves transparency and facilitates communication with stakeholders including organizations like OIG and GAO.
Throughout the program design and performance management process you create information that can be grouped together in any way that is most appropriate for your team. This information can be saved as part of your program files. We recommend creating a program summary and a performance management plan:
5.3.1: Compile Information to Create a Program Summary
The program summary includes information from sections 1-3. As detailed in Step 3.4, the program summary is a document that:
Explains how your program aligns with higher level strategies
Summarizes key points from your situational analysis
Restates the problem statement
Restates your goal and objectives
Explains the program logic and theory of change
Creates a preliminary list of plausible activities or projects within your program, along with their anticipated results
Identifies stakeholders, potential partners, and beneficiaries
1.0 Align programs to advance existing strategies.
2.0 Conduct a situational analysis.
4.0 Manage Performance.
5.1 Analyze and Learn.
5.3 Organize information.
5. 2 Act.
3.0 Design a program.
Section 5: Analyze, Learn, Act
78
Program Design and Performance Management Toolkit Section 5: Analyze, Learn, Act cas.state.gov/managingforresults
1 2 3 4 5
5.3.2: Compile Information to Create a Performance Management Plan
The performance management plan (PMP) includes information detailed in sections 4 and 5. The PMP may restate your program logic and TOC, but will highlight what information you will collect data on, how, and when. The PMP will include:
Indicator Reference Sheets
Monitoring Plan and Indicator Tracking Table
M&E Budget Information
Preliminary Evaluation Information
Data Quality Assessments
Strategic Progress Review Framework
Action Item Follow-Up Tracker
Program Design and Performance Management Toolkit
Appendix
Appendix A: Design a Project
A - 2
Program Design and Performance Management Toolkit Appendix A: Design a Project cas.state.gov/managingforresults
APPENDIX
APPENDIX A: DESIGN A PROJECT
A project is a set of planned and then executed interventions identified through a design process, which are together intended to achieve a defined result, generally to solving an associated problem or challenge.12 A project is temporary in that it has a defined beginning and end in time, and therefore defined scope and resources. A project is unique in that it is not a routine operation, but a specific set of activities designed to accomplish a singular goal.13
Projects relate to program planning because a set of projects make up the portfolio of a program14. Because projects tend to be part of larger programs, many of the tools in Sections 1 and 2 would most frequently be applied for the planning of the overarching program rather than specific activities of the projects themselves. That being said, these tools can be used for designing your project as you see fit. For instance, a logic model may be a useful tool for designing and monitoring a project when the project is not part of a larger program. In these instances, your team will also determine the problem or needs statement as well as the project goals and objectives. Resources available to your project design and implantation can be found at the Teamwork@State homepage (Teamwork@State) and the Project Management Institute (PMI).
Tools that are frequently used in designing a project include, but are not limited to:
A.1 PICK Chart
A PICK Chart is a visual tool to help identify the most useful ideas to implement. PICK is an acronym for implementation categories: Possible, Implement, Consider, and Kill. The Teamwork@State PICK Chart template can be found here (PICK Chart).
A.2 RACI Matrix
A RACI Matrix is a simple matrix for clearly defining roles on a team. RACI is an acronym that defines four key roles: Responsible, Accountable, Consulted, and Informed. The Teamwork@State RACI Matrix template can be found here (RACI Matrix).
A.3 Project Charter
A Project Charter contains key project information, including project challenge, justification, goals, scope, team members, and milestones. The Teamwork@State Project Charter template can be found here (Project Charter).
12
State Department Evaluation Policy 13
http://www.pmi.org/About-Us/About-Us-What-is-Project-Management.aspx 14
State Department Evaluation Policy
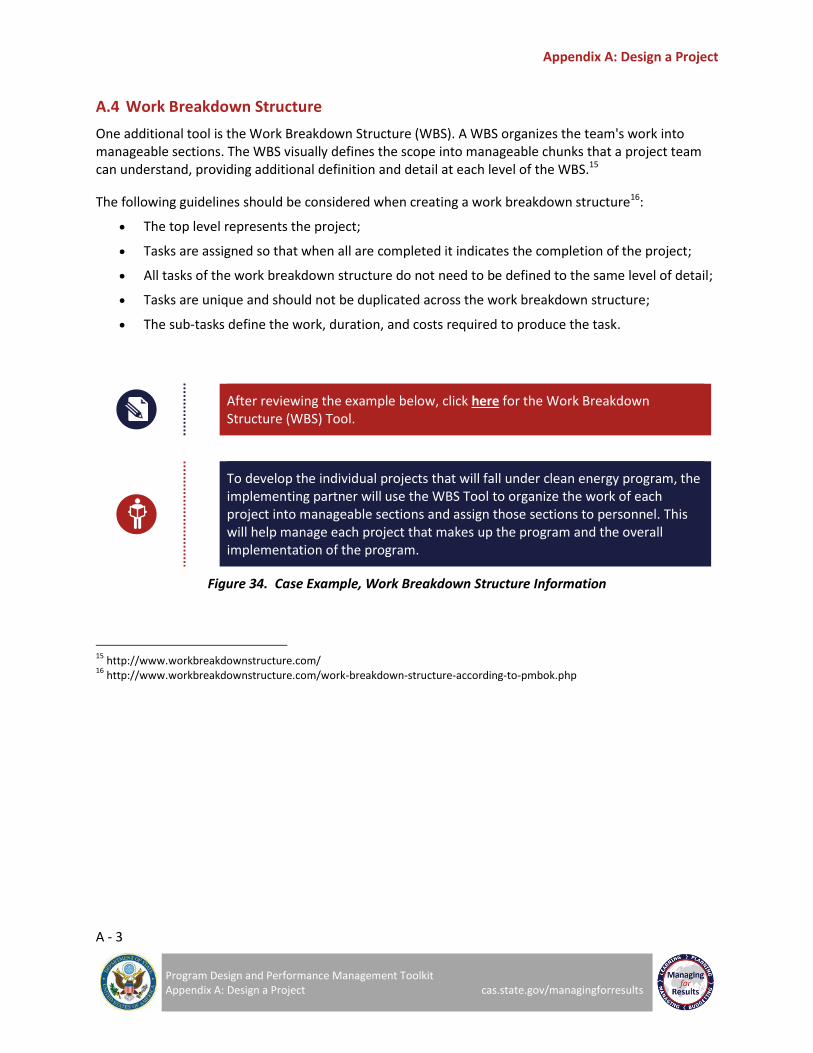
Appendix A: Design a Project
A - 3
Program Design and Performance Management Toolkit Appendix A: Design a Project cas.state.gov/managingforresults
A.4 Work Breakdown Structure
One additional tool is the Work Breakdown Structure (WBS). A WBS organizes the team's work into manageable sections. The WBS visually defines the scope into manageable chunks that a project team can understand, providing additional definition and detail at each level of the WBS.15
The following guidelines should be considered when creating a work breakdown structure16:
The top level represents the project;
Tasks are assigned so that when all are completed it indicates the completion of the project;
All tasks of the work breakdown structure do not need to be defined to the same level of detail;
Tasks are unique and should not be duplicated across the work breakdown structure;
The sub-tasks define the work, duration, and costs required to produce the task.
After reviewing the example below, click here for the Work Breakdown Structure (WBS) Tool.
To develop the individual projects that will fall under clean energy program, the implementing partner will use the WBS Tool to organize the work of each project into manageable sections and assign those sections to personnel. This will help manage each project that makes up the program and the overall implementation of the program.
Figure 34. Case Example, Work Breakdown Structure Information
15
http://www.workbreakdownstructure.com/ 16
http://www.workbreakdownstructure.com/work-breakdown-structure-according-to-pmbok.php
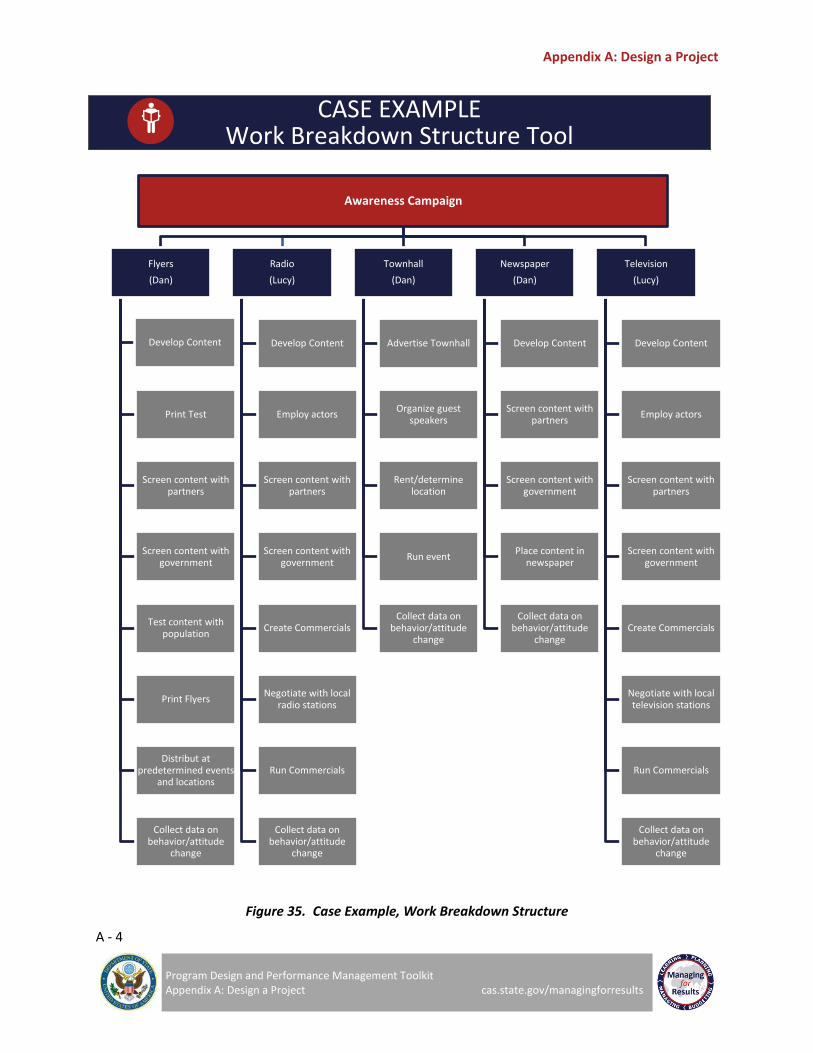
Appendix A: Design a Project
A - 4
Program Design and Performance Management Toolkit Appendix A: Design a Project cas.state.gov/managingforresults
CASE EXAMPLE Work Breakdown Structure Tool
Figure 35. Case Example, Work Breakdown Structure
Awareness Campaign
Flyers
(Dan)
Develop Content
Print Test
Screen content with partners
Screen content with government
Test content with population
Print Flyers
Distribut at predetermined events
and locations
Collect data on behavior/attitude
change
Radio
(Lucy)
Develop Content
Employ actors
Screen content with partners
Screen content with government
Create Commercials
Negotiate with local radio stations
Run Commercials
Collect data on behavior/attitude
change
Townhall
(Dan)
Advertise Townhall
Organize guest speakers
Rent/determine location
Run event
Collect data on behavior/attitude
change
Newspaper
(Dan)
Develop Content
Screen content with partners
Screen content with government
Place content in newspaper
Collect data on behavior/attitude
change
Television
(Lucy)
Develop Content
Employ actors
Screen content with partners
Screen content with government
Create Commercials
Negotiate with local television stations
Run Commercials
Collect data on behavior/attitude
change
Appendix B: Design a Process
B - 1
Program Design and Performance Management Toolkit Appendix B: Design a Process cas.state.gov/managingforresults
APPENDIX B: DESIGN A PROCESS
The following are tools that are frequently used in designing and implementing a process:
B.1 SIPOC
SIPOC is a one-page document that provides a high-level, clear understanding of the Suppliers, Inputs, Process, Outputs, and Customers associated with any service, operation, or production process. The Teamwork@State SIPOC template can be found here (SIPOC).
B.2 Process Map
SIPOC is a one-page document that provides a high-level, clear understanding of the Suppliers, Inputs, Process, Outputs, and Customers associated with any service, operation, or production process. The Teamwork@State Process Map template can be found here (Process Mapping).
B.3 Value Analysis
Value analysis is a tool to help teams look at steps within a process to identify areas of value and waste (i.e., areas that do not add value). The Teamwork@State Value Analysis template can be found here (Value Analysis). Additional tools and resources are available at the Teamwork@State homepage (Teamwork@State).
A process is a series of actions or steps taken to achieve a particular end. Processes may be part of your program and project implementation but may also be part of everyday operations for your office and bureau. For instance, there can be processes to formalize memos, to receive clearance on documents, to view and approve grant submissions, to hold a meeting, or to review visa applications.

APPENDIX C: BLANK TOOL TEMPLATES
Appendix C provides the blank tool templates for you to use to design your program and throughout implementation to monitor its progress. This appendix is divided by section and each template provides instructions for its use. The templates are also available on the MfR website.
Section 1: Align Programs to Advance Existing Strategies
1

Appendix C: Tools
C - 3
Program Design and Performance Management Toolkit Appendix C: Tools cas.state.gov/managingforresults
C.1 Align Programs to Advance Existing Strategies Tool
Overview
When initiating a program, the first phase is to review the program idea and confirm that it aligns to advance existing strategies.
Important strategies and reports to consider include:
Joint Regional Strategy (JRS)
Functional Bureau Strategy (FBS)
Integrated Country Strategy (ICS)
USAID Country Development Cooperation Strategies (CDCS)
Sustainable Development Goals (SDGs)
Interagency policies, sector strategies, Presidential directives, commitments, and guidance (e.g. National Security Strategy)
Considerations Answers
How does the program idea help achieve the
goals or objectives from the relevant JRS or
FBS?
How does the program help achieve one or
more ICS objectives or sub-objectives?
Does the scope of the program idea fit
within the purview of your office, bureau, or
post?
How have you determined what is necessary
for the program to achieve the goals and
objectives of higher level strategy?
How does the program concept help achieve
any goals and objectives of agencies or
groups outside of the State Department?
How has the program implemented a plan to
ensure continued alignment and
advancement of strategy throughout
program design and implementation?
Table 14. Blank “Align Program to Advance Existing Strategies Tool” Template

Section 2: Conduct a Situational Analysis
2
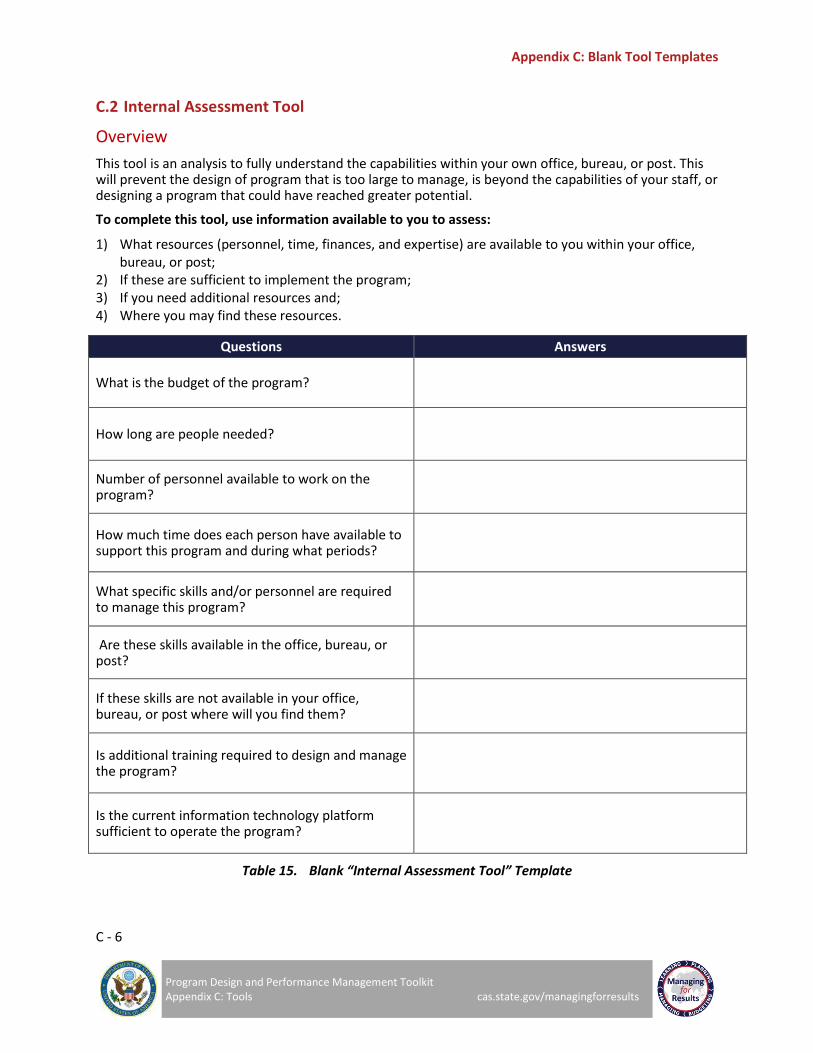
Appendix C: Blank Tool Templates
C - 6
Program Design and Performance Management Toolkit Appendix C: Tools cas.state.gov/managingforresults
C.2 Internal Assessment Tool
Overview
This tool is an analysis to fully understand the capabilities within your own office, bureau, or post. This will prevent the design of program that is too large to manage, is beyond the capabilities of your staff, or designing a program that could have reached greater potential.
To complete this tool, use information available to you to assess:
1) What resources (personnel, time, finances, and expertise) are available to you within your office, bureau, or post;
2) If these are sufficient to implement the program; 3) If you need additional resources and; 4) Where you may find these resources.
Questions Answers
What is the budget of the program?
How long are people needed?
Number of personnel available to work on the program?
How much time does each person have available to support this program and during what periods?
What specific skills and/or personnel are required to manage this program?
Are these skills available in the office, bureau, or post?
If these skills are not available in your office, bureau, or post where will you find them?
Is additional training required to design and manage the program?
Is the current information technology platform sufficient to operate the program?
Table 15. Blank “Internal Assessment Tool” Template
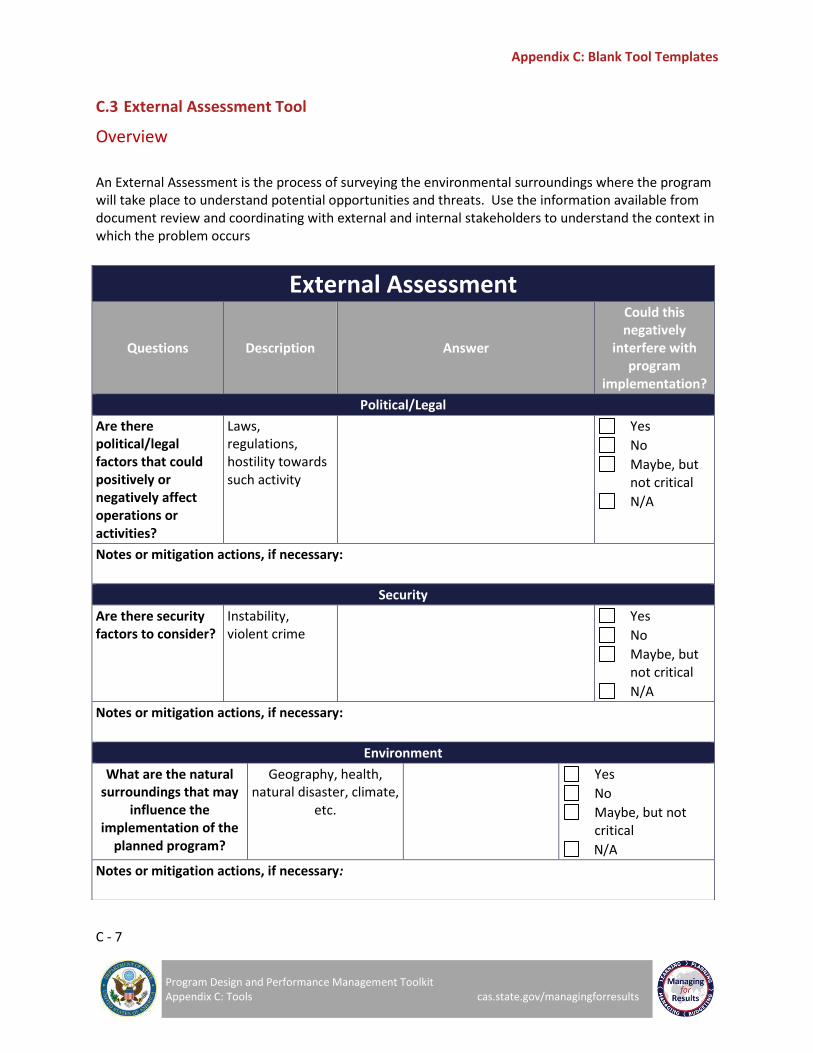
Appendix C: Blank Tool Templates
C - 7
Program Design and Performance Management Toolkit Appendix C: Tools cas.state.gov/managingforresults
C.3 External Assessment Tool
Overview
An External Assessment is the process of surveying the environmental surroundings where the program will take place to understand potential opportunities and threats. Use the information available from document review and coordinating with external and internal stakeholders to understand the context in which the problem occurs
External Assessment
Questions Description Answer
Could this negatively
interfere with program
implementation?
Political/Legal
Are there political/legal factors that could positively or negatively affect operations or activities?
Laws, regulations, hostility towards such activity
Yes
No
Maybe, but not critical
N/A
Notes or mitigation actions, if necessary:
Security
Are there security factors to consider?
Instability, violent crime
Yes
No
Maybe, but not critical
N/A
Notes or mitigation actions, if necessary:
Environment
What are the natural surroundings that may
influence the implementation of the
planned program?
Geography, health, natural disaster, climate,
etc.
Yes
No
Maybe, but not critical
N/A
Notes or mitigation actions, if necessary:
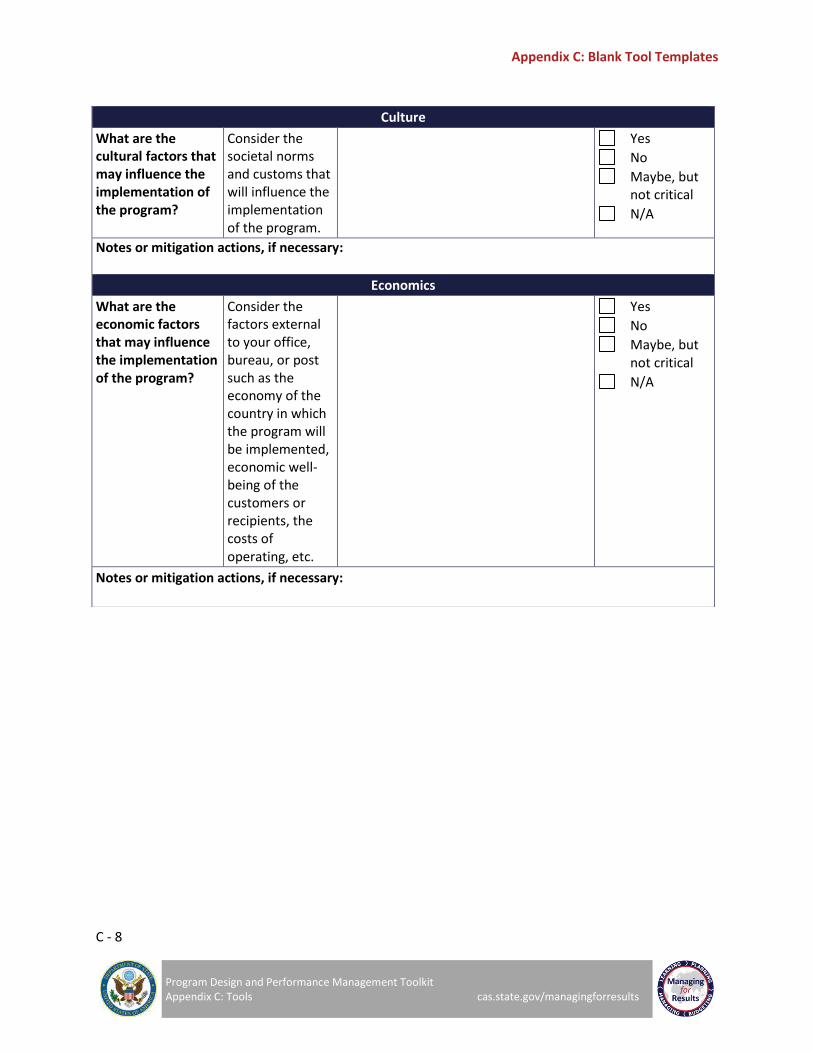
Appendix C: Blank Tool Templates
C - 8
Program Design and Performance Management Toolkit Appendix C: Tools cas.state.gov/managingforresults
Culture
What are the cultural factors that may influence the implementation of the program?
Consider the societal norms and customs that will influence the implementation of the program.
Yes
No
Maybe, but not critical
N/A
Notes or mitigation actions, if necessary:
Economics
What are the economic factors that may influence the implementation of the program?
Consider the factors external to your office, bureau, or post such as the economy of the country in which the program will be implemented, economic well-being of the customers or recipients, the costs of operating, etc.
Yes
No
Maybe, but not critical
N/A
Notes or mitigation actions, if necessary:

Appendix C: Blank Tool Templates
C - 9
Program Design and Performance Management Toolkit Appendix C: Tools cas.state.gov/managingforresults
Table 16. Blank “External Assessment Tool” Template
Institutional
What are the institutional factors that may influence the implementation of the program?
Consider the characteristics of any organizations you may need to partner with such as: customs, attitudes, processes, behaviors, etc.
Yes
No
Maybe, but not critical
N/A
Notes or mitigation actions, if necessary:
Infrastructure
What are the infrastructure factors that may influence the implementation of the program?
Consider building space, IT (cell phones, computers, internet), water, electricity, etc.
Yes
No
Maybe, but not critical
N/A
Notes or mitigation actions, if necessary:

Appendix C: Blank Tool Templates
C - 10
Program Design and Performance Management Toolkit Appendix C: Tools cas.state.gov/managingforresults
C.4 Five Whys Tool
Table 17. Blank “Five Whys Tool” Template
What is the undesirable symptom you would like to address?
The visible result of the underlying root cause. The problem we would like to solve.
.
First Why:
Why is this happening?
Second Why:
Why is this happening?
Third Why:
Why is this happening?
Fourth Why:
Why is this happening?
Fifth Why:
Why is this happening?
Team Discussion
Will the answer to the fifth why potentially address resolve the undesirable cause?
Overview
The Five Whys tool will help programs determine the root cause of the problem. Fill in the section that answers what undesirable symptom you would like to address. Then ask, “Why is this happening?” As simply as possible, fill in the answer. Then ask, “Why is this happening?” Continue to do this until the underlying cause is discovered.
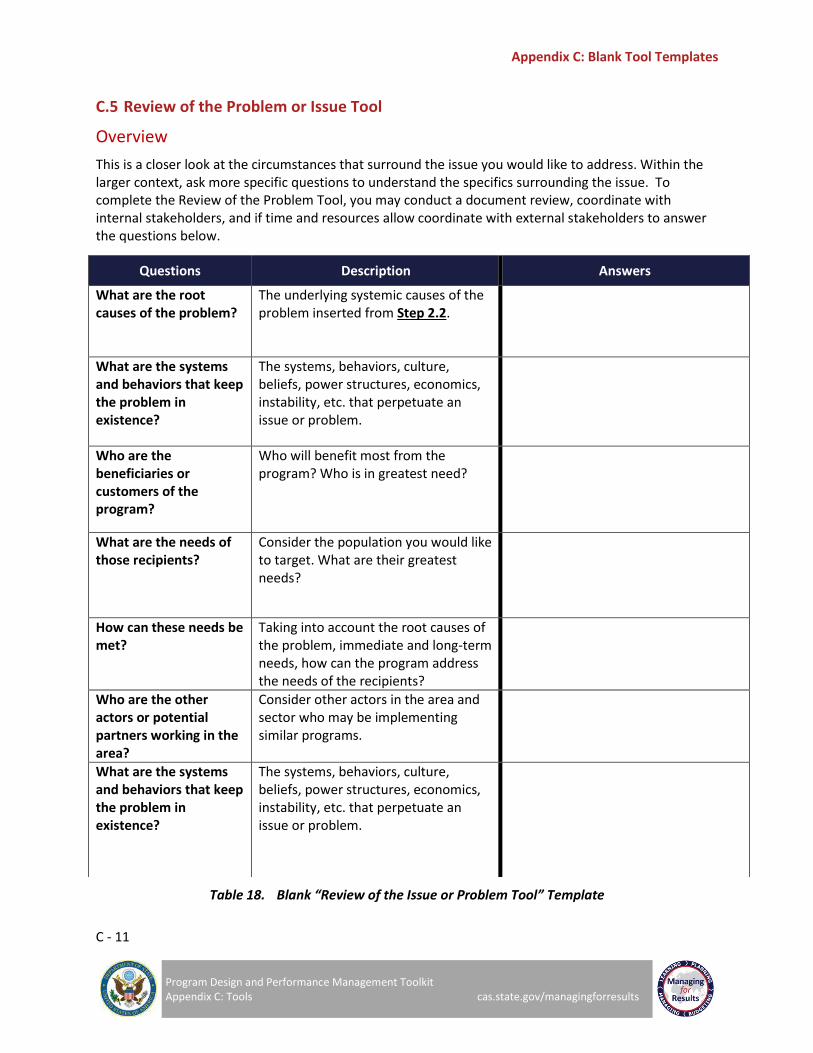
Appendix C: Blank Tool Templates
C - 11
Program Design and Performance Management Toolkit Appendix C: Tools cas.state.gov/managingforresults
C.5 Review of the Problem or Issue Tool
Overview
This is a closer look at the circumstances that surround the issue you would like to address. Within the larger context, ask more specific questions to understand the specifics surrounding the issue. To complete the Review of the Problem Tool, you may conduct a document review, coordinate with internal stakeholders, and if time and resources allow coordinate with external stakeholders to answer the questions below.
Table 18. Blank “Review of the Issue or Problem Tool” Template
Questions Description Answers
What are the root causes of the problem?
The underlying systemic causes of the problem inserted from Step 2.2.
What are the systems and behaviors that keep the problem in existence?
The systems, behaviors, culture, beliefs, power structures, economics, instability, etc. that perpetuate an issue or problem.
Who are the beneficiaries or customers of the program?
Who will benefit most from the program? Who is in greatest need?
What are the needs of those recipients?
Consider the population you would like to target. What are their greatest needs?
How can these needs be met?
Taking into account the root causes of the problem, immediate and long-term needs, how can the program address the needs of the recipients?
Who are the other actors or potential partners working in the area?
Consider other actors in the area and sector who may be implementing similar programs.
What are the systems and behaviors that keep the problem in existence?
The systems, behaviors, culture, beliefs, power structures, economics, instability, etc. that perpetuate an issue or problem.

Section 3: Design a Program
3
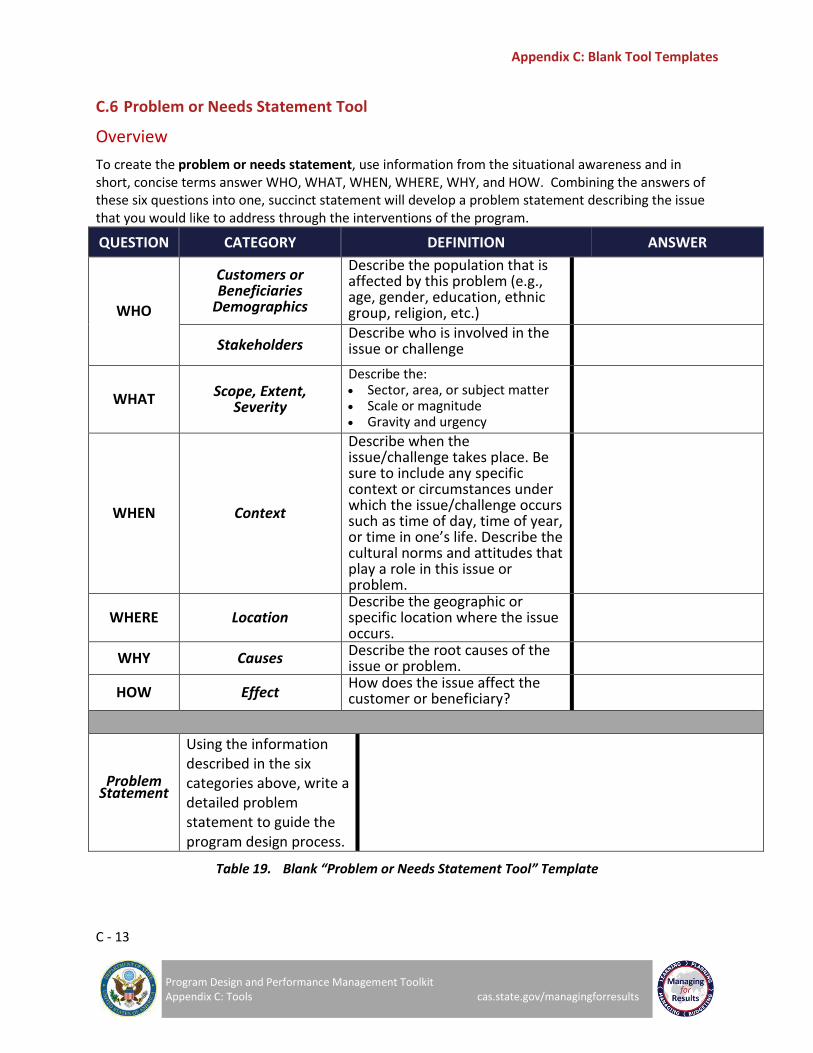
Appendix C: Blank Tool Templates
C - 13
Program Design and Performance Management Toolkit Appendix C: Tools cas.state.gov/managingforresults
C.6 Problem or Needs Statement Tool
Overview
To create the problem or needs statement, use information from the situational awareness and in short, concise terms answer WHO, WHAT, WHEN, WHERE, WHY, and HOW. Combining the answers of these six questions into one, succinct statement will develop a problem statement describing the issue that you would like to address through the interventions of the program.
QUESTION CATEGORY DEFINITION ANSWER
WHO
Customers or Beneficiaries
Demographics
Describe the population that is affected by this problem (e.g., age, gender, education, ethnic group, religion, etc.)
Stakeholders Describe who is involved in the issue or challenge
WHAT Scope, Extent, Severity
Describe the: Sector, area, or subject matter Scale or magnitude Gravity and urgency
WHEN Context
Describe when the issue/challenge takes place. Be sure to include any specific context or circumstances under which the issue/challenge occurs such as time of day, time of year, or time in one’s life. Describe the cultural norms and attitudes that play a role in this issue or problem.
WHERE Location Describe the geographic or specific location where the issue occurs.
WHY Causes Describe the root causes of the issue or problem.
HOW Effect How does the issue affect the customer or beneficiary?
Problem Statement
Using the information described in the six categories above, write a detailed problem statement to guide the program design process.
Table 19. Blank “Problem or Needs Statement Tool” Template

Appendix C: Blank Tool Templates
C - 14
Program Design and Performance Management Toolkit Appendix C: Tools cas.state.gov/managingforresults
C.7 Program Goals and Objectives Tool
Overview
To develop program goals and objectives: 1) Insert the problem statement from the Problem or Needs Statement Tool. 2) To develop the program goal(s), consider the problem statement and ask, “What is the overall intent
or purpose of the program that will address this problem?” The goal becomes the response to that question and is the desired end state.
3) The objectives are the steps that will guide your team in the attainment of the goal(s). Be certain each objective is clear and concise; measurable during program evaluations; feasible considering program funding, time, human capital, and other resources; is relevant to program and office or bureau goals; and can be achieved within the time-frame of the program. Ask, “Can I measure this objective during the mid-term and end of program evaluations?”
4) The worksheet provides space for 3 objectives, but you may have as few as 2 and as many as 5 objectives per goal.
Figure 36. Blank “Program Goals and Objectives Tool” Template
Problem Statement
Program Goal
Objective 1 Objective 2 Objective 3
2 31
A
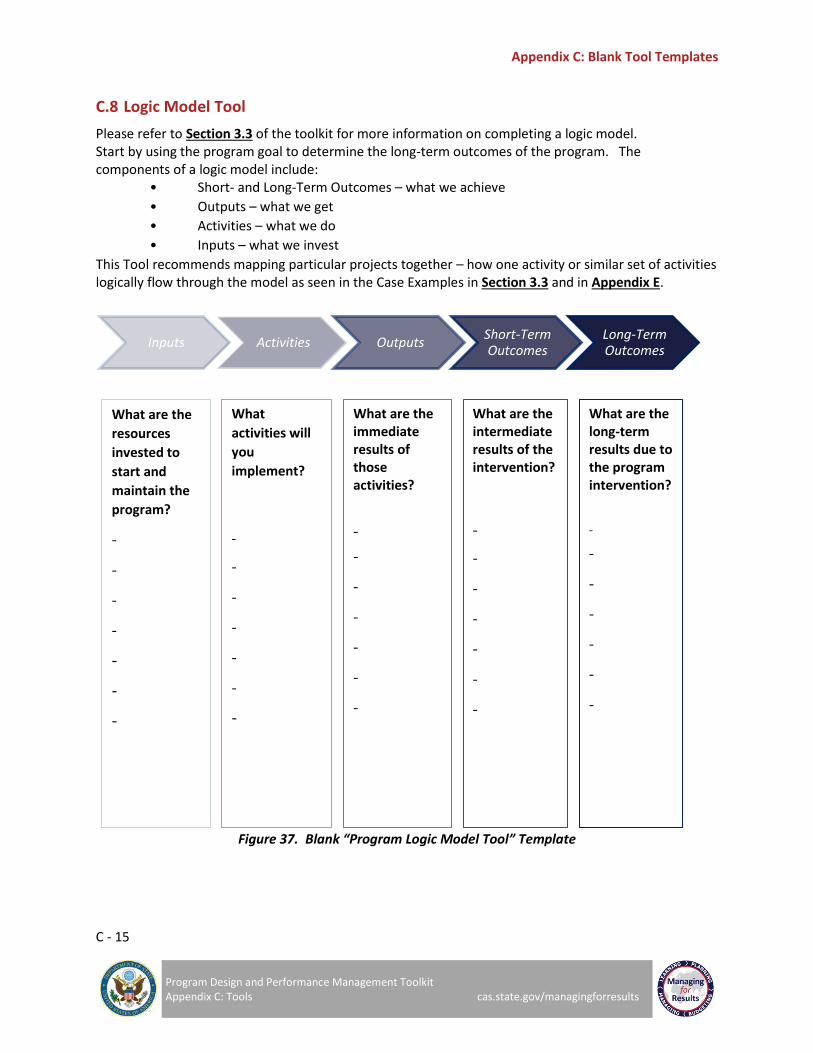
Appendix C: Blank Tool Templates
C - 15
Program Design and Performance Management Toolkit Appendix C: Tools cas.state.gov/managingforresults
C.8 Logic Model Tool
Please refer to Section 3.3 of the toolkit for more information on completing a logic model. Start by using the program goal to determine the long-term outcomes of the program. The components of a logic model include:
• Short- and Long-Term Outcomes – what we achieve
• Outputs – what we get
• Activities – what we do
• Inputs – what we invest
This Tool recommends mapping particular projects together – how one activity or similar set of activities logically flow through the model as seen in the Case Examples in Section 3.3 and in Appendix E.
Figure 37. Blank “Program Logic Model Tool” Template
What are the
resources
invested to
start and
maintain the
program?
-
-
-
-
-
-
-
What are the long-term results due to the program intervention?
-
-
-
-
-
-
-
What
activities will
you
implement?
-
-
-
-
-
-
-
What are the immediate results of those activities?
-
-
-
-
-
-
-
What are the intermediate results of the intervention? -
-
-
-
-
-
-
Inputs Activities Outputs Short-Term Outcomes
Long-Term Outcomes
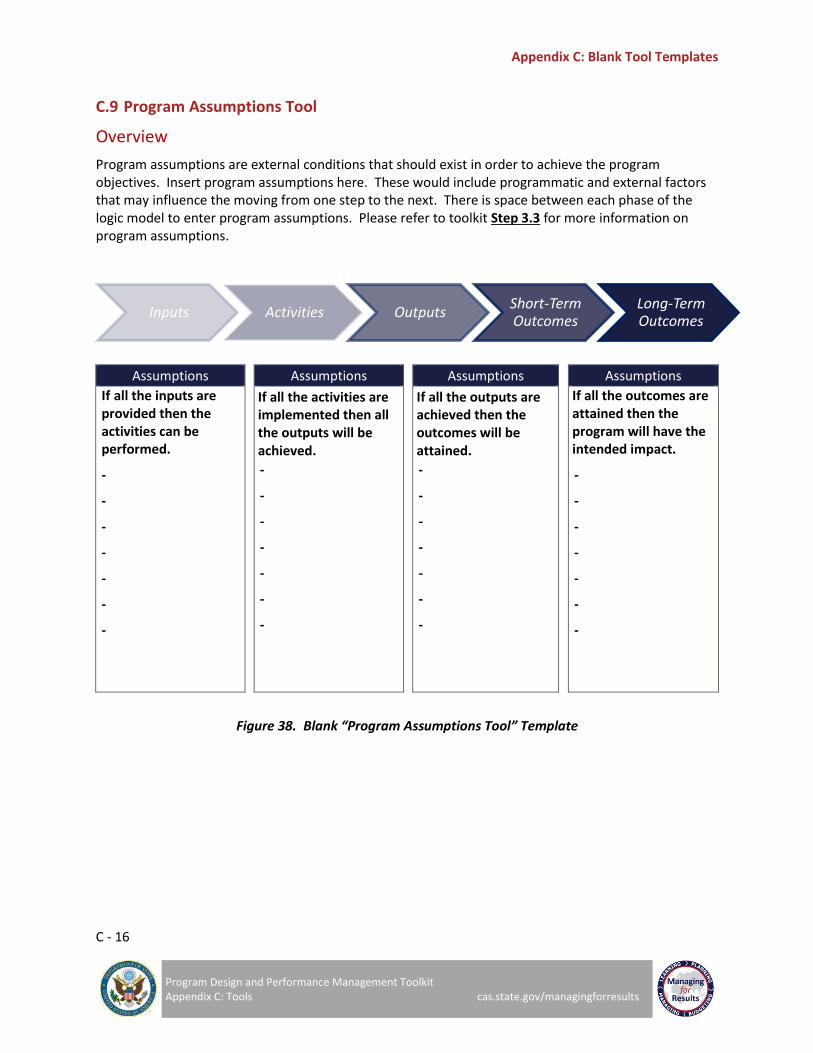
Appendix C: Blank Tool Templates
C - 16
Program Design and Performance Management Toolkit Appendix C: Tools cas.state.gov/managingforresults
C.9 Program Assumptions Tool
Overview
Program assumptions are external conditions that should exist in order to achieve the program objectives. Insert program assumptions here. These would include programmatic and external factors that may influence the moving from one step to the next. There is space between each phase of the logic model to enter program assumptions. Please refer to toolkit Step 3.3 for more information on program assumptions.
Assumptions Assumptions Assumptions Assumptions
If all the inputs are provided then the activities can be performed.
-
-
-
-
-
-
-
If all the activities are implemented then all the outputs will be achieved.
-
-
-
-
-
-
-
If all the outputs are achieved then the outcomes will be attained.
-
-
-
-
-
-
-
If all the outcomes are attained then the program will have the intended impact.
-
-
-
-
-
-
-
Figure 38. Blank “Program Assumptions Tool” Template
Inputs Activities Outputs Short-Term Outcomes
Long-Term Outcomes
Section 4: Manage Performance
4

Appendix C: Blank Tool Templates
C - 18
Program Design and Performance Management Toolkit Appendix C: Tools cas.state.gov/managingforresults
C.10 OPUDATA Tool
Overview
This tool helps programs develop indicators that are objective, practical, useful, direct, attributable, timely, and adequate. When developing your performance indicators use this checklist to determine if each performance indicator has each characteristic or if the indicator needs revised.
Table 20. Blank “OPUDATA Tool” Template
Indicator:
Characteristic Description Yes or Needs Revision
Objective Performance indicators should be unambiguous about what is being measured. They should be unidimensional, which means they should measure only one aspect at a time. Performance indicators should also be precisely defined in the PMP.
Yes
Needs Revision
Practical Program teams should select performance indicators for which data can be obtained within the cost and time confines of the program.
Yes
Needs Revision
Useful for management
Decision-making needs should be a key factor when selecting performance indicators. Bureaus and offices may want to reference the list of standard foreign assistance indicators to review whether any of these indicators are applicable and useful for measuring progress against the program’s goals and
objectives (MfR PPR Page); however, it will be necessary to create program specific indicators as well.
Yes
Needs Revision
Direct Performance indicators should closely track the results they are intended to measure. If a direct indicator cannot be used because of cost or other factors, a proxy indicator (an indirect measure of the result that is related by one or more assumptions) may be used to measure the result.
Yes
Needs Revision
Attributable to program efforts
It is important that performance indicators measure changes that are clearly and reasonably caused by the program’s efforts.
Yes
Needs Revision
Timely Performance indicators should be available when they are needed to make decisions.
Yes
Needs Revision
Adequate Teams should have as many indicators in their PMP as are necessary and cost effective for results management and reporting purposes. In most cases, two or three indicators per result should be sufficient to assess performance.
Yes
Needs Revision
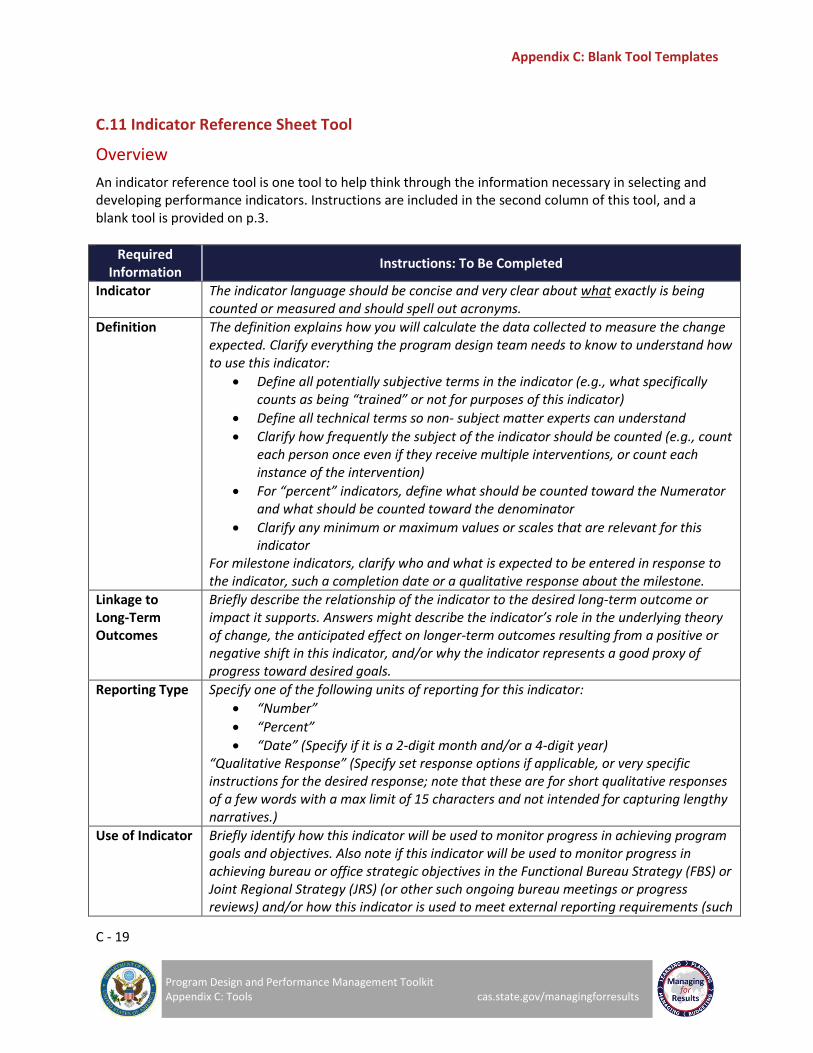
Appendix C: Blank Tool Templates
C - 19
Program Design and Performance Management Toolkit Appendix C: Tools cas.state.gov/managingforresults
C.11 Indicator Reference Sheet Tool
Overview
An indicator reference tool is one tool to help think through the information necessary in selecting and developing performance indicators. Instructions are included in the second column of this tool, and a blank tool is provided on p.3.
Required Information
Instructions: To Be Completed
Indicator The indicator language should be concise and very clear about what exactly is being counted or measured and should spell out acronyms.
Definition The definition explains how you will calculate the data collected to measure the change expected. Clarify everything the program design team needs to know to understand how to use this indicator:
Define all potentially subjective terms in the indicator (e.g., what specifically counts as being “trained” or not for purposes of this indicator)
Define all technical terms so non- subject matter experts can understand
Clarify how frequently the subject of the indicator should be counted (e.g., count each person once even if they receive multiple interventions, or count each instance of the intervention)
For “percent” indicators, define what should be counted toward the Numerator and what should be counted toward the denominator
Clarify any minimum or maximum values or scales that are relevant for this indicator
For milestone indicators, clarify who and what is expected to be entered in response to the indicator, such a completion date or a qualitative response about the milestone.
Linkage to Long-Term Outcomes
Briefly describe the relationship of the indicator to the desired long-term outcome or impact it supports. Answers might describe the indicator’s role in the underlying theory of change, the anticipated effect on longer-term outcomes resulting from a positive or negative shift in this indicator, and/or why the indicator represents a good proxy of progress toward desired goals.
Reporting Type Specify one of the following units of reporting for this indicator:
“Number”
“Percent”
“Date” (Specify if it is a 2-digit month and/or a 4-digit year) “Qualitative Response” (Specify set response options if applicable, or very specific instructions for the desired response; note that these are for short qualitative responses of a few words with a max limit of 15 characters and not intended for capturing lengthy narratives.)
Use of Indicator Briefly identify how this indicator will be used to monitor progress in achieving program goals and objectives. Also note if this indicator will be used to monitor progress in achieving bureau or office strategic objectives in the Functional Bureau Strategy (FBS) or Joint Regional Strategy (JRS) (or other such ongoing bureau meetings or progress reviews) and/or how this indicator is used to meet external reporting requirements (such

Appendix C: Blank Tool Templates
C - 20
Program Design and Performance Management Toolkit Appendix C: Tools cas.state.gov/managingforresults
as the name of the report in which it is used.)
Reporting Frequency
Frequency for reporting results and setting targets (i.e., quarterly, annually, every two/three/etc. years).
Data Source
In order to track progress and to properly set baselines and targets, data will need to be collected. Specify how and when data for this indicator will be generated in very practical terms. Include the specific acceptable method(s) by which data for this indicator are/will be/should be collected. There are two different types of data sources, including those that are specific to your program (primary data) and secondary data sources: Data collection tools should be easy to use for both the participant and the person responsible for analyzing the data. Suggested primary data collection tools include, but are not limited to:
Pre- and post-tests
Informal pre- and post- intervention surveys/questionnaires
Formal pre- and post- intervention surveys/questionnaires
Meeting minutes
Attendance sheets
Site visit checklists
Interviews (key informant and community)
Direct observation
Focus groups
Program reports Examples of secondary data sources include, but are not limited to
Host country government reports/data
UN, World Bank, and other relevant data
Document review (reports, studies, evaluations of similar programs, etc.
Official government records Official reports from implementing partner(s)
Bureau Owner(s)
Bureau, Office, or Post: (provide as much organizational detail as possible, starting with the bureau and drilling down). POC: Provide at least one point of contact and their name, phone, and email from the owner bureau(s) for consultation and records management purposes.
Disaggregate(s) To disaggregate data means to break it down by subgroups. It is important to consider only the information that you need to know, as there are infinite ways to disaggregate information. Note that all people-level indicators must be sex-disaggregated. Bureaus, offices, and posts are encouraged to limit disaggregates to what is reasonable and feasible to obtain in the field.
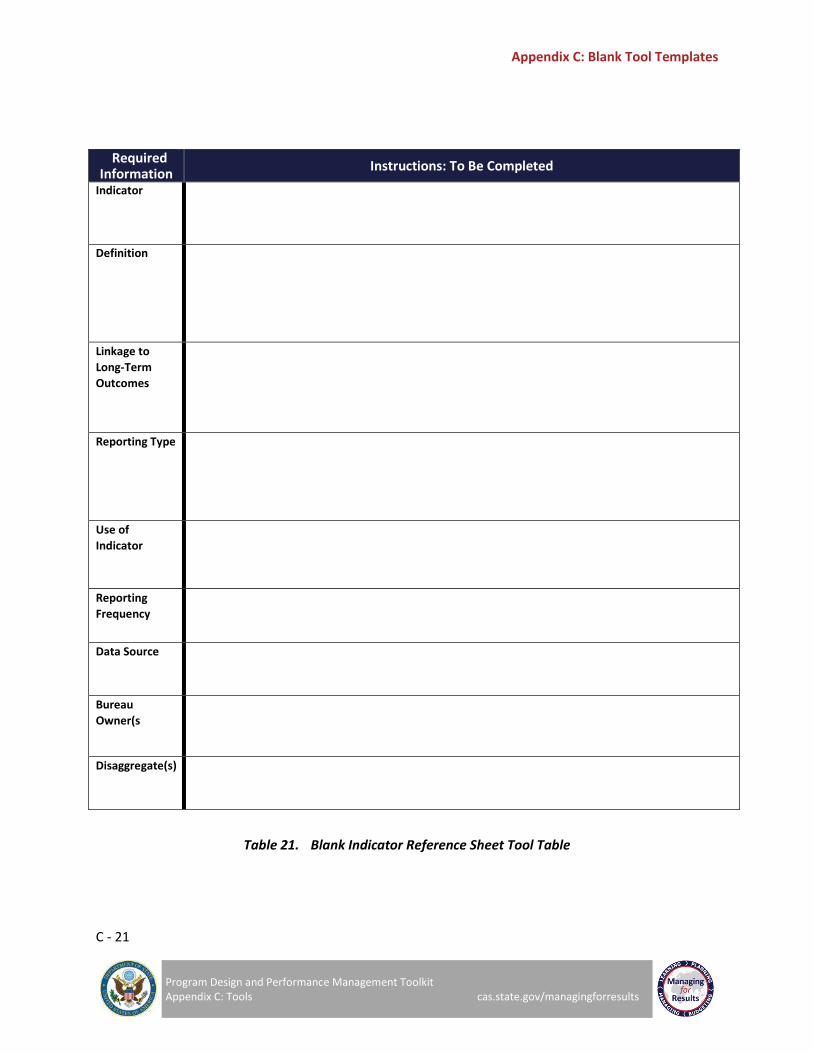
Appendix C: Blank Tool Templates
C - 21
Program Design and Performance Management Toolkit Appendix C: Tools cas.state.gov/managingforresults
Required Information
Instructions: To Be Completed
Indicator
Definition
Linkage to
Long-Term
Outcomes
Reporting Type
Use of
Indicator
Reporting
Frequency
Data Source
Bureau
Owner(s
Disaggregate(s)
Table 21. Blank Indicator Reference Sheet Tool Table
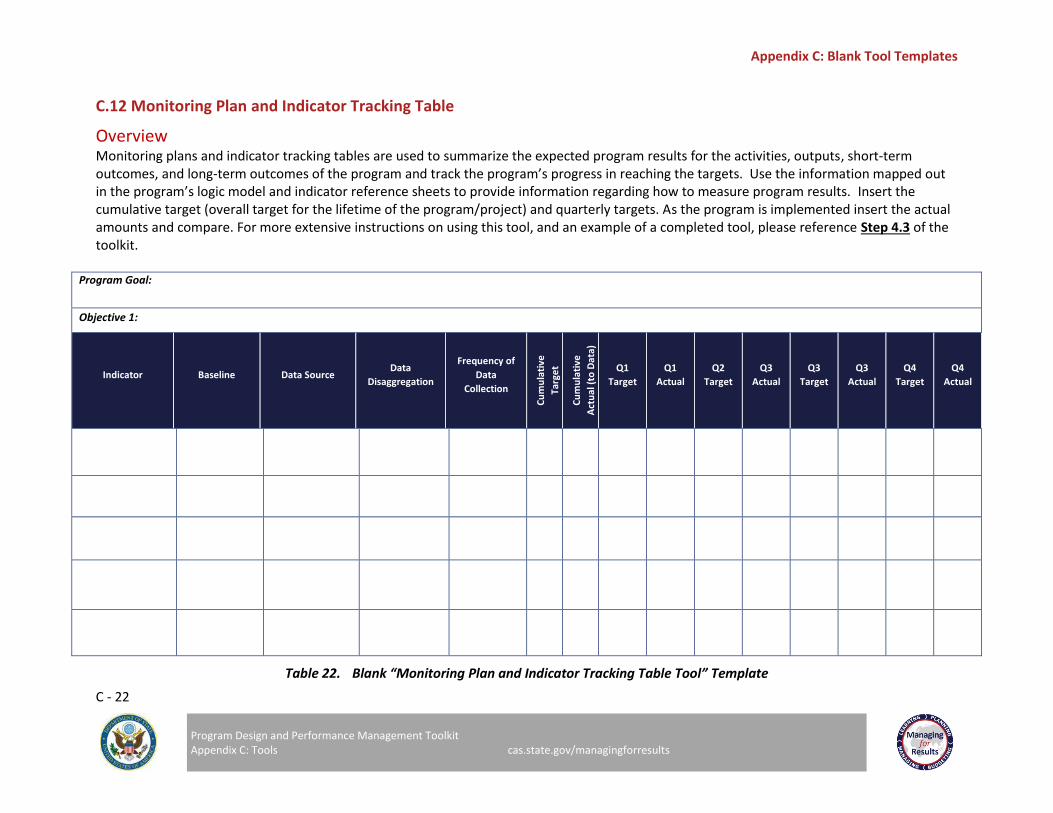
Appendix C: Blank Tool Templates
C - 22
Program Design and Performance Management Toolkit Appendix C: Tools cas.state.gov/managingforresults
C.12 Monitoring Plan and Indicator Tracking Table
Overview Monitoring plans and indicator tracking tables are used to summarize the expected program results for the activities, outputs, short-term outcomes, and long-term outcomes of the program and track the program’s progress in reaching the targets. Use the information mapped out in the program’s logic model and indicator reference sheets to provide information regarding how to measure program results. Insert the cumulative target (overall target for the lifetime of the program/project) and quarterly targets. As the program is implemented insert the actual amounts and compare. For more extensive instructions on using this tool, and an example of a completed tool, please reference Step 4.3 of the toolkit.
Program Goal:
Objective 1:
Indicator Baseline Data Source Data
Disaggregation
Frequency of
Data
Collection
Cu
mu
lati
ve
Targ
et
Cu
mu
lati
ve
Act
ual
(to
Dat
a)
Q1
Target
Q1
Actual
Q2
Target
Q3
Actual
Q3
Target
Q3
Actual
Q4
Target
Q4
Actual
Table 22. Blank “Monitoring Plan and Indicator Tracking Table Tool” Template

Section 5: Analyze, Learn, Act
5
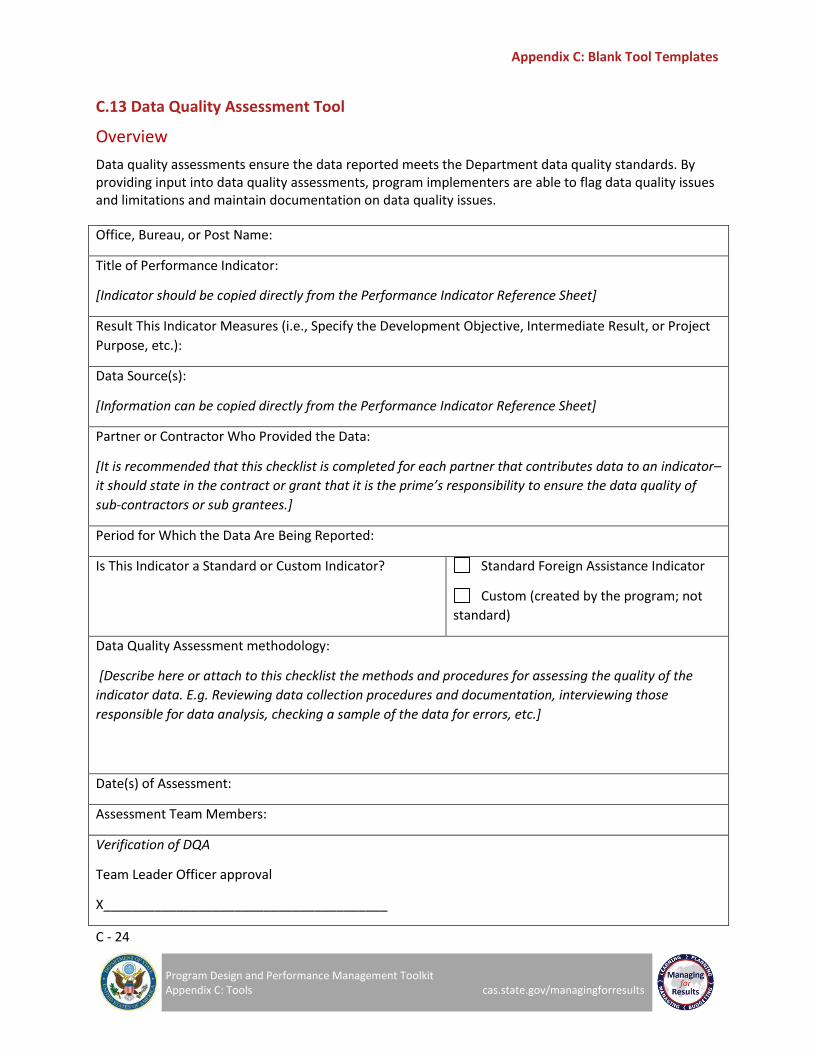
Appendix C: Blank Tool Templates
C - 24
Program Design and Performance Management Toolkit Appendix C: Tools cas.state.gov/managingforresults
C.13 Data Quality Assessment Tool
Overview
Data quality assessments ensure the data reported meets the Department data quality standards. By providing input into data quality assessments, program implementers are able to flag data quality issues and limitations and maintain documentation on data quality issues.
Office, Bureau, or Post Name:
Title of Performance Indicator:
[Indicator should be copied directly from the Performance Indicator Reference Sheet]
Result This Indicator Measures (i.e., Specify the Development Objective, Intermediate Result, or Project
Purpose, etc.):
Data Source(s):
[Information can be copied directly from the Performance Indicator Reference Sheet]
Partner or Contractor Who Provided the Data:
[It is recommended that this checklist is completed for each partner that contributes data to an indicator–
it should state in the contract or grant that it is the prime’s responsibility to ensure the data quality of
sub-contractors or sub grantees.]
Period for Which the Data Are Being Reported:
Is This Indicator a Standard or Custom Indicator? Standard Foreign Assistance Indicator
Custom (created by the program; not
standard)
Data Quality Assessment methodology:
[Describe here or attach to this checklist the methods and procedures for assessing the quality of the
indicator data. E.g. Reviewing data collection procedures and documentation, interviewing those
responsible for data analysis, checking a sample of the data for errors, etc.]
Date(s) of Assessment:
Assessment Team Members:
Verification of DQA
Team Leader Officer approval
X_______________________________________
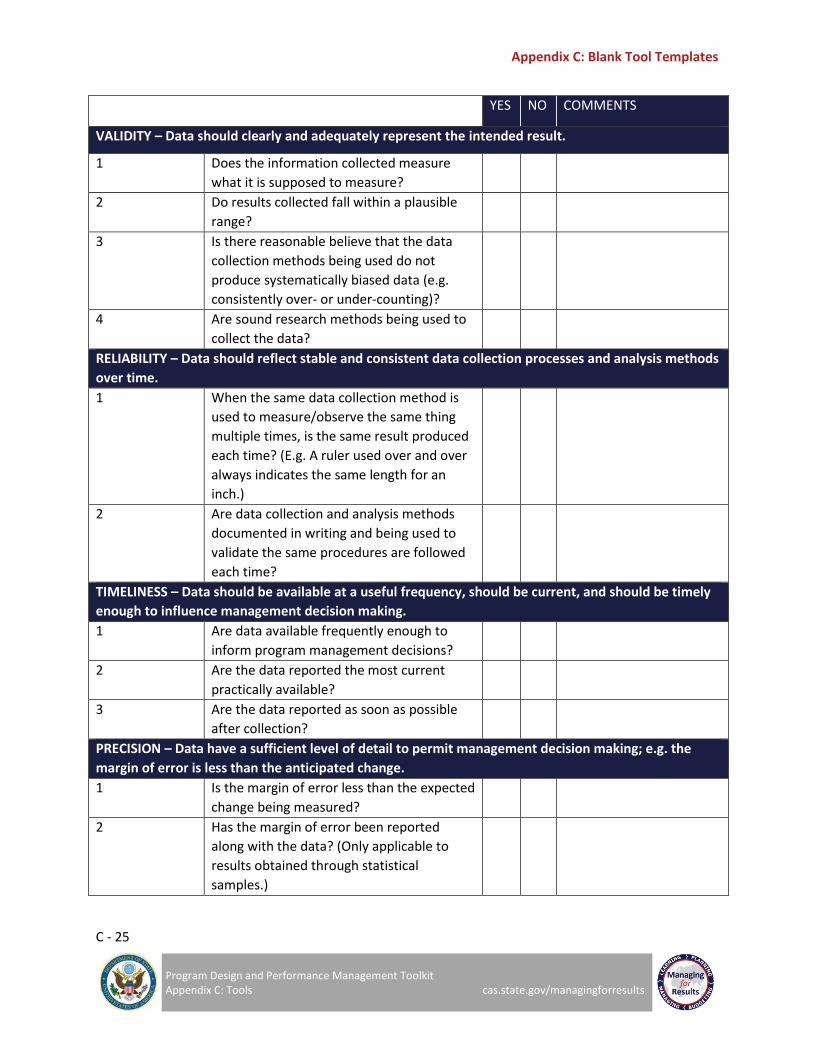
Appendix C: Blank Tool Templates
C - 25
Program Design and Performance Management Toolkit Appendix C: Tools cas.state.gov/managingforresults
YES NO COMMENTS
VALIDITY – Data should clearly and adequately represent the intended result.
1 Does the information collected measure
what it is supposed to measure?
2 Do results collected fall within a plausible
range?
3 Is there reasonable believe that the data
collection methods being used do not
produce systematically biased data (e.g.
consistently over- or under-counting)?
4 Are sound research methods being used to
collect the data?
RELIABILITY – Data should reflect stable and consistent data collection processes and analysis methods
over time.
1 When the same data collection method is
used to measure/observe the same thing
multiple times, is the same result produced
each time? (E.g. A ruler used over and over
always indicates the same length for an
inch.)
2 Are data collection and analysis methods
documented in writing and being used to
validate the same procedures are followed
each time?
TIMELINESS – Data should be available at a useful frequency, should be current, and should be timely
enough to influence management decision making.
1 Are data available frequently enough to
inform program management decisions?
2 Are the data reported the most current
practically available?
3 Are the data reported as soon as possible
after collection?
PRECISION – Data have a sufficient level of detail to permit management decision making; e.g. the
margin of error is less than the anticipated change.
1 Is the margin of error less than the expected
change being measured?
2 Has the margin of error been reported
along with the data? (Only applicable to
results obtained through statistical
samples.)

Appendix C: Blank Tool Templates
C - 26
Program Design and Performance Management Toolkit Appendix C: Tools cas.state.gov/managingforresults
3 Is the data collection method/tool being
used to collect the data fine-tuned or exact
enough to register the expected change?
(E.g. A yardstick may not be a precise
enough tool to measure a change of a few
millimeters.)
INTEGRITY – Data collected should have safeguards to minimize the risk of transcription error or data
manipulation.
1 Are procedures or safeguards in place to
minimize data transcription errors?
2 Is there independence in key data
collection, management, and assessment
procedures?
3 Are mechanisms in place to prevent
unauthorized changes to the data?
SUMMARY
Based on the assessment relative to the five standards, what is the overall conclusion regarding the
quality of the data?
Significance of limitations (if any):
Actions needed to address limitations prior to the next DQA (given level of USG control over data):
IF NO DATA ARE AVAILABLE FOR THE INDICATOR COMMENTS
If no recent relevant data are available for this
indicator, why not?
What concrete actions are now being taken to
collect and report these data as soon as
possible?
Table 23. Blank “Data Quality Assessment Tool” Template
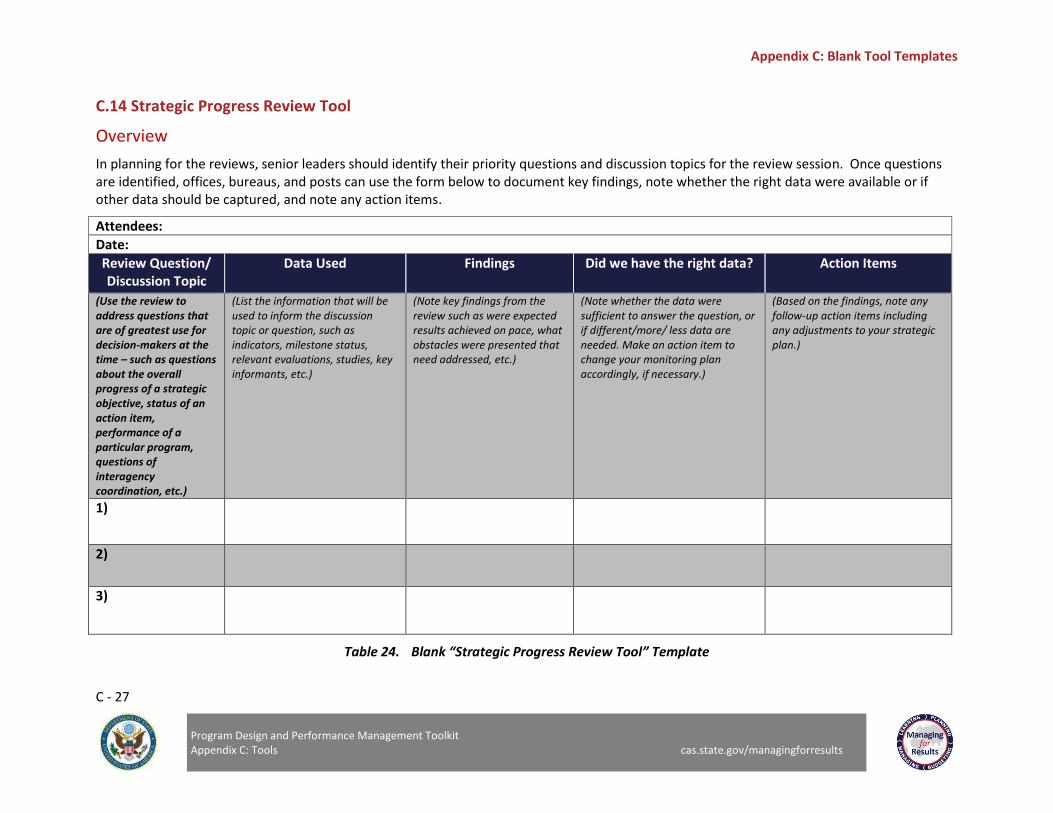
Appendix C: Blank Tool Templates
C - 27
Program Design and Performance Management Toolkit Appendix C: Tools cas.state.gov/managingforresults
C.14 Strategic Progress Review Tool
Overview
In planning for the reviews, senior leaders should identify their priority questions and discussion topics for the review session. Once questions are identified, offices, bureaus, and posts can use the form below to document key findings, note whether the right data were available or if other data should be captured, and note any action items.
Attendees:
Date:
Review Question/ Discussion Topic
Data Used
Findings
Did we have the right data? Action Items
(Use the review to address questions that are of greatest use for decision-makers at the time – such as questions about the overall progress of a strategic objective, status of an action item, performance of a particular program, questions of interagency coordination, etc.)
(List the information that will be used to inform the discussion topic or question, such as indicators, milestone status, relevant evaluations, studies, key informants, etc.)
(Note key findings from the review such as were expected results achieved on pace, what obstacles were presented that need addressed, etc.)
(Note whether the data were sufficient to answer the question, or if different/more/ less data are needed. Make an action item to change your monitoring plan accordingly, if necessary.)
(Based on the findings, note any follow-up action items including any adjustments to your strategic plan.)
1)
2)
3)
Table 24. Blank “Strategic Progress Review Tool” Template
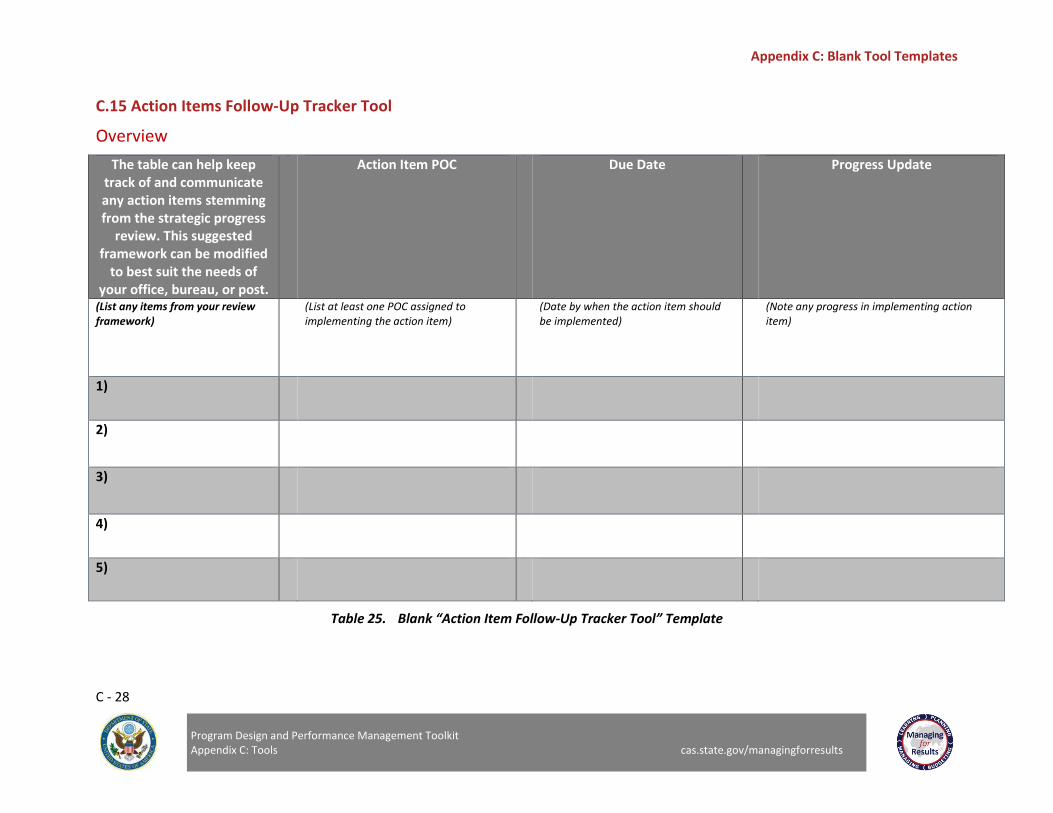
Appendix C: Blank Tool Templates
C - 28
Program Design and Performance Management Toolkit Appendix C: Tools cas.state.gov/managingforresults
C.15 Action Items Follow-Up Tracker Tool
Overview
The table can help keep track of and communicate any action items stemming from the strategic progress
review. This suggested framework can be modified
to best suit the needs of your office, bureau, or post.
Action Item POC
Due Date Progress Update
(List any items from your review framework)
(List at least one POC assigned to implementing the action item)
(Date by when the action item should be implemented)
(Note any progress in implementing action item)
1)
2)
3)
4)
5)
Table 25. Blank “Action Item Follow-Up Tracker Tool” Template
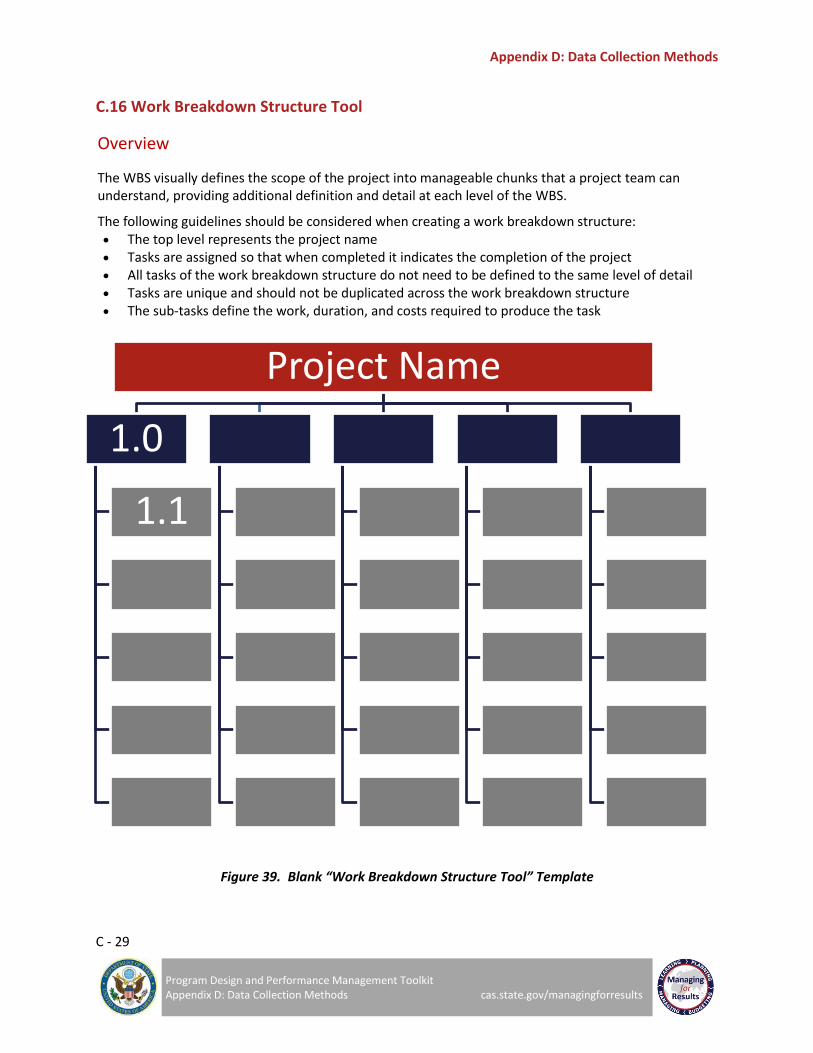
Appendix D: Data Collection Methods
C - 29
Program Design and Performance Management Toolkit Appendix D: Data Collection Methods cas.state.gov/managingforresults
C.16 Work Breakdown Structure Tool
Figure 39. Blank “Work Breakdown Structure Tool” Template
Overview
The WBS visually defines the scope of the project into manageable chunks that a project team can understand, providing additional definition and detail at each level of the WBS.
The following guidelines should be considered when creating a work breakdown structure: The top level represents the project name Tasks are assigned so that when completed it indicates the completion of the project All tasks of the work breakdown structure do not need to be defined to the same level of detail Tasks are unique and should not be duplicated across the work breakdown structure The sub-tasks define the work, duration, and costs required to produce the task
Project Name
1.0
1.1

APPENDIX D: DATA COLLECTION METHODS
It is important to note that the information in Appendix D regarding financial resource requirements for data collection tools is generalized. Factors that may influence data collection costs include geography, instability, complexity of the indicator, sample size, frequency of data collection, personnel requirements such as time in the field, number of data collectors, subject matter expertise, etc. This appendix is meant as a guide, not a rule of thumb.

Appendix D: Data Collection Methods
D - 2
Program Design and Performance Management Toolkit Appendix D: Data Collection Methods cas.state.gov/managingforresults
Primary Data Source Information Data
Sources Description Strengths Limitations Cost Estimates
Administrative records
Records of services provided and who received them
- Provide quantitative information about implementation
- Data may be disaggregated by gender, age, geography, etc.i
- Only provides output information
Attendance sheets
Records of who participated in a particular event
- Helpful in counting participants - Somewhat helpful in gender
disaggregation
- Ability to gather comparable data across program sites or time intervals
- Only provides output information
Meeting minutes/ meeting
summaries
Information recorded officially or unofficially during meetings
- Provide qualitative information regarding implementation
- Provide information about meeting attendance
- May not provide contextual information
Informal pre- and post-
intervention surveys
Short surveys that are administered to a convenience sampleii
- Can generate quantitative data when conditions make it difficult or inadvisable to survey a sample that is statistically representative of the population of interest
- Not appropriate for collecting in-depth information
- Susceptible to bias because the sample does not represent the population of interest.iii
- Costs vary depending on the need for interpreters, travel, etc.
Pre- and post-tests
Tests that are administered before and after an intervention
- Ability to gather comparable data across program sites or time intervals
- Easy to administer
- Only provides output information
- Hiring a subject matter expert to design and pilot a test can be costly.
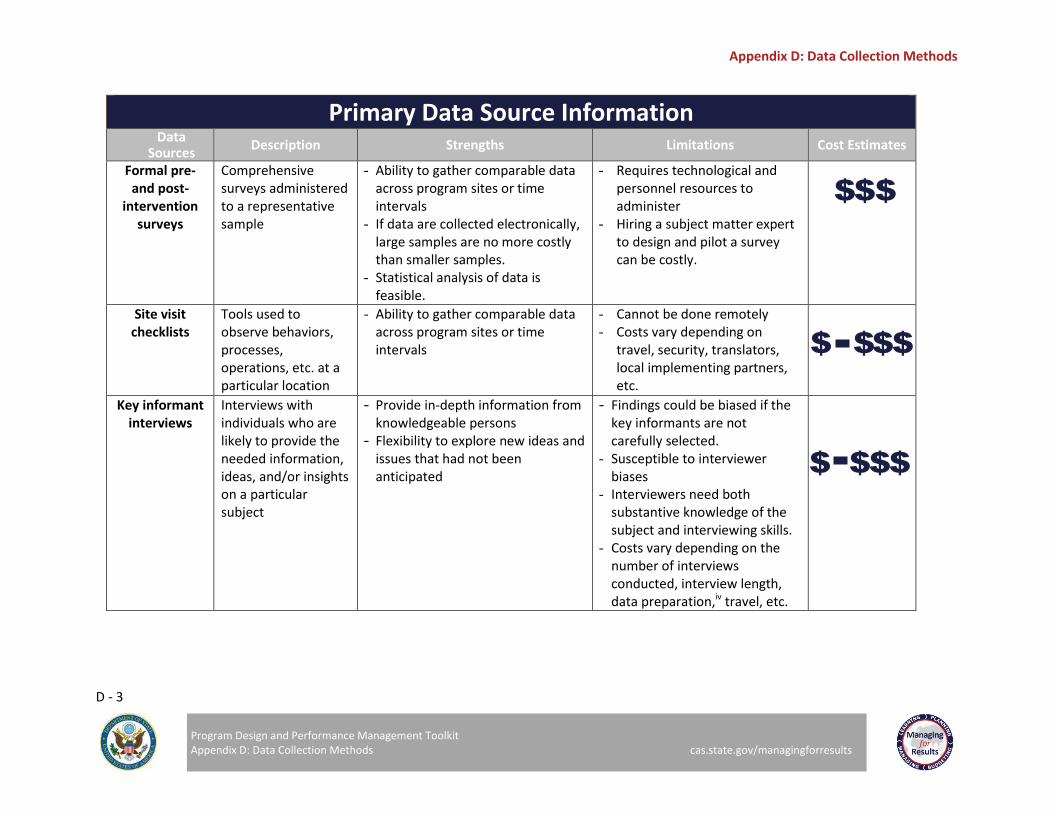
Appendix D: Data Collection Methods
D - 3
Program Design and Performance Management Toolkit Appendix D: Data Collection Methods cas.state.gov/managingforresults
Primary Data Source Information Data
Sources Description Strengths Limitations Cost Estimates
Formal pre- and post-
intervention surveys
Comprehensive surveys administered to a representative sample
- Ability to gather comparable data across program sites or time intervals
- If data are collected electronically, large samples are no more costly than smaller samples.
- Statistical analysis of data is feasible.
- Requires technological and personnel resources to administer
- Hiring a subject matter expert to design and pilot a survey can be costly.
Site visit checklists
Tools used to observe behaviors, processes, operations, etc. at a particular location
- Ability to gather comparable data across program sites or time intervals
- Cannot be done remotely
- Costs vary depending on travel, security, translators, local implementing partners, etc.
Key informant interviews
Interviews with individuals who are likely to provide the needed information, ideas, and/or insights on a particular subject
- Provide in-depth information from knowledgeable persons
- Flexibility to explore new ideas and issues that had not been anticipated
- Findings could be biased if the key informants are not carefully selected.
- Susceptible to interviewer biases
- Interviewers need both substantive knowledge of the subject and interviewing skills.
- Costs vary depending on the number of interviews conducted, interview length, data preparation,iv travel, etc.

Appendix D: Data Collection Methods
D - 4
Program Design and Performance Management Toolkit Appendix D: Data Collection Methods cas.state.gov/managingforresults
Community interviews
Meetings open to all community members in which the main interactions are between the investigator(s) and participants
- Permit direct interactions between the investigator(s) and a large number of people in the relevant population
- Can generate some quantitative data, e.g., by tallying yes or no responses to questions
- Attendees may not represent the relevant population.
- Some topics that can be discussed one-on-one cannot be raised in community interviews because of social or political constraints.
Direct observation
Systematic observation of an event or process as it takes place
- Observation occurs within context. - May reveal social and economic
conditions, problems, or behavior patterns that informants are unaware of or unable or unwilling to describe.
- Susceptible to observer bias - If the observed event or
process is not representative, the observer may get a misleading picture.
- Being under observation can affect the behavior of the people or organizations being observed.
Focus groups
Moderated discussions among small groups of relevant participants
- Enable information to be gathered rapidly
- May reduce individual inhibitions - May generate fresh ideas and
insights because the participants stimulate each other
- Susceptible to moderator bias - A few participants may
dominate the discussion; their views may not be the views of the entire group.
- Cannot provide quantifiable information
Table 26. Data Collection Methods
i When developing indicators, it is important to specify how they should be disaggregated and to communicate this information in the statements of work or requests for proposals. ii A convenience sample is made up of people who are easy to reach, e.g., shoppers in a market, workers in a factory cafeteria, or parents at a playground with their children.
iii For example, if an intervention targets both men and women, a survey administered to shoppers in order to learn something about the intervention’s effectiveness may not
adequately capture results for men. iv
Interviews should be recorded and transcribed or the interview should take extensive notes and use them to prepare a summary immediately after the interview has taken place.

APPENDIX E: CASE EXAMPLE 2, EMBASSY DISASTER PREPAREDNESS
The second case example can be used for those who work in a management office or on infrastructure programs. The case example follows the program design and performance management toolkit through an embassy disaster preparedness program. The case example is divided by section for ease of use.
Section 1: Align Programs to Advance Existing Strategies
1
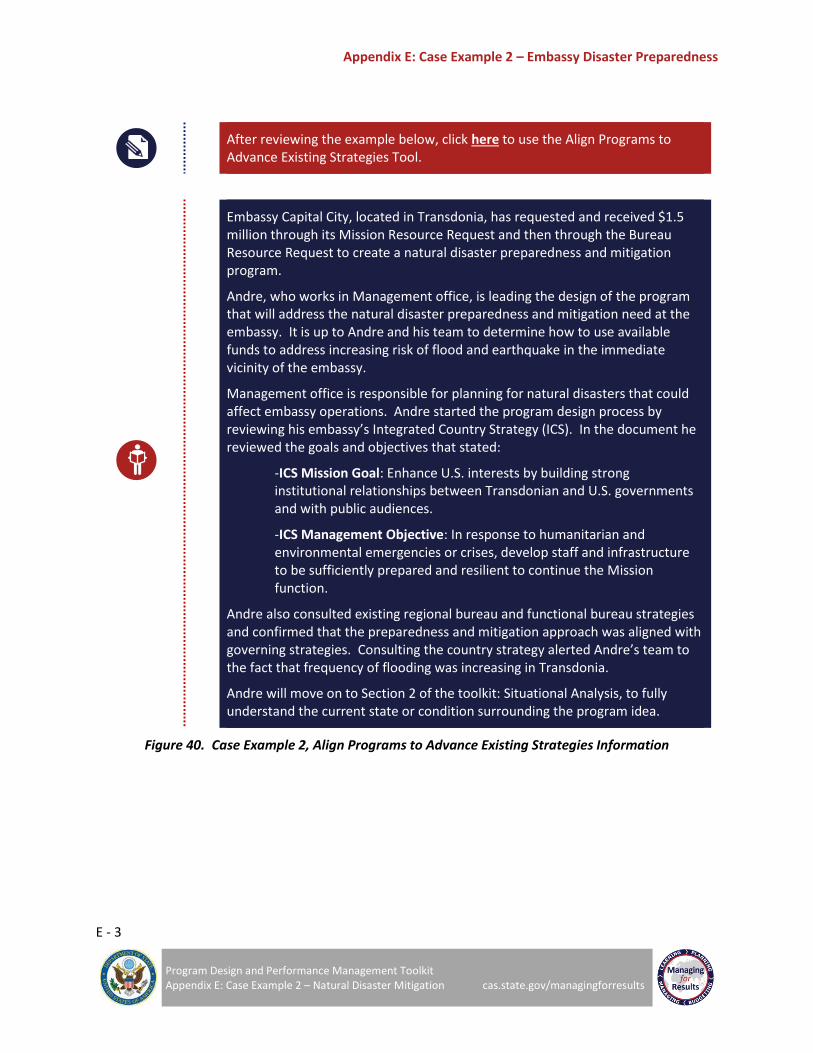
Appendix E: Case Example 2 – Embassy Disaster Preparedness
E - 3
Program Design and Performance Management Toolkit Appendix E: Case Example 2 – Natural Disaster Mitigation cas.state.gov/managingforresults
After reviewing the example below, click here to use the Align Programs to Advance Existing Strategies Tool.
Embassy Capital City, located in Transdonia, has requested and received $1.5 million through its Mission Resource Request and then through the Bureau Resource Request to create a natural disaster preparedness and mitigation program.
Andre, who works in Management office, is leading the design of the program that will address the natural disaster preparedness and mitigation need at the embassy. It is up to Andre and his team to determine how to use available funds to address increasing risk of flood and earthquake in the immediate vicinity of the embassy.
Management office is responsible for planning for natural disasters that could affect embassy operations. Andre started the program design process by reviewing his embassy’s Integrated Country Strategy (ICS). In the document he reviewed the goals and objectives that stated:
-ICS Mission Goal: Enhance U.S. interests by building strong institutional relationships between Transdonian and U.S. governments and with public audiences.
-ICS Management Objective: In response to humanitarian and environmental emergencies or crises, develop staff and infrastructure to be sufficiently prepared and resilient to continue the Mission function.
Andre also consulted existing regional bureau and functional bureau strategies and confirmed that the preparedness and mitigation approach was aligned with governing strategies. Consulting the country strategy alerted Andre’s team to the fact that frequency of flooding was increasing in Transdonia.
Andre will move on to Section 2 of the toolkit: Situational Analysis, to fully understand the current state or condition surrounding the program idea.
Figure 40. Case Example 2, Align Programs to Advance Existing Strategies Information
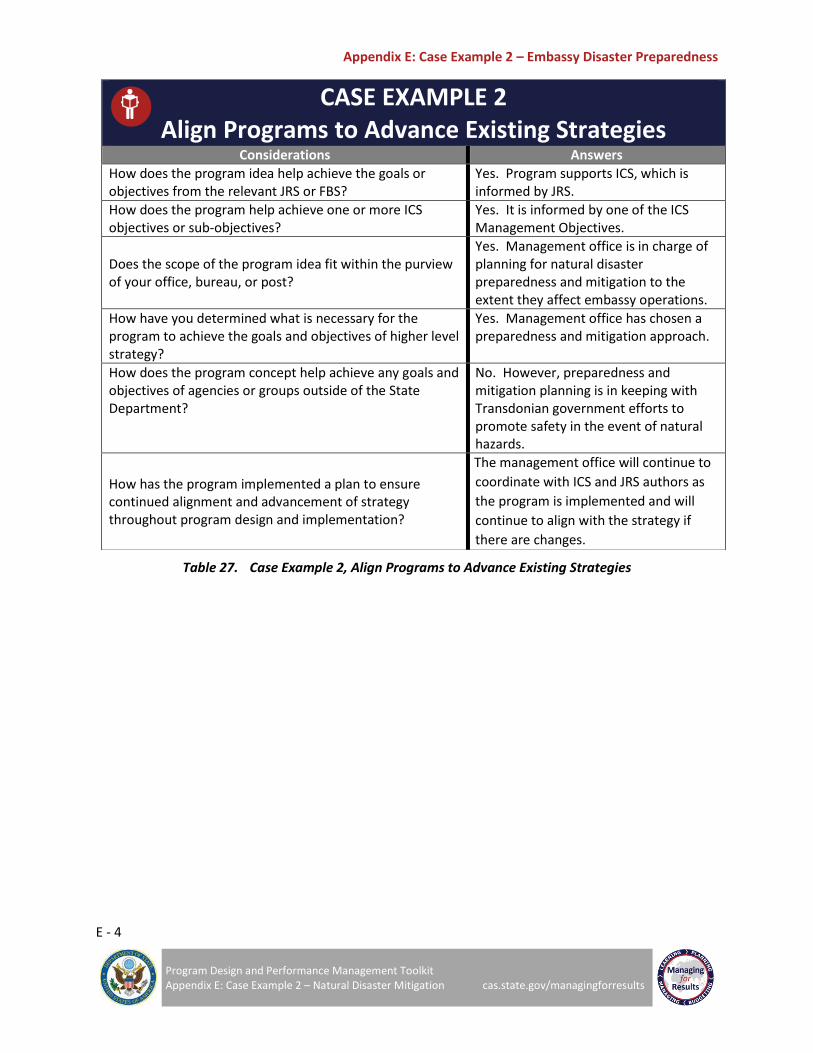
Appendix E: Case Example 2 – Embassy Disaster Preparedness
E - 4
Program Design and Performance Management Toolkit Appendix E: Case Example 2 – Natural Disaster Mitigation cas.state.gov/managingforresults
Table 27. Case Example 2, Align Programs to Advance Existing Strategies
CASE EXAMPLE 2 Align Programs to Advance Existing Strategies
Considerations Answers How does the program idea help achieve the goals or objectives from the relevant JRS or FBS?
Yes. Program supports ICS, which is informed by JRS.
How does the program help achieve one or more ICS objectives or sub-objectives?
Yes. It is informed by one of the ICS Management Objectives.
Does the scope of the program idea fit within the purview of your office, bureau, or post?
Yes. Management office is in charge of planning for natural disaster preparedness and mitigation to the extent they affect embassy operations.
How have you determined what is necessary for the program to achieve the goals and objectives of higher level strategy?
Yes. Management office has chosen a preparedness and mitigation approach.
How does the program concept help achieve any goals and objectives of agencies or groups outside of the State Department?
No. However, preparedness and mitigation planning is in keeping with Transdonian government efforts to promote safety in the event of natural hazards.
How has the program implemented a plan to ensure continued alignment and advancement of strategy throughout program design and implementation?
The management office will continue to
coordinate with ICS and JRS authors as
the program is implemented and will
continue to align with the strategy if
there are changes.
Section 2: Conduct a Situational Analysis
2
Appendix E: Case Example 2 – Embassy Disaster Preparedness
E - 6
Program Design and Performance Management Toolkit Appendix E: Case Example 2 – Natural Disaster Mitigation cas.state.gov/managingforresults
After reviewing the example below, click here to use the Internal Assessment Tool.
Andre started to design the program by conducting an internal assessment of Management office. He did this to identify the resources and skills his team possesses and to be aware of any potential gaps prior to designing the program. He asked a series of questions of bureau leadership and staff using the Internal Assessment Tool and he found that the resources are available to implement the program.
Figure 41. Case Example 2, Internal Assessment Information
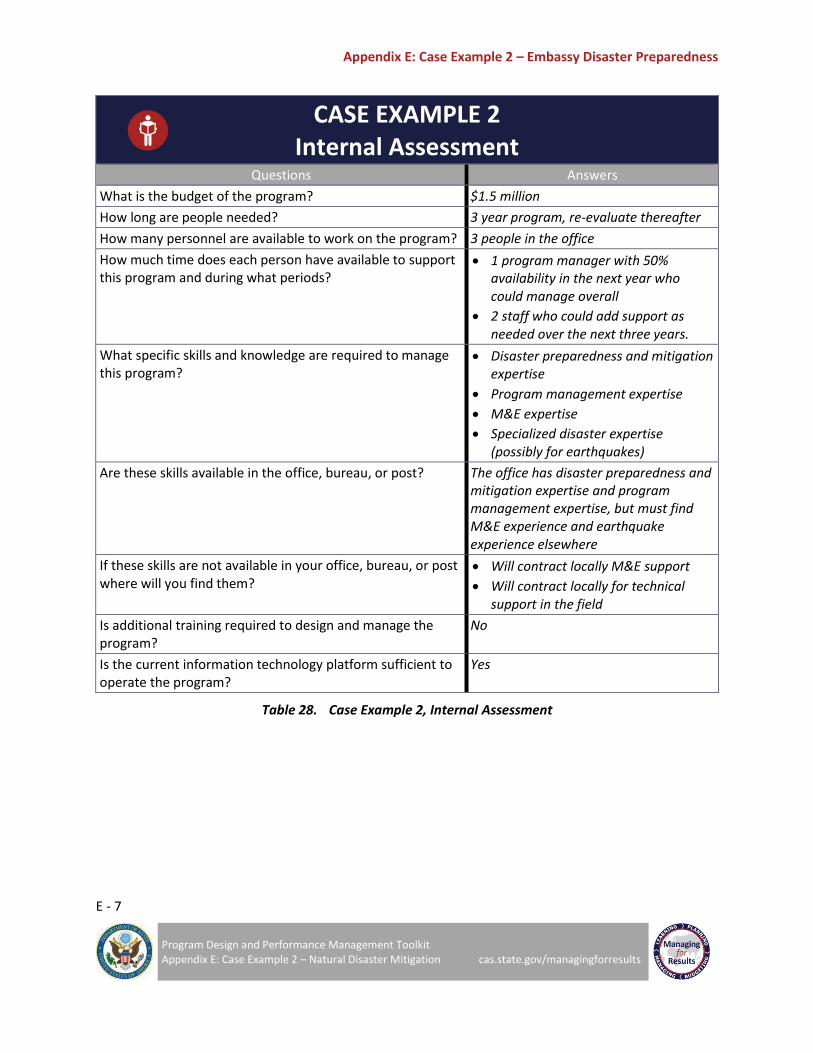
Appendix E: Case Example 2 – Embassy Disaster Preparedness
E - 7
Program Design and Performance Management Toolkit Appendix E: Case Example 2 – Natural Disaster Mitigation cas.state.gov/managingforresults
CASE EXAMPLE 2 Internal Assessment
Questions Answers
What is the budget of the program? $1.5 million
How long are people needed? 3 year program, re-evaluate thereafter
How many personnel are available to work on the program? 3 people in the office
How much time does each person have available to support this program and during what periods?
1 program manager with 50% availability in the next year who could manage overall
2 staff who could add support as needed over the next three years.
What specific skills and knowledge are required to manage this program?
Disaster preparedness and mitigation expertise
Program management expertise
M&E expertise
Specialized disaster expertise (possibly for earthquakes)
Are these skills available in the office, bureau, or post? The office has disaster preparedness and mitigation expertise and program management expertise, but must find M&E experience and earthquake experience elsewhere
If these skills are not available in your office, bureau, or post where will you find them?
Will contract locally M&E support
Will contract locally for technical support in the field
Is additional training required to design and manage the program?
No
Is the current information technology platform sufficient to operate the program?
Yes
Table 28. Case Example 2, Internal Assessment

Appendix E: Case Example 2 – Embassy Disaster Preparedness
E - 8
Program Design and Performance Management Toolkit Appendix E: Case Example 2 – Natural Disaster Mitigation cas.state.gov/managingforresults
After reviewing the example below, click here to use the External Assessment Tool.
Andre conducted an external assessment to learn about the environment in which the embassy team will be implementing the program. He included the information in Table 29.
Figure 42. Case Example 2, External Assessment Information

Appendix E: Case Example 2 – Embassy Disaster Preparedness
E - 9
Program Design and Performance Management Toolkit Appendix E: Case Example 2 – Natural Disaster Mitigation cas.state.gov/managingforresults
CASE EXAMPLE 2
External Assessment
Questions Description Answer
Could this negatively
interfere with program
implementation?
Political/Legal
Are there political/legal factors that could positively or negatively affect operations or activities?
Laws, regulations, hostility towards such activity
Transdonia’s Ministry of Disaster Management has a disaster action plan, mandated by national law
There is no hostility towards a disaster preparedness plan for Embassy Capital City
Yes
No
Maybe, but not critical
N/A
Notes or mitigation actions, if necessary: Program team should be in contact with the Ministry of Disaster Management so that they are aware that a plan is in place. This also important to confirm that any evacuation planning is coordinated with existing plans for the rest of the city.
Security
Are there security factors to consider?
Instability, violent crime
The region is stable and peaceful but the capital city is known for property crime.
Yes
No
Maybe, but not critical
N/A
Notes or mitigation actions, if necessary:
Environment
What are the natural surroundings that may influence the implementation of the planned program?
Geography, health, natural disaster, climate, etc.
Capital City is bounded by the coast to the west and by mountains to the east
Flooding is happening more frequently following seasonal storms
Fault lines run throughout the country
It was recently discovered that there is a fault line near the embassy
Yes
No
Maybe, but not critical
N/A
Notes or mitigation actions, if necessary: The severity of flooding is increasing. The future intensity and frequency of earthquakes is unknown. It will be important to reevaluate the program on a regular basis to make sure it is addressing need.

Appendix E: Case Example 2 – Embassy Disaster Preparedness
E - 10
Program Design and Performance Management Toolkit Appendix E: Case Example 2 – Natural Disaster Mitigation cas.state.gov/managingforresults
CASE EXAMPLE 2
External Assessment
Questions Description Answer
Could this negatively
interfere with program
implementation?
Culture
What are the cultural factors that may influence the implementation of the program?
Consider the societal norms and customs that will influence the implementation of the program.
While national government has a planning function, local communities do not have a tradition of planning for preparedness.
Yes
No
Maybe, but not critical
N/A
Notes or mitigation actions, if necessary:
Economics
What are the economic factors that may influence the implementation of the program?
Consider the factors external to your office, bureau, or post such as the economy of the country in which the program will be implemented, economic well-being of the customers/ recipients, the costs of operating, etc.
Transdonian government is unlikely to have financial resources to restore essential infrastructure (communications, roads) rapidly
Per-capita income is low and it may not be possible to expect all staff to have adequate supplies on hand in case of sudden onset disaster
The economy is highly dependent on the tourist trade from the United States. A sudden onset disaster could seriously affect the local economy. It may also cause many American Citizens to seek assistance from the embassy.
Yes
No
Maybe, but not critical
N/A
Notes or mitigation actions, if necessary: Disaster preparedness should include strategies to ensure that staff are evacuated quickly and safely so that operations can continue. Planning should anticipate unavailability of national transportation and communication systems for a minimum of two weeks

Appendix E: Case Example 2 – Embassy Disaster Preparedness
E - 11
Program Design and Performance Management Toolkit Appendix E: Case Example 2 – Natural Disaster Mitigation cas.state.gov/managingforresults
CASE EXAMPLE 2
External Assessment
Questions Description Answer
Could this negatively
interfere with program
implementation?
Institutional
What are the institutional factors that may influence the implementation of the program?
Consider the characteristics of any organizations you may need to partner with such as: customs, attitudes, processes, behaviors, etc.
The Ministry of Disaster Management has authority over national preparedness and response in cases of natural disaster
Other embassies have developed and instituted preparedness and mitigation plans recently. Embassy Capital City has a history of collaborating when planning similar efforts
There are NGOs in the country that are working to increase the country’s resilience to natural disaster
Yes
No
Maybe, but not critical
N/A
Notes or mitigation actions, if necessary: For the sake of custom, it is best to begin coordination by meeting with the national government.
Infrastructure
What are the infrastructure factors that may influence the implementation of the program?
Consider building space, IT (cell phones, computers, internet), water, electricity, etc.
The embassy is planning to alter compound infrastructure so that it is resilient to flood and earthquake. However, Transdonian infrastructure is vulnerable to these hazards. As a result, the disaster preparedness plan will need to incorporate the likelihood that roads/electricity/communications systems will not function.
Yes
No
Maybe, but not critical
N/A
Notes or mitigation actions, if necessary:
Table 29. Case Example 2, External Assessment
Appendix E: Case Example 2 – Embassy Disaster Preparedness
E - 12
Program Design and Performance Management Toolkit Appendix E: Case Example 2 – Natural Disaster Mitigation cas.state.gov/managingforresults
After reviewing the example below, click here to use the Five Whys Tool.
Andre and his team understood from their analysis that there were certain groups they should work with in developing the preparedness and mitigation program and how these other external factors should shape their program. They used the 5 Whys Tool to understand the root cause of the flood and earthquake risk and found that the team only needed go through four stages of question and answer isolate the root cause. The team started by asking “why is there high risk of loss of life and property from flood and earthquake?” in an effort to separate the issue of hazard from the sources of vulnerability. Table 30 shows how Andre’s team used the Five Whys Tool.
Figure 43. Case Example 2, Five Whys Tool Information

Appendix E: Case Example 2 – Embassy Disaster Preparedness
E - 13
Program Design and Performance Management Toolkit Appendix E: Case Example 2 – Natural Disaster Mitigation cas.state.gov/managingforresults
CASE EXAMPLE 2 Five Whys
Component Description Answer
What is the undesirable symptom you would like to address?
The visible result of the underlying root cause. The problem we would like to solve.
Risk of loss of life and property at Embassy Capital City due to flood and earthquake.
First Why:
Why is this happening?
Why is the embassy at risk for loss of life and property due to natural disaster?
For flooding, because it is becoming more frequent and severe seasonally.
For earthquakes, because a fault line was recently discovered near the embassy.
Second Why:
Why is this happening?
Why is flooding threatening life and property at the embassy?
Why are earthquakes threatening life and property at the embassy?
In the case of flood hazard, this is because flood levels are rising and are threatening to flood embassy grounds.
In the case of earthquake hazard, the shaking and destruction is occurring closer to the embassy as a fault line near the embassy has become active. The country in general is experiencing earthquakes more frequently.
Third Why:
Why is this happening?
Why is flooding submerging the embassy and threatening life and property?
Why is the shaking and destruction threatening life and property?
Flood waters are submerging the embassy and threatening property because there are no flood defenses. They are threatening life because of lack of flood defenses for embassy grounds and because Capital City infrastructure stops functioning in flooding.
The shaking is damaging buildings, dislodging furniture, and causing injury at the embassy and disabling infrastructure.
Fourth Why:
Why is this happening?
Why does the embassy lack flood defenses and why is the infrastructure being disabled?
Why are buildings at risk of being damaged and infrastructure disabled during earthquakes?
The embassy lacks flood defenses because the
embassy has yet to develop a strategy and
infrastructure to mitigate this risk to property.
The embassy also has yet to develop a strategy
and infrastructure to protect personnel.
Damage is occurring and infrastructure is being
disabled as the embassy building has not been
reinforced for shaking. Life is threatened because
personnel do not know how to respond and
evacuate. Infrastructure is disabled and the
national government is not able.
Fifth Why N/A N/A
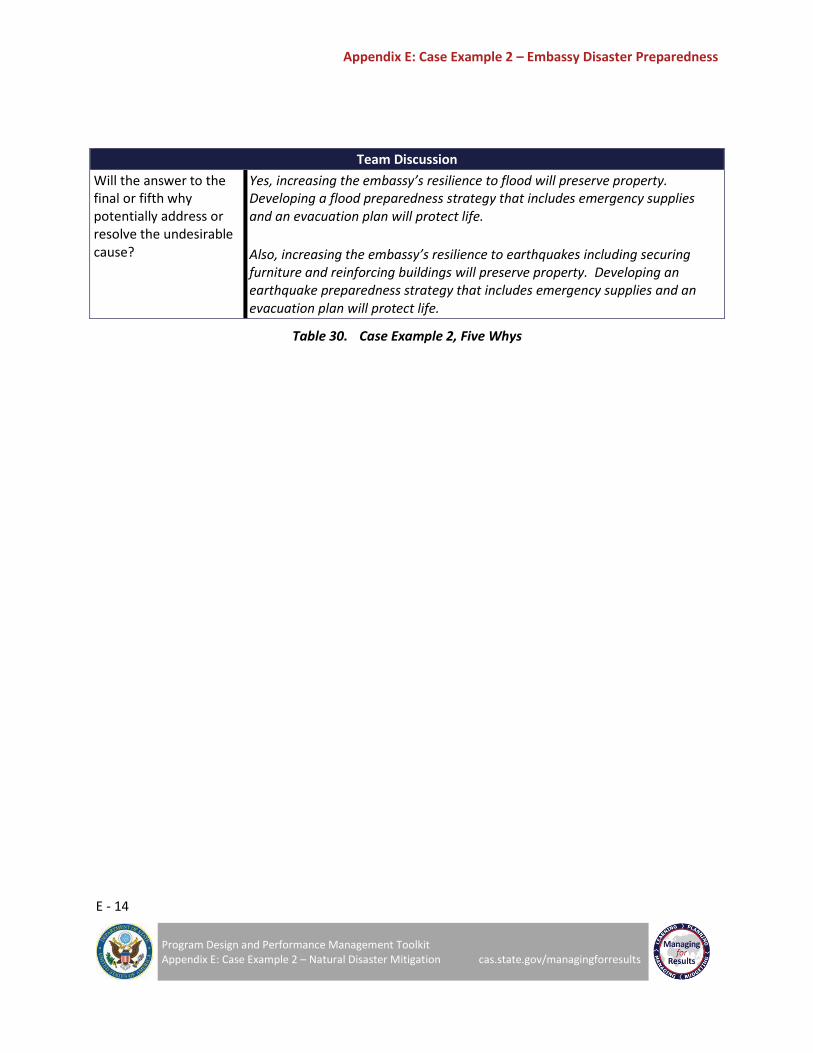
Appendix E: Case Example 2 – Embassy Disaster Preparedness
E - 14
Program Design and Performance Management Toolkit Appendix E: Case Example 2 – Natural Disaster Mitigation cas.state.gov/managingforresults
Team Discussion
Will the answer to the final or fifth why potentially address or resolve the undesirable cause?
Yes, increasing the embassy’s resilience to flood will preserve property. Developing a flood preparedness strategy that includes emergency supplies and an evacuation plan will protect life.
Also, increasing the embassy’s resilience to earthquakes including securing furniture and reinforcing buildings will preserve property. Developing an earthquake preparedness strategy that includes emergency supplies and an evacuation plan will protect life.
Table 30. Case Example 2, Five Whys
Appendix E: Case Example 2 – Embassy Disaster Preparedness
E - 15
Program Design and Performance Management Toolkit Appendix E: Case Example 2 – Natural Disaster Mitigation cas.state.gov/managingforresults
After reviewing the example below, click here to use the Review of the Issue or Problem Tool.
Andre conducted a document review and coordinated with stakeholders to review the issue of natural disaster preparedness and mitigation in Transdonia. This information is important as it will inform the development of the problem statement, goal, objectives, and program logic. The information from this analysis can be found in Table 31.
Figure 44. Case Example 2, Review of the Issue or Problem
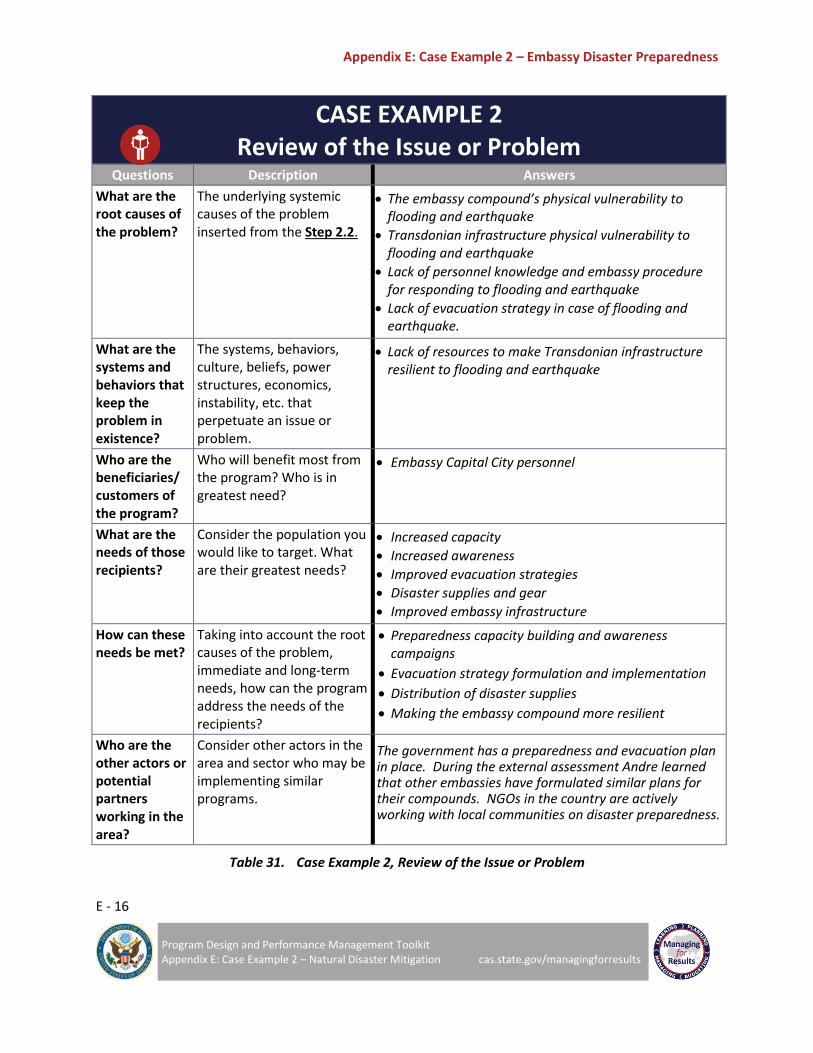
Appendix E: Case Example 2 – Embassy Disaster Preparedness
E - 16
Program Design and Performance Management Toolkit Appendix E: Case Example 2 – Natural Disaster Mitigation cas.state.gov/managingforresults
CASE EXAMPLE 2 Review of the Issue or Problem
Questions Description Answers
What are the root causes of the problem?
The underlying systemic causes of the problem inserted from the Step 2.2.
The embassy compound’s physical vulnerability to flooding and earthquake
Transdonian infrastructure physical vulnerability to flooding and earthquake
Lack of personnel knowledge and embassy procedure for responding to flooding and earthquake
Lack of evacuation strategy in case of flooding and earthquake.
What are the systems and behaviors that keep the problem in existence?
The systems, behaviors, culture, beliefs, power structures, economics, instability, etc. that perpetuate an issue or problem.
Lack of resources to make Transdonian infrastructure resilient to flooding and earthquake
Who are the beneficiaries/ customers of the program?
Who will benefit most from the program? Who is in greatest need?
Embassy Capital City personnel
What are the needs of those recipients?
Consider the population you would like to target. What are their greatest needs?
Increased capacity
Increased awareness
Improved evacuation strategies
Disaster supplies and gear
Improved embassy infrastructure
How can these needs be met?
Taking into account the root causes of the problem, immediate and long-term needs, how can the program address the needs of the recipients?
Preparedness capacity building and awareness campaigns
Evacuation strategy formulation and implementation
Distribution of disaster supplies
Making the embassy compound more resilient
Who are the other actors or potential partners working in the area?
Consider other actors in the area and sector who may be implementing similar programs.
The government has a preparedness and evacuation plan in place. During the external assessment Andre learned that other embassies have formulated similar plans for their compounds. NGOs in the country are actively working with local communities on disaster preparedness.
Table 31. Case Example 2, Review of the Issue or Problem

Section 3: Design a Program
3

Appendix E: Case Example 2 – Embassy Disaster Preparedness
E - 18
Program Design and Performance Management Toolkit Appendix E: Case Example 2 – Natural Disaster Mitigation cas.state.gov/managingforresults
After reviewing the example below, click here to use the Develop the Problem or Needs Statement Tool.
Andre and his team used information from the situational analysis to answer specific questions about the problem, who is affected, when, where, why and how. Andre and his team used the Problem or Needs Statement Tool to determine the exact challenge their program will address. This information will be used in the development of the goals and objectives and lays the foundation for designing the program. Please see the information from Andre’s team in Table 32.
Figure 45. Case Example 2, Problem or Needs Statement Tool Information

Appendix E: Case Example 2 – Embassy Disaster Preparedness
E - 19
Program Design and Performance Management Toolkit Appendix E: Case Example 2 – Natural Disaster Mitigation cas.state.gov/managingforresults
CASE EXAMPLE 2 Develop the Problem or Needs Statement
Question Category Definition Answer
WHO
Customers or Beneficiaries
Demographics
Describe the population that is affected by this problem (e.g., age, gender, education, ethnic group, religion, etc.)
Personnel: Foreign Service/Civil Service/EFM. Average age is 35 and education is a mix of college and graduate degree.
Personnel: Locally Employed Staff. Average age is 30 and education is a mix of college and graduate degree with 5% having high school degree.
3% of LES have difficulty with English.
2% of participants have physical limitations and need assistance to move around the embassy compound.
Stakeholders
Describe who is involved in the issue or challenge
Government agencies and officials that coordinate disaster preparedness and response efforts.
Nearby embassies that have disaster preparedness and mitigation plans for the same risks
Family members of personnel who will want to ensure and be informed about the well being of family members who work on the embassy compound.
NGOs that work on disaster preparedness and resiliency in local communities.
WHAT Scope, Extent,
Severity
Describe the:
Sector, area, or subject matter
Scale or magnitude
Gravity and urgency
Sector – Disaster preparedness-making embassy compound resilient, training and equipping personnel to survive and evacuate.
Scale – Embassy compound and buildings require improvements, personnel require training, awareness and supplies.
Urgency – Urgent. Flooding is seasonal and anticipated. Earthquakes are not precisely predictable but potentially devastating.
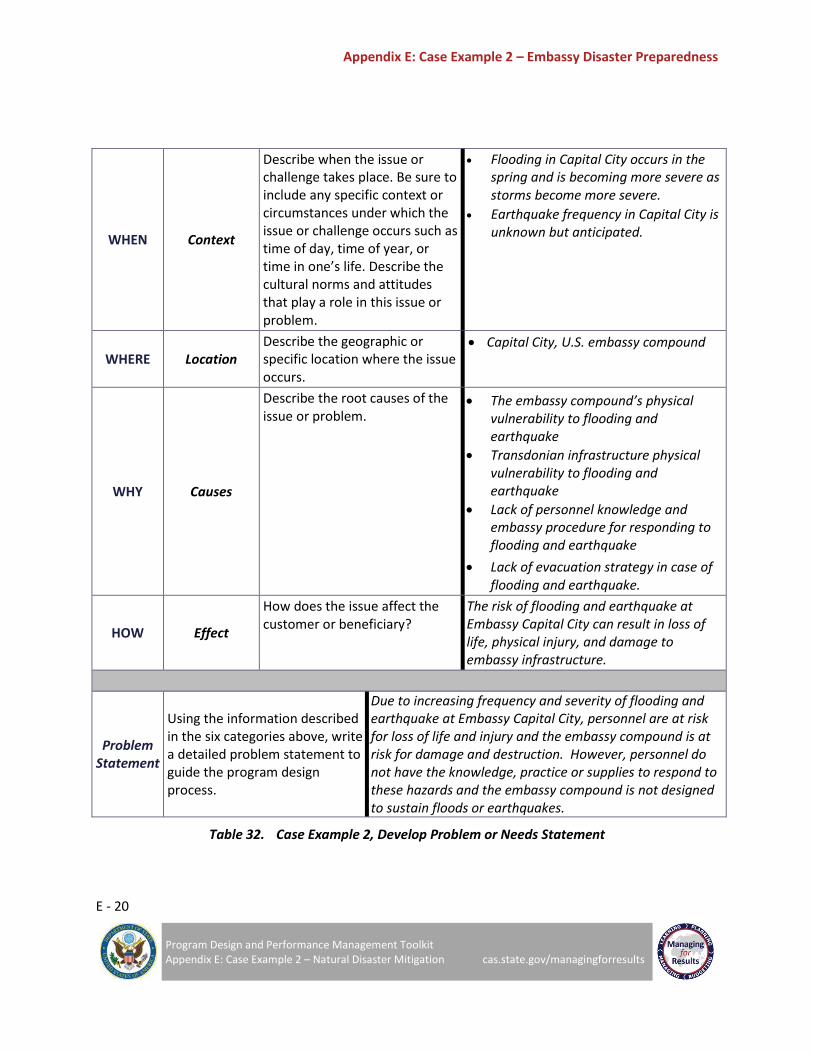
Appendix E: Case Example 2 – Embassy Disaster Preparedness
E - 20
Program Design and Performance Management Toolkit Appendix E: Case Example 2 – Natural Disaster Mitigation cas.state.gov/managingforresults
WHEN Context
Describe when the issue or challenge takes place. Be sure to include any specific context or circumstances under which the issue or challenge occurs such as time of day, time of year, or time in one’s life. Describe the cultural norms and attitudes that play a role in this issue or problem.
Flooding in Capital City occurs in the spring and is becoming more severe as storms become more severe.
Earthquake frequency in Capital City is unknown but anticipated.
WHERE Location Describe the geographic or specific location where the issue occurs.
Capital City, U.S. embassy compound
WHY Causes
Describe the root causes of the issue or problem.
The embassy compound’s physical vulnerability to flooding and earthquake
Transdonian infrastructure physical vulnerability to flooding and earthquake
Lack of personnel knowledge and embassy procedure for responding to flooding and earthquake
Lack of evacuation strategy in case of flooding and earthquake.
HOW Effect
How does the issue affect the customer or beneficiary?
The risk of flooding and earthquake at Embassy Capital City can result in loss of life, physical injury, and damage to embassy infrastructure.
Problem Statement
Using the information described in the six categories above, write a detailed problem statement to guide the program design process.
Due to increasing frequency and severity of flooding and earthquake at Embassy Capital City, personnel are at risk for loss of life and injury and the embassy compound is at risk for damage and destruction. However, personnel do not have the knowledge, practice or supplies to respond to these hazards and the embassy compound is not designed to sustain floods or earthquakes.
Table 32. Case Example 2, Develop Problem or Needs Statement
Appendix E: Case Example 2 – Embassy Disaster Preparedness
E - 21
Program Design and Performance Management Toolkit Appendix E: Case Example 2 – Natural Disaster Mitigation cas.state.gov/managingforresults
After reviewing the example below, click here for the Develop Program Goals and Objectives Tool. For more guidance on developing program objectives, consider using the SMART principles – Specific, Measureable, Achievable, Relevant, and Time-bound.
During the “Five Why’s” exercise in Section 2, Andre’s team determined that a disaster preparedness plan and embassy compound improvements were the major initiatives necessary for implementing a disaster preparedness and mitigation program. His team decided to collaborate with the local government and other stakeholders in the area to develop a disaster mitigation plan. They will also collaborate with professionals to identify what will need to be done in the embassy compound to make it more resilient to flood and earthquake.
The $1.5 million will be used to support the goal(s) and objectives determined in the Goals and Objectives Tool seen in Figure 47.
Figure 46. Case Example 2, Develop Goals and Objectives Information

Appendix E: Case Example 2 – Embassy Disaster Preparedness
E - 22
Program Design and Performance Management Toolkit Appendix E: Case Example 2 – Natural Disaster Mitigation cas.state.gov/managingforresults
CASE EXAMPLE 2 Develop Program Goals and Objectives
Problem Statement
Due to increasing frequency and severity of flooding and earthquake at Embassy Capital City, personnel are at risk for loss of life and injury and the embassy compound is at risk for damage and destruction. However, personnel do not have the knowledge, practice or supplies to respond to these hazards and the embassy compound is not designed to sustain floods or earthquakes.
Program Goal
Vulnerability of Embassy Capital City personnel and infrastructure to flood and earthquake is decreased.
Objective 1 Objective 2
Increase preparedness of embassy personnel in case of flood and earthquake hazard.
Increase resilience of embassy compound in the case of flood or earthquake hazard.
Figure 47. Case Example 2, Develop Program Goals and Objectives
A
1 2

Appendix E: Case Example 2 – Embassy Disaster Preparedness
E - 23
Program Design and Performance Management Toolkit Appendix E: Case Example 2 – Natural Disaster Mitigation cas.state.gov/managingforresults
Long-Term Outcome
Reduction in incidence of Embassy Capital City personnel’s flood and earthquake hazard related morbidity and mortality.
This is a strong long-term outcome because although it may not be realized during the timeframe of a single disaster preparedness program, it is a logical long-term extension and it is a measurable/observable change.
Figure 48. Case Example 2, Long-Term Outcome
CASE EXAMPLE 2 Developing Long-Term Outcomes
Program Goal
Vulnerability of Embassy Capital City personnel and infrastructure to flood and earthquake hazard is decreased.
Number of personnel who survive flood or earthquake hazard unharmed.
Embassy compound is open and functioning after flood or earthquake hazard.
Figure 49. Case Example 2, Develop Long-Term Outcomes
Long-Term Outcomes
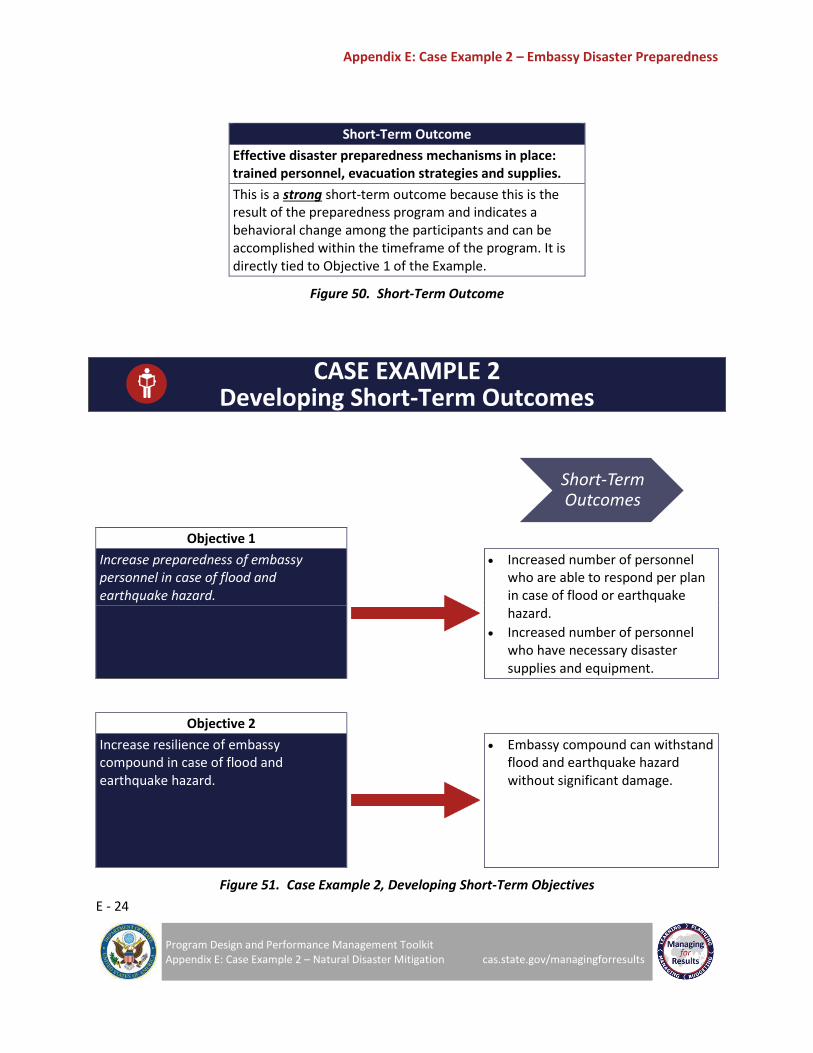
Appendix E: Case Example 2 – Embassy Disaster Preparedness
E - 24
Program Design and Performance Management Toolkit Appendix E: Case Example 2 – Natural Disaster Mitigation cas.state.gov/managingforresults
Short-Term Outcome
Effective disaster preparedness mechanisms in place: trained personnel, evacuation strategies and supplies.
This is a strong short-term outcome because this is the result of the preparedness program and indicates a behavioral change among the participants and can be accomplished within the timeframe of the program. It is directly tied to Objective 1 of the Example.
Figure 50. Short-Term Outcome
CASE EXAMPLE 2 Developing Short-Term Outcomes
Objective 1
Increase preparedness of embassy personnel in case of flood and earthquake hazard.
Increased number of personnel who are able to respond per plan in case of flood or earthquake hazard.
Increased number of personnel who have necessary disaster supplies and equipment.
Objective 2
Increase resilience of embassy compound in case of flood and earthquake hazard.
Embassy compound can withstand flood and earthquake hazard without significant damage.
Figure 51. Case Example 2, Developing Short-Term Objectives
Short-Term Outcomes

Appendix E: Case Example 2 – Embassy Disaster Preparedness
E - 25
Program Design and Performance Management Toolkit Appendix E: Case Example 2 – Natural Disaster Mitigation cas.state.gov/managingforresults
Output
Number of personnel who received disaster preparedness training.
This is a strong example of an output because it is a direct result of the program activity. This output is measurable; it is specific and relevant to the program activities and long-term outcomes.
Figure 52. Case Example 2, Output
Activity
Training in how to respond to flood and earthquake hazard in the embassy compound.
This is a strong example of an activity because explains who will receive training, what type of training and it directly relates to Objective 1.
Figure 53. Case Example 2, Activity
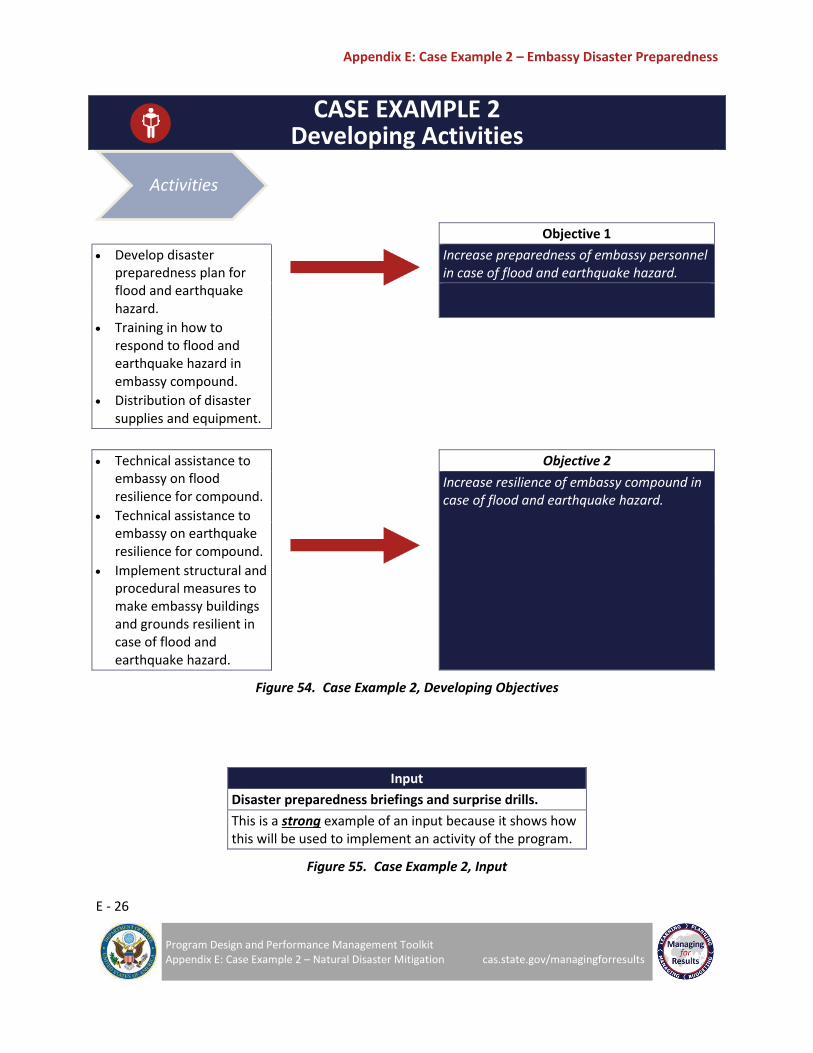
Appendix E: Case Example 2 – Embassy Disaster Preparedness
E - 26
Program Design and Performance Management Toolkit Appendix E: Case Example 2 – Natural Disaster Mitigation cas.state.gov/managingforresults
CASE EXAMPLE 2 Developing Activities
Objective 1
Develop disaster preparedness plan for flood and earthquake hazard.
Training in how to respond to flood and earthquake hazard in embassy compound.
Distribution of disaster supplies and equipment.
Increase preparedness of embassy personnel in case of flood and earthquake hazard.
Technical assistance to embassy on flood resilience for compound.
Technical assistance to embassy on earthquake resilience for compound.
Implement structural and procedural measures to make embassy buildings and grounds resilient in case of flood and earthquake hazard.
Objective 2
Increase resilience of embassy compound in case of flood and earthquake hazard.
Figure 54. Case Example 2, Developing Objectives
Input
Disaster preparedness briefings and surprise drills.
This is a strong example of an input because it shows how this will be used to implement an activity of the program.
Figure 55. Case Example 2, Input
Activities

Appendix E: Case Example 2 – Embassy Disaster Preparedness
E - 27
Program Design and Performance Management Toolkit Appendix E: Case Example 2 – Natural Disaster Mitigation cas.state.gov/managingforresults
After reviewing the case example below, click here to use the Logic Model Tool.
Now that the goals and objectives of the program are developed, Mary and her team can develop the program logic using the Program Logic Model Tool. In doing so she can determine how the program’s inputs will lead to the long-term outcomes of the program. See the case example of the Program Logic Model in Figure 57.
Figure 56. Case Example, Logic Model Information
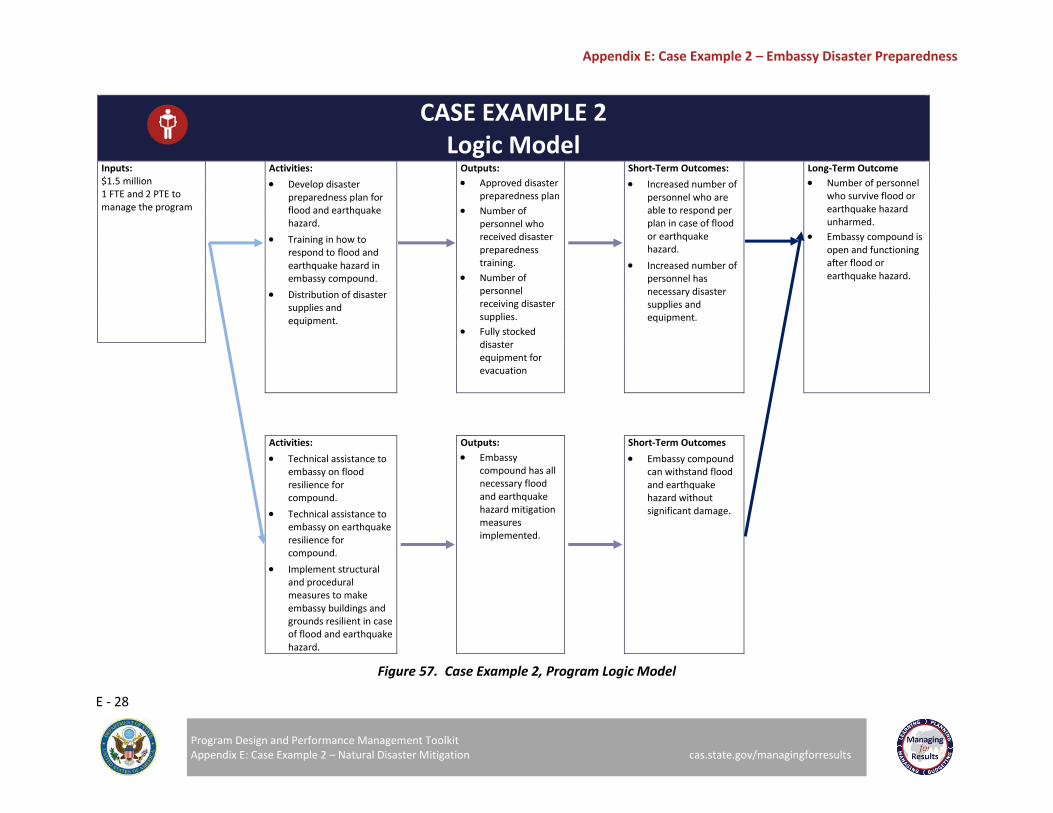
Appendix E: Case Example 2 – Embassy Disaster Preparedness
E - 28
Program Design and Performance Management Toolkit Appendix E: Case Example 2 – Natural Disaster Mitigation cas.state.gov/managingforresults
CASE EXAMPLE 2 Logic Model
Inputs: $1.5 million 1 FTE and 2 PTE to manage the program
Activities:
Develop disaster preparedness plan for flood and earthquake hazard.
Training in how to respond to flood and earthquake hazard in embassy compound.
Distribution of disaster supplies and equipment.
Outputs:
Approved disaster preparedness plan
Number of personnel who received disaster preparedness training.
Number of personnel receiving disaster supplies.
Fully stocked disaster equipment for evacuation
Short-Term Outcomes:
Increased number of personnel who are able to respond per plan in case of flood or earthquake hazard.
Increased number of personnel has necessary disaster supplies and equipment.
Long-Term Outcome
Number of personnel who survive flood or earthquake hazard unharmed.
Embassy compound is open and functioning after flood or earthquake hazard.
Activities:
Technical assistance to embassy on flood resilience for compound.
Technical assistance to embassy on earthquake resilience for compound.
Implement structural and procedural measures to make embassy buildings and grounds resilient in case of flood and earthquake hazard.
Outputs:
Embassy compound has all necessary flood and earthquake hazard mitigation measures implemented.
Short-Term Outcomes
Embassy compound can withstand flood and earthquake hazard without significant damage.
Figure 57. Case Example 2, Program Logic Model

Appendix E: Case Example 2 – Embassy Disaster Preparedness
E - 29
Program Design and Performance Management Toolkit Appendix E: Case Example 2 – Natural Disaster Mitigation cas.state.gov/managingforresults
After reviewing the case example below, click here to use the Program Assumptions Tool.
While developing the logic model, Andre and his team will also develop the program assumptions. In doing so, he will articulate the external factors that either must be in place for the program to be a success or over which the program implementers have no control.
Upon completion of the logic model and program assumptions, Andre and his team will write the theory of change. The theory of change will explain why they believe an awareness campaign and capacity building program will address the problem determined in Step 3.1: Due to increasing frequency and severity of flooding and earthquake at Embassy Capital City, personnel are at risk for loss of life and injury and the embassy compound is at risk for damage and destruction. However, personnel do not have the knowledge, practice or supplies to respond to these hazards and the embassy compound is not designed to sustain floods or earthquakes.
Figure 58. Case Example 2, Program Assumptions and Theory of Change Information

Appendix E: Case Example 2 – Embassy Disaster Preparedness
E - 30
Program Design and Performance Management Toolkit Appendix E: Case Example 2 – Natural Disaster Mitigation cas.state.gov/managingforresults
CASE EXAMPLE 22 Program Assumptions
Assumptions Assumptions Assumptions Assumptions
Transdonian government will support preparedness and evacuation planning.
$1.5 million will be made available to support training and embassy compound improvements.
Personnel will be able to focus adequately to retain training content.
Structural and compound improvements will be completed in specified manner.
Personnel will follow training and evacuation procedures.
Structural and compound improvements will provide adequate protection from flood and earthquake.
Training and evacuation will adequately protect personnel.
Structural and compound improvements will adequately protect embassy.
Figure 59. Case Example 2, Program Assumptions
Inputs Activities Outputs Short-Term Outcomes
Long-Term Outcomes
Section 4: Manage Performance
4

Appendix E: Case Example 2 – Embassy Disaster Preparedness
E - 32
Program Design and Performance Management Toolkit Appendix E: Case Example 2 – Natural Disaster Mitigation cas.state.gov/managingforresults
Attribution Contribution
Example: Number of personnel who received disaster preparedness training.
Example: Number of people who survive flood or earthquake hazard unharmed.
Explanation: This is directly attributable to the program because without training embassy personnel would not know how to follow disaster preparedness plan. There is a direct link between the program and the result
Explanation: The program is contributing to the decrease in vulnerability to flood and earthquake hazard. As people are prepared and buildings improved the likelihood of harm and damage decreases. But this link is indirect and there may be other factors that influence safety that this program has no control over.
Figure 60. Case Example 2, Attribution vs. Contribution
Strong Indicator Weak Indicator
Example: Embassy compound has had flood and earthquake hazard mitigation measures implemented.
Example: Embassy is fixed and resilient to floods and earthquakes.
Explanation: This indicator is strong because it is easily defined and measured. It is unambiguous and useful to program implementers. The indicator closely measures the result it is intended to measure and the result is attributable to the program activities.
This is a weak indicator because (1) ‘fixed’ and ‘resilient’ are not clearly defined and (2) the indicator is multidimensional.
Figure 61. Case Example 2, Strong vs. Weak Indicators
Appendix E: Case Example 2 – Embassy Disaster Preparedness
E - 33
Program Design and Performance Management Toolkit Appendix E: Case Example 2 – Natural Disaster Mitigation cas.state.gov/managingforresults
After reviewing the example below, click here for the OPUDATA tool.
As Andre’s team developed the indicators, they used the OPUDATA Tool as seen Table 33 to be sure the indicators developed are objective, practical, useful, direct, attributable, timely and achievable. Andre’s team will check each indicator and revise each to be sure they meet these standards. After the indicators are developed, the team will move on to the Indicator Reference Sheets in Table 34.
Figure 62. Case Example 2, OPUDATA Information

Appendix E: Case Example 2 – Embassy Disaster Preparedness
E - 34
Program Design and Performance Management Toolkit Appendix E: Case Example 2 – Natural Disaster Mitigation cas.state.gov/managingforresults
CASE EXAMPLE 2 OPUDATA Tool
Indicator: Percent of personnel who are able to respond per plan in case of flood or earthquake hazard.
Characteristic Description Yes or Needs Revision
Objective Performance indicators should be unambiguous about what is being measured. They should be unidimensional, which means they should measure only one aspect at a time. Performance indicators should also be precisely defined in the PMP.
Yes
Needs Revision
Practical Program teams should select performance indicators for which data can be obtained within the cost and time confines of the program.
Yes
Needs Revision
Useful for management
Decision-making needs should be a key factor when selecting performance indicators. Bureaus and offices may want to reference the list of standard foreign assistance indicators to review whether any of these indicators are applicable and useful for measuring progress against the program’s goals and objectives (MfR PPR Page); however, it will be necessary to create program specific indicators as well.
Yes
Needs Revision
Direct Performance indicators should closely track the results they are intended to measure. If a direct indicator cannot be used because of cost or other factors, a proxy indicator (an indirect measure of the result that is related by one or more assumptions) may be used to measure the result.
Yes
Needs Revision
Attribution to program efforts
It is important that performance indicators measure changes that are clearly and reasonably caused by the program’s efforts.
Yes
Needs Revision
Timely Performance indicators should be available when they are needed to make decisions.
Yes
Needs Revision
Adequate Teams should have as many indicators in their PMP as are necessary and cost effective for results management and reporting purposes. In most cases, two or three indicators per result should be sufficient to assess performance.
Yes
Needs Revision
Table 33. Case Example 2, OPUDATA
Appendix E: Case Example 2 – Embassy Disaster Preparedness
E - 35
Program Design and Performance Management Toolkit Appendix E: Case Example 2 – Natural Disaster Mitigation cas.state.gov/managingforresults
After reviewing the example below, click here for the Indicator Reference Sheet Tool.
After developing the indicators, Andre’s team completed Indicator Reference Sheets for each indicator they will track throughout program implementation. Indicator reference sheets are a critical part of the performance monitoring plan as they define the indicator, explain how data will be collected and articulate the use of the information and why this particular indicator is important. Additionally, Andre will then use this information to develop his Monitoring Plan and Indicator Tracking Table.
Figure 63. Case Example 2, Indicator Reference Sheet Information
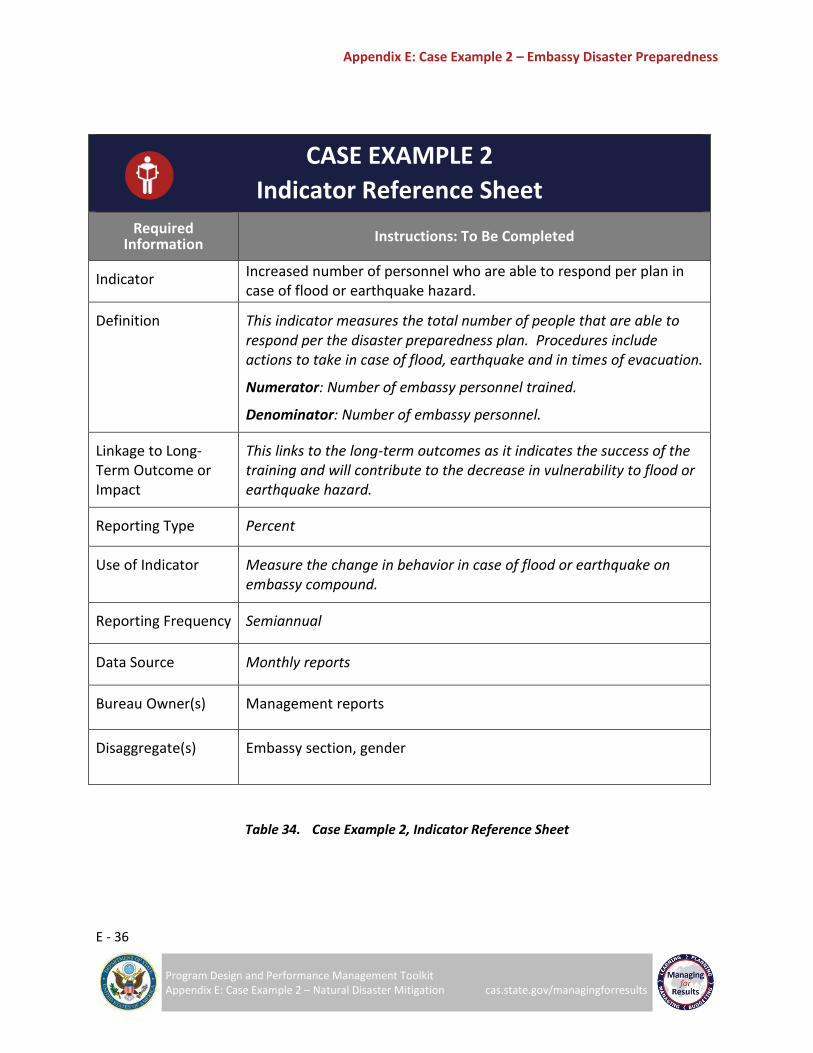
Appendix E: Case Example 2 – Embassy Disaster Preparedness
E - 36
Program Design and Performance Management Toolkit Appendix E: Case Example 2 – Natural Disaster Mitigation cas.state.gov/managingforresults
Table 34. Case Example 2, Indicator Reference Sheet
CASE EXAMPLE 2
Indicator Reference Sheet
Required Information Instructions: To Be Completed
Indicator Increased number of personnel who are able to respond per plan in case of flood or earthquake hazard.
Definition This indicator measures the total number of people that are able to respond per the disaster preparedness plan. Procedures include actions to take in case of flood, earthquake and in times of evacuation.
Numerator: Number of embassy personnel trained.
Denominator: Number of embassy personnel.
Linkage to Long-Term Outcome or Impact
This links to the long-term outcomes as it indicates the success of the training and will contribute to the decrease in vulnerability to flood or earthquake hazard.
Reporting Type Percent
Use of Indicator Measure the change in behavior in case of flood or earthquake on embassy compound.
Reporting Frequency Semiannual
Data Source Monthly reports
Bureau Owner(s) Management reports
Disaggregate(s) Embassy section, gender

Appendix E: Case Example 2 – Embassy Disaster Preparedness
E - 37
Program Design and Performance Management Toolkit Appendix E: Case Example 2 – Natural Disaster Mitigation cas.state.gov/managingforresults
Click here to view the Monitoring Plan and Indicator Tracking Table.
Andre’s ream used the Indicator Reference Sheets to complete the Monitoring Plan and Indicator Tracking Table. They will use this table throughout the implementation of the program to track progress towards their targets. The completed Monitoring Plan and Indicator Tracking Table can be seen in Table 35.
Figure 64. Case Example, Monitoring Plan and Indicator Tracking Table
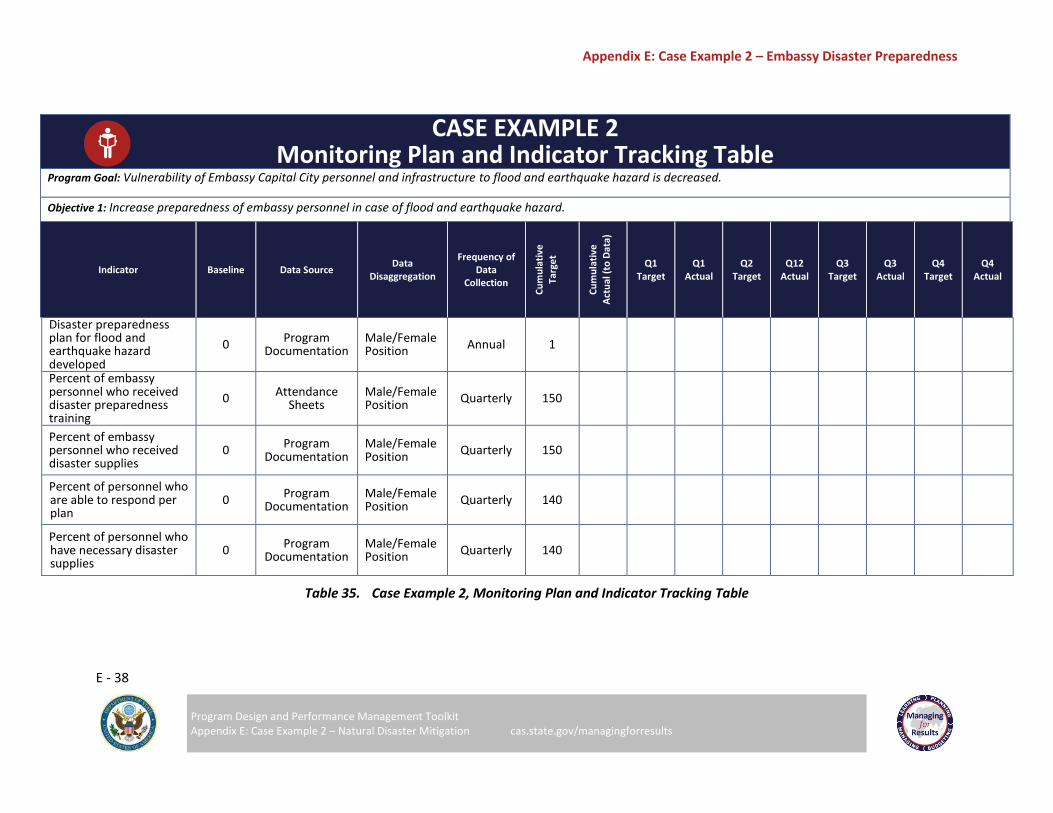
Appendix E: Case Example 2 – Embassy Disaster Preparedness
E - 38
Program Design and Performance Management Toolkit Appendix E: Case Example 2 – Natural Disaster Mitigation cas.state.gov/managingforresults
CASE EXAMPLE 2 Monitoring Plan and Indicator Tracking Table
Program Goal: Vulnerability of Embassy Capital City personnel and infrastructure to flood and earthquake hazard is decreased.
Objective 1: Increase preparedness of embassy personnel in case of flood and earthquake hazard.
Indicator Baseline Data Source Data
Disaggregation
Frequency of Data
Collection
Cu
mu
lati
ve
Targ
et
Cu
mu
lati
ve
Act
ual
(to
Dat
a)
Q1 Target
Q1 Actual
Q2 Target
Q12 Actual
Q3 Target
Q3 Actual
Q4 Target
Q4 Actual
Disaster preparedness plan for flood and earthquake hazard developed
0 Program
Documentation Male/Female Position Annual 1
Percent of embassy personnel who received disaster preparedness training
0 Attendance Sheets
Male/Female Position
Quarterly 150
Percent of embassy personnel who received disaster supplies
0 Program
Documentation Male/Female Position
Quarterly 150
Percent of personnel who are able to respond per plan
0 Program
Documentation Male/Female Position Quarterly 140
Percent of personnel who have necessary disaster supplies
0 Program
Documentation Male/Female Position Quarterly 140
Table 35. Case Example 2, Monitoring Plan and Indicator Tracking Table
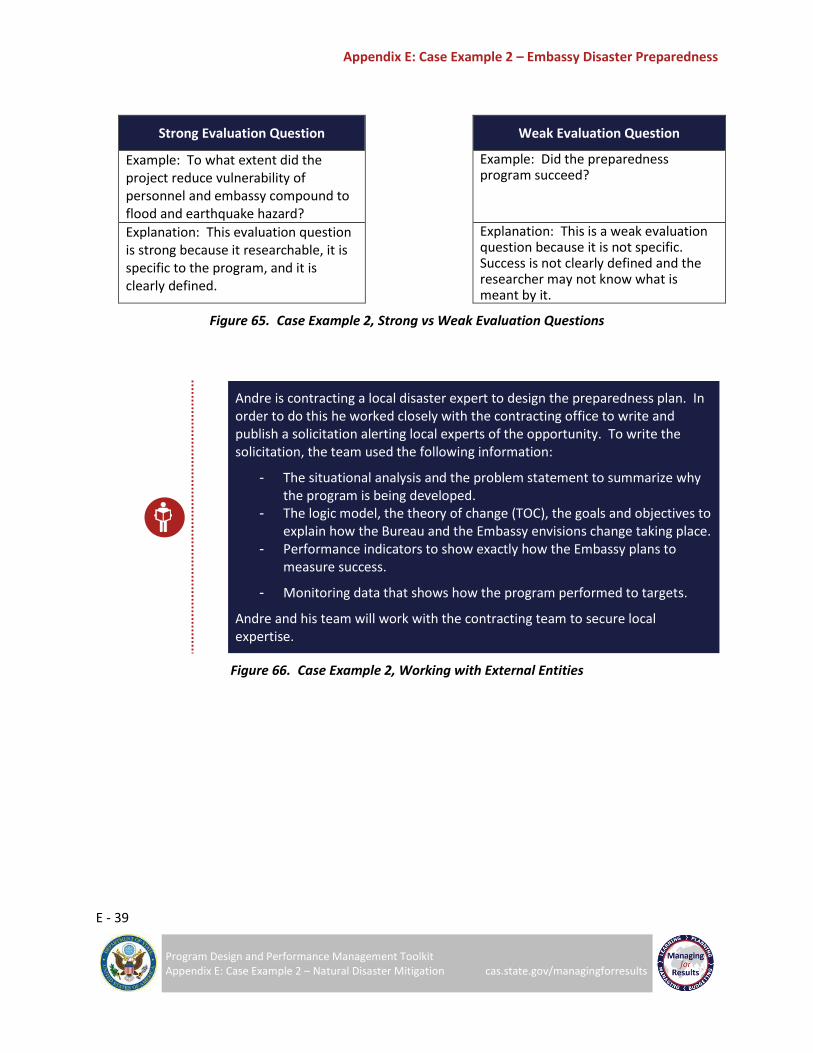
Appendix E: Case Example 2 – Embassy Disaster Preparedness
E - 39
Program Design and Performance Management Toolkit Appendix E: Case Example 2 – Natural Disaster Mitigation cas.state.gov/managingforresults
Strong Evaluation Question
Weak Evaluation Question
Example: To what extent did the project reduce vulnerability of personnel and embassy compound to flood and earthquake hazard?
Example: Did the preparedness program succeed?
Explanation: This evaluation question is strong because it researchable, it is specific to the program, and it is clearly defined.
Explanation: This is a weak evaluation question because it is not specific. Success is not clearly defined and the researcher may not know what is meant by it.
Figure 65. Case Example 2, Strong vs Weak Evaluation Questions
Andre is contracting a local disaster expert to design the preparedness plan. In order to do this he worked closely with the contracting office to write and publish a solicitation alerting local experts of the opportunity. To write the solicitation, the team used the following information:
- The situational analysis and the problem statement to summarize why the program is being developed.
- The logic model, the theory of change (TOC), the goals and objectives to explain how the Bureau and the Embassy envisions change taking place.
- Performance indicators to show exactly how the Embassy plans to measure success.
- Monitoring data that shows how the program performed to targets.
Andre and his team will work with the contracting team to secure local expertise.
Figure 66. Case Example 2, Working with External Entities

Section 5: Analyze, Learn, Act
5
Appendix E: Case Example 2 – Embassy Disaster Preparedness
E - 41
Program Design and Performance Management Toolkit Appendix E: Case Example 2 – Natural Disaster Mitigation cas.state.gov/managingforresults
After reviewing the example below, click here for the Data Quality Assessment Checklists.
The program just completed its first quarter of implementation. Andre’s team collected the first quarter data using the Monitoring Plan and Indicator Tracking Table. With this report, the Embassy in Transdonia completed the Data Quality Assessments (DQAs) to ensure the data are valid, precise, reliable, timely, and have integrity. The team will complete the DQAs the first time data is reported and periodically throughout program implementation to ensure data collected maintains these five characteristics. An example of a completed DQA can be seen in Table 36.
Figure 67. Case Example 2, Data Quality Assessment

Appendix E: Case Example 2 – Embassy Disaster Preparedness
E - 42
Program Design and Performance Management Toolkit Appendix E: Case Example 2 – Natural Disaster Mitigation cas.state.gov/managingforresults
CASE EXAMPLE 2 Data Quality Assessment Checklist
Office, Bureau, or Post Name: Embassy Capital City
Title of Performance Indicator: Increased number of personnel who are able to respond per plan in case of flood or earthquake hazard.
Result This Indicator Measures (i.e., Specify the Development Objective, Intermediate Result, or Project Purpose, etc.): Output to measure if short term outcomes are realized
Data Source(s):Program documentation
Partner or Contractor Who Provided the Data: Embassy Capital City
Period for Which the Data Are Being Reported: First Quarter
Is This Indicator a Standard or Custom Indicator?
____ Standard Foreign Assistance Indicator Custom (created by the program; not standard)
Data Quality Assessment methodology: Reviewed data collection procedures and documentation Interviewed those responsible for data information
Date(s) of Assessment: --/--/--
Assessment Team Members: Andre– Program Officer, Embassy Transdonia; Mika, Contracted Consultant
Verification of DQA Team Leader Officer approval X______________________________________
YES NO COMMENTS
VALIDITY – Data should clearly and adequately represent the intended result.
1 Does the information collected measure what it is supposed to measure?
2 Do results collected fall within a plausible range?
3 Is there reasonable assurance that the data collection methods being used do not produce systematically biased data (e.g. consistently over- or under-counting)?
4 Are sound research methods being used to collect the data?
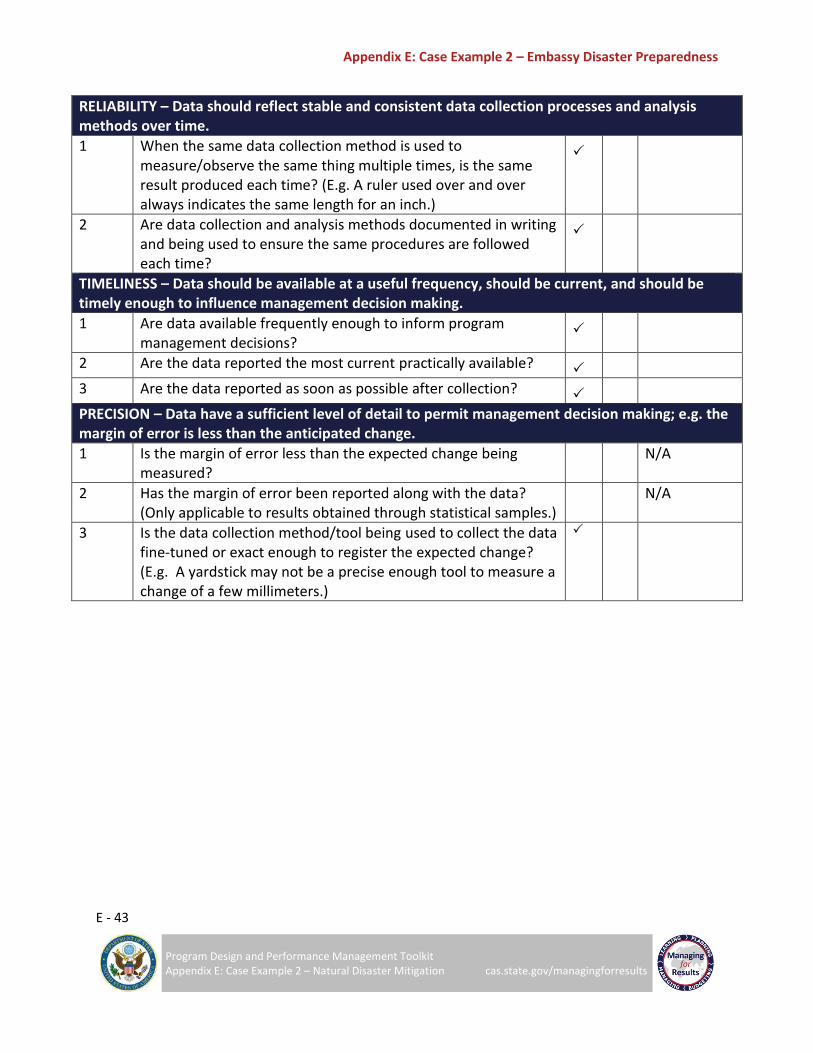
Appendix E: Case Example 2 – Embassy Disaster Preparedness
E - 43
Program Design and Performance Management Toolkit Appendix E: Case Example 2 – Natural Disaster Mitigation cas.state.gov/managingforresults
RELIABILITY – Data should reflect stable and consistent data collection processes and analysis methods over time.
1 When the same data collection method is used to measure/observe the same thing multiple times, is the same result produced each time? (E.g. A ruler used over and over always indicates the same length for an inch.)
2 Are data collection and analysis methods documented in writing and being used to ensure the same procedures are followed each time?
TIMELINESS – Data should be available at a useful frequency, should be current, and should be timely enough to influence management decision making.
1 Are data available frequently enough to inform program management decisions?
2 Are the data reported the most current practically available?
3 Are the data reported as soon as possible after collection?
PRECISION – Data have a sufficient level of detail to permit management decision making; e.g. the margin of error is less than the anticipated change.
1 Is the margin of error less than the expected change being measured?
N/A
2 Has the margin of error been reported along with the data? (Only applicable to results obtained through statistical samples.)
N/A
3 Is the data collection method/tool being used to collect the data fine-tuned or exact enough to register the expected change? (E.g. A yardstick may not be a precise enough tool to measure a change of a few millimeters.)
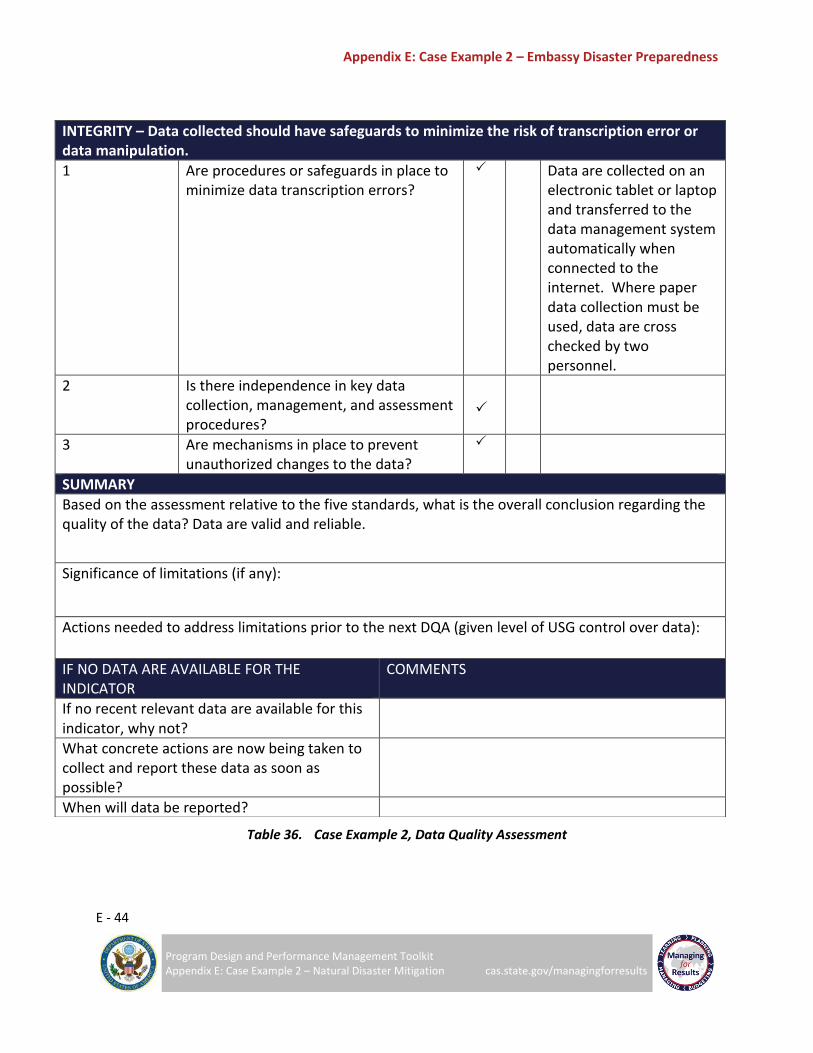
Appendix E: Case Example 2 – Embassy Disaster Preparedness
E - 44
Program Design and Performance Management Toolkit Appendix E: Case Example 2 – Natural Disaster Mitigation cas.state.gov/managingforresults
Table 36. Case Example 2, Data Quality Assessment
INTEGRITY – Data collected should have safeguards to minimize the risk of transcription error or data manipulation.
1 Are procedures or safeguards in place to minimize data transcription errors?
Data are collected on an electronic tablet or laptop and transferred to the data management system automatically when connected to the internet. Where paper data collection must be used, data are cross checked by two personnel.
2 Is there independence in key data collection, management, and assessment procedures?
3 Are mechanisms in place to prevent unauthorized changes to the data?
SUMMARY
Based on the assessment relative to the five standards, what is the overall conclusion regarding the quality of the data? Data are valid and reliable.
Significance of limitations (if any):
Actions needed to address limitations prior to the next DQA (given level of USG control over data):
IF NO DATA ARE AVAILABLE FOR THE INDICATOR
COMMENTS
If no recent relevant data are available for this indicator, why not?
What concrete actions are now being taken to collect and report these data as soon as possible?
When will data be reported?
Appendix E: Case Example 2 – Embassy Disaster Preparedness
E - 45
Program Design and Performance Management Toolkit Appendix E: Case Example 2 – Natural Disaster Mitigation cas.state.gov/managingforresults
After reviewing the example below, click here for the Strategic Progress Review Framework and here for the Action Item Follow-Up Tracker.
With the first quarter data submitted, Andre and his team will analyze the data. His team will assemble all stakeholders to meet and assess the information collected and discuss relevant topics that are of greatest use for decision-makers at the time – such as questions about the overall progress of a strategic objective, questions of overall implementation, performance of a particular activity, questions of interagency coordination, etc. His team will use the Strategic Progress Review Framework to record topics of discussion and the Action Item Follow-Up Tracker to assign point of contact for each action item as a way to track progress of each one. An example of the Strategic Progress Review Framework can be found in Table 37 and the Action Item Follow-Up Tracker can be found in Table 38.
Figure 68. Case Example 2, Strategic Progress Review Framework and Action Item Follow-Up Tracker Information
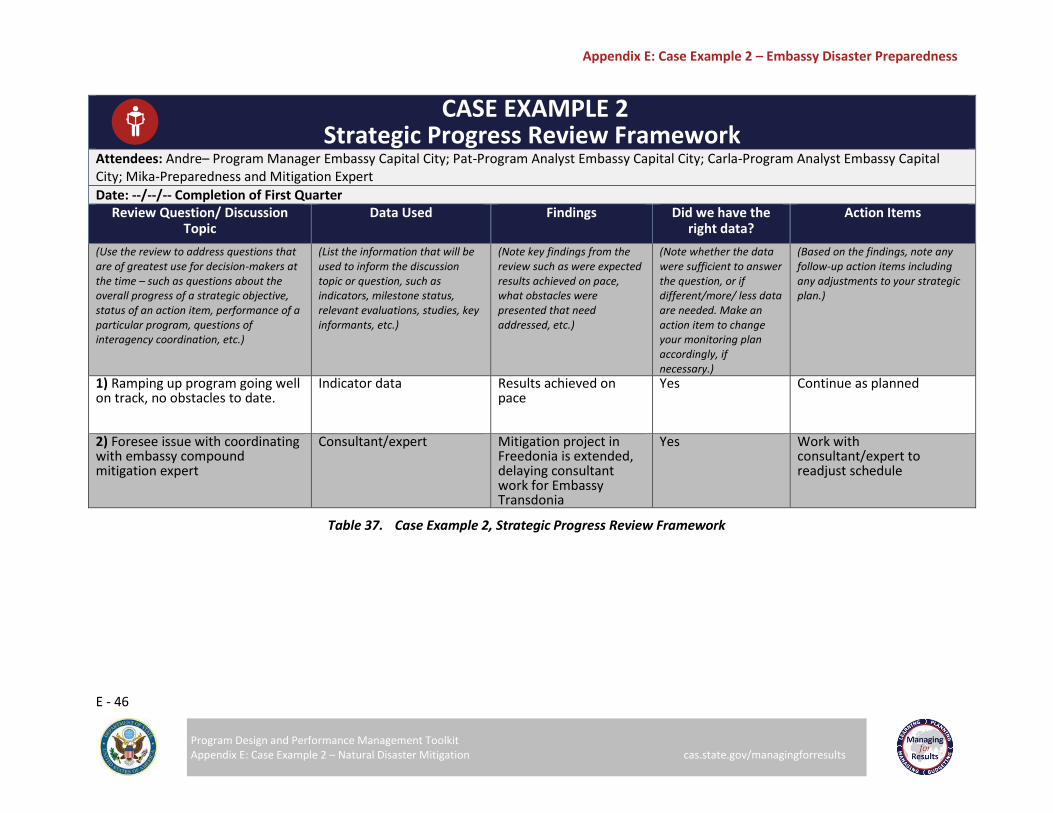
Appendix E: Case Example 2 – Embassy Disaster Preparedness
E - 46
Program Design and Performance Management Toolkit Appendix E: Case Example 2 – Natural Disaster Mitigation cas.state.gov/managingforresults
CASE EXAMPLE 2 Strategic Progress Review Framework
Attendees: Andre– Program Manager Embassy Capital City; Pat-Program Analyst Embassy Capital City; Carla-Program Analyst Embassy Capital City; Mika-Preparedness and Mitigation Expert
Date: --/--/-- Completion of First Quarter Review Question/ Discussion
Topic Data Used
Findings
Did we have the
right data? Action Items
(Use the review to address questions that are of greatest use for decision-makers at the time – such as questions about the overall progress of a strategic objective, status of an action item, performance of a particular program, questions of interagency coordination, etc.)
(List the information that will be used to inform the discussion topic or question, such as indicators, milestone status, relevant evaluations, studies, key informants, etc.)
(Note key findings from the review such as were expected results achieved on pace, what obstacles were presented that need addressed, etc.)
(Note whether the data were sufficient to answer the question, or if different/more/ less data are needed. Make an action item to change your monitoring plan accordingly, if necessary.)
(Based on the findings, note any follow-up action items including any adjustments to your strategic plan.)
1) Ramping up program going well on track, no obstacles to date.
Indicator data Results achieved on pace
Yes Continue as planned
2) Foresee issue with coordinating with embassy compound mitigation expert
Consultant/expert Mitigation project in Freedonia is extended, delaying consultant work for Embassy Transdonia
Yes Work with consultant/expert to readjust schedule
Table 37. Case Example 2, Strategic Progress Review Framework

Appendix E: Case Example 2 – Embassy Disaster Preparedness
E - 47
Program Design and Performance Management Toolkit Appendix E: Case Example 2 – Natural Disaster Mitigation cas.state.gov/managingforresults
CASE EXAMPLE 2 Action Item Follow-Up Tracker
Action Item Action Item POC
Due Date Progress Update
(List any items from your review framework)
(List at least one POC assigned to implementing the action item)
(Date by when the action item should be implemented)
(Note any progress in implementing action item)
1)Set up meeting with embassy compound mitigation consultant/expert
Andre Within one week
2)Update project plan and senior management team
Andre Within one week
3)
4)
5)
Table 38. Case Example 2, Action Item Follow-Up Tracker
Appendix E: Case Example 2 – Embassy Disaster Preparedness
E - 48
Program Design and Performance Management Toolkit Appendix E: Case Example 2 – Natural Disaster Mitigation cas.state.gov/managingforresults
After reviewing the example below, click here for the Work Breakdown Structure (WBS) Tool.
To develop the individual projects that will fall under the embassy disaster preparedness program, the Management Office will use the WBS Tool to organize the work of each project into manageable sections and assign those sections to personnel. This will help manage each project that makes up the program and the overall implementation of the program.
Figure 69. Case Example 2, Work Breakdown Structure Information
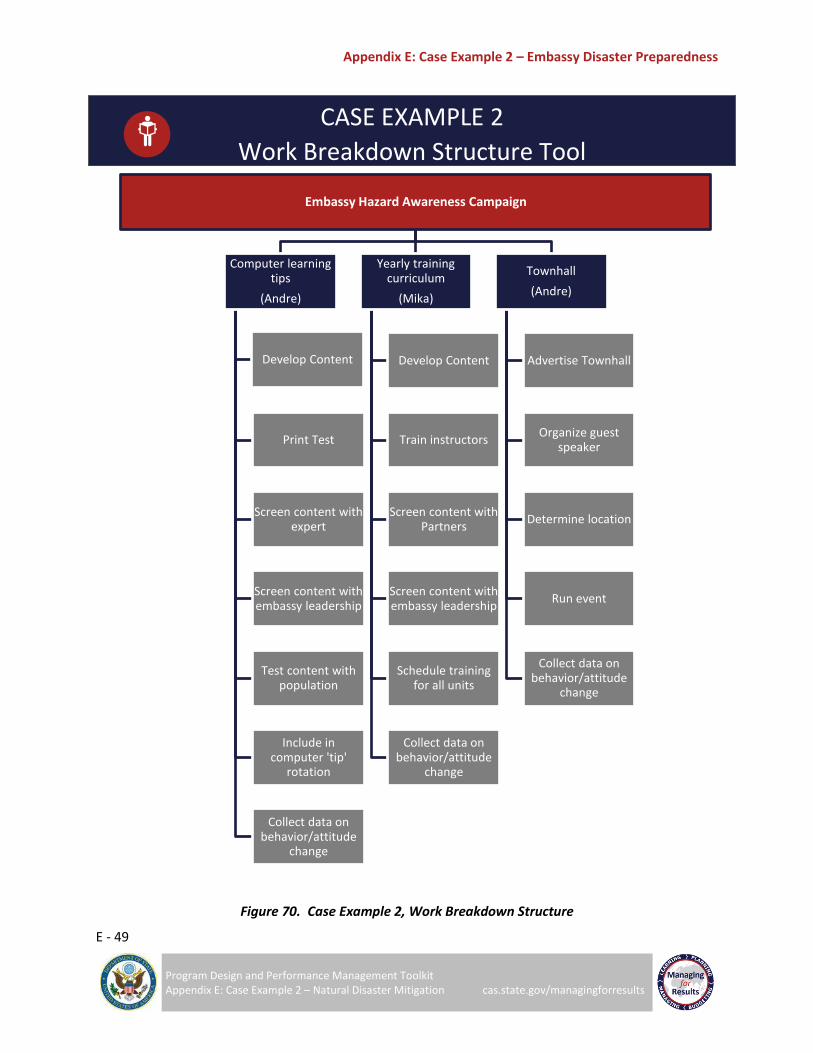
Appendix E: Case Example 2 – Embassy Disaster Preparedness
E - 49
Program Design and Performance Management Toolkit Appendix E: Case Example 2 – Natural Disaster Mitigation cas.state.gov/managingforresults
CASE EXAMPLE 2
Work Breakdown Structure Tool
Figure 70. Case Example 2, Work Breakdown Structure
Embassy Hazard Awareness Campaign
Computer learning tips
(Andre)
Develop Content
Print Test
Screen content with expert
Screen content with embassy leadership
Test content with population
Include in computer 'tip'
rotation
Collect data on behavior/attitude
change
Yearly training curriculum
(Mika)
Develop Content
Train instructors
Screen content with Partners
Screen content with embassy leadership
Schedule training for all units
Collect data on behavior/attitude
change
Townhall
(Andre)
Advertise Townhall
Organize guest speaker
Determine location
Run event
Collect data on behavior/attitude
change
APPENDIX F: KEY TERMS
The key terms below are frequently used when discussing strategic planning, program design and performance management. Although not an exhaustive list these terms are relevant in designing and implementing projects, programs, and processes. Become familiar with these terms as you design your program.
Term Definition
Activity A specific action undertaken over a specific period of time through which inputs are mobilized to produce specific outputs. An activity can be a sub-component of a program, project, or process.
Assumption
A fact or condition that is accepted as true. For performance management, assumptions are beliefs about the context in which a program, project, or process in undertaken. For example, “The country’s government will remain stable,” or “The supply of electricity will be consistent.”
Attribution
Ascribing a causal link between observed changes and specific programs, projects, or processes taking into account the effects of other programs, projects, or processes and possible confounding factors. The extent to which the observed change in outcome is the result of the programs, projects, or processes having allowed for all other factors which may also affect the outcome(s) of interest.
Baseline The data that are collected before or at the start of a program, project, or process and provide a basis for planning and/or assessing subsequent progress and impact.
Beneficiaries The individuals, groups, or organizations that benefit from a project, program, or process.
Context Indicators Indicators that do not directly measure the outcomes of a program, but rather factors that are beyond the control of the program management/implementers, such as country GDP or which political party is in power.
Contribution The extent to which changes can be ascribed to a variety of programs or projects or stakeholders.
Data Cleaning The process of reviewing data that has been collected to ensure its integrity before analysis.
Disaggregation The breakdown of data by subgroup, e.g., men and women, urban dwellers and rural dwellers.
Evaluation
The systematic collection and analysis of information about the characteristics and outcomes of programs, projects, and processes as a basis for judgements, improving effectiveness, and informing decisions about current and future programs, projects, and processes. Evaluation is distinct from assessment, which may be designed to examine country or sector context to inform project design.

Appendix F: Key Terms
F - 3
Program Design and Performance Management Toolkit Appendix F: Key Terms cas.state.gov/managingforresults
Terms Definition
External Assessment
A situational analysis that surveys the environmental surroundings where the program will take place to understand potential opportunities and threats.
Gender
A social construct that refers to relations between and among the sexes, based on their relative roles. Gender encompasses the economic, political, and socio-cultural attributes, constraints, and opportunities associated with being male or female. It varies across cultures, is dynamic and open to change over time. Because of the variation in gender across cultures and over time, gender roles should not be assumed but investigated. Note that gender is not interchangeable with women or sex.
Gender Integration/ Mainstreaming
The identification and treatment of gender differences and inequalities when designing and implementing programs. Gender integration seeks to promote gender equality and improve policy and programming outcomes. Please note that the Department of State uses gender integration and mainstreaming synonymously. Involves identifying and then addressing gender differences during strategic planning, project design, implementation, and monitoring and evaluation
Gender Planning Developing programs and projects while taking into account how those projects and programs may impact women, men, boys, and girls.
Gender Policy A course of action adopted by a government entity, private or public organization intended to promote gender equality within an organization, community, or society.
Gender Programming
An operationalized commitment to gender equality. This process involves developing and implementing specific goals and objectives, measures, and activities to promote gender equality.
Goal The highest-order outcome or end state to which a program, project, process or policy is intended to contribute.
Impact A result or effect that is caused by or attributable to a program, project, process, or policy. Impact is often used to refer to higher-level effects that occur in the medium or long term, and can be intended or unintended and positive or negative.
Indicator A particular characteristic or dimension used to measure intended changes. Performance indicators are used to observe progress and to measure actual results compared to expected results.
Input Resources provided for program implementation. Examples are money, staff, time facilities, equipment, etc.
Internal Assessment
A situational analysis that allows you to understand the capabilities within your own office, bureau, or post such as financial resources, time, and human capital resources of your office, bureau, or post prior to designing a program to ensure it is within your capabilities and capacity.

Appendix F: Key Terms
F - 4
Program Design and Performance Management Toolkit Appendix F: Key Terms cas.state.gov/managingforresults
Terms Definitions
Intervention An activity, project, or program.
Lessons Learned
Generalizations based on evaluation findings that abstract from the specific circumstances to broader situations. Frequently, lessons highlight strengths or weakness in preparation, design and implementation that affect performance, outcome and impact.
Logic Model
A rigorous methodology used for program or project design that focuses on the causal linkages between project inputs, activities, outputs, short-term outcomes, and long-term outcomes. It is a visual representation that shows the sequence of related events connecting a planned program’s objectives with its desired outcomes.
Monitoring An ongoing system of gathering information and tracking performance to assess progress against established goals and objectives.
Monitoring Plan A plan that uses the information mapped out in the logic model and in the indicator reference sheets to clearly summarize how to measure results.
Objective A statement of the condition or state one expects to achieve toward accomplishing a program, project, or process goal.
Outcome The result or effect that is caused by or attributable to the project, program or policy of the program activities. Outcomes may be short-term or long-term, intended or unintended, positive or negative, direct or indirect.
Outcome Indicator An indicator that focuses on change and is a measure of the extent to which a program objective is being achieved.
Output A short-term, immediate result of a program, project, or process that leads to longer-term outcomes. Outputs are the products, goods, and services which result from activities.
Output Indicator A measure of the direct results of the program activities. They do not measure change; they answer the question, “What is the immediate product of the activity?”
Performance Management
The systematic process of collecting, analyzing and using performance monitoring data and evaluations to track progress, influence decision making, and improve results.
Performance Management Plan
A tool to plan and manage the process of monitoring, evaluating, and analyzing progress toward achieving results identified in a logic model in order to inform decision-making, resource allocation, learning, and adapting projects and programs.
Problem Statement
A clear description of the issue or challenge the program seeks to address.
Process A systematic series of actions or steps taken to achieve a particular end.
Appendix F: Key Terms
F - 5
Program Design and Performance Management Toolkit Appendix F: Key Terms cas.state.gov/managingforresults
Terms Definitions
Program A set of activities, processes, or projects aimed at achieving a goal or objective that are typically implemented by several parties over a specified period of time and may cut across sectors, themes, and/or geographic areas.
Program Design The process of planning, analyzing the context, identifying root causes of the issues to be addressed, and constructing a theory of why a proposed program, project, or process will work.
Program Summary
A comprehensive document that encompasses all program information used for program design, implementation, monitoring, evaluation learning, knowledge sharing, and accountability.
Project A set of activities intended to achieve a defined product, service, or result within specified resources and implementation schedules. A set of projects makes up the portfolio of a program.
Review of the Issue or Problem
A close examination of the problem you would like to solve that takes into account the larger context, the stakeholders involved, and an understanding of the problem’s root causes.
Root Cause Analysis
A closer look at the source of the problem(s) or issue(s) your program will address.
Target The specified result(s), often expressed by a value of an indicator(s), that project, program or policy is intended to achieve within an explicit timeframe with a given level of resources.
Theory of Change A brief statement that ties your logic model together by summarizing why, based on available evidence and consideration of other possible paths, the particular changes described in your logic model are expected to occur.
Qualitative Data Virtually any information that can be captured that is not numerical in nature, such as observations, narratives, and images.
Quantitative Data Information that can be expressed in numerical terms, counted or compared on a scale.
Reliability Consistency or dependability of data with reference to the quality of the instruments, procedures, and used. Data are reliable when the repeated use of the same instrument generates the same result.
Validity The extent to which an indicator measures what it purports to measure.
Appendix G: Works Cited
G - 1
Program Design and Performance Management Toolkit Appendix G: Works Cited cas.state.gov/managingforresults
APPENDIX G: WORKS CITED
Section 1: Align Programs to Advance Existing Strategies
Managing for Results - Strategic Planning:
http://cas.state.gov/managingforresults/planning/
Divider page images:
https://www.flickr.com/photos/usembassydakar/22793712110/in/album-72157660373201347/
https://www.flickr.com/photos/embaixadaeua-brasil/14418404769/in/album-72157645167531169/
http://modernizeaid.net/2010/01/high-level-haiti-commentary-touches-on-foreign-assistance-reform-
themes/
Section 2: Conduct a Situational Analysis
Conducting a Comprehensive Situational Analysis: http://www.thesustainablengo.org/general-
management-skills/conducting-an-organizational-situation-analysis
Divider page images:
https://www.flickr.com/photos/usembassylondon/26404111460/
http://gppreview.com/2013/06/19/usaids-water-strategy-makes-a-splash-for-us-foreign-assistance/
https://www.flickr.com/photos/statephotos/
Section 3: Design a Program
Isabel Vogel for the UK Department of International Development Review of the use of ‘Theory of
Change’ in international development:
https://assets.publishing.service.gov.uk/media/57a08a5ded915d3cfd00071a/DFID_ToC_Review_VogelV
7.pdf
Divider page images:
https://www.flickr.com/photos/61972246@N08/17178623282/
https://www.flickr.com/photos/embaixadaeua-brasil/15487224195/in/album-72157648562048202/
https://www.flickr.com/photos/achanoi/28336435290/
Section 4: Performance Management
Standard foreign assistance indicators can be found at
http://cas.state.gov/managingforresults/learning/ppr/
Appendix G: Works Cited
G - 2
Program Design and Performance Management Toolkit Appendix G: Works Cited cas.state.gov/managingforresults
Department of State Evaluation Resources: http://cas.state.gov/evaluation/files/2014/05/2016-
Evaluation-Guidance.pdf
ADS Chapter 203 Assessing and Learning:
https://www.usaid.gov/sites/default/files/documents/1870/203.pdf
State Department Evaluation Policy: http://cas.state.gov/evaluation/evaluation-policy-and-guidance/ Community Toolbox: http://ctb.ku.edu/en/table-of-contents/evaluate/evaluate-community-interventions/choose-evaluation-questions/main
Divider page images:
https://uk.usembassy.gov/wp-content/uploads/sites/16/2016/01/NewUSEmbassyRender02.jpg
https://www.flickr.com/photos/61972246@N08/25259349685/
https://www.flickr.com/photos/usembassyphnompenh/
Section 5: Analyze, Learn, Act
USAID Learning Lab, PMP Toolkit: http://usaidlearninglab.org/sites/default/files/resource/files/36pmp_toolkit_complete_final_14_aug_2014.pdf USAID Learning Lab, Data Quality Assessment Checklist https://usaidlearninglab.org/sites/default/files/resource/files/4-data_quality_assessment_checklist.pdf Divider page images:
https://www.flickr.com/photos/embaixadaeua-brasil/14418404769/in/album-72157645167531169/
https://www.flickr.com/photos/usembassylondon/26864986411/
http://redirect.state.sbu/?url=https://www.flickr.com/photos/stateprm/8718387504/
Appendix A: Design a Project
Project Management Institute’s “What is Project Management?”http://www.pmi.org/About-Us/About-Us-What-is-Project-Management.aspx Work Breakdown Structure: http://www.workbreakdownstructure.com/
Work Breakdown Structure According to PMBOK: http://www.workbreakdownstructure.com/work-breakdown-structure-according-to-pmbok.php

Appendix G: Works Cited
G - 3
Program Design and Performance Management Toolkit Appendix G: Works Cited cas.state.gov/managingforresults
Divider page images:
https://www.flickr.com/photos/usembassylondon/28166436402/
https://www.flickr.com/photos/usembassycanberra/3692333515/in/album-72157621019822622/
https://www.flickr.com/photos/61972246@N08/9621978869/