STATE OF THE CITIES 2021
19
NATIONAL LEAGUE OF CITIES STATE OF THE CITIES 2021
-
Upload
khangminh22 -
Category
Documents
-
view
0 -
download
0
Transcript of STATE OF THE CITIES 2021
NATIONALLEAGUEOF CITIES
STATE OF THE CITIES 2021
3
| S
tate
of
the
Cit
ies
2021
TABLE OF CONTENTS
4 Introduction
8 Essential Infrastructure Enables Community Resilience
12 Hard-Hit Budgets Beginning to Stabilize with Federal Funding
16 Reimagining Public Safety a Top Priority for Cities
18 Commercial Decline Hits Smaller Towns Hard
22 Rising Home Values and Decreasing Supply Contribute to Growing Urban-Rural Divide
26 Conclusion
28 Methodology
30 Appendix
About the National League of Cities
The National League of Cities (NLC) is
the voice of America’s cities, towns and
villages, representing more than 200
million people. NLC works to strengthen
local leadership, influence Federal
policy and drive innovative solutions.
NLC’s Center for City Solutions provides
research and analysis on key topics
and trends important to cities, creative
solutions to improve the quality of life in
communities, inspiration and ideas for
local officials to use in tackling tough
issues, and opportunities for city leaders
to connect with peers, share experiences
and learn about innovative approaches
in cities.
Authors
Christiana K. McFarland, PhD, Research
Director, Center for City Solutions
Brooks Rainwater, Senior Executive and
Director, Center for City Solutions
Erica Grabowski, Senior Specialist,
Center for City Solutions
Joshua Pine, Senior Specialist, Center for
City Solutions
Anita Yadavalli, PhD, Program Director,
Center for City Solutions
Acknowledgements
The authors would like to acknowledge
Kaelyn Sheehan, who helped collect the
data and analyze mayoral speeches. The
authors are also grateful to NLC staff for
their contributions to the report.
NATIONALLEAGUEOF CITIES
© 2021 National League of Cities. All Rights Reserved.
54
| S
tate
of
the
Cit
ies
2021
| S
tate
of
the
Cit
ies
2021
INTRODUCTIONthat people and economies have shifted
between and within urban and rural
places, this year’s results are presented
for urban core, suburbs, exurbs and rural
communities to demonstrate varying
impacts where they are evident in
order to best inform policy, funding and
program responses.
Top Mayoral PrioritiesInfrastructure
Budget and Management
Public Safety
Economic and Workforce Development
Housing
Top positive conditions that most supported communities through the pandemic
Home property values
Availability of parks, recreation and green space
Access to clean water
Remote work
Sales tax collections
Top negative conditions that most challenged communities over the past year:
Affordable housing supply
Inactive/vacant commercial developments
Infrastructure funding
Price of rentals/apartments
Total general fund revenue
Our analysis of survey results gauges
how key conditions in cities have
changed over the past year and which
conditions have had the most significant
positive and negative local impacts
through the pandemic. With little
surprise, local economic conditions
worsened for most cities over the
past year, with major challenges
reported for affordable housing supply,
vacant developments, and rental
housing prices. Worsening economic
performance is affecting the housing
market and residents’ ability to secure
affordable housing. In urban cores,
many officials reported increases in
homelessness, as well as demand for
financial assistance, temporary housing,
and nutrition assistance. Unemployment
in urban cores and new business
starts in exurban and rural cities are
among the most frequently reported
as conditions that have had significant
negative local impact over the past year,
underscoring business performance
as a major issue for cities. Overall,
our findings indicate that essential
infrastructure enabled community
resilience during the pandemic, rising
home values and decreasing affordable
supply contributed to a growing urban-
rural divide, and commercial decline hit
smaller communities more drastically
than anticipated.
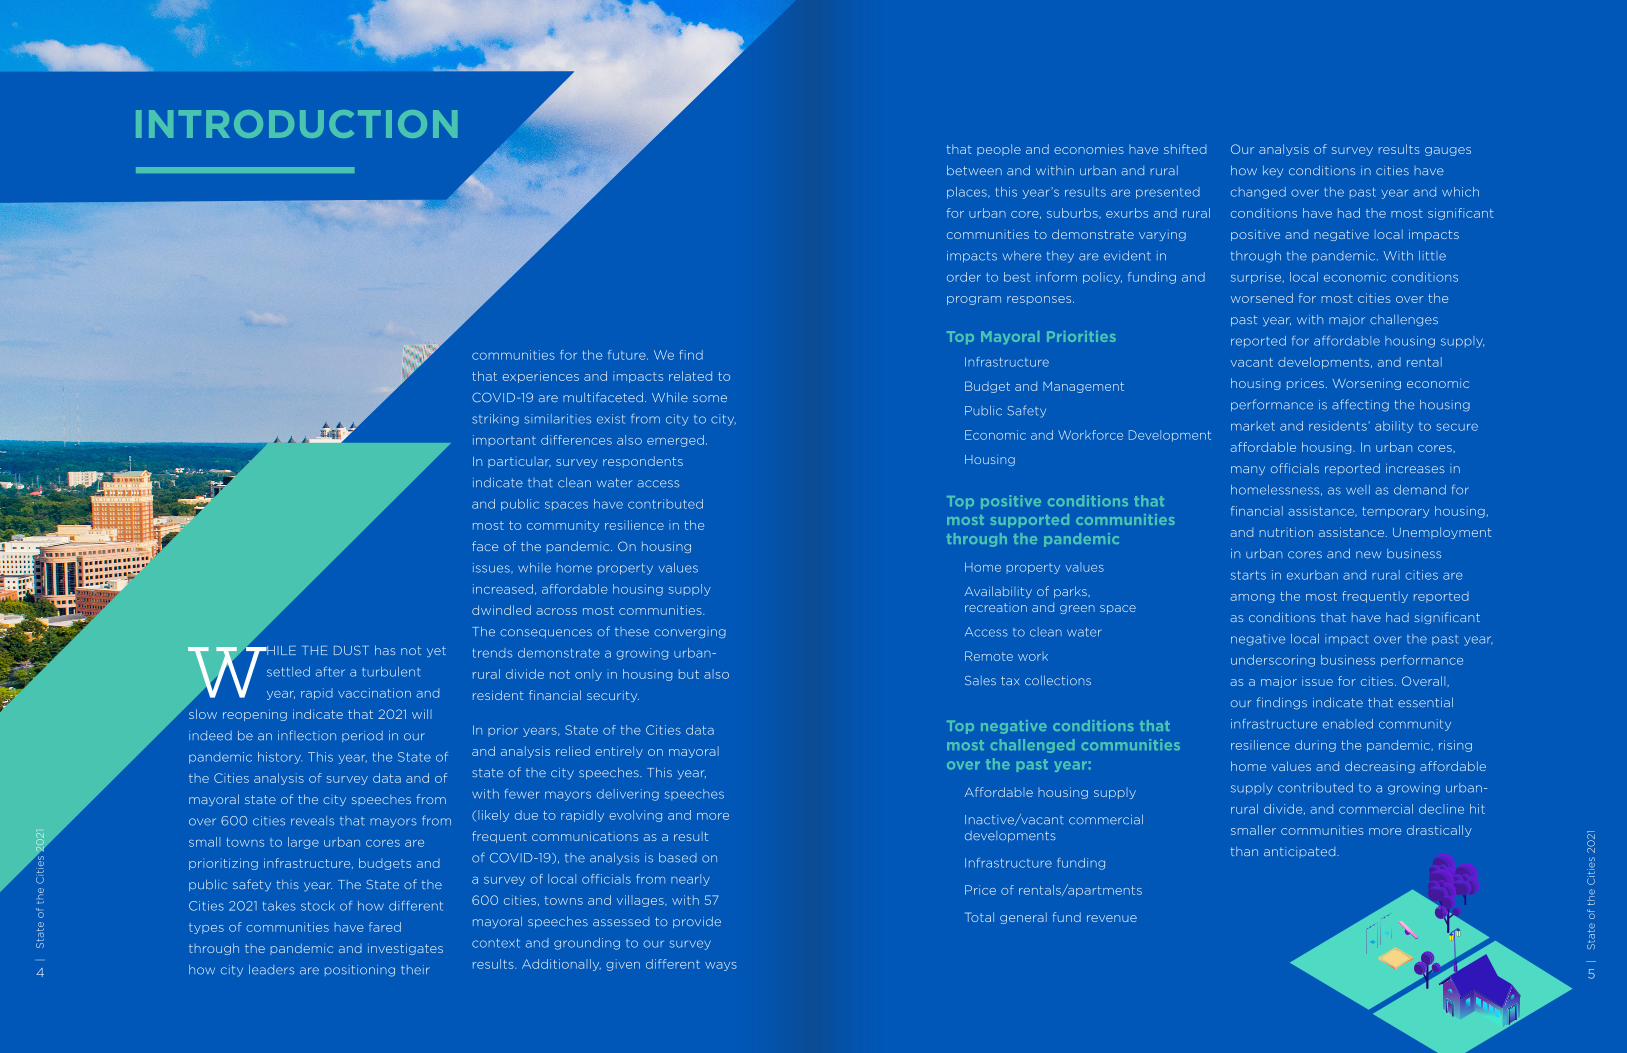
WHILE THE DUST has not yet
settled after a turbulent
year, rapid vaccination and
slow reopening indicate that 2021 will
indeed be an inflection period in our
pandemic history. This year, the State of
the Cities analysis of survey data and of
mayoral state of the city speeches from
over 600 cities reveals that mayors from
small towns to large urban cores are
prioritizing infrastructure, budgets and
public safety this year. The State of the
Cities 2021 takes stock of how different
types of communities have fared
through the pandemic and investigates
how city leaders are positioning their
communities for the future. We find
that experiences and impacts related to
COVID-19 are multifaceted. While some
striking similarities exist from city to city,
important differences also emerged.
In particular, survey respondents
indicate that clean water access
and public spaces have contributed
most to community resilience in the
face of the pandemic. On housing
issues, while home property values
increased, affordable housing supply
dwindled across most communities.
The consequences of these converging
trends demonstrate a growing urban-
rural divide not only in housing but also
resident financial security.
In prior years, State of the Cities data
and analysis relied entirely on mayoral
state of the city speeches. This year,
with fewer mayors delivering speeches
(likely due to rapidly evolving and more
frequent communications as a result
of COVID-19), the analysis is based on
a survey of local officials from nearly
600 cities, towns and villages, with 57
mayoral speeches assessed to provide
context and grounding to our survey
results. Additionally, given different ways
All Urban Suburban Exurban Rural
1
2
3
4
5
6
7
8
9
10
Valor
10
9
8
7
6
4
5
3
2
1
Mayor Priorities
Demographics
Government Data and Technology
Sustainability, Energy, andEnvironment
Health and Human Services
Education
Housing
Economic and WorkforceDevelopment
Public Safety
Budget and Management
Infrastructure
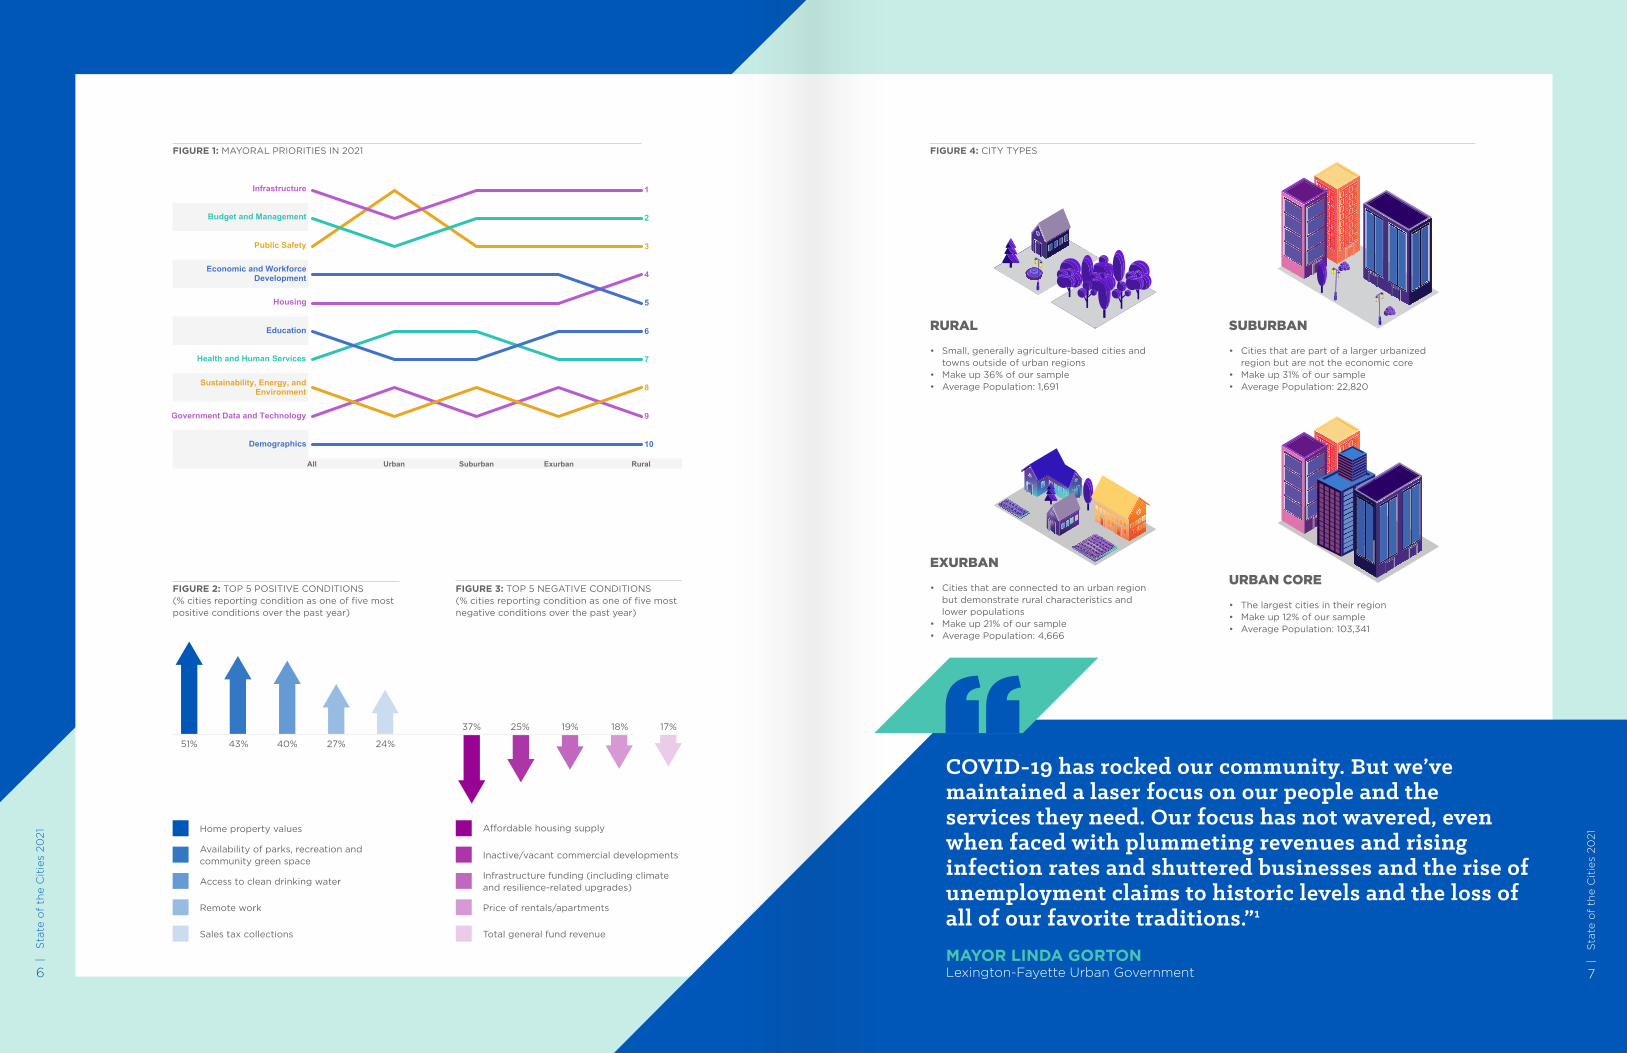
Update: 07/06/2021 19:27:27FIGURE 1: MAYORAL PRIORITIES IN 2021 FIGURE 4: CITY TYPES
FIGURE 2: TOP 5 POSITIVE CONDITIONS(% cities reporting condition as one of five most positive conditions over the past year)
FIGURE 3: TOP 5 NEGATIVE CONDITIONS(% cities reporting condition as one of five most negative conditions over the past year)
24%27%51% 43% 40%
Availability of parks, recreation and community green space
Access to clean drinking water
Remote work
Sales tax collections
Home property values
37% 25% 19% 18% 17%
Inactive/vacant commercial developments
Infrastructure funding (including climate and resilience-related upgrades)
Price of rentals/apartments
Affordable housing supply
Total general fund revenue
7
| S
tate
of
the
Cit
ies
2021
6
| S
tate
of
the
Cit
ies
2021
COVID-19 has rocked our community. But we’ve maintained a laser focus on our people and the services they need. Our focus has not wavered, even when faced with plummeting revenues and rising infection rates and shuttered businesses and the rise of unemployment claims to historic levels and the loss of all of our favorite traditions.”1 MAYOR LINDA GORTONLexington-Fayette Urban Government
RURAL
• Small, generally agriculture-based cities and towns outside of urban regions
• Make up 36% of our sample• Average Population: 1,691
SUBURBAN
• Cities that are part of a larger urbanized region but are not the economic core
• Make up 31% of our sample• Average Population: 22,820
EXURBAN
• Cities that are connected to an urban region but demonstrate rural characteristics and lower populations
• Make up 21% of our sample• Average Population: 4,666
URBAN CORE
• The largest cities in their region• Make up 12% of our sample• Average Population: 103,341
9
| S
tate
of
the
Cit
ies
2021
8
| S
tate
of
the
Cit
ies
2021
ESSENTIAL INFRASTRUCTUREENABLES COMMUNITY RESILIENCE
THE PANDEMIC HAS shone a
light on the necessity of
basic public infrastructure.
From clean drinking water to parks
and open space, the most crucial
elements of community resilience in
the face of COVID-19 were aspects
of everyday life that we often take
for granted. Infrastructure funding,
however, ranked among the top
challenges facing cities, driving
infrastructure to the top of mayoral
priorities for 2021. Nearly a quarter of
cities experienced fewer infrastructure
upgrades over the past year,
including those related to climate
and resiliency, further reflecting
the trend in delayed maintenance
resulting from budget challenges.
While most infrastructure conditions
remained remarkably unchanged
over the course of the pandemic,
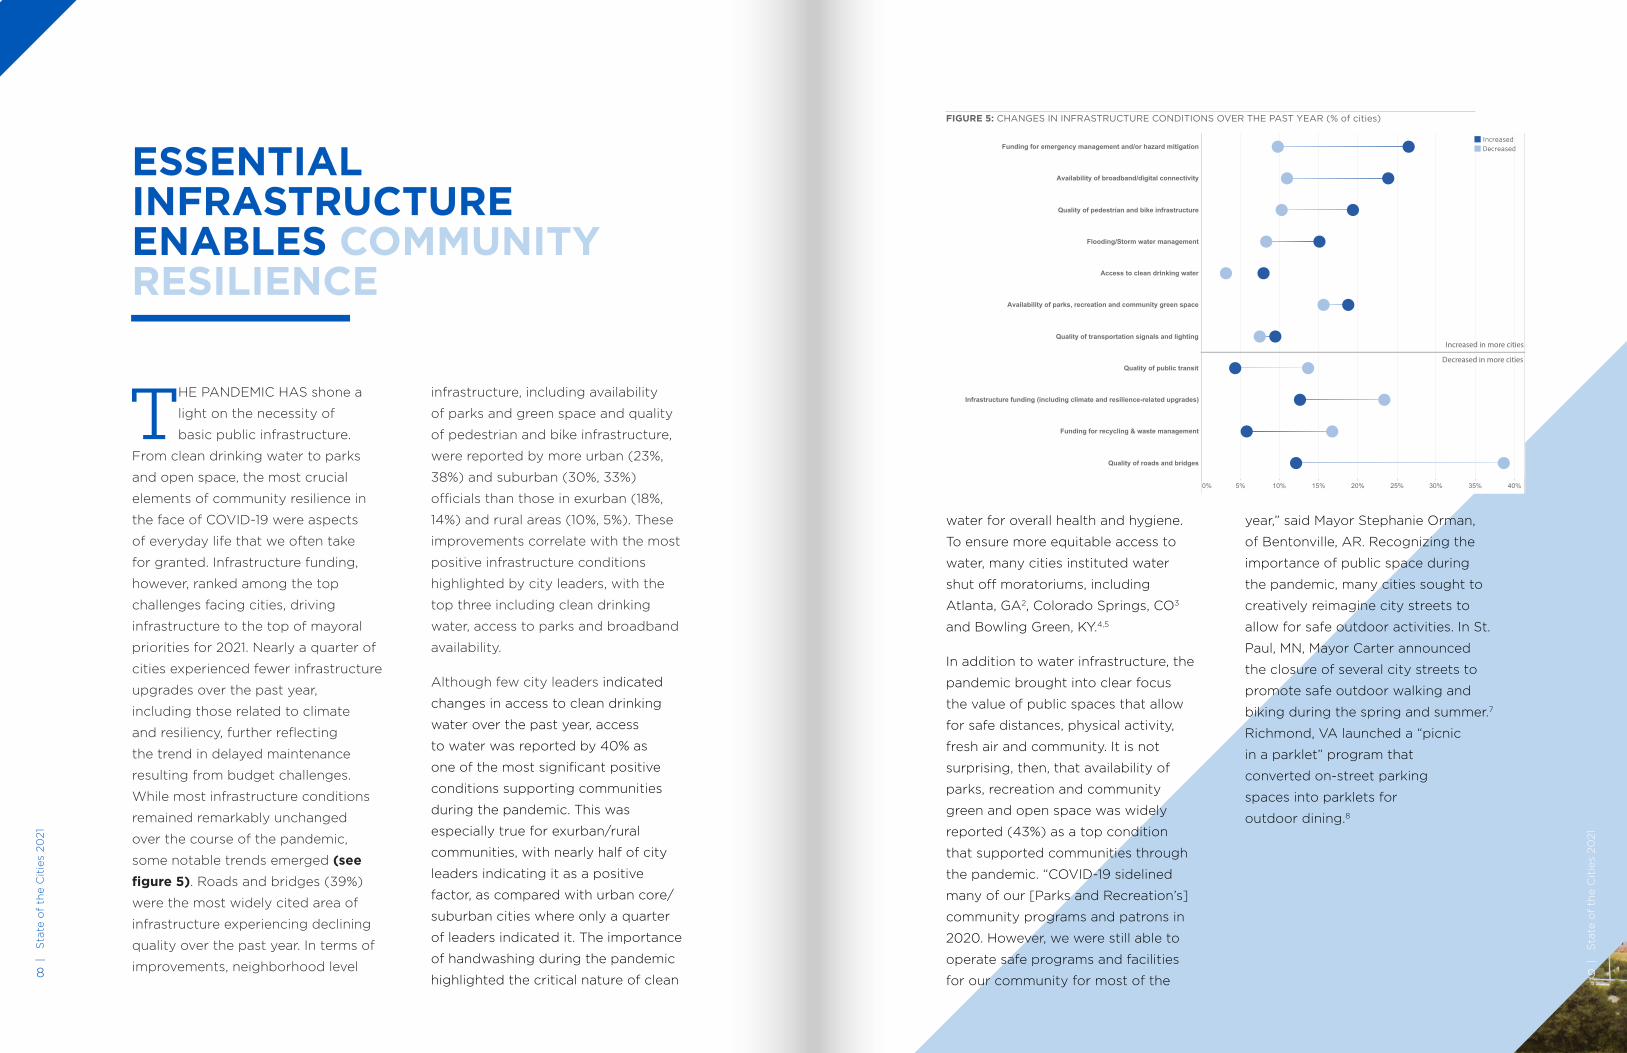
some notable trends emerged (see figure 5). Roads and bridges (39%)
were the most widely cited area of
infrastructure experiencing declining
quality over the past year. In terms of
improvements, neighborhood level
infrastructure, including availability
of parks and green space and quality
of pedestrian and bike infrastructure,
were reported by more urban (23%,
38%) and suburban (30%, 33%)
officials than those in exurban (18%,
14%) and rural areas (10%, 5%). These
improvements correlate with the most
positive infrastructure conditions
highlighted by city leaders, with the
top three including clean drinking
water, access to parks and broadband
availability.
Although few city leaders indicated
changes in access to clean drinking
water over the past year, access
to water was reported by 40% as
one of the most significant positive
conditions supporting communities
during the pandemic. This was
especially true for exurban/rural
communities, with nearly half of city
leaders indicating it as a positive
factor, as compared with urban core/
suburban cities where only a quarter
of leaders indicated it. The importance
of handwashing during the pandemic
highlighted the critical nature of clean
water for overall health and hygiene.
To ensure more equitable access to
water, many cities instituted water
shut off moratoriums, including
Atlanta, GA2, Colorado Springs, CO3
and Bowling Green, KY.4,5
In addition to water infrastructure, the
pandemic brought into clear focus
the value of public spaces that allow
for safe distances, physical activity,
fresh air and community. It is not
surprising, then, that availability of
parks, recreation and community
green and open space was widely
reported (43%) as a top condition
that supported communities through
the pandemic. “COVID-19 sidelined
many of our [Parks and Recreation’s]
community programs and patrons in
2020. However, we were still able to
operate safe programs and facilities
for our community for most of the
year,” said Mayor Stephanie Orman,
of Bentonville, AR. Recognizing the
importance of public space during
the pandemic, many cities sought to
creatively reimagine city streets to
allow for safe outdoor activities. In St.
Paul, MN, Mayor Carter announced
the closure of several city streets to
promote safe outdoor walking and
biking during the spring and summer.7
Richmond, VA launched a “picnic
in a parklet” program that
converted on-street parking
spaces into parklets for
outdoor dining.8
Infrastructure ConditionsChanges Over the Past Year (% of cities)
0% 5% 10% 15% 20% 25% 30% 35% 40%
Funding for emergency management and/or hazard mitigation
Availability of broadband/digital connectivity
Quality of pedestrian and bike infrastructure
Flooding/Storm water management
Access to clean drinking water
Availability of parks, recreation and community green space
Quality of transportation signals and lighting
Quality of public transit
Infrastructure funding (including climate and resilience-related upgrades)
Funding for recycling & waste management
Quality of roads and bridges
Update: 07/06/2021 19:27:27
IncreasedDecreased
FIGURE 5: CHANGES IN INFRASTRUCTURE CONDITIONS OVER THE PAST YEAR (% of cities)
Increased in more cities
Decreased in more cities
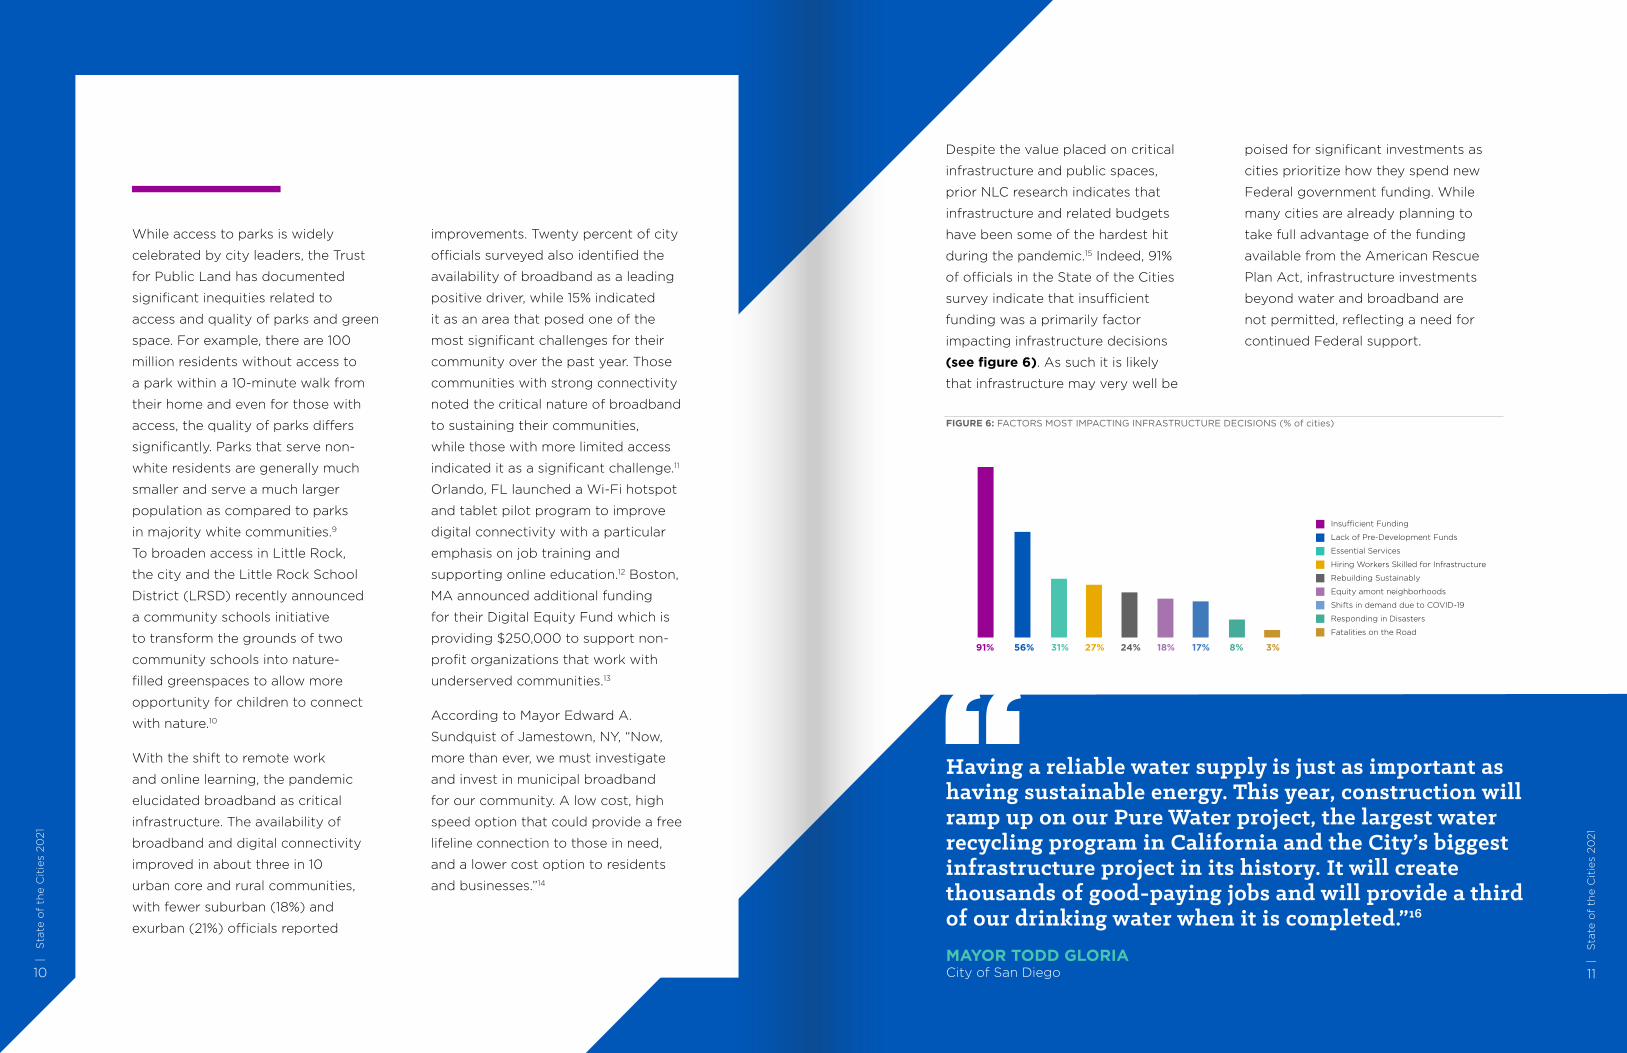
FIGURE 6: FACTORS MOST IMPACTING INFRASTRUCTURE DECISIONS (% of cities)
Insufficient Funding
Lack of Pre-Development Funds
Essential Services
Hiring Workers Skilled for Infrastructure
Rebuilding Sustainably
Equity amont neighborhoods
Shifts in demand due to COVID-19
Responding in Disasters
Fatalities on the Road
91% 56% 31% 27% 24% 18% 8%17% 3%
11
| S
tate
of
the
Cit
ies
2021
| S
tate
of
the
Cit
ies
2021
10
While access to parks is widely
celebrated by city leaders, the Trust
for Public Land has documented
significant inequities related to
access and quality of parks and green
space. For example, there are 100
million residents without access to
a park within a 10-minute walk from
their home and even for those with
access, the quality of parks differs
significantly. Parks that serve non-
white residents are generally much
smaller and serve a much larger
population as compared to parks
in majority white communities.9
To broaden access in Little Rock,
the city and the Little Rock School
District (LRSD) recently announced
a community schools initiative
to transform the grounds of two
community schools into nature-
filled greenspaces to allow more
opportunity for children to connect
with nature.10
With the shift to remote work
and online learning, the pandemic
elucidated broadband as critical
infrastructure. The availability of
broadband and digital connectivity
improved in about three in 10
urban core and rural communities,
with fewer suburban (18%) and
exurban (21%) officials reported
improvements. Twenty percent of city
officials surveyed also identified the
availability of broadband as a leading
positive driver, while 15% indicated
it as an area that posed one of the
most significant challenges for their
community over the past year. Those
communities with strong connectivity
noted the critical nature of broadband
to sustaining their communities,
while those with more limited access
indicated it as a significant challenge.11
Orlando, FL launched a Wi-Fi hotspot
and tablet pilot program to improve
digital connectivity with a particular
emphasis on job training and
supporting online education.12 Boston,
MA announced additional funding
for their Digital Equity Fund which is
providing $250,000 to support non-
profit organizations that work with
underserved communities.13
According to Mayor Edward A.
Sundquist of Jamestown, NY, “Now,
more than ever, we must investigate
and invest in municipal broadband
for our community. A low cost, high
speed option that could provide a free
lifeline connection to those in need,
and a lower cost option to residents
and businesses.”14
Despite the value placed on critical
infrastructure and public spaces,
prior NLC research indicates that
infrastructure and related budgets
have been some of the hardest hit
during the pandemic.15 Indeed, 91%
of officials in the State of the Cities
survey indicate that insufficient
funding was a primarily factor
impacting infrastructure decisions
(see figure 6). As such it is likely
that infrastructure may very well be
poised for significant investments as
cities prioritize how they spend new
Federal government funding. While
many cities are already planning to
take full advantage of the funding
available from the American Rescue
Plan Act, infrastructure investments
beyond water and broadband are
not permitted, reflecting a need for
continued Federal support.
Having a reliable water supply is just as important as having sustainable energy. This year, construction will ramp up on our Pure Water project, the largest water recycling program in California and the City’s biggest infrastructure project in its history. It will create thousands of good-paying jobs and will provide a third of our drinking water when it is completed.”16
MAYOR TODD GLORIACity of San Diego
13
| S
tate
of
the
Cit
ies
2021
12
| S
tate
of
the
Cit
ies
2021
HARD-HIT BUDGETS BEGINNING TO STABILIZEWITH FEDERAL FUNDING
THIS YEAR BUDGET and
management ranked second
among mayoral priorities for
2021. While this is a shift from years
prior, where the topic often ranked
in the middle of the pack instead
of near the top, it is not surprising.
Last year, the COVID-19 pandemic
decimated city budgets. In addition
to lost revenue as a result of a
slowing economy, many cities also
took actions to support businesses
and residents that impacted their
bottom lines like deferring property
taxes, waiving late fees on utilities
and providing small business loans.17
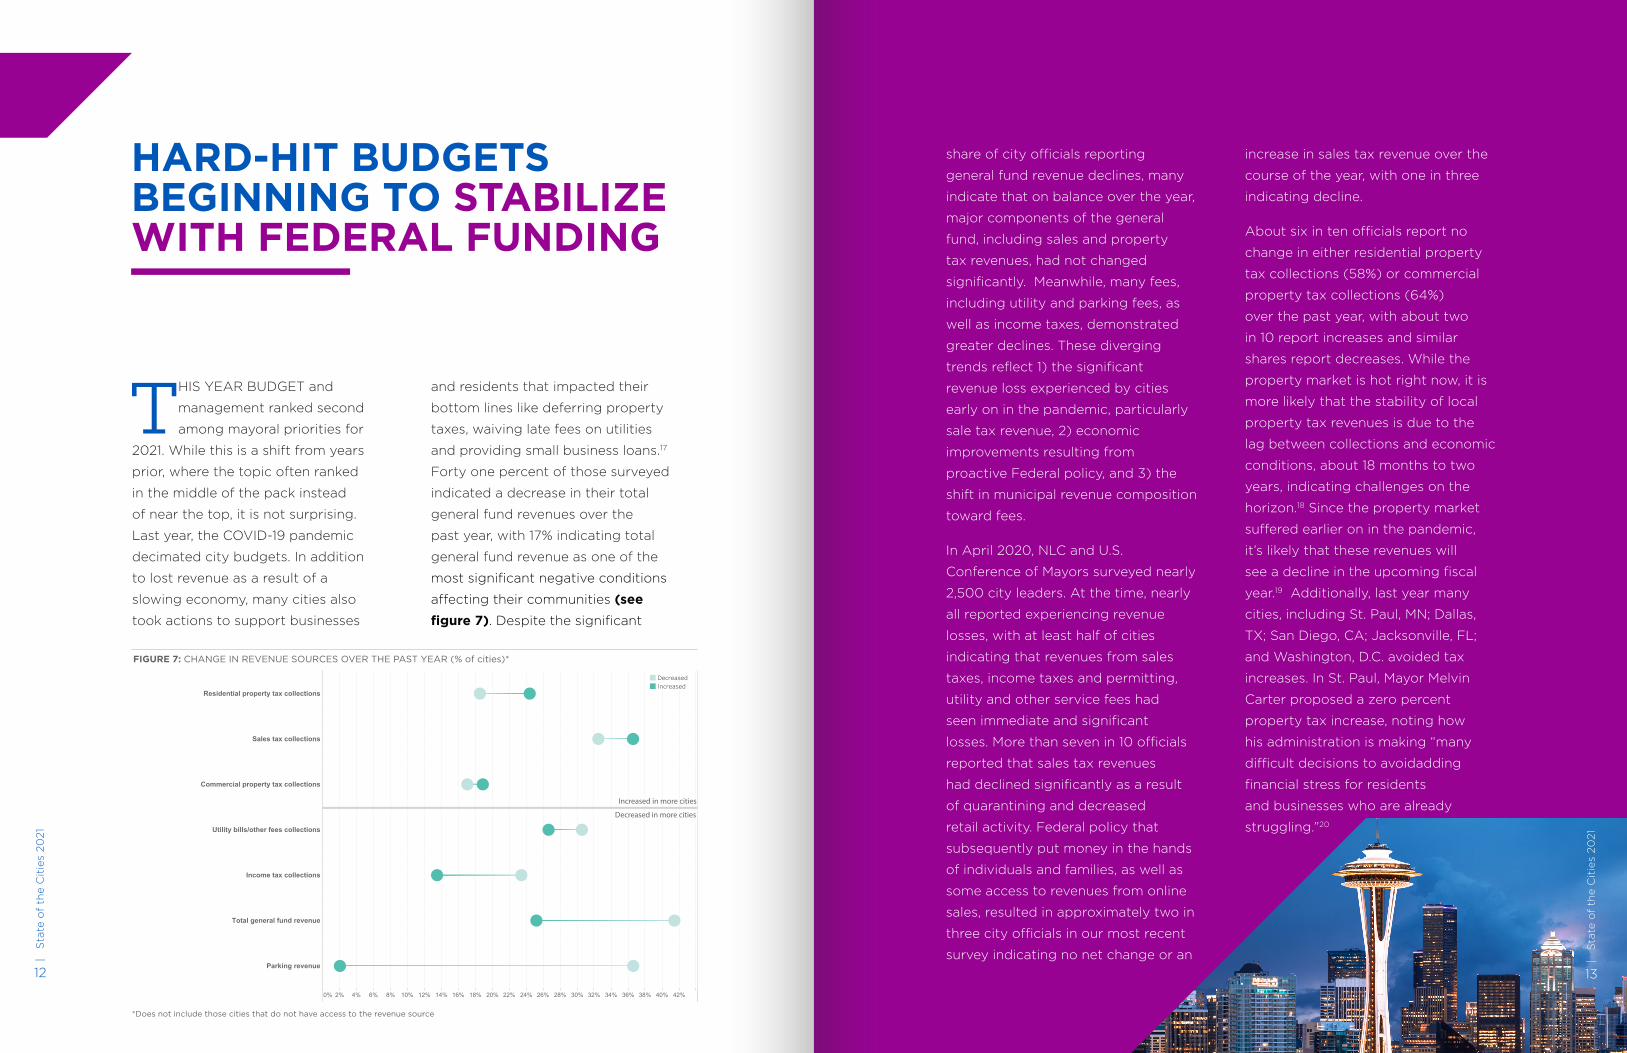
Forty one percent of those surveyed
indicated a decrease in their total
general fund revenues over the
past year, with 17% indicating total
general fund revenue as one of the
most significant negative conditions
affecting their communities (see figure 7). Despite the significant
share of city officials reporting
general fund revenue declines, many
indicate that on balance over the year,
major components of the general
fund, including sales and property
tax revenues, had not changed
significantly. Meanwhile, many fees,
including utility and parking fees, as
well as income taxes, demonstrated
greater declines. These diverging
trends reflect 1) the significant
revenue loss experienced by cities
early on in the pandemic, particularly
sale tax revenue, 2) economic
improvements resulting from
proactive Federal policy, and 3) the
shift in municipal revenue composition
toward fees.
In April 2020, NLC and U.S.
Conference of Mayors surveyed nearly
2,500 city leaders. At the time, nearly
all reported experiencing revenue
losses, with at least half of cities
indicating that revenues from sales
taxes, income taxes and permitting,
utility and other service fees had
seen immediate and significant
losses. More than seven in 10 officials
reported that sales tax revenues
had declined significantly as a result
of quarantining and decreased
retail activity. Federal policy that
subsequently put money in the hands
of individuals and families, as well as
some access to revenues from online
sales, resulted in approximately two in
three city officials in our most recent
survey indicating no net change or an
increase in sales tax revenue over the
course of the year, with one in three
indicating decline.
About six in ten officials report no
change in either residential property
tax collections (58%) or commercial
property tax collections (64%)
over the past year, with about two
in 10 report increases and similar
shares report decreases. While the
property market is hot right now, it is
more likely that the stability of local
property tax revenues is due to the
lag between collections and economic
conditions, about 18 months to two
years, indicating challenges on the
horizon.18 Since the property market
suffered earlier on in the pandemic,
it’s likely that these revenues will
see a decline in the upcoming fiscal
year.19 Additionally, last year many
cities, including St. Paul, MN; Dallas,
TX; San Diego, CA; Jacksonville, FL;
and Washington, D.C. avoided tax
increases. In St. Paul, Mayor Melvin
Carter proposed a zero percent
property tax increase, noting how
his administration is making “many
difficult decisions to avoidadding
financial stress for residents
and businesses who are already
struggling.”20
FIGURE 7: CHANGE IN REVENUE SOURCES OVER THE PAST YEAR (% of cities)*BudgetChanges in Budget Conditions Over the Past Year (% of cities)
0% 2% 4% 6% 8% 10% 12% 14% 16% 18% 20% 22% 24% 26% 28% 30% 32% 34% 36% 38% 40% 42%
Residential property tax collections
Sales tax collections
Commercial property tax collections
Utility bills/other fees collections
Income tax collections
Total general fund revenue
Parking revenue
Update: 07/06/2021 19:27:27
DecreasedIncreased
Increased in more cities
Decreased in more cities
*Does not include those cities that do not have access to the revenue source
1514
| S
tate
of
the
Cit
ies
2021
| S
tate
of
the
Cit
ies
2021
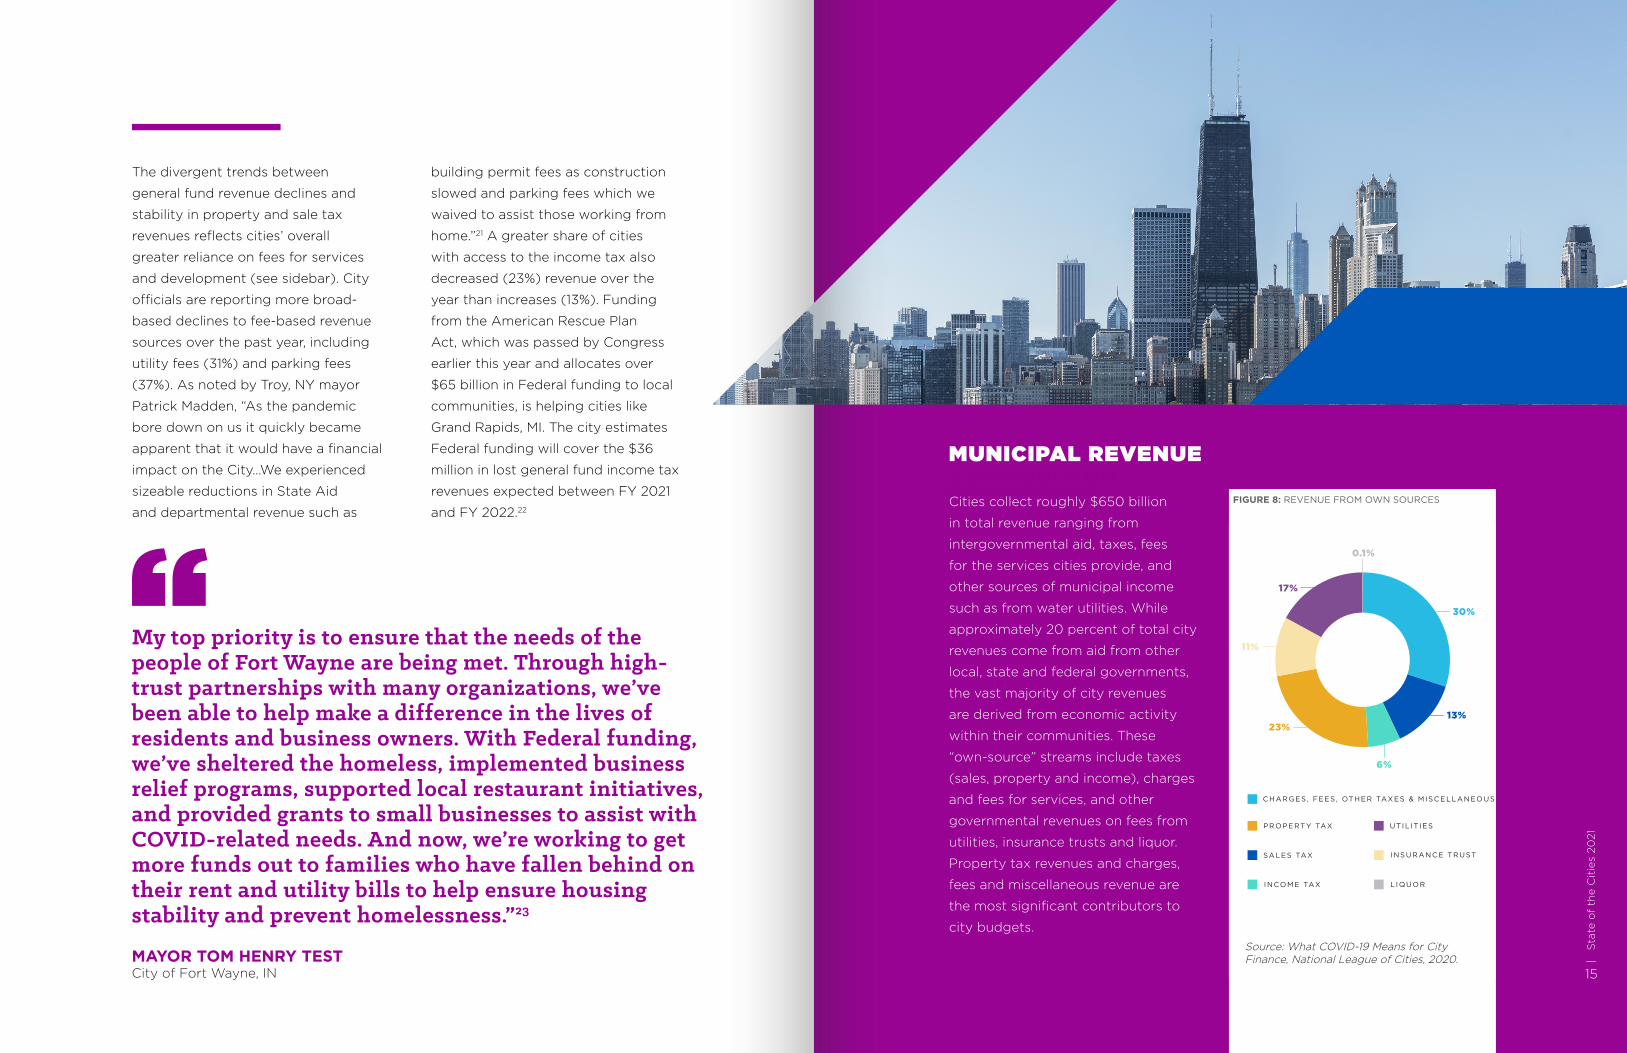
Cities collect roughly $650 billion
in total revenue ranging from
intergovernmental aid, taxes, fees
for the services cities provide, and
other sources of municipal income
such as from water utilities. While
approximately 20 percent of total city
revenues come from aid from other
local, state and federal governments,
the vast majority of city revenues
are derived from economic activity
within their communities. These
“own-source” streams include taxes
(sales, property and income), charges
and fees for services, and other
governmental revenues on fees from
utilities, insurance trusts and liquor.
Property tax revenues and charges,
fees and miscellaneous revenue are
the most significant contributors to
city budgets.Source: What COVID-19 Means for City Finance, National League of Cities, 2020.
MUNICIPAL REVENUE COMPOSITION
My top priority is to ensure that the needs of the people of Fort Wayne are being met. Through high-trust partnerships with many organizations, we’ve been able to help make a difference in the lives of residents and business owners. With Federal funding, we’ve sheltered the homeless, implemented business relief programs, supported local restaurant initiatives, and provided grants to small businesses to assist with COVID-related needs. And now, we’re working to get more funds out to families who have fallen behind on their rent and utility bills to help ensure housing stability and prevent homelessness.”23
MAYOR TOM HENRY TESTCity of Fort Wayne, IN
The divergent trends between
general fund revenue declines and
stability in property and sale tax
revenues reflects cities’ overall
greater reliance on fees for services
and development (see sidebar). City
officials are reporting more broad-
based declines to fee-based revenue
sources over the past year, including
utility fees (31%) and parking fees
(37%). As noted by Troy, NY mayor
Patrick Madden, “As the pandemic
bore down on us it quickly became
apparent that it would have a financial
impact on the City…We experienced
sizeable reductions in State Aid
and departmental revenue such as
building permit fees as construction
slowed and parking fees which we
waived to assist those working from
home.”21 A greater share of cities
with access to the income tax also
decreased (23%) revenue over the
year than increases (13%). Funding
from the American Rescue Plan
Act, which was passed by Congress
earlier this year and allocates over
$65 billion in Federal funding to local
communities, is helping cities like
Grand Rapids, MI. The city estimates
Federal funding will cover the $36
million in lost general fund income tax
revenues expected between FY 2021
and FY 2022.22
CHARGES , FEES , OTHER TAXES & MISCELLANEOUS
SALES TAX
INCOME TAX
PROPERTY TAX
INSURANCE TRUST
UTIL IT IES
L IQUOR
revenue from own sources
FIGURE 8: REVENUE FROM OWN SOURCES
1716
| S
tate
of
the
Cit
ies
2021
| S
tate
of
the
Cit
ies
2021
REIMAGINING PUBLIC SAFETY A TOP PRIORITY FOR CITIES
THIS YEAR, PUBLIC safety
ranked third among mayoral
priorities. America’s cities
continue to work toward more
comprehensive public safety
solutions in response to calls for
racial justice and demands to re-
imagine public safety.24 Strategies
such as de-escalation and implicit
bias training, body cameras and
independent oversight bodies25 were
seeing ubiquitously26 this past year,
and plans for the year ahead. For
example, Chicago, IL.27 created a Use
of Force Dashboard, and Indianapolis,
IN28 created a new facility for use-of-
force and de-escalation training to
better mimic what police experience
day to day. The evidence supports
these strategies. The Newark Police
Department did not fire a single
weapon in 2020 after a focus on de-
escalation.29
As public trust in law enforcement
officers has decreased considerably,
cities from Portland, OR to Austin, TX
to Philadelphia, PA shared approaches
to demilitarize their police forces.
“Please know that we have seen
and heard the cries of thousands of
Philadelphians demanding change
and proclaiming a simple but
powerful truth: Black Lives Matter,”
said Philadelphia Mayor Jim Kenney.30
“We are focusing on reconciliation,
on listening—and on taking action for
change.” While mayors recognize the
need for police reform and efforts to
reimagine local systems, public safety
did not show up as a top negative
condition affecting communities. It
also did not show up as a top positive
condition.31
About six in 10 city officials note
that over the past year, crime in their
communities has decreased (11%) or
experienced no change (48%). When
assessing crime rate by community
type, four in 10 urban core officials
report an increase in crime over
the past year, and fewer from other
community types reported increases.
General trends indicate that crime
has not increased significantly, but
some places are experiencing upticks
in violent crimes. As noted by Mayor
Brandon Scott, city of Baltimore,
“Violent crime is our biggest
challenge, and reducing it remains
my top priority…I established the
Office of Neighborhood Safety and
Engagement…to implementing our
comprehensive violence reduction
strategy based in equity, healing,
and trauma-informed practices to
improve public safety in Baltimore.”32
While public safety will continue to
be a vital function of our society, local
elected officials are working diligently
to engage community members and
center racial equity as they rethink
public safety and policing.
If the pandemic weren’t enough, 2020 brought horrible acts of racial injustice that prompted millions across the nation to pour into the streets and cry out for change. Cary is a diverse community that embraces and celebrates our diversity. There is absolutely no place for injustices of any kind in Cary. [As a result] the town will review police use of force policies and engage our community in a broad range of input, experiences, and stories.”33
MAYOR HAROLD WEINBRECHT Town of Cary, NC
19
| S
tate
of
the
Cit
ies
2021
18
| S
tate
of
the
Cit
ies
2021
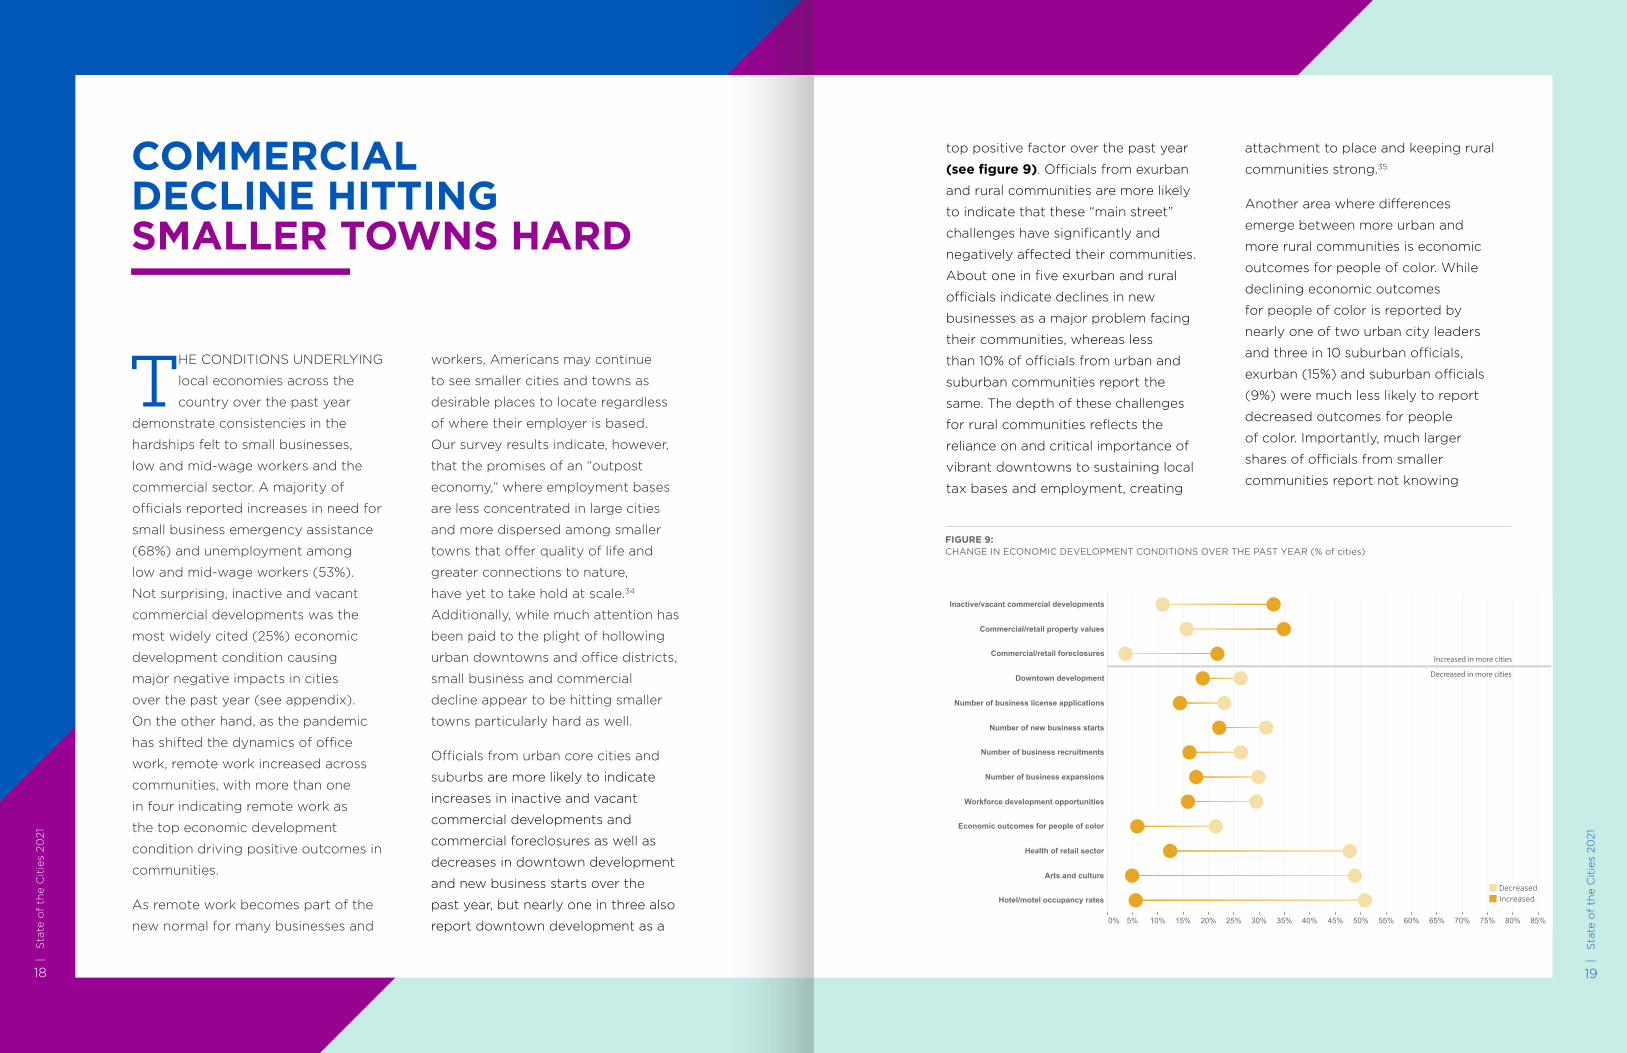
COMMERCIAL DECLINE HITTING SMALLER TOWNS HARD
THE CONDITIONS UNDERLYING
local economies across the
country over the past year
demonstrate consistencies in the
hardships felt to small businesses,
low and mid-wage workers and the
commercial sector. A majority of
officials reported increases in need for
small business emergency assistance
(68%) and unemployment among
low and mid-wage workers (53%).
Not surprising, inactive and vacant
commercial developments was the
most widely cited (25%) economic
development condition causing
major negative impacts in cities
over the past year (see appendix).
On the other hand, as the pandemic
has shifted the dynamics of office
work, remote work increased across
communities, with more than one
in four indicating remote work as
the top economic development
condition driving positive outcomes in
communities.
As remote work becomes part of the
new normal for many businesses and
workers, Americans may continue
to see smaller cities and towns as
desirable places to locate regardless
of where their employer is based.
Our survey results indicate, however,
that the promises of an “outpost
economy,” where employment bases
are less concentrated in large cities
and more dispersed among smaller
towns that offer quality of life and
greater connections to nature,
have yet to take hold at scale.34
Additionally, while much attention has
been paid to the plight of hollowing
urban downtowns and office districts,
small business and commercial
decline appear to be hitting smaller
towns particularly hard as well.
Officials from urban core cities and
suburbs are more likely to indicate
increases in inactive and vacant
commercial developments and
commercial foreclosures as well as
decreases in downtown development
and new business starts over the
past year, but nearly one in three also
report downtown development as a
top positive factor over the past year
(see figure 9). Officials from exurban
and rural communities are more likely
to indicate that these “main street”
challenges have significantly and
negatively affected their communities.
About one in five exurban and rural
officials indicate declines in new
businesses as a major problem facing
their communities, whereas less
than 10% of officials from urban and
suburban communities report the
same. The depth of these challenges
for rural communities reflects the
reliance on and critical importance of
vibrant downtowns to sustaining local
tax bases and employment, creating
attachment to place and keeping rural
communities strong.35
Another area where differences
emerge between more urban and
more rural communities is economic
outcomes for people of color. While
declining economic outcomes
for people of color is reported by
nearly one of two urban city leaders
and three in 10 suburban officials,
exurban (15%) and suburban officials
(9%) were much less likely to report
decreased outcomes for people
of color. Importantly, much larger
shares of officials from smaller
communities report not knowing
FIGURE 9: CHANGE IN ECONOMIC DEVELOPMENT CONDITIONS OVER THE PAST YEAR (% of cities)
Economic ConditionsChanges in Economic Development Conditions Over the Past Year (% of cities)
0% 5% 10% 15% 20% 25% 30% 35% 40% 45% 50% 55% 60% 65% 70% 75% 80% 85%
Remote work
Demand for small business emergency assistance
Unemployment amongst low-mid income workers
Inactive/vacant commercial developments
Commercial/retail property values
Commercial/retail foreclosures
Downtown development
Number of business license applications
Number of new business starts
Number of business recruitments
Number of business expansions
Workforce development opportunities
Economic outcomes for people of color
Health of retail sector
Arts and culture
Hotel/motel occupancy rates
Update: 07/06/2021 19:27:27
DecreasedIncreased
Increased in more cities
Decreased in more cities
21
| S
tate
of
the
Cit
ies
2021
| S
tate
of
the
Cit
ies
2021
20
While we will continue our efforts to attract new jobs, we know that entrepreneurship also builds wealth and provides stability for families and communities. New businesses are the lifeblood of a city, but the pandemic has exposed the disparities in who’s able to get ahead. This begs the question: what can we do to create new jobs, level the playing field, and reduce economic injustice during this recovery? Little Rock’s answer is BUILD Academy, a 12-week small business incubator to serve as a front door for current and future business owners in our city.”41
MAYOR FRANK D. SCOTT, JR.Little Rock, AR
whether outcomes for people of color
have improved or worsened. While
rural areas tend to be older and less
racially diverse than urban centers,
2012 research found that 22% of
rural residents are people of color.36
Furthermore, over the last decade,
the share of non-metropolitan area
populations that are communities
of color has exhibited an upward
trajectory.37 Overall, despite influxes
of people of color to smaller and
more rural places as well as stark
data demonstrating disparate impact
of COVID-19 on people of color,
officials from these communities are
challenged in measuring economic
impact with an equity lens.
The lack of available data and
knowledge about racial inequities in
more rural communities demonstrates
the need for greater support and
resources to disaggregate economic
and other data by race, understand
disproportionate impact, engage
residents and align local strategies.
As noted by The Washington Center
for Equitable Growth, “Failing to
recognize that certain communities
are more exposed to the coronavirus
and preferencing “colorblind” policy
will reinforce the systemic racism
that made these communities so
vulnerable in the first place. It will
also make those communities more
vulnerable in the next crisis.”38
Understanding these challenges,
some cities have taken action on
disaggregating data during the
pandemic to address disproportionate
impact. For example, when deciding
where to expand testing sites
last year, Austin, TX used data to
determine those areas of the city
most impacted by COVID-19.39 Using
data to target resources also allowed
the health department to better
engage with residents to address the
barriers related to transportation,
language and misinformation and
improve services for lower-income
families and communities of colors.40
Extending a data-driven approach
to other outcome areas, including
economic outcomes, is a necessary
step improving the lives of everyone
in our communities.
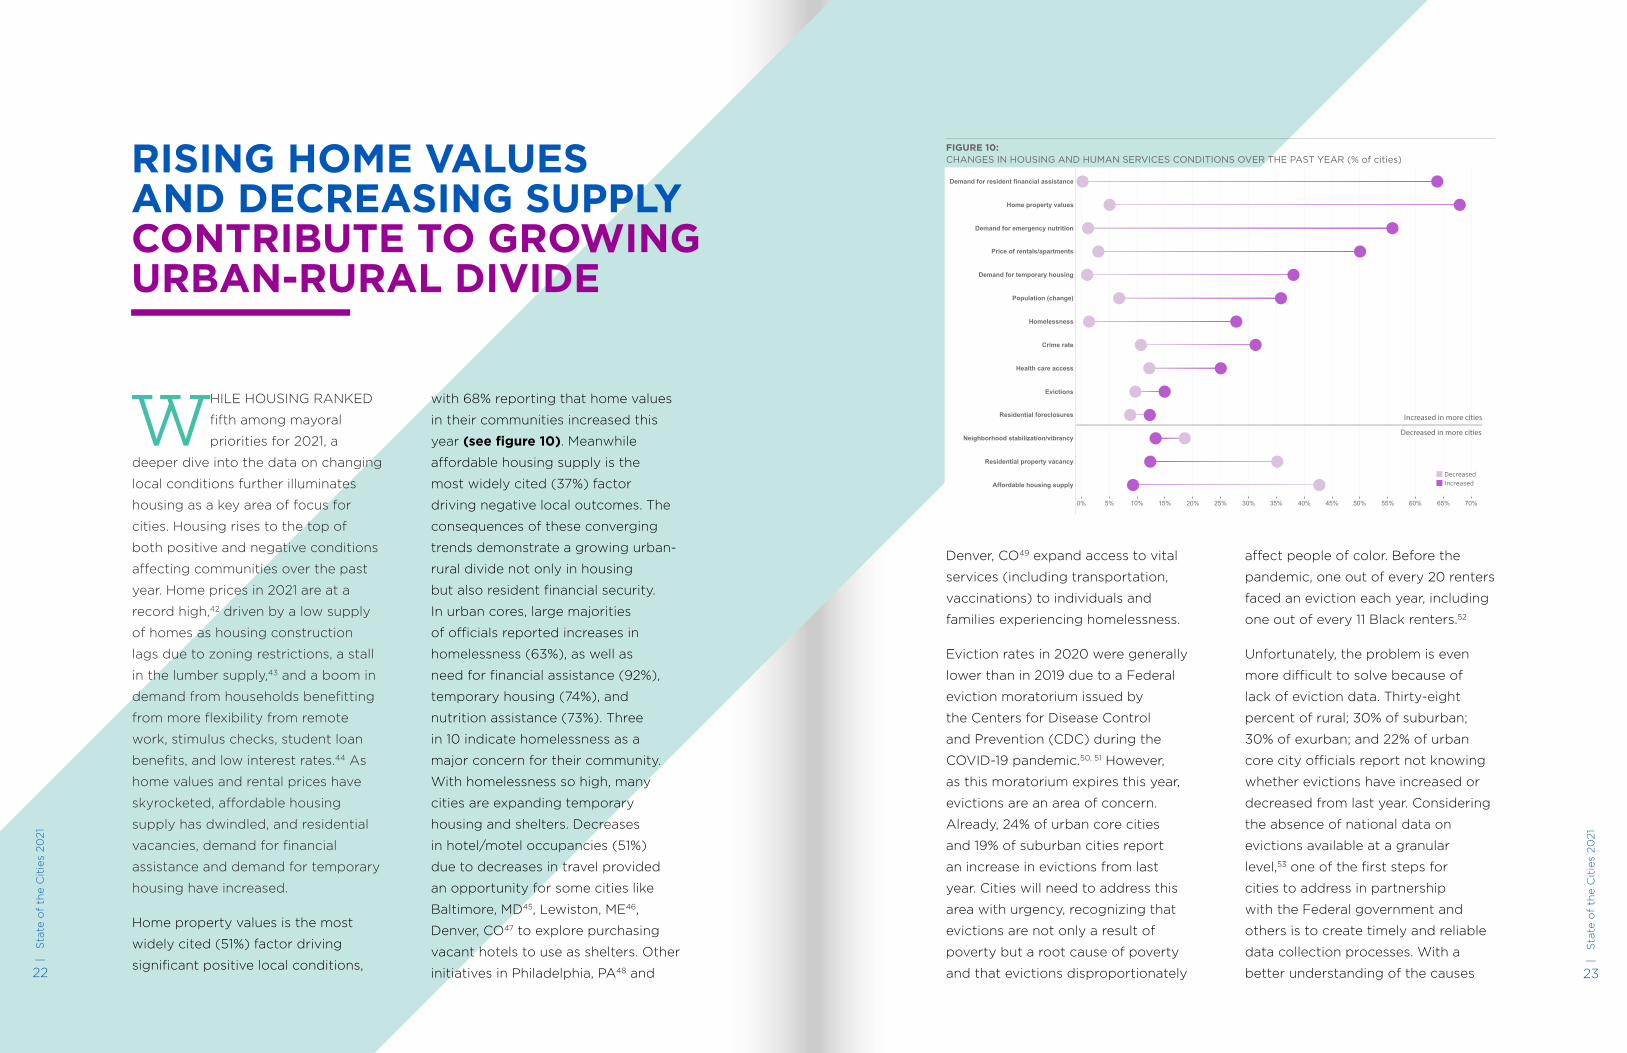
Housing and Human Services ConditionsChanges Over the Past Year (% of cities)
0% 5% 10% 15% 20% 25% 30% 35% 40% 45% 50% 55% 60% 65% 70%
Demand for resident financial assistance
Home property values
Demand for emergency nutrition
Price of rentals/apartments
Demand for temporary housing
Population (change)
Homelessness
Crime rate
Health care access
Evictions
Residential foreclosures
Neighborhood stabilization/vibrancy
Residential property vacancy
Affordable housing supply
Update: 07/06/2021 19:27:27
DecreasedIncreased
Increased in more cities
Decreased in more cities
22
| S
tate
of
the
Cit
ies
2021
23
| S
tate
of
the
Cit
ies
2021
RISING HOME VALUES AND DECREASING SUPPLY CONTRIBUTE TO GROWING URBAN-RURAL DIVIDE
WHILE HOUSING RANKED
fifth among mayoral
priorities for 2021, a
deeper dive into the data on changing
local conditions further illuminates
housing as a key area of focus for
cities. Housing rises to the top of
both positive and negative conditions
affecting communities over the past
year. Home prices in 2021 are at a
record high,42 driven by a low supply
of homes as housing construction
lags due to zoning restrictions, a stall
in the lumber supply,43 and a boom in
demand from households benefitting
from more flexibility from remote
work, stimulus checks, student loan
benefits, and low interest rates.44 As
home values and rental prices have
skyrocketed, affordable housing
supply has dwindled, and residential
vacancies, demand for financial
assistance and demand for temporary
housing have increased.
Home property values is the most
widely cited (51%) factor driving
significant positive local conditions,
with 68% reporting that home values
in their communities increased this
year (see figure 10). Meanwhile
affordable housing supply is the
most widely cited (37%) factor
driving negative local outcomes. The
consequences of these converging
trends demonstrate a growing urban-
rural divide not only in housing
but also resident financial security.
In urban cores, large majorities
of officials reported increases in
homelessness (63%), as well as
need for financial assistance (92%),
temporary housing (74%), and
nutrition assistance (73%). Three
in 10 indicate homelessness as a
major concern for their community.
With homelessness so high, many
cities are expanding temporary
housing and shelters. Decreases
in hotel/motel occupancies (51%)
due to decreases in travel provided
an opportunity for some cities like
Baltimore, MD45, Lewiston, ME46,
Denver, CO47 to explore purchasing
vacant hotels to use as shelters. Other
initiatives in Philadelphia, PA48 and
Denver, CO49 expand access to vital
services (including transportation,
vaccinations) to individuals and
families experiencing homelessness.
Eviction rates in 2020 were generally
lower than in 2019 due to a Federal
eviction moratorium issued by
the Centers for Disease Control
and Prevention (CDC) during the
COVID-19 pandemic.50, 51 However,
as this moratorium expires this year,
evictions are an area of concern.
Already, 24% of urban core cities
and 19% of suburban cities report
an increase in evictions from last
year. Cities will need to address this
area with urgency, recognizing that
evictions are not only a result of
poverty but a root cause of poverty
and that evictions disproportionately
affect people of color. Before the
pandemic, one out of every 20 renters
faced an eviction each year, including
one out of every 11 Black renters.52
Unfortunately, the problem is even
more difficult to solve because of
lack of eviction data. Thirty-eight
percent of rural; 30% of suburban;
30% of exurban; and 22% of urban
core city officials report not knowing
whether evictions have increased or
decreased from last year. Considering
the absence of national data on
evictions available at a granular
level,53 one of the first steps for
cities to address in partnership
with the Federal government and
others is to create timely and reliable
data collection processes. With a
better understanding of the causes
FIGURE 10:CHANGES IN HOUSING AND HUMAN SERVICES CONDITIONS OVER THE PAST YEAR (% of cities)
25
| S
tate
of
the
Cit
ies
2021
24
| S
tate
of
the
Cit
ies
2021
and challenges of evictions particular
to their city, officials can come up with
a plan of action of targeted strategies
to keep residents housed. Strategies
include mediation services, legal aid to
tenants, eviction diversion programs,
and emergency rental assistance. Cities
like Portland, OR54, Jacksonville, FL55 and
others are expanding legal protections
and offering legal support for renters
now. Additionally, providing tenants the
opportunity to pay back rent owed through
emergency rental assistance or through
an eviction diversion strategy including
payment plans can help residents stay
housed. Strategies like these have had
proven success in Richmond VA56, Newark
NJ57, Greensboro NC58, Durham County,
NC59, and Palo Alto, CA.60
MAYOR CASSIE FRANKLINCity of Everett, WA
[A] priority is housing, and this need has been intensified by the pandemic and its economic toll. I recently issued a housing directive geared at “housing for all,” which seeks to add more housing at all price points so everyone who lives and works in Everett can afford a home and access the great amenities our city has to offer. We also have a growing need for shelter and are moving f orward with new initiatives to expand shelter capacity.”61
2726
| S
tate
of
the
Cit
ies
2021
| S
tate
of
the
Cit
ies
2021
CONCLUSION
MAYORS HAVE LED our
nation’s cities through one
of the most tumultuous
times in American history. As we
continue to address our collective
trauma, vaccinations and proactive
policymaking are allowing our cities
to move from muddling through to
recovery to rebuilding. State of the
City speeches provide the pulse
of what mayors are focused on
accomplishing in our cities. This year
they demonstrate this shift from
survival to bold thinking and provide
a glimpse into what we can expect in
the months and years ahead. From
Pure Water, a massive sustainable
water project in San Diego, to parklets
in Richmond, creative reimagining
in big and small ways is leading the
way. These issues and solutions
show up differently in urban and
rural communities indicating how
geographic differences continue
to broadly influence economic and
health outcomes, as well as how city
leaders are addressing them.
Our analysis also reveals that mayors continue to focus on equity. The murder of George Floyd and other Black men by police officers, the racial uprisings and protests of 2020, and the disparate impact of Covid-19 on Black and Brown communities converged over this last year to continue to drive home the critical work to rectify inequities and injustices. This focus on equity, however, has emerged in different
ways. For example, communities centered economic outcomes for people of color differently dependent on geography. In large cities and suburban communities, the recognition of disparate challenges was high, but in rural areas, less so. A key piece of this is that much larger shares of officials from smaller communities’ report not knowing whether outcomes for people of color have improved or worsened. Similar challenges were evident in our analysis of evictions. Issues with data create a knowledge gap that perpetuates color blind policies that do not acknowledge or confront racism, systematic or otherwise. Local strategies that create positive outcomes for people of color are necessary to improving equity. These trends point to the need for localized data with more nuanced disaggregations by race.
Our nation’s local leaders have been on the front lines this last year, doing all that they can to support residents and businesses in their time of need. As tends to be the case, when our nation is most tested, some of the most valued leadership and innovative ideas percolate from the ground up. Our current circumstance proves no different. Mayors are the leaders our nation needs to continue to succeed and flourish.
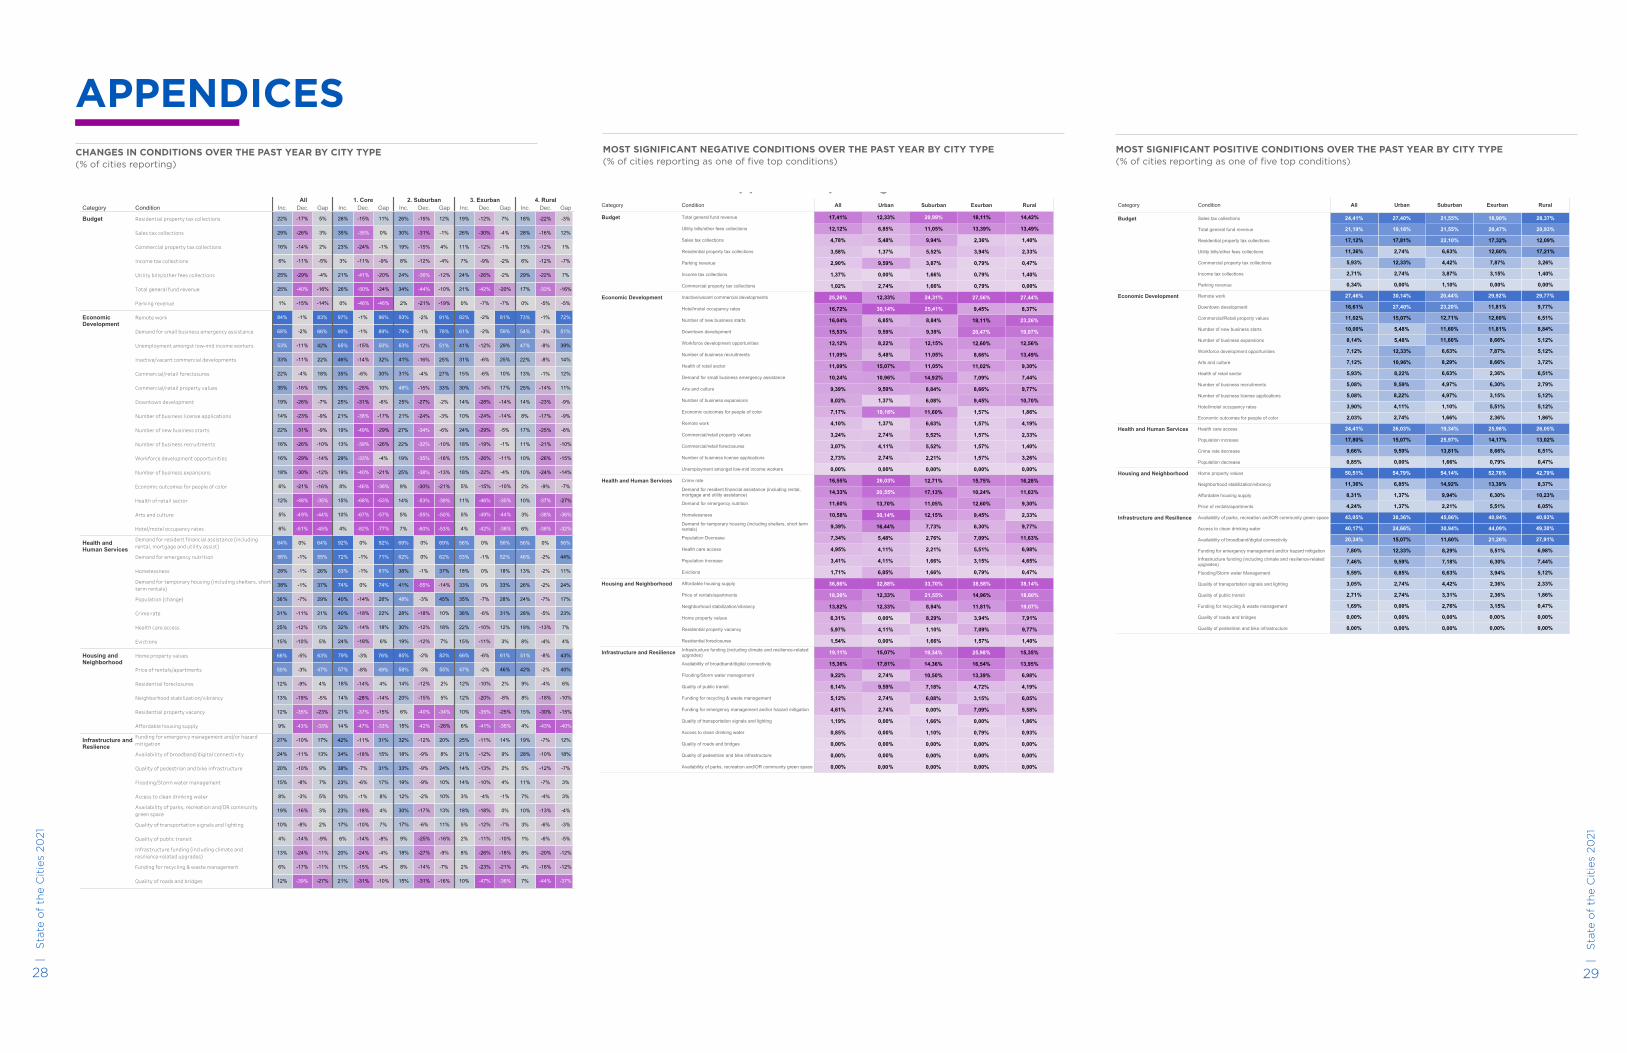
CHANGES IN CONDITIONS OVER THE PAST YEAR BY CITY TYPE (% of cities reporting)
Appendix Top 5 NegativeCategory Condition All Urban Suburban Exurban Rural
Budget Total general fund revenue
Utility bills/other fees collections
Sales tax collections
Residential property tax collections
Parking revenue
Income tax collections
Commercial property tax collections
Economic Development Inactive/vacant commercial developments
Hotel/motel occupancy rates
Number of new business starts
Downtown development
Workforce development opportunities
Number of business recruitments
Health of retail sector
Demand for small business emergency assistance
Arts and culture
Number of business expansions
Economic outcomes for people of color
Remote work
Commercial/retail property values
Commercial/retail foreclosures
Number of business license applications
Unemployment amongst low-mid income workers
Health and Human Services Crime rate
Demand for resident financial assistance (including rental,mortgage and utility assistance)
Demand for emergency nutrition
Homelessness
Demand for temporary housing (including shelters, short termrentals)
Population Decrease
Health care access
Population Increase
Evictions
Housing and Neighborhood Affordable housing supply
Price of rentals/apartments
Neighborhood stabilization/vibrancy
Home property values
Residential property vacancy
Residential foreclosures
Infrastructure and Resilience Infrastructure funding (including climate and resilience-relatedupgrades)
Availability of broadband/digital connectivity
Flooding/Storm water management
Quality of public transit
Funding for recycling & waste management
Funding for emergency management and/or hazard mitigation
Quality of transportation signals and lighting
Access to clean drinking water
Quality of roads and bridges
Quality of pedestrian and bike infrastructure
Availability of parks, recreation and/OR community green space
0,00%
1,40%
0,47%
2,33%
1,40%
13,49%
14,42%
0,79%
0,79%
0,79%
3,94%
2,36%
13,39%
18,11%
1,66%
1,66%
3,87%
5,52%
9,94%
11,05%
20,99%
2,74%
0,00%
9,59%
1,37%
5,48%
6,85%
12,33%
1,02%
1,37%
2,90%
3,58%
4,78%
12,12%
17,41%
0,00%
3,26%
1,40%
2,33%
4,19%
1,86%
10,70%
9,77%
7,44%
9,30%
13,49%
12,56%
19,07%
23,26%
8,37%
27,44%
0,00%
1,57%
1,57%
1,57%
1,57%
1,57%
9,45%
8,66%
7,09%
11,02%
8,66%
12,60%
20,47%
18,11%
9,45%
27,56%
0,00%
2,21%
5,52%
5,52%
6,63%
11,60%
6,08%
8,84%
14,92%
11,05%
11,05%
12,15%
9,39%
8,84%
25,41%
24,31%
0,00%
2,74%
4,11%
2,74%
1,37%
19,18%
1,37%
9,59%
10,96%
15,07%
5,48%
8,22%
9,59%
6,85%
30,14%
12,33%
0,00%
2,73%
3,07%
3,24%
4,10%
7,17%
8,02%
9,39%
10,24%
11,09%
11,09%
12,12%
15,53%
16,04%
16,72%
25,26%
0,47%
4,65%
6,98%
11,63%
9,77%
2,33%
9,30%
11,63%
16,28%
0,79%
3,15%
5,51%
7,09%
6,30%
9,45%
12,60%
10,24%
15,75%
1,66%
1,66%
2,21%
2,76%
7,73%
12,15%
11,05%
17,13%
12,71%
6,85%
4,11%
4,11%
5,48%
16,44%
30,14%
13,70%
20,55%
26,03%
1,71%
3,41%
4,95%
7,34%
9,39%
10,58%
11,60%
14,33%
16,55%
1,40%
9,77%
7,91%
19,07%
18,60%
38,14%
1,57%
7,09%
3,94%
11,81%
14,96%
38,58%
1,66%
1,10%
8,29%
8,84%
21,55%
33,70%
0,00%
4,11%
0,00%
12,33%
12,33%
32,88%
1,54%
5,97%
6,31%
13,82%
18,26%
36,86%
0,00%
0,00%
0,00%
0,93%
1,86%
5,58%
6,05%
4,19%
6,98%
13,95%
15,35%
0,00%
0,00%
0,00%
0,79%
0,00%
7,09%
3,15%
4,72%
13,39%
16,54%
25,98%
0,00%
0,00%
0,00%
1,10%
1,66%
0,00%
6,08%
7,18%
10,50%
14,36%
19,34%
0,00%
0,00%
0,00%
0,00%
0,00%
2,74%
2,74%
9,59%
2,74%
17,81%
15,07%
0,00%
0,00%
0,00%
0,85%
1,19%
4,61%
5,12%
6,14%
9,22%
15,36%
19,11%
Update: 07/06/2021 19:27:27
2928
| S
tate
of
the
Cit
ies
2021
| S
tate
of
the
Cit
ies
2021
APPENDICESMOST SIGNIFICANT NEGATIVE CONDITIONS OVER THE PAST YEAR BY CITY TYPE (% of cities reporting as one of five top conditions)
MOST SIGNIFICANT POSITIVE CONDITIONS OVER THE PAST YEAR BY CITY TYPE (% of cities reporting as one of five top conditions)
Overall ConditionsCategory Condition
AllInc. Dec. Gap
1. CoreInc. Dec. Gap
2. SuburbanInc. Dec. Gap
3. ExurbanInc. Dec. Gap
4. RuralInc. Dec. Gap
Budget Residential property tax collections
Sales tax collections
Commercial property tax collections
Income tax collections
Utility bills/other fees collections
Total general fund revenue
Parking revenue
EconomicDevelopment
Remote work
Demand for small business emergency assistance
Unemployment amongst low-mid income workers
Inactive/vacant commercial developments
Commercial/retail foreclosures
Commercial/retail property values
Downtown development
Number of business license applications
Number of new business starts
Number of business recruitments
Workforce development opportunities
Number of business expansions
Economic outcomes for people of color
Health of retail sector
Arts and culture
Hotel/motel occupancy rates
Health andHuman Services
Demand for resident financial assistance (includingrental, mortgage and utility assist)
Demand for emergency nutrition
Homelessness
Demand for temporary housing (including shelters, shortterm rentals)
Population (change)
Crime rate
Health care access
Evictions
Housing andNeighborhood
Home property values
Price of rentals/apartments
Residential foreclosures
Neighborhood stabilization/vibrancy
Residential property vacancy
Affordable housing supply
Infrastructure andReslience
Funding for emergency management and/or hazardmitigation
Availability of broadband/digital connectivity
Quality of pedestrian and bike infrastructure
Flooding/Storm water management
Access to clean drinking water
Availability of parks, recreation and/OR communitygreen space
Quality of transportation signals and lighting
Quality of public transit
Infrastructure funding (including climate andresilience-related upgrades)
Funding for recycling & waste management
Quality of roads and bridges
-14%
-16%
-4%
-5%
2%
3%
5%
-15%
-40%
-29%
-11%
-14%
-26%
-17%
1%
25%
25%
6%
16%
29%
22%
-46%
-24%
-20%
-9%
-1%
0%
11%
-46%
-50%
-41%
-11%
-24%
-35%
-15%
0%
26%
21%
3%
23%
35%
26%
-19%
-10%
-12%
-4%
4%
-1%
12%
-21%
-44%
-36%
-12%
-15%
-31%
-15%
2%
34%
24%
8%
19%
30%
26%
-7%
-20%
-2%
-2%
-1%
-4%
7%
-7%
-42%
-26%
-9%
-12%
-30%
-12%
0%
21%
24%
7%
11%
26%
19%
-5%
-16%
7%
-7%
1%
12%
-3%
-5%
-33%
-22%
-12%
-12%
-16%
-22%
0%
17%
29%
6%
13%
28%
18%
-45%
-44%
-35%
-16%
-12%
-14%
-10%
-9%
-9%
-7%
19%
18%
22%
42%
66%
83%
-51%
-49%
-48%
-21%
-30%
-29%
-26%
-31%
-23%
-26%
-16%
-4%
-11%
-11%
-2%
-1%
6%
5%
12%
6%
18%
16%
16%
22%
14%
19%
35%
22%
33%
53%
68%
84%
-77%
-57%
-53%
-38%
-21%
-4%
-26%
-29%
-17%
-6%
10%
30%
32%
50%
89%
96%
-82%
-67%
-68%
-46%
-40%
-33%
-39%
-49%
-38%
-31%
-25%
-6%
-14%
-15%
-1%
-1%
4%
10%
15%
8%
19%
29%
13%
19%
21%
25%
35%
35%
46%
65%
90%
97%
-53%
-50%
-39%
-21%
-13%
-16%
-10%
-6%
-3%
-2%
33%
27%
25%
51%
78%
91%
-60%
-55%
-53%
-30%
-38%
-35%
-32%
-34%
-24%
-27%
-15%
-4%
-16%
-12%
-1%
-2%
7%
5%
14%
9%
25%
19%
22%
27%
21%
25%
48%
31%
41%
63%
79%
93%
-38%
-44%
-35%
-10%
-4%
-11%
-1%
-5%
-14%
-14%
17%
10%
25%
29%
59%
81%
-42%
-49%
-46%
-15%
-22%
-26%
-19%
-29%
-24%
-28%
-14%
-6%
-6%
-12%
-2%
-2%
4%
5%
11%
5%
18%
15%
18%
24%
10%
14%
30%
15%
31%
41%
61%
82%
-32%
-36%
-27%
-7%
-14%
-15%
-10%
-8%
-9%
-9%
11%
12%
14%
39%
51%
72%
-38%
-38%
-37%
-9%
-24%
-26%
-21%
-25%
-17%
-23%
-14%
-1%
-8%
-8%
-3%
-1%
6%
3%
10%
2%
10%
10%
11%
17%
8%
14%
25%
13%
22%
47%
54%
73%
5%
13%
21%
29%
37%
26%
55%
64%
-10%
-12%
-11%
-7%
-1%
-1%
-1%
0%
15%
25%
31%
36%
38%
28%
56%
64%
6%
18%
22%
26%
74%
61%
71%
92%
-18%
-14%
-18%
-14%
0%
-1%
-1%
0%
24%
32%
40%
40%
74%
63%
72%
92%
7%
18%
10%
45%
-14%
37%
62%
69%
-12%
-12%
-18%
-3%
-55%
-1%
0%
0%
19%
30%
28%
48%
41%
38%
62%
69%
3%
12%
31%
28%
33%
18%
52%
56%
-11%
-10%
-6%
-7%
0%
0%
-1%
0%
15%
22%
36%
35%
33%
18%
53%
56%
4%
7%
23%
17%
24%
11%
44%
56%
-4%
-13%
-5%
-7%
-2%
-2%
-2%
0%
8%
19%
28%
24%
26%
13%
46%
56%
-33%
-23%
-5%
4%
47%
63%
-43%
-35%
-19%
-9%
-3%
-5%
9%
12%
13%
12%
50%
68%
-33%
-15%
-14%
4%
49%
76%
-47%
-37%
-28%
-14%
-8%
-3%
14%
21%
14%
18%
57%
79%
-26%
-34%
5%
2%
55%
82%
-42%
-40%
-15%
-12%
-3%
-2%
15%
6%
20%
14%
58%
85%
-35%
-25%
-8%
2%
46%
61%
-41%
-35%
-20%
-10%
-2%
-6%
6%
10%
12%
12%
47%
66%
-40%
-15%
-10%
6%
40%
43%
-43%
-30%
-18%
-4%
-2%
-8%
4%
15%
8%
9%
42%
51%
-27%
-11%
-11%
-9%
2%
3%
5%
7%
9%
13%
17%
-39%
-17%
-24%
-14%
-8%
-16%
-3%
-8%
-10%
-11%
-10%
12%
6%
13%
4%
10%
19%
8%
15%
20%
24%
27%
-10%
-4%
-4%
-8%
7%
4%
8%
17%
31%
15%
31%
-31%
-15%
-24%
-14%
-10%
-18%
-1%
-6%
-7%
-18%
-11%
21%
11%
20%
6%
17%
23%
10%
23%
38%
34%
42%
-16%
-7%
-9%
-16%
11%
13%
10%
10%
24%
8%
20%
-31%
-14%
-27%
-25%
-6%
-17%
-2%
-9%
-9%
-9%
-12%
15%
8%
18%
9%
17%
30%
12%
19%
33%
18%
32%
-36%
-21%
-18%
-10%
-7%
0%
-1%
4%
2%
9%
14%
-47%
-23%
-26%
-11%
-12%
-18%
-4%
-10%
-13%
-12%
-11%
10%
2%
8%
2%
5%
18%
3%
14%
14%
21%
25%
-37%
-12%
-12%
-5%
-3%
-4%
3%
3%
-7%
18%
12%
-44%
-16%
-20%
-6%
-6%
-13%
-4%
-7%
-12%
-10%
-7%
7%
4%
8%
1%
3%
10%
7%
11%
5%
28%
19%
Update: 07/06/2021 19:27:27 Appendix Top 5 PositiveCategory Condition All Urban Suburban Exurban Rural
Budget Sales tax collections
Total general fund revenue
Residential property tax collections
Utility bills/other fees collections
Commercial property tax collections
Income tax collections
Parking revenue
Economic Development Remote work
Downtown development
Commercial/Retail property values
Number of new business starts
Number of business expansions
Workforce development opportunities
Arts and culture
Health of retail sector
Number of business recruitments
Number of business license applications
Hotel/motel occupancy rates
Economic outcomes for people of color
Health and Human Services Health care access
Population increase
Crime rate decrease
Population decrease
Housing and Neighborhood Home property values
Neighborhood stabilization/vibrancy
Affordable housing supply
Price of rentals/apartments
Infrastructure and Resilience Availability of parks, recreation and/OR community green space
Access to clean drinking water
Availability of broadband/digital connectivity
Funding for emergency management and/or hazard mitigation
Infrastructure funding (including climate and resilience-relatedupgrades)
Flooding/Storm water Management
Quality of transportation signals and lighting
Quality of public transit
Funding for recycling & waste management
Quality of roads and bridges
Quality of pedestrian and bike infrastructure
0,00%
1,40%
3,26%
17,21%
12,09%
20,93%
28,37%
0,00%
3,15%
7,87%
12,60%
17,32%
20,47%
18,90%
1,10%
3,87%
4,42%
6,63%
22,10%
21,55%
21,55%
0,00%
2,74%
12,33%
2,74%
17,81%
19,18%
27,40%
0,34%
2,71%
5,93%
11,36%
17,12%
21,19%
24,41%
1,86%
5,12%
5,12%
2,79%
6,51%
3,72%
5,12%
5,12%
8,84%
6,51%
9,77%
29,77%
2,36%
5,51%
3,15%
6,30%
2,36%
8,66%
7,87%
8,66%
11,81%
12,60%
11,81%
29,92%
1,66%
1,10%
4,97%
4,97%
6,63%
8,29%
6,63%
11,60%
11,60%
12,71%
23,20%
20,44%
2,74%
4,11%
8,22%
9,59%
8,22%
10,96%
12,33%
5,48%
5,48%
15,07%
27,40%
30,14%
2,03%
3,90%
5,08%
5,08%
5,93%
7,12%
7,12%
8,14%
10,00%
11,02%
16,61%
27,46%
0,47%
6,51%
13,02%
26,05%
0,79%
8,66%
14,17%
25,98%
1,66%
13,81%
25,97%
19,34%
0,00%
9,59%
15,07%
26,03%
0,85%
9,66%
17,80%
24,41%
6,05%
10,23%
8,37%
42,79%
5,51%
6,30%
13,39%
52,76%
2,21%
9,94%
14,92%
54,14%
1,37%
1,37%
6,85%
54,79%
4,24%
8,31%
11,36%
50,51%
0,00%
0,00%
0,47%
1,86%
2,33%
5,12%
7,44%
6,98%
27,91%
49,30%
40,93%
0,00%
0,00%
3,15%
2,36%
2,36%
3,94%
6,30%
5,51%
21,26%
44,09%
40,94%
0,00%
0,00%
2,76%
3,31%
4,42%
6,63%
7,18%
8,29%
11,60%
30,94%
45,86%
0,00%
0,00%
0,00%
2,74%
2,74%
6,85%
9,59%
12,33%
15,07%
24,66%
38,36%
0,00%
0,00%
1,69%
2,71%
3,05%
5,59%
7,46%
7,80%
20,34%
40,17%
43,05%
Update: 07/06/2021 19:27:27
3130
| S
tate
of
the
Cit
ies
2021
| S
tate
of
the
Cit
ies
2021
THIS REPORT REFERENCES
findings from a survey
conducted by National League
of Cities in March and April 2021
and from mayoral ’state of the city’
addresses given between January 1
and March 31, 2021. The objective of
the survey is to determine the top
policy areas of priority in 2021 for
mayors and city governments, and to
explore the landscape of these policy
areas by gauging changes in local
conditions and which conditions had
the most significant impacts. NLC
has conducted an annual review of
mayoral state of the city speeches
since 2011. By assessing the top
policy areas identified through the
inductive process of speech coding
in NLC’s 2014-2020 studies, we
identified 10 areas that were most
popular among mayors: Economic
Development, Infrastructure, Housing,
Energy & Environment, Public
Safety, Demographics, Budgets
& Management, Health & Human
Services, Education, Government Data
& Technology.
In the 2021 survey, we asked
respondents to rank the 10 policy
areas in terms of priority for their city’s
mayor. We identified the top priorities
for 2021 by averaging the ranking of
each policy area. We also identified
indicators, or conditions, related to
each policy area (i.e. business starts,
remote work, downtown development
are related to Economic Development
policy area) and asked respondents
to report whether each indicator
had increased, decreased, stayed the
same, or whether they didn’t know.
Additionally, of all conditions, we
asked respondents to select their the
most positive and five most negative
conditions affecting their communities
over the past year. In assessing the
survey results, we wanted to get a
sense of how priorities and challenges
vary or are consistent across urban
and rural cities this year. Our report
refers to four types of cities: Urban
core, Suburban, Exurban, and Rural,
which are defined using a combination
of Federal definitions, population
thresholds and survey responses asking
for “city type.”
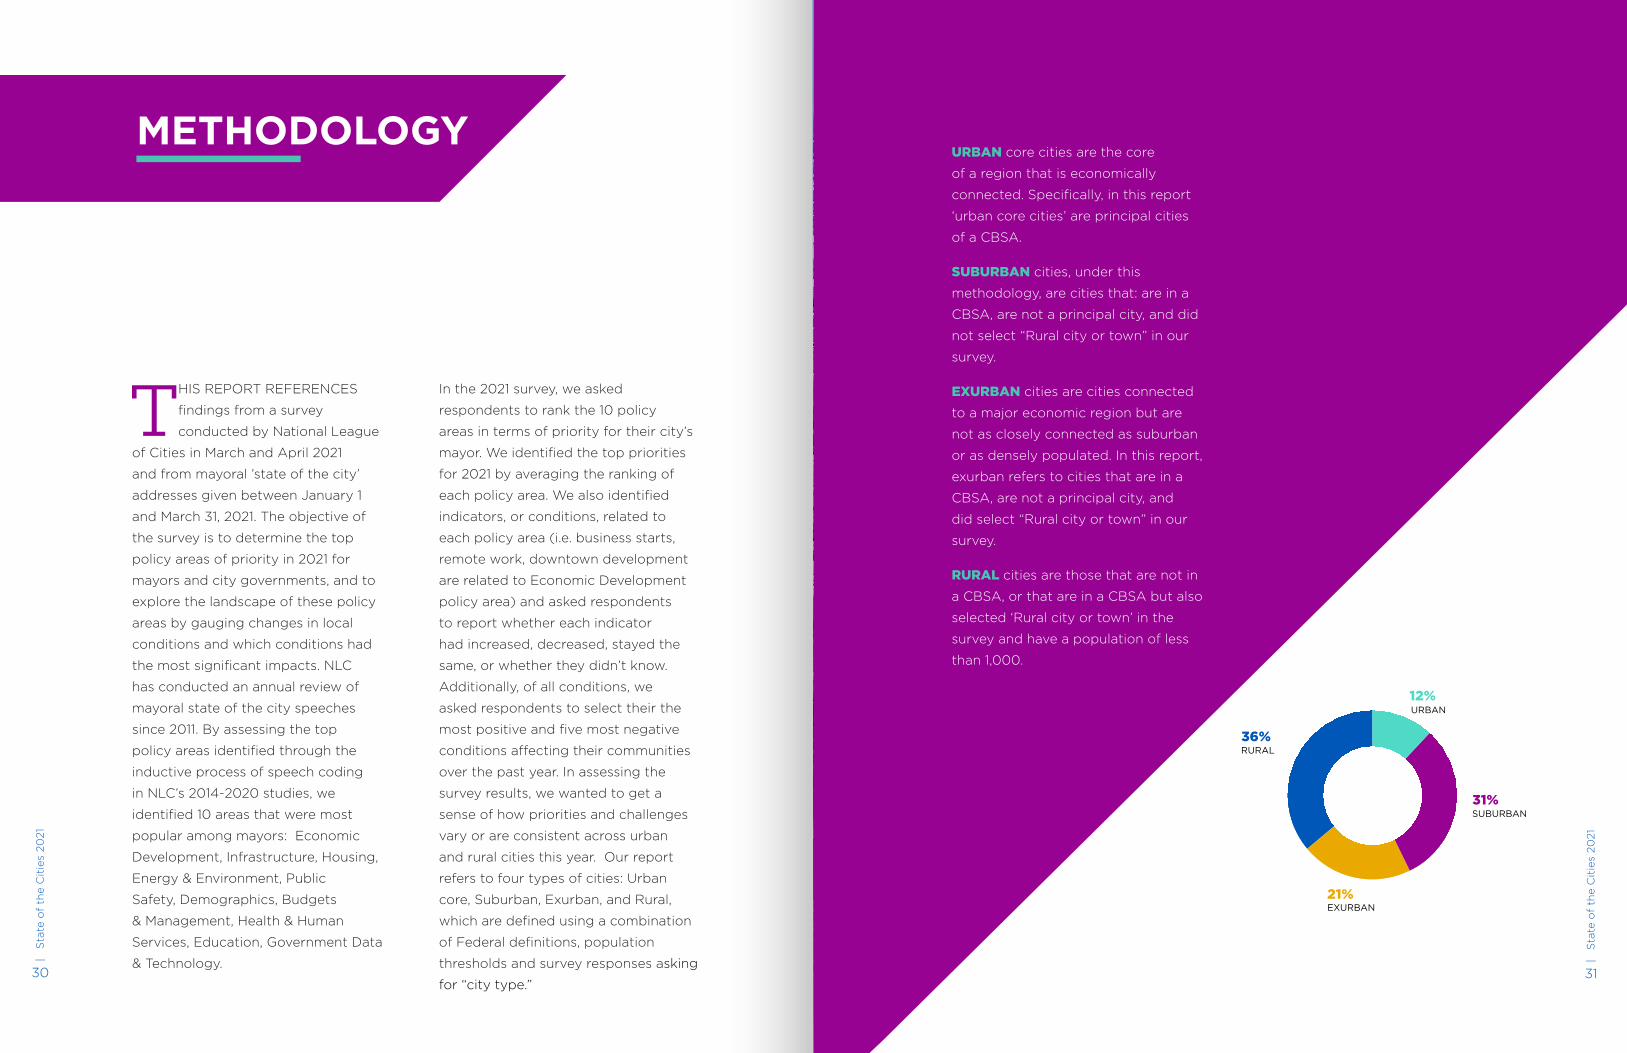
METHODOLOGYURBAN core cities are the core
of a region that is economically
connected. Specifically, in this report
‘urban core cities’ are principal cities
of a CBSA.
SUBURBAN cities, under this
methodology, are cities that: are in a
CBSA, are not a principal city, and did
not select “Rural city or town” in our
survey.
EXURBAN cities are cities connected
to a major economic region but are
not as closely connected as suburban
or as densely populated. In this report,
exurban refers to cities that are in a
CBSA, are not a principal city, and
did select “Rural city or town” in our
survey.
RURAL cities are those that are not in
a CBSA, or that are in a CBSA but also
selected ‘Rural city or town’ in the
survey and have a population of less
than 1,000.
RURAL
EXURBAN
SUBURBAN
URBAN CORE
URBAN12%
SUBURBAN31%
EXURBAN21%
RURAL36%
33
| S
tate
of
the
Cit
ies
2021
32
| S
tate
of
the
Cit
ies
2021
1 Mayor Gorton delivers State of the Merged Government address. (2021, January 26). FOX 56, WDKY News. https://foxlexington.com/news/local/mayor-gorton-delivers-state-of-the-merged-government-address/
2 Administrative Order. (2020). Office of the Mayor City of Atlanta. https://www.atlantaga.gov/Home/ShowDocument?id=45350
3 Shinn, M. (2020, November 15). Colorado Springs Utilities suspending disconnections during coronavirus outbreak. Colorado Springs Gazette. https://gazette.com/news/colorado-springs-utilities-suspending-disconnections-during-coronavirus-outbreak/article_1253c286-67a8-11ea-8646-7f6cd284f17a.html
4 BGMU, Warren Water, Atmos, WRECC to halt disconnections amid outbreak. (2020). Daily News. https://www.bgdailynews.com/news/bgmu-warren-water-atmos-to-halt-disconnections-amid-outbreak/article_b9b2c14f-eeeb-55eb-96bc-51375fa017ef.html
5 NACWA, & K, S. (2020). Recovering from Coronavirus. https://www.nacwa.org/docs/default-source/resources---public/water-sector-covid-19-financial-impacts.pdf?sfvrsn=98f9ff61_2
6 State of the City | Bentonville, AR. (2021, February 9). The City Bentonville. https://www.bentonvillear.com/600/State-of-the-City
7 Leggett, P. (2021, April 14). Mayor Carter Announces Temporary Road Closures on Four City Streets To Support Physically Distant Outdoor Activities This Spring and Summer. Saint Paul, Minnesota. https://www.stpaul.gov/news/mayor-carter-announces-temporary-road-closures-four-city-streets-support-physically-distant
8 Office of the Press Secretary to the Mayor. (2021, March 30). Richmond to install five parklets adjacent to local businesses. http://richmondvaannouncements.blogspot.com/2021/03/richmond-to-install-five-parklets.html
9 Mock, B. (2020, May 26). The Toxic Intersection of Racism and Public Space. Bloomberg CityLab. https://www.bloomberg.com/tosv2.html?vid=&uuid=35f268f0-b739-11eb-8a3b-3d839e0de9f7&url=L25ld3MvYXJ0aWNsZXMvMjAyMC0wNS0yNi9hbXktY29vcGVyLWV4cG9zZXMtZ3JlZW4tc3BhY2Utcy1yYWNlLXByb-2JsZW0= Boston University. (2021, April 9). City Leaders Expect New Appreciation of Outdoors to Last | BU Today. http://www.bu.edu/articles/2021/menino-survey-of-mayors-urban-parks/
10 City of Little Rock and Little Rock School District Collaborate | City of Little Rock. (2021, April 23). City of Little Rock Public Relations. https://www.littlerock.gov/news/city-of-little-rock-and-little-rock-school-district-collaborate/
11 Cities Can’t Wait for Federal Broadband Investment. (2021, May 12). National League of Cities. https://www.nlc.org/article/2021/05/12/cities-cant-wait-for-federal-broadband-investment/
12 Mobile Hotspot and Tablet Checkout Pilot Program. (2021, March 17). City of Orlando. https://www.orlando.gov/News/Press-Releases/2021-Press-Releases/The-City-of-Orlando-Works-to-Bridge-Digital-Divide-with-Mobile-Hotspot-and-Tablet-Checkout-Pilot-Program
13 Digital Equity Fund reopened to accept applications. (2021, April 1). Boston.Gov. https://www.boston.gov/news/digital-equity-fund-reopened-accept-applications
14 Sundquist, E. (2021, January 25). State of the City. City of Jamestown. https://www.jamestownny.gov/wp-content/uploads/2021/01/SOC-2021-Final-Report-with-Cover.pdf
ENDNOTES 15 Congress’ Delay Slashes Main Street Investments Amid COVID-19. (2020, October 21). National League of Cities. https://www.nlc.org/article/2020/10/20/congress-delay-slashes-main-street-investments-amid-covid-19/
16 City of San Diego. (2021). 2021 State of the City Prepared Remarks. https://www.sandiego.gov/sites/default/files/2021-mayor-gloria-sotc-address.pdf
17 Cities Prepared for Rainy Days, but Not a Fiscal Tsunami. (2020, October 23). National League of Cities. https://www.nlc.org/article/2020/06/08/cities-prepared-for-rainy-days-but-not-a-fiscal-tsunami/
18 National League of Cities. (2020). City Fiscal Conditions. https://www.nlc.org/wp-content/uploads/2020/08/City_Fiscal_Conditions_2020_FINAL.pdf
19 The Danger of Conflating State and Local Pandemic Relief. (2021, February 8). National League of Cities. https://www.nlc.org/article/2021/02/08/the-danger-of-conflating-state-and-local-pandemic-relief/
20 Melo, F. (2020, August 20). St. Paul Mayor Melvin Carter unveils budget that avoids layoffs despite deep cuts, no tax increase. Twin Cities. https://www.twincities.com/2020/08/20/st-paul-mayor-melvin-carter-unveils-budget-that-avoids-layoffs-despite-deep-cuts-no-tax-increase/
21 State of City. (2021, February 4). City of Troy. http://www.troyny.gov/wp-content/uploads/2021/02/2021-04-05-State-of-the-City-Address_FINAL.pdf
22 Oberle, M. (2021, April 27). Grand Rapids proposed budget shortfalls offset by American Rescue Plan. WXMI. https://www.fox17online.com/news/local-news/grand-rapids/live-at-10-a-m-grand-rapids-city-manager-presents-2022-budget
23 Mayor Henry’s State of the City speech. (2021, February 27). City of Fort Wayne. https://www.cityoffortwayne.org/latest-news/1180-mayor-henrys-state-of-the-city-speech.html
24 Engaging Leaders Voices: New Visions of Public Safety. (2020, October 14). National League of Cities. https://www.nlc.org/article/2020/09/18/engaging-leaders-voices-new-visions-of-public-safety/
25 Trending Topics: What Mayors Are Tweeting About Shifts in Public Safety Policy. (2020, October 30). National League of Cities. https://www.nlc.org/article/2020/10/30/trending-topics-what-mayors-are-tweeting-about-shifts-in-public-safety-policy/
26 National League of Cities. (2020b). How State and Local Governments Can Work Together to Create Better, Safer Communities. https://www.nlc.org/wp-content/uploads/2021/01/NLC2021_ReimaginingPolicing.pdf
27 Mayor Lori Lightfoot. (2020). Twitter. https://twitter.com/chicagosmayor/status/1272537882658398208
28 Mayor Joe Hogsett on. (2020). Twitter. https://twitter.com/IndyMayorJoe/status/1292967547537698817
29 Tom Moran, Star-Ledger Editorial Board. (2021, January 11). Newark cops, with reform, didn’t fire a single shot in 2020 | Moran. Nj. https://www.nj.com/news/2021/01/newark-cops-with-reform-didnt-fire-a-single-shot-in-2020-moran.html
30 Jim #VaxUpPhilly Kenney on. (2020, June 25). Twitter. https://twitter.com/PhillyMayor/status/1276242686161367042
31 NLC Assembles Task Force of Local Leaders to Reimagine Public Safety in Communities Across the U.S. (2021, February 16). National League of Cities. https://www.nlc.org/post/2021/02/16/nlc-assembles-task-force-of-local-leaders-to-reimagine-public-safety-in-communities-across-the-u-s/#:%7E:text=The%20Task%20Force%20will%20work,justice%20reform%20and%20public%20safety.
32 Scott, B. (2021). 2021 State of the City Address. Mayor Brandon M. Scott. https://mayor.baltimorecity.gov/2021-state-city-address
33 Weinbrecht, H. (2021, January 27). State of Cary | Town of Cary. Town of Cary. https://www.townofcary.org/mayor-council/town-council/state-of-cary
35
| S
tate
of
the
Cit
ies
2021
34
| S
tate
of
the
Cit
ies
2021
34 Swehla, R. (2021, March 16). The Rise Of The Outpost Economy: Three Things Causing A Realignment Of The Employment Landscape. Forbes. https://www.forbes.com/sites/forbesfinancecouncil/2021/03/17/the-rise-of-the-outpost-economy-three-things-causing-a-realignment-of-the-employment-landscape/?sh=4089f1284ad2
35 Powe, H. L. A. M. (2020, December 1). Why Main Streets are a key driver of equitable economic recovery in rural America. Brookings. https://www.brookings.edu/research/why-main-streets-are-a-key-driver-of-equitable-economic-recovery-in-rural-america/
36 Lichter, D. (2015, October 15). Immigration and the New Racial Diversity in Rural America. https://www.ncbi.nlm.nih.gov/pmc/articles/PMC4606139/
37 University of Minnesota. (2015). IPUMS Abacus. IPUMS Abascus. https://usa.abacus.ipums.org/#/tabulator/
38 Monroe, M. (2020, April 17). The coronavirus pandemic highlights the importance of disaggregating U.S. data by race and ethnicity. Equitable Growth. https://equitablegrowth.org/the-coronavirus-pandemic-highlights-the-importance-of-disaggregating-u-s-data-by-race-and-ethnicity/
39 Austin Public Health Expands COVID-19 Testing to Neighborhood Testing Sites | AustinTexas.gov. (2020, July 7). CITY OF AUSTIN. https://www.austintexas.gov/news/austin-public-health-expands-covid-19-testing-neighborhood-testing-sites
40 Disaggregated Data by Race and Ethnicity Can Help Us Get Closer to Recovery from COVID-19. (2020, October 23). National League of Cities. https://www.nlc.org/article/2020/08/25/disaggregated-data-by-race-and-ethnicity-can-help-us-get-closer-to-recovery-from-covid-19/
41 Scott Jr., F. (2021). State of the City. City of Little Rock. https://www.littlerock.gov/media/8067/2021-sotc-website-script.pdf
42 Giammona, C. (2021, April 27). U.S. Home Prices Surge Most Since 2006 With Tight Inventory. Https://Www.Bloomberg.Com/News/Articles/2021-04-27/Home-Prices-in-u-s-Surge-Most-since-2006-with-Inventory-Tight. https://www.bloomberg.com/news/articles/2021-04-27/home-prices-in-u-s-surge-most-since-2006-with-inventory-tight
43 Jaekel, B. (2021, May 10). Lumber Shortage Is the Latest to Exhibit Supply Chain’s Impact. Supply and Demand Chain Executive. https://www.sdcexec.com/sourcing-procurement/article/21427201/lumber-shortage-is-the-latest-to-exhibit-supply-chains-impact
44 Campisi, N. (2020, November 6). Low Mortgage Rates and High Home Prices Shatter Records, But Will It Last? Forbes. https://www.forbes.com/advisor/mortgages/low-mortgage-rates-high-home-prices/
45 M. Scott, B. (2021, April 21). Mayor Brandon M. Scott Exploring City Purchase of Hotels to Provide Short-Term & Permanent Housing Solutions for People Experiencing Homelessness. Office of the Mayor, Baltimore City. https://mayor.baltimorecity.gov/news/press-releases/2021-04-21-mayor-brandon-m-scott-exploring-city-purchase-hotels-provide-short
46 Rice, A. (2021, May 13). Lewiston Ramada hotel wellness shelter will operate through September. Lewiston Sun Journal. https://www.sunjournal.com/2021/05/12/lewiston-ramada-hotel-wellness-shelter-will-operate-through-september/
47 Swanson, C. (2021b, May 6). Denver to turn hotel into a shelter for some of its homeless population. The Denver Post. https://www.denverpost.com/2021/05/06/denver-buying-hotel-homeless-shelter/
48 City launches “Help for the Hurdles” to connect more homeless people with jobs | Office of Homeless Services. (2021b, April 6). City of Philadelphia. https://www.phila.gov/2021-04-06-city-launches-help-for-the-hurdles-to-connect-more-homeless-people-with-jobs/
49 Denver: Accelerate Vaccines for People Experiencing Homelessness. (2021, February 8). City and County of Denver. https://www.denvergov.org/Government/COVID-19-Information/Public-Orders-Response/News-Updates/2021/Vaccination-Task-Force?BestBetMatch=vaccine|95c94ae0-247e-4b0c-b511-f9439cc122bd|c4f1b630-3cf4-4ec1-8110-c4784b6aa32e|en-US
50 Martin, H. (2021, May 10). Data Updates: Measuring Evictions during the COVID-19 Crisis. Website. https://www.clevelandfed.org/newsroom-and-events/publications/community-development-briefs/db-20200902-data-updates-measuring-evictions-during-the-covid-19-crisis.aspx
51 U.S. Eviction Filing Patterns in 2020. (2021, April 21). SAGE Journals. https://journals.sagepub.com/doi/full/10.1177/23780231211009983
52 King, N. (2020, July 21). It “Looks Very Scary For Renters” As Federal Eviction Relief Expiration Nears. NPR. https://www.npr.org/sections/coronavirus-live-updates/2020/07/21/893406577/as-protections-expire-millions-of-americans-face-threats-of-eviction
53 Panfil, Y., & Lowery, L. (2021, February 3). We Have to Close the Eviction Data Gap. Bloomberg. https://www.bloomberg.com/news/articles/2021-02-03/why-is-it-so-hard-to-collect-good-eviction-data
54 Oregon Eviction Moratorium FAQ. (2021, January 14). Portland.Gov. https://www.portland.gov/phb/rental-services/helpdesk/oregon-eviction-moratorium-faq
55 City, Jacksonville Bar Association Partner to Prevent Evictions and Foreclosures. (2020, November 25). City of Jacksonville, FL. https://www.coj.net/welcome/news/city,-jacksonville-bar-association-partner-to-prev
56 Info. (2021). RVA Evictions. https://www.rvaevictions.org/info
57 Department: Office of Tenant Legal Services. (2021). City of Newark. https://www.newarknj.gov/departments/office-of-tenant-legal-services
58 Eviction Resolution – UNCG Community Engagement. (2021). UNC Greensboro. https://communityengagement.uncg.edu/eviction-resolution/
59 LANC. (2017). Spotlight: Durham’s Eviction Diversion Program. LEGAL AID OF NORTH CAROLINA. https://www.legalaidnc.org/sites/default/files/2020-01/durham-eviction-diversion-program.pdf
60 Tenant / Landlord Mediation Services. (2021, April 7). City of Palo Alto. https://www.cityofpaloalto.org/Departments/Community-Services/Human-Services/Tenant-Landlord-Mediation-Services
61 Franklin, C. (2021, January 28). State of Everett 2021. City of Everett. https://www.everettwa.gov/DocumentCenter/View/27347/State-of-Everett-2021?bidId=
THESTATE
OF THE CITIES
2021