STATE FINANCES: A STUDY OF BUDGETS OF 2004-051
71
Reserve Bank of India 1 STATE FINANCES: A STUDY OF BUDGETS OF 2004-05 1 Overview The State Government budgets for 2004-05 2 were presented against the backdrop of persistent structural weaknesses in their finances and an exacerbation of fiscal stress in 2003-04, following a transitory moderation during the previous three years. In view of the Parliamentary and Legislative Assembly elections scheduled during April-May 2004, many State Governments first presented Vote- on-Account budgets, and the regular budgets, subsequently. These budgets were presented in an environment marked by a growing recognition of the urgent need for fiscal consolidation and the progressive implementation of fiscal and institutional reforms by a number of States. Notwithstanding these initiatives, the evolving fiscal scenario reaffirmed the existence of vulnerabilities in State Government finances. As documented in various studies and reports including those of the Reserve Bank, the structural weaknesses in the finances of State Governments had become clearly manifest during the 1990s. These were reflected in the persistent expansion of the revenue deficit (RD) and gross fiscal deficit (GFD), large accumulation of debt, mounting debt service burden, rising share of committed but non- developmental expenditures, low and declining non-tax revenues and increasing contingent liabilities. Recognising the urgent need for fiscal correction, a number of State Governments had initiated an array of reforms in the late 1990s covering taxation, user charges on public services, public sector enterprises, expenditure management, contingent liabilities and more recently, the enactment of fiscal responsibility legislation. The Central Government also introduced measures to encourage and facilitate fiscal reforms at the State level; such measures included, inter alia, the Fiscal Reforms Facility and the Debt Swap Scheme. Some signs of improvement in State finances were evident in the initial years of the present decade, facilitated, inter alia, by a moderation in the rate of growth of revenue expenditure. All the major deficit indicators, as ratios to GDP, recorded a decline over the period 2000-01 to 2002-03. This positive development, however, turned out to be transitory, with the revised estimates of 2003-04 showing a sharp deterioration in fiscal imbalances. Slippages were witnessed for the State Governments in respect of the major deficit indicators in the revised estimates for 2003-04 from their budgeted levels. The RD increased to 2.6 per cent of GDP in the revised estimates for 2003-04, which was substantially higher than that of 1.8 per cent in the budget estimates and 1.7 per cent during the latter half of the 1990s. The persistent and rising RD resulted in the widening of the GFD. The GFD of the State Governments was placed at 5.1 per cent of GDP in the revised estimates for 2003-04 as compared with 4.2 per cent in the budget estimates and an average of around 3.5 per cent during the second half of the 1990s. The fiscal imbalances led to a steady accumulation of debt 3 and consequently, the debt- GDP ratio increased by over seven percentage 1. Prepared in the Division of State and Local Finances (DSLF) of the Department of Economic Analysis and Policy (DEAP), with the technical support of the Regional Offices, the Division of Econometrics and the Division of Central Finances of DEAP. 2. An analysis of the consolidated fiscal position of State Governments based on the budgets of 26 States (some of which were Vote on Account) for 2004-05 has been published in the Reserve Bank of India Annual Report, 2003-04. This Study covers 29 State budgets. It provides further details on the consolidated fiscal position as also a State-wise analysis covering budgetary data as well as additional information obtained from the State Governments and the Government of India. 3. In this Study, the debt of the State Governments comprises of Internal Debt (including market borrowings and securities issued to the National Small Savings Fund), Loans and Advances from the Centre, Small Savings, State Provident Funds, Insurance and Pension Funds, Trusts and Endowments. text_final.p65 1/6/05, 12:06 AM 1
-
Upload
khangminh22 -
Category
Documents
-
view
6 -
download
0
Transcript of STATE FINANCES: A STUDY OF BUDGETS OF 2004-051

Reserve Bank of India
1
STATE FINANCES:A STUDY OF BUDGETS OF 2004-051
Overview
The State Government budgets for 2004-052
were presented against the backdrop of persistentstructural weaknesses in their finances and anexacerbation of fiscal stress in 2003-04, followinga transitory moderation during the previous threeyears. In view of the Parliamentary and LegislativeAssembly elections scheduled during April-May2004, many State Governments first presented Vote-on-Account budgets, and the regular budgets,subsequently. These budgets were presented in anenvironment marked by a growing recognition ofthe urgent need for fiscal consolidation and theprogressive implementation of fiscal andinstitutional reforms by a number of States.Notwithstanding these initiatives, the evolvingfiscal scenario reaffirmed the existence ofvulnerabilities in State Government finances.
As documented in various studies and reportsincluding those of the Reserve Bank, the structuralweaknesses in the finances of State Governmentshad become clearly manifest during the 1990s.These were reflected in the persistent expansion ofthe revenue deficit (RD) and gross fiscal deficit(GFD), large accumulation of debt, mounting debtservice burden, rising share of committed but non-developmental expenditures, low and decliningnon-tax revenues and increasing contingentliabilities. Recognising the urgent need for fiscalcorrection, a number of State Governments hadinitiated an array of reforms in the late 1990scovering taxation, user charges on public services,public sector enterprises, expenditure management,
contingent liabilities and more recently, theenactment of fiscal responsibility legislation. TheCentral Government also introduced measures toencourage and facilitate fiscal reforms at the Statelevel; such measures included, inter alia, the FiscalReforms Facility and the Debt Swap Scheme.
Some signs of improvement in State financeswere evident in the initial years of the presentdecade, facilitated, inter alia, by a moderation inthe rate of growth of revenue expenditure. All themajor deficit indicators, as ratios to GDP, recordeda decline over the period 2000-01 to 2002-03. Thispositive development, however, turned out to betransitory, with the revised estimates of 2003-04showing a sharp deterioration in fiscal imbalances.
Slippages were witnessed for the StateGovernments in respect of the major deficitindicators in the revised estimates for 2003-04 fromtheir budgeted levels. The RD increased to 2.6 percent of GDP in the revised estimates for 2003-04,which was substantially higher than that of 1.8 percent in the budget estimates and 1.7 per cent duringthe latter half of the 1990s. The persistent and risingRD resulted in the widening of the GFD. The GFDof the State Governments was placed at 5.1 per centof GDP in the revised estimates for 2003-04 ascompared with 4.2 per cent in the budget estimatesand an average of around 3.5 per cent during thesecond half of the 1990s.
The fiscal imbalances led to a steadyaccumulation of debt3 and consequently, the debt-GDP ratio increased by over seven percentage
1. Prepared in the Division of State and Local Finances (DSLF) of the Department of Economic Analysis and Policy (DEAP),with the technical support of the Regional Offices, the Division of Econometrics and the Division of Central Finances ofDEAP.
2. An analysis of the consolidated fiscal position of State Governments based on the budgets of 26 States (some of which wereVote on Account) for 2004-05 has been published in the Reserve Bank of India Annual Report, 2003-04. This Study covers 29State budgets. It provides further details on the consolidated fiscal position as also a State-wise analysis covering budgetarydata as well as additional information obtained from the State Governments and the Government of India.
3. In this Study, the debt of the State Governments comprises of Internal Debt (including market borrowings and securitiesissued to the National Small Savings Fund), Loans and Advances from the Centre, Small Savings, State Provident Funds,Insurance and Pension Funds, Trusts and Endowments.
text_final.p65 1/6/05, 12:06 AM1

State Finances : A Study of Budgets of 2004-05
2
points to 29.1 per cent over the five-year periodended March 31, 2004. Interest payments on debtpre-empted over 25 per cent of revenue receipts in2003-04, accentuating the resource constraint. Thecomposition of outstanding liabilities of the StateGovernments shows a sharp decline in the share ofloans from the Centre and upsurge in the shares ofloans from National Small Savings Fund (NSSF),market loans and negotiated loans from banks andother institutions.
Apart from the increasing level of debt, theoutstanding guarantees of State Governmentsincreased from 4.4 per cent of GDP as at end-March1996 to 8.1 per cent per cent of GDP as at end-March 2001 and were placed at 7.5 per cent(Rs.1,84,294 crore) of GDP at end-March 2003.4
Such contingent liabilities could add to the alreadyhigh debt burden in the event of default by theborrowing entity.
One of the factors that had engendered the sharpincrease in the resource gaps during 2003-04 wasthe issue of power bonds by State Governments toCentral Public Sector Undertakings under the One-Time Settlement Scheme for dues of the StateElectricity Boards. Some State Governments alsostepped-up current assistance to the State ElectricityBoards and enhanced capital outlay on irrigationprojects during the year. Since all such expendituresare part of ‘Economic Services’, the share ofdevelopmental expenditure witnessed an increaseduring the year, in conjunction with the expansionin fiscal deficit. It is, in fact, estimated that aroundhalf of the increase in the GFD-GDP ratio in 2003-04 over the budget estimates was on account oftransactions relating to the power sector. There was,however, no let-up in the increase in non-developmental expenditures nor any improvementin non-tax revenue mobilisation by the StateGovernments during 2003-04, highlighting thepersistence of structural infirmities in their finances.An econometric analysis of the GFD of fifteenmajor State Governments over the 1990-91 to 2003-04, as set out in Box 1, in fact, corroborated thepredominance of the structural component as wellas the underlying variation between expenditure and
revenue elasticities.
A positive aspect, however, has been that theStates’ own tax revenue, at 5.9 per cent of GDP in2003-04, continued to show an upward movement,albeit gradual, since the 1990s, in contrast to thetrends in respect of the Centre’s gross tax revenues.The improvement in own tax revenues was reflectedacross most State Governments. Within own taxrevenues, however, the shares of State Excise Dutiesand Profession Tax have recorded a clear decline.It is also well recognised that the consolidatedposition on the tax front camouflages inter-Statevariations. The own tax-GSDP ratios were amongstthe highest in the case of Karnataka and Tamil Naduduring 2003-04, whereas those in respect of Biharand West Bengal were relatively lower. Moreover,a distinction is usually drawn between the taxcapacity of a State Government and its tax effort;while the former relates to the level of economicactivity in the State, the latter connotes theinitiatives that the State has taken to, inter alia,expand the tax base, rationalise the tax structureand improve tax administration. An empiricalexercise in respect of fifteen major States, aspresented in Box 2, also showed markeddifferentials in tax efforts of the State Governments.
A milestone in the process of tax reforms wouldbe the implementation of Value Added Tax (VAT)at the State level. As announced in the UnionBudget for 2004-05, the scheduled date forimplementation of VAT is April 1, 2005. Theexperience of Haryana, the only State to implementVAT so far, highlights the positive implications ofsuch initiatives. Even so, there are a number ofissues that are germane to the implementation ofVAT in India, which are well recognised by theEmpowered Committee of State Finance Ministerson VAT. Indeed, many of the associatedinternational practices relating to VAT may have tobe judiciously modified to suit the fiscal-federalframework of India. Some of these issues aresummarised in Box 3.
The States’ own non-tax revenues have beenan area of persistent concern. A major reason
4. The data on guarantees are based on information received from seventeen States for all the years.
text_final.p65 1/6/05, 12:06 AM2

Reserve Bank of India
3
underlying the sluggish growth in non-tax revenuesis the levy of inadequate user charges. This isreflected in poor cost recovery towards provisionof public services. In fact, calculations undertakenin subsequent Sections show that cost recovery inthe case of education and health services havehovered around 1 per cent and 5 per cent,respectively, in the recent period. The cost recoveryin respect of economic services such as irrigation,roads and power is found to be higher than that ofsocial services, but still remain quite low. A relatedissue that assumes significance in this context isthat of power subsidies. These subsidies haveincreased manifold over the years and even aftersubventions (financial support) from StateGovernments and cross-subsidisation, themagnitude of the ‘uncovered’ subsidy leaves littlescope for the State Electricity Boards (SEBs), butto default on payments. It is expected that the One-Time Settlement Scheme would help the SEBs tostart afresh and carry forward the process of powersector reforms. In fact, a sharp increase in costrecovery is expected in the power sector during2004-05 which as reflected in the upsurge in non-tax receipts coupled with a substantial decline innon-Plan revenue expenditure from the high levelsin the previous year.
Apart from inappropriate user charges, low ornegative returns from investment have adverselyaffected the growth of States’ own non-taxrevenues.
The evolving pattern of expenditure in 2003-04 indicated a sharp increase in developmentalexpenditure as a ratio to GDP. This largely reflectedhigher (revenue and capital) expenditure on thepower sector (which is recorded under ‘EconomicServices’). The increase in developmentalexpenditure during 2003-04 was evident acrossmost State Governments. Non-developmentalexpenditure, as a ratio to GDP, also maintained itssteady upward trend to 6.4 per cent of GDP in 2003-04. The ratio of non-developmental expenditure toGSDP was relatively high in the case of Bihar,
Orissa, Punjab and Uttar Pradesh. Within non-developmental expenditure, interest paymentsabsorbed over 25 per cent of revenue receipts atthe consolidated level, which was substantiallyhigher than that of 18 per cent recommended bythe Eleventh Finance Commission (EFC) from theviewpoint of debt sustainability over the mediumterm.
The weaknesses in the finances of the StateGovernments have invited, in some cases, adversereaction from the financial markets as manifestedin the widening spread and under-subscription tomarket loans of some of the States. The spreadbetween the rate of interest on State market loansand Central market loans of ten-year maturity inthe secondary market has widened from 25 basispoints in 2000-01 to 50 basis points in the recentperiod. The under-subscription to the State marketloans also brings to the fore various factors thatimpact on their liquidity. These factors include thehealth of the finances of the State Governments,the credibility of their prospective policy actionsand transparency of their budgets. Some issues inthis regard are highlighted in Box 4.
In the context of the urgent need for fiscalcorrection, a significant initiative on the part of fiveState Governments viz., Karnataka, Kerala, Punjab,Tamil Nadu and Uttar Pradesh has been theenactment of fiscal responsibility legislation. It isindeed noteworthy that except for Uttar Pradesh,the other four State Governments recorded a declinein the revenue deficit during 2003-04 over theprevious year. In the case of Karnataka, the debt-GSDP ratio was estimated at 29.0 per cent in 2003-04 as compared with the target of 25 per cent to beattained by 20155 . The positive experience of theseState Governments is expected to motivate otherStates to expeditiously enact fiscal responsibilitylegislation.
The liquidity management of the StateGovernments since 2003-04 was facilitated byperiodic enhancement of the limits of Ways and
5. According to the Fiscal Responsibility Legislation of Karnataka, total liabilities are defined as liabilities under the ConsolidatedFund and the Public Accounts of the State Government. This definition differs from that adopted in this Study as explained inFootnote 3.
text_final.p65 1/6/05, 12:06 AM3

State Finances : A Study of Budgets of 2004-05
4
Means Advances (WMA) as also highermobilisation of Small Savings and enhanced marketborrowings. Apart from WMA from the ReserveBank, a number of States took recourse to WMAfrom the Central Government to tide over liquiditymismatches; the magnitude of such advances tosome State Governments have been persistentlylarge. The budgetary transactions of the StateGovernments have generally resulted in largenegative opening cash balances. An opening cashdeficit portends ex ante liquidity problems, whichcould exacerbate by the extent to which totalreceipts fall short of total expenditures during theyear, unless compensated by Additional ResourceMobilisation. This would, in turn, necessitate thedrawing down of cash/investment balances orrecourse to WMA/Overdrafts from the ReserveBank.
The budget estimates for 2004-05 portray anendeavour to carry forward the fiscal reform processthrough a renewed emphasis on fiscalempowerment and expenditure containment. Thebudgetary proposals include rationalisation of thetax structure, amnesty schemes for the recovery oftax arrears, computerisation of tax departments,restructuring of staff position in governmentdepartments, introduction of a pension schemebased on defined contribution and power sectorreforms. Additional Resource Mobilisation ofRs.2,046 crore has been envisaged during 2004-05.
It is, however, evident that a part of theenvisaged reduction in fiscal imbalances wouldsimply be a correction of the ‘high base effect’ ofdevelopmental (revenue and capital) expendituresincurred in the previous year. In fact, excluding thetransactions in respect of the power sector, revenueexpenditure is estimated to increase by 7.4 per centin 2004-05 as compared with 15.4 per cent in theprevious year. The volume of power subsidies,although still quite large, is estimated to declinefrom 1.6 per cent of GDP in 2000-01 to 1.1 percent in 2004-056 .
The expected improvement in the States’ fiscalposition during 2004-05 would also be contingentupon the acceleration in their share in Central taxrevenue and the revenue mobilisation efforts of theState Governments. Accordingly, the revenuedeficit is budgeted to decline from 2.6 per cent ofGDP in 2003-04 to 1.4 per cent of GDP in 2004-05which is, in fact, lower than the average level of1.7 per cent recorded during the latter half of the1990s. The GFD is estimated to have come downfrom 5.1 per cent of GDP in 2003-04 to 3.6 percent of GDP in 2004-05 which is only slightlyhigher than the level that prevailed, on an average,during the second half of the 1990s. The revenuedeficit would account for 39.1 per cent of the GFDin 2004-05 as compared with over 50 per cent inthe previous year and 44.7 per cent in the secondhalf of the 1990s.
Apart from the envisaged fiscal correction, theState budgets for 2004-05 assume specialsignificance in the context of the regular UnionBudget 2004-05 and the adoption of the NationalCommon Minimum Programme (NCMP) in July2004.
The regular Union Budget for 2004-05, whichwas presented in July 2004, after the presentationof some of the State budgets, has, inter alia,provided for higher devolution of resources to theStates and has proposed specific measures toalleviate their debt-service burden. According tothe State budgets, however, gross devolution andtransfer of resources from the Centre would declineto 5.5 per cent of GDP in 2004-05 from 5.7 percent in the previous year and 6.8 per cent, on anaverage, during the first half of the 1990s. Thebudgeted reduction in the transfer of resources fromthe Centre, as a ratio to GDP, during 2004-05 mainlyreflects the decline in Non-Plan grants.
It is also pertinent to note that the Report ofthe Twelfth Finance Commission, submitted to theHon’ble President of India recently, would providethe framework for devolution of resources from the
6. Economic Survey 2003-04, Government of India.
text_final.p65 1/6/05, 12:06 AM4
Reserve Bank of India
5
Centre over the five-year period beginning fiscal2005-06. This would, in conjunction with the roleof the States envisaged in the ensuing Mid-TermAppraisal of the Tenth Five-Year Plan (2002-07),form the policy frame for fiscal federalism over themedium term. Some of the major issues in fiscalfederalism that have emerged in the internationalarena are highlighted in Box 5.
The NCMP has, inter alia, called for the raisingof public spending on education and health and hasplaced highest priority on the development ofinfrastructure - areas where the States play animportant and ubiquitous role. It has, however, beenwell recognised, at various fora, that thedevelopmental role of the States is beingcircumscribed by the underlying stress on theirfinances. In fact, social sector expenditure(comprising social services, rural developmentand food storage and warehousing) of the StateGovernments is estimated to decline to 5.4 percent of GDP in 2004-05 from 5.9 per cent in theprevious year. Within social sector expenditures,provisions for education and health (as a ratio toaggregate disbursements) are also estimated todecline from 2.52 per cent and 0.72 per cent in2003-04 to 2.37 per cent and 0.67 per cent,respectively, in 2004-05.
Another important issue in the context of thedevelopmental role of the States is the efficiencyof government expenditures. In view of resourceconstraints for State Governments, it is worthwhileto examine whether the same developmentaloutcome could be attained with smaller governmentexpenditure. A number of international studies havebeen undertaken since the late 1990s to measurethe efficiency of government expenditures in across-country framework. Most studies underscorethe need to enhance the efficiency of Governmentexpenditures to ensure improved delivery of publicservices. Some of the measurement issues relatingto the efficiency of government expenditure arediscussed in Box 6.
The evolution of expenditures of the StateGovernments over the future would be shaped bythe changes in the demographic profile of thecountry. In particular, with increase in share of
ageing population, expenditures on health care andpensions are likely to expand at very high rates. Inthis context, the demographic issues that impingeupon the sustainability of State Governmentfinances are set out in Box 7.
Against this backdrop, the present studyanalyses the State Government budgets for 2004-05. Section I summarises the major policy initiativesproposed in the State Government budgets for 2004-05 as well as the measures undertaken by theCentral Government and the Reserve Bank in thecontext of State Government finances. Section IIpresents an analysis of the consolidated fiscalposition of the State Governments for the years2002-03 (Accounts), 2003-04 (Revised Estimates)and 2004-05 (Budget Estimates). Section IIIdiscusses the State-wise fiscal scenario. This isbased on an analysis of fifteen fiscal indicatorsclassified broadly into (i) resource gap; (ii) revenueperformance; (iii) pattern of expenditure; and (iv)debt position. The analysis of fiscal indicators isundertaken separately for Special and Non-SpecialCategory States. In the case of each category, theState Governments are placed in an ascending orderfor each fiscal indicator. The State Governmentshave then been ranked into four quartiles for eachfiscal indicator for the years 2000-03 (average) and2003-04. The State Governments are also groupedaccording to different quartiles for each fiscalindicator for 2000-03 (average) and 2003-04. Therelative strengths and weaknesses of the financialposition of the State Governments become clearerin this form of analysis. Emerging issues in StateGovernment finances are discussed in theconcluding Section. The detailed State-wise dataon revenue receipts, revenue expenditure, capitalreceipts and capital expenditure are set out inAppendices I, II, III and IV, respectively.
Section IPolicy Initiatives
(A) State-level Policy Initiatives
The State Government budgets for 2004-05seek to carry forward the reform process initiatedin the recent past. The State-wise details of theseinitiatives are set out in Annex 1. A brief summaryof these measures is presented in this Section.
text_final.p65 1/6/05, 12:06 AM5
State Finances : A Study of Budgets of 2004-05
6
(i) Revenue Mobilisation Measures
A number of State Governments have placedspecial emphasis on fiscal empowerment and, inthis context, have underscored the need to increasethe magnitude and efficiency of tax revenuemobilisation7 . The general approach is to rationaliseand simplify the tax structure, broaden the tax baseand impose moderate rates of taxation. Some StateGovernments such as Kerala, Maharashtra andJammu and Kashmir have announced one-timesettlement/amnesty schemes for recovery of taxarrears. State Governments such as Andhra Pradeshhave appointed expert committees to recommendtax reform measures, and those such as Tamil Naduare already implementing the accepted suggestionsof such expert committees. Preparations for theintroduction of VAT are also underway in manyStates. A renewed drive for computerisation of tax/budget departments, treasuries and check-posts (forimplementing VAT) is also evident in a number ofStates.
(ii) Expenditure Management
Most State Governments have reiterated theneed to contain unproductive expenditures andreorient spending towards developmental purpose.Some State Governments such as Punjab havecalled for restructuring of the staff position in eachgovernment department and have indicated thatfuture employment in the government would beproject-specific and need-based. Therecommendations of a Public Reforms Committeecovering, inter alia, Voluntary Retirement Schemeand privatisation, is under consideration by theGovernment of Assam, whereas an ExpenditureReview Committee is proposed to be constitutedby the Government of Tamil Nadu, to review, onan on-going basis, the expenditure in respect of eachdepartment. States such as Punjab have proposeddisinvestment on a selective basis in respect of loss-making Public Sector Undertakings. Some StateGovernments such as Punjab and Rajasthan haveannounced the introduction of a new pensionscheme based on defined contribution.
(iii) Institutional Reforms
State Governments which have already enactedFiscal Responsibility Legislation (FRL) (i.e.,Karnataka, Kerala, Tamil Nadu, Punjab and UttarPradesh) have formulated medium term fiscal plansto bring about an orderly correction of their financialpositions. Some of the other State Governments likeAssam, Himachal Pradesh and Rajasthan haveproposed to enact FRL. Provisions to empowerlocal bodies, on the basis of the recommendationsof the respective State Finance Commissions, arealso evident in the case of a number of StateGovernments including Haryana, HimachalPradesh, Punjab and Sikkim. Power sector reformsinitiated by the State governments in the late 1990sinclude the constitution of State ElectricityRegulatory Commissions (SERCs) for determiningthe tariff structure, unbundling of State ElectricityBoards into separate entities for power generation,transmission and distribution, raising power tariffsand measures for reducing transmission anddistribution losses. A number of States includingKarnataka and Punjab are also expected to carryforward the process of power sector reforms. It may,however, be mentioned that the NCMP hadenvisaged a review of the Electricity Act, 2003, inview of the concerns expressed by a number ofStates, and an extension of the mandatory date (June10, 2004) for unbundling and replacing the StateElectricity Boards.
(iv) Other Measures
Many States including Andhra Pradesh, TamilNadu and Mizoram have announced measures toprovide a boost to infrastructure projects. Statessuch as Gujarat, Haryana and Tamil Nadu haveproposed to set up Special Economic Zones/Agro-Export Zones. Some State Governments such asAndhra Pradesh have also made budgetaryprovisions for the supply of free power to farmers,as also for the waiver of outstanding arrears ofagricultural consumers. States like Assam haveprovided for land revenue exemption for flood-affected people.
7. The details of Additional Resource Mobilisation proposed by the States are given in Statement 24.
text_final.p65 1/6/05, 12:06 AM6
Reserve Bank of India
7
(B) Centre’s Initiatives
Following the recommendations of theEleventh Finance Commission, the Governmentof India set up an Incentive Fund during 2000-01 to encourage State Governments to initiatefiscal reforms. The corpus of the Fund wasRs.10,607.72 crore and an equal amount ofRs.2,121.54 crore was available for release to theState Governments in each year of the period2000-01 through 2004-05. Releases from theIncentive Fund to the State Governments werebased on a single monitorable fiscal objectiveviz., a minimum improvement of 5 percentagepoints in the ratio of revenue deficit to revenuereceipts in each year till 2004-05 over the baseyear (1999-2000). The revenue surplus Stateswere required to show an improvement of 3percentage points in the ratio of Balance fromCurrent Revenues to non-Plan revenueexpenditure. In order to attain this objective, theState Governments were required to formulate aMedium-Term Fiscal Reforms Programme(MTFRP) encompassing fiscal consolidation,public sector enterprises reforms, power sectorreforms and fiscal transparency. Based on theMTFRP, the States sign a Memorandum ofUnderstanding (MOU) with the Government ofIndia. As of end-December 2004, the MTFRP hadbeen finalised by 27 States while the MOUs weresigned in the case of 22 States. A total amountof Rs.5,363 crore till end-December 2004 hadbeen released from the Incentive Fund.
The Union Budget for 2003-04 had announceda Debt Swap Scheme (DSS) that would enableStates to prepay their high-cost debt to the Centrethrough additional market borrowings and proceedsfrom Small Savings (upto specified limits) at theprevailing interest rates, over a period of three yearsending 2004-05. Of the total outstanding high-costloans amounting to Rs.1,14,317 crore as at end-March 2002, Rs. 92,369 crore i.e., 80.8 per cent,(comprising Rs. 41,965 crore of Small Savingsloans and Rs.50,404 crore of market loans) has beenswapped so far. The balance of outstanding high-cost loans that remains to be swapped is Rs. 21,948crore.
The Union Budget for 2004-05 has furtherreduced the interest on loans from the Centre from10.5 per cent to 9 per cent with effect from April 1,2004; States are expected to benefit from thismeasure to the extent of Rs.375 crore during 2004-05. The Union Budget has also proposed that theDSS would be extended by allowing States to raisefresh loans and repay their old high-cost loans toNABARD and some other agencies. It was alsoproposed to consult the States on the issue ofallowing them to increase their open marketborrowings and reduce their dependence on loansfrom the Centre.
(C) Reserve Bank’s Initiatives
As the banker and debt manager to the StateGovernments, the Reserve Bank has been providingWays and Means Advances and Overdrafts facilityto the State Governments on the basis of mutualagreements to tide over temporary mismatches incash flows, and has been periodically revising theScheme in the light of evolving circumstances.
The Reserve Bank has also introducedflexibility in the market borrowing programme ofthe State Governments by allowing the States todirectly access the market upto specified amountsof gross market borrowings. The Reserve Bank hasbeen organising the conferences of State FinanceSecretaries in a structured manner since 1997,wherein a consensual approach among the CentralGovernment, State Governments and the ReserveBank has evolved on issues relating to Statefinances. The Reserve Bank constituted acommittee to frame Model Fiscal ResponsibilityLegislation at the State level; the report of thecommittee was discussed at the 14th Conferenceof State Finance Secretaries held in August 2004and is in the process of finalisation. The ReserveBank has continued its efforts to sensitise the Statesabout the problems posed by increasing volume ofguarantees. A Standing Committee has beenconstituted within the Reserve Bank to collect andmonitor information on State Governmentguaranteed advances and bonds from the investors’side on a periodic basis. Following the discussionat the last conference of State Finance Secretaries,the Reserve Bank has constituted a Working Group
text_final.p65 1/6/05, 12:06 AM7
State Finances : A Study of Budgets of 2004-05
8
on the methodology of compilation of data on StateGovernment liabilities. A summary of recentinitiatives of the Reserve Bank relating to StateGovernment finances is set out in Annex 2.
Section IIConsolidated Fiscal Position of
State Governments
(A) Accounts: 2002-03
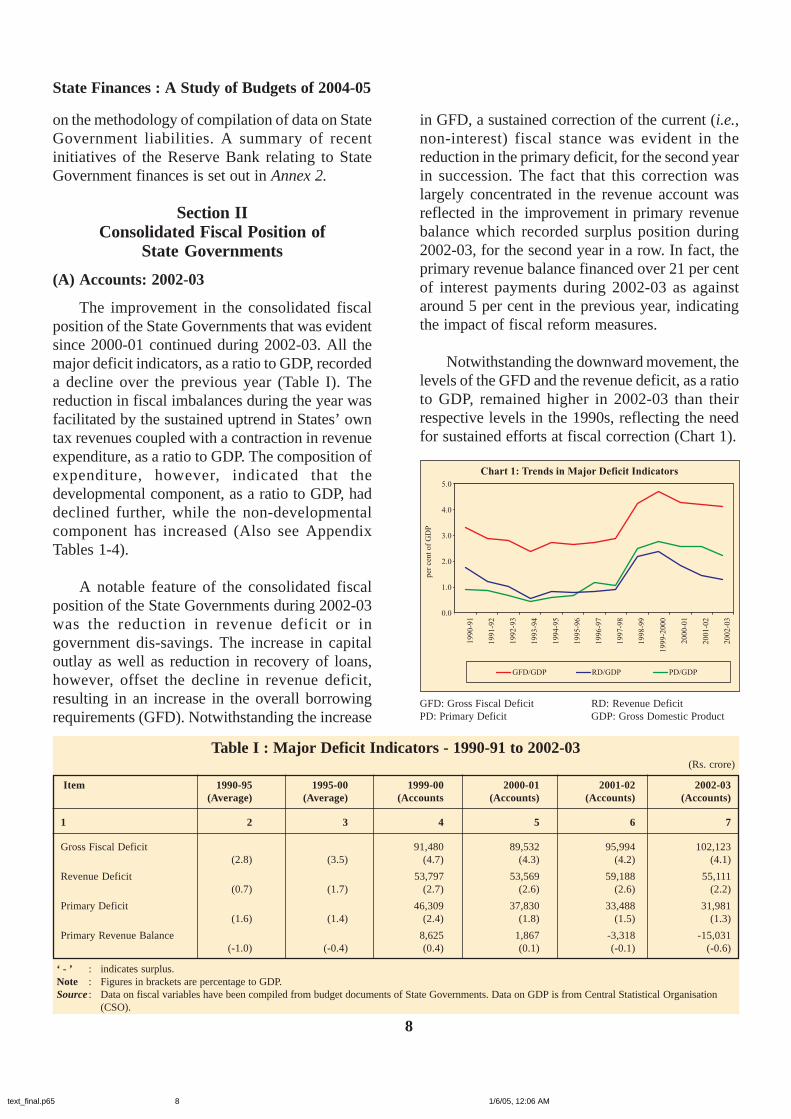
The improvement in the consolidated fiscalposition of the State Governments that was evidentsince 2000-01 continued during 2002-03. All themajor deficit indicators, as a ratio to GDP, recordeda decline over the previous year (Table I). Thereduction in fiscal imbalances during the year wasfacilitated by the sustained uptrend in States’ owntax revenues coupled with a contraction in revenueexpenditure, as a ratio to GDP. The composition ofexpenditure, however, indicated that thedevelopmental component, as a ratio to GDP, haddeclined further, while the non-developmentalcomponent has increased (Also see AppendixTables 1-4).
A notable feature of the consolidated fiscalposition of the State Governments during 2002-03was the reduction in revenue deficit or ingovernment dis-savings. The increase in capitaloutlay as well as reduction in recovery of loans,however, offset the decline in revenue deficit,resulting in an increase in the overall borrowingrequirements (GFD). Notwithstanding the increase
in GFD, a sustained correction of the current (i.e.,non-interest) fiscal stance was evident in thereduction in the primary deficit, for the second yearin succession. The fact that this correction waslargely concentrated in the revenue account wasreflected in the improvement in primary revenuebalance which recorded surplus position during2002-03, for the second year in a row. In fact, theprimary revenue balance financed over 21 per centof interest payments during 2002-03 as againstaround 5 per cent in the previous year, indicatingthe impact of fiscal reform measures.
Notwithstanding the downward movement, thelevels of the GFD and the revenue deficit, as a ratioto GDP, remained higher in 2002-03 than theirrespective levels in the 1990s, reflecting the needfor sustained efforts at fiscal correction (Chart 1).
Table I : Major Deficit Indicators - 1990-91 to 2002-03(Rs. crore)
Item 1990-95 1995-00 1999-00 2000-01 2001-02 2002-03 (Average) (Average) (Accounts (Accounts) (Accounts) (Accounts)
1 2 3 4 5 6 7
Gross Fiscal Deficit 91,480 89,532 95,994 102,123 (2.8) (3.5) (4.7) (4.3) (4.2) (4.1)
Revenue Deficit 53,797 53,569 59,188 55,111 (0.7) (1.7) (2.7) (2.6) (2.6) (2.2)
Primary Deficit 46,309 37,830 33,488 31,981 (1.6) (1.4) (2.4) (1.8) (1.5) (1.3)
Primary Revenue Balance 8,625 1,867 -3,318 -15,031(-1.0) (-0.4) (0.4) (0.1) (-0.1) (-0.6)
‘ - ’ : indicates surplus.Note : Figures in brackets are percentage to GDP.Source : Data on fiscal variables have been compiled from budget documents of State Governments. Data on GDP is from Central Statistical Organisation
(CSO).
Chart 1: Trends in Major Deficit Indicators
0.0
1.0
2.0
3.0
4.0
5.0
19
90
-91
1991-9
2
19
92
-93
19
93
-94
19
94
-95
19
95
-96
19
96
-97
19
97
-98
1998-9
9
1999-2
000
2000-0
1
20
01
-02
2002-0
3
per
cen
to
fG
DP
GFD/GDP RD/GDP PD/GDP
GFD: Gross Fiscal Deficit RD: Revenue DeficitPD: Primary Deficit GDP: Gross Domestic Product
text_final.p65 1/6/05, 12:06 AM8
Reserve Bank of India
9
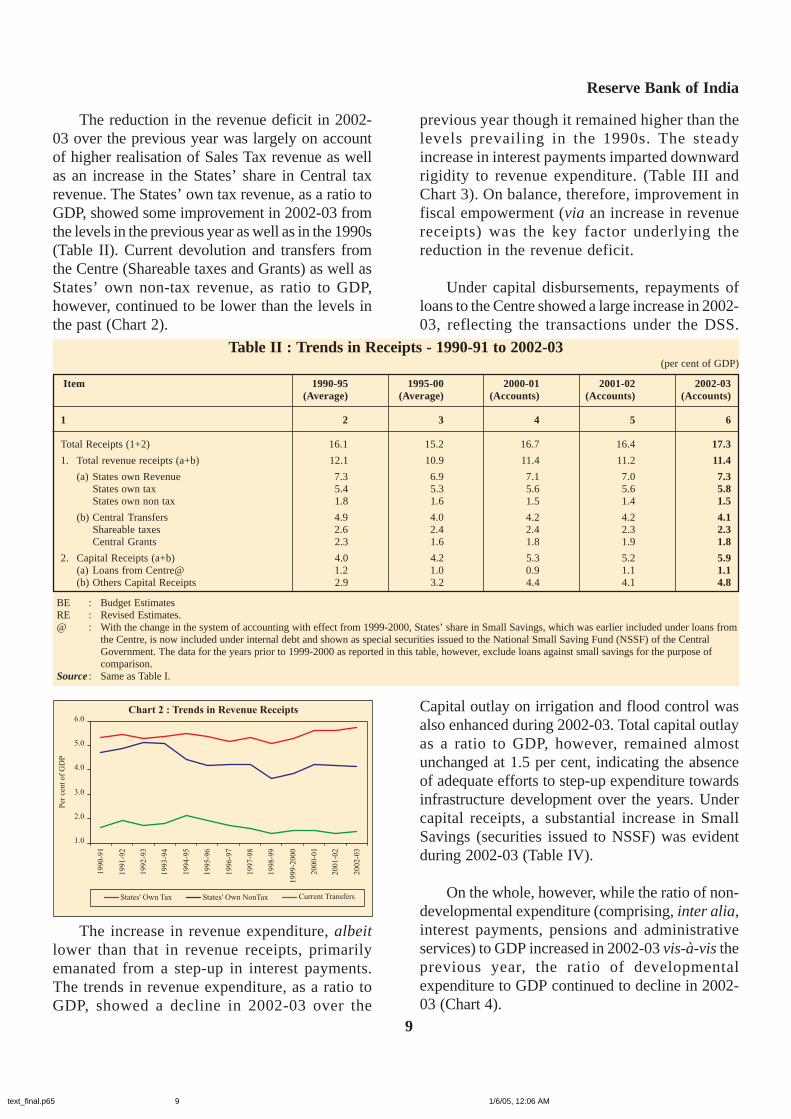
The reduction in the revenue deficit in 2002-03 over the previous year was largely on accountof higher realisation of Sales Tax revenue as wellas an increase in the States’ share in Central taxrevenue. The States’ own tax revenue, as a ratio toGDP, showed some improvement in 2002-03 fromthe levels in the previous year as well as in the 1990s(Table II). Current devolution and transfers fromthe Centre (Shareable taxes and Grants) as well asStates’ own non-tax revenue, as ratio to GDP,however, continued to be lower than the levels inthe past (Chart 2).
previous year though it remained higher than thelevels prevailing in the 1990s. The steadyincrease in interest payments imparted downwardrigidity to revenue expenditure. (Table III andChart 3). On balance, therefore, improvement infiscal empowerment (via an increase in revenuereceipts) was the key factor underlying thereduction in the revenue deficit.
Under capital disbursements, repayments ofloans to the Centre showed a large increase in 2002-03, reflecting the transactions under the DSS.
Chart 2 : Trends in Revenue Receipts
1.0
2.0
3.0
4.0
5.0
6.0
19
90
-91
19
91
-92
19
92
-93
19
93
-94
19
94
-95
19
95
-96
19
96
-97
19
97
-98
19
98
-99
19
99
-20
00
20
00
-01
20
01
-02
20
02
-03
Per
cen
to
fG
DP
States' Own Tax States' Own NonTax Current Transfers
The increase in revenue expenditure, albeitlower than that in revenue receipts, primarilyemanated from a step-up in interest payments.The trends in revenue expenditure, as a ratio toGDP, showed a decline in 2002-03 over the
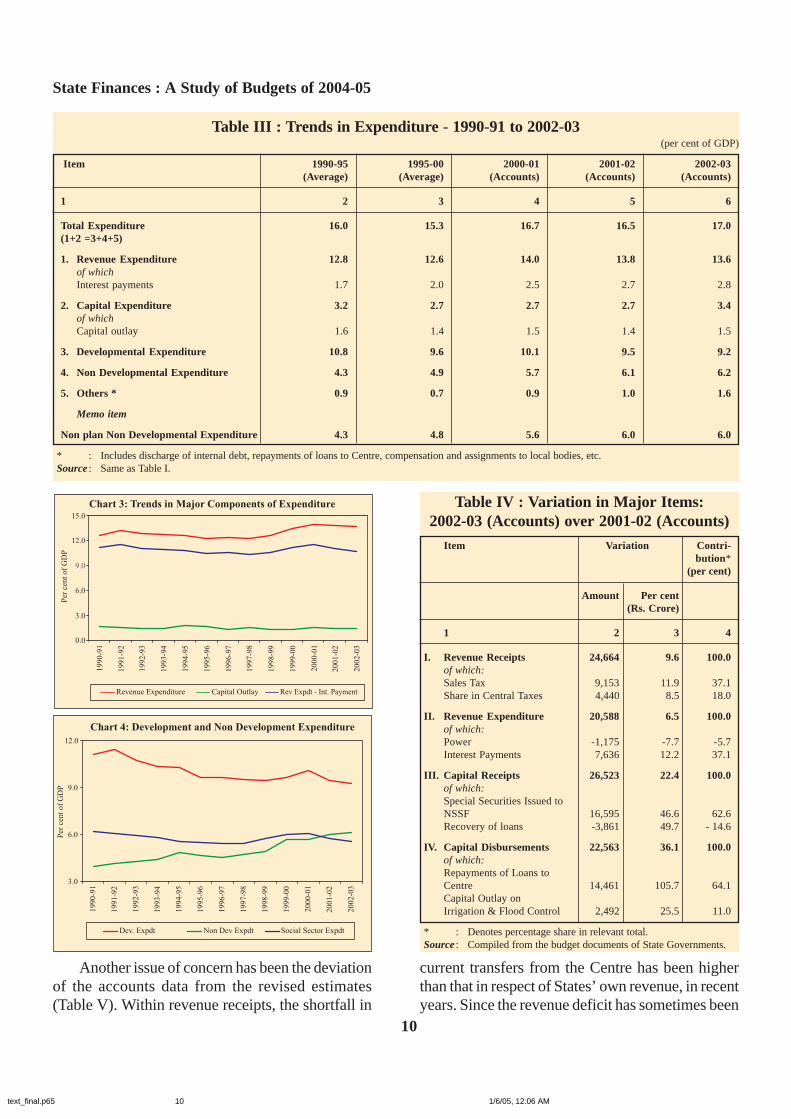
Capital outlay on irrigation and flood control wasalso enhanced during 2002-03. Total capital outlayas a ratio to GDP, however, remained almostunchanged at 1.5 per cent, indicating the absenceof adequate efforts to step-up expenditure towardsinfrastructure development over the years. Undercapital receipts, a substantial increase in SmallSavings (securities issued to NSSF) was evidentduring 2002-03 (Table IV).
On the whole, however, while the ratio of non-developmental expenditure (comprising, inter alia,interest payments, pensions and administrativeservices) to GDP increased in 2002-03 vis-à-vis theprevious year, the ratio of developmentalexpenditure to GDP continued to decline in 2002-03 (Chart 4).
Table II : Trends in Receipts - 1990-91 to 2002-03(per cent of GDP)
Item 1990-95 1995-00 2000-01 2001-02 2002-03 (Average) (Average) (Accounts) (Accounts) (Accounts)
1 2 3 4 5 6
Total Receipts (1+2) 16.1 15.2 16.7 16.4 17.3
1. Total revenue receipts (a+b) 12.1 10.9 11.4 11.2 11.4
(a) States own Revenue 7.3 6.9 7.1 7.0 7.3States own tax 5.4 5.3 5.6 5.6 5.8States own non tax 1.8 1.6 1.5 1.4 1.5
(b) Central Transfers 4.9 4.0 4.2 4.2 4.1Shareable taxes 2.6 2.4 2.4 2.3 2.3Central Grants 2.3 1.6 1.8 1.9 1.8
2. Capital Receipts (a+b) 4.0 4.2 5.3 5.2 5.9(a) Loans from Centre@ 1.2 1.0 0.9 1.1 1.1(b) Others Capital Receipts 2.9 3.2 4.4 4.1 4.8
BE : Budget EstimatesRE : Revised Estimates.@ : With the change in the system of accounting with effect from 1999-2000, States’ share in Small Savings, which was earlier included under loans from
the Centre, is now included under internal debt and shown as special securities issued to the National Small Saving Fund (NSSF) of the CentralGovernment. The data for the years prior to 1999-2000 as reported in this table, however, exclude loans against small savings for the purpose ofcomparison.
Source : Same as Table I.
text_final.p65 1/6/05, 12:06 AM9
State Finances : A Study of Budgets of 2004-05
10
Chart 3: Trends in Major Components of Expenditure
0.0
3.0
6.0
9.0
12.0
15.0
19
90
-91
19
91
-92
19
92
-93
19
93
-94
19
94
-95
19
95
-96
19
96
-97
19
97
-98
19
98
-99
19
99
-00
20
00
-01
20
01
-02
20
02
-03
Per
cen
to
fG
DP
Revenue Expenditure Capital Outlay Rev Expdt - Int. Payment
Table III : Trends in Expenditure - 1990-91 to 2002-03(per cent of GDP)
Item 1990-95 1995-00 2000-01 2001-02 2002-03 (Average) (Average) (Accounts) (Accounts) (Accounts)
1 2 3 4 5 6
Total Expenditure 16.0 15.3 16.7 16.5 17.0(1+2 =3+4+5)
1. Revenue Expenditure 12.8 12.6 14.0 13.8 13.6of whichInterest payments 1.7 2.0 2.5 2.7 2.8
2. Capital Expenditure 3.2 2.7 2.7 2.7 3.4of whichCapital outlay 1.6 1.4 1.5 1.4 1.5
3. Developmental Expenditure 10.8 9.6 10.1 9.5 9.2
4. Non Developmental Expenditure 4.3 4.9 5.7 6.1 6.2
5. Others * 0.9 0.7 0.9 1.0 1.6
Memo item
Non plan Non Developmental Expenditure 4.3 4.8 5.6 6.0 6.0
* : Includes discharge of internal debt, repayments of loans to Centre, compensation and assignments to local bodies, etc.Source : Same as Table I.
Table IV : Variation in Major Items:2002-03 (Accounts) over 2001-02 (Accounts)
Item Variation Contri-bution*
(per cent)
Amount Per cent(Rs. Crore)
1 2 3 4
I. Revenue Receipts 24,664 9.6 100.0of which:Sales Tax 9,153 11.9 37.1Share in Central Taxes 4,440 8.5 18.0
II. Revenue Expenditure 20,588 6.5 100.0of which:Power -1,175 -7.7 -5.7Interest Payments 7,636 12.2 37.1
III. Capital Receipts 26,523 22.4 100.0of which:Special Securities Issued toNSSF 16,595 46.6 62.6Recovery of loans -3,861 49.7 - 14.6
IV. Capital Disbursements 22,563 36.1 100.0of which:Repayments of Loans toCentre 14,461 105.7 64.1Capital Outlay onIrrigation & Flood Control 2,492 25.5 11.0
* : Denotes percentage share in relevant total.Source : Compiled from the budget documents of State Governments.
Chart 4: Development and Non Development Expenditure
3.0
6.0
9.0
12.0
1990-9
1
1991-9
2
1992-9
3
1993-9
4
1994-9
5
1995-9
6
1996-9
7
1997-9
8
1998-9
9
1999-0
0
2000-0
1
2001-0
2
2002-0
3
Per
cent
of
GD
P
Dev. Expdt Non Dev Expdt Social Sector Expdt
Another issue of concern has been the deviationof the accounts data from the revised estimates(Table V). Within revenue receipts, the shortfall in
current transfers from the Centre has been higherthan that in respect of States’ own revenue, in recentyears. Since the revenue deficit has sometimes been
text_final.p65 1/6/05, 12:06 AM10
Reserve Bank of India
11
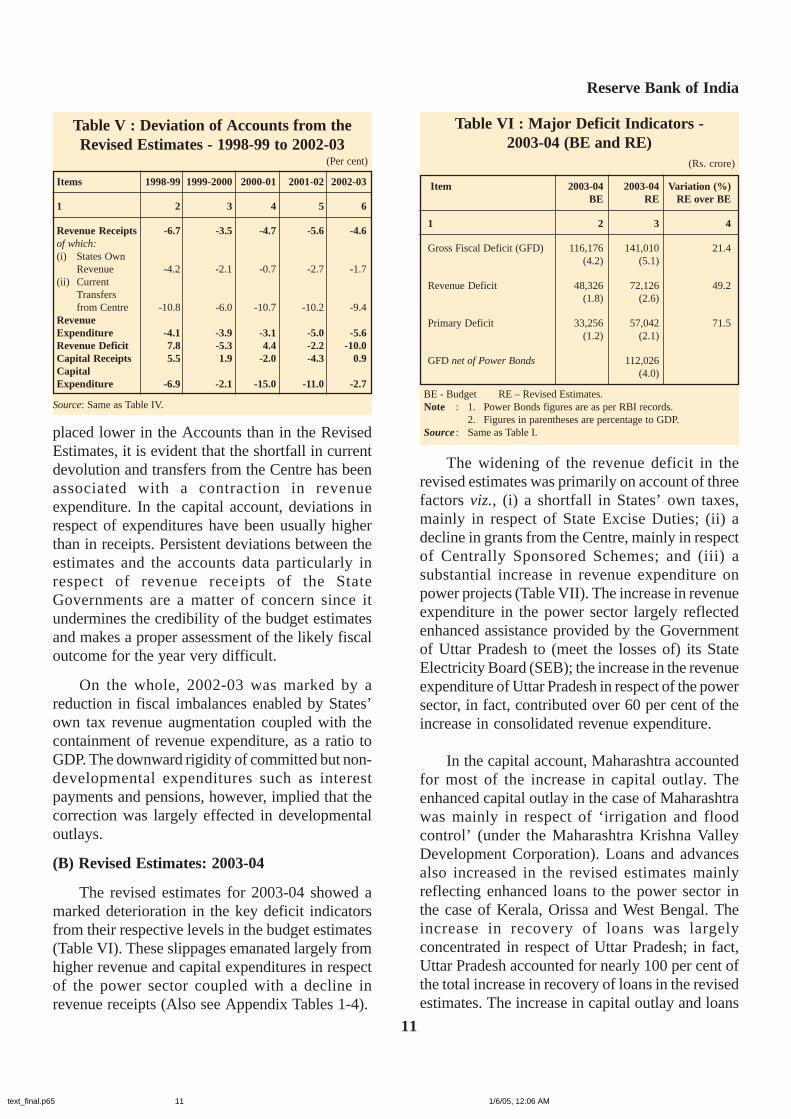
placed lower in the Accounts than in the RevisedEstimates, it is evident that the shortfall in currentdevolution and transfers from the Centre has beenassociated with a contraction in revenueexpenditure. In the capital account, deviations inrespect of expenditures have been usually higherthan in receipts. Persistent deviations between theestimates and the accounts data particularly inrespect of revenue receipts of the StateGovernments are a matter of concern since itundermines the credibility of the budget estimatesand makes a proper assessment of the likely fiscaloutcome for the year very difficult.
On the whole, 2002-03 was marked by areduction in fiscal imbalances enabled by States’own tax revenue augmentation coupled with thecontainment of revenue expenditure, as a ratio toGDP. The downward rigidity of committed but non-developmental expenditures such as interestpayments and pensions, however, implied that thecorrection was largely effected in developmentaloutlays.
(B) Revised Estimates: 2003-04
The revised estimates for 2003-04 showed amarked deterioration in the key deficit indicatorsfrom their respective levels in the budget estimates(Table VI). These slippages emanated largely fromhigher revenue and capital expenditures in respectof the power sector coupled with a decline inrevenue receipts (Also see Appendix Tables 1-4).
Table V : Deviation of Accounts from theRevised Estimates - 1998-99 to 2002-03
(Per cent)
Items 1998-99 1999-2000 2000-01 2001-02 2002-03
1 2 3 4 5 6
Revenue Receipts -6.7 -3.5 -4.7 -5.6 -4.6of which:(i) States Own
Revenue -4.2 -2.1 -0.7 -2.7 -1.7(ii) Current
Transfersfrom Centre -10.8 -6.0 -10.7 -10.2 -9.4
RevenueExpenditure -4.1 -3.9 -3.1 -5.0 -5.6Revenue Deficit 7.8 -5.3 4.4 -2.2 -10.0Capital Receipts 5.5 1.9 -2.0 -4.3 0.9CapitalExpenditure -6.9 -2.1 -15.0 -11.0 -2.7
Source: Same as Table IV.
Table VI : Major Deficit Indicators -2003-04 (BE and RE)
(Rs. crore)
Item 2003-04 2003-04 Variation (%) BE RE RE over BE
1 2 3 4
Gross Fiscal Deficit (GFD) 116,176 141,010 21.4 (4.2) (5.1)
Revenue Deficit 48,326 72,126 49.2 (1.8) (2.6)
Primary Deficit 33,256 57,042 71.5 (1.2) (2.1)
GFD net of Power Bonds 112,026(4.0)
BE - Budget RE – Revised Estimates.Note : 1. Power Bonds figures are as per RBI records.
2. Figures in parentheses are percentage to GDP.Source : Same as Table I.
The widening of the revenue deficit in therevised estimates was primarily on account of threefactors viz., (i) a shortfall in States’ own taxes,mainly in respect of State Excise Duties; (ii) adecline in grants from the Centre, mainly in respectof Centrally Sponsored Schemes; and (iii) asubstantial increase in revenue expenditure onpower projects (Table VII). The increase in revenueexpenditure in the power sector largely reflectedenhanced assistance provided by the Governmentof Uttar Pradesh to (meet the losses of) its StateElectricity Board (SEB); the increase in the revenueexpenditure of Uttar Pradesh in respect of the powersector, in fact, contributed over 60 per cent of theincrease in consolidated revenue expenditure.
In the capital account, Maharashtra accountedfor most of the increase in capital outlay. Theenhanced capital outlay in the case of Maharashtrawas mainly in respect of ‘irrigation and floodcontrol’ (under the Maharashtra Krishna ValleyDevelopment Corporation). Loans and advancesalso increased in the revised estimates mainlyreflecting enhanced loans to the power sector inthe case of Kerala, Orissa and West Bengal. Theincrease in recovery of loans was largelyconcentrated in respect of Uttar Pradesh; in fact,Uttar Pradesh accounted for nearly 100 per cent ofthe total increase in recovery of loans in the revisedestimates. The increase in capital outlay and loans
text_final.p65 1/6/05, 12:06 AM11

State Finances : A Study of Budgets of 2004-05
12
and advances coupled with the slippage in therevenue deficit, thus, resulted in a higher GFD inthe revised estimates for 2003-04 (Appendix Tables5-6).
It may be important to mention that under theOne-Time Settlement Scheme for dues of the SEBs,power bonds amounting to Rs.28,984 crore (as perRBI records) were issued by 26 State Governmentsto the CPSUs in September 2003 (with retrospectivedate of October 1, 2001). According to the budgetdocuments, the total amount of power and otherbonds8 (the break-up is not available in respect ofall State Governments) were placed at Rs.18,755crore in the revised estimates for 2003-04 ascompared with Rs.5,908 crore in the budgetestimates for the year. Accordingly, the variationin the revised estimates of 2003-04 over the budget
estimates underestimates the actual amount ofpower bonds issued in September 2003.
Net expenditure on the power sector (i.e.,revenue and capital expenditure less revenuereceipts and recovery of loans) accounted for 29.2per cent of the GFD of the State Governments inthe revised estimates for 2003-04 which was higherthan that of 25.2 per cent in the budget estimatesand 20.3 per cent in 2002-03 (Table VIII).Correspondingly, from the financing side, the issueof power and other bonds accounted for 13.3 percent of the GFD in the revised estimates for 2003-04 as against 5.1 per cent in the budget estimatesand negligible amounts in the previous years.
Table VII: Major Items of Variation: 2003-04Revised Estimates over 2003-04
Budget Estimates(Amount in Rs. crore)
Items Variation Contribution *(per cent)
Amount Per cent
1 2 3 4
I. Revenue Receipts -4,363 -1.3 100.0of which:State Excise -1,357 -6.2 31.1Grants from Centre -2,538 -4.0 58.2
II. Revenue Expenditure 19,436 5.1 100.0of which:Power 17,553 128.7 90.3
III. Capital Receipts 65,482 44.6 100.0of Which:Market Loans (Gross) 27,552 130.6 42.1Special Securities issued toNSSF 10,764 21.4 16.4Power Bonds and OtherBonds 12,847 217.5 19.6Recovery of Loans 12,521 383.1 19.1
IV. Capital Disbursements 46,301 43.8 100.0of which:Capital Outlay on Irrigationand Flood Control 7,212 56.1 15.6Loans to Power Projects 6,496 78.6 14.0Discharge of Internal Debt 5,118 59.0 11.1Repayments of Loans to Centre 27,626 106.6 59.7
* : Denotes percentage share in relevant total.Source : Same as Table IV.
8. The reporting of data pertaining to power bonds has not been uniform and transparent across the States.
Table VIII : Transactions Relating tothe Power Sector*
(Rs crore)
Items 2001-02 2002-03 2003-04 2003-04 Variation BE RE Cols. 5-4
1 2 3 4 5 6
1. RevenueAccount a. Expenditure 15224 14049 13634 31187 17553b. Receipts 773 961 1224 1199 -25c. Net Revenuec. expenditure (a-b) 14451 13088 12410 29988 17578
2. Capital Account d. Capital Outlay* 2671 2997 9210 9341 131e. Loans ande. Advances 5438 5930 8267 14763 6496f. Recovery of loansf. and advances 2198 1275 662 12973 12311g. Net capitalg. expenditureg. (d+e-f) 5911 7652 16815 11132 -5683
3. Total powerexpenditure (net)(c+g) 20362 20740 29225 41120 11895
4. GFD of States 95994 102123 116176 141010 24834
5. Item 3 as percent of Item 4 21.2 20.3 25.2 29.2 4.0
6. Power Bondsand OtherBonds @ 0.3 3.6 5907 18754 12847
7. Item 6 as percent of Item 4 – – 5.1 13.3 8.2
BE - Budget RE – Revised Estimates.* : Relates to Energy.@ : Net of RepaymentsSource : Same as Table IV.
text_final.p65 1/6/05, 12:06 AM12

Reserve Bank of India
13
Excluding the transactions relating to the powersector, the revenue deficit would have been placedat 1.5 per cent in the revised estimates (instead of2.6 per cent), whereas the GFD would have beenplaced at 3.6 per cent9 (instead of 5.1 per cent).
Reflecting the deterioration in the revenueaccount, decomposition of GFD showed that theshare of revenue deficit increased to 51.1 per centin the revised estimates for 2003-04 as comparedwith 41.6 per cent in the budget estimates andaround 25 per cent, on an average, in the first halfof the 1990s (Table IX and Appendix Table 7).
The financing pattern of GFD indicated asubstantial increase in market borrowings, primarilyon account of additional allocations under the DebtSwap Scheme (DSS)10 . Correspondingly,repayment of loans to the Centre exceeded itsbudgeted level by a large margin. In fact,repayments of loans to the Centre surpassed grossloans from the Centre in the revised estimates for2003-04. Small Savings (Securities issued to NSSF)continued to predominate the financing of GFD atover 40 per cent in 2003-04. Higher ‘other’borrowings in the revised estimates largely reflected
9. This figure is obtained after excluding all transactions relating to the power sector, as reported in the budget documents. Totaltransactions relating to the power sector would, in any case, differ from the amount of power bonds issued in connection with theOne-Time Settlement Scheme. As indicated in Table VI, GFD net of power bonds works out to 4.0 per cent of GDP in 2003-04.
10. The DSS has been discussed in detail in Reserve Bank’s Study entitled “State Finances: A Study of Budgets of 2003-04” as well as in theReserve Bank’s Annual Report 2003-04.
the issue of power bonds, as mentioned earlier(Table IX and Appendix Table 8).
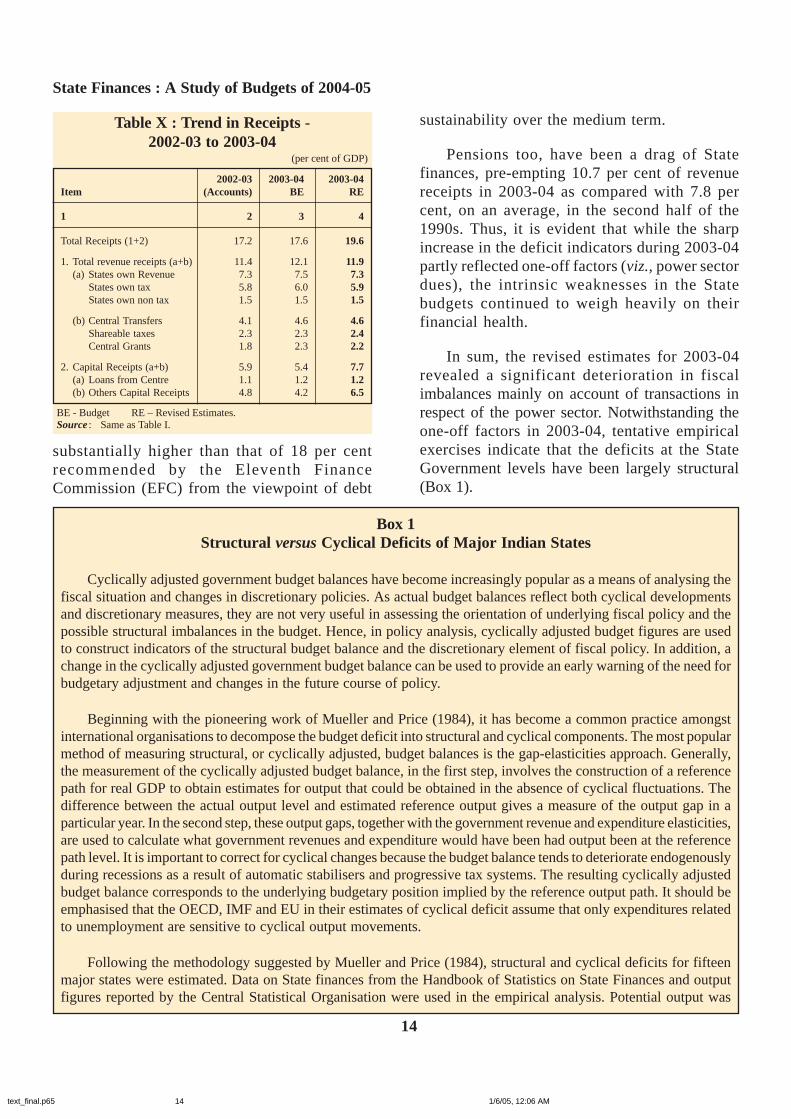
The trends in the pattern of receipts showedthat while States’ own tax revenue, at 5.9 per centof GDP in the revised estimates for 2003-04, wasslightly higher than its levels since the 1990s, theStates’ own non-tax revenues declined from 1.8 percent to 1.5 per cent of GDP over this period (TableX). Some improvement in current transfers fromthe Centre was also evident in 2003-04 over theprevious year, although it remained below theposition in the first half of the 1990s.
The evolving pattern of expenditure indicatedsharp increase in developmental expenditure, asa ratio to GDP, in 2003-04. This largely reflectedhigher revenue and capital expenditure on thepower sector and enhanced capital outlay onirrigation (which are recorded under ‘EconomicServices’), as explained earlier. Non-developmental expenditure, as a ratio to GDP,also maintained its upward trend to 6.4 per centof GDP in 2003-04. Within non-developmentalexpenditure, interest payments accounted foraround 25 per cent of revenue receipts which was
Table IX : Decomposition and Financing Pattern of Gross Fiscal Deficit - 1990-91 to 2003-04(Per cent)
Item 1990-95 1995-00 2000-02 2002-03 2003-04 2003-04 (Average) (Average) (Average) (Accounts) BE RE
1 2 3 4 5 6 7
Decomposition (1+2+3) 100.0 100.0 100.0 100.0 100.0 100.01. Revenue Deficit 24.7 44.7 60.7 54.0 41.6 51.12. Capital Outlay 55.3 43.2 34.2 35.8 48.0 43.63. Net Lending 20.0 12.1 5.1 10.2 10.4 5.3 Financing (1+2+3+4+5) 100.0 100.0 100.0 100.0 100.0 100.01. Small Savings - 5.8 36.8 51.2 43.4 43.42. Market Borrowings 16.0 16.1 16.0 27.9 15.2 32.03. State Provident Fund 14.3 13.4 10.2 7.0 7.6 6.84. Loans from Centre 49.0 40.6 13.5 -0.9 6.7 -15.25. Others* 20.7 24.0 23.6 14.8 27.1 33.0
BE - Budget RE – Revised Estimates.* : Includes Reserve Funds, Deposits, Loans from banks and other institutions.Source : Same as Table IV.
text_final.p65 1/6/05, 12:06 AM13
State Finances : A Study of Budgets of 2004-05
14
sustainability over the medium term.
Pensions too, have been a drag of Statefinances, pre-empting 10.7 per cent of revenuereceipts in 2003-04 as compared with 7.8 percent, on an average, in the second half of the1990s. Thus, it is evident that while the sharpincrease in the deficit indicators during 2003-04partly reflected one-off factors (viz., power sectordues), the intrinsic weaknesses in the Statebudgets continued to weigh heavily on theirfinancial health.
In sum, the revised estimates for 2003-04revealed a significant deterioration in fiscalimbalances mainly on account of transactions inrespect of the power sector. Notwithstanding theone-off factors in 2003-04, tentative empiricalexercises indicate that the deficits at the StateGovernment levels have been largely structural(Box 1).
Box 1Structural versus Cyclical Deficits of Major Indian States
Cyclically adjusted government budget balances have become increasingly popular as a means of analysing thefiscal situation and changes in discretionary policies. As actual budget balances reflect both cyclical developmentsand discretionary measures, they are not very useful in assessing the orientation of underlying fiscal policy and thepossible structural imbalances in the budget. Hence, in policy analysis, cyclically adjusted budget figures are usedto construct indicators of the structural budget balance and the discretionary element of fiscal policy. In addition, achange in the cyclically adjusted government budget balance can be used to provide an early warning of the need forbudgetary adjustment and changes in the future course of policy.
Beginning with the pioneering work of Mueller and Price (1984), it has become a common practice amongstinternational organisations to decompose the budget deficit into structural and cyclical components. The most popularmethod of measuring structural, or cyclically adjusted, budget balances is the gap-elasticities approach. Generally,the measurement of the cyclically adjusted budget balance, in the first step, involves the construction of a referencepath for real GDP to obtain estimates for output that could be obtained in the absence of cyclical fluctuations. Thedifference between the actual output level and estimated reference output gives a measure of the output gap in aparticular year. In the second step, these output gaps, together with the government revenue and expenditure elasticities,are used to calculate what government revenues and expenditure would have been had output been at the referencepath level. It is important to correct for cyclical changes because the budget balance tends to deteriorate endogenouslyduring recessions as a result of automatic stabilisers and progressive tax systems. The resulting cyclically adjustedbudget balance corresponds to the underlying budgetary position implied by the reference output path. It should beemphasised that the OECD, IMF and EU in their estimates of cyclical deficit assume that only expenditures relatedto unemployment are sensitive to cyclical output movements.
Following the methodology suggested by Mueller and Price (1984), structural and cyclical deficits for fifteenmajor states were estimated. Data on State finances from the Handbook of Statistics on State Finances and outputfigures reported by the Central Statistical Organisation were used in the empirical analysis. Potential output was
Table X : Trend in Receipts -2002-03 to 2003-04
(per cent of GDP)
2002-03 2003-04 2003-04Item (Accounts) BE RE
1 2 3 4
Total Receipts (1+2) 17.2 17.6 19.6
1. Total revenue receipts (a+b) 11.4 12.1 11.9(a) States own Revenue 7.3 7.5 7.3
States own tax 5.8 6.0 5.9States own non tax 1.5 1.5 1.5
(b) Central Transfers 4.1 4.6 4.6Shareable taxes 2.3 2.3 2.4Central Grants 1.8 2.3 2.2
2. Capital Receipts (a+b) 5.9 5.4 7.7(a) Loans from Centre 1.1 1.2 1.2(b) Others Capital Receipts 4.8 4.2 6.5
BE - Budget RE – Revised Estimates.Source : Same as Table I.
substantially higher than that of 18 per centrecommended by the Eleventh FinanceCommission (EFC) from the viewpoint of debt
text_final.p65 1/6/05, 12:06 AM14

Reserve Bank of India
15
estimated using Hodrick- Prescott filter on real GSDP series. Minimal difference between real actual GSDP and realpotential GSDP was the guiding criteria in choosing the base year for calculation of structural and cyclical deficitfor each of the states. For all States taken together, the amplitude of cyclical deficit as a proportion of output waslower in the second half of the 1990s than that in the first half. Fiscal drag which indicates the built-in budgetbalance has also deteriorated for the majority of the States over the same period. Predominance of fiscal dragobtained from the estimates indicates the presence of structural rigidities at the State level, which is reflected in thehigher expenditure elasticities than the revenue elasticities. Cyclical deficit on an average varied within a range of –9.0 percent to 6.0 percent of gross fiscal deficit for the fifteen major states during the period 1990-91 to 2003-04.Measured as a percentage of Gross SDP, cyclical deficit on an average accounted for -0.2 percent of GSDP in thepost 1990 period for the fifteen major states while the structural component was placed, on an average, at 4.9 percent. This indicates that fiscal deficit of the Indian States is mostly structural in character.
References:
1. Mueller, P., and R. W. R. Price, (1984) “Structural budget deficits and fiscal stance,” OECD Economics andStatistics Department, Working Paper No. 15 (Paris: OECD, July).
2. Pattnaik, R. K., S.M. Pillai, and Sangeeta Das (1997).” Budget Deficit in India: A Primer on Measurement”, RBIStaff Studies.
3. Hodrick, R. and E.C., Prescott, (1997) “ Post war Business Cycles: An Empirical Investigation”, Journal ofMoney Credit and Banking 29, pp. 1–16.
4. Blejer, M.I. and A. Cheasty, (1991)“The Measurement of Fiscal Deficits: Analytical and Methodological Issues”,Journal of Economic Literature 29, 1991. pp. 1644-1678
(C) Budget Estimates: 2004-05
A substantial correction of fiscal imbalancesis attempted in the budget estimates for 2004-05.All the major deficit indicators are estimated todecline in 2004-05 from their respective levels inthe revised estimates of the previous year (TableXI and Chart 5).
Table XI : Major Deficit Indicators -2003-04 (RE) and 2004-05 (BE)
(Rs. crore)
Item 2003-04 2004-05 RE BE
1 2 3
Gross Fiscal deficit 141,010 111852 (5.1) (3.6)
Revenue Deficit 72,126 43718 (2.6) (1.4)
Primary Deficit 57,042 20994 (2.1) (0.7)
GFD net of Power Bonds 112,026(4.0)
BE: Budget Estimates RE: Revised Estimates.Note : 1. Power Bonds figures as per RBI records.
2. Figures in brackets are percentage to GDP.Source : Data on fiscal variables have been compiled from budget
documents of State Governments. The GDP data for 2004 -05has been worked out from the budget estimates of the GFD-GDP ratio for 2004-05 as provided in the Union Budget.
The envisaged fiscal correction in 2004-05 isexpected to emanate from an increase in revenuereceipts and would be facilitated by a reduction inexpenditure on the power sector from its upsurgein the previous year. The analysis of the budgetestimates for 2004-05, however, needs to takecognisance of the fact that, over the past years, thebudget estimates have usually deviated from therevised estimates, reflecting poor fiscalmarksmanship.
Chart 5: Major Deficit Indicators (2000-01 to 2004-05)
0.0
1.0
2.0
3.0
4.0
5.0
6.0
2000-01 2001-02 2002-03 2003-04 (RE) 2004-05 (BE)
Per
cen
to
fG
DP
GFD/GDP RD/GDP PD/GDP
text_final.p65 1/6/05, 12:06 AM15
State Finances : A Study of Budgets of 2004-05
16
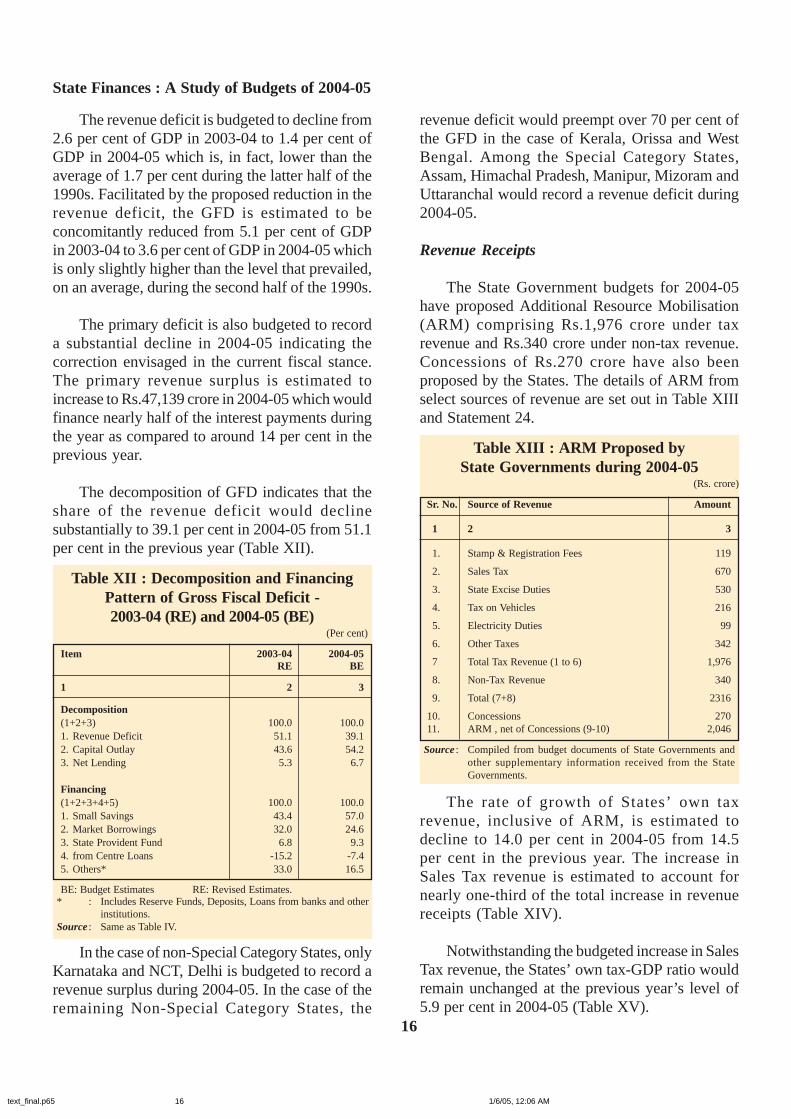
The revenue deficit is budgeted to decline from2.6 per cent of GDP in 2003-04 to 1.4 per cent ofGDP in 2004-05 which is, in fact, lower than theaverage of 1.7 per cent during the latter half of the1990s. Facilitated by the proposed reduction in therevenue deficit, the GFD is estimated to beconcomitantly reduced from 5.1 per cent of GDPin 2003-04 to 3.6 per cent of GDP in 2004-05 whichis only slightly higher than the level that prevailed,on an average, during the second half of the 1990s.
The primary deficit is also budgeted to recorda substantial decline in 2004-05 indicating thecorrection envisaged in the current fiscal stance.The primary revenue surplus is estimated toincrease to Rs.47,139 crore in 2004-05 which wouldfinance nearly half of the interest payments duringthe year as compared to around 14 per cent in theprevious year.
The decomposition of GFD indicates that theshare of the revenue deficit would declinesubstantially to 39.1 per cent in 2004-05 from 51.1per cent in the previous year (Table XII).
Table XII : Decomposition and FinancingPattern of Gross Fiscal Deficit -2003-04 (RE) and 2004-05 (BE)
(Per cent)
Item 2003-04 2004-05 RE BE
1 2 3
Decomposition (1+2+3) 100.0 100.01. Revenue Deficit 51.1 39.12. Capital Outlay 43.6 54.23. Net Lending 5.3 6.7
Financing (1+2+3+4+5) 100.0 100.01. Small Savings 43.4 57.02. Market Borrowings 32.0 24.63. State Provident Fund 6.8 9.34. from Centre Loans -15.2 -7.45. Others* 33.0 16.5
BE: Budget Estimates RE: Revised Estimates.* : Includes Reserve Funds, Deposits, Loans from banks and other
institutions.Source : Same as Table IV.
In the case of non-Special Category States, onlyKarnataka and NCT, Delhi is budgeted to record arevenue surplus during 2004-05. In the case of theremaining Non-Special Category States, the
revenue deficit would preempt over 70 per cent ofthe GFD in the case of Kerala, Orissa and WestBengal. Among the Special Category States,Assam, Himachal Pradesh, Manipur, Mizoram andUttaranchal would record a revenue deficit during2004-05.
Revenue Receipts
The State Government budgets for 2004-05have proposed Additional Resource Mobilisation(ARM) comprising Rs.1,976 crore under taxrevenue and Rs.340 crore under non-tax revenue.Concessions of Rs.270 crore have also beenproposed by the States. The details of ARM fromselect sources of revenue are set out in Table XIIIand Statement 24.
Table XIII : ARM Proposed byState Governments during 2004-05
(Rs. crore)
Sr. No. Source of Revenue Amount
1 2 3
1. Stamp & Registration Fees 119
2. Sales Tax 670
3. State Excise Duties 530
4. Tax on Vehicles 216
5. Electricity Duties 99
6. Other Taxes 342
7 Total Tax Revenue (1 to 6) 1,976
8. Non-Tax Revenue 340
9. Total (7+8) 2316
10. Concessions 27011. ARM , net of Concessions (9-10) 2,046
Source : Compiled from budget documents of State Governments andother supplementary information received from the StateGovernments.
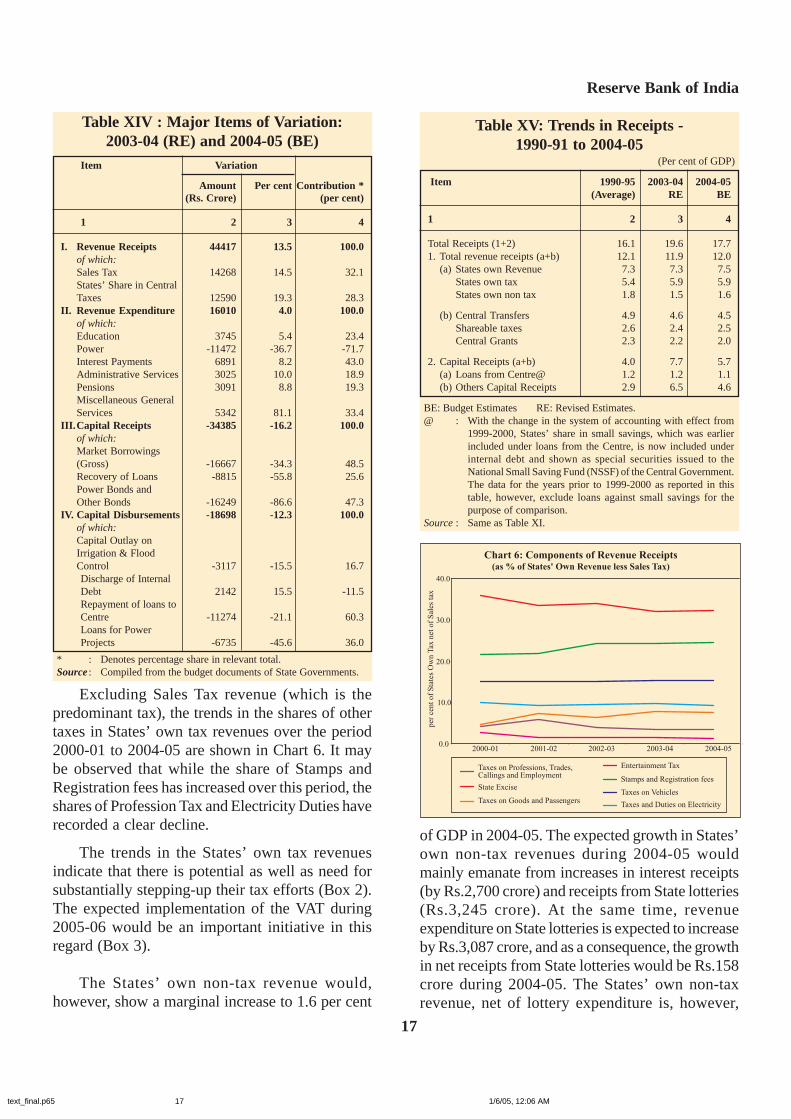
The rate of growth of States’ own taxrevenue, inclusive of ARM, is estimated todecline to 14.0 per cent in 2004-05 from 14.5per cent in the previous year. The increase inSales Tax revenue is estimated to account fornearly one-third of the total increase in revenuereceipts (Table XIV).
Notwithstanding the budgeted increase in SalesTax revenue, the States’ own tax-GDP ratio wouldremain unchanged at the previous year’s level of5.9 per cent in 2004-05 (Table XV).
text_final.p65 1/6/05, 12:06 AM16
Reserve Bank of India
17
Excluding Sales Tax revenue (which is thepredominant tax), the trends in the shares of othertaxes in States’ own tax revenues over the period2000-01 to 2004-05 are shown in Chart 6. It maybe observed that while the share of Stamps andRegistration fees has increased over this period, theshares of Profession Tax and Electricity Duties haverecorded a clear decline.
The trends in the States’ own tax revenuesindicate that there is potential as well as need forsubstantially stepping-up their tax efforts (Box 2).The expected implementation of the VAT during2005-06 would be an important initiative in thisregard (Box 3).
The States’ own non-tax revenue would,however, show a marginal increase to 1.6 per cent
Table XIV : Major Items of Variation:2003-04 (RE) and 2004-05 (BE)
Item Variation
Amount Per cent Contribution *(Rs. Crore) (per cent)
1 2 3 4
I. Revenue Receipts 44417 13.5 100.0 of which: Sales Tax 14268 14.5 32.1 States’ Share in Central
Taxes 12590 19.3 28.3II. Revenue Expenditure 16010 4.0 100.0 of which: Education 3745 5.4 23.4 Power -11472 -36.7 -71.7 Interest Payments 6891 8.2 43.0 Administrative Services 3025 10.0 18.9 Pensions 3091 8.8 19.3 Miscellaneous General
Services 5342 81.1 33.4III.Capital Receipts -34385 -16.2 100.0 of which: Market Borrowings
(Gross) -16667 -34.3 48.5 Recovery of Loans -8815 -55.8 25.6 Power Bonds and
Other Bonds -16249 -86.6 47.3IV. Capital Disbursements -18698 -12.3 100.0 of which: Capital Outlay on
Irrigation & FloodControl -3117 -15.5 16.7
Discharge of InternalDebt 2142 15.5 -11.5
Repayment of loans toCentre -11274 -21.1 60.3
Loans for PowerProjects -6735 -45.6 36.0
* : Denotes percentage share in relevant total.Source : Compiled from the budget documents of State Governments.
Chart 6: Components of Revenue Receipts(as % of States' Own Revenue less Sales Tax)
0.0
10.0
20.0
30.0
40.0
2000-01 2001-02 2002-03 2003-04 2004-05
per
cent
of
Sta
tes
Ow
nT
axnet
of
Sal
esta
x
Taxes on Professions, Trades,Callings and Employment
Stamps and Registration feesState Excise
Taxes on VehiclesTaxes on Goods and Passengers
Taxes and Duties on Electricity
Entertainment Tax
Table XV: Trends in Receipts -1990-91 to 2004-05
(Per cent of GDP)
Item 1990-95 2003-04 2004-05(Average) RE BE
1 2 3 4
Total Receipts (1+2) 16.1 19.6 17.71. Total revenue receipts (a+b) 12.1 11.9 12.0
(a) States own Revenue 7.3 7.3 7.5States own tax 5.4 5.9 5.9States own non tax 1.8 1.5 1.6
(b) Central Transfers 4.9 4.6 4.5Shareable taxes 2.6 2.4 2.5Central Grants 2.3 2.2 2.0
2. Capital Receipts (a+b) 4.0 7.7 5.7(a) Loans from Centre@ 1.2 1.2 1.1(b) Others Capital Receipts 2.9 6.5 4.6
BE: Budget Estimates RE: Revised Estimates.@ : With the change in the system of accounting with effect from
1999-2000, States’ share in small savings, which was earlierincluded under loans from the Centre, is now included underinternal debt and shown as special securities issued to theNational Small Saving Fund (NSSF) of the Central Government.The data for the years prior to 1999-2000 as reported in thistable, however, exclude loans against small savings for thepurpose of comparison.
Source : Same as Table XI.
of GDP in 2004-05. The expected growth in States’own non-tax revenues during 2004-05 wouldmainly emanate from increases in interest receipts(by Rs.2,700 crore) and receipts from State lotteries(Rs.3,245 crore). At the same time, revenueexpenditure on State lotteries is expected to increaseby Rs.3,087 crore, and as a consequence, the growthin net receipts from State lotteries would be Rs.158crore during 2004-05. The States’ own non-taxrevenue, net of lottery expenditure is, however,
text_final.p65 1/6/05, 12:06 AM17
State Finances : A Study of Budgets of 2004-05
18
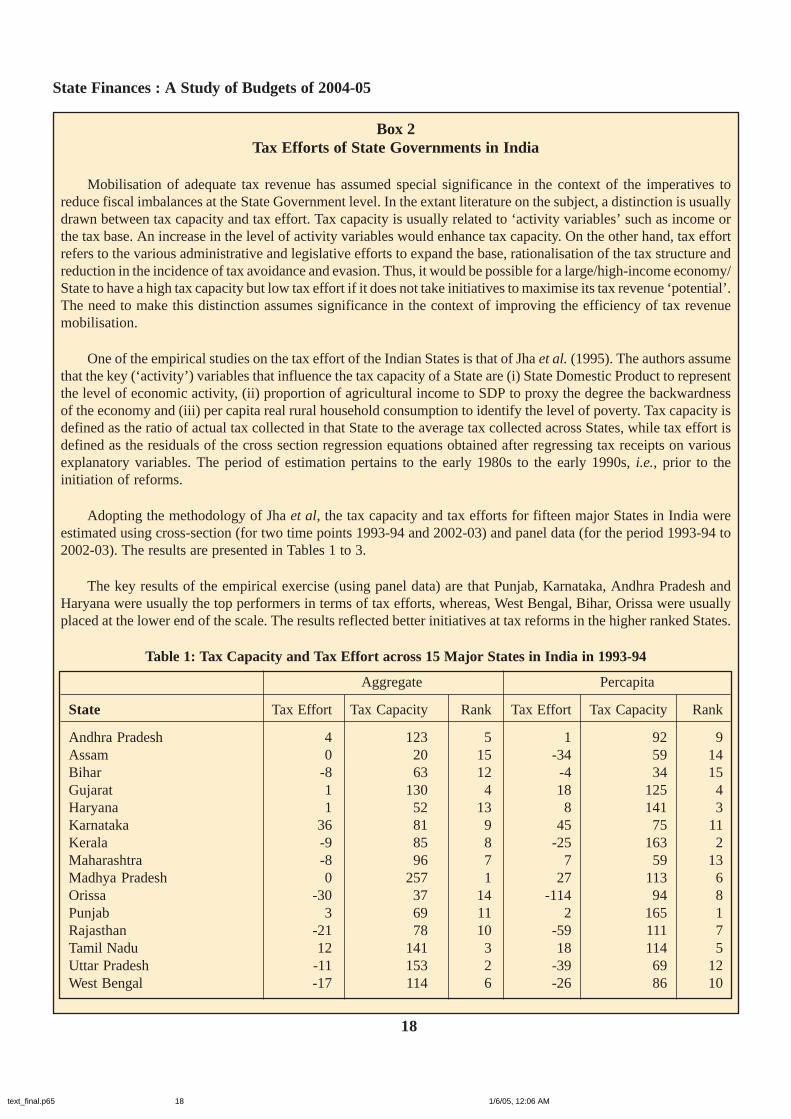
Box 2Tax Efforts of State Governments in India
Mobilisation of adequate tax revenue has assumed special significance in the context of the imperatives toreduce fiscal imbalances at the State Government level. In the extant literature on the subject, a distinction is usuallydrawn between tax capacity and tax effort. Tax capacity is usually related to ‘activity variables’ such as income orthe tax base. An increase in the level of activity variables would enhance tax capacity. On the other hand, tax effortrefers to the various administrative and legislative efforts to expand the base, rationalisation of the tax structure andreduction in the incidence of tax avoidance and evasion. Thus, it would be possible for a large/high-income economy/State to have a high tax capacity but low tax effort if it does not take initiatives to maximise its tax revenue ‘potential’.The need to make this distinction assumes significance in the context of improving the efficiency of tax revenuemobilisation.
One of the empirical studies on the tax effort of the Indian States is that of Jha et al. (1995). The authors assumethat the key (‘activity’) variables that influence the tax capacity of a State are (i) State Domestic Product to representthe level of economic activity, (ii) proportion of agricultural income to SDP to proxy the degree the backwardnessof the economy and (iii) per capita real rural household consumption to identify the level of poverty. Tax capacity isdefined as the ratio of actual tax collected in that State to the average tax collected across States, while tax effort isdefined as the residuals of the cross section regression equations obtained after regressing tax receipts on variousexplanatory variables. The period of estimation pertains to the early 1980s to the early 1990s, i.e., prior to theinitiation of reforms.
Adopting the methodology of Jha et al, the tax capacity and tax efforts for fifteen major States in India wereestimated using cross-section (for two time points 1993-94 and 2002-03) and panel data (for the period 1993-94 to2002-03). The results are presented in Tables 1 to 3.
The key results of the empirical exercise (using panel data) are that Punjab, Karnataka, Andhra Pradesh andHaryana were usually the top performers in terms of tax efforts, whereas, West Bengal, Bihar, Orissa were usuallyplaced at the lower end of the scale. The results reflected better initiatives at tax reforms in the higher ranked States.
Table 1: Tax Capacity and Tax Effort across 15 Major States in India in 1993-94
Aggregate Percapita
State Tax Effort Tax Capacity Rank Tax Effort Tax Capacity Rank
Andhra Pradesh 4 123 5 1 92 9Assam 0 20 15 -34 59 14Bihar -8 63 12 -4 34 15Gujarat 1 130 4 18 125 4Haryana 1 52 13 8 141 3Karnataka 36 81 9 45 75 11Kerala -9 85 8 -25 163 2Maharashtra -8 96 7 7 59 13Madhya Pradesh 0 257 1 27 113 6Orissa -30 37 14 -114 94 8Punjab 3 69 11 2 165 1Rajasthan -21 78 10 -59 111 7Tamil Nadu 12 141 3 18 114 5Uttar Pradesh -11 153 2 -39 69 12West Bengal -17 114 6 -26 86 10
text_final.p65 1/6/05, 12:06 AM18

Reserve Bank of India
19
Table 2 : Tax Capacity and Tax Effort across 15 Major States in India in 2002-03
Actuals Per capita
State Tax Effort Tax Capacity Rank Tax Effort Tax Capacity Rank
Andhra Pradesh 10 127 6 14 94 9Assam -6 23 15 -13 54 13Bihar (Undivided) -10 62 11 -39 42 15Gujarat -21 129 5 -21 154 2Haryana 4 60 12 28 121 6Karnataka 21 92 7 27 94 8Kerala -8 88 9 -1 149 3Madhya Pradesh (Undivided) 7 88 8 -6 72 11Maharashtra 3 247 1 -2 156 1Orissa 12 28 14 11 47 14Punjab 9 58 13 -38 105 7Rajasthan -5 74 10 -19 85 10Tamil Nadu 11 143 3 6 143 4Uttar Pradesh (Undivided) 4 148 2 -6 57 12West Bengal -66 131 4 -13 129 5
Note : The Tax Effort and Tax Capacity are expressed in terms of indices.
Table 3 : Average Tax Capacity and Tax Efforts Across 15 Major States During 1993-94 to 2002-03
Actuals Percapita
State Tax Effort Tax Capacity Rank Tax Effort Tax Capacity Rank
Andhra Pradesh 9 124 5 5 97 9Assam -10 21 15 -24 51 13Bihar (Undivided) -34 69 11 -22 34 15Gujarat -10 136 4 -5 154 2Haryana 17 46 12 14 134 4Karnataka 21 97 8 21 106 7Kerala 4 77 9 16 120 6Madhya Pradesh (Undivided) -10 98 7 -11 71 11Maharashtra 3 256 1 -9 173 1Orissa -11 32 14 -11 51 14Punjab 34 42 13 6 132 5Rajasthan -9 76 10 -8 79 10Tamil Nadu 8 153 2 8 142 3Uttar Pradesh (Undivided) -7 153 3 -6 54 12West Bengal -40 121 6 -65 103 8
Note : The Tax Effort and Tax Capacity are expressed in terms of indices.
References:
1. Bird, Richard M (1999): “Rethinking Sub-national Taxes: A New Look at Tax Assignment”, IMF Working PaperNo.99/169, International Monetary Fund, Washington.
2. Bird, Richard M, Jorge Martinez-Vasquez and Benno Torgler (2004): “Societal Institutions and Tax Effort inDeveloping Countries”, International Studies Program Working Paper 04-06, Andrew Young School of PolicyStudies, Georgia State University.
3. Jha, Raghabendra, M.S.Mohanty and Somnath Chatterjee (1995) : “Fiscal Efficiency in The Indian Federation”,DRG Study Report 11, Department of Economic Analysis and Policy, Reserve Bank of India, 1995.
4. Rakhe, P. B. (2003): “Estimation of Tax Leakage and Its Impact on Fiscal Health in Kerala”, Working Paper 347,Centre for Development Studies, Trivandrum.
text_final.p65 1/6/05, 12:06 AM19

State Finances : A Study of Budgets of 2004-05
20
Box 3Implementation of VAT: India and the International Experience
Value added tax (VAT), a tax on the value added at each stage of production and distribution of a commodity, isinherently efficient than the sales tax or excise duty or any turnover tax. Operationally, application of VAT at aparticular stage implies payment of tax by the producer or distributor on the value of his output but with a rebate (orcredit) on the taxes paid by him on the inputs. The inherent efficiency of VAT lies in the taxation of value addedportion only rather than full value of output at each stage of the production and distribution process thereby avoidingany ‘tax’ on tax that is normally associated with the cascading effect of sales tax or excise duty where entire valueof output is taxed at any one or more stages. As the effective tax rate works out lower in case of VAT, it does notcreate an undue incentive for vertical integration and does not distort undertaking of efficient resource allocation.VAT application being on the value added makes it neutral to choice of production technique without creating anybias against use of any factor of production. VAT tends to minimise tax evasion with an in-built system of multi-stage tax distribution and a cross-auditing practice, whereby firms necessarily have to properly account for inputtaxes so as to avail the rebate.
The origin of VAT can be traced as far back as the writings of F Von Siemens, who proposed it in 1918 as asubstitute for then newly established German turnover tax. Since then numerous economists have recommended itin different contexts. However, VAT was first introduced in France in 1954 to replace turnover taxes and it becamethe first European country to implement VAT on an extensive scale. VAT was introduced by the European Commissioncountries by 1970. Development of VAT in other countries has been gradual. Until the 1960s it was not adopted bymany countries, but over the years the tax has come to occupy an important place in the fiscal domain of nearly allindustrialised countries and in a large number of Latin American, Asian and African countries. As many as 50countries have switched over to VAT during last decade, bringing the total number of such countries to more than110. In India, it was introduced on the recommendation of L. K. Jha Enquiry Committee (1978) on Indian IndirectTaxation.
In India, Rule 56-A of the Central Excise and Salt Rules (1944) introduced in 1962 allowed manufacturers ofcertain goods to seek credit for the input excises paid from the duty paid of the final good under Proforma CreditScheme. The Indirect Taxation Enquiry Committee, 1978 recommended wider commodity coverage of Rule 56-Aand the introduction of VAT at the manufacturing stage (MANVAT) to tackle the cascading effect of excise taxation.As recommended by the Long Term Fiscal Policy Statement (1985), a modified system of VAT (MODVAT) wasintroduced in stages to extend the Proforma Credit Scheme to all excisable commodities except petroleum, tobaccoand textile products. The essential feature of MODVAT was that credit on input taxes was available only in caseswhere the final product was dutiable. With a view to retain revenue neutrality in MODVAT, the Government raisedthe duty rates on final products to ensure against loss of collection of excise duties. The Tax Reforms Committee(1991) recommended genuine VAT and accordingly a single ad valorem excise rate of 16 per cent was introducedunder Central Value Added Tax (CENVAT) in the Union Budget 2000-01. Additionally, however, special exciseduty rates were introduced in some commodities (three rates initially at 8 per cent, 16 per cent and 24 per cent butlater converged to 16 per cent) where MODVAT credit (paid on account of credit on excise paid on inputs) could notbe availed. Consequently, 80 per cent of the revenue in respect of the ad valorem duties comes from the single rateof 16 per cent and about 17 per cent from the combined rate of 32 per cent. Despite advantages of VAT, its spreadinternationally as well as some initiatives at the Central level in India, the implementation of VAT by the States inIndia has raised some apprehensions.
Presently, different States in India levy sales taxes on a wide range of commodities at different rates withdiverse procedures and rules for its collection, while the Central Government prescribes the ceiling rate on sales taxon goods in inter-State trade. The Central Government also levies additional excise duties on textiles, sugar andtobacco in lieu of the sales tax with the proceeds being distributed across the States. In most of the cases, sales taxesare levied on commodities which are also subject to Central excise duties. Multiple taxation on such commoditiesnot only lack co-ordination among Centre and State Governments, but also lead to the cascading effect. Mostly salestaxes on inputs are not rebated and therefore tend to lead to reverse flow of resources to richer States when they sell
text_final.p65 1/6/05, 12:06 AM20
Reserve Bank of India
21
the goods to the poor States as the cumulative impact of the cascading effect is passed on. Typically, the varied inter-State sales tax system on certain occasions have led to unhealthy ‘rate war’ in terms of competitive reductions insales tax rates to attract trade and industry thereby leading to sub-optimal allocation of resources. Sales taxes discouragehorizontal integration and encourage vertical integration which harm the growth of small scale ancillary units.Although State laws provide relief through exemptions in regards to sales tax when inputs are sold to manufacturers,such concessions are limited and lack uniformity. This lacuna has hindered indirect tax reform system in India andrepresents a classic case for a switch over to VAT independently by the Central Government and the State Governments.The Tax Reforms Committee 1991 had recommended conversion of sales tax into a form of State VAT within themanufacturing sector without any need for sales tax at more than two rates since the distributional and other non-revenue objectives to be performed by the Central taxes. The inter-State conference in 1999 decided to end all salestax-based incentives to industry, enforce floor rates of sales tax effective January 1, 2000 and switch over to VATeffective from April 1, 2001.
The apprehensions about revenue loss, however, delayed the introduction of State VAT. The EmpoweredCommittee (EC) of State Finance Ministers in India has been constituted to steer the States towards a regime ofharmonised VAT. The Central Government’s assurance of full compensation for revenue loss due to phasing out ofCentral sales tax (100 per cent compensation in the first year followed by 75 per cent and 50 per cent in the followingtwo years) after States switch over to VAT has reactivated the process. The zero-rating system on interstate saleswould be ushered in the next two years. 17 States have announced their readiness to implement VAT regime fromApril 1, 2005 in place of sales tax and other related State taxes on goods. The remaining States are expected to joinby November 2005. According to the Government, the tax reforms in the States are expected to raise the revenues ofthe States by 20 per cent. As per the information in the website of Ministry of Finance, Government of India(January 2004), the VAT system in the States will have only four rates (the zero rate, 1 per cent, 4 per cent and ageneral rate of 12.5 per cent) uniformly applicable in all the States. VAT would cover all business transactionsexcept small businesses below a threshold limit (decided by the States) and those medium size businesses that optfor a composition of tax on turnover instead of VAT. Most essential goods would be exempt from VAT or would fallin the rate of 4 per cent. The VAT rate of 4 per cent would be applicable for 250 commodities (agro-products andindustrial inputs), 12.5 per cent for 217 items and one per cent for gold and precious metals. Operationally, VAT onoutput would be adjusted for VAT on input purchases of raw materials or goods purchased for resale. The uniformapplication of VAT is expected to boost fair trade and enable complete self-assessment by the tax payer. The systemof input tax credit would enhance production efficiency with investment decisions no longer based on tax differentialsand tax holidays. VAT system would anchor price rise as it weeds out the tax on tax. An interstate VAT InformationExchange System is expected to be set up to help in checking misuse of zero-rating.
The debate on the proposed VAT system still continues. Some analysts feel that harmonisation should not be‘total’ as demonstrated by the VAT system of the European Union. The total uniformity, they argue, undercuts theStates’ fiscal power and weakens their accountability in spending by severing the link between the power to spendand the power to tax. They also feel a different tax rate on input (4 per cent) from the rest compromises on the meritof VAT of doing away with the distinction between commodities by use (EPW, 2004). The general VAT rate also ishigher than the general sales tax of 8 to 10 per cent prevailing in most of the States. It also remains to be seen howthe proposal of the Kelkar Task Force for a ‘unified goods and services tax’ to be levied in the Centre and the Statesis integrated with VAT system of the States. Notwithstanding the debate, the VAT system at the State level isexpected to refine the sales tax system and improve the efficiency in the allocation of resources. The EC has assuredin its Meeting in the first week of January 2005 that most of the states would be ready for introduction of VAT byApril 1, 2005. It would also release a White Paper on implementation of VAT shortly.
References:
1. Chidambaram, P (2004), “India: States to usher VAT by April 2005’’, Meeting of the Finance Minister withEmpowered Committee in September.
2. Economic and Political Weekly (2004), “Whither State VAT?’’ (September 25-October 11).
3. Indian Tax Foundation (2001), Value-Added Tax: Theory and the Indian Experience, Indian Tax Foundation,New Delhi
4. Purohit, M. C., (2001), “National and Sub-national VATs: A Road Map for India”, Economic and Political Weekly,March 3.
text_final.p65 1/6/05, 12:06 AM21

State Finances : A Study of Budgets of 2004-05
22
budgeted to be stagnant at the previous year’s levelof 1.3 per cent of GDP.
The trends in shares of the major componentsof States’ own non-tax revenues during 2000-01 to2004-05 are depicted in Chart 7. It may be observedthat the share of interest receipts declined steeplyupto 2003-04. The share of dividends and profitshas remained abysmally low indicating that thereturns from investment have continued to bealmost negligible over this period. In fact, theEleventh Finance Commission had observed thatthe average rate of return on capital invested in theState Electricity Boards, that account for the bulkof the States’ investment in Public SectorUndertakings, has been persistently negative.
Chart 7: Non-Tax Receipts
0.0
10.0
20.0
30.0
40.0
50.0
2000-01 2001-02 2002-03 2003-04 2004-05
%of
Sta
tes'
Ow
nN
on-T
axR
even
ue
Interest Receipts Dividends and Profits Social Services Economic Services
during 2003-04 reflected enhanced assistance totheir SEBs.
Power Subsidies
The expected improvement in cost recovery inrespect of the power sector assumes significancein the context of the announcement of free powerfor certain sections by some State Governments,and the long-standing problem of power subsidies.According to Economic Survey (2003-04)published by the Government of India, powersubsidy increased from Rs.7,449 crore in 1991-92to Rs.31,941 crore in the revised estimates for 2003-04 and further to Rs.33,797 crore in the AnnualPlan estimates for 2004-05 (Table XVII). As a ratioto GDP, power subsidy would decline from 1.6 percent in 2000-01 to 1.1 per cent in 2004-05.
It is also evident from Chart 8 that the receiptsfrom social services (education, health) have beenmuch lower than those from economic services(irrigation, power and roads). In fact, low costrecovery in respect of public services has been aperennial concern in State Government finances,which essentially stems from the levy ofinappropriate user charges (Table XVI).
It may be observed that while there has not beenmuch change in cost recovery in respect ofeducation and health, a sharp improvement in costrecovery is expected in the case of the power sectorduring 2004-05. This appears to be mainly onaccount of a substantial decline in non-plan revenueexpenditure mainly in respect of Madhya Pradeshand Uttar Pradesh from their high levels in theprevious year. The increase in non-plan revenueexpenditure by these two States in the power sector
Table XVI :Cost Recovery of Select Services*
(Per cent)
Item 2000-01 2001-02 2002-03 2003-04 2004-05Accounts Accounts Accounts RE BE
1 2 3 4 5 6
Social ServicesEducation 1.2 1.2 1.6 1.5 1.2Health 4.6 6.1 5.4 5.8 5.9
EconomicServicesIrrigation 8.2 7.5 8.4 15.0 13.9Power 6.5 6.4 5.8 4.4 14.5Roads 16.1 19.3 15.5 18.2 19.5
BE: Budget Estimates RE: Revised Estimates.* : Ratio of Non-tax Revenue to Non-plan Revenue ExpenditureSource : Compiled from budget documents of State Governments.
Chart 8: Cost Recovery of Select Services *
10
15
20
25
2000-01 2001-02 2002-03 2003-04 2004-05
Education Health Irrigation Power Roads
5
0
Per
cent
* : Ratio of Non-tax Revenue to Non-plan Revenue Expenditure
text_final.p65 1/6/05, 12:06 AM22
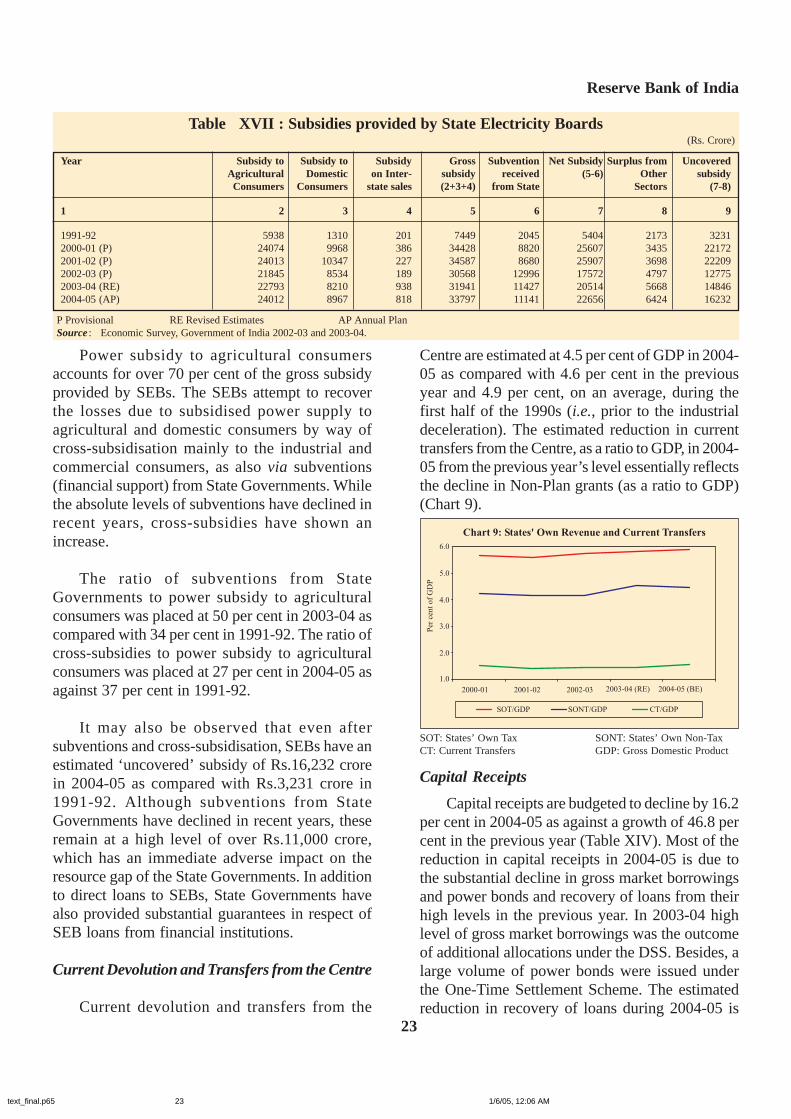
Reserve Bank of India
23
Power subsidy to agricultural consumersaccounts for over 70 per cent of the gross subsidyprovided by SEBs. The SEBs attempt to recoverthe losses due to subsidised power supply toagricultural and domestic consumers by way ofcross-subsidisation mainly to the industrial andcommercial consumers, as also via subventions(financial support) from State Governments. Whilethe absolute levels of subventions have declined inrecent years, cross-subsidies have shown anincrease.
The ratio of subventions from StateGovernments to power subsidy to agriculturalconsumers was placed at 50 per cent in 2003-04 ascompared with 34 per cent in 1991-92. The ratio ofcross-subsidies to power subsidy to agriculturalconsumers was placed at 27 per cent in 2004-05 asagainst 37 per cent in 1991-92.
It may also be observed that even aftersubventions and cross-subsidisation, SEBs have anestimated ‘uncovered’ subsidy of Rs.16,232 crorein 2004-05 as compared with Rs.3,231 crore in1991-92. Although subventions from StateGovernments have declined in recent years, theseremain at a high level of over Rs.11,000 crore,which has an immediate adverse impact on theresource gap of the State Governments. In additionto direct loans to SEBs, State Governments havealso provided substantial guarantees in respect ofSEB loans from financial institutions.
Current Devolution and Transfers from the Centre
Current devolution and transfers from the
Centre are estimated at 4.5 per cent of GDP in 2004-05 as compared with 4.6 per cent in the previousyear and 4.9 per cent, on an average, during thefirst half of the 1990s (i.e., prior to the industrialdeceleration). The estimated reduction in currenttransfers from the Centre, as a ratio to GDP, in 2004-05 from the previous year’s level essentially reflectsthe decline in Non-Plan grants (as a ratio to GDP)(Chart 9).
1.0
2.0
3.0
4.0
5.0
6.0
2000-01 2001-02 2002-03 2003-04 (RE) 2004-05 (BE)
SOT/GDP SONT/GDP CT/GDP
Chart 9: States' Own Revenue and Current Transfers
Per
cen
to
fG
DP
Capital Receipts
Capital receipts are budgeted to decline by 16.2per cent in 2004-05 as against a growth of 46.8 percent in the previous year (Table XIV). Most of thereduction in capital receipts in 2004-05 is due tothe substantial decline in gross market borrowingsand power bonds and recovery of loans from theirhigh levels in the previous year. In 2003-04 highlevel of gross market borrowings was the outcomeof additional allocations under the DSS. Besides, alarge volume of power bonds were issued underthe One-Time Settlement Scheme. The estimatedreduction in recovery of loans during 2004-05 is
Table XVII : Subsidies provided by State Electricity Boards(Rs. Crore)
Year Subsidy to Subsidy to Subsidy Gross Subvention Net Subsidy Surplus from UncoveredAgricultural Domestic on Inter- subsidy received (5-6) Other subsidy
Consumers Consumers state sales (2+3+4) from State Sectors (7-8)
1 2 3 4 5 6 7 8 9
1991-92 5938 1310 201 7449 2045 5404 2173 32312000-01 (P) 24074 9968 386 34428 8820 25607 3435 221722001-02 (P) 24013 10347 227 34587 8680 25907 3698 222092002-03 (P) 21845 8534 189 30568 12996 17572 4797 127752003-04 (RE) 22793 8210 938 31941 11427 20514 5668 148462004-05 (AP) 24012 8967 818 33797 11141 22656 6424 16232
P Provisional RE Revised Estimates AP Annual PlanSource : Economic Survey, Government of India 2002-03 and 2003-04.
SOT: States’ Own Tax SONT: States’ Own Non-TaxCT: Current Transfers GDP: Gross Domestic Product
text_final.p65 1/6/05, 12:06 AM23
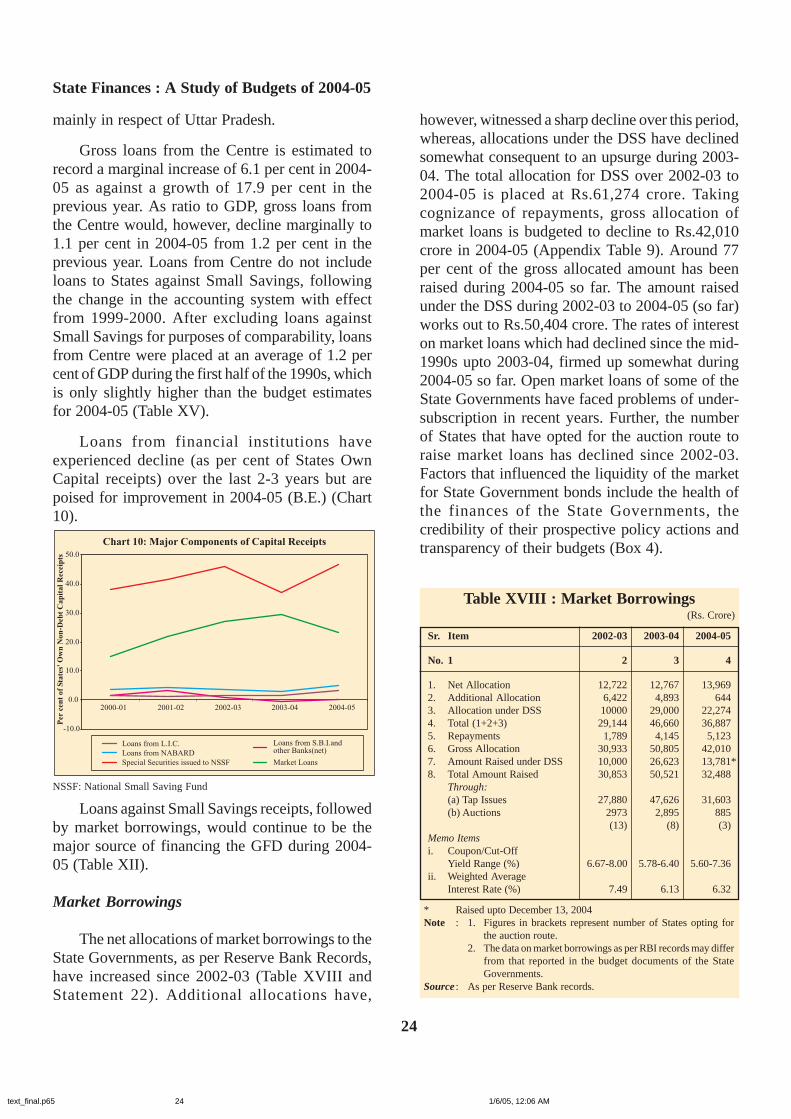
State Finances : A Study of Budgets of 2004-05
24
mainly in respect of Uttar Pradesh.
Gross loans from the Centre is estimated torecord a marginal increase of 6.1 per cent in 2004-05 as against a growth of 17.9 per cent in theprevious year. As ratio to GDP, gross loans fromthe Centre would, however, decline marginally to1.1 per cent in 2004-05 from 1.2 per cent in theprevious year. Loans from Centre do not includeloans to States against Small Savings, followingthe change in the accounting system with effectfrom 1999-2000. After excluding loans againstSmall Savings for purposes of comparability, loansfrom Centre were placed at an average of 1.2 percent of GDP during the first half of the 1990s, whichis only slightly higher than the budget estimatesfor 2004-05 (Table XV).
Loans from financial institutions haveexperienced decline (as per cent of States OwnCapital receipts) over the last 2-3 years but arepoised for improvement in 2004-05 (B.E.) (Chart10).
however, witnessed a sharp decline over this period,whereas, allocations under the DSS have declinedsomewhat consequent to an upsurge during 2003-04. The total allocation for DSS over 2002-03 to2004-05 is placed at Rs.61,274 crore. Takingcognizance of repayments, gross allocation ofmarket loans is budgeted to decline to Rs.42,010crore in 2004-05 (Appendix Table 9). Around 77per cent of the gross allocated amount has beenraised during 2004-05 so far. The amount raisedunder the DSS during 2002-03 to 2004-05 (so far)works out to Rs.50,404 crore. The rates of intereston market loans which had declined since the mid-1990s upto 2003-04, firmed up somewhat during2004-05 so far. Open market loans of some of theState Governments have faced problems of under-subscription in recent years. Further, the numberof States that have opted for the auction route toraise market loans has declined since 2002-03.Factors that influenced the liquidity of the marketfor State Government bonds include the health ofthe finances of the State Governments, thecredibility of their prospective policy actions andtransparency of their budgets (Box 4).Chart 10: Major Components of Capital Receipts
-10.0
0.0
10.0
20.0
30.0
40.0
50.0
2000-01 2001-02 2002-03 2003-04 2004-05
Per
cen
tof
Sta
tes'
Ow
nN
on
-Deb
tC
ap
ital
Rec
eip
ts
Loans from L.I.C. Loans from S.B.I.andother Banks(net)Loans from NABARD
Market LoansSpecial Securities issued to NSSF
Loans against Small Savings receipts, followedby market borrowings, would continue to be themajor source of financing the GFD during 2004-05 (Table XII).
Market Borrowings
The net allocations of market borrowings to theState Governments, as per Reserve Bank Records,have increased since 2002-03 (Table XVIII andStatement 22). Additional allocations have,
Table XVIII : Market Borrowings(Rs. Crore)
Sr. Item 2002-03 2003-04 2004-05
No. 1 2 3 4
1. Net Allocation 12,722 12,767 13,9692. Additional Allocation 6,422 4,893 6443. Allocation under DSS 10000 29,000 22,2744. Total (1+2+3) 29,144 46,660 36,8875. Repayments 1,789 4,145 5,1236. Gross Allocation 30,933 50,805 42,0107. Amount Raised under DSS 10,000 26,623 13,781*8. Total Amount Raised 30,853 50,521 32,488
Through:(a) Tap Issues 27,880 47,626 31,603(b) Auctions 2973 2,895 885
(13) (8) (3)Memo Itemsi. Coupon/Cut-Off
Yield Range (%) 6.67-8.00 5.78-6.40 5.60-7.36ii. Weighted Average
Interest Rate (%) 7.49 6.13 6.32
* Raised upto December 13, 2004Note : 1. Figures in brackets represent number of States opting for
the auction route.2. The data on market borrowings as per RBI records may differ
from that reported in the budget documents of the StateGovernments.
Source : As per Reserve Bank records.
NSSF: National Small Saving Fund
text_final.p65 1/6/05, 12:06 AM24

Reserve Bank of India
25
The weighted average maturity of the StateGovernments securities issued during the yearincreased to 11.05 years in 2003-04 from 10 years
in 2002-03. In the composite portfolio ofoutstanding loans of the State Governments,securities in the maturity range of 6-10 years
Box 4Factors Influencing the Liquidity of the Government Bond Market:
An Emerging Markets Perspective
Notwithstanding the significant growth in government domestic bond markets in emerging market economiesin recent years, insufficient liquidity has circumscribed the development of these markets. A liquid governmentbond market facilitates (i) the financing of the government deficit at low costs; (ii) the pricing of other financialassets; and (iii) the conduct of monetary policy. The liquidity of a market could be ascertained by its relativetightness, depth and resilience. Tightness of a market could be gauged by bid-ask spreads, the depth of a market byits ability to handle large transactions without causing sharp changes in prices and the resilience by the speed withwhich price fluctuations are ultimately diffused.
It has been observed that the size of the economy need not necessarily impede the liquidity of the governmentbond market. The experience of Taiwan shows that the entry of foreign banks and securities firms helped to createa level playing field in the existing small market with relatively few (and monopolistic) players. Another way toenhance liquidity is to allow (highly rated) offshore banks and domestic companies to hold and issue local currencybonds, as in the case of Singapore.
An important factor influencing the liquidity of government bonds is the extent of interest rate deregulation.While emerging market economies have witnessed interest rate liberalisation, instances of policy interventions toset the interest rate at the ‘appropriate’ level are also evident. Such interventions usually stem from the objective tosignal the monetary policy stance or from concerns relating to the impact of an interest rate hike on the sustainabilityof government debt as also on the balance sheets of banks and financial institutions (which hold such bonds). Theresultant under-allocation to the announced amount of bond floatation is filled, in some cases, by an underwritingagency at a rate lower than the average auction rate. When central banks are also debt managers to government debt,policy coordination between the fiscal and monetary authorities becomes even more important for the purposes ofthe development of the government bond market.
Broadening the investor base by permitting the entry of foreign institutional investors (such as pension andinsurance funds) or by promoting mutual or gilt funds also help to improve the liquidity of government bondmarkets.
A well-developed money market is also important for the liquidity of the government bond market, since itreduces liquidity risks for bondholders by providing access to immediate cash. High reserve requirements, however,impede the development of the money market.
One of the main factors that influence the liquidity of the primary market is the health of the finances of theGovernment, the credibility of its prospective policy actions and the transparency of the budget. Liquidity alsodepends upon the extent to which the government precommits to set a set of issuing policies that encourage investorsto bid in a desirable way. Different auction techniques (multiple or uniform price), limits on participation to draw ajudicious balance between the objectives of broadening the investor base and operational convenience, as well as,the nature and extent of central bank participation also influence the liquidity of the primary market.
Liquidity of secondary markets could be enhanced by repo transactions since these allow market participants toborrow against their securities portfolio, generally below the unsecured borrowing rate. Developing certain benchmarkswith high liquidity characteristics is also considered important. For instance, a policy of ‘passive consolidation’ ofbonds was adopted in India by reopening existing highly demanded loans. Thirdly, the extent and frequency to
text_final.p65 1/6/05, 12:06 AM25
State Finances : A Study of Budgets of 2004-05
26
which bondholders are required to mark their portfolio to the market is an important determinant of the liquidity ofthe government bond market. Absence of mark-to-market practices encourages investors not to book accrued gainsor losses in their portfolio, reducing the incentives to trade. Broadening the range of debt instruments to, say, includeinflation-indexed bonds and zero-coupon bonds in order to cater to the preferences of investors, is also an importantinitiative. A modern system of payment and settlements could also help to enhance secondary market liquidity inGovernment bonds.
In India, developing a deep and liquid secondary market in government securities has been the main objectiveof the Reserve Bank in the recent period. To that end, the Reserve Bank has initiated legal and regulatory reforms,infrastructure and technology improvement, safe settlement system and market dissemination of information on alltrades in the wholesale market. It also improved methods of issuance such as reopenings and price-based auctionsthereby improving fungibility, introduced derivatives such as interest rate swaps and enlarged the repo markets.Repos conducted by the Reserve Bank are, however, restricted to Central Government bonds. Liquidity supportfacilities to the primary dealers and timely open market operations have also been felt necessary to prevent thedrying-up of liquidity in the secondary markets. In all these areas, the dilemmas have been resolved through aphased sequencing towards a clear ultimate objective.
In the ultimate analysis, the liquidity in the market for State Government bonds would be greatly influenced bycredible institutional and fiscal reforms and a durable improvement in the financial position of the States.
References:
1. Bank for International Settlements (2002), “The Development of Bonds Markets in Emerging Economies”, BISPapers No.11, June.
2. Reserve Bank of India, Annual Report, Various issues.
constituted the largest share (53.9 per cent),followed by 0-5 years (32.1 per cent) and above 10years (14.0 per cent) (Table XIX and XX). TheState-wise and scrip-wise details of outstandingmarket loans are presented in Statement 25.
Devolution and Transfer of Resources from theCentre
Gross devolution and transfer of resources (i.e.,shareable tax revenue, grants and loans) from theCentre are estimated to increase by 9.4 per cent toRs.1,73,088 crore in 2004-05 as compared with agrowth of 22.2 per cent in the previous year. As aratio to GDP, gross devolution and transfers fromthe Centre would decline to 5.5 per cent in 2004-05 from 5.7 per cent in the previous year and fromthe average level of 6.8 per cent, during the firsthalf of the 1990s. Gross devolution and transfersfrom the Centre would finance 31.4 per cent of theaggregate disbursements of the State Governmentsin 2004-05 as compared with 28.6 per cent in theprevious year (Appendix Table 18). The prospective
mechanism of devolution of transfer of resourcesfrom the Centre to the States has been recommendedby the Twelfth Finance Commission, whose Reporthas been submitted to the Hon’ble President of Indiarecently. The international experience in this regardindicates the emergence of several issues whichhave a significant bearing on sub-nationalGovernment finances and fiscal federalism. Theseissues include the general asymmetry in thedevolution of expenditure responsibilities vis-a-visrevenue raising powers, the impact of overallmacroeconomic imbalances as well asadministrative weaknesses at the sub-national levelon the feasible degree of decentralisation and theneed to promote market discipline in respect of sub-national government borrowings (Box 5).
Revenue Expenditure
Revenue expenditure is budgeted to decelerateto 4.0 per cent in 2004-05 from 19.9 per cent in theprevious year. Total revenue expenditure net ofpower sector, is, however, expected to grow at 7.4
text_final.p65 1/6/05, 12:06 AM26
Reserve Bank of India
27
Box 5Major Issues in Sub-national Government Finances and Fiscal Federalism:
The International Experience
Cross-country evidence over the past few decades suggests a fairly clear tendency towards increasingdecentralisation of expenditure responsibilities to subnational governments. The same trend, albeit to alesser degree, is evident in the case of revenue-raising responsibilities. Several issues have emerged in thiscontext.
The design of intergovernmental fiscal relations is significantly influenced by non-economic (political,social and cultural) and economic factors. The formulation of fiscal federal relations usually takes cognisanceof various (sometimes competing) objectives, namely allocative efficiency, income redistribution, andmacroeconomic management. The implicit weights assigned to these objectives in different countries, andtheir changing profile over time, mirror the country’s social and political history, extant conditions, apartfrom the degree of macroeconomic imbalances.
On theoretical considerations, a decentralisation of expenditure responsibilities should in principle leadto allocative efficiency gains, by facilitating a closer correspondence between expenditure priorities and thepreferences of the people concerned. On pragmatic grounds, however, these theoretical efficiency gainsmay not materialise (fully) on account of administrative weaknesses at the sub-national level and in particular,the lack of modern and transparent public expenditure management systems.
The international experience generally underscores the need to accompany a decentralisation ofexpenditure responsibilities with revenue decentralisation, with a view to promoting fiscal responsibilityand political responsibility of the subnational government. Taxes with relatively low mobility, a fairly evendistribution of the base over the national territory, and relative stability over the cycle, are usually mostsuitable for decentralisation. Accordingly, personal income tax, general retail sales taxes and certain excisesare generally assigned to regional governments whereas property tax, business license fees and user fees aregenerally assigned to local governments. In general, tax-induced distortions could be minimised by ensuringthe harmonisation of the definition of tax bases and precluding large variations in tax rates across the nation.
Since administrative infirmities of the subnational governments could circumscribe effective revenuedecentralisation, strengthening of administrative capacities should preferably precede a decentralisation ofthe administration of the taxes.
The trade-off between objectives of decentralisation and distribution may be accentuated in countriescharacterised by large regional disparities in income. In such instances, a system of equalisation-orientedvertical transfers from the centre (as in Australia) or a horizontal redistribution mechanism (as in Germany)could become necessary. The formulation of such mechanisms should, however, need to ensure that theseare cost effective and do not discourage the tax efforts of the sub-national governments.
Trade-offs are also evident between decentralisation and the efficacy of macroeconomic stabilisationprogrammes. Consequently, the pace of decentralisation needs to be determined by the degree of fiscal ormacroeconomic imbalances. In countries with large macroeconomic imbalances, cross-country experienceindicates the significance of imposing a hard budget constraint on the sub-national governments, whileproviding an adequate ex ante balance between expenditure responsibilities and own revenues plus clearlydefined transfers from the centre, coupled with prohibition of borrowing.
text_final.p65 1/6/05, 12:06 AM27
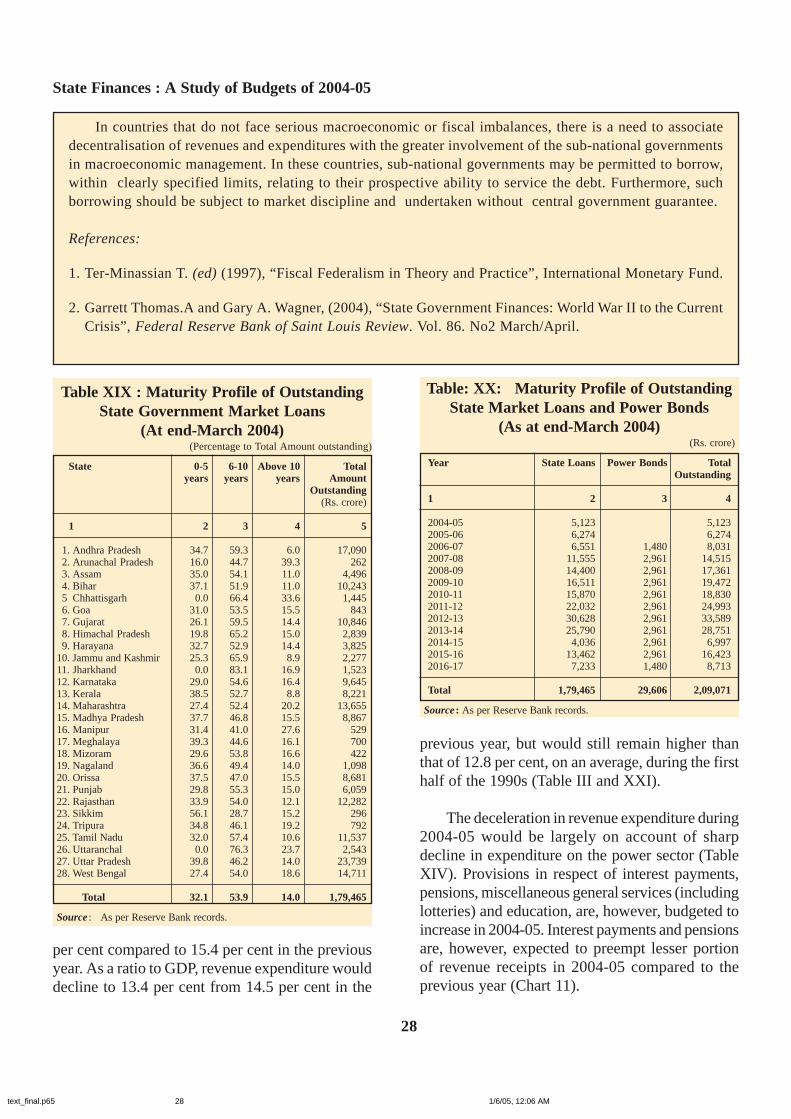
State Finances : A Study of Budgets of 2004-05
28
In countries that do not face serious macroeconomic or fiscal imbalances, there is a need to associatedecentralisation of revenues and expenditures with the greater involvement of the sub-national governmentsin macroeconomic management. In these countries, sub-national governments may be permitted to borrow,within clearly specified limits, relating to their prospective ability to service the debt. Furthermore, suchborrowing should be subject to market discipline and undertaken without central government guarantee.
References:
1. Ter-Minassian T. (ed) (1997), “Fiscal Federalism in Theory and Practice”, International Monetary Fund.
2. Garrett Thomas.A and Gary A. Wagner, (2004), “State Government Finances: World War II to the CurrentCrisis”, Federal Reserve Bank of Saint Louis Review. Vol. 86. No2 March/April.
Table XIX : Maturity Profile of OutstandingState Government Market Loans
(At end-March 2004)(Percentage to Total Amount outstanding)
State 0-5 6-10 Above 10 Totalyears years years Amount
Outstanding(Rs. crore)
1 2 3 4 5
1. Andhra Pradesh 34.7 59.3 6.0 17,0902. Arunachal Pradesh 16.0 44.7 39.3 2623. Assam 35.0 54.1 11.0 4,4964. Bihar 37.1 51.9 11.0 10,2435 Chhattisgarh 0.0 66.4 33.6 1,4456. Goa 31.0 53.5 15.5 8437. Gujarat 26.1 59.5 14.4 10,8468. Himachal Pradesh 19.8 65.2 15.0 2,8399. Harayana 32.7 52.9 14.4 3,825
10. Jammu and Kashmir 25.3 65.9 8.9 2,27711. Jharkhand 0.0 83.1 16.9 1,52312. Karnataka 29.0 54.6 16.4 9,64513. Kerala 38.5 52.7 8.8 8,22114. Maharashtra 27.4 52.4 20.2 13,65515. Madhya Pradesh 37.7 46.8 15.5 8,86716. Manipur 31.4 41.0 27.6 52917. Meghalaya 39.3 44.6 16.1 70018. Mizoram 29.6 53.8 16.6 42219. Nagaland 36.6 49.4 14.0 1,09820. Orissa 37.5 47.0 15.5 8,68121. Punjab 29.8 55.3 15.0 6,05922. Rajasthan 33.9 54.0 12.1 12,28223. Sikkim 56.1 28.7 15.2 29624. Tripura 34.8 46.1 19.2 79225. Tamil Nadu 32.0 57.4 10.6 11,53726. Uttaranchal 0.0 76.3 23.7 2,54327. Uttar Pradesh 39.8 46.2 14.0 23,73928. West Bengal 27.4 54.0 18.6 14,711
Total 32.1 53.9 14.0 1,79,465
Source : As per Reserve Bank records.
Table: XX: Maturity Profile of OutstandingState Market Loans and Power Bonds
(As at end-March 2004)(Rs. crore)
Year State Loans Power Bonds TotalOutstanding
1 2 3 4
2004-05 5,123 5,1232005-06 6,274 6,2742006-07 6,551 1,480 8,0312007-08 11,555 2,961 14,5152008-09 14,400 2,961 17,3612009-10 16,511 2,961 19,4722010-11 15,870 2,961 18,8302011-12 22,032 2,961 24,9932012-13 30,628 2,961 33,5892013-14 25,790 2,961 28,7512014-15 4,036 2,961 6,9972015-16 13,462 2,961 16,4232016-17 7,233 1,480 8,713
Total 1,79,465 29,606 2,09,071
Source : As per Reserve Bank records.
per cent compared to 15.4 per cent in the previousyear. As a ratio to GDP, revenue expenditure woulddecline to 13.4 per cent from 14.5 per cent in the
previous year, but would still remain higher thanthat of 12.8 per cent, on an average, during the firsthalf of the 1990s (Table III and XXI).
The deceleration in revenue expenditure during2004-05 would be largely on account of sharpdecline in expenditure on the power sector (TableXIV). Provisions in respect of interest payments,pensions, miscellaneous general services (includinglotteries) and education, are, however, budgeted toincrease in 2004-05. Interest payments and pensionsare, however, expected to preempt lesser portionof revenue receipts in 2004-05 compared to theprevious year (Chart 11).
text_final.p65 1/6/05, 12:06 AM28

Reserve Bank of India
29
Chart 11: Interest Payments and Pensions
9.0
15.0
21.0
27.0
2000-01 2001-02 2002-03 2003-04 (RE) 2004-05 (BE)
Per
cen
to
fR
even
ue
Rec
eip
ts
Interest Payments Pension
0.0
4.0
8.0
12.0
16.0
1990-95 1995-2000 2000-01 2001-02 2002-03 2003-04(RE)
2004-05(BE)
Per
cen
to
fG
DP
Chart 12: Trends in Revenue Expenditure, Capital Outlayand Loans & Advances
CO/GDP LA/GDPREx/GDP
Capital Disbursements
Capital disbursements would decline by 12.3per cent in 2004-05 as against an increase of 78.8per cent in the previous year. Over 60 per cent ofthe decline in capital disbursements would be onaccount of repayments of loans to the Centre (TableXIV). In contrast, loans and advances for powerprojects by the State Governments would contribute36 per cent of the decline in capital disbursement.The decline observed in the budget estimatesemanates mainly from the higher base in capitalexpenditure in the previous year on account ofhigher provisions towards one-time settlement ofpower dues of SEBs. Capital outlay on irrigationand flood control is also budgeted to decline in2004-05. As a consequence, the ratio of capitaloutlay to GDP would be placed at 1.9 per cent in2004-05 as compared with 2.2 per cent in theprevious year and 1.6 per cent, on an average, inthe first half of the 1990s (Chart 12).
Developmental and Non-DevelopmentalExpenditure
Total developmental (revenue plus capital)expenditure would be placed lower at 9.2 per centof GDP than 10.9 per cent in the previous year and10.8 per cent, on an average, in the first half of the1990s. Within developmental expenditure, SocialSector expenditure (comprising social services,food storage and warehousing) would be placed at5.4 per cent of GDP in 2004-05 as compared with5.9 per cent in the previous year. On the other hand,in 2004-05, non-developmental expenditure wouldremain at the previous year’s level of 6.4 per cent
of GDP, which would be higher than that of 4.3 percent in the first half of the 1990s (Chart 13, TableIII and Appendix Tables 10-17).
Non-Plan Non-Developmental expenditure, asratio to GDP, would be placed at the previous year’slevel of 6.3 per cent (Table XXI).
The evolution of expenditures of the StateGovernments in the future would need to takecognisance of the demographical changes in thecountry and corresponding implications for socialsecurity, health care, pensions and relatedexpenditure (Box 6).
Table XXI: Pattern of Expenditure(per cent of GDP)
2003-04 2004-05Item RE BE
1 2 3
Total Expenditure 20.0 17.71+2 = 3+4+51. Revenue Expenditure 14.5 13.4
of whichInterest payments 3.0 2.9
2. Capital Expenditure 5.5 4.3of whichCapital outlay 2.2 1.9
3. Developmental Expenditure 10.9 9.2
4. Non Developmental Expenditure 6.4 6.4
5. Others * 2.7 2.1
Memo itemNon-Plan Non Developmental Expenditure 6.3 6.3
BE: Budget Estimates RE: Revised Estimates* : Includes discharge of internal debt, repayments of loans to
Centre, compensation and assignments to local bodies, etc.Source : Same as Table XI.
REx: Revenue Expenditure CO: Capital OutlayLA: Loans and Advances GDP: Gross Domestic Product
text_final.p65 1/6/05, 12:06 AM29
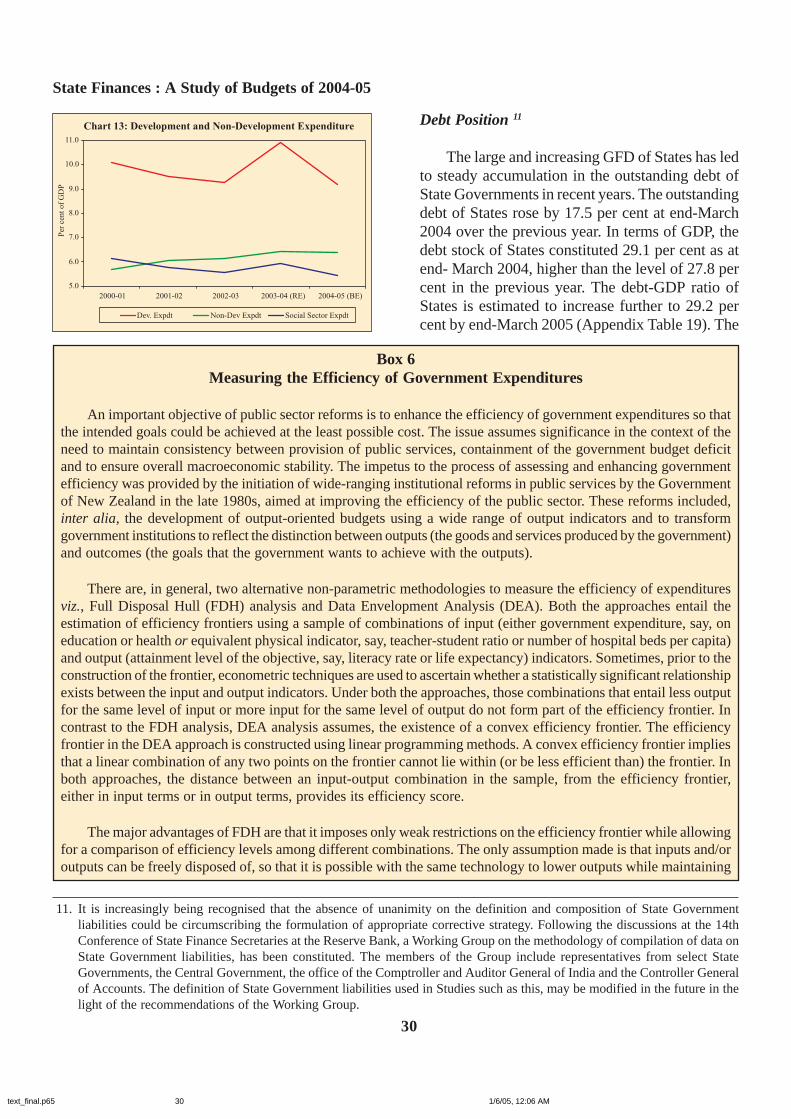
State Finances : A Study of Budgets of 2004-05
30
Debt Position 11
The large and increasing GFD of States has ledto steady accumulation in the outstanding debt ofState Governments in recent years. The outstandingdebt of States rose by 17.5 per cent at end-March2004 over the previous year. In terms of GDP, thedebt stock of States constituted 29.1 per cent as atend- March 2004, higher than the level of 27.8 percent in the previous year. The debt-GDP ratio ofStates is estimated to increase further to 29.2 percent by end-March 2005 (Appendix Table 19). The
Chart 13: Development and Non-Development Expenditure
5.0
6.0
7.0
8.0
9.0
10.0
11.0
2000-01 2001-02 2002-03 2003-04 (RE) 2004-05 (BE)
Per
cen
to
fG
DP
Dev. Expdt Non-Dev Expdt Social Sector Expdt
Box 6Measuring the Efficiency of Government Expenditures
An important objective of public sector reforms is to enhance the efficiency of government expenditures so thatthe intended goals could be achieved at the least possible cost. The issue assumes significance in the context of theneed to maintain consistency between provision of public services, containment of the government budget deficitand to ensure overall macroeconomic stability. The impetus to the process of assessing and enhancing governmentefficiency was provided by the initiation of wide-ranging institutional reforms in public services by the Governmentof New Zealand in the late 1980s, aimed at improving the efficiency of the public sector. These reforms included,inter alia, the development of output-oriented budgets using a wide range of output indicators and to transformgovernment institutions to reflect the distinction between outputs (the goods and services produced by the government)and outcomes (the goals that the government wants to achieve with the outputs).
There are, in general, two alternative non-parametric methodologies to measure the efficiency of expendituresviz., Full Disposal Hull (FDH) analysis and Data Envelopment Analysis (DEA). Both the approaches entail theestimation of efficiency frontiers using a sample of combinations of input (either government expenditure, say, oneducation or health or equivalent physical indicator, say, teacher-student ratio or number of hospital beds per capita)and output (attainment level of the objective, say, literacy rate or life expectancy) indicators. Sometimes, prior to theconstruction of the frontier, econometric techniques are used to ascertain whether a statistically significant relationshipexists between the input and output indicators. Under both the approaches, those combinations that entail less outputfor the same level of input or more input for the same level of output do not form part of the efficiency frontier. Incontrast to the FDH analysis, DEA analysis assumes, the existence of a convex efficiency frontier. The efficiencyfrontier in the DEA approach is constructed using linear programming methods. A convex efficiency frontier impliesthat a linear combination of any two points on the frontier cannot lie within (or be less efficient than) the frontier. Inboth approaches, the distance between an input-output combination in the sample, from the efficiency frontier,either in input terms or in output terms, provides its efficiency score.
The major advantages of FDH are that it imposes only weak restrictions on the efficiency frontier while allowingfor a comparison of efficiency levels among different combinations. The only assumption made is that inputs and/oroutputs can be freely disposed of, so that it is possible with the same technology to lower outputs while maintaining
11. It is increasingly being recognised that the absence of unanimity on the definition and composition of State Governmentliabilities could be circumscribing the formulation of appropriate corrective strategy. Following the discussions at the 14thConference of State Finance Secretaries at the Reserve Bank, a Working Group on the methodology of compilation of data onState Government liabilities, has been constituted. The members of the Group include representatives from select StateGovernments, the Central Government, the office of the Comptroller and Auditor General of India and the Controller Generalof Accounts. The definition of State Government liabilities used in Studies such as this, may be modified in the future in thelight of the recommendations of the Working Group.
text_final.p65 1/6/05, 12:06 AM30

Reserve Bank of India
31
receipts. The ratio of interest payments to revenuereceipts is placed at around 25 per cent in 2004-05as compared with 18 per cent recommended by theEFC from the viewpoint of ensuring debtsustainability in the medium term. The burden ofinterest payments tends to exacerbate the revenue
Statewise analysis is provided in the subsequentsection.
Interest payments on the debt of StateGovernments have also mounted, and have pre-empted an increasing proportion of revenue
the level of inputs and to increase the inputs while maintaining outputs at the same level. This assumption guaranteesthe existence of a continuous FDH, for any sample. On account of the convexity assumption, DEA is more stringentthan FDH - a combination that is efficient under DEA will be efficient under FDH, but not necessarily vice versa.Thus, smaller efficiency scores are obtained under DEA than under FDH. As compared to parametric methods, boththe approaches suffer from a limitation i.e., correction for random factors unrelated to efficiency is not possible andtherefore statistical noise is included in the measure of inefficiency.
There are a number of empirical studies on the efficiency of government expenditures. For instance, Karras(1996) finds that government services are overprovided in Africa underprovided in Asia and optimally providedelsewhere.
Harbison and Hanushek (1992) survey 96 studies of education production functions in developing countries.They find that in most studies of developing countries, teacher education, teacher experience and the availability offacilities have a positive and significant impact on education output, and that the effect of expenditure per pupil issignificant in half the studies while the pupil-teacher ratio and teacher salary have no discernable impact on educationoutput.
Tanzi and Schuknecht (1997) found that in a sample of industrial countries, higher public spending does notsignificantly improve social welfare. Afonso and M.St.Aubyn (2004) use both the approaches to assess the efficiencyof expenditure on education and health for a sample of OECD countries and find that efficient outcomes seem tocluster around a small number of core countries viz., Finland, Japan, Korea and Sweden.
Gupta et al. (1997), using FDH analysis find that, on average, governments in African countries are less efficientin the provision of health and education services than the governments in Asia and the western Hemisphere withthose in Asia appearing as most efficient. The authors suggest that the observed inefficiencies in Africa are unrelatedto the level of private spending, but may be the result of relatively high government wages (in the case of educationspending) and the intrasectoral allocation of government resources. Furthermore, no apparent relationship is observedbetween input efficiency scores and public spending as a share of GDP. The results need to take cognizance of thelagged impact of public spending on output indicators. Moreover, the results underscore the need for interpretingthe positive relationship between government spending on education and health indicators, as obtained fromeconometric techniques, with caution, particularly when the initial level of spending is already high. Thus, theStudy suggests that increasing budgetary allocations for education and health may not be the only or most effectiveway to increase education and health output and that more attention should be given to increasing the efficiency ofexpenditure.
References:
1. Afonso A. and M. St. Aubyn (2004), “Non-parametric Approaches to Education and Health Expenditure Efficiencyin OECD Countries”, OECD Working Paper, January.
2. Gupta S., K. Honjo and M. Verhoeven (1997), “The Efficiency of Government Expenditure: Experience fromAfrica”, IMF Working Paper No.WP/97/153.
3. Premchand A. (1993), “Public Expenditure Management”, International Monetary Fund.
text_final.p65 1/6/05, 12:06 AM31

State Finances : A Study of Budgets of 2004-05
32
It needs to be highlighted that the budgetdocuments of the State Governments do not providesufficient details of their outstanding liabilitiesincluding the amounts under various categories andassociated terms and conditions (such as rate ofinterest and maturity structure). Such lacunae areparticularly evident in the case of negotiated loansfrom banks and financial institutions. Consequently,an in-depth analysis of their debt position remainscircumscribed.
Contingent Liabilities
The outstanding guarantees of StateGovernments have shown a rising trend during the1990s. Contingent liabilities do not directly formpart of the debt burden of the States. In the event ofdefault by the borrowing agency, however, theStates will be required to meet the debt serviceobligations. The outstanding guarantees of StateGovernments are estimated to increase fromRs.1,65,386 crore (7.2 per cent of GDP) as at end-March 2002 to Rs.1,84,294 crore (7.5 per cent ofGDP) as at end-March 2003.
In view of the fiscal implication of rising levelof guarantees, many States have taken initiativesto place ceilings on guarantees. Statutory ceilingson guarantees have been instituted by a number ofStates including Goa, Gujarat, Karnataka, Sikkimand West Bengal, while some other States, viz.,Assam, Orissa and Rajasthan have imposedadministrative ceilings on guarantees.
Liquidity Management
A revised Scheme of Ways and MeansAdvances (WMA) was effected on March 3, 2003based on the recommendations of theRamachandran Committee and after consultationswith the State Governments. The total normalWMA limit for the State Governments, under therevised Scheme, was enhanced by 18.8 per centfrom Rs.6,035 crore to Rs.7,170 crore with effectfrom March 3, 2003. The total normal WMA limitwas increased further by 13.5 per cent to Rs.8,140crore with effect from April 1, 2004, on account ofhigher average revenue receipts of the StateGovernments in the preceding three years (TableXXII).
Chart 14: Deficit, Debt and Interest Payments
10.0
15.0
20.0
25.0
30.0
19
90
-91
19
91
-92
19
92
-93
19
93
-94
19
94
-95
19
95
-96
19
96
-97
19
97
-98
19
98
-99
19
99
-00
20
00
-01
20
01
-02
20
02
-03
20
03
-04
20
04
-05
Deb
t/G
DP
,IP
/RR
0.0
1.0
2.0
3.0
4.0
5.0
GF
D/G
DP
GFD/GDP Debt/GDP IP/RR
deficit and, in turn, the GFD. Consequently, avicious circle of deficit, debt and interest paymentshas been a permanent feature of State Governmentfinances.
As mentioned earlier, a number of initiativeshave been taken by the State and CentralGovernments to strengthen and facilitate fiscalreforms at the State level. A notable initiative hasbeen the introduction of the Debt Swap Schemewhich has enabled the States to pre-pay their highcost debt to the Centre. The impact of all theseinitiatives is evident from the reduction in theaverage interest rate of debt from 13.2 per cent in1999-2000 to 12.2 per cent in 2003-04 and furtherto 11.3 per cent in 2004-05.
The composition of outstanding liabilities ofthe State Governments shows a sharp decline inthe share of loans from the Centre with an upsurgein the shares of loans from NSSF, market loans andnegotiated loans from banks and other institutions(Chart 15).
Chart 15: Composition of Outstanding Liability
17%
12%
46%
18%
1%22%
8%
27%
26%
15%
2%
6%
Market loans
Loans from banks & Other InstitutionsNSSF Loans from Centre
State Provident Funds, etc Others*
*Includes Insurance and Pension Funds, Trusts & Endowments and Compensation and Other Bonds
2003-04
2000-01
GFD: Gross Fiscal Deficit IP: Interest PaymentsRR: Revenue Receipts GDP: Gross Domestic Product
text_final.p65 1/6/05, 12:06 AM32

Reserve Bank of India
33
so far, exceeded that in respect of the (full) previousyear.
Most of the State Governments reduced theirrecourse to normal WMA and overdrafts (OD)during 2003-04. This partly reflected a substantiallyhigher (by around 53 per cent) utilisation of specialWMA by the State Governments, mainly onaccount of the change in the provision under therevised Scheme that special WMA should beavailed before taking recourse to normal WMA.The rate of interest charged on special WMA isone percentage point less than that on normalWMA. Higher mobilisation of Small Savings andenhanced market borrowings (other than thoseunder the Debt Swap Scheme) also facilitated thereduction in recourse to normal WMA.Furthermore, the frequency of overdrafts declinedin the case of most States during 2003-04. Even so,the number of occasions as well as the number ofdays on which ODs were resorted during 2003-04remained high, particularly by Assam, Manipur,Kerala, Orissa and Punjab.
During 2004-05 so far (upto December 31,2004), the average utilisation of WMA and ODsince July 2004 has been lower than that in thecorresponding period of the previous year (Chart16). The frequency of resort to overdrafts has alsobeen, in general, lower during 2004-05 (so far) thanthat in the (full) previous year. Even so, a few StateGovernments such as Assam, Kerala and WestBengal have resorted to overdrafts much morefrequently than the other State Governments during2004-05 so far. Furthermore, the number of daysduring which Arunachal Pradesh, Nagaland andUttaranchal resorted to overdrafts during 2004-05
Chart 16: Utilisation of WMA and Overdraft(Weekly Average)
0
2000
4000
6000
8000
Ap
ril
May
Jun
e
July
Au
gu
st
Sep
tem
ber
Oct
ob
er
No
vem
ber
Dec
emb
er
Jan
uar
y
Feb
ruar
y
Mar
ch
(Rs.
cro
re)
2004-05 2003-04 2002-03
Table XXII : Normal WMA Limits(1999 to 2004)
Period Amount Increase(Rs Crore) over
earlier limits(%)
1 2 3
August 1996 to February 1999 2,234 100.0March 1999 to Jan 2001 3,941 76.4February 2001 to March 2002 5,283 34.1April 2002 to March 2, 2003 6,035 14.2March 3, 2003 to March 31 2004 7,170 18.8April 2004 to till date 8,140 13.5
Source : As per RBI records.
While the trends in the actual recourse toWMA/OD by the States from the Reserve Bankare generally encouraging so far, budgetary datafor 2004-05 however, indicate that the potential forthe emergence of liquidity pressures remains large(Table XXIII).
Apart from the WMA from the Reserve Bank,the Central Government also provides WMA to theState Governments, which unlike the former is,however, not a direct source of monetary expansion.It is generally perceived that the Centre’s WMAare utilised by the State Governments over andabove WMA availed from the Reserve Bank andare sometimes used for smoothening liquiditymismatches.
Data on Centre’s (gross) WMA to the StateGovernments, as reported in the budget documentsof the State Governments, during 2000-01 to 2004-05 (Budget Estimates) are set out in Table XXIV.The total amount of such advances has variedbetween Rs.1,301 crore and Rs.3,329 crore overthis period. There are, however, wide inter-Statevariations in the recourse to these advances.Seventeen out of the 29 State Governments haveaccessed these advances in different years duringthis period.
Among the Special Category States, theseadvances have been persistent and usually large inthe case of Manipur and Assam. Non-Special
text_final.p65 1/6/05, 12:06 AM33

State Finances : A Study of Budgets of 2004-05
34
Category States like Punjab, Kerala and Orissa havealso accessed these advances to different degrees,but not to the same extent as Manipur. Six Statesviz., Assam, Kerala, Madhya Pradesh, Manipur,Nagaland and Punjab have budgeted for suchadvances in 2004-05. This probably reflects theiranticipation of continued short-term (liquidity)pressures on their budgets. Furthermore, States likeAssam, Manipur, Kerala, Orissa and Punjab whichaccessed a relatively higher amount of WMA fromthe Centre, are also the ones in respect of whichthe number of occasions as well as the number ofdays on which overdrafts were resorted to from theReserve Bank, remained high during 2003-04.
Another issue that has a bearing on the liquiditymanagement by the State Governments relates totheir negative opening cash balance. Almost all
(Special Category as well as Non-Special Category)State Governments have recorded a negativeopening cash balance in the budget estimates for2004-05, aggregating Rs.10,575 crore, and varyingbetween (-) Rs 2.7 crore (Meghalaya) and (-)Rs.1,241.3 crore (Jammu and Kashmir). Many StateGovernments have recorded negative opening cashbalance in the past as well. An opening cash deficitportends ex ante liquidity problems, which couldexacerbate by the extent to which total receipts fallshort of total expenditures (i.e., the conventionalbudget deficit) during the year, unless alleviatedby ARM. This would, in turn, necessitate thedrawing down of cash/investment balances orrecourse to WMA/OD from the Reserve Bank. Infact, excluding ARM, most State Governmentswould close the year 2004-05 with higher negativecash balance, perpetuating the initial problem.
Table XXIII : State-wise Availment of WMA and OD from the Reserve BankSr. States WMA OD
No. 2004-05* 2003-04 2004-05* 2003-04
Number Number Number Number Number Numberof days of days of occasions of occasions of occasions of days
1 2 3 4 5 6 7 8
Non-Special Category States 1 Andhra Pradesh 0 173 0 0 6 302 Bihar 3 92 0 0 5 443 Goa 213 270 3 13 8 484 Gujarat 82 203 0 0 4 215 Haryana 0 24 0 0 0 06 Karnataka 61 196 0 0 6 337 Kerala 268 328 15 124 27 1788 Madhya Pradesh 100 261 0 0 10 599 Maharashtra 68 207 5 22 5 39
10 Orissa 99 315 0 0 19 16811 Punjab 200 291 7 90 14 13112 Rajasthan 85 303 0 0 16 9413 Tamil Nadu 22 38 0 0 1 214 Uttar Pradesh 260 321 10 79 10 10015 West Bengal 275 362 14 114 21 14016 Chhattisgarh 0 0 0 0 0 017 Jharkhand 0 31 0 0 0 0
Special Category States 1 Arunachal Pradesh 32 0 2 5 0 02 Assam 225 337 10 102 20 2353 Himachal Pradesh 144 327 4 27 14 1094 Manipur 140 268 1 117 14 2015 Meghalaya 6 31 0 0 0 06 Mizoram 142 131 1 1 3 57 Nagaland 81 12 3 18 0 08 Tripura 24 25 0 0 0 09 Uttaranchal 90 78 2 16 3 13
* : As on December 31, 2004.Source : As per Reserve bank records
text_final.p65 1/6/05, 12:06 AM34
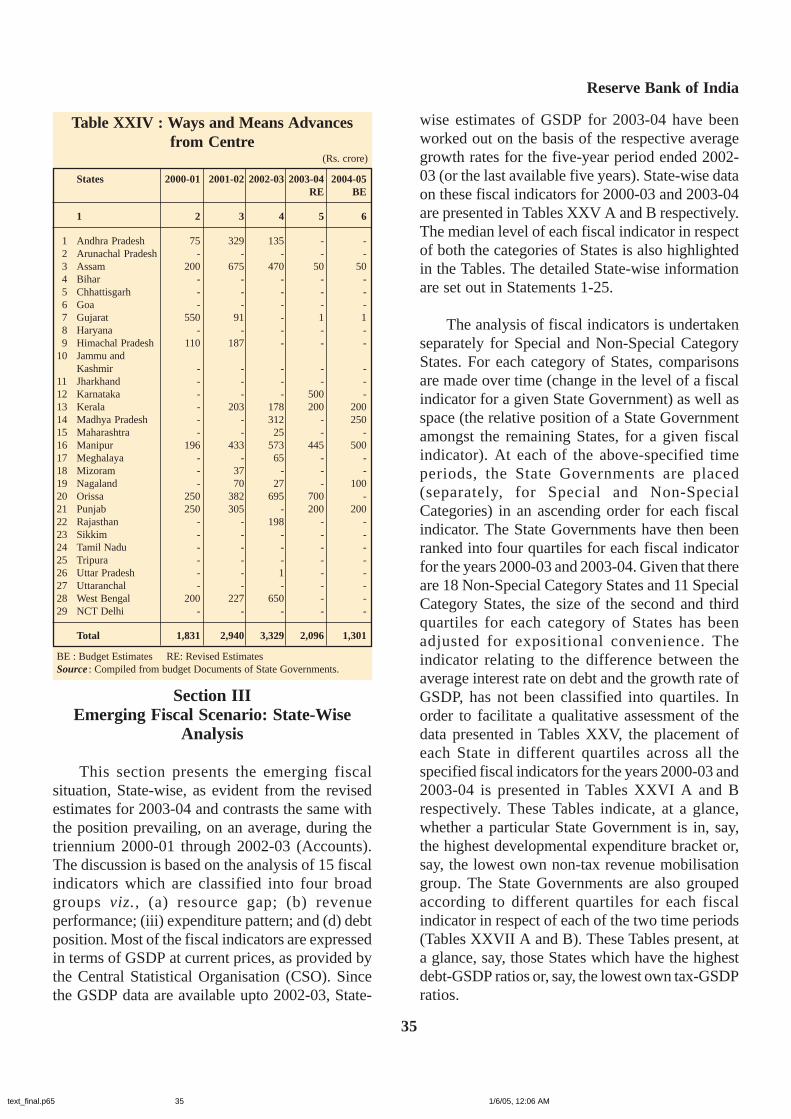
Reserve Bank of India
35
Section IIIEmerging Fiscal Scenario: State-Wise
Analysis
This section presents the emerging fiscalsituation, State-wise, as evident from the revisedestimates for 2003-04 and contrasts the same withthe position prevailing, on an average, during thetriennium 2000-01 through 2002-03 (Accounts).The discussion is based on the analysis of 15 fiscalindicators which are classified into four broadgroups viz., (a) resource gap; (b) revenueperformance; (iii) expenditure pattern; and (d) debtposition. Most of the fiscal indicators are expressedin terms of GSDP at current prices, as provided bythe Central Statistical Organisation (CSO). Sincethe GSDP data are available upto 2002-03, State-
wise estimates of GSDP for 2003-04 have beenworked out on the basis of the respective averagegrowth rates for the five-year period ended 2002-03 (or the last available five years). State-wise dataon these fiscal indicators for 2000-03 and 2003-04are presented in Tables XXV A and B respectively.The median level of each fiscal indicator in respectof both the categories of States is also highlightedin the Tables. The detailed State-wise informationare set out in Statements 1-25.
The analysis of fiscal indicators is undertakenseparately for Special and Non-Special CategoryStates. For each category of States, comparisonsare made over time (change in the level of a fiscalindicator for a given State Government) as well asspace (the relative position of a State Governmentamongst the remaining States, for a given fiscalindicator). At each of the above-specified timeperiods, the State Governments are placed(separately, for Special and Non-SpecialCategories) in an ascending order for each fiscalindicator. The State Governments have then beenranked into four quartiles for each fiscal indicatorfor the years 2000-03 and 2003-04. Given that thereare 18 Non-Special Category States and 11 SpecialCategory States, the size of the second and thirdquartiles for each category of States has beenadjusted for expositional convenience. Theindicator relating to the difference between theaverage interest rate on debt and the growth rate ofGSDP, has not been classified into quartiles. Inorder to facilitate a qualitative assessment of thedata presented in Tables XXV, the placement ofeach State in different quartiles across all thespecified fiscal indicators for the years 2000-03 and2003-04 is presented in Tables XXVI A and Brespectively. These Tables indicate, at a glance,whether a particular State Government is in, say,the highest developmental expenditure bracket or,say, the lowest own non-tax revenue mobilisationgroup. The State Governments are also groupedaccording to different quartiles for each fiscalindicator in respect of each of the two time periods(Tables XXVII A and B). These Tables present, ata glance, say, those States which have the highestdebt-GSDP ratios or, say, the lowest own tax-GSDPratios.
Table XXIV : Ways and Means Advancesfrom Centre
(Rs. crore)
States 2000-01 2001-02 2002-03 2003-04 2004-05 RE BE
1 2 3 4 5 6
1 Andhra Pradesh 75 329 135 - -2 Arunachal Pradesh - - - - -3 Assam 200 675 470 50 504 Bihar - - - - -5 Chhattisgarh - - - - -6 Goa - - - - -7 Gujarat 550 91 - 1 18 Haryana - - - - -9 Himachal Pradesh 110 187 - - -
10 Jammu andKashmir - - - - -
11 Jharkhand - - - - -12 Karnataka - - - 500 -13 Kerala - 203 178 200 20014 Madhya Pradesh - - 312 - 25015 Maharashtra - - 25 - -16 Manipur 196 433 573 445 50017 Meghalaya - - 65 - -18 Mizoram - 37 - - -19 Nagaland - 70 27 - 10020 Orissa 250 382 695 700 -21 Punjab 250 305 - 200 20022 Rajasthan - - 198 - -23 Sikkim - - - - -24 Tamil Nadu - - - - -25 Tripura - - - - -26 Uttar Pradesh - - 1 - -27 Uttaranchal - - - - -28 West Bengal 200 227 650 - -29 NCT Delhi - - - - -
Total 1,831 2,940 3,329 2,096 1,301
BE : Budget Estimates RE: Revised EstimatesSource : Compiled from budget Documents of State Governments.
text_final.p65 1/6/05, 12:06 AM35
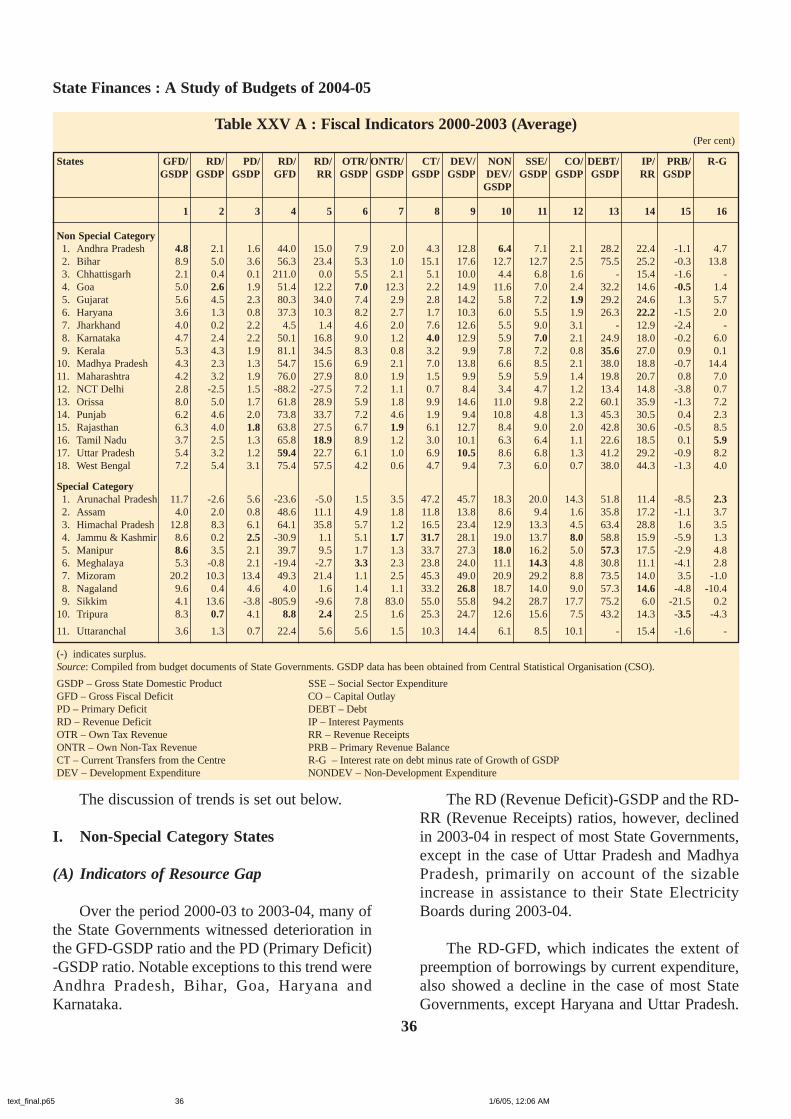
State Finances : A Study of Budgets of 2004-05
36
Table XXV A : Fiscal Indicators 2000-2003 (Average)(Per cent)
States GFD/ RD/ PD/ RD/ RD/ OTR/ ONTR/ CT/ DEV/ NON SSE/ CO/ DEBT/ IP/ PRB/ R-GGSDP GSDP GSDP GFD RR GSDP GSDP GSDP GSDP DEV/ GSDP GSDP GSDP RR GSDP
GSDP
1 2 3 4 5 6 7 8 9 10 11 12 13 14 15 16
Non Special Category1. Andhra Pradesh 4.8 2.1 1.6 44.0 15.0 7.9 2.0 4.3 12.8 6.4 7.1 2.1 28.2 22.4 -1.1 4.72. Bihar 8.9 5.0 3.6 56.3 23.4 5.3 1.0 15.1 17.6 12.7 12.7 2.5 75.5 25.2 -0.3 13.83. Chhattisgarh 2.1 0.4 0.1 211.0 0.0 5.5 2.1 5.1 10.0 4.4 6.8 1.6 - 15.4 -1.6 -4. Goa 5.0 2.6 1.9 51.4 12.2 7.0 12.3 2.2 14.9 11.6 7.0 2.4 32.2 14.6 -0.5 1.45. Gujarat 5.6 4.5 2.3 80.3 34.0 7.4 2.9 2.8 14.2 5.8 7.2 1.9 29.2 24.6 1.3 5.76. Haryana 3.6 1.3 0.8 37.3 10.3 8.2 2.7 1.7 10.3 6.0 5.5 1.9 26.3 22.2 -1.5 2.07. Jharkhand 4.0 0.2 2.2 4.5 1.4 4.6 2.0 7.6 12.6 5.5 9.0 3.1 - 12.9 -2.4 -8. Karnataka 4.7 2.4 2.2 50.1 16.8 9.0 1.2 4.0 12.9 5.9 7.0 2.1 24.9 18.0 -0.2 6.09. Kerala 5.3 4.3 1.9 81.1 34.5 8.3 0.8 3.2 9.9 7.8 7.2 0.8 35.6 27.0 0.9 0.1
10. Madhya Pradesh 4.3 2.3 1.3 54.7 15.6 6.9 2.1 7.0 13.8 6.6 8.5 2.1 38.0 18.8 -0.7 14.411. Maharashtra 4.2 3.2 1.9 76.0 27.9 8.0 1.9 1.5 9.9 5.9 5.9 1.4 19.8 20.7 0.8 7.012. NCT Delhi 2.8 -2.5 1.5 -88.2 -27.5 7.2 1.1 0.7 8.4 3.4 4.7 1.2 13.4 14.8 -3.8 0.713. Orissa 8.0 5.0 1.7 61.8 28.9 5.9 1.8 9.9 14.6 11.0 9.8 2.2 60.1 35.9 -1.3 7.214. Punjab 6.2 4.6 2.0 73.8 33.7 7.2 4.6 1.9 9.4 10.8 4.8 1.3 45.3 30.5 0.4 2.315. Rajasthan 6.3 4.0 1.8 63.8 27.5 6.7 1.9 6.1 12.7 8.4 9.0 2.0 42.8 30.6 -0.5 8.516. Tamil Nadu 3.7 2.5 1.3 65.8 18.9 8.9 1.2 3.0 10.1 6.3 6.4 1.1 22.6 18.5 0.1 5.917. Uttar Pradesh 5.4 3.2 1.2 59.4 22.7 6.1 1.0 6.9 10.5 8.6 6.8 1.3 41.2 29.2 -0.9 8.218. West Bengal 7.2 5.4 3.1 75.4 57.5 4.2 0.6 4.7 9.4 7.3 6.0 0.7 38.0 44.3 -1.3 4.0
Special Category1. Arunachal Pradesh 11.7 -2.6 5.6 -23.6 -5.0 1.5 3.5 47.2 45.7 18.3 20.0 14.3 51.8 11.4 -8.5 2.32. Assam 4.0 2.0 0.8 48.6 11.1 4.9 1.8 11.8 13.8 8.6 9.4 1.6 35.8 17.2 -1.1 3.73. Himachal Pradesh 12.8 8.3 6.1 64.1 35.8 5.7 1.2 16.5 23.4 12.9 13.3 4.5 63.4 28.8 1.6 3.54. Jammu & Kashmir 8.6 0.2 2.5 -30.9 1.1 5.1 1.7 31.7 28.1 19.0 13.7 8.0 58.8 15.9 -5.9 1.35. Manipur 8.6 3.5 2.1 39.7 9.5 1.7 1.3 33.7 27.3 18.0 16.2 5.0 57.3 17.5 -2.9 4.86. Meghalaya 5.3 -0.8 2.1 -19.4 -2.7 3.3 2.3 23.8 24.0 11.1 14.3 4.8 30.8 11.1 -4.1 2.87. Mizoram 20.2 10.3 13.4 49.3 21.4 1.1 2.5 45.3 49.0 20.9 29.2 8.8 73.5 14.0 3.5 -1.08. Nagaland 9.6 0.4 4.6 4.0 1.6 1.4 1.1 33.2 26.8 18.7 14.0 9.0 57.3 14.6 -4.8 -10.49. Sikkim 4.1 13.6 -3.8 -805.9 -9.6 7.8 83.0 55.0 55.8 94.2 28.7 17.7 75.2 6.0 -21.5 0.2
10. Tripura 8.3 0.7 4.1 8.8 2.4 2.5 1.6 25.3 24.7 12.6 15.6 7.5 43.2 14.3 -3.5 -4.3
11. Uttaranchal 3.6 1.3 0.7 22.4 5.6 5.6 1.5 10.3 14.4 6.1 8.5 10.1 - 15.4 -1.6 -
(-) indicates surplus.Source: Compiled from budget documents of State Governments. GSDP data has been obtained from Central Statistical Organisation (CSO).
GSDP – Gross State Domestic Product SSE – Social Sector ExpenditureGFD – Gross Fiscal Deficit CO – Capital OutlayPD – Primary Deficit DEBT – DebtRD – Revenue Deficit IP – Interest PaymentsOTR – Own Tax Revenue RR – Revenue ReceiptsONTR – Own Non-Tax Revenue PRB – Primary Revenue BalanceCT – Current Transfers from the Centre R-G – Interest rate on debt minus rate of Growth of GSDPDEV – Development Expenditure NONDEV – Non-Development Expenditure
The discussion of trends is set out below.
I. Non-Special Category States
(A) Indicators of Resource Gap
Over the period 2000-03 to 2003-04, many ofthe State Governments witnessed deterioration inthe GFD-GSDP ratio and the PD (Primary Deficit)-GSDP ratio. Notable exceptions to this trend wereAndhra Pradesh, Bihar, Goa, Haryana andKarnataka.
The RD (Revenue Deficit)-GSDP and the RD-RR (Revenue Receipts) ratios, however, declinedin 2003-04 in respect of most State Governments,except in the case of Uttar Pradesh and MadhyaPradesh, primarily on account of the sizableincrease in assistance to their State ElectricityBoards during 2003-04.
The RD-GFD, which indicates the extent ofpreemption of borrowings by current expenditure,also showed a decline in the case of most StateGovernments, except Haryana and Uttar Pradesh.
text_final.p65 1/6/05, 12:06 AM36

Reserve Bank of India
37
Table XXV B : Fiscal Indicators 2003-04 (R.E.)(Per cent)
States GFD/ RD/ PD/ RD/ RD/ OTR/ ONTR/ CT/ DEV/ NON/ SSE/ CO/ DEBT/ IP/ PRB/ R-GDEV GSDP
GSDP GSDP GSDP GFD RR GSDP GSDP GSDP GSDP GSDP GSDP GSDP GSDP RR
1 2 3 4 5 6 7 8 9 10 11 12 13 14 15 16
Non Special Category1. Andhra Pradesh 4.2 1.6 0.3 39.1 10.6 7.9 2.3 5.1 12.7 6.9 7.7 2.1 32.3 25.2 -2.2 2.82. Bihar 7.2 1.9 1.4 27.0 8.2 5.9 0.8 17.1 17.8 13.3 12.4 3.3 87.3 24.6 -3.9 7.23. Chhattisgarh 5.3 1.6 2.8 30.2 9.0 7.3 3.1 7.6 16.9 5.8 11.0 3.5 - 14.3 -1.0 -4. Goa 4.4 0.9 1.4 20.2 5.2 7.3 7.9 2.0 15.5 6.2 7.4 3.5 32.8 17.5 -2.1 -4.15. Gujarat 6.6 2.3 2.8 35.0 17.2 7.5 3.6 2.3 14.0 6.0 6.1 2.8 35.3 28.0 -1.4 4.06. Haryana 1.8 1.2 -1.1 67.1 9.3 8.5 3.0 1.8 9.0 6.3 4.2 0.4 27.3 22.4 -1.8 0.57. Jharkhand 4.8 -0.4 1.9 -8.5 -1.9 6.6 3.4 11.7 17.8 8.8 12.6 4.5 - 13.3 -3.3 -8. Karnataka 4.5 1.1 1.5 23.7 6.1 10.4 2.7 4.3 13.2 8.1 6.9 3.1 29.0 17.0 -1.9 2.29. Kerala 6.0 3.9 2.4 65.0 29.3 9.1 0.9 3.3 11.3 8.0 7.0 0.7 38.1 26.6 0.4 -0.6
10. Madhya Pradesh 10.0 6.2 6.0 61.3 35.3 7.8 1.8 7.8 18.0 8.8 8.4 3.5 53.1 23.1 2.1 7.911. Maharashtra 6.1 2.8 3.4 46.4 24.3 8.1 1.2 2.3 10.9 6.5 6.3 3.0 23.3 22.9 0.2 5.112. NCT Delhi 3.9 -2.1 2.2 -55.0 -25.2 6.7 1.2 0.6 9.1 3.0 4.5 1.2 16.9 19.3 -3.8 -0.813. Orissa 11.5 6.2 4.6 53.9 30.6 6.6 1.9 11.7 18.5 13.2 10.8 2.1 70.8 33.9 -0.7 4.514. Punjab 6.8 4.1 2.4 61.3 25.9 7.7 5.6 2.8 11.4 11.2 5.7 1.7 49.4 27.3 -0.2 0.215. Rajasthan 8.5 3.9 3.4 46.3 23.4 8.2 2.0 6.6 16.2 9.3 10.4 3.7 54.0 30.6 -1.2 4.616. Tamil Nadu 4.6 2.2 1.8 48.1 16.2 9.6 1.1 3.1 10.7 7.0 7.2 2.3 28.4 20.5 -0.6 3.717. Uttar Pradesh 9.9 9.7 4.7 97.7 60.7 6.6 0.9 8.4 21.2 10.2 7.5 0.4 50.1 32.8 4.4 6.418. West Bengal 7.2 5.0 2.2 70.4 53.9 4.7 0.6 4.0 8.6 7.9 5.3 0.5 45.4 53.3 0.1 1.6
Special Category1. Arunachal Pradesh 23.9 1.7 17.6 7.0 2.8 1.6 5.4 52.5 63.5 20.0 28.4 22.1 61.6 10.6 -4.6 3.02. Assam 8.0 4.2 3.2 53.0 16.4 6.1 2.2 17.4 22.1 11.7 15.3 3.1 41.4 18.4 -0.5 4.03. Himachal Pradesh 12.7 8.4 4.3 66.4 38.7 5.6 1.4 14.7 20.1 14.4 12.2 4.3 71.7 38.5 0.0 0.94. Jammu & Kashmir -0.1 -9.0 -5.3 11513.4 -22.5 5.4 1.7 33.0 22.8 17.2 11.8 8.7 56.2 12.9 -14.2 2.95. Manipur 21.1 7.2 13.7 34.0 17.5 1.8 1.6 37.6 42.9 19.2 22.0 13.5 64.3 18.1 -0.2 2.96. Meghalaya 6.0 -2.3 2.2 -38.1 -6.5 3.8 2.7 28.4 29.3 11.9 17.9 6.0 33.7 10.8 -6.0 0.77. Mizoram 19.4 1.5 11.6 7.6 2.5 1.3 2.4 54.6 54.0 24.5 30.1 16.8 87.2 13.2 -6.3 -0.88. Nagaland 8.8 -2.0 4.1 -23.0 -5.3 1.5 1.1 35.4 27.8 19.1 14.2 10.8 66.9 12.3 -6.7 -2.09. Sikkim 8.6 -12.6 1.3 -147.2 -13.2 6.1 30.8 58.4 61.1 42.8 33.7 21.2 73.0 7.6 -19.9 - 1.4
10. Tripura 7.6 -1.1 3.7 -14.7 -4.0 2.7 1.4 23.4 22.3 12.5 13.9 8.6 44.2 14.1 -5.0 -6.8
11. Uttaranchal 16.3 9.5 10.4 58.5 35.2 7.9 2.8 16.4 28.0 14.0 15.8 77.5 - 21.9 3.6 -
(-) : indicates surplusNote : Figures in bold pertain to median States for the given indicator.Source : Compiled from budget documents of State Governments.
While the GFD-GSDP ratio in the case of Haryanawas placed at only 1.8 per cent in 2003-04, morethan 67 per cent of the overall borrowings was pre-empted by current expenditure. In the case of UttarPradesh, the GFD-GSDP ratio was placed at 9.9per cent in 2003-04 and the extent of pre-emptionof borrowings by current expenditure was as highas 98 per cent, reflecting the sizable assistance toits State Electricity Board during the year.
As far as the five State Governments that haveenacted Fiscal Responsibility Legislation (FRL) areconcerned, the GFD-GSDP ratio increased during2003-04 in respect of all except Karnataka. In fact,the GFD-GSDP ratio in 2003-04 were higher byaround 2 percentage points (Tamil Nadu) to around7 percentage points (Uttar Pradesh) than the targeted
levels to be attained over the next three to five years,as envisaged in their respective FRLs. On the otherhand, the RD-GSDP ratio declined in the case ofKarnataka, Kerala, Punjab and Tamil Nadu. TheRD-GSDP ratios during 2003-04 were higher thanthe envisaged target values (‘nil’) by 1 percentagepoint (Karnataka) to 9.7 percentage points (UttarPradesh).
In general, during 2003-04, resource gaps (interms of GSDP) were the highest for MadhyaPradesh, Orissa and Uttar Pradesh. In respect ofthese States, the GFD-GSDP ratio ranged between10 to 11.5 per cent while the RD-GSDP ratio rangedbetween around 6.2 to 9.7 per cent during 2003-04. In contrast, resource gaps were among thelowest in the case of Goa and Delhi. The GFD-
text_final.p65 1/6/05, 12:06 AM37
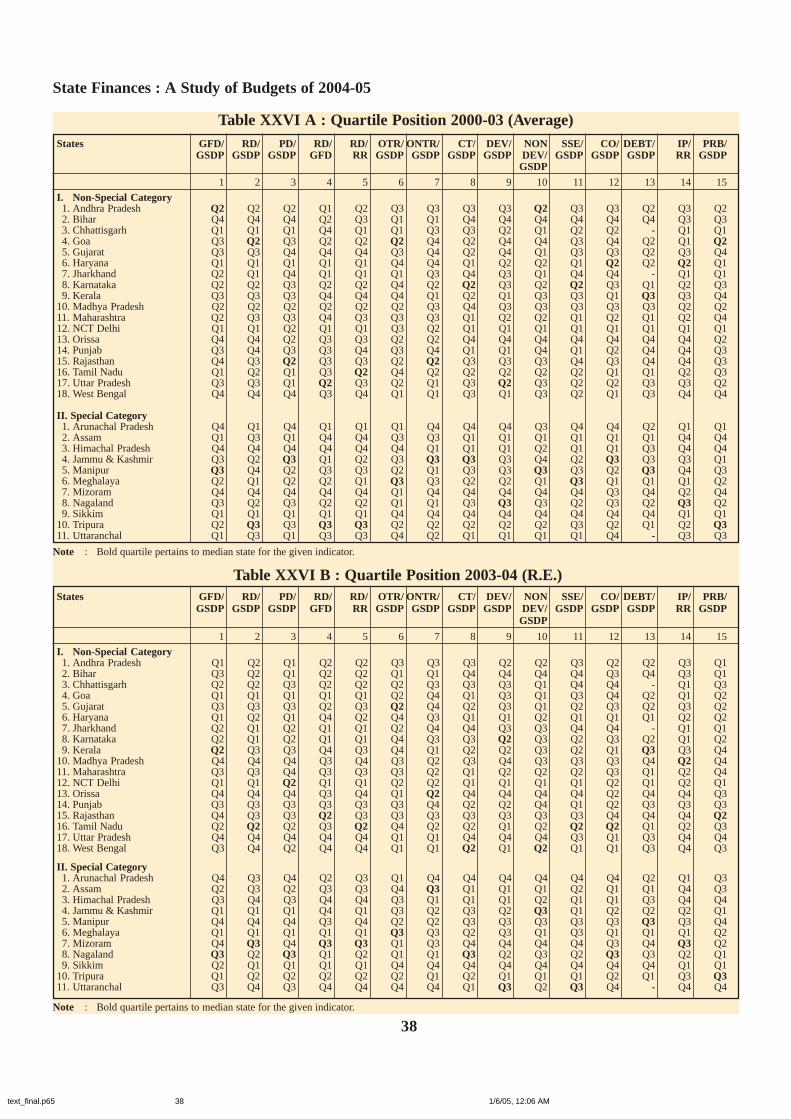
State Finances : A Study of Budgets of 2004-05
38
Table XXVI A : Quartile Position 2000-03 (Average)States GFD/ RD/ PD/ RD/ RD/ OTR/ ONTR/ CT/ DEV/ NON SSE/ CO/ DEBT/ IP/ PRB/
GSDP GSDP GSDP GFD RR GSDP GSDP GSDP GSDP DEV/ GSDP GSDP GSDP RR GSDPGSDP
1 2 3 4 5 6 7 8 9 10 11 12 13 14 15
I. Non-Special Category 1. Andhra Pradesh Q2 Q2 Q2 Q1 Q2 Q3 Q3 Q3 Q3 Q2 Q3 Q3 Q2 Q3 Q22. Bihar Q4 Q4 Q4 Q2 Q3 Q1 Q1 Q4 Q4 Q4 Q4 Q4 Q4 Q3 Q33. Chhattisgarh Q1 Q1 Q1 Q4 Q1 Q1 Q3 Q3 Q2 Q1 Q2 Q2 - Q1 Q14. Goa Q3 Q2 Q3 Q2 Q2 Q2 Q4 Q2 Q4 Q4 Q3 Q4 Q2 Q1 Q25. Gujarat Q3 Q3 Q4 Q4 Q4 Q3 Q4 Q2 Q4 Q1 Q3 Q3 Q2 Q3 Q46. Haryana Q1 Q1 Q1 Q1 Q1 Q4 Q4 Q1 Q2 Q2 Q1 Q2 Q2 Q2 Q17. Jharkhand Q2 Q1 Q4 Q1 Q1 Q1 Q3 Q4 Q3 Q1 Q4 Q4 - Q1 Q18. Karnataka Q2 Q2 Q3 Q2 Q2 Q4 Q2 Q2 Q3 Q2 Q2 Q3 Q1 Q2 Q39. Kerala Q3 Q3 Q3 Q4 Q4 Q4 Q1 Q2 Q1 Q3 Q3 Q1 Q3 Q3 Q4
10. Madhya Pradesh Q2 Q2 Q2 Q2 Q2 Q2 Q3 Q4 Q3 Q3 Q3 Q3 Q3 Q2 Q211. Maharashtra Q2 Q3 Q3 Q4 Q3 Q3 Q3 Q1 Q2 Q2 Q1 Q2 Q1 Q2 Q412. NCT Delhi Q1 Q1 Q2 Q1 Q1 Q3 Q2 Q1 Q1 Q1 Q1 Q1 Q1 Q1 Q113. Orissa Q4 Q4 Q2 Q3 Q3 Q2 Q2 Q4 Q4 Q4 Q4 Q4 Q4 Q4 Q214. Punjab Q3 Q4 Q3 Q3 Q4 Q3 Q4 Q1 Q1 Q4 Q1 Q2 Q4 Q4 Q315. Rajasthan Q4 Q3 Q2 Q3 Q3 Q2 Q2 Q3 Q3 Q3 Q4 Q3 Q4 Q4 Q316. Tamil Nadu Q1 Q2 Q1 Q3 Q2 Q4 Q2 Q2 Q2 Q2 Q2 Q1 Q1 Q2 Q317. Uttar Pradesh Q3 Q3 Q1 Q2 Q3 Q2 Q1 Q3 Q2 Q3 Q2 Q2 Q3 Q3 Q218. West Bengal Q4 Q4 Q4 Q3 Q4 Q1 Q1 Q3 Q1 Q3 Q2 Q1 Q3 Q4 Q4
II. Special Category1. Arunachal Pradesh Q4 Q1 Q4 Q1 Q1 Q1 Q4 Q4 Q4 Q3 Q4 Q4 Q2 Q1 Q12. Assam Q1 Q3 Q1 Q4 Q4 Q3 Q3 Q1 Q1 Q1 Q1 Q1 Q1 Q4 Q43. Himachal Pradesh Q4 Q4 Q4 Q4 Q4 Q4 Q1 Q1 Q1 Q2 Q1 Q1 Q3 Q4 Q44. Jammu & Kashmir Q3 Q2 Q3 Q1 Q2 Q3 Q3 Q3 Q3 Q4 Q2 Q3 Q3 Q3 Q15. Manipur Q3 Q4 Q2 Q3 Q3 Q2 Q1 Q3 Q3 Q3 Q3 Q2 Q3 Q4 Q36. Meghalaya Q2 Q1 Q2 Q2 Q1 Q3 Q3 Q2 Q2 Q1 Q3 Q1 Q1 Q1 Q27. Mizoram Q4 Q4 Q4 Q4 Q4 Q1 Q4 Q4 Q4 Q4 Q4 Q3 Q4 Q2 Q48. Nagaland Q3 Q2 Q3 Q2 Q2 Q1 Q1 Q3 Q3 Q3 Q2 Q3 Q2 Q3 Q29. Sikkim Q1 Q1 Q1 Q1 Q1 Q4 Q4 Q4 Q4 Q4 Q4 Q4 Q4 Q1 Q1
10. Tripura Q2 Q3 Q3 Q3 Q3 Q2 Q2 Q2 Q2 Q2 Q3 Q2 Q1 Q2 Q311. Uttaranchal Q1 Q3 Q1 Q3 Q3 Q4 Q2 Q1 Q1 Q1 Q1 Q4 - Q3 Q3
Note : Bold quartile pertains to median state for the given indicator.
Table XXVI B : Quartile Position 2003-04 (R.E.)States GFD/ RD/ PD/ RD/ RD/ OTR/ ONTR/ CT/ DEV/ NON SSE/ CO/ DEBT/ IP/ PRB/
GSDP GSDP GSDP GFD RR GSDP GSDP GSDP GSDP DEV/ GSDP GSDP GSDP RR GSDPGSDP
1 2 3 4 5 6 7 8 9 10 11 12 13 14 15
I. Non-Special Category 1. Andhra Pradesh Q1 Q2 Q1 Q2 Q2 Q3 Q3 Q3 Q2 Q2 Q3 Q2 Q2 Q3 Q12. Bihar Q3 Q2 Q1 Q2 Q2 Q1 Q1 Q4 Q4 Q4 Q4 Q3 Q4 Q3 Q13. Chhattisgarh Q2 Q2 Q3 Q2 Q2 Q2 Q3 Q3 Q3 Q1 Q4 Q4 - Q1 Q34. Goa Q1 Q1 Q1 Q1 Q1 Q2 Q4 Q1 Q3 Q1 Q3 Q4 Q2 Q1 Q25. Gujarat Q3 Q3 Q3 Q2 Q3 Q2 Q4 Q2 Q3 Q1 Q2 Q3 Q2 Q3 Q26. Haryana Q1 Q2 Q1 Q4 Q2 Q4 Q3 Q1 Q1 Q2 Q1 Q1 Q1 Q2 Q27. Jharkhand Q2 Q1 Q2 Q1 Q1 Q2 Q4 Q4 Q3 Q3 Q4 Q4 - Q1 Q18. Karnataka Q2 Q1 Q2 Q1 Q1 Q4 Q3 Q3 Q2 Q3 Q2 Q3 Q2 Q1 Q29. Kerala Q2 Q3 Q3 Q4 Q3 Q4 Q1 Q2 Q2 Q3 Q2 Q1 Q3 Q3 Q4
10. Madhya Pradesh Q4 Q4 Q4 Q3 Q4 Q3 Q2 Q3 Q4 Q3 Q3 Q3 Q4 Q2 Q411. Maharashtra Q3 Q3 Q4 Q3 Q3 Q3 Q2 Q1 Q2 Q2 Q2 Q3 Q1 Q2 Q412. NCT Delhi Q1 Q1 Q2 Q1 Q1 Q2 Q2 Q1 Q1 Q1 Q1 Q2 Q1 Q2 Q113. Orissa Q4 Q4 Q4 Q3 Q4 Q1 Q2 Q4 Q4 Q4 Q4 Q2 Q4 Q4 Q314. Punjab Q3 Q3 Q3 Q3 Q3 Q3 Q4 Q2 Q2 Q4 Q1 Q2 Q3 Q3 Q315. Rajasthan Q4 Q3 Q3 Q2 Q3 Q3 Q3 Q3 Q3 Q3 Q3 Q4 Q4 Q4 Q216. Tamil Nadu Q2 Q2 Q2 Q3 Q2 Q4 Q2 Q2 Q1 Q2 Q2 Q2 Q1 Q2 Q317. Uttar Pradesh Q4 Q4 Q4 Q4 Q4 Q1 Q1 Q4 Q4 Q4 Q3 Q1 Q3 Q4 Q418. West Bengal Q3 Q4 Q2 Q4 Q4 Q1 Q1 Q2 Q1 Q2 Q1 Q1 Q3 Q4 Q3
II. Special Category1. Arunachal Pradesh Q4 Q3 Q4 Q2 Q3 Q1 Q4 Q4 Q4 Q4 Q4 Q4 Q2 Q1 Q32. Assam Q2 Q3 Q2 Q3 Q3 Q4 Q3 Q1 Q1 Q1 Q2 Q1 Q1 Q4 Q33. Himachal Pradesh Q3 Q4 Q3 Q4 Q4 Q3 Q1 Q1 Q1 Q2 Q1 Q1 Q3 Q4 Q44. Jammu & Kashmir Q1 Q1 Q1 Q4 Q1 Q3 Q2 Q3 Q2 Q3 Q1 Q2 Q2 Q2 Q15. Manipur Q4 Q4 Q4 Q3 Q4 Q2 Q2 Q3 Q3 Q3 Q3 Q3 Q3 Q3 Q46. Meghalaya Q1 Q1 Q1 Q1 Q1 Q3 Q3 Q2 Q3 Q1 Q3 Q1 Q1 Q1 Q27. Mizoram Q4 Q3 Q4 Q3 Q3 Q1 Q3 Q4 Q4 Q4 Q4 Q3 Q4 Q3 Q28. Nagaland Q3 Q2 Q3 Q1 Q2 Q1 Q1 Q3 Q2 Q3 Q2 Q3 Q3 Q2 Q19. Sikkim Q2 Q1 Q1 Q1 Q1 Q4 Q4 Q4 Q4 Q4 Q4 Q4 Q4 Q1 Q1
10. Tripura Q1 Q2 Q2 Q2 Q2 Q2 Q1 Q2 Q1 Q1 Q1 Q2 Q1 Q3 Q311. Uttaranchal Q3 Q4 Q3 Q4 Q4 Q4 Q4 Q1 Q3 Q2 Q3 Q4 - Q4 Q4
Note : Bold quartile pertains to median state for the given indicator.
text_final.p65 1/6/05, 12:06 AM38
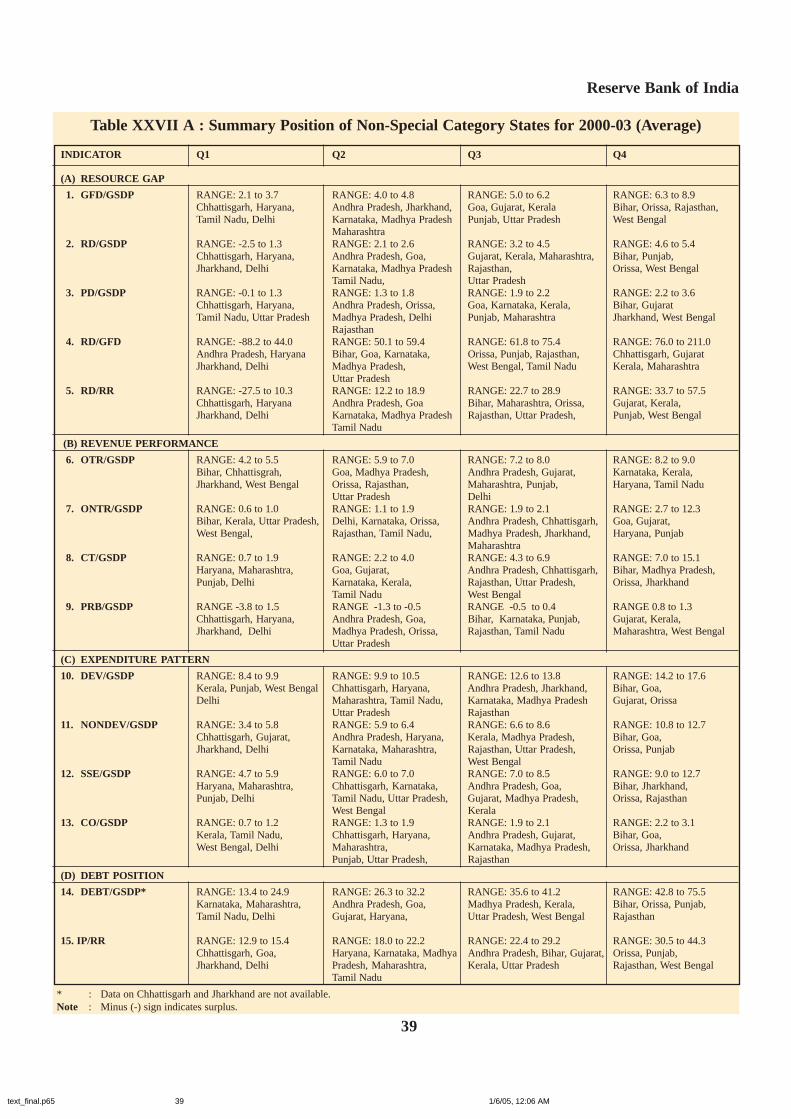
Reserve Bank of India
39
Table XXVII A : Summary Position of Non-Special Category States for 2000-03 (Average)
INDICATOR Q1 Q2 Q3 Q4
(A) RESOURCE GAP
1. GFD/GSDP RANGE: 2.1 to 3.7 RANGE: 4.0 to 4.8 RANGE: 5.0 to 6.2 RANGE: 6.3 to 8.9Chhattisgarh, Haryana, Andhra Pradesh, Jharkhand, Goa, Gujarat, Kerala Bihar, Orissa, Rajasthan,Tamil Nadu, Delhi Karnataka, Madhya Pradesh Punjab, Uttar Pradesh West Bengal
Maharashtra2. RD/GSDP RANGE: -2.5 to 1.3 RANGE: 2.1 to 2.6 RANGE: 3.2 to 4.5 RANGE: 4.6 to 5.4
Chhattisgarh, Haryana, Andhra Pradesh, Goa, Gujarat, Kerala, Maharashtra, Bihar, Punjab,Jharkhand, Delhi Karnataka, Madhya Pradesh Rajasthan, Orissa, West Bengal
Tamil Nadu, Uttar Pradesh3. PD/GSDP RANGE: -0.1 to 1.3 RANGE: 1.3 to 1.8 RANGE: 1.9 to 2.2 RANGE: 2.2 to 3.6
Chhattisgarh, Haryana, Andhra Pradesh, Orissa, Goa, Karnataka, Kerala, Bihar, GujaratTamil Nadu, Uttar Pradesh Madhya Pradesh, Delhi Punjab, Maharashtra Jharkhand, West Bengal
Rajasthan4. RD/GFD RANGE: -88.2 to 44.0 RANGE: 50.1 to 59.4 RANGE: 61.8 to 75.4 RANGE: 76.0 to 211.0
Andhra Pradesh, Haryana Bihar, Goa, Karnataka, Orissa, Punjab, Rajasthan, Chhattisgarh, GujaratJharkhand, Delhi Madhya Pradesh, West Bengal, Tamil Nadu Kerala, Maharashtra
Uttar Pradesh5. RD/RR RANGE: -27.5 to 10.3 RANGE: 12.2 to 18.9 RANGE: 22.7 to 28.9 RANGE: 33.7 to 57.5
Chhattisgarh, Haryana Andhra Pradesh, Goa Bihar, Maharashtra, Orissa, Gujarat, Kerala,Jharkhand, Delhi Karnataka, Madhya Pradesh Rajasthan, Uttar Pradesh, Punjab, West Bengal
Tamil Nadu
(B) REVENUE PERFORMANCE
6. OTR/GSDP RANGE: 4.2 to 5.5 RANGE: 5.9 to 7.0 RANGE: 7.2 to 8.0 RANGE: 8.2 to 9.0Bihar, Chhattisgrah, Goa, Madhya Pradesh, Andhra Pradesh, Gujarat, Karnataka, Kerala,Jharkhand, West Bengal Orissa, Rajasthan, Maharashtra, Punjab, Haryana, Tamil Nadu
Uttar Pradesh Delhi7. ONTR/GSDP RANGE: 0.6 to 1.0 RANGE: 1.1 to 1.9 RANGE: 1.9 to 2.1 RANGE: 2.7 to 12.3
Bihar, Kerala, Uttar Pradesh, Delhi, Karnataka, Orissa, Andhra Pradesh, Chhattisgarh, Goa, Gujarat,West Bengal, Rajasthan, Tamil Nadu, Madhya Pradesh, Jharkhand, Haryana, Punjab
Maharashtra8. CT/GSDP RANGE: 0.7 to 1.9 RANGE: 2.2 to 4.0 RANGE: 4.3 to 6.9 RANGE: 7.0 to 15.1
Haryana, Maharashtra, Goa, Gujarat, Andhra Pradesh, Chhattisgarh, Bihar, Madhya Pradesh,Punjab, Delhi Karnataka, Kerala, Rajasthan, Uttar Pradesh, Orissa, Jharkhand
Tamil Nadu West Bengal9. PRB/GSDP RANGE -3.8 to 1.5 RANGE -1.3 to -0.5 RANGE -0.5 to 0.4 RANGE 0.8 to 1.3
Chhattisgarh, Haryana, Andhra Pradesh, Goa, Bihar, Karnataka, Punjab, Gujarat, Kerala,Jharkhand, Delhi Madhya Pradesh, Orissa, Rajasthan, Tamil Nadu Maharashtra, West Bengal
Uttar Pradesh
(C) EXPENDITURE PATTERN
10. DEV/GSDP RANGE: 8.4 to 9.9 RANGE: 9.9 to 10.5 RANGE: 12.6 to 13.8 RANGE: 14.2 to 17.6Kerala, Punjab, West Bengal Chhattisgarh, Haryana, Andhra Pradesh, Jharkhand, Bihar, Goa,Delhi Maharashtra, Tamil Nadu, Karnataka, Madhya Pradesh Gujarat, Orissa
Uttar Pradesh Rajasthan11. NONDEV/GSDP RANGE: 3.4 to 5.8 RANGE: 5.9 to 6.4 RANGE: 6.6 to 8.6 RANGE: 10.8 to 12.7
Chhattisgarh, Gujarat, Andhra Pradesh, Haryana, Kerala, Madhya Pradesh, Bihar, Goa,Jharkhand, Delhi Karnataka, Maharashtra, Rajasthan, Uttar Pradesh, Orissa, Punjab
Tamil Nadu West Bengal12. SSE/GSDP RANGE: 4.7 to 5.9 RANGE: 6.0 to 7.0 RANGE: 7.0 to 8.5 RANGE: 9.0 to 12.7
Haryana, Maharashtra, Chhattisgarh, Karnataka, Andhra Pradesh, Goa, Bihar, Jharkhand,Punjab, Delhi Tamil Nadu, Uttar Pradesh, Gujarat, Madhya Pradesh, Orissa, Rajasthan
West Bengal Kerala13. CO/GSDP RANGE: 0.7 to 1.2 RANGE: 1.3 to 1.9 RANGE: 1.9 to 2.1 RANGE: 2.2 to 3.1
Kerala, Tamil Nadu, Chhattisgarh, Haryana, Andhra Pradesh, Gujarat, Bihar, Goa,West Bengal, Delhi Maharashtra, Karnataka, Madhya Pradesh, Orissa, Jharkhand
Punjab, Uttar Pradesh, Rajasthan
(D) DEBT POSITION
14. DEBT/GSDP* RANGE: 13.4 to 24.9 RANGE: 26.3 to 32.2 RANGE: 35.6 to 41.2 RANGE: 42.8 to 75.5Karnataka, Maharashtra, Andhra Pradesh, Goa, Madhya Pradesh, Kerala, Bihar, Orissa, Punjab,Tamil Nadu, Delhi Gujarat, Haryana, Uttar Pradesh, West Bengal Rajasthan
15. IP/RR RANGE: 12.9 to 15.4 RANGE: 18.0 to 22.2 RANGE: 22.4 to 29.2 RANGE: 30.5 to 44.3Chhattisgarh, Goa, Haryana, Karnataka, Madhya Andhra Pradesh, Bihar, Gujarat, Orissa, Punjab,Jharkhand, Delhi Pradesh, Maharashtra, Kerala, Uttar Pradesh Rajasthan, West Bengal
Tamil Nadu
* : Data on Chhattisgarh and Jharkhand are not available.Note : Minus (-) sign indicates surplus.
text_final.p65 1/6/05, 12:06 AM39

State Finances : A Study of Budgets of 2004-05
40
Table XXVII B : Summary Position of Non-Special Category States for 2003-04 (Revised Estimates)INDICATOR Q1 Q2 Q3 Q4
(A) RESOURCE GAP
1. GFD/GSDP RANGE: 1.8 to 4.4 RANGE: 4.5 to 6.0 RANGE: 6.1 to 7.2 RANGE: 8.5 to 11.5Andhra Pradesh, Haryana, Chhattisgarh, Kerala, Bihar, Gujarat, Madhya Pradesh, Orissa,Goa, Delhi Jharkhand, Karnataka, Maharashtra, Punjab, Rajasthan, Uttar Pradesh
Tamil Nadu West Bengal2. RD/GSDP RANGE: -2.1 to 1.1 RANGE: 1.2 to 2.2 RANGE: 2.3 to 4.1 RANGE: 5.0 to 9.7
Goa, Jharkhand Andhra Pradesh, Bihar, Gujarat, Kerala, Madhya Pradesh, Orissa,Karnataka, Delhi Chhattisgarh, Haryana, Maharashtra, Punjab Uttar Pradesh, West Bengal
Tamil Nadu Rajasthan3. PD/GSDP RANGE: -1.1 to 1.4 RANGE: 1.5 to 2.2 RANGE: 2.4 to 3.4 RANGE: 3.4 to 6.0
Andhra Pradesh, Bihar Jharkhand, Karnataka, Chhattisgarh, Gujarat Madhya Pradesh,Goa, Haryana Tamil Nadu, West Bengal, Kerala, Punjab, Maharashtra
Delhi Rajasthan Orissa, Uttar Pradesh4. RD/GFD RANGE: -55.0 to 23.7 RANGE: 27.0 to 46.3 RANGE: 46.4 to 61.3 RANGE: 65.0 to 97.7
Goa, Jharkhand Andhra Pradesh, Bihar, Madhya Pradesh, Haryana, Kerala,Karnataka, Delhi Chhattisgarh, Gujarat, Maharashtra, Orissa, Uttar Pradesh, West Bengal
Rajasthan Punjab, Tamil Nadu5. RD/RR RANGE: -25.2 to 6.1 RANGE: 8.2 to 16.2 RANGE: 17.2 to 29.3 RANGE: 30.6 to 60.7
Goa, Jharkhand Andhra Pradesh, Bihar Gujarat, Kerala Madhya Pradesh, Orissa,Karnataka, Delhi Chhattisgarh, Haryana Maharashtra, Punjab Uttar Pradesh, West Bengal
Tamil Nadu Rajasthan
(B) REVENUE PERFORMANCE
6. OTR/GSDP RANGE: 4.7 to 6.6 RANGE: 6.6 to 7.5 RANGE: 7.7 to 8.2 RANGE: 8.5 to 10.4Bihar, Orissa, Chhattisgarh, Goa Andhra Pradesh, Madhya Haryana, KarnatakaUttar Pradesh, West Bengal Gujarat, Jharkhand, Pradesh, Punjab, Rajasthan, Kerala, Tamil Nadu
Delhi Maharashtra,7. ONTR/GSDP RANGE: 0.6 to 0.9 RANGE: 1.1 to 1.9 RANGE: 2.0 to 3.1 RANGE: 3.4 to 7.9
Bihar, Kerala Madhya Pradesh, Andhra Pradesh, Chhattisgarh Goa, GujaratUttar Pradesh, West Bengal Maharashtra, Orissa, Haryana, Karnataka Jharkhand, Punjab
Tamil Nadu, Delhi Rajasthan8. CT/GSDP RANGE: 0.6 to 2.3 RANGE: 2.3 to 4.0 RANGE: 4.3 to 7.8 RANGE: 8.4 to 17.1
Goa, Haryana Gujarat, Kerala Andhra Pradesh, Chhattisgarh Bihar, JharkhandMaharashtra, Delhi Punjab, Tamil Nadu Karnataka, Madhya Pradesh Orissa, Uttar Pradesh
West Bengal Rajasthan9. PRB/GSDP RANGE -3.9 to -2.2 RANGE -2.1 to -1.2 RANGE -1.0 to 0.1 RANGE 0.2 to 4.4
Andhra Pradesh, Bihar, Goa, Gujarat, Haryana, Chhattisgarh, Orissa, Punjab, Kerala, Madhya Pradesh,Jharkhand, Delhi Karnataka, Rajasthan Tamil Nadu, West Bengal Maharashtra, Uttar Pradesh
(C) EXPENDITURE PATTERN
10. DEV/GSDP RANGE: 8.6 to 10.7 RANGE: 10.9 to 13.2 RANGE: 14.0 to 17.8 RANGE: 17.8to 21.2Haryana, Tamil Nadu, Andhra Pradesh, Karnataka Jharkhand, Goa, Bihar, Madhya Pradesh,West Bengal, Delhi Kerala, Maharashtra, Punjab Gujarat, Chhattisgarh, Orissa, Uttar Pradesh
Rajasthan11. NONDEV/GSDP RANGE: 3.0 to 6.2 RANGE: 6.3 to 7.9 RANGE: 8.0 to 9.3 RANGE: 10.2 to 13.3
Chhattisgarh, Goa Andhra Pradesh, Haryana Jharkhand, Karnataka Bihar, Orissa,Gujarat, Delhi Maharashtra, Tamil Nadu Kerala, Madhya Pradesh Punjab, Uttar Pradesh
West Bengal Rajasthan12. SSE/GSDP RANGE: 4.2 to 5.7 RANGE: 6.1 to 7.2 RANGE: 7.4 to 10.4 RANGE: 10.8 to 12.6
Haryana, Punjab Gujarat, Karnataka Andhra Pradesh, Goa Bihar, ChhattisgarhWest Bengal, Delhi Kerala, Maharashtra Madhya Pradesh, Rajasthan Jharkhand, Orissa
Tamil Nadu Uttar Pradesh13. CO/GSDP RANGE: 0.4 to 0.7 RANGE: 1.2 to 2.3 RANGE: 2.8 to 3.5 RANGE: 3.5 to 4.5
Haryana, Uttar Pradesh, Andhra Pradesh, Orissa, Bihar, Gujarat, Chhattisgarh, GoaKerala, West Bengal Punjab, Tamil Nadu, Karnataka, Maharashtra, Jharkhand, Rajasthan
Delhi Madhya Pradesh
(D) DEBT POSITION
14. DEBT/GSDP* RANGE: 16.9 to 28.4 RANGE: 29.0 to 35.3 RANGE: 38.1 to 50.1 RANGE: 53.1 to 87.3Haryana, Tamil Nadu, Andhra Pradesh, Goa Kerala, Punjab, Uttar Pradesh Bihar, Orissa, Rajasthan,Maharashtra, Delhi Gujarat, Karnataka West Bengal Madhya Pradesh
15. IP/RR RANGE: 13.3 to 17.5 RANGE: 19.3 to 23.1 RANGE: 24.6 to 28.0 RANGE: 30.6 to 53.3Chhattisgarh, Goa Haryana, Madhya Pradesh, Andhra Pradesh, Bihar Orissa, RajasthanJharkhand, Karnataka Maharashtra, Tamil Nadu Gujarat, Kerala, Uttar Pradesh, West Bengal
Delhi Punjab
* : Data on Chhattisgarh and Jharkhand are not available.Note : Minus (-) sign indicates surplus.
text_final.p65 1/6/05, 12:06 AM40
Reserve Bank of India
41
GSDP ratios of these two State Governments wereplaced at around 4 per cent during 2003-04. TheRD-GSDP ratio of Goa was placed at 0.9 percentwhile Delhi recorded a revenue surplus in2003-04.
(B) Revenue Performance
Almost all State Governments, except NCTDelhi, showed improvements in their own taxrevenue performance during 2003-04 over theperiod 2000-03, as reflected in their respective tax-GSDP ratios.
Haryana, Karnataka, Kerala and Tamil Naduaccounted for the highest own tax-GSDP ratios(more than 8.5 per cent), while Bihar, Orissa, WestBengal and Uttar Pradesh occupied the lowest rungs(less than 6.6 per cent) during 2003-04.
Many State Governments showed marginalimprovement in own non-tax-GSDP ratio during2003-04.
Goa, Gujarat and Punjab continued to occupythe highest ranks in terms of own non-tax-GSDPratio (more than 3.4 per cent) whereas Bihar,Kerala, West Bengal and Uttar Pradesh continuedto occupy the lowest positions (less than 1 percent).
Current transfers (sharable tax revenue andgrants) from the Centre, as a ratio to GSDP,increased during 2003-04 in the case of all StateGovernments except Goa, Gujarat, West Bengal andNCT Delhi.
Bihar, Jharkhand, Orissa and Uttar Pradeshreceived the highest level of current transfers as aratio to GSDP (more than 8 per cent) during 2003-04 while Goa, Haryana, Maharashtra and NCTDelhi occupied the lowest positions in terms of thecurrent transfers-GSDP ratio (less than 2.3 per cent).
(C) Pattern of Expenditure
Most State Governments showed an increasein developmental and non-developmental
expenditures expressed as ratios to GSDP in 2003-04.
The increase in developmental expenditurereflected, inter alia, the higher expenditures inrespect of the power sector.
Haryana was among the few StateGovernments which showed a reduction indevelopmental outlays as a ratio to GSDP.
Bihar, Madhya Pradesh, Orissa and UttarPradesh earned the highest rankings in terms ofdevelopmental expenditure-GSDP ratio (over 17.8per cent) in 2003-04.
A mixed trend is evident in respect of socialsector expenditures (comprising social services,rural development, food storage andwarehousing) as a ratio to GSDP, with ten StateGovernments showing an increase and eight StateGovernments indicating a decline during 2003-04. Amongst all the State Governments, Bihar,Jharkhand and Orissa continued to provide forthe highest level of social sector expenditure interms of GSDP (around 11 per cent) during 2003-04. In contrast, NCT Delhi, Haryana, Punjab andWest Bengal formed part of the lowest quartilein terms of the ratio of social sector expenditureto GSDP (4-6 per cent) during 2003-04.
Amongst all the States, the ratio of non-developmental expenditure to GSDP was thehighest (over 10.2 per cent) in the case of Bihar,Orissa, Punjab and Uttar Pradesh.
Based on the information received fromselect States, the proportion of operations andmaintenance expenditure in total revenueexpenditure exihibited a decline over the years(Table XXVIII). This has implications for thereturns from the projects undertaken under thePlans. On the other hand, share of wages andsalaries in revenue expenditure increased overthe second half of the 1990s and then declined to29.1 per cent in 2003-04 (Revised Estimates)(Table XXIX). The continuing large share (nearlyone-third) of wages and salaries in total revenue
text_final.p65 1/6/05, 12:06 AM41

State Finances : A Study of Budgets of 2004-05
42
to aggregate disbursements have declined during2000-01 through 2003-04; some improvement is,however, expected during 2004-05. Expenditure oneducation and medical and public health serviceshave constituted only 2.5 per cent and 0.72 per cent,respectively, of GDP during 2003-04. The decliningshare of education and medical expenditures in totalexpenditures is also evident in many of the States.While there is a certainly a need for qualitativelysuperior and wider coverage of education andmedical services in India, there may also be a needfor examining the efficacy of governmentexpenditures (Box 7).
(D) Debt Position
The debt-GSDP ratios of all State Governmentscontinued to show an increase during 2003-04. Suchelevated debt levels of State Governments couldimpact on their resource raising capability from themarket. This has been experienced by the StateGovernments during the current year.
Table XXVIII : Expenditure on Operationsand Maintenance
(Rs. crore)
States 1995-96 2000-01 2001-02 2002-03 2003-04 2004-05(RE) (BE)
1 2 3 4 5 6 7
Chhattisgarh 61.5 252.8 351.9 375.8 371.5(3.8) (5.1) (6.4) (5.3) (4.9)
Gujarat 425.8 1223.6 909.2 1419.2 2161.8 -(4.9) (5.6) (4.0) (6.6) (9.2) -
Haryana 158.2 220.3 258.7 317.8 393.2 349.4(3.0) (3.1) (3.0) (3.4) (3.7) (3.0)
Jharkhand - - 72.8 59.1 58.4 76.3- - (1.2) (0.8) (0.8) (1.0)
Maharashtra* 4266.5 6876.6 7143.2 8257.1 9921.7 13114.8(24.9) (18.4) (18.7) (20.4) (21.5) (27.4)
Orissa 247.3 427.0 418.4 435.8 524.1 584.9(5.3) (4.8) (4.2) (4.4) (4.1) (4.2)
Tamil Nadu 1498.3 1866.9 1683.0 2143.7 2664.4 2874.6(13.7) (8.6) (7.8) (8.3) (10.0) (10.2)
Uttar Pradesh 6046.3 4887.4 6028.4 6033.3 6203.3 6426.1(34.4) (15.7) (19.0) (18.3) (11.7) (15.0)
Total 12642.3 15563.4 16766.4 19017.9 22302.7 23797.6 (19.6) (12.0) (11.7) (12.4) (11.9) (12.9)
BE – Budget Estimates RE – Revised Estimates.* : Includes expenditure under maintenance works, tools & plants,
machinery & equipment, material & supplies, grant-in-aid non-salary and suspense
- : Not available.Note : Figures in brackets are percentage of Total Revenue Expendi-
ture.Source : Information received from these States.
expenditure is one of the primary factorsunderlying the downward rigidity in revenueexpenditures.
Most State Governments showed an increasein the ratio of capital outlay to GSDP during2003-04. The ratio of capital outlay to GSDPdeclined by 1.5 percentage points in the case ofHaryana to 0.4 per cent in 2003-04; the reductionin capital outlay during 2003-04 was mainlyreflected under food storage and warehousing aswell as irrigation and flood control.
In terms of the ratio of capital outlay to GSDP,Jharkhand and Goa continued to occupy the topquartile, while Kerala and West Bengal continuedto form part of the lowest quartile during 2003-04.
At the consolidated level, the proportion ofexpenditure (revenue expenditure and capitaloutlay) on education (Table XXX) and also medicaland public health and family welfare (Table XXXI)
Table XXIX :Expenditure on Wages and Salary
(Rs. crore)
States 1995-96 2000-01 2001-02 2002-03 2003-04 2004-05(RE) (BE)
1 2 3 4 5 6 7
Chhattisgarh - 832.6 1924.2 1947.7 2169.1 2516.6(51.7) (39.2) (35.2) (30.5) (33.1)
Gujarat 1299.1 2228.5 2310.4 2460.1 2548.2 -(14.8) (10.1) (10.2) (11.5) (10.8) -
Haryana 1369.3 2687.1 2920.4 3156.1 3376.8 3574.8(25.5) (37.4) (33.7) (33.8) (31.6) (30.6)
Maharashtra* 7899.4 18188.1 18474.7 18499.4 20160.5 20497.8(46.0) (48.6) (48.3) (45.7) (43.6) (42.8)
Orissa 1798.3 3568.8 3517.0 3610.3 4068.2 3942.9(38.3) (40.4) (35.6) (36.0) (32.2) (28.0)
Punjab 1900.7 4287.3 4132.7 4556.2 5113.3 5449.8(33.7) (36.6) (32.5) (30.7) (29.7) (28.5)
Rajasthan - 5100.8 5298.1 5281.9 5766.6 5496.5(33.9) (33.2) (31.0) (29.8) (28.1)
Tamil Nadu 4230.6 8251.2 8261.9 7980.4 8919.1 9477.9(38.8) (37.9) (38.3) (31.1) (33.6) (33.7)
Uttar Pradesh 4115.5 7724.4 6962.3 7395.1 8617.8 9481.4(23.4) (24.9) (21.9) (22.5) (16.3) (22.2)
Total 22612.9 52868.9 53801.7 54887.3 60739.5 60437.7 (32.3) (34.1) (33.3) (32.0) (29.1) (33.0)
BE – Budget Estimates RE – Revised Estimates.* : Includes Pension & Gratuity- : Not available/Not applicable.Note : Figures in brackets are percentage of Total Revenue Expendi-
ture.Source : Information received from these States.
text_final.p65 1/6/05, 12:06 AM42
Reserve Bank of India
43
Box 7Demography and the Sustainability of Government Finances in India
An important demographic event of critical significance in the world today is population ageing i.e., the processby which the share of older individuals in the total population starts becoming larger. The ageing phenomenoninitially experienced by developed countries is steadily approaching the developing world. Projections show thatover the next five decades, world median age will continue to increase resulting in enhanced old age dependencyratios in all parts of the world. The experience of OECD countries suggests that substantial demographic changeshave occurred in the past few decades as evident from the projected old-age dependency ratio of nearly 50 per centby 2050. This is going to pose a huge fiscal burden in terms of social security, health care, pension and other relatedexpenditures. In this regard, an OECD exercise reveals that total age-related expenditures relative to GDP could riseon average by about 7 percentage points over the period 2000-2050. In turn, this would imply an average decline of6-7 percentage points in the primary balance to GDP ratio.
India is treading the same path of demographic transition that have been experienced in other parts of the world,albeit delayed by a few decades. Population will continue to grow in the next 50 years at a lower rate. The agestructure will change dramatically with a doubling of the share of ageing population. In fact, India’s populationstructure will, in 2050, mirror that presently found in the major industrial countries. These epidemiological trendswill create pressures for increased spending on medical care in the coming decades. In particular, India is expectedto face greater fiscal stress after 2015 on demographic grounds (Lee, 2003).
The case for fiscal consolidation in India is very strong given that the existing nominal debt to GDP ratio isalready very high compared to other emerging market economies. Both at the national and sub-national level, thefisc suffers from the chronic malaise of fiscal imbalances. The burden is further aggravated when unfunded pensionliabilities, contingent liabilities, government guarantees of state enterprise debts and the prospects of re-capitalisationof a number of state owned financial institutions is taken into account. The challenge facing India, therefore, is arenewed focus on fiscal consolidation as embedded in the objectives of the Fiscal Responsibility and BudgetManagement Act. As the fiscal challenges arising from ageing will take some time to become evident, the opportunityof strengthening the fisc is new and needs to be pursued with greater resolve.
The challenge to the fisc emanate from several factors. First of all, India’s demographics have importantramifications for the approach taken to the provision of medical care and the structure of India’s evolving socialinsurance policy framework. Medical insurance and health care reforms is at a primary stage with the principalmedical facilities located in the urban areas. Although there is large contingent of private practitioners, they aremainly city based and the per capita availability of medical care in rural areas is quite low. Moreover, shift in diseasepatterns further compound the problem. Although they do not necessarily imply a dramatic expansion in the size ofthe government health care system, the need for a substantial strengthening of both this system in coverage and theregulatory framework in the sector cannot be over emphasised. Even without a national health insurance scheme,the level of primary care expenditure is grossly insufficient and would require at least a doubling of the share of thisexpenditure in GDP by 2010 (Heller, 2004). Moreover, with an increasingly affluent population, the demand formedical care is expected to rise sharply.
The government’s involvement in the education sector has been most extensive in terms of primary schooling,where enrollment rates are virtually universal. It is also the principal provider of secondary education, though theprivate sector also plays a significant role. Government involvement is far lower in the tertiary sector. Private sectorinvolvement, either through private universities (so-called long distance training), or the acquisition of education atoverseas universities, is far more common at this level.
A cursory review of India’s social insurance framework suggests enormous gaps, both in coverage and in theregulatory structure. Unemployment insurance basically does not exist, adding to the factors that have made it
text_final.p65 1/6/05, 12:06 AM43
State Finances : A Study of Budgets of 2004-05
44
difficult for enterprises to rationalise work forces. In the health sector, most of the population is covered at best bya limited and poorly staffed public health service. As a consequence, the bulk of health care is provided by theprivate sector. Moreover, government involvement in higher education is marginal with greater scope for furtherenhancement. Looking ahead, India will need to develop a framework for provision of mechanisms for socialinsurance consistent with a modern economy. While the private sector has to play an important part in extendingsocial security services, there has to be a dominant role of the public sector in both regulation of the private sectorand in the targeting of the poorest groups.
However, one redeeming feature in the Indian context is the role of private remittances in alleviating the fiscalburden of the states. It may be noted that India and the Philippines have recorded relatively high remittances duringthe last decade, which are now in excess of 3 per cent of GDP. Private provisions from remittances largely fundexpenditure on education and, in many cases, old age dependency. Nevertheless, the bulk of health and medical careof older people should come from public spending on social security. In this regard, public pension reforms andhealth insurance would play a pivotal role in alleviating the fiscal burden.
In India, initiatives towards pension reforms have been somewhat nascent at both the Central and StateGovernment level. In February 2002, the High Level Expert Group on New Pension System submitted its reportsuggesting modifications in the pension system for Central Government employees. In August 2003, the UnionGovernment approved the proposal to implement the budget announcement of 2003-04 relating to the introductionof a new restructured defined contributory pension system for new entrants to Central Government services, exceptto Armed Forces. An independent Pension Fund Regulatory and Development Authority have also been set up toregulate and develop the pension market. At the State level, the issue of increasing pension liabilities has alsoassumed critical importance since their unfunded and non-contributory nature has proved to be a mounting burdenon the State budgets. So far, however, only a few State Governments have initiated measures towards the introductionof a contributory pension scheme. A Group to Study the Pension Liabilities of the State Governments submitted itsreport in February 2003, which was published in February 2004.
Fortunately, from, the fiscal point of view, unlike in industrial countries, India does not have a “Beveridgean”social insurance system in place (Heller, 2004). Thus, India’s demographics do not necessarily portend explosion ingovernment social insurance outlays arising from underlying existing policy commitments. This being the case,demographic trends still pose important challenges for the government on social security.
References:
1. Chakraborty Dhar, Rajagopal (2004): The Greying of India – Population Ageing in the Context of Asia, SagePublications, New Delhi.
2. Government of India, Report of the High level Expert Group on New Pension System, February 2002.
3. Heller, S. Peter (2004): “India: Today’s Fiscal Policy Imperatives Seen in the Context of Longer-Term Challengesand Risks”, IMF/NIPFP Conference on Fiscal Policy in India.
4. Kapur, Devesh (2003): “Remittances: The New Development Mantra?” Paper prepared for the G-24 TechnicalGroup Meeting, Harvard University and Center for Global Development, August.
5. Mohan, Rakesh (2004): “Fiscal Challenges of Population Ageing: The Asian Experience”, Presentation at theGlobal Demographic Change Symposium sponsored by the Federal Reserve Bank of Kansas City, Jackson Hole,Wyoming, August 26-28, 2004.
6. Lee, Ronald (2003): “The Demographic Transition: Three Centuries of Fundamental Change”, Journal of EconomicPerspectives, November.
7. Reserve Bank of India (2004): “Report of the Group to Study the Pension Liabilities of the State Governments”,Supplement to RBI Monthly Bulletin, February.
text_final.p65 1/6/05, 12:06 AM44

Reserve Bank of India
45
Bihar, Orissa, Rajasthan, and Madhya Pradeshoccupied the topmost quartile (over 53 per cent) interms of debt-GSDP ratio in 2003-04. In fact, thedebt-GSDP ratio of Bihar and Orissa exceeded 70per cent in 2003-04.
The FRL of three State Governments viz.,Karnataka, Punjab and Uttar Pradesh haveincorporated specific targets in respect of their debt-GSDP ratios12. The debt-GSDP ratio in the case ofKarnataka is placed at 29.0 per cent in 2003-04 as
against the target of 25 per cent to be achieved by2015. In contrast, the debt-GSDP ratio of Punjab isplaced at 49.4 per cent in 2003-04 as against a targetof 40 per cent in 2006-07. Similarly, the debt-GSDPratio of Uttar Pradesh is placed at 50.1 per cent in2003-04 as against a target of 25 per cent by 2017-18.
The PD-GSDP ratio witnessed deterioration inthe case of some State Governments during 2003-04, adversely impacting upon the sustainability oftheir debt.
Table XXX :Expenditure on Education
(Revenue Expenditure & Capital Outlay as Ratioto Aggregate Disbursements)
(per cent)
States 2000-01 2001-02 2002-03 2003-04 2004-05
1 2 3 4 5 6
Andhra Pradesh 13.3 12.5 11.7 10.7 11.4Arunachal Pradesh 6.4 13.3 12.1 10.2 11.2Assam 25.5 21.9 22.4 22.1 14.3Bihar 23.7 20.7 18.4 18.9 17.9Chhattisgarh 13.1 12.4 11.0 12.1 12.2Goa 11.9 10.5 12.0 11.8 9.1Gujarat 13.6 12.7 13.5 10.4 12.5Haryana 14.6 13.8 13.7 13.7 13.1Himachal Pradesh 17.0 16.2 14.5 15.1 15.5Jammu and Kashmir 11.1 11.6 10.9 11.1 10.7Jharkhand NA 16.2 19.0 14.2 15.9Karnataka 17.7 16.0 14.8 12.5 13.8Kerala 20.0 19.0 17.6 15.6 17.1Madhya Pradesh 16.3 12.5 12.2 9.4 8.7Maharashtra 22.3 22.1 18.9 15.0 16.4Manipur 20.2 13.7 13.3 11.7 13.1Meghalaya 16.6 17.9 15.3 19.4 17.2Mizoram 16.2 16.0 14.5 11.9 13.9Nagaland 13.8 11.0 11.0 10.6 10.2Orissa 15.9 14.6 14.3 11.7 10.6Punjab 13.2 11.7 12.1 10.9 11.3Rajasthan 18.8 18.2 15.5 14.2 14.4Sikkim 14.2 8.0 7.6 13.6 8.9Tamil Nadu 18.0 17.3 13.8 13.5 14.3Tripura 19.3 18.6 19.2 17.7 17.5Uttar Pradesh 16.8 16.0 14.6 9.2 12.5Uttaranchal 21.5 21.1 20.0 15.2 17.3West Bengal 17.1 16.2 15.9 12.0 12.7NCT Delhi 15.1 13.7 12.1 10.6 12.6
All States 17.4 16.1 15.0 12.6 13.4 (% of Agg. Dis)
All States (% of GDP) 2.9 2.7 2.6 2.5 2.4
Note : Also includes expenditure on Sports, Art and CultureSource: Compiled from budget documents of State Governments.
Table XXXI :Expenditure on Medical and Public Health &
Family Welfare
(Revenue Expenditure & Capital Outlay as Ratioto Aggregate Disbursements)
(per cent)
States 2000-01 2001-02 2002-03 2003-04 2004-05
1 2 3 4 5 6
Andhra Pradesh 4.7 4.4 4.0 3.8 3.4Arunachal Pradesh 5.0 4.9 4.5 3.7 4.3Assam 4.7 4.2 3.7 3.4 3.1Bihar 5.9 4.9 4.2 3.8 3.2Chhattisgarh 4.1 4.3 4.0 3.6 3.7Goa 4.4 3.8 4.0 4.4 3.3Gujarat 3.4 2.8 3.2 2.5 3.0Haryana 3.3 3.0 3.3 2.8 2.8Himachal Pradesh 5.6 4.9 4.5 5.2 5.1Jammu and Kashmir 4.9 5.5 5.2 5.5 4.8Jharkhand NA 4.9 4.2 4.1 3.7Karnataka 5.1 4.9 4.2 3.5 3.5Kerala 5.3 5.8 4.8 4.5 4.7Madhya Pradesh 5.1 4.1 4.1 3.1 3.4Maharashtra 3.9 4.3 3.7 3.3 3.5Manipur 4.8 3.4 2.9 3.2 3.7Meghalaya 5.6 6.6 5.9 4.8 5.2Mizoram 5.4 5.4 5.0 5.6 4.0Nagaland 5.2 4.1 4.6 4.0 4.7Orissa 4.2 3.7 3.8 3.4 3.9Punjab 4.5 3.9 3.5 3.4 3.1Rajasthan 5.2 5.2 4.2 3.9 3.9Sikkim 3.7 2.2 2.0 3.2 2.6Tamil Nadu 4.9 4.9 4.1 4.0 4.2Tripura 4.0 3.7 3.8 4.2 3.8Uttar Pradesh 4.0 3.6 3.8 3.1 4.5Uttaranchal 3.1 4.4 3.8 3.9 4.3West Bengal 5.6 5.0 4.9 3.9 3.8NCT Delhi 7.2 6.7 6.3 5.9 7.0
All States (% of Agg. Dis) 4.7 4.4 4.1 3.6 3.8All States(% of GDP) 0.77 0.73 0.69 0.72 0.67
Source: Compiled from budget documents of State Governments.
12. Please see footnote 5. The definitions of debt in the FRL of these State could differ from that adopted in this Study.
text_final.p65 1/6/05, 12:06 AM45

State Finances : A Study of Budgets of 2004-05
46
The extent of preemption of revenue receiptsby interest payments, another indicator of debtsustainability, showed a decline during 2003-04 inthe case of only six State Governments, two ofwhich (Karnataka and Punjab) which have enactedFRL.
During 2003-04, the ratio of interest paymentsto revenue receipts of as many as 14 StateGovernments (as against 13 States in 2000-03)exceeded 18 per cent as recommended by theEleventh Finance Commission from the viewpointof ensuring debt sustainability over the mediumterm. In fact, this ratio exceeded 50 per cent in thecase of West Bengal during 2003-04. On the otherhand, the ratio of interest payments to revenuereceipts was placed below 18 per cent in the caseof Chhattisgarh, Goa, Jharkhand and Karnatakaduring 2003-04; of these only Karnataka hasenacted FRL.
The average nominal interest rate on debtexceeded the growth rate of GSDP at current pricesfor most State Governments during 2000-03 and2003-04, indicating the unsustainability of theirdebt positions.
A simple correlation analysis between the realper capita NSDP and the debt-GSDP ratio showedthat the correlation coefficient increased from (-)0.63 in 2000-01 to (-) 0.79 in 2003-04. Thecorrelation coefficient was statistically significantin each year. This indicates that States with lowreal per capita income usually have high debt-GSDPratios.
The guarantees issued by the StateGovernments reveal an increasing trend in recentyears (Table XXXII).
II. Special Category States13
The summary table pertaining to the specialcategory States based on the quartile positionindicated in Table XXVI (A & B) is provided inTable XXXIII A&B.
Six out of the eleven States recorded a revenuedeficit during 2003-04; the five revenue surplusStates were Meghalya, Jammu & KashmirNagaland, Sikkim and Tripura.
Himachal Pradesh, Manipur and Uttaranchalrecorded the highest revenue deficits in relation totheir respective GSDP (7 – 9.5 per cent).
The GFD-GSDP was the highest in the case ofArunanchal Pradesh, Manipur and Mizoram (19-24 per cent).
The own tax-GSDP ratio was low in the caseof Arunanchal Pradesh, Mizoram and Nagaland (1– 1.6 per cent), and high in the case of Assam,Sikkim and Uttaranchal (6 – 8 per cent).
The own non-tax to GSDP ratio was low in thecase of Himachal Pradesh, Nagaland and Tripura(less than 1.4 per cent) and very high in the case ofSikkim (30.8 per cent), essentially reflecting theimpact of State lotteries.
13. A distinction is drawn between Special and Non-Special Category States in the context of Plan allocations. The SpecialCategory States are Arunachal Pradesh, Assam, Himachal Pradesh, Jammu and Kashmir, Manipur, Meghalaya, Mizoram,Nagaland, Sikkim, Tripura and Uttaranchal.
Table XXXII : Outstanding Guarantees of theState Governments
(Rs. crore)
States 2000-01 2001-02 2002-03
1 2 3 4
1. Andhra Pradesh 13138 10237 153372. Assam 1100 1854 11013. Bihar 1157 997 7894. Gujarat 17301 18723 190015. Haryana 8209 9174 76846. Himachal Pradesh 1921 4113 21537. Jammu and Kashmir 1143 1033 10338. Karnataka 12989 11845 133149. Kerala 8756 11937 1141010. Madhya Pradesh 10482 9670 967011. Maharashtra 44954 35520 3800212. Orissa 3787 5309 549913. Punjab 6067 6149 1863214. Rajasthan 11954 12912 1481915. Tamil Nadu 12388 12004 1191816. Uttar Pradesh 6391 6268 360117. West Bengal 6982 7641 10331
TOTAL 168719 165386 184294
Source: Information received from 17 State Governments.
text_final.p65 1/6/05, 12:06 AM46

Reserve Bank of India
47
Table XXXIII A : Summary Position of Special Category States for 2000-03 (Average)
INDICATOR Q1 Q2 Q3 Q4
(A)RESOURCE GAP
1. GFD/GSDP RANGE: 3.6 to 4.1 RANGE: 5.3 to 8.3 RANGE: 8.6 to 9.6 RANGE: 11.7 to 20.2Assam, Sikkim, Uttaranchal Meghalaya, Tripura Jammu & Kashmir, Manipur, Arunachal Pradesh,
Nagaland HimachalPradesh, Mizoram
2. RD/GSDP RANGE: -13.6 to -0.8 RANGE: 0.2 to 0.4 RANGE: 0.7 to 2.0 RANGE: 3.5 to 10.3Arunachal Pradesh, Jammu & Kashmir, Assam, Tripura, Uttaranchal Himachal Pradesh, Manipur,Meghalaya, Sikkim Nagaland Mizoram
3. PD/GSDP RANGE: -3.8 to 0.8 RANGE: 2.1 to 2.1 RANGE: 2.5 to 4.6 RANGE: 5.6 to 13.4Assam, Sikkim, Uttaranchal Manipur, Meghalaya Jammu & Kashmir, Nagaland, Arunachal Pradesh,
Tripura HimachalPradesh, Mizoram
4. RD/GFD RANGE: -805.9 to -23.6 RANGE: -19.4 to 4.0 RANGE: 8.8 to 39.7 RANGE: 48.6 to 64.1Arunachal Pradesh, Jammu Meghalaya, Nagaland Manipur, Tripura, Uttaranchal Assam, Himachal Pradesh,& Kashmir, Sikkim Mizoram
5. RD/RR RANGE: -9.6 to -2.7 RANGE: 1.1 to 1.6 RANGE: 2.4 to 9.5 RANGE: 11.1 to 35.8Arunachal Pradesh, Jammu & Kashmir, Manipur, Tripura, Uttaranchal Assam, Himachal Pradesh,Meghalaya, Sikkim Nagaland Mizoram
(B) REVENUE PERFORMANCE
6. OTR/GSDP RANGE: 1.1 to 1.5 RANGE: 1.7 to 2.5 RANGE: 3.3 to 5.1 RANGE: 5.6 to 7.8Arunachal Pradesh, Mizoram, Manipur, Tripura Assam, Jammu & Kashmir, Himachal Pradesh,Nagaland Meghalaya, Sikkim, Uttaranchal,
7. ONTR/GSDP RANGE: 1.1 to 1.3 RANGE: 1.5 to 1.6 RANGE: 1.7 to 2.3 RANGE: 2.5 to 83.0Himachal Pradesh, Tripura, Uttaranchal Assam, Jammu & Kashmir, Arunachal Pradesh,Manipur, Nagaland Meghalaya Mizoram, Sikkim
8. CT/GSDP RANGE: 10.3 to 16.5 RANGE: 23.8 to 25.3 RANGE: 31.7 to 33.7 RANGE: 45.3 to 55.0Assam, Himachal Pradesh, Meghalaya, Tripura Jammu & Kashmir, Manipur, Arunachal Pradesh,Uttaranchal Nagaland Mizoram, Sikkim
9. PRB/GSDP RANGE: -21.5 to -5.9 RANGE: -4.8 to -4.1 RANGE: -3.5 to -1.6 RANGE: -1.1 to 3.5Arunachal Pradesh, Meghalaya, Nagaland Manipur, Tripura, Assam, Himachal Pradesh,Jammu & Kashmir, Sikkim Uttaranchal Mizoram
(C)EXPENDITURE PATTERN
10. DEV/GSDP RANGE: 13.8 to 23.4 RANGE: 24.0 to 24.7 RANGE: 26.8 to 28.1 RANGE: 45.7 to 55.8Assam, Himachal Pradesh, Meghalaya, Tripura Jammu & Kashmir, Manipur, Arunachal Pradesh,Uttaranchal Nagaland Mizoram, Sikkim
11. NONDEV/GSDP RANGE: 6.1 to 11.1 RANGE: 12.6 to 12.9 RANGE: 18.0 to 18.7 RANGE: 19.0 to 94.2Assam, Meghalaya, Himachal Pradesh, Tripura Arunachal Pradesh, Manipur, Jammu & Kashmir,Uttaranchal Nagaland Mizoram, Sikkim
12. SSE/GSDP RANGE: 8.5 to 13.3 RANGE: 13.7 to 14.0 RANGE: 14.3 to 16.2 RANGE: 20.0 to 29.2Assam, Himachal Pradesh, Jammu & Kashmir, Nagaland Manipur, Meghalaya, Arunachal Pradesh,Uttaranchal Tripura Mizoram, Sikkim
13. CO/GSDP RANGE: 1.6 to 4.8 RANGE: 5.0 to 7.5 RANGE: 8.0 to 9.0 RANGE: 10.1 to 17.7Assam, Himachal Pradesh, Manipur, Tripura Jammun & Kashmir, Mizoram, Arunachal Pradesh, Sikkim,Meghalaya Nagaland Uttaranchal
(D) DEBT/POSITION
14. DEBT/GSDP* RANGE: 30.8 to 43.2 RANGE: 51.8 to 57.3 RANGE: 57.3 to 58.8 RANGE: 63.4 to 75.2Assam, Meghalaya, Arunachal Pradesh,Nagaland Jammu & Kashmir, Manipur Himachal Pradesh,Tripura Mizoram, Sikkim
15 IP/RR RANGE: 6.0 to 11.4 RANGE: 14.0 to 14.3 RANGE: 14.6 to 15.9 RANGE: 17.2 to 28.8Arunachal Pradesh, Mizoram, Tripura Jammu & Kashmir, Assam, Himachal Pradesh,Meghalaya, Sikkim Nagaland, Uttaranchal Manipur
* : Data on Uttaranchal is not available.Note : Minus (-) sign indicates surplus
text_final.p65 1/6/05, 12:06 AM47
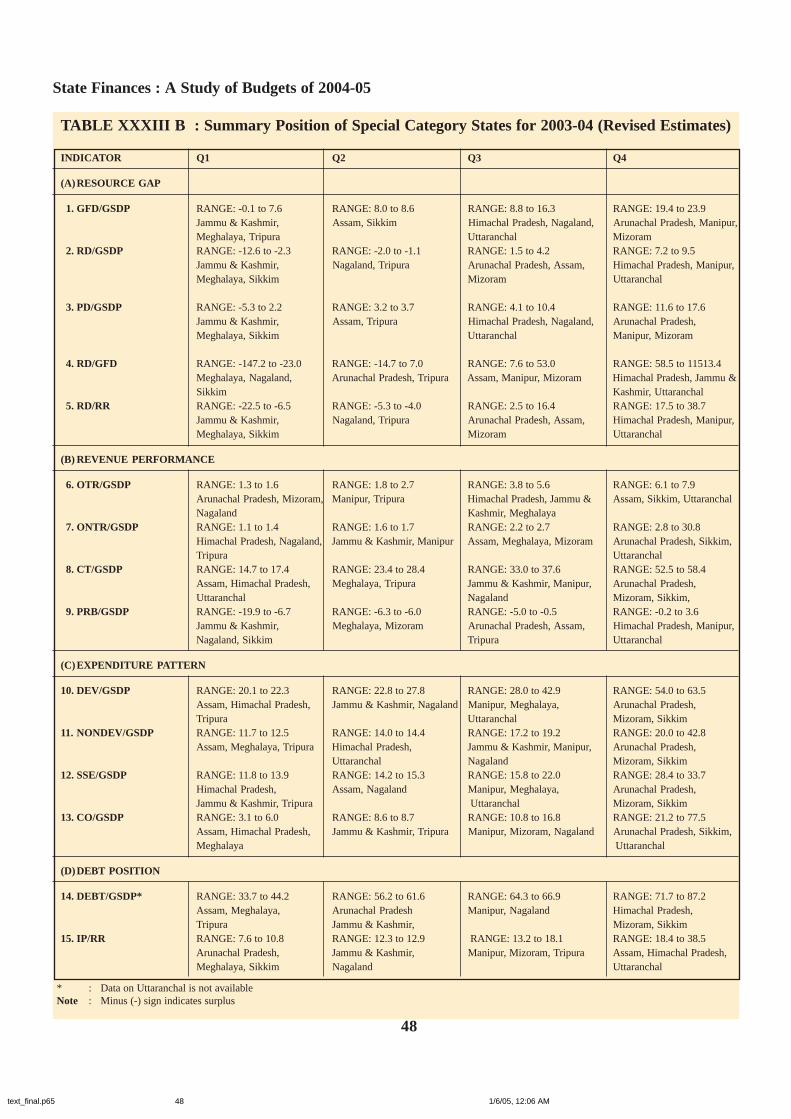
State Finances : A Study of Budgets of 2004-05
48
TABLE XXXIII B : Summary Position of Special Category States for 2003-04 (Revised Estimates)
INDICATOR Q1 Q2 Q3 Q4
(A)RESOURCE GAP
1. GFD/GSDP RANGE: -0.1 to 7.6 RANGE: 8.0 to 8.6 RANGE: 8.8 to 16.3 RANGE: 19.4 to 23.9Jammu & Kashmir, Assam, Sikkim Himachal Pradesh, Nagaland, Arunachal Pradesh, Manipur,Meghalaya, Tripura Uttaranchal Mizoram
2. RD/GSDP RANGE: -12.6 to -2.3 RANGE: -2.0 to -1.1 RANGE: 1.5 to 4.2 RANGE: 7.2 to 9.5Jammu & Kashmir, Nagaland, Tripura Arunachal Pradesh, Assam, Himachal Pradesh, Manipur,Meghalaya, Sikkim Mizoram Uttaranchal
3. PD/GSDP RANGE: -5.3 to 2.2 RANGE: 3.2 to 3.7 RANGE: 4.1 to 10.4 RANGE: 11.6 to 17.6Jammu & Kashmir, Assam, Tripura Himachal Pradesh, Nagaland, Arunachal Pradesh,Meghalaya, Sikkim Uttaranchal Manipur, Mizoram
4. RD/GFD RANGE: -147.2 to -23.0 RANGE: -14.7 to 7.0 RANGE: 7.6 to 53.0 RANGE: 58.5 to 11513.4Meghalaya, Nagaland, Arunachal Pradesh, Tripura Assam, Manipur, Mizoram Himachal Pradesh, Jammu &Sikkim Kashmir, Uttaranchal
5. RD/RR RANGE: -22.5 to -6.5 RANGE: -5.3 to -4.0 RANGE: 2.5 to 16.4 RANGE: 17.5 to 38.7Jammu & Kashmir, Nagaland, Tripura Arunachal Pradesh, Assam, Himachal Pradesh, Manipur,Meghalaya, Sikkim Mizoram Uttaranchal
(B) REVENUE PERFORMANCE
6. OTR/GSDP RANGE: 1.3 to 1.6 RANGE: 1.8 to 2.7 RANGE: 3.8 to 5.6 RANGE: 6.1 to 7.9Arunachal Pradesh, Mizoram, Manipur, Tripura Himachal Pradesh, Jammu & Assam, Sikkim, UttaranchalNagaland Kashmir, Meghalaya
7. ONTR/GSDP RANGE: 1.1 to 1.4 RANGE: 1.6 to 1.7 RANGE: 2.2 to 2.7 RANGE: 2.8 to 30.8Himachal Pradesh, Nagaland, Jammu & Kashmir, Manipur Assam, Meghalaya, Mizoram Arunachal Pradesh, Sikkim,Tripura Uttaranchal
8. CT/GSDP RANGE: 14.7 to 17.4 RANGE: 23.4 to 28.4 RANGE: 33.0 to 37.6 RANGE: 52.5 to 58.4Assam, Himachal Pradesh, Meghalaya, Tripura Jammu & Kashmir, Manipur, Arunachal Pradesh,Uttaranchal Nagaland Mizoram, Sikkim,
9. PRB/GSDP RANGE: -19.9 to -6.7 RANGE: -6.3 to -6.0 RANGE: -5.0 to -0.5 RANGE: -0.2 to 3.6Jammu & Kashmir, Meghalaya, Mizoram Arunachal Pradesh, Assam, Himachal Pradesh, Manipur,Nagaland, Sikkim Tripura Uttaranchal
(C)EXPENDITURE PATTERN
10. DEV/GSDP RANGE: 20.1 to 22.3 RANGE: 22.8 to 27.8 RANGE: 28.0 to 42.9 RANGE: 54.0 to 63.5Assam, Himachal Pradesh, Jammu & Kashmir, Nagaland Manipur, Meghalaya, Arunachal Pradesh,Tripura Uttaranchal Mizoram, Sikkim
11. NONDEV/GSDP RANGE: 11.7 to 12.5 RANGE: 14.0 to 14.4 RANGE: 17.2 to 19.2 RANGE: 20.0 to 42.8Assam, Meghalaya, Tripura Himachal Pradesh, Jammu & Kashmir, Manipur, Arunachal Pradesh,
Uttaranchal Nagaland Mizoram, Sikkim12. SSE/GSDP RANGE: 11.8 to 13.9 RANGE: 14.2 to 15.3 RANGE: 15.8 to 22.0 RANGE: 28.4 to 33.7
Himachal Pradesh, Assam, Nagaland Manipur, Meghalaya, Arunachal Pradesh,Jammu & Kashmir, Tripura Uttaranchal Mizoram, Sikkim
13. CO/GSDP RANGE: 3.1 to 6.0 RANGE: 8.6 to 8.7 RANGE: 10.8 to 16.8 RANGE: 21.2 to 77.5Assam, Himachal Pradesh, Jammu & Kashmir, Tripura Manipur, Mizoram, Nagaland Arunachal Pradesh, Sikkim,Meghalaya Uttaranchal
(D)DEBT POSITION
14. DEBT/GSDP* RANGE: 33.7 to 44.2 RANGE: 56.2 to 61.6 RANGE: 64.3 to 66.9 RANGE: 71.7 to 87.2Assam, Meghalaya, Arunachal Pradesh Manipur, Nagaland Himachal Pradesh,Tripura Jammu & Kashmir, Mizoram, Sikkim
15. IP/RR RANGE: 7.6 to 10.8 RANGE: 12.3 to 12.9 RANGE: 13.2 to 18.1 RANGE: 18.4 to 38.5Arunachal Pradesh, Jammu & Kashmir, Manipur, Mizoram, Tripura Assam, Himachal Pradesh,Meghalaya, Sikkim Nagaland Uttaranchal
* : Data on Uttaranchal is not availableNote : Minus (-) sign indicates surplus
text_final.p65 1/6/05, 12:06 AM48
Reserve Bank of India
49
The debt-GSDP ratio was the highest in the caseof Sikkim and Mizoram (over 70 per cent).
The ratio of interest payments to revenuereceipts exceeded 18 per cent in the case of Assam,Himachal Pradesh, Manipur and Uttaranchal,indicating that their debt position tended to beunsustainable.
The average nominal interest rate on debt alsoexceeded the growth rate of GSDP at current pricesin the case of many special-category StateGovernments, underlining the unsustainability oftheir debt.
Section IVIssues and Perspectives
1. Fiscal Consolidation
The emerging trends in the consolidated fiscalposition of the State Governments show that (1)there was a steady and sizable deterioration in StateGovernment finances over the 1990s, as reflectedin various fiscal indicators; (2) a slow movementtowards correction of fiscal imbalances wasdiscernable during the three-year period 2000-01to 2002-03, facilitated by the reforms undertakenby the States; (3) the underlying weaknesses in StateGovernment finances, however, persisted as themagnitude of fiscal imbalances generally remainedmuch higher than the levels prevailing in the mid-1990s; (4) the direction of fiscal correction saw areversal during 2003-04 partly on account of one-off factors essentially relating to the settlement ofdues of the State Electricity Boards aimed atstrengthening the power sector; and (5) thecorrection envisaged in the budget estimates for2004-05 seeks to reduce the fiscal imbalances (inrelation to GDP) to the levels prevailing around themid-1990s.
Keeping in view the discernible deteriorationin fiscal imbalances in 2003-04 following a phaseof brief correction during the previous three years,the need for an orderly fiscal correction, asenvisaged in the budget estimates for 2004-05,cannot be over-emphasised. This would be
necessary not only from the point of view of thesustainability of fiscal policies at the individualState level, but also from the viewpoint of overallmacroeconomic stability, given that the GFD ofStates has accounted for around 44 per cent of thecombined GFD of the Centre and States in recentyears.
The envisaged correction in the revenue deficitduring 2004-05 is contingent upon, inter alia, adecline in the ratio of revenue expenditure to GDPto 13.4 per cent and the persistence of currenttransfers from the Centre at the previous year’s levelof around 4.6 per cent of GDP. These projectionsmay be viewed in the context of a steady annualdecline of 0.2 percentage points in the revenueexpenditure to GDP ratio beginning 2000-01 to 13.6per cent in 2002-03, followed by a sharp upsurgeto 14.5 per cent in the following year mainly onaccount of the (one-time) transactions relating tothe power sector. Similarly, it may be noted that,barring the sharp hike to 4.6 per cent of GDP in2003-04, current transfers from the Centre havehovered around 4.2 per cent of GDP in the initialthree years of the present decade. It is expected thatin line with the proposals in the Union Budget 2004-05 and the NCMP, current transfers from the Centreto the States would remain buoyant and facilitatethe envisaged fiscal correction at the State level.
It is pertinent to note that except for UttarPradesh, the other four States that have enactedFiscal Responsibility Legislation, had recorded adecline in their revenue deficit in 2003-04 from therespective levels in the previous year. The movetowards rule-based fiscal policy appears to begathering momentum as three more StateGovernments have announced their intention toenact Fiscal Responsibility Legislation. It wouldbe useful if the remaining States could expeditesimilar initiatives. It may be recalled that a WorkingGroup comprising Finance Secretaries of States thathave already enacted the Fiscal ResponsibilityLegislation (or placed the bill before theLegislature), and a representative each from theCentral Government and the Reserve Bank wasconstituted in October 2003 to draft a model fiscalresponsibility legislation at the State level. The draft
text_final.p65 1/6/05, 12:06 AM49
State Finances : A Study of Budgets of 2004-05
50
report of the Group was discussed at the lastconference of State Finance Secretaries in August2004. The report would be finalised after takinginto account the comments of the State FinanceSecretaries.
The Centre’s Fiscal Reforms Facility, underwhich States frame their MTFRPs, is also animportant initiative to encourage and facilitate fiscalreforms at the State level. The experience withMTFRP, however, indicates, inter alia, that the paceof reform at the State level has been slower thanexpected, as the amount of funds released so far, isrelatively small compared to the size of the corpus.It may be worthwhile to review the efficacy of suchincentive-based schemes in the context of theexpected enactment of fiscal responsibilitylegislation by the State Governments, progressivelyin the future.
2. Debt Sustainability
The sharp increase in the debt-GDP ratio fromaround 22 per cent in 1999-2000 to around 29 percent in 2003-04 brings the issue of debtsustainability of State Governments to the fore.Interest payments on debt have, in fact, accountedfor over 25 per cent of revenue receipts in therevised estimates for 2003-04 as against 18 per centrecommended by the Eleventh FinanceCommission from the viewpoint of ensuring debtsustainability in the medium term. Concerns aboutthe sustainability of the debt could possibly haveadverse implications in terms of inadequateresponse of the market to future issues of StateGovernment loans and widening of the spread frombenchmark Central Government securities ofcomparable maturity. In fact, as indicated in theMid-Term Review of Annual Monetary and CreditPolicy for the year 2004-05, “In the recent period,there have been some instances of under-subscription to the State Government issues despiteeasy liquidity conditions. This inadequate responseon the part of the market participants once againunderlines the need for prudent fiscal managementat the State level to ensure completion of theapproved borrowings of the State Government. In
this context, the persistence of large aggregateborrowings of the Central and State Governmentscontinues to be a matter of concern in terms of itspossible adverse impact on the desired accelerationin growth that is consistent with stability, as alsofrom the point of view of ensuring efficient monetaryand debt management.”
The repayment schedule of market loans alsohas a bearing on the future volume of grossborrowings and hence on the sustainability of debt.The repayment of additional allocations of marketborrowings to the States during 2002-03 to 2004-05 would add to the pressure on gross marketborrowings in the future. It is also evident that theexisting humps in the repayment schedule of marketloans during the period 2007-08 to 2013-14 havebeen aggravated to an extent by the issue of powerbonds. It may be useful for the remaining States toestablish Consolidated Sinking Funds in order tomeet such repayments without undue pressure onthe budgets. So far, 13 States have set up theConsolidated Sinking Fund.
A related issue of concern is the substantialincrease in the liabilities of the State Governmentsthrough Small Savings. These high-cost SmallSavings loans from the NSSF are outside thepurview of Article 293 (3) of the Constitution whichrequires the State Governments to seek thepermission of the Centre to access the market forborrowing as long as they are indebted to the Centre.Similarly, the volume of negotiated loans frombanks and financial institutions has witnessed anupsurge in recent years. As a consequence, theoverall level of borrowing of the State Governmentshas remained beyond the purview of anyadministrative control, which is evident from theunabated increase in the GFD of many of the StateGovernments. It has been observed that StateGovernments mobilise substantial amounts of off-budget borrowings through Special PurposeVehicles (SPVs). In this connection, it is noteworthythat the Fiscal Responsibility Legislation (FRL) ofsome of the State Governments already containprovisions relating to a cap on the debt-GSDP ratiosas also on the guarantees. It is expected that theprogressive adoption of such FRL by other State
text_final.p65 1/6/05, 12:06 AM50

Reserve Bank of India
51
Governments would invoke discipline with regardto borrowings.
Further, it is being increasingly recognized thata major factor impeding an in-depth analysis of thedebt position of the State Government is the absenceof unanimity on the definition and composition ofdebt. Compounding this problem is the lack ofuniformity, comprehensiveness and transparency inthe reporting of data on various categories of debtin the budget documents of the State Governments.There is also the unresolved issue of compiling dataon an ‘extended’ definition of debt incorporatingcontingent liabilities, off-budget borrowings andpension liabilities. A Working Group has beenrecently constituted by the Reserve Bank withrepresentation from select State Governments, theGovernment of India, the office of the Comptrollerand Auditor General of India and the ControllerGeneral of Accounts, which would examine someof these issues and work out a model estimationmethodology for compilation of data on StateGovernment liabilities.
3. Loans from the Centre versus Open MarketLoans by States
Central loans to States (excluding SmallSavings loans) have hovered around 1.2 per centof GDP since the 1990s. The Hon’ble FinanceMinister in his Union Budget Speech 2004-05stated, “I also propose to consult the States onallowing them to increase their open marketborrowings and reduce their dependence on loansfrom the Central Government.” In this regard, thereare some issues that merit attention. As mentionedearlier, there have been some instances in recentyears of under-subscription to the marketborrowings of the State Governments. A successfultransition towards greater reliance on marketborrowings by States would, however, becontingent upon the markets perceiving clearevidence of improvement in the financial positionof the State Governments.
The spread between the interest rate on Centralloans to States and the weighted average yield onCentral market loans increased from 1 percentage
point in 1997-98 to over 5 percentage points in2002-03 and is placed at around 3.5 percentagepoints in 2004-05. Moreover, the average interestrate on Centre’s outstanding liabilities is estimatedto have declined to 7.5 per cent in 2004-05, andremains lower than the present interest rate on loansfrom the Centre to the States (9 per cent with effectfrom April 1, 2004).
It may be added that the internationalexperience seems to indicate that exclusive relianceon market discipline for subnational governmentborrowings, though appealing in principle, may notbe appropriate in some circumstances. This isbecause the conditions for its effective working(viz., (i) markets are free and open; (ii) adequateinformation on the borrowers financial profileshould be available to potential lenders; (iii) thereis no perceived chance of bailouts; and (iv) theborrower should have institutional structures thatensure adequate policy responsiveness to marketsignals before reaching the point of exclusion fromnew borrowing) are, on many occasions, notrealised in practice in many cases. Marketdiscipline, however, can usefully complement otherforms of borrowing controls. In this connection,greater transparency and dissemination ofinformation on recent and prospectivedevelopments in the finances of subnationalgovernments is highly desirable.
4. Revenue Mobilisation
Given the downward rigidities in committedexpenditures and the need to enhancedevelopmental spending, it is evident that thesuccess of fiscal consolidation efforts at the Statelevel is critically contingent upon fiscalempowerment in respect of revenue mobilisationpowers. In fact, the Reserve Bank’s Annual Reportfor 2000-01 had stated that, “the path to durablefiscal consolidation is through fiscal empowermenti.e. by expanding the scope and size of revenue flowsinto the budget.” In this context, while it isnoteworthy that the States’ own tax revenue, as aratio to GDP, has shown an upward trend since the1990s, it is at best marginal. In fact, according tothe budget estimates for 2004-05, the ratio of States’
text_final.p65 1/6/05, 12:06 AM51

State Finances : A Study of Budgets of 2004-05
52
own tax to GDP is placed at the previous year’slevel of 5.9 per cent. The State Governments,therefore, need to reinvigorate the efforts toimprove its own tax revenues. It is expected thatthe on-going initiatives at rationalisation of taxstructure and computerisation of the taxdepartments by most State Governments wouldfacilitate the process. The experience of Haryanahighlights the positive impact of VAT on taxrevenues. The Union Budget 2004-05 announcedthat VAT would be implemented on April 1, 2005.Many States have already completed thepreparatory work relating to the implementationof VAT. A Empowered Committee of StateFinance Ministers is examining various aspectsof VAT implementation. In the meanwhile, theremaining States may need to expedite thenecessary groundwork so that the VAT could beimplemented without any further delay. Given theincreasing share of services sector in GDP, theenactment and implementation of the proposedConstitutional amendment to integrate servicesinto the tax net in a comprehensive manner wouldalso help to boost revenues of the StateGovernments. Finally, States may need to takecorrective measures to address the decliningshares of Profession Tax and Electricity Duty intotal own tax revenues in the recent period.
Non-tax revenues have clearly been an areaof debility in State finances. Inappropriate usercharges have led to dismally low cost recoveries,particularly in respect of social services. Costrecovery in respect of economic services isrelatively better, although the large volume ofpower subsidies has been a chronic problem. Inthis context, it is expected that the on-goingpower sector reforms, including the setting upof SERCs, would help to bring power tariffs inline with commercial principles over a period oftime. Furthermore, it is expected that the one timesettlement of dues of the State Electricity Boardsduring 2003 would help them start afresh basedon sound principles of financial management.Improvement in the financial performance ofother State Public Sector Undertakings wouldalso be critical to step-up the return on investmentfrom its abysmally low level.
5. Expenditure Management
A disconcerting aspect of State Governmentfinances since the 1990s is that while developmentalexpenditure and capital outlay, as ratios to GDP,have hovered between 9 -10 per cent and 1.5 - 2per cent, respectively, non-developmentalexpenditure (comprising, inter alia, interestpayments, pensions and administrative services),as a ratio to GDP, has shown noticeable increaseover the last few years and was at 6.4 per cent in2003-04. In fact, during 2004-05, the reduction inthe revenue deficit and GFD is expected to bebrought about without any change in the ratio ofnon-developmental expenditure to GDP.
A sizable reduction in non-developmentalexpenditure may not be feasible in the short-term,given the committed nature of many of itsconstituent items. Within non-developmentalexpenditures, pension payments are likely toincrease in the future in the context of thedemographic changes. It is noteworthy that someof the State Governments have initiated the creationof pension funds based on defined contributions,which could alleviate the pressure on the budget.As far as interest payments are concerned, the DebtSwap Scheme has brought about definite savingson interest costs. Additional savings may beforthcoming in case the Scheme is extended tonegotiated loans from NABARD and other agenciesas announced in the Union Budget for 2004-05. Itis, however, well recognised that such schemesprovide only a temporary palliative, and a durablereduction in interest payments would occur paripassu with a reduction in outstanding debt. On theother hand, moderation in administrative andestablishment expenditures may be feasible if theinitiatives taken by some of the States with regardto the restructuring and redeployment of staff, gainwider acceptability and momentum.
As far as developmental outlays are concerned,it is evident that social sector expenditures havedeclined in terms of GDP. Provisions for educationand health, as ratios to GDP, have declined steadilyand are placed as low as 2.4 per cent and 0.7 percent, respectively, in 2004-05. In line with the
text_final.p65 1/6/05, 12:06 AM52
Reserve Bank of India
53
entrenched developmental role of the States and inthe context of NCMP, it is also imperative thatStates not only increase the coverage but alsoimprove the efficiency of their developmentaloutlays, particularly in respect of education andhealth. As explained earlier, this process could befacilitated if the user charges on such public servicesare appropriately raised to ensure long-termviability.
A reorientation of expenditure towardsproductive purposes may necessitate the adherenceto the principles of public expenditure management.In this context, the international experienceindicates a wide variety of techniques includingplacing of limits on certain expenditures,prioritisation of expenditures, greaterdecentralisation of executive functions, improvedcash management and greater accountability in thedelivery of services against specified targets. Theadoption of some of these principles could facilitatea qualitatively superior process of fiscalconsolidation.
6. Infrastructure Financing
As pointed out in successive Annual Reportsof the Reserve Bank, the financing requirementsof infrastructure as a whole are massive and poseserious problems in the context of the ability to raisemore resources both by the public and privatesector.
The India Infrastructure Report (IIR) (1996)had estimated the infrastructure requirements of theIndian economy to be around US $ 215 billion forthe period 2001-02 to 2005-06. About 85 per centwas expected to be met through domestic financingand 15 per cent by external saving,equiproportionally divided between debt and equity.The IIR had envisioned the commercialisation ofinfrastructure projects as a solution to the unlockingof domestic resources.
In India, financing of infrastructure is stilldominated by the public sector, except intelecommunications. Budget constraints and sub-optimal pricing are the principal impediments topublic investment in infrastructure. Opportunities
for private sector financing in areas previously inthe exclusive domain of the Government haveexpanded not only through the sale equity in Stateenterprises but also through inviting private partiesfor undertaking greenfield projects. Private sectorparticipation in infrastructure financing has,however, been grossly inadequate. There is a lackof commercialisation in infrastructure sectors dueto inadequate reforms in the area of user charges,cross subsidisation, lack of structured financingoptions to mitigate the risks involved andunderdeveloped financial and capital markets. It is,however, important to note that the Governmenthas significantly shifted away from the directproduction of public goods and is also focusing onthe regulatory and policy framework and private-public partnership to generate adequate provisionof public goods.
In the above context, it may be pertinent torecall the observations in the Reserve Bank’sAnnual Report (1996-97), “Currently, the privatesector finds regulatory environment and legal aswell as institutional framework non-transparentand complex for its entry. The problem iscompounded by mix-up of the roles as between theowner and regulator in public domain. Thesefactors in conjunction with the virtual dominationof public sector in long-term contractual saving inhousehold sector, and lack of securitisation of debtseem to have contributed to inadequacies ininvestment in infrastructure. Injection of resourcesin public sector to expeditiously complete theongoing projects on a selective basis and a moretransparent as well as a definitive policy onownership, regulation and financing to attractprivate investor interest, both domestic and foreign,are some of the areas where initiatives are needed.At the same time, full cost recovery allowing fortransparent, and explicit subsidisation whereneeded, would make possible adequate flow ofresources to this critical area.” Even though therehave been some regulatory and legal changes inthe subsequent period, the import of the aboveobservations still merits consideration.
Infrastructural projects are prone to variety ofrisks beyond the traditional management andtechnical risks. The free rider problem and political
text_final.p65 1/6/05, 12:06 AM53
State Finances : A Study of Budgets of 2004-05
54
considerations create appropriability risks.Financial and legal risks arise from non-recoursefinancing, complex payment mechanisms andimperfect credit enhancement. There are alsoinstrument-specific risks arising from maturitymismatches, exposure to market risk, restrictionson assignability and charge creation. Evolvingappropriate mechanisms to manage these risksholds the key to releasing resources for financinginfrastructure.
The Reserve Bank has, over the years,liberalised term loan financing by banks forinfrastructure with recourse to finance throughfunds raised by way of subordinated debt, take outfinancing, direct financing, investment ininfrastructure bonds and guarantees. Banks havebeen allowed to contribute to the equity capital ininfrastructure projects and lend to special purposevehicles (SPVs) in the private sector for directlyundertaking infrastructure projects. The Securitiesand Exchange Board of India (SEBI) has, over theyears, extended relaxations for public issues byinfrastructure companies regarding size, pricing,mode and minimum subscription of issues.
The experience since the late 1990s suggeststhat a key prerequisite for the evolution ofinstitutional arrangements for infrastructurefinancing is the development of the capital market.The central issue is not the adequacy of funds butthe convergence of investment horizons of ultimatesavers and borrowers in the economy. This, in turn,warrants intensifying reforms in insurance andpension funds which provide a natural hedge forthe risks inherent in the financing infrastructure.
Inadequate investment in infrastructure hasconstrained the growth and development of theStates. Several States have, however, proposedin their budgets, projects/schemes to develop theinfrastructure, at times with the help ofmultilateral agencies. The States would need tostrengthen their finances through fiscal, structuraland institutional reforms which would enablethem to release adequate budgetary resources asalso enable them to mobilise funds more easilyfor financing infrastructure.
In the above context, the followingobservations of the Economic Survey of theGovernment of India (2003-04), are noteworthy,“As is well known, enormous financialinvestments are required to bring India’sinfrastructure up to world standards. For theseinvestments to come about, a sound policyframework is required, which emphasises soundenforcement of user charges. Conversely, oncesound policies fall into place, we may expect asharp payoff in terms of an improvement in theflow of investment. To the extent that theseinvestments are undertaken by the private sector,this is particularly beneficial given the fiscalconstraints that limit the ability of the State toengage in those expenditures.”
7. Budget Integrity and Transparency
The persistently large deviations between thebudget estimates and the accounts dataparticularly in respect of revenue receipts of theState Governments raise serious concerns sincethese adversely impact upon the credibility of thebudget estimates and preclude a properassessment of the likely fiscal outcome for theyear. It may, therefore, be useful to improve uponthe entire budget estimation process andmethodology.
It has also been observed that budgetdocuments of all the State Governments do notprovide adequate details on their outstandingliabilities, guarantees and off-budget borrowings.Data on wages and salaries, operation andmaintenance expenditures, subsidies, and the termsand conditions of negotiated loans from banks andfinancial institutions are also not usually provided.The recommendations of the Core Group onVoluntary Disclosure Norms for State Governments(2000) assume significance in this regard. Thedissemination of such information through the Statebudgets would not only facilitate policy formulationbut also help investors to take informed decisionsregarding the health of State finances.
In sum, the sharp deterioration in fiscalimbalances during 2003-04 was mainly a reflection
text_final.p65 1/6/05, 12:06 AM54

Reserve Bank of India
55
of one-off factors to shore-up the finances of StateElectricity Boards. The projected improvement inthe fiscal situation in 2004-05 is largely contingentupon the enhanced devolution and transfers fromthe Centre as well as the containment of the growthin revenue expenditures. The weaknesses in StateGovernment finances have, however, persisted andare manifest mainly in the sluggish non-taxrevenues, downwardly rigid non-developmentalcommitted expenditures, and inadequate allocations
for education, health and infrastructure. It isincreasingly evident that fiscal empowerment holdsthe key to enduring fiscal correction and to provideadequate resources to finance developmentalspending. Self-regulation through the expeditiousenactment and implementation of fiscalresponsibility legislation and other institutionalreforms appear to be a pragmatic approach toimprove the fiscal condition of States.
text_final.p65 1/6/05, 12:06 AM55

State Finances : A Study of Budgets of 2004-05
56
Annex-1 Major Policy Initiatives Proposed in the State Budgets for 2004-05
State
1. Andhra Pradesh
2. ArunachalPradesh
3. Assam
Fiscal
• Revitalising State and Districtlevel Audit Committees to ensurebetter audit compliance.
• An additional subsidy hasbeen provided for supply of freepower to farmers. Outstandingarrears of agricultural farmershave also been waived.
• Devolve Rs.200 crore toPanchayati Raj Institutions basedon recommendations of SecondState Finance Commission.
• Special package to rescuefamilies of farmers whocommitted suicides due to cropfailures or debt trap.
• Modify expenditures in favourof developmental andinfrastructure spending andcontain non-plan expenditure.
• Address key issues of greaterfinancial accountability.
• Adhere to strict financialdiscipline and ruthlessly curbunnecessary and unproductiveexpenditure.
• Proposes to raise additionalrevenue by increase in quantumand efficiency of revenue raisingdepartments.
• APST students will beexempted from 25 per cent theypay for text books.
• Exempt the flood affectedpeople from payment of landrevenue.
• Transfer the salary burdenworth Rs.700 crore from plan tonon-plan by normalisation of
Institutional
• Agriculture TechnologyMission will be set upimmediately to focus onimproving efficiency factors.
• A new department “Rain-Shadow DevelopmentDepartment” has beenestablished for emphasis ondevelopment of rain-shadowareas.
• MLA Local AreaDevelopment Fund isincreased from Rs.20 lakh toRs. 50 lakh.
• A revolving fund to meetthe expenditure of salaries ofschool teachers working on acontractual basis under SarvaShiksha Abhiyan (SSA).
• Assured CareerProgression schemeimplemented for Governmentemployees stagnating in aparticular scale.
• Introduce a legislation forprotection and insurance coverof the unorganised labourcommunity.
• C o n t e m p l a t i n gintroduction of judicious
Sectoral
• 26 irrigation projects areplanned to be completed within5 years.
• Engaged with World Bank tofund Urban Programme forAdvancement of HouseholdIncome (UPADHI) AndhraPradesh Urban Services for Poor(APUSP) programmes in all 118Urban Local bodies.
• A special fund of Rs.300 crorewas raised through HUDCO forfinancing A.P. UrbanInfrastructure DevelopmentProject and other projects.
• During July-Septemberspecified amounts of rice, salt andsoap to be distributed free totarget group comprising poor,downtrodden and needy people ofinterior areas not covered underBPL category.
• Public sector reforms havebeen keenly addressed by thebudget with recommendations ofthe Public Sector ReformCommittee submitted earlier. Thevarious steps suggested are theOTS route, Voluntary Retirement
text_final.p65 1/6/05, 12:06 AM56
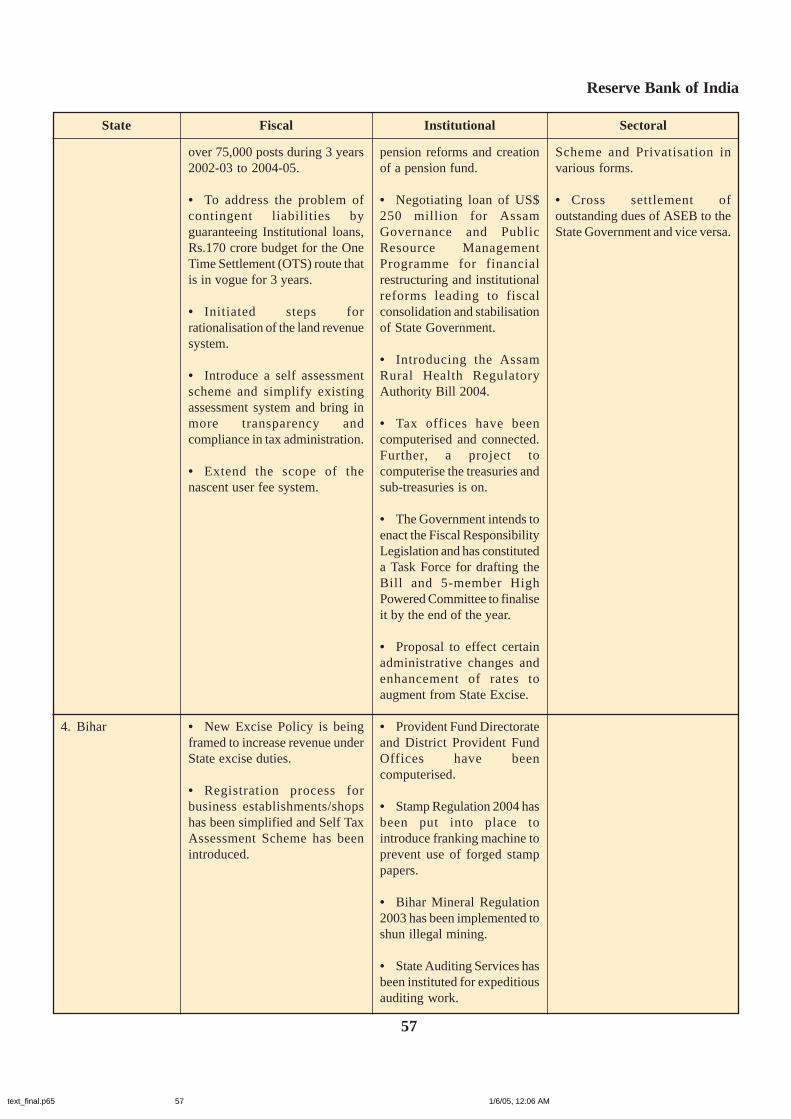
Reserve Bank of India
57
State Fiscal Institutional Sectoral
over 75,000 posts during 3 years2002-03 to 2004-05.
• To address the problem ofcontingent liabilities byguaranteeing Institutional loans,Rs.170 crore budget for the OneTime Settlement (OTS) route thatis in vogue for 3 years.
• Initiated steps forrationalisation of the land revenuesystem.
• Introduce a self assessmentscheme and simplify existingassessment system and bring inmore transparency andcompliance in tax administration.
• Extend the scope of thenascent user fee system.
• New Excise Policy is beingframed to increase revenue underState excise duties.
• Registration process forbusiness establishments/shopshas been simplified and Self TaxAssessment Scheme has beenintroduced.
pension reforms and creationof a pension fund.
• Negotiating loan of US$250 million for AssamGovernance and PublicResource ManagementProgramme for financialrestructuring and institutionalreforms leading to fiscalconsolidation and stabilisationof State Government.
• Introducing the AssamRural Health RegulatoryAuthority Bill 2004.
• Tax offices have beencomputerised and connected.Further, a project tocomputerise the treasuries andsub-treasuries is on.
• The Government intends toenact the Fiscal ResponsibilityLegislation and has constituteda Task Force for drafting theBill and 5-member HighPowered Committee to finaliseit by the end of the year.
• Proposal to effect certainadministrative changes andenhancement of rates toaugment from State Excise.
• Provident Fund Directorateand District Provident FundOffices have beencomputerised.
• Stamp Regulation 2004 hasbeen put into place tointroduce franking machine toprevent use of forged stamppapers.
• Bihar Mineral Regulation2003 has been implemented toshun illegal mining.
• State Auditing Services hasbeen instituted for expeditiousauditing work.
Scheme and Privatisation invarious forms.
• Cross settlement ofoutstanding dues of ASEB to theState Government and vice versa.
4. Bihar
text_final.p65 1/6/05, 12:06 AM57
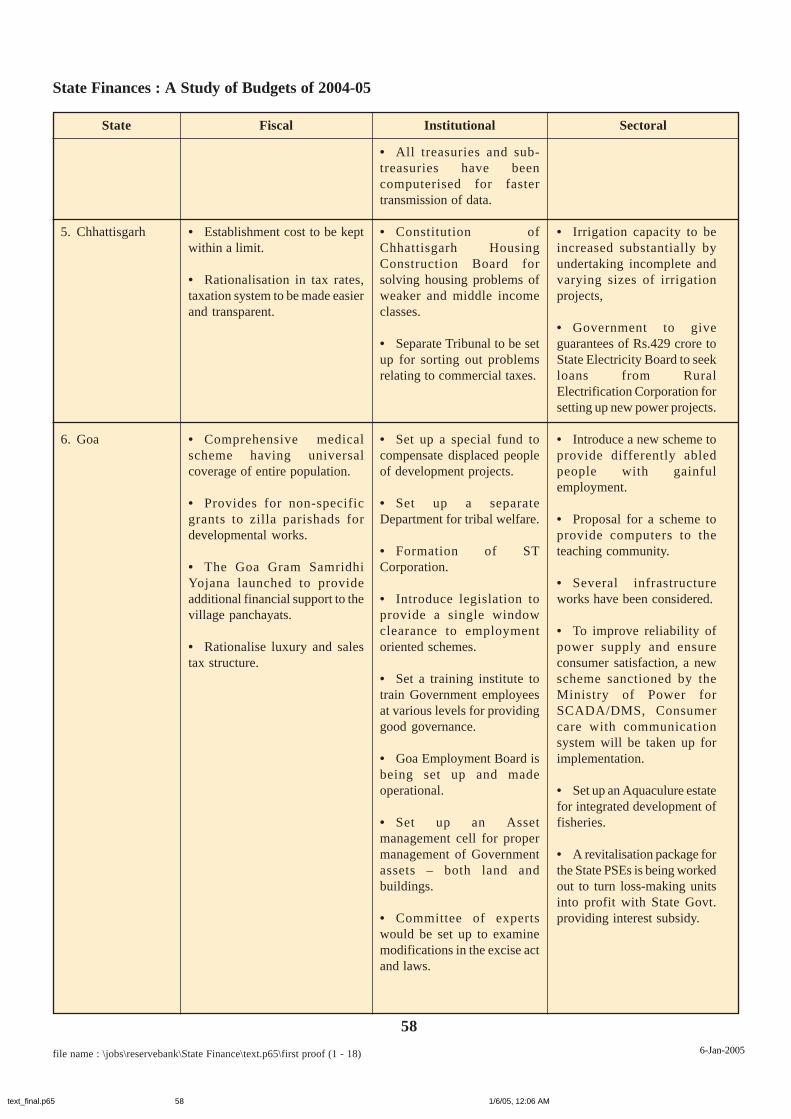
State Finances : A Study of Budgets of 2004-05
58
file name : \jobs\reservebank\State Finance\text.p65\first proof (1 - 18) 6-Jan-2005
State Fiscal Institutional Sectoral
• All treasuries and sub-treasuries have beencomputerised for fastertransmission of data.
• Constitution ofChhattisgarh HousingConstruction Board forsolving housing problems ofweaker and middle incomeclasses.
• Separate Tribunal to be setup for sorting out problemsrelating to commercial taxes.
• Set up a special fund tocompensate displaced peopleof development projects.
• Set up a separateDepartment for tribal welfare.
• Formation of STCorporation.
• Introduce legislation toprovide a single windowclearance to employmentoriented schemes.
• Set a training institute totrain Government employeesat various levels for providinggood governance.
• Goa Employment Board isbeing set up and madeoperational.
• Set up an Assetmanagement cell for propermanagement of Governmentassets – both land andbuildings.
• Committee of expertswould be set up to examinemodifications in the excise actand laws.
5. Chhattisgarh
6. Goa
• Irrigation capacity to beincreased substantially byundertaking incomplete andvarying sizes of irrigationprojects,
• Government to giveguarantees of Rs.429 crore toState Electricity Board to seekloans from RuralElectrification Corporation forsetting up new power projects.
• Introduce a new scheme toprovide differently abledpeople with gainfulemployment.
• Proposal for a scheme toprovide computers to theteaching community.
• Several infrastructureworks have been considered.
• To improve reliability ofpower supply and ensureconsumer satisfaction, a newscheme sanctioned by theMinistry of Power forSCADA/DMS, Consumercare with communicationsystem will be taken up forimplementation.
• Set up an Aquaculure estatefor integrated development offisheries.
• A revitalisation package forthe State PSEs is being workedout to turn loss-making unitsinto profit with State Govt.providing interest subsidy.
• Establishment cost to be keptwithin a limit.
• Rationalisation in tax rates,taxation system to be made easierand transparent.
• Comprehensive medicalscheme having universalcoverage of entire population.
• Provides for non-specificgrants to zilla parishads fordevelopmental works.
• The Goa Gram SamridhiYojana launched to provideadditional financial support to thevillage panchayats.
• Rationalise luxury and salestax structure.
text_final.p65 1/6/05, 12:06 AM58

Reserve Bank of India
59
State Fiscal Institutional Sectoral
• Proposal underconsideration for fishermans’welfare fund to provide reliefduring lean/ban period andduring natural calamity.
• Constituted the SecondFinance Commission forstrengthening the financialadministration of the localgovernments.
7. Gujarat • Taxation policy based onreform through rationalisation,simplification and transparencyin the tax structure.
• Farmers to benefit from fullexemption of electricity duty.
• Provision for an ambitiousscheme for providing water to dryland and dry underground anddouble the income of farmers.
• Decided to undertake watersupply and sanitation sectorreform programme in all thedistricts.
• Start Amritdhara scheme formaking available safe drinkingwater to everyone inmunicipalities.
• Plan to support a major thrusttowards the establishment of agas-based economy in Gujarat.
• Implement MatruvandanaScheme to remove deficiency ofnutrients in adolescent girls andset up health service organisation/set up in urban/municipal areas.
• Introduce SwayamPramanikaran Sah SankalitVarshik Patrak Yojana byadopting the approach to abolishInspector-Raj to removehardships of people.
• Two Special Economic Zonesat Mundra and Dahej with theenactment of Special EconomicZone Act.
• Two Garment Parks and Threemore Industrial Parks fordiamonds and jewellery withcollaboration of India.
• Identified three zones fordevelopment planning.
• Implement ‘AnnapurnaScheme’ of Government of Indiawherein infrm, destitute and old
text_final.p65 1/6/05, 12:06 AM59
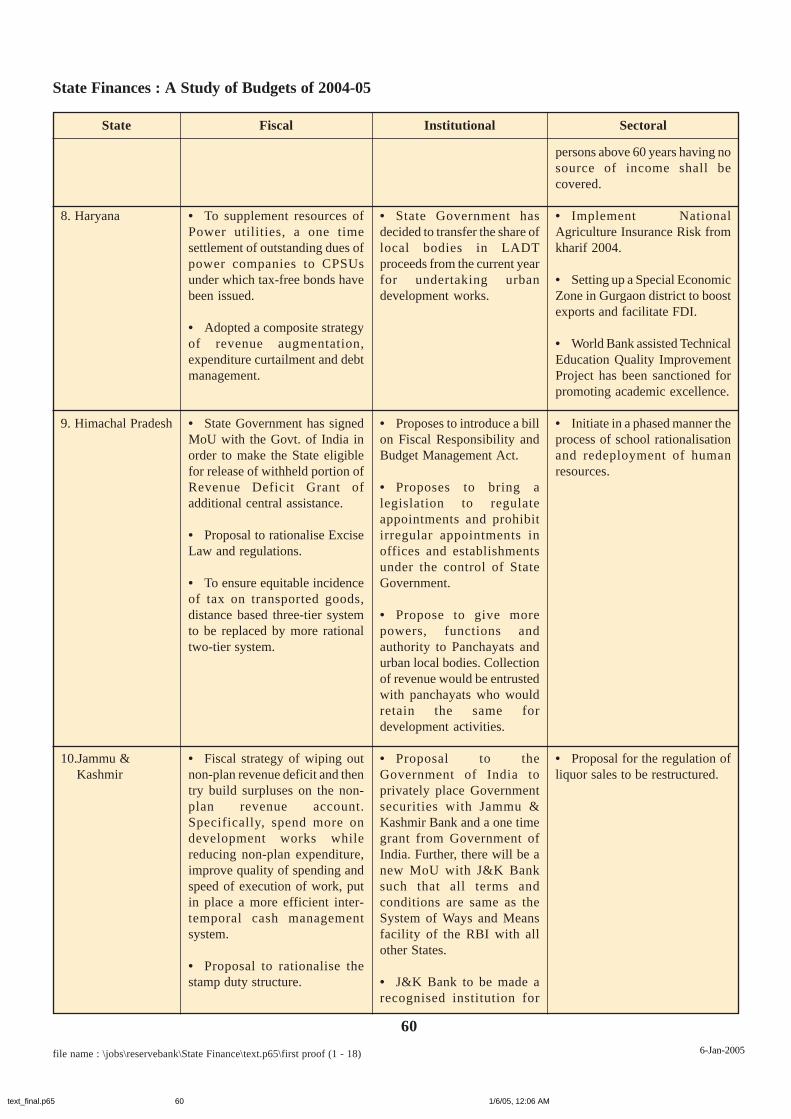
State Finances : A Study of Budgets of 2004-05
60
file name : \jobs\reservebank\State Finance\text.p65\first proof (1 - 18) 6-Jan-2005
State Fiscal Institutional Sectoral
persons above 60 years having nosource of income shall becovered.
• Implement NationalAgriculture Insurance Risk fromkharif 2004.
• Setting up a Special EconomicZone in Gurgaon district to boostexports and facilitate FDI.
• World Bank assisted TechnicalEducation Quality ImprovementProject has been sanctioned forpromoting academic excellence.
• Initiate in a phased manner theprocess of school rationalisationand redeployment of humanresources.
• Proposal for the regulation ofliquor sales to be restructured.
8. Haryana
9. Himachal Pradesh
10.Jammu &Kashmir
• To supplement resources ofPower utilities, a one timesettlement of outstanding dues ofpower companies to CPSUsunder which tax-free bonds havebeen issued.
• Adopted a composite strategyof revenue augmentation,expenditure curtailment and debtmanagement.
• State Government has signedMoU with the Govt. of India inorder to make the State eligiblefor release of withheld portion ofRevenue Deficit Grant ofadditional central assistance.
• Proposal to rationalise ExciseLaw and regulations.
• To ensure equitable incidenceof tax on transported goods,distance based three-tier systemto be replaced by more rationaltwo-tier system.
• Fiscal strategy of wiping outnon-plan revenue deficit and thentry build surpluses on the non-plan revenue account.Specifically, spend more ondevelopment works whilereducing non-plan expenditure,improve quality of spending andspeed of execution of work, putin place a more efficient inter-temporal cash managementsystem.
• Proposal to rationalise thestamp duty structure.
• State Government hasdecided to transfer the share oflocal bodies in LADTproceeds from the current yearfor undertaking urbandevelopment works.
• Proposes to introduce a billon Fiscal Responsibility andBudget Management Act.
• Proposes to bring alegislation to regulateappointments and prohibitirregular appointments inoffices and establishmentsunder the control of StateGovernment.
• Propose to give morepowers, functions andauthority to Panchayats andurban local bodies. Collectionof revenue would be entrustedwith panchayats who wouldretain the same fordevelopment activities.
• Proposal to theGovernment of India toprivately place Governmentsecurities with Jammu &Kashmir Bank and a one timegrant from Government ofIndia. Further, there will be anew MoU with J&K Banksuch that all terms andconditions are same as theSystem of Ways and Meansfacility of the RBI with allother States.
• J&K Bank to be made arecognised institution for
text_final.p65 1/6/05, 12:06 AM60
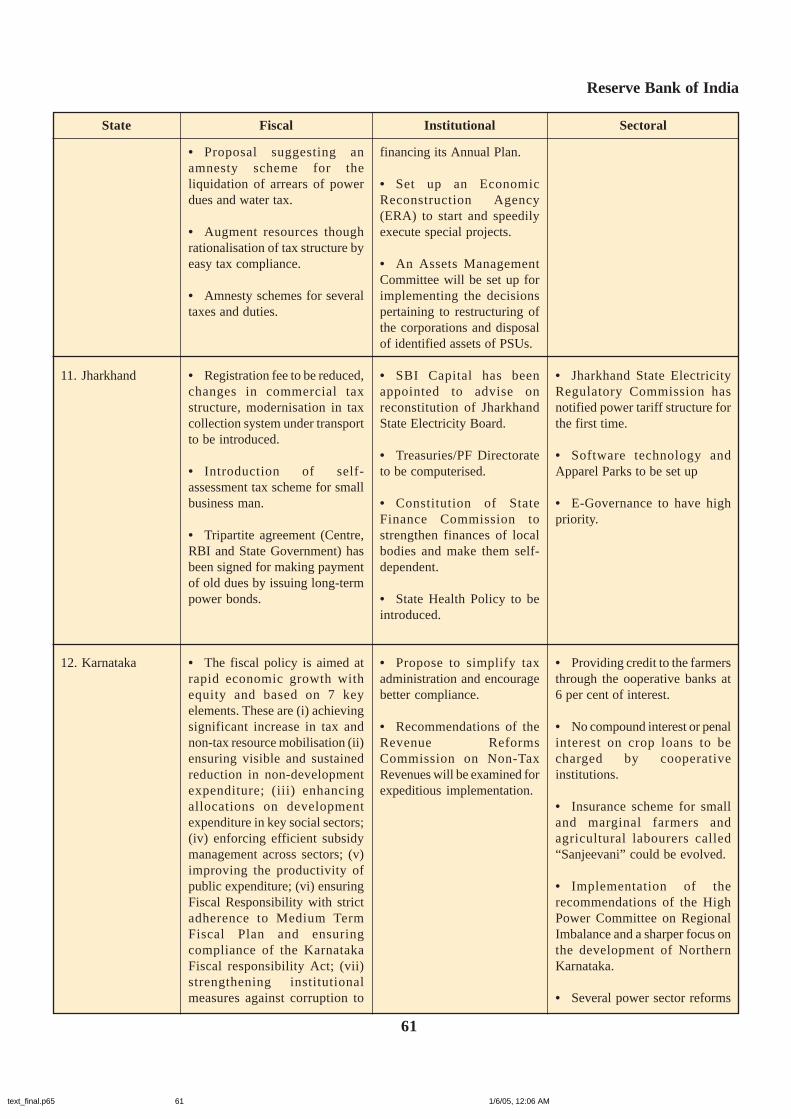
Reserve Bank of India
61
State Fiscal Institutional Sectoral
• Proposal suggesting anamnesty scheme for theliquidation of arrears of powerdues and water tax.
• Augment resources thoughrationalisation of tax structure byeasy tax compliance.
• Amnesty schemes for severaltaxes and duties.
• Registration fee to be reduced,changes in commercial taxstructure, modernisation in taxcollection system under transportto be introduced.
• Introduction of self-assessment tax scheme for smallbusiness man.
• Tripartite agreement (Centre,RBI and State Government) hasbeen signed for making paymentof old dues by issuing long-termpower bonds.
• The fiscal policy is aimed atrapid economic growth withequity and based on 7 keyelements. These are (i) achievingsignificant increase in tax andnon-tax resource mobilisation (ii)ensuring visible and sustainedreduction in non-developmentexpenditure; (iii) enhancingallocations on developmentexpenditure in key social sectors;(iv) enforcing efficient subsidymanagement across sectors; (v)improving the productivity ofpublic expenditure; (vi) ensuringFiscal Responsibility with strictadherence to Medium TermFiscal Plan and ensuringcompliance of the KarnatakaFiscal responsibility Act; (vii)strengthening institutionalmeasures against corruption to
financing its Annual Plan.
• Set up an EconomicReconstruction Agency(ERA) to start and speedilyexecute special projects.
• An Assets ManagementCommittee will be set up forimplementing the decisionspertaining to restructuring ofthe corporations and disposalof identified assets of PSUs.
• SBI Capital has beenappointed to advise onreconstitution of JharkhandState Electricity Board.
• Treasuries/PF Directorateto be computerised.
• Constitution of StateFinance Commission tostrengthen finances of localbodies and make them self-dependent.
• State Health Policy to beintroduced.
• Propose to simplify taxadministration and encouragebetter compliance.
• Recommendations of theRevenue ReformsCommission on Non-TaxRevenues will be examined forexpeditious implementation.
• Jharkhand State ElectricityRegulatory Commission hasnotified power tariff structure forthe first time.
• Software technology andApparel Parks to be set up
• E-Governance to have highpriority.
• Providing credit to the farmersthrough the ooperative banks at6 per cent of interest.
• No compound interest or penalinterest on crop loans to becharged by cooperativeinstitutions.
• Insurance scheme for smalland marginal farmers andagricultural labourers called“Sanjeevani” could be evolved.
• Implementation of therecommendations of the HighPower Committee on RegionalImbalance and a sharper focus onthe development of NorthernKarnataka.
• Several power sector reforms
11. Jharkhand
12. Karnataka
text_final.p65 1/6/05, 12:06 AM61
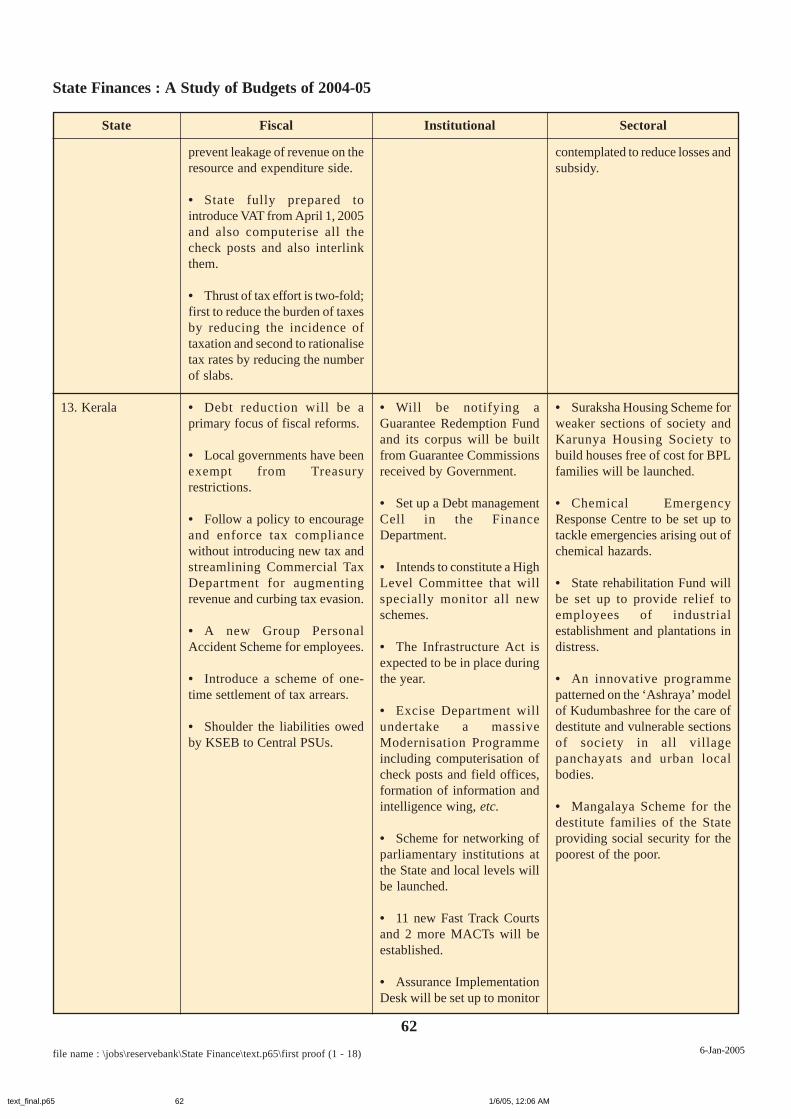
State Finances : A Study of Budgets of 2004-05
62
file name : \jobs\reservebank\State Finance\text.p65\first proof (1 - 18) 6-Jan-2005
State Fiscal Institutional Sectoral
prevent leakage of revenue on theresource and expenditure side.
• State fully prepared tointroduce VAT from April 1, 2005and also computerise all thecheck posts and also interlinkthem.
• Thrust of tax effort is two-fold;first to reduce the burden of taxesby reducing the incidence oftaxation and second to rationalisetax rates by reducing the numberof slabs.
• Debt reduction will be aprimary focus of fiscal reforms.
• Local governments have beenexempt from Treasuryrestrictions.
• Follow a policy to encourageand enforce tax compliancewithout introducing new tax andstreamlining Commercial TaxDepartment for augmentingrevenue and curbing tax evasion.
• A new Group PersonalAccident Scheme for employees.
• Introduce a scheme of one-time settlement of tax arrears.
• Shoulder the liabilities owedby KSEB to Central PSUs.
contemplated to reduce losses andsubsidy.
• Suraksha Housing Scheme forweaker sections of society andKarunya Housing Society tobuild houses free of cost for BPLfamilies will be launched.
• Chemical EmergencyResponse Centre to be set up totackle emergencies arising out ofchemical hazards.
• State rehabilitation Fund willbe set up to provide relief toemployees of industrialestablishment and plantations indistress.
• An innovative programmepatterned on the ‘Ashraya’ modelof Kudumbashree for the care ofdestitute and vulnerable sectionsof society in all villagepanchayats and urban localbodies.
• Mangalaya Scheme for thedestitute families of the Stateproviding social security for thepoorest of the poor.
13. Kerala • Will be notifying aGuarantee Redemption Fundand its corpus will be builtfrom Guarantee Commissionsreceived by Government.
• Set up a Debt managementCell in the FinanceDepartment.
• Intends to constitute a HighLevel Committee that willspecially monitor all newschemes.
• The Infrastructure Act isexpected to be in place duringthe year.
• Excise Department willundertake a massiveModernisation Programmeincluding computerisation ofcheck posts and field offices,formation of information andintelligence wing, etc.
• Scheme for networking ofparliamentary institutions atthe State and local levels willbe launched.
• 11 new Fast Track Courtsand 2 more MACTs will beestablished.
• Assurance ImplementationDesk will be set up to monitor
text_final.p65 1/6/05, 12:06 AM62
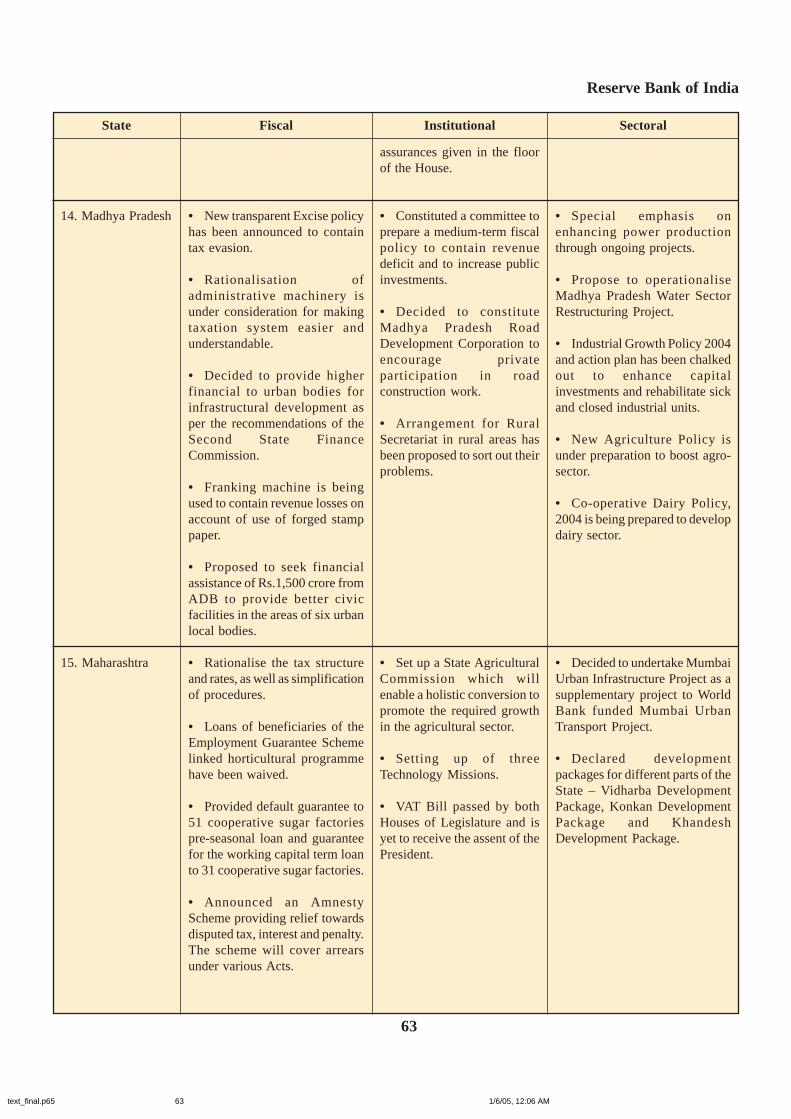
Reserve Bank of India
63
State Fiscal Institutional Sectoral
assurances given in the floorof the House.
• Constituted a committee toprepare a medium-term fiscalpolicy to contain revenuedeficit and to increase publicinvestments.
• Decided to constituteMadhya Pradesh RoadDevelopment Corporation toencourage privateparticipation in roadconstruction work.
• Arrangement for RuralSecretariat in rural areas hasbeen proposed to sort out theirproblems.
• Set up a State AgriculturalCommission which willenable a holistic conversion topromote the required growthin the agricultural sector.
• Setting up of threeTechnology Missions.
• VAT Bill passed by bothHouses of Legislature and isyet to receive the assent of thePresident.
14. Madhya Pradesh
15. Maharashtra
• New transparent Excise policyhas been announced to containtax evasion.
• Rationalisation ofadministrative machinery isunder consideration for makingtaxation system easier andunderstandable.
• Decided to provide higherfinancial to urban bodies forinfrastructural development asper the recommendations of theSecond State FinanceCommission.
• Franking machine is beingused to contain revenue losses onaccount of use of forged stamppaper.
• Proposed to seek financialassistance of Rs.1,500 crore fromADB to provide better civicfacilities in the areas of six urbanlocal bodies.
• Rationalise the tax structureand rates, as well as simplificationof procedures.
• Loans of beneficiaries of theEmployment Guarantee Schemelinked horticultural programmehave been waived.
• Provided default guarantee to51 cooperative sugar factoriespre-seasonal loan and guaranteefor the working capital term loanto 31 cooperative sugar factories.
• Announced an AmnestyScheme providing relief towardsdisputed tax, interest and penalty.The scheme will cover arrearsunder various Acts.
• Special emphasis onenhancing power productionthrough ongoing projects.
• Propose to operationaliseMadhya Pradesh Water SectorRestructuring Project.
• Industrial Growth Policy 2004and action plan has been chalkedout to enhance capitalinvestments and rehabilitate sickand closed industrial units.
• New Agriculture Policy isunder preparation to boost agro-sector.
• Co-operative Dairy Policy,2004 is being prepared to developdairy sector.
• Decided to undertake MumbaiUrban Infrastructure Project as asupplementary project to WorldBank funded Mumbai UrbanTransport Project.
• Declared developmentpackages for different parts of theState – Vidharba DevelopmentPackage, Konkan DevelopmentPackage and KhandeshDevelopment Package.
text_final.p65 1/6/05, 12:06 AM63
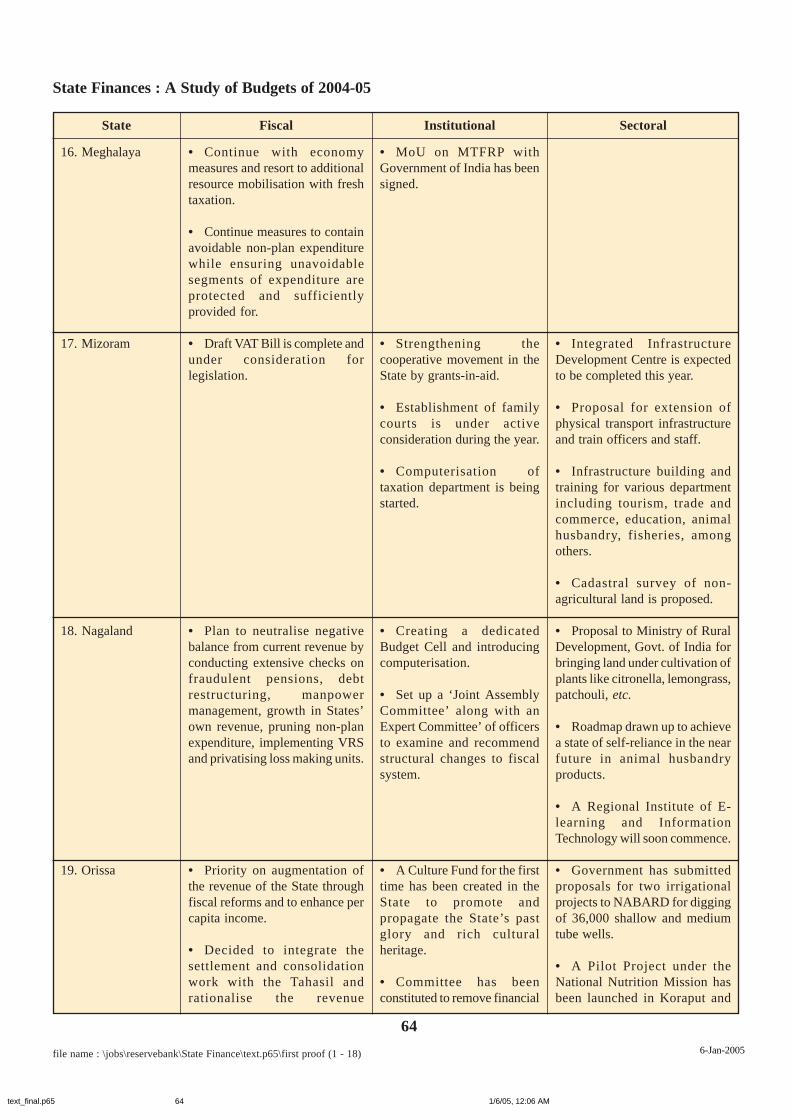
State Finances : A Study of Budgets of 2004-05
64
file name : \jobs\reservebank\State Finance\text.p65\first proof (1 - 18) 6-Jan-2005
State Fiscal Institutional Sectoral
• Continue with economymeasures and resort to additionalresource mobilisation with freshtaxation.
• Continue measures to containavoidable non-plan expenditurewhile ensuring unavoidablesegments of expenditure areprotected and sufficientlyprovided for.
• Draft VAT Bill is complete andunder consideration forlegislation.
• Plan to neutralise negativebalance from current revenue byconducting extensive checks onfraudulent pensions, debtrestructuring, manpowermanagement, growth in States’own revenue, pruning non-planexpenditure, implementing VRSand privatising loss making units.
• Priority on augmentation ofthe revenue of the State throughfiscal reforms and to enhance percapita income.
• Decided to integrate thesettlement and consolidationwork with the Tahasil andrationalise the revenue
16. Meghalaya
17. Mizoram
18. Nagaland
19. Orissa
• MoU on MTFRP withGovernment of India has beensigned.
• Strengthening thecooperative movement in theState by grants-in-aid.
• Establishment of familycourts is under activeconsideration during the year.
• Computerisation oftaxation department is beingstarted.
• Creating a dedicatedBudget Cell and introducingcomputerisation.
• Set up a ‘Joint AssemblyCommittee’ along with anExpert Committee’ of officersto examine and recommendstructural changes to fiscalsystem.
• A Culture Fund for the firsttime has been created in theState to promote andpropagate the State’s pastglory and rich culturalheritage.
• Committee has beenconstituted to remove financial
• Integrated InfrastructureDevelopment Centre is expectedto be completed this year.
• Proposal for extension ofphysical transport infrastructureand train officers and staff.
• Infrastructure building andtraining for various departmentincluding tourism, trade andcommerce, education, animalhusbandry, fisheries, amongothers.
• Cadastral survey of non-agricultural land is proposed.
• Proposal to Ministry of RuralDevelopment, Govt. of India forbringing land under cultivation ofplants like citronella, lemongrass,patchouli, etc.
• Roadmap drawn up to achievea state of self-reliance in the nearfuture in animal husbandryproducts.
• A Regional Institute of E-learning and InformationTechnology will soon commence.
• Government has submittedproposals for two irrigationalprojects to NABARD for diggingof 36,000 shallow and mediumtube wells.
• A Pilot Project under theNational Nutrition Mission hasbeen launched in Koraput and
text_final.p65 1/6/05, 12:06 AM64

Reserve Bank of India
65
State Fiscal Institutional Sectoral
Kalahandi districts to provide @6 kg free rice to 1,19,121 undernourished persons.
• Department of InformationTechnology has proposed twoinnovative self-employmentschemes viz., Information Kiosksand Business ProcessOutsourcing Complex to tacklethe problem of unemploymentamong educated youths.
• Emphasis to complete theincomplete projects on prioritybasis instead of starting newprojects.
• A new scheme ‘AgriculturalProduction Pattern AdjustmentProgramme’ to shift agriculturalarea from wheat-paddy toalternative crops with centralassistance is awaitingGovernment of India approval.
• Introduced ‘AshirwadScheme’ to provide economicsupport to families of scheduledcaste and backward classes withthe benefit limited to twodaughters in a family.
• To launch a self-financedHealth Insurance scheme“Sanjivni” for members ofprimary cooperative societies.
disparity and regionalimbalances.
• A new pension schemebased on defined contributionis being introduced.
• Constituted EmpoweredCommittee underChairmanship of ChiefMinister to consider specialpackage for mega projects.
• Powers and duties relatingto several Departments havebeen transferred to panchayatiraj institutions.
• Reforms in power sector asper Electricity Act 2003including unbundling of thepresent organisationalstructure at an advanced stageof consideration.
• New legislation to bebrought out to empower ruraland urban local bodies byconstituting District PlanningCommittees.
• Draft a new agecooperation legislation “ThePunjab Self SupportingCooperative Societies Act” toremove undue control ofGovernment on cooperatives.
administration at the Directorate,District, Sub-Division andTahasil levels.
• Each Department ofGovernment to undertake anexercise of restructuring of staffand thereafter revival or creationof posts can be considered.
• Future employment in theGovernment would be scheme/project specific and need based.
• Disinvestment on a selectivebasis for loss making PSUs.
• Personal Ledger Accountshave been closed in most cases.
• Computerisation of treasuries.
• Proposed to leverage funds byraising urban infrastructure bondsshortly for upgradation ofexisting infrastructure and addingnew assets.
• Lifted the ban imposed oncompassionate employment.
• Education cess on liquor sale.
20. Punjab
text_final.p65 1/6/05, 12:06 AM65

State Finances : A Study of Budgets of 2004-05
66
file name : \jobs\reservebank\State Finance\text.p65\first proof (1 - 18) 6-Jan-2005
State Fiscal Institutional Sectoral
21. Rajasthan
22. Sikkim
• Simplication in taxes withabolition in Surcharge andTurnover taxes.
• Rationalisation of entry tax,stamp duties and entertainmenttax.
• Proposal to establish BlockDevelopment Offices in each ofthe administrative blocks and aRegional Secretariat to facilitatethe process of democraticdecentralisation.
• Reorient approach andstrategy in overall fiscaladministration process byintroducing a package ofmeasures tailored to graduallynarrow down the fiscal deficit,together with efforts to curtailnon-plan expenditure.
• Broadening the tax base foradditional revenue generation.
• Higher studies fellowships tothe youth who would take uphigher studies.
• Rajasthan State Road Fundto be set-up by introducing aBill in the Assembly.
• Local bodies to be givenmore funds as per therecommendations of theSecond Finance Commission.
• Rajasthan UrbanInfrastructure Finance andDevelopment Corporation tobe set-up for the developmentof infrastructure by urban localbodies.
• Fiscal Responsibility andBudget Management Bill isunder preparation.
• Contributory PensionScheme has been implementedfor new employees joining theservices since January 1, 2004.
• Creation of “TechnologyInduction Fund” to bring in avariety of newer technologiesfor the farmer.
• Setting up of Jari-BootiKosh primarily to list thetraditional folk medicinepractices in the State.
• A separate fund fordeveloping amenities for thephysically challenged peoplein all the public places.
• Do a comprehensive‘Village Mapping’ wherenatural resources, populationfeatures and other informationare put together for futuredevelopment purposes.
• Board of Investment will befully activated as a facilitatorfor attracting investmentproposals.
• Bring into force the StateMinimum Wages Act
• All Departments to prepare a100 days action plan highlightingspecific projects.
• Adoption of DecentralisedParticipatory and beneficiaryDriven Approaches designed toimprove delivery of ruralservices.
• Implement recommendationsmade by Centre for InfrastructureManagement, ASCI, Hyderabadin bringing about power sectorreforms. Corporatise the powersector and operationalise theSikkim Power DevelopmentCorporation.
• Establishment of Food Parkand an Export Processing Zone.
text_final.p65 1/6/05, 12:06 AM66
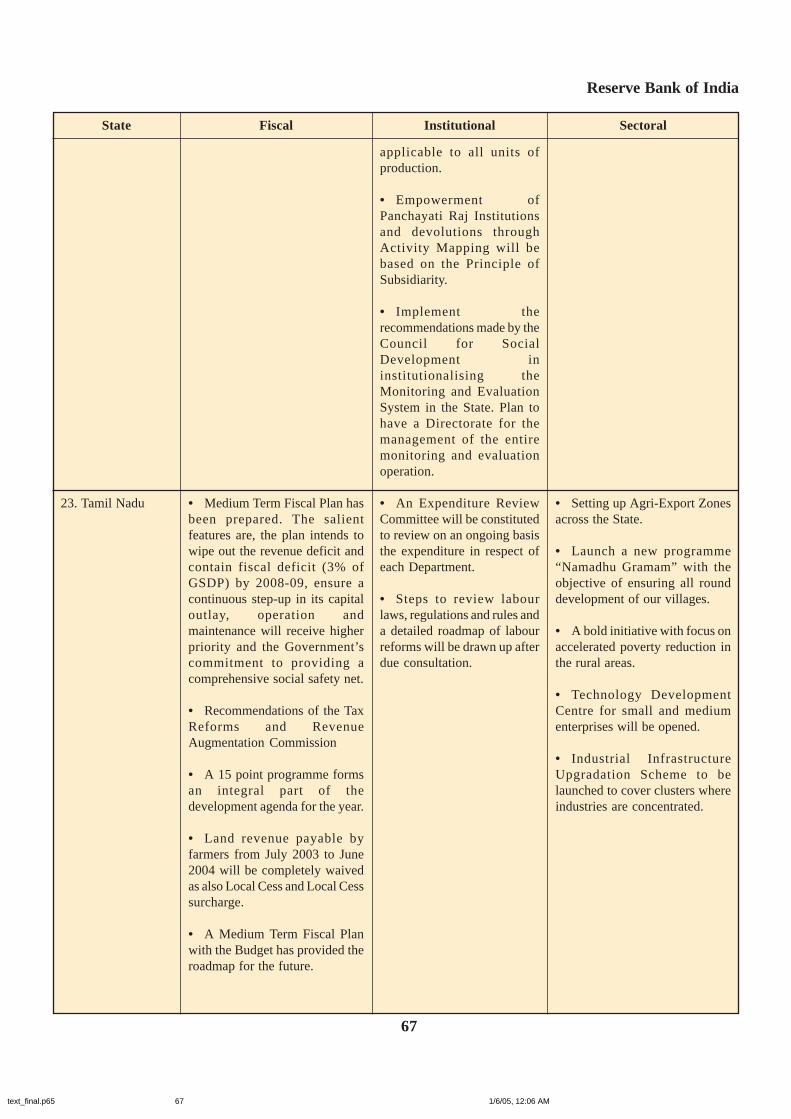
Reserve Bank of India
67
State Fiscal Institutional Sectoral
applicable to all units ofproduction.
• Empowerment ofPanchayati Raj Institutionsand devolutions throughActivity Mapping will bebased on the Principle ofSubsidiarity.
• Implement therecommendations made by theCouncil for SocialDevelopment ininstitutionalising theMonitoring and EvaluationSystem in the State. Plan tohave a Directorate for themanagement of the entiremonitoring and evaluationoperation.
• An Expenditure ReviewCommittee will be constitutedto review on an ongoing basisthe expenditure in respect ofeach Department.
• Steps to review labourlaws, regulations and rules anda detailed roadmap of labourreforms will be drawn up afterdue consultation.
23. Tamil Nadu • Medium Term Fiscal Plan hasbeen prepared. The salientfeatures are, the plan intends towipe out the revenue deficit andcontain fiscal deficit (3% ofGSDP) by 2008-09, ensure acontinuous step-up in its capitaloutlay, operation andmaintenance will receive higherpriority and the Government’scommitment to providing acomprehensive social safety net.
• Recommendations of the TaxReforms and RevenueAugmentation Commission
• A 15 point programme formsan integral part of thedevelopment agenda for the year.
• Land revenue payable byfarmers from July 2003 to June2004 will be completely waivedas also Local Cess and Local Cesssurcharge.
• A Medium Term Fiscal Planwith the Budget has provided theroadmap for the future.
• Setting up Agri-Export Zonesacross the State.
• Launch a new programme“Namadhu Gramam” with theobjective of ensuring all rounddevelopment of our villages.
• A bold initiative with focus onaccelerated poverty reduction inthe rural areas.
• Technology DevelopmentCentre for small and mediumenterprises will be opened.
• Industrial InfrastructureUpgradation Scheme to belaunched to cover clusters whereindustries are concentrated.
text_final.p65 1/6/05, 12:06 AM67
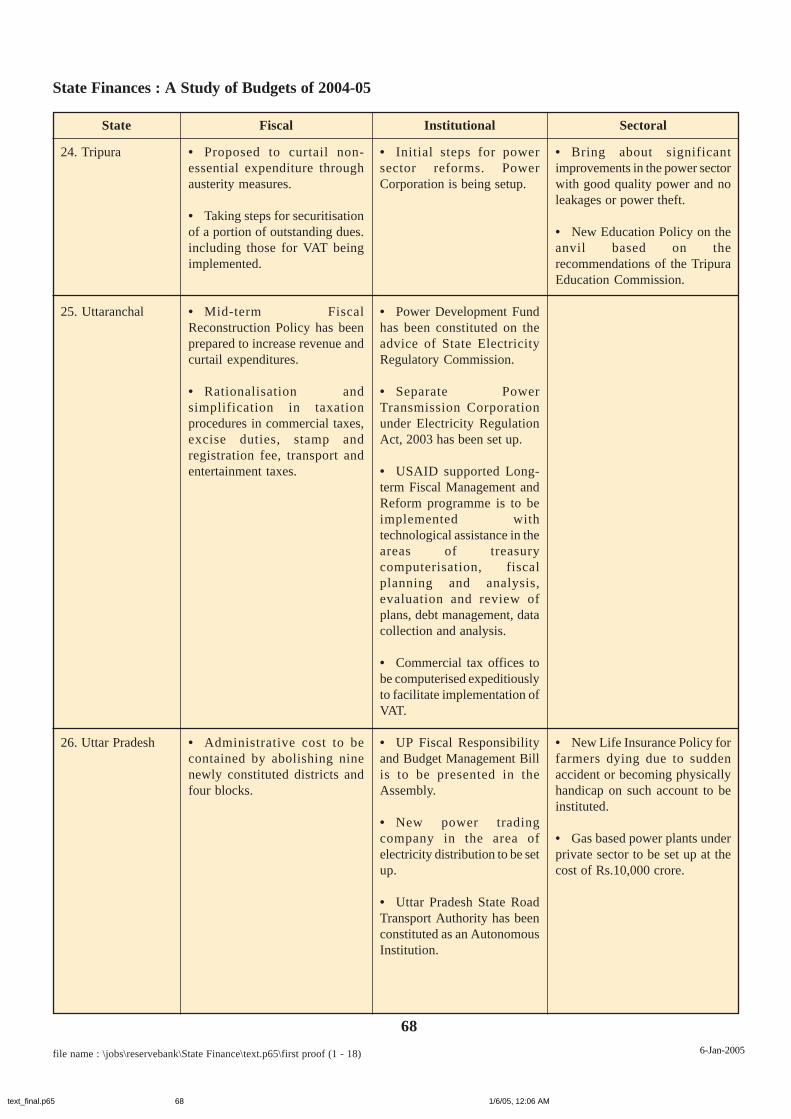
State Finances : A Study of Budgets of 2004-05
68
file name : \jobs\reservebank\State Finance\text.p65\first proof (1 - 18) 6-Jan-2005
State Fiscal Institutional Sectoral
24. Tripura
25. Uttaranchal
26. Uttar Pradesh
• Proposed to curtail non-essential expenditure throughausterity measures.
• Taking steps for securitisationof a portion of outstanding dues.including those for VAT beingimplemented.
• Mid-term FiscalReconstruction Policy has beenprepared to increase revenue andcurtail expenditures.
• Rationalisation andsimplification in taxationprocedures in commercial taxes,excise duties, stamp andregistration fee, transport andentertainment taxes.
• Administrative cost to becontained by abolishing ninenewly constituted districts andfour blocks.
• Initial steps for powersector reforms. PowerCorporation is being setup.
• Power Development Fundhas been constituted on theadvice of State ElectricityRegulatory Commission.
• Separate PowerTransmission Corporationunder Electricity RegulationAct, 2003 has been set up.
• USAID supported Long-term Fiscal Management andReform programme is to beimplemented withtechnological assistance in theareas of treasurycomputerisation, fiscalplanning and analysis,evaluation and review ofplans, debt management, datacollection and analysis.
• Commercial tax offices tobe computerised expeditiouslyto facilitate implementation ofVAT.
• UP Fiscal Responsibilityand Budget Management Billis to be presented in theAssembly.
• New power tradingcompany in the area ofelectricity distribution to be setup.
• Uttar Pradesh State RoadTransport Authority has beenconstituted as an AutonomousInstitution.
• Bring about significantimprovements in the power sectorwith good quality power and noleakages or power theft.
• New Education Policy on theanvil based on therecommendations of the TripuraEducation Commission.
• New Life Insurance Policy forfarmers dying due to suddenaccident or becoming physicallyhandicap on such account to beinstituted.
• Gas based power plants underprivate sector to be set up at thecost of Rs.10,000 crore.
text_final.p65 1/6/05, 12:06 AM68

Reserve Bank of India
69
State Fiscal Institutional Sectoral
• Uttar Pradesh Rural RoadAgency has been constitutedfor construction of rural roads.
• Consultants are finalizingthe report on restructuring of(Delhi Jal Board) DJB.Restructuring of DTC is beingexamined.
27. West Bengal
28. NCT Delhi
• It will be necessary to takesteps for appropriatedecentralisation in financialpowers and also inadministration.
• Emphasis on States’ ownresource mobilisation based onimproved method of collection incase of tax and non-tax revenues.
• Reduction of subsidies byincreasing efficiency and keepingthe growth in non-Planexpenditure within limits.
• Committed to the policy ofprogressive taxation.
• Property tax has beenintroduced by MCD.
• Decided to enhance financialassistance to local bodies from taxrevenue.
• Reinforce pro-people taxationpolicy while mobilising neededresources for infrastructuredevelopment and welfareprogrammes and simplificationand rationalisation of taxationsystem.
• Proposal to have change in thepoints of taxation.
• Special priority has beenplaced on land reforms in theState’s programme for alternativeeconomic reforms.
• Implementation of alternativepolicy of economic reforms forincreased employment generationthrough enhancement ofproduction in agriculture andallied sectors and in industry andexpansion of services.
• Special priority has beenaccorded to the universalisationof primary education.
text_final.p65 1/6/05, 12:06 AM69
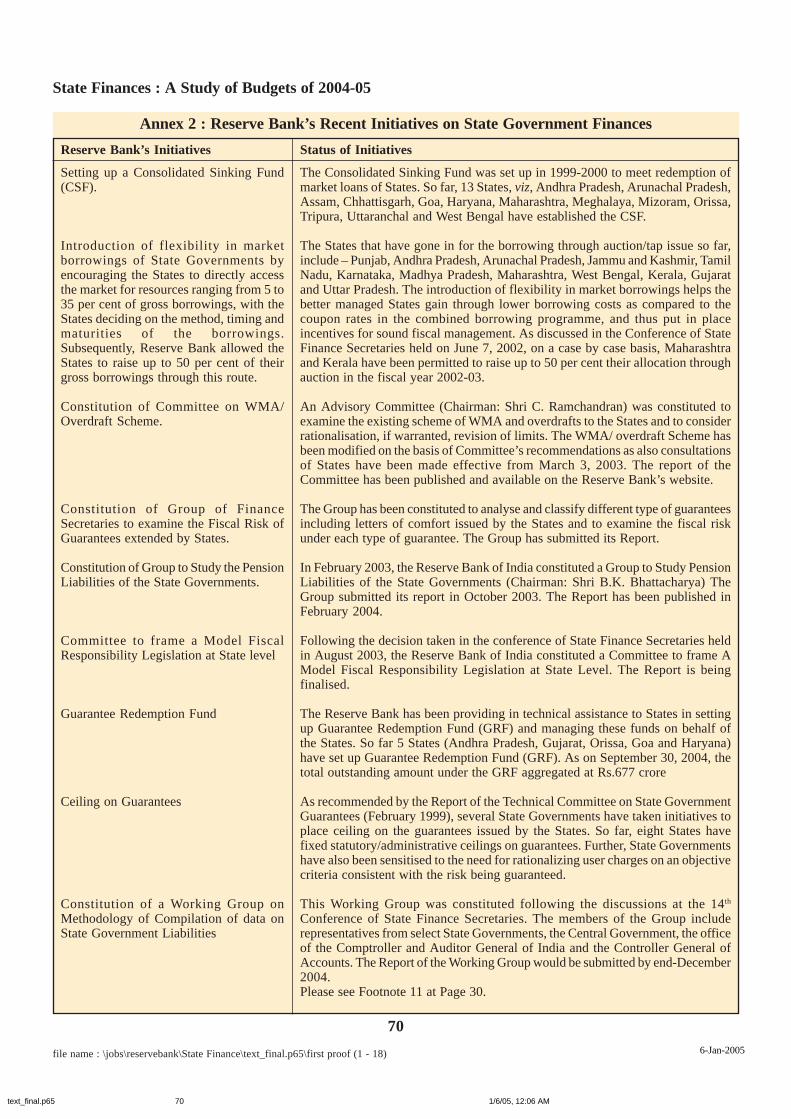
State Finances : A Study of Budgets of 2004-05
70
file name : \jobs\reservebank\State Finance\text_final.p65\first proof (1 - 18) 6-Jan-2005
Annex 2 : Reserve Bank’s Recent Initiatives on State Government Finances
Reserve Bank’s Initiatives
Setting up a Consolidated Sinking Fund(CSF).
Introduction of flexibility in marketborrowings of State Governments byencouraging the States to directly accessthe market for resources ranging from 5 to35 per cent of gross borrowings, with theStates deciding on the method, timing andmaturities of the borrowings.Subsequently, Reserve Bank allowed theStates to raise up to 50 per cent of theirgross borrowings through this route.
Constitution of Committee on WMA/Overdraft Scheme.
Constitution of Group of FinanceSecretaries to examine the Fiscal Risk ofGuarantees extended by States.
Constitution of Group to Study the PensionLiabilities of the State Governments.
Committee to frame a Model FiscalResponsibility Legislation at State level
Guarantee Redemption Fund
Ceiling on Guarantees
Constitution of a Working Group onMethodology of Compilation of data onState Government Liabilities
Status of Initiatives
The Consolidated Sinking Fund was set up in 1999-2000 to meet redemption ofmarket loans of States. So far, 13 States, viz, Andhra Pradesh, Arunachal Pradesh,Assam, Chhattisgarh, Goa, Haryana, Maharashtra, Meghalaya, Mizoram, Orissa,Tripura, Uttaranchal and West Bengal have established the CSF.
The States that have gone in for the borrowing through auction/tap issue so far,include – Punjab, Andhra Pradesh, Arunachal Pradesh, Jammu and Kashmir, TamilNadu, Karnataka, Madhya Pradesh, Maharashtra, West Bengal, Kerala, Gujaratand Uttar Pradesh. The introduction of flexibility in market borrowings helps thebetter managed States gain through lower borrowing costs as compared to thecoupon rates in the combined borrowing programme, and thus put in placeincentives for sound fiscal management. As discussed in the Conference of StateFinance Secretaries held on June 7, 2002, on a case by case basis, Maharashtraand Kerala have been permitted to raise up to 50 per cent their allocation throughauction in the fiscal year 2002-03.
An Advisory Committee (Chairman: Shri C. Ramchandran) was constituted toexamine the existing scheme of WMA and overdrafts to the States and to considerrationalisation, if warranted, revision of limits. The WMA/ overdraft Scheme hasbeen modified on the basis of Committee’s recommendations as also consultationsof States have been made effective from March 3, 2003. The report of theCommittee has been published and available on the Reserve Bank’s website.
The Group has been constituted to analyse and classify different type of guaranteesincluding letters of comfort issued by the States and to examine the fiscal riskunder each type of guarantee. The Group has submitted its Report.
In February 2003, the Reserve Bank of India constituted a Group to Study PensionLiabilities of the State Governments (Chairman: Shri B.K. Bhattacharya) TheGroup submitted its report in October 2003. The Report has been published inFebruary 2004.
Following the decision taken in the conference of State Finance Secretaries heldin August 2003, the Reserve Bank of India constituted a Committee to frame AModel Fiscal Responsibility Legislation at State Level. The Report is beingfinalised.
The Reserve Bank has been providing in technical assistance to States in settingup Guarantee Redemption Fund (GRF) and managing these funds on behalf ofthe States. So far 5 States (Andhra Pradesh, Gujarat, Orissa, Goa and Haryana)have set up Guarantee Redemption Fund (GRF). As on September 30, 2004, thetotal outstanding amount under the GRF aggregated at Rs.677 crore
As recommended by the Report of the Technical Committee on State GovernmentGuarantees (February 1999), several State Governments have taken initiatives toplace ceiling on the guarantees issued by the States. So far, eight States havefixed statutory/administrative ceilings on guarantees. Further, State Governmentshave also been sensitised to the need for rationalizing user charges on an objectivecriteria consistent with the risk being guaranteed.
This Working Group was constituted following the discussions at the 14th
Conference of State Finance Secretaries. The members of the Group includerepresentatives from select State Governments, the Central Government, the officeof the Comptroller and Auditor General of India and the Controller General ofAccounts. The Report of the Working Group would be submitted by end-December2004.Please see Footnote 11 at Page 30.
text_final.p65 1/6/05, 12:06 AM70
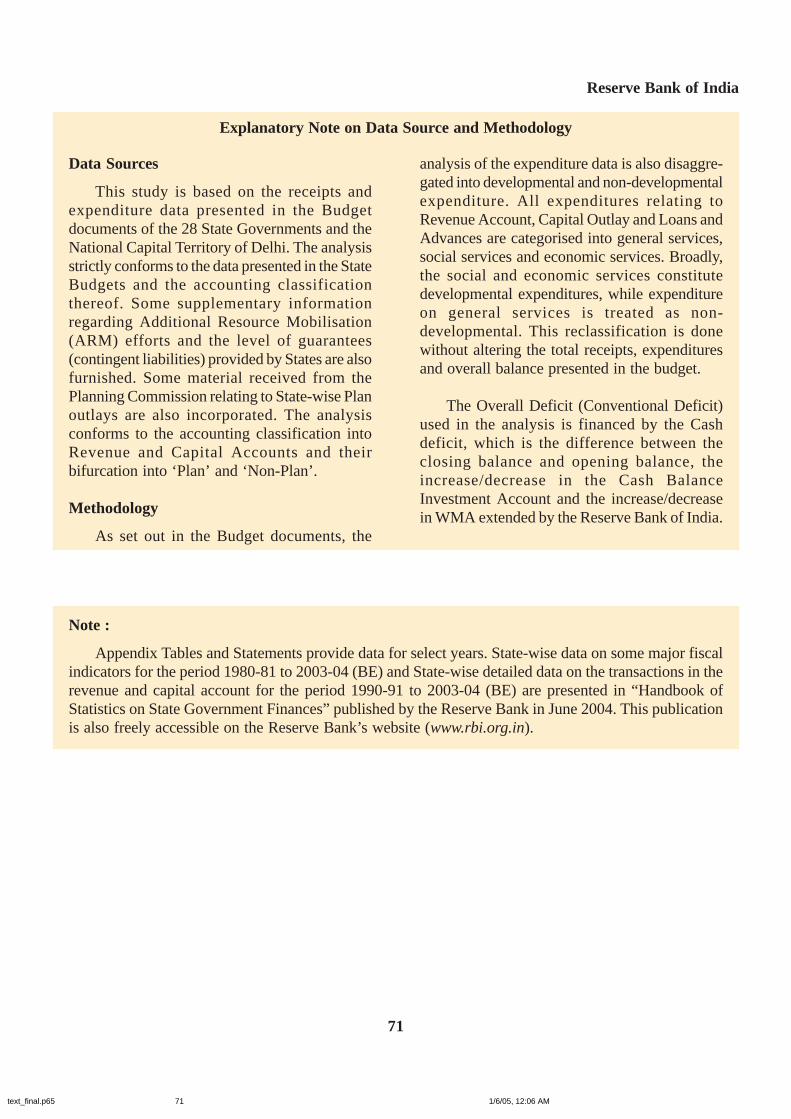
Reserve Bank of India
71
Explanatory Note on Data Source and Methodology
Data Sources
This study is based on the receipts andexpenditure data presented in the Budgetdocuments of the 28 State Governments and theNational Capital Territory of Delhi. The analysisstrictly conforms to the data presented in the StateBudgets and the accounting classificationthereof. Some supplementary informationregarding Additional Resource Mobilisation(ARM) efforts and the level of guarantees(contingent liabilities) provided by States are alsofurnished. Some material received from thePlanning Commission relating to State-wise Planoutlays are also incorporated. The analysisconforms to the accounting classification intoRevenue and Capital Accounts and theirbifurcation into ‘Plan’ and ‘Non-Plan’.
Methodology
As set out in the Budget documents, the
analysis of the expenditure data is also disaggre-gated into developmental and non-developmentalexpenditure. All expenditures relating toRevenue Account, Capital Outlay and Loans andAdvances are categorised into general services,social services and economic services. Broadly,the social and economic services constitutedevelopmental expenditures, while expenditureon general services is treated as non-developmental. This reclassification is donewithout altering the total receipts, expendituresand overall balance presented in the budget.
The Overall Deficit (Conventional Deficit)used in the analysis is financed by the Cashdeficit, which is the difference between theclosing balance and opening balance, theincrease/decrease in the Cash BalanceInvestment Account and the increase/decreasein WMA extended by the Reserve Bank of India.
Note :
Appendix Tables and Statements provide data for select years. State-wise data on some major fiscalindicators for the period 1980-81 to 2003-04 (BE) and State-wise detailed data on the transactions in therevenue and capital account for the period 1990-91 to 2003-04 (BE) are presented in “Handbook ofStatistics on State Government Finances” published by the Reserve Bank in June 2004. This publicationis also freely accessible on the Reserve Bank’s website (www.rbi.org.in).
text_final.p65 1/6/05, 12:06 AM71