
atlas note - atl-phys-pub-2015-051
14
ATL-PHYS-PUB-2015-051 02 December 2015 ATLAS NOTE ATL-PHYS-PUB-2015-051 2nd December 2015 Early Inner Detector Tracking Performance in the 2015 Data at √ s = 13 TeV The ATLAS Collaboration Abstract This note summarises the studies undertaken to recommend benchmark values and systematic uncertainties for various aspects of the ATLAS Inner Detector tracking based on √ s = 13 TeV proton-proton collisions from the Large Hadron Collider Run 2 data. The track reconstruction efficiency, fake rate, and related systematic uncertainties are presented for two different track quality selections, along with the impact parameter resolution and the alignment weak mode systematic uncertainities. These recommendations apply to physics analyses using Inner Detector tracks in Run 2 data and are important inputs for other objects based on tracks. © 2015 CERN for the benefit of the ATLAS Collaboration. Reproduction of this article or parts of it is allowed as specified in the CC-BY-3.0 license.
-
Upload
khangminh22 -
Category
Documents
-
view
2 -
download
0
Transcript of atlas note - atl-phys-pub-2015-051

ATL
-PH
YS-
PUB-
2015
-051
02D
ecem
ber
2015
ATLAS NOTEATL-PHYS-PUB-2015-051
2nd December 2015
Early Inner Detector Tracking Performance in the 2015 Data at√s = 13 TeV
The ATLAS Collaboration
Abstract
This note summarises the studies undertaken to recommend benchmark values and systematicuncertainties for various aspects of the ATLAS Inner Detector tracking based on
√s = 13TeV
proton-proton collisions from the LargeHadron Collider Run 2 data. The track reconstructionefficiency, fake rate, and related systematic uncertainties are presented for two different trackquality selections, along with the impact parameter resolution and the alignment weak modesystematic uncertainities. These recommendations apply to physics analyses using InnerDetector tracks in Run 2 data and are important inputs for other objects based on tracks.
© 2015 CERN for the benefit of the ATLAS Collaboration.Reproduction of this article or parts of it is allowed as specified in the CC-BY-3.0 license.

1 Introduction
The ATLAS detector [1] is a multi-purpose detector at the Large Hadron Collider (LHC). The InnerDetector (ID) [2] of the ATLAS experiment is responsible for efficiently and accurately measuring chargedparticle trajectories (tracks) in the region of ATLAS closest to the interaction point. This allows precisedetemination of the momentum and impact parameters (transverse and longitudinal distances of closestapproach to a reference point) of charged particles, as well as the positions of primary and secondaryvertices. It comprises three subsystems based on different detector technologies: the Pixel detector (Pixel),Semiconductor Tracker (SCT) and Transition Radiation Tracker (TRT).
During the first LHC Long Shutdown, the Pixel system underwent significant updates; a new smallerbeam pipe was installed together with a new innermost Pixel layer, called the Insertable B-Layer (IBL) [3]which allows measurements closer to the interaction point. In addition, new Pixel Service QuarterPanels [4], providing more robust service connections and allowing the recovery of a number of inactivepixel modules, were installed.
In this note, the studies undertaken to provide a recommended set of Inner Detector tracking performancebenchmarks are summarised. These recommendations provide information on appropriate working points(track selection criteria with well-understood performance) to be used in Run 2 physics analyses usingID tracks, along with the estimated systematic uncertainties from a variety of sources which should beapplied. The data set and simulation samples used for these studies and the selections applied to thereconstructed tracks are discussed in Sections 2 and 3, respectively. In Section 4 the track reconstructionefficiencies are presented for two different track quality selections. In Section 5 the fake rate evaluationis shown. In Sections 6 and 7 the alignment weak modes and impact parameter resolution analyses arediscussed, respectively.
2 Data Set and Simulation Samples
The results presented in this note were obtained by using data collected at the LHC in proton-protoncollisions at
√s = 13 TeV.
• For the fake rate study in Section 5 data taken between September and November 2015 are used,corresponding to an integrated luminosity of around 1.74 fb−1. In this period, the bunch spacingwas 25 ns and the average number of interactions per bunch crossing, µ, reached approximately 23.A zero-bias trigger1 was used to select the data events for study.
• The alignment weak mode measurements in Section 6 use data from the same period as above,selected using a logical OR of all physics triggers.
• The analysis of the impact parameter resolutions presented in Section 7 uses data taken in June2015, corresponding to an integrated luminosity of around 0.37 nb−1. In this period, the bunchspacing was 50 ns, and µwas approximately 0.005. The events used were selected by the minimumbias trigger, which requires hits in the Minimum Bias Trigger Scintillators [5].
1 This trigger selects events one LHC orbit after a reference trigger, to give a completeley unbiased sample of collision events.
2

Appropriate data quality requirements are applied to all data sets such that only events from periods withgood detector performance are included.
Monte Carlo (MC) models are used to evaluate the track reconstruction efficiency and to compare data tosimulation. The Pythia 8 [6] generator was used to produce samples for these studies. This generatoruses a model that splits the total inelastic cross section for inclusive hadron-hadron collisions into threecomponents: non-diffractive, single diffractive and double diffractive. The ATLAS minimum-bias tuneA2, based on MSTW2008LO PDF is used [7]. For studying the fake rate, a varying number of such eventswere overlaid on top of an ‘empty’ event, produced by simulating events containing single neutrinos, inorder to provide simulated ‘pile-up’ events (events containing multiple proton-proton interactions) witha range of values of µ. In addition, for impact parameter resolution and weak mode studies a sampleof Z bosons decaying into muon pairs was used. This sample was generated with Powheg [8–10] withdedicated modeling of single boson production [11], interfaced to Pythia 8 for showering. The detectorresponse is simulated in a detailed model implemented in geant4 [12].
The detector geometries used for the simulated samples are the standard geometry used as baseline for theproduction of MC simulation in 2015 (referred to as default) and an updated geometry which adds someadditional material to better model the physical IBL staves (referred to as updated). The difference in thetracking efficiency due to the changes between the two geometries has been evaluated to be negligible.The default geometry was used for the production of Monte Carlo samples unless otherwise specified.The uncertainty on the tracking efficiency is dominated by the knowledge of the ID material distribution,therefore, based on the ID material studies described in [13], a number of distorted geometries wereproduced and used in order to study this source of uncertainty:
• +5%Extra = same as default, but with 5% extra material uniformily distributed in the ID.
• +25%PixServExtra = same as default, but with 25% extra material uniformily distributed in the Pixel servicesregions.
• +50%PixServExtra = same as default, but with 50% extra material uniformily distributed in the Pixel servicesregions.
• +10%IBLExtra = same as updated, but with 10% extra material uniformily distributed in the IBL region.
3 Selection
Reconstructed tracks are selected by applying track quality criteria. Two sets of quality criteria are studiedin this note, based on transverse momentum (pT), pseudorapidity2 (η) and the number of hits in thesubsystems.
Loose
• pT > 400 MeV
• |η | < 2.5
2 ATLAS uses a right-handed coordinate system with its origin at the nominal interaction point (IP) in the centre of the detectorand the z-axis along the beam pipe. The x-axis points from the IP to the centre of the LHC ring, and the y-axis pointsupward. Cylindrical coordinates (r, φ) are used in the transverse plane, φ being the azimuthal angle around the beam pipe.The pseudorapidity is defined in terms of the polar angle θ as η = − ln tan(θ/2).
3

• Number of Pixel and SCT clusters on track (‘silicon hits’) ≥ 7
• Number of shared modules ≤ 1
• Number of silicon holes ≤ 2
• Number of pixel holes ≤ 1
Tight Primary (in addition to the Loose selection requirements)
• Number of silicon hits ≥ 9 (if |η | ≤ 1.65)
• Number of silicon hits ≥ 11 (if |η | ≥ 1.65)
• At least one hit on one of the two innermost pixel layers
• No pixel holes
A shared hit is a hit used by more than one track. A Pixel module is considered to be shared if it has one ormore shared hits. In the case of the SCT, a shared module has at least two shared hits3. Holes are definedas intersections of the reconstructed track trajectory with a sensitive detector element that do not result in ahit - essentially a ‘missing hit’ on a track. They are estimated by following closely the track trajectory andcomparing the hits-on-track with the intersected modules. Inactive modules or regions such as edge areason the silicon sensors are excluded from the hole definition. The tracks selected by the above workingpoints can have extensions into the TRT, but no explicit criteria are applied on the number of TRT hits.
The Loose track selection corresponds to the default track requirements applied during ‘inside-out’ trackreconstruction [14] and aims to obtain highly efficient charged particle reconstruction at the cost of anon-negligible fraction of fake tracks. The name Tight Primary reflects the fact that this set of criteria isdesigned and optimized for selecting primary tracks, which are defined in Section 4, and rejecting faketracks at the cost of a reduced track reconstruction efficiency. Further details are discussed in Sections 4and 5.
4 Tracking Efficiency
The track reconstruction efficiency is evaluated from simulation using a hit-based track-to-truth particleassociation to associate reconstructed tracks to primary particles [15]. Each of the clusters is associatedto the truth particle which has the largest energy deposition in the MC simulation. The clusters are thenweighted according to their importance in the track reconstruction: if the clusters are from the pixeldetector including IBL, the weight is set to 10 for each cluster. If they are from the SCT, the weight is setto 5 and if they are from the TRT, the weight is set to 1. A weighted matching probability Pmatch can bedefined using the ratio of the number of hits which are common to a given track and the correspondingtruth particle (Ncommon
Pixel, SCT, TRT) and the number of hits which form the track (N trackPixel, SCT, TRT):
Pmatch =10 · Ncommon
Pixel + 5 · NcommonSCT + 1 · Ncommon
TRT
10 · N trackPixel + 5 · N track
SCT + 1 · N trackTRT
. (1)
3 No requirement is made that the two hits should be on opposite sides of the double-sided modules.
4

The hit-matching technique is very robust since it exploits the relation between tracks and truth particles atthe geant4 energy deposition level and is mostly independent of the detector resolutions. A Pmatch > 0.5is required for a primary track.
Primary charged particles are defined as charged particles with a mean lifetime τ > 300 ps, either directlyproduced in proton-proton interactions or from decays of directly produced particles with mean lifetimeτ < 30 ps. Particles produced from decays of particles with τ > 30 ps are denoted secondary particlesand are excluded [15].
The tracking efficiency ε trk(pT, η) is then measured as a function of pT and η with the following defini-tion:
ε trk(pT, η) =Nmatched
rec (pT, η)Ngen(pT, η)
(2)
where pT and η are truth particle properties, Nmatchedrec (pT, η) is the number of reconstructed tracks matched
to truth charged particles and Ngen(pT, η) is the number of truth charged particles in that (pT, η) range.
The tracking efficiency for primary tracks is shown in Figure 1 as a function of pT and η for both Looseand Tight Primary selections, as defined in Section 3.
η2.5− 2− 1.5− 1− 0.5− 0 0.5 1 1.5 2 2.5
Tra
ck R
econ
stru
ctio
n E
ffici
ency
0.6
0.8
1
1.2
ATLAS = 13 TeVs
Simulation Preliminary Track Selections
Loose
Tight Primary
(a)
[GeV]T
p0 0.5 1 1.5 2 2.5 3 3.5 4 4.5 5
Tra
ck R
econ
stru
ctio
n E
ffici
ency
0.6
0.8
1
1.2
ATLAS = 13 TeVs
Simulation Preliminary Track Selections
Loose
Tight Primary
(b)
Figure 1: Track reconstruction efficiency, evaluated by using minimum bias simulated events, as a function of truthη (a) and pT (b) for Loose and Tight Primary track selections.The bands indicate the total systematic uncertainty.
The evaluated Tight Primary track reconstruction efficiency is overall lower (up to ∼ 10% for 1.5 ≤ |η | ≤2.5, ∼ 5% for |η | < 1.5 and ∼ 5% in the full pT range) than the Loose track reconstruction efficiencybecause of the more stringent requirements, but the Tight Primary selection improves fake rejection, asdetailed in Section 5. In general, the lower track reconstruction efficiency in the region |η | > 1 is due tothe increasing amounts of material that the particles must traverse. The slight increase in efficiency for|η | > 2 is due to the particles passing through a larger number of sensitive layers. Above pT ≥ 5 GeV, thetrack reconstruction efficiency reaches a plateau equal to ∼90% and ∼85% respectively for the Loose andTight Primary selections.
5

Track Reconstruction Efficiencies and Systematic UncertaintiesTrack Quality Selection Loose Tight Primary
η Range |η | ≤ 0.1 2.3 ≤ |η | ≤ 2.5 |η | ≤ 0.1 2.3 ≤ |η | ≤ 2.5Track Reconstruction Efficiency 91% 73% 86% 63%
Sys+5%Extra 0.4% 0.9% 0.5% 1.1%SysPixServExtra — 2.0% — 2.3%
Sys+30%IBLExtra 0.2% 0.5% 0.2% 0.5%Total Systematic Uncertainty 0.4% 2.2% 0.5% 2.6%
Table 1: Track reconstruction efficiencies and absolute systematic uncertainties for both Loose and Tight Primarytrack quality selections. Two η intervals were selected to demonstrate the range of the systematic uncertainties:|η | ≤ 0.1 (which is characterised by the lowest systematic uncertainty values) and 2.3 ≤ |η | ≤ 2.5 (which is charac-terised by the largest systematic uncertainty values). The total systematic uncertainty is estimated by quadraticallycombining the three different contrbutions: Sys+5%Extra(pT, η), SysPixServExtra(pT, η) and Sys+30%IBLExtra(pT, η). Theresults shown are obtained by integrating over pT in the range [0.4,20] GeV.
The accuracy with which the amount of material in the ID is known is the largest source of uncertaintyon the simulation-based estimate of the track reconstruction efficiency. There are currently three maincomponents to the systematic uncertainty (referred to as Sys+5%Extra(pT, η), SysPixServExtra(pT, η) andSys+30%IBLExtra(pT, η) in the following) designed to cover disagreements between data and MC simulationin the context of the ID material studies described in [13]. These components have been evaluated forboth Loose and Tight Primary selections as a function of pT and η by subtracting unity from the ratioof the track reconstruction efficiencies measured in the default and distorted geometry samples listed inSection 2:
SysExtraMaterial(pT, η) =ε
defaulttrk (pT, η)
εExtraMaterialtrk (pT, η)
− 1 (3)
where ExtraMaterial means +5%Extra, +25%PixServExtra, +50%PixServExtra or +10%IBLExtra.
The contributionSys+5%Extra(pT, η) is directlymeasured from the+5%Extra sample, to cover the systematicuncertainty due to an overall 5% material mis-modeling which is the assumed upper limit on the precisionwithwhich the Run 1material budget is known. Based on the hadronic interactions and photon conversionsstudies [13], the contribution Sys+10%IBLExtra(pT, η) corresponding to the results from the +10%IBLExtrasample, was increased by a factor of 3 to fully cover the disagreement between data and simulation,and so becomes Sys+30%IBLExtra(pT, η). An uncertainty denoted SysPixServExtra(pT, η) is applied in theregion with |η | > 1.5 to cover the data/simulation discrepancy in the forward region of the detector. For1.5 < |η | < 2.3, the full difference between the default and +50%PixServExtra samples is conservativelyused to evaluate this contribution to the systematic uncertainty, while, in the region |η | > 2.3, since themissing pixel services material is estimated to be in the order of 30% [13], it is necessary to carry outa linear interpolation between the +25%PixServExtra and +50%PixServExtra samples to evaluate theuncertainty.
The errors bars shown in Figure 1 represent the total systematic uncertainty obtained by combining inquadrature the three contributions discussed above. An overview of the track reconstruction efficiencyand the absolute values of the systematic uncertainties is shown in Table 1.
6
With a fraction higher than 98%, pions represent the dominant particle type in the simulation samplesused to evaluate the track reconstrunction efficiency. Therefore, since the track reconstruction efficiencyis sensitive to particle type, the above-described track systematic uncertainties are intended to be appliedto charged pions.
5 Fake Rate
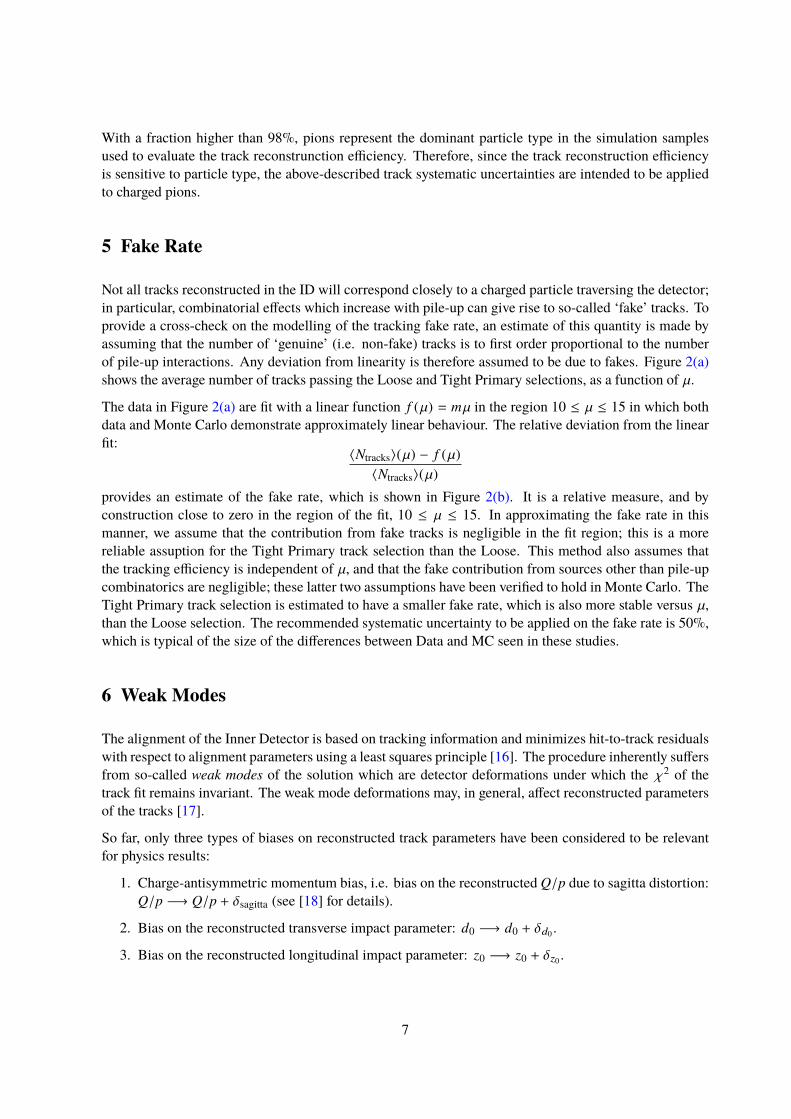
Not all tracks reconstructed in the ID will correspond closely to a charged particle traversing the detector;in particular, combinatorial effects which increase with pile-up can give rise to so-called ‘fake’ tracks. Toprovide a cross-check on the modelling of the tracking fake rate, an estimate of this quantity is made byassuming that the number of ‘genuine’ (i.e. non-fake) tracks is to first order proportional to the numberof pile-up interactions. Any deviation from linearity is therefore assumed to be due to fakes. Figure 2(a)shows the average number of tracks passing the Loose and Tight Primary selections, as a function of µ.
The data in Figure 2(a) are fit with a linear function f (µ) = mµ in the region 10 ≤ µ ≤ 15 in which bothdata and Monte Carlo demonstrate approximately linear behaviour. The relative deviation from the linearfit:
〈Ntracks〉(µ) − f (µ)〈Ntracks〉(µ)
provides an estimate of the fake rate, which is shown in Figure 2(b). It is a relative measure, and byconstruction close to zero in the region of the fit, 10 ≤ µ ≤ 15. In approximating the fake rate in thismanner, we assume that the contribution from fake tracks is negligible in the fit region; this is a morereliable assuption for the Tight Primary track selection than the Loose. This method also assumes thatthe tracking efficiency is independent of µ, and that the fake contribution from sources other than pile-upcombinatorics are negligible; these latter two assumptions have been verified to hold in Monte Carlo. TheTight Primary track selection is estimated to have a smaller fake rate, which is also more stable versus µ,than the Loose selection. The recommended systematic uncertainty to be applied on the fake rate is 50%,which is typical of the size of the differences between Data and MC seen in these studies.
6 Weak Modes
The alignment of the Inner Detector is based on tracking information and minimizes hit-to-track residualswith respect to alignment parameters using a least squares principle [16]. The procedure inherently suffersfrom so-called weak modes of the solution which are detector deformations under which the χ2 of thetrack fit remains invariant. The weak mode deformations may, in general, affect reconstructed parametersof the tracks [17].
So far, only three types of biases on reconstructed track parameters have been considered to be relevantfor physics results:
1. Charge-antisymmetric momentum bias, i.e. bias on the reconstructed Q/p due to sagitta distortion:Q/p −→ Q/p + δsagitta (see [18] for details).
2. Bias on the reconstructed transverse impact parameter: d0 −→ d0 + δd0 .
3. Bias on the reconstructed longitudinal impact parameter: z0 −→ z0 + δz0 .
7
µ5 10 15 20 25 30
⟩T
rack
sN⟨
100
200
300
400
500Loose Tracks, DataTight Primary Tracks, DataLoose Tracks, MCTight Primary Tracks, MC
µ5 10 15 20 25 30
Dat
a/M
C
0.80.91.01.11.2
LooseTight Primary
= 13 TeVs Preliminary, ATLAS
(a)
µ5 10 15 20 25 30
⟩T
rack
sN⟨
)µ f(− ⟩
Tra
cks
N⟨
0.05−
0
0.05
0.1
0.15
Loose Tracks, DataTight Primary Tracks, DataLoose Tracks, MCTight Primary Tracks, MC
= 13 TeVs Preliminary, ATLAS
(b)
Figure 2: Average number of reconstructed tracks as a function of µ for data and minimum bias simulation, applyingthe Loose and Tight Primary selections (a), and an estimation of the tracking fake rate, derived from the deviationfrom linearity of a fit to Ntracks as a function of µ (b). In (a), the statistical uncertainty on the mean number of tracksis considered, but are too small to be seen. The displayed µ range for data, in contrast to simulation, is limited bythe available µ values in the data sample.
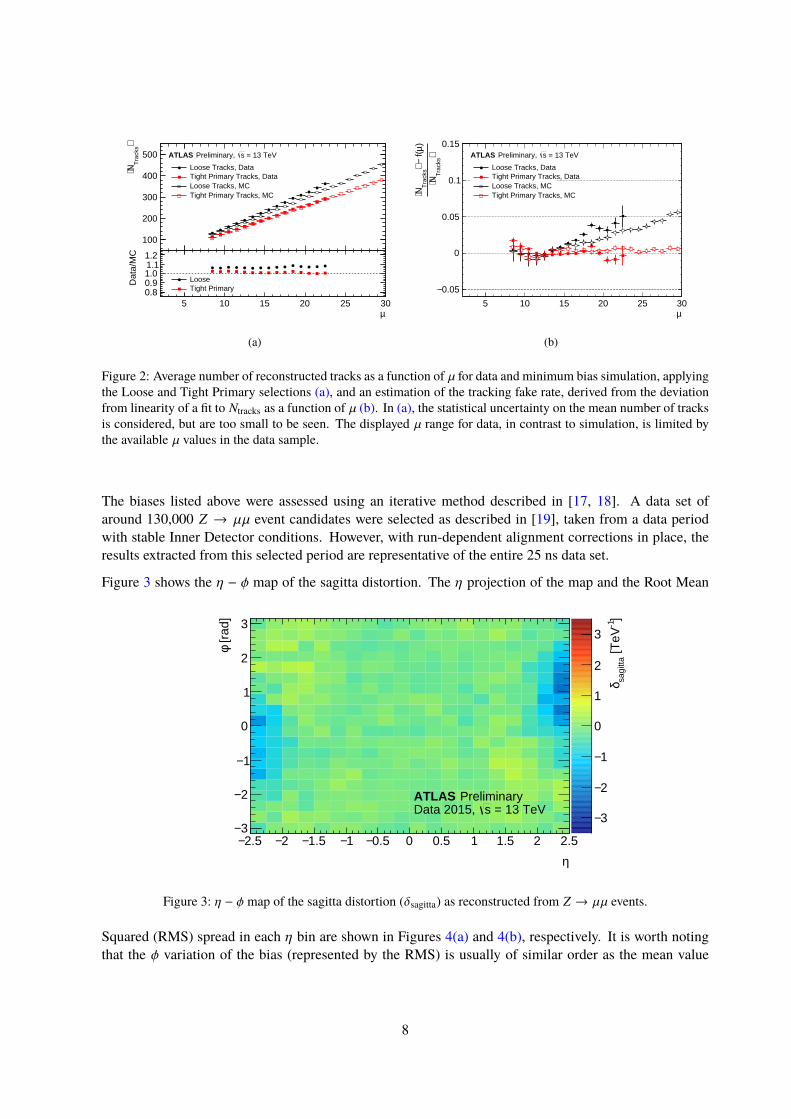
The biases listed above were assessed using an iterative method described in [17, 18]. A data set ofaround 130,000 Z → µµ event candidates were selected as described in [19], taken from a data periodwith stable Inner Detector conditions. However, with run-dependent alignment corrections in place, theresults extracted from this selected period are representative of the entire 25 ns data set.
Figure 3 shows the η − φ map of the sagitta distortion. The η projection of the map and the Root Mean
η
2.5− 2− 1.5− 1− 0.5− 0 0.5 1 1.5 2 2.5
[rad
]φ
3−
2−
1−
0
1
2
3 ]-1
[TeV
sagi
ttaδ
3−
2−
1−
0
1
2
3
ATLAS Preliminary = 13 TeVsData 2015,
Figure 3: η − φ map of the sagitta distortion (δsagitta) as reconstructed from Z → µµ events.
Squared (RMS) spread in each η bin are shown in Figures 4(a) and 4(b), respectively. It is worth notingthat the φ variation of the bias (represented by the RMS) is usually of similar order as the mean value
8

from the projection on η. When integrated over the entire ID acceptance, the mean sagitta distortionis -0.17 TeV−1, but the absolute value does not exceed 0.1 TeV−1 over a large part of the acceptance(|η | < 2).
η
2.5− 2− 1.5− 1− 0.5− 0 0.5 1 1.5 2 2.5
]-1
[TeV
sagi
ttaδ
Mea
n
1−
0.8−
0.6−
0.4−
0.2−
0
0.2
0.4
0.6
0.8
1ATLAS Preliminary
= 13 TeVsData 2015,
(a)
η
2.5− 2− 1.5− 1− 0.5− 0 0.5 1 1.5 2 2.5
]-1
[TeV
sagi
ttaδ
RM
S
0.1
0.2
0.3
0.4
0.5
0.6
0.7
0.8
0.9 ATLAS Preliminary = 13 TeVsData 2015,
(b)
Figure 4: Projection on η of the mean (a) and RMS spread (b) of the η − φ δsagitta distortion map (Figure 3).
Figures 5 and 7 show the analogous 2D maps for the δd0 and δz0 biases, respectively. Similarly, Figures 6and 8 show the mean value and RMS projections on η of the δd0 and δz0 biases, respectively.
η
2.5− 2− 1.5− 1− 0.5− 0 0.5 1 1.5 2 2.5
[rad
]φ
3−
2−
1−
0
1
2
3 m]
µ [0dδ
10−
8−
6−
4−
2−
0
2
4
6
8
10
ATLAS Preliminary = 13 TeVsData 2015,
Figure 5: η − φ map of the δd0 distortion as reconstructed from Z → µµ events.
The systematic effect due to the alignment-induced bias is assessed by altering the reconstructed tracksparameters using the above η − φ distortion maps.
9

η
2.5− 2− 1.5− 1− 0.5− 0 0.5 1 1.5 2 2.5
m]
µ [0dδ
Mea
n
8−
6−
4−
2−
0
2
4
6
8ATLAS Preliminary
= 13 TeVsData 2015,
(a)
η
2.5− 2− 1.5− 1− 0.5− 0 0.5 1 1.5 2 2.5
m]
µ [0dδ
RM
S
0
1
2
3
4
5
6ATLAS Preliminary
= 13 TeVsData 2015,
(b)
Figure 6: Projection on η of the mean (a) and RMS spread (b) of the η − φ δd0 distortion map (Figure 5).
η
2.5− 2− 1.5− 1− 0.5− 0 0.5 1 1.5 2 2.5
[rad
]φ
3−
2−
1−
0
1
2
3
[mm
]0zδ
0.2−
0.1−
0
0.1
0.2
ATLAS Preliminary = 13 TeVsData 2015,
Figure 7: η − φ map of the δz0 distortion as reconstructed from Z → µµ events.
η
2.5− 2− 1.5− 1− 0.5− 0 0.5 1 1.5 2 2.5
[mm
]0zδ
Mea
n
0.02−
0
0.02
0.04
0.06
0.08
0.1
0.12ATLAS Preliminary
= 13 TeVsData 2015,
(a)
η
2.5− 2− 1.5− 1− 0.5− 0 0.5 1 1.5 2 2.5
[mm
]0zδ
RM
S
0.01
0.02
0.03
0.04
0.05
0.06
0.07
0.08
0.09ATLAS Preliminary
= 13 TeVsData 2015,
(b)
Figure 8: Projection on η of the mean(a) and RMS spread (b) of the η − φ δz0 distortion map (Figure 7).
10

7 Impact Parameter Resolution
The transverse and longitudinal impact parameters, d0 and z0 respectively, are important to discriminatetracks originating from primary vertices from tracks originating from secondary vertices. The primaryvertices are used as the reference point for the distance of closest approach. The intrinsic resolutions ofthe track impact parameters with respect to the primary vertex are measured from data and simulation.To extrapolate the systematic uncertainty on the impact parameters to higher track pT, the results fromminimum bias simulation are compared with those using muon tracks from Z boson decays.
For minimum bias data and simulation, events are required to have a reconstructed primary vertex with atleast 10 tracks, while events with one or more additional reconstructed primary vertices with more than4 tracks are removed to reduce the influence of pile-up. For Z → µµ simulation, the event selection isdescribed in [19]. To extract the resolutions, the distribution of impact parameters is fitted within 2σ ofits mean with a Gaussian function for each bin in η and pT of tracks. In data, the width of the Gaussianfunction includes the contribution from the uncertainty on the position of the reconstructed primaryvertices. The intrinsic resolutions of tracks are obtained by deconvolving the primary vertex uncertaintyusing the iterative deconvolution procedure [20]. In simulation, the values of the resolutions are calculatedfrom the difference between the reconstructed impact parameters and those of the Monte Carlo truthparticles. The values of σ representing the intrinsic resolution are shown in Figure 9. The resolutionsfrom simulation with the nominal and June-2015 alignment [21] in Z → µµ configurations are alsoshown. The nominal alignment configuration represents a perfectly aligned detector, while the June-2015alignment configuration reproduces the uncertainties on this alignment by applying error scalings (random,Gaussian-distributed misalignments with their σ corresponding to the relevant alignment uncertainties)to the various detector components.
The d0 and z0 resolutions in both simulations agree with each other to within 20%. The difference ofthe resolutions between minimum bias data and simulation is taken to be the systematic uncertainty onthe impact parameter resolutions. The systematic uncertainties are obtained by taking the square root ofthe quadrature difference between data and simulation in regions where there are sufficient statistics. Aparameterization of the resolutions as a function of η and pT is used to extrapolate up to higher pT regionswhich are statistically limited. Z → µµ offers a cross-check of the validity of the extrapolations into theseregions.
8 Conclusions
The behaviour of several important aspects of Inner Detector tracking performance, specifically trackingefficiency, fake rate, alignment weak modes and impact parameter resolution, have been studied in 13 TeVLHC Run 2 data and Monte Carlo simulations. For the tracking efficiencies and fake rates, two workingpoints were considered: the Loose and Tight Primary track quality selections. Based on these studiesa series of benchmarks, including paramterizations of the metrics investigated and associated systematicuncertainties, have been derived.
11

[GeV]T
p
20 30 40 50 60 70 80 90 100
) [m
m]
0(dσ
5
10
15
20
25
30-310×
ATLAS Preliminary
= 13 TeVsMinbias MC reco-truth
Minbias data unfolded
Zmumu MC reco-truth (nominal)
Zmumu MC reco-truth (align syst)
(a)
[GeV]T
p
20 30 40 50 60 70 80 90 100)
[mm
]0
(zσ
0.02
0.04
0.06
0.08
0.1
0.12
0.14 ATLAS Preliminary
= 13 TeVsMinbias MC reco-truth
Minbias data unfolded
Zmumu MC reco-truth (nominal)
Zmumu MC reco-truth (align syst)
(b)
η-2 -1 0 1 2
) [m
m]
0(dσ
0
5
10
15
20
25
30
35
40-310×
ATLAS Preliminary
= 13 TeVs
< 25 GeVT
20 < p
Minbias MC reco-truth
Minbias data unfolded
Zmumu MC reco-truth (nominal)
Zmumu MC reco-truth (align syst)
(c)
η-2 -1 0 1 2
) [m
m]
0(zσ
0
0.02
0.04
0.06
0.08
0.1
0.12
0.14
0.16
0.18
0.2ATLAS Preliminary
= 13 TeVs
< 30 GeVT
20 < p
Minbias MC reco-truth
Minbias data unfolded
Zmumu MC reco-truth (nominal)
Zmumu MC reco-truth (align syst)
(d)
Figure 9: Unfolded transverse (a)(c) and longitudinal (b)(d) impact parameter resolution measured in data as afunction of pT and η, compared to the expectation from minimum bias and Z → µµ simulation. For simulation, theresolution is taken from the differences between the reconstructed and truth quantities (reco-truth) while for datathe resolution is derived by using the iterative deconvolution procedure. In the Z → µ+µ− simulation, the nominalshows the resolutions with perfect alignment configuration, while the align syst shows those with the June-2015alignment configuration, which reproduces the uncertainties on this alignment by applying Gaussian-distributedmisalignments to the various detector components. The d0 and z0 resolutions in both simulations agree with eachother to within 20%.
12

References
[1] ATLAS Collaboration, The ATLAS Experiment at the CERN Large Hadron Collider,JINST 3 (2008) S08003.
[2] ATLAS Collaboration, ATLAS inner detector: Technical Design Report, 1,Technical Design Report ATLAS, Geneva: CERN, 1997,url: https://cds.cern.ch/record/331063.
[3] ATLAS Collaboration, ATLAS Insertable B-Layer Technical Design Report,CERN-LHCC-2010-013. ATLAS-TDR-19, Geneva, 2010,url: https://cds.cern.ch/record/1291633.
[4] Y. Takubo,The Pixel Detector of the ATLAS experiment for the Run2 at the Large Hadron Collider,JINST 10.02 (2015) C02001, arXiv: 1411.5338 [physics.ins-det].
[5] A. Sidoti, Minimum Bias Trigger Scintillators in ATLAS Run II,Journal of Instrumentation 9.10 (2014) C10020,url: http://stacks.iop.org/1748-0221/9/i=10/a=C10020.
[6] T. Sjostrand, S. Mrenna and P. Z. Skands, A Brief Introduction to PYTHIA 8.1,Comput. Phys. Commun. 178 (2008) 852, arXiv: 0710.3820 [hep-ph],url: https://inspirehep.net/record/764903.
[7] ATLAS Collaboration, Summary of ATLAS Pythia 8 tunes, ATL-PHYS-PUB-2012-003, 2012,url: https://cds.cern.ch/record/1474107.
[8] P. Nason, A New method for combining NLO QCD with shower Monte Carlo algorithms,JHEP 11 (2004) 040, arXiv: hep-ph/0409146 [hep-ph],url: http://stacks.iop.org/1126-6708/2004/i=11/a=040.
[9] S. Frixione, P. Nason and C. Oleari,Matching NLO QCD computations with Parton Shower simulations: the POWHEG method,JHEP 11 (2007) 070, arXiv: 0709.2092 [hep-ph],url: http://inspirehep.net/record/760769.
[10] S. Alioli et al., A general framework for implementing NLO calculations in shower Monte Carloprograms: the POWHEG BOX, JHEP 06 (2010) 043, arXiv: 1002.2581 [hep-ph],url: http://inspirehep.net/record/845712.
[11] S. Alioli et al., NLO vector-boson production matched with shower in POWHEG,JHEP 0807 (2008) 060, arXiv: 0805.4802 [hep-ph],url: http://inspirehep.net/record/787440.
[12] Agostinelli, S, et al., Geant4 - a simulation toolkit,Nuclear Instruments and Methods A 506 (2003) 250,url: http://inspirehep.net/record/593382.
[13] ATLAS Collaboration,Studies of the ATLAS Inner Detector material using
√s =13 TeV pp collision data,
ATL-PHYS-PUB-2015-050, 2015, url: https://cds.cern.ch/record/2109010.[14] T. Cornelissen et al., The new ATLAS track reconstruction (NEWT),
J. Phys. Conf. Ser. 119 (2008) 032014,url: http://stacks.iop.org/1742-6596/119/i=3/a=032014.
13

[15] ATLAS Collaboration, Charged-particle distributions in√
s = 13 TeV pp interactions measuredwith the ATLAS detector at the LHC, ATLAS-CONF-2015-028, 2015,url: https://cds.cern.ch/record/2037701.
[16] ATLAS Collaboration,Common Framework Implementation for the Track-Based Alignment of the ATLAS Detector,ATL-SOFT-PUB-2014-003, 2014, url: https://cds.cern.ch/record/1670354.
[17] ATLAS Collaboration,Study of alignment-related systematic effects on the ATLAS Inner Detector tracking,ATLAS-CONF-2012-141, 2012, url: https://cds.cern.ch/record/1483518.
[18] ATLAS Collaboration, Alignment of the ATLAS Inner Detector and its Performance in 2012,ATLAS-CONF-2014-047, 2014, url: https://cds.cern.ch/record/1483518.
[19] ATLAS Collaboration, Study of the mechanical stability of the ATLAS Insertable B-Layer,ATL-INDET-PUB-2015-001, 2015, url: https://cds.cern.ch/record/2022587.
[20] ATLAS Collaboration,Tracking Studies for b-tagging with 7 TeV Collision Data with the ATLAS Detector,ATLAS-CONF-2010-070, 2010, url: http://cdsweb.cern.ch/record/1281352.
[21] ATLAS Collaboration,Alignment of the ATLAS Inner Detector with the initial LHC data at
√s = 13 TeV,
ATL-PHYS-PUB-2015-031, 2015, url: http://cds.cern.ch/record/2038139.
14


![Erratum to “Thermodynamic equilibrium conditions for mass varying particle structures”[Phys. Lett. B 684 (2010) 96]](https://static.fdokumen.com/doc/165x107/634093fc874853545a0976bc/erratum-to-thermodynamic-equilibrium-conditions-for-mass-varying-particle-structuresphys.jpg)