STATE CAPTURE VERSUS ADMINISTRATIVE CORRUPTION A COMPARATIVE STUDY FOR THE PUBLIC HEALTH SERVICE IN...
39
Electronic copy available at: http://ssrn.com/abstract=1438573 Electronic copy available at: http://ssrn.com/abstract=1438573 Electronic copy available at: http://ssrn.com/abstract=1438573 STATE CAPTURE VERSUS ADMINISTRATIVE CORRUPTION A COMPARATIVE STUDY FOR THE PUBLIC HEALTH SERVICE IN ROMANIA Prof. ANI MATEI Assist. Florin Marius POPA Faculty of Public Administration National School of Political Studies and Public Administration Bucharest, Romania Abstract The papers tackles, from an evolutive and comparative perspective, the general issue of the state capture and administrative corruption phenomena, with specific reference to the South Eastern European states, as well as to the assessment of the perception upon these phenomena in the public health service in Romania. In this regard, the paper mainly uses the theoretical framework developed by the World Bank and turns to account empirical studies from the field literature or developed by the authors, regarding the assessment of the mentioned corruption phenomenon, in a South Eastern European and Romanian context. The analysis and research demarche refers to the compatibility of the anticorruption strategies in Romania with the general framework of these strategies promoted by the World Bank. Unlike other existent empirical studies, the ones used by the authors propose a new method of assessment, based on statistical instruments and processing, of the state capture and/or administrative capture level. Key words: state capture, administrative corruption, influence, lobbying, anti-corruption strategies. 1
Transcript of STATE CAPTURE VERSUS ADMINISTRATIVE CORRUPTION A COMPARATIVE STUDY FOR THE PUBLIC HEALTH SERVICE IN...
Electronic copy available at: http://ssrn.com/abstract=1438573Electronic copy available at: http://ssrn.com/abstract=1438573Electronic copy available at: http://ssrn.com/abstract=1438573
STATE CAPTURE VERSUS ADMINISTRATIVE CORRUPTION A COMPARATIVE STUDY FOR THE PUBLIC HEALTH SERVICE
IN ROMANIA
Prof. ANI MATEI Assist. Florin Marius POPA Faculty of Public Administration National School of Political Studies and Public Administration Bucharest, Romania Abstract The papers tackles, from an evolutive and comparative perspective, the general issue of the state capture and administrative corruption phenomena, with specific reference to the South Eastern European states, as well as to the assessment of the perception upon these phenomena in the public health service in Romania. In this regard, the paper mainly uses the theoretical framework developed by the World Bank and turns to account empirical studies from the field literature or developed by the authors, regarding the assessment of the mentioned corruption phenomenon, in a South Eastern European and Romanian context. The analysis and research demarche refers to the compatibility of the anticorruption strategies in Romania with the general framework of these strategies promoted by the World Bank. Unlike other existent empirical studies, the ones used by the authors propose a new method of assessment, based on statistical instruments and processing, of the state capture and/or administrative capture level. Key words: state capture, administrative corruption, influence, lobbying, anti-corruption strategies.
1

Electronic copy available at: http://ssrn.com/abstract=1438573Electronic copy available at: http://ssrn.com/abstract=1438573Electronic copy available at: http://ssrn.com/abstract=1438573
Introduction State capture represents o form of corruption. Introduced by Hellman and Kaufmann (2001), the state capture concept represents the process through which “firms make private payments to public officials to influence the choice and design of laws, rules and regulations”1. In itself, the concept, as well as its multiple expressing forms, was tackled by several specialists on the corruption analysis issue. Bardhan and Mookherjee (2000) explore the effects of federalism on capture, and find that electoral decentralization makes this problem worse. “In a sense, interest groups are more cohesive at the local level, hence they are better positioned to finance politicians’ favours or “buy” laws”2. Hellman, Jones and Kaufamnn (2000) make a complex analysis of the way in which these are capable of creating their own rules of the game in relation with the state’s institutions. The authors empirically investigate the dynamics of the capture economy on the basis of new firm-level data from the 1999 Business Environment and Enterprise Performance Survey (BEEPS), which permits the unbundling of corruption into meaningful and measurable components. The state capture concept is included in the World Bank’s studies in a broader environment of the state’s actions of corruption. The state corruption comprises the designing of laws, rules and decrees by a large number of state institutions, including the executive, the ministers and the state agencies, the legislative an the judiciary. At the same time, state corruption has a more narrow definition that exclusively focuses upon the illicit, illegal, and non-transparent forms of influence. Who can corrupt the state? Often “the corrupters” are persons, groups or private sector companies that are looking for tax exemptions or other advantages from the state. Nevertheless, any of the stakeholders, who have access to the public officials and to the capacity to ensure private benefits for these officials in order to obtain advantages in the governance process, can be a potential corrupter. In truth, public officials themselves can corrupt the state if they abuse their authority in order to give deform the institutions and laws, mainly to follow their own financial interests, in spite of disadvantage the public interest, though the identification and the exact measurement of some interest conflicts are almost impossible to accomplish in the context of transition. The influence of the private interests upon the state’s decisions is a specific feature of all the political systems. What differentiates the state corruption as a form of corruption from the conventional forms of the political influence, like lobbying, are the mechanisms through which the private interests interact with the state. The state corruption takes place by illicitly ensuring private gains to the public officials through informal, non-transparent and obviously preferential channels of access. It also takes place in the absence of some clear borders between the political interests and the business interests of the state officials, which represented a prominent feature of many countries in transition. In all its forms, the state corruption tends to undermine or even substitute the legitimate a transparent channels of political influence and of interests’ intermediation, reducing the access of groups and competent interests to the state officials. The forms of state corruption differentiated after the corrupters’ type (e.g.
1 Hellman, J., Kaufmann, D., (2001), “Confronting the Challenge of State Capture in Transition Countries”, Finance and Development, vol. 38, no. 3, September, p.1. 2 Bardhan, P., Mookherjee, D., (2000), “Capture and governance at local and national level”, American Economic Review, 90(2), pp. 135-9, taken from Rose-Ackerman (2006), pp.152.
2

Electronic copy available at: http://ssrn.com/abstract=1438573Electronic copy available at: http://ssrn.com/abstract=1438573Electronic copy available at: http://ssrn.com/abstract=1438573
private firms, politicians, ethnic groups, and army) and the different state institutions involved (e.g. the executive, legislative and judiciary branch, or other authorised institutions) will certainly have their own dynamics and consequences. Thus, the state corruption in itself can present a broad area of different relations. The reduction of state corruption involves the state removing the private sector’s influence in policy-making, rules and laws formulations. In truth, such an influence can be an important factor that accelerates both the political reform and the economic one. This problem will not be solved neither through the authentication of private payments for the public officials. The reduction of state corruption rather involves the change of the private sector’s influence from illicit, non-transparent and obviously preferential of the access channels into competitive forms of interests’ intermediation. Also, it involves the development of clearer border between the political roles and the business roles of the state officials in order to prevent the conflicts of interest.
3

Chapter I State capture, influence and lobbying “They contrast state capture (firms shaping and affecting formulation of the rules of the game through private payments to public officials and politicians) with influence (doing the same without recourse to payments) and with administrative corruption (“petty” form of bribery in connection with the implementation of laws, rules, and regulation)”3. According to the mentioned authors, the state capture, the influence and the administrative corruption have abstract causes and consequences. Significant aspects are emphasised for the large companied that benefit from close official connections and inherit the previous influence, which became traditional influence. For the new companies that plan to compete with the traditional ones, state capture becomes a strategic choice, as an innovation substitute to compensate the weaknesses of the juridical and regulation framework. The intervention of the latter happens when the public goods are underprovided and, by using the “pirate” competition they will directly acquire directly from the state forms such private benefits like the property rights, removal of obstacles aiming at public performance, etc. The empirical researches enclosed in the mentioned paper have showed that the administrative corruption, unlike the state capture or the influence, is not associated with specific benefits for the firms4. Kaufmann, Hellman, Jones and Schankerman (2000) tackle the link between the corporate governance and the business environment, corroborating the above mentioned issue with that of measuring the government performance. A topic insufficiently explained in the authors’ view, until the moment analysed by them, is materialised through a study regarding the assessment of governance and corruption as viewed by the firms. “Particular attention is paid to state capture by parts of the corporate sector (i.e. the propensity of firms to shape the underlying “rules of the game” including “purchase” of legislation and court decisions”5. The sociologic growth “also provides measures of other dimensions of “grand corruption”, such as that related to public procurement”6. Without confusing lobbying with the influence introduced by Hellman, Jones and Kaufmann (2000), Begovic (2005) make a comparative analysis of the corruption and lobby effects regarding the social welfare seen as an alternative method of state capture. Following Appelbaum and Katza (1987) as well as Lambsdorff (2002), Begovic (2005) refer to a relation between transfers and the total costs of the state capture (rent-seeking) can be specified as:
xcz )1( −= (1)
3 Hellman, J., James, G., Kaufmann, D., (2000), “Seize the State, Seize the Day, State Capture and Influence in Transition Economies”, World Bank Policy Research Working Paper, no. 2444, pp. 1-2. 4 Idem, pp. 2. 5 Kaufmann, D., Hellman, J.S., Jones, G., Schankerman, M.A., (2000), “Measuring Governance, Corruption, and State Capture: How Firms and Bureaucrats Shape the Business Environment in Transition Economies”, World Bank Policy Research Paper no. 2312, pp.1. 6 Idem 6.
4

Where x stands for total costs of state capture by an interested party, z – for the total transfer of welfare to the legislation and c is a parameter which stands for transaction costs, that is, the costs of the transfer. Parameter c takes the values:
10 ≤≤ c (2) So that in case c=0 there is pure corruption, i.e. a transfer without any costs, and in case c=1 there is pure lobbying without any transfer of wealth/welfare from an interest group to a legislative7. For the economies in transition, like the one of Romania, the state capture phenomenon is more spread due to the high level of concentration of the economy, its structure as well as the low mobility of the labour force, both horizontally and vertically. (Sonin (2009)). I.1 State Capture Index The index has been used for the first time by Hellman, Jones, and Kaufmann (2000). The index has as base the empirical investigation the dynamics of the capture economy on the basis of new firm-level data from the 1999 Business Environment and Enterprise Performance Survey (BEEPS), as part of World Business Environment Survey. The results of this survey are presented in Hellman, Jones, Kaufmann, and Schankerman (2000).
To construct an index of the capture economy, firm were asked to asses the extent to which the following six types of activities have had a direct impact on their business:
the sale of Parliamentary votes on laws to private interests; the sale of Presidential decrees to private interests; Central Bank mishandling of funds; the sale of court decisions in criminal cases; the sale of court decisions in commercial cases; illicit contributions paid by private interests to political parties and
election campaigns. From the analysis of the data follows that states which do not adopt measures
such as privatization, reducing the state participation in economy, liberalization of the market, thus with underdeveloped private sector have few chances to know the phenomenon of state capture.
7 Begovic, B., (2005), “Corruption, Lobbying and State Capture”, CLDS Working Paper #0106, March, pp. 11.
5

Chapter II State capture, administrative corruption and the anticorruption strategies8
The relation between state capture and administrative corruption, in better words, its intensity, represents the basis of the conception for many anticorruption strategies. Defined by Hellman and Kaufmann (2001)9, with reverberations especially in transition economies, state capture refers to the actions of individuals, groups, or firms both in the public and private sectors to influence making of laws, regulations, decrees, and other government policies to their own advantage as a result of the illicit and non-transparent provision of private benefits to public officials. Types of institutions subject to capture:
the legislature, the executive, the judiciary, or regulatory agencies.
Types of actors engaged in the capturing: private firms, political leaders, or narrow interest groups.
Yet all forms of state capture are directed toward extracting rents from the state for a narrow range of individuals, firms, or sectors through distorting the basic legal and regulatory framework with potentially enormous losses for the society at large. They thrive where economic power is highly concentrated, countervailing social interests are weak, and the formal channels of political influence and interest intermediation are underdeveloped. On the other hand, administrative corruption refers to the intentional imposition of distortions in the prescribed implementation of existing laws, rules, and regulations to provide advantages to either state or non-state actors as a result of the illicit and non-transparent provision of private gains to public officials. Examples of administrative corruption: bribes to a seemingly endless stream of official inspectors to overlook minor (or possibly major) infractions of existing regulations; “grease payments” as bribes to gain licenses, to smooth customs procedures, to win public procurement contracts, or to be given priority in the provision of a variety of other government services; state officials can simply misdirect public funds under their control for their own or their family’s direct financial benefit. At the root of this form of corruption is discretion on the part of public officials to grant selective exemptions, to prioritize the delivery of public services, or to discriminate in the application of rules and regulations. (Figure I.1)
8 The chapter follows the ideas from Matei, L., Matei, A., (2009), “Corruption in the Public Organizations – Towards a Model of Cost-Benefit Analysis for the Anticorruption Strategies”, available at SSRN: http://ssrn.com/abstract=1405209 9 Hellman, J., Kaufmann, D., (2001), “Confronting the challenge of state capture in transition economies”, Finance and Development, Vol. 38, No. 3, Sept., IMF, pp. 5-8.
6

Figure I.1 Multi -pronged Strategy: Addressing State Capture and Administrative Corruption10
To be effective, a multi-pronged approach requires some guidelines for the selection and sequencing of reform priorities tailored to the particular contours of the corruption problem in each country. The typology can be divided into four spheres determined by the relative levels of state capture and administrative corruption: • Countries within the medium-medium category have been able to contain both types of corruption to more manageable levels, though serious challenges remain. • In the medium-high category are countries where the problem of administrative corruption remains the central problem, while the state has been less subject to capture by the private sector than other transition countries. • The high-medium category includes countries that have been able to contain the level of administrative corruption relative to other transition countries, but nevertheless have done so in a context of high state capture. • In the high-high category, a serious problem of administrative corruption—and hence, weak state capacity—is nested in a state highly subject to capture.
10 The World Bank, (2000), “Anticorruption in Transition. A Contribution to the Policy Debate”, chapter 4, p. 39, Washington D.C.
7

8
II.2 World Bank: Designing Effective Anticorruption Strategies11
The strategies are based on the studies and field analyses carried out even by the World Bank or prestigious authors for the topic on combating corruption. The actual strategy offers “a framework for self-assessment of corruption within each country rather than a device for providing a fixed reform blueprint for each country in the region”. At the same time, “a key argument embedded in the typology is that an anticorruption strategy should be designed not only in response to the level of either state capture or administrative corruption alone in a given country, but to the interaction of these forms of corruption as well”12. In the context of the above documentary sources, Figure I.2 presents a synthesis of the key focus, challenges and priorities for each typology of the relation state capture-administrative corruption.
11 The World Bank, (2000), “Anticorruption in Transition. A Contribution to the Policy Debate”, chapter 5, pp. 58-78, Washington D.C. 12 Idem, p.59
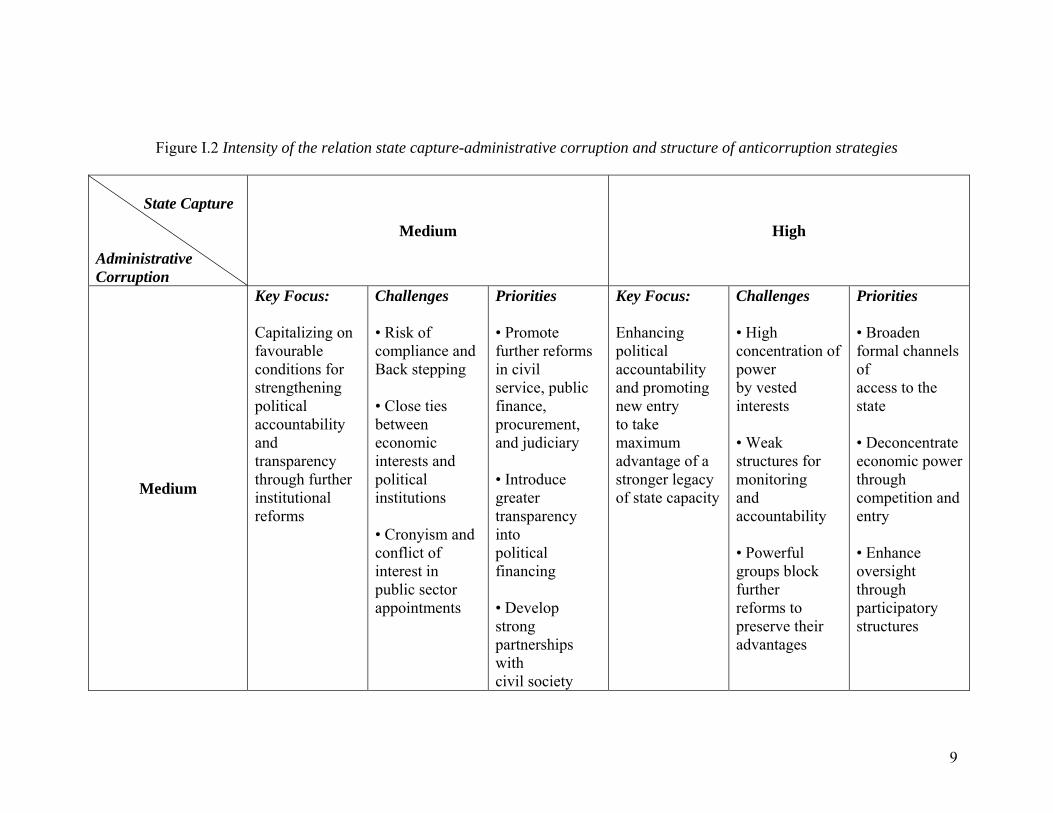
Figure I.2 Intensity of the relation state capture-administrative corruption and structure of anticorruption strategies
State Capture Administrative Corruption
Medium High
Medium
Key Focus: Capitalizing on favourable conditions for strengthening political accountability and transparency through further institutional reforms
Challenges • Risk of compliance and Back stepping • Close ties between economic interests and political institutions • Cronyism and conflict of interest in public sector appointments
Priorities • Promote further reforms in civil service, public finance, procurement, and judiciary • Introduce greater transparency into political financing • Develop strong partnerships with civil society
Key Focus: Enhancing political accountability and promoting new entry to take maximum advantage of a stronger legacy of state capacity
Challenges • High concentration of power by vested interests • Weak structures for monitoring and accountability • Powerful groups block further reforms to preserve their advantages
Priorities • Broaden formal channels of access to the state • Deconcentrate economic powerthrough competition and entry • Enhance oversight through participatory structures
9

High
Key Focus : Enhancing state capacity to improve the provision of basic public goods.
Challenges • Highly underdeveloped public administration • Lack of control and accountability within the state • Nascent civil society
Priorities • Build the capacity of public administration • Develop instruments for financial management • Encourage civil society development
Key Focus: Breaking the hold of vested interests on the process of policy and institutional reform
Challenges • Highly concentrated economic interests that can block reforms • Limited implementation capacity of Government • Poorly organized anticorruption constituencies • Restricted channels of access for countervailing interests
Priorities • Deconcentrate economic interests through restructuring, competition and enhanced entry • Build accountability and oversight mechanisms • Promote collective action among countervailing interests • Stand-alone technocratic reforms will have limited impact
10

II.3 Anti- state capture strategies in South Eastern Europe Hellman (2002) analyses the specific situation of the countries in transition with regard to the size of the state capture phenomenon. By making every time the necessary links with the administrative corruption, the author mentions for those countries, Romania included, some “very serious issues”13: • the lack of a stable system for public financing; • weak levels of collective action and of social organisation; This fact is the result of the post-communist heritage, of the discrediting of the collective interests and, therefore, the emergence of some interest groups. • The market is dominated by very large stakes, for which the rules of the game are
altered. This situation is due to the fact that the transition concentrates important issues of redistribution of property, design of new laws, building new institutions as well as establishing the regulation framework.
• The market for influence is virtually unregulated; This refers to the fact that the incipient stage of the financing policy-making, conflict of interest, freedom of information, lobby etc. • Increasing competition on the influence market determined by the emergence of new
financial and industrial groups, as well as the introduction of some anti-competitive rules/ obstacles.
• The reform process of the policies also becomes the attribute of state capture, which does not limit only to monopolising some channels of influence and it even occupies the field of public policy-making in relation to group or individual interests.
• Strengthening the regulation and monitoring process of public financing. It can be said that there is a “market of the state capture” in which there is both a buyer and a seller of influence. In perspective, this “market” must be regulated through clear norms that can be successfully applied by the public authorities in the process of monitoring the borders between money and politics.
With reference to the administrative corruption, Hellman (2002) focuses upon some mechanisms that proved to be useful for the fight against corruption. From these, the author describes14:
• Point-of-service evaluation surveys (POSEs); • Deregulation monitoring surveys; • Scorecards; • Corruption impact assessments.
II.3.1 The assessment of state capture/administrative corruption in South Eastern Europe For the states in the South Eastern Europe the studies for assessing the state capture phenomena are not that many. Correlating these with administrative corruption, for which the World Bank, Transparency International, etc. provide annual assessments, can lead to more real images of the corruption in South Eastern Europe, and not only. Kaufmann et al. (2000) emphasise the results of a broad research, for the transition
13 Hellman, J., (2002), op.cit., pp. 3-6. 14 For details see Hellman (2002), Op.cit., pp. 8-10.
11

economies, of the perception inside the business environment of the state capture and administrative corruption phenomena. On the basis of a sample comprising 3000 companies from 20 countries, the conclusions point out, for many of the South Eastern European states, alarming results. The forms of corruption15 are synthesised in Table II.1. Table II.1 Forms of corruption with an impact upon the business environment
Type Forms of corruption State capture • Sale of Parliamentary votes on laws to
private interests; • Sale of Presidential decrees to private
interests; • Central Bank mishandling of funds; • Sale of court decisions in criminal
cases; • Sale of court decisions in arbitration
cases; • Contributions paid by private interests
to political parties and election campaigns.
Administrative corruption • Patronage, defined as public officials hiring their friends and relatives to official positions;
• Bribes paid to public officials to avoid taxes and regulations.
In the paper, there are also presented the level of the Parliament capture, presidential or Central Bank capture. For some states in South Eastern Europe some illustrative data16 are presented below in order to provide a comparative basis regarding the state capture levels, and the ones of administrative corruption.
15 Idem 6, pp.21. 16 The data are extracted from the synthesis and figures in Kaufmann et al. (2000), op.cit., pp. 21-24.
12

Figure II.1.a Legislative Capture for the South Eastern European states
0
5
10
15
20
25
30
35
40
45
Bulgaria Belarus Croatia Moldova Romania Russia Slovenia Ukraine
Figure II.1.b Presidential Capture for the South Eastern European states
0
5
10
15
20
25
30
35
40
Bulgaria Belarus Croatia Moldova Romania Russia Slovenia Ukraine
It can be observed that the percentages showing major or moderate obstacles vary between 10-25%, except Russia with 38% and Ukraine with 48%.
13

Figure II.2 Central Bank Capture for South Eastern European states
0
5
10
15
20
25
30
35
40
45
50
Bulgaria Belarus Croatia Moldova Romania Russia Slovenia Ukraine
There are similarities in the perception of the business environment upon the Legislative and/or Presidential Capture and the Central Bank Capture, the levels indicated in the two figures emphasising similar evolutions. Figure II.3.a Legal Capture – sale of court decisions in criminal cases
0
5
10
15
20
25
30
35
Bulgaria Belarus Croatia Moldova Romania Russia Slovenia Ukraine
14

Figure II.3.b Legal Capture - sale of court decisions in commercial cases
0
5
10
15
20
25
30
35
Bulgaria Belarus Croatia Moldova Romania Russia Slovenia Ukraine
As resulted from Figure II.1. The legal capture refers to the sale of court decisions in criminal and arbitration court cases. The assessments are between 5-18%, except for Croatia (35%), Moldova (38%), Russia (29%) and Ukraine (27%). Figure II.4 Non transparent political party finance
0
5
10
15
20
25
30
35
40
45
Bulgaria Belarus Croatia Moldova Romania Russia Slovenia Ukraine
The evaluations presented in Figure II.4 refer to the contributions by private interests to political parties and election campaigns and it is, on average, between 5-42%, with Bulgaria and Moldova at the highest level (42%). On the basis of the elements presented before we computed a composite index of state capture that also varies between 8-38% (see Table II.2).
15

With reference to the forms of corruption emphasised in Table II.1, relevant for the administrative corruption, the perception of the business environment upon what the author calls “patronage” is presented in Figure II.5. Figure II.5 The perception of the business environment upon the patronage in the South Eastern European states
0
5
10
15
20
25
30
35
40
Bulgaria Belarus Croatia Moldova Romania Russia Slovenia Ukraine
Here also it can be observed that there are major discrepancies varying between 12% (Belarus, Slovenia) and 43% (Bulgaria). The petty corruption, meaning bribes to public officials to avoid taxes and regulations is the most prevailing form of administrative corruption. Their perception varies from 9% (Slovenia) to 40% (Romania). The two forms of administrative corruption have, on average, similar evolutions for each state. Going back to the composite index of state capture, in Table II.2 there are presented in synthesis both the indices for each type of capture, correlated with the administrative corruption, and the classification according to the intensity of the relation between state capture and administrative corruption17 (acc. to Figure I.2).
17 Adapted after Hellman, Jones and Kaufmann (2000), op.cit., pp.10.
16

Table II.2 State Capture and Administrative Corruption, by South Eastern European Countries
Country State Capture Index Administrative corruption
No. Parliamentary legislation (% of firms)
Presidential decrees (% of firms)
Central Bank (% of firms)
Criminal Courts (% of firms)
Commercial Courts (% of firms)
Party finance (%of firms)
Capture economy index (% of firms)
Capture economy classification (% of firms)
Level of bribery of firms
Classification of administrative corruption
Albania 12 7 8 22 20 25 16 Medium 4.0 High Bulgaria 28 26 28 28 19 42 28 High 2.1 Medium Croatia 18 24 30 29 29 30 27 High 1.1 Medium Moldova 43 30 40 33 34 42 37 High 4.0 High Romania 22 20 26 14 17 27 21 High 3.2 High Russia 35 32 47 24 27 24 32 High 2.8 Medium Slovenia 8 5 4 6 6 11 7 Medium 1.4 Medium Ukraine 44 37 37 21 26 29 32 High 4.4 High
II.4 The anticorruption strategy in Romania The analysis of the anticorruption strategies in Romania, aiming both at the state capture and the administrative corruption is based on key elements, challenges and priorities previously defined in Figure I.2. Romania’s preoccupations to become a European, democratic state, with an efficient administration are reflected especially in the last decade in “the impressive arsenal of legal instruments for transparency, responsibility and anticorruption18, aiming to develop standards and best practices at the level of administration and other key sectors, such as the sanitary system, bodies to maintain public order, justice and strengthening internal and international cooperation in the field of preventing and fight against corruption, representing the three priority areas of the National Anticorruption Strategy 2005-2007 (Table II.3).
18 Freedom House Washington Inc. (2005), Independent audit of National Anticorruption Strategy 2001-2004.
17

Table II.3. Priority areas and objectives of the National Anticorruption Strategy 2005- 200719 (combating state capture/administrative corruption)
Impact Priority area Objectives State
Capture Administrative
Corruption Objective 1 Increasing the transparency and integrity in public administration X
Objective 2 Preventing corruption in the business environment X
Priority area I PREVENTION, TRANSPARENCY, EDUCATION Objective 3 Information campaigns and
educational measures X
Objective 4 Increasing the integrity and resistance to corruption of the judiciary system
X
Objective 5 Reducing the number of structures that have tasks in the fight against corruption
X
Objective 6 Strengthening the institutional capacity of the National Anticorruption Prosecutors Office (NAPO)
X
Objective 7 Increasing the celerity of criminal prosecution and criminal trials X
Priority area II COMBATING CORRUPTION
Objective 8 Combating corruption through administrative means X
Objective 9 Coordinating and monitoring the implementation of Strategy and Action Plan
X X Priority area III INTERNAL COOPERATION AND COORDINATION
Objective 10 Fully implementing all the anticorruption instruments of UE, UN, CoE and OECD
X X
The mission of the Strategy 2005-2007 is to prevent and counter the phenomenon of state capture by refining and rigorously implementing the legal framework, through legislative coherence and stability, and by institutional strengthening of the entities with important tasks in the field. Administrative corruption will be the main object of a new document National Strategy on preventing and combating corruption in vulnerable sectors and local government (2008-2010). This strategy aims to design and implement new measures for combating or reducing corruption in vulnerable sectors and local government, based on the internal and external assessments of the previous strategy during the period of its application, as well as to continue the efforts in fighting against corruption. In order to sustain the areas and objectives of the new strategy (Table II.4) four benchmarks – BM - were identified by the European Commission and they were comprised in the
19 Decision of the Government of Romania no. 231 on 30 March 2005 concerning the approval of the National Anticorruption Strategy 2005-2007 and the Action Plan for implementing the National Anticorruption Strategy 2005-2007, Official Journal no. 272 on 1 April 2005.
18

Commission Decision no. 2006/928/EC on 13 December 200620; we remark the conditional element number 4, referring to „Adoption of additional measures for preventing and fighting against corruption, especially in local government”.
The representatives of central government, the representatives of association structures of local governments have been the actors who elaborated the strategy. In view of implementing the strategy, the measures adopted at administration level aimed mainly legislative harmonisation and coordination of the legal framework in the field-most measures in the Action Plan were legislative ones. For example, in the sanitary system, the most important normative acts regulating the specific medical activities are as follows: Law no. 95/2006 on the reform in the field of health (collection of laws for reform in health); Government Decision no. 862 / 2006, on organisation of the Ministry of Public Health; Government Decision no 1842/2006 (for approving the Framework Contract on the conditions for medical assistance inside the social security system for health for 2007); Order No. 840/2003, on the Methodological Rules for internal public audit in the Ministry of Health; Table II.4. Priority areas and objectives of the National Strategy on preventing and combating corruption in vulnerable sectors and local government (2008-2010) (administrative corruption/state capture)
Impact Priority area Objectives SC AC
Priority area I
ANALYSES, STUDIES, RESEARCHES ON THE
CORRUPTION PHENOMENON
Objective: Supporting public administration in view to evaluate the size of the corruption phenomenon X X
Objective 1: Increasing the information degree and awareness on the risks associated to corruption
X
Objective 2: Increasing the transparency in the public services
X
Objective 3: Developing the human resource management system in view to diminish the risks associated to the corruption phenomenon
X
Priority area II COOPERATION, TRANSPARENCY, INTEGRITY, SIMPLIFICATION OF THE ADMINISTRATIVE PROCEDURES
Objective 4: Simplifying the administrative procedures in view to improve the public services
X
20 Commission Decision no. 2006/928/EC on 13 December 2006, published in Official Journal of the European Union no. 354 on 14 December 2006.
19

• Order no. 1136/2005, on the Programme for development of the management control
system of the Ministry of Public Health and creation of the working group for monitoring, coordinating and methodological guidance concerning the management control systems in the Ministry of Public Health, transposing the Order no. 946/2005 (Code on the internal control) of the Ministry of Public Finance (MFP);
• Order of the National Chamber of Health Insurance no. 328/2006, on monitoring and control in the health social insurance systems;
• Order of the Minister of Public Health no. 880/2006, on the Regulation for organisation and functioning of the Public Health Authority (inquiries and complaints);
• Order of the Minister of Public Health no. 922 on 27 July 2006, on approving the model for the management contract of the public hospital;
• Order of the Minister of Public Health no. 921 / 2006, on the attributions of the steering committee of the hospitals;
• Order no. 1781/558 on 27 December 2006 (for approving the Methodological rules to apply Framework Contract concerning the conditions for providing medical assistance in the health social insurance systems for 2007);
• Order of the Minister of Public Health no. 320/2007 on the Contract of administrating the department/laboratory or medical service in the public hospital.
The Governing Programme of Romania 2009-201221 in Chapter 22: Reform of public administration and Chapter 23: Justice and anticorruption policies, states the fight against corruption, simplification of administrative procedures, increasing the transparency of public services as governance objectives.
21 Source: http://www.gov.ro
20

Chapter III Empirical studies concerning state capture and/or administrative corruption in the public health service from Romania The national authorities and the international organisations are concerned to evaluate corruption in the public health service. Without insisting on the extension and results of the above studies, we remark some important assertions in this field. Thus, Transparency International (2006)22 reviews the main causes of corruption in the health care services. The conclusions reveal both “the propensity to corruption in public health services”23, providing examples about the specific modalities for this field concerning the principal agent theory and state capture. III. 1 State capture mechanisms in the public health service Emphasising five main actors in the health services, the core causes of corruption are: uncertainty, asymmetry of information and high number of actors.24
Government regulator
Payer (Social security, private or public health insurance)
Other Supplier (e.g. construction)
Drug & equipment Supplier
Provider (Public or private hospitals, physicians)
Patients
State capture
Definition and approval of norms
Extortion by inspectors
Drug approval &control Equipment norms
State capture
Influence on decision-makers
Negative incentives to save costs
Over-provision Absenteeism Overbilling Phantom
Bribes to overlook compliance
Influence on decision-makers
Prescription practices Drug & equipment procurement
Procurement (facilities, ambulances)
Informal payments Unnecessary treatment & prescriptions
Fraud in beneficiary ID use Understatement of income
Figure III. 1 State capture mechanisms in the public health service25
22 Transparency International (2006), “The Causes of Corruption in the Health Sector: a focus on health care systems”, www.transparency.org/.../20corruption.pdf 23 Savedoff, D., W, Hussmann, K., (2005), “Why are health systems prone to corruption”, included in Transparency International (2006), p.6 24 Transparency International (2006), op.cit., p.5
21

The modalities of corruption aim mainly issues of regulation, social security organisations, health insurance organisations, providers of health care, patients, equipment suppliers. The study emphasises, concretely, for each actor, the possibilities of fraud or corruption. Corruption in health services has an endemic character, being expressed in relation to the national and universal specificity, as many causes and modalities are similar in several states. It is worth to mention other papers, relevant for the topic approached by us, namely, Arrow (1963), Lewis (2006), Andrei, Matei, Stancu and Andrei (2009). At the same time, Andrei, Matei and Oancea (2009) achieve a statistical processing and analysis on the relations between corruption and performance in the health public service in Romania. III.2 Public Health Care Markets
Unlike other goods and services, the health care services embody some unique characteristics stemming from inherent market failures. First is the asymmetry of information and agencies in charge of physicians, acting as agents for patients. The patients are aware they do not feel well but they rely on health professionals, often physicians, to act as their agents in diagnosing and treating illnesses.
Patients are ill-equipped to assess the adequacy and quality of physician decisions and actions, and therefore focus on the environmental and interpersonal aspects of clinical services, the elements they are best able to evaluate.
Second, the adverse selection practices by private health insurers lead to an uninsured population disproportionately made up of those most in need of health care: the chronically ill, the poor and those having experienced a catastrophic illness.
Government’s intervention compensates for the market’s reluctance to insure the most vulnerable. And, because of the random nature of illness or injury, government subsidies protect the population against the financial expenditures linked with the illness.
Finally, the moral hazard of over-consumption by the insured who do not face the true cost of health care requires an adequate mechanism of cost control, the key issue for OECD countries and relevant for the development countries as well.
A second form of moral hazard is the over production of care by physicians when third parties cover the costs. Physician induced costs act in the same manner the consumer does, with similar implications for payers.
In most countries market failures translate into publicly financed and delivered care. Most developing countries depend heavily on a public intervention rather than regulation, hence the predominance of public health care services in those countries.
A limitation in assessing existing health care services is the lack of any single measure of what constitutes a functioning system. Every OECD country has its own, unique health care arrangements with a mix of public and private financing, delivery and regulations. OECD comparisons of system performance tend to be limited to gross measures such as spending for the levels of mortality or statistics.
The more meaningful comparisons are those based on specific diseases where costs, treatment options and outcomes can be compared, though countries do not 25 Undertaken after Savedoff and Husmann (2005), p. 7
22

necessarily collect comparable data limiting the extent of meaningful comparisons. For the developing countries, systems differ and information on comparable indicators simply does not yet exist.
This effort proves the “government’s failure” to live up to the objectives of public policy, looking specifically at efficiency enhancement and redistribution, and focusing on incentives as a means to improve performance without compromising equity objectives (Jack and Lewis, 2004). III.3 Social perception of corruption in the public health service in Romania In the analyses of corruption and social perception assessment the exact borders between the phenomena of state capture and administrative corruption are hard to define. Often identified with the grand corruption, state capture aims at the political processes and their major influences upon the normative mechanisms, of functioning and implementations of a certain social subsystem. The administrative corruption refers to the petty corruption that materialises in direct payments and several advantages provided/obtained as a result of delivering some preferential or illicit services. For the public health service in Romania a social research was made in order to extract the social perception of the basic characteristics of their reform. In this regard, we as well will tackle a series of specificities of the phenomena of state capture and administrative corruption in the public health service in Romania. The analyses that will be presented use the results from Andrei, Matei, Stancu and Andrei (2009b), as well as from Andrei, Matei and Oancea (2009a)
Reform of public health is a complex and lengthy process, which involves different types of institutions and individuals. During the transition, actions undertaken by all governments have pursued solving the current problems and not to define a new functioning philosophy of the public health service. Under these circumstances, public health service has become expensive and often non-functional. Not a few times, inefficient solutions have been chosen for solving problems in the health service, both in terms of professional, but also economically. The networks of health services providers from Romania, currently do not respond to most needs to improve the health of the population.
In the past eighteen years, a series of measures have been undertaken to decentralize the system and to the privatization of medical services. However, currently we assist to a fragmentation of the system, which emphasize the inequality in the distribution of medical personnel and a reduction of it to certain types of medical services. We note that the number of doctors per capita in the rural area is now only 20% of those in urban areas. Another major shortcoming is related to the financing and linking it with the strategies of decentralization. Not a few times, decentralization appeared as a way of placement of the tasks from the central level to local administrations.
Hypothesis 1. The reform process in the public health service will determine, in an average time horizon, changes in national policy of public health service viewed from the perspective of increasing the volume of public expenditure for health, the policy of national programs carried out by the health ministry and the increase of the transparency in the usage of public funds for compensate and free drugs in the primary medicine.
23

Hypothesis 2. The results of the reform process are perceived by reducing the level of the corruption in the public health service, by narrowing the manifest area of the state capture phenomenon and diminishing the administrative corruption.
Hypothesis 3. State capture is the result of a process dependent on the quality of the reform, transparent decision making, the accessibility level of the citizens to health, the influences and involvement of the political factors in the system’s management, the medical personnel satisfaction etc.
Hypothesis 4. Administrative corruption is a direct consequence of the mentality of the medical personnel, the low accessibility level of the population to health, lack of professional and material satisfaction of the medical personnel as well as the influence of other social subsystems, especially the political, economic or the business environment. Data sample
For data collection we used a two stage poll. The first stage was represented by public health units from Bucharest (hospitals, health centres, polyclinics) which were treated as primary sampling units. The second stage was represented by doctors in each primary sampling unit.
The representative sample from Bucharest consisted in 407 people, and the survey results are guaranteed with a 95% probability in circumstances where there is an error of representativeness of ± 2.5%.
The sample was divided in three categories of staff, as family doctors - 75, doctors in hospitals - 279 and doctors in polyclinics - 53.
The period of recording the information in the sample was about two weeks, these weeks being in June 2007. Thus the comparability of such responses from the individuals included in the sample was ensured, meaning that during this period there were not taken any major decisions at the Ministry of Health to change the opinion of respondents, while most people were present at the workplace. III.3.1 Assessing the state capture level
During the research we designed a questionnaire which was structured according to eight themes presentation in Table III.3. For each theme of the analysis the number of primary variables is specified in the table below. Based on the 52 questions in the questionnaire, of which 49 have been closed, were set 153 primary variables. Using primary characteristics a series of aggregated characteristics have been defined to be used in the simultaneous equations model.
Table III.3 Primary and aggregated variables grouped on themes
No. The theme The number of primary variables
The number of aggregated variables
1. General issues concerning the reform of the public health service 41 14 2. Ministry policy in this area 18 5 3. Health education of the population 18 4 4. The analysis of corruption 24 7 5. Characteristics of current activities 6 2 6. Personal aspects 32 1 7. General data 14 - 8. Total 153 33
24

In table III.4 are presented the variables used in the model. Table III.4 Synthetic description of the aggregated variables used for the simultaneous equations model
No. Code Aggregated variable description Primary variable number
1. RSS
The variable is defined to measure the medical staff opinion on the quality of reform in the public health viewed from the perspective of six components: system funding, procurement of medicines, the process of decentralization, the employment and promotion of staff with medium and higher medical studies and reform measures applied to the units in which they are employed. Range of values: 1 - very poor, 2, 3, 4, 5-very good.
6
2. CSE Estimates the quality of the assessment system of health services provided to beneficiaries. Range of values: 1 - unsatisfactory, 2, 3, 4 - very good.
3
3. TMS It is an aggregate variable used to estimate the ministry transparency in decision-making in the reform process. Range of values: 1 - unsatisfactory, 2, 3, 4 - very good.
2
4. SC Aggregated variable used to measure the level of corruption at the national level in the opinion of medical staff with higher education. Range of values: 1 - there is no corruption, 2, 3, 4, 5 - there is generalized corruption.
5
5. SCP Primary variable used to assess to what extent the political change of management personnel on political criteria. Range of values: 1 – changes in the leadership have not been made based on political changes, 2, 3, 4 - changing the technical staff on political criteria of is a practice.
1
6. GSM Aggregated variable defined to assess the satisfaction degree of the medical personnel. Range of values: 1 - are not happy at all, 2, 3, 4, 5 - fully satisfied.
5
In order to assess the physicians’ perception regarding the level of corruption
from certain systems o measuring scale with five values was used, defined as it follows: • Value 1 is assigned whether in the person’s opinion there is no corruption in
the area of interest; • Value 2 if there is corruption but insignificant; • Value 3 if there is moderate corruption; • Value 4 if there is corruption to a large extent; • Value 5 if there is a generalised corruption in the targeted field.
25
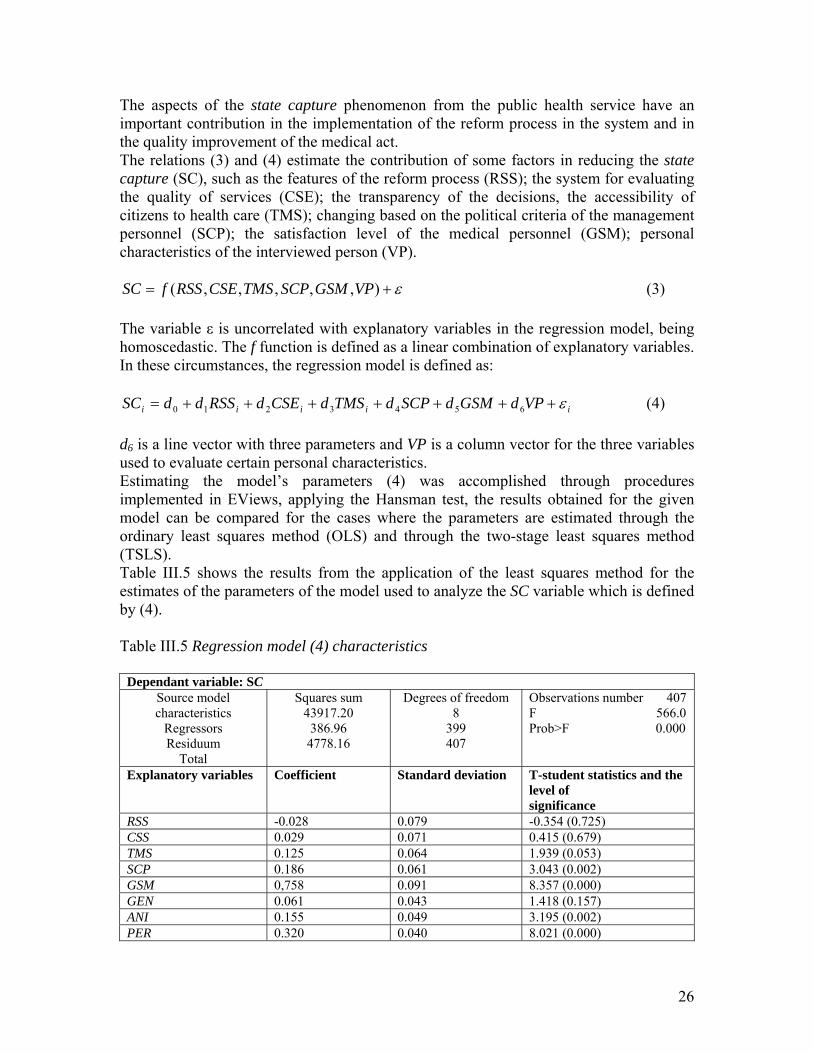
The aspects of the state capture phenomenon from the public health service have an important contribution in the implementation of the reform process in the system and in the quality improvement of the medical act. The relations (3) and (4) estimate the contribution of some factors in reducing the state capture (SC), such as the features of the reform process (RSS); the system for evaluating the quality of services (CSE); the transparency of the decisions, the accessibility of citizens to health care (TMS); changing based on the political criteria of the management personnel (SCP); the satisfaction level of the medical personnel (GSM); personal characteristics of the interviewed person (VP).
ε+= ),,,,,( VPGSMSCPTMSCSERSSfSC (3) The variable ε is uncorrelated with explanatory variables in the regression model, being homoscedastic. The f function is defined as a linear combination of explanatory variables. In these circumstances, the regression model is defined as:
iiiii VPdGSMdSCPdTMSdCSEdRSSddSC ε+++++++= 6543210 (4) d6 is a line vector with three parameters and VP is a column vector for the three variables used to evaluate certain personal characteristics. Estimating the model’s parameters (4) was accomplished through procedures implemented in EViews, applying the Hansman test, the results obtained for the given model can be compared for the cases where the parameters are estimated through the ordinary least squares method (OLS) and through the two-stage least squares method (TSLS). Table III.5 shows the results from the application of the least squares method for the estimates of the parameters of the model used to analyze the SC variable which is defined by (4). Table III.5 Regression model (4) characteristics
Dependant variable: SC Source model characteristics
Regressors Residuum
Total
Squares sum 43917.20
386.96 4778.16
Degrees of freedom 8
399 407
Observations number 407 F 566.0 Prob>F 0.000
Explanatory variables Coefficient Standard deviation T-student statistics and the level of significance
RSS -0.028 0.079 -0.354 (0.725) CSS 0.029 0.071 0.415 (0.679) TMS 0.125 0.064 1.939 (0.053) SCP 0.186 0.061 3.043 (0.002) GSM 0,758 0.091 8.357 (0.000) GEN 0.061 0.043 1.418 (0.157) ANI 0.155 0.049 3.195 (0.002) PER 0.320 0.040 8.021 (0.000)
26

The results from Table III.5 show three categories of explanatory variables included in the model: (1) First are the variables TMS, SCP, GSM, ANI and PER whose parameters significantly differ from zero in the regression model defined above. (2) The second category includes the variable GEN which is likely to be included in the model. (3) The third category includes variables RSS and CSE whose parameters do not significantly differ from zero in the current regression model. The results from the application of OLS to the situation in which the SC is explained in terms of explanatory variables TMS, SCP, GSM, GEN, ANI, PER are presented in table III.6. Table III.6 Regression model SC depending on TMS, SCP, GSM, GEN, ANI, PER
Dependant variable: SC Source model characteristics
Regressors Residuum
Total
Squares sum 4390.9 387.2 4778.1
Degrees of freedom 6
401 407
Observations number 407 F 747.9 Prob>F 0.000
Explanatory variables Coefficient Standard deviation T-student statistics and the level of significance
TMS 0.123 0.060 2.040 (0.042) SCP 0.320 0.040 8.043 (0.000) GSM 0.187 0.053 3.556 (0.000) GEN 0.761 0.088 8.615 (0.014) ANI 0.060 0.042 1.413 (0.150) PER 0.154 0.048 3.188 (0.002)
As a result, relation (4) becomes:
ε++++++= PERANIGENGSMSCPTMSSC 154.0060.0761.0187.0320.0123.0 (5) Where ε represents the error and it must be determined by comparing the real data (ε = -2.975). Equation (5) does not provide an assessment, on a scale from 1 to 5 of the social perception of the state capture phenomenon in the public health service. As an example, if we were to consider that all the variables in (5) would take the 2.5 value, then SC = 1.0125 thus, judging in terms of defining the state capture index, is equivalent with the favourable perception of the state capture phenomenon by 20.25% of the private actors in the public health service. III.3.2 Assessing the administrative corruption (AC) in the public health service The assessment of the administrative corruption level in the public health service follows chapter VI from Andrei et al. (2009b). The general diagram of the applied questionnaire can be found in the appendix. For each question, the used scale was from 1 to 5. Based on the answers and their processing, the results are the following.
a) The perception of corruption in the public health service and other fields
27

28
The results are presented in III.7. Tab. III.7. Level of corruption on certain areas Education Health Political areas Public
administration The institution in which the doctor work
3.16 (0.975)
3.28 (0.992)
4.29 (0.840)
4.02 (0.866)
2.47 (1.081)
Note: under each average there is in bracket mean square deviation In order to assure the compatibilities of data obtained through analysis with the one used for measuring corruption through Corruption Perception Index calculated by Transparency International, using the transformation of data as below:
Index of Corruption (TI) = 2(5-Index of corruption)
In the case of TI index a low value highlights a high level of corruption from a specific area. The domain of values of the index is from 1 to 10. In the interpretation of results we have to take into account that in 2007 corruption in Romania estimated on Transparency International methodology’s is 3.7, Romanian being on the spot 30 at the level of entire Europe. Confidence interval estimated for this is 3.4, 4.1. In world rating Romania’s place is 60. As a result of transformation from above we obtain the following results in certain areas of activity: Education Health Political
areas Public administration
The institution in which the doctor works
3.78 3.44 1.42 1.96 5.06 The index of corruption, calculated on the base of data at the level of sample, on the base of results from the five institutions, presents the following characters:
The value of corruption index is 3,23 and standard deviation 0,759. In order to calculate la medium level has been used questionnaires, 375 pieces, with variables answers at all five questions which has been the base for defining primary variable.
The index of corruption evaluated on the basis of transformation is equal with 3.52, value which stand in confidence interval of Corruption Perception Index of Transparency International.
Distribution of corruption definite on the series of data is a symmetrical one. There are significantly differences between distributions of variable AC definite
on areas of activity. Relative similar profiles are recorded in the case of series of data from education and health, respectively administration and political areas. Otherwise, for education and health, respectively public administration and political areas the recorded values almost equal.

29
Figure III.1. Distribution of answers concerning level of corruption on areas of activity

30
b) Factors of reducing/encouraging of corruption Table III.9 Distribution of answers concerning contribution of some factors to encourage corruption (%)
Non
answer Largely Pretty
much Moderate In an
insignificant measure
Not at all
Overall
1.Legal framework
5,7 22,9 18,2 25,3 20,4 7,5 100,0
2. The wage system
2,9 64,9 21,6 6,6 2,2 1,7 100,0
3. Pressure from economic environment
5,4 33,7 29,2 19,9 9,3 2,5
100,0
4. Pressure from political system
6,4 24,6 22,1 20,6 19,4 6,9
100,0
5. Patient behaviour
4,9 16,7 19,4 26,8 20,9 11,3 100,0
Also, in tab III.10 there is a distribution of the answers regarding the contribution of other institutions in reducing corruption.
Table III.10 Distribution of answers concerning contribution of some institutions in reducing corruption (%)
Non answer
Negative Moderately negative
No influence
Moderately positive Positive
Overall
1. Mass - media
3,2 12,3 9,8 17,9 44,5 12,3 100,0
2. School 3,4 5,4 5,7 38,3 35,4 11,8 100,0 3. Church 3,9 4,2 3,7 50,1 26,3 11,8 100,0 4. Political class
3,2 42,8 25,6 10,6 9,8 8,1 100,0
5. Representative of the state/ civil servant
3,2 34,6 29,0 12,8 11,8 8,6
100,0
We can see that three institutions - school, mass media and the church – have an important contribution at reducing AC in the society. Also, the behaviour of the political class and of the public servants has a moderately negative influence upon the reduction of AC in the system.

31
Figure III.2 Distribution of answers concerning contribution of some factors to encourage corruption

3.36 3.44 3.39
2.12 2.28
2.9
00.5
11.5
22.5
33.5
4
Mas
s - m
edia
Sch
ool
Chu
rch
Pol
itica
l cla
ss
Rep
rese
ntat
ive
of th
e st
ate/
civi
l ser
vant
Citi
zens
Figure III.3 Contribution of some factors to reduce corruption
d) Perception concerning the evolution of AC
The questionnaires have made the distinction between general perception of AC in last years, ACU, and perception of AC after Romanian integration in EU, ACPA. For these two variables used, ACU and ACPA have been taking into account 338 questionnaires which had valid answers. The conclusions can be summarizing as it follows:
Medium level of the two variables is 2.72 (standard deviation 0,887) for ACU and 3.26(standard deviation 0,843) for ACPA. In these circumstances we can consider that administrative corruption has known a slight increase in last period and for the next period will have a slight decrease.
The linear coefficient of correlation calculated for data series corresponding for two variables is equal with 0.638 and is significantly different of 0.638 for a for a threshold of significance of 0.01
2.3
10.7
22.3
50
13.2
1.51.5 2
13.7
46.7
29.7
6.3
0
10
20
30
40
50
60
non answer I II III IV V
Fig. III.4 Evolution of corruption before and after integration
32
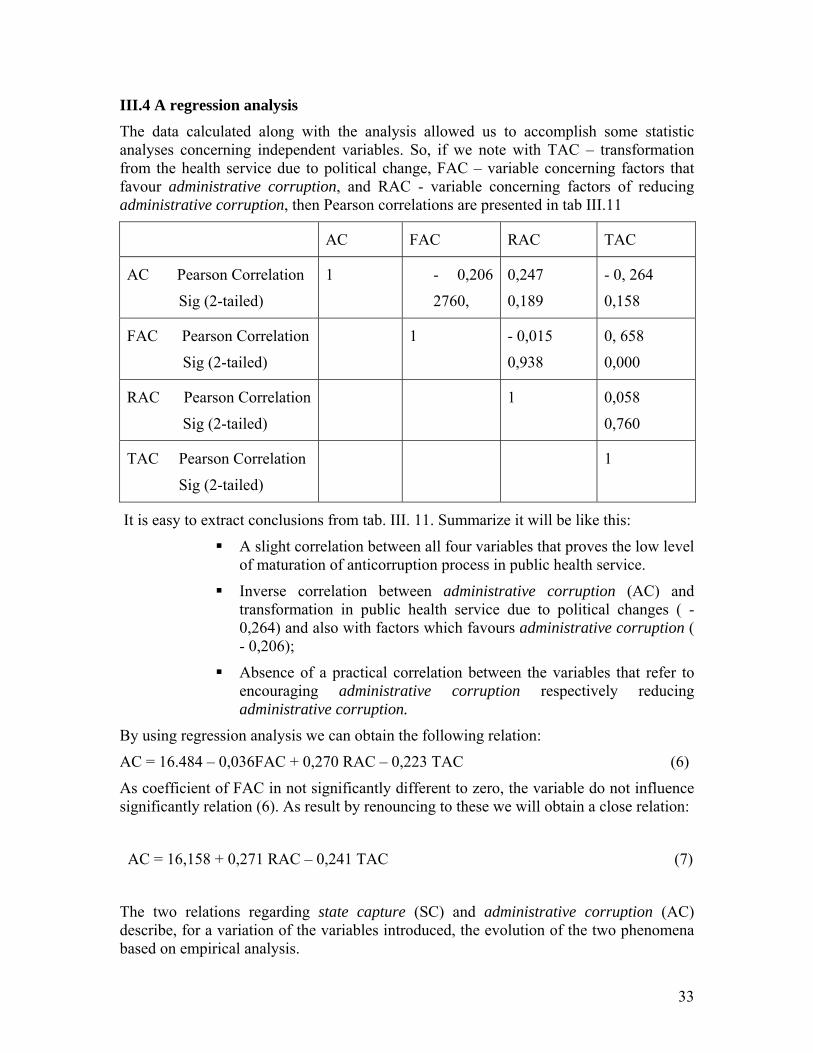
III.4 A regression analysis
The data calculated along with the analysis allowed us to accomplish some statistic analyses concerning independent variables. So, if we note with TAC – transformation from the health service due to political change, FAC – variable concerning factors that favour administrative corruption, and RAC - variable concerning factors of reducing administrative corruption, then Pearson correlations are presented in tab III.11
AC FAC RAC TAC
AC Pearson Correlation
Sig (2-tailed)
1 - 0,206
2760,
0,247
0,189
- 0, 264
0,158
FAC Pearson Correlation
Sig (2-tailed)
1 - 0,015
0,938
0, 658
0,000
RAC Pearson Correlation
Sig (2-tailed)
1 0,058
0,760
TAC Pearson Correlation
Sig (2-tailed)
1
It is easy to extract conclusions from tab. III. 11. Summarize it will be like this:
A slight correlation between all four variables that proves the low level of maturation of anticorruption process in public health service.
Inverse correlation between administrative corruption (AC) and transformation in public health service due to political changes ( - 0,264) and also with factors which favours administrative corruption ( - 0,206);
Absence of a practical correlation between the variables that refer to encouraging administrative corruption respectively reducing administrative corruption.
By using regression analysis we can obtain the following relation:
AC = 16.484 – 0,036FAC + 0,270 RAC – 0,223 TAC (6)
As coefficient of FAC in not significantly different to zero, the variable do not influence significantly relation (6). As result by renouncing to these we will obtain a close relation:
AC = 16,158 + 0,271 RAC – 0,241 TAC (7)
The two relations regarding state capture (SC) and administrative corruption (AC) describe, for a variation of the variables introduced, the evolution of the two phenomena based on empirical analysis.
33

Conclusions
The two phenomenon state capture and administrative corruption are presented
and have an evolution also in the public health services in Romania. Although their evolutions are different, in the social analysis the perception of some important parts can be confused. As a result when we tackle the perception of corruption it does not mean that we simply add the two phenomena. Under a continuous reduction of corruption in Romania, the relation between the evolutions of the two phenomena, state capture and administrative corruption is not linear. The causes of the two phenomena are different. In the anticorruption strategies both the causes and the existent evaluation on medium and log term must be followed. The analysis presented in this paper aims at substantiating the decisions regarding the fight against corruption.
34

Appendix a) How do you appreciate the level of corruption in the following areas of activity (mark only one answer on the line) There is no
corruption It exist corruption in an insignificant extent
It exist corruption at a moderate level
It exist corruption in a largely extent
It exist generalized corruption
1. Education 2. Health 3. Political environment
4. Public administration
5. In your institution
b1) In your opinion which are the elements that favours the corruption in public health system: (mark only one answer on the line)
Non answer Largely Pretty much Moderate
In an insignificant
measure Not at all
1.Legal framework 2. The wage system 3. Pressure from economic environment
4. Pressure from political system
5. Patient behaviour b2) How do you consider that the next elements contribute to the reduction of corruption: (mark only one answer on the line)
Non answer
Negative Moderately negative
No influence
Moderately positive Positive
1. Mass - media 2. School 3. Church 4. Political class 5. Representative of the state/ civil servant
6. Citizen behaviour
35

c) How do you appreciate the evolution of the level of corruption in public health system: (mark only one answer on the line) The level of corruption has grow a lot
The level of corruption has grow
The level of corruption did not suffer any significant evolution
The level of corruption decrease moderate
The level of corruption decrease significantly
36

References Andrei, T., Matei, A., Oancea, B., (2009a), „Simultaneous Equations Models Used in the Study of Some Issues Related to the Corruption and Performance of Services in the Public Health System”, Theoretical and Applied Economics, No. 1/2009, Available at SSRN: http://ssrn.com/abstract=1333528; Andrei, T., Matei, A., Roşca, I., (2008), “Corupţia. O analiză economică şi socială”, Editura Economică, Bucureşti; Andrei, T., Matei, A., Stancu, I., Andrei, C., (2009b), “Socioperformanţa reformei sistemului public de sănătate”, Editura Economică, Bucureşti; Appelbaum, E., Katz, E., (1987), “Seeking rents by Setting Rents: The Political Economy of Rent Seeking”, Economic Journal, vol. 97, pp. 685-699; Arrow, J.K., (1963), “Uncertainty and the Welfare Economics of Medical Case”, American Economic Review; Bardhan, P., Mookherjee, D., (2000), “Capture and governance at local and national levels”, American Economic Revue, 90(2), pp. 135-9; Begovic, B., (2005), “Corruption, Lobbying and State Capture”, CLDS Working Paper #0106, March; Hellman, J., (2002), “Strategies to Combat State Capture and Administrative Corruption in Transition Economies”, Conference “Economic Reform and Good Governance. Fighting Corruption in Transition Economies”, 11-12 April, Beijing, China. Hellman, J., Kaufmann, D., (2001), “Confronting the Challenge of State Capture in Transition Countries”, Finance and Development, vol. 38, no. 3, September. Hellman, J., Jones, G., Kaufmann, D., (2000), “Seize the State, Seize the Day, State Capture, Corruption and Influence in Transition Economies”, World Bank Policy Research Working Paper, no. 2444. Kaufmann, D., Hellman, J.S., Jones, G., Schankerman, M.A., (2000), “Measuring Governance, Corruption, and State Capture: How Firms and Bureaucrats Shape the Business Environment in Transition Economies”, World Bank Policy Research Paper no. 2312, available at SSRN: http://ssrn.com/abstact=236214; Kunicova, J., (2006), “Democratic institutions and corruption: incentives and constraints in politics”, in Rose-Ackerman, S. (ed.) (2006), pp. 140-160.
37

Lambsdorff, J.G., (2002), “Corruption and rent-Seeking”, Public Choice, vol. 113, pp. 97-125; Lewis, M., (2006), “Governance and Corruption in Public Health Care Systems”, Center for Global Development, Working Paper No. 78, January, www.cgdev.org/files/5967_file_WP_78.pdf; Matei, L., Matei, A., (2009), “Corruption in the Public Organizations – Towards a Model of Cost-Benefit Analysis for the Anticorruption Strategies”, The First Global Dialogue “Governing Good and Governing Well”, 28-30 May, Amsterdam, The Netherlands, available at SSRN: http://ssrn.com/abstract=1405209; Pesic, V., (2007), “State Capture and Widespread Corruption in Serbia”, CEPS Working Document no. 262, March; Rose-Ackerman, S., (2005), “Corruption and Government. Causes. Consequences and Reform”, Cambridge University Press; Rose-Ackerman, S. (ed.), (2006), “International Handbook on the economics of corruption”, Edward Elgar Publishing; Savedoff, D., W., Hussmann, K., (2005), “Why are health systems prone to corruption”, in Transparency International (2006), www.transparency.org; Savedoff, D.W., (2004), „’40th Anniversary: Kenneth Arrow and the Birth of Health Economics”, Bulletin of the World Health Organization 82(2), February; Sonin, K., (2009), “State capture and Corruption in Transition economies”, available at SSRN: http//ssrn.com/abstract=1397325; European Commission, (2006), “Monitoring Report on 26 September 2006”; European Commission, (2006), Decision no. 2006/928/CE, Official Journal of EU no. 354/14 December 2006; European Commission, (2007), “Report concerning the evolution of the accompanying measures in Romania after accession”, 27 June 2007; Freedom House, (2005), “Independent Audit of National Anticorruption Strategy”, 2001-2004, www.gov.ro; Government of Romania, (2004), “Strategy for public administration reform”, http://www.gov.ro; Government of Romania, (2005), “Governing Programme 2005-2008”, http://www.gov.ro;
38
Government of Romania, (2005), Decision on the approval of the National Anticorruption Strategy 2005-2007 and Action Plan, O.J. no. 272/1.04.2005; Transparency International, (2006), “The Causes of Corruption in the Health Sector: a focus on health case systems”, www.transparency.org/.../20corruption.pdf; World Bank, (2000), “Anticorruption in Transition. A Contribution to the Policy Debate”, Washington D.C.
39