STAGGERING AND SYNCHRONIZATION OF PRICES IN A LOW INFLATION ENVIRONMENT: EVIDENCE FROM GERMAN FOOD...
16
Staggering and Synchronisation of Prices in a Low Inflation Environment: Evidence from German Food Stores J.P. Loy C.R. Weiss Paper prepared for presentation at the X th EAAE Congress ‘Exploring Diversity in the European Agri -Food System’, Zaragoza (Spain), 28-31 August 2002 Copyright 2002by J.P. Loy and C.R. Weiss . All rights reserved. Readers may make verbatim copies of this document for non-commercial purposes by any means, provided that this copyright notice appears on all such copies.
Transcript of STAGGERING AND SYNCHRONIZATION OF PRICES IN A LOW INFLATION ENVIRONMENT: EVIDENCE FROM GERMAN FOOD...

Staggering and Synchronisation of Prices in a Low Inflation Environment:
Evidence from German Food Stores
J.P. Loy
C.R. Weiss
Paper prepared for presentation at the Xth EAAE Congress ‘Exploring Diversity in the European Agri -Food System’,
Zaragoza (Spain), 28-31 August 2002
Copyright 2002by J.P. Loy and C.R. Weiss. All rights reserved. Readers may make verbatim copies of this document for non-commercial purposes by any means, provided
that this copyright notice appears on all such copies.

1
Staggering and Synchronisation of Prices in a Low Inflation
Environment:
Evidence from German Food Stores
J.P. Loy+)
and C.R. Weiss++)
Abstract
Only a few studies have analysed staggering and synchronisation in pricing behaviour of
multi-product firms. These studies used low-frequency data in an environment of high rates of
inflation. This paper investigates staggering and synchronisation of weekly prices for ten food
products in 131 grocery stores in Germany over the period from May 1995 to December 2000
(296 weeks). Different forms of staggering and synchronisation (across-store
synchronisation, within type-of-store synchronisation, within retailer synchronisation or
across-product synchronisation) have been analysed. None of these forms of synchronisation
is supported empirically however. In contrast, perfect staggering can only be rejected in very
few cases.
key words: Pricing behaviour, food products, German retailers
_____________ +) Department of Agricultural Economics, University of Kiel, Germany ++) Department of Food Economics and Consumption Studies, University of Kiel, Germany
2
Staggering and Synchronisation of Prices in a Low Inflation Environment:
Evidence from German Food Stores
Abstract Only a few studies have analysed staggering and synchronisation in pricing behaviour of multi-product firms. These studies used low-frequency data in an environment of high rates of inflation. This paper investigates staggering and synchronisation of weekly prices for ten food products in 131 grocery stores in Germany over the period from May 1995 to December 2000 (296 weeks). Different forms of staggering and synchronisation (across-store synchronisation, within type-of-store synchronisation, within retailer synchronisation or across-product synchronisation) have been analysed. None of these forms of synchronisation is supported empirically however. In contrast, perfect staggering can only be rejected in very few cases.
1 Introduction
Much of the motivation for studying staggering and synchronisation of prices originates from the macroeconomic literature, where the stickiness of prices and wages are blamed for real effects of nominal shocks. Whereas traditional Keynesian analysis took the assumption of sluggish price adjustment for granted, new-Keynesian economics has primarily involved the search for rigorous and convincing models of wage and/or price stickiness based on maximising behaviour and rational expectations. This requires first to argue for individual firms not to change prices and secondly, to show that individual price stickiness translates into aggregate rigidity. Within this second task, the analysis of staggering versus synchronisation of price changes is a key issue. In two seminal papers, Taylor (1979 and 1980) shows that staggering of prices between firms causes aggregate price level inertia. Analysing staggering and synchronisation however also is of intrinsic value as it provides essential information for understanding firms pricing behaviour in different markets. To what extent, for instance, do firms react to price changes of competitors? Parallel pricing behaviour could be an indicator of collusion and it is thus interesting to see, to what extent firms actually synchronise their pricing strategy. Do multi-product firms change prices of all products simultaneously (within-store synchronisation) or are these price changes distributed uniformly over time (within-store uniform staggering)? To what extent do stores belonging to the same retailer chain follow an independent pricing strategy as opposed to changing prices simultaneously. Recent studies in this field have been carried out for retail prices in Israel (Lach and Tsiddon, 1992 and 1996), Argentina (Tommasi, 1993), the United States (Cecchettti, 1986, Kashyap, 1995) and Canada (Fisher and Konieczny, 2000). We provide some first empirical evidence for Europe by investigating data from German food retail stores over the period from 1995 to 2000. Besides this regional aspect, the present paper differs from this literature in a number of ways. Firstly, we analyse high-frequency data (weekly data in contrast to monthly observations used in many studies) in an environment characterised by low inflation rates. If the frequency of observations is too low (which is particularly likely in high inflation countries and where low-frequency data are used) staggering may not be observed accurately. Secondly, we investigate products where quality changes over time are very unlikely. Survey results (Blinder, 1991) reinforce the view that quality adjustment is important: survey participants often cite the ability to vary non-price attributes of a good as a reason for price rigidity. The products under investigation here are exactly defined and the study period is relatively short. Further, delivery lags or stocks outs are unlikely. Thirdly, we investigate the pricing behaviour of a number of
3
different products (in contrast to many studies looking at one good only). This allows us to investigate pricing behaviour of multi-product firms. And finally, focusing on prices of different products also permits investigating the importance of the degree of substitution between products (strategic complementarity) by analysing within-store synchronisation between and within classes of products. The following section gives a brief review of the literature on price staggering and synchronisation. Section 3 describes the data and the empirical results are reported in section 4. Section 5 concludes.
2 Brief review of literature One of the most popular explanations for the phenomenon that prices are kept at constant nominal levels over at least some time at the firm level is the existence of menu cost. Menu costs include all costs related to the adjustment of prices. Under menu costs, prices will only be changed if the change of economic conditions is significant enough that potential losses from not adjusting prices exceed the threshold that is set by the menu costs. Food retailers, for instance, often announce their prices by printing price lists, by advertisements, and by in store labels. Adjusting prices calls for printing new lists, placing new advertisements, and changing in store labels. Such costs lead to a reduction of price adjustment. In measuring the magnitude of menu costs for drugstore and supermarket chains, Dutta et al. (1999) argue that the menu costs are sufficiently large to form a barrier to price changes (the ratio of menu costs to revenues is 0.7% for supermarket chains and 0.74% for drugstore chains). Marginal changes in the economic environment do not automatically lead to product price changes of a specific firm. The basic menu-cost models (Akerlof and Yellen 1985, Mankiw, 1985) have been extended in different ways (a) to consider a distribution of shocks rather than one-off shocks (Ball and Romer, 1989), (b) to analyse price adjustment in oligopolistic markets (Rotemberg and Saloner, 1987), (c) to simultaneously consider adjustment costs in prices and quantities (Andersen, 1995 and Lucke, 1995) and (d) to examine the effects of menu costs in a dynamic setting.1 In addition to menu costs, some other explanations for individual firms not to change prices have been offered. Nominal price rigidities at the retail level can also follow from negotiating nominal contracts, which implicitly keeps marginal costs of buying in constant over the time of the contract. Interviews with practitioners indicate that this is widely applied procedure (Blinder et al., 1998). The issues discussed here are very similar to those in the menu cost literature. Another argument for sticky prices is based on the existence of psychological pricing points. It is assumed that the marginal revenue curves for suppliers are discontinuous at such pricing points. Firms setting prices slightly below such pricing points will not adjust prices upwards (or jump to the next price just below a pricing point) as a consequence of an exogenous demand or cost shock. Carlton (1983) raises an important point when arguing that non-price features such as product quality, service, extra gifts etc. can also cause nominal rigidities when firms use these items to react to changes in the economic conditions. Under periods of inflation, for example, firms can keep prices constant and at the same time gradually adjust quality (downwards). In this case we do not have a nominal rigidity of the product value, but a spurious price stickiness caused by the exclusive focus on product prices.
1 A significant literature has developed in the 1990s to examine the effects of menu costs in a dynamic setting. This literature has two branches: time-dependent pricing and state dependent pricing. For a good overview see Cassino (1995).

4
Irrespective of the specific reason for an individual firm not to adjust prices it is important to note that sticky prices at the firm level not necessarily implies price rigidity at the aggregate level (industry or macro-economy). At the aggregate level, the relative timing of price changes by individual firms becomes a central issue. Whether all firms review prices simultaneously (“synchronisation”) or only a fraction of firms adjusts prices each period (“staggering”) has important macroeconomic consequences. If all firms change their prices simultaneously with a lag of one period, then the aggregate price level will have adjusted fully to the new equilibrium level by the end of this period and exogenous nominal shocks will not have persistent real consequences. If, however, price-setting is staggered, the effect of nominal shocks will be prolonged. In two seminal papers, Taylor (1979 and 1980) shows that staggering of prices between firms causes aggregate price level inertia. The assumption of price-staggering is a necessary condition for explaining macroeconomic price rigidity. Whether this assumption is plausible and consistent with firms profit maximising behaviour quickly became a heavily debated issue. Blanchard and Fisher (1989) conclude: “staggering is unlikely to be an (stable) equilibrium” (p. 400). Their conclusion also rests on the strategic complementarity in price-setting decisions. Each firm takes into account that not all competitors have adjusted prices yet, which prevents the firm to change prices fully as well. If the proportion of firms changing prices (π) increases above π = ½, it will be more attractive for firms with fixed prices to adjust too and vice versa. This implies that synchronisation (with either π = 1 or π = 0) is always a stable equilibrium. Staggering can only be an equilibrium if π = ½, but this equilibrium is unstable. A number of different models have been proposed to defeat this argument. Fethke and Policano (1984) and Parkin (1986) argue that price changes tend to be synchronized when changes in economic conditions are common shocks to all firms, while idiosyncratic shocks lead to synchronisation of prices.2 Ball and Cecchetti (1988) develop a model in which firms have imperfect knowledge of the current state of the economy and use the behaviour of other firms in their market to make inference about demand. This gives each firm an incentive to postpone price adjustment and set prices shortly after other firms set theirs. Staggering can be an equilibrium outcome. In the case of wage setting in oligopolistic markets, De Fraja (1993) and Lau (1996) focus on strategic incentives to stagger. Staggering is possible if the economy consists of a small number of large firms. The relative attractiveness of staggering vs. synchronisation also depends on the form of price adjustment costs. Sheshinski and Weiss (1992) argue, that firms tend to synchronise when menu costs are fixed but stagger with variable menu costs.3 An important extension of this literature is the analysis of pricing in a multi-product setting. Kashyap (1995) argues that if information, which is costly to gather and evaluate, arrives at the same time and has the same content for all agents, then price changes over close substitutes should be synchronised. In a dynamic (sS)-pricing model Sheshinski und Weiss (1992) argue that price changes will be staggered if the goods supplied are strategic substitutes, while they will be synchronised if these are strategic complements. A similar result has most recently been proposed by Bhaskar (2001). Given that the elasticity of substitution between products of the same industry is larger than between products of different industries,4 he argues that price changes will be synchronised within the industry but staggered between industries and in the aggregate economy.
2 For a critical discussion of this argument see Blanchard and Fisher, 1988, p. 401. 3 Fixed, or store specific menu costs, such as the costs of printing a new menu, are shared by all products. Variable menu costs, on the other hand, are not independent with the number of prices to be changed. Decision costs are one example for variable menu costs. 4 This implies that strategic complementarities are stronger within industries than across industries.

5
The vast majority of empirical studies in the macroeconomic literature aims at measuring the consequences of staggering (the lag of price adjustment to exogenous shocks) and thus reports only indirect evidence on staggering.5 More direct evidence on pricing behaviour, staggering and synchronisation is available in a few studies using micro-data such as Cecchetti (1985, 1986), Lach and Tsidon (1992, 1996), Thomasi (1993), and Fisher et al. (2000). However, reviewing this literature is rendered difficult due to problems associated with finding an unequivocal definition and thus an appropriate measure of staggering. Different measures have been used and the relationship between these is often unclear. A brief review of the empirical literature (in a working paper version of this paper) suggest a more precautious conclusion about the empirical relevance of staggering or synchronisation as in Taylor (1999), who summarizes: “Price setting is also staggered. These facts, which are apparent in casual observation, are confirmed in studies of wages, retail prices, and industrial prices” (p. 25). Most studies, however, have so far been carried out for high inflation countries and/or by focusing on a small set of products only. Further, are only a few studies testing for synchronisation between different groups of stores as well as within stores. These aspects deserve more attention.
3 Data The data used for this study have been provided by the “Zentrale Markt- und Preisberichtstelle” (ZMP) in Bonn, Germany. The ZMP is an independent organisation that has a mandate from the German Government to provide, among other things, representative consumer price data. The Government’s mandate aims to inform all market participants on agricultural and food markets about the actual market developments. However, the Government has not outlined any directions to fulfil this mandate. Thus, the ZMP has developed its own rules and taken specific actions to achieve the goal. To inform consumers and retailers about the developments in food retail prices, the ZMP has set up a price reporting system on a weekly basis. The ZMP maintains a network of roughly 450 so-called ‘Melder’ (melden = to report) who visit about 1,300 retail food stores in Germany on a weekly basis and collect price data for a variety of standard fresh foods.6 The sample is designed to represent the geographic regions and the type of stores with respect to their population values. Thus, the ZMP tries to reflect the relative weights of the region measured by its population and the number of store types for the underlying population in construction of the sample. Germany is divided into 8 geographic regions for this purpose, and retail stores are divided into 6 categories (small supermarkets (SSM: primarily food less than 400 square meter shopping area), big supermarkets (BSM: primarily food more than 400 but less than 800 square meter shopping area), combined supermarkets (CSM: food and other items more than 800 square meter shopping area), discounter (DC: primarily food with self service), butchers (BU), fruit and vegetable markets (FV)). In accordance to the relative weights given by the underlying populations with respect to regional, peoples’, and store types’ aspects the ZMP decides what kind of store from what region enters the sample. Price data is collected for 56 fresh food products. To ensure the comparability of reported prices, the Melder are given detailed instructions on the quality of the product and the measure (price per piece or per kg). The Melder decides on what day of the week he or she visits the stores that he or she is reporting on. Special offers are to be considered. The Melder fills out a standard sheet that is send back to the ZMP weekly. The ZMP does not publish individual store prices or any information on the price setting behaviour. Instead, on a weekly
5 For a recent review of this literature see Taylor (1999). 6 The list of products does only include some processed items, such as butter, yoghurt, or sausage.
6
or monthly basis, average prices for regions and store types for all products are published. The data sent by the Melder are processed as follows by the ZMP prior to publishing:
i) Removal of ‘obvious outliers’ (e.g. misplaced decimal points) by hand and removal of observations that deviate by more than 2.6 standard deviations from the mean. Roughly 1-2 % of the available observations are lost in this way.7
ii) Calculation of the unweighted average price for each store type within a region. iii) Calculation of the regional average as a weighted average of the store type
averages from ii), with weights equal to share of each store type in total purchases of the commodity in question.
iv) Calculation of the national average price for each store type as the weighted average of the store type averages from ii), with regional population shares as weights.
v) Calculation of the national average over all store types as the weighted average of the regional averages from iii), with regional population shares as weights.
vi) Average product prices are only published if at least 100 observations were available over all store types and regions.
The resulting regional, store type and national averages for each food product are published weekly and also provide the basis for a variety of monthly, quarterly, and annual publications produced by the ZMP (see ZMP internet page at http://www.zmp.de). Furthermore, this data is reproduced in many other publications, such as local farm journals and consumer affairs publications etc. The ZMP-panel ought to be a random sample of the above mentioned types of food stores in Germany. However, reporters decide on the store they visit to report prices and neither the reporter nor the store he or she selects is chosen a priori randomly. As we do not have information about the group of reporters, such as age, education, income etc. we can only speculate towards which direction the actual sample might be biased. For instance, it is likely that low income pensioners are over represented in the sample of reporters; thus, it might well be that these people prefer to report on low price stores. In this case estimates of average prices would be biased downwards. By controlling the regional number of stores and the number of the various store types, potential biases of sample parameters due to these characteristics are limited. For our study we selected ten out of the 56 food products. As we focus on the price setting behaviour we aimed to get a full panel data set, which means each store in our sample reports prices for all ten food items over the entire period of observation. For this reason, specialised fruit and vegetable as well as butcher shops have been excluded from the analysis. We first selected the food products by excluding the items that are only offered seasonally, such as cherries, by excluding the items that are only reported on a monthly basis, such as milk products. The remaining products can be classified into meat, fruits, and vegetables. We selected 4 meats, 3 fruits and 3 vegetables by choosing the product items with the maximum number of observations in the raw data set. Thereby we hoped to maximise the number of stores with a continuous reporting over time. For these 10 food products we selected only those stores that carry all items at all times. We defined continuous price reporting by availability of price observations for each product in more than 92 % of all weeks from May 1995 to December 2000 (n = 296). For the missing observations we set the price of the product in the store in week before respectively. This entire selection process reduced the number of observations from around 250.000 for each product to 38.776, which corresponds
7 The automatic routine to remove outliers has not been applied to the raw data set that is used here; however, the data have been corrected for irregular observations by hand.

7
to observations from 131 food stores over a period of 296 weeks. For the individual stores, information on the corresponding zip code (exact regional location), the type of the store (see above for definition), the name of the store, and the company that owns the store are also available. Our final sample of products consists of fresh beef (braised beef quality without bones), liver sausage (from calves, thin cut, packed in gold skin), fresh pork steak (“Schnitzel” without bones), fresh turkey breast steak (without skin and bones), apples (Golden Delicious, size 70 to 80 mm in cross section), pears (table pears of different sort), citrons (regular quality), lattice (ice salad), carrots (without foliage), onions (regular quality of typical sort). Prices are reported in German cent or pennies per kilogram, except for lattice and citrons for which prices are reported in cent or pennies per piece. The stores in our final sample belong to the following store type and companies. The real names of the companies have been suppressed and substituted for alphabetical letters by confidentiality reasons.8
Insert Table 1 about here The sample is a complete panel of retail prices for ten basic food items in 131 retail stores that have been collected continuously on a weekly basis from 1995 to 2000. In Figure 1 the average prices over all stores (m = 131) are shown for the entire period of observation to indicate the common price dynamics. Average prices do not show significant linear trends, except the prices of citrons which exhibit a slight upward shift in this period. For meat products some longer term cyclical behaviour can be observed which differs somewhat for the selected products. Because of the short period of observation this phenomenon cannot be analysed in more detail. Fruit and vegetable prices indicate significant seasonal patterns, which also vary between products and in time. Again, formal statistical testing is not possible because of the short time horizon covered by the sample.
Insert Figure 1 about here Besides the deterministic time series components all series have an autocorrelated stationary residual component which is less significant for fruits and vegetables.9 The average prices change from week to week and the magnitudes of changes are much bigger for meat products than for fruits and vegetables. The same holds for the volatility around the deterministic components.
4 Empirical results The terms “perfect staggering” and “perfect synchronisation” characterise two extreme features of the timing of price changes. Under perfect synchronisation, the conditional probability of a price change of item i given a price change of another item j is one. Perfect staggering would imply the conditional probability of a price change of item i given a price change of another item j to be zero. Hereby items i and j might indicate the same product at different stores (Across-Store Synchronisation), different products at the same store (Within-Store Synchronisation) or a number of different products at different stores belonging to the same retailer (Within-Retailer Synchronisation). For the analysis of these issues the data frequency is obviously of critical importance. When time intervals between observations
8 Because of the small number of observations in some cases we have to be cautious with some conclusions. For instance, with respect to DI and retail chains D and F. 9 All series have been tested for stationarity using the ADF-test and the procedure by Phillips and Perron (1988). The Null-hypothesis is rejected at the 95 % significance level.

8
become too long, we might end up with the obvious result of perfect synchronisation as every supplier has adjusted prices since the last point of observation (spurious perfect synchronisation). Food retail markets in Germany often announce prices via newspaper or special advertisements on a weekly basis. Thus, there is some reason to consider weekly price observations appropriate for this type of analysis. 4.1. Across-Store Synchronisation If price changes were perfectly synchronized and all stores would change prices of a given item at the same time, the proportion of price changes in any given period would be either 0 (no store changes prices) or 1 (all change prices). Under perfect staggering, the proportion of price changes in any period would be equal to the average proportion of price changes over time. Figure 2 reports the proportion of stores changing prices in a given time period. Over the entire time period of 296 weeks, 47% of all prices in all stores changed on average (the solid line in Figure 2). The proportion of stores changing prices in a given week (the individual observations) is very close to the solid line, however, they are not exactly located on the solid line, as “uniform perfect staggering” would imply.10
Insert Figure 2 about here Tommasi (1993), Lach and Tsidden (1996) as well as Fisher and Konieczny (2000) use the standard deviation of the proportion of stores changing prices each period. It will be at its maximum (close to 0.5) with full synchronisation and will be zero under uniform staggering. The standard deviation here is 0.03 which is extremely low compared to the results reported in Lach and Tsiddon, Tommasi and Fisher and Knoieczny. This is, of course, not a formal test of staggering. Whether individual observations significantly deviate from the “perfect staggering” situation can be tested more formally on
the basis of a χ2 –test: ∑ −=− )(
))(( 22
1i
iin hE
hEhχ , where hi is he number of price changes in
store i during the 296 weeks and n is the number of stores. This test clearly rejects the hypothesis of “perfect staggering” at the 5%-level (the χ2 test statistic is 642 and the critical value for the test statistic with 294 degrees of freedom is 335). Although price changes are far from being perfectly synchronised across stores, there is no indication for perfect staggering either and we cannot rule out some form of synchronisation in pricing. Following Sheshinski and Weiss (1992) as well as Bhaskar (2001) we would expect to find the amount of staggering to be related to the degree of product heterogeneity. Less heterogeneity between items implies stronger strategic complementarity and increases the benefits of synchronising price changes. Assuming that the elasticity of substitution between the same products at different stores exceeds the elasticity of substitution between different products within the same store, this leads us to an expectation of a stronger tendency towards synchronisation when investigating pricing behaviour for each of the ten products in our sample separately. On first sight, the results shown in Figure 3 look very similar to those shown above. The proportion of shops changing prices differs between products. On average, 60% of all stores change prices per week in the case of beef, whereas this figure is 30% in the case of onions. Secondly, Figure 3 exhibits a cyclical pattern in pricing behaviour for fruits and vegetables.11 10 Cecchetti (1983) defines uniform staggering (or uniform nonsynchronsiation) as a situation where firms setting prices for k periods are uniformly distributed over the interval from zero to k. 11 Note that in this case, cyclicality does not refer to the level of prices but to the frequency of price adjustments.
9
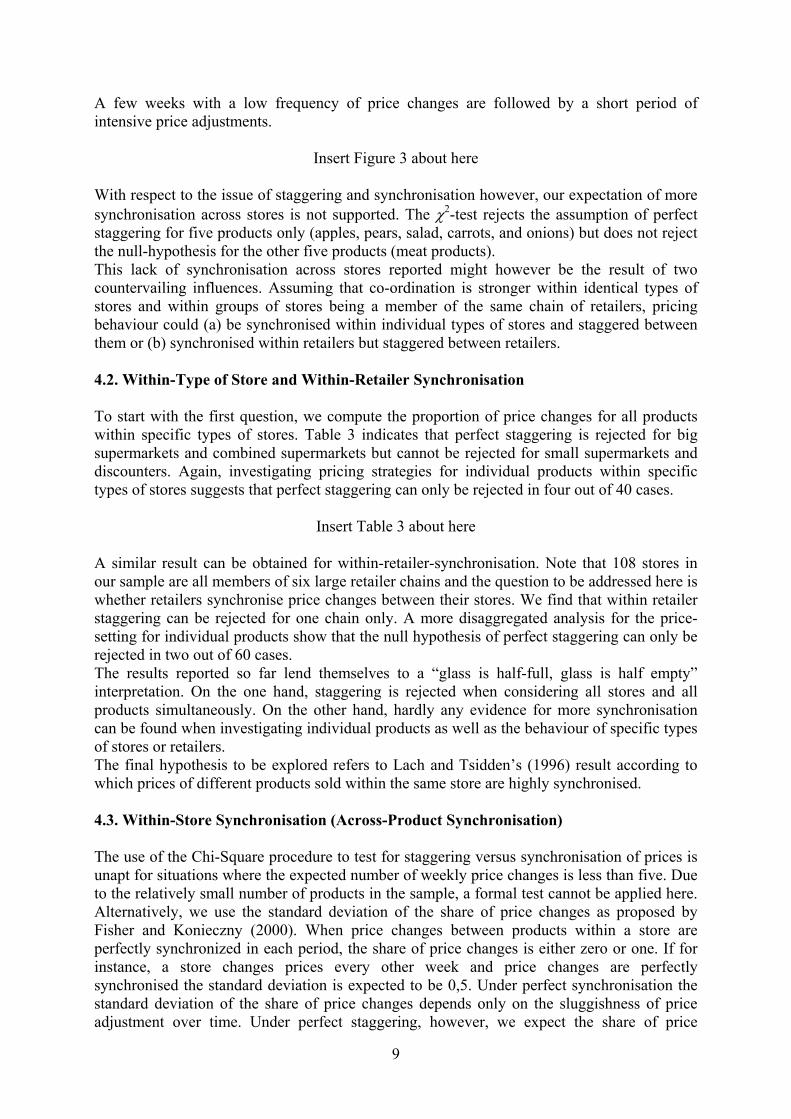
A few weeks with a low frequency of price changes are followed by a short period of intensive price adjustments.
Insert Figure 3 about here With respect to the issue of staggering and synchronisation however, our expectation of more synchronisation across stores is not supported. The χ2-test rejects the assumption of perfect staggering for five products only (apples, pears, salad, carrots, and onions) but does not reject the null-hypothesis for the other five products (meat products). This lack of synchronisation across stores reported might however be the result of two countervailing influences. Assuming that co-ordination is stronger within identical types of stores and within groups of stores being a member of the same chain of retailers, pricing behaviour could (a) be synchronised within individual types of stores and staggered between them or (b) synchronised within retailers but staggered between retailers. 4.2. Within-Type of Store and Within-Retailer Synchronisation To start with the first question, we compute the proportion of price changes for all products within specific types of stores. Table 3 indicates that perfect staggering is rejected for big supermarkets and combined supermarkets but cannot be rejected for small supermarkets and discounters. Again, investigating pricing strategies for individual products within specific types of stores suggests that perfect staggering can only be rejected in four out of 40 cases.
Insert Table 3 about here A similar result can be obtained for within-retailer-synchronisation. Note that 108 stores in our sample are all members of six large retailer chains and the question to be addressed here is whether retailers synchronise price changes between their stores. We find that within retailer staggering can be rejected for one chain only. A more disaggregated analysis for the price-setting for individual products show that the null hypothesis of perfect staggering can only be rejected in two out of 60 cases. The results reported so far lend themselves to a “glass is half-full, glass is half empty” interpretation. On the one hand, staggering is rejected when considering all stores and all products simultaneously. On the other hand, hardly any evidence for more synchronisation can be found when investigating individual products as well as the behaviour of specific types of stores or retailers. The final hypothesis to be explored refers to Lach and Tsidden’s (1996) result according to which prices of different products sold within the same store are highly synchronised. 4.3. Within-Store Synchronisation (Across-Product Synchronisation) The use of the Chi-Square procedure to test for staggering versus synchronisation of prices is unapt for situations where the expected number of weekly price changes is less than five. Due to the relatively small number of products in the sample, a formal test cannot be applied here. Alternatively, we use the standard deviation of the share of price changes as proposed by Fisher and Konieczny (2000). When price changes between products within a store are perfectly synchronized in each period, the share of price changes is either zero or one. If for instance, a store changes prices every other week and price changes are perfectly synchronised the standard deviation is expected to be 0,5. Under perfect synchronisation the standard deviation of the share of price changes depends only on the sluggishness of price adjustment over time. Under perfect staggering, however, we expect the share of price
10
changes to be equal at each point in time. Price changes for the offered products occur purely random. For sufficient large samples at each point in time (many products) the standard deviation converges to zero. In small samples the expected level of the standard deviation depends on the number of observations at each point in time and the general level of price sluggishness. With decreasing number of observations per period the measure converges to the upper limit that is characterised by perfect synchronisation. When observations increase to infinity this measure converges to zero. Within this range the relationship between the frequency of price changes and the expected standard deviation of the frequency can be approximated by a quadratic function. The parameters of this set of functions converges to zero by root of m.12 Figure 4 reports the results for meat products as well as fruits and vegetables.
Insert Figure 4 about here In both cases, the results strongly suggest that price changes are staggered almost perfectly within stores even for specific product groups. Thus, the timing of price changes between products within in single stores in most cases is best characterised by a random unique distribution. Even in the case of products groups of close substitutes such as meats, fruits, or vegetables, the stores do not tend to synchronize their own price changes.13 This result contrasts sharply with the findings of Lach and Tsiddon (1996).
5 Conclusions Only a few studies have analysed staggering and synchronisation in pricing behaviour of multi-product firms. These studies used low-frequency data in an environment of high rates of inflation. This paper investigates staggering and synchronisation of prices for German food stores. Weekly observations on prices of ten products over the period from May 1995 to December 2000 (296 weeks) are analysed for 131 food stores. These stores are all members of six large retailer chains and can further be classified into four different store types. We go beyond the existing literature by analysing different forms of staggering and synchronisation. More specifically, we test for synchronisation across stores, within specific types of stores, within retailer chains as well as within individual stores (across product synchronisation). Perfect synchronisation of prices is rejected in all cases. Our results do not support the notion that product prices are adjusted at the same time neither across all stores, nor within specific types of stores or retailers nor even within individual stores. Perfect staggering, on the other hand, can only be rejected in very few cases. Our conclusion, that pricing behaviour in German food stores comes very close to perfect staggering contradicts earlier empirical findings, such as Lach and Tsiddon (1996) who report evidence for across-store staggering but within-store synchronisation. The perceivable lack of synchronisation in pricing behaviour draws into question the significance of fixed, or store specific menu costs. Given that the costs of printing a new menu are shared by all products and possibly by all stores belonging to the same retailer chain, one would expect to find price changes to be synchronised within stores as well as within retailers. In addition, our empirical results do not support the notion of “parallel behaviour” with respect to the timing of price changes. Despite the fact, that the food retail market in Germany is highly concentrated, there is no empirical evidence for a coordination in 12 The number of observations in time also affects the measure, however, as in all cases 295 observations are available, this effect is not considered here. 13 Because the results are very close to perfect staggering we restrain from testing whether there might be a statistically significant deviation. To do this, as for the expected levels of the standard deviation we would have to simulate the expected distribution to derive critical values.
11
price changes across retailers. Although macroeconomic textbooks consider staggering unlikely to be a stable equilibrium, the empirical evidence reported here suggests the opposite: staggering is a common phenomenon in German food stores.
6 References AKERLOF G. AND YELLEN J. (1985): A Near-rational Model of Business Cycle with Wage and
Price Inertia. Quarterly Journal of Economics 100: 823-838.
ANDERSEN T. (1995): Adjustment Costs and Price and Quantity Adjustment. Economics Letters 47: 343-349.
BLINDER A.S. (1991): Why are prices sticky? Preliminary results from an interview study. American Economic Review 81: 89-100.
BALL L. AND CECCHETTI S. (1988): Imperfect Information and Staggered Pricing. American Economic Review 78: 999-1018.
BALL L. AND ROMER D. (1989): The Equilibrium and Optimal Timing of Price Changes. Review of Economic Studies 56: 179-189.
BHASKAR V. (2001) On Endogenously Staggered Prices. forthcoming in: Review of Economic Studies.
BLANCHARD O. AND FISHER S. (1989): Lectures in Macroeconomics. MIT Press, Cambridge Massachusetts.
BLINDER A.S., E.R.D. CANETTI, D.E. LEBOW UND J.B. RUDD (1998): Asking about prices. A new approach to understanding price stickiness. Russell Sage Foundation: New York.
CARLTON D.W. (1983): Equilibrium Fluctuations When Price and Delivery Lags Clear the Market. Bell Journal of Economics 14: 562-572.
CASSINO V. (1995): Menu Costs – A Review of the Literature. Discussion Paper G95/1, Reserve Bank of New Zealand.
DE FRAJA G. (1993): Staggered versus Synchronized Wage Setting in Oligopoly. European Economic Review 37: 1507-1522.
DOMBERGER S. ANND FIEBIG D.G. (1993): The distribution of Price Changes in Oligopoly. The Journal of Industrial Economics 41: 295-313.
DUTTA S., BERGEN M., LEVY D. AND VENABLE R. (1999): Menu Costs, Posted Prices, and Multiproduct Retailers. Journal of Money, Credit and Banking 31: 683-703.
FETHKE G. AND POLICANO A. (1984): Wage Contingencies, the Patterns of Negotiation and Aggregate Implications of Alternative Conttract Structures. Journal of Monetary Economics 14: 151-170.
FISHER T.C.G. AND J.D. KONIECZNY (2000): Synchronization of price changes by multiproduct firms: Evidence from Canadian newspaper prices. Economics Letters 68: 271-277.
KASHYAP A.K. (1995): Sticky prices: New evidence from retail catalogs. The Quarterly Journal of Economics 110: 245-274.
KOELLN K.A. AND RUSH M. (1993): Rigid Prices and Flexible Products. Journal of Economics 19: 57-64.

12
LACH S. UND D. TSIDDON (1992): The behavior of prices and inflation: An empirical analysis of disaggregated price data. Journal of Political Economy 100: 349-389.
LACH S. UND D. TSIDDON (1996): Staggering and synchronization in price setting: an empirical analysis of disaggregated data. American Economic Review 86(5): 1175-1196.
LAU S-H. P. (1996): Aggregate Pattern of Time-Dependent Adjustment Rules I: A Game Theoretic Analysis of Staggered versus Synchronized Wage Setting. Economic Journal 106: 1645-1658.
LUCKE B. (1995): Do Small Menu Costs Explain Large Business Cycles? Economics Letters 47: 185-192.
MANKIW G. (1985): Small Menu Costs and Large Business Cycles: A Macroeconomic Model of Monopoly. The Quarterly Journal of Economics 100: 529-537.
PARKIN M. (1986): The Output-Inflation Tradeoff When Prices are Costly to Change. Journal of Political Economy 94: 200-224.
PHILLIPS P.C.B. AND PERRON P. (1988): Testing a Unit Root in Time Series Regression. Biometrika 75: 335-346.
ROTEMBERG J.J. AND SALONER G. (1987): The Relative Rigidity of Monopoly Pricing. The American Economic Review 77: 917-926.
SHESHINSKI E. UND Y. WEISS (1992): Staggered and synchronized price setting under inflation: the multiproduct monopoly case. Review of Economic Studies 59: 331-359.
TAYLOR, J.B. (1979): Staggered Price Setting in a Macro Model. American Economic Review 60: 108-113.
TAYLOR, J.B. (1980): Aggregate Dynamics and Staggered Contracts. Journal of Political Economy 88: 1-24.
TAYLOR J.B. (1999): Staggered Price and Wage Setting in Macroeconomics. Taylor, J.B. (Ed.): Handbook of Macroeconomics. Elsevier, Amsterdam, Vol. 1: 1009-1050.
TOMMASI M. (1993): Inflation and relative prices: evidence from Argentina. Sheshinski, E. and Y. Weiss (Eds.): Inflation and Cost of Price Adjustment. MIT Press, Massachusetts: 485-511.
7 Figures and Tables
Tab. 1: Selection of store types and retailer companies in the sample
Retailer company Total A B C D E F Other
SSM BSM CSM DC
16 43 68 4
5 12 7 0
7 5 4 2
2 11 12 0
1 3 5 2
0 4 20 0
0 0 6 0
1 8 14 0
Total 131 24 18 25 11 24 6 23 Notes: SSM: Small supermarkets, BSM: Big supermarkets, CSM: Combined supermarkets, DC: Discounter. A to F: Different retailer companies, such as Edeka or Spar group. Source: Data by ZMP, 2001.

13
Fig. 1: Weekly average food retail prices in Germany from 1995 to 2000 (sample of 131 stores over 296 weeks)
0 50 100 150 200 250 300140015001600
0 50 100 150 200 250 3001300140015001600
0 50 100 150 200 250 300
1200
1400
1600
0 50 100 150 200 250 300
150016001700
0 50 100 150 200 250 300300350400
0 50 100 150 200 250 300
300350400450
0 50 100 150 200 250 30050556065
0 50 100 150 200 250 300
200
300
0 50 100 150 200 250 300
150
200
250
0 50 100 150 200 250 300150200250
beef
pork
apples
citrons
carrots
beef
pork
apples
citrons
carrots
liversausage
poultry
pears
lattice
onions
liversausage
poultry
pears
lattice
onions
Legend: All prices in German cent per kg, except the prices of lattice and citrons which are quoted in German cent per piece. Source: Data by ZMP, 2001. Fig. 2: Frequency of price changes per week over all products and stores in percent (sample of 10 food items in 131 stores over 296 weeks)
0 25 50 75 100 125 150 175 200 225 250 275 300
.1
.2
.3
.4
.5
.6
.7
.8
.9
1
Source: Data by ZMP, 2001.
14
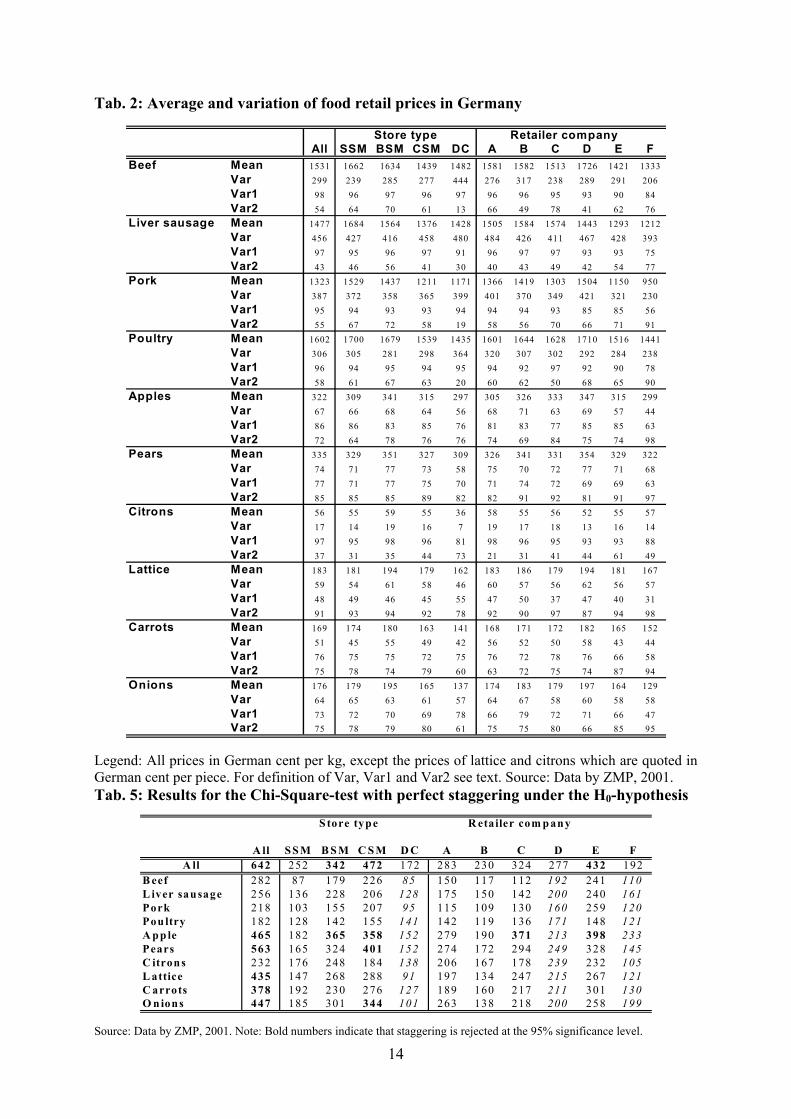
Tab. 2: Average and variation of food retail prices in Germany
Store type Retailer companyAll SSM BSM CSM DC A B C D E F
Beef Mean 1531 1662 1634 1439 1482 1581 1582 1513 1726 1421 1333Var 299 239 285 277 444 276 317 238 289 291 206Var1 98 96 97 96 97 96 96 95 93 90 84Var2 54 64 70 61 13 66 49 78 41 62 76
Liver sausage Mean 1477 1684 1564 1376 1428 1505 1584 1574 1443 1293 1212Var 456 427 416 458 480 484 426 411 467 428 393Var1 97 95 96 97 91 96 97 97 93 93 75Var2 43 46 56 41 30 40 43 49 42 54 77
Pork Mean 1323 1529 1437 1211 1171 1366 1419 1303 1504 1150 950Var 387 372 358 365 399 401 370 349 421 321 230Var1 95 94 93 93 94 94 94 93 85 85 56Var2 55 67 72 58 19 58 56 70 66 71 91
Poultry Mean 1602 1700 1679 1539 1435 1601 1644 1628 1710 1516 1441Var 306 305 281 298 364 320 307 302 292 284 238Var1 96 94 95 94 95 94 92 97 92 90 78Var2 58 61 67 63 20 60 62 50 68 65 90
Apples Mean 322 309 341 315 297 305 326 333 347 315 299Var 67 66 68 64 56 68 71 63 69 57 44Var1 86 86 83 85 76 81 83 77 85 85 63Var2 72 64 78 76 76 74 69 84 75 74 98
Pears Mean 335 329 351 327 309 326 341 331 354 329 322Var 74 71 77 73 58 75 70 72 77 71 68Var1 77 71 77 75 70 71 74 72 69 69 63Var2 85 85 85 89 82 82 91 92 81 91 97
Citrons Mean 56 55 59 55 36 58 55 56 52 55 57Var 17 14 19 16 7 19 17 18 13 16 14Var1 97 95 98 96 81 98 96 95 93 93 88Var2 37 31 35 44 73 21 31 41 44 61 49
Lattice Mean 183 181 194 179 162 183 186 179 194 181 167Var 59 54 61 58 46 60 57 56 62 56 57Var1 48 49 46 45 55 47 50 37 47 40 31Var2 91 93 94 92 78 92 90 97 87 94 98
Carrots Mean 169 174 180 163 141 168 171 172 182 165 152Var 51 45 55 49 42 56 52 50 58 43 44Var1 76 75 75 72 75 76 72 78 76 66 58Var2 75 78 74 79 60 63 72 75 74 87 94
Onions Mean 176 179 195 165 137 174 183 179 197 164 129Var 64 65 63 61 57 64 67 58 60 58 58Var1 73 72 70 69 78 66 79 72 71 66 47Var2 75 78 79 80 61 75 75 80 66 85 95
Legend: All prices in German cent per kg, except the prices of lattice and citrons which are quoted in German cent per piece. For definition of Var, Var1 and Var2 see text. Source: Data by ZMP, 2001. Tab. 5: Results for the Chi-Square-test with perfect staggering under the H0-hypothesis
S tore type R etailer com p any
A ll SS M B SM C S M D C A B C D E FA ll 642 252 342 472 172 283 230 324 277 432 192
B eef 282 87 179 226 85 150 117 112 192 241 110L iver sausage 256 136 228 206 128 175 150 142 200 240 161Pork 218 103 155 207 95 115 109 130 160 259 120Pou ltry 182 128 142 155 141 142 119 136 171 148 121A pp le 465 182 365 358 152 279 190 371 213 398 233Pears 563 165 324 401 152 274 172 294 249 328 145C itrons 232 176 248 184 138 206 167 178 239 232 105L attice 435 147 268 288 91 197 134 247 215 267 121C arrots 378 192 230 276 127 189 160 217 211 301 130O n ions 447 185 301 344 101 263 138 218 200 258 199
Source: Data by ZMP, 2001. Note: Bold numbers indicate that staggering is rejected at the 95% significance level.

15
Fig. 3: Frequency of price changes per week over all stores for each food item in percent (sample of 131 stores over 296 weeks)
0 50 100 150 200 250 300
.5
1
0 50 100 150 200 250 300
.5
1
0 50 100 150 200 250 300
.5
1
0 50 100 150 200 250 300
.5
1
0 50 100 150 200 250 300
.5
1
0 50 100 150 200 250 300
.5
1
0 50 100 150 200 250 300
.5
1
0 50 100 150 200 250 300
.5
1
0 50 100 150 200 250 300
.5
1
0 50 100 150 200 250 300
.5
1
beef
pork
apples
citrons
carrots
liversausage
poultry
pears
lattice
onions
Source: Data by ZMP, 2001. Fig. 4: The relationship between the average frequency of price changes and the standard deviation of the frequency for meat products and fruits and vegetables
Relationship estimated from sample datay = -0.4913x2 + 0.5232x + 0.1221R2 = 0.5115
0.00
0.05
0.10
0.15
0.20
0.25
0.30
0.35
0.40
0.45
0.50
0.55
0 0.1 0.2 0.3 0.4 0.5 0.6 0.7 0.8 0.9 1
perfect synchronisationand 5 %lower confidence band
Frequency of price changes
Standard deviationof frequency of price changes
perfect staggering
Sample data
Meats
Relationship estimated from sample datay = -0.5372x2 + 0.6134x + 0.061R2 = 0.4281
0.00
0.05
0.10
0.15
0.20
0.25
0.30
0.35
0.40
0.45
0.50
0.55
0 0.1 0.2 0.3 0.4 0.5 0.6 0.7 0.8 0.9 1
perfect synchronisationand 5 %lower confidence band
Frequency of price changes
Standard deviationof frequency of price changes
perfect staggering
Sample data
Fruits andvegetables