Staff paper 15 - Financial model for four year regulatory period 2010 ...
75
Staff paper 15 - Financial model for four year regulatory period 2010-14 Financial model (version 2.1) Financial modelling worksheets Tariff Basket worksheets Modelling: K solving sheet TA1 Customer base: Tariffs (Primary revenue) Modelling: Revenue allocation targets T1 Customer base: Revenue summary by source Modelling: Scenario control sheet T2 Customer base: Revenue summary by tariff basket and revenue group Modelling: Phasing sheet T3 Customer base: Water - retail - primary revenue: retail charges from unmeasured household premises B1 Base historic data: Profit and Loss account T4 Customer Base: Water - retail - primary revenue: retail charges from measured household premises B2 Base historic data: Balance Sheet T5 Customer base: Waste water - retail - primary revenue: retail charges from unmeasured household premises B3 Base historic data: Cash Flow T6 Customer base: Waste water - retail - primary revenue: retail foul sewerage charges from measured household premises B4 Base historic data: Working Capital and other non-trade debtors/creditors T7 Customer base: Waste water - retail - primary revenue: retail property drainage charges from measured household premises B5 Base historic data: Tax T8 Customer base: Waste water - retail - primary revenue: retail roads drainage charges from measured household premises B6 Base historic data: Maturity profile of closing (embedded) debt (as of 31 March 2008) T9 Customer base: Water - wholesale - primary revenue: wholesale water charges (assessed) to licensed providers through charges scheme B7 Base historic data: Depreciation and amortisation of closing assets T10 Customer base: Water - wholesale - primary revenue: wholesale water charges (measured) to licensed providers through charges scheme in respect of supply points consuming up to and including 100Ml/annum A1 Assumptions: Inflation T11 Customer base: Water - wholesale - primary revenue: wholesale water charges (measured) to licensed providers through charges scheme in respect of supply points consuming between 100Ml/annum and up to and including 250Ml/annum A2 Assumptions: Financing T12 Customer base: Water - wholesale - primary revenue: wholesale water charges (measured) to licensed providers through charges scheme in respect of supply points consuming between 250Ml/annum and up to and including 1,000Ml/annum A3 Assumptions: Capital expenditure T13 Customer base: Water - wholesale - primary revenue: wholesale water charges (measured) to licensed providers through charges scheme in respect of supply points consuming greater than 1,000Ml/annum A4 Assumptions: Asset Disposals T14 Customer base: Waste water - wholesale - primary revenue: foul sewerage charges (assessed) to licensed providers through charges scheme A5 Assumptions: Non Fixed assets T15 Customer base: Waste water - wholesale - primary revenue: foul sewerage charges (measured) to licensed providers through charges scheme A6 Assumptions: Tax T16 Customer base: Waste water - wholesale - primary revenue: surface water drainage charges to licensed providers through charges scheme P1 Process sheet: Capital Expenditure T17 Customer base: Waste water - wholesale - primary revenue: trade effluent charges to licensed providers through charges scheme P2 Process sheet: Depreciation T18 Customer base: Water - wholesale - primary revenue: wholesale charges for miscellaneous services to licensed providers P3 Process sheet: Book Value T19 Customer base: Waste water - wholesale - primary revenue: wholesale charges for miscellaneous services to licensed providers through charges scheme P4 Process sheet: Regulatory capital value T20 Customer base: Schedule 3 agreements P5 Process sheet: Interest income and interest expense T21 Customer base: Retail - non-primary revenue : retail revenue from charges to household premises through charges scheme P6 Process sheet: Capital allowances T22 Customer base: Wholesale - non-primary revenue : wholesale revenue from charges to Licensed Providers through charges scheme P7 Process sheet: Tax T23 Customer base: charge cap workings P8 Process sheet: Cost of capital P9 Process sheet: Current Cost reserve adjustments P10 Process sheet: Revenue calculation formula O1 Output Sheet: Profit and Loss Account O2 Output Sheet: Balance Sheet O3 Output Sheet: Cash Flow O4 Output Sheet: Financial ratios and debt calculations O5 Output Sheet: Investment summary O6 Output sheet: charge caps E1 Alternative inputs: Operating costs, PPP and inflation scenarios E2 Alternative inputs: Q&S3b: Capital enhancement (total investment and apportionments) scenarios E3 Alternative inputs: Q&S3b: Capital maintenance (total investment and apportionments) scenarios E4 Alternative inputs: Q&S3a: Capital enhancement (total investment and apportionments) scenarios E5 Alternative inputs: Cost of Capital, Financing Costs and Dividend Scenarios E6 Alternative inputs: Revenue Options
-
Upload
khangminh22 -
Category
Documents
-
view
5 -
download
0
Transcript of Staff paper 15 - Financial model for four year regulatory period 2010 ...

Staff paper 15 - Financial model for four year regulatory period 2010-14
Financial model (version 2.1)
Financial modelling worksheets Tariff Basket worksheets
Modelling: K solving sheet TA1 Customer base: Tariffs (Primary revenue)
Modelling: Revenue allocation targets T1 Customer base: Revenue summary by source
Modelling: Scenario control sheet T2 Customer base: Revenue summary by tariff basket and revenue group
Modelling: Phasing sheet T3 Customer base: Water - retail - primary revenue: retail charges from unmeasured household premises
B1 Base historic data: Profit and Loss account T4 Customer Base: Water - retail - primary revenue: retail charges from measured household premises
B2 Base historic data: Balance Sheet T5 Customer base: Waste water - retail - primary revenue: retail charges from unmeasured household premises
B3 Base historic data: Cash Flow T6 Customer base: Waste water - retail - primary revenue: retail foul sewerage charges from measured household premises
B4 Base historic data: Working Capital and other non-trade debtors/creditors T7 Customer base: Waste water - retail - primary revenue: retail property drainage charges from measured household premises
B5 Base historic data: Tax T8 Customer base: Waste water - retail - primary revenue: retail roads drainage charges from measured household premises
B6 Base historic data: Maturity profile of closing (embedded) debt (as of 31 March 2008) T9 Customer base: Water - wholesale - primary revenue: wholesale water charges (assessed) to licensed providers through charges scheme
B7 Base historic data: Depreciation and amortisation of closing assets T10 Customer base: Water - wholesale - primary revenue: wholesale water charges (measured) to licensed providers through charges scheme in respect of supply points consuming up to and including 100Ml/annum
A1 Assumptions: Inflation T11 Customer base: Water - wholesale - primary revenue: wholesale water charges (measured) to licensed providers through charges scheme in respect of supply points consuming between 100Ml/annum and up to and including 250Ml/annum
A2 Assumptions: Financing T12 Customer base: Water - wholesale - primary revenue: wholesale water charges (measured) to licensed providers through charges scheme in respect of supply points consuming between 250Ml/annum and up to and including 1,000Ml/annum
A3 Assumptions: Capital expenditure T13 Customer base: Water - wholesale - primary revenue: wholesale water charges (measured) to licensed providers through charges scheme in respect of supply points consuming greater than 1,000Ml/annum
A4 Assumptions: Asset Disposals T14 Customer base: Waste water - wholesale - primary revenue: foul sewerage charges (assessed) to licensed providers through charges scheme
A5 Assumptions: Non Fixed assets T15 Customer base: Waste water - wholesale - primary revenue: foul sewerage charges (measured) to licensed providers through charges scheme
A6 Assumptions: Tax T16 Customer base: Waste water - wholesale - primary revenue: surface water drainage charges to licensed providers through charges scheme
P1 Process sheet: Capital Expenditure T17 Customer base: Waste water - wholesale - primary revenue: trade effluent charges to licensed providers through charges scheme
P2 Process sheet: Depreciation T18 Customer base: Water - wholesale - primary revenue: wholesale charges for miscellaneous services to licensed providers
P3 Process sheet: Book Value T19 Customer base: Waste water - wholesale - primary revenue: wholesale charges for miscellaneous services to licensed providers through charges scheme
P4 Process sheet: Regulatory capital value T20 Customer base: Schedule 3 agreements
P5 Process sheet: Interest income and interest expense T21 Customer base: Retail - non-primary revenue : retail revenue from charges to household premises through charges scheme
P6 Process sheet: Capital allowances T22 Customer base: Wholesale - non-primary revenue : wholesale revenue from charges to Licensed Providers through charges scheme
P7 Process sheet: Tax T23 Customer base: charge cap workings
P8 Process sheet: Cost of capital
P9 Process sheet: Current Cost reserve adjustments
P10 Process sheet: Revenue calculation formula
O1 Output Sheet: Profit and Loss Account
O2 Output Sheet: Balance Sheet
O3 Output Sheet: Cash Flow
O4 Output Sheet: Financial ratios and debt calculations
O5 Output Sheet: Investment summary
O6 Output sheet: charge caps
E1 Alternative inputs: Operating costs, PPP and inflation scenarios
E2 Alternative inputs: Q&S3b: Capital enhancement (total investment and apportionments) scenarios
E3 Alternative inputs: Q&S3b: Capital maintenance (total investment and apportionments) scenarios
E4 Alternative inputs: Q&S3a: Capital enhancement (total investment and apportionments) scenarios
E5 Alternative inputs: Cost of Capital, Financing Costs and Dividend Scenarios
E6 Alternative inputs: Revenue Options

Modelling: K solving sheet
Revenue approach selection
Revenue approach
1 Option 1: Fixed revenue
2 Option 2: Revenue calculation formula
3 Option 3: Tariff basket revenue Use sheet 'TA1' for tariff assumptions, click here to open this table
4 Option 4: Financial ratios approach
K factor solving (only if option 1 or 2 selected above)
Revenue proportion allocation
5 Selection of target revenue approach (1, 2, 3) 3
1.- Straight line, 2.- Input on year one, straight line thereafter, 3.- all inputs
Outputs: Tariff Baskets (nominal)
Retail Tariff baskets Unit 2009-10 2010-11 2011-12 2012-13 2013-14
6 Tariff Basket 1: Water - Retail - Primary (charges to households) % increase 3.7% 0.3% 0.3% 0.3% 0.3%
7 Tariff Basket 2: Water - Wholesale - Primary (charges to licensed providers) % increase 3.1% -1.6% -1.6% -1.6% -1.6%
8 Tariff Basket 3: Waste water - Retail - Primary (charges to households) % increase 3.7% 1.6% 1.6% 1.6% 1.6%
9 Tariff Basket 4: Waste water - Wholesale - Primary - foul and surface drainage (charges to licensed providers) % increase 3.0% -4.8% -4.8% -4.8% -4.8%
10 Tariff Basket 5: Waste water - Wholesale - Primary - trade effluent (charges to licensed providers) % increase 3.0% 3.5% 3.5% 3.5% 3.5%
Outputs: Tariff Baskets (real)
Retail Tariff baskets Unit 2009-10 2010-11 2011-12 2012-13 2013-14
11 Tariff Basket 1: Water - Retail - Primary (charges to households) % increase 1.2% -2.2% -2.2% -2.2% -2.2%
12 Tariff Basket 2: Water - Wholesale - Primary (charges to licensed providers) % increase 0.6% -4.1% -4.1% -4.1% -4.1%
13 Tariff Basket 3: Waste water - Retail - Primary (charges to households) % increase 1.2% -0.9% -0.9% -0.9% -0.9%
14 Tariff Basket 4: Waste water - Wholesale - Primary - foul and surface drainage (charges to licensed providers) % increase 0.5% -7.3% -7.3% -7.3% -7.3%
15 Tariff Basket 5: Waste water - Wholesale - Primary - trade effluent (charges to licensed providers) % increase 0.5% 1.0% 1.0% 1.0% 1.0%
Non tariff key outputs
Wholesale Tariffs Unit 2009-10 2010-11 2011-12 2012-13 2013-14
16 Wholesale Revenue £m 1064.5 1071.7 1075.1 1080.5 1086.5
17 Ratio 1: Cash interest cover Nr. 3.8 3.5 3.5 3.4 3.3
18 Ratio 2: Adjusted cash interest cover I (maintenance charges) Nr. 1.5 1.1 1.2 1.0 0.9
19 Ratio 3: Adjusted cash interest cover II (maintenance expenditure) Nr. 2.6 2.1 2.1 2.0 1.9
20 Ratio 4: Funds from operations:debt % 15.1% 13.2% 13.2% 12.4% 11.7%
21 Ratio 5: Retained cashflow:debt % 15.1% 13.2% 13.2% 12.4% 11.7%
22 Ratio 6: Gearing % 54.0% 54.2% 54.3% 54.4% 54.5%
Solve K

Modelling: Revenue allocation targets
Current revenue group revenue allocation
% Revenue allocated to Revenue groups (net of non-primary revenue) Units Field Type Additional Info 2006-07 2007-08 2008-09 2009-10 2010-11 2011-12 2012-13 2013-14
1 Revenue: Input or building blocks (Financial model) £m C 986.7 1,026.4 1,064.5 1,071.7 1,075.1 1,080.5 1,086.5
2 minus: Non-primary revenue - retail £m C 4.0 4.8 4.9 4.8 5.3 5.4 5.5
3 minus Non-primary revenue - wholesale £m C 3.9 2.9 2.6 2.8 3.8 3.9 4.0
4 Primary revenue (from Financial model) £m C 978.8 1,018.8 1,057.0 1,064.1 1,066.0 1,071.2 1,077.1
5 Primary revenue (from Customer base) £m C 978.8 1,018.8 1,057.0 1,064.1 1,066.0 1,071.2 1,077.1
6 Difference £m C 0.0 0.0 0.0 0.0 0.0 0.0 0.0
% Revenue allocated to Revenue groups (net of non-primary revenue) Units Field Type Additional Info 2006-07 2007-08 2008-09 2009-10 2010-11 2011-12 2012-13 2013-14
7 Revenue Group 1: household primary revenue - water % C 33.1% 33.3% 33.6% 33.7% 34.0% 34.2% 34.4%
8 Revenue Group 2: household primary revenue - waste water % C 35.6% 35.8% 36.1% 36.7% 37.5% 38.1% 38.8%
9 Revenue Group 3: Licensed provider primary revenue - water - 0-100Ml/a % C 8.3% 8.1% 7.9% 7.8% 7.6% 7.5% 7.3%
10 Revenue Group 4: Licensed provider primary revenue - water - >100-250Ml/a % C 0.7% 0.8% 0.8% 0.8% 0.8% 0.8% 0.8%
11 Revenue Group 5: Licensed provider primary revenue - water - >250-1,000Ml/a % C 0.6% 0.6% 0.6% 0.6% 0.6% 0.6% 0.6%
12 Revenue Group 6: Licensed provider primary revenue - water - >1,000Ml/a % C 1.7% 1.7% 1.7% 1.7% 1.6% 1.6% 1.5%
13 Revenue Group 7: Licensed provider primary revenue - Foul sewerage % C 8.2% 8.0% 7.8% 6.9% 6.0% 5.2% 4.5%
14 Revenue Group 8: Licensed provider primary revenue - surface drainage % C 9.4% 9.2% 9.1% 9.2% 9.2% 9.2% 9.2%
15 Revenue Group 9: Licensed provider primary revenue - trade effluent % C 2.3% 2.3% 2.4% 2.6% 2.7% 2.8% 2.9%
16 Total group revenue as % of Financial model revenue % C 100.0% 100.0% 100.0% 100.0% 100.0% 100.0% 100.0%
% Revenue allocated to tariff baskets (net of non-primary revenue) Units Field Type Additional Info 2006-07 2007-08 2008-09 2009-10 2010-11 2011-12 2012-13 2013-14
17 Tariff Basket 1: Water - Retail - Primary (charges to households) % C 33.1% 33.3% 33.6% 33.7% 34.0% 34.2% 34.4%
18 Tariff Basket 2: Water - Wholesale - Primary (charges to licensed providers) % C 11.4% 11.2% 11.0% 10.8% 10.6% 10.4% 10.3%
19 Tariff Basket 3: Waste water - Retail - Primary (charges to households) % C 35.6% 35.8% 36.1% 36.7% 37.5% 38.1% 38.8%
20 Tariff Basket 4: Waste water - Wholesale - Primary - foul and surface drainage (charges to licensed providers) % C 17.5% 17.3% 16.9% 16.1% 15.2% 14.4% 13.7%
21 Tariff Basket 5: Waste water - Wholesale - Primary - trade effluent (charges to licensed providers) % C 2.3% 2.3% 2.4% 2.6% 2.7% 2.8% 2.9%
22 Total revenue % C 100.0% 100.0% 100.0% 100.0% 100.0% 100.0% 100.0%
Revenue target: Alternative 1 - straight line
% Revenue allocated to Revenue groups (net of non-primary revenue) Units Field Type Additional Info 2006-07 2007-08 2008-09 2009-10 2010-11 2011-12 2012-13 2013-14
23 Revenue Group 1: household primary revenue - water % I/C 33.1% 33.3% 33.6% 33.7% 34.0% 34.2% 34.4%
24 Revenue Group 2: household primary revenue - waste water % I/C 35.6% 35.8% 36.1% 36.7% 37.4% 38.1% 38.8%
25 Revenue Group 3: Licensed provider primary revenue - water - 0-100Ml/a % I/C 8.3% 8.1% 7.9% 7.8% 7.6% 7.4% 7.3%
26 Revenue Group 4: Licensed provider primary revenue - water - >100-250Ml/a % I/C 0.7% 0.8% 0.8% 0.8% 0.8% 0.8% 0.8%
27 Revenue Group 5: Licensed provider primary revenue - water - >250-1,000Ml/a % I/C 0.6% 0.6% 0.6% 0.6% 0.6% 0.6% 0.6%
28 Revenue Group 6: Licensed provider primary revenue - water - >1,000Ml/a % I/C 1.7% 1.7% 1.7% 1.7% 1.6% 1.6% 1.5%
29 Revenue Group 7: Licensed provider primary revenue - Foul sewerage % I/C 8.2% 8.0% 7.8% 6.9% 6.0% 5.3% 4.5%
30 Revenue Group 8: Licensed provider primary revenue - surface drainage % I/C 9.4% 9.2% 9.1% 9.2% 9.2% 9.2% 9.2%
31 Revenue Group 9: Licensed provider primary revenue - trade effluent % I/C 2.3% 2.3% 2.4% 2.6% 2.7% 2.8% 2.9%
32 Total revenue % C 100.0% 100.0% 100.0% 100.0% 100.0% 100.0% 100.0%
% Revenue allocated to tariff baskets (net of non-primary revenue) Units Field Type Additional Info 2006-07 2007-08 2008-09 2009-10 2010-11 2011-12 2012-13 2013-14
33 Tariff Basket 1: Water - Retail - Primary (charges to households) % C 33.1% 33.3% 33.6% 33.7% 34.0% 34.2% 34.4%
34 Tariff Basket 2: Water - Wholesale - Primary (charges to licensed providers) % C 11.4% 11.2% 11.0% 10.8% 10.6% 10.4% 10.3%
35 Tariff Basket 3: Waste water - Retail - Primary (charges to households) % C 35.6% 35.8% 36.1% 36.7% 37.4% 38.1% 38.8%
36 Tariff Basket 4: Waste water - Wholesale - Primary - foul and surface drainage (charges to licensed providers) % C 17.5% 17.3% 16.9% 16.2% 15.3% 14.5% 13.7%
37 Tariff Basket 5: Waste water - Wholesale - Primary - trade effluent (charges to licensed providers) % C 2.3% 2.3% 2.4% 2.6% 2.7% 2.8% 2.9%
38 Total revenue % C 100.0% 100.0% 100.0% 100.0% 100.0% 100.0% 100.0%

Revenue target: Alternative 2 - Input 1st year, straight line thereafter
% Revenue allocated to Revenue groups (net of non-primary revenue) Units Field Type Additional Info 2006-07 2007-08 2008-09 2009-10 2010-11 2011-12 2012-13 2013-14
39 Revenue Group 1: household primary revenue - water % I/C 33.1% 33.3% 33.6% 34.3% 34.3% 34.4% 34.4%
40 Revenue Group 2: household primary revenue - waste water % I/C 35.6% 35.8% 36.1% 38.8% 38.8% 38.8% 38.8%
41 Revenue Group 3: Licensed provider primary revenue - water - 0-100Ml/a % I/C 8.3% 8.1% 7.9% 7.3% 7.3% 7.3% 7.3%
42 Revenue Group 4: Licensed provider primary revenue - water - >100-250Ml/a % I/C 0.7% 0.8% 0.8% 0.8% 0.8% 0.8% 0.8%
43 Revenue Group 5: Licensed provider primary revenue - water - >250-1,000Ml/a % I/C 0.6% 0.6% 0.6% 0.6% 0.6% 0.6% 0.6%
44 Revenue Group 6: Licensed provider primary revenue - water - >1,000Ml/a % I/C 1.7% 1.7% 1.7% 1.5% 1.5% 1.5% 1.5%
45 Revenue Group 7: Licensed provider primary revenue - Foul sewerage % I/C 8.2% 8.0% 7.8% 4.6% 4.6% 4.5% 4.5%
46 Revenue Group 8: Licensed provider primary revenue - surface drainage % I/C 9.4% 9.2% 9.1% 9.2% 9.2% 9.2% 9.2%
47 Revenue Group 9: Licensed provider primary revenue - trade effluent % I/C 2.3% 2.3% 2.4% 2.9% 2.9% 2.9% 2.9%
48 Total revenue % C 100.0% 100.0% 100.0% 100.00% 100.0% 100.0% 100.0%
% Revenue allocated to tariff baskets (net of non-primary revenue) Units Field Type Additional Info 2006-07 2007-08 2008-09 2009-10 2010-11 2011-12 2012-13 2013-14
49 Tariff Basket 1: Water - Retail - Primary (charges to households) % C 33.1% 33.3% 33.6% 34.3% 34.3% 34.4% 34.4%
50 Tariff Basket 2: Water - Wholesale - Primary (charges to licensed providers) % C 11.4% 11.2% 11.0% 10.2% 10.2% 10.3% 10.3%
51 Tariff Basket 3: Waste water - Retail - Primary (charges to households) % C 35.6% 35.8% 36.1% 38.8% 38.8% 38.8% 38.8%
52 Tariff Basket 4: Waste water - Wholesale - Primary - foul and surface drainage (charges to licensed providers) % C 17.5% 17.3% 16.9% 13.7% 13.7% 13.7% 13.7%
53 Tariff Basket 5: Waste water - Wholesale - Primary - trade effluent (charges to licensed providers) % C 2.3% 2.3% 2.4% 2.9% 2.9% 2.9% 2.9%
54 Total revenue % C 100.0% 100.0% 100.0% 100.0% 100.0% 100.0% 100.0%
Revenue target: Alternative 3 - Custom inputs
% Revenue allocated to Revenue groups (net of non-primary revenue) Units Field Type Additional Info 2006-07 2007-08 2008-09 2009-10 2010-11 2011-12 2012-13 2013-14
55 Revenue Group 1: household primary revenue - water % I/C 33.1% 33.3% 33.6% 33.7% 34.0% 34.2% 34.4%
56 Revenue Group 2: household primary revenue - waste water % I/C 35.6% 35.8% 36.1% 36.7% 37.5% 38.1% 38.8%
57 Revenue Group 3: Licensed provider primary revenue - water - 0-100Ml/a % I/C 8.3% 8.1% 7.9% 7.8% 7.6% 7.5% 7.3%
58 Revenue Group 4: Licensed provider primary revenue - water - >100-250Ml/a % I/C 0.7% 0.8% 0.8% 0.8% 0.8% 0.8% 0.8%
59 Revenue Group 5: Licensed provider primary revenue - water - >250-1,000Ml/a % I/C 0.6% 0.6% 0.6% 0.6% 0.6% 0.6% 0.6%
60 Revenue Group 6: Licensed provider primary revenue - water - >1,000Ml/a % I/C 1.7% 1.7% 1.7% 1.7% 1.6% 1.6% 1.5%
61 Revenue Group 7: Licensed provider primary revenue - Foul sewerage % I/C 8.2% 8.0% 7.8% 6.9% 6.0% 5.2% 4.5%
62 Revenue Group 8: Licensed provider primary revenue - surface drainage % I/C 9.4% 9.2% 9.1% 9.2% 9.2% 9.2% 9.2%
63 Revenue Group 9: Licensed provider primary revenue - trade effluent % I/C 2.3% 2.3% 2.4% 2.6% 2.7% 2.8% 2.9%
64 Total revenue % C 100.0% 100.0% 100.0% 100.0% 100.0% 100.0% 100.0%
% Revenue allocated to tariff baskets (net of non-primary revenue) Units Field Type Additional Info 2006-07 2007-08 2008-09 2009-10 2010-11 2011-12 2012-13 2013-14
65 Tariff Basket 1: Water - Retail - Primary (charges to households) % C 33.1% 33.3% 33.6% 33.7% 34.0% 34.2% 34.4%
66 Tariff Basket 2: Water - Wholesale - Primary (charges to licensed providers) % C 11.4% 11.2% 11.0% 10.8% 10.6% 10.4% 10.3%
67 Tariff Basket 3: Waste water - Retail - Primary (charges to households) % C 35.6% 35.8% 36.1% 36.7% 37.5% 38.1% 38.8%
68 Tariff Basket 4: Waste water - Wholesale - Primary - foul and surface drainage (charges to licensed providers) % C 17.5% 17.3% 16.9% 16.1% 15.2% 14.4% 13.7%
69 Tariff Basket 5: Waste water - Wholesale - Primary - trade effluent (charges to licensed providers) % C 2.3% 2.3% 2.4% 2.6% 2.7% 2.8% 2.9%
70 Total revenue % C 100.0% 100.0% 100.0% 100.0% 100.0% 100.0% 100.0%
Revenue target: Selected alternative
% Revenue allocated to Revenue groups (net of non-primary revenue) Units Field Type Additional Info 2006-07 2007-08 2008-09 2009-10 2010-11 2011-12 2012-13 2013-14
71 Revenue Group 1: household primary revenue - water % I/C 33.1% 33.3% 33.6% 33.7% 34.0% 34.2% 34.4%
72 Revenue Group 2: household primary revenue - waste water % I/C 35.6% 35.8% 36.1% 36.7% 37.5% 38.1% 38.8%
73 Revenue Group 3: Licensed provider primary revenue - water - 0-100Ml/a % I/C 8.3% 8.1% 7.9% 7.8% 7.6% 7.5% 7.3%
74 Revenue Group 4: Licensed provider primary revenue - water - 100-250Ml/a % I/C 0.7% 0.8% 0.8% 0.8% 0.8% 0.8% 0.8%
75 Revenue Group 5: Licensed provider primary revenue - water - 250-1,000Ml/a % I/C 0.6% 0.6% 0.6% 0.6% 0.6% 0.6% 0.6%
76 Revenue Group 6: Licensed provider primary revenue - water - 1,000Ml/a plus % I/C 1.7% 1.7% 1.7% 1.7% 1.6% 1.6% 1.5%
77 Revenue Group 7: Licensed provider primary revenue - Foul sewerage % I/C 8.2% 8.0% 7.8% 6.9% 6.0% 5.2% 4.5%
78 Revenue Group 8: Licensed provider primary revenue - surface drainage % I/C 9.4% 9.2% 9.1% 9.2% 9.2% 9.2% 9.2%
79 Revenue Group 9: Licensed provider primary revenue - trade effluent % I/C 2.3% 2.3% 2.4% 2.6% 2.7% 2.8% 2.9%
80 Total revenue % C 100.0% 100.0% 100.0% 100.0% 100.0% 100.0% 100.0%
% Revenue allocated to tariff baskets (net of non-primary revenue) Units Field Type Additional Info 2006-07 2007-08 2008-09 2009-10 2010-11 2011-12 2012-13 2013-14
81 Tariff Basket 1: Water - Retail - Primary (charges to households) % C 33.1% 33.3% 33.6% 33.7% 34.0% 34.2% 34.4%
82 Tariff Basket 2: Water - Wholesale - Primary (charges to licensed providers) % C 11.4% 11.2% 11.0% 10.8% 10.6% 10.4% 10.3%
83 Tariff Basket 3: Waste water - Retail - Primary (charges to households) % C 35.6% 35.8% 36.1% 36.7% 37.5% 38.1% 38.8%
84 Tariff Basket 4: Waste water - Wholesale - Primary - foul and surface drainage (charges to licensed providers) % C 17.5% 17.3% 16.9% 16.1% 15.2% 14.4% 13.7%
85 Tariff Basket 5: Waste water - Wholesale - Primary - trade effluent (charges to licensed providers) % C 2.3% 2.3% 2.4% 2.6% 2.7% 2.8% 2.9%
86 Total revenue % C 100.0% 100.0% 100.0% 100.0% 100.0% 100.0% 100.0%

Base historic data: Profit and Loss account
Historic Cost Accounts
Scottish Water (Core - wholesale) - Historic Cost Profit and Loss Units Field type Additional Info 2006-07 2007-08
1 Turnover £m I Historic values (outturn) 972.8 986.7
2 Operating expenditure (excluding PPP) £m I Historic values (outturn) -256.4 -259.0
3 PPP operating costs £m I Historic values (outturn) -125.7 -127.6
4 Historical Cost Depreciation £m I Historic values (outturn) -137.1 -160.8
5 Infrastructure Renewals charge £m I Historic values (outturn) -88.0 -90.0
6 Amortisation of PPP assets £m I Historic values (outturn) -1.6 -1.6
7 Amortisation of deferred income £m I Historic values (outturn) 1.1 0.9
8 Historic cost profit or loss on disposal of fixed assets £m I Historic values (outturn) 1.4 9.3
9 Operating income £m I Historic values (outturn) 0.0 0.0
10 Operating profit £m C Historic values (outturn) 366.5 357.9
11 Other income £m I Historic values (outturn) 0.0 0.0
12 Net interest receivable less payable £m I Historic values (outturn) -142.6 -140.3
13 Profit on ordinary activities before taxation £m C Historic values (outturn) 223.9 217.6
14 Taxation - current £m I Historic values (outturn) 0.0 -0.6
15 Taxation - deferred £m I Historic values (outturn) -68.2 -36.7
16 Profit on ordinary activities after taxation £m C Historic values (outturn) 155.6 180.4
17 Extraordinary items £m I Historic values (outturn) 0.0 0.0
18 Historic cost profit for the year £m C Historic values (outturn) 155.6 180.4
19 Dividends £m I Historic values (outturn) 0.0 0.0
20 Historic Cost retained profit for year £m C Historic values (outturn) 155.6 180.4
Current Cost Accounts
Current Cost Profit and Loss Units Field type Additional Info 2006-07 2007-08
21 Turnover £m B Outturn 972.8 986.7
22 Current cost operating expenditure (excluding PPP) £m B Outturn -256.4 -259.0
23 PPP operating costs £m B Outturn -125.7 -127.6
24 Current Cost Depreciation £m I Outturn -163.6 -192.2
25 Infrastructure Renewals Charge £m B Outturn -88.0 -90.0
26 Amortisation of PPP assets £m B Outturn -1.6 -1.6
27 Amortisation of deferred income £m I Outturn 1.1 0.9
28 Current cost profit or loss on disposal of fixed assets £m I Outturn 1.4 9.3
29 Operating income £m B Outturn 0.0 0.0
30 Current cost operating profit before working capital adjustment £m C Outturn 340.0 326.6
31 Working capital adjustment £m I Outturn 7.3 6.8
32 Current cost operating profit £m C Outturn 347.2 333.4
33 Other income £m B Outturn 0.0 0.0
34 Net interest receivable less payable £m B Outturn -142.6 -140.3
35 Financing adjustment £m I Outturn 10.4 3.6
36 Current cost profit before taxation £m C Outturn 215.0 196.7
37 Taxation - Current taxation £m B Outturn 0.0 -0.6
38 Taxation - Deferred £m B Outturn -68.2 -36.7
39 Current cost profit on ordinary activities £m C Outturn 146.8 159.4
40 Extraordinary items £m B Outturn 0.0 0.0
41 Current cost profit for the year £m C Outturn 146.8 159.4
42 Dividends £m B Outturn 0.0 0.0
43 Current cost retained profit £m C Outturn 146.8 159.4

Base historic data: Balance Sheet
Historic Cost Accounts
Description Units Field Additional Info 2006-07 2007-08
Fixed Assets1 Tangible Assets £m I/B Historic values (outturn) 3,462.0 3,811.2
2 Investment - loan to group company £m I Historic values (outturn) 64.5 58.5
3 Investment - Other £m I Historic values (outturn) 0.0 34.7
4 Total fixed assets £m C Historic values (outturn) 3,526.6 3,904.4
Current Assets5 Stocks £m B Historic values (outturn) 2.9 3.6
6 Debtors £m I Historic values (outturn) 56.1 79.2
7 Cash (net of overdrafts) £m I Historic values (outturn) 3.3 -0.3
8 Short term deposits £m I Historic values (outturn) 0.0 0.0
9 Gilts buffer £m I Historic values (outturn) 0.0 27.4
10 PPP assets £m I Historic values (outturn) 35.5 33.9
11 Infrastructure Renewals prepayment/accrual £m I Historic values (outturn) -20.7 4.8
12 Total current assets £m C Historic values (outturn) 77.1 148.7
Creditors: amounts falling due within one year
13 Creditors (including corporation tax and dividends payable) £m I Historic values (outturn) -278.3 -282.3
14 Borrowings (excl. Govt. loans) £m I/B Historic values (outturn) -6.6 -8.0
15 Total creditors £m C Historic values (outturn) -284.8 -290.2
16 Net current assets £m C Historic values (outturn) -207.7 -141.6
17 Total assets less current liabilities £m C Historic values (outturn) 3,318.8 3,762.8
Creditors: amounts falling due after one year18 Borrowings (excl. Govt. loans) £m I/B Historic values (outturn) -18.1 -10.1
19 Other creditors £m I Historic values (outturn) -21.0 -39.0
20 Total creditors £m C Historic values (outturn) -39.1 -49.1
Provision for liabilities & charges21 Deferred tax provision £m I Historic values (outturn) -205.3 -242.0
22 Deferred income - grants and contributions £m I Historic values (outturn) -18.7 -19.7
23 Post employment assets / (liabilities) £m I Historic values (outturn) 0.0 0.0
24 Other provisions £m I Historic values (outturn) -56.0 -59.4
25 Net Assets employed £m C Historic values (outturn) 2,999.7 3,392.7
Capital and reserves26 Government Loans £m I/B Historic values (outturn) 2,412.2 2,615.2
27 Income and Expenditure account £m I/C Historic values (outturn) 454.1 644.1
28 Other reserves £m I Historic values (outturn) 133.4 133.4
29 Capital & reserves £m C Historic values (outturn) 2,999.7 3,392.7
Check ok ok

Base historic data: Balance Sheet
Current Cost Accounts
Line Description Units Field Additional Info 2006-07 2007-08
Fixed Assets30 Tangible assets £m I/B Outturn 27,627.7 39,740.2
31 Third party contributions £m I Outturn -19.7 -21.4
Other Operating Assets and liabilities32 Working capital £m B Outturn -210.0 -190.1
33 Cash (net of overdrafts) £m B Outturn 3.3 -0.3
34 Short term deposits £m B Outturn 0.0 0.0
35 Infrastructure renewals prepayment/(accrual) £m B Outturn -20.7 4.8
36 Net operating assets £m C Outturn 27,380.5 39,533.3
Non-operating assets and liabilities37 Borrowings (excl. govt. loans) £m B Outturn -6.6 -8.0
38 Gilts buffer £m B Outturn 0.0 27.4
39 Assets transferred to PPP contractors £m B Outturn 35.5 33.9
40 Non-trade debtors £m I Outturn 20.9 32.5
41 Non-trade creditors due within one year £m I Outturn -30.1 -41.8
42 Investment - loan to group company £m B Outturn 64.5 58.5
43 Investment - Other £m B Outturn 0.0 34.7
44 Total non-operating assets and liabilities £m C Outturn 84.3 137.2
Creditors - amounts falling due after more than one year45 Borrowings (excl. govt. loans) £m B Outturn -18.1 -10.1
46 Other Creditors £m B Outturn -21.0 -39.0
47 Total Creditors falling due after more than one year £m C Outturn -39.1 -49.1
Provisions for liabilities & charges48 Deferred tax provision £m B Outturn -205.3 -242.0
49 Post employment asset / (liabilities) £m B Outturn 0.0 0.0
50 Other provisions £m B Outturn -56.0 -59.4
51 Total provisions £m C Outturn -261.3 -301.4
52 Net assets employed £m C Outturn 27,164.4 39,320.0
Capital and reserves53 Government Loans £m B Outturn 2,412.2 2,615.2
54 Income and expenditure account £m I Outturn 445.3 614.3
55 Current cost reserve £m I Outturn 24,173.6 35,957.2
56 Other reserves £m C Outturn 133.4 133.4
57 Total capital & reserves £m C Outturn 27,164.4 39,320.0
Check ok ok

Base historic data: Cash Flow
Reconciliation of Current cost operating profit to net cash flow from operating activities
Deriving Net cash flow from operating activities Units Field Additional Info 2006-07 2007-08
1 Current cost operating profit £m B Outturn 347.2 333.42 Working capital adjustment £m B Outturn -7.3 -6.83 Movement in working capital £m I Outturn -11.9 -19.94 Receipts from other income £m I Outturn 0.0 0.05 Current Cost depreciation £m B Outturn 163.6 192.26 Amortisation of PPP assets £m B Outturn 1.6 1.67 Amortisation of deferred income £m B Outturn -1.1 -0.98 Current cost profit/(loss) on sale of assets £m B Outturn -1.4 -9.39 Infrastructure renewals charge £m B Outturn 88.0 90.010 Other non-cash profit and loss items £m I Outturn -5.4 3.511 Net cash flow from operating activities £m C Outturn 573.3 583.7
Cash Flow
Net cash flow from operating activities Units Field Additional Info 2006-07 2007-08
12 Net cash flow from operating activities £m B Outturn 573.3 583.7
Cash changes in non-operating debtors/creditors and extraordinary
items Units Field Additional Info 2006-07 2007-08
13 Cash inflow/outflow from changes in non-trade debtors/creditors £m I Outturn 46.5 17.014 Cash inflow/outflow from extraodinary items £m I Outturn 0.0 0.0
Returns on investments & servicing of finance
15 Interest received £m I Outturn 3.3 4.216 Interest paid £m I Outturn -146.5 -144.517 Net cash flow from returns on Investment & servicing of finance £m C Outturn -143.2 -140.3
Taxation18 Taxation paid £m I Outturn 0.0 -0.6
Capital expenditure and financial investment19 Gross cost of purchase of fixed assets £m I Outturn -413.3 -519.320 Receipt of grants and contributions £m I Outturn 1.6 2.921 Infrastructure renewals expenditure £m I Outturn 0.0 -106.822 Disposal of fixed assets £m I Outturn 2.1 9.923 Movements on long term loans to group companies £m I Outturn -64.5 6.0
24 Net cash flow from investing activities £m C Outturn -474.1 -607.325 Acquisitions and disposals £m I Outturn 0.0 -25.026 Customer dividends paid £m I Outturn 0.0 0.0
Management of liquid resources27 Net cash flow from management of liquid resources £m I Outturn 0.0 0.028 Net Cash flow before financing £m C Outturn 2.5 -172.5
Financing29 New Government loans £m I Outturn 142.6 461.130 Non-Government loans repayments £m I Outturn -6.2 -6.731 Government loans repayments £m I Outturn -136.4 -258.132 Gilts buffer £m I Outturn 0.0 -27.4
33 Net cash inflow from financing £m C Outturn 0.0 168.934 Increase (decrease) in cash and cash equivalents £m C Outturn 2.5 -3.6

Base historic data: Working Capital and other non-trade debtors/creditors
Description Units Field Additional Info 2006-07 2007-08
1 Stocks £m I Historic values (outturn) 2.9 3.6
2 Trade debtors £m I Historic values (outturn) 23.0 30.0
3 Prepayments, accruals and other short term debtors £m I Historic values (outturn) 12.3 16.7
4 Trade creditors £m I Historic values (outturn) -12.7 -20.0
5 Wholesale charge prepayment £m I Historic values (outturn) -27.3 -18.5
6 Short-term capital creditors £m I Historic values (outturn) -79.4 -71.6
7 Accruals and other creditors £m I Historic values (outturn) -128.8 -130.5
8 Total working capital £m C Calculated field -210.0 -190.1
9 Non-trade debtors £m B Calculated field 20.9 32.5
10 Non-trade creditors £m B Calculated field -30.1 -41.8
11 Total Debtors + Creditors £m C Calculated field -222.1 -203.0
Check against Historic Cost Debtors + Creditors TRUE TRUE

Base historic data: Tax
Allocation of capital expenditure for tax purposes Units Field Additional Info 2006-07 2007-08
1 Work in progress - Opening amount £m I Historic values (outturn) 1123.5 792.7
2 Work in progress (portion where capital allowances have not been claimed) - opening £m I Historic values (outturn) 1123.5 712.3
3 Total capitalised expenditure including IRE (outturn prices) excluding grants £m I Historic values (outturn) 414.5 628.3
4 Capitalised expenditure allocated for capital allowances (including Work in progress) £m I Historic values (outturn) 825.7 761.6
5 Work in progress (portion where capital allowances have not been claimed) - closing £m C Calculated field 712.3 579.0
6 Assets qualifying for 100% first year allowances £m I Historic values (outturn) 0.0 0.0
7 Assets to be included in the general (25%) pool £m I Historic values (outturn) 227.1 283.4
8 Assets qualifying for long life (6%) pool £m I Historic values (outturn) 226.6 230.7
9 Assets qualifying for Industrial Buildings Allowance £m I Historic values (outturn) 28.5 76.6
10 Assets purchased under finance leasing £m I Historic values (outturn) 0.0 0.0
11 Capitalised revenue expenditure deducted in year of spend £m I Historic values (outturn) 0.0 0.0
12 Capitalised revenue expenditure depreciated - non – infrastructure £m I Historic values (outturn) 30.3 14.4
13 Capitalised revenue expenditure depreciated – infrastructure £m I Historic values (outturn) 307.2 110.9
14 Capitalised revenue expenditure not depreciated £m I Historic values (outturn) 0.0 0.0
15 Other assets not qualifying for capital allowances or revenue deductions £m I Historic values (outturn) 5.9 46.2
16 Grants and contributions taxable on receipt £m I Historic values (outturn) 0.0 0.0
Opening position
17 Opening pool of capital allowances – asset life < 25 years £m I Historic values (outturn) 474.8 526.4
18 Opening pool of capital allowances – asset life >= 25 years £m I Historic values (outturn) 696.4 867.6
19 Residual IBA’s £m I Historic values (outturn) 251.4 263.0
20 General provisions – opening balance £m I Historic values (outturn) 92.4 66.4
21 Losses brought forward £m I Historic values (outturn) 230.9 172.5
22 Average asset life – non - infrastructure Years I Historic values (outturn) 1.0 1.0
23 Average asset life – infrastructure Years I Historic values (outturn) 0.0 0.0
Calculation of trading profit
24 HCA Operating profit £m C Calculated field 366.5 357.9
25 Total HCA Depreciation £m B Calculated field 137.1 160.8
26 Infrastructure renewals charge £m B Calculated field 88.0 90.0
27 Amortisation of PPP assets £m B Calculated field 1.6 1.6
28 Amortisation of grants £m B Calculated field -1.1 -0.9
29 Deduction for capitalised revenue expenditure £m I Historic values (outturn) 1.1 1.1
30 Trading profit £m C Calculated field 593.2 610.5
Deductions to trading profit
31 Depreciation on capitalised revenue expenditure – non – infrastructure £m I Historic values (outturn) 25.4 30.3
32 Depreciation on capitalised revenue expenditure – infrastructure £m I Historic values (outturn) 88.0 90.0
33 Total interest paid £m I Historic values (outturn) 146.3 145.7
34 Capital allowances - asset life <25 years £m I Historic values (outturn) 175.5 202.5
35 Capital allowances - asset life >=25 years £m I Historic values (outturn) 55.4 65.9
36 Industrial building allowance utilised £m I Historic values (outturn) 16.9 19.7
37 Other deductions £m I Historic values (outturn) 30.1 13.6
38 Total deductions £m C Calculated field 537.6 567.7
Additions to trading profit
39 Grants and contributions taxable on receipt £m B Calculated field 0.0 0.0
40 Other additions £m I Historic values (outturn) 0.2 5.8
41 Total additions £m C Calculated field 0.2 5.8
Taxation
42 Trading profit for tax £m C Calculated field 55.8 48.6
43 Adjusted trading profit for tax £m I Historic values (outturn) 0.0 0.0
44 Current tax charge £m I Historic values (outturn) 0.0 1.5
45 Prior Year adjustments £m I Historic values (outturn) 0.0 0.0
46 Total current tax charge £m C Calculated field 0.0 1.5

Base historic data: Maturity profile of closing (embedded) debt (as of 31 March 2008)
Government loans Units Field 2008-09 2009-10 2010-11 2011-12 2012-13 2013-14 2014-15 2015-16 2016-17 2017-18 2018-19 beyond 2018-19 Total
1 3-3.99% £m I, C 15.0 0.0 0.0 0.0 0.0 0.0 0.0 0.0 0.0 0.0 0.0 51.0 66.0
2 4-4.99% £m I, C 32.5 15.0 27.4 35.0 35.5 20.0 38.0 12.0 15.0 11.0 0.0 1073.2 1314.6
3 5-5.99% £m I, C 47.4 22.9 0.0 15.0 0.0 17.5 7.5 15.0 0.0 0.0 20.0 225.6 370.9
4 6-6.99% £m I, C 2.0 3.0 0.0 8.0 2.0 5.0 5.0 0.0 4.0 4.0 4.0 94.4 131.4
5 7-7.99% £m I, C 58.5 10.0 0.0 8.0 27.0 2.0 0.0 14.0 20.0 26.0 27.0 270.0 462.5
6 8-8.99% £m I, C 0.0 0.0 0.0 0.0 0.0 0.0 0.0 0.0 0.0 4.6 0.0 23.3 27.9
7 9-9.99% £m I, C 5.3 0.3 0.3 9.2 3.6 18.0 28.1 20.1 13.2 9.0 8.5 12.1 127.7
8 10-10.99% £m I, C 12.8 11.8 37.7 3.2 2.3 1.0 1.2 17.7 0.6 2.4 3.4 6.9 101.1
9 11-11.99% £m I, C 5.5 0.4 1.0 0.1 0.5 0.9 0.1 0.7 1.2 0.6 0.0 1.7 12.8
10 12-12.99% £m I, C 0.1 0.0 0.0 0.0 0.0 0.0 0.0 0.0 0.0 0.0 0.0 0.0 0.1
11 13-13.99% £m I, C 0.0 0.0 0.0 0.0 0.0 0.0 0.0 0.0 0.0 0.0 0.0 0.2 0.2
12 14-14.99% £m I, C 0.0 0.0 0.1 0.0 0.0 0.0 0.0 0.0 0.0 0.0 0.0 0.0 0.2
13 Total £m C 179.0 63.5 66.5 78.5 70.9 64.4 80.0 79.5 53.9 57.6 63.0 1758.3 2615.2
Non - Government loans Units Field 2008-09 2009-10 2010-11 2011-12 2012-13 2013-14 2014-15 2015-16 2016-17 2017-18 2018-19 beyond 2018-19 Total
14 3-3.99% £m I, C 0.0 0.0 0.0 0.0 0.0 0.0 0.0 0.0 0.0 0.0 0.0 0.0 0.0
15 4-4.99% £m I, C 0.0 0.0 0.0 0.0 0.0 0.0 0.0 0.0 0.0 0.0 0.0 0.0 0.0
16 5-5.99% £m I, C 0.0 0.0 0.0 0.0 0.0 0.0 0.0 0.0 0.0 0.0 0.0 0.0 0.0
17 6-6.99% £m I, C 0.0 0.0 0.0 0.0 0.0 0.0 0.0 0.0 0.0 0.0 0.0 0.0 0.0
18 7-7.99% £m I, C 1.9 0.7 0.0 0.0 0.0 0.0 0.0 0.0 0.0 0.0 0.0 0.0 2.6
19 8-8.99% £m I, C 5.1 2.2 1.4 1.6 1.7 0.9 0.5 0.0 0.0 0.0 0.0 0.5 13.9
20 9-9.99% £m I, C 0.0 0.0 0.0 0.0 0.0 0.0 0.0 0.0 0.0 0.0 0.0 0.0 0.0
21 10-10.99% £m I, C 0.0 0.0 0.0 0.0 0.0 0.0 0.0 0.0 0.0 0.0 0.0 0.0 0.0
22 11-11.99% £m I, C 0.0 0.0 0.0 0.0 0.0 0.0 0.0 0.0 0.0 0.0 0.0 0.5 0.5
23 12-12.99% £m I, C 1.0 0.0 0.0 0.0 0.0 0.0 0.0 0.0 0.0 0.0 0.0 0.0 1.0
24 13-13.99% £m I, C 0.0 0.0 0.0 0.0 0.0 0.0 0.0 0.0 0.0 0.0 0.0 0.0 0.0
25 14-14.99% £m I, C 0.0 0.0 0.0 0.0 0.0 0.0 0.0 0.0 0.0 0.0 0.0 0.0 0.0
26 Total £m C 8.0 2.9 1.4 1.6 1.7 0.9 0.5 0.0 0.0 0.0 0.0 1.0 18.0
Maturity of Base year closing debt

Base historic data: Depreciation and amortisation of closing assets
Historic Cost Accounts
Historic cost Fixed Assets Units Field Type Additional Info 2007-08
1 Gross Fixed Assets - assets existing at 31 March 2008 £m I 5,725.7
2 Accumulated depreciation - assets existing at 31 March 2008 £m I Input negative (1,914.5)
3 Net book value - assets existing at 31 March 2008 £m C 3,811.2
Expected Historic cost depreciation Units Field Type Additional Info 2007-08 2008-09 2009-10 2010-11 2011-12 2012-13 2013-14
4 Expected historic cost depreciation on assets existing at 31 March 2008 £m I Input negative (147.6) (154.1) (138.9) (125.3) (109.4) (102.7)
Expected Historic Cost amortisation Units Field Type Additional Info 2007-08 2008-09 2009-10 2010-11 2011-12 2012-13 2013-14
5 Amortisation of existing grants and contributions (31 March 2008) £m I Input negative (0.8) (0.8) (0.8) (0.8) (0.8) (0.8)
Current Cost accounts
Current cost Fixed assets Units Field Type Additional Info 2007-08
6 Gross Fixed Assets - assets existing at 31 March 2008 £m I 43,342.0
7 Accumulated depreciation - assets existing at 31 March 2008 £m I Input negative (3,601.8)
8 Net book value - assets existing at 31 March 2008 £m C 39,740.2
Expected current cost depreciation Units Field Type Additional Info 2007-08 2008-09 2009-10 2010-11 2011-12 2012-13 2013-14
9 Expected current cost depreciation on assets existing at 31 March 2008 £m I Base year prices / Input negative (210.3) (206.6) (197.2) (182.1) (174.8) (169.3)
10 Current cost depreciation on WIP assets (commissioned after 31 March 2008) £m I Base year prices / Input negative - - - - - -
Amortisation of existing current cost Third Party Contributions Units Field Type Additional Info 2007-08 2008-09 2009-10 2010-11 2011-12 2012-13 2013-14
11 Amortisation of existing current cost Third Party Contributions £m I Base year prices / Input negative (0.8) (0.8) (0.8) (0.8) (0.8) (0.8)

Assumptions: Inflation
Retail price Index (RPI)Base year
2003-04 2004-05 2005-06 2006-07 2007-08 2008-09 2009-10 2010-11 2011-12 2012-13 2013-14
1 Financial Year Average 182.5 188.2 193.1 200.3 208.6 214.8 220.2 225.7 231.3 237.1 243.0
2 % increase 3.1% 2.6% 3.7% 4.1% 3.0% 2.5% 2.5% 2.5% 2.5% 2.5%
Construction Output Price Index (COPI)Base year
2003-04 2004-05 2005-06 2006-07 2007-08 2008-09 2009-10 2010-11 2011-12 2012-13 2013-14
3 Financial Year Average 135.3 145.0 151.0 157.0 162.5 162.5 166.6 170.7 175.0 179.4 183.9
4 % increase 7.2% 4.1% 4.0% 3.5% 0.0% 2.5% 2.5% 2.5% 2.5% 2.5%

Assumptions: Financing
Cost of Capital Units Field Additional Info 2006-07 2007-08 All years
1 Cost of Debt % I Input real 3.5%
2 Cost of Equity % I Input real 3.0%
3 Gearing % I 54.4%
Financing and borrowing Units Field Additional Info 2006-07 2007-08 2008-09 2009-10 2010-11 2011-12 2012-13 2013-14
4 Financing cost % I Input nominal 4.6% 4.6% 4.6% 4.6% 4.6% 4.6%
5 Interest on cash balances/short term investments % I Input nominal 0.8% 0.8% 2.3% 2.3% 2.3% 2.3%
6 Interest on gilts buffer % I Input nominal 0.0% 0.0% 0.0% 0.0% 0.0% 0.0%
7 Interest paid to licensed retailers % I Input nominal 1.0% 1.0% 2.5% 2.5% 2.5% 2.5%
Dividends foregone and Gilts buffer Units Field Additional Info 2006-07 2007-08 2008-09 2009-10 2010-11 2011-12 2012-13 2013-14
8 Dividends foregone by the Scottish Government £m I % unleveraged portion RCV 0.0% 0.0% 0.0% 0.0%
9 Increase in Gilts buffer £m I Change in the year (Outturn) 16.3 -43.7 19.9 57.4 35.6 15.4
Benchmark ratios Units Field Additional Info 2006-07 2007-08 Reference
10 Cash interest cover number F Around 3.0
11 Adjusted cash interest cover I (maintenance charges) number F Around 1.6
12 Adjusted cash interest cover II (maintenance expenditure) number F Around 2.0
13 Funds from operations:debt % F Greater than 13.0%
14 Retained cashflow:debt % F Greater than 7.0%
15 Gearing % F Less than 65.0%
16 'Around' bandings % F +/- % of target 20.0%
Scottish Water RCV
Regulatory Capital Value Units Field Additional Info 2006-07 2007-08 2008-09 2009-10 2010-11 2011-12 2012-13 2013-14
17 Closing RCV (2009-10) £m I 2009-10 price base 5,504.2
18 Adjustments £m I Base year 0.0 0.0 0.0 0.0
Treatment of embedded debt
Treatment of embedded debt adjustment
19 1OFF - Do not allow for embedded debt adjustments in "P9"

Assumptions: Capital expenditure
Total capital expenditure
Total capital expenditure - post efficiency Units Field Type Additional Info 2008-09 2009-10 2010-11 2011-12 2012-13 2013-14
1 Q&S3b - Capital Maintenance (net of grants) £m I Enter amount (Base year prices) 6.0 25.5 207.6 217.6 216.0 220.0
2 Q&S3b - Capital Enhancement (net of grants) £m I Enter amount (Base year prices) 16.7 31.6 146.0 247.9 265.6 270.0
3 Q&S3a - Capital Maintenance (net of grants) £m I Enter amount (Base year prices) 230.0 162.5 12.4 2.4 4.0 0.0
4 Q&S3a - Capital Enhancement (net of grants) £m I Enter amount (Base year prices) 410.7 410.3 101.0 11.7 4.3 0.0
5 Q&S2 - Capital Investment (net of grants) £m I Enter amount (Base year prices) 29.2 51.4 22.9 10.4 0.1 0.0
6 Gross Other Investment (net of grants) £m I Enter amount (Base year prices) 0.0 0.0 0.0 0.0 0.0 0.0
7 Grants and Third Party Contributions £m I Enter amount (Base year prices) 0.0 0.0 0.0 0.0 0.0 0.0
8 Total Capital Programme £m C Calculated Field 692.5 681.3 490.0 490.0 490.0 490.0
Q&S3b - Allocation of capital expenditure into asset life categories
Allocation of capital maintenance Units Field Type Additional Info 2008-09 2009-10 2010-11 2011-12 2012-13 2013-14
9 Very Short % I % apportioned to this life category 1.3% 19.7% 15.2% 8.4% 10.8% 16.1%
10 Short % I % apportioned to this life category 3.3% 2.5% 3.7% 4.3% 3.7% 3.3%
11 Medium % I % apportioned to this life category 19.3% 16.1% 15.7% 23.4% 19.1% 16.2%
12 Medium long % I % apportioned to this life category 0.4% 0.3% 0.3% 0.5% 0.4% 0.4%
13 Long % I % apportioned to this life category 15.8% 12.5% 12.0% 17.7% 14.9% 13.8%
14 Infinite (land) % I % apportioned to this life category 0.5% 0.5% 0.6% 0.8% 0.7% 0.6%
15 Infrastructure % I % apportioned to this life category 59.4% 48.3% 52.4% 45.0% 50.5% 49.7%
16 Total % C Calculated field (should equal 100%) 100% 100% 100% 100% 100% 100%
Check ok ok ok ok ok ok
Allocation of capital enhancement Units Field Type Additional Info 2008-09 2009-10 2010-11 2011-12 2012-13 2013-14
17 Very Short % I % apportioned to this life category 0.9% 1.7% 2.6% 3.4% 4.4% 3.3%
18 Short I % apportioned to this life category 61.1% 38.5% 9.7% 7.5% 4.6% 5.6%
19 Medium % I % apportioned to this life category 8.5% 15.7% 18.9% 20.7% 27.3% 23.6%
20 Medium long % I % apportioned to this life category 0.2% 0.4% 0.5% 0.6% 0.8% 0.6%
21 Long % I % apportioned to this life category 6.5% 11.9% 15.0% 15.9% 19.1% 17.0%
22 Infinite (land) % I % apportioned to this life category 0.2% 0.3% 0.5% 0.5% 0.5% 0.4%
23 Infrastructure % I % apportioned to this life category 22.5% 31.4% 52.8% 51.6% 43.4% 49.3%
24 Total % C Calculated field (should equal 100%) 100% 100% 100% 100% 100% 100%
Check ok ok ok ok ok ok
Q&S3a - Allocation of capital expenditure into asset life categories
Allocation of capital maintenance Units Field Type Additional Info 2008-09 2009-10 2010-11 2011-12 2012-13 2013-14
25 Very Short % I % apportioned to this life category 9.7% 11.9% 6.2% 5.3% 1.3% 0.0%
26 Short % I % apportioned to this life category 3.8% 2.3% 0.7% 1.2% 0.1% 0.0%
27 Medium % I % apportioned to this life category 23.1% 21.8% 45.8% 27.4% 8.1% 0.0%
28 Medium long % I % apportioned to this life category 0.5% 0.5% 0.9% 0.8% 0.2% 0.0%
29 Long % I % apportioned to this life category 18.0% 16.7% 19.6% 19.5% 4.6% 0.0%
30 % I % apportioned to this life category 0.8% 1.0% 0.5% 0.5% 0.2% 0.0%
31 Infrastructure % I % apportioned to this life category 44.2% 45.8% 26.2% 45.3% 85.5% 0.0%
32 Total % C Calculated field (should equal 100%) 100% 100% 100% 100% 100% 0%
Check ok ok ok ok ok

Assumptions: Capital expenditure
Allocation of capital enhancement Units Field Type Additional Info 2008-09 2009-10 2010-11 2011-12 2012-13 2013-14
33 Very Short % I % apportioned to this life category 7.1% 6.3% 4.5% 6.4% 7.1% 0.0%
34 Short % I % apportioned to this life category 2.7% 3.3% 6.3% 4.3% 3.9% 0.0%
35 Medium % I % apportioned to this life category 34.4% 32.5% 24.4% 37.6% 48.7% 0.0%
36 Medium long % I % apportioned to this life category 1.5% 2.2% 0.7% 1.3% 1.4% 0.0%
37 Long % I % apportioned to this life category 26.9% 24.4% 17.1% 26.6% 34.9% 0.0%
38 Infinite (land) % I % apportioned to this life category 0.5% 0.5% 0.4% 0.6% 0.8% 0.0%
39 Infrastructure % I % apportioned to this life category 26.9% 30.8% 46.6% 23.2% 3.2% 0.0%
40 Total % C Calculated field (should equal 100%) 100% 100% 100% 100% 100% 0%
Check ok ok ok ok ok
Q&S2 - Allocation of capital expenditure into asset life categories
Overhang capital expenditure Units Field Type Additional Info 2008-09 2009-10 2010-11 2011-12 2012-13 2013-14
41 Very Short % I % apportioned to this life category 4.8% 2.1% 1.6% 1.4% 0.8% 0.0%
42 Short % I % apportioned to this life category 5.8% 4.2% 3.0% 3.5% 1.0% 0.0%
43 Medium % I % apportioned to this life category 42.7% 22.4% 18.0% 19.3% 5.1%
44 Medium long % I % apportioned to this life category 1.0% 0.5% 0.4% 0.4% 0.1% 0.0%
45 Long % I % apportioned to this life category 33.2% 19.9% 16.3% 17.4% 6.9% 0.0%
46 Infinite (land) % I % apportioned to this life category 1.0% 0.7% 0.5% 0.5% 0.2% 0.0%
47 Infrastructure Enhancement % I % apportioned to this life category 11.5% 50.1% 60.2% 57.5% 85.9% 0.0%
48 Total % C Calculated field (should equal 100%) 100% 100% 100% 100% 100% 0%
Check ok ok ok ok ok
Other investment - Allocation of capital expenditure into asset life categories
Other investment Units Field Type Additional Info 2008-09 2009-10 2010-11 2011-12 2012-13 2013-14
49 Very Short % I % apportioned to this life category 0.0% 0.0% 0.0% 0.0% 0.0% 0.0%
50 Short % I % apportioned to this life category 0.0% 0.0% 0.0% 0.0% 0.0% 0.0%
51 Medium % I % apportioned to this life category 0.0% 0.0% 0.0% 0.0% 0.0% 0.0%
52 Medium long % I % apportioned to this life category 0.0% 0.0% 0.0% 0.0% 0.0% 0.0%
53 Long % I % apportioned to this life category 0.0% 0.0% 0.0% 0.0% 0.0% 0.0%
54 Infinite (land) % I % apportioned to this life category 0.0% 0.0% 0.0% 0.0% 0.0% 0.0%
55 Infrastructure Enhancement % I % apportioned to this life category 0.0% 0.0% 0.0% 0.0% 0.0% 0.0%
56 Total % C Calculated field (should equal 100%) 0% 0% 0% 0% 0% 0%
Check
Grants and Contributions - Allocation of capital expenditure into asset life categories
Grants and Third Party Contributions Units Field Type Additional Info 2008-09 2009-10 2010-11 2011-12 2012-13 2013-14
57 Very Short % I % apportioned to this life category 0.0% 0.0% 0.0% 0.0% 0.0% 0.0%
58 Short % I % apportioned to this life category 0.0% 0.0% 0.0% 0.0% 0.0% 0.0%
59 Medium % I % apportioned to this life category 0.0% 0.0% 0.0% 0.0% 0.0% 0.0%
60 Medium long % I % apportioned to this life category 0.0% 0.0% 0.0% 0.0% 0.0% 0.0%
61 Long % I % apportioned to this life category 0.0% 0.0% 0.0% 0.0% 0.0% 0.0%
62 Infinite (land) % I % apportioned to this life category 0.0% 0.0% 0.0% 0.0% 0.0% 0.0%
63 Infrastructure Enhancement % I % apportioned to this life category 0.0% 0.0% 0.0% 0.0% 0.0% 0.0%
64 Total % C Calculated field (should equal 100%) 0% 0% 0% 0% 0% 0%
Check
Infrastructure Renewals Charge
Infrastructure Renewals Units Field Type Additional Info 2008-09 2009-10 2010-11 2011-12 2012-13 2013-14
65 Infrastructure Renewals Expenditure £m C Calculated field 105.2 86.7 112.1 99.0 112.5 109.2
66 Infrastructure Renewals Charge £m I Enter amount (Base year prices) 100.2 101.7 112.4 112.4 112.4 112.4

Assumptions: Asset Disposals
Historic Cost Accounts
Asset disposals - HCA Units Field Type Additional Info 2008-09 2009-10 2010-11 2011-12 2012-13 2013-14
1 Gross cost of disposed assets £m I Historic Cost 2.8 0.0 1.0 1.0 1.0 1.0
2 Accumulated depreciation of disposed assets £m I Historic Cost / Input negative -2.4 0.0 0.0 0.0 0.0 0.0
3 Net cost of disposed assets £m C Calculated field 0.4 0.0 1.0 1.0 1.0 1.0
4 Annual Depreciation foregone by disposal of assets £m I Historic Cost / Cumulative / Input negative 0.0 0.0 0.0 0.0 0.0 0.0
5 Cash income from asset disposals £m I Enter amount (outturn) 1.4 1.0 1.0 1.0 1.0 1.0
Current Cost Accounts
Asset disposals - CCA Units Field Type Additional Info 2008-09 2009-10 2010-11 2011-12 2012-13 2013-14
6 Gross cost of disposed asstes £m I Base Year prices 2.7 0.0 0.9 0.9 0.9 0.9
7 Accumulated depreciation of disposed assets £m I Base Year prices / Input negative -2.3 0.0 0.0 0.0 0.0 0.0
8 Net cost of disposed assets £m C Calculated field 0.4 0.0 0.9 0.9 0.9 0.9
9 Annual Depreciation foregone by disposal of assets £m I Base Year prices / Cumulative / Input negative 0.0 0.0 0.0 0.0 0.0 0.0

Assumptions: Non Fixed assets
Profit and loss assumptions
Profit and Loss assumptions Units Field Type Additional Info 2006-07 2007-08 2008-09 2009-10 2010-11 2011-12 2012-13 2013-14
1 Revenue (2008-09 and 2009-10) £m I Base year prices 996.9 1,008.6
2 Operating costs £m I/C/B Base year prices -267.0 -259.0 -271.3 -291.3 -280.0 -280.0 -280.0 -280.0
3 PPP Operating Costs £m I/C/B Base year prices -130.9 -127.6 -128.3 -129.1 -130.0 -132.0 -132.0 -132.0
4 Operating income (excluding sale of fixed assets) £m I/C/B Base year prices 0.0 0.0 0.0 0.0 0.0 0.0 0.0 0.0
5 Other income £m I/C/B Base year prices 0.0 0.0 0.0 0.0 0.0 0.0 0.0 0.0
6 Extraordinary items £m I/C/B Base year prices 0.0 0.0 0.0 0.0 0.0 0.0 0.0 0.0
7 Dividends paid £m I/C/B Base year prices / enter negative 0.0 0.0 0.0 0.0 0.0 0.0 0.0 0.0
8 Amortisation of PPP assets £m I/B Historic Cost / enter negative -1.6 -1.6 -1.6 -1.6 -2.0 -2.5 -2.5 -2.5
Balance Sheet Assumptions
Working capital Units Field Type Additional Info 2006-07 2007-08 2008-09 2009-10 2010-11 2011-12 2012-13 2013-14
9 Stocks % I/C % of operating costs 1.1% 1.4% 1.2% 1.2% 1.1% 1.1% 1.0% 1.0%
10 Trade debtors Days I/C Debtor days (previous year) 11.1 10.4 10.3 10.3 10.2 10.1 10.0
11 Prepayments, accruals and other short term debtors % I/C % of total revenue (previous year) 1.7% 1.2% 0.8% 0.8% 0.9% 0.9% 1.0%
12 Trade creditors Days I/C Creditor days 17.9 27.7 24.3 21.3 21.0 20.7 20.3 20.0
13 Licensed wholesale charge prepayment Days I/C Revenue days (previous year) 6.9 9.5 9.8 9.9 9.9 10.0 10.0
14 Short-term capital creditors % I/C % of capital expenditure 19.2% 11.4% 12.9% 11.6% 11.2% 10.8% 10.4% 10.0%
15 Accruals and other creditors % I/C % of operating costs (incl. PPP) 33.7% 33.7% 31.7% 28.7% 28.5% 28.3% 28.2% 28.0%
Other Balance Sheet accounts Units Field Type Additional Info 2006-07 2007-08 2008-09 2009-10 2010-11 2011-12 2012-13 2013-14
16 Cash (net of overdrafts) £m I/B Enter amount (Outturn prices) 3.3 -0.3 0.0 2.0 2.0 2.0 2.0 2.0
17 Short term deposits £m I/B Enter amount (Outturn prices) 0.0 0.0 0.0 0.0 0.0 0.0 0.0 0.0
18 Non-trade debtors £m I/B Enter amount (Outturn prices) 20.9 32.5 26.3 26.3 27.8 27.8 28.3 28.9
19 Non-trade creditors due within one year £m I/B Enter amount (Outturn prices) / negative -30.1 -41.8 -66.8 -65.8 -65.9 -67.0 -68.4 -69.5
20 Investment - loan to group company £m I/B Enter amount (Outturn prices) 64.5 58.5 0.0 -26.1 0.0 0.0 0.0 0.0
21 Investment - Other £m I/B Enter amount (Outturn prices) 0.0 34.7 34.6 34.6 34.6 34.6 34.6 34.6
22 Other Creditors - greater than one year £m I/B Enter amount (Outturn prices) / negative -21.0 -39.0 -14.0 -14.0 -14.0 -14.0 -14.0 -14.0
23 PPP assets addition £m I Enter amount (Outturn prices) 0.0 8.0 8.0 0.0 0.0 0.0
Provisions for liabilities & charges Units Field Type Additional Info 2006-07 2007-08 2008-09 2009-10 2010-11 2011-12 2012-13 2013-14
24 Change in Post employment asset / (liabilities) £m I/B Enter amount (Outturn prices) 0.0 0.0 0.0 0.0 0.0 0.0 0.0
25 Change in other provisions £m I/B Enter amount (Outturn prices) -3.5 8.4 5.0 10.7 4.4 4.4 4.4

Assumptions: Tax
Tax rate Units Field Type Additional Info 2006-07 2007-08 2008-09 2009-10 2010-11 2011-12 2012-13 2013-14
1 Tax rate % I 28% 28% 28% 28% 28% 28%
Capital Allowances Rates Units Field Type Additional Info 2006-07 2007-08 2008-09 2009-10 2010-11 2011-12 2012-13 2013-14
2 Plant and Machinery Short life - less than 25 years - allowance rate (reducing balance) % I 20% 20% 20% 20% 20% 20%
3 Plant and Machinery Long life - more than 25 years - allowance rate (reducing balance) % I 10% 10% 10% 10% 10% 10%
4 Industrial Buildings Allowance rate (straight line) % I 3% 2% 1% 0% 0% 0%
Allocation of capital expenditure for tax purposes Units Field Additional Info 2006-07 2007-08 2008-09 2009-10 2010-11 2011-12 2012-13 2013-14
5 Work in progress - Opening amount £m I/C 1123.5 792.7 871.0
6 Work in progress (portion where capital allowances have not been claimed) - opening £m C 1123.5 712.3 579.0 571.6 602.6 572.4 539.7 518.8
7 Total capitalised expenditure including IRE (outturn prices) excluding grants £m C 414.5 628.3 692.5 698.3 514.8 527.7 540.9 554.4
8 Capitalised expenditure allocated for capital allowances (including Work in progress) % I/C % of Opening + capitalised exp. 53.7% 56.8% 55.0% 52.5% 48.8% 50.9% 52.0% 52.2%
9 Capitalised expenditure allocated for capital allowances (including Work in progress) £m C 825.7 761.6 699.9 667.3 544.9 560.4 561.8 560.0
10 Work in progress (portion where capital allowances have not been claimed) - closing £m C Calculated Field 712.3 579.0 571.6 602.6 572.4 539.7 518.8 513.2
11 Assets qualifying for 100% first year allowances % I/C % allocated to this category 0.0% 0.0% 0.0% 0.0% 0.0% 0.0% 0.0% 0.0%
12 Assets to be included in the general (25%) pool % I/C % allocated to this category 27.5% 37.2% 19.4% 26.9% 28.0% 26.6% 29.2% 28.9%
13 Assets qualifying for long life (6%) pool % I/C % allocated to this category 27.4% 30.3% 29.1% 45.4% 42.0% 40.9% 41.7% 43.0%
14 Assets qualifying for Industrial Buildings Allowance % I/C % allocated to this category 3.5% 10.1% 20.8% 12.5% 9.1% 0.0% 0.0% 0.0%
15 Assets purchased under finance leasing % I/C % allocated to this category 0.0% 0.0% 0.0% 0.0% 0.0% 0.0% 0.0% 0.0%
16 Capitalised revenue expenditure deducted in year of spend % I/C % allocated to this category 0.0% 0.0% 0.0% 8.2% 13.1% 13.6% 13.0% 13.7%
17 Capitalised revenue expenditure depreciated - non – infrastructure % I/C % allocated to this category 3.7% 1.9% 5.2% 2.9% 3.8% 3.0% 2.1% 1.9%
18 Capitalised revenue expenditure depreciated – infrastructure % I/C % allocated to this category 37.2% 14.6% 23.7% 0.0% 0.0% 0.0% 0.0% 0.0%
19 Capitalised revenue expenditure not depreciated % I/C % allocated to this category 0.0% 0.0% 0.0% 0.0% 0.0% 0.0% 0.0% 0.0%
20 Other assets not qualifying for capital allowances or revenue deductions % I/C % allocated to this category 0.7% 6.1% 1.7% 4.1% 4.0% 15.9% 13.9% 12.5%
21 Grants and contributions taxable on receipt % I/C % allocated to this category 0.0% 0.0% 0.0% 0.0% 0.0% 0.0% 0.0% 0.0%
Check ok ok ok ok ok ok
Opening position (£ Million) Units Field Additional Info 2006-07 2007-08 2008-09
22 Opening pool of capital allowances – asset life < 25 years £m C 474.8 526.4 607.3
23 Opening pool of capital allowances – asset life >= 25 years £m C 696.4 867.6 1032.4
24 Residual IBA’s £m C 251.4 263.0 319.9
25 General provisions – opening balance £m I/C 92.4 66.4 62.0
26 Losses brought forward £m I/C 230.9 172.5 121.3
Deductions for capital expenditure (£ Million) Units Field Additional Info 2006-07 2007-08 2008-09 2009-10 2010-11 2011-12 2012-13 2013-14
27 Existing IBA claims (Outturn) £m I/C Input positive 16.9 19.7 14.8 9.8 4.9 0.0 0.0 0.0
28 Depreciation on capitalised revenue expenditure – non – infrastructure (outturn) - Assets capitalised by 31/03/08 £m I/C Input positive 25.4 30.3 14.4 36.6 19.4 20.7 16.7 12.0
29 Depreciation on capitalised revenue expenditure – infrastructure (outturn) £m I/C Input positive 88.0 90.0 104.2 0.0 0.0 0.0 0.0 0.0
30 Average asset life – non - infrastructure (new assets) Years I/C Life of capitalised asset in the year 1 1 0.0 0.0 0.0 0.0 0.0 0.0
31 Average asset life – infrastructure (new assets) Years I/C Life of capitalised asset in the year 0 0 1.0 1.0 1.0 1.0 1.0 1.0
Other Deductions/Adjustments (£ Million) Units Field Additional Info 2006-07 2007-08 2008-09 2009-10 2010-11 2011-12 2012-13 2013-14
32 Revenue expenditure not allowable for tax purposes £m I 2.2 2.2 2.2 2.2 2.2 2.2
33 Permanently disallowed expenditure £m I 0.0 0.0 0.0 0.0 0.0 0.0
34 Profit/income not subject to tax/not taxed as trading income £m I 0.0 0.0 0.0 0.0 0.0 0.0
35 Increase/(decrease) in general provisions (outturn) £m I 0.0 0.0 0.0 0.0 0.0 0.0

Process sheet: Capital Expenditure
Total capital expenditure
Total Allowed for Investment - post efficiency Units Field Type 2008-09 2009-10 2010-11 2011-12 2012-13 2013-14
1 Q&S3b - Capital Maintenance - Infrastructure (net of grants) £m C 3.5 12.6 114.4 105.5 120.4 123.6
2 Q&S3b - Capital Maintenance - Non-Infrastructure (net of grants) £m C 2.4 13.5 103.7 128.9 118.0 125.3
3 Q&S3b - Capital Enhancement - Infrastructure (net of grants) £m C 3.8 10.2 81.0 137.7 127.3 150.8
4 Q&S3b - Capital Enhancement - Non Infrastructure (net of grants) £m C 13.0 22.2 72.4 129.3 165.9 154.7
5 Q&S3a - Capital Maintenance - Infrastructure (net of grants) £m C 101.6 76.3 3.4 1.2 3.8 0.0
6 Q&S3a - Capital Maintenance - Non-Infrastructure (net of grants) £m C 128.3 90.3 9.6 1.4 0.6 0.0
7 Q&S3a - Capital Enhancement - Infrastructure (net of grants) £m C 110.4 129.6 49.4 2.9 0.2 0.0
8 Q&S3a - Capital Enhancement - Non Infrastructure (net of grants) £m C 300.3 291.0 56.7 9.6 4.6 0.0
9 Q&S2 - Capital Investment (net of grants) £m C 29.2 52.6 24.1 11.2 0.1 0.0
10 Gross Other Investment (net of grants) £m C 0.0 0.0 0.0 0.0 0.0 0.0
11 Grants and Third Party Contributions £m C 0.0 0.0 0.0 0.0 0.0 0.0
12 Total Capital Programme £m C 692.5 698.3 514.8 527.7 540.9 554.4
Q&S3b - Allocation of capital expenditure into asset life categories
Allocation of Non-Infrastructure Capital Maintenance Units Field Type 2008-09 2009-10 2010-11 2011-12 2012-13 2013-14
13 Very Short £m C 0.1 5.1 33.2 19.6 25.7 40.1
14 Short £m C 0.2 0.7 8.1 10.1 8.8 8.2
15 Medium £m C 1.1 4.2 34.3 54.8 45.5 40.2
16 Medium long £m C 0.0 0.1 0.7 1.1 0.9 0.9
17 Long £m C 0.9 3.3 26.1 41.5 35.4 34.4
18 Infinite (land) £m C 0.0 0.1 1.3 1.8 1.7 1.5
19 Total £m C 2.4 13.5 103.7 128.9 118.0 125.3
Allocation of Non-Infrastructure Capital Enhancement Units Field Type 2008-09 2009-10 2010-11 2011-12 2012-13 2013-14
20 Very Short £m C 0.1 0.5 4.0 9.0 12.8 10.1
21 Short £m C 10.2 12.5 14.9 20.1 13.4 17.3
22 Medium £m C 1.4 5.1 29.0 55.2 80.1 72.0
23 Medium long £m C 0.0 0.1 0.7 1.5 2.3 1.9
24 Long £m C 1.1 3.9 23.0 42.3 56.0 52.0
25 Infinite (land) £m C 0.0 0.1 0.7 1.3 1.4 1.4
26 Total £m C 13.0 22.2 72.4 129.3 165.9 154.7
Q&S3a - Allocation of capital expenditure into asset life categories
Allocation of Non-Infrastructure Capital Maintenance Units Field Type 2008-09 2009-10 2010-11 2011-12 2012-13 2013-14
27 Very Short £m C 22.3 19.8 0.8 0.1 0.1 0.0
28 Short £m C 8.7 3.9 0.1 0.0 0.0 0.0
29 Medium £m C 53.1 36.4 6.0 0.7 0.4 0.0
30 Medium long £m C 1.1 0.8 0.1 0.0 0.0 0.0
31 Long £m C 41.3 27.8 2.6 0.5 0.2 0.0
32 Infinite (land) £m C 1.8 1.6 0.1 0.0 0.0 0.0
33 Total £m C 128.3 90.3 9.6 1.4 0.6 0.0
Allocation of Non-Infrastructure Capital Enhancement Units Field Type 2008-09 2009-10 2010-11 2011-12 2012-13 2013-14
34 Very Short £m C 29.3 26.4 4.8 0.8 0.3 0.0
35 Short £m C 10.9 13.8 6.7 0.5 0.2 0.0
36 Medium £m C 141.2 136.5 25.9 4.7 2.3 0.0
37 Medium long £m C 6.1 9.4 0.8 0.2 0.1 0.0
38 Long £m C 110.6 102.7 18.2 3.3 1.7 0.0
39 Infinite (land) £m C 2.3 2.1 0.4 0.1 0.0 0.0
40 Total £m C 300.3 291.0 56.7 9.6 4.6 0.0

Process sheet: Capital Expenditure
Q&S2 - Allocation of capital expenditure into asset life categories
Overhang capital expenditure Units Field Type 2008-09 2009-10 2010-11 2011-12 2012-13 2013-14
41 Very Short £m C 1.4 1.1 0.4 0.2 0.0 0.0
42 Short £m C 1.7 2.2 0.7 0.4 0.0 0.0
43 Medium £m C 12.5 11.8 4.3 2.2 0.0 0.0
44 Medium long £m C 0.3 0.3 0.1 0.0 0.0 0.0
45 Long £m C 9.7 10.5 3.9 1.9 0.0 0.0
46 Infinite (land) £m C 0.3 0.4 0.1 0.1 0.0 0.0
47 Infrastructure Enhancement £m C 3.3 26.4 14.5 6.4 0.1 0.0
48 Total £m C 29.2 52.6 24.1 11.2 0.1 0.0
Other investment - Allocation of capital expenditure into asset life categories
Other Investment Units Field Type 2008-09 2009-10 2010-11 2011-12 2012-13 2013-14
49 Very Short £m C 0.0 0.0 0.0 0.0 0.0 0.0
50 Short £m C 0.0 0.0 0.0 0.0 0.0 0.0
51 Medium £m C 0.0 0.0 0.0 0.0 0.0 0.0
52 Medium long £m C 0.0 0.0 0.0 0.0 0.0 0.0
53 Long £m C 0.0 0.0 0.0 0.0 0.0 0.0
54 Infinite (land) £m C 0.0 0.0 0.0 0.0 0.0 0.0
55 Infrastructure Enhancement £m C 0.0 0.0 0.0 0.0 0.0 0.0
56 Total £m C 0.0 0.0 0.0 0.0 0.0 0.0
Grants and Contributions - Allocation of capital expenditure into asset life categories
Grants and Third Party Contributions Units Field Type 2008-09 2009-10 2010-11 2011-12 2012-13 2013-14
57 Very Short £m C 0.0 0.0 0.0 0.0 0.0 0.0
58 Short £m C 0.0 0.0 0.0 0.0 0.0 0.0
59 Medium £m C 0.0 0.0 0.0 0.0 0.0 0.0
60 Medium long £m C 0.0 0.0 0.0 0.0 0.0 0.0
61 Long £m C 0.0 0.0 0.0 0.0 0.0 0.0
62 Infinite (land) £m C 0.0 0.0 0.0 0.0 0.0 0.0
63 Infrastructure Enhancement £m C 0.0 0.0 0.0 0.0 0.0 0.0
64 Total £m C 0.0 0.0 0.0 0.0 0.0 0.0
Infrastructure Renewals Charge
Infrastructure Renewals Charge Units Field Type 2008-09 2009-10 2010-11 2011-12 2012-13 2013-14
65 Infrastructure Renewals Charge £m C 100.2 104.2 118.1 121.1 124.1 127.2

Process sheet: Capital Expenditure
Total Asset additions
Total asset additions - Historic Cost Units Field Type 2008-09 2009-10 2010-11 2011-12 2012-13 2013-14
66 Very Short £m C 53.2 53.0 43.2 29.7 38.9 50.2
67 Short £m C 31.7 33.0 30.5 31.2 22.4 25.4
68 Medium £m C 209.3 194.0 99.6 117.5 128.2 112.3
69 Medium long £m C 7.6 10.7 2.4 2.8 3.3 2.8
70 Long £m C 163.6 148.2 73.8 89.6 93.3 86.4
71 Infinite (land) £m C 4.4 4.4 2.6 3.2 3.1 2.9
72 Infrastructure Enhancement £m C 117.5 166.1 144.9 147.0 127.5 150.8
73 Infrastructure Renewals expenditure £m C 105.2 88.9 117.8 106.6 124.2 123.6
74 Total £m C 692.5 698.3 514.8 527.7 540.9 554.4
Total asset additions - Current Cost Units Field Type 2008-09 2009-10 2010-11 2011-12 2012-13 2013-14
75 Very Short £m C 53.2 53.0 43.2 29.7 38.9 50.2
76 Short £m C 31.7 33.0 30.5 31.2 22.4 25.4
77 Medium £m C 209.3 194.0 99.6 117.5 128.2 112.3
78 Medium long £m C 7.6 10.7 2.4 2.8 3.3 2.8
79 Long £m C 163.6 148.2 73.8 89.6 93.3 86.4
80 Infinite (land) £m C 4.4 4.4 2.6 3.2 3.1 2.9
81 Infrastructure Enhancement £m C 117.5 166.1 144.9 147.0 127.5 150.8
82 Infrastructure Renewals expenditure £m C 105.2 88.9 117.8 106.6 124.2 123.6
83 Total £m C 692.5 698.3 514.8 527.7 540.9 554.4
Check! TRUE TRUE TRUE TRUE TRUE TRUE

Process sheet: Depreciation
Depreciation rates
Asset Depreciation rates Rate Years
1 Very Short 20% 5.0
2 Short 10% 10.0
3 Medium 5% 20.0
4 Medium long 3% 40.0
5 Long 2% 60.0
6 Infinite 0% Inf.
7 Infrastructure 0% Inf.
Tangible Assets - Historic Cost Accounting
HC depreciation on opening assets Units Field Type 2008-09 2009-10 2010-11 2011-12 2012-13 2013-14
8 Depreciation on opening assets £m B 147.6 154.1 138.9 125.3 109.4 102.7
Depreciation annual rate on asset added in the year (outturn) Units Field Type 2008-09 2009-10 2010-11 2011-12 2012-13 2013-14
9 Very Short £m C 10.6 10.6 8.6 5.9 7.8 10.0
10 Short £m C 3.2 3.3 3.1 3.1 2.2 2.5
11 Medium £m C 10.5 9.7 5.0 5.9 6.4 5.6
12 Medium long £m C 0.2 0.3 0.1 0.1 0.1 0.1
13 Long £m C 2.7 2.5 1.2 1.5 1.6 1.4
14 Total depreciation on asset additions £m C 27.2 26.3 18.0 16.5 18.1 19.7
HC depreciation on asset additions Units Field Type 2008-09 2009-10 2010-11 2011-12 2012-13 2013-14
15 Very Short £m C 5.3 16.0 25.6 32.9 39.7 43.3
16 Short £m C 1.6 4.8 8.0 11.1 13.8 16.1
17 Medium £m C 5.2 15.3 22.7 28.1 34.2 40.2
18 Medium long £m C 0.1 0.3 0.5 0.6 0.6 0.7
19 Long £m C 1.4 4.0 5.8 7.2 8.7 10.2
20 Total depreciation on asset additions £m C 13.6 40.4 62.5 79.7 97.0 110.6
HC depreciation forgone on asset disposals Units Field Type 2008-09 2009-10 2010-11 2011-12 2012-13 2013-14
21 HC depreciation forgone on asset disposals £m B 0.0 0.0 0.0 0.0 0.0 0.0
Total HC depreciation charge in the year Units Field Type 2008-09 2009-10 2010-11 2011-12 2012-13 2013-14
22 Total depreciation charge in the year £m C 161.2 194.5 201.4 205.1 206.4 213.2
Tangible Assets - Current Cost Accounting
CC Depreciation on opening assets Units Field Type 2008-09 2009-10 2010-11 2011-12 2012-13 2013-14
23 Depreciation on opening assets £m C 216.6 218.1 213.3 201.9 198.7 197.2
CC Depreciation on asset additions Units Field Type 2008-09 2009-10 2010-11 2011-12 2012-13 2013-14
24 Very Short £m C 5.3 16.2 26.4 34.4 42.2 46.3
25 Short £m C 1.6 4.9 8.2 11.6 14.6 17.3
26 Medium £m C 5.2 15.6 23.4 29.5 36.5 43.5
27 Medium long £m C 0.1 0.3 0.5 0.6 0.7 0.8
28 Long £m C 1.4 4.0 6.0 7.5 9.3 11.0
29 Total depreciation on asset additions £m C 13.6 41.1 64.6 83.6 103.2 118.9
CC Depreciation forgone on asset disposals Units Field Type 2008-09 2009-10 2010-11 2011-12 2012-13 2013-14
30 CC depreciation forgone on asset disposals £m C 0.0 0.0 0.0 0.0 0.0 0.0

Process sheet: Depreciation
CC depreciation on WIP commissioned after 31/03/08 Units Field Type 2008-09 2009-10 2010-11 2011-12 2012-13 2013-14
31 CC depreciation on WIP commissioned after 31/03/08 £m C 0.0 0.0 0.0 0.0 0.0 0.0
Total CC depreciation charge in the year Units Field Type 2008-09 2009-10 2010-11 2011-12 2012-13 2013-14
32 Total CC depreciation charge in the year £m C 230.2 259.1 277.8 285.5 301.9 316.0
Infrastructure Renewals Charge
Infrastructure Renewals Charge Units Field Type 2008-09 2009-10 2010-11 2011-12 2012-13 2013-14
33 Infrastructure Renewals charge £m C 100.2 104.2 118.1 121.1 124.1 127.2
Grants and Contributions - Historic Cost Accounting
Historic Cost Amortisation of Existing Grants (£ Million) Units Field Type 2008-09 2009-10 2010-11 2011-12 2012-13 2013-14
34 Amortisation of Existing Grants (31/03/2008) £m B 0.8 0.8 0.8 0.8 0.8 0.8
Amortisation of new grants Units Field Type 2008-09 2009-10 2010-11 2011-12 2012-13 2013-14
35 Very Short £m C 0.0 0.0 0.0 0.0 0.0 0.0
36 Short £m C 0.0 0.0 0.0 0.0 0.0 0.0
37 Medium £m C 0.0 0.0 0.0 0.0 0.0 0.0
38 Medium long £m C 0.0 0.0 0.0 0.0 0.0 0.0
39 Long £m C 0.0 0.0 0.0 0.0 0.0 0.0
40 Infinite (land) £m C 0.0 0.0 0.0 0.0 0.0 0.0
41 Total £m C 0.0 0.0 0.0 0.0 0.0 0.0
Total amortisation of grants and contributions Units Field Type 2008-09 2009-10 2010-11 2011-12 2012-13 2013-14
42 Total amortisation of grants and contributions £m C 0.8 0.8 0.8 0.8 0.8 0.8
Third Party Contributions - Current Cost Accounting
Current Cost Amortisation of Existing Grants (£ Million) Units Field Type 2008-09 2009-10 2010-11 2011-12 2012-13 2013-14
43 Amortisation of Existing Grants (31/03/2008) £m C 0.8 0.8 0.9 0.9 0.9 0.9
Amortisation of new grants added in the period Units Field Type 2008-09 2009-10 2010-11 2011-12 2012-13 2013-14
44 Very Short £m C 0.0 0.0 0.0 0.0 0.0 0.0
45 Short £m C 0.0 0.0 0.0 0.0 0.0 0.0
46 Medium £m C 0.0 0.0 0.0 0.0 0.0 0.0
47 Medium long £m C 0.0 0.0 0.0 0.0 0.0 0.0
48 Long £m C 0.0 0.0 0.0 0.0 0.0 0.0
49 Infinite (land) £m C 0.0 0.0 0.0 0.0 0.0 0.0
50 Infrastructure £m C 0.0 0.0 0.0 0.0 0.0 0.0
51 Total £m C 0.0 0.0 0.0 0.0 0.0 0.0
Cumulative amortisation of new grants Units Field Type 2008-09 2009-10 2010-11 2011-12 2012-13 2013-14
52 Very Short £m C 0.0 0.0 0.0 0.0 0.0 0.0
53 Short £m C 0.0 0.0 0.0 0.0 0.0 0.0
54 Medium £m C 0.0 0.0 0.0 0.0 0.0 0.0
55 Medium long £m C 0.0 0.0 0.0 0.0 0.0 0.0
56 Long £m C 0.0 0.0 0.0 0.0 0.0 0.0
57 Infinite (land) £m C 0.0 0.0 0.0 0.0 0.0 0.0
58 Infrastructure £m C 0.0 0.0 0.0 0.0 0.0 0.0
59 Total £m C 0.0 0.0 0.0 0.0 0.0 0.0
Total amortisation of grants and contributions Units Field Type 2008-09 2009-10 2010-11 2011-12 2012-13 2013-14
60 Total amortisation of grants and contributions £m C 0.8 0.8 0.9 0.9 0.9 0.9

Process sheet: Book Value
Fixed Assets - Historic Cost Accounting
Gross fixed assets Units Field Type 2008-09 2009-10 2010-11 2011-12 2012-13 2013-14
1 Opening Gross cost of fixed assets £m B 5,725.7 6,310.3 6,911.7 7,299.7 7,719.7 8,135.4
2 Asset additions £m C 587.4 601.4 389.0 421.0 416.7 430.8
3 Asset disposals £m B -2.8 0.0 -1.0 -1.0 -1.0 -1.0
4 Closing Gross cost of fixed assets £m C 6,310.3 6,911.7 7,299.7 7,719.7 8,135.4 8,565.2
Accumulated Depreciation Units Field Type 2008-09 2009-10 2010-11 2011-12 2012-13 2013-14
5 Opening accumulated depreciation £m B -1,914.5 -2,073.3 -2,267.7 -2,469.1 -2,674.2 -2,880.6
6 Depreciation in the year £m B -161.2 -194.5 -201.4 -205.1 -206.4 -213.2
7 Disposals £m B 2.4 0.0 0.0 0.0 0.0 0.0
8 Closing accumulated depreciation £m C -2,073.3 -2,267.7 -2,469.1 -2,674.2 -2,880.6 -3,093.8
Net book value Units Field Type 2008-09 2009-10 2010-11 2011-12 2012-13 2013-14
9 Net book value £m C 4,237.0 4,644.0 4,830.6 5,045.6 5,254.8 5,471.4
Fixed Assets - Current Cost Accounting
Gross fixed assets Units Field Type 2008-09 2009-10 2010-11 2011-12 2012-13 2013-14
10 Opening Gross cost of fixed assets £m B 43,342.0 45,213.1 46,944.8 48,506.4 50,139.1 51,808.2
11 Inflation adjustment £m C 1,286.5 1,130.3 1,173.6 1,212.7 1,253.5 1,295.2
12 Asset additions £m C 587.4 601.4 389.0 421.0 416.7 430.8
13 Asset disposals £m C -2.8 0.0 -1.0 -1.0 -1.0 -1.1
14 Closing Gross cost of fixed assets £m C 45,213.1 46,944.8 48,506.4 50,139.1 51,808.2 53,533.1
Accumulated depreciation Units Field Type 2008-09 2009-10 2010-11 2011-12 2012-13 2013-14
15 Opening accumulated depreciation £m B -3,601.8 -3,936.4 -4,294.0 -4,679.2 -5,081.6 -5,510.6
16 Inflation adjustment £m C -106.9 -98.4 -107.3 -117.0 -127.0 -137.8
17 Depreciation in the year £m B -230.2 -259.1 -277.8 -285.5 -301.9 -316.0
18 Disposals £m C 2.4 0.0 0.0 0.0 0.0 0.0
19 Closing accumulated depreciation £m C -3,936.4 -4,294.0 -4,679.2 -5,081.6 -5,510.6 -5,964.4
Net book value Units Field Type 2008-09 2009-10 2010-11 2011-12 2012-13 2013-14
20 Net book value £m C 41,276.6 42,650.8 43,827.2 45,057.4 46,297.6 47,568.8
Infrastructure Renewals Calculations
Infrastructure renewals prepayment/accrual Units Field Type 2008-09 2009-10 2010-11 2011-12 2012-13 2013-14
21 Infrastructure Renewals prepayment/accrual (opening) £m B 4.8 9.8 -5.6 -5.9 -20.4 -20.3
22 Infrastructure Renewals Expenditure £m B 105.2 88.9 117.8 106.6 124.2 123.6
23 Infrastructure Renewals Charge £m B -100.2 -104.2 -118.1 -121.1 -124.1 -127.2
24 Infrastructure Renewals prepayment/accrual (closing) £m C 9.8 -5.6 -5.9 -20.4 -20.3 -23.9
Grants and Deferred income - Historic Cost accounting
Amortisation of new grants Units Field Type 2008-09 2009-10 2010-11 2011-12 2012-13 2013-14
25 Deferred Income - opening amount £m B -19.7 -18.9 -18.1 -17.3 -16.5 -15.7
26 Additions on year £m C 0.0 0.0 0.0 0.0 0.0 0.0
27 Amortisation £m B 0.8 0.8 0.8 0.8 0.8 0.8
28 Deferred Income - closing amount £m C -18.9 -18.1 -17.3 -16.5 -15.7 -14.9
Third Party contributions - Current Cost accounting
Amortisation of new grants Units Field Type 2008-09 2009-10 2010-11 2011-12 2012-13 2013-14
29 Third Party Contributions - opening amount £m B -21.4 -21.2 -20.9 -20.5 -20.1 -19.7
30 Inflation adjustment £m C -0.6 -0.5 -0.5 -0.5 -0.5 -0.5
31 Additions on year £m B 0.0 0.0 0.0 0.0 0.0 0.0
32 Amortisation £m B 0.8 0.8 0.9 0.9 0.9 0.9
33 Third Party Contributions - closing amount £m C -21.2 -20.9 -20.5 -20.1 -19.7 -19.3

Process sheet: Regulatory capital value
RCV Units Field Type Additional Info 2010-11 2011-12 2012-13 2013-14
1 Closing RCV (previous year) £m B 5,504.2 5,760.5 6,025.4 6,290.8
2 Indexation £m C 137.6 144.0 150.6 157.3
3 Adjustments £m C 0.0 0.0 0.0 0.0
4 Opening RCV £m C 5,641.8 5,904.5 6,176.1 6,448.1
5 Capital Expenditure £m C 397.0 421.0 416.7 430.8
6 Non-Infrastructure Assets £m C 252.1 274.0 289.2 280.0
7 Infrastructure Enhancement £m B 144.9 147.0 127.5 150.8
8 Infrastructure Renewals Expenditure £m B 117.8 106.6 124.2 123.6
9 Grants and Contributions £m B 0.0 0.0 0.0 0.0
10 Depreciation £m C -277.0 -284.6 -301.0 -315.1
11 Depreciation £m B -277.8 -285.5 -301.9 -316.0
12 Depreciation of Capital Grants £m B 0.9 0.9 0.9 0.9
13 Infrastructure Renewals Charge £m B -118.1 -121.1 -124.1 -127.2
14 Disposal of Assets £m C -1.0 -1.0 -1.0 -1.1
15 Closing RCV £m C 5,760.5 6,025.4 6,290.8 6,559.1
16 Average Year RCV £m C 5,632.3 5,892.9 6,158.1 6,424.9

Process sheet: Interest income and interest expense
Interest payments on embedded debt
Embedded debt Units Field Type Additional Info 2007-08 2008-09 2009-10 2010-11 2011-12 2012-13 2013-14
1 3%-3.99% £m C 66.0 51.0 51.0 51.0 51.0 51.0
2 4%-4.99% £m C 1314.6 1282.1 1267.1 1239.7 1204.7 1169.2
3 5%-5.99% £m C 370.9 323.5 300.6 300.6 285.6 285.6
4 6%-6.99% £m C 131.4 129.4 126.4 126.4 118.4 116.4
5 7%-7.99% £m C 465.1 404.7 394.0 394.0 386.0 359.0
6 8%-8.99% £m C 41.8 36.7 34.5 33.1 31.5 29.8
7 9%-9.99% £m C 127.7 122.4 122.1 121.7 112.6 109.0
8 10%-10.99% £m C 101.1 88.3 76.4 38.8 35.6 33.2
9 11%-11.99% £m C 13.3 7.9 7.4 6.4 6.3 5.8
10 12%-12.99% £m C 1.1 0.0 0.0 0.0 0.0 0.0
11 13%-13.99% £m C 0.2 0.2 0.2 0.2 0.2 0.2
12 14%-14.99% £m C 0.2 0.2 0.2 0.0 0.0 0.0
13 Total Embedded Debt £m C 2633.2 2446.2 2379.8 2311.8 2231.8 2159.2
Embedded Debt Due for Repayment (£ Million) Units Field Type Additional Info 2007-08 2008-09 2009-10 2010-11 2011-12 2012-13 2013-14
14 3%-3.99% £m C 15.0 0.0 0.0 0.0 0.0 0.0
15 4%-4.99% £m C 32.5 15.0 27.4 35.0 35.5 20.0
16 5%-5.99% £m C 47.4 22.9 0.0 15.0 0.0 17.5
17 6%-6.99% £m C 2.0 3.0 0.0 8.0 2.0 5.0
18 7%-7.99% £m C 60.4 10.7 0.0 8.0 27.0 2.0
19 8%-8.99% £m C 5.1 2.2 1.4 1.6 1.7 0.9
20 9%-9.99% £m C 5.3 0.3 0.3 9.2 3.6 18.0
21 10%-10.99% £m C 12.8 11.8 37.7 3.2 2.3 1.0
22 11%-11.99% £m C 5.5 0.4 1.0 0.1 0.5 0.9
23 12%-12.99% £m C 1.1 0.0 0.0 0.0 0.0 0.0
24 13%-13.99% £m C 0.0 0.0 0.0 0.0 0.0 0.0
25 14%-14.99% £m C 0.0 0.0 0.1 0.0 0.0 0.0
26 Total £m C 187.0 66.4 67.9 80.1 72.6 65.4
Interest Payable on Embedded Debt (£ Million) Units Field Type Additional Info Avg. rate 2008-09 2009-10 2010-11 2011-12 2012-13 2013-14
27 3%-3.99% £m C 3.5% 2.0 1.8 1.8 1.8 1.8 1.8
28 4%-4.99% £m C 4.5% 58.4 57.4 56.4 55.0 53.4 52.2
29 5%-5.99% £m C 5.5% 19.1 17.2 16.5 16.1 15.7 15.2
30 6%-6.99% £m C 6.5% 8.5 8.3 8.2 8.0 7.6 7.4
31 7%-7.99% £m C 7.5% 32.6 30.0 29.6 29.3 27.9 26.9
32 8%-8.99% £m C 8.5% 3.3 3.0 2.9 2.7 2.6 2.5
33 9%-9.99% £m C 9.5% 11.9 11.6 11.6 11.1 10.5 9.5
34 10%-10.99% £m C 10.5% 9.9 8.6 6.0 3.9 3.6 3.4
35 11%-11.99% £m C 11.5% 1.2 0.9 0.8 0.7 0.7 0.6
36 12%-12.99% £m C 12.5% 0.1 0.0 0.0 0.0 0.0 0.0
37 13%-13.99% £m C 13.5% 0.0 0.0 0.0 0.0 0.0 0.0
38 14%-14.99% £m C 14.5% 0.0 0.0 0.0 0.0 0.0 0.0
39 Total Interest Payable on Embedded Debt £m C 147.1 138.8 133.8 128.6 123.9 119.5
Interest payments on prepaid wholesale charge
Cost of capital adjustment Units Field Type Additional Info Avg. rate 2008-09 2009-10 2010-11 2011-12 2012-13 2013-14
40 Prepaid wholesale charge (opening) £m C 18.5 18.5 26.0 28.0 29.2 29.5
41 Prepaid wholesale charge (closing) £m B 18.5 26.0 28.0 29.2 29.5 29.7
42 Prepaid wholesale charge (average in the year) £m C 18.5 22.3 27.0 28.6 29.3 29.6
43 Interest rate paid on charge % B 1.0% 1.0% 2.5% 2.5% 2.5% 2.5%
44 Interest payable on wholesale prepaid charge £m C 0.2 0.2 0.7 0.7 0.7 0.7
45 Interest payable before interest on new debt £m C 147.3 139.0 134.5 129.4 124.7 120.2

Process sheet: Interest income and interest expense
Interest payments on new debt
New debt and interest payments on new debt Units Field Type Additional Info 2007-08 2008-09 2009-10 2010-11 2011-12 2012-13 2013-14
46 Interest rate (nominal) £m B 4.6% 4.6% 4.6% 4.6% 4.6% 4.6%
New debt required (output to cash flow) Units Field Type Additional Info 2007-08 2008-09 2009-10 2010-11 2011-12 2012-13 2013-14
47 New Debt £m C -348.3 -248.4 -217.9 -230.1 -222.6 -215.4
New debt and interest payments on new debt Units Field Type Additional Info 2007-08 2008-09 2009-10 2010-11 2011-12 2012-13 2013-14
48 Interest Payable on New Debt (before iterations) £m C 0.0 -16.0 -27.4 -37.5 -48.1 -58.3
49 Interest Payable on New Debt (iterations only) £m C -8.0 -5.7 -4.7 -5.0 -5.0 -4.9
50 Cumulative Interest on New Debt £m C -8.0 -21.7 -32.1 -42.5 -53.0 -63.2
51 Total interest before tax adjustment £m C -155.3 -160.7 -166.6 -171.9 -177.7 -183.4
52 Adjustments due to tax changes £m C 0.0 0.0 0.0 0.0
53 Interest payable new debt (after tax changes) £m C -8.0 -21.7 -32.1 -42.5 -53.0 -63.2
Iterations to calculate new debt required (£ Million) Units Field Type Additional Info 2007-08 2008-09 2009-10 2010-11 2011-12 2012-13 2013-14
54 New debt before rolled up interest (before tax) £m B -340.3 -242.7 -199.0 -213.8 -210.5 -208.6
55 Iteration to infinity £m C -348.3 -248.4 -203.6 -218.8 -215.4 -213.5
Total interest payments
Total interest payments Units Field Type Additional Info 2007-08 2008-09 2009-10 2010-11 2011-12 2012-13 2013-14
56 Total interest payments £m C 155.3 160.7 166.6 171.9 177.7 183.4
Interest income
Interest income Units Field Type Additional Info 2007-08 2008-09 2009-10 2010-11 2011-12 2012-13 2013-14
57 Cash and equivalents £m C 0.00 0.01 0.05 0.05 0.05 0.05
58 Short term deposits £m C 0.00 0.00 0.00 0.00 0.00 0.00
59 Gilts buffer £m C 0.00 0.00 0.00 0.00 0.00 0.00
60 Total interest income £m C 0.00 0.01 0.05 0.05 0.05 0.05
Cash flow calculations adapted for Revenue variance options
Cash flow calcs to avoid circularities Units Field Type Additional Info 2007-08 2008-09 2009-10 2010-11 2011-12 2012-13 2013-14
61 Revenue inputs or tariff baskets £m C -340.3 -242.7 -199.0 -213.8 -210.5 -208.6
62 Revenue building blocks £m C -253.4 -238.7 -201.4 -167.9
Allowance of embedded debt over Cost of Capital
Cost of capital adjustment Units Field Type Additional Info 2007-08 2008-09 2009-10 2010-11 2011-12 2012-13 2013-14
63 Cost of Debt (pre-tax) for cost of capital calculations £m C 83.3 80.9 78.1 75.6
64 Weighted average interest rate on embedded debt % C 5.6% 5.6% 5.6% 5.5%
65 Notional inflation % F 2.5% 2.5% 2.5% 2.5%
66 Real weighted average interest rate on embedded debt % C 3.1% 3.1% 3.1% 3.0%
67 Cost of embedded debt (Real) £m C 74.3 70.8 68.1 65.5
69 Adjustment to cost of capital £m C 0.0 0.0 0.0 0.0

Process sheet: Capital allowances
Capital Allowances Rates Units Field Type Additional Info 2008-09 2009-10 2010-11 2011-12 2012-13 2013-14
1 Plant and Machinery Short life - less than 25 years - allowance rate (reducing balance) % B 20% 20% 20% 20% 20% 20%
2 Plant and Machinery Long life - more than 25 years - allowance rate (reducing balance) % B 10% 10% 10% 10% 10% 10%
3 Industrial Buildings Allowance rate (straight line) % B 3% 2% 1% 0% 0% 0%
Apportionments of Capital expenditure Units Field Type Additional Info 2008-09 2009-10 2010-11 2011-12 2012-13 2013-14
4 Work in progress - Opening amount £m C 871.0
5 Work in progress (portion where capital allowances have not been claimed) - opening £m B 579.0 571.6 602.6 572.4 539.7 518.8
6 Total capitalised expenditure including IRE (outturn prices) excluding grants £m B 692.5 698.3 514.8 527.7 540.9 554.4
7 Capitalised expenditure allocated for capital allowances (including Work in progress) £m C 699.9 667.3 544.9 560.4 561.8 560.0
8 Work in progress (portion where capital allowances have not been claimed) - closing £m C 571.6 602.6 572.4 539.7 518.8 513.2
9 Assets qualifying for 100% first year allowances £m C 0.0 0.0 0.0 0.0 0.0 0.0
10 Assets to be included in the general (25%) pool £m C 135.8 179.5 152.8 149.2 164.1 162.0
11 Assets qualifying for long life (6%) pool £m C 203.5 303.0 228.9 229.2 234.4 240.6
12 Assets qualifying for Industrial Buildings Allowance £m C 145.8 83.4 49.4 0.0 0.0 0.0
13 Assets purchased under finance leasing £m C 0.0 0.0 0.0 0.0 0.0 0.0
14 Capitalised revenue expenditure deducted in year of spend £m C 0.0 54.8 71.5 76.2 73.1 76.5
15 Capitalised revenue expenditure depreciated - non – infrastructure £m C 36.6 19.6 20.6 16.5 11.9 10.7
16 Capitalised revenue expenditure depreciated – infrastructure £m C 166.0 0.0 0.0 0.0 0.0 0.0
17 Capitalised revenue expenditure not depreciated £m C 0.0 0.0 0.0 0.0 0.0 0.0
18 Other assets not qualifying for capital allowances or revenue deductions £m C 12.1 27.1 21.7 89.3 78.2 70.2
19 Grants and contributions taxable on receipt £m C 0.0 0.0 0.0 0.0 0.0 0.0
20 Total £m C 699.9 667.3 544.9 560.4 561.8 560.0
100% Allowances or Capital expenditures deducted from trading profit (£ Million) Units Field Type Additional Info 2008-09 2009-10 2010-11 2011-12 2012-13 2013-14
21 Allowances £m B 0.0 0.0 0.0 0.0 0.0 0.0
Short life assets (25%) pool (£ Million) Units Field Type Additional Info 2008-09 2009-10 2010-11 2011-12 2012-13 2013-14
22 Opening Balance £m B 607.3 594.5 619.2 617.6 613.4 622.0
23 Additions £m B 135.8 179.5 152.8 149.2 164.1 162.0
24 Allowances £m C -148.6 -154.8 -154.4 -153.4 -155.5 -156.8
25 Closing Balance £m C 594.5 619.2 617.6 613.4 622.0 627.2
Long Life Assets (6%) pool (Million) Units Field Type Additional Info 2008-09 2009-10 2010-11 2011-12 2012-13 2013-14
26 Opening Balance £m B 1032.4 1112.3 1273.7 1352.3 1423.3 1492.0
27 Additions £m B 203.5 303.0 228.9 229.2 234.4 240.6
28 Allowances £m C -123.6 -141.5 -150.3 -158.1 -165.8 -173.3
29 Closing Balance £m C 1112.3 1273.7 1352.3 1423.3 1492.0 1559.4
Industrial Buildings (straight line) (£ Million) Units Field Type Additional Info 2008-09 2009-10 2010-11 2011-12 2012-13 2013-14
30 IBA claims (Base year 2007-08) £m B -14.8 -9.8 -4.9 0 0 0
31 New IB assets £m B 145.8 83.4 49.4 0.0 0.0 0.0
32 Allowances on new IBA assets £m C -4.4 -4.6 -2.8 0.0 0.0 0.0
33 Total Industrial Building Allowances £m C -19.1 -14.4 -7.7 0.0 0.0 0.0
Total Capital Allowances (incl. IBA) (£ Million) Units Field Type Additional Info 2008-09 2009-10 2010-11 2011-12 2012-13 2013-14
34 Total Allowances £m C -291.3 -310.7 -312.4 -311.5 -321.3 -330.1
Capitalised Revenue Expenduture: Non-Infrastrure Assets (£ Million) Units Field Type Additional Info 2008-09 2009-10 2010-11 2011-12 2012-13 2013-14
35 Opening Non-Infrastructure Assets (capitalised after 31/03/08) £m B 36.6 56.2 76.8 93.4 105.3
36 Depreciation of new capitalised Assets £m B 0.0 0.0 0.0 0.0 0.0
37 Capital Additions £m B 36.6 19.6 20.6 16.5 11.9 10.7
38 Closing Capitalised Non-Infrastructure Assets £m C 36.6 56.2 76.8 93.4 105.3 115.9

Process sheet: Capital allowances
Summary of Depreciation Calculations for Capitalised Revenue Expenditure: NI (£m) Units Field Type Additional Info 2008-09 2009-10 2010-11 2011-12 2012-13 2013-14
39 Non-Infrastructure: Depreciation of capitalised Assets (capitalised before 31/03/08) £m B -14.4 -36.6 -19.4 -20.7 -16.7 -12.0
40 Non-Infrastructure: Depreciation of capitalised Assets (capitalised after 31/03/08) £m B 0.0 0.0 0.0 0.0 0.0 0.0
41 Total Depreciation £m C -14.4 -36.6 -19.4 -20.7 -16.7 -12.0
Depreciation of Capitalised revenue Expenditure - Non Infrastructure Assets (£m) Units Field Type Additional Info 2008-09 2009-10 2010-11 2011-12 2012-13 2013-14
41 Capital Additions £m B 36.6 19.6 20.6 16.5 11.9 10.7
42 Asset Life £m C 0 0 0 0 0 0
43 Annual depreciation £m C #DIV/0! #DIV/0! #DIV/0! #DIV/0! #DIV/0! #DIV/0!
44 2008-09 £m C 0.0 0.0 0.0 0.0 0.0
45 2009-10 £m C 0.0 0.0 0.0 0.0
46 2010-11 £m C 0.0 0.0 0.0
47 2011-12 £m C 0.0 0.0
48 2012-13 £m C 0.0
49 2013-14 £m C
50 2014-15 £m C
51 2015-16 £m C
52 2016-17 £m C
53 2017-18 £m C
54 2018-19 £m C
55 2019-20 £m C
56 2020-21 £m C
57 2021-22 £m C
58 Total £m C 0.0 0.0 0.0 0.0 0.0 0.0

Process sheet: Tax
Corporation Tax Assumptions Units Field Type Additional Info 2008-09 2009-10 2010-11 2011-12 2012-13 2013-14
1 Corporate Tax Rate % B 28% 28% 28% 28% 28% 28%
Trading profit/loss calculation (before losses brought forward)* Units Field Type Additional Info 2008-09 2009-10 2010-11 2011-12 2012-13 2013-14
2 Historic Cost Operating Profit £m C 353.8 322.3 307.4 290.4 280.1 264.4
3 plus HC Depreciation £m B 161.2 194.5 201.4 205.1 206.4 213.2
4 plus infrastructure renewals charge £m B 100.2 104.2 118.1 121.1 124.1 127.2
5 plus amortisation of PPP £m B 1.6 1.6 2.0 2.5 2.5 2.5
6 minus amortisation of grants £m B -0.8 -0.8 -0.8 -0.8 -0.8 -0.8
7 minus Capital expenditure allowable as a deduction from profits £m B 0.0 -54.8 -71.5 -76.2 -73.1 -76.5
8 minus Depreciation Allowed as a deduction for tax purposes £m C -118.6 -36.6 -19.4 -20.7 -16.7 -12.0
9 minus net interest payable £m C -155.3 -160.7 -166.6 -171.8 -177.6 -183.4
10 plus revenue expenditure not allowable £m B 2.2 2.2 2.2 2.2 2.2 2.2
11 plus Change in General provision £m B 0.0 0.0 0.0 0.0 0.0 0.0
12 minus Capital Allowances (25%, 6% pools and 100% first year) £m C -272.2 -296.3 -304.6 -311.5 -321.3 -330.1
13 minus Industrial Buildings Allowance £m B -19.1 -14.4 -7.7 0.0 0.0 0.0
14 minus Profit/income not taxed as trading income £m B 0.0 0.0 0.0 0.0 0.0 0.0
15 minus gain on sale of assets £m B -1.0 -1.0 0.0 0.0 0.0 0.0
16 plus exceptional income less exceptional expense £m B 0.0 0.0 0.0 0.0 0.0 0.0
17 plus Grants and Contributions taxable on receipt £m B 0.0 0.0 0.0 0.0 0.0 0.0
18 Trading profit/loss for tax £m C 51.9 60.1 60.4 40.3 25.6 6.8
* The initial trading profit might differ for different revenue approach options. However, for the option 2 there is a further adjustment in line 25 which will match both calculations. This has been done to avoid the use of circular references.
Losses Units Field Type Additional Info 2008-09 2009-10 2010-11 2011-12 2012-13 2013-14
19 Losses brought forward £m B 121.3 69.4 9.3 0.0 0.0 0.0
20 Losses used in the period £m C -51.9 -60.1 -9.3 0.0 0.0 0.0
21 Additions £m C 0.0 0.0 0.0 0.0 0.0 0.0
22 Losses carried forward £m C 69.4 9.3 0.0 0.0 0.0 0.0
Corporation tax calculation (if trading profit) Units Field Type Additional Info 2008-09 2009-10 2010-11 2011-12 2012-13 2013-14
23 Adjusted trading profit £m C 0.0 0.0 51.1 40.3 25.6 6.8
24 Corporation Tax paid £m C 0.0 0.0 14.3 11.3 7.2 1.9
Adjustments due to circularity Units Field Type Additional Info 2008-09 2009-10 2010-11 2011-12 2012-13 2013-14
25 Adjustments in Tax due to circularity £m B 0.0 0.0 0.0 0.0
26 Corporation tax paid £m C 0.0 0.0 14.3 11.3 7.2 1.9
Change in Accelerated Capital Allowances Units Field Type Additional Info 2008-09 2009-10 2010-11 2011-12 2012-13 2013-14
27 Total capital allowances utilised £m C 291.3 310.7 312.4 311.5 321.3 330.1
28 plus Expenditure allowed as a trading profit deduction £m B 0.0 54.8 71.5 76.2 73.1 76.5
29 minus IRC £m B -100.2 -104.2 -118.1 -121.1 -124.1 -127.2
30 minus Historic Cost depreciation £m B -161.2 -194.5 -201.4 -205.1 -206.4 -213.2
31 minus amortisation of PPP £m B -1.6 -1.6 -2.0 -2.5 -2.5 -2.5
32 plus amortisation of grants £m B 0.8 0.8 0.8 0.8 0.8 0.8
33 minus revenue expenditure not allowed for tax (excluding permanently disallowed expenditure) £m C -2.2 -2.2 -2.2 -2.2 -2.2 -2.2
34 minus Grants and contributions taxable on receipt £m B 0.0 0.0 0.0 0.0 0.0 0.0
35 plus depreciation allowed as a deduction £m B 118.6 36.6 19.4 20.7 16.7 12.0
36 Change in accelerated capital allowances £m C 145.6 100.5 80.4 78.3 76.8 74.2
Change in deferred tax items Units Field Type Additional Info 2008-09 2009-10 2010-11 2011-12 2012-13 2013-14
37 Change in accelerated capital allowances £m B 145.6 100.5 80.4 78.3 76.8 74.2
38 minus change in general provision £m B 0.0 0.0 0.0 0.0 0.0 0.0
39 minus movement in losses carried forward £m C 51.9 60.1 9.3 0.0 0.0 0.0
40 Deferred tax items £m C 197.5 160.6 89.7 78.3 76.8 74.2

Process sheet: Tax
Deferred tax change Units Field Type Additional Info 2008-09 2009-10 2010-11 2011-12 2012-13 2013-14
41 Deferred tax items multiplied by corporate tax rate £m C 55.3 45.0 25.1 21.9 21.5 20.8
Deferred Tax + Corporation Tax Units Field Type Additional Info 2008-09 2009-10 2010-11 2011-12 2012-13 2013-14
42 Deferred Tax + Corporation Tax £m C 55.3 45.0 39.4 33.2 28.7 22.7
Tax Reconciliation Units Field Type Additional Info 2008-09 2009-10 2010-11 2011-12 2012-13 2013-14
43 Profit before tax £m B 197.5 160.6 140.8 118.6 102.4 81.0
44 Expected tax charge @ 30% £m C 55.3 45.0 39.4 33.2 28.7 22.7
45 Tax charge/(credit) per accounts
46 Corporation Tax £m B 0.0 0.0 -14.3 -11.3 -7.2 -1.9
47 Deferred Tax £m B -55.3 -45.0 -25.1 -21.9 -21.5 -20.8
48 Total Tax £m C -55.3 -45.0 -39.4 -33.2 -28.7 -22.7
49 Overcharge/(undercharge) £m C 0.0 0.0 0.0 0.0 0.0 0.0
50 This over/(under) charge is explained as:
51 Permanent differences @ 30% £m B 0.0 0.0 0.0 0.0 0.0 0.0
52 Unexplained items £m B 0.0 0.0 0.0 0.0 0.0 0.0
53 Total Difference £m C 0.0 0.0 0.0 0.0 0.0 0.0
54 Check Line (Unexplained items = 0) OK OK OK OK OK OK
Alternative calculation of Historic Operating Profit excluding cash allowance for tax (when Revenue building blocks approach is used)
Historic Cost Operating Profit without tax allowance Units Field Type Additional Info 2008-09 2009-10 2010-11 2011-12 2012-13 2013-14
55 WICS Revenue without tax allowance from the required revenue £m C 0.0 0.0 0.0 0.0
56 minus Operating Costs £m B -302.9 -310.5 -318.2 -326.2
57 minus PPP charge £m B -140.6 -146.4 -150.0 -153.8
58 minus IRC £m B -118.1 -121.1 -124.1 -127.2
59 minus Historic Cost Depreciation £m B -201.4 -205.1 -206.4 -213.2
60 minus Historic Amortisation of PPP £m B -2.0 -2.5 -2.5 -2.5
61 plus Amortisation of grants £m B 0.8 0.8 0.8 0.8
62 Other operating income £m C 0.0 0.0 0.0 0.0
63 Historic Cost Operating Profit without tax allowance on Required Revenue £m C -764.3 -784.7 -800.4 -822.1
Adjustments due to Circularity between Revenue Requirement and Tax Units Field Type Additional Info 2008-09 2009-10 2010-11 2011-12 2012-13 2013-14
64 Tax before iterations £m C 0.0 0.0 0.0 0.0
65 Additional Tax and interest adjustment to infinity (due to circularities) £m C 0.0 0.0 0.0 0.0
66 Difference £m C 0.0 0.0 0.0 0.0
67 Proportion of tax % C 92% 92% 92% 92%
68 Proportion of interest % C 8% 8% 8% 8%
69 Corporate tax adjustment £m C 0.0 0.0 0.0 0.0
70 Interest Adjustment £m C 0.0 0.0 0.0 0.0

Process sheet: Cost of capital
Allowed return Units Field Type Additional Info 2010-11 2011-12 2012-13 2013-14
1 Cost of debt % B 3.5% 3.5% 3.5% 3.5%
2 Cost of equity % B 3.0% 3.0% 3.0% 3.0%
3 Gearing % B 54.4% 54.4% 54.4% 54.4%
4 WACC (Pre tax CoD, Post tax CoE) % C 3.2% 3.2% 3.2% 3.2%
5 Average RCV £m C 5,632.3 5,892.9 6,158.1 6,424.9
6 Return on RCV £m C 183.0 191.5 200.1 208.8
7 Adjustments for embedded debt £m B 0.0 0.0 0.0 0.0
8 Total allowed return £m C 183.0 191.5 200.1 208.8
9 Implied adjusted Cost of Capital % C 3.2% 3.2% 3.2% 3.2%

Process sheet: Current Cost reserve adjustments
Changes in current cost reserve Units Field Type Additional Info 2008-09 2009-10 2010-11 2011-12 2012-13 2013-14
1 Opening Current Cost Reserve £m B 35957.2 37121.5 38137.3 39188.7 40271.1 41384.6
2 Fixed Assets Adjustments £m B 1179.6 1031.9 1066.3 1095.7 1126.4 1157.4
3 Working Capital Adjustments £m B -5.6 -5.5 -5.3 -4.7 -4.8 -4.8
4 Financing Adjustments £m B -9.0 -10.0 -9.0 -8.1 -7.7 -7.7
5 Grants and Third Party Contributions Adjustments £m B -0.6 -0.5 -0.5 -0.5 -0.5 -0.5
6 Current Cost Reserve £m C 37121.5 38137.3 39188.7 40271.1 41384.6 42529.0
Fixed asset adjustments Units Field Type Additional Info 2008-09 2009-10 2010-11 2011-12 2012-13 2013-14
7 Inflation adjustment on gross assets £m B 1286.5 1130.3 1173.6 1212.7 1253.5 1295.2
8 Inflation adjustment on accumulated depreciation £m B -106.9 -98.4 -107.3 -117.0 -127.0 -137.8
9 Total fixed assets inflation adjustments £m C 1179.6 1031.9 1066.3 1095.7 1126.4 1157.4
Working capital Units Field Type Additional Info 2008-09 2009-10 2010-11 2011-12 2012-13 2013-14
10 Stocks £m C 3.4 3.5 3.4 3.3 3.3 3.3
11 Trade debtors £m C 28.5 29.5 30.3 30.3 30.1 30.0
12 Prepayments and other short term debtors £m C 12.1 7.7 8.7 9.4 10.1 10.8
13 Trade creditors £m C -18.8 -18.2 -17.6 -17.8 -18.0 -18.1
14 Licenced wholesale charge prepayment £m C -26.0 -28.0 -29.2 -29.5 -29.7 -30.0
15 Short-term capital creditors £m C -89.1 -81.2 -57.8 -57.1 -56.3 -55.4
16 Accruals and other creditors £m C -130.5 -127.2 -126.5 -129.5 -131.9 -134.4
17 Total working capital £m C -220.5 -213.9 -188.7 -190.9 -192.4 -193.9
Working capital inflation adjustment Units Field Type Additional Info 2008-09 2009-10 2010-11 2011-12 2012-13 2013-14
18 Opening working capital £m B -190.1 -220.5 -213.9 -188.7 -190.9 -192.4
19 Working capital inflation adjustment £m C -5.6 -5.5 -5.3 -4.7 -4.8 -4.8
Financing adjustment Units Field Type Additional Info 2008-09 2009-10 2010-11 2011-12 2012-13 2013-14
20 Net Assets Employed £m B 40742.4 42010.7 43252.9 44504.6 45760.6 47024.0
21 Net Operating Assets £m B 41044.7 42412.5 43614.1 44828.1 46067.2 47333.7
22 Difference £m C -302.3 -401.7 -361.3 -323.5 -306.6 -309.7
23 Financing adjustment £m C -9.0 -10.0 -9.0 -8.1 -7.7 -7.7
Grants and Third Party Contributions Units Field Type Additional Info 2008-09 2009-10 2010-11 2011-12 2012-13 2013-14
24 Grants and Third Party Contributions £m B -0.6 -0.5 -0.5 -0.5 -0.5 -0.5

Process sheet: Revenue calculation formula
Wholesale business revenue Units Field Type Additional Info 2010-11 2011-12 2012-13 2013-14
1 Allowed for return £m B 183.0 191.5 200.1 208.8
2 Infrastructure Renewals Charge £m B 118.1 121.1 124.1 127.2
3 MEAV Depreciation (net of Amortisation of grants) £m B 277.8 285.5 301.9 316.0
4 Operating Costs £m B 302.9 310.5 318.2 326.2
5 PPP costs £m B 140.6 146.4 150.0 153.8
6 Working Capital Adjustment £m B -5.3 -4.7 -4.8 -4.8
7 Dividends foregone £m C 0.0 0.0 0.0 0.0
8 Taxation payable in the year £m B 14.3 11.3 7.2 1.9
9 Total Revenue Requirement £m C 1031.5 1061.5 1096.8 1129.1
10 Revenue Requirement excluding tax £m C 1017.2 1050.2 1089.6 1127.2

Output Sheet: Profit and Loss Account
Historic Cost Profit and Loss account
Historic Cost Profit and Loss Units Field Type Additional Info 2006-07 2007-08 2008-09 2009-10 2010-11 2011-12 2012-13 2013-14
1 Turnover £m B Outturn prices 972.8 986.7 1026.4 1064.5 1071.7 1075.1 1080.5 1086.5
2 Operating expenditure (excluding PPP) £m C Outturn prices -256.4 -259.0 -279.3 -307.4 -302.9 -310.5 -318.2 -326.2
3 PPP operating costs £m C Outturn prices -125.7 -127.6 -132.1 -136.2 -140.6 -146.4 -150.0 -153.8
4 Historical Cost Depreciation £m B Outturn prices -137.1 -160.8 -161.2 -194.5 -201.4 -205.1 -206.4 -213.2
5 Infrastructure Renewals charge £m B Outturn prices -88.0 -90.0 -100.2 -104.2 -118.1 -121.1 -124.1 -127.2
6 Amortisation of PPP assets £m B Outturn prices -1.6 -1.6 -1.6 -1.6 -2.0 -2.5 -2.5 -2.5
7 Amortisation of deferred income £m B Outturn prices 1.1 0.9 0.8 0.8 0.8 0.8 0.8 0.8
8 Historic cost profit or loss on disposal of fixed assets £m C Outturn prices 1.4 9.3 1.0 1.0 0.0 0.0 0.0 0.0
9 Other Operating income £m C Outturn prices 0.0 0.0 0.0 0.0 0.0 0.0 0.0 0.0
10 Operating profit £m C Outturn prices 366.5 357.9 353.8 322.3 307.4 290.4 280.1 264.4
11 Other income £m C Outturn prices 0.0 0.0 0.0 0.0 0.0 0.0 0.0 0.0
12 Net interest receivable less payable £m C Outturn prices -142.6 -140.3 -155.3 -160.7 -166.6 -171.8 -177.6 -183.4
13 Profit on ordinary activities before taxation £m C Outturn prices 223.9 217.6 198.5 161.6 140.8 118.6 102.4 81.0
14 Taxation - current £m B Outturn prices 0.0 -0.6 0.0 0.0 -14.3 -11.3 -7.2 -1.9
15 Taxation - deferred £m B Outturn prices -68.2 -36.7 -55.3 -45.0 -25.1 -21.9 -21.5 -20.8
16 Profit on ordinary activities after taxation £m C Outturn prices 155.6 180.4 143.2 116.6 101.4 85.4 73.7 58.3
17 Extraordinary items £m C Outturn prices 0.0 0.0 0.0 0.0 0.0 0.0 0.0 0.0
18 Profit for the year £m C Outturn prices 155.6 180.4 143.2 116.6 101.4 85.4 73.7 58.3
19 Customer earnings/ dividends £m C Outturn prices 0.0 0.0 0.0 0.0 0.0 0.0 0.0 0.0
20 Retained profit for year £m C Outturn prices 155.6 180.4 143.2 116.6 101.4 85.4 73.7 58.3
Current Cost Profit and Loss account
Scottish Water Units Field Type Additional Info 2006-07 2007-08 2008-09 2009-10 2010-11 2011-12 2012-13 2013-14
21 Turnover £m B Outturn prices 972.8 986.7 1026.4 1064.5 1071.7 1075.1 1080.5 1086.5
22 Current cost operating expenditure (excluding PPP) £m B Outturn prices -256.4 -259.0 -279.3 -307.4 -302.9 -310.5 -318.2 -326.2
23 PPP operating costs £m B Outturn prices -125.7 -127.6 -132.1 -136.2 -140.6 -146.4 -150.0 -153.8
24 Current Cost Depreciation £m B Outturn prices -163.6 -192.2 -230.2 -259.1 -277.8 -285.5 -301.9 -316.0
25 Infrastructure Renewals Charge £m B Outturn prices -88.0 -90.0 -100.2 -104.2 -118.1 -121.1 -124.1 -127.2
26 Amortisation of PPP £m B Outturn prices -1.6 -1.6 -1.6 -1.6 -2.0 -2.5 -2.5 -2.5
27 Amortisation of deferred income £m B Outturn prices 1.1 0.9 0.8 0.8 0.9 0.9 0.9 0.9
28 Current cost profit or loss on disposal of fixed assets £m C Outturn prices 1.4 9.3 1.0 1.0 0.0 0.0 0.0 -0.1
29 Other operating income £m B Outturn prices 0.0 0.0 0.0 0.0 0.0 0.0 0.0 0.0
30 Current cost operating profit before working capital adjustment £m C Outturn prices 340.0 326.6 284.8 257.7 231.0 210.1 184.6 161.7
31 Working capital adjustment £m B Outturn prices 7.3 6.8 5.6 5.5 5.3 4.7 4.8 4.8
32 Current cost operating profit £m C Outturn prices 347.2 333.4 290.5 263.2 236.3 214.8 189.4 166.5
33 Other income £m B Outturn prices 0.0 0.0 0.0 0.0 0.0 0.0 0.0 0.0
34 Net interest receivable less payable £m B Outturn prices -142.6 -140.3 -155.3 -160.7 -166.6 -171.8 -177.6 -183.4
35 Financing adjustment £m B Outturn prices 10.4 3.6 9.0 10.0 9.0 8.1 7.7 7.7
36 Current cost profit before taxation £m C Outturn prices 215.0 196.7 144.1 112.5 78.8 51.0 19.4 -9.2
37 Taxation - Current taxation £m B Outturn prices 0.0 -0.6 0.0 0.0 -14.3 -11.3 -7.2 -1.9
38 Taxation - Deferred £m B Outturn prices -68.2 -36.7 -55.3 -45.0 -25.1 -21.9 -21.5 -20.8
39 Current cost profit on ordinary activities £m C Outturn prices 146.8 159.4 88.8 67.6 39.3 17.8 -9.2 -31.9
40 Extraordinary items £m B Outturn prices 0.0 0.0 0.0 0.0 0.0 0.0 0.0 0.0
41 Current cost profit for the year £m C Outturn prices 146.8 159.4 88.8 67.6 39.3 17.8 -9.2 -31.9
42 Customer retained earnings / dividends £m B Outturn prices 0.0 0.0 0.0 0.0 0.0 0.0 0.0 0.0
43 Current cost profit retained £m C Outturn prices 146.8 159.4 88.8 67.6 39.3 17.8 -9.2 -31.9

Output Sheet: Balance Sheet
Historic Cost Accounts
Historic Cost Balance Sheet Units Field Type Additional Info 2006-07 2007-08 2008-09 2009-10 2010-11 2011-12 2012-13 2013-14
Fixed Assets1 Tangible Assets £m B Outturn prices 3,462.0 3,811.2 4,237.0 4,644.0 4,830.6 5,045.6 5,254.8 5,471.4
2 Investment - loan to group company £m B Outturn prices 64.5 58.5 0.0 -26.1 0.0 0.0 0.0 0.0
3 Investment - Other £m B Outturn prices 0.0 34.7 34.6 34.6 34.6 34.6 34.6 34.6
4 Total fixed assets £m C Outturn prices 3,526.6 3,904.4 4,271.6 4,652.5 4,865.2 5,080.2 5,289.4 5,506.0
Current Assets5 Stocks £m B Outturn prices 2.9 3.6 3.4 3.5 3.4 3.3 3.3 3.3
6 Debtors £m C Outturn prices 56.1 79.2 66.9 63.5 66.8 67.5 68.5 69.7
7 Cash (net of overdrafts) £m B Outturn prices 3.3 -0.3 0.0 2.0 2.0 2.0 2.0 2.0
8 Short term deposits £m B Outturn prices 0.0 0.0 0.0 0.0 0.0 0.0 0.0 0.0
9 Gilts buffer £m C Outturn prices 0.0 27.4 43.7 0.0 19.9 77.3 112.9 128.3
10 PPP assets £m C Outturn prices 35.5 33.9 32.3 38.7 44.6 42.2 39.7 37.3
11 Infrastructure Renewals prepayment/accrual £m B Outturn prices -20.7 4.8 9.8 -5.6 -5.9 -20.4 -20.3 -23.9
12 Total current assets £m C Outturn prices 77.1 148.7 156.0 102.1 130.9 172.0 206.1 216.6
Creditors: amounts falling due within one year
13 Creditors £m C Outturn prices -278.3 -282.3 -331.3 -320.5 -296.9 -300.9 -304.3 -307.4
14 Borrowings (excl. Govt. loans) £m B Outturn prices -6.6 -8.0 -2.9 -1.4 -1.6 -1.7 -0.9 -0.5
15 Total creditors £m C Outturn prices -284.8 -290.2 -334.2 -321.9 -298.5 -302.6 -305.2 -308.0
16 Net current assets £m C Outturn prices -207.7 -141.6 -178.2 -219.8 -167.6 -130.6 -99.1 -91.3
17 Total assets less current liabilities £m C Outturn prices 3,318.8 3,762.8 4,093.4 4,432.7 4,697.5 4,949.5 5,190.3 5,414.6
Creditors: amounts falling due after one year18 Borrowings (excl. Govt. loans) £m C Outturn prices -18.1 -10.1 -7.1 -5.7 -4.1 -2.4 -1.5 -1.0
19 Other creditors £m B Outturn prices -21.0 -39.0 -14.0 -14.0 -14.0 -14.0 -14.0 -14.0
20 Total creditors £m C Outturn prices -39.1 -49.1 -21.1 -19.7 -18.1 -16.4 -15.5 -15.0
Provision for liabilities & charges21 Deferred tax provision £m C Outturn prices -205.3 -242.0 -297.3 -342.2 -367.3 -389.3 -410.8 -431.6
22 Deferred income - grants and contributions £m B Outturn prices -18.7 -19.7 -18.9 -18.1 -17.3 -16.5 -15.7 -14.9
23 Post employment assets / (liabilities) £m C Outturn prices 0.0 0.0 0.0 0.0 0.0 0.0 0.0 0.0
24 Other provisions £m C Outturn prices -56.0 -59.4 -51.0 -46.0 -35.3 -30.9 -26.5 -22.1
25 Net Assets employed £m C Outturn prices 2,999.7 3,392.7 3,705.1 4,006.6 4,259.4 4,496.4 4,721.8 4,931.1
Capital and reserves26 Govt. loans £m C Outturn prices 2,412.2 2,615.2 2,784.4 2,969.3 3,120.8 3,272.3 3,424.0 3,575.0
27 Income and Expenditure account £m C Outturn prices 454.1 644.1 787.3 903.9 1,005.3 1,090.7 1,164.4 1,222.7
28 Other reserves £m B Outturn prices 133.4 133.4 133.4 133.4 133.4 133.4 133.4 133.4
29 Capital & reserves £m C Outturn prices 2,999.7 3,392.7 3,705.1 4,006.6 4,259.4 4,496.4 4,721.8 4,931.1
Check OK OK OK OK OK OK OK OK

Output Sheet: Balance Sheet
Current Cost Accounts
Current Cost Balance Sheet Units Field Type Additional Info 2006-07 2007-08 2008-09 2009-10 2010-11 2011-12 2012-13 2013-14
Fixed Assets30 Tangible assets £m B Outturn prices 27,627.7 39,740.2 41,276.6 42,650.8 43,827.2 45,057.4 46,297.6 47,568.8
31 Third party contributions £m B Outturn prices -19.7 -21.4 -21.2 -20.9 -20.5 -20.1 -19.7 -19.3
Other Operating Assets and liabilities32 Working capital £m B Outturn prices -210.0 -190.1 -220.5 -213.9 -188.7 -190.9 -192.4 -193.9
33 Cash (net of overdrafts) £m B Outturn prices 3.3 -0.3 0.0 2.0 2.0 2.0 2.0 2.0
34 Short term deposits £m B Outturn prices 0.0 0.0 0.0 0.0 0.0 0.0 0.0 0.0
35 Infrastructure renewals prepayment/(accrual) £m B Outturn prices -20.7 4.8 9.8 -5.6 -5.9 -20.4 -20.3 -23.9
36 Net operating assets £m C Outturn prices 27,380.5 39,533.3 41,044.7 42,412.5 43,614.1 44,828.1 46,067.2 47,333.7
Non-operating assets and liabilities37 Borrowings (excl. govt. loans) £m B Outturn prices -6.6 -8.0 -2.9 -1.4 -1.6 -1.7 -0.9 -0.5
38 Gilts buffer £m B Outturn prices 0.0 27.4 43.7 0.0 19.9 77.3 112.9 128.3
39 PPP assets £m B Outturn prices 35.5 33.9 32.3 38.7 44.6 42.2 39.7 37.3
40 Non-trade debtors £m B Outturn prices 20.9 32.5 26.3 26.3 27.8 27.8 28.3 28.9
41 Non-trade creditors due within one year £m B Outturn prices -30.1 -41.8 -66.8 -65.8 -65.9 -67.0 -68.4 -69.5
42 Investment - loan to group company £m B Outturn prices 64.5 58.5 0.0 -26.1 0.0 0.0 0.0 0.0
43 Investment - Other £m B Outturn prices 0.0 34.7 34.6 34.6 34.6 34.6 34.6 34.6
44 Total non-operating assets and liabilities £m C Outturn prices 84.3 137.2 67.1 6.2 59.6 113.2 146.2 159.0
Creditors - amounts falling due after more than one year45 Borrowings (excl. govt. loans) £m B Outturn prices -18.1 -10.1 -7.1 -5.7 -4.1 -2.4 -1.5 -1.0
46 Other Creditors £m B Outturn prices -21.0 -39.0 -14.0 -14.0 -14.0 -14.0 -14.0 -14.0
47 Total Creditors falling due after more than one year £m C Outturn prices -39.1 -49.1 -21.1 -19.7 -18.1 -16.4 -15.5 -15.0
Provisions for liabilities & charges48 Deferred tax provision £m B Outturn prices -205.3 -242.0 -297.3 -342.2 -367.3 -389.3 -410.8 -431.6
49 Post employment asset / (liabilities) £m B Outturn prices 0.0 0.0 0.0 0.0 0.0 0.0 0.0 0.0
50 Other provisions £m B Outturn prices -56.0 -59.4 -51.0 -46.0 -35.3 -30.9 -26.5 -22.1
51 Total provisions £m C Outturn prices -261.3 -301.4 -348.3 -388.3 -402.7 -420.2 -437.3 -453.7
52 Net assets employed £m C Outturn prices 27,164.4 39,320.0 40,742.4 42,010.7 43,252.9 44,504.6 45,760.6 47,024.0
Capital and reserves53 Government Loans £m B Outturn prices 2,412.2 2,615.2 2,784.4 2,969.3 3,120.8 3,272.3 3,424.0 3,575.0
54 Income and expenditure account £m C Outturn prices 445.3 614.3 703.1 770.6 810.0 827.8 818.5 786.7
55 Current cost reserve £m B Outturn prices 24,173.6 35,957.2 37,121.5 38,137.3 39,188.7 40,271.1 41,384.6 42,529.0
56 Other reserves £m B Outturn prices 133.4 133.4 133.4 133.4 133.4 133.4 133.4 133.4
57 Total capital & reserves £m C Outturn prices 27,164.4 39,320.0 40,742.4 42,010.7 43,252.9 44,504.6 45,760.6 47,024.0
Check OK OK OK OK OK OK OK OK

Output Sheet: Cash Flow
Reconciliation of Current cost operating profit to net cash flow from operating activities
Deriving Net cash flow from operating activities Units Field Type Criteria 2006-07 2007-08 2008-09 2009-10 2010-11 2011-12 2012-13 2013-14
1 Current cost operating profit £m B Outturn prices 347.2 333.4 290.5 263.2 236.3 214.8 189.4 166.5
2 Working capital adjustment £m B Outturn prices -7.3 -6.8 -5.6 -5.5 -5.3 -4.7 -4.8 -4.8
3 Movement in working capital £m C Outturn prices -11.9 -19.9 30.4 -6.6 -25.2 2.2 1.5 1.5
6 Receipts from other income £m B Outturn prices 0.0 0.0 0.0 0.0 0.0 0.0 0.0 0.0
7 Current Cost depreciation £m B Outturn prices 163.6 192.2 230.2 259.1 277.8 285.5 301.9 316.0
8 Amortisation of PPP assets £m B Outturn prices 1.6 1.6 1.6 1.6 2.0 2.5 2.5 2.5
9 Amortisation of deferred income £m B Outturn prices -1.1 -0.9 -0.8 -0.8 -0.9 -0.9 -0.9 -0.9
4 Current cost profit/(loss) on sale of assets £m B Outturn prices -1.4 -9.3 -1.0 -1.0 0.0 0.0 0.0 0.1
10 Infrastructure renewals charge £m B Outturn prices 88.0 90.0 100.2 104.2 118.1 121.1 124.1 127.2
11 Other non-cash profit and loss items £m C Outturn prices -5.4 3.5 -8.4 -5.0 -10.7 -4.4 -4.4 -4.4
12 Net cash flow from operating activities £m C Outturn prices 573.3 583.7 637.0 609.2 592.2 616.0 609.4 603.6
Cash flow
Net cash flow from operating activities Units Field Type Criteria 2006-07 2007-08 2008-09 2009-10 2010-11 2011-12 2012-13 2013-14
13 Net cash flow from operating activities £m B Outturn prices 573.3 583.7 637.0 609.2 592.2 616.0 609.4 603.6
Cash changes in non-operating debtors/creditors and extraordinary items Units Field Type Criteria 2006-07 2007-08 2008-09 2009-10 2010-11 2011-12 2012-13 2013-14
14 Cash inflow/outflow from changes in non-trade debtors/creditors £m C Outturn prices 46.5 17.0 6.3 -1.0 -1.5 1.1 0.9 0.5
15 Cash inflow/outflow from extraodinary items £m B Outturn prices 0.0 0.0 0.0 0.0 0.0 0.0 0.0 0.0
Returns on investments & servicing of finance16 Interest received £m B Outturn prices 3.3 4.2 0.0 0.0 0.0 0.0 0.0 0.0
17 Interest paid £m B Outturn prices -146.5 -144.5 -155.3 -160.7 -166.6 -171.9 -177.7 -183.4
18 Net cash flow from returns on Investment & servicing of finance £m C Outturn prices -143.2 -140.3 -155.3 -160.7 -166.6 -171.8 -177.6 -183.4
Taxation19 Taxation paid £m B Outturn prices 0.0 -0.6 0.0 0.0 -14.3 -11.3 -7.2 -1.9
Capital expenditure and financial investment20 Gross cost of purchase of fixed assets (enhancement) £m C Outturn prices -413.3 -519.3 -587.4 -609.4 -397.0 -421.0 -416.7 -430.8
21 Receipt of grants and contributions £m B Outturn prices 1.6 2.9 0.0 0.0 0.0 0.0 0.0 0.0
22 Infrastructure renewals expenditure £m B Outturn prices 0.0 -106.8 -105.2 -88.9 -117.8 -106.6 -124.2 -123.6
24 Disposal of fixed assets £m B Outturn prices 2.1 9.9 1.4 1.0 1.0 1.0 1.0 1.0
25 Movements on long term loans to group companies £m C Outturn prices -64.5 6.0 58.5 26.1 -26.1 0.0 0.0 0.0
26 Net cash outflow from investing activities £m C Outturn prices -474.1 -607.3 -632.6 -671.2 -539.9 -526.7 -539.9 -553.4
27 Acquisitions and disposals £m C Outturn prices 0.0 -25.0 0.1 0.0 0.0 0.0 0.0 0.0
28 Dividends paid £m B Outturn prices 0.0 0.0 0.0 0.0 0.0 0.0 0.0 0.0
Management of liquid resources29 Net cash flow from management of liquid resources £m C Outturn prices 0.0 0.0 0.0 0.0 0.0 0.0 0.0 0.0
30 Net Cash flow before financing £m C Outturn prices 2.5 -172.5 -144.7 -223.7 -130.1 -92.6 -114.4 -134.6
Financing31 New Government loans £m B Outturn prices 142.6 461.1 348.3 248.4 217.9 230.1 222.6 215.4
32 Bank loans repayments £m B Outturn prices -6.2 -6.7 -8.0 -2.9 -1.4 -1.6 -1.7 -0.9
33 Government loans repayments £m B Outturn prices -136.4 -258.1 -179.0 -63.5 -66.5 -78.5 -70.9 -64.4
34 Gilts buffer £m C Outturn prices 0.0 -27.4 -16.3 43.7 -19.9 -57.4 -35.6 -15.4
35 Net cash inflow from financing £m C Outturn prices 0.0 168.9 145.0 225.7 130.1 92.6 114.4 134.6
36 Increase (decrease) in cash and cash equivalents £m C Outturn prices 2.5 -3.6 0.3 2.0 0.0 0.0 0.0 0.0
Check ok OK OK OK OK OK OK
New debt37 New debt (net from repayments) £m C Outturn prices 0.0 196.3 161.3 182.0 150.0 150.0 150.0 150.0

Output Sheet: Financial ratios and debt calculations
Ratios
List of Ratios1 Cash interest cover Around 3.0
2 Adjusted cash interest cover I (maintenance charges) Around 1.6
3 Adjusted cash interest cover II (maintenance expenditure) Around 2.0
4 Funds from operations:debt Greater than 13%
5 Retained cashflow:debt Greater than 7%
6 Gearing Less than 65%
Ratio calculation (Core wholesale + Household retail) Units Field Type Additional Info 2006-07 2007-08 2008-09 2009-10 2010-11 2011-12 2012-13 2013-14
7 Cash interest cover Nr. C 3.9 4.1 4.1 3.8 3.5 3.5 3.4 3.3
8 Adjusted cash interest cover I (maintenance charges) Nr. C 2.2 2.1 2.0 1.5 1.1 1.2 1.0 0.9
9 Adjusted cash interest cover II (maintenance expenditure) Nr. C 2.6 2.6 2.1 2.1 2.0 1.9
10 Funds from operations:debt % C 17.7% 16.8% 17.2% 15.1% 13.2% 13.2% 12.4% 11.7%
11 Retained cashflow:debt % C 17.7% 16.8% 17.2% 15.1% 13.2% 13.2% 12.4% 11.7%
12 Gearing * % C 54.0% 54.2% 54.3% 54.4% 54.5%
* Gearing calculations exclude Gilts buffer
Debt calculations
Debt Units Field Type Additional Info 2006-07 2007-08 2008-09 2009-10 2010-11 2011-12 2012-13 2013-14
13 Total Debt (opening) £m B 2,436.9 2,633.2 2,794.5 2,976.5 3,126.5 3,276.5 3,426.5
14 Total Debt (closing) £m C 2,436.9 2,633.2 2,794.5 2,976.5 3,126.5 3,276.5 3,426.5 3,576.5
15 Increase (decrease) in debt £m C 196.3 161.3 182.0 150.0 150.0 150.0 150.0
16 Cash and equivalents (opening) * £m B 3.3 -0.3 0.0 2.0 2.0 2.0 2.0
17 Cash and equivalents (Closing) * £m C 3.3 -0.3 0.0 2.0 2.0 2.0 2.0 2.0
18 Increase (decrease) in cash and equivalents £m C -3.6 0.3 2.0 0.0 0.0 0.0 0.0
19 Net debt (opening) * £m B 2,433.6 2,633.5 2,794.5 2,974.5 3,124.5 3,274.5 3,424.5
20 Net debt (closing) * £m C 2,433.6 2,633.5 2,794.5 2,974.5 3,124.5 3,274.5 3,424.5 3,574.5
21 Increase (decrease) in Net debt £m C 199.9 161.0 180.0 150.0 150.0 150.0 150.0
* Cash and equivalents calculations exclude Gilts buffer
Retained cashflow:debt
net debt:regulatory capital value
Reference
funds from operations less capital expenditure: gross interest
Definition
funds from operations: gross interest
funds from operations less capital charges: gross interest
Funds from operations:debt

Output Sheet: Investment summary
Outturn prices
Outturn prices Units Field Type Additional Info 2008-09 2009-10 2010-11 2011-12 2012-13 2013-14
Q&S3b
1 Q&S3b - Maintenance Infrastructure £m B Outturn prices 3.5 12.6 114.4 105.5 120.4 123.6
2 Q&S3b - Maintenance Non-Infrastructure £m B Outturn prices 2.4 13.5 103.7 128.9 118.0 125.3
3 Q&S3b - Enhancement Infrastructure £m B Outturn prices 3.8 10.2 81.0 137.7 127.3 150.8
4 Q&S3b - Enhancement Non-Infrastructure £m B Outturn prices 13.0 22.2 72.4 129.3 165.9 154.7
5 Q&S3b - Total £m C Outturn prices 22.7 58.5 371.5 501.4 531.6 554.4
Q&S3a
6 Q&S3a - Maintenance Infrastructure £m B Outturn prices 101.6 76.3 3.4 1.2 3.8 0.0
7 Q&S3a - Maintenance Non-Infrastructure £m B Outturn prices 128.3 90.3 9.6 1.4 0.6 0.0
8 Q&S3a - Enhancement Infrastructure £m B Outturn prices 110.4 129.6 49.4 2.9 0.2 0.0
9 Q&S3a - Enhancement Non-Infrastructure £m B Outturn prices 300.3 291.0 56.7 9.6 4.6 0.0
10 Q&S3a - Total £m C Outturn prices 640.7 587.1 119.2 15.1 9.1 0.0
Q&S2
11 Q&S2 - Enhancement Infrastructure £m B Outturn prices 3.3 26.4 14.5 6.4 0.1 0.0
12 Q&S2 - Enhancement Non-Infrastructure £m C Outturn prices 25.8 26.3 9.6 4.8 0.0 0.0
13 Q&S2 - Total £m C Outturn prices 29.2 52.6 24.1 11.2 0.1 0.0
Other
14 Other - Enhancement Infrastructure £m B Outturn prices 0.0 0.0 0.0 0.0 0.0 0.0
15 Other - Enhancement Non-Infrastructure £m C Outturn prices 0.0 0.0 0.0 0.0 0.0 0.0
16 Other - Total £m C Outturn prices 0.0 0.0 0.0 0.0 0.0 0.0
Grants and contributions
17 G&C - Enhancement Infrastructure £m B Outturn prices 0.0 0.0 0.0 0.0 0.0 0.0
18 G&C - Enhancement Non-Infrastructure £m C Outturn prices 0.0 0.0 0.0 0.0 0.0 0.0
19 G&C - Total £m C Outturn prices 0.0 0.0 0.0 0.0 0.0 0.0
Total
20 Total - Maintenance Infrastructure £m C Outturn prices 105.2 88.9 117.8 106.6 124.2 123.6
21 Total - Maintenance Non-Infrastructure £m C Outturn prices 130.7 103.8 113.3 130.3 118.6 125.3
22 Total - Enhancement Infrastructure £m C Outturn prices 117.5 166.1 144.9 147.0 127.5 150.8
23 Total - Enhancement Non-Infrastructure £m C Outturn prices 339.1 339.5 138.8 143.8 170.5 154.7
24 Total investment £m C Outturn prices 692.5 698.3 514.8 527.7 540.9 554.4

Output Sheet: Investment summaryBase Year (2007-08) prices
Outturn prices Units Field Type Additional Info 2008-09 2009-10 2010-11 2011-12 2012-13 2013-14
Q&S3b
25 Q&S3b - Maintenance Infrastructure £m C Base Year prices 3.5 12.3 108.9 97.9 109.1 109.2
26 Q&S3b - Maintenance Non-Infrastructure £m C Base Year prices 2.4 13.2 98.7 119.7 106.9 110.8
27 Q&S3b - Enhancement Infrastructure £m C Base Year prices 3.8 9.9 77.1 127.8 115.3 133.2
28 Q&S3b - Enhancement Non-Infrastructure £m C Base Year prices 13.0 21.7 68.9 120.1 150.3 136.8
29 Q&S3b - Total £m C Base Year prices 22.7 57.1 353.6 465.6 481.6 490.0
Q&S3a
30 Q&S3a - Maintenance Infrastructure £m C Base Year prices 101.6 74.4 3.3 1.1 3.4 0.0
31 Q&S3a - Maintenance Non-Infrastructure £m C Base Year prices 128.3 88.1 9.2 1.3 0.6 0.0
32 Q&S3a - Enhancement Infrastructure £m C Base Year prices 110.4 126.4 47.0 2.7 0.1 0.0
33 Q&S3a - Enhancement Non-Infrastructure £m C Base Year prices 300.3 283.9 54.0 9.0 4.2 0.0
34 Q&S3a - Total £m C Base Year prices 640.7 572.8 113.5 14.1 8.3 0.0
Q&S2
35 Q&S2 - Enhancement Infrastructure £m C Base Year prices 3.3 25.7 13.8 6.0 0.1 0.0
36 Q&S2 - Enhancement Non-Infrastructure £m C Base Year prices 25.8 25.6 9.1 4.4 0.0 0.0
37 Q&S2 - Total £m C Base Year prices 29.2 51.4 22.9 10.4 0.1 0.0
Other
38 Other - Enhancement Infrastructure £m C Base Year prices 0.0 0.0 0.0 0.0 0.0 0.0
39 Other - Enhancement Non-Infrastructure £m C Base Year prices 0.0 0.0 0.0 0.0 0.0 0.0
40 Other - Total £m C Base Year prices 0.0 0.0 0.0 0.0 0.0 0.0
Grants and contributions
41 G&C - Enhancement Infrastructure £m C Base Year prices 0.0 0.0 0.0 0.0 0.0 0.0
42 G&C - Enhancement Non-Infrastructure £m C Base Year prices 0.0 0.0 0.0 0.0 0.0 0.0
43 G&C - Total £m C Base Year prices 0.0 0.0 0.0 0.0 0.0 0.0
Total
44 Total - Maintenance Infrastructure £m C Base Year prices 105.2 86.7 112.1 99.0 112.5 109.2
45 Total - Maintenance Non-Infrastructure £m C Base Year prices 130.7 101.2 107.9 121.0 107.5 110.8
46 Total - Enhancement Infrastructure £m C Base Year prices 117.5 162.1 137.9 136.5 115.5 133.2
47 Total - Enhancement Non-Infrastructure £m C Base Year prices 339.1 331.2 132.1 133.5 154.5 136.8
48 Total investment £m C Base Year prices 692.5 681.3 490.0 490.0 490.0 490.0
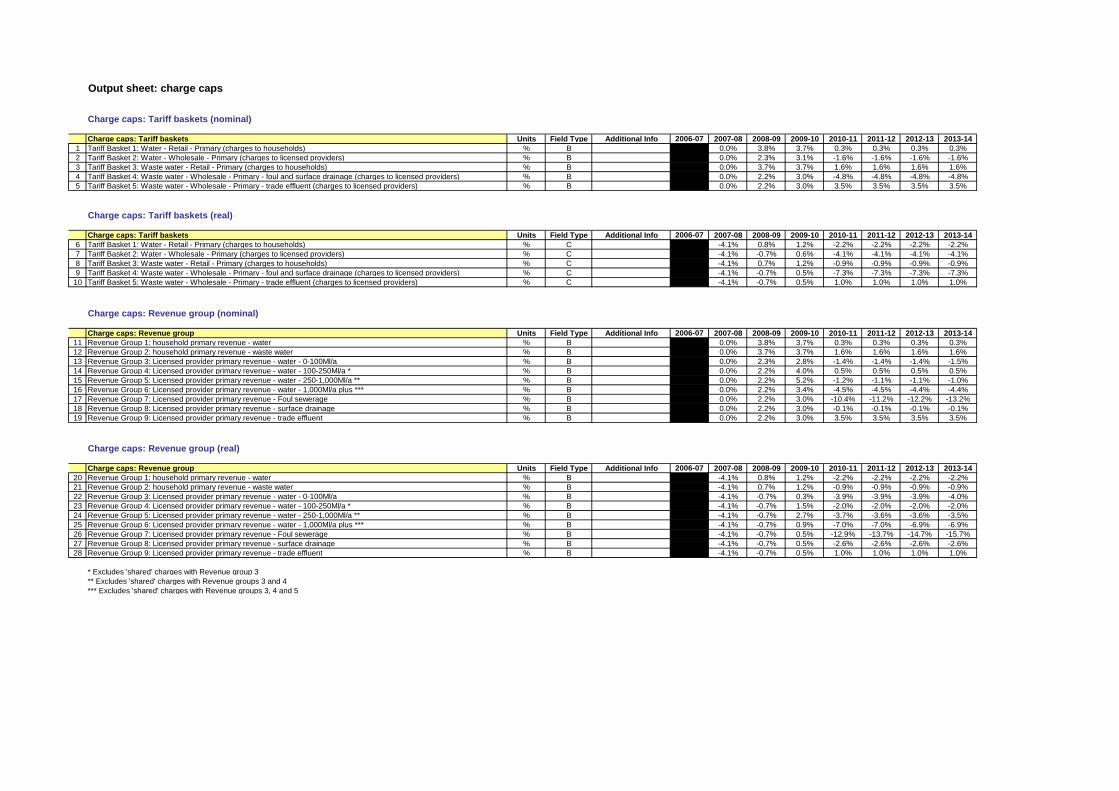
Output sheet: charge caps
Charge caps: Tariff baskets (nominal)
Charge caps: Tariff baskets Units Field Type Additional Info 2006-07 2007-08 2008-09 2009-10 2010-11 2011-12 2012-13 2013-14
1 Tariff Basket 1: Water - Retail - Primary (charges to households) % B 0.0% 3.8% 3.7% 0.3% 0.3% 0.3% 0.3%
2 Tariff Basket 2: Water - Wholesale - Primary (charges to licensed providers) % B 0.0% 2.3% 3.1% -1.6% -1.6% -1.6% -1.6%
3 Tariff Basket 3: Waste water - Retail - Primary (charges to households) % B 0.0% 3.7% 3.7% 1.6% 1.6% 1.6% 1.6%
4 Tariff Basket 4: Waste water - Wholesale - Primary - foul and surface drainage (charges to licensed providers) % B 0.0% 2.2% 3.0% -4.8% -4.8% -4.8% -4.8%
5 Tariff Basket 5: Waste water - Wholesale - Primary - trade effluent (charges to licensed providers) % B 0.0% 2.2% 3.0% 3.5% 3.5% 3.5% 3.5%
Charge caps: Tariff baskets (real)
Charge caps: Tariff baskets Units Field Type Additional Info 2006-07 2007-08 2008-09 2009-10 2010-11 2011-12 2012-13 2013-14
6 Tariff Basket 1: Water - Retail - Primary (charges to households) % C -4.1% 0.8% 1.2% -2.2% -2.2% -2.2% -2.2%
7 Tariff Basket 2: Water - Wholesale - Primary (charges to licensed providers) % C -4.1% -0.7% 0.6% -4.1% -4.1% -4.1% -4.1%
8 Tariff Basket 3: Waste water - Retail - Primary (charges to households) % C -4.1% 0.7% 1.2% -0.9% -0.9% -0.9% -0.9%
9 Tariff Basket 4: Waste water - Wholesale - Primary - foul and surface drainage (charges to licensed providers) % C -4.1% -0.7% 0.5% -7.3% -7.3% -7.3% -7.3%
10 Tariff Basket 5: Waste water - Wholesale - Primary - trade effluent (charges to licensed providers) % C -4.1% -0.7% 0.5% 1.0% 1.0% 1.0% 1.0%
Charge caps: Revenue group (nominal)
Charge caps: Revenue group Units Field Type Additional Info 2006-07 2007-08 2008-09 2009-10 2010-11 2011-12 2012-13 2013-14
11 Revenue Group 1: household primary revenue - water % B 0.0% 3.8% 3.7% 0.3% 0.3% 0.3% 0.3%
12 Revenue Group 2: household primary revenue - waste water % B 0.0% 3.7% 3.7% 1.6% 1.6% 1.6% 1.6%
13 Revenue Group 3: Licensed provider primary revenue - water - 0-100Ml/a % B 0.0% 2.3% 2.8% -1.4% -1.4% -1.4% -1.5%
14 Revenue Group 4: Licensed provider primary revenue - water - 100-250Ml/a * % B 0.0% 2.2% 4.0% 0.5% 0.5% 0.5% 0.5%
15 Revenue Group 5: Licensed provider primary revenue - water - 250-1,000Ml/a ** % B 0.0% 2.2% 5.2% -1.2% -1.1% -1.1% -1.0%
16 Revenue Group 6: Licensed provider primary revenue - water - 1,000Ml/a plus *** % B 0.0% 2.2% 3.4% -4.5% -4.5% -4.4% -4.4%
17 Revenue Group 7: Licensed provider primary revenue - Foul sewerage % B 0.0% 2.2% 3.0% -10.4% -11.2% -12.2% -13.2%
18 Revenue Group 8: Licensed provider primary revenue - surface drainage % B 0.0% 2.2% 3.0% -0.1% -0.1% -0.1% -0.1%
19 Revenue Group 9: Licensed provider primary revenue - trade effluent % B 0.0% 2.2% 3.0% 3.5% 3.5% 3.5% 3.5%
Charge caps: Revenue group (real)
Charge caps: Revenue group Units Field Type Additional Info 2006-07 2007-08 2008-09 2009-10 2010-11 2011-12 2012-13 2013-14
20 Revenue Group 1: household primary revenue - water % B -4.1% 0.8% 1.2% -2.2% -2.2% -2.2% -2.2%
21 Revenue Group 2: household primary revenue - waste water % B -4.1% 0.7% 1.2% -0.9% -0.9% -0.9% -0.9%
22 Revenue Group 3: Licensed provider primary revenue - water - 0-100Ml/a % B -4.1% -0.7% 0.3% -3.9% -3.9% -3.9% -4.0%
23 Revenue Group 4: Licensed provider primary revenue - water - 100-250Ml/a * % B -4.1% -0.7% 1.5% -2.0% -2.0% -2.0% -2.0%
24 Revenue Group 5: Licensed provider primary revenue - water - 250-1,000Ml/a ** % B -4.1% -0.7% 2.7% -3.7% -3.6% -3.6% -3.5%
25 Revenue Group 6: Licensed provider primary revenue - water - 1,000Ml/a plus *** % B -4.1% -0.7% 0.9% -7.0% -7.0% -6.9% -6.9%
26 Revenue Group 7: Licensed provider primary revenue - Foul sewerage % B -4.1% -0.7% 0.5% -12.9% -13.7% -14.7% -15.7%
27 Revenue Group 8: Licensed provider primary revenue - surface drainage % B -4.1% -0.7% 0.5% -2.6% -2.6% -2.6% -2.6%
28 Revenue Group 9: Licensed provider primary revenue - trade effluent % B -4.1% -0.7% 0.5% 1.0% 1.0% 1.0% 1.0%
* Excludes 'shared' charges with Revenue group 3
** Excludes 'shared' charges with Revenue groups 3 and 4
*** Excludes 'shared' charges with Revenue groups 3, 4 and 5

Customer base: Tariffs (Primary revenue)
Tariff increases per tariff basket/revenue group
Percentage change in tariffs per tariff basket (net of Schedule 3 agreements) Units Field Type Additional Info 2007-08 2008-09 2009-10 2010-11 2011-12 2012-13 2013-14
1 Tariff Basket 1: Water - Retail - Primary (charges to households) % I 0.3% 0.3% 0.3% 0.3%
2 Tariff Basket 2: Water - Wholesale - Primary (charges to licensed providers) % I/C -1.6% -1.6% -1.6% -1.6%
3 Tariff Basket 3: Waste water - Retail - Primary (charges to households) % I/C 1.6% 1.6% 1.6% 1.6%
4 Tariff Basket 4: Waste water - Wholesale - Primary - foul and surface drainage (charges to licensed providers) % I/C -4.8% -4.8% -4.8% -4.8%
5 Tariff Basket 5: Waste water - Wholesale - Primary - trade effluent (charges to licensed providers) % I/C 3.5% 3.5% 3.5% 3.5%
Percentage change in tariffs per revenue group (net of Schedule 3 agreements) Units Field Type Additional Info 2007-08 2008-09 2009-10 2010-11 2011-12 2012-13 2013-14
6 Revenue Group 1: household primary revenue - water % C 0.3% 0.3% 0.3% 0.3%
7 Revenue Group 2: household primary revenue - waste water % C 1.6% 1.6% 1.6% 1.6%
8 Revenue Group 3: Licensed provider primary revenue - water - 0-100Ml/a % C -1.4% -1.4% -1.5% -1.5%
9 Revenue Group 4: Licensed provider primary revenue - water - 100-250Ml/a * % C 1.4% 1.4% 1.3% 1.3%
10 Revenue Group 5: Licensed provider primary revenue - water - 250-1,000Ml/a ** % C -5.4% -5.4% -5.5% -5.5%
11 Revenue Group 6: Licensed provider primary revenue - water - 1,000Ml/a plus *** % C -6.6% -6.6% -6.7% -6.7%
12 Revenue Group 7: Licensed provider primary revenue - Foul sewerage % C -10.4% -11.2% -12.2% -13.2%
13 Revenue Group 8: Licensed provider primary revenue - surface drainage % C -0.1% -0.1% -0.1% -0.1%
14 Revenue Group 9: Licensed provider primary revenue - trade effluent % C 3.5% 3.5% 3.5% 3.5%
Go to "K solving" worksheet
Go to "Phasing" worksheet
Credit note and income uncertainty provisions
Credit note and income uncertainty provisions Units Field Type Additional Info 2007-08 2008-09 2009-10 2010-11 2011-12 2012-13 2013-14
15 Credit note provision - household primary (%) % I 99.0% 98.7% 99.0% 99.0% 99.0% 99.0% 99.0%
16 Income uncertainty provision - wholesale primary (%) % I 96.8% 98.1% 98.1% 100.0% 100.0% 100.0% 100.0%
List of tariffs
Revenue Group 1: Retail household primary revenue - water Units Field Type BP Table 2007-08 2008-09 2009-10 2010-11 2011-12 2012-13 2013-14
17 Unmeasured: Band D charge £ I/C T8.3, L49 171.72 178.20 184.77 185.38 185.99 186.60 187.22
18 Measured - Fixed Charge - 20mm £ I/C T8.4, L10 128.54 133.40 138.36 138.82 139.27 139.73 140.20
19 Measured - Fixed Charge - 25mm £ I/C T8.4, L11 381.75 396.00 411.00 412.36 413.72 415.08 416.45
20 Measured - Fixed Charge - 40mm £ I/C T8.4, L12 1,081.00 1,122.00 1,164.00 1,167.84 1,171.70 1,175.56 1,179.44
21 Measured - Fixed Charge - 50mm £ I/C T8.4, L13 2,404.00 2,495.00 2,588.00 2,596.54 2,605.11 2,613.71 2,622.33
22 Measured - Volumetric charge - First 25m3 pa, 20mm meters £ I/C T8.4, L14 2.018400 2.094700 2.172600 2.179770 2.186963 2.194180 2.201421
23 Measured - Volumetric charge - Volumes over 25m3 pa, 20mm meters £ I/C T8.4, L15 0.731400 0.759000 0.787200 0.789798 0.792404 0.795019 0.797643
24 Measured - Volumetric charge - Meters of diameter > 20mm £ I/C T8.4, L16 0.731400 0.759000 0.787200 0.789798 0.792404 0.795019 0.797643
Revenue Group 2: Retail household primary revenue - waste water Units Field Type BP Table 2007-08 2008-09 2009-10 2010-11 2011-12 2012-13 2013-14
25 Unmeasured - Foul & SWD - Band D charge £ I/C T8.5, L49 194.13 201.33 208.80 212.15 215.54 218.99 222.49
26 Measured - Foul - Fixed Charge - 20mm £ I/C T8.6, L10 128.54 133.35 138.34 140.55 142.80 145.09 147.41
27 Measured - Foul - Fixed Charge - 25mm £ I/C T8.6, L11 381.75 396.00 411.00 417.58 424.26 431.05 437.94
28 Measured - Foul - Fixed Charge - 40mm £ I/C T8.6, L12 1,081.00 1,121.00 1,163.00 1,181.61 1,200.51 1,219.72 1,239.24
29 Measured - Foul - Fixed Charge - 50mm £ I/C T8.6, L13 2,404.00 2,494.00 2,587.00 2,628.39 2,670.45 2,713.17 2,756.58
30 Measured - Foul - Volumetric charge - First 23.75m³ pa, 20mm meters £ I/C T8.6, L14 2.541100 2.636100 2.734700 2.778455 2.822910 2.868077 2.913966
31 Measured - Foul - Volumetric charge - Volume over 23.75m³ pa, 20mm meters £ I/C T8.6, L15 1.201700 1.246600 1.293200 1.313891 1.334913 1.356272 1.377972
32 Measured - Foul - Volumetric charge - Meters of diameter > 20mm £ I/C T8.6, L16 1.201700 1.246600 1.293200 1.313891 1.334913 1.356272 1.377972
33 Measured - Property Drainage - Band D charge £ I/C T8.7, L48 38.82 40.23 41.76 42.43 43.11 43.80 44.50
34 Measured - Roads Drainage - Band D charge £ I/C T8.8, L48 38.82 40.23 41.76 42.43 43.11 43.80 44.50

Revenue Groups 3, 4, 5 and 6: Wholesale water meter based annual charges ONLY Units Field Type BP Table 2007-08 2008-09 2009-10 2010-11 2011-12 2012-13 2013-14
35 Meter based annual charges: 20mm £ I/C T8.13, L47 65.53 67.00 69.00 68.03 67.05 66.07 65.09
36 Meter based annual charges: 25mm £ I/C T8.13, L48 126.17 129.00 133.00 131.13 129.25 127.36 125.46
37 Meter based annual charges: 40mm £ I/C T8.13, L49 499.80 511.00 526.00 518.60 511.16 503.69 496.19
38 Meter based annual charges: 50mm £ I/C T8.13, L50 900.82 921.00 949.00 935.66 922.23 908.76 895.22
39 Meter based annual charges: 80mm £ I/C T8.13, L51 1,751.76 1,791.00 1,845.00 1,819.06 1,792.96 1,766.76 1,740.45
40 Meter based annual charges: 100mm £ I/C T8.13, L52 1,900.43 1,943.00 2,001.00 1,972.86 1,944.56 1,916.15 1,887.61
41 Meter based annual charges: 150mm £ I/C T8.13, L53 4,000.39 4,090.00 4,213.00 4,153.76 4,094.17 4,034.34 3,974.25
42 Meter based annual charges: 200mm £ I/C T8.13, L54 30,000.00 30,672.00 31,595.00 31,150.74 30,703.81 30,255.19 29,804.54
43 Meter based annual charges: 250mm £ I/C T8.13, L55 80,000.00 81,792.00 84,254.00 83,069.30 81,877.48 80,681.15 79,479.41
44 Meter based annual charges: 300mm £ I/C T8.13, L56 99,000.39 101,218.00 104,265.00 102,798.92 101,324.04 99,843.57 98,356.40
Revenue group 3, 4, 5 and 6: Wholesale water capacity charges Units Field Type BP Table 2007-08 2008-09 2009-10 2010-11 2011-12 2012-13 2013-14
45 Capacity charges: 20mm (non-former LUVA) premium Capacity volume charge* £ I/C T8.13, L57 0.737823 0.754350 0.764100 0.753356 0.742547 0.731698 0.720799
46 Capacity charges: Capacity Volume Charge* £ I/C T8.13, L58 0.491882 0.502900 0.518000 0.510716 0.503389 0.496034 0.488645
Revenue group 3, 4, 5 and 6: Wholesale water standard charges Units Field Type BP Table 2007-08 2008-09 2009-10 2010-11 2011-12 2012-13 2013-14
47 Standard charges: 20mm meters (non-former LUVA): volume between 20m3 and up to and including 100m3* £ I/C T8.13, L59 1.0035 1.0260 1.0393 1.024686 1.009985 0.995228 0.980404
48 Standard charges: 20mm meters (non-former LUVA): volume greater than 100m3* £ I/C T8.13, L60 0.6690 0.6840 0.7046 0.694693 0.684726 0.674721 0.664671
49 Standard charges: > 20mm meters (non-former LUVA): volume between 20m3 and (up to and including) 250,000m3* £ I/C T8.13, L61 0.6690 0.6840 0.7046 0.694693 0.684726 0.674721 0.664671
50 Standard charges: > 20mm meters (non-former LUVA): volume between 250,000m3 and (up to and including) 1,000,000m3 ** £ I/C T8.13, L62 0.5648 0.5775 0.5949 0.562735 0.532160 0.503110 0.475501
51 Standard charges: > 20mm meters (non-former LUVA): volume greater than 1,000,000m3 **** £ I/C T8.13, L63 0.3466 0.3544 0.3651 0.340988 0.318397 0.297196 0.277315
52 Standard charges: 20mm meters (former LUVA): volume between 20m3 and up to and including 100m3 *** £ I/C T8.13, L64 0.6690 0.6840 0.7046 0.714401 0.724158 0.733835 0.743440
53 Standard charges: 20mm meters (former LUVA): volume greater than 100m3 *** £ I/C T8.13, L65 0.6690 0.6840 0.7046 0.714401 0.724158 0.733835 0.743440
54 Standard charges: > 20mm meters (former LUVA): volume between 20m3 and (up to and including) 100,000m3 *** £ I/C T8.13, L66 0.6690 0.6840 0.7046 0.714401 0.724158 0.733835 0.743440
55 Standard charges: > 20mm meters (former LUVA): volume between 100,000m3 and (up to and including) 250,000m3 *** £ I/C T8.13, L67 0.4683 0.4788 0.5144 0.521555 0.528678 0.535743 0.542755
56 Standard charges: > 20mm meters (former LUVA): volume between 250,000m3 and (up to and including) 1,000,000m3 ** £ I/C T8.13, L68 0.4236 0.4331 0.4581 0.433332 0.409787 0.387418 0.366157
57 Standard charges: > 20mm meters (former LUVA): volume greater than 1,000,000m3 **** £ I/C T8.13, L69 0.4194 0.4288 0.4345 0.405804 0.378920 0.353689 0.330028
* Charges affecting Revenue groups 3, 4, 5 and 6
*** Charges affecting Revenue groups 4, 5 and 6
** Charges affecting Revenue groups 5 and 6
**** Charges affecting Revenue group 6
Revenue group 3: Miscellaneous services to licensed providers Units Field Type BP Table 2007-08 2008-09 2009-10 2010-11 2011-12 2012-13 2013-14
58 Field Troughs and Drinking Bowls: farms £ I/C T8.18, L6 115.22 120.11 123.73 121.99 120.24 118.48 116.72
59 Field Troughs and Drinking Bowls: crofts and Registered Small Holdings £ I/C T8.18, L7 75.10 78.28 80.64 79.50 78.36 77.22 76.07
60 Outside taps: farms £ I/C T8.18, L8 115.22 120.11 123.73 121.99 120.24 118.48 116.72
61 Outside taps: crofts and Registered Small Holdings £ I/C T8.18, L9 75.10 78.28 80.64 79.50 78.36 77.22 76.07
62 Caravans £ I/C T8.18, L10 102.35 106.00 110.50 108.95 107.38 105.81 104.24
Revenue Group 7: Licensed provider primary revenue - Foul sewerage Units Field Type Additional Info 2007-08 2008-09 2009-10 2010-11 2011-12 2012-13 2013-14
63 Meter based annual charges - 20mm £ I/C T8.15, L26 75.31 77.00 79.00 70.75 62.79 55.12 47.84
64 Meter based annual charges - 25mm £ I/C T8.15, L27 149.65 153.00 158.00 141.49 125.58 110.25 95.67
65 Meter based annual charges - 40mm £ I/C T8.15, L28 590.77 604.00 622.00 557.01 494.39 434.02 376.64
66 Meter based annual charges - 50mm £ I/C T8.15, L29 880.28 900.00 927.00 830.15 736.81 646.84 561.33
67 Meter based annual charges - 80mm £ I/C T8.15, L30 2,383.61 2,437.00 2,510.00 2,247.76 1,995.04 1,751.41 1,519.89
68 Meter based annual charges - 100mm £ I/C T8.15, L31 4,234.15 4,329.00 4,459.00 3,993.13 3,544.18 3,111.37 2,700.07
69 Meter based annual charges - 150mm £ I/C T8.15, L32 13,564.16 13,868.00 14,285.00 12,792.52 11,354.24 9,967.70 8,650.04
70 Capacity volume charge £ I/C T8.15, L33 1.00 1.02 1.05 0.94 0.84 0.73 0.64
71 Standard volume charge £ I/C T8.15, L34 1.20 1.23 1.26 1.13 1.00 0.88 0.76
72 Miscellaneous services: Caravans £ I/C T8.19, L2 115.70 119.00 124.00 111.04 98.56 86.52 75.09
Revenue Group 8: Licensed provider primary revenue - surface drainage Units Field Type Additional Info 2007-08 2008-09 2009-10 2010-11 2011-12 2012-13 2013-14
73 Charge per £ of RV - property drainage £ I/C T8.16, L7 0.014510 0.014835 0.021877 0.021864 0.021850 0.021837 0.021823
74 Charge per £ of RV - roads drainage £ I/C T8.16, L8 0.019340 0.019773 0.014046 0.014037 0.014029 0.014020 0.014011
75 Standard area-based tariff £ I/C T8.16, L9 0.301640 0.308397 0.317680 0.317484 0.317288 0.317093 0.316897
Revenue Group 9: Licensed provider primary revenue - trade effluent Units Field Type Additional Info 2007-08 2008-09 2009-10 2010-11 2011-12 2012-13 2013-14
76 Availability charge (fixed): Reception charge (Ra) £ I/C T8.17, L10 0.073703 0.075354 0.077622 0.080339 0.083151 0.086061 0.089073
77 Availability charge (fixed): Volumetric / primary charge (Va) £ I/C T8.17, L11 0.049073 0.050172 0.051682 0.053491 0.055363 0.057301 0.059306
78 Availability charge (fixed): Biological capacity charge (Ba) £ I/C T8.17, L12 0.187255 0.191450 0.197213 0.204115 0.211259 0.218654 0.226306
79 Availability charge (fixed): Sludge capacity charge (Sa) £ I/C T8.17, L13 0.160504 0.164099 0.169038 0.174954 0.181078 0.187415 0.193975
80 Operating charge (variable): Reception charge (Ro) £ I/C T8.17, L14 0.118810 0.121471 0.125127 0.129506 0.134039 0.138731 0.143586
81 Operating charge (variable): Volumetric / primary charge (Vo) £ I/C T8.17, L15 0.079237 0.081012 0.083450 0.086371 0.089394 0.092523 0.095761
82 Operating charge (variable): Secondary treatment charge (Bo) (for Scottish average strength - sCOD) £ I/C T8.17, L16 0.105896 0.108268 0.111527 0.115430 0.119471 0.123652 0.127980
83 Operating charge (variable): Sludge treatment charge (So) (for Scottish average strength - SS) £ I/C T8.17, L17 0.064755 0.066206 0.068199 0.070586 0.073056 0.075613 0.078260

Customer base: Revenue summary by source
Total revenue Units Field Type BP Reference 2007-08 2008-09 2009-10 2010-11 2011-12 2012-13 2013-14
1 Core water revenue £ B T8.1, L1 441.2 459.2 476.1 479.1 481.9 484.5 487.1
2 Core waste water revenue £ B T8.1, L2 545.5 567.2 588.4 592.5 593.2 596.0 599.4
3 Core total revenue £ C T8.1, L3 986.7 1,026.4 1,064.5 1,071.7 1,075.1 1,080.5 1,086.5
Core water revenue Units Field Type BP Reference 2007-08 2008-09 2009-10 2010-11 2011-12 2012-13 2013-14
4 Retail water revenue £ B T8.1, L4 326.1 342.0 357.4 361.0 365.2 368.9 372.8
5 Wholesale water revenue £ B T8.1, L5 115.1 117.2 118.7 118.1 116.7 115.5 114.4
6 Total core water revenue £ C T8.1, L6 441.2 459.2 476.1 479.1 481.9 484.5 487.1
Core wastewater revenue Units Field Type BP Reference 2007-08 2008-09 2009-10 2010-11 2011-12 2012-13 2013-14
7 Retail waste water revenue £ B T8.1, L7 351.0 367.3 384.1 392.9 402.0 411.3 420.8
8 Wholesale waste water revenue £ B T8.1, L8 194.5 199.9 204.2 199.6 191.2 184.7 178.6
9 Total core waste water revenue £ C T8.1, L9 545.5 567.2 588.4 592.5 593.2 596.0 599.4
Retail water revenue Units Field Type BP Reference 2007-08 2008-09 2009-10 2010-11 2011-12 2012-13 2013-14
10 Primary revenue £ C T8.1, L10 324.3 339.7 355.2 358.8 362.5 366.3 370.1
11 Non-primary revenue £ C T8.1, L11 1.8 2.3 2.2 2.2 2.6 2.7 2.7
12 Total Retail water revenue £ C T8.1, L12 326.1 342.0 357.4 361.0 365.2 368.9 372.8
Wholesale water revenue Units Field Type BP Reference 2007-08 2008-09 2009-10 2010-11 2011-12 2012-13 2013-14
13 Primary revenue £ B T8.1, L13 111.2 114.3 116.2 115.4 112.9 111.7 110.5
14 Non-primary revenue £ C T8.1, L14 3.9 2.9 2.6 2.7 3.8 3.8 3.9
15 Total Wholesale water revenue £ C T8.1, L15 115.1 117.2 118.7 118.1 116.7 115.5 114.4
Retail wastewater revenue Units Field Type BP Reference 2007-08 2008-09 2009-10 2010-11 2011-12 2012-13 2013-14
16 Primary revenue £ C T8.1, L16 348.7 364.8 381.5 390.3 399.3 408.6 418.0
17 Non-primary revenue £ C T8.1, L17 2.2 2.5 2.7 2.6 2.7 2.7 2.8
18 Total Retail waste water revenue £ C T8.1, L18 351.0 367.3 384.1 392.9 402.0 411.3 420.8
Wholesale wastewater revenue Units Field Type BP Reference 2007-08 2008-09 2009-10 2010-11 2011-12 2012-13 2013-14
19 Primary revenue £ B T8.1, L19 194.5 199.9 204.2 199.5 191.2 184.7 178.5
20 Non-primary revenue £ C T8.1, L20 0.0 0.0 0.1 0.0 0.1 0.1 0.1
21 Total Wholesale waste water revenue £ C T8.1, L21 194.5 199.9 204.2 199.6 191.2 184.7 178.6
Wholesale primary water revenue Units Field Type BP Reference 2007-08 2008-09 2009-10 2010-11 2011-12 2012-13 2013-14
22 Charges Scheme £ C T8.1, L22 105.8 108.5 110.1 109.3 106.7 105.3 104.0
23 Schedule 3 £ C T8.1, L23 5.4 5.8 6.1 6.2 6.3 6.4 6.5
24 Total Wholesale Primary Water Revenue £ C T8.1, L24 111.2 114.3 116.2 115.4 112.9 111.7 110.5
Wholesale primary wastewater revenue Units Field Type BP Reference 2007-08 2008-09 2009-10 2010-11 2011-12 2012-13 2013-14
25 Charges Scheme £ B T8.1, L25 180.3 184.5 187.2 191.8 183.2 176.6 170.2
26 Schedule 3 £ C T8.1, L26 14.3 15.5 17.0 7.7 7.9 8.1 8.3
27 Total Wholesale Primary Waste Water Revenue £ C T8.1, L27 194.5 199.9 204.2 199.5 191.2 184.7 178.5
Wholesale Primary Waste Water Charges Scheme Revenue Units Field Type BP Reference 2007-08 2008-09 2009-10 2010-11 2011-12 2012-13 2013-14
28 Foul sewerage, and surface water drainage £ C T8.1, L28 171.4 175.8 178.3 171.2 161.9 154.5 147.4
29 Trade effluent £ C T8.1, L29 8.9 8.7 9.0 20.6 21.4 22.1 22.9
30 Total Wholesale Primary Waste Water Charges Scheme Revenue £ C T8.1, L30 180.3 184.5 187.2 191.8 183.2 176.6 170.2

Customer base: Revenue summary by tariff basket and revenue group
Tariff Basket
Tariff basket revenue summary Units Field Type BP Reference 2006-07 2007-08 2008-09 2009-10 2010-11 2011-12 2012-13 2013-14
1 Tariff Basket 1: Water - Retail - Primary (charges to households) £ C T8.2, L1 324.3 339.7 355.2 358.8 362.5 366.3 370.1
2 Tariff Basket 2: Water - Wholesale - Primary (charges to licensed providers) £ C T8.2, L2 105.8 108.5 110.1 109.3 106.7 105.3 104.0
3 Tariff Basket 3: Waste water - Retail - Primary (charges to households) £ C T8.2, L3 348.7 364.8 381.5 390.3 399.3 408.6 418.0
4 Tariff Basket 4: Waste water - Wholesale - Primary - foul and surface drainage (charges to licensed providers) £ C T8.2, L4 171.4 175.8 178.3 171.2 161.9 154.5 147.4
5 Tariff Basket 5: Waste water - Wholesale - Primary - trade effluent (charges to licensed providers) £ C T8.2, L5 8.9 8.7 9.0 20.6 21.4 22.1 22.9
6 Non tariff basket revenue (household, retail) £ C T8.2, L6 4.0 4.8 4.9 4.8 5.3 5.4 5.5
7 Non tariff basket revenue licensed provider, wholesale) £ C T8.2, L7 23.6 24.2 25.7 16.7 18.0 18.4 18.8
8 Total revenue £ C T8.2, L8 986.7 1,026.4 1,064.5 1,071.7 1,075.1 1,080.5 1,086.5
Revenue group
Revenue group revenue summary Units Field Type BP Reference 2006-07 2007-08 2008-09 2009-10 2010-11 2011-12 2012-13 2013-14
9 Revenue Group 1: household primary revenue - water £ C T8.2, L9 324.3 339.7 355.2 358.8 362.5 366.3 370.1
10 Revenue Group 2: household primary revenue - waste water £ C T8.2, L10 348.7 364.8 381.5 390.3 399.3 408.6 418.0
11 Revenue Group 3: Licensed provider primary revenue - water - 0-100Ml/a £ C T8.2, L11 80.9 83.0 83.7 82.9 80.8 79.9 79.0
12 Revenue Group 4: Licensed provider primary revenue - water - 100-250Ml/a £ C T8.2, L12 7.3 7.8 8.0 8.2 8.4 8.3 8.2
13 Revenue Group 5: Licensed provider primary revenue - water - 250-1,000Ml/a £ C T8.2, L13 6.2 6.1 6.4 6.4 6.4 6.5 6.6
14 Revenue Group 6: Licensed provider primary revenue - water - 1,000Ml/a plus £ C T8.2, L14 16.8 17.5 18.1 17.8 17.4 17.0 16.7
15 Revenue Group 7: Licensed provider primary revenue - Foul sewerage £ C T8.2, L15 79.9 81.9 82.0 73.2 63.7 56.1 48.9
16 Revenue Group 8: Licensed provider primary revenue - surface drainage £ C T8.2, L16 91.6 94.1 96.5 98.3 98.5 98.6 98.7
17 Revenue Group 9: Licensed provider primary revenue - trade effluent £ C T8.2, L17 23.0 23.9 25.7 28.1 29.0 30.0 30.9
18 Revenue Group 10: Non-primary revenue - retail £ C T8.2, L18 4.0 4.8 4.9 4.8 5.3 5.4 5.5
19 Revenue Group 11: Non-primary revenue - wholesale £ C T8.2, L19 3.9 2.9 2.6 2.8 3.8 3.9 4.0
20 Total revenue £ C T8.2, L20 986.7 1,026.4 1,064.5 1,071.7 1,075.1 1,080.5 1,086.5

Customer base: Water - retail - primary revenue: retail charges from unmeasured household premises
Tariff basket: 1 Revenue group: 1
Tariff multipliers: Household properties: Billed unmeasured Units Field Type BP Reference 2007-08 2008-09 2009-10 2010-11 2011-12 2012-13 2013-14
1 Number of Band "A*" properties, paying full charge nr I T8.3, L1 387 401 408 416 424 432 440
2 Band "A*" properties, with <=25% (Council tax relief) discount nr I T8.3, L2 298 273 278 283 289 294 300
3 Band "A*" properties, with 25% (single person) discount nr I T8.3, L3 531 540 556 573 591 609 628
4 Band "A*" properties, with 50% (unoccupied) discount nr I T8.3, L4 5 6 6 6 6 6 7
5 Number of Band "A" properties, paying full charge nr I T8.3, L5 154,862 157,238 157,234 157,229 157,224 157,219 157,213
6 Band "A" properties, with <=25% (Council tax relief) discount nr I T8.3, L6 59,530 57,222 57,220 57,219 57,217 57,215 57,213
7 Band "A" properties, with 25% (single person) discount nr I T8.3, L7 299,677 298,592 297,577 296,419 295,252 294,077 292,895
8 Band "A" properties, with 50% (unoccupied) discount nr I T8.3, L8 4,481 2,127 2,127 2,127 2,127 2,127 2,127
9 Number of Band "B" properties, paying full charge nr I T8.3, L9 232,188 236,241 236,744 237,319 237,897 238,480 239,066
10 Band "B" properties, with <=25% (Council tax relief) discount nr I T8.3, L10 62,733 60,688 60,817 60,965 61,113 61,263 61,414
11 Band "B" properties, with 25% (single person) discount nr I T8.3, L11 253,632 254,849 255,186 255,571 255,958 256,348 256,741
12 Band "B" properties, with 50% (unoccupied) discount nr I T8.3, L12 2,236 1,123 1,125 1,128 1,131 1,134 1,136
13 Number of Band "C" properties, paying full charge nr I T8.3, L13 182,491 185,647 186,395 187,248 188,108 188,973 189,845
14 Band "C" properties, with <=25% (Council tax relief) discount nr I T8.3, L14 31,244 30,420 30,543 30,682 30,823 30,965 31,108
15 Band "C" properties, with 25% (single person) discount nr I T8.3, L15 139,351 140,682 141,612 142,673 143,742 144,818 145,902
16 Band "C" properties, with 50% (unoccupied) discount nr I T8.3, L16 1,316 710 713 716 719 723 726
17 Number of Band "D" properties, paying full charge nr I T8.3, L17 177,478 181,023 182,281 183,717 185,164 186,620 188,086
18 Band "D" properties, with <=25% (Council tax relief) discount nr I T8.3, L18 13,343 13,097 13,188 13,292 13,397 13,502 13,608
19 Band "D" properties, with 25% (single person) discount nr I T8.3, L19 89,299 91,111 92,220 93,486 94,761 96,045 97,338
20 Band "D" properties, with 50% (unoccupied) discount nr I T8.3, L20 1,059 580 584 589 593 598 603
21 Number of Band "E" properties, paying full charge nr I T8.3, L21 210,076 213,358 214,908 216,677 218,459 220,253 222,060
22 Band "E" properties, with <=25% (Council tax relief) discount nr I T8.3, L22 7,720 7,520 7,575 7,637 7,700 7,763 7,827
23 Band "E" properties, with 25% (single person) discount nr I T8.3, L23 69,003 69,985 70,868 71,877 72,892 73,914 74,944
24 Band "E" properties, with 50% (unoccupied) discount nr I T8.3, L24 899 523 527 531 536 540 544
25 Number of Band "F" properties, paying full charge nr I T8.3, L25 124,121 127,580 129,417 131,513 133,624 135,750 137,891
26 Band "F" properties, with <=25% (Council tax relief) discount nr I T8.3, L26 2,427 2,366 2,400 2,439 2,478 2,518 2,557
27 Band "F" properties, with 25% (single person) discount nr I T8.3, L27 29,023 29,796 30,327 30,933 31,543 32,157 32,776
28 Band "F" properties, with 50% (unoccupied) discount nr I T8.3, L28 509 279 283 288 292 297 302
29 Number of Band "G" properties, paying full charge nr I T8.3, L29 83,051 84,850 85,858 87,009 88,168 89,335 90,511
30 Band "G" properties, with <=25% (Council tax relief) discount nr I T8.3, L30 869 854 864 876 887 899 911
31 Band "G" properties, with 25% (single person) discount nr I T8.3, L31 14,637 15,011 15,239 15,500 15,763 16,027 16,293
32 Band "G" properties, with 50% (unoccupied) discount nr I T8.3, L32 361 216 219 221 224 227 230
33 Number of Band "H" properties, paying full charge nr I T8.3, L33 8,568 8,708 8,793 8,889 8,987 9,085 9,183
34 Band "H" properties, with <=25% (Council tax relief) discount nr I T8.3, L34 34 33 33 34 34 34 35
35 Band "H" properties, with 25% (single person) discount nr I T8.3, L35 1,057 1,058 1,069 1,081 1,094 1,106 1,119
36 Band "H" properties, with 50% (unoccupied) discount nr I T8.3, L36 60 40 40 41 41 42 42
37 Total number of billed properties nr C T8.3, L37 2,258,556 2,274,747 2,285,235 2,297,205 2,309,258 2,321,396 2,333,619
38 "Band D equivalents" Band "A*" properties with up to 25% (Council tax relief) discount nr I T8.3, L38 132 119 121 124 126 129 131
39 "Band D equivalents" Band "A" properties with up to 25% (Council tax relief) discount nr I T8.3, L39 31,567 30,255 30,254 30,253 30,252 30,251 30,250
40 "Band D equivalents" Band "B" properties with up to 25% (Council tax relief) discount nr I T8.3, L40 39,023 37,591 37,671 37,762 37,854 37,947 38,040
41 "Band D equivalents" Band "C" properties with up to 25% (Council tax relief) discount nr I T8.3, L41 22,295 21,584 21,671 21,770 21,870 21,970 22,072
42 "Band D equivalents" Band "D" properties with up to 25% (Council tax relief) discount nr I T8.3, L42 10,774 10,512 10,585 10,668 10,752 10,836 10,922
43 "Band D equivalents" Band "E" properties with up to 25% (Council tax relief) discount nr I T8.3, L43 7,675 7,440 7,494 7,556 7,618 7,680 7,743
44 "Band D equivalents" Band "F" properties with up to 25% (Council tax relief) discount nr I T8.3, L44 2,864 2,775 2,815 2,860 2,906 2,952 2,999
45 "Band D equivalents" Band "G" properties with up to 25% (Council tax relief) discount nr I T8.3, L45 1,179 1,153 1,166 1,182 1,198 1,214 1,229
46 "Band D equivalents" Band "H" properties with up to 25% (Council tax relief) discount nr I T8.3, L46 56 54 54 55 55 56 56
47 Number of Band "D" equivalent properties nr C T8.3, L47 1,908,122 1,929,781 1,941,691 1,955,282 1,968,969 1,982,752 1,996,631
48 Number of exempt properties nr I T8.3, L48 59,162 60,537 60,537 60,537 60,537 60,537 60,537
Tariffs: Household properties: Billed unmeasured Units Field Type BP Reference 2007-08 2008-09 2009-10 2010-11 2011-12 2012-13 2013-14
49 Band D Charge £ B T8.3, L49 171.7 178.2 184.8 185.4 186.0 186.6 187.2
Revenue: Household properties: Billed unmeasured Units Field Type BP Reference 2007-08 2008-09 2009-10 2010-11 2011-12 2012-13 2013-14
50 Total revenue £ C T8.3, L50 324,222,308 339,554,072 354,990,967 358,655,574 362,358,012 366,098,670 369,877,943
Revenue: Using previous year customer base Units Field Type BP Reference 2007-08 2008-09 2009-10 2010-11 2011-12 2012-13 2013-14
51 Total revenue £ C 336,457,112 352,064,885 356,162,437 359,839,138 363,553,793 367,306,795

Customer Base: Water - retail - primary revenue: retail charges from measured household premises
Tariff basket: 1 Revenue group: 1
Tariff multipliers: Household Properties - billed on measured basis: tariff meters Units Field Type BP Reference 2007-08 2008-09 2009-10 2010-11 2011-12 2012-13 2013-14
1 20mm nr I T8.4, L1 530 604 604 608 612 617 621
2 25mm nr I T8.4, L2 0 0 0 0 0 0 0
3 40mm nr I T8.4, L3 0 0 0 0 0 0 0
4 50mm nr I T8.4, L4 0 0 0 0 0 0 0
5 Total number of billed properties nr C T8.4, L5 530 604 604 608 612 617 621
Tariff multipliers: Volumes - Measured household Properties Units Field Type BP Reference 2007-08 2008-09 2009-10 2010-11 2011-12 2012-13 2013-14
6 First 25m3 pa, meters <= 20mm m3 I T8.4, L6 9,366 22,968 22,968 23,129 23,291 23,454 23,618
7 Volume over 25m3 pa, meters <= 20mm m3 I T8.4, L7 54,744 66,990 66,990 67,459 67,931 68,407 68,886
8 Meters of diameter > 20mm m3 I T8.4, L8 443 0 0 0 0 0 0
9 Total m3 C T8.4, L9 64,553 89,958 89,958 90,588 91,222 91,860 92,503
Tariffs: Fixed Charge Measured household Properties Units Field Type BP Reference 2007-08 2008-09 2009-10 2010-11 2011-12 2012-13 2013-14
10 20mm £ B T8.4, L10 128.5 133.4 138.4 138.8 139.3 139.7 140.2
11 25mm £ B T8.4, L11 381.8 396.0 411.0 412.4 413.7 415.1 416.5
12 40mm £ B T8.4, L12 1081.0 1122.0 1164.0 1167.8 1171.7 1175.6 1179.4
13 50mm £ B T8.4, L13 2404.0 2495.0 2588.0 2596.5 2605.1 2613.7 2622.3
Tariffs: Volumetric Charge Measured household Properties Units Field Type BP Reference 2007-08 2008-09 2009-10 2010-11 2011-12 2012-13 2013-14
14 First 25m3 pa, 20mm meters £/m3 B T8.4, L14 2.018400 2.094700 2.172600 2.179770 2.186963 2.194180 2.201421
15 Volumes over 25m3 pa, 20mm meters £/m3 B T8.4, L15 0.731400 0.759000 0.787200 0.789798 0.792404 0.795019 0.797643
16 Meters of diameter > 20mm £/m3 B T8.4, L16 0.731400 0.759000 0.787200 0.789798 0.792404 0.795019 0.797643
Revenue - Measured household Properties Units Field Type BP Reference 2007-08 2008-09 2009-10 2010-11 2011-12 2012-13 2013-14
17 Fixed charges £ C T8.4, L17 68,126 80,574 83,569 84,432 85,304 86,184 87,074
18 20mm meters, annual volume <= 25m3 £ C T8.4, L18 18,904 48,111 49,900 50,415 50,936 51,462 51,993
19 20mm meters, annual volume > 25m3 £ C T8.4, L19 40,040 50,845 52,735 53,279 53,829 54,385 54,946
20 Meters of diameter > 20mm £ C T8.4, L20 324 0 0 0 0 0 0
21 Total Revenue £ C T8.4, L21 126,057 177,268 184,249 186,151 188,073 190,014 191,976
Revenue - Using previous year customer base Units Field Type BP Reference 2007-08 2008-09 2009-10 2010-11 2011-12 2012-13 2013-14
22 Fixed charges £ C 70,702 83,569 83,845 84,711 85,585 86,469
23 20mm meters, annual volume <= 25m3 £ C 19,619 49,900 50,065 50,582 51,104 51,631
24 20mm meters, annual volume > 25m3 £ C 41,551 52,735 52,909 53,455 54,007 54,564
25 Meters of diameter > 20mm £ C 336 0 0 0 0 0
26 Total Revenue £ C 130,820 183,858 184,857 186,765 188,693 190,641

Customer base: Waste water - retail - primary revenue: retail charges from unmeasured household premises
Tariff basket: 2 Revenue group: 2
Tariff multipliers: Household properties: Billed unmeasured Units Field Type BP Reference 2007-08 2008-09 2009-10 2010-11 2011-12 2012-13 2013-14
1 Number of Band "A*" properties, paying full charge nr I T8.5, L1 382 397 404 412 420 429 437
2 Band "A*" properties, with <=25% (Council tax relief) discount nr I T8.5, L2 296 268 273 278 284 289 295
3 Band "A*" properties, with 25% (single person) discount nr I T8.5, L3 523 533 550 568 587 606 625
4 Band "A*" properties, with 50% (unoccupied) discount nr I T8.5, L4 5 6 6 6 6 6 7
5 Number of Band "A" properties, paying full charge nr I T8.5, L5 151,672 154,153 154,161 154,170 154,179 154,188 154,198
6 Band "A" properties, with <=25% (Council tax relief) discount nr I T8.5, L6 59,152 56,882 56,885 56,888 56,892 56,895 56,898
7 Band "A" properties, with 25% (single person) discount nr I T8.5, L7 297,907 296,552 295,338 293,966 292,584 291,193 289,792
8 Band "A" properties, with 50% (unoccupied) discount nr I T8.5, L8 4,270 1,889 1,889 1,889 1,889 1,889 1,890
9 Number of Band "B" properties, paying full charge nr I T8.5, L9 227,191 231,230 231,745 232,327 232,913 233,504 234,098
10 Band "B" properties, with <=25% (Council tax relief) discount nr I T8.5, L10 62,066 60,037 60,171 60,322 60,474 60,627 60,782
11 Band "B" properties, with 25% (single person) discount nr I T8.5, L11 250,773 251,908 252,245 252,626 253,009 253,395 253,784
12 Band "B" properties, with 50% (unoccupied) discount nr I T8.5, L12 2,155 1,043 1,045 1,048 1,051 1,053 1,056
13 Number of Band "C" properties, paying full charge nr I T8.5, L13 174,238 177,286 178,023 178,855 179,694 180,538 181,388
14 Band "C" properties, with <=25% (Council tax relief) discount nr I T8.5, L14 30,374 29,588 29,711 29,850 29,990 30,131 30,273
15 Band "C" properties, with 25% (single person) discount nr I T8.5, L15 135,706 136,907 137,866 138,950 140,041 141,140 142,247
16 Band "C" properties, with 50% (unoccupied) discount nr I T8.5, L16 1,225 621 624 626 629 632 635
17 Number of Band "D" properties, paying full charge nr I T8.5, L17 166,684 170,003 171,228 172,612 174,006 175,410 176,823
18 Band "D" properties, with <=25% (Council tax relief) discount nr I T8.5, L18 12,601 12,374 12,463 12,564 12,665 12,768 12,870
19 Band "D" properties, with 25% (single person) discount nr I T8.5, L19 85,774 87,456 88,601 89,895 91,197 92,509 93,831
20 Band "D" properties, with 50% (unoccupied) discount nr I T8.5, L20 999 508 512 516 520 524 528
21 Number of Band "E" properties, paying full charge nr I T8.5, L21 195,286 198,315 199,793 201,464 203,147 204,841 206,547
22 Band "E" properties, with <=25% (Council tax relief) discount nr I T8.5, L22 7,113 6,927 6,979 7,037 7,096 7,155 7,215
23 Band "E" properties, with 25% (single person) discount nr I T8.5, L23 65,445 66,349 67,253 68,275 69,304 70,340 71,383
24 Band "E" properties, with 50% (unoccupied) discount nr I T8.5, L24 858 477 481 485 489 493 497
25 Number of Band "F" properties, paying full charge nr I T8.5, L25 113,901 117,026 118,827 120,862 122,911 124,975 127,053
26 Band "F" properties, with <=25% (Council tax relief) discount nr I T8.5, L26 2,211 2,150 2,183 2,220 2,258 2,296 2,334
27 Band "F" properties, with 25% (single person) discount nr I T8.5, L27 27,175 27,908 28,444 29,050 29,660 30,274 30,893
28 Band "F" properties, with 50% (unoccupied) discount nr I T8.5, L28 483 264 268 273 277 282 287
29 Number of Band "G" properties, paying full charge nr I T8.5, L29 73,836 75,271 76,147 77,137 78,134 79,138 80,149
30 Band "G" properties, with <=25% (Council tax relief) discount nr I T8.5, L30 760 742 751 760 770 780 790
31 Band "G" properties, with 25% (single person) discount nr I T8.5, L31 13,307 13,605 13,812 14,047 14,283 14,520 14,760
32 Band "G" properties, with 50% (unoccupied) discount nr I T8.5, L32 320 199 201 204 207 209 212
33 Number of Band "H" properties, paying full charge nr I T8.5, L33 7,204 7,315 7,385 7,463 7,542 7,622 7,702
34 Band "H" properties, with <=25% (Council tax relief) discount nr I T8.5, L34 31 30 30 31 31 31 32
35 Band "H" properties, with 25% (single person) discount nr I T8.5, L35 910 912 922 934 946 958 970
36 Band "H" properties, with 50% (unoccupied) discount nr I T8.5, L36 48 39 39 40 40 41 41
37 Total number of billed properties nr I T8.5, L37 2,172,881 2,187,170 2,197,254 2,208,650 2,220,127 2,231,683 2,243,321
38 "Band D equivalents" Band "A*" properties with up to 25% (Council tax relief) discount nr I T8.5, L38 131 117 119 122 124 126 129
39 "Band D equivalents" Band "A" properties with up to 25% (Council tax relief) discount nr I T8.5, L39 31,366 30,074 30,076 30,077 30,079 30,081 30,083
40 "Band D equivalents" Band "B" properties with up to 25% (Council tax relief) discount nr I T8.5, L40 38,608 37,186 37,269 37,363 37,457 37,552 37,647
41 "Band D equivalents" Band "C" properties with up to 25% (Council tax relief) discount nr I T8.5, L41 21,675 20,992 21,079 21,177 21,277 21,377 21,477
42 "Band D equivalents" Band "D" properties with up to 25% (Council tax relief) discount nr I T8.5, L42 10,178 9,934 10,006 10,087 10,168 10,250 10,333
43 "Band D equivalents" Band "E" properties with up to 25% (Council tax relief) discount nr I T8.5, L43 7,079 6,858 6,909 6,966 7,025 7,083 7,142
44 "Band D equivalents" Band "F" properties with up to 25% (Council tax relief) discount nr I T8.5, L44 2,611 2,523 2,562 2,606 2,650 2,695 2,740
45 "Band D equivalents" Band "G" properties with up to 25% (Council tax relief) discount nr I T8.5, L45 1,031 1,002 1,013 1,027 1,040 1,053 1,067
46 "Band D equivalents" Band "H" properties with up to 25% (Council tax relief) discount nr I T8.5, L46 51 49 49 50 50 51 51
47 Number of Band "D" equivalent properties nr C T8.5, L47 1,815,179 1,834,654 1,846,087 1,859,010 1,872,023 1,885,127 1,898,323
48 Number of exempt properties nr I T8.5, L48 58,951 60,324 60,324 60,324 60,324 60,324 60,324
Tariffs: Household properties: Billed unmeasured Units Field Type BP Reference 2007-08 2008-09 2009-10 2010-11 2011-12 2012-13 2013-14
49 Band D Charge £ B T8.5, L49 194.1 201.3 208.8 212.1 215.5 219.0 222.5
Revenue: Household properties: Billed unmeasured Units Field Type BP Reference 2007-08 2008-09 2009-10 2010-11 2011-12 2012-13 2013-14
50 Total revenue £ C T8.5, L50 348,680,629 364,716,756 381,423,830 390,239,297 399,258,508 408,486,171 417,927,103
Revenue - Using previous year customer base Units Field Type BP Reference 2007-08 2008-09 2009-10 2010-11 2011-12 2012-13 2013-14
51 Total revenue £ C 361,612,688 378,257,018 387,526,611 396,483,126 405,646,644 415,021,949

Customer base: Waste water - retail - primary revenue: retail foul sewerage charges from measured household premises
Tariff basket: 2 Revenue group: 2
Tariff multipliers: Household Properties - billed on measured basis: tariff meters Units Field Type BP Reference 2007-08 2008-09 2009-10 2010-11 2011-12 2012-13 2013-14
1 20mm nr I T8.6, L1 180 181 181 182 184 185 186
2 25mm nr I T8.6, L2 0 0 0 0 0 0 0
3 40mm nr I T8.6, L3 0 0 0 0 0 0 0
4 50mm nr I T8.6, L4 0 0 0 0 0 0 0
5 Total number of billed properties nr C T8.6, L5 180 181 181 182 184 185 186
Tariff multipliers: Volumes - Measured household Properties Units Field Type BP Reference 2007-08 2008-09 2009-10 2010-11 2011-12 2012-13 2013-14
6 First 23.75m³ pa, meters <= 20mm m3 I T8.6, L6 3,154 6,138 6,138 6,181 6,224 6,268 6,312
7 Volume over 23.75m³ pa, meters <= 20mm m3 I T8.6, L7 9,075 8,840 8,840 8,902 8,964 9,027 9,090
8 Meters of diameter > 20mm m3 I T8.6, L8 0 0 0 0 0 0 0
9 Total m3 C T8.6, L9 12,230 14,978 14,978 15,083 15,188 15,295 15,402
Tariffs: Fixed Charge Measured household Properties Units Field Type BP Reference 2007-08 2008-09 2009-10 2010-11 2011-12 2012-13 2013-14
10 20mm £ B T8.6, L10 128.5 133.4 138.3 140.6 142.8 145.1 147.4
11 25mm £ B T8.6, L11 381.8 396.0 411.0 417.6 424.3 431.0 437.9
12 40mm £ B T8.6, L12 1081.0 1121.0 1163.0 1181.6 1200.5 1219.7 1239.2
13 50mm £ B T8.6, L13 2404.0 2494.0 2587.0 2628.4 2670.4 2713.2 2756.6
Tariffs: Fixed Charge Measured household Properties Units Field Type BP Reference 2007-08 2008-09 2009-10 2010-11 2011-12 2012-13 2013-14
14 First 23.75m³ pa, 20mm meters £/m3 B T8.6, L14 2.541100 2.636100 2.734700 2.778455 2.822910 2.868077 2.913966
15 Volume over 23.75m³ pa, 20mm meters £/m3 B T8.6, L15 1.201700 1.246600 1.293200 1.313891 1.334913 1.356272 1.377972
16 Meters of diameter > 20mm £/m3 B T8.6, L16 1.201700 1.246600 1.293200 1.313891 1.334913 1.356272 1.377972
Revenue - Measured household Properties Units Field Type BP Reference 2007-08 2008-09 2009-10 2010-11 2011-12 2012-13 2013-14
17 Fixed charges £ C T8.6, L17 23,137 24,136 25,040 25,618 26,210 26,816 27,436
18 20mm meters, annual volume <= 23.75m³ £ C T8.6, L18 8,016 16,180 16,786 17,174 17,570 17,977 18,392
19 20mm meters, annual volume > 23.75m³ £ C T8.6, L19 10,906 11,020 11,432 11,696 11,966 12,243 12,526
20 Meters of diameter > 20mm £ C T8.6, L20 0 0 0 0 0 0 0
21 Total Revenue £ C T8.6, L21 41,617 50,690 52,698 53,916 55,162 56,437 57,741
Revenue - Using previous year customer base Units Field Type BP Reference 2007-08 2008-09 2009-10 2010-11 2011-12 2012-13 2013-14
22 Fixed charges £ C 24,003 25,040 25,440 26,028 26,630 27,245
23 20mm meters, annual volume <= 23.75m³ £ C 8,315 16,786 17,054 17,448 17,852 18,264
24 20mm meters, annual volume > 23.75m³ £ C 11,313 11,432 11,615 11,883 12,158 12,439
25 Meters of diameter > 20mm £ C 0 0 0 0 0 0
26 Total Revenue £ C 43,173 52,586 53,541 54,778 56,044 57,340

Customer base: Waste water - retail - primary revenue: retail property drainage charges from measured household premises
Tariff basket: 2 Revenue group: 2
Tariff multipliers: Property drainage for household properties billed measured Units Field Type BP Reference 2007-08 2008-09 2009-10 2010-11 2011-12 2012-13 2013-14
1 Number of Band "A*" properties, paying full charge nr I T8.7, L1 0 0 0 0 0 0 0
2 Band "A*" properties, with <=25% (Council tax relief) discount nr I T8.7, L2 0 0 0 0 0 0 0
3 Band "A*" properties, with 25% (single person) discount nr I T8.7, L3 0 0 0 0 0 0 0
4 Band "A*" properties, with 50% (unoccupied) discount nr I T8.7, L4 0 0 0 0 0 0 0
5 Number of Band "A" properties, paying full charge nr I T8.7, L5 4 4 4 4 4 4 4
6 Band "A" properties, with <=25% (Council tax relief) discount nr I T8.7, L6 0 0 0 0 0 0 0
7 Band "A" properties, with 25% (single person) discount nr I T8.7, L7 0 0 0 0 0 0 0
8 Band "A" properties, with 50% (unoccupied) discount nr I T8.7, L8 0 0 0 0 0 0 0
9 Number of Band "B" properties, paying full charge nr I T8.7, L9 2 2 2 2 2 2 2
10 Band "B" properties, with <=25% (Council tax relief) discount nr I T8.7, L10 0 0 0 0 0 0 0
11 Band "B" properties, with 25% (single person) discount nr I T8.7, L11 0 0 0 0 0 0 0
12 Band "B" properties, with 50% (unoccupied) discount nr I T8.7, L12 0 0 0 0 0 0 0
13 Number of Band "C" properties, paying full charge nr I T8.7, L13 5 2 2 2 2 2 2
14 Band "C" properties, with <=25% (Council tax relief) discount nr I T8.7, L14 0 0 0 0 0 0 0
15 Band "C" properties, with 25% (single person) discount nr I T8.7, L15 0 0 0 0 0 0 0
16 Band "C" properties, with 50% (unoccupied) discount nr I T8.7, L16 0 0 0 0 0 0 0
17 Number of Band "D" properties, paying full charge nr I T8.7, L17 5 3 3 3 3 3 3
18 Band "D" properties, with <=25% (Council tax relief) discount nr I T8.7, L18 0 0 0 0 0 0 0
19 Band "D" properties, with 25% (single person) discount nr I T8.7, L19 1 1 1 1 1 1 1
20 Band "D" properties, with 50% (unoccupied) discount nr I T8.7, L20 0 0 0 0 0 0 0
21 Number of Band "E" properties, paying full charge nr I T8.7, L21 14 6 6 6 6 6 6
22 Band "E" properties, with <=25% (Council tax relief) discount nr I T8.7, L22 0 0 0 0 0 0 0
23 Band "E" properties, with 25% (single person) discount nr I T8.7, L23 3 3 3 3 3 3 3
24 Band "E" properties, with 50% (unoccupied) discount nr I T8.7, L24 1 1 1 1 1 1 1
25 Number of Band "F" properties, paying full charge nr I T8.7, L25 28 20 20 20 20 20 20
26 Band "F" properties, with <=25% (Council tax relief) discount nr I T8.7, L26 0 0 0 0 0 0 0
27 Band "F" properties, with 25% (single person) discount nr I T8.7, L27 3 3 3 3 3 3 3
28 Band "F" properties, with 50% (unoccupied) discount nr I T8.7, L28 0 0 0 0 0 0 0
29 Number of Band "G" properties, paying full charge nr I T8.7, L29 66 35 35 35 35 35 35
30 Band "G" properties, with <=25% (Council tax relief) discount nr I T8.7, L30 0 0 0 0 0 0 0
31 Band "G" properties, with 25% (single person) discount nr I T8.7, L31 1 1 1 1 1 1 1
32 Band "G" properties, with 50% (unoccupied) discount nr I T8.7, L32 0 0 0 0 0 0 0
33 Number of Band "H" properties, paying full charge nr I T8.7, L33 30 16 16 16 16 16 16
34 Band "H" properties, with <=25% (Council tax relief) discount nr I T8.7, L34 0 0 0 0 0 0 0
35 Band "H" properties, with 25% (single person) discount nr I T8.7, L35 0 0 0 0 0 0 0
36 Band "H" properties, with 50% (unoccupied) discount nr I T8.7, L36 0 0 0 0 0 0 0
37 Total number of billed properties nr I T8.7, L37 163 97 97 97 97 97 97
38 "Band D equivalents" Band "A*" properties with up to 25% (Council tax relief) discount nr I T8.7, L38 0 0 0 0 0 0 0
39 "Band D equivalents" Band "A" properties with up to 25% (Council tax relief) discount nr I T8.7, L39 0 0 0 0 0 0 0
40 "Band D equivalents" Band "B" properties with up to 25% (Council tax relief) discount nr I T8.7, L40 0 0 0 0 0 0 0
41 "Band D equivalents" Band "C" properties with up to 25% (Council tax relief) discount nr I T8.7, L41 0 0 0 0 0 0 0
42 "Band D equivalents" Band "D" properties with up to 25% (Council tax relief) discount nr I T8.7, L42 0 0 0 0 0 0 0
43 "Band D equivalents" Band "E" properties with up to 25% (Council tax relief) discount nr I T8.7, L43 0 0 0 0 0 0 0
44 "Band D equivalents" Band "F" properties with up to 25% (Council tax relief) discount nr I T8.7, L44 0 0 0 0 0 0 0
45 "Band D equivalents" Band "G" properties with up to 25% (Council tax relief) discount nr I T8.7, L45 0 0 0 0 0 0 0
46 "Band D equivalents" Band "H" properties with up to 25% (Council tax relief) discount nr I T8.7, L46 0 0 0 0 0 0 0
47 Number of Band "D" equivalent properties nr C T8.7, L47 250 144 144 144 144 144 144
Tariffs: Property drainage for household properties billed measured Units Field Type BP Reference 2007-08 2008-09 2009-10 2010-11 2011-12 2012-13 2013-14
48 Band D Charge £ B T8.7, L48 38.8 40.2 41.8 42.4 43.1 43.8 44.5
Revenue: Property drainage for household properties billed measured Units Field Type BP Reference 2007-08 2008-09 2009-10 2010-11 2011-12 2012-13 2013-14
49 Total revenue £ C T8.7, L49 9,597 5,727 5,957 6,053 6,149 6,248 6,348
Revenue - Using previous year customer base Units Field Type BP Reference 2007-08 2008-09 2009-10 2010-11 2011-12 2012-13 2013-14
50 Total revenue £ C 9,945 5,945 6,053 6,149 6,248 6,348

Customer base: Waste water - retail - primary revenue: retail roads drainage charges from measured household premises
Tariff basket: 2 Revenue group: 2
Tariff multipliers: Roads drainage for household properties billed measured Units Field Type BP Reference 2007-08 2008-09 2009-10 2010-11 2011-12 2012-13 2013-14
1 Number of Band "A*" properties, paying full charge nr I T8.8, L1 0 0 0 0 0 0 0
2 Band "A*" properties, with <=25% (Council tax relief) discount nr I T8.8, L2 0 0 0 0 0 0 0
3 Band "A*" properties, with 25% (single person) discount nr I T8.8, L3 0 0 0 0 0 0 0
4 Band "A*" properties, with 50% (unoccupied) discount nr I T8.8, L4 0 0 0 0 0 0 0
5 Number of Band "A" properties, paying full charge nr I T8.8, L5 4 4 4 4 4 4 4
6 Band "A" properties, with <=25% (Council tax relief) discount nr I T8.8, L6 0 0 0 0 0 0 0
7 Band "A" properties, with 25% (single person) discount nr I T8.8, L7 0 0 0 0 0 0 0
8 Band "A" properties, with 50% (unoccupied) discount nr I T8.8, L8 0 0 0 0 0 0 0
9 Number of Band "B" properties, paying full charge nr I T8.8, L9 2 2 2 2 2 2 2
10 Band "B" properties, with <=25% (Council tax relief) discount nr I T8.8, L10 0 0 0 0 0 0 0
11 Band "B" properties, with 25% (single person) discount nr I T8.8, L11 0 0 0 0 0 0 0
12 Band "B" properties, with 50% (unoccupied) discount nr I T8.8, L12 0 0 0 0 0 0 0
13 Number of Band "C" properties, paying full charge nr I T8.8, L13 5 2 2 2 2 2 2
14 Band "C" properties, with <=25% (Council tax relief) discount nr I T8.8, L14 0 0 0 0 0 0 0
15 Band "C" properties, with 25% (single person) discount nr I T8.8, L15 0 0 0 0 0 0 0
16 Band "C" properties, with 50% (unoccupied) discount nr I T8.8, L16 0 0 0 0 0 0 0
17 Number of Band "D" properties, paying full charge nr I T8.8, L17 5 3 3 3 3 3 3
18 Band "D" properties, with <=25% (Council tax relief) discount nr I T8.8, L18 0 0 0 0 0 0 0
19 Band "D" properties, with 25% (single person) discount nr I T8.8, L19 1 1 1 1 1 1 1
20 Band "D" properties, with 50% (unoccupied) discount nr I T8.8, L20 0 0 0 0 0 0 0
21 Number of Band "E" properties, paying full charge nr I T8.8, L21 15 6 6 6 6 6 6
22 Band "E" properties, with <=25% (Council tax relief) discount nr I T8.8, L22 0 0 0 0 0 0 0
23 Band "E" properties, with 25% (single person) discount nr I T8.8, L23 3 3 3 3 3 3 3
24 Band "E" properties, with 50% (unoccupied) discount nr I T8.8, L24 1 1 1 1 1 1 1
25 Number of Band "F" properties, paying full charge nr I T8.8, L25 32 22 22 22 22 22 22
26 Band "F" properties, with <=25% (Council tax relief) discount nr I T8.8, L26 0 0 0 0 0 0 0
27 Band "F" properties, with 25% (single person) discount nr I T8.8, L27 3 3 3 3 3 3 3
28 Band "F" properties, with 50% (unoccupied) discount nr I T8.8, L28 0 0 0 0 0 0 0
29 Number of Band "G" properties, paying full charge nr I T8.8, L29 69 39 39 39 39 39 39
30 Band "G" properties, with <=25% (Council tax relief) discount nr I T8.8, L30 0 0 0 0 0 0 0
31 Band "G" properties, with 25% (single person) discount nr I T8.8, L31 1 1 1 1 1 1 1
32 Band "G" properties, with 50% (unoccupied) discount nr I T8.8, L32 0 0 0 0 0 0 0
33 Number of Band "H" properties, paying full charge nr I T8.8, L33 31 17 17 17 17 17 17
34 Band "H" properties, with <=25% (Council tax relief) discount nr I T8.8, L34 0 0 0 0 0 0 0
35 Band "H" properties, with 25% (single person) discount nr I T8.8, L35 0 0 0 0 0 0 0
36 Band "H" properties, with 50% (unoccupied) discount nr I T8.8, L36 0 0 0 0 0 0 0
37 Total number of billed properties nr I T8.8, L37 172 104 104 104 104 104 104
38 "Band D equivalents" Band "A*" properties with up to 25% (Council tax relief) discount nr I T8.8, L38 0 0 0 0 0 0 0
39 "Band D equivalents" Band "A" properties with up to 25% (Council tax relief) discount nr I T8.8, L39 0 0 0 0 0 0 0
40 "Band D equivalents" Band "B" properties with up to 25% (Council tax relief) discount nr I T8.8, L40 0 0 0 0 0 0 0
41 "Band D equivalents" Band "C" properties with up to 25% (Council tax relief) discount nr I T8.8, L41 0 0 0 0 0 0 0
42 "Band D equivalents" Band "D" properties with up to 25% (Council tax relief) discount nr I T8.8, L42 0 0 0 0 0 0 0
43 "Band D equivalents" Band "E" properties with up to 25% (Council tax relief) discount nr I T8.8, L43 0 0 0 0 0 0 0
44 "Band D equivalents" Band "F" properties with up to 25% (Council tax relief) discount nr I T8.8, L44 0 0 0 0 0 0 0
45 "Band D equivalents" Band "G" properties with up to 25% (Council tax relief) discount nr I T8.8, L45 0 0 0 0 0 0 0
46 "Band D equivalents" Band "H" properties with up to 25% (Council tax relief) discount nr I T8.8, L46 0 0 0 0 0 0 0
47 Number of Band "D" equivalent properties nr C T8.8, L47 264 156 156 156 156 156 156
Tariffs: Roads drainage for household properties billed measured Units Field Type BP Reference 2007-08 2008-09 2009-10 2010-11 2011-12 2012-13 2013-14
48 Band D Charge £ B T8.8, L48 38.8 40.2 41.8 42.4 43.1 43.8 44.5
Revenue: Roads drainage for household properties billed measured Units Field Type BP Reference 2007-08 2008-09 2009-10 2010-11 2011-12 2012-13 2013-14
49 Total revenue £ C T8.8, L49 10,134 6,186 6,435 6,538 6,642 6,749 6,856
Revenue - Using previous year customer base Units Field Type BP Reference 2007-08 2008-09 2009-10 2010-11 2011-12 2012-13 2013-14
50 Total revenue £ C 10,503 6,421 6,538 6,642 6,749 6,856

Customer base: Water - wholesale - primary revenue: wholesale water charges (assessed) to licensed providers through charges scheme
Tariff basket: 3 Revenue group: 3
Tariff multipliers: Licensed Provider: assessed meter sizes Units Field Type BP Reference 2007-08 2008-09 2009-10 2010-11 2011-12 2012-13 2013-14
1 20mm nr I T8.9, L1 43,244 43,244 43,244 43,244 43,244 43,244 43,244
2 25mm nr I T8.9, L2 482 482 482 482 482 482 482
3 40mm nr I T8.9, L3 72 72 72 72 72 72 72
4 50mm nr I T8.9, L4 40 40 40 40 40 40 40
5 80mm nr I T8.9, L5 1 1 1 1 1 1 1
6 Total nr C T8.9, L6 43,839 43,839 43,839 43,839 43,839 43,839 43,839
Tariff multipliers: Licensed Provider: assessed allocated tranche Units Field Type BP Reference 2007-08 2008-09 2009-10 2010-11 2011-12 2012-13 2013-14
7 20mm m3 I T8.9, L7 785,278 785,278 785,278 785,278 785,278 785,278 785,278
8 25mm m3 I T8.9, L8 9,640 9,640 9,640 9,640 9,640 9,640 9,640
9 40mm m3 I T8.9, L9 1,440 1,440 1,440 1,440 1,440 1,440 1,440
10 50mm m3 I T8.9, L10 800 800 800 800 800 800 800
11 80mm m3 I T8.9, L11 20 20 20 20 20 20 20
12 Total m3 C T8.9, L12 797,178 797,178 797,178 797,178 797,178 797,178 797,178
Tariff multipliers: Licensed provider: assessed capacity volume Units Field Type BP Reference 2007-08 2008-09 2009-10 2010-11 2011-12 2012-13 2013-14
13 20mm m3 I T8.9, L13 2,499,974 2,499,974 2,499,974 2,499,974 2,499,974 2,499,974 2,499,974
14 25mm m3 I T8.9, L14 231,360 231,360 231,360 231,360 231,360 231,360 231,360
15 40mm m3 I T8.9, L15 70,560 70,560 70,560 70,560 70,560 70,560 70,560
16 50mm m3 I T8.9, L16 99,200 99,200 99,200 99,200 99,200 99,200 99,200
17 80mm m3 I T8.9, L17 7,480 7,480 7,480 7,480 7,480 7,480 7,480
18 Total m3 C T8.9, L18 2,908,574 2,908,574 2,908,574 2,908,574 2,908,574 2,908,574 2,908,574
Tariff multipliers: Licensed provider: assessed standard volumes Units Field Type BP Reference 2007-08 2008-09 2009-10 2010-11 2011-12 2012-13 2013-14
19 20mm meters: volume between 20m3 and up to and including 100m3 m3 I T8.9, L19 2,499,974 2,499,974 2,499,974 2,499,974 2,499,974 2,499,974 2,499,974
20 20mm meters: volume greater than 100m3 m3 I T8.9, L20 7,779,700 7,779,700 7,779,700 7,779,700 7,779,700 7,779,700 7,779,700
21 > 20mm meters: volume between 20m3 and (up to and including) 250,000m3 m3 I T8.9, L21 3,084,896 3,084,896 3,084,896 3,084,896 3,084,896 3,084,896 3,084,896
22 > 20mm meters: volume between 250,000m3 and (up to and including) 1,000,000m3 m3 I T8.9, L22 0 0 0 0 0 0 0
23 > 20mm meters: volume greater than 1,000,000m3 m3 I T8.9, L23 0 0 0 0 0 0 0
24 Total standard volumes m3 C T8.9, L24 13,364,569 13,364,569 13,364,569 13,364,569 13,364,569 13,364,569 13,364,569
Tariff multipliers: Licensed Provider: actual meter sizes Units Field Type BP Reference 2007-08 2008-09 2009-10 2010-11 2011-12 2012-13 2013-14
25 20mm nr I T8.9, L25 43,244 43,244 43,244 43,244 43,244 43,244 43,244
26 25mm nr I T8.9, L26 482 482 482 482 482 482 482
27 40mm nr I T8.9, L27 72 72 72 72 72 72 72
28 50mm nr I T8.9, L28 40 40 40 40 40 40 40
29 80mm nr I T8.9, L29 1 1 1 1 1 1 1
30 Total nr C T8.9, L30 43,839 43,839 43,839 43,839 43,839 43,839 43,839
Tariff multipliers: Licensed Provider: actual allocated tranche Units Field Type BP Reference 2007-08 2008-09 2009-10 2010-11 2011-12 2012-13 2013-14
31 20mm m3 I T8.9, L31 544,280 544,280 544,280 544,280 544,280 544,280 544,280
32 25mm m3 I T8.9, L32 6,682 6,682 6,682 6,682 6,682 6,682 6,682
33 40mm m3 I T8.9, L33 998 998 998 998 998 998 998
34 50mm m3 I T8.9, L34 554 554 554 554 554 554 554
35 80mm m3 I T8.9, L35 14 14 14 14 14 14 14
36 Total m3 C T8.9, L36 552,528 552,528 552,528 552,528 552,528 552,528 552,528
Tariff multipliers: Licensed provider: actual capacity volume Units Field Type BP Reference 2007-08 2008-09 2009-10 2010-11 2011-12 2012-13 2013-14
37 20mm m3 I T8.9, L37 1,732,746 1,732,746 1,732,746 1,732,746 1,732,746 1,732,746 1,732,746
38 25mm m3 I T8.9, L38 160,357 160,357 160,357 160,357 160,357 160,357 160,357
39 40mm m3 I T8.9, L39 48,906 48,906 48,906 48,906 48,906 48,906 48,906
40 50mm m3 I T8.9, L40 68,756 68,756 68,756 68,756 68,756 68,756 68,756

41 80mm m3 I T8.9, L41 5,184 5,184 5,184 5,184 5,184 5,184 5,184
42 Total m3 C T8.9, L42 2,015,949 2,015,949 2,015,949 2,015,949 2,015,949 2,015,949 2,015,949
Tariff multipliers: Licensed provider: actual standard volumes Units Field Type BP Reference 2007-08 2008-09 2009-10 2010-11 2011-12 2012-13 2013-14
43 20mm meters: volume between 20m3 and up to and including 100m3 m3 I T8.9, L43 1,732,746 1,732,746 1,732,746 1,732,746 1,732,746 1,732,746 1,732,746
44 20mm meters: volume greater than 100m3 m3 I T8.9, L44 5,392,153 5,392,153 5,392,153 5,392,153 5,392,153 5,392,153 5,392,153
45 > 20mm meters: volume between 20m3 and (up to and including) 250,000m3 m3 I T8.9, L45 2,138,158 2,138,158 2,138,158 2,138,158 2,138,158 2,138,158 2,138,158
46 > 20mm meters: volume between 250,000m3 and (up to and including) 1,000,000m3 m3 I T8.9, L46 0 0 0 0 0 0 0
47 > 20mm meters: volume greater than 1,000,000m3 m3 I T8.9, L47 0 0 0 0 0 0 0
48 Total standard volumes m3 C T8.9, L48 9,263,058 9,263,058 9,263,058 9,263,058 9,263,058 9,263,058 9,263,058
Tariff multipliers: exempt supply points Units Field Type BP Reference 2007-08 2008-09 2009-10 2010-11 2011-12 2012-13 2013-14
49 The number of exempt supply points nr I T8.9, L49 4,557 4,557 4,557 4,557 4,557 4,557 4,557
Tariffs: Meter based annual charges Units Field Type BP Reference 2007-08 2008-09 2009-10 2010-11 2011-12 2012-13 2013-14
50 20mm £ B T8.9, L50 65.53 67.00 69.00 68.03 67.05 66.07 65.09
51 25mm £ B T8.9, L51 126.17 129.00 133.00 131.13 129.25 127.36 125.46
52 40mm £ B T8.9, L52 499.80 511.00 526.00 518.60 511.16 503.69 496.19
53 50mm £ B T8.9, L53 900.82 921.00 949.00 935.66 922.23 908.76 895.22
54 80mm £ B T8.9, L54 1751.76 1791.00 1845.00 1819.06 1792.96 1766.76 1740.45
Tariffs: Capacity Volume Charge Units Field Type BP Reference 2007-08 2008-09 2009-10 2010-11 2011-12 2012-13 2013-14
55 20mm premium Capacity volume charge £ B T8.9, L55 0.737823 0.754350 0.764100 0.753356 0.742547 0.731698 0.720799
56 Capacity Volume Charge £ B T8.9, L56 0.491882 0.502900 0.518000 0.510716 0.503389 0.496034 0.488645
Tariffs: Standard Volumes Units Field Type BP Reference 2007-08 2008-09 2009-10 2010-11 2011-12 2012-13 2013-14
57 20mm meters: volume between 20m3 and up to and including 100m3 £ B T8.9, L57 1.003521 1.026000 1.039300 1.024686 1.009985 0.995228 0.980404
58 20mm meters: volume greater than 100m3 £ B T8.9, L58 0.669014 0.684000 0.704600 0.694693 0.684726 0.674721 0.664671
59 > 20mm meters: volume between 20m3 and (up to and including) 250,000m3 £ B T8.9, L59 0.669014 0.684000 0.704600 0.694693 0.684726 0.674721 0.664671
60 > 20mm meters: volume between 250,000m3 and (up to and including) 1,000,000m3 £ B T8.9, L60 0.564847 0.577500 0.594900 0.562735 0.532160 0.503110 0.475501
61 > 20mm meters: volume greater than 1,000,000m3 £ B T8.9, L61 0.346635 0.354400 0.365100 0.340988 0.318397 0.297196 0.277315
Tariffs: exempt supply points Units Field Type BP Reference 2007-08 2008-09 2009-10 2010-11 2011-12 2012-13 2013-14
62 Charge per supply point £ I T8.9, L62 -14.29 -14.61 -14.76 -14.55 -14.34 -14.13 -13.92
Revenue: Phasing Units Field Type BP Reference 2007-08 2008-09 2009-10 2010-11 2011-12 2012-13 2013-14
62 Assessed revenue proportion % I 100% 100% 67% 33% 0% 0% 0%
63 Actual revenue proportion % C 0% 0% 33% 67% 100% 100% 100%
64 Total % C 100% 100% 100% 100% 100% 100% 100%
Revenue Units Field Type BP Reference 2007-08 2008-09 2009-10 2010-11 2011-12 2012-13 2013-14
65 Assessed meter based annual charges £ C T8.9, L63 2,968,456 3,034,949 2,094,165 1,016,951 0 0 0
66 Assessed capacity volume charges £ C T8.9, L64 2,045,520 2,091,340 1,421,663 690,376 0 0 0
67 Assessed standard volume charges £ C T8.9, L65 9,777,344 9,996,356 6,869,789 3,336,050 0 0 0
68 Actual meter based annual charges £ C T8.9, L66 0 0 1,031,454 2,064,718 3,037,456 2,993,075 2,948,493
69 Actual capacity volume charges £ C T8.9, L67 0 0 485,328 971,507 1,429,207 1,408,324 1,387,347
70 Actual standard volume charges £ C T8.9, L68 0 0 2,345,211 4,694,537 6,906,244 6,805,335 6,703,970
71 Negative revenue in respect of supply points with negative wholesale charges £ C T8.9, L69 -65,119 -66,578 -67,244 -66,298 -65,347 -64,392 -63,433
72 Total £ C T8.9, L70 14,252,306 14,770,002 13,910,939 12,707,842 11,307,560 11,142,343 10,976,378
Revenue - Using previous year customer base Units Field Type BP Reference 2007-08 2008-09 2009-10 2010-11 2011-12 2012-13 2013-14
73 Assessed meter based annual charges £ C T8.9, L63 3,034,949 3,125,619 2,064,718 1,002,360 0 0
74 Assessed capacity volume charges £ C T8.9, L64 2,091,340 2,121,885 1,401,673 680,471 0 0
75 Assessed standard volume charges £ C T8.9, L65 9,996,356 10,253,417 6,773,192 3,288,187 0 0
76 Actual meter based annual charges £ C T8.9, L66 0 0 1,016,951 2,035,095 2,993,075 2,948,493
77 Actual capacity volume charges £ C T8.9, L67 0 0 478,503 957,569 1,408,324 1,387,347
78 Actual standard volume charges £ C T8.9, L68 0 0 2,312,235 4,627,184 6,805,335 6,703,970
79 Negative revenue in respect of supply points with negative wholesale charges £ C T8.9, L69 -66,578 -67,244 -66,298 -65,347 -64,392 -63,433
80 Total £ C T8.9, L70 14,571,557 15,140,437 13,715,336 12,525,519 11,142,343 10,976,378

Customer base: Water - wholesale - primary revenue: wholesale water charges (measured) to licensed providers through charges scheme in respect of supply points consuming up to and including 100Ml/annum
Tariff basket: 3 Revenue group: 3
Tariff multipliers: Licensed provider: tariff meters Units Field Type BP Reference 2007-08 2008-09 2009-10 2010-11 2011-12 2012-13 2013-14
1 20mm nr I T8.10, L1 68,616 65,822 64,240 64,181 64,927 65,598 66,177
2 25mm nr I T8.10, L2 9,726 9,726 9,726 9,726 9,726 9,726 9,726
3 40mm nr I T8.10, L3 1,293 1,293 1,293 1,293 1,293 1,293 1,293
4 50mm nr I T8.10, L4 1,079 1,079 1,079 1,079 1,079 1,079 1,079
5 80mm nr I T8.10, L5 251 252 252 252 251 251 251
6 100mm nr I T8.10, L6 38 38 38 38 38 38 38
7 150mm nr I T8.10, L7 6 6 6 6 6 6 6
8 200mm nr I T8.10, L8 0 0 0 0 0 0 0
9 250mm nr I T8.10, L9 0 0 0 0 0 0 0
10 300mm nr I T8.10, L10 0 0 0 0 0 0 0
11 Total nr C T8.10, L11 81,009 78,216 76,634 76,575 77,320 77,991 78,570
Tariff multipliers: Licensed provider: allocated tranche Units Field Type BP Reference 2007-08 2008-09 2009-10 2010-11 2011-12 2012-13 2013-14
12 20mm m3 I T8.10, L12 1,213,766 1,157,018 1,124,350 1,123,265 1,139,053 1,153,176 1,165,314
13 25mm m3 I T8.10, L13 186,458 186,434 186,426 186,429 186,438 186,446 186,453
14 40mm m3 I T8.10, L14 27,287 27,286 27,285 27,286 27,286 27,286 27,287
15 50mm m3 I T8.10, L15 26,768 26,767 26,766 26,767 26,767 26,768 26,768
16 80mm m3 I T8.10, L16 6,690 6,730 6,730 6,730 6,690 6,690 6,690
17 100mm m3 I T8.10, L17 1,321 1,321 1,321 1,321 1,321 1,321 1,321
18 150mm m3 I T8.10, L18 180 180 180 180 180 180 180
19 200mm m3 I T8.10, L19 0 0 0 0 0 0 0
20 250mm m3 I T8.10, L20 0 0 0 0 0 0 0
21 300mm m3 I T8.10, L21 0 0 0 0 0 0 0
22 Total m3 C T8.10, L22 1,462,470 1,405,736 1,373,058 1,371,976 1,387,734 1,401,867 1,414,013
Tariff multipliers: Licensed provider: capacity volume Units Field Type BP Reference 2007-08 2008-09 2009-10 2010-11 2011-12 2012-13 2013-14
23 20mm (non-former LUVA) m3 I T8.10, L23 3,555,182 3,321,307 3,188,165 3,184,769 3,250,460 3,309,272 3,360,024
24 20mm (former LUVA) m3 I T8.10, L24 320 320 320 320 320 320 320
25 25mm m3 I T8.10, L25 3,490,008 3,483,367 3,480,969 3,481,886 3,484,351 3,486,592 3,488,713
26 40mm m3 I T8.10, L26 1,091,690 1,090,663 1,090,283 1,090,428 1,090,818 1,091,165 1,091,492
27 50mm m3 I T8.10, L27 2,238,696 2,236,201 2,235,298 2,235,644 2,236,571 2,237,410 2,238,209
28 80mm m3 I T8.10, L28 1,301,167 1,306,181 1,305,274 1,305,620 1,298,996 1,299,852 1,300,667
29 100mm m3 I T8.10, L29 681,056 679,677 679,186 679,374 679,880 680,344 680,785
30 150mm m3 I T8.10, L30 150,365 149,592 149,317 149,422 149,706 149,966 150,214
31 200mm m3 I T8.10, L31 0 0 0 0 0 0 0
32 250mm m3 I T8.10, L32 0 0 0 0 0 0 0
33 300mm m3 I T8.10, L33 0 0 0 0 0 0 0
34 Total m3 C T8.10, L34 12,508,484 12,267,309 12,128,812 12,127,463 12,191,102 12,254,921 12,310,425
Tariff multipliers: Licensed provider: Standard volumes Units Field Type BP Reference 2007-08 2008-09 2009-10 2010-11 2011-12 2012-13 2013-14
35 20mm meters (non-former LUVA): volume between 20m3 and up to and including 100m3 m3 I T8.10, L35 3,555,182 3,321,307 3,188,165 3,184,769 3,250,460 3,309,272 3,360,024
36 20mm meters (non-former LUVA): volume greater than 100m3 m3 I T8.10, L36 28,532,548 28,478,450 28,521,178 28,572,632 28,618,044 28,661,374 28,709,096
37 > 20mm meters (non-former LUVA): volume between 20m3 and (up to and including) 250,000m3 m3 I T8.10, L37 44,091,756 43,631,825 43,467,959 43,530,495 43,699,434 43,854,223 44,001,487
38 > 20mm meters (non-former LUVA): volume between 250,000m3 and (up to and including) 1,000,000m3 m3 I T8.10, L38 0 0 0 0 0 0 0
39 > 20mm meters (non-former LUVA): volume greater than 1,000,000m3 m3 I T8.10, L39 0 0 0 0 0 0 0
40 20mm meters (former LUVA): volume between 20m3 and up to and including 100m3 m3 I T8.10, L40 320 320 320 320 320 320 320
41 20mm meters (former LUVA): volume greater than 100m3 m3 I T8.10, L41 17,451 17,265 17,199 17,225 17,293 17,355 17,414
42 > 20mm meters (former LUVA): volume between 20m3 and (up to and including) 100,000m3 m3 I T8.10, L42 1,041,864 1,130,937 1,126,709 1,128,323 1,032,637 1,036,278 1,039,741
43 > 20mm meters (former LUVA): volume between 100,000m3 and (up to and including) 250,000m3 m3 I T8.10, L43 0 0 0 0 0 0 0
44 > 20mm meters (former LUVA): volume between 250,000m3 and (up to and including) 1,000,000m3 m3 I T8.10, L44 0 0 0 0 0 0 0
45 > 20mm meters (former LUVA): volume greater than 1,000,000m3 m3 I T8.10, L45 0 0 0 0 0 0 0
46 Total standard volumes m3 C T8.10, L46 77,239,122 76,580,104 76,321,531 76,433,763 76,618,188 76,878,822 77,128,083
Tariffs: Meter based annual charges Units Field Type BP Reference 2007-08 2008-09 2009-10 2010-11 2011-12 2012-13 2013-14
47 20mm £ B T8.10, L47 65.53 67.00 69.00 68.03 67.05 66.07 65.09
48 25mm £ B T8.10, L48 126.17 129.00 133.00 131.13 129.25 127.36 125.46
49 40mm £ B T8.10, L49 499.80 511.00 526.00 518.60 511.16 503.69 496.19
50 50mm £ B T8.10, L50 900.82 921.00 949.00 935.66 922.23 908.76 895.22
51 80mm £ B T8.10, L51 1751.76 1791.00 1845.00 1819.06 1792.96 1766.76 1740.45
52 100mm £ I T8.10, L52 1900.43 1943.00 2001.00 1972.86 1944.56 1916.15 1887.61
53 150mm £ I T8.10, L53 4000.39 4090.00 4213.00 4153.76 4094.17 4034.34 3974.25
54 200mm £ I T8.10, L54 30000.00 30672.00 31595.00 31150.74 30703.81 30255.19 29804.54
55 250mm £ I T8.10, L55 80000.00 81792.00 84254.00 83069.30 81877.48 80681.15 79479.41
56 300mm £ I T8.10, L56 99000.39 101218.00 104265.00 102798.92 101324.04 99843.57 98356.40
Tariffs: Capacity Volume Charge Units Field Type BP Reference 2007-08 2008-09 2009-10 2010-11 2011-12 2012-13 2013-14
57 20mm (non-former LUVA) premium Capacity volume charge £ B T8.10, L57 0.737823 0.754350 0.764100 0.753356 0.742547 0.731698 0.720799
58 Capacity Volume Charge £ B T8.10, L58 0.491882 0.502900 0.518000 0.510716 0.503389 0.496034 0.488645

Tariffs: Standard Volume Charge Units Field Type BP Reference 2007-08 2008-09 2009-10 2010-11 2011-12 2012-13 2013-14
59 20mm meters (non-former LUVA): volume between 20m3 and up to and including 100m3 £ B T8.10, L59 1.003521 1.026000 1.039300 1.024686 1.009985 0.995228 0.980404
60 20mm meters (non-former LUVA): volume greater than 100m3 £ B T8.10, L60 0.669014 0.684000 0.704600 0.694693 0.684726 0.674721 0.664671
61 > 20mm meters (non-former LUVA): volume between 20m3 and (up to and including) 250,000m3 £ B T8.10, L61 0.669014 0.684000 0.704600 0.694693 0.684726 0.674721 0.664671
62 > 20mm meters (non-former LUVA): volume between 250,000m3 and (up to and including) 1,000,000m3 £ B T8.10, L62 0.564847 0.577500 0.594900 0.562735 0.532160 0.503110 0.475501
63 > 20mm meters (non-former LUVA): volume greater than 1,000,000m3 £ B T8.10, L63 0.346635 0.354400 0.365100 0.340988 0.318397 0.297196 0.277315
64 20mm meters (former LUVA): volume between 20m3 and up to and including 100m3 £ B T8.10, L64 0.669014 0.684000 0.704600 0.714401 0.724158 0.733835 0.743440
65 20mm meters (former LUVA): volume greater than 100m3 £ B T8.10, L65 0.669014 0.684000 0.704600 0.714401 0.724158 0.733835 0.743440
66 > 20mm meters (former LUVA): volume between 20m3 and (up to and including) 100,000m3 £ B T8.10, L66 0.669014 0.684000 0.704600 0.714401 0.724158 0.733835 0.743440
67 > 20mm meters (former LUVA): volume between 100,000m3 and (up to and including) 250,000m3 £ B T8.10, L67 0.468310 0.478800 0.514400 0.521555 0.528678 0.535743 0.542755
68 > 20mm meters (former LUVA): volume between 250,000m3 and (up to and including) 1,000,000m3 £ B T8.10, L68 0.423636 0.433125 0.458100 0.433332 0.409787 0.387418 0.366157
69 > 20mm meters (former LUVA): volume greater than 1,000,000m3 £ B T8.10, L69 0.419429 0.428824 0.434500 0.405804 0.378920 0.353689 0.330028
Revenue Units Field Type BP Reference 2007-08 2008-09 2009-10 2010-11 2011-12 2012-13 2013-14
70 Meter Based Annual Charges £ C T8.10, L70 7,877,859 7,868,892 7,996,438 7,880,040 7,815,192 7,745,346 7,667,653
71 Capacity volume charges £ C T8.10, L71 7,027,061 7,004,373 7,067,332 6,966,444 6,914,241 6,858,731 6,795,475
72 Standard volume charges £ C T8.10, L72 52,863,294 53,516,678 54,843,230 54,171,502 53,561,093 52,994,697 52,408,965
73 Total £ C T8.10, L73 65,587,405 67,090,533 68,578,767 69,017,987 68,290,526 67,598,774 66,872,094
Revenue - Using previous year customer base Units Field Type BP Reference 2007-08 2008-09 2009-10 2010-11 2011-12 2012-13 2013-14
74 Meter Based Annual Charges £ C T8.10, L70 8,054,323 8,105,596 7,883,999 7,766,983 7,701,002 7,629,979
75 Capacity volume charges £ C T8.10, L71 7,184,467 7,171,840 6,967,958 6,866,495 6,813,215 6,756,571
76 Standard volume charges £ C T8.10, L72 54,047,431 55,069,983 54,094,624 53,417,216 52,799,773 52,226,987
77 Total £ C T8.10, L73 67,056,562 69,010,817 67,636,596 68,050,694 67,313,991 66,613,537

Customer base: Water - wholesale - primary revenue: wholesale water charges (measured) to licensed providers through charges scheme in respect of supply points consuming between 100Ml/annum and up to and including 250Ml/annum
Tariff basket: 3 Revenue group: 4
Tariff multipliers: Licensed provider: tariff meters Units Field Type BP Reference 2006-07 2007-08 2008-09 2009-10 2010-11 2011-12 2012-13 2013-14
1 20mm nr I T8.11, L1 43 47 47 47 48 45 43
2 25mm nr I T8.11, L2 40 42 42 42 42 40 40
3 40mm nr I T8.11, L3 14 14 14 14 14 14 14
4 50mm nr I T8.11, L4 39 39 39 39 39 39 39
5 80mm nr I T8.11, L5 34 33 33 33 34 34 34
6 100mm nr I T8.11, L6 26 29 29 29 29 27 26
7 150mm nr I T8.11, L7 3 3 3 3 3 3 3
8 200mm nr I T8.11, L8 0 0 0 0 0 0 0
9 250mm nr I T8.11, L9 0 0 0 0 0 0 0
10 300mm nr I T8.11, L10 0 0 0 0 0 0 0
11 Total nr C T8.11, L11 199 207 207 207 209 202 199
Tariff multipliers: Licensed provider: allocated tranche Units Field Type BP Reference 2006-07 2007-08 2008-09 2009-10 2010-11 2011-12 2012-13 2013-14
12 20mm m3 I T8.11, L12 20 20 20 20 20 20 20
13 25mm m3 I T8.11, L13 60 60 60 60 60 60 60
14 40mm m3 I T8.11, L14 0 0 0 0 0 0 0
15 50mm m3 I T8.11, L15 740 740 740 740 740 740 740
16 80mm m3 I T8.11, L16 1,060 1,020 1,020 1,020 1,060 1,060 1,060
17 100mm m3 I T8.11, L17 1,960 2,160 2,160 2,160 2,160 2,020 1,960
18 150mm m3 I T8.11, L18 160 160 160 160 160 160 160
19 200mm m3 I T8.11, L19 0 0 0 0 0 0 0
20 250mm m3 I T8.11, L20 0 0 0 0 0 0 0
21 300mm m3 I T8.11, L21 0 0 0 0 0 0 0
22 Total m3 C T8.11, L22 4,000 4,160 4,160 4,160 4,200 4,060 4,000
Tariff multipliers: Licensed provider: capacity volume Units Field Type BP Reference 2006-07 2007-08 2008-09 2009-10 2010-11 2011-12 2012-13 2013-14
23 20mm (non-former LUVA) m3 I T8.11, L23 80 80 80 80 80 80 80
24 20mm (former LUVA) m3 I T8.11, L24 0 0 0 0 0 0 0
25 25mm m3 I T8.11, L25 1,440 1,440 1,440 1,440 1,440 1,440 1,440
26 40mm m3 I T8.11, L26 0 0 0 0 0 0 0
27 50mm m3 I T8.11, L27 55,760 55,760 55,760 55,760 55,760 55,760 55,760
28 80mm m3 I T8.11, L28 220,340 212,780 212,780 212,780 220,340 220,340 220,340
29 100mm m3 I T8.11, L29 756,540 832,840 832,840 832,840 832,840 781,680 756,540
30 150mm m3 I T8.11, L30 228,140 228,140 228,140 228,140 228,140 228,140 228,140
31 200mm m3 I T8.11, L31 0 0 0 0 0 0 0
32 250mm m3 I T8.11, L32 0 0 0 0 0 0 0
33 300mm m3 I T8.11, L33 0 0 0 0 0 0 0
34 Total m3 C T8.11, L34 1,262,300 1,331,040 1,331,040 1,331,040 1,338,600 1,287,440 1,262,300
Tariff multipliers: Licensed provider: Standard volumes Units Field Type BP Reference 2006-07 2007-08 2008-09 2009-10 2010-11 2011-12 2012-13 2013-14
35 20mm meters (non-former LUVA): volume between 20m3 and up to and including 100m3 m3 I T8.11, L35 80 80 80 80 80 80 80
36 20mm meters (non-former LUVA): volume greater than 100m3 m3 I T8.11, L36 132,729 131,431 130,940 131,128 131,634 132,097 132,539
37 > 20mm meters (non-former LUVA): volume between 20m3 and (up to and including) 250,000m3 m3 I T8.11, L37 2,052,009 2,030,716 2,023,129 2,026,025 2,033,846 2,041,012 2,047,830
38 > 20mm meters (non-former LUVA): volume between 250,000m3 and (up to and including) 1,000,000m3 m3 I T8.11, L38 0 0 0 0 0 0 0
39 > 20mm meters (non-former LUVA): volume greater than 1,000,000m3 m3 I T8.11, L39 0 0 0 0 0 0 0
40 20mm meters (former LUVA): volume between 20m3 and up to and including 100m3 m3 I T8.11, L40 0 0 0 0 0 0 0
41 20mm meters (former LUVA): volume greater than 100m3 m3 I T8.11, L41 0 0 0 0 0 0 0
42 > 20mm meters (former LUVA): volume between 20m3 and (up to and including) 100,000m3 m3 I T8.11, L42 5,096,640 5,196,480 5,196,480 5,196,480 5,296,440 5,196,580 5,096,640
43 > 20mm meters (former LUVA): volume between 100,000m3 and (up to and including) 250,000m3 m3 I T8.11, L43 3,245,904 3,456,489 3,424,160 3,436,498 3,469,911 3,350,482 3,228,912
44 > 20mm meters (former LUVA): volume between 250,000m3 and (up to and including) 1,000,000m3 m3 I T8.11, L44 0 0 0 0 0 0 0
45 > 20mm meters (former LUVA): volume greater than 1,000,000m3 m3 I T8.11, L45 0 0 0 0 0 0 0
46 Total m3 C T8.11, L46 10,527,362 10,815,196 10,774,790 10,790,210 10,931,911 10,720,251 10,506,000
Tariffs: Meter based annual charges Units Field Type BP Reference 2006-07 2007-08 2008-09 2009-10 2010-11 2011-12 2012-13 2013-14
47 20mm £ B T8.11, L47 65.53 67.00 69.00 68.03 67.05 66.07 65.09
48 25mm £ B T8.11, L48 126.17 129.00 133.00 131.13 129.25 127.36 125.46
49 40mm £ B T8.11, L49 499.80 511.00 526.00 518.60 511.16 503.69 496.19
50 50mm £ B T8.11, L50 900.82 921.00 949.00 935.66 922.23 908.76 895.22
51 80mm £ B T8.11, L51 1751.76 1791.00 1845.00 1819.06 1792.96 1766.76 1740.45
52 100mm £ B T8.11, L52 1900.43 1943.00 2001.00 1972.86 1944.56 1916.15 1887.61
53 150mm £ B T8.11, L53 4000.39 4090.00 4213.00 4153.76 4094.17 4034.34 3974.25
54 200mm £ B T8.11, L54 30000.00 30672.00 31595.00 31150.74 30703.81 30255.19 29804.54
55 250mm £ B T8.11, L55 80000.00 81792.00 84254.00 83069.30 81877.48 80681.15 79479.41
56 300mm £ B T8.11, L56 99000.39 101218.00 104265.00 102798.92 101324.04 99843.57 98356.40
Tariffs: Capacity Volume Charge Units Field Type BP Reference 2006-07 2007-08 2008-09 2009-10 2010-11 2011-12 2012-13 2013-14
57 20mm (non-former LUVA) premium Capacity volume charge £ B T8.11, L57 0.737823 0.754350 0.764100 0.753356 0.742547 0.731698 0.720799
58 Capacity Volume Charge £ B T8.11, L58 0.491882 0.502900 0.518000 0.510716 0.503389 0.496034 0.488645
Tariffs: Standard Volume Charge Units Field Type BP Reference 2006-07 2007-08 2008-09 2009-10 2010-11 2011-12 2012-13 2013-14
59 20mm meters (non-former LUVA): volume between 20m3 and up to and including 100m3 £ B T8.11, L59 1.003521 1.026000 1.039300 1.024686 1.009985 0.995228 0.980404
60 20mm meters (non-former LUVA): volume greater than 100m3 £ B T8.11, L60 0.669014 0.684000 0.704600 0.694693 0.684726 0.674721 0.664671
61 > 20mm meters (non-former LUVA): volume between 20m3 and (up to and including) 250,000m3 £ B T8.11, L61 0.669014 0.684000 0.704600 0.694693 0.684726 0.674721 0.664671
62 > 20mm meters (non-former LUVA): volume between 250,000m3 and (up to and including) 1,000,000m3 £ B T8.11, L62 0.564847 0.577500 0.594900 0.562735 0.532160 0.503110 0.475501
63 > 20mm meters (non-former LUVA): volume greater than 1,000,000m3 £ B T8.11, L63 0.346635 0.354400 0.365100 0.340988 0.318397 0.297196 0.277315
64 20mm meters (former LUVA): volume between 20m3 and up to and including 100m3 £ B T8.11, L64 0.669014 0.684000 0.704600 0.714401 0.724158 0.733835 0.743440
65 20mm meters (former LUVA): volume greater than 100m3 £ B T8.11, L65 0.669014 0.684000 0.704600 0.714401 0.724158 0.733835 0.743440
66 > 20mm meters (former LUVA): volume between 20m3 and (up to and including) 100,000m3 £ B T8.11, L66 0.669014 0.684000 0.704600 0.714401 0.724158 0.733835 0.743440
67 > 20mm meters (former LUVA): volume between 100,000m3 and (up to and including) 250,000m3 £ B T8.11, L67 0.468310 0.478800 0.514400 0.521555 0.528678 0.535743 0.542755
68 > 20mm meters (former LUVA): volume between 250,000m3 and (up to and including) 1,000,000m3 £ B T8.11, L68 0.423636 0.433125 0.458100 0.433332 0.409787 0.387418 0.366157
69 > 20mm meters (former LUVA): volume greater than 1,000,000m3 £ B T8.11, L69 0.419429 0.428824 0.434500 0.405804 0.378920 0.353689 0.330028

Revenue Units Field Type BP Reference 2006-07 2007-08 2008-09 2009-10 2010-11 2011-12 2012-13 2013-14
70 Meter Based Annual Charges £ C T8.11, L70 170,966 179,360 184,757 182,159 181,406 174,470 169,853
71 Capacity volume charges £ C T8.11, L71 620,922 669,400 689,498 679,803 673,856 638,633 616,836
72 Standard volume charges £ C T8.11, L72 6,391,513 6,688,350 6,940,668 7,003,331 7,152,764 7,074,750 6,990,859
73 Total £ C T8.11, L73 6,952,237 7,393,905 7,666,440 7,865,294 8,008,025 7,887,853 7,777,548
Revenue - Using previous year customer base Units Field Type BP Reference 2006-07 2007-08 2008-09 2009-10 2010-11 2011-12 2012-13 2013-14
74 Meter Based Annual Charges £ C T8.10, L70 174,796 184,757 182,159 179,546 178,755 171,871
75 Capacity volume charges £ C T8.10, L71 634,831 689,498 679,803 670,050 664,010 629,120
76 Standard volume charges £ C T8.10, L72 6,534,683 6,962,990 6,994,755 7,057,010 7,206,866 7,126,317
77 Total £ C T8.10, L73 7,107,967 7,688,338 7,707,440 7,906,606 8,049,631 7,927,308

Customer base: Water - wholesale - primary revenue: wholesale water charges (measured) to licensed providers through charges scheme in respect of supply points consuming between 250Ml/annum and up to and including 1,000Ml/annum
Tariff basket: 3 Revenue group: 5
Tariff multipliers: Licensed provider: tariff meters Units Field Type BP Reference 2006-07 2007-08 2008-09 2009-10 2010-11 2011-12 2012-13 2013-14
1 20mm nr I T8.12, L1 33 28 28 28 28 31 33
2 25mm nr I T8.12, L2 13 11 11 11 11 13 13
3 40mm nr I T8.12, L3 10 10 10 10 10 10 10
4 50mm nr I T8.12, L4 16 16 16 16 16 16 16
5 80mm nr I T8.12, L5 8 8 8 8 8 8 8
6 100mm nr I T8.12, L6 16 13 13 13 13 15 16
7 150mm nr I T8.12, L7 8 8 8 8 8 8 8
8 200mm nr I T8.12, L8 1 1 1 1 1 1 1
9 250mm nr I T8.12, L9 0 0 0 0 0 0 0
10 300mm nr I T8.12, L10 0 0 0 0 0 0 0
11 Total nr C T8.12, L11 105 95 95 95 95 102 105
Tariff multipliers: Licensed provider: allocated tranche Units Field Type BP Reference 2006-07 2007-08 2008-09 2009-10 2010-11 2011-12 2012-13 2013-14
12 20mm m3 I T8.12, L12 0 0 0 0 0 0 0
13 25mm m3 I T8.12, L13 0 0 0 0 0 0 0
14 40mm m3 I T8.12, L14 0 0 0 0 0 0 0
15 50mm m3 I T8.12, L15 120 120 120 120 120 120 120
16 80mm m3 I T8.12, L16 860 860 860 860 860 860 860
17 100mm m3 I T8.12, L17 600 400 400 400 400 540 600
18 150mm m3 I T8.12, L18 280 280 280 280 280 280 280
19 200mm m3 I T8.12, L19 240 240 240 240 240 240 240
20 250mm m3 I T8.12, L20 0 0 0 0 0 0 0
21 300mm m3 I T8.12, L21 0 0 0 0 0 0 0
22 Total m3 C T8.12, L22 2,100 1,900 1,900 1,900 1,900 2,040 2,100
Tariff multipliers: Licensed provider: capacity volume Units Field Type BP Reference 2006-07 2007-08 2008-09 2009-10 2010-11 2011-12 2012-13 2013-14
23 20mm (non-former LUVA) m3 I T8.12, L23 0 0 0 0 0 0 0
24 20mm (former LUVA) m3 I T8.12, L24 0 0 0 0 0 0 0
25 25mm m3 I T8.12, L25 0 0 0 0 0 0 0
26 40mm m3 I T8.12, L26 0 0 0 0 0 0 0
27 50mm m3 I T8.12, L27 6,080 6,080 6,080 6,080 6,080 6,080 6,080
28 80mm m3 I T8.12, L28 70,140 70,140 70,140 70,140 70,140 70,140 70,140
29 100mm m3 I T8.12, L29 365,100 288,800 288,800 288,800 288,800 339,960 365,100
30 150mm m3 I T8.12, L30 634,820 634,820 634,820 634,820 634,820 634,820 634,820
31 200mm m3 I T8.12, L31 141,560 141,560 141,560 141,560 141,560 141,560 141,560
32 250mm m3 I T8.12, L32 0 0 0 0 0 0 0
33 300mm m3 I T8.12, L33 0 0 0 0 0 0 0
34 Total m3 C T8.12, L34 1,217,700 1,141,400 1,141,400 1,141,400 1,141,400 1,192,560 1,217,700
Tariff multipliers: Licensed provider: Standard volumes Units Field Type BP Reference 2006-07 2007-08 2008-09 2009-10 2010-11 2011-12 2012-13 2013-14
35 20mm meters (non-former LUVA): volume between 20m3 and up to and including 100m3 m3 I T8.12, L35 0 0 0 0 0 0 0
36 20mm meters (non-former LUVA): volume greater than 100m3 m3 I T8.12, L36 0 0 0 0 0 0 0
37 > 20mm meters (non-former LUVA): volume between 20m3 and (up to and including) 250,000m3 m3 I T8.12, L37 0 0 0 0 0 0 0
38 > 20mm meters (non-former LUVA): volume between 250,000m3 and (up to and including) 1,000,000m3 m3 I T8.12, L38 0 0 0 0 0 0 0
39 > 20mm meters (non-former LUVA): volume greater than 1,000,000m3 m3 I T8.12, L39 0 0 0 0 0 0 0
40 20mm meters (former LUVA): volume between 20m3 and up to and including 100m3 m3 I T8.12, L40 0 0 0 0 0 0 0
41 20mm meters (former LUVA): volume greater than 100m3 m3 I T8.12, L41 0 0 0 0 0 0 0
42 > 20mm meters (former LUVA): volume between 20m3 and (up to and including) 100,000m3 m3 I T8.12, L42 2,497,900 2,298,100 2,298,100 2,298,100 2,298,100 2,397,960 2,497,900
43 > 20mm meters (former LUVA): volume between 100,000m3 and (up to and including) 250,000m3 m3 I T8.12, L43 3,750,000 3,450,000 3,450,000 3,450,000 3,450,000 3,600,000 3,750,000
44 > 20mm meters (former LUVA): volume between 250,000m3 and (up to and including) 1,000,000m3 m3 I T8.12, L44 4,684,737 4,574,214 4,535,657 4,550,371 4,590,122 4,626,864 4,662,474
45 > 20mm meters (former LUVA): volume greater than 1,000,000m3 m3 I T8.12, L45 0 0 0 0 0 0 0
46 Total m3 C T8.12, L46 10,932,637 10,322,314 10,283,757 10,298,471 10,338,222 10,624,824 10,910,374
Tariffs: Meter based annual charges Units Field Type BP Reference 2006-07 2007-08 2008-09 2009-10 2010-11 2011-12 2012-13 2013-14
47 20mm £ B T8.12, L47 65.53 67.00 69.00 68.03 67.05 66.07 65.09
48 25mm £ B T8.12, L48 126.17 129.00 133.00 131.13 129.25 127.36 125.46
49 40mm £ B T8.12, L49 499.80 511.00 526.00 518.60 511.16 503.69 496.19
50 50mm £ B T8.12, L50 900.82 921.00 949.00 935.66 922.23 908.76 895.22
51 80mm £ B T8.12, L51 1751.76 1791.00 1845.00 1819.06 1792.96 1766.76 1740.45
52 100mm £ B T8.12, L52 1900.43 1943.00 2001.00 1972.86 1944.56 1916.15 1887.61
53 150mm £ B T8.12, L53 4000.39 4090.00 4213.00 4153.76 4094.17 4034.34 3974.25
54 200mm £ B T8.12, L54 30000.00 30672.00 31595.00 31150.74 30703.81 30255.19 29804.54
55 250mm £ B T8.12, L55 80000.00 81792.00 84254.00 83069.30 81877.48 80681.15 79479.41
56 300mm £ B T8.12, L56 99000.39 101218.00 104265.00 102798.92 101324.04 99843.57 98356.40
Tariffs: Capacity Volume Charge Units Field Type BP Reference 2006-07 2007-08 2008-09 2009-10 2010-11 2011-12 2012-13 2013-14
57 20mm (non-former LUVA) premium Capacity volume charge £ B T8.12, L57 0.737823 0.754350 0.764100 0.753356 0.742547 0.731698 0.720799
58 Capacity Volume Charge £ B T8.12, L58 0.491882 0.502900 0.518000 0.510716 0.503389 0.496034 0.488645
Tariffs: Standard Volume Charge Units Field Type BP Reference 2006-07 2007-08 2008-09 2009-10 2010-11 2011-12 2012-13 2013-14
59 20mm meters (non-former LUVA): volume between 20m3 and up to and including 100m3 £ B T8.12, L59 1.003521 1.026000 1.039300 1.024686 1.009985 0.995228 0.980404
60 20mm meters (non-former LUVA): volume greater than 100m3 £ B T8.12, L60 0.669014 0.684000 0.704600 0.694693 0.684726 0.674721 0.664671
61 > 20mm meters (non-former LUVA): volume between 20m3 and (up to and including) 250,000m3 £ B T8.12, L61 0.669014 0.684000 0.704600 0.694693 0.684726 0.674721 0.664671
62 > 20mm meters (non-former LUVA): volume between 250,000m3 and (up to and including) 1,000,000m3 £ B T8.12, L62 0.564847 0.577500 0.594900 0.562735 0.532160 0.503110 0.475501
63 > 20mm meters (non-former LUVA): volume greater than 1,000,000m3 £ B T8.12, L63 0.346635 0.354400 0.365100 0.340988 0.318397 0.297196 0.277315
64 20mm meters (former LUVA): volume between 20m3 and up to and including 100m3 £ B T8.12, L64 0.669014 0.684000 0.704600 0.714401 0.724158 0.733835 0.743440
65 20mm meters (former LUVA): volume greater than 100m3 £ B T8.12, L65 0.669014 0.684000 0.704600 0.714401 0.724158 0.733835 0.743440
66 > 20mm meters (former LUVA): volume between 20m3 and (up to and including) 100,000m3 £ B T8.12, L66 0.669014 0.684000 0.704600 0.714401 0.724158 0.733835 0.743440
67 > 20mm meters (former LUVA): volume between 100,000m3 and (up to and including) 250,000m3 £ B T8.12, L67 0.468310 0.478800 0.514400 0.521555 0.528678 0.535743 0.542755
68 > 20mm meters (former LUVA): volume between 250,000m3 and (up to and including) 1,000,000m3 £ B T8.12, L68 0.423636 0.433125 0.458100 0.433332 0.409787 0.387418 0.366157
69 > 20mm meters (former LUVA): volume greater than 1,000,000m3 £ B T8.12, L69 0.419429 0.428824 0.434500 0.405804 0.378920 0.353689 0.330028

Revenue Units Field Type BP Reference 2006-07 2007-08 2008-09 2009-10 2010-11 2011-12 2012-13 2013-14
70 Meter Based Annual Charges £ C T8.12, L70 129,638 126,120 129,911 128,084 126,247 128,687 128,788
71 Capacity volume charges £ C T8.12, L71 598,965 574,010 591,245 582,932 574,568 591,550 595,024
72 Standard volume charges £ C T8.12, L72 5,411,914 5,204,967 5,471,706 5,412,950 5,369,100 5,480,910 5,599,568
73 Total £ C T8.12, L73 5,942,912 5,792,900 6,075,197 6,123,966 6,069,915 6,201,147 6,323,380
Revenue - Using previous year customer base Units Field Type BP Reference 2006-07 2007-08 2008-09 2009-10 2010-11 2011-12 2012-13 2013-14
74 Meter Based Annual Charges £ C T8.10, L70 132,542 129,911 128,084 126,247 124,402 126,770
75 Capacity volume charges £ C T8.10, L71 612,381 591,245 582,932 574,568 566,173 582,739
76 Standard volume charges £ C T8.10, L72 5,533,140 5,489,369 5,406,574 5,352,811 5,313,033 5,430,817
77 Total £ C T8.10, L73 6,076,033 6,092,525 6,001,355 6,053,626 6,003,609 6,140,326

Customer base: Water - wholesale - primary revenue: wholesale water charges (measured) to licensed providers through charges scheme in respect of supply points consuming greater than 1,000Ml/annum
Tariff basket: 3 Revenue group: 6
Tariff multipliers: Licensed provider: tariff meters Units Field Type BP Reference 2006-07 2007-08 2008-09 2009-10 2010-11 2011-12 2012-13 2013-14
1 20mm nr I T8.13, L1 5 5 5 5 5 5 5
2 25mm nr I T8.13, L2 1 1 1 1 1 1 1
3 40mm nr I T8.13, L3 1 1 1 1 1 1 1
4 50mm nr I T8.13, L4 2 2 2 2 2 2 2
5 80mm nr I T8.13, L5 0 0 0 0 0 0 0
6 100mm nr I T8.13, L6 4 4 4 4 4 4 4
7 150mm nr I T8.13, L7 3 3 3 3 3 3 3
8 200mm nr I T8.13, L8 4 4 4 4 4 4 4
9 250mm nr I T8.13, L9 3 3 3 3 3 3 3
10 300mm nr I T8.13, L10 2 2 2 2 2 2 2
11 Total nr C T8.13, L11 25 25 25 25 25 25 25
Tariff multipliers: Licensed provider: allocated tranche Units Field Type BP Reference 2006-07 2007-08 2008-09 2009-10 2010-11 2011-12 2012-13 2013-14
12 20mm m3 I T8.13, L12 0 0 0 0 0 0 0
13 25mm m3 I T8.13, L13 0 0 0 0 0 0 0
14 40mm m3 I T8.13, L14 0 0 0 0 0 0 0
15 50mm m3 I T8.13, L15 0 0 0 0 0 0 0
16 80mm m3 I T8.13, L16 0 0 0 0 0 0 0
17 100mm m3 I T8.13, L17 0 0 0 0 0 0 0
18 150mm m3 I T8.13, L18 260 260 260 260 260 260 260
19 200mm m3 I T8.13, L19 80 80 80 80 80 80 80
20 250mm m3 I T8.13, L20 120 120 120 120 120 120 120
21 300mm m3 I T8.13, L21 40 40 40 40 40 40 40
22 Total m3 C T8.13, L22 500 500 500 500 500 500 500
Tariff multipliers: Licensed provider: capacity volume Units Field Type BP Reference 2006-07 2007-08 2008-09 2009-10 2010-11 2011-12 2012-13 2013-14
23 20mm (non-former LUVA) m3 I T8.13, L23 0 0 0 0 0 0 0
24 20mm (former LUVA) m3 I T8.13, L24 0 0 0 0 0 0 0
25 25mm m3 I T8.13, L25 0 0 0 0 0 0 0
26 40mm m3 I T8.13, L26 0 0 0 0 0 0 0
27 50mm m3 I T8.13, L27 0 0 0 0 0 0 0
28 80mm m3 I T8.13, L28 0 0 0 0 0 0 0
29 100mm m3 I T8.13, L29 0 0 0 0 0 0 0
30 150mm m3 I T8.13, L30 281,640 281,640 281,640 281,640 281,640 281,640 281,640
31 200mm m3 I T8.13, L31 399,920 399,920 399,920 399,920 399,920 399,920 399,920
32 250mm m3 I T8.13, L32 499,980 499,980 499,980 499,980 499,980 499,980 499,980
33 300mm m3 I T8.13, L33 599,960 599,960 599,960 599,960 599,960 599,960 599,960
34 Total m3 C T8.13, L34 1,781,500 1,781,500 1,781,500 1,781,500 1,781,500 1,781,500 1,781,500
Tariff multipliers: Licensed provider: Standard volumes Units Field Type BP Reference 2006-07 2007-08 2008-09 2009-10 2010-11 2011-12 2012-13 2013-14
35 20mm meters (non-former LUVA): volume between 20m3 and up to and including 100m3 m3 I T8.13, L35 0 0 0 0 0 0 0
36 20mm meters (non-former LUVA): volume greater than 100m3 m3 I T8.13, L36 0 0 0 0 0 0 0
37 > 20mm meters (non-former LUVA): volume between 20m3 and (up to and including) 250,000m3 m3 I T8.13, L37 0 0 0 0 0 0 0
38 > 20mm meters (non-former LUVA): volume between 250,000m3 and (up to and including) 1,000,000m3 m3 I T8.13, L38 0 0 0 0 0 0 0
39 > 20mm meters (non-former LUVA): volume greater than 1,000,000m3 m3 I T8.13, L39 0 0 0 0 0 0 0
40 20mm meters (former LUVA): volume between 20m3 and up to and including 100m3 m3 I T8.13, L40 0 0 0 0 0 0 0
41 20mm meters (former LUVA): volume greater than 100m3 m3 I T8.13, L41 0 0 0 0 0 0 0
42 > 20mm meters (former LUVA): volume between 20m3 and (up to and including) 100,000m3 m3 I T8.13, L42 1,199,500 1,199,500 1,199,500 1,199,500 1,199,500 1,199,500 1,199,500
43 > 20mm meters (former LUVA): volume between 100,000m3 and (up to and including) 250,000m3 m3 I T8.13, L43 1,800,000 1,800,000 1,800,000 1,800,000 1,800,000 1,800,000 1,800,000
44 > 20mm meters (former LUVA): volume between 250,000m3 and (up to and including) 1,000,000m3 m3 I T8.13, L44 9,000,000 9,000,000 9,000,000 9,000,000 9,000,000 9,000,000 9,000,000
45 > 20mm meters (former LUVA): volume greater than 1,000,000m3 m3 I T8.13, L45 13,114,740 12,854,211 12,761,389 12,796,813 12,892,508 12,980,189 13,063,606
46 Total m3 C T8.13, L46 25,114,240 24,853,711 24,760,889 24,796,313 24,892,008 24,979,689 25,063,106
Tariffs: Meter based annual charges Units Field Type BP Reference 2006-07 2007-08 2008-09 2009-10 2010-11 2011-12 2012-13 2013-14
47 20mm £ B T8.13, L47 65.53 67.00 69.00 68.03 67.05 66.07 65.09
48 25mm £ B T8.13, L48 126.17 129.00 133.00 131.13 129.25 127.36 125.46
49 40mm £ B T8.13, L49 499.80 511.00 526.00 518.60 511.16 503.69 496.19
50 50mm £ B T8.13, L50 900.82 921.00 949.00 935.66 922.23 908.76 895.22
51 80mm £ B T8.13, L51 1751.76 1791.00 1845.00 1819.06 1792.96 1766.76 1740.45
52 100mm £ B T8.13, L52 1900.43 1943.00 2001.00 1972.86 1944.56 1916.15 1887.61
53 150mm £ B T8.13, L53 4000.39 4090.00 4213.00 4153.76 4094.17 4034.34 3974.25
54 200mm £ B T8.13, L54 30000.00 30672.00 31595.00 31150.74 30703.81 30255.19 29804.54
55 250mm £ B T8.13, L55 80000.00 81792.00 84254.00 83069.30 81877.48 80681.15 79479.41
56 300mm £ B T8.13, L56 99000.39 101218.00 104265.00 102798.92 101324.04 99843.57 98356.40
Tariffs: Capacity Volume Charge Units Field Type BP Reference 2006-07 2007-08 2008-09 2009-10 2010-11 2011-12 2012-13 2013-14
57 20mm (non-former LUVA) premium Capacity volume charge £ B T8.13, L57 0.737823 0.754350 0.764100 0.753356 0.742547 0.731698 0.720799
58 Capacity Volume Charge £ B T8.13, L58 0.491882 0.502900 0.518000 0.510716 0.503389 0.496034 0.488645

Tariff multipliers: Licensed provider: actual capacity volume Units Field Type BP Reference 2006-07 2007-08 2008-09 2009-10 2010-11 2011-12 2012-13 2013-14
59 20mm meters (non-former LUVA): volume between 20m3 and up to and including 100m3 £ B T8.13, L59 1.003521 1.026000 1.039300 1.024686 1.009985 0.995228 0.980404
60 20mm meters (non-former LUVA): volume greater than 100m3 £ B T8.13, L60 0.669014 0.684000 0.704600 0.694693 0.684726 0.674721 0.664671
61 > 20mm meters (non-former LUVA): volume between 20m3 and (up to and including) 250,000m3 £ B T8.13, L61 0.669014 0.684000 0.704600 0.694693 0.684726 0.674721 0.664671
62 > 20mm meters (non-former LUVA): volume between 250,000m3 and (up to and including) 1,000,000m3 £ B T8.13, L62 0.564847 0.577500 0.594900 0.562735 0.532160 0.503110 0.475501
63 > 20mm meters (non-former LUVA): volume greater than 1,000,000m3 £ B T8.13, L63 0.346635 0.354400 0.365100 0.340988 0.318397 0.297196 0.277315
64 20mm meters (former LUVA): volume between 20m3 and up to and including 100m3 £ B T8.13, L64 0.669014 0.684000 0.704600 0.714401 0.724158 0.733835 0.743440
65 20mm meters (former LUVA): volume greater than 100m3 £ B T8.13, L65 0.669014 0.684000 0.704600 0.714401 0.724158 0.733835 0.743440
66 > 20mm meters (former LUVA): volume between 20m3 and (up to and including) 100,000m3 £ B T8.13, L66 0.669014 0.684000 0.704600 0.714401 0.724158 0.733835 0.743440
67 > 20mm meters (former LUVA): volume between 100,000m3 and (up to and including) 250,000m3 £ B T8.13, L67 0.468310 0.478800 0.514400 0.521555 0.528678 0.535743 0.542755
68 > 20mm meters (former LUVA): volume between 250,000m3 and (up to and including) 1,000,000m3 £ B T8.13, L68 0.423636 0.433125 0.458100 0.433332 0.409787 0.387418 0.366157
69 > 20mm meters (former LUVA): volume greater than 1,000,000m3 £ B T8.13, L69 0.419429 0.428824 0.434500 0.405804 0.378920 0.353689 0.330028
Revenue Units Field Type BP Reference 2006-07 2007-08 2008-09 2009-10 2010-11 2011-12 2012-13 2013-14
70 Meter Based Annual Charges £ C T8.13, L70 580,359 593,359 611,217 602,623 593,977 585,298 576,580
71 Capacity volume charges £ C T8.13, L71 876,288 895,916 922,817 909,841 896,787 883,684 870,522
72 Standard volume charges £ C T8.13, L72 10,958,860 11,092,617 11,438,811 10,888,709 10,393,562 9,922,279 9,475,487
73 Total £ C T8.13, L73 12,015,970 12,342,837 12,726,361 12,401,172 11,884,327 11,391,261 10,922,588
Revenue - Using previous year customer base Units Field Type BP Reference 2006-07 2007-08 2008-09 2009-10 2010-11 2011-12 2012-13 2013-14
74 Meter Based Annual Charges £ C T8.10, L70 593,359 611,217 602,623 593,977 585,298 576,580
75 Capacity volume charges £ C T8.10, L71 895,916 922,817 909,841 896,787 883,684 870,522
76 Standard volume charges £ C T8.10, L72 11,204,338 11,479,142 10,874,333 10,357,302 9,891,267 9,447,956
77 Total £ C T8.10, L73 12,285,128 12,765,926 12,151,448 11,848,066 11,360,249 10,895,058

Customer base: Waste water - wholesale - primary revenue: foul sewerage charges (assessed) to licensed providers through charges scheme
Tariff basket: 4 Revenue group: 7
Tariff multipliers: Licensed provider: assessed tariff meters Units Field Type BP Reference 2007-08 2008-09 2009-10 2010-11 2011-12 2012-13 2013-14
1 20mm nr I T8.14, L1 39,540 39,540 39,540 39,540 39,540 39,540 39,540
2 25mm nr I T8.14, L2 473 473 473 473 473 473 473
3 40mm nr I T8.14, L3 73 73 73 73 73 73 73
4 50mm nr I T8.14, L4 39 39 39 39 39 39 39
5 80mm nr I T8.14, L5 1 1 1 1 1 1 1
6 Total nr C T8.14, L6 40,126 40,126 40,126 40,126 40,126 40,126 40,126
Tariff multipliers: Licensed provider: assessed allocated tranche Units Field Type BP Reference 2007-08 2008-09 2009-10 2010-11 2011-12 2012-13 2013-14
7 20mm m3 I T8.14, L7 744,268 744,268 744,268 744,268 744,268 744,268 744,268
8 25mm m3 I T8.14, L8 9,460 9,460 9,460 9,460 9,460 9,460 9,460
9 40mm m3 I T8.14, L9 1,460 1,460 1,460 1,460 1,460 1,460 1,460
10 50mm m3 I T8.14, L10 780 780 780 780 780 780 780
11 80mm m3 I T8.14, L11 20 20 20 20 20 20 20
12 Total m3 C T8.14, L12 755,988 755,988 755,988 755,988 755,988 755,988 755,988
Tariff multipliers: Licensed provider: assessed capacity volume Units Field Type BP Reference 2007-08 2008-09 2009-10 2010-11 2011-12 2012-13 2013-14
13 20mm m3 I T8.14, L13 2,572,460 2,572,460 2,572,460 2,572,460 2,572,460 2,572,460 2,572,460
14 25mm m3 I T8.14, L14 227,040 227,040 227,040 227,040 227,040 227,040 227,040
15 40mm m3 I T8.14, L15 71,540 71,540 71,540 71,540 71,540 71,540 71,540
16 50mm m3 I T8.14, L16 96,720 96,720 96,720 96,720 96,720 96,720 96,720
17 80mm m3 I T8.14, L17 7,480 7,480 7,480 7,480 7,480 7,480 7,480
18 Total m3 C T8.14, L18 2,975,240 2,975,240 2,975,240 2,975,240 2,975,240 2,975,240 2,975,240
Tariff multipliers: Licensed provider: assessed standard volumes Units Field Type BP Reference 2007-08 2008-09 2009-10 2010-11 2011-12 2012-13 2013-14
19 All discharges greater than 20m3 m3 I T8.14, L19 12,391,338 12,391,338 12,391,338 12,391,338 12,391,338 12,391,338 12,391,338
Tariff multipliers: Licensed provider: actual tariff meters Units Field Type BP Reference 2007-08 2008-09 2009-10 2010-11 2011-12 2012-13 2013-14
20 20mm nr I T8.14, L20 39,540 39,540 39,540 39,540 39,540 39,540 39,540
21 25mm nr I T8.14, L21 473 473 473 473 473 473 473
22 40mm nr I T8.14, L22 73 73 73 73 73 73 73
23 50mm nr I T8.14, L23 39 39 39 39 39 39 39
24 80mm nr I T8.14, L24 1 1 1 1 1 1 1
25 Total nr C T8.14, L25 40,126 40,126 40,126 40,126 40,126 40,126 40,126
Tariff multipliers: Licensed provider: actual allocated tranche Units Field Type BP Reference 2007-08 2008-09 2009-10 2010-11 2011-12 2012-13 2013-14
26 20mm m3 I T8.14, L26 513,596 513,596 513,596 513,596 513,596 513,596 513,596
27 25mm m3 I T8.14, L27 6,528 6,528 6,528 6,528 6,528 6,528 6,528
28 40mm m3 I T8.14, L28 1,007 1,007 1,007 1,007 1,007 1,007 1,007
29 50mm m3 I T8.14, L29 538 538 538 538 538 538 538
30 80mm m3 I T8.14, L30 14 14 14 14 14 14 14
31 Total m3 C T8.14, L31 521,683 521,683 521,683 521,683 521,683 521,683 521,683
Tariff multipliers: Licensed provider: actual capacity volume Units Field Type BP Reference 2007-08 2008-09 2009-10 2010-11 2011-12 2012-13 2013-14
32 20mm m3 I T8.14, L32 1,775,172 1,775,172 1,775,172 1,775,172 1,775,172 1,775,172 1,775,172
33 25mm m3 I T8.14, L33 156,673 156,673 156,673 156,673 156,673 156,673 156,673
34 40mm m3 I T8.14, L34 49,367 49,367 49,367 49,367 49,367 49,367 49,367
35 50mm m3 I T8.14, L35 66,743 66,743 66,743 66,743 66,743 66,743 66,743
36 80mm m3 I T8.14, L36 5,162 5,162 5,162 5,162 5,162 5,162 5,162
37 Total m3 C T8.14, L37 2,053,118 2,053,118 2,053,118 2,053,118 2,053,118 2,053,118 2,053,118
Tariff multipliers: Licensed provider: actual capacity volume Units Field Type BP Reference 2007-08 2008-09 2009-10 2010-11 2011-12 2012-13 2013-14
38 All discharges greater than 20m3 m3 I T8.14, L38 8,550,867 8,550,867 8,550,867 8,550,867 8,550,867 8,550,867 8,550,867
Tariff multipliers: exempt supply points Units Field Type BP Reference 2007-08 2008-09 2009-10 2010-11 2011-12 2012-13 2013-14

39 The number of exempt supply points m3 I T8.14, L39 4,339 4,339 4,339 4,339 4,339 4,339 4,339
Tariffs: Meter based annual charges Units Field Type BP Reference 2007-08 2008-09 2009-10 2010-11 2011-12 2012-13 2013-14
40 20mm £ B T8.14, L40 75.31 77.00 79.00 70.75 62.79 55.12 47.84
41 25mm £ B T8.14, L41 149.65 153.00 158.00 141.49 125.58 110.25 95.67
42 40mm £ B T8.14, L42 590.77 604.00 622.00 557.01 494.39 434.02 376.64
43 50mm £ B T8.14, L43 880.28 900.00 927.00 830.15 736.81 646.84 561.33
44 80mm £ B T8.14, L44 2383.61 2437.00 2510.00 2247.76 1995.04 1751.41 1519.89
Tariffs: capacity volume charge Units Field Type BP Reference 2007-08 2008-09 2009-10 2010-11 2011-12 2012-13 2013-14
45 Capacity volume charge £ B T8.14, L45 1.000000 1.022400 1.053200 0.943163 0.837122 0.734895 0.637747
Tariffs: standard volume charge Units Field Type BP Reference 2007-08 2008-09 2009-10 2010-11 2011-12 2012-13 2013-14
46 Standard volume charge £ B T8.14, L46 1.199041 1.225900 1.262800 1.130864 1.003720 0.881149 0.764667
Tariffs: exempt supply points Units Field Type BP Reference 2007-08 2008-09 2009-10 2010-11 2011-12 2012-13 2013-14
47 Charge per supply point £ B T8.14, L47 -15.4 -15.7 -15.9 -14.2 -12.6 -11.1 -9.6
Revenue: Phasing Units Field Type BP Reference 2007-08 2008-09 2009-10 2010-11 2011-12 2012-13 2013-14
48 Assessed revenue proportion % I 100% 100% 67% 33% 0% 0% 0%
49 Actual revenue proportion % C 0% 0% 33% 67% 100% 100% 100%
50 Total % C 100% 100% 100% 100% 100% 100% 100%
Revenue Units Field Type BP Reference 2007-08 2008-09 2009-10 2010-11 2011-12 2012-13 2013-14
51 Assessed meter based annual charges £ C T8.14, L48 3,128,500 3,198,578 2,199,250 970,040 0 0 0
52 Assessed capacity volume charges £ C T8.14, L49 2,975,240 3,041,885 2,099,460 926,024 0 0 0
53 Assessed standard volume charges £ C T8.14, L50 14,857,728 15,190,541 10,484,013 4,624,262 0 0 0
54 Actual meter based annual charges £ C T8.14, L51 0 0 1,083,213 1,969,474 2,609,022 2,290,417 1,987,640
55 Actual capacity volume charges £ C T8.14, L52 0 0 713,573 1,297,404 1,718,710 1,508,827 1,309,371
56 Actual standard volume charges £ C T8.14, L53 0 0 3,563,351 6,478,810 8,582,675 7,534,586 6,538,566
57 Negative revenue in respect of supply points with negative wholesale charges £ C T8.14, L54 -66,774 -68,252 -68,935 -61,733 -54,792 -48,101 -41,742
58 Total £ C T8.14, L55 20,222,294 20,956,859 19,692,522 16,204,281 12,855,615 11,285,729 9,793,834
Revenue - Using previous year customer base Units Field Type BP Reference 2007-08 2008-09 2009-10 2010-11 2011-12 2012-13 2013-14
59 Assessed meter based annual charges £ C T8.14, L48 3,198,578 3,282,463 1,969,474 860,977 0 0
60 Assessed capacity volume charges £ C T8.14, L49 3,041,885 3,133,522 1,880,110 821,911 0 0
61 Assessed standard volume charges £ C T8.14, L50 15,190,541 15,647,781 9,388,653 4,104,352 0 0
62 Actual meter based annual charges £ C T8.14, L51 0 0 970,040 1,748,045 2,290,417 1,987,640
63 Actual capacity volume charges £ C T8.14, L52 0 0 639,020 1,151,536 1,508,827 1,309,371
64 Actual standard volume charges £ C T8.14, L53 0 0 3,191,055 5,750,392 7,534,586 6,538,566
65 Negative revenue in respect of supply points with negative wholesale charges £ C T8.14, L54 -68,252 -68,935 -61,733 -54,792 -48,101 -41,742
66 Total £ C T8.14, L55 20,675,289 21,576,930 17,635,064 14,382,421 11,285,729 9,793,834

Customer base: Waste water - wholesale - primary revenue: foul sewerage charges (measured) to licensed providers through charges scheme
Tariff basket: 4 Revenue group: 7
Tariff multipliers: Licensed Provider: assessed meter sizes Units Field Type BP Reference 2007-08 2008-09 2009-10 2010-11 2011-12 2012-13 2013-14
1 20mm nr I T8.15, L1 51,500 48,707 47,089 47,029 47,802 48,493 49,086
2 25mm nr I T8.15, L2 6,505 6,505 6,505 6,505 6,505 6,505 6,505
3 40mm nr I T8.15, L3 961 961 961 961 961 961 961
4 50mm nr I T8.15, L4 690 690 690 690 690 690 690
5 80mm nr I T8.15, L5 146 146 146 146 146 146 146
6 100mm nr I T8.15, L6 28 28 28 28 28 28 28
7 150mm nr I T8.15, L7 4 4 4 4 4 4 4
8 Total nr C T8.15, L8 59,834 57,041 55,423 55,363 56,136 56,827 57,420
Tariff multipliers: Licensed Provider: assessed allocated tranche Units Field Type BP Reference 2007-08 2008-09 2009-10 2010-11 2011-12 2012-13 2013-14
9 20mm m3 I T8.15, L9 930,755 873,841 841,113 840,051 855,900 870,079 882,270
10 25mm m3 I T8.15, L10 121,300 121,280 121,273 121,276 121,283 121,290 121,296
11 40mm m3 I T8.15, L11 17,968 17,967 17,967 17,967 17,967 17,968 17,968
12 50mm m3 I T8.15, L12 12,640 12,639 12,638 12,639 12,639 12,640 12,640
13 80mm m3 I T8.15, L13 2,568 2,567 2,567 2,567 2,567 2,568 2,568
14 100mm m3 I T8.15, L14 420 420 420 420 420 420 420
15 150mm m3 I T8.15, L15 80 80 80 80 80 80 80
16 Total m3 C T8.15, L16 1,085,732 1,028,795 996,058 995,000 1,010,857 1,025,044 1,037,242
Tariff multipliers: Licensed provider: assessed capacity volume Units Field Type BP Reference 2007-08 2008-09 2009-10 2010-11 2011-12 2012-13 2013-14
17 20mm m3 I T8.15, L17 1,162,865 935,389 804,780 800,415 863,501 920,587 969,085
18 25mm m3 I T8.15, L18 273,551 273,048 273,235 273,270 272,899 273,273 273,418
19 40mm m3 I T8.15, L19 47,325 47,053 47,854 47,442 47,093 47,185 47,272
20 50mm m3 I T8.15, L20 94,759 95,344 95,031 95,150 94,022 94,313 94,589
21 80mm m3 I T8.15, L21 58,117 57,530 57,321 57,401 57,617 57,814 58,002
22 100mm m3 I T8.15, L22 20,253 20,046 19,972 20,000 20,076 20,146 20,213
23 150mm m3 I T8.15, L23 775 767 764 765 768 771 773
24 Total m3 C T8.15, L24 1,657,646 1,429,178 1,298,958 1,294,444 1,355,977 1,414,089 1,463,352
Tariff multipliers: Licensed provider: assessed standard volumes Units Field Type BP Reference 2007-08 2008-09 2009-10 2010-11 2011-12 2012-13 2013-14
25 All discharges greater than 20m3 m3 I T8.15, L25 44,602,682 44,185,668 44,049,543 44,115,045 44,273,275 44,418,596 44,558,151
Tariffs: Meter based annual charges Units Field Type BP Reference 2007-08 2008-09 2009-10 2010-11 2011-12 2012-13 2013-14
26 20mm £ B T8.15, L26 75.3 77.0 79.0 70.7 62.8 55.1 47.8
27 25mm £ B T8.15, L27 149.6 153.0 158.0 141.5 125.6 110.2 95.7
28 40mm £ B T8.15, L28 590.8 604.0 622.0 557.0 494.4 434.0 376.6
29 50mm £ B T8.15, L29 880.3 900.0 927.0 830.1 736.8 646.8 561.3
30 80mm £ B T8.15, L30 2383.6 2437.0 2510.0 2247.8 1995.0 1751.4 1519.9
31 100mm £ B T8.15, L31 4234.2 4329.0 4459.0 3993.1 3544.2 3111.4 2700.1
32 150mm £ B T8.15, L32 13564.2 13868.0 14285.0 12792.5 11354.2 9967.7 8650.0
Tariffs: Capacity Volume Charge Units Field Type BP Reference 2007-08 2008-09 2009-10 2010-11 2011-12 2012-13 2013-14
33 Capacity volume charge £ B T8.15, L33 1.000000 1.022400 1.053200 0.943163 0.837122 0.734895 0.637747
Tariffs: Standard Volumes Units Field Type BP Reference 2007-08 2008-09 2009-10 2010-11 2011-12 2012-13 2013-14
34 Standard volume charge £ B T8.15, L34 1.199041 1.225900 1.262800 1.130864 1.003720 0.881149 0.764667
Revenue Units Field Type BP Reference 2007-08 2008-09 2009-10 2010-11 2011-12 2012-13 2013-14
35 Fixed Charges £ C T8.15, L35 6,548,019 6,479,598 6,533,641 5,846,745 5,237,935 4,636,404 4,051,864
36 Capacity volume charges £ C T8.15, L36 1,657,646 1,461,191 1,368,063 1,220,871 1,135,118 1,039,208 933,249
37 Standard volume charges £ C T8.15, L37 53,480,465 54,167,211 55,625,763 49,888,105 44,437,965 39,139,395 34,072,151
38 Total £ C T8.15, L38 59,701,045 60,927,947 62,320,445 56,955,721 50,811,018 44,815,007 39,057,264
Revenue - Using previous year customer base Units Field Type BP Reference 2007-08 2008-09 2009-10 2010-11 2011-12 2012-13 2013-14
39 Fixed Charges £ C T8.15, L35 6,694,695 6,661,430 5,851,011 5,189,391 4,598,296 4,023,504
40 Capacity volume charges £ C T8.15, L36 1,694,777 1,505,210 1,225,129 1,083,608 996,501 901,832
41 Standard volume charges £ C T8.15, L37 54,678,427 55,797,662 49,814,031 44,279,146 39,011,345 33,965,438
42 Total £ C T8.15, L38 61,038,349 62,748,979 55,809,258 50,552,144 44,606,142 38,890,773

Customer base: Waste water - wholesale - primary revenue: surface water drainage charges to licensed providers through charges scheme
Tariff basket: 4 Revenue group: 8
Tariff multipliers: Licensed providers: supply points Units Field Type BP Reference 2007-08 2008-09 2009-10 2010-11 2011-12 2012-13 2013-14
1 Supply points with area based surface drainage tariffs nr I T8.16, L1 24 24 24 24 24 24 24
2 Supply points with property drainage RV tariff nr I T8.16, L2 111,021 108,228 106,610 106,550 107,323 108,014 108,607
3 Supply points with roads drainage RV tariff nr I T8.16, L3 111,919 109,126 107,508 107,448 108,221 108,912 109,505
Tariff multipliers: Rateable Value Base Units Field Type BP Reference 2007-08 2008-09 2009-10 2010-11 2011-12 2012-13 2013-14
4 RV for property drainage £ I T8.16, L4 2,724,825,038 2,700,181,022 2,685,910,709 2,685,378,703 2,692,198,946 2,698,297,799 2,703,527,994
5 RV for roads drainage tariff £ I T8.16, L5 2,839,308,976 2,814,664,960 2,800,394,647 2,799,862,641 2,806,682,884 2,812,781,737 2,818,011,932
Tariff multipliers: Surface area for area based drainage charge Units Field Type BP Reference 2007-08 2008-09 2009-10 2010-11 2011-12 2012-13 2013-14
6 Area of supply points charged an area based tariff m2 I T8.16, L6 67,183 67,183 67,183 67,183 67,183 67,183 67,183
Tariffs Units Field Type BP Reference 2007-08 2008-09 2009-10 2010-11 2011-12 2012-13 2013-14
7 Charge per £ of RV - property drainage £/£RV B T8.16, L7 0.014510 0.014835 0.021877 0.021864 0.021850 0.021837 0.021823
8 Charge per £ of RV - roads drainage £/£RV B T8.16, L8 0.019340 0.019773 0.014046 0.014037 0.014029 0.014020 0.014011
9 Standard area-based tariff £/m2 B T8.16, L9 0.301640 0.308397 0.317680 0.317484 0.317288 0.317093 0.316897
Revenue Units Field Type BP Reference 2007-08 2008-09 2009-10 2010-11 2011-12 2012-13 2013-14
10 Property drainage - standard RV charges £ C T8.16, L10 39,537,147 40,057,185 58,759,669 58,711,812 58,824,638 58,921,551 58,999,365
11 Roads drainage - standard RV charges £ C T8.16, L11 54,911,636 55,654,370 39,334,343 39,302,626 39,374,075 39,435,307 39,484,277
12 Area charge - standard area-based tariff £ C T8.16, L12 20,265 20,719 21,343 21,330 21,316 21,303 21,290
13 Total Revenue £ C T8.16, L13 91,428,995 93,913,362 96,251,163 98,035,767 98,220,029 98,378,161 98,504,932
Revenue - Using previous year customer base Units Field Type BP Reference 2007-08 2008-09 2009-10 2010-11 2011-12 2012-13 2013-14
14 Property drainage - standard RV charges £ C T8.16, L10 40,422,779 59,071,860 58,723,443 58,675,616 58,788,373 58,885,226
15 Roads drainage - standard RV charges £ C T8.16, L11 56,141,656 39,534,784 39,310,094 39,278,396 39,349,800 39,410,995
16 Area charge - standard area-based tariff £ C T8.16, L12 20,719 21,343 21,330 21,316 21,303 21,290
17 Total Revenue £ C T8.16, L13 93,477,005 96,754,055 96,191,824 97,975,328 98,159,477 98,317,511

Customer base: Waste water - wholesale - primary revenue: trade effluent charges to licensed providers through charges scheme
Tariff basket: 5 Revenue group: 9
Tariff multipliers: Supply points Units Field Type BP Reference 2007-08 2008-09 2009-10 2010-11 2011-12 2012-13 2013-14
1 Number of discharge points charged for trade effluent in accordance with the charges scheme nr I T8.17, L1 837 713 713 1,368 1,368 1,368 1,368
Tariff multipliers: Scottish average sewage strength Units Field Type BP Reference 2007-08 2008-09 2009-10 2010-11 2011-12 2012-13 2013-14
2 Settled chemical oxygen demand (Os) mg/l I T8.17, L2 350 350 350 350 350 350 350
3 Total suspended solids (Ss) mg/l I T8.17, L3 250 250 250 250 250 250 250
Tariff multipliers: Availability charging parameters Units Field Type BP Reference 2007-08 2008-09 2009-10 2010-11 2011-12 2012-13 2013-14
4 Chargeable daily volume m3 I T8.17, L4 45,646 43,178 43,178 87,454 87,454 87,454 87,454
5 Settled biological oxygen demand (sBODl) kg/day I T8.17, L5 13,907 12,865 12,865 36,493 36,493 36,493 36,493
6 Suspended solids (TSSl) kg/day I T8.17, L6 9,907 9,135 9,135 22,026 22,026 22,026 22,026
Tariff multipliers: Annual volumes and strength adjusted volumes Units Field Type BP Reference 2007-08 2008-09 2009-10 2010-11 2011-12 2012-13 2013-14
7 Actual volume discharged (AVD) - site discharge m3 I T8.17, L7 11,665,156 11,180,132 11,255,133 21,170,671 21,222,012 21,214,892 21,211,022
8 Strength adjusted volume for settled COD - site strength adjusted volume m3 I T8.17, L8 25,258,781 23,147,369 23,302,652 53,141,131 53,270,003 53,252,131 53,242,418
9 Strength adjusted volume for suspended solids m3 I T8.17, L9 10,400,607 9,705,468 9,770,576 21,242,665 21,294,180 21,287,036 21,283,153
Tariffs: Availability charge - fixed Units Field Type BP Reference 2007-08 2008-09 2009-10 2010-11 2011-12 2012-13 2013-14
10 Reception charge (Ra) £/m3/day B T8.17, L10 0.073703 0.075354 0.077622 0.080339 0.083151 0.086061 0.089073
11 Volumetric / primary charge (Va) £/m3/day B T8.17, L11 0.049073 0.050172 0.051682 0.053491 0.055363 0.057301 0.059306
12 Biological capacity charge (Ba) £/m3/day B T8.17, L12 0.187255 0.191450 0.197213 0.204115 0.211259 0.218654 0.226306
13 Sludge capacity charge (Sa) £/m3/day B T8.17, L13 0.160504 0.164099 0.169038 0.174954 0.181078 0.187415 0.193975
Tariffs: Operating charge - variable Units Field Type BP Reference 2007-08 2008-09 2009-10 2010-11 2011-12 2012-13 2013-14
14 Reception charge (Ro) £/m3 B T8.17, L14 0.118810 0.121471 0.125127 0.129506 0.134039 0.138731 0.143586
15 Volumetric / primary charge (Vo) £/m3 B T8.17, L15 0.079237 0.081012 0.083450 0.086371 0.089394 0.092523 0.095761
16 Secondary treatment charge (Bo) (for Scottish average strength - sCOD) £/m3 B T8.17, L16 0.105896 0.108268 0.111527 0.115430 0.119471 0.123652 0.127980
17 Sludge treatment charge (So) (for Scottish average strength - SS) £/m3 B T8.17, L17 0.064755 0.066206 0.068199 0.070586 0.073056 0.075613 0.078260
Revenue Units Field Type BP Reference 2007-08 2008-09 2009-10 2010-11 2011-12 2012-13 2013-14
18 Availability Charge £ C T8.17, L18 3,576,451 3,424,404 3,527,473 8,397,259 8,691,164 8,995,354 9,310,192
19 Operating charge £ C T8.17, L19 5,658,544 5,412,466 5,612,780 12,203,803 12,661,568 13,100,326 13,556,364
20 Total Revenue £ C T8.17, L20 8,937,809 8,668,969 8,966,589 20,601,063 21,352,731 22,095,680 22,866,556
Revenue - Using previous year customer base Units Field Type BP Reference 2007-08 2008-09 2009-10 2010-11 2011-12 2012-13 2013-14
21 Availability Charge £ C T8.17, L18 3,656,562 3,527,473 3,650,935 8,691,164 8,995,354 9,310,192
22 Operating charge £ C T8.17, L19 5,785,296 5,575,378 5,809,228 12,630,936 13,104,723 13,558,837
23 Total Revenue £ C T8.17, L20 9,138,015 8,929,897 9,280,420 21,322,100 22,100,077 22,869,029

Customer base: Water - wholesale - primary revenue: wholesale charges for miscellaneous services to licensed providers
Tariff basket: 3 Revenue group: 3
Tariff multipliers Units Field Type BP Reference 2007-08 2008-09 2009-10 2010-11 2011-12 2012-13 2013-14
1 Field Troughs and Drinking Bowls: number of farms Nr I T8.18, L1 1,439 1,439 1,439 1,439 1,439 1,439 1,439
2 Field Troughs and Drinking Bowls: number of crofts and Registered Small Holdings Nr I T8.18, L2 12,175 12,175 12,175 12,175 12,175 12,175 12,175
3 Outside taps: number of farms Nr I T8.18, L3 0 0 0 0 0 0 0
4 Outside taps: number of crofts and Registered Small Holdings Nr I T8.18, L4 0 0 0 0 0 0 0
5 Number of caravans connected to the water service Nr I T8.18, L5 0 0 0 0 0 0 0
Tariffs Units Field Type BP Reference 2007-08 2008-09 2009-10 2010-11 2011-12 2012-13 2013-14
6 Field Troughs and Drinking Bowls: farms £ B T8.18, L6 115.22 120.11 123.73 121.99 120.24 118.48 116.72
7 Field Troughs and Drinking Bowls: crofts and Registered Small Holdings £ B T8.18, L7 75.10 78.28 80.64 79.50 78.36 77.22 76.07
8 Outside taps: farms £ B T8.18, L8 115.22 120.11 123.73 121.99 120.24 118.48 116.72
9 Outside taps: crofts and Registered Small Holdings £ B T8.18, L9 75.10 78.28 80.64 79.50 78.36 77.22 76.07
10 Caravans £ B T8.18, L10 102.35 106.00 110.50 108.95 107.38 105.81 104.24
Revenue Units Field Type BP Reference 2007-08 2008-09 2009-10 2010-11 2011-12 2012-13 2013-14
11 Field Troughs and Drinking Bowls: farms £ C T8.18, L11 165,802 172,838 178,045 175,542 173,023 170,495 167,955
12 Field Troughs and Drinking Bowls: crofts and Registered Small Holdings £ C T8.18, L12 914,343 953,059 981,770 967,966 954,078 940,138 926,134
13 Outside taps: farms £ C T8.18, L13 0 0 0 0 0 0 0
14 Outside taps: crofts and Registered Small Holdings £ C T8.18, L14 0 0 0 0 0 0 0
15 Caravans £ C T8.18, L15 0 0 0 0 0 0 0
16 Total revenue £ C T8.18, L16 1,045,385 1,104,505 1,137,779 1,143,507 1,127,101 1,110,633 1,094,090
Revenue - Using previous year customer base Units Field Type BP Reference 2007-08 2008-09 2009-10 2010-11 2011-12 2012-13 2013-14
17 Field Troughs and Drinking Bowls: farms £ C T8.18, L11 172,838 178,045 175,542 173,023 170,495 167,955
18 Field Troughs and Drinking Bowls: crofts and Registered Small Holdings £ C T8.18, L12 953,059 981,770 967,966 954,078 940,138 926,134
19 Outside taps: farms £ C T8.18, L13 0 0 0 0 0 0
20 Outside taps: crofts and Registered Small Holdings £ C T8.18, L14 0 0 0 0 0 0
21 Caravans £ C T8.18, L15 0 0 0 0 0 0
22 Total revenue £ C T8.18, L16 1,089,665 1,137,779 1,121,780 1,127,101 1,110,633 1,094,090

Customer base: Waste water - wholesale - primary revenue: wholesale charges for miscellaneous services to licensed providers through charges scheme
Tariff basket: 4 Revenue group: 7
Tariff multipliers Units Field Type BP Reference 2007-08 2008-09 2009-10 2010-11 2011-12 2012-13 2013-14
1 Number of caravans connected to the waste water service Nr I T8.19, L1 0 0 0 0 0 0 0
Tariffs Units Field Type BP Reference 2007-08 2008-09 2009-10 2010-11 2011-12 2012-13 2013-14
2 Caravans £ B T8.19, L2 115.70 119.00 124.00 111.04 98.56 86.52 75.09
Revenue Units Field Type BP Reference 2007-08 2008-09 2009-10 2010-11 2011-12 2012-13 2013-14
3 Caravans £ C T8.19, L3 0 0 0 0 0 0 0
Revenue - Using previous year customer base Units Field Type BP Reference 2007-08 2008-09 2009-10 2010-11 2011-12 2012-13 2013-14
4 Caravans £ C T8.19, L3 0 0 0 0 0 0

Customer base: Schedule 3 agreements
Tariff basket: Non-Wholesale Revenue group: 3
Units Field Type BP Reference 2007-08 2008-09 2009-10 2010-11 2011-12 2012-13 2013-14
1
Water - wholesale - primary revenue: wholesale water charges to licensed providers
through Schedule 3 in respect of supply points consuming up to and including
100Ml/annum
£ I T8.22, L58 19,886 33,313 34,331 34,862 35,412 36,059 36,816
Tariff basket: Non-Wholesale Revenue group: 4
Units Field Type BP Reference 2007-08 2008-09 2009-10 2010-11 2011-12 2012-13 2013-14
2
Water - wholesale - primary revenue: wholesale water charges to licensed providers
through Schedule 3 in respect of supply points consuming between 100Ml/annum and
up to and including 250Ml/annum
£ I T8.23, L58 311,029 357,797 369,430 374,731 379,651 385,670 392,885
Tariff basket: Non-Wholesale Revenue group: 5
Units Field Type BP Reference 2007-08 2008-09 2009-10 2010-11 2011-12 2012-13 2013-14
3
Water - wholesale - primary revenue: wholesale water charges to licensed providers
through Schedule 3 in respect of supply points consuming between 250Ml/annum and
up to and including 1,000Ml/annum
£ I T8.24, L58 262,532 292,596 304,204 308,713 312,373 317,002 322,645
Tariff basket: Non-Wholesale Revenue group: 6
Units Field Type BP Reference 2007-08 2008-09 2009-10 2010-11 2011-12 2012-13 2013-14
4
Water - wholesale - primary revenue: wholesale water charges to licensed providers
through Schedule 3 in respect of supply points consuming greater than
1,000Ml/annum
£ I T8.25, L58 4,828,048 5,136,398 5,354,995 5,446,519 5,526,573 5,622,101 5,734,448
Tariff basket: Non-Wholesale Revenue group: 7
Units Field Type BP Reference 2007-08 2008-09 2009-10 2010-11 2011-12 2012-13 2013-14
5Waste Water- wholesale - primary revenue: Foul Sewerage charges to licensed
providers through Schedule 3£ I T8.26, L46 0 0 0 0 0 0 0
Tariff basket: Non-Wholesale Revenue group: 8
Units Field Type BP Reference 2007-08 2008-09 2009-10 2010-11 2011-12 2012-13 2013-14
6Waste Water- wholesale - primary revenue: Surface Drainage charges to licensed
providers through Schedule 3£ I T8.27, L27 204,737 214,910 223,958 227,382 230,111 233,562 237,766
Tariff basket: Non-Wholesale Revenue group: 9
Units Field Type BP Reference 2007-08 2008-09 2009-10 2010-11 2011-12 2012-13 2013-14
7Waste Water - wholesale - primary revenue: Trade effluent charges to licensed
providers through Schedule 3 (excluding former caps)£ I T8.28, L30 6,436,330 6,646,991 6,858,872 7,203,663 7,401,661 7,584,157 7,772,343
8Waste Water- wholesale - primary revenue: Trade effluent charges to licensed
providers through Schedule 3 (former caps)£ I T8.29, L10 7,609,431 8,602,589 9,873,575 285,275 293,116 300,344 307,796

Customer base: Retail - non-primary revenue : retail revenue from charges to household premises through charges scheme
Tariff basket: Non-Retail Revenue group: 10
Water Retail Revenue Units Field Type BP Reference 2007-08 2008-09 2009-10 2010-11 2011-12 2012-13 2013-14
1 Provision of information £ I T8.20, L1 0 0 0 0 0 0 0
2 Standpipes £ I T8.20, L2 600,594 657,000 600,000 597,600 604,771 613,843 624,892
3 Disconnections £ I T8.20, L3 112,000 120,000 125,052 124,552 126,046 127,937 130,240
4 Development Services: Infrastructure Charges £ I T8.20, L4 0 0 0 0 0 0 0
5 Development Services: Building Water £ I T8.20, L5 898,579 1,077,000 1,009,000 958,579 1,400,368 1,421,374 1,446,958
6 Development Services: Connection charges (self-build houses) £ I T8.20, L6 0 0 0 0 0 0 0
7 Development Services: Infrastructure Charges (commercial housebuilding) £ I T8.20, L7 0 0 0 0 0 0 0
8 Meter services for households £ I T8.20, L8 0 0 0 0 0 0 0
9 Fire Hydrants £ I T8.20, L9 158,988 450,000 480,000 478,080 483,817 491,074 499,914
10 Total revenue £ C T8.20, L10 1,770,161 2,304,000 2,214,052 2,158,811 2,615,003 2,654,228 2,702,004
Tariff basket: Non-Retail Revenue group: 10
Wastewater retail revenue Units Field Type BP Reference 2007-08 2008-09 2009-10 2010-11 2011-12 2012-13 2013-14
1 Provision of information £ I T8.21, L1 0 0 0 0 0 0 0
2 Household septic tanks £ I T8.21, L2 1,650,072 1,950,000 2,050,000 2,041,800 2,066,302 2,097,296 2,135,047
3 Business septic tanks £ I T8.21, L3 560,580 544,000 600,000 597,600 604,771 613,843 624,892
4 Disconnections £ I T8.21, L4 0 0 0 0 0 0 0
5 Development Services: Infrastructure Charges £ I T8.21, L5 0 0 0 0 0 0 0
6 Development Services: Building Water £ I T8.21, L6 0 0 0 0 0 0 0
7 Development Services: Connection charges (self-build houses) £ I T8.21, L7 0 0 0 0 0 0 0
8 Development Services: Infrastructure Charges (commercial housebuilding) £ I T8.21, L8 0 0 0 0 0 0 0
9 Meter services for households £ I T8.21, L9 0 0 0 0 0 0 0
10 Total revenue £ C T8.21, L10 2,210,652 2,494,000 2,650,000 2,639,400 2,671,073 2,711,139 2,759,939

Customer base: Wholesale - non-primary revenue : wholesale revenue from charges to Licensed Providers through charges scheme
Tariff basket: Non-Wholesale Revenue group: 11
Water Wholesale revenue Units Field Type BP Reference 2007-08 2008-09 2009-10 2010-11 2011-12 2012-13 2013-14
1 Verification of service provision £ I T8.30, L1 0 52,500 54,710 54,491 55,145 55,972 56,980
2 Water Byelaw Inspection - repeat visit charge £ I T8.30, L2 0 0 0 0 0 0 0
3 Temporary Disconnection £ I T8.30, L3 51,673 68,000 70,863 70,579 71,426 72,498 73,803
4 Permanent Disconnection £ I T8.30, L4 179,991 330,000 150,000 149,400 151,193 153,461 156,223
5 Inspection Charges £ I T8.30, L5 0 25,000 26,053 25,948 26,260 26,654 27,133
6 Reconnection charges £ I T8.30, L6 0 7,000 7,295 7,266 7,353 7,463 7,597
7 Reported supply failures £ I T8.30, L7 0 0 0 0 0 0 0
8 Water supply pipe burst £ I T8.30, L8 0 0 0 0 0 0 0
9 Metering services £ I T8.30, L9 68,516 122,500 127,657 127,147 128,672 130,602 132,953
10 Development services: Infrastructure Charges £ I T8.30, L10 0 0 0 0 0 0 0
11 Development services: Building water £ I T8.30, L11 0 0 0 0 0 0 0
12
Development services: Connection Charges and inspection fees for non-household
development £ I T8.30, L12 0 0 0 0 0 0 0
13 Water for building work: Commercial House Building £ I T8.30, L13 2,001,223 1,258,950 1,179,750 1,258,338 1,838,279 1,865,854 1,899,439
14 Water for building work: Business and Industrial Developments £ I T8.30, L14 1,593,093 1,030,050 965,250 1,029,549 1,504,047 1,526,607 1,554,086
15 Provision of information £ I T8.30, L15 0 0 0 0 0 0 0
16 Any other goods and services £ I T8.30, L16 0 0 0 0 0 0 0
17 Total wholesale non-primary water revenue £ C T8.30, L17 3894496 2894000 2581578 2722719 3782375 3839111 3908215
Tariff basket: Non-Wholesale Revenue group: 11
Waste water wholesale revenue Units Field Type BP Reference 2007-08 2008-09 2009-10 2010-11 2011-12 2012-13 2013-14
18 Verification of service provision £ I T8.31, L1 0 0 50,000 49,800 50,398 51,154 52,074
19 Discontinuation of trade effluent service £ I T8.31, L2 0 0 0 0 0 0 0
20 Re-establishment of trade effluent service £ I T8.31, L3 0 0 0 0 0 0 0
21 Metering services £ I T8.31, L4 0 0 0 0 0 0 0
22 Development services: Infrastructure Charges £ I T8.31, L5 0 0 0 0 0 0 0
23 Development services: Building water £ I T8.31, L6 0 0 0 0 0 0 0
24
Development services: Connection Charges and inspection fees for non-household
development £ I T8.31, L7 0 0 0 0 0 0 0
25 Provision of information £ I T8.31, L8 0 0 0 0 0 0 0
26 Any other goods and services £ I T8.31, L9 0 0 0 0 0 0 0
27 Total wholesale non-primary waste water revenue £ C T8.31, L10 0 0 50000 49800 50398 51154 52074

Customer base: charge cap workings
Revenue per BP table BP Table Basket Rev. Group 2006-07 2007-08 2008-09 2009-10 2010-11 2011-12 2012-13 2013-14
1 Water - retail - primary revenue: retail charges from unmeasured household premises 8.3 1 1 324.22 339.6 354.99 358.7 362.4 366.1 369.9
2 Water - retail - primary revenue: retail charges from measured household premises 8.4 1 1 0.1 0.2 0.2 0.2 0.2 0.2 0.2
3 Waste water - retail - primary revenue: retail charges from unmeasured household premises 8.5 2 2 348.7 364.7 381.4 390.2 399.3 408.5 417.9
4 Waste water - retail - primary revenue: retail foul sewerage charges from measured household premises 8.6 2 2 0.0 0.1 0.1 0.1 0.1 0.1 0.1
5 Waste water - retail - primary revenue: retail property drainage charges from measured household premises 8.7 2 2 0.0 0.0 0.0 0.0 0.0 0.0 0.0
6 Waste water - retail - primary revenue: retail roads drainage charges from measured household premises 8.8 2 2 0.0 0.0 0.0 0.0 0.0 0.0 0.0
7 Water - wholesale - primary revenue: wholesale water charges (assessed) to licensed providers through charges scheme 8.9 3 3 14.3 14.8 13.9 12.7 11.3 11.1 11.0
8 Water - wholesale - primary revenue: wholesale water charges (measured) to licensed providers through charges scheme in respect of supply points consuming up to and including 100Ml/annum 8.10 3 3 65.6 67.1 68.6 69.0 68.3 67.6 66.9
9 Water - wholesale - primary revenue: wholesale water charges (measured) to licensed providers through charges scheme in respect of supply points consuming between 100Ml/annum and up to and including 250Ml/annum 8.11 3 4 7.0 7.4 7.7 7.9 8.0 7.9 7.8
10 Water - wholesale - primary revenue: wholesale water charges (measured) to licensed providers through charges scheme in respect of supply points consuming between 250Ml/annum and up to and including 1,000Ml/annum 8.12 3 5 5.9 5.8 6.1 6.1 6.1 6.2 6.3
11 Water - wholesale - primary revenue: wholesale water charges (measured) to licensed providers through charges scheme in respect of supply points consuming greater than 1,000Ml/annum 8.13 3 6 12.0 12.3 12.7 12.4 11.9 11.4 10.9
12 Waste water - wholesale - primary revenue: foul sewerage charges (assessed) to licensed providers through charges scheme 8.14 4 7 20.2 21.0 19.7 16.2 12.9 11.3 9.8
13 Waste water - wholesale - primary revenue: foul sewerage charges (measured) to licensed providers through charges scheme 8.15 4 7 59.7 60.9 62.3 57.0 50.8 44.8 39.1
14 Waste water - wholesale - primary revenue: surface water drainage charges to licensed providers through charges scheme 8.16 4 8 91.4 93.9 96.3 98.0 98.2 98.4 98.5
15 Waste water - wholesale - primary revenue: trade effluent charges to licensed providers through charges scheme 8.17 5 9 8.9 8.7 9.0 20.6 21.4 22.1 22.9
16 Water - wholesale - primary revenue: wholesale charges for miscellaneous services to licensed providers through charges scheme 8.18 3 3 1.0 1.1 1.1 1.1 1.1 1.1 1.1
17 Waste water - wholesale - primary revenue: wholesale charges for miscellaneous services to licensed providers through charges scheme 8.19 4 7 0.0 0.0 0.0 0.0 0.0 0.0 0.0
18 Schedule 3: Water - wholesale - primary revenue: wholesale water charges to licensed providers through Schedule 3 in respect of supply points consuming up to and including 100Ml/annum 8.22 Non-Wholesale 3 0.0 0.0 0.0 0.0 0.0 0.0 0.0
19 Schedule 3: Water - wholesale - primary revenue: wholesale water charges to licensed providers through Schedule 3 in respect of supply points consuming between 100Ml/annum and up to and including 250Ml/annum 8.23 Non-Wholesale 4 0.3 0.4 0.4 0.4 0.4 0.4 0.4
20 Schedule 3: Water - wholesale - primary revenue: wholesale water charges to licensed providers through Schedule 3 in respect of supply points consuming between 250Ml/annum and up to and including 1,000Ml/annum 8.24 Non-Wholesale 5 0.3 0.3 0.3 0.3 0.3 0.3 0.3
21 Schedule 3: Water - wholesale - primary revenue: wholesale water charges to licensed providers through Schedule 3 in respect of supply points consuming greater than 1,000Ml/annum 8.25 Non-Wholesale 6 4.8 5.1 5.4 5.4 5.5 5.6 5.7
22 Schedule 3: Waste Water- wholesale - primary revenue: Foul Sewerage charges to licensed providers through Schedule 3 8.26 Non-Wholesale 7 0.0 0.0 0.0 0.0 0.0 0.0 0.0
23 Schedule 3: Waste Water- wholesale - primary revenue: Surface Drainage charges to licensed providers through Schedule 3 8.27 Non-Wholesale 8 0.2 0.2 0.2 0.2 0.2 0.2 0.2
24 Schedule 3: Waste Water- wholesale - primary revenue: Trade effluent charges to licensed providers through Schedule 3 (excluding former caps) 8.28 Non-Wholesale 9 6.4 6.6 6.9 7.2 7.4 7.6 7.8
25 Schedule 3: Waste Water- wholesale - primary revenue: Trade effluent charges to licensed providers through Schedule 3 (former caps) 8.29 Non-Wholesale 9 7.6 8.6 9.9 0.3 0.3 0.3 0.3
26 Water: Retail - non-primary revenue : retail revenue from charges to household premises through charges scheme 8.20 Non-Retail 10 1.8 2.3 2.2 2.2 2.6 2.7 2.7
27 Waste water: Retail - non-primary revenue : retail revenue from charges to household premises through charges scheme 8.21 Non-Retail 10 2.2 2.5 2.7 2.6 2.7 2.7 2.8
28 Water: Wholesale - non-primary revenue : wholesale revenue from charges to Licensed Providers through charges scheme 8.30 Non-Wholesale 11 3.9 2.9 2.6 2.7 3.8 3.8 3.9
29 Wastewater: Wholesale - non-primary revenue : wholesale revenue from charges to Licensed Providers through charges scheme 8.31 Non-Wholesale 11 0.0 0.0 0.1 0.0 0.1 0.1 0.1
30 Total 986.7 1,026.4 1,064.5 1,071.7 1,075.1 1,080.5 1,086.5
Revenue - calculated from previous year customer base BP Table Basket Rev. Group 2006-07 2007-08 2008-09 2009-10 2010-11 2011-12 2012-13 2013-14
31 Water - retail - primary revenue: retail charges from unmeasured household premises 8.3 1 1 336.5 352.1 356.2 359.8 363.6 367.3
32 Water - retail - primary revenue: retail charges from measured household premises 8.4 1 1 0.1 0.2 0.2 0.2 0.2 0.2
33 Waste water - retail - primary revenue: retail charges from unmeasured household premises 8.5 2 2 361.6 378.3 387.5 396.5 405.6 415.0
34 Waste water - retail - primary revenue: retail foul sewerage charges from measured household premises 8.6 2 2 0.0 0.1 0.1 0.1 0.1 0.1
35 Waste water - retail - primary revenue: retail property drainage charges from measured household premises 8.7 2 2 0.0 0.0 0.0 0.0 0.0 0.0
36 Waste water - retail - primary revenue: retail roads drainage charges from measured household premises 8.8 2 2 0.0 0.0 0.0 0.0 0.0 0.0
37 Water - wholesale - primary revenue: wholesale water charges (assessed) to licensed providers through charges scheme 8.9 3 3 14.6 15.1 13.7 12.5 11.1 11.0
38 Water - wholesale - primary revenue: wholesale water charges (measured) to licensed providers through charges scheme in respect of supply points consuming up to and including 100Ml/annum 8.10 3 3 67.1 69.0 67.6 68.1 67.3 66.6
39 Water - wholesale - primary revenue: wholesale water charges (measured) to licensed providers through charges scheme in respect of supply points consuming between 100Ml/annum and up to and including 250Ml/annum 8.11 3 4 7.1 7.7 7.7 7.9 8.0 7.9
40 Water - wholesale - primary revenue: wholesale water charges (measured) to licensed providers through charges scheme in respect of supply points consuming between 250Ml/annum and up to and including 1,000Ml/annum 8.12 3 5 6.1 6.1 6.0 6.1 6.0 6.1
41 Water - wholesale - primary revenue: wholesale water charges (measured) to licensed providers through charges scheme in respect of supply points consuming greater than 1,000Ml/annum 8.13 3 6 12.3 12.8 12.2 11.8 11.4 10.9
42 Waste water - wholesale - primary revenue: foul sewerage charges (assessed) to licensed providers through charges scheme 8.14 4 7 20.7 21.6 17.6 14.4 11.3 9.8
43 Waste water - wholesale - primary revenue: foul sewerage charges (measured) to licensed providers through charges scheme 8.15 4 7 61.0 62.7 55.8 50.6 44.6 38.9
44 Waste water - wholesale - primary revenue: surface water drainage charges to licensed providers through charges scheme 8.16 4 8 93.5 96.8 96.2 98.0 98.2 98.3
45 Waste water - wholesale - primary revenue: trade effluent charges to licensed providers through charges scheme 8.17 5 9 9.1 8.9 9.3 21.3 22.1 22.9
46 Water - wholesale - primary revenue: wholesale charges for miscellaneous services to licensed providers through charge scheme 8.18 3 3 1.1 1.1 1.1 1.1 1.1 1.1
47 Waste water - wholesale - primary revenue: wholesale charges for miscellaneous services to licensed providers through charges scheme 8.19 4 7 0.0 0.0 0.0 0.0 0.0 0.0
48 Total 990.8 1,032.4 1,031.2 1,048.3 1,050.6 1,056.1
Charge cap calculations - per tariff basket 2006-07 2007-08 2008-09 2009-10 2010-11 2011-12 2012-13 2013-14
49 Current year revenue - Tariff Basket 1: Water - Retail - Primary (charges to households) 324.3 339.7 355.2 358.8 362.5 366.3 370.1
50 Current year revenue - Tariff Basket 2: Water - Wholesale - Primary (charges to licensed providers) 105.8 108.5 110.1 109.3 106.7 105.3 104.0
51 Current year revenue - Tariff Basket 3: Waste water - Retail - Primary (charges to households) 348.7 364.8 381.5 390.3 399.3 408.6 418.0
52 Current year revenue - Tariff Basket 4: Waste water - Wholesale - Primary - foul and surface drainage (charges to licensed providers) 171.4 175.8 178.3 171.2 161.9 154.5 147.4
53 Current year revenue - Tariff Basket 5: Waste water - Wholesale - Primary - trade effluent (charges to licensed providers) 8.9 8.7 9.0 20.6 21.4 22.1 22.9
54 Current year revenue - Total 959.2 997.5 1,034.0 1,050.2 1,051.8 1,056.8 1,062.3
55 Revenue w/ previous year customer base - Tariff Basket 1: Water - Retail - Primary (charges to households) 336.6 352.2 356.3 360.0 363.7 367.5
56 Revenue w/ previous year customer base - Tariff Basket 2: Water - Wholesale - Primary (charges to licensed providers) 108.2 111.8 108.3 107.5 105.0 103.6
57 Revenue w/ previous year customer base - Tariff Basket 3: Waste water - Retail - Primary (charges to households) 361.7 378.3 387.6 396.6 405.7 415.1
58 Revenue w/ previous year customer base - Tariff Basket 4: Waste water - Wholesale - Primary - foul and surface drainage (charges to licensed providers) 175.2 181.1 169.6 162.9 154.1 147.0
59 Revenue w/ previous year customer base - Tariff Basket 5: Waste water - Wholesale - Primary - trade effluent (charges to licensed providers) 9.1 8.9 9.3 21.3 22.1 22.9
60 Revenue w/ previous year customer base - Total 990.8 1,032.4 1,031.2 1,048.3 1,050.6 1,056.1
61 Charge cap - Tariff Basket 1: Water - Retail - Primary (charges to households) 3.8% 3.7% 0.3% 0.3% 0.3% 0.3%
62 Charge cap - Tariff Basket 2: Water - Wholesale - Primary (charges to licensed providers) 2.3% 3.1% -1.6% -1.6% -1.6% -1.6%
63 Charge cap - Tariff Basket 3: Waste water - Retail - Primary (charges to households) 3.7% 3.7% 1.6% 1.6% 1.6% 1.6%
64 Charge cap - Tariff Basket 4: Waste water - Wholesale - Primary - foul and surface drainage (charges to licensed providers) 2.2% 3.0% -4.8% -4.8% -4.8% -4.8%
65 Charge cap - Tariff Basket 5: Waste water - Wholesale - Primary - trade effluent (charges to licensed providers) 2.2% 3.0% 3.5% 3.5% 3.5% 3.5%
66 WAPI - Tariff basket 3.3% 3.5% -0.3% -0.2% -0.1% -0.1%

Charge cap calculations - per revenue group 2006-07 2007-08 2008-09 2009-10 2010-11 2011-12 2012-13 2013-14
67 Current year revenue - Revenue Group 1: household primary revenue - water 324.3 339.7 355.2 358.8 362.5 366.3 370.1
68 Current year revenue - Revenue Group 2: household primary revenue - waste water 348.7 364.8 381.5 390.3 399.3 408.6 418.0
69 Current year revenue - Revenue Group 3: Licensed provider primary revenue - water - 0-100Ml/a (excludes Schedule 3 revenue) 80.9 83.0 83.6 82.9 80.7 79.9 78.9
70 Current year revenue - Revenue Group 4: Licensed provider primary revenue - water - 100-250Ml/a (excludes Schedule 3 revenue) 7.0 7.4 7.7 7.9 8.0 7.9 7.8
71 Current year revenue - Revenue Group 5: Licensed provider primary revenue - water - 250-1,000Ml/a (excludes Schedule 3 revenue) 5.9 5.8 6.1 6.1 6.1 6.2 6.3
72 Current year revenue - Revenue Group 6: Licensed provider primary revenue - water - 1,000Ml/a plus (excludes Schedule 3 revenue) 12.0 12.3 12.7 12.4 11.9 11.4 10.9
73 Current year revenue - Revenue Group 7: Licensed provider primary revenue - Foul sewerage (excludes Schedule 3 revenue) 79.9 81.9 82.0 73.2 63.7 56.1 48.9
74 Current year revenue - Revenue Group 8: Licensed provider primary revenue - surface drainage (excludes Schedule 3 revenue) 91.4 93.9 96.3 98.0 98.2 98.4 98.5
75 Current year revenue - Revenue Group 9: Licensed provider primary revenue - trade effluent (excludes Schedule 3 revenue) 8.9 8.7 9.0 20.6 21.4 22.1 22.9
76 Current year revenue - Total 959.2 997.5 1,034.0 1,050.2 1,051.8 1,056.8 1,062.3
77 Revenue w/ previous year customer base - Revenue Group 1: household primary revenue - water 336.6 352.2 356.3 360.0 363.7 367.5
78 Revenue w/ previous year customer base - Revenue Group 2: household primary revenue - waste water 361.7 378.3 387.6 396.6 405.7 415.1
79 Revenue w/ previous year customer base - Revenue Group 3: Licensed provider primary revenue - water - 0-100Ml/a (excludes Schedule 3 revenue) 82.7 85.3 82.5 81.7 79.6 78.7
80 Revenue w/ previous year customer base - Revenue Group 4: Licensed provider primary revenue - water - 100-250Ml/a (excludes Schedule 3 revenue) 7.1 7.7 7.7 7.9 8.0 7.9
81 Revenue w/ previous year customer base - Revenue Group 5: Licensed provider primary revenue - water - 250-1,000Ml/a (excludes Schedule 3 revenue) 6.1 6.1 6.0 6.1 6.0 6.1
82 Revenue w/ previous year customer base - Revenue Group 6: Licensed provider primary revenue - water - 1,000Ml/a plus (excludes Schedule 3 revenue) 12.3 12.8 12.2 11.8 11.4 10.9
83 Revenue w/ previous year customer base - Revenue Group 7: Licensed provider primary revenue - Foul sewerage (excludes Schedule 3 revenue) 81.7 84.3 73.4 64.9 55.9 48.7
84 Revenue w/ previous year customer base - Revenue Group 8: Licensed provider primary revenue - surface drainage (excludes Schedule 3 revenue) 93.5 96.8 96.2 98.0 98.2 98.3
85 Revenue w/ previous year customer base - Revenue Group 9: Licensed provider primary revenue - trade effluent (excludes Schedule 3 revenue) 9.1 8.9 9.3 21.3 22.1 22.9
86 Revenue w/ previous year customer base - Total 990.8 1032.4 1031.2 1048.3 1050.6 1056.1
87 Charge cap - Revenue Group 1: household primary revenue - water 3.8% 3.7% 0.3% 0.3% 0.3% 0.3%
88 Charge cap - Revenue Group 2: household primary revenue - waste water 3.7% 3.7% 1.6% 1.6% 1.6% 1.6%
89 Charge cap - Revenue Group 3: Licensed provider primary revenue - water - 0-100Ml/a 2.3% 2.8% -1.4% -1.4% -1.4% -1.5%
90 Charge cap - Revenue Group 4: Licensed provider primary revenue - water - 100-250Ml/a 2.2% 4.0% 0.5% 0.5% 0.5% 0.5%
91 Charge cap - Revenue Group 5: Licensed provider primary revenue - water - 250-1,000Ml/a 2.2% 5.2% -1.2% -1.1% -1.1% -1.0%
92 Charge cap - Revenue Group 6: Licensed provider primary revenue - water - 1,000Ml/a plus 2.2% 3.4% -4.5% -4.5% -4.4% -4.4%
93 2.2% 3.0% -10.4% -11.2% -12.2% -13.2%
94 Charge cap - Revenue Group 8: Licensed provider primary revenue - surface drainage 2.2% 3.0% -0.1% -0.1% -0.1% -0.1%
95 Charge cap - Revenue Group 9: Licensed provider primary revenue - trade effluent 2.2% 3.0% 3.5% 3.5% 3.5% 3.5%
96 WAPI - Revenue groups 3.3% 3.5% -0.3% -0.2% -0.1% -0.1%
97 Ratios approach check 4.73%
Charge cap calculations - Household and Non-household 2006-07 2007-08 2008-09 2009-10 2010-11 2011-12 2012-13 2013-14
98 Current year revenue - Household 673.1 704.5 736.7 749.1 761.9 774.8 788.1
99 Current year revenue - Non-Household 286.1 293.0 297.3 301.1 289.9 281.9 274.2
100 Revenue w/previous year customer base - Household 698.3 730.6 743.9 756.6 769.5 782.6
101 Revenue w/previous year customer base - Non-Household 292.5 301.8 287.3 291.7 281.1 273.5
102 Charge Cap - Household 3.7% 3.7% 1.0% 1.0% 1.0% 1.0%
103 Charge Cap - Non-household 2.2% 3.0% -3.4% -3.1% -3.0% -3.0%