postharvest handling systems for fresh fruits and vegetables
Upload
independentCategory
view
0download
0
Stable Isotope and Trace Element Profiling Combined withClassification Models To Differentiate Geographic GrowingOrigin for Three Fruits: Effects of Subregion and Variety
ANGELA L. PEREZ,†,‡ BRIAN W. SMITH,† AND KIM A. ANDERSON* ,†,‡
Department of Environmental and Molecular Toxicology and Food Safety and EnvironmentalStewardship Program, Oregon State University, Corvallis, Oregon 97331
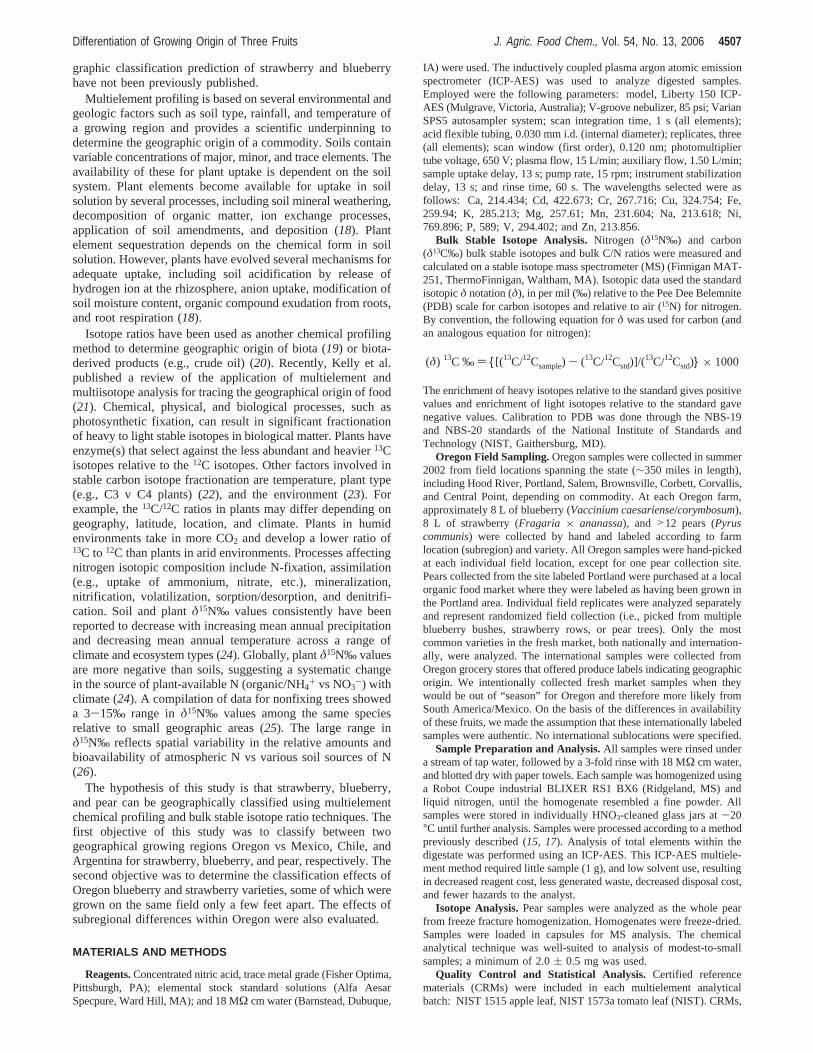
Classifications of geographic growing origin of three fresh fruits combining elemental profiles withvarious modeling approaches were determined. Elemental analysis (Ca, Cd, Cr, Cu, Fe, K, Mg, Mn,Na, Ni, P, V, and Zn) of strawberry, blueberry, and pear samples was performed using inductivelycoupled plasma argon atomic emission spectrometer. Bulk stable carbon and nitrogen isotope analysesin pear were performed using mass spectrometry as an alternative fingerprinting technique. Eachfruit, strawberry (Fragaria × ananassa), blueberry (Vaccinium caesariense/corymbosum), and pear(Pyrus communis), was analyzed from two growing regions: Oregon vs Mexico, Chile, and Argentina,respectively. Principal component analysis and canonical discriminant analysis were used for datavisualization. The data were modeled using linear discriminant function, quadratic discriminant function,neural network, genetic neural network, and hierarchical tree models with successful classificationranging from 70 to 100% depending on commodity and model. Effects of Oregon subregional andvariety classification were investigated with similar success rates.
KEYWORDS: Geographic authenticity; principal component analysis; canonical discriminant analysis;
elemental analysis; stable isotope; strawberry ( Fragaria × ananassa ); blueberry ( Vaccinium caesariense /
corymbosum ; pear ( Pyrus communis ); geographic origin; food labeling; linear discriminant function;
quadratic discriminant function; hierarchal tree; neural network; genetic neural network; modeling
INTRODUCTION
Globalization has shifted the world market for fresh fruit,making availability year round commonplace. Concerns sur-rounding disparate agricultural practices, such as a lack of foodsafety standards and protection of the market share, have ledcommerce officials to prioritize the dissemination of methodsto determine the geographic origin of commodities. For example,on May 23, 2000, the Food and Drug Administration announcedthat a major strawberry production company in Mexico recalledalmost 13000 pounds of fresh strawberries, including the varietyFresh Delight used in this study, due toSalmonellacontamina-tion (1). Food traceability studies are important for three primaryreasons: to improve supply management, to facilitate traceabilityfor food safety and quality, and to differentiate and market foodswith subtle quality attributes (2). Knowledge of geographicgrowing region is not only paramount in upholding account-ability in the food production industries but is also importantto consumers. In February 2001, the Consumer Right-to-KnowAct (S. 280) was passed, requiring country of origin labels onperishable agricultural commodities. This act came about largely
from public concern about potentially harmful substances inconsumables (3), and polls show that a majority of consumersprefer country of origin labels (3, 4). On January 27, 2004,President Bush signed Public Law 108-199, which delays untilSeptember 30, 2006, the implementation of mandatory countryof origin labeling for all covered commodities except wild andfarm-raised fish and shellfish (5).
Previous attempts have been made to elucidate the countryof origin of edible commodities but, until recently, have beenlimited to processed foods. The geolocation of juices (6), drugsof abuse (7, 8), cocoa (8, 9), olive oil (10), nuts and coffee (11,12), and wine (13, 14) has had moderate success. Thesetechniques often require the use of multiple instruments, whichcan become laborious and increase costs. Vitamin or amino acidassays have proven successful in geolocating some commoditiesbut are expensive due to sensitivity to degradation and, therefore,are not always conducive to broad implementation. Alterna-tively, we employ a chemical profiling method that is efficient,nonreagent intensive, and has reliable accuracy to differentiatethe country of origin and geographic growing regions of severalcommodities. Although geographic origin analysis of potatoes,coffee, and pistachios has been performed successfully (15-17), geographical analysis of fresh strawberry, blueberry, andpear has not been previously investigated using this method.Finally, geographic subregional and varietal effects on geo-
* To whom correspondence should be addressed. Tel: 541-737-8501.Fax: 541-737-0497. E-mail: [email protected].
† Department of Environmental and Molecular Toxicology.‡ Food Safety and Environmental Stewardship Program.
4506 J. Agric. Food Chem. 2006, 54, 4506−4516
10.1021/jf0600455 CCC: $33.50 © 2006 American Chemical SocietyPublished on Web 06/07/2006
graphic classification prediction of strawberry and blueberryhave not been previously published.
Multielement profiling is based on several environmental andgeologic factors such as soil type, rainfall, and temperature ofa growing region and provides a scientific underpinning todetermine the geographic origin of a commodity. Soils containvariable concentrations of major, minor, and trace elements. Theavailability of these for plant uptake is dependent on the soilsystem. Plant elements become available for uptake in soilsolution by several processes, including soil mineral weathering,decomposition of organic matter, ion exchange processes,application of soil amendments, and deposition (18). Plantelement sequestration depends on the chemical form in soilsolution. However, plants have evolved several mechanisms foradequate uptake, including soil acidification by release ofhydrogen ion at the rhizosphere, anion uptake, modification ofsoil moisture content, organic compound exudation from roots,and root respiration (18).
Isotope ratios have been used as another chemical profilingmethod to determine geographic origin of biota (19) or biota-derived products (e.g., crude oil) (20). Recently, Kelly et al.published a review of the application of multielement andmultiisotope analysis for tracing the geographical origin of food(21). Chemical, physical, and biological processes, such asphotosynthetic fixation, can result in significant fractionationof heavy to light stable isotopes in biological matter. Plants haveenzyme(s) that select against the less abundant and heavier13Cisotopes relative to the12C isotopes. Other factors involved instable carbon isotope fractionation are temperature, plant type(e.g., C3 v C4 plants) (22), and the environment (23). Forexample, the13C/12C ratios in plants may differ depending ongeography, latitude, location, and climate. Plants in humidenvironments take in more CO2 and develop a lower ratio of13C to 12C than plants in arid environments. Processes affectingnitrogen isotopic composition include N-fixation, assimilation(e.g., uptake of ammonium, nitrate, etc.), mineralization,nitrification, volatilization, sorption/desorption, and denitrifi-cation. Soil and plantδ15N‰ values consistently have beenreported to decrease with increasing mean annual precipitationand decreasing mean annual temperature across a range ofclimate and ecosystem types (24). Globally, plantδ15N‰ valuesare more negative than soils, suggesting a systematic changein the source of plant-available N (organic/NH4
+ vs NO3-) with
climate (24). A compilation of data for nonfixing trees showeda 3-15‰ range inδ15N‰ values among the same speciesrelative to small geographic areas (25). The large range inδ15N‰ reflects spatial variability in the relative amounts andbioavailability of atmospheric N vs various soil sources of N(26).
The hypothesis of this study is that strawberry, blueberry,and pear can be geographically classified using multielementchemical profiling and bulk stable isotope ratio techniques. Thefirst objective of this study was to classify between twogeographical growing regions Oregon vs Mexico, Chile, andArgentina for strawberry, blueberry, and pear, respectively. Thesecond objective was to determine the classification effects ofOregon blueberry and strawberry varieties, some of which weregrown on the same field only a few feet apart. The effects ofsubregional differences within Oregon were also evaluated.
MATERIALS AND METHODS
Reagents.Concentrated nitric acid, trace metal grade (Fisher Optima,Pittsburgh, PA); elemental stock standard solutions (Alfa AesarSpecpure, Ward Hill, MA); and 18 MΩ cm water (Barnstead, Dubuque,
IA) were used. The inductively coupled plasma argon atomic emissionspectrometer (ICP-AES) was used to analyze digested samples.Employed were the following parameters: model, Liberty 150 ICP-AES (Mulgrave, Victoria, Australia); V-groove nebulizer, 85 psi; VarianSPS5 autosampler system; scan integration time, 1 s (all elements);acid flexible tubing, 0.030 mm i.d. (internal diameter); replicates, three(all elements); scan window (first order), 0.120 nm; photomultipliertube voltage, 650 V; plasma flow, 15 L/min; auxiliary flow, 1.50 L/min;sample uptake delay, 13 s; pump rate, 15 rpm; instrument stabilizationdelay, 13 s; and rinse time, 60 s. The wavelengths selected were asfollows: Ca, 214.434; Cd, 422.673; Cr, 267.716; Cu, 324.754; Fe,259.94; K, 285.213; Mg, 257.61; Mn, 231.604; Na, 213.618; Ni,769.896; P, 589; V, 294.402; and Zn, 213.856.
Bulk Stable Isotope Analysis. Nitrogen (δ15N‰) and carbon(δ13C‰) bulk stable isotopes and bulk C/N ratios were measured andcalculated on a stable isotope mass spectrometer (MS) (Finnigan MAT-251, ThermoFinnigan, Waltham, MA). Isotopic data used the standardisotopicδ notation (δ), in per mil (‰) relative to the Pee Dee Belemnite(PDB) scale for carbon isotopes and relative to air (15N) for nitrogen.By convention, the following equation forδ was used for carbon (andan analogous equation for nitrogen):
The enrichment of heavy isotopes relative to the standard gives positivevalues and enrichment of light isotopes relative to the standard gavenegative values. Calibration to PDB was done through the NBS-19and NBS-20 standards of the National Institute of Standards andTechnology (NIST, Gaithersburg, MD).
Oregon Field Sampling.Oregon samples were collected in summer2002 from field locations spanning the state (∼350 miles in length),including Hood River, Portland, Salem, Brownsville, Corbett, Corvallis,and Central Point, depending on commodity. At each Oregon farm,approximately 8 L of blueberry (Vaccinium caesariense/corymbosum),8 L of strawberry (Fragaria × ananassa), and >12 pears (Pyruscommunis) were collected by hand and labeled according to farmlocation (subregion) and variety. All Oregon samples were hand-pickedat each individual field location, except for one pear collection site.Pears collected from the site labeled Portland were purchased at a localorganic food market where they were labeled as having been grown inthe Portland area. Individual field replicates were analyzed separatelyand represent randomized field collection (i.e., picked from multipleblueberry bushes, strawberry rows, or pear trees). Only the mostcommon varieties in the fresh market, both nationally and internation-ally, were analyzed. The international samples were collected fromOregon grocery stores that offered produce labels indicating geographicorigin. We intentionally collected fresh market samples when theywould be out of “season” for Oregon and therefore more likely fromSouth America/Mexico. On the basis of the differences in availabilityof these fruits, we made the assumption that these internationally labeledsamples were authentic. No international sublocations were specified.
Sample Preparation and Analysis.All samples were rinsed undera stream of tap water, followed by a 3-fold rinse with 18 MΩ cm water,and blotted dry with paper towels. Each sample was homogenized usinga Robot Coupe industrial BLIXER RS1 BX6 (Ridgeland, MS) andliquid nitrogen, until the homogenate resembled a fine powder. Allsamples were stored in individually HNO3-cleaned glass jars at-20°C until further analysis. Samples were processed according to a methodpreviously described (15, 17). Analysis of total elements within thedigestate was performed using an ICP-AES. This ICP-AES multiele-ment method required little sample (1 g), and low solvent use, resultingin decreased reagent cost, less generated waste, decreased disposal cost,and fewer hazards to the analyst.
Isotope Analysis.Pear samples were analyzed as the whole pearfrom freeze fracture homogenization. Homogenates were freeze-dried.Samples were loaded in capsules for MS analysis. The chemicalanalytical technique was well-suited to analysis of modest-to-smallsamples; a minimum of 2.0( 0.5 mg was used.
Quality Control and Statistical Analysis. Certified referencematerials (CRMs) were included in each multielement analyticalbatch: NIST 1515 apple leaf, NIST 1573a tomato leaf (NIST). CRMs,
(δ) 13C ‰ ) [(13C/12Csample) - (13C/12Cstd)]/(13C/12Cstd) × 1000
Differentiation of Growing Origin of Three Fruits J. Agric. Food Chem., Vol. 54, No. 13, 2006 4507
4508 J. Agric. Food Chem., Vol. 54, No. 13, 2006 Perez et al.
check standards, and blanks accounted for at least 25% of eachanalytical batch. A minimum of three standards were used percalibration curve withR2 values> 0.99. Detection limits were calculatedas three standard deviations based on seven blanks. Average recoveriesfor each element were as follows: Ca, 108%; Cu, 120%; Fe, 98%; K,96%; Mg, 125%; Mn, 106%; Na, 99%; P, 120%; and Zn, 116%. Checkstandard recoveries averaged 101%.
Each isotope sample was analyzed in triplicate. NIST 8542 sucroseANU-sucrose and NIST 8548 IAEA-N2-ammonium sulfate sampleswere analyzed with each batch. External precision estimates ofδ15N‰andδ13C‰, based on replicate analysis of acetanilide and oxalic acidstandards, were(0.12 and(0.11‰, respectively.
Several statistical analysis methods were applied to the data. Multiplecomparisons analysis of variance (ANOVA) were used in subregionaland variety analysis by Sigma Stat for Windows, Version 2.0 (Systat,Point Richmond, CA). Graphical presentations andt-tests comparinggeographical location used SigmaPlot 2003 for Windows, Version 8.0(Systat). Significance was determined using a two-sampledt-test inSigma Plot. Canonical discriminant analysis (CDA), linear discriminantfunction, and quadratic discriminant function analyses were appliedutilizing SAS version 9.0 (SAS Institute Inc., Cary, NC), and neuralnetwork and genetic neural network analysis were applied usingNeuroShell Classifer (Ward Systems Group, Inc, V2.2, Frederick, MD).Hierarchal tree model and principal component analyses (PCAs) wereapplied using S-Plus (Lucent Technologies, Inc.). The modelingapproach was previously described (16). The tree models were basedon a minimum deviation) 0.01. The models were tested with up tothree different approaches, resubstitution, cross-validation (i.e., leave-out-one), and test set, previously described in ref15. From eachgeographic group, five samples were randomly selected (from 40) toform a test set of 10 samples (two geographic regions) and removedfrom the training set. The remaining samples (nominally 35 from eachgroup, a total of 70) were used as the training set for the classificationmodels. Once trained, each model was then used to classify the 10
“unknown” samples in the test set. Variety testing was preformed onlywhen we had two varieties at the same site so as not to have theconfounding variation created by different geographic sites. Trainingand test sets were created that were variety specific; test sets weretypically n ) 8. For example, a training set was created without aspecific variety and the test set contained only the variety withheldfrom the training set. Classification performances for each classificationmodel for each commodity are discussed below.
RESULTS AND DISCUSSION
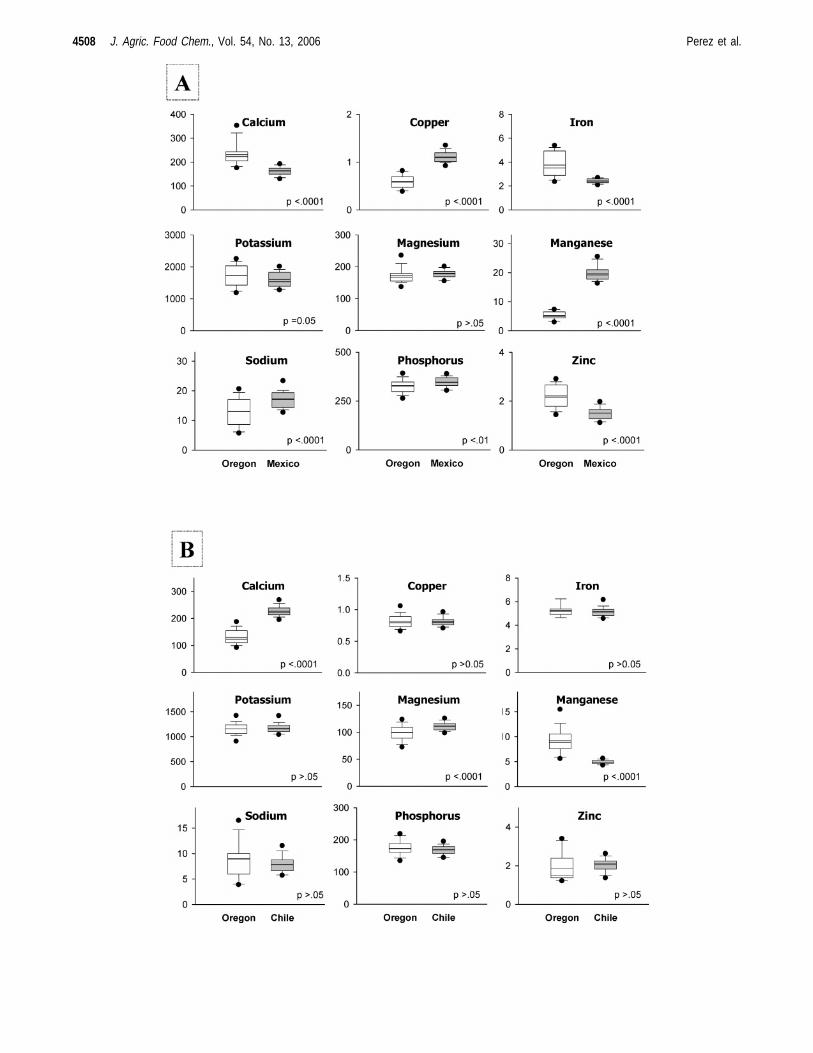
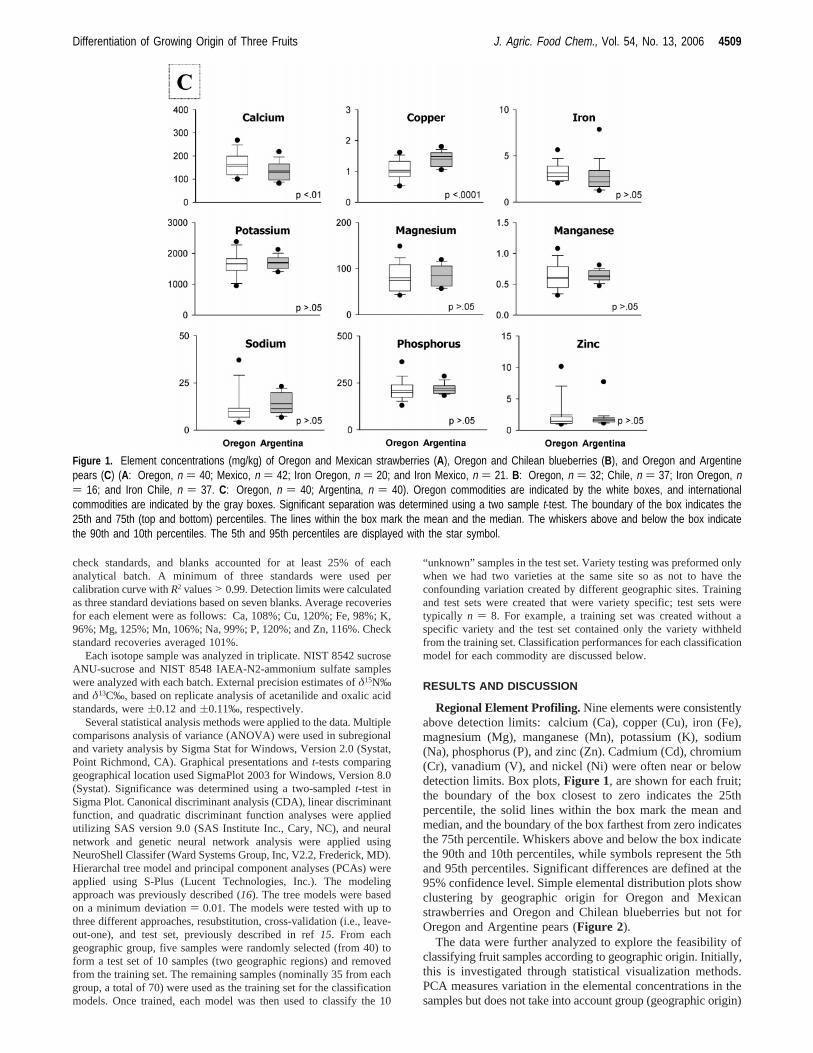
Regional Element Profiling.Nine elements were consistentlyabove detection limits: calcium (Ca), copper (Cu), iron (Fe),magnesium (Mg), manganese (Mn), potassium (K), sodium(Na), phosphorus (P), and zinc (Zn). Cadmium (Cd), chromium(Cr), vanadium (V), and nickel (Ni) were often near or belowdetection limits. Box plots,Figure 1, are shown for each fruit;the boundary of the box closest to zero indicates the 25thpercentile, the solid lines within the box mark the mean andmedian, and the boundary of the box farthest from zero indicatesthe 75th percentile. Whiskers above and below the box indicatethe 90th and 10th percentiles, while symbols represent the 5thand 95th percentiles. Significant differences are defined at the95% confidence level. Simple elemental distribution plots showclustering by geographic origin for Oregon and Mexicanstrawberries and Oregon and Chilean blueberries but not forOregon and Argentine pears (Figure 2).
The data were further analyzed to explore the feasibility ofclassifying fruit samples according to geographic origin. Initially,this is investigated through statistical visualization methods.PCA measures variation in the elemental concentrations in thesamples but does not take into account group (geographic origin)
Figure 1. Element concentrations (mg/kg) of Oregon and Mexican strawberries (A), Oregon and Chilean blueberries (B), and Oregon and Argentinepears (C) (A: Oregon, n ) 40; Mexico, n ) 42; Iron Oregon, n ) 20; and Iron Mexico, n ) 21. B: Oregon, n ) 32; Chile, n ) 37; Iron Oregon, n) 16; and Iron Chile, n ) 37. C: Oregon, n ) 40; Argentina, n ) 40). Oregon commodities are indicated by the white boxes, and internationalcommodities are indicated by the gray boxes. Significant separation was determined using a two sample t-test. The boundary of the box indicates the25th and 75th (top and bottom) percentiles. The lines within the box mark the mean and the median. The whiskers above and below the box indicatethe 90th and 10th percentiles. The 5th and 95th percentiles are displayed with the star symbol.
Differentiation of Growing Origin of Three Fruits J. Agric. Food Chem., Vol. 54, No. 13, 2006 4509
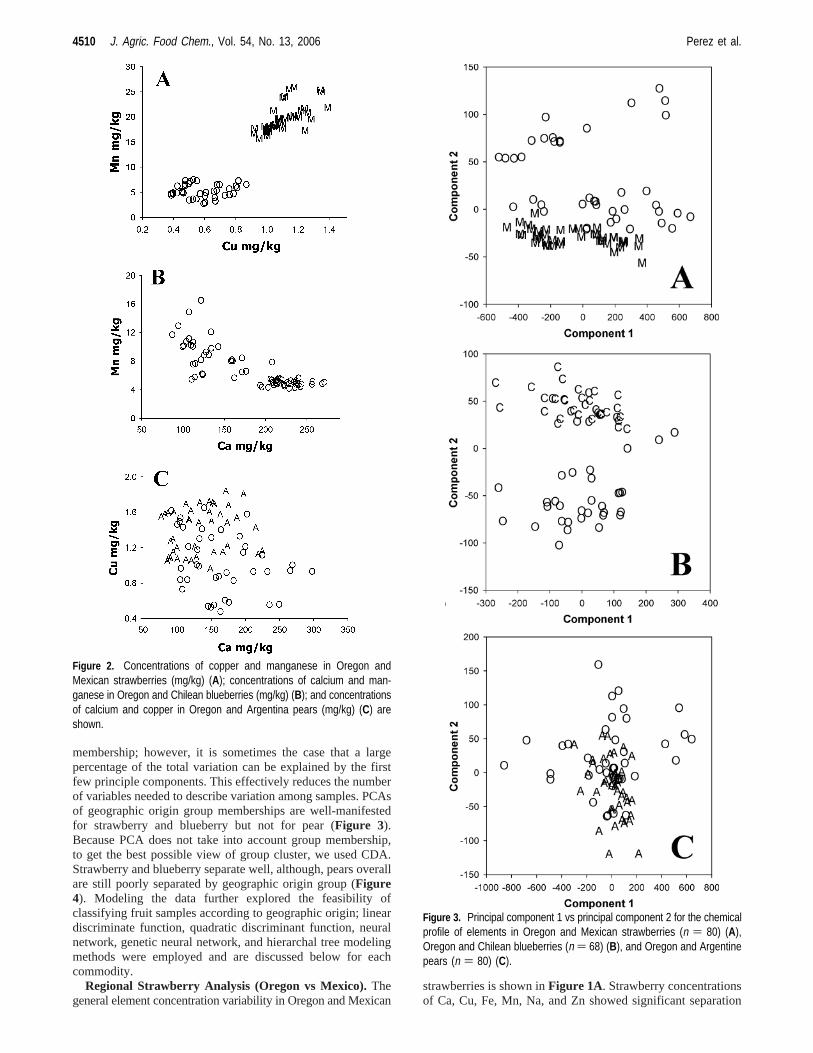
membership; however, it is sometimes the case that a largepercentage of the total variation can be explained by the firstfew principle components. This effectively reduces the numberof variables needed to describe variation among samples. PCAsof geographic origin group memberships are well-manifestedfor strawberry and blueberry but not for pear (Figure 3).Because PCA does not take into account group membership,to get the best possible view of group cluster, we used CDA.Strawberry and blueberry separate well, although, pears overallare still poorly separated by geographic origin group (Figure4). Modeling the data further explored the feasibility ofclassifying fruit samples according to geographic origin; lineardiscriminate function, quadratic discriminant function, neuralnetwork, genetic neural network, and hierarchal tree modelingmethods were employed and are discussed below for eachcommodity.
Regional Strawberry Analysis (Oregon vs Mexico).Thegeneral element concentration variability in Oregon and Mexican
strawberries is shown inFigure 1A. Strawberry concentrationsof Ca, Cu, Fe, Mn, Na, and Zn showed significant separation
Figure 2. Concentrations of copper and manganese in Oregon andMexican strawberries (mg/kg) (A); concentrations of calcium and man-ganese in Oregon and Chilean blueberries (mg/kg) (B); and concentrationsof calcium and copper in Oregon and Argentina pears (mg/kg) (C) areshown.
Figure 3. Principal component 1 vs principal component 2 for the chemicalprofile of elements in Oregon and Mexican strawberries (n ) 80) (A),Oregon and Chilean blueberries (n ) 68) (B), and Oregon and Argentinepears (n ) 80) (C).
4510 J. Agric. Food Chem., Vol. 54, No. 13, 2006 Perez et al.
(p < 0.0001), as did P and K concentrations (p < 0.01 and0.05, respectively, 78 d.f.). No significant difference for Mgconcentration was observed between Oregon and Mexicanstrawberries. Combinations of Ca, Mn, K, Cu, Fe, or Zn couldbe used to visually depict geographic origin group clustering;for example, seeFigure 2A. On average, Mexican strawberriescontained 380% the concentration of Mn and 190% the Cuconcentration of Oregon strawberries, while Oregon strawberriescontained more Ca (29%), Fe (35%), and Zn (32%) thanMexican strawberries. Potential sources of increased Mn andCu in Mexican strawberry might include atmospheric deposition,irrigation water, fertilizers, and soil amendments, such asbiosolids (27). PCA generates principle components that arelinear combinations of the original variables. The first principle
component describes the maximum possible variation that canbe projected onto one dimension. PCA on strawberry showedthat the first three components accounted for 99.7% of the totalvariability (95, 98, and 99.7%, respectively). PCA and CDAshowed strong visual clustering with Mexican and Oregonstrawberries (Figures 3A and4A).
Strawberry Modeling. The results of linear discriminatefunction, quadratic discriminant function, neural network,genetic neural network, and hierarchal tree modeling methodsare shown inTable 1. Multiple approaches to evaluate eachmodel included resubstitution, cross-validation, and test sets.The linear discriminant function, the quadratic discriminantfunction, the neural network, and the genetic neural networkmodels all had a 100% success classification rate for strawber-ries. The trace elements P, Cu, Zn, and Mg (Figure 5A) werefound to have the most relative importance to the genetic neuralnetwork model. The hierarchal tree model also had 100%success rates. Cu concentrations less than 0.87 mg/kg wereclassified as Mexican (two terminal nodes) (Figure 6).
Regional Blueberry Analysis (Oregon vs Chile). Figure1B depicts variable element concentrations in blueberry samplesfrom Oregon and Chile. Ca, Mg, and Mn were stronglyseparated (p , 0.0001, 66 d.f.) using a two-samplet-test, whileCu, Fe, P, K, Na, and Zn concentrations showed no significantdifferences between regions (p > 0.05). Combinations of Ca,Mg, K, Cu, Na, Fe, or P could be used to visually depictgeographic origin group clustering; for example, seeFigure 2B.In general, Chilean blueberry had 50% the concentration of Mnand 180% the Ca concentration of Oregon blueberries. One U.S.Department of Agriculture blueberry collection site in Corvallis,Oregon, was excluded (n ) 8) due to the historical land use atthe agricultural experiment station and because no retailcommodities are grown for human consumption at this site.Interestingly, blueberries from this experimental site hadelevated levels of Cu and Mn (152 and 678%, respectively)relative to the average concentrations at the remaining Oregonsites. Although high bush blueberries are not fertilizer intensive,they grow readily in acidic, moist soils. This optimum growingcondition renders them susceptible to increased nonnutritivemetal uptake. It is suggested that blueberries could be used asa bioindicator species to assess metal contamination in soils(28, 29). The U.S. Department of Agriculture is also exploringthe use of coal ash and biosolid compost as a soil amendmentin large scale blueberry production operations globally (30).High metal concentrations in blueberry marked this Corvallissite as statistically independent from all others from typicalagronomical practices. These data points were removed fromfurther statistical analysis.
Using PCA, 99.9% of the total variability could be explainedby the first three principal components (75, 96, and 99.9%respectively). Strong visual regional clustering was observedfor Chilean and Oregon blueberries using PCA (Figure 3B)and CDA (Figure 4B).
Blueberry Modeling. The results of linear discriminantfunction, quadratic discriminant function, neural network,genetic neural network, and hierarchal tree modeling methodsare shown inTable 1. The linear discriminant function, thequadratic discriminant function, the neural network, and thegenetic neural network models all had a 100% success clas-sification rate for blueberry. The trace elements Cu, Mg, andZn, Figure 5B, were found to have the most relative importanceto the genetic neural network model. The hierarchal tree modelhad 100% success rates. Mn concentrations<6.65 mg/kg wereclassified as Chilean (two terminal nodes) (Figure 6).
Figure 4. CDA frequency chart using the canonical variable. All 10available dimensions are utilized in this simplified visual representationof the separation between Oregon and Mexican strawberries (n ) 80)(A), Oregon and Chilean blueberries (n ) 68) (B), and Oregon andArgentine pears (n ) 80) (C).
Differentiation of Growing Origin of Three Fruits J. Agric. Food Chem., Vol. 54, No. 13, 2006 4511
Regional Pear Analysis (Oregon vs Argentina).Elementconcentration variation in Oregon and Argentine pears can beobserved inFigure 1C. Two-samplet-tests suggest that Cuconcentration showed significant separation (p < 0.0001, 78d.f.) as did Ca (p < 0.01), while all other element concentrations
were not significantly different between Oregon and Argentinepears (p > 0.05). Combinations of trace elements could not befound that provided good visually depicted geographic origingroup clustering (Figure 2C). PCA results showed that the firstthree components explained 99.9% of the variability (93, 98,and 99.9%, respectively); however, no visual clustering ofOregon and Argentine pears was observed (Figure 3C). TheCDA frequency chart for Oregon and Argentina pears alsoshows a great deal of overlap (Figure 4C).
Pear Modeling. The results of linear discriminate function,quadratic discriminant function, neural network, genetic neuralnetwork, and hierarchal tree modeling methods. Multipleapproaches to evaluate each model included resubstitution, cross-validation, and test sets as shown inTable 1. Overall, the linear
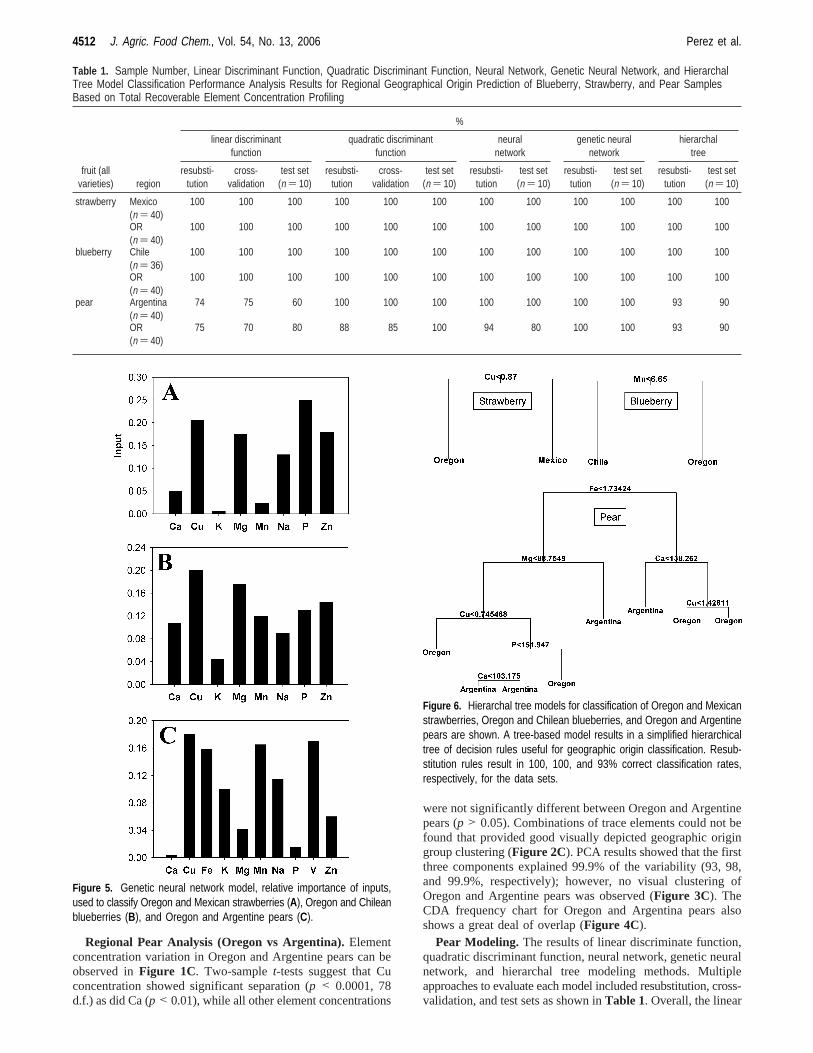
Table 1. Sample Number, Linear Discriminant Function, Quadratic Discriminant Function, Neural Network, Genetic Neural Network, and HierarchalTree Model Classification Performance Analysis Results for Regional Geographical Origin Prediction of Blueberry, Strawberry, and Pear SamplesBased on Total Recoverable Element Concentration Profiling
%
linear discriminantfunction
quadratic discriminantfunction
neuralnetwork
genetic neuralnetwork
hierarchaltree
fruit (allvarieties) region
resubsti-tution
cross-validation
test set(n ) 10)
resubsti-tution
cross-validation
test set(n ) 10)
resubsti-tution
test set(n ) 10)
resubsti-tution
test set(n ) 10)
resubsti-tution
test set(n ) 10)
strawberry Mexico(n ) 40)
100 100 100 100 100 100 100 100 100 100 100 100
OR(n ) 40)
100 100 100 100 100 100 100 100 100 100 100 100
blueberry Chile(n ) 36)
100 100 100 100 100 100 100 100 100 100 100 100
OR(n ) 40)
100 100 100 100 100 100 100 100 100 100 100 100
pear Argentina(n ) 40)
74 75 60 100 100 100 100 100 100 100 93 90
OR(n ) 40)
75 70 80 88 85 100 94 80 100 100 93 90
Figure 5. Genetic neural network model, relative importance of inputs,used to classify Oregon and Mexican strawberries (A), Oregon and Chileanblueberries (B), and Oregon and Argentine pears (C).
Figure 6. Hierarchal tree models for classification of Oregon and Mexicanstrawberries, Oregon and Chilean blueberries, and Oregon and Argentinepears are shown. A tree-based model results in a simplified hierarchicaltree of decision rules useful for geographic origin classification. Resub-stitution rules result in 100, 100, and 93% correct classification rates,respectively, for the data sets.
4512 J. Agric. Food Chem., Vol. 54, No. 13, 2006 Perez et al.
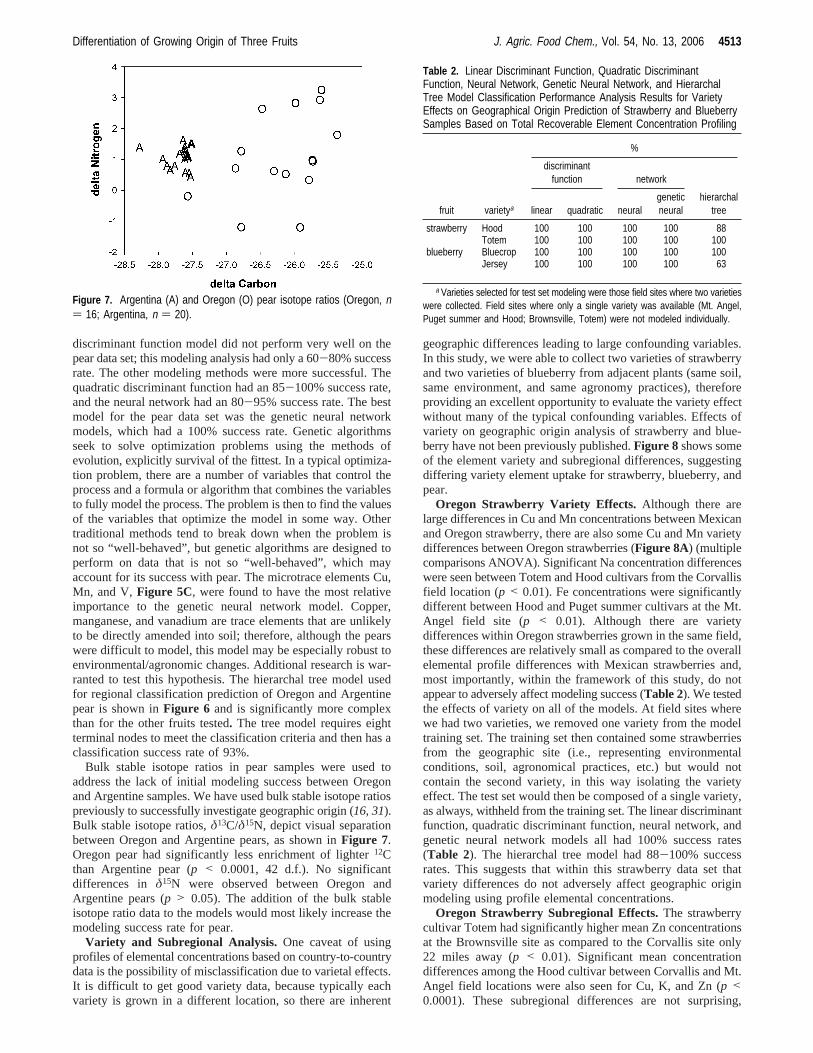
discriminant function model did not perform very well on thepear data set; this modeling analysis had only a 60-80% successrate. The other modeling methods were more successful. Thequadratic discriminant function had an 85-100% success rate,and the neural network had an 80-95% success rate. The bestmodel for the pear data set was the genetic neural networkmodels, which had a 100% success rate. Genetic algorithmsseek to solve optimization problems using the methods ofevolution, explicitly survival of the fittest. In a typical optimiza-tion problem, there are a number of variables that control theprocess and a formula or algorithm that combines the variablesto fully model the process. The problem is then to find the valuesof the variables that optimize the model in some way. Othertraditional methods tend to break down when the problem isnot so “well-behaved”, but genetic algorithms are designed toperform on data that is not so “well-behaved”, which mayaccount for its success with pear. The microtrace elements Cu,Mn, and V,Figure 5C, were found to have the most relativeimportance to the genetic neural network model. Copper,manganese, and vanadium are trace elements that are unlikelyto be directly amended into soil; therefore, although the pearswere difficult to model, this model may be especially robust toenvironmental/agronomic changes. Additional research is war-ranted to test this hypothesis. The hierarchal tree model usedfor regional classification prediction of Oregon and Argentinepear is shown inFigure 6 and is significantly more complexthan for the other fruits tested. The tree model requires eightterminal nodes to meet the classification criteria and then has aclassification success rate of 93%.
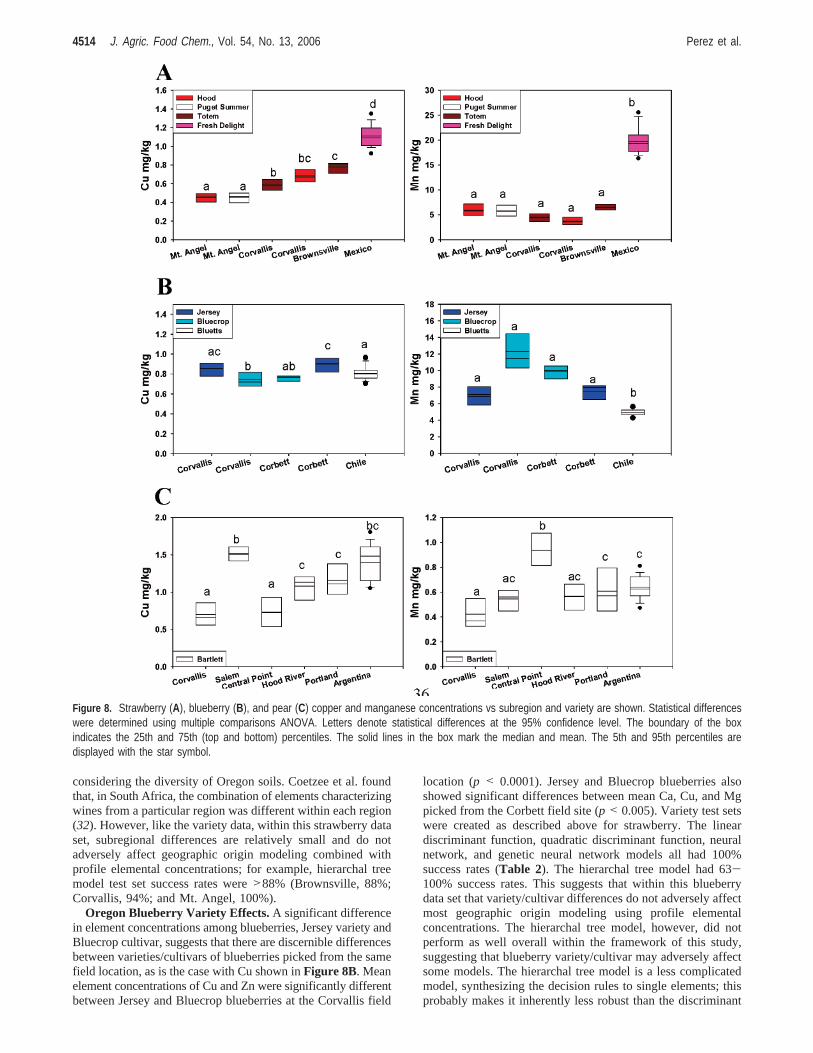
Bulk stable isotope ratios in pear samples were used toaddress the lack of initial modeling success between Oregonand Argentine samples. We have used bulk stable isotope ratiospreviously to successfully investigate geographic origin (16, 31).Bulk stable isotope ratios,δ13C/δ15N, depict visual separationbetween Oregon and Argentine pears, as shown inFigure 7.Oregon pear had significantly less enrichment of lighter12Cthan Argentine pear (p < 0.0001, 42 d.f.). No significantdifferences in δ15N were observed between Oregon andArgentine pears (p > 0.05). The addition of the bulk stableisotope ratio data to the models would most likely increase themodeling success rate for pear.
Variety and Subregional Analysis. One caveat of usingprofiles of elemental concentrations based on country-to-countrydata is the possibility of misclassification due to varietal effects.It is difficult to get good variety data, because typically eachvariety is grown in a different location, so there are inherent
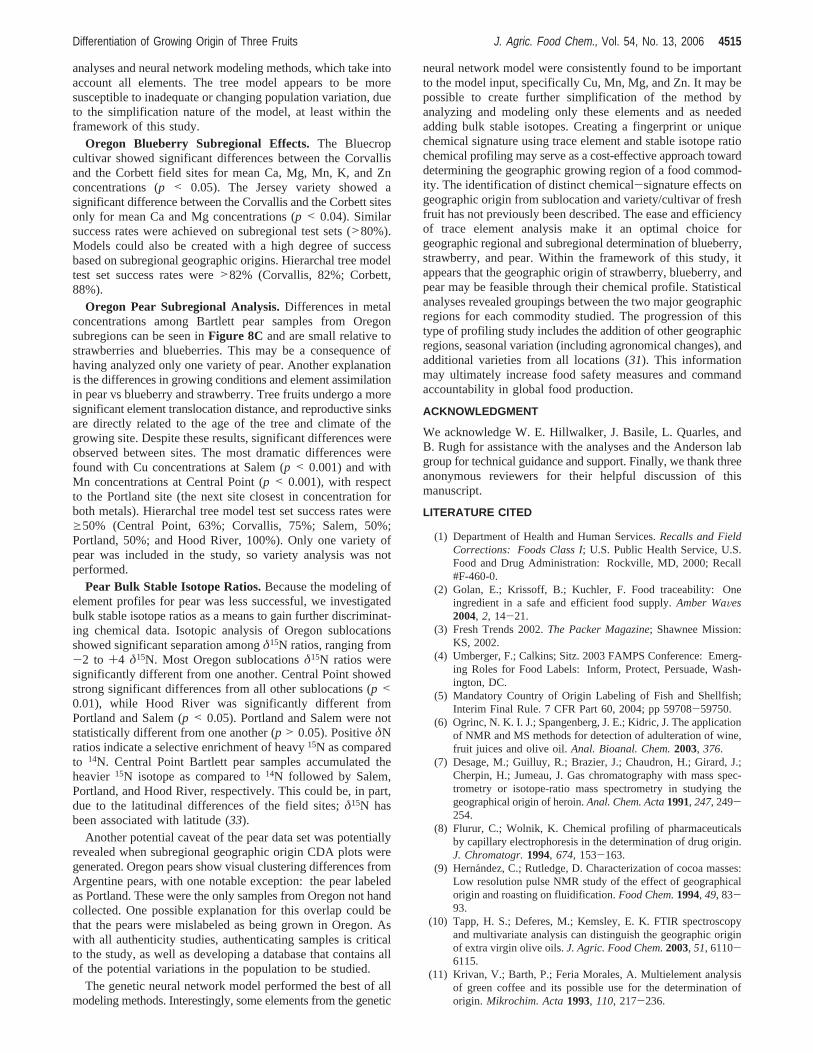
geographic differences leading to large confounding variables.In this study, we were able to collect two varieties of strawberryand two varieties of blueberry from adjacent plants (same soil,same environment, and same agronomy practices), thereforeproviding an excellent opportunity to evaluate the variety effectwithout many of the typical confounding variables. Effects ofvariety on geographic origin analysis of strawberry and blue-berry have not been previously published.Figure 8 shows someof the element variety and subregional differences, suggestingdiffering variety element uptake for strawberry, blueberry, andpear.
Oregon Strawberry Variety Effects. Although there arelarge differences in Cu and Mn concentrations between Mexicanand Oregon strawberry, there are also some Cu and Mn varietydifferences between Oregon strawberries (Figure 8A) (multiplecomparisons ANOVA). Significant Na concentration differenceswere seen between Totem and Hood cultivars from the Corvallisfield location (p < 0.01). Fe concentrations were significantlydifferent between Hood and Puget summer cultivars at the Mt.Angel field site (p < 0.01). Although there are varietydifferences within Oregon strawberries grown in the same field,these differences are relatively small as compared to the overallelemental profile differences with Mexican strawberries and,most importantly, within the framework of this study, do notappear to adversely affect modeling success (Table 2). We testedthe effects of variety on all of the models. At field sites wherewe had two varieties, we removed one variety from the modeltraining set. The training set then contained some strawberriesfrom the geographic site (i.e., representing environmentalconditions, soil, agronomical practices, etc.) but would notcontain the second variety, in this way isolating the varietyeffect. The test set would then be composed of a single variety,as always, withheld from the training set. The linear discriminantfunction, quadratic discriminant function, neural network, andgenetic neural network models all had 100% success rates(Table 2). The hierarchal tree model had 88-100% successrates. This suggests that within this strawberry data set thatvariety differences do not adversely affect geographic originmodeling using profile elemental concentrations.
Oregon Strawberry Subregional Effects.The strawberrycultivar Totem had significantly higher mean Zn concentrationsat the Brownsville site as compared to the Corvallis site only22 miles away (p < 0.01). Significant mean concentrationdifferences among the Hood cultivar between Corvallis and Mt.Angel field locations were also seen for Cu, K, and Zn (p <0.0001). These subregional differences are not surprising,
Figure 7. Argentina (A) and Oregon (O) pear isotope ratios (Oregon, n) 16; Argentina, n ) 20).
Table 2. Linear Discriminant Function, Quadratic DiscriminantFunction, Neural Network, Genetic Neural Network, and HierarchalTree Model Classification Performance Analysis Results for VarietyEffects on Geographical Origin Prediction of Strawberry and BlueberrySamples Based on Total Recoverable Element Concentration Profiling
%
discriminantfunction network
fruit varietya linear quadratic neuralgeneticneural
hierarchaltree
strawberry Hood 100 100 100 100 88Totem 100 100 100 100 100
blueberry Bluecrop 100 100 100 100 100Jersey 100 100 100 100 63
a Varieties selected for test set modeling were those field sites where two varietieswere collected. Field sites where only a single variety was available (Mt. Angel,Puget summer and Hood; Brownsville, Totem) were not modeled individually.
Differentiation of Growing Origin of Three Fruits J. Agric. Food Chem., Vol. 54, No. 13, 2006 4513
considering the diversity of Oregon soils. Coetzee et al. foundthat, in South Africa, the combination of elements characterizingwines from a particular region was different within each region(32). However, like the variety data, within this strawberry dataset, subregional differences are relatively small and do notadversely affect geographic origin modeling combined withprofile elemental concentrations; for example, hierarchal treemodel test set success rates were>88% (Brownsville, 88%;Corvallis, 94%; and Mt. Angel, 100%).
Oregon Blueberry Variety Effects. A significant differencein element concentrations among blueberries, Jersey variety andBluecrop cultivar, suggests that there are discernible differencesbetween varieties/cultivars of blueberries picked from the samefield location, as is the case with Cu shown inFigure 8B. Meanelement concentrations of Cu and Zn were significantly differentbetween Jersey and Bluecrop blueberries at the Corvallis field
location (p < 0.0001). Jersey and Bluecrop blueberries alsoshowed significant differences between mean Ca, Cu, and Mgpicked from the Corbett field site (p < 0.005). Variety test setswere created as described above for strawberry. The lineardiscriminant function, quadratic discriminant function, neuralnetwork, and genetic neural network models all had 100%success rates (Table 2). The hierarchal tree model had 63-100% success rates. This suggests that within this blueberrydata set that variety/cultivar differences do not adversely affectmost geographic origin modeling using profile elementalconcentrations. The hierarchal tree model, however, did notperform as well overall within the framework of this study,suggesting that blueberry variety/cultivar may adversely affectsome models. The hierarchal tree model is a less complicatedmodel, synthesizing the decision rules to single elements; thisprobably makes it inherently less robust than the discriminant
Figure 8. Strawberry (A), blueberry (B), and pear (C) copper and manganese concentrations vs subregion and variety are shown. Statistical differenceswere determined using multiple comparisons ANOVA. Letters denote statistical differences at the 95% confidence level. The boundary of the boxindicates the 25th and 75th (top and bottom) percentiles. The solid lines in the box mark the median and mean. The 5th and 95th percentiles aredisplayed with the star symbol.
4514 J. Agric. Food Chem., Vol. 54, No. 13, 2006 Perez et al.
analyses and neural network modeling methods, which take intoaccount all elements. The tree model appears to be moresusceptible to inadequate or changing population variation, dueto the simplification nature of the model, at least within theframework of this study.
Oregon Blueberry Subregional Effects. The Bluecropcultivar showed significant differences between the Corvallisand the Corbett field sites for mean Ca, Mg, Mn, K, and Znconcentrations (p < 0.05). The Jersey variety showed asignificant difference between the Corvallis and the Corbett sitesonly for mean Ca and Mg concentrations (p < 0.04). Similarsuccess rates were achieved on subregional test sets (>80%).Models could also be created with a high degree of successbased on subregional geographic origins. Hierarchal tree modeltest set success rates were>82% (Corvallis, 82%; Corbett,88%).
Oregon Pear Subregional Analysis.Differences in metalconcentrations among Bartlett pear samples from Oregonsubregions can be seen inFigure 8C and are small relative tostrawberries and blueberries. This may be a consequence ofhaving analyzed only one variety of pear. Another explanationis the differences in growing conditions and element assimilationin pear vs blueberry and strawberry. Tree fruits undergo a moresignificant element translocation distance, and reproductive sinksare directly related to the age of the tree and climate of thegrowing site. Despite these results, significant differences wereobserved between sites. The most dramatic differences werefound with Cu concentrations at Salem (p < 0.001) and withMn concentrations at Central Point (p < 0.001), with respectto the Portland site (the next site closest in concentration forboth metals). Hierarchal tree model test set success rates wereg50% (Central Point, 63%; Corvallis, 75%; Salem, 50%;Portland, 50%; and Hood River, 100%). Only one variety ofpear was included in the study, so variety analysis was notperformed.
Pear Bulk Stable Isotope Ratios.Because the modeling ofelement profiles for pear was less successful, we investigatedbulk stable isotope ratios as a means to gain further discriminat-ing chemical data. Isotopic analysis of Oregon sublocationsshowed significant separation amongδ15N ratios, ranging from-2 to +4 δ15N. Most Oregon sublocationsδ15N ratios weresignificantly different from one another. Central Point showedstrong significant differences from all other sublocations (p <0.01), while Hood River was significantly different fromPortland and Salem (p < 0.05). Portland and Salem were notstatistically different from one another (p > 0.05). PositiveδNratios indicate a selective enrichment of heavy15N as comparedto 14N. Central Point Bartlett pear samples accumulated theheavier15N isotope as compared to14N followed by Salem,Portland, and Hood River, respectively. This could be, in part,due to the latitudinal differences of the field sites;δ15N hasbeen associated with latitude (33).
Another potential caveat of the pear data set was potentiallyrevealed when subregional geographic origin CDA plots weregenerated. Oregon pears show visual clustering differences fromArgentine pears, with one notable exception: the pear labeledas Portland. These were the only samples from Oregon not handcollected. One possible explanation for this overlap could bethat the pears were mislabeled as being grown in Oregon. Aswith all authenticity studies, authenticating samples is criticalto the study, as well as developing a database that contains allof the potential variations in the population to be studied.
The genetic neural network model performed the best of allmodeling methods. Interestingly, some elements from the genetic
neural network model were consistently found to be importantto the model input, specifically Cu, Mn, Mg, and Zn. It may bepossible to create further simplification of the method byanalyzing and modeling only these elements and as neededadding bulk stable isotopes. Creating a fingerprint or uniquechemical signature using trace element and stable isotope ratiochemical profiling may serve as a cost-effective approach towarddetermining the geographic growing region of a food commod-ity. The identification of distinct chemical-signature effects ongeographic origin from sublocation and variety/cultivar of freshfruit has not previously been described. The ease and efficiencyof trace element analysis make it an optimal choice forgeographic regional and subregional determination of blueberry,strawberry, and pear. Within the framework of this study, itappears that the geographic origin of strawberry, blueberry, andpear may be feasible through their chemical profile. Statisticalanalyses revealed groupings between the two major geographicregions for each commodity studied. The progression of thistype of profiling study includes the addition of other geographicregions, seasonal variation (including agronomical changes), andadditional varieties from all locations (31). This informationmay ultimately increase food safety measures and commandaccountability in global food production.
ACKNOWLEDGMENT
We acknowledge W. E. Hillwalker, J. Basile, L. Quarles, andB. Rugh for assistance with the analyses and the Anderson labgroup for technical guidance and support. Finally, we thank threeanonymous reviewers for their helpful discussion of thismanuscript.
LITERATURE CITED
(1) Department of Health and Human Services.Recalls and FieldCorrections: Foods Class I; U.S. Public Health Service, U.S.Food and Drug Administration: Rockville, MD, 2000; Recall#F-460-0.
(2) Golan, E.; Krissoff, B.; Kuchler, F. Food traceability: Oneingredient in a safe and efficient food supply.Amber WaVes2004, 2, 14-21.
(3) Fresh Trends 2002.The Packer Magazine; Shawnee Mission:KS, 2002.
(4) Umberger, F.; Calkins; Sitz. 2003 FAMPS Conference: Emerg-ing Roles for Food Labels: Inform, Protect, Persuade, Wash-ington, DC.
(5) Mandatory Country of Origin Labeling of Fish and Shellfish;Interim Final Rule. 7 CFR Part 60, 2004; pp 59708-59750.
(6) Ogrinc, N. K. I. J.; Spangenberg, J. E.; Kidric, J. The applicationof NMR and MS methods for detection of adulteration of wine,fruit juices and olive oil.Anal. Bioanal. Chem.2003, 376.
(7) Desage, M.; Guilluy, R.; Brazier, J.; Chaudron, H.; Girard, J.;Cherpin, H.; Jumeau, J. Gas chromatography with mass spec-trometry or isotope-ratio mass spectrometry in studying thegeographical origin of heroin.Anal. Chem. Acta1991, 247, 249-254.
(8) Flurur, C.; Wolnik, K. Chemical profiling of pharmaceuticalsby capillary electrophoresis in the determination of drug origin.J. Chromatogr.1994, 674, 153-163.
(9) Hernandez, C.; Rutledge, D. Characterization of cocoa masses:Low resolution pulse NMR study of the effect of geographicalorigin and roasting on fluidification.Food Chem.1994, 49, 83-93.
(10) Tapp, H. S.; Deferes, M.; Kemsley, E. K. FTIR spectroscopyand multivariate analysis can distinguish the geographic originof extra virgin olive oils.J. Agric. Food Chem.2003, 51, 6110-6115.
(11) Krivan, V.; Barth, P.; Feria Morales, A. Multielement analysisof green coffee and its possible use for the determination oforigin. Mikrochim. Acta1993, 110, 217-236.
Differentiation of Growing Origin of Three Fruits J. Agric. Food Chem., Vol. 54, No. 13, 2006 4515
(12) Bicchi, C. P.; Binello, A. E.; Legovich, M. M.; Pellegrino, G.M.; Alfredo, C. Vanni characterization of roasted coffee byS-HSGC and HPLC-UV and principal component analysis.J.Agric. Food Chem.1993, 41, 2324-2328.
(13) Cozzolineo, D.; Smythe, H. E.; Gishen, M. Feasibility study onthe use of visible and near-infrared spectroscopy together withchemometrics to discriminate between commercial white wineof different varietal origins.J. Agric. Food Chem.2003, 51, 7703.
(14) Danzer, K.; Carcia, D. D. C.; Thiel, G.; Reicembacher, M.Classification of wine samples according to origin and grapevarieties on the basis of inorganic and organic trace analyses.Am. Lab.1999, 31, 29-34.
(15) Anderson, K. A.; Smith B. W. Chemical profiling to differentiategeographic growing origin of coffee.J. Agric. Food Chem.2002,50, 2068-2075.
(16) Anderson, K. A.; Smith, B. W. Use of chemical profiling todifferentiate geographic growing origin of raw pistachios.J.Agric. Food Chem.2005, 53, 410-418.
(17) Anderson, K. A.; Magnuson, B. A.; Tschirgi, M. L.; Smith, B.W. Determining the geographic origin of potatoes with tracemetal analysis using statistical and neural network classifiers.J.Agric. Food Chem.1999, 47, 1568-1575.
(18) Cresser, M.; Killham, K.; Edwards, T.Soil Chemistry and ItsApplications; Cambridge University Press: Cambridge, 1993.
(19) Guiseppe, N.; Monetti, A.; Reniero, F. Monitoring authenticity& regional origin of wines by natural stable isotopes ratioanalysis.ACS Symp. Ser.1997, 661, 113-132.
(20) Mansuy, L.; Philp, R. P.; Allen, J. Source identification of oilspills bases on isotopic composition of individual componentsin weathered oil samples.EnViron. Sci. Technol.1997, 31, 3417-3425.
(21) Kelly, S.; Heaton, K.; Hoogewerff, J. Tracing the geographicalorigin of food: The application of multi-element and multi-isotope analysis.Food Sci. Technol.2005, 16, 555-567.
(22) Whilte, J. W.; Winters, K.; Martin, P.; Rossman, A. Stable carbonisotope ratio analysis of honey: Calidation of internal standardsprocedure for worldwide application.J. AOAC Int.1998, 81,610-618.
(23) Guy, R. D.; Holowachuk, D. L. Population differences in stablecarbon isotope ratio of Pinus contorta Dougl.ex lour.: Relation-
ship to environment, climate of origin, and growth potential.Can.J. Bot.2001, 79, 274-283.
(24) Amundson, R.; Austin, A. T.; Schuur, E. A. G.; Yoo, K.; Matzek,V.; Kendall, C.; Uebersax, A.; Brenner, D.; Baisden, W. T.Global patterns of the isotopic composition of soil and plantnitrogen.Global Biogeochem. Cycles2003, 17, 1031.
(25) Garten, C. T., Jr. Variation in foliar 15N abundance and theavailability of soil nitrogen on Walker Branch watershed.Ecology1993, 74, 2098-2113.
(26) Kendall, C. Isotope tracers in catchment hydrology. InTracingNitrogen Sources and Cycling in Catchments; Kendall, C. M. J.J., Eds.; Elsevier Science B. V.: Amsterdam, 1998; pp 519-576.
(27) U.S. Environmental Protection Agency.Biosolids TechnologyFact Sheet: Land Application of Biosolids; Office of Water, U.S.EPA: Washington, DC, 2000; EPA 832-F-00-064.
(28) Buzman, B.; Lorek, E. Bioindicatory value ofV. angustifolium-spp.Pr. Nauk. Uniw. Slask. Katowicach1982, 505, 242-254.
(29) Sheppard, S. C. A field and literature survey, with interpretations,of elemental concentrations in blueberry (V. angustifolium). Can.J. Bot.1991, 69, 63-77.
(30) Black, B. L.; Zimmerman, R. H. Mixtures of coal ash andcompost as substrates for highbush blueberry.J. Am. Soc. Hortic.Sci.2002, 127, 869-877.
(31) Anderson, K. A.; Smith, B. W. Effect of season and variety onthe differentiation of geographic growing origin of pistachiosby stable isotope profiling.J. Agric. Food Chem.2006, 54,1747-1752.
(32) Coetzee, P. P.; Steffens, F. E.; Eiselen, R. J.; Augustyn, O. P.;Balcaen, L.; Vanhaecke, F. Multi-element analysis of SouthAfrican wines by ICP-MS and their classification according togeographical origin.J. Agric. Food Chem.2005, 53, 5060-5066.
(33) Flanagan, L. B.; Ehleringer, J. R.; Pataki, D. E.Stable Isotopesand Biosphere-Atmosphere Interactions: Processes and Biologi-cal Controls; Elsevier Academic: San Diego, 2005.
Received for review January 5, 2006. Revised manuscript received May4, 2006. Accepted May 8, 2006. We thank the Oregon AgricultureResearch Foundation for partial funding of this research.
JF0600455
4516 J. Agric. Food Chem., Vol. 54, No. 13, 2006 Perez et al.
Copyright © 2022 FDOKUMEN