Stability of Rock Riprap for Protection at the Toe of Abutments ...
122
Stability of Rock Riprap for Protection at the Toe of Abutments Located at the Floodplain Publication No. FHW A-RD-9 1-057 US Department of Transportation Federal Highway Administration SE>ptemlwr · 199 1 Off1ce of Research and Development Turner-Fa1rbank Htghway Research Center 6300 Georgetown P1ke Mclean, V1rgm1a 22101-2296
-
Upload
khangminh22 -
Category
Documents
-
view
0 -
download
0
Transcript of Stability of Rock Riprap for Protection at the Toe of Abutments ...

Stability of Rock Riprap for Protection at the Toe of Abutments Located at the Floodplain
Publication No. FHW A-RD-9 1-057
US Department of Transportation
Federal Highway Administration
SE>ptemlwr ·199 1
Off1ce of Research and Development Turner-Fa1rbank Htghway Research Center 6300 Georgetown P1ke Mclean, V1rgm1a 22101-2296

Foreword
This report presents the results of a Master Thesis on stability of rock riprap to provide scour protection of abutments on flood plains. Experiments were conducted in a hydraulic flume ·r.ith two abutment types: vertical wall and spill-through (H:V = 2:1). Equation~; md velocity multipliers to determine the stable rock size were developed c~sed on the results of the laboratory investigation. This report will be of interest to hydraulic, structural, geotechnical and roadway design engineers concerned about scour countermeasures to prevent local scour at bridge abutments.
Thomas J. P Office of gineering and Highway Operations Research and Development
NOTICE
This document is disseminated under the sponsorship of the Department of Transportation in the interest of information exchange. The United States Government assumes no liability for its contents or use thereof. This report does not constitute a standard, specification, or regulation.
The United States Government does not endorse products or manufacturers. Trade and manufacturers' names appear in this report only because they are considered essential to the object of the document.

Technical Report Documentation Page
1. Repo•t No. I , 3. Rec1p1ents Catalog No. ! FHWA-RD-91-057 PB93-174639
4. T,tle and Subtitle 5. R epo•t Dote September 1991 Stability of Rock Riprap for Protection I
at the Toe of Abutments located at the Floodplain 6. Performrng Orgcn1 zotron Code
r-:-· 8. Performing Orgonr zotron Report No.
7. Authorr' s) I
Jorge E. Pagan-Ortiz, MSCE I I
9. Performing Organi zotion Name and Address 10. Wo•k Untt No. (TRAIS) Office of Engineering, Bridge Division NCP 3D3b2152 Hydraulics and Geotechnical Branch 11. Contract or Grant No.
Federal Highway Administration, HNG-31 Washington, D.C. 20590 13. Type of Report and Pe•iod Cove•ed
12. Sponso•ing Agency Name and Add•ess
Office of Engineering and Highway Final Report Operations, Research, and Development May 1990 - December 1990 FHWA, 6300 Georgetown Pike 14. Spanso•ing Agency Code
Md Pan Virainia 22101-229.6_ 15. Supplementary Notes Technical Assistant: Phi 1 ip L. Thompson, lawrence J. Harrison, J. Sterling Jones, Dr. Roy Trent, Jennifer D. Rhodes, FHWA; Or. Khalid Mahmood, Or. M. I. Haque, Dr. Charles A. Bertoldi GKY and Associates.
Garris, The George Washington University; David
16. Abstract
·-
' ~his report presents the results of a research conducted in a hydraulic flume to determine the stability of rock riprap protecting abutments located on flood plains. The observed vulnerable zone for rock riprap failure is presented for two abutment types: vertical wall and spill-through (H:V = 2:1).
Equations and velocity multipliers to assist an engineer in determining the stable rock riprap size are presented in this report for the two abutment types. Conditions found to influence the stability of rock riprap are also presented.
The results obtained in this research report have been published in FHWA Publication HEC No. 18, "Evaluating Scour at Bridges," dated February 1991. ~ ..
17. Key Words 18. Distribution Statement
Abutment, Grave 1, Local Scour, No restrictions. This document is Rock Riprap, Velocity, Sediment available to the public through the Number National Technical Information Service,
- Springfield, Virginia 22161 19. Security Classif. (of this report) 20. Secu•ity Clossd. (of this page) 21. No. of Pages 22. Price
Unclassified Unclassified 125
Form DOT F 1700.7 (8-72l Reproduction of completed page authorized
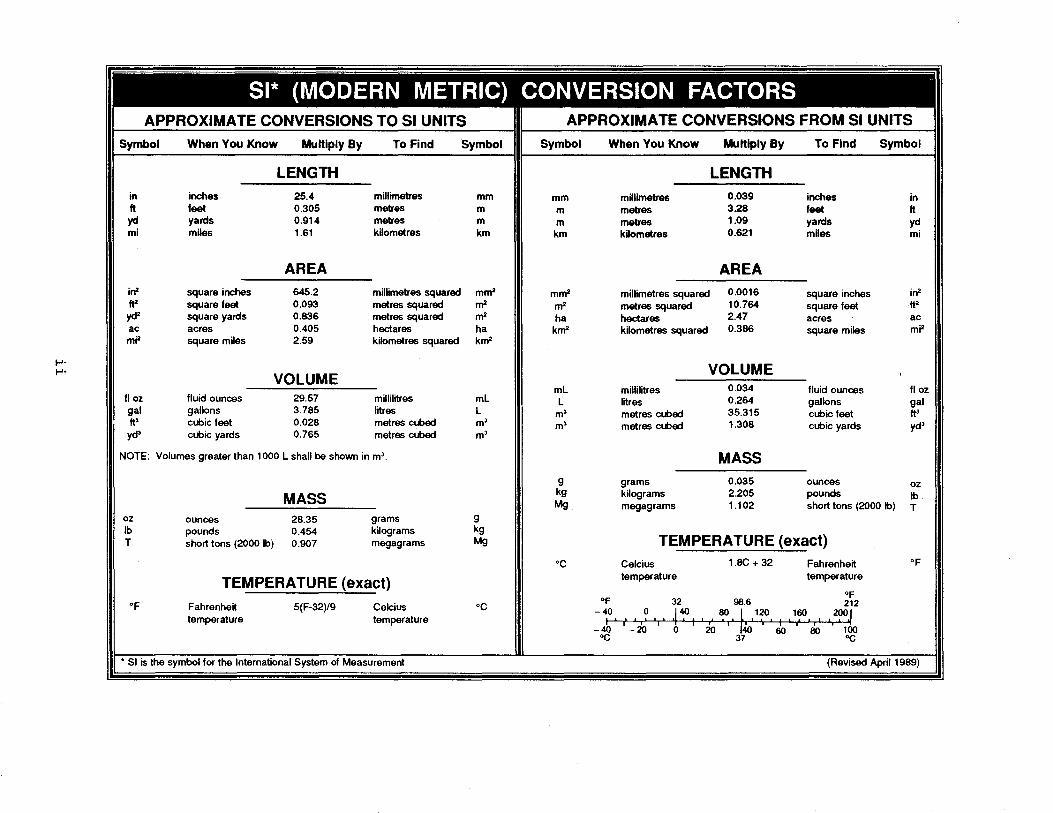
APPROXIMATE CONVERSIONS TO Sl UNITS APPROXIMATE CONVERSIONS FROM Sl UNITS
Symbol When You Know Multiply By To Find Symbol Symbol When You Know Multiply By To Find Symbol
LENGTH LENGTH
in inches 25.4 millimetres mm mm millimetre& 0.039 inches in It feet 0.305 metres m m metres 3.28 feet It yd yards 0.914 metres m m metres 1.09 yards yd mi miles 1.61 kilometres km km kilometres 0.621 miles mi
AREA AREA
in" square inches 645.2 millimetres squared mrn" mrn" millimetres squared 0.0016 square inches in" ft2 square feet 0.093 metres squared rn" rn" metres squared 10.764 square feet tt• yd2 square yards 0.836 metres squared rn" ha hectares 2.47 acres ac ac acres 0.405 hectares ha krn" kilometres squared 0.386 square miles mi" mi" square miles 2.59 kilometres squared km2
~: Ill VOLUME VOLUME mL millilitres 0.034 fluid ounces fl oz
fl oz fluid ounces 29.57 millilitres mL L litres 0.264 gallons gal gal gallons 3.785 litres L m> metres cubed 35.315 cubic feet ft> ft3 cubic feet 0.028 metres cubed m3 m> metres cubed 1.308 cubic yards yd> yd3 cubic yards 0.765 metres cubed m3
NOTE: Volumes greater than 1000 L shall be shown in m3. Ill MASS
g grams 0.035 ounces oz MASS Ill kg kilograms 2.205 pounds lb
Mg megagrams 1.102 short tons (2000 lb) T . oz ounces 28.35 grams g lb pounds 0.454 kilograms kg T shorttons(20001b) 0.907 megagrams Mg Ill TEMPERATURE (exact)
•c Celcius 1.8C + 32 Fahrenheit •F
TEMPERATURE (exact) I temperature temperature Of
•F Fahrenheit 5(F-32)/9 Celcius •c _ ":0 0 32
40 80 98·6
120 160 2~12
temperature temperature 1 1 I I 1 1 1 .j I 1 , 1 I 1 l 1 1 1 1 1 1 1 1 1 1 ./ I I I I I I I I I '
-40 -20 0 20 40 60 80 100 •c 37 oc

TABLE OF CONTENTS
DESCRIPTION
CHAPTER 1 INTRODUCTION
CHAPTER 2 LITERATURE REVIEW
1. INTRODUCTION 2. ROCK RIPRAP AS A SCOUR COUNTERMEASURE 3. VELOCITY-BASED CRITERIA 4. SUMMARY
PAGE
1
13 19 21 25
CHAPTER 3 --- EXPERIMENTAL PLAN
1. BACKGROUND 26 2. TEST FACILITIES AND INSTRUMENTATION 26
a. HYDRAULIC FLUME 26 b. ELECTROMAGNETIC VELOCITY METER OPERATION 26 c. ABUTMENT MODELS 2 8
(1) Vertical wall shape 28 (2) Spill-through shape 29
3. GRAVEL PLACEMENT SETUP 29 4. FRAMEWORK OF EXPERIMENTATION 34
CHAPTER 4 --- EXPERIMENTAL RESULTS AND DATA ANALYSIS
CHAPTER 5
CHAPTER 6
APPENDIX A
APPENDIX B
APPENDIX C
APPENDIX D
1. VERTICAL WALL ABUTMENT 2. SPILL-THROUGH ABUTMENT
CONCLUSION AND RECOMMENDATIONS
EXAMPLE PROBLEMS
1. VERTICAL WALL ABUTMENT 2. SPILL-THROUGH ABUTMENT
SEDIMENT NUMBER FOR VERTICAL WALL ABUTMENT
SEDIMENT NUMBER FOR SPILL-THROUGH ABUTMENT
COMPUTED POINT VELOCITY FOR COMPUTED AVERAGE DEPTH FOR VERTICAL WALL ABUTMENT
COMPUTED POINT VELOCITY FOR COMPUTED AVERAGE DEPTH FOR SPILL-THROUGH ABUTMENT
40 45
52
54 55
56
58
60
63
APPENDIX E -- MEASURED POINT VELOCITY FOR MEASURED AVERAGE 66 DEPTH FOR VERTICAL WALL ABUTMENT
iii

TABLE OF CONTENTS (CONTINUED)
DESCRIPTION PAGE
APPENDIX F MEASURED POINT VELOCITY FOR MEASURED AVERAGE 69 DEPTH FOR SPILL-THROUGH ABUTMENT
APPENDIX G COMPUTED VELOCITY RATIO FOR VARIABLE DEPTH 72 FOR VERTICAL WALL ABUTMENT
APPENDIX H COMPUTED VELOCITY RATIO FOR VARIABLE DEPTH 75 FOR SPILL-THROUGH ABUTMENT
APPENDIX I MEASURED VELOCITY RATIO FOR VARIABLE DEPTH 78 FOR VERTICAL WALL ABUTMENT
APPENDIX J MEASURED VELOCITY RATIO FOR VARIABLE DEPTH 81 FOR SPILL-THROUGH ABUTMENT
APPENDIX K VELOCITY POINT DISTANCE FROM TOE OF 84 VERTICAL WALL ABUTMENT TO CHANNEL
APPENDIX L VELOCITY POINT DISTANCE FROM TOE OF 96 SPILL-THROUGH ABUTMENT TO CHANNEL
REFERENCES 104
iv

LIST OF FIGURES
FIGURE DESCRIPTION
1 Plan view of point velocity locations for vertical wall abutment in the hydraulic flume.
2 Plan view of point velocity locations for spill-through abutment in the hydraulic flume.
3 Plan view of point velocity locations for vertical wall abutment (obstructed flow).
4 Plan view of point velocity locations for spill-through abutment (obstructed flow).
5 Average point velocity profiles for vertical wall abutment.
6 Average point velocity profiles for spill-through abutment.
7 Observation area for vertical wall abutment.
8 Observation area for spill-through abutment.
9 Location of initial failure zone for vertical wall abutment.
10 Plan view of failure zone of the gravel with time and increase in discharge for vertical wall abutment.
11 Location of initial failure zone for spill-through abutment.
12 Plan view of failure zone of the gravel with time and increase in discharge for spill-through abutment.
13 Upstream view of failure zone of the gravel with time and increase in discharge for spill-through abutment.
14 Sediment number curve for unobstructed flow.
15 View of the hydraulic flume facility.
16 Diagram of vertical wall abutment.
v
PAGE
3
4
6
7
8
9
11
12
14
15
16
17
18
23
27
30

LIST OF FIGURES (CONTINUED)
FIGURE DESCRIPTION
17 View of typical setup for the vertical wall abutment in the observation area.
18 Diagram of the combined elements forming the spill-through abutment model.
19 View of typical setup for the spill-through abutment in the observation area.
20 Section view of the gravel setup for vertical wall abutment.
21 Section view of the gravel setup for spill-through abutment.
22 View of the tailgate located downstream of the hydraulic flume.
23 Individual sediment number curve for vertical wall abutment.
24 Combined sediment number curve for vertical wall abutment.
25 Point velocity ratio for vertical wall abutment.
26 Drop in water surface elevation through the contraction of the spill-through abutment.
27 Turbulence of flow at the failure zone of the spill-through abutment.
28 Individual sediment number curve for spill-through abutment.
29 Combined sediment number curve for spill-through abutment.
30 Point velocity ratio for spill-through abutment.
vi
PAGE
31
32
33
35
36
37
41
42
44
46
47
48
49
51

LIST OF TABLES
TABLE DESCRIPTION
1 Sediment number for vertical wall abutment (D~ = 0.025 ft = 0.0076 m).
2 Sediment number for vertical wall abutment (D~ = 0.033 ft = 0.0101 m).
3 Sediment number for spill-through abutment (D50 = 0.025 ft = 0.0076 m).
4 Sediment number for spill-through abutment (D50 = 0.033 ft = 0.0101 m).
5 Computed point velocity (Vcp) for computed average depth (dec> @ Xt = 0 for vertical wall abutment (dec<= 0.375 ft or dec<= 0.114 m).
6
7
8
9
10
11
Computed point velocity (Vcp) for computed average depth (dec> @ Xt = 0 for vertical wall abutment (0.375 ft < d~ <= 0.667 ft or 0.114 m < dec <= 0. 203 m) .
Computed point velocity (Vcp) for computed average depth (dec) @ Xt = 0 for vertical wall abutment (d~ > 0.667 ft or d~ > 0.203 m).
Computed point velocity (V~) for computed average depth (dec) @ Xt = 0 for sp111-through abutment (dec<= 0.375 ft or dec<= 0.114 m).
Computed point velocity (V~) for computed average depth (dec) @ Xt = 0 for Sp111-through abutment (0.375 ft <dec <= 0.667 ft or 0.114 m < dec <= 0. 203 m) .
Computed point velocity (V~) for computed average depth (dec) @ Xt = 0 for sp111-through abutment (d~ > 0.667 ft or d~ > 0.203 m).
Measured point velocity (V~) for measured average depth (dmcl @ Xt = 0 for vertical wall abutment (~c <= 0.375 ft or dmc <= 0.114 m).
vii
PAGE
56
57
58
59
60
61
62
63
64
65
66
LIST OF TABLES (CONTINUED)
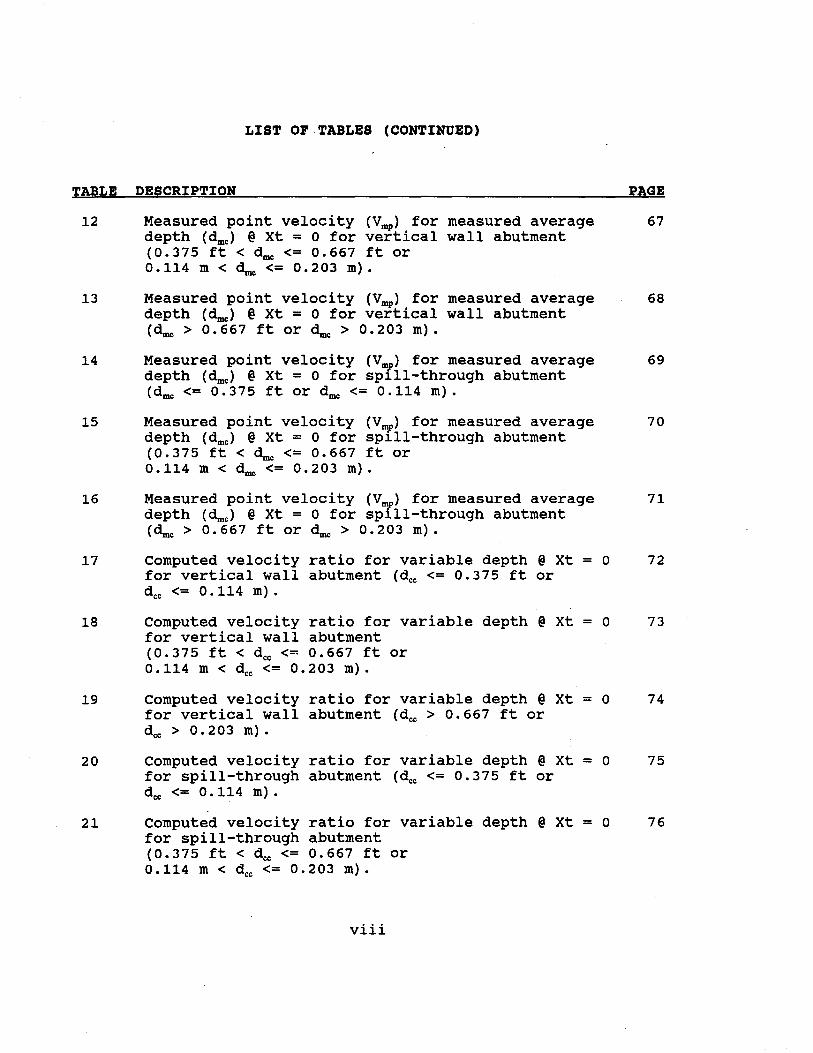
TABLE DESCRIPTION
12
13
14
15
16
17
18
19
20
21
Measured point velocity (V~) for measured average depth (~c) @ Xt = 0 for vertical wall abutment (0.375 ft < ~ <= 0.667 ft or 0.114 m < ~ <= 0.203 m).
Measured point velocity (V~) for measured average depth (d=) @ Xt = 0 for vertical wall abutment C~c > 0.667 ft or ~ > 0.203 m).
Measured point velocity (V~) for measured average depth (d=) @ Xt = 0 for sp111-through abutment (d= <= 0.375 ft or d= <= 0.114 m).
Measured point velocity (V~) for measured average depth (dmc> @ Xt = 0 for sp1ll-through abutment (0.375 ft < ~c <= 0.667 ft or 0.114 m < ~c <= 0.203 m).
Measured point velocity (V~) for measured average depth (~c) @ Xt = 0 for sp111-through abutment C~c > o. 667 ft or dmc > o. 203 m) .
Computed velocity ratio for variable depth @ Xt = 0 for vertical wall abutment (dec <= 0.375 ft or dec <= 0.114 m) .
Computed velocity ratio for variable depth @ Xt = 0 for vertical wall abutment (0.375 ft < d~ <= 0.667 ft or 0.114 m < dec <= 0.203 m).
Computed velocity ratio for variable depth @ Xt = 0 for vertical wall abutment (dec > 0.667 ft or dec > 0.203 m).
Computed velocity ratio for variable depth @ Xt = 0 for spill-through abutment (dec <= 0. 375 ft or dec <= 0. 114 m) .
Computed velocity ratio for variable depth @ Xt = 0 for spill-through abutment (0.375 ft < d~ <= 0.667 ft or 0.114 m < dec <= 0. 2 03 m) .
viii
PAGE
67
68
69
70
71
72
73
74
75
76

LIST OF TABLES (CONTINUED)
TABLE DESCRIPTION PAGE
22 computed velocity ratio for variable depth @ Xt = o 77 for spill-through abutment (dec > 0. 667 ft or dec> 0.203 m).
23 Measured velocity ratio for variable depth @ Xt = o 78 for vertical wall abutment (~c <= 0.375 ft or
24
25
26
27
28
29
30
31
~ <= 0. 114 m) •
Measured velocity ratio for variable depth @ Xt = 0 for vertical wall abutment (0.375 ft < ~ <= 0.667 ft or 0 . 114 m < ~c <= 0 . 2 0 3 m) •
Measured velocity ratio for variable depth @ Xt = 0 for vertical wall abutment (~ > 0.667 ft or dmc > 0.203 m).
Measured velocity ratio for variable depth @ Xt = 0 for spill-through abutment (~ <= 0.375 ft or ~ <= 0. 114 m) •
Measured velocity ratio for variable depth @ Xt = 0 for spill-through abutment (0.375 ft < dmc <= 0.667 ft or 0.114 m < ~c <= 0. 203 m) •
Measured velocity ratio for variable depth @ Xt = o for spill-through abutment (~c > 0.667 ft or ~c > 0.203 m).
Velocity point distance from toe of vertical wall abutment to channel (L = 0.417 ft or L = 0.127 m; dcac <= 0. 375 ft or dcac <= 0.114 m).
Velocity point distance from toe of vertical wall abutment to channel (L = 0.417 ft or L = 0.127 m; 0.375 ft < dcac <= 0.667 ft or 0.114 m < d~ <= 0.203 m).
Velocity point distance from toe of vertical wall abutment to channel (L = 0.417 ft or L = 0.127 m; dcac > 0.667 ft or dcac > 0.203 m).
ix
79
80
81
82
83
84
85
86

LIST OF TABLES (CONTINUED)
TABLE DESCRIPTION
32 Velocity point distance from toe of vertical wall abutment to channel (L = 0.833 ft or L = 0.254 m; dcac <= 0.375 ft or dcac <= 0.114 m).
33 Velocity point distance from toe of vertical wall abutment to channel (L = 0.833 ft or L = 0.254 m; 0.375 ft < dcac <= 0.667 ft or 0.114 m < d~ <= 0.203 m).
34 Velocity point distance from toe of vertical wall abutment to channel (L = 0.833 ft or L = 0.254 m; d~ > 0.667 ft or dcac > 0.203 m).
35 Velocity point distance from toe of vertical wall abutment to channel (L = 1.250 ft or L = 0.381 m; d~ <= 0.375 ft or dcac <= 0.114 m).
36 Velocity point distance from toe of vertical wall abutment to channel (L = 1.250 ft or L = 0.381 m; 0.375 ft < dcac <= 0.667 ft or 0.114 m < d~ <= 0.203 m).
37 Velocity point distance from toe of vertical wall abutment to channel (L = 1.250 ft or L = 0.381 m; d~ > 0.667 ft or dcac > 0.203 m).
38 Velocity point distance from toe of vertical wall abutment to channel (L = 1.667 ft or L = 0.508 m; d~ <= 0.375 ft or dcac <= 0.114 m).
39 Velocity point distance from toe of vertical wall abutment to channel (L = 1.667 ft or L = 0.508 m; 0.375 ft < dcac <= 0.667 ft or 0.114 m < d~ <= 0.203 m).
40 Velocity point distance from toe of vertical wall abutment to channel (L = 1.667 ft or L = 0.508 m; dcac > 0.667 ft or dcac > 0.203 m).
41 Velocity point distance from toe of spill-through abutment to channel (L = 2.083 ft or L = 0.635 m; dcac <= 0.292 ft or d~ <= 0.089 m).
X
PAGE
87
88
89
90
91
92
93
94
95
96

LIST OF TABLES (CONTINUED)
TABLE DESCRIPTION
42 Velocity point distance from toe of spill-through abutment to channel (L = 2o083 ft or L = Oo635 m; dcac <= Oo292 ft or dcac <= Oo089 m) 0
43 Velocity point distance from toe of spill-through abutment to channel (L = 2o083 ft or L = Oo635 m; Oo292 ft < dcac <= Oo625 ft or Oo089 m < dcac <= Ool90 m) o
44 Velocity point distance from toe of spill-through abutment to channel (L = 2o083 ft or L = Oo635 m; dcac > 0.625 ft or dcac > 0.190 m) 0
45 Velocity point distance from toe of spill-through abutment to channel (L = 2o500 ft or L = 0.762 m; dcac <= 0.292 ft or dcac <= 0.089 m).
46 Velocity point distance from toe of spill-through abutment to channel (L = 2o500 ft or L = Oo762 m; dcac <= 0. 292 ft or dcac <= 0. 089 m) •
47 Velocity point distance from toe of spill-through abutment to channel (L = 2.500 ft or L = Oo762 m; 0.292 ft < dcac <= 0.625 ft or 0. 089 m < dcac <= 0 0 190 m) 0
48 Velocity point distance from toe of spill-through abutment to channel (L = 2.500 ft or L = 0.762 m; dcac > 0.625 ft or dcac > 0.190 m).
49 Velocity point distance from toe of spill-through abutment to channel (L = 2o9l7 ft or L = 0.889 m; dcac <= 0 0 292 ft or dcac <= 0. 089 m) .
50 Velocity point distance from toe of spill-through abutment to channel (L = 2.917 ft or L = Oo889 m; dcac <= 0. 292 ft or dcac <= 0. 089 m) 0
51 Velocity point distance from toe of spill-through abutment to channel (L = 2.917 ft or L = 0.889 m; 0.292 ft < dcac <= 0.625 ft or 0.089 m < d= <= 0.190 m)o
xi
PAGE
96
97
97
98
98
99
99
100
100
101
LIST OF TABLES (CONTINUED)
TABLE DESCRIPTION
52 Velocity point distance from toe of spill-through abutment to channel (L = 2.917 ft or L = 0.889 m; dcac > 0.625 ft or dcac > 0.190 m).
53 Velocity point distance from toe of spill-through abutment to channel (L = 3.333 ft or L = 1.016 m; dcac <= 0. 292 ft or dcac <= 0. 089 m) •
54 Velocity point distance from toe of spill-through abutment to channel (L = 3.333 ft or L = 1.016 m; dcac <= 0. 292 ft or dcac <= 0. 089 m) •
55 Velocity point distance from toe of spill-through abutment to channel (L = 3.333 ft or L = 1.016 m; 0.292 ft < dcac <= 0.625 ft or 0.089 m < dcac <= 0.190 m).
56 Velocity point distance from toe of spill-through abutment to channel (L = 3.333 ft or L = 1.016 m; dcac > 0.625 ft or dcac > 0.190 m).
xii
PAGE
101
102
102
103
103

SYMBOLS
d
D
Dso
g
K
L
N
Nsm
LIST OF SYMBOLS
DESCRIPTION
Depth of Water (ft).
Average Measured Depth at the Approach (ft).
Average Computed Depth at the Contraction for Obstructed Flow (ft).
Average Measured Depth at the Contraction for Obstructed Flow (ft).
Average Computed Depth at the Contraction for Smooth Bed (ft).
Average Measured Depth at the Contraction for Smooth Bed (ft).
Average Computed Depth at the Contraction (Last Three Points in Row for Smooth Bed) (ft).
Estimated Maximum Depth of Scour for Alluvial Bed Channels (ft).
Average Grain Diameter (ft).
Average Rock Size (ft).
Median Rock Size (ft).
Gravitational Acceleration (32.2 ftjs2 or 9.81 mjs2).
Roughness of the Bed Upstream.
Roughness of the Bed Surrounding the Obstruction.
Abutment Length (ft).
Sediment Number.
Computed Sediment Number From Undisturbed curve.
Measured Sediment Number From Undisturbed Flow Curve.
Measured Sediment Number for Disturbed Flow.
xiii
SYMBOLS
Nsc
R
R.
s
S.G.
vmu
vmin
LIST OF SYMBOLS (CONTINUED)
DESCRIPTION
Computed Sediment Number for Disturbed Flow.
Hydraulic Radius (ft).
Particle Reynolds Number.
Slope (ftjft).
Specific Gravity of Rock.
Computed Discharge (ft3js).
Measured Discharge (ft3 js).
Measured Average Point Velocity at the Approach, in (ft/s).
Computed Average Velocity at the Contraction for Smooth Bed (ft/s).
Computed Average Point Velocity at the Contraction for Disturbed Flow (ft/s).
Computed Average Point Velocity at the Contraction for Unobstructed Flow (ft/s).
Maximum Velocity that will Roll-out the Stones Lying Among the Others on the Slope (ft/s).
Measured Average Point Velocity at the Contraction for Disturbed Flow (ft/s).
Minimum Velocity that will Remove the Loose Stones Lying on Top of the Fill (ft/s).
Measured Average Point Velocity at the Contraction for Unobstructed Flow (ft/s).
Average Measured Point Velocity at the Contraction for Smooth Bed (ft/s).
Average Velocity of the Last Three Points on the Velocity Profile in the Contraction for Smooth Bed (ft/s).
xiv

SYMBOLS
r r.
'f •c
LIST OF SYMBOLS (CONTINUED)
DESCRIPTION
Two-directional Horizontal Temporal Mean Velocities (ftjs) .
Horizontal Distance from the Toe of Abutment to the Channel Boundary (ft).
Horizontal Location of Point Velocities within the Contraction (ft).
Unit Weight of Water (lb/ft3).
Stability Factor.
Fluid Density (slugjft3).
Rock Density (slugjft3).
Boundary Shear Stress (lb/ft2).
Critical Non-dimensional Boundary Shear Stress.
Dynamic Viscosity of Fluid (slugjft-s).
Kinematic Viscosity of Water (ft2js).
XV

CHAPTER 1
INTRODUCTION
The need to improve the transportation system required the design, construction and furthermore, the maintenance of highway structures crossing bodies of water. However, the construction of these structures encroaches most of the time on the stream, causing hydraulic changes in its performance.
One of the most important changes that can be observed in streams is the erosion of the bed material caused by the flowing water through the bridge opening, particularly near the toe of a bridge abutment. The erosion of the bed material at the toe of the bridge abutment is called local scour phenomena.
Scour is the result of the erosive actions of running water, excavating, and carrying away material from the bed and banks of streams. <tl There are basically three components that comprise the total scour at a highway crossing: aggradation and degradation; contraction scour; and local scour:
• Aggradation and degradation are the long-term stream bed elevation changes due to natural or man induced causes within the reach of the river on which the bridge is located.
· Contraction scour in a natural channel involves the removal of bed material within the channel width. This component of scour results from a contraction of the flow by bridge approach embankments encroaching onto the floodplain andjor into the channel. The scour is caused by increased velocities and a resulting increase in bed shear stress.
· Local scour involves the removal of material from around the piers, abutment, spurs, and embankments. It is caused by the acceleration of flow and resulting vortices induced by the flow obstruction. Local scour is restricted to a narrow area and is confined very close to the structures.
It is very important to conduct a hydraulic study in a project involving the construction of a highway structure which would affect the hydraulics of the stream. The hydraulic study should include the scour analysis performed at that particular location to obtain an indication of probable depth of scour around the bridge abutments. The Federal Highway Administration (FHWA) recommended equations for estimating the depth of local scour at bridge abutments.Ol These equations were developed by Laursen in a hydraulic flume for live bed and clear water scour.~l The equations have been used by State Highway Agencies (SHA) during their design of new bridges, and during evaluation of existing
1

bridges for scour susceptibility. However, hydraulic engineers from the FHWA and SHA have found that these equations overestimate the scour depth at_ bridge abutments. The estimated scour depth obtained from these equations suggests the need to design deeper bridge foundations for new structures andjor to design a reliable countermeasure to prevent the development of scour for new or existing bridge structures.
Preliminary investigation conducted in this research demonstrated that the toe of the abutment and floodplain near the toe are more vulnerable to rock failure, depending on the abutment shape. This research investigates the parameters that significantly influence the stability of rock riprap to protect the toe of the abutment and the surrounding floodplain. The research objectives were to identify the vulnerable zone of initial failure using two types of abutment shapes; to identify the parameters which influence the boundary conditions in the flow obstructed by the abutment located in the floodplain; and to determine the influence of these parameters on the stability of the rock to protect the toe of bridge abutment and the surrounding floodplain.
These objective were met by conducting two experimental investigations:
1. Average Point Velocity Measurements -- Tests were performed to determine the location of the highest averaged point velocities normal to the flow within the flow constricted for smooth bed (abutment model in floodplain, but no rock in the floodplain bed) and obstructed flow (abutment model in floodplain and rock placed in the floodplain bed).
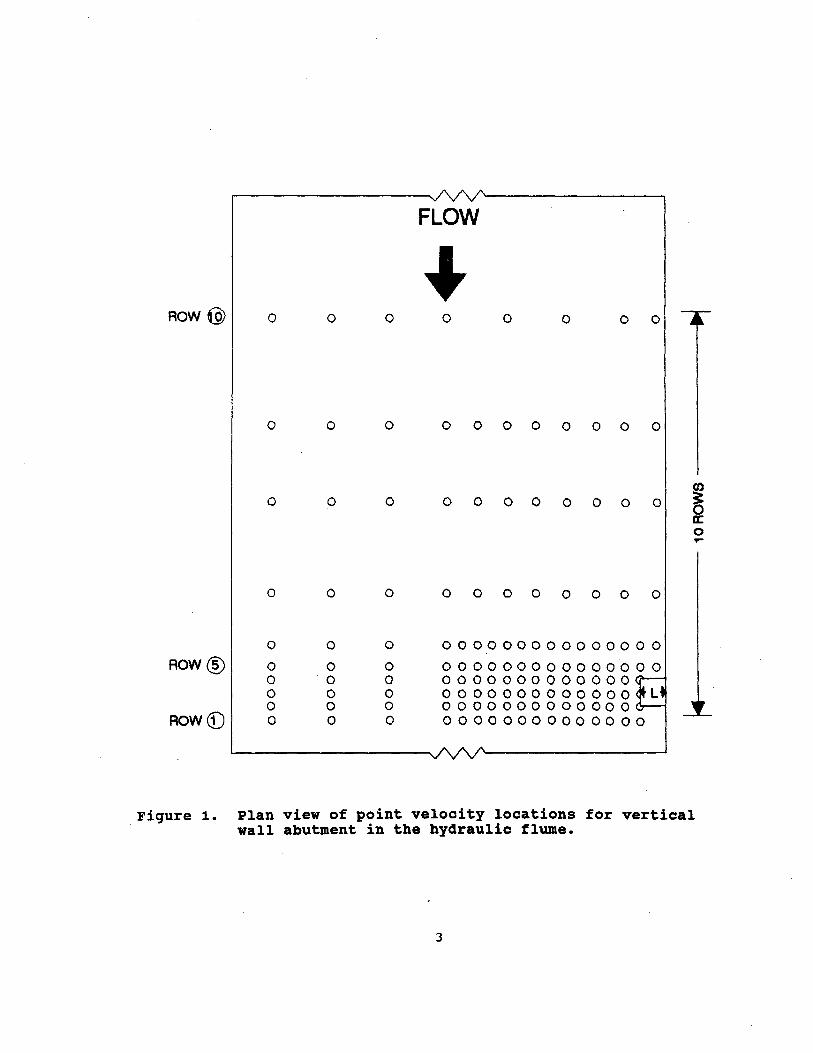
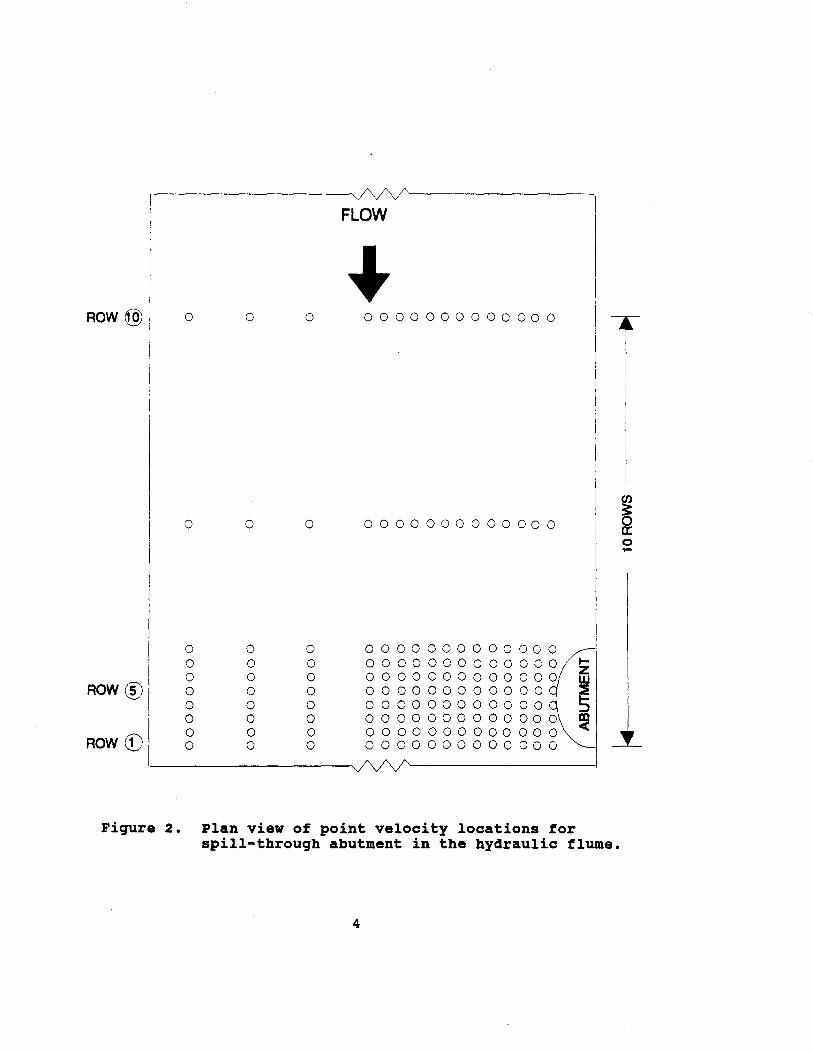
A detailed velocity profile for smooth bed was taken during the investigation to determine the location of the highest average velocities normal to the flow constricted by the abutment within the floodplain, and to determine how far away from the abutment the velocities within the constriction are affected by the abutment model. Figures 1 and 2 show a grid of the location of velocity points for the vertical wall and spill-through abutment models, respectively.
It was learned from the smooth bed velocity profiles that for the vertical wall abutment, the location of the highest average velocities occur in row 2 (See figure 1). Once it was learned that the highest velocities occur in row 2, a new grid was developed for obstructed flow, and rows 2 and 10 were kept for data collection. Row 10 represents the location of the approach point velocity profile with respect to the contraction. This row was located 9.26 ft (2.82 m) upstream of the normal face of the vertical wall abutment to the flow in the floodplain.
2
ROW@
ROW@)
ROW(£)
. Figure 1.
FLOW
0 0 0 0 0 0 0 0
0 0 0 0 0 00 0 00 0
0 0 0 0 0 00 0 0 0 0 (/)
~ a: 0 .,..
0 0 0 0 0 00 0 00 0
0 0 0 000000000000000
0 0 0 000000000000000 0 0 0 0000000000000 0 0 0 0000000000000 0 0 0 0000000000000 0 0 0 00000000000000
Plan view of point velocity locations for vertical wall abutment in the hydraulic flume.
3
FLOW
ROW@ 0 0 0 0000000000000
0 0 0 0000000000000
0 0 0 0000000000000 0 0 0 0000000000000 1-z 0 0 0 0000000000000 w
ROW@ 0 0 0 000000000000 ~ 0 0 0 000000000000 :::> 0 0 0 0000000000000 ~ 0 0 0 0000000000000
ROW~ 0 0 0 0000000000000
Fiqure 2. Plan view of point velocity locations for spill-throuqh abutment in the hydraulic flume.
4
~ 0 ....
The smooth bed velocity profile for spill-through abutment demonstrated that the location of the highest average velocities occur in row 1 (See figure 2). A new grid was also developed for this abutment shape and rows 1 and 10 were kept for data collection. Row 10 represents the location of the approach point velocity profile with respect to the contraction. This row was located 7.58 ft (2.31 m) upstream of the normal face of the spill-through abutment to the flow in the floodplain.
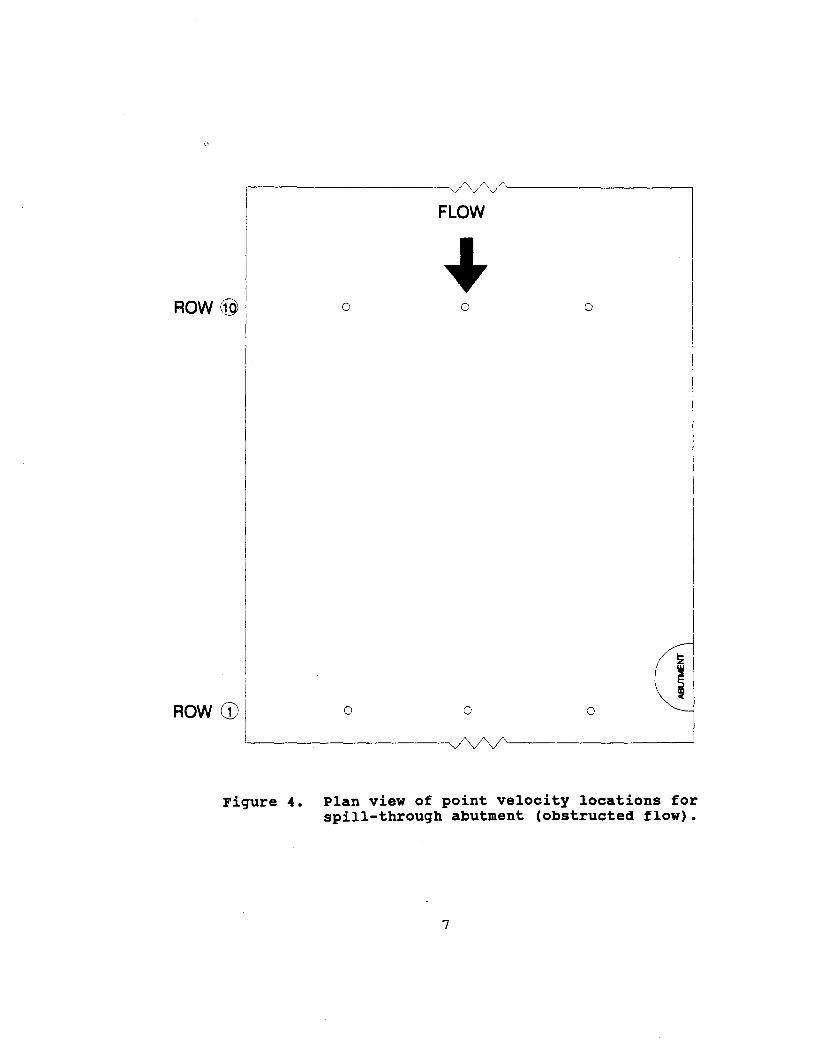
For the obstructed flow experiments only three equally spaced average point velocities were taken within the contraction. Figures 3 and 4 show the new grid developed for the vertical wall and spill-through abutment shape, respectively.
It was learned from the smooth bed experiments that the readings of average point velocity near the face of the abutment parallel to the flow were severely affected by the turbulence of the flow. Low velocity readings were measured near the face of the abutment as a result of the turbulence. Figure 5 shows a plot of average point velocity profile for readings taken near the parallel face to the flow using the vertical wall abutment. Figure 6 shows a plot of average point velocities profile for readings taken near the parallel face to the flow using the spill-through abutment. These figures show the low velocity readings measured near the abutment face parallel to the flow.
Furthermore, the experiments for disturbed flow demonstrated that the vulnerable zone for initial failure of gravel occur near the toe of the abutment models used in this investigation.
This indicates that the measured velocities near the face of the abutment were severely affected by the turbulence of the flow when forced to go through the contraction.
The velocity of the flow near the face of the abutments have to be much higher than those measured during the experiments to cause the initial motion of the gravel located at the toe of the abutment.
This report will present an indirect method to obtain the velocity near the face of the abutment at which the incipient motion of gravel is observed. This velocity is a function of the abutment type and the average contracted velocity in the floodplain.
2. Model Riprap Displacement -- Experiments were performed to determine the location of the vulnerable zone for initial failure and critical condition for displacement of uniformly graded angular gravel. The g~avel was placed in a depression
5

Flow
ROW@ 0 0 0
L ROW@ 0 0 0
Fiqure 3. Plan view of point velocity locations for vertical wall abutment (obstructed flow).
6
FLOW
ROW@ 0 0 0
ROW G) 0 0 0
Figure 4. Plan view of point velocity locations for spill-through abutment (obstructed flow).
7

2 r-----------------------------------------------~
en 1.5
~ z-0 § CD a: In a ~ 8 ....J w >
~ 0.5 a..
ABUTMENT
0 ~----~~--~------L------L----~------~-----L----~ 20 15 10 5
POINT VELOCITY LOCATION
LEGEND:
Fiqure s. Averaqe point velocity profiles for vertical wall abutment.
Note: 1 ft = 0.3048 m
8
0

fl z 0 § IX)
a: ~ 0
~ ~ w > !z ~
3
2.5
2 ~
AOW®
1.5
1
ABUTMENT
0.5 12 10 8 6 4 2
VELOCITY POINT LOCATION
LEGEND:
• • • • ROW ()
-Row®
Figure 6. Average point velocity profiles for spill-through abutment.
Note: 1 ft = 0.3048 m
9
0

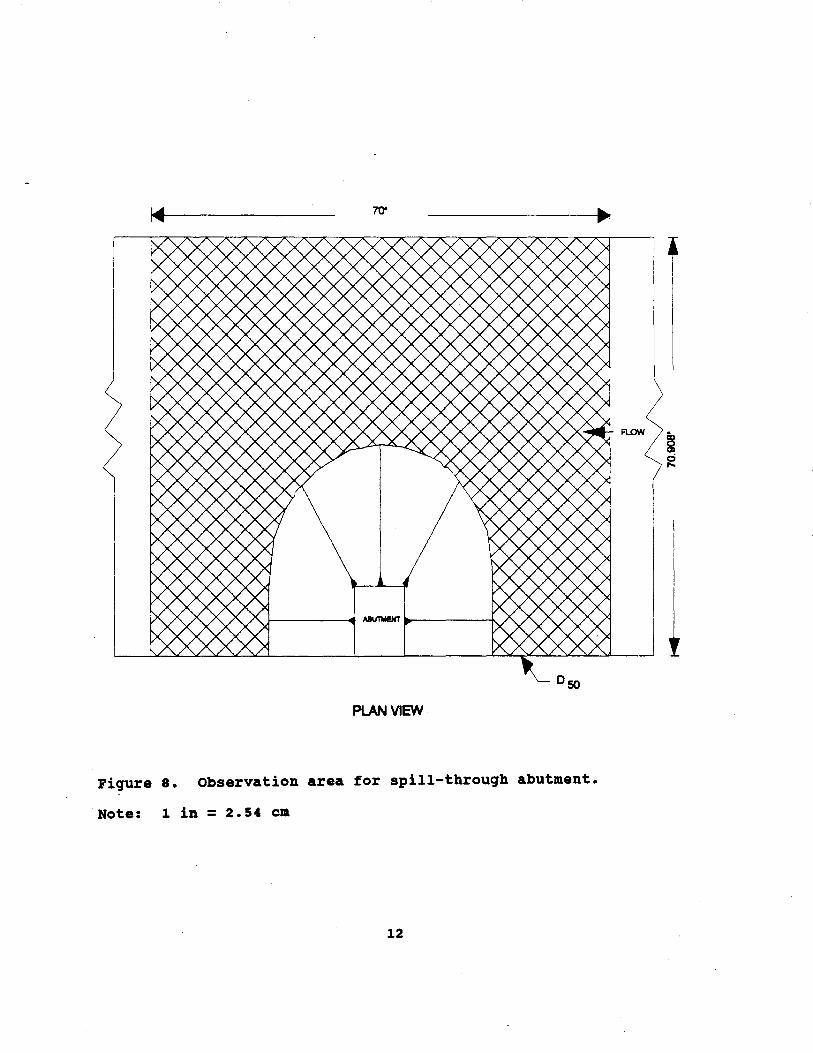
area (herein called the observation area) in the bottom of the hydraulic flume. The gravel was placed around the toe of the abutment model and was extended across the flume width. Figures 7 and 8 show the observation area for the vertical wall and spill-through models used in this investigation.
The following parameters were varied during the experiment:
• Average Depth of Contraction. • Discharge. · Median Rock Size (D5o) • · Abutment Shape. • Abutment Length. • Tailgate Height.
10

30"
H
_,
t
PlAN VIEW
Figure 7. observation area for vertical wall abutment.
Note: 1 in = 2.54 em
11
I ..
PlAN VIEW
Figure a. Observation area for spill-through abutment.
Note: 1 in = 2.54 em
12
CHAPTER 2
LITERATURE REVIEW
1. INTRODUCTION
Scour at bridges is one of the main concerns that hydraulic engineers face in river mechanics. The construction of a bridge structure on a river system can have a significant general and local effect on the geomorphology and hydraulics of a river.
Local scour at abutments involves the removal of material from the channel bed or banks. It is caused by the acceleration of the flow deflected by obstructions such as piers or abutments.
The development of vortex system induced by the obstruction to the flow is the principal mechanism for the development of local scour. The strength of the vorticity generated by the deflection of the flow is related to the depth of flow, abutment length and shape, alignment of the abutment with respect to the flow, size of bed material, rate of bed transport, and ice or drift accumulation.
Laboratory measurements indicate that the velocity of the flow in the area away from the vicinity of the abutment is not influenced by the presence of the abutment. Hence, scour at abutments can be considered as a local phenomena, and not being significantly related to the overall geometry of the flow. <4> This was confirmed during this investigation.
The scour hole pattern in an unprotected channel being obstructed by either a vertical wall or spill-through abutment normal to the flow has been observed at the upstream corner of the abutments. <S>
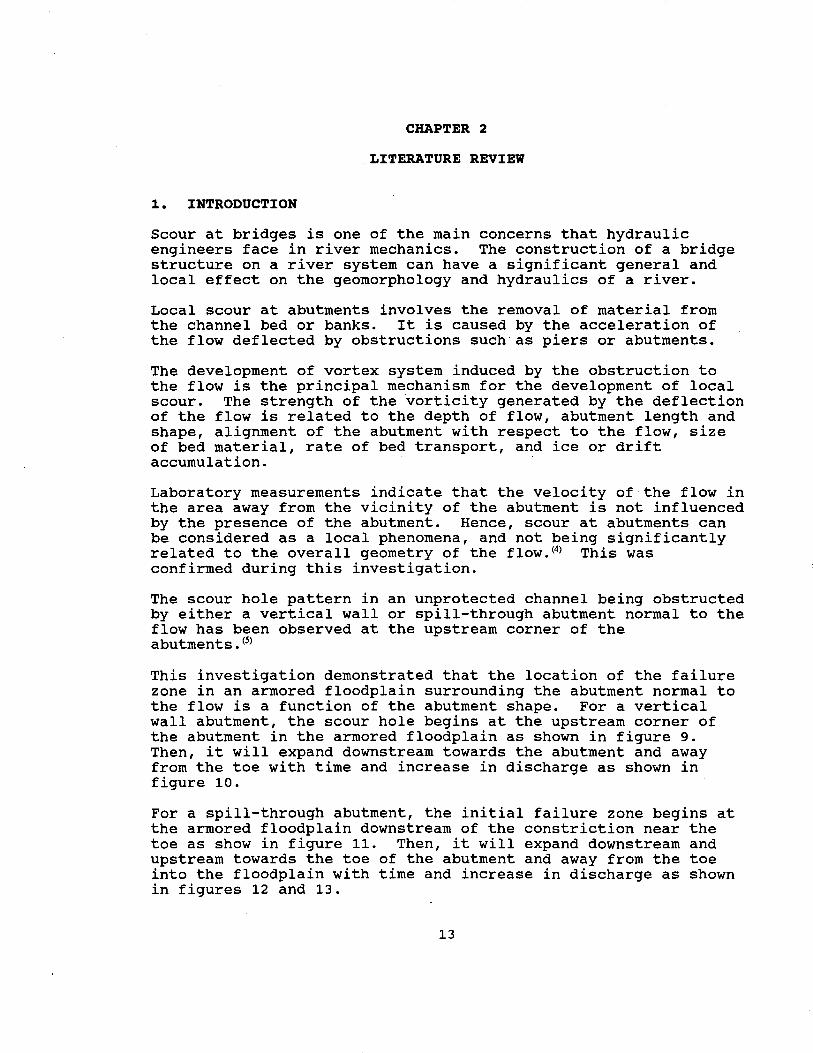
This investigation demonstrated that the location of the failure zone in an armored floodplain surrounding the abutment normal to the flow is a function of the abutment shape. For a vertical wall abutment, the scour hole begins at the upstream corner of the abutment in the armored floodplain as shown in figure 9. Then, it will expand downstream towards the abutment and away from the toe with time and increase in discharge as shown in figure 10.
For a spill-through abutment, the initial failure zone begins at the armored floodplain downstream of the constriction near the toe as show in figure 11. Then, it will expand downstream and upstream towards the toe of the abutment and away from the toe into the floodplain with time and increase in discharge as shown in figures 12 and 13.
13

i ....
OBSERVATION AREA
.....
PLAN VIEW
Figure 9. Location of initial failure zone for verticRl wall abutment.
Note: 1 in = 2.54 em
14
f I I
! I
I I
I I
'

Fiqure 10. Plan view of failure zone of the qravel with time and increase in discharqe for vertical wall abutment.
15

!01111 7rJ' ~
I+ I !
OBSERVATION MEA I I
I INITIAL FAIWAE ZONE
~ 0
~FLOW Q,
r~ I
I I I
I I
ABUTMENT I
!
PLAN VIEW
Fiqure 11. Location of initial failure zone for spill-throuqh abutment.
Note: 1 in = 2.54 em
16

FLOW
Figure 12. Plan view of failure zone of the gravel with time and increase in discharge for spill-through abutment.
17

Fiqure 13. Upstream view of failure zone of the gravel with time and increase in discharge for spill-through abutment.
18

2. ROCK RIPRAP AS A SCOUR COUNTERMEASURE
The FHWA reported that 86 percent of the Nation's 577,000 bridges on the National Bridge Inventory are built over waterways.<~ Because the bridge structures are a vital part of our Nation's transportation system, the FHWA developed Interim Procedures for Evaluating Scour at Bridges to provide guidance to SHA on how to treat scour at bridges.m These procedures were published with FHWA Technical Advisory T 5140.20 "Scour at Bridges."(])
Equations are presented in the interim procedures for estimation of scour depth at bridge piers and abutments. The equations were developed by Laursen in 1960 for live bed and clear-water scour and are based on laboratory experiments and inductive reasoning from sediment continuity equations; however, these equations tend to overestimate the scour depth at bridge abutments.
A commonly used countermeasure to prevent the development of scour holes is rock riprap. The design of riprap as a countermeasure for bridge piers and abutment protection involves the assessment of several factors associated with the river environment, bridge site, and quality of riprap material. Inadequate recognition of the erosion process that is occurring or improper riprap design may lead to failure of the riprap.
FHWA publication HEC-11 and the United States Geological Survey (USGS) publication "Evaluation of Riprap Design Procedures" present suggested specifications for rock riprap such as rock characteristics size, resistance, gradation, and construction requirements. <8•9l
The characteristic rock riprap size is generally taken as the median diameter (mean rock size), D50 • The rock should also be resistant to weathering and to water action; resistant to disintegration from the type of exposure; and withstand abrasive action from material transported by the stream.
Equations have been developed to relate the rock size and scour depth at the toe of channels. For instance, the USGS developed an equation to estimate the depth of toe trench to prevent undermining of the riprap on a channel slope:<10l
Where:
ds(max) = 6 . 5 * D50 - 0 . 115
ds(maxl = Estimated Maximum Depth of Scour for Alluvial Bed Channels, ft
D~ Median Diameter of Bed Material, ft
19
( 1)
FHWA Publication HEC-11 recommends that the rock riprap layer to protect embankments be extended a minimum vertical distance of 5 ft (1.52 m) below the stream bed, and on a continuous slope with the channel embankment. <8>
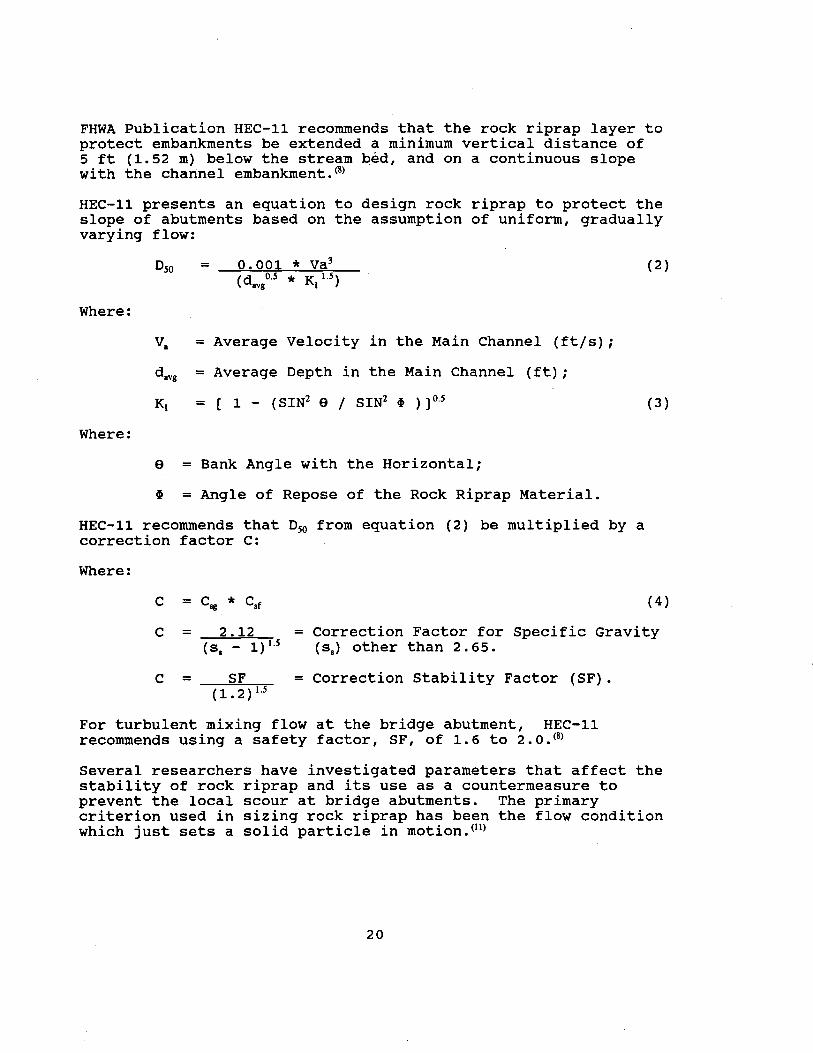
HEC-11 presents an equation to design rock riprap to protect the slope of abutments based on the assumption of uniform, gradually varying flow:
Where:
Where:
0.001 * va3 Dso = ( d o.s * K u) avg 1
v. =Average Velocity in the Main Channel (ft/s);
davg = Average Depth in the Main Channel (ft);
= [ 1 - ( SIN2 9 / SIN2 t ) ] 0·5
e = Bank Angle with the Horizontal;
t = Angle of Repose of the Rock Riprap Material.
HEC-11 recommends that 0 50 from equation (2) be multiplied by a correction factor c:
Where:
(2)
(3)
(4)
c = 2.12 ( ss - 1) 1.5
= Correction Factor for Specific Gravity ( ss) other than 2. 65.
c = SF (1.2)1.5
=Correction Stability Factor (SF).
For turbulent mixing flow at the bridge abutment, HEC-11 recommends using a safety factor, SF, of 1. 6 to 2. 0. <8>
Several researchers have investigated parameters that affect the stability of rock riprap and its use as a countermeasure to prevent the local scour at bridge abutments. The primary criterion used in sizing rock riprap has been the flow condition which just sets a solid particle in motion. <H>
20

Shields conducted experiments with uniform non-cohesive sediment sizes to develop his incipient bed motion diagram which proposes the following relation: <14>
T.c = f(R.) (5)
Where:
T •c = Critical Non-dimensional Boundary Shear Stress
Defined as:
T~ = T/[ g * (S.G. -1)] (6)
Where:
T = '"t * R. * S
S.G. = Specific Gravity of Rock
R. = Particle Reynolds Number Expressed as:
R. = u. * Dfv- (7)
u. =Velocity of Flow (ft3js).
When the boundary shear stress is equal to the critical shear stress, the rock riprap will begin to move. Gessler noted that because of fluctuations in turbulence intensity and in nonuniformity of channel bed material, Shields criteria must be a probabilistic procedure.on Neill and Yalin indicated that the wide scatter of points on some recent revisions of the Shields' diagram is evidence that subjective assessment of the "beginning of bed motion" is unsatisfactory.o~
The peaks of turbulent fluctuations are competent to cause the displacement of bed material. Because these peaks are statistically disturbed, rare grain movements can take place even at low values of the mean time-average shear.
3. VELOCITY-BASED CRITERIA
Many researchers have developed equations relating the critical conditions based on average velocity. Isbash presented an equation that can be expressed as: <B>
(8)
21

For loose stone lying on top of the fill, N~ is expressed as:
N~ = Vmin2/[2 * g * 0 50 *{S.G. -1)] (9)
E = 0.86
For stones deposited into flowing water and rolled until find a "seat" and a support, N~ is expressed as:
N~ = VmA//[2 * g * D50 *(S.G. -1)]
E = 1. 44
Neill established a relation for "first displacement" of uniformly graded gravel based on uniform flow parameters. <12>
(10)
A conservative design curve expresses in the following relation was presented:
N~ = 2 0 50 * (Dg I d) -0·20 ( 11)
Neill compared his results with those of Mavis, Ho and Tu, Schaffernak, Meyer-Peter and Muller, and Linnton Hydraulic Laboratory and found good agreement. <14> Parol a conducted experiments using Neill's criteria for first displacement and found good agreement, too. <14> Figure 14 shows the sediment number curve, N~, based on Neill's and Parola's experiments for undisturbed flow.
An averaged design curve for Neill's and Parola's experiments for undisturbed flow is presented as follows:
(12)
Parola investigated the stability of rock riprap for bridge piers using the modified Isbash equation (10).<14> He found a velocity multiplier to be applied to the average approach velocity to the pier to determine the stable rock riprap size. Parola suggested computing the velocity by using the continuity equation in the form of:
V = Q/A (13)
22

5 5
3 3
2 2
' "'
!1)
> «
o'i. « 0.5 0.5 Cl
II 0.3 0.3 z
0.2 0.2
0.1 t__ ___ ___L __ ..J._ __ ___i.,_ ____ .L_ ___ _L __ ....L_ __ _L. ___ ___J 0.1
0.01 1 0.02 0.03 0.05 0.1 0.2 0.3 0.5
Dso --d
LEGEND:
o Neill (1967), Undisturbed Flow
• Parola (1990), Undisturbed Flow
Figure 14. Sediment number curve for unobstructed flow.
23

Where:
V =Average Channel Velo9ity (ft/s);
Q =Discharge in Channel (ft3js); and
A= Area of Flow (ft2).
To determine the stable size of rock riprap, Parola recommended using equation (10) in the following form:
Where:
0 50 = 0. 692 (K * V2)
(s -1) * 2 * g
K = Coefficient for Pier Shape. = 1.5 for Round-Nose Pier. = 1.7 for Rectangular Pier.
V =Average Velocity Approaching the Pier (ft/s);
s = Specific Gravity of the Rock Riprap; and
g = Gravitational Acceleration = 32.2 ftjs2 •
(14)
Parola recommended to apply his multiplier to the average velocity computed from the equation (13) to obtain the average velocity approaching the pier, v. The multiplier ranges from 0.9 for a pier near the bank in a straight uniform reach of the stream to 1.7 for a pier in the main current of flow around a bend.
Maynord conducted laboratory experiments of model rock riprap with the form of Neill's equation to develop a uniform flow relation for "incipient failure" of non-uniform graded model rock riprap using 030 as the rock characteristic size. <IS) The relation can be expressed as follows:
N sc = 3 . 3 3 * ( 030 I d) -0.20 (15)
By rearranging equation (14) for 030/d, we obtain:
Where:
030 = Rock Riprap Size for Which 30 percent is Finer by Weight, in ft;
V = Local Average Velocity, in ftjs.
24
Equation (16) is applicable to channel bottoms or side slopes less or equal to H:V = 2:1. A safety factor, SF, equal to 1.2 should be applied to equation (16) for stability.
Simons and Lewis suggested the use of velocities near the outlet of the constriction at the vena contracta of the jet caused by the flow realignment induced by the abutment. <16> They recommended an equation to describe the stability of riprap for spill-through abutments as:
1\. = {(0.4 * u2r) I [(S.G. -1) * g * d]}
Where:
~ = Stability Factor.
For flow over a horizontal bed, n = 0.595; equation (17) is expressed as follows:
0.595 = {(0.4 * u\) I [(S.G. -1) * g * Dm]}
Simplifying equation (18) we obtain:
1.49 = { u2r I [(S.G. -1) * g * Dm]}
Where:
Ur =Bed Velocity at One Rock Diameter (ftls).
Dm =Effective Diameter of Rock Mixture (ft).
4. SUMMARY
(17)
(18)
(19)
Most researchers performed investigations dealing with protection of channel slopes, and slopes of spill-through abutment with limited research as to the most vulnerable zone within the bridge constriction. The use of average boundary shear alone obtained by analytical means or experimental means may be insufficient to determine the flow conditions for the stability of rock riprap for protection of bridge abutments, especially in zones of intense turbulence. This study investigates the stability of rock riprap in the vicinity of abutments located in floodplains away from the main channel using the average computed velocity in the maximum contraction of the bridge abutment.
25

CHAPTER 3
EXPERIMENTAL PLAN
1. BACKGROUND
The purpose of the experiment was to determine the location of the most vulnerable zone for incipient motion of uniformly graded angular gravel and to develop a design procedure to determine the stable rock riprap size to protect the vulnerable zone of the bridge abutments from scour. Two abutment shapes were modeled: Vertical Wall and Spill-Through (H:V = 2:1).
Two experimental investigations were performed: measurement of two-dimensional average velocities without gravel surrounding the toe of the obstruction (abutment model) and the determination of flow conditions that caused the displacement of uniformly graded angular gravel.
2. TEST FACILITIES AND INSTRUMENTATION
The experiments were conducted in the FHWA hydraulic laboratory facilities located at the Turner-Fairbank Highway Research Center, McLean, Virginia. Test facilities and instrumentation used during the experiments are described in this section.
a. HYDRAULIC FLUME
The experiments were conducted in a 70 ft (21.34 m) long by 5 ft 10 in (1.78 m) wide rectangular flume. The walls of the flume are made of a smooth glass. The bottom of the flume for this experiment consisted of marine plywood coated with tar and fine sand. A view of the hydraulic flume is shown in figure 15. Maximum discharge generated by the pump used in the flume is approximately 11 ft3 js (0.31 m3js); however, for the experiments this capacity was not needed.
b. ELECTROMAGNETIC VELOCITY METER OPERATION
The two-directional mean flow velocities in a plane parallel to the flume were measured using a 13-mm spherical electromagnetic velocity sensor (Marsh-McBirney 523). A fluctuating magnetic field was produced in the fluid surrounding the spherical sensor that was orthogonal to the plane of four carbon tipped electrodes. As a conductive fluid passed around the sensor, an electric potential was produced proportional to the product of the fluid velocity component tangential to the surface of the sphere and normal to the magnetic field and the magnetic field strength. The electrodes, located at the four locations on the sensor, detected the voltage potential created by the flowing
26
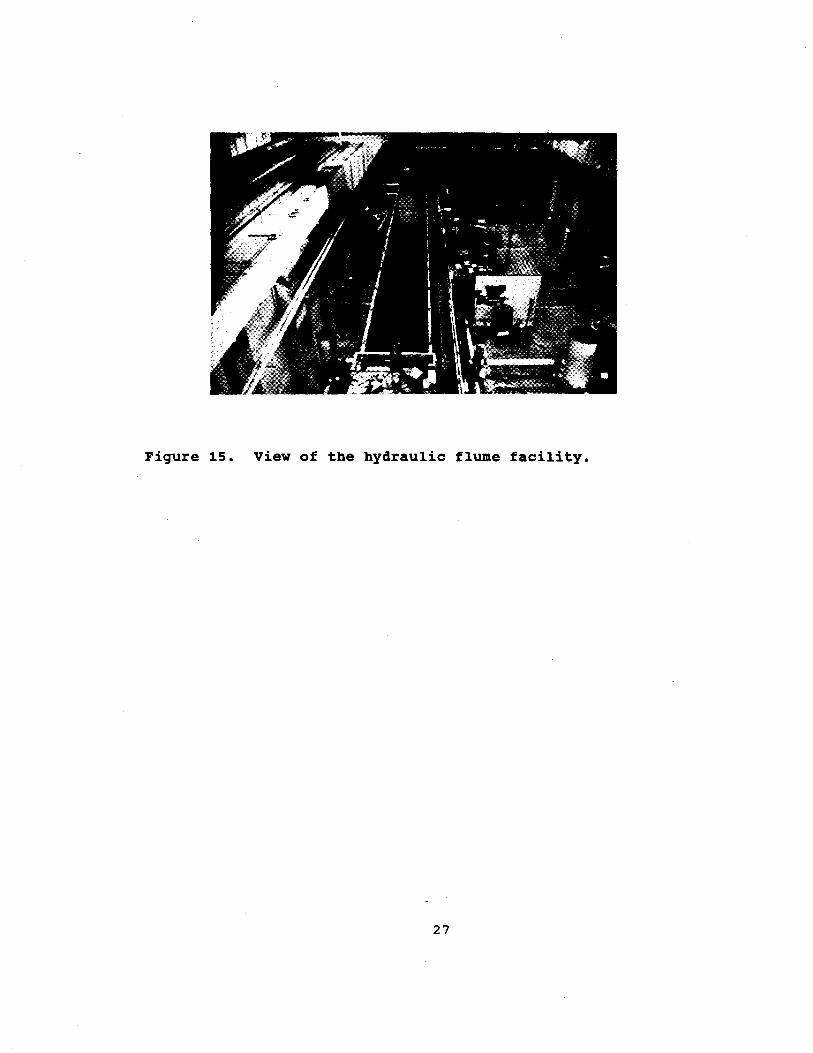
Figure 15. View of the hydraulic flume facility.
27

water. The voltage potential produced was proportional to the velocity of the fluid flowing in the plane of the electrodes.
Two orthogonal velocity components in the plane of the electrodes were measured. Detailed information on the meter operation is available in the technical manual provided by the probe manufacturer (Marsh-McBirney 523 Reference Manual). The orthogonal velocity components were combined to determine magnitude of an equivalent uniform horizontal velocity vector using:
( 20}
The meter response period was adjustable from 0.2, 1, and 5 seconds. Throughout this investigation the response period was held constant at 0.2 seconds.
The advantages of using the spherical electromagnetic sensor were:
• The sensor did not need to be aligned with flow direction.
• The meter calibration of zero and gain were insensitive to temperature and, except for hydrocarbons, were relatively insensitive to contaminants.
The disadvantages of using the electromagnetic sensor include that:
• The size of the meter may have been excessive causing flow accelerations when placed close to the obstruction and/or averaging out the highest local velocity.
• Due to the relative slow response period of the meter, and accurate description of the turbulent velocity fluctuation could not be made.
• Only velocity components in the plane of the electrodes could be measured.
c. ABUTMENT MODELS
Two abutment shapes were modeled during the investigation: vertical wall and spill-through. The length of the models was varied to determine the effect of the encroachment in the incipient motion of the uniformly graded angular gravel surrounding the toe and at the floodplain.
(1} Vertical wall shape -- The vertical wall abutment consisted of a rectangular box constructed from marine plywood. It was
28

sealed to prevent splitting. The dimensions of this abutment were:
• Width • Height • Length
6 in (15.24 em) (Constant) 12 in (30.49 em) (Constant) 5 in (12.70) (Variable; 5 in (12.70 em) increment up to 20 in (50.81 em))
Figure 16 shows a diagram of the vertical wall abutment. Figure 17 shows a typical set up for the experiment using the vertical wall abutment model. The abutment model was bolted to the observation area at centerline location 25.50 ft (7.77 m) from a reference point location 35.00 ft (10.67 m) upstream of the model, and glued to the wall of the flume.
(2) Spill-through shape -- The spill-through shape abutment consisted of six elements assembled together to form this shape. Figure 18 shows a diagram of the combined sections forming this abutment shape. Figure 19 shows the spillthrough abutment model after assembled and mounted in the observation area. The spill-through abutment was also bolted to the observation area at centerline location 25.50 ft (7.77 m) from a reference point location 35.00 ft (10.67 m) upstream of the model, and glued to the wall of the flume.
The dimensions for this shape were:
• Width • Height • Length
46 in (116.87 em) (Constant) 12 in (30.49 em) (Constant) 25 in (63.52 em) (Variable; 5 in (12.703 em) increment up to 40 in (101.63 em))
The slope of the abutment was 2:1 (H:V). Preliminary investigation conducted with the spill-through abutment model with gravel on the slope, toe and floodplain was performed. This investigation demonstrated that the most vulnerable zone for incipient motion of the gravel is at the downstream of the constriction at the floodplain near the toe. Figure 11 shows the observed area of first incipient motion of the gravel.
Experiments using the spill-through abutment model were concentrated to determine the stability of the gravel to protect the vulnerable zone which was determined to be at the floodplain near the toe of the abutment.
3. GRAVEL PLACEMENT SETUP
Two different sizes of gravel were used in the experiments: D50 = 0.30 in (0.76 em), and 0.40 in (1.02 em). The gravel was placed in the observation area to a depth of 1.5 in (3.81 em) in
29

Tl
LENGTH
... I SIDE VIEW
PlAN VIEW
Fiqure 16. Diagram of vertical wall abutment.
30

Fiqure 17. View of typical setup for the vertical wall abutment in the observation area.
31

ID LJ ---•' <0
__.L
ID T ~
_j_ , .... VARIABLE ....., ~ 2<r -1
PLAN VIEW
1 ~ <
f lSl A SECTJONA-A
PLAN VIEW DETAIL
Figure 18. Diagram of the combined elements forming the spillthrough abutment model.
Note: 1 in = 2.54 em
32

Figure 19. View of a typical setup for the spill-through abutment in the observation area.
33

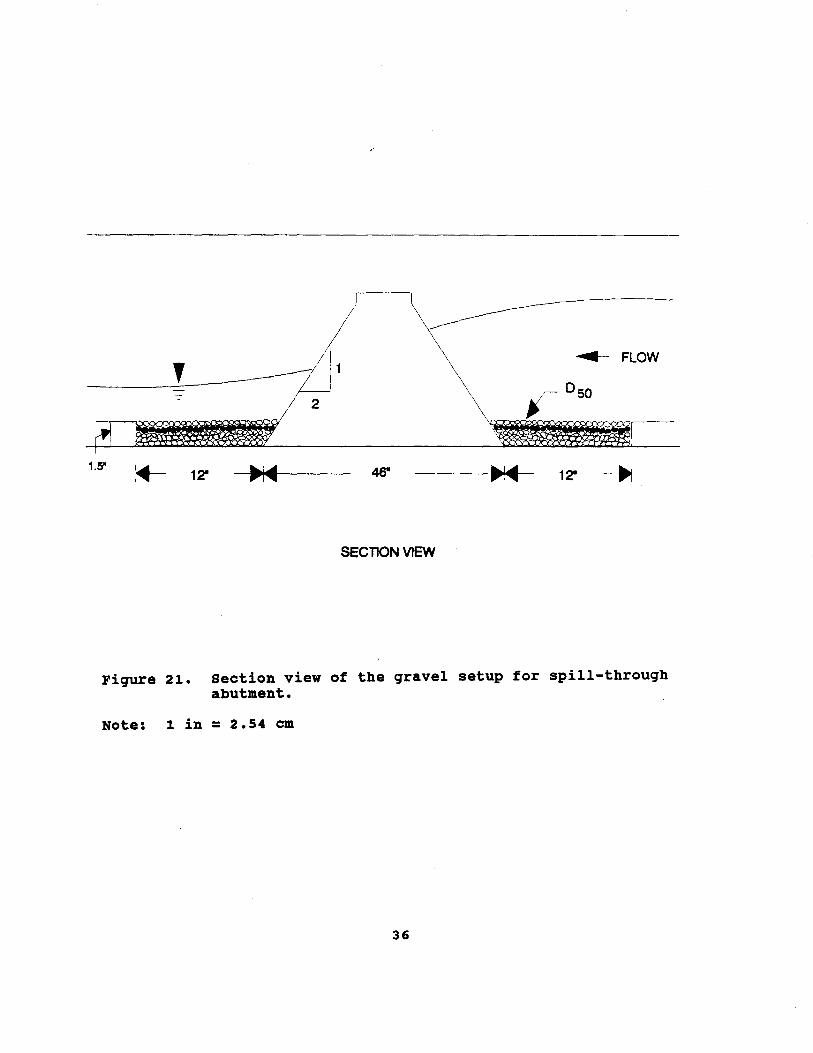
three non-uniform layers. For D50 = o. 30 in (0. 76 em), a thick, unpainted layer of gravel was first placed in the observation area. The thickness of this layer was approximately 0.90 in (2.29 em). Then, a red spray-painted gravel layer was placed over the unpainted layer in the observation area. The thickness of this painted gravel layer was approximately 0.30 in (0.76 em). The painted layer was covered with an approximately 0.30 in (0.76 em) thick layer of unpainted gravel. For D50 = 0. 40 in ( 1. 02 em), a thick, unpainted layer of gravel was placed at the bottom of the observation area. The thickness of this layer was approximately 0.70 in (1.78 em). Then, a red spray-painted gravel was placed over the unpainted layer. The thickness of this layer was approximately 0.40 in (1.02 em). This layer was covered with an approximately 0.40 in (1.02 em). thick layer of unpainted gravel.
Figure 20 shows a section view of the gravel setup for the vertical wall abutment model. Figure 21 shows a section view of the gravel setup for the spill-through abutment model. Discharges were computed for four different flow depths at the contraction for an assumed critical velocity (i.e., velocity that causes incipient motion of gravel). At a particular discharge and flow depth the tailgate located downstream of the flume was lowered at constant speed. Figure 22 shows a view of the tailgate downstream of the hydraulic flume. The failure criteria was established at the moment of observing exposure of red spraypainted rock in the observation area. Once the painted rock was observed to be exposed, the tailgate was stopped and measurements were taken. The direction of flow was always normal to the abutment model.
4. FRAMEWORK OF EXPERIMENTATION
The parameters that characterize the disturbed flow are:
Vee = Average Computed Velocity of the Contraction Flow at Observed Incipient Motion of Rock at the Contraction (ftjs).
dec = Average Computed Depth of the Contraction Flow at Observed Incipient Motion of Rock at the Contraction (ft).
w. =Width of the Approach Flow (ft).
Wt-c Width of the Contraction ( ft) •
D50 = Characteristic Median Rock Size on the Contracted Flow Bed (ft).
AS = Factor Associated with the Abutment Shape.
34

.,.._ FLOW
1.5"
SECTlON VIEW
Figure 20. section view of the gravel setup for vertical wall abutment.
Note: 1 in = 2.54 em
35
' 1
,..._ FLOW
2
1.5" ~ 12" 46" 12" ~
SECTION VIEW
Figure 21. section view of the qravel setup for spill-throuqh abutment.
Note: 1 in = 2.54 em
36
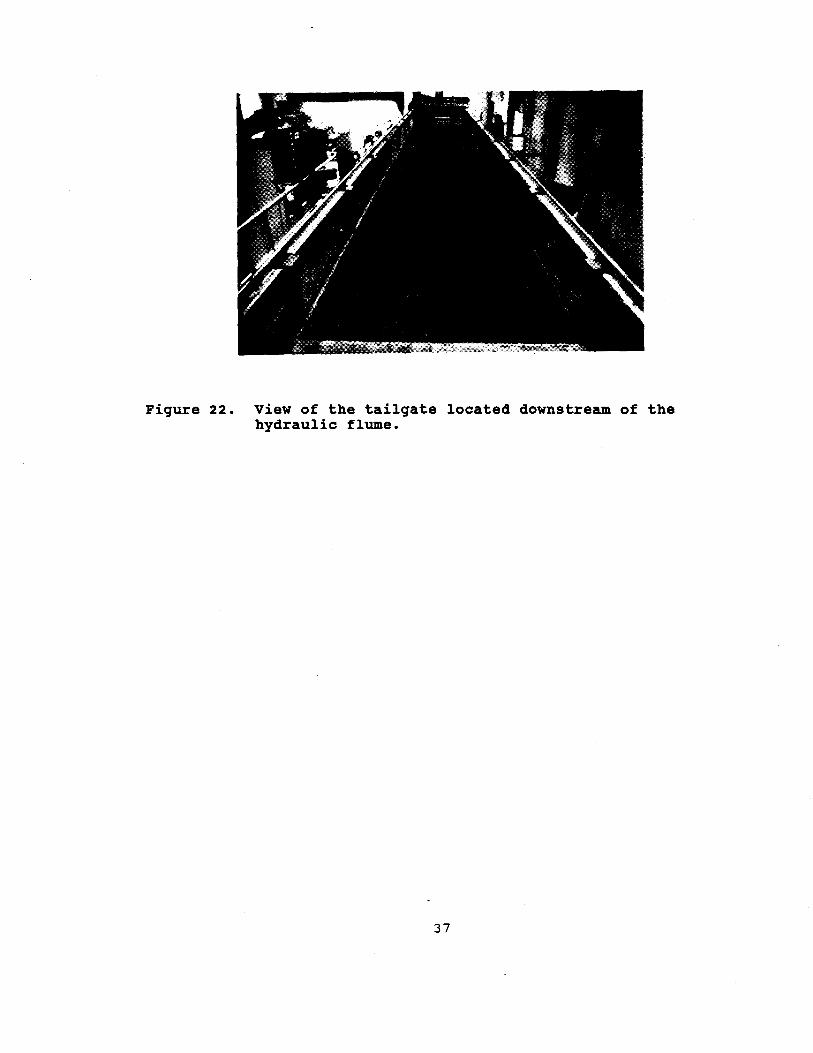
Figure 22. View of the tailgate located downstream of the hydraulic flume.
37

K = Roughness of the Bed Upstream.
K. = Roughness of the Bed surrounding the Obstruction.
g = Gravitational Acceleration (32 ftjs2 or 9. 8 mjs2)
p = Fluid Density (slugjft3).
P. = Rock density (slugjft3).
J.l. = Dynamic Viscosity of Fluid (slugjft-s).
The effect of displacement due to leaching of fines through the armored apron of gravel near the toe of the abutment and floodplain was not studied in this investigation.
The size of the bed material, D50 , in the obstructed area and the roughness in the vicinity of the obstruction, K., are dependent variables. For the purpose of this study, K. was assumed to be adequately represented by D50 • The characteristic parameters can be arranged into a functional equation that describes the critical conditions for the initial motion of the rock within the observation area as follows:
The parameter g must appear in combination with f. and, f as following:
'lS' = g * ( f. - f)
( 21)
(22)
Combining equations (21) and (22) in a non-dimensional form, we obtain:
Where:
Nse is defined in equation ( 8) and "V = (J.J./ f)
Yalin stated that (f./ f) "can be important only with regard to the properties associated with the "ballistics" of an individual grain. "<14> In case of the highly turbulent flows required to cause the initial motion of the rock protection, the influence of the obstruction particle Reynold Is number I vee * (D/T) was considered to be negligible because the Reynold's number was greater than 106 which is well beyond the range that Shields and other researchers found to be no longer a factor.
38

Therefore, neglecting the effect of (f./ f), and {Vee* (D/v-)}, equation (23) can be reduced as follows:
By using the contracted velocity in Noc, the effect of deefW., w.fwt-e' and k are negligible. Then equation (24) reduces to:
(24)
Nse = f(Dso/dect AS) (25)
Equation (25) provides the framework for this investigation. The quantity Nsc is defined in this investigation as the computed sediment number. The parameter D50/ dec represents the relative roughness of the contracted flow.
39

CHAPTER 4
EXPERIMENTAL RESULTS.AND DATA ANALYSIS
1. VERTICAL WALL ABUTMENT
The vulnerable zone for incipient motion for this abutment shape was observed at the upstream corner of the abutment as illustrated in Figure 9. The separation of flow created by the contraction of the abutment shape caused a strong turbulence particularly for deeper flows. With the flow depth and velocity at the approach and for a computed discharge at the approach (representing Q100}, the velocity and flow depth were computed at the contraction of the abutment in the floodplain using the Bernoulli's Energy equation (26} and the Continuity equation ( 27} :
( 26}
Where:
hL = Energy Losses (assumed to be negligible}.
(27}
Using equation (10}, the Sediment Number, N•e' was computed with Vee• The values of Nse were plotted versus the D50fdee ratio. Figure 23 shows a plot of the individual computed sediment number for vertical wall abutment for 050 = 0.30 in (0.76 em} and 0.40 in (1.02 em} for obstructed flow. Data used to develop figure 23 are tabulated on tables 1 and 2 in appendix A. These tables also show a measured N.m for comparison purposes. Figure 23 shows that the curves for the two sediment sizes which were derived by independent regressions were very close to one curve and were almost parallel to the unobstructed flow curve. The velocity, Vee' is the average computed contracted velocity in the opening for the obstructed flow, but observed failure is for any discernible area of particle movement in that opening. Figure 24 shows the combined sediment number curve for the two gravel sizes. This plot reveals that the slope of the combined curve follows the slope for the unobstructed flow curve. For the rock to fail at the toe of the abutment upstream of the constriction the local effective velocity must have been close to the unobstructed flow that would have caused failure.
For determining the stable size of rock riprap size, equation (10} should be rearranged as follows:
40
(28}

10 10 •
0
5 0 0
5 0
0
3 0 0 3
• -..- 2 2 cj
C\lg en - D 50 = 0.40" 0
... • • > g .. 1 1
Q ... C)
II 0.5 0.5 ~ z
0.3
0.2
0.1 0.01 0.02 0.03 0.05 0.1
Dso
dec
LEGEND: o Neill, Unobatructed Flow (1967)
• Parole, Unobatruc:ted Flow (1990)
0.2 0.3 0.5
o Flow Obstructed by Vertical Wall Abutment - 050 = 0.30"
• Flow Obatructed by Vertical Wall Abutment - 05() = 0.40'
0.3
0.2
0.1 1
Figure 23. Individual sediment number curve for vertical wall abutment.
Note: 1 in = 2.54 em
41

10
5
3
2 ~ -d
N 8 ~ > .. i
0 .. 01
II a 0.5
z
0.3
0.2
0.1
0.01 0.02 0.03 0.05 0.1
LEGEND: 0 Nell, ~Flaw (1e.l)
• f>IR*. lJnobllruclld Flaw (1110J
0.2
a Flaw Ol:lsln.dlcl 1:1¥ Verllcll Will Al:lutr'*1t- Dao • 0.30"
• FlawObeiNclld 1:1¥ Verllcll Willi Al:lutr'*1t- Dao• O.lt(f'
0,3 0.5
Fiqure 24. Combined sediment number curve for vertical wall abutment.
Note: 1 in = 2.54 em
42
10
5
3
2
0.5
0.3
0.2
0.1

Where:
Vee = Computed Average Velocity at the Contraction Within the Floodplain (ftjs) .
Substituting equation
0 50 = h. 064 * ' g * (
(29) in equation (28), we obtain:
vcc2 * d co.z'i\ 0.81
S.G. - 1)--;
(29)
(30)
Although equation (30) is not dimensionless as it is written, it is dimensionally homogeneous (i.e., can be reduced to the same units on both sides). This equation can be used with either SI or English units as long as consistent units are used in all of the terms.
Figure 25 presents a plot of Vcp/Vcc vs. XtfW1_0 • The velocity ratio, Vcp/V
00, represents the effective computed local velocity
(near the abutment face at which the rock failed) to the average computed contracted velocity in the floodplain within the contraction. At X1/W1_0 = 0 and for 95 percent of the computations, the ratio Vcp/Vcc fell near 2. 0. At X1/W1_0 = 0 and for 5 percent of the computations, the ratio Vcp/Vcc reached 2. 304.
The ratio of Vcp/Vcc also represents the indirect method or "velocity multlplier" which should be applied to the averaged computed contracted velocity in the contraction within the floodplain to obtain the velocity near the abutment face which caused the incipient motion of the gravel. This plot also shows that the effect of the abutment diminished quickly with distance from the abutment.
The discharge was increased 1.7 times the discharge that caused the incipient motion of the gravel and to observe the extent of the failure zone. The multiplier 1.7 is suggested in FHWA Interim Procedures to approximate Q500 from Q100 • <2> This demonstrated that the rock riprap apron should be extended along the entire length of the abutment, both upstream and downstream, and to the parallel face of the abutment to the flow.
Figure 25 also illustrates that the velocity amplification decays rapidly with distance from the toe of the abutment. Therefore, it would be reasonable to limit the rock riprap apron to a relatively small portion of the constriction. However, additional data analysis needs to be made to determine the extent of the rock riprap apron.
43

Figure 26. Drop in water surface elevation through the contraction of the spill-through abutment.
46

Fiqure 27. Turbulence of flow at the failure zone of the spillthrough abutment.
47

10 10
0 0
5 0 " 5 0
,., 0 0
0 0
3 0 0 3 Dso= 0.30" So 0
0 o a .,.... D 0
I
2 2 d II
C\1 8 cri • • > ... ~
c ... C)
II ~ z
I D
Dso= 0.40" ,. Obstructed
1 1
0.5 0.5
0.3 0.3
0.2 0.2
~---'----'-----'-----"-----'---....._--~--___j 0.1 0.1 0.01 0.02 0.03 0.05 0.1
Dso
dec
LEGEND:
o Nelli, Unobetructed Flow (1967)
• Parole, Unobatructed Flow (1990)
0.2 0.3
a Flow Obctructed by Spill-Through Abutment - o50 = 0.30"
• Flow Obatruetect by Spill-Through Abutment- o50 = 0.40"
0.5 1
Fiqure 28. Individual sediment number curve for spill-through abutment.
Note: 1 in = 2.54 em
48
...,g >
II li
z
;:-
d en . :il
0 . at
10
5
3
2
0.5
0.3
0.2
0.1 0.01
Figure 29.
0.02
•
0 0
0 0
0 C))
0 0
0 0 0
0 c
c c
c "· c • • ··' , a • • •• •
0.03 0.05 0.1 0.2 0.3
LEGEND:
o Nelli, lJnObAucllld Flaw (1987)
• ~~Flaw (111110)
0 Flaw CbWctld ~ Spill-Through Abulment - 0 110- 0.30"
• Flaw Ot:8truclld by BPI-Through Abulmllnl - 0 110• 0.40'
0.5
combined sediment number curve for spill-through abutment.
Note: 1 in = 2.54 em
49
10
5
3
2
0.5
0.3
0.2
0.1

Where:
Vee = computed average velocity at the contraction within the floodplain.
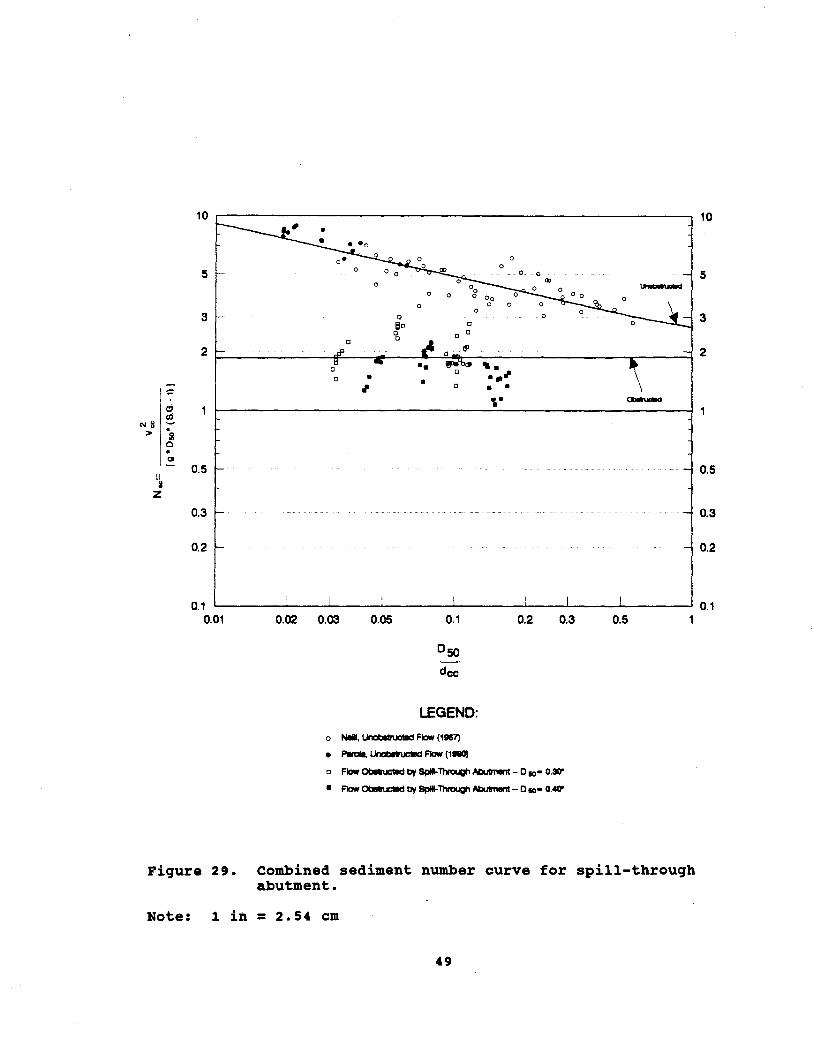
Figure 30 present a plot of Vep/Vce vs. XtfWt-c• The velocity ratio, V~/Vee' represents the effective computed local velocity (near the abutment face at which the rock failed) to the average computed contracted velocity in the floodplain within the contraction. At ~/Wt-c = 0 and for 97 percent of the computations, the ratio V~/Vce fell near 2. 0. At ~/Wt-c = 0 and for 3 percent of the computations, the ratio Vcp/Vee reached 2. 13 5.
The ratio of Vep/Vcc represents the indirect method or "velocity multiplier" wh1ch should be applied to the averaged computed contracted velocity in the contraction within the floodplain to obtain the velocity near the abutment face which caused the incipient motion of the gravel. This plot also shows that the effect of the abutment diminished quickly with distance from the abutment.
The discharge was increased 1.7 times the discharge that caused the incipient motion of the gravel observe the extent of the failure zone. The multiplier 1.7 is suggested on FHWA Interim Procedures to approximate Q500 from Q100 • <2> This demonstrated that the rock riprap apron should be extended along the entire length of the abutment, both upstream and downstream, and to the parallel face of the abutment to the flow. Figure 30 also illustrates that the velocity amplification decays rapidly with distance from the toe of the abutment.
Therefore, it would be reasonable to limit the rock riprap apron to a relatively small portion of the constriction. However, additional data analysis needs to be made to determine the extent of the rock riprap apron.
Appendix D, tables 8 through 10; appendix H, tables 20 through 22; and appendix L, tables 41 through 56 were used to generate figure 30. Data shown in appendix F, tables 14 through 16; and appendix J, tables 26 through 28 were used for data comparison.
50

3 .---------------------------------------------------------------~ 3
2.5 2.5
Flow Dllph- Flom0.118' 100.794'.
2 2
0
c..l 8 1.5 -:: >
1.5 0.375' < delle < 0.125'
0
0.5
0 0
• 0
0
dalic <- 0.375'
0.5
0 ~----~----------~------------~----------~------------~----------~ 0 0 0.2 0.4
Xt
Wt-c
0.8 0.1
Fiqure 30. Point velocity ratio for spill-throuqh abutment.
Note: 1 in = 2.54 em 1 ft = 0.3048 m
51

CHAPTER 5
CONCLUSIONS AND RECOMMENDATIONS
This research demonstrated the following:
1. The location for the most critical failure zone on an abutment encroaching the free flow of water on the floodplain depends on the abutment shape.
2. The turbulence of flow and vorticity generated near the face of the abutment are the causes for rock riprap failure.
3. The velocities diminish in intensity and stabilize as distance from the toe of the abutment increases.
4. The critical failure zone of the gravel occurs at the upstream corner of the vertical wall abutment and will expand downstream towards the abutment and away from the toe with time and increase in discharge.
5. It is recommended to use equation (30) to determine a stable rock riprap size to protect the toe of vertical wall abutments.
6. The critical failure zone for the spill-through abutment shape was observed downstream of the contraction near the toe and will "grow" downstream and upstream of the constriction expanding to the toe and away from the abutment.
7. It is recommended to use equation (31) to determine a stable rock riprap size to protect the toe and floodplain near the toe of the spill-through abutment.
8. Further data analysis is needed to determine the extension of the rock riprap apron for both, vertical wall and spillthrough abutment.
9. Preliminary experiments conducted on the spill-through abutment with H:V = 2:1 demonstrated that the most vulnerable failure zone is at the floodplain near the toe of the spillthrough abutment.
10. The recommendations presented in this research are limited to abutments encroaching up to 14 percent onto the floodplain for vertical wall abutment, and 20 percent onto the floodplain for spill-through abutment shape.
52

11. Further research is needed to investigate the effect of a greater encroachment onto the floodplain on the stability of the rock riprap.
12. Further research is needed to investigate the effect of abutments in a skew to the flow on the stability of the rock riprap and the effect of the main channel in the stability of the rock riprap.
53

CHAPTER 6
EXAMPLE PROBLEMS
1. VERTICAL WALL ABUTMENT
Determine stable rock riprap size to protect the toe of a vertical wall abutment encroaching the left outer bank (floodplain) of a stream. The length of the vertical wall abutment is 10ft (3.048 m). The floodplain length is 100ft (30.48 m). A water surface profile computation at the floodplain shows an average contracted depth of 5 ft (1.524 m) and an average contracted velocity of 6 ft/s (1.829 m). A nearby quarry has rock having a specific gravity = 2.85 lb/ft2
(136.8 n/m2 ) and can produce the 0 50 gradation.
**** Check Encroachment Limit (not to exceed 14 percent) ****
· Abutment length = 10 ft (3.084 m) • Floodplain length = 100 ft (30.84 m)
(10/100) * 100 = 10 percent encroachment --- OK!
Using equation (30), D50 = 0.93 ft (0.28 m).
54

2. SPILL-THROUGH ABUTMENT
Experimental research has demonstrated that the vulnerable zone for initial failure of rock riprap used in an armored floodplain protecting the toe of a spill-through abutment is at the floodplain near the toe of the abutment.
· Determine a stable rock riprap size to prevent failure of the rock riprap at the floodplain near the spill-through abutment. The floodplain length is 150 ft (45.72 m) from which 25 ft (7.62 m) are encroached by the abutment. The slope of the spill-through abutment (H:V) is 2:1. The average contraction depth of flow and average contraction velocity in the floodplain are 4 ft (1.22 m) and 8 ft/s (2.44 mfs), respectively. Use specific gravity equal to 2.85 lb/ft2 (136.8 nfm2
).
**** Check Encroachment Limit ( not to exceed 20 percent) **** · Abutment length = 45 ft (13.72 m) · Floodplain length= 150 ft (45.72 m)
(25/150) * 100 = 20% encroachment OK!
Using equation (31), D50 = 0.57 ft (0.174 m).
55
APPENDIX A
SEDIMENT NUMBER FOR VERTICAL WALL ABUTMENT
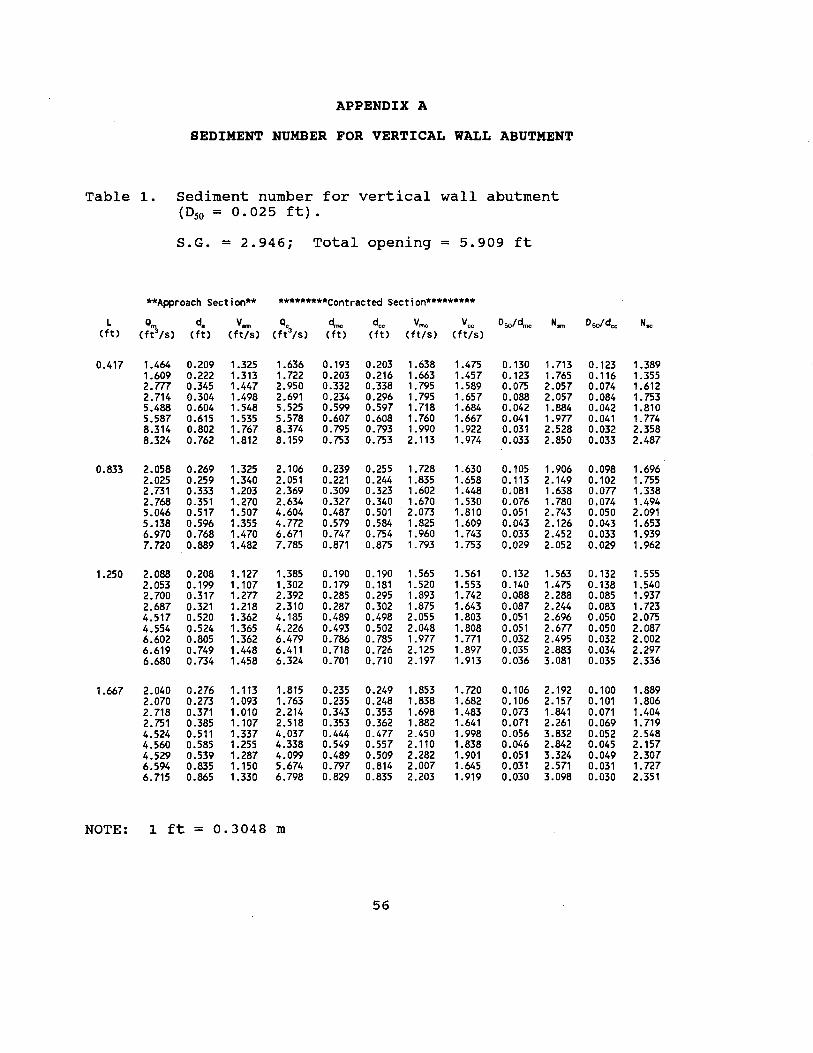
Table 1. Sediment number for vertical wall abutment (D50 = 0. 025 ft).
s.G. = 2.946; Total opening = 5.909 ft
**Approach Section** *********Contracted Section*********
L Q d. v.,. a. d,. d •• vmc vee 050/d,. Nom (ft) ct?ts> (ft) (ft/s) ( ft' /S) (ft) Cft) Cft/s) (ft/s)
0.417 1.464 0.209 1.325 1.636 0.193 0.203 1.638 1.475 0.130 1. 713 1.609 0.222 1.313 1.722 0.203 0.216 1.663 1.457 0.123 1.765 2.m 0.345 1.447 2.950 0.332 0.338 1. 795 1.589 0.075 2.057 2.714 0.304 1.498 2.691 0.234 0.296 1. 795 1.657 0.088 2.057 5.488 0.604 1.548 5.525 0.599 0.597 1. 718 1.684 0.042 1.884 5.587 0.615 1.535 5.578 0.607 0.608 1. 760 1.667 0.041 1.977 8.314 0.802 1.767 8.374 0.795 0.793 1.990 1.922 0.031 2.528 8.324 0.762 1.812 8.159 0.753 0.753 2.113 1.974 0.033 2.850
0.833 2.058 0.269 1.325 2.106 0.239 0.255 1.728 1.630 o. 105 1.906 2.025 0.259 1.340 2.051 0.221 0.244 1.835 1.658 0.113 2.149 2.731 0.333 1.203 2.369 0.309 0.323 1.602 1.448 0.081 1.638 2.768 0.351 1.270 2.634 0.327 0.340 1.670 1.530 0.076 1. 780 5.046 0.517 1.507 4.604 0.487 0.501 2.073 1.810 0.051 2.743 5.138 0.596 1.355 4.772 0.579 0.584 1.825 1.609 0.043 2.126 6.970 0.768 1.470 6.671 0.747 0.754 1.960 1. 743 0.033 2.452 7.720 0.889 1.482 7.785 0.871 0.875 1. 793 1. 753 0.029 2.052
1.250 2.088 0.208 1.127 1.385 0.190 0.190 1.565 1.561 0.132 1.563 2.053 0.199 1.107 1.302 0.179 o. 181 1.520 1.553 0.140 1.475 2.700 0.317 1.277 2.392 0.285 0.295 1.893 1. 742 0.088 2.288 2.687 0.321 1.218 2.310 0.287 0.302 1.875 1.643 0.087 2.244 4.517 0.520 1.362 4.185 0.489 0.498 2.055 1.803 0.051 2.696 4.554 0.524 1.365 4.226 0.493 0.502 2.048 1.808 0.051 2.677 6.602 0.805 1.362 6.479 0.786 0. 785 1.977 1.771 0.032 2.495 6.619 0.749 1.448 6.411 0.718 0.726 2.125 1.897 0.035 2.883 6.680 0.734 1.458 6.324 0.701 0.710 2.197 1.913 0.036 3.081
1.667 2.040 0.276 1.113 1.815 0.235 0.249 1.853 1. 720 0.106 2.192 2.070 0.273 1.093 1.763 0.235 0.248 1.838 1.682 0.106 2.157 2.718 0.371 1.010 2.214 0.343 0.353 1.698 1.483 0.073 1.841 2. 751 0.385 1.107 2.518 0.353 0.362 1.882 1.641 0.071 2.261 4.524 0.511 1.337 4.037 0.444 0.477 2.450 1.998 0.056 3.832 4.560 0.585 1.255 4.338 0.549 0.557 2.110 1.838 0.046 2.842 4.529 0.539 1.287 4.099 0.489 0.509 2.282 1.901 0.051 3.324 6.594 0.835 1.150 5.674 0.797 0.814 2.007 1.645 0.031 2.571 6. 715 0.865 1.330 6.798 0.829 0.835 2.203 1.919 0.030 3.098
NOTE: 1 ft = 0.3048 m
56
Dwdcc N ..
0.123 1.389 0.116 1.355 0.074 1.612 0.084 1. 753 0.042 1.810 0.041 1.774 0.032 2.358 0.033 2.487
0.098 1.696 0.102 1. 755 0.077 1.338 0.074 1.494 0.050 2.091 0.043 1.653 0.033 1.939 0.029 1.962
0.132 1.555 0.138 1.540 0.085 1.937 0.083 1. 723 0.050 2.075 0.050 2.087 0.032 2.002 0.034 2.297 0.035 2.336
0.100 1.889 0.101 1.806 0.071 1.404 0.069 1. 719 0.052 2.548 0.045 2.157 0.049 2.307 0.031 1.727 0.030 2.351

Table 2. Sediment number for vertical wall abutment (050 = 0.033 ft).
S.G. = 2.777; Total opening= 5.909 ft
**Approach Section** *********Contracted Section*********
L Q d. v., Qc d,., dec vmc vee Dsofd,., N..., (ft) <fi'ts> (ft) (ft/s) ctets> (ft) (ft) (ft/s) (ft/S)
0.417 3.489 0.322 1. 717 3.267 0.304 0.311 2.100 1.917 0.110 2.312 3.502 0.311 1. 722 3.165 0.293 0.299 2.060 1.928 0.114 2.225 5.797 0.567 1. 712 5.736 0.564 0.558 1.948 1.870 0.059 1.990 5.769 0.564 1.637 5.456 0.563 0.556 1.867 1.786 0.059 1.828 8.775 0.735 1.940 8.426 0.729 0.724 2.132 2.119 0.046 2.383 8.784 0.719 1.935 8.221 0.706 0.707 2.268 2.116 0.047 2.697
0.833 2.438 0.270 1.388 2.214 0.256 0.254 1.813 1. 710 0.130 1.723 1. 702 0.205 1.253 1.518 0.202 0.192 1.533 1.554 0.165 1.232 1.673 0.213 1.338 1.684 0.211 0.197 1.637 1.679 0.158 1.405 2.660 0.286 1.452 2.454 0.273 0.269 1.893 1.797 0.122 1.879 2.654 0.284 1.468 2.464 0.273 0.266 1.830 1.822 0.122 1.756 5.375 0.471 1.820 5.065 0.449 0.444 2.387 2.245 0.074 2.987 5.395 0.541 1.588 5.076 0.533 0.524 2.057 1.909 0.063 2.218 5.363 0.492 1.685 4.899 0.476 0.471 2.260 2.047 0.070 2.678 7.968 0.868 1.483 7.606 0.865 0.854 1.932 1. 754 0.039 1.957 8.091 0.830 1.580 7.749 0.824 0.814 2.022 1.875 0.040 2.144
1.250 1.170 0.173 1.047 1.070 0.168 0.157 1.375 1.456 0.198 0.991 1. 731 0.199 1.1 18 1.315 0.193 0.181 1.538 1.556 0.173 1.240 2.522 0.323 1.272 2.428 0.300 0.302 1.927 1. 731 0.1 1 1 1.947 2.473 0.329 1.148 2.232 0.324 0.313 1.697 1.526 0.103 1.510 4.953 0.461 1.498 4.081 0.435 0.432 2.320 2.025 0.077 2.822 4.927 0.496 1.328 3.892 0.483 0.476 2.007 1. 754 0.069 2.112 7.421 0. 781 1.328 6.129 0.773 0.762 1.970 1. 725 0.043 2.035 7.368 0.873 1.162 5.994 0.874 0.859 1.687 1.496 0.038 1.492
1.667 1.243 o. 175 0.953 0.985 0.172 0.154 1.420 1.499 0.194 1.057 1.195 0.171 0.915 0.925 0.169 0.153 1.352 1.422 0.197 0.958 2.217 0.299 1.203 2.125 0.277 0.267 1.930 1.871 0.120 1.953 2.243 0.331 1.035 2.024 0.322 0.313 1.655 1.530 0.104 1.436 4.544 0.653 1.027 3.963 0.652 0.636 1.602 1.468 0.051 1.346 4.495 0.631 1.010 3.766 0.631 0.615 1.627 1.443 0.053 1.388 6.m 0.809 1.205 5.760 0.795 0.785 1.928 1. 730 0.042 1.949 6.745 0.755 1.320 5.889 0.739 0.725 2.108 1.914 0.045 2.330
NOTE: 1 ft = 0.3048 m
57
060/dcc N,.
0.107 1.927 0.111 1.949 0.060 1.833 0.060 1.672 0.046 2.354 0.047 2.348
0.131 1.533 0.174 1.266 0.169 1.478 0.124 1.693 0.125 1. 741 0.075 2.642 0.064 1.911 0.071 2.197 0.039 1.613 0.041 1.843
0.212 1 .111 0.184 1.269 0.110 1.571 0.106 1.221 0.077 2.150 0.070 1.613 0.044 1.560 0.039 1.173
0.216 1.178 0.218 1.060 0.125 1.835 0.106 1.227 0.052 1.130 0.054 1.092 0.042 1.569 0.046 1.921

APPENDIX B
SEDIMENT NUMBER FOR SPILL-THROUGH ABUTMENT
Table 3. Sediment number for spill-through abutment ( 0 50 = 0 . 0 2 5 ft) .
S.G. = 2.828; Total opening = 5.909 ft
**Approach Section** *********Contracted Section********
L Qm d. v .... Qc dmc dec vmc vee 050/dmc Nom (ft) <tets> (ft) (ft/s) <tets> (ft) (ft) (ft/S) (ft/s)
2.083 2.019 0.287 1.003 1. 701 0.196 0.264 2.090 1.581 0.128 2.968 2.027 0.285 1.015 1. 709 0.194 0.261 2.125 1.607 0.129 3.069 2.307 0.297 1.063 1.866 0.204 0.270 2.373 1.690 0.123 3.827 2.068 0.291 1.015 1. 745 0.195 0.267 2.233 1.600 0.128 3.388 4.341 0.461 1.252 3.411 0.354 0.432 2.550 1.857 0.071 4.419 4.281 0.447 1.322 3.492 0.321 0.412 2.810 2.004 0.078 5.366 6.982 0.725 1.347 5. 771 0.663 0.702 2.215 1.817 0.038 3.334 6.914 o. 755 1.293 5.768 0.702 0.735 2.093 1. 722 0.036 2.977
2.500 1.828 0.257 0.875 1.329 0.169 0.229 1.845 1.599 0.148 2.313 1. 740 0.264 0.895 1.396 0.172 0.235 1.920 1.638 0.145 2.505 1.837 0.247 0.862 1.258 0.170 0.220 1.753 1.586 0.147 2.088 1.856 0.257 0.935 1.420 0.175 0.222 1.923 1. 767 0.143 2.513 3.946 0.473 1.148 3.209 0.380 0.437 2.450 1.914 0.066 4.079 4.008 0.469 1.183 3.278 0.359 0.429 2.673 1.992 0.070 4.855 6.265 0.783 1.157 5.353 0.756 0.759 1.923 1.693 0.033 2.513 6.289 0.809 1.128 5.392 0.780 0.787 1.878 1.632 0.032 2.397
2.917 1. 702 0.269 0.747 1.187 0.137 0.242 2.293 1.526 0.182 3.573 1.809 0.285 0.785 1.322 0.144 0.255 2.453 1.604 0.174 4.089 1.690 0.269 0.700 1.113 0.167 0.246 1.975 1.402 0.150 2.651 1. 731 0.273 0.797 1.286 0.166 0.240 2.063 1.665 0.151 2.892 3.527 0.479 1.058 2.995 0.331 0.433 2.798 2.024 0.076 5.320 3.497 0.473 1.040 2.907 0.312 0.429 2.940 1.985 0.080 5.874 5.633 0.795 0.905 4.251 0.731 0.775 1.898 1.458 0.034 2.448 5.612 0.817 0.962 4.644 0.759 0.794 1.863 1.545 0.033 2.359
3.333 1.432 0.267 0.740 1.168 0.141 0.218 2.263 1.928 0.177 3.480 1.774 0.289 0.752 1.284 0.150 0.243 2.433 1.883 0.167 4.023 1.502 0.271 0.700 1.121 0.151 0.215 2.200 2.026 0.166 3.289 1.497 0.265 0.702 1.099 0.148 0.225 2.218 1. 750 0.169 3.343 3.122 0.479 0.905 2.562 0.346 0.431 2.620 1.981 0.072 4.665 3.170 0.477 0.943 2.658 0.315 0.422 2.913 2.104 0.079 5.766 5.051 0.805 0.908 4.319 0.746 0.775 2.023 1.664 0.034 2.781 5.042 0.815 0.882 4.248 0.754 0.787 1.958 1.606 0.033 2.605
NOTE: 1 ft = 0.3048 m
58
Dsofdcc N..,
0.095 1.699 0.096 1.755 0.093 1.941 0.094 1.740 0.058 2.343 0.061 2.729 0.036 2.244 0.034 2.015
0.109 1. 738 0.106 1.823 0.114 1. 709 0.113 2.122 0.057 2.489 0.058 2.697 0.033 1.948 0.032 1.810
0.103 1.582 0.098 1.748 0.102 1.336 0.104 1.884 0.058 2.784 0.058 2.678 0.032 1.445 0.031 1.622
0.115 2.526 0.103 2.410 0.116 2.789 0.111 2.081 0.058 2.667 0.059 3.008 0.032 1.882 0.032 1. 753

Table 4. Sediment number for spill-through abutment ( 0 50 = 0 . 0 3 3 ft) .
S.G. = 2.777; Total opening= 5.909 .ft
**Approach Section** *********Contracted Section*********
L Q d, v., Qc d,., dec v..., vee 060/d,., N.., (ft) ct? Is> (ft) (ft/s) ctels> (ft) (ft) (ft/s) (ft/S)
2.083 3.409 0.366 1.215 2.628 0.264 0.333 2.555 1.903 0.126 3.423 3.149 0.356 1.167 2.455 0.260 0.326 2.480 1.819 0.128 3.225 1.980 0.282 1.112 1.853 0.203 0.249 2.475 1.828 0.164 3.212 2.574 0.319 1.142 2.153 0.224 0.288 2.403 1.824 0.149 3.028 4.340 0.445 1.318 3.466 0.364 0.410 2.455 1.998 0.092 3.160 4.357 0.468 1.283 3.548 0.394 0.437 2.367 1.905 0.085 2.937 6.931 0.735 1.375 5.972 0.706 0. 711 2.148 1.852 0.047 2.419 6.909 0.718 1.370 5.812 0.695 0.694 2.188 1.855 0.048 2.510
2.500 1. 702 0.265 0.915 1.433 0.187 0.234 2.288 1.689 0.178 2.745 1. 786 0.277 0.962 1.575 0.201 0.242 2.395 1.792 0.166 3.007 1.859 0.245 0.893 1.293 0.188 0.214 2.083 1.675 0.177 2.275 1.847 0.279 0.972 1.602 0.204 0.243 2.390 1.814 0.163 2.995 1.902 0.265 0.875 1.370 0.181 0.238 2.060 1.585 0.184 2.225 4.001 0.483 1.182 3.373 0.434 0.444 2.340 1.972 0.077 2.871 4.061 0.459 1.210 3.282 0.358 0.415 2.770 2.070 0.093 4.023 3.932 0.471 1.085 3.020 0.403 0.440 2.305 1. 787 0.083 2.786 6.258 0.813 1.083 5.203 0.814 0.793 1.790 1.560 0.041 1.680 6.375 0.785 1.157 5.367 0.776 0.761 1.935 1.691 0.043 1.963
2.917 1.522 0.231 0.745 1.017 0.150 0.200 2.045 1.603 0.222 2.193 1.530 0.233 0.783 1.078 0.152 0.196 2.090 1. 735 0.219 2.290 1.580 0.238 0.713 1.003 0.172 0.212 1.895 1.486 0.194 1.883 1.609 0.238 0.780 1.097 0.174 0.202 1.945 1. 705 0.192 1.983 3.563 0.469 1.050 2.910 0.332 0.423 2.935 2.018 0.100 4.516 3.505 0.473 1.050 2.935 0.360 0.427 2.700 2.012 0.093 3.822 3.531 0.479 0.898 2.542 0.376 0.449 2.375 1.645 0.089 2.957 5.647 0. 715 1.090 4.605 0.645 0.681 2.303 1.843 0.052 2.781 5.601 0.727 1.115 4.790 0.662 0.691 2.270 1.882 0.050 2.702
3.333 1.621 0.255 0.673 1.014 0.154 0.219 2.258 1.665 0.216 2.673 1.571 0.263 0.707 1.099 0.152 0.222 2.258 1. 781 0.219 2.673 1.467 0.257 0.623 0.946 0.155 0.229 1.873 1.480 0.215 1.839 1.487 0.251 0.607 0.900 0.151 0.225 1.888 1.438 0.221 1.869 3.139 0.505 0.858 2.560 0.402 0.465 2.350 1.811 0.083 2.895 3.146 0.491 0.892 2.588 0.350 0.446 2.680 1.924 0.095 3. 766 5.021 0.797 0.870 4.097 0.739 0.769 2.045 1.594 0.045 2.193 5.037 0. 711 0.983 4.130 0.652 0.670 2.458 1.901 0.051 3.168
NOTE: 1 ft = 0.3048 m
59
060/dcc N..,
0.100 1.899 0.102 1. 735 0.134 1. 752 0.116 1.744 0.081 2.093 0.076 1.903 0.047 1.798 0.048 1.804
0.142 1.496 0.138 1.684 0.156 1.471 0.137 1.725 0.140 1.317 0.075 2.039 0.080 2.247 0.076 1.674 0.042 1.276 0.044 1.499
0.167 1.347 0.170 1.578 0.157 1.158 0.165 1.524 0.079 2.135 0.078 2.122 0.074 1.419 0.049 1. 781 0.048 1.857
0.152 1.453 0.150 1.663 0.146 1.148 0.148 1.084 0.072 1.720 0.075 1.941 0.043 1.332 0.050 1.895

APPENDIX C
COMPUTED POINT VELOCITY FOR COMPUTED AVERAGE DEPTH FOR VERTICAL WALL ABUTMENT
Table 5. Computed point velocity (Vcp) for computed average depth (dec) @ Xt = 0 for vertical wall abutment (d~ <= 0.375 ft).
L S.G. Dso dec Dsofdcc Ncc~ Vcp (ft) (ft) (ft) (ft/S)
0.417 2.946 0.025 0.203 0.123 4.554 2.671 2.946 0.025 0.216 0.116 4.631 2.694 2.946 0.025 0.338 0.074 5.229 2.862 2.946 0.025 0.296 0.084 5.044 2.811 2.m 0.033 0.311 0.107 4.729 3.003 2.777 0.033 0.299 0.111 4.679 2.987
0.833 2.946 0.025 0.255 0.098 4.844 2.755 2.946 0.025 0.244 0.102 4.787 2.738 2.946 0.025 0.323 0.077 5.165 2.844 2.946 0.025 0.340 0.074 5.237 2.864 2.777 0.033 0.254 0.131 4.476 2.922 2.777 0.033 0.192 0.174 4.150 2.813 2.m 0.033 0.197 0.169 4.179 2.823 2.777 0.033 0.269 0.124 4.547 2.945 2.m 0.033 0.266 0.125 4.533 2.940
1.250 2.946 0.025 0.190 0.132 4.473 2.647 2.946 0.025 0.181 0.138 4.415 2.630 2.946 0.025 0.295 0.085 5.039 2.810 2.946 0.025 0.302 0.083 5.072 2.819 2.777 0.033 0.157 0.212 3.930 2.738 2.m 0.033 0.181 0.184 4.084 2.791 2.m 0.033 0.302 0.110 4.691 2.991 2.m 0.033 0.313 0.106 4.737 3.006
1.667 2.946 0.025 0.249 0.100 4.813 2.746 2.946 0.025 0.248 0.101 4.808 2.744 2.946 0.025 0.353 0.071 5.290 2.879 2.946 0.025 0.362 0.069 5.327 2.889 2.m 0.033 0.154 0.216 3.909 2.731 2.m 0.033 0.153 0.218 3.902 2.728 2.777 0.033 0.267 0.125 4.537 2.942 2.m 0.033 0.313 0.106 4.737 3.006
NOTE: 1 ft = 0.3048 m
60

Table 6. Computed point velocity (V~) for computed average depth (dcJ @ Xt = 0 for vertical wall abutment (0.375 ft < d~ <= 0.667 ft).
L S.G. 050 cl.c 050/dcc Ned vcp (ft) (ft) (ft) (ft/S)
0.417 2.946 0.025 0.597 0.042 6.100 3.091 2.946 0.025 0.608 0.041 6.130 3.099 2.777 0.033 0.558 0.060 5.540 3.251 2.777 0.033 0.556 0.060 5.535 3.249
0.833 2.946 0.025 0.501 0.050 5.817 3.019 2.946 0.025 0.584 0.043 6.063 3.082 2.777 0.033 0.444 0.075 5.208 3.152 2.777 0.033 0.524 0.064 5.447 3.223 2.m 0.033 0.471 0.071 5.291 3.177
1.250 2.946 0.025 0.498 0.050 5.807 3.016 2.946 0.025 0.502 0.050 5.820 3.019 2.777 0.033 0.432 0.077 5.169 3.140 2.777 0.033 0.476 0.070 5.307 3.181
1.667 2.946 0.025 0.477 0.052 5. 740 2.999 2.946 0.025 0.557 0.045 5.986 3.062 2.946 0.025 0.509 0.049 5.842 3.025 2.777 0.033 0.636 0.052 5.740 3.309 2.777 0.033 0.615 0.054 5.688 3.294
NOTE: 1 ft = 0.3048 m
61

Table 7. Computed point velocity (V~) for computed average depth (dec) @ Xt = 0 for vertical wall abutment (dec > 0.667 ft).
L S.G. 050 dec 050/dcc Ned Yep (ft) (ft) (ft) (ft/S)
0.417 2.946 0.025 0.793 0.032 6.587 3.212 2.946 0.025 0.753 0.033 6.496 3.190 2.777 0.033 0.724 0.046 5.945 3.367 2.777 0.033 0.707 0.047 5.907 3.357
0.833 2.946 0.025 0.754 0.033 6.498 3.190 2.946 0.025 0.875 0.029 6.765 3.255 2.777 0.033 0.854 0.039 6.217 3.444 2.777 0.033 0.814 0.041 6.137 3.421
1.250 2.946 0.025 0.785 0.032 6.569 3.208 2.946 0.025 0.726 0.034 6.432 3.174 2.946 0.025 0.710 0.035 6.393 3.165 2.777 0.033 0.762 0.044 6.028 3.391 2.777 0.033 0.859 0.039 6.227 3.446
1.667 2.946 0.025 0.814 0.031 6.634 3.224 2.946 0.025 0.835 0.030 6.680 3.235 2.777 0.033 0.785 0.042 6.077 3.404 2.777 0.033 0.725 0.046 5.947 3.368
NOTE: 1 ft = 0.3048 m
62

APPENDIX D
COMPUTED POINT VELOCITY FOR COMPUTED AVERAGE DEPTH FOR SPILL-THROUGH ABUTMENT
Table 8. Computed point velocity (V~) for computed average depth (dec) @ Xt = 0 for spl.ll-through abutment (dec <= 0 • 375 ft).
L S.G. Dso d.. Dsofd,. Ned v.p (ft) (ft) (ft) (ft/s)
2.083 2.828 0.025 0.264 0.095 4.890 2.683 2.828 0.025 0.261 0.096 4.875 2.678 2.828 0.025 0.270 0.093 4.920 2.691 2.828 0.025 0.267 0.094 4.905 2.687 2.m 0.031 0.333 0.094 4.902 2.961 2.m 0.031 0.326 0.096 4.874 2.952 2.m 0.031 0.249 0.126 4.531 2.846 2.m 0.031 0.288 0.109 4.713 2.903
2.500 2.828 0.025 0.229 0.109 4.705 2.631 2.828 0.025 0.235 0.106 4.738 2.641 2.828 0.025 0.220 0.114 4.654 2.617 2.828 0.025 0.222 0.113 4.666 2.620 2.m 0.031 0.234 0.134 4.455 2.823 2.m 0.031 0.242 0.129 4.496 2.835 2.m 0.031 0.214 0.146 4.349 2.789 2.m 0.031 0.243 0.129 4.501 2.837 2.m 0.031 0.238 0.131 4.476 2.829
2.917 2.828 0.025 0.242 0.103 4.776 2.651 2.828 0.025 0.255 0.098 4.844 2.670 2.828 0.025 0.246 0.102 4.797 2.657 2.828 0.025 0.240 0.104 4.765 2.648 2.777 0.031 0.200 0.156 4.270 2.763 2.m 0.031 0.196 0.159 4.246 2.756 2.777 0.031 0.212 0.147 4.338 2.785 2.m 0.031 0.202 0.155 4.281 2.767
3.333 2.828 0.025 0.218 0.115 4.643 2.614 2.828 0.025 0.243 0.103 4.782 2.653 2.828 0.025 0.215 0.116 4.626 2.609 2.828 0.025 0.225 0.111 4.683 2.625 2.m 0.031 0.219 0.143 4.376 2.797 2.m 0.031 0.222 0.141 4.392 2.802 2.m 0.031 0.229 0.136 4.429 2.814 2.m 0.031 0.225 0.139 4.408 2.808
NOTE: 1 ft = 0.3048 m
63

Table 9. Computed point velocity (V?) for computed average depth (dec) @ Xt = 0 for spl.ll-through abutment (0.375 ft < d~ <= 0.667 ft).
l S.G. Dso d,. Dsofcf,. Ned vcp (ft) Cft) (ft) Cft/s)
2.083 2.828 0.021 0.432 0.048 5.871 2.683 2.828 0.021 0.412 0.051 5.796 2.666 2.m 0.031 0.410 0.076 5.186 3.045 2.m 0.031 0.437 0.072 5.277 3.072
2.500 2.828 0.021 0.437 0.048 5.889 2.687 2.828 0.021 0.429 0.049 5.860 2.681 2.m 0.031 0.444 0.070 5.299 3.078 2.m 0.031 0.415 0.075 5.203 3.050 2.m 0.031 0.440 0.071 5.286 3.075
2.917 2.828 0.021 0.433 0.048 5.875 2.684 2.828 0.021 0.429 0.049 5.860 2.681 2.m 0.031 0.423 0.074 5.230 3.058 2.m 0.031 0.427 0.073 5.244 3.062 2.m 0.031 0.449 0.070 5.315 3.083
3.333 2.828 0.021 0.431 0.048 5.867 2.682 2.828 0.021 0.422 0.049 5.834 2.675 2.m 0.031 0.465 0.067 5.366 3.098 2.m 0.031 0.446 0.070 5.306 3.080
NOTE: 1 ft = 0.3048 m
64

Table 10. Computed point velocity (V~) for computed average depth (dec) @ Xt = 0 for sp1ll-through abutment (dec > 0 • 667 ft) .
L S.G. Oso d.. Osofd,. N .. v"" (ft) (ft) (ft) Cft/s)
2.083 2.828 0.021 0.702 0.030 6.696 2.866 2.828 0.021 0.735 0.028 6.780 2.883 2.m 0.031 0.711 0.044 6.020 3.281 2.m 0.031 0.694 0.045 5.981 3.270
2.500 2.828 0.021 0.775 0.027 6.878 2.904 2.828 0.021 0.787 0.026 6.907 2.910 2.m 0.031 0.793 0.039 6.201 3.330 2.m 0.031 0.761 0.041 6.132 3.311
2.917 2.828 0.021 0.775 0.027 6.878 2.904 2.828 0.021 0.787 0.026 6.907 2.910 2.m 0.031 0.681 0.046 5.950 3.262 2.m 0.031 0.691 0.045 5.974 3.268
3.333 2.828 0.021 0.775 0.027 6.878 2.904 2.828 0.021 0.787 0.026 6.907 2.910 2.m 0.031 0.769 0.041 6.150 3.316 2.m 0.031 0.670 0.047 5.924 3.255
NOTE: 1 ft = 0.3048 m
65

APPENDIX E
MEASURED POINT VELOCITY FOR MEASURED AVERAGE DEPTH FOR VERTICAL WALL ABUTMENT
Table 11. Measured point velocity (V~) for measured average depth (~) @ Xt = 0 for vertical wall abutment (~ <= 0.375 ft).
L S.G. Dso d,. Dsofd,. Nmd vmp
Cft) Cft) Cft) ( ft/S)
0.417 2.946 0.025 0.193 0.130 4.492 2.653 2.946 0.025 0.203 0.123 4.554 2.671 2.946 0.025 0.332 0.075 5.203 2.855 2.946 0.025 0.284 0.088 4.988 2.795 2.m 0.033 0.304 0.110 4.700 2.994 2.m 0.033 0.293 0.114 4.653 2.979
0.833 2.946 0.025 0.239 0.105 4.760 2.731 2.946 0.025 0.221 0.113 4.660 2.702 2.946 0.025 0.309 0.081 5.103 2.827 2.946 0.025 0.327 0.076 5.182 2.849 2.m 0.033 0.256 0.130 4.486 2.925 2.m 0.033 0.202 0.165 4.207 2.833 2.m 0.033 0.211 0.158 4.257 2.849 2.m 0.033 0.273 0.122 4.565 2.951 2.m 0.033 0.273 0.122 4.565 2.951
1.250 2.946 0.025 0.190 0.132 4.473 2.647 2.946 0.025 0.179 0.140 4.402 2.626 2.946 0.025 0.285 0.088 4.993 2.797 2.946 0.025 0.287 0.087 5.002 2.799 2.m 0.033 0.168 0.198 4.002 2.763 2.m 0.033 0.193 0.173 4.156 2.815 2.m 0.033 0.300 0.111 4.683 2.989 2.m 0.033 0.324 0.103 4.782 3.020
1.667 2.946 0.025 0.235 0.106 4.738 2.724 2.946 0.025 0.235 0.106 4.738 2.724 2.946 0.025 0.343 0.073 5.249 2.868 2.946 0.025 0.353 0.071 5.290 2.879 2.m 0.033 0.172 0.194 4.028 2.n2 2.m 0.033 0.169 0.197 4.009 2.765 2.m 0.033 o.2n 0.120 4.583 2.956 2.m 0.033 0.322 0.104 4.n4 3.017
NOTE: 1 ft = 0.3048 m
66
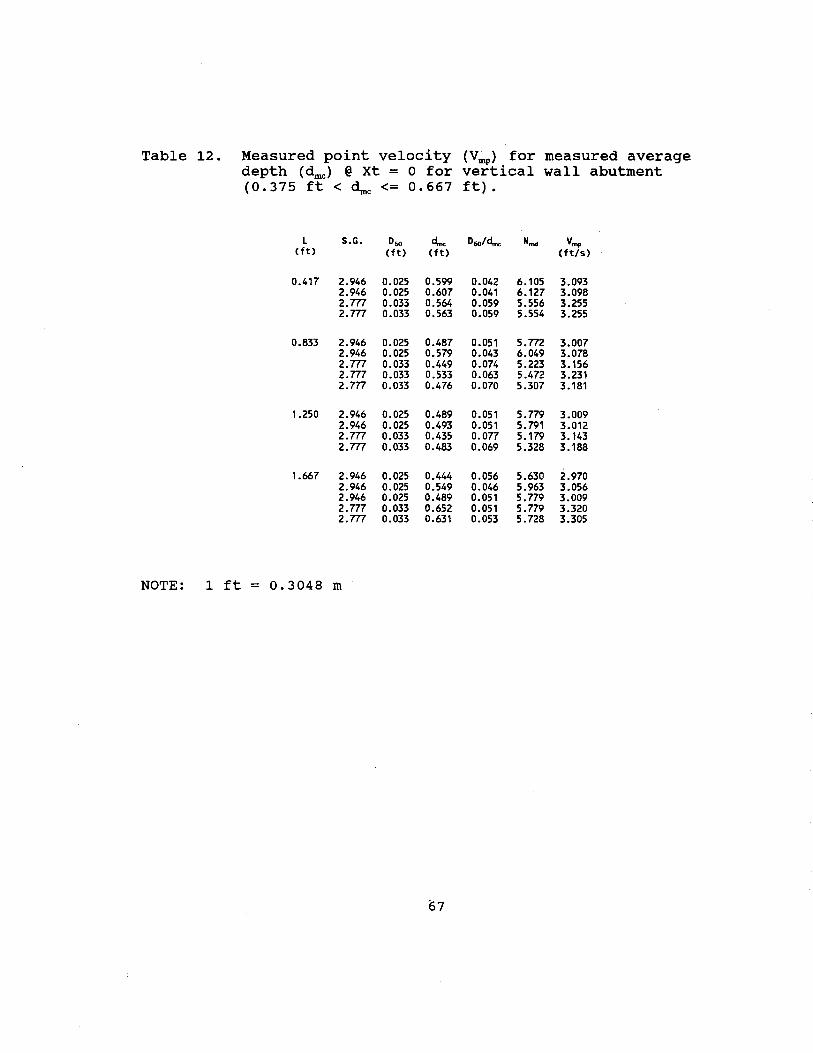
Table 12. Measured point velocity (Vmp) for measured average depth (~c) @ Xt = 0 for vertical wall abutment (0.375 ft < ~c <= 0.667 ft).
L S.G. Dso d,. Dso/d,. Nmd Vmp (ft) (ft) (ft) (ft/s)
0.417 2.946 0.025 0.599 0.042 6.105 3.093 2.946 0.025 0.607 0.041 6.127 3.098 2.777 0.033 0.564 0.059 5.556 3.255 2.777 0.033 0.563 0.059 5.554 3.255
0.833 2.946 0.025 0.487 0.051 5.772 3.007 2.946 0.025 0.579 0.043 6.049 3.078 2.777 0.033 0.449 0.074 5.223 3.156 2.777 0.033 0.533 0.063 5.472 3.231 2.777 0.033 0.476 0.070 5.307 3.181
1.250 2.946 0.025 0.489 0.051 5.779 3.009 2.946 0.025 0.493 0.051 5.791 3.012 2.777 0.033 0.435 0.077 5.179 3.143 2.777 0.033 0.483 0.069 5.328 3.188
1.667 2.946 0.025 0.444 0.056 5.630 2.970 2.946 0.025 0.549 0.046 5.963 3.056 2.946 0.025 0.489 0.051 5.779 3.009 2.777 0.033 0.652 0.051 5.779 3.320 2.777 0.033 0.631 0.053 5.728 3.305
NOTE: 1 ft = 0.3048 m
67

Table 13. Measured point velocity (V~) for measured average depth (~0 ) @ Xt = 0 for vertical wall abutment (dmc > 0.667 ft).
L S.G. Dso d,., Dso/d.nc N""' Vmp (ft) (ft) (ft) (ft/S)
0.417 2.946 0.025 0.795 0.031 6.592 3.213 2.946 0.025 0.753 0.033 6.496 3.190 2.m 0.033 0.729 0.046 5.956 3.370 2.m 0.033 0.706 0.047 5.905 3.356
0.833 2.946 0.025 0.747 0.033 6.482 3.186 2.946 0.025 0.871 0.029 6.757 3.253 2.777 0.033 0.865 0.039 6.239 3.449 2.m 0.033 0.824 0.040 6.157 3.427
1.250 2.946 0.025 0.786 0.032 6.571 3.208 2.946 0.025 0.718 0.035 6.412 3.169 2.946 0.025 o. 701 0.036 6.371 3.159 2.m 0.033 o.m 0.043 6.051 3.397 2.m 0.033 0.874 0.038 6.256 3.454
1.667 2.946 0.025 0.797 0.031 6.596 3.215 2.946 0.025 0.829 0.030 6.667 3.232 2.777 0.033 0.795 0.042 6.098 3.410 2.m 0.033 0.739 0.045 5.978 3.377
NOTE: 1 ft = 0.3048 m
68

Table
NOTE:
14.
APPENDIX F
MEASURED POINT VELOCITY FOR MEASURED AVERAGE DEPTH FOR SPILL-THROUGH ABUTMENT
Measured point velocity (V~) for measured average depth ( d.nc) @ Xt = 0 for splll-through abutment ( d.nc <= 0.375 ft) .
L S.G. Dso d,., Dso/d.nc N""' vmp (ft) (ft) Cft) (ft/S)
2.083 2.828 0.025 0.196 0.128 4.511 2.576 2.828 0.025 0.194 0.129 4.499 2.573 2.828 0.025 0.204 0.123 4.560 2.590 2.828 0.025 0.195 0.128 4.505 2.575 2.777 0.031 0.264 0.118 4.603 2.869 2.777 0.031 0.260 0.120 4.584 2.863 2.777 0.031 0.203 0.154 4.287 2.769 2.777 0.031 0.224 0.140 4.403 2.806
2.500 2.828 0.025 0.169 0.148 4.334 2.525 2.828 0.025 0.172 0.145 4.354 2.531 2.828 0.025 0.170 0.147 4.340 2.527 2.828 0.025 0.175 0.143 4.375 2.537 2.777 0.031 0.187 0.167 4.193 2.738 2.777 0.031 0.201 0.155 4.276 2. 765 2.777 0.031 0.188 0.166 4.199 2. 740 2.777 0.031 0.204 0.153 4.293 2.771 2.777 0.031 0.181 0.173 4.156 2.726
2.917 2.828 0.025 0.137 0.182 4.094 2.454 2.828 0.025 0.144 0.174 4.150 2.471 2.828 0.025 0.167 0.150 4.320 2.521 2.828 0.025 0.166 0.151 4.313 2.519 2.m 0.031 0.150 0.208 3.950 2.658 2.m 0.031 0.152 0.206 3.964 2.662 2.777 0.031 0.172 0.182 4.099 2.707 2.777 0.031 0.174 0.180 4.112 2.711
3.333 2.828 0.025 0.141 0.177 4.126 2.464 2.828 0.025 0.150 0.167 4.196 2.485 2.828 0.025 0.151 0.166 4.203 2.487 2.828 0.025 0.148 0.169 4.181 2.480 2.777 0.031 0.154 0.203 3.978 2.667 2.777 0.031 0.152 0.206 3.964 2.662 2.777 0.031 0.155 0.202 3.985 2.669 2.777 0.031 0.151 0.207 3.957 2.660
1 ft = 0.3048 m
69

Table 15. Measured point velocity (V~) for measured average depth (~J @ Xt = 0 for sp111-through abutment (0.375 ft < ~c <= 0.667 ft).
L S.G. Dso d,., Dso/d.nc Nmct vmp
(ft) (ft) (ft) (ft/s)
2.083 2.828 0.021 0.354 0.059 5.563 2.612 2.828 0.021 0.321 0.065 5.417 2.577 2.m 0.031 0.364 0.086 5.022 2.997 2.m 0.031 0.394 0.079 5.131 3.029
2.500 2.828 0.021 0.380 0.055 5.670 2.637 2.828 0.021 0.359 0.058 5.584 2.617 2.m 0.031 0.434 0.072 5.267 3.069 2.m 0.031 0.358 0.087 4.999 2.990 2.m 0.031 0.403 0.078 5.162 3.038
2.917 2.828 0.021 0.331 0.063 5.462 2.588 2.828 0.021 0.312 0.067 5.375 2.567 2.777 0.031 0.332 0.094 4.898 2.959 2.m 0.031 0.360 0.087 5.007 2.992 2.777 0.031 0.376 0.083 5.066 3.010
3.333 2.828 0.021 0.346 0.060 5.528 2.604 2.828 0.021 0.315 0.066 5.389 2.571 2.m 0.031 0.402 0.078 5.159 3.037 2.m 0.031 0.350 0.089 4.969 2.981
NOTE: 1 ft = 0.3048 m
70
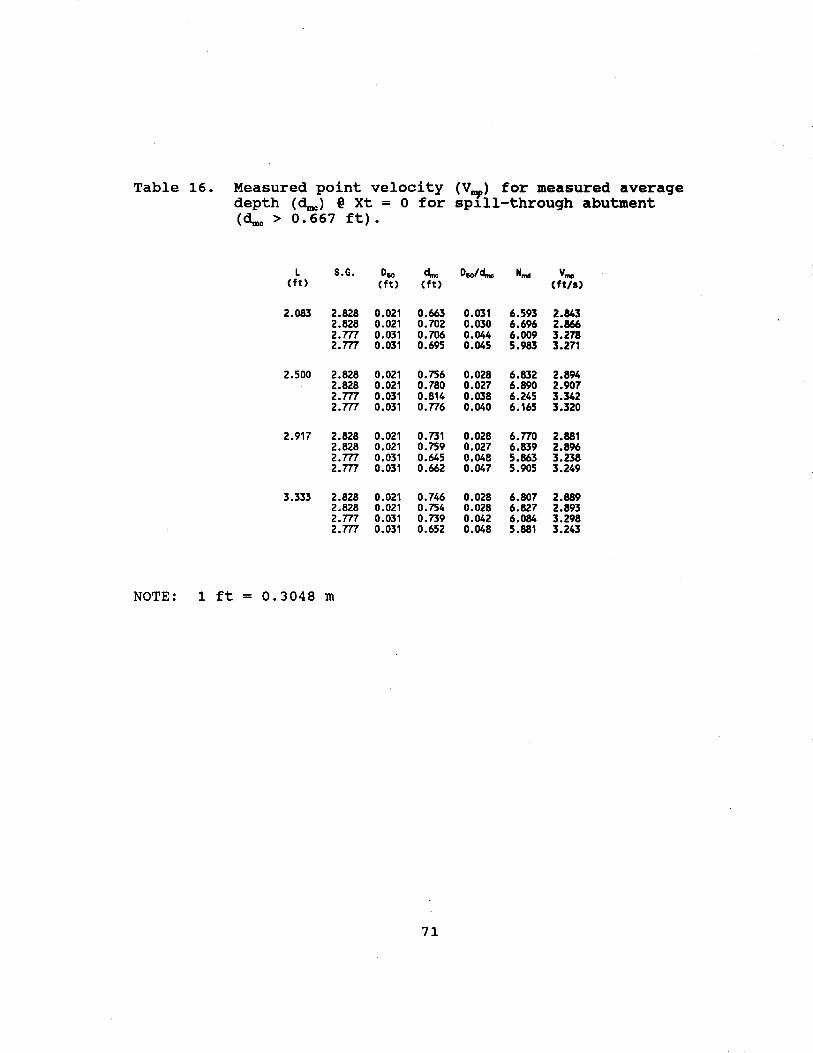
Table 16. Measured point velocity (V~) for measured average depth (~) @ Xt = o for sp1ll-throuqh abutment (~ > 0.667 ft).
L S.G. Dso d,., Dr;o/d,., Nm~~ v,. (ft) (ft) (ft) (ft/8)
2.083 2.828 0.021 0.663 0.031 6.593 2.843 2.828 0.021 0.702 0.030 6.696 2.866 2.m 0.031 0.706 0.044 6.009 3.278 2.m 0.031 0.695 0.045 5.983 3.271
2.500 2.828 0.021 0.756 0.028 6.832 2.894 2.828 0.021 0.780 0.027 6.890 2.907 2.m 0.031 0.814 0.038 6.245 3.342 2.m 0.031 o.n6 0.040 6.165 3.320
2.917 2.828 0.021 0.731 0.028 6.no 2.881 2.828 0.021 0.759 0.027 6.839 2.896 2.m 0.031 0.645 0.048 5.863 3.238 2.m 0.031 0.662 0.047 5.905 3.249
3.333 2.828 0.021 0.746 0.028 6.807 2.889 2.828 0.021 0.754 0.028 6.827 2.893 2.m 0.031 0.739 0.042 6.084 3.298 2.m 0.031 0.652 0.048 5.881 3.243
NOTE: 1 ft = 0.3048 m
71

APPENDIX G
COMPUTED VELOCITY RATIO FOR VARIABLE DEPTH FOR VERTICAL WALL ABUTMENT
Table 17. Computed velocity ratio for variable depth @ Xt = 0 for vertical wall abutment (dec<= 0.375 ft).
L v., v •• v.p~v., (ft) Cft/s) Cft/S)
0.417 1.475 2.671 1.811 1.457 2.694 1.849 1.589 2.862 1.801 1.657 2.811 1.696 1.917 3.003 1.567 1.928 2.987 1.549
0.833 1.630 2.755 1.690 1.658 2.738 1.652 1.448 2.844 1.964 1.530 2.864 1.872 1. 710 2.922 1.709 1.554 2.813 1.810 1.679 2.823 1.681 1. 797 2.945 1.639 1.822 2.940 1.614
1.250 1.561 2.647 1.696 1.553 2.630 1.693 1. 742 2.810 1.613 1.643 2.819 1. 716 1.456 2.738 1.880 1.556 2.791 1. 794 1. 731 2.991 1. 728 1.526 3.006 1.970
1.667 1. 720 2.746 1.596 1.682 2.744 1.632 1.483 2.879 1.941 1.641 2.889 1.760 1.499 2. 731 1.822 1.422 2.728 1.919 1.971 2.942 1.493 1.530 3.006 1.965
NOTE: 1 ft = 0.3048 m
72

Table 18. Computed velocity ratio for variable depth @ Xt = 0 for vertical wall abutment (0.375 ft <dec<= 0.667 ft).
L vee v •• V.,JVcc (ft) (ft/S) (ft/S)
0.417 1.684 3.091 1.836 1.667 3.099 1.859 1.870 3.251 1.738 1.786 3.249 1.819
0.833 1.810 3.019 1.668 1.609 3.082 1.915 2.245 3.152 1.404 1.909 3.223 1.688 2.047 3.177 1.552
1.250 1.803 3.016 1.673 1.808 3.019 1.670 2.025 3.140 1.551 1.754 3.181 1.814
1.667 1.998 2.999 1.501 1.838 3.062 1.666 1.901 3.025 1.591 1.468 3.309 2.254 1.443 3.294 2.283
NOTE: 1 ft = 0.3048 m
73
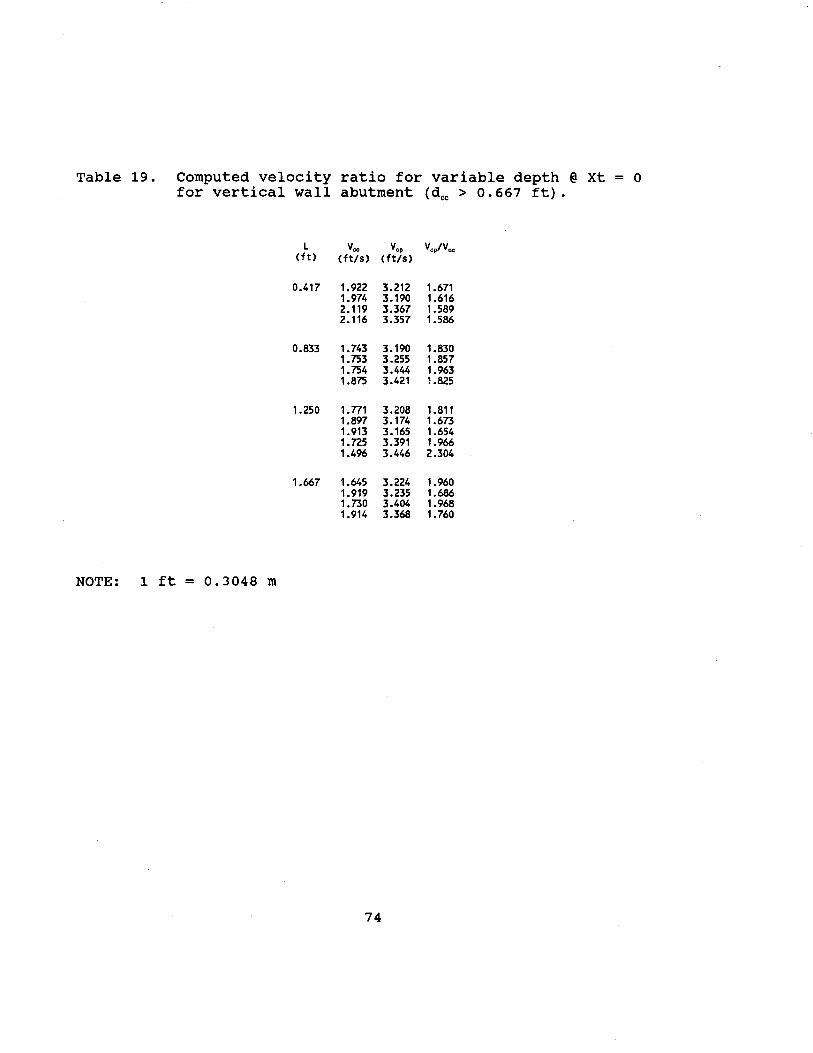
Table 19. Computed velocity ratio for variable depth @ Xt = 0 for vertical wall abutment (d~ > 0.667 ft}.
L v .. Yep Yep/Vee (ft) (ft/s) (ft/s)
0.417 1.922 3.212 1.671 1.974 3.190 1.616 2.119 3.367 1.589 2.116 3.357 1.586
0.833 1.743 3.190 1.830 1.753 3.255 1.857 1.754 3.444 1.963 1.875 3.421 1.825
1.250 1. 771 3.208 1.811 1.897 3.174 1.673 1.913 3.165 1.654 1. 725 3.391 1.966 1.496 3.446 2.304
1.667 1.645 3.224 1.960 1.919 3.235 1.686 1. 730 3.404 1.968 1.914 3.368 1.760
NOTE: 1 ft = 0.3048 m
74

APPENDIX H
COMPUTED VELOCITY RATIO FOR VARIABLE DEPTH FOR SPILL-THROUGH ABUTMENT
Table 20. Computed velocity ratio for variable depth @ Xt = 0 for spill-through abutment (dec <= 0. 375 ft).
L v .. vcp VcpiV .. (ft) (ft/S) (ft/s)
2.083 1.581 2.683 1.697 1.607 2.678 1.667 1.690 2.691 1.592 1.600 2.687 1.679 1.903 2.961 1.556 1.819 2.952 1.623 1.828 2.846 1.557 1.824 2.903 1.592
2.500 1.599 2.631 1.646 1.638 2.641 1.612 1.586 2.617 1.650 1. 767 2.620 1.483 1.689 2.823 1.671 1.792 2.835 1.582 1.675 2.789 1.665 1.814 2.837 1.564 1.585 2.829 1. 785
2.917 1.526 2.651 1. 737 1.604 2.670 1.665 1.402 2.657 Let;, 1.665 2.648 1.590 1.603 2.763 1. 724 1. 735 2. 756 1.588 1.486 2. 785 1.874 1. 705 2.767 1.623
3.333 1.928 2.614 1.356 1.883 2.653 1.409 2.026 2.609 1.288 1. 750 2.625 1.500 1.665 2.797 1.680 1. 781 2.802 1.574 1.480 2.814 1.902 1.438 2.808 1.952
NOTE: 1 ft = 0.3048 m
75

Table 21. Computed velocity ratio for variable depth @ Xt = 0 for spill-through abutment (0.375 ft <dec<= 0.667 ft).
L vee Vep Vep/Vcc (ft) (ft/s) (ft/s)
2.083 1.857 2.683 1.445 2.004 2.666 1.330 1.998 3.045 1.524 1.905 3.072 1.612
2.500 1.914 2.687 1.404 1.992 2.681 1.346 1.972 3.078 1.561 2.070 3.050 1.474 1.787 3.075 1.720
2.197 2.024 2.684 1.326 1.985 2.681 1.350 2.018 3.058 1.515 2.012 3.062 1.522 1.645 3.083 1.874
3.333 1.981 2.682 1.354 2.104 2.675 1.271 1.811 3.098 1. 710 1.924 3.080 1.601
NOTE: 1 ft = 0.3048 m
76

Table 22. Computed velocity ratio for variable depth @ Xt = 0 for spill-through abutment (dec > 0. 667 ft}.
L Vee vcp Vc0/Vcc (ft) (ft/s) (ft/s)
2.083 1.817 2.866 1.577 1. 722 2.883 1.674 1.852 3.281 1.772 1.855 3.270 1.763
2.500 1.693 2.904 1. 715 1.632 2.910 1. 783 1.560 3.330 2.135 1.691 3.311 1.958
2.197 1.458 2.904 1.992 1.545 2.910 1.884 1.843 3.262 1.770 1.882 3.268 1.737
3.333 1.664 2.904 1. 745 1.606 2.910 1.812 1.594 3.316 2.080 1.901 3.255 1. 712
NOTE: 1 ft 0.3048 m
77

APPENDIX I
MEASURED VELOCITY RATIO FOR VARIABLE DEPTH FOR VERTICAL WALL ABUTMENT
Table 23. Measured velocity ratio for variable depth @ Xt = 0 for vertical wall abutment (dmc <= 0.375 ft).
L vmc Vmp Vm.fVmc (ft) (ft/s) (ft/S)
0.417 1.638 2.653 1.620 1.663 2.671 1.606 1. 795 2.855 1.591 1. 795 2.795 1.557 2.100 2.994 1.426 2.060 2.979 1.446
0.833 1. 728 2.731 1.580 1.835 2.702 1.472 1.602 2.827 1.765 1.670 2.849 1. 706 1.813 2.925 1.613 1.533 2.833 1.848 1.637 2.849 1.741 1.893 2.951 1.559 1.830 2.951 1.612
1.250 1.565 2.647 1.691 1.520 2.626 1. 728 1.893 2.797 1.477 1.875 2.799 1.493 1.375 2.763 2.009 1.538 2.815 1.830 1.927 2.989 1.551 1.697 3.020 1. 780
1.667 1.853 2.724 1.470 1.838 2.724 1.482 1.698 2.868 1.689 1.882 2.879 1.530 1.420 2.772 1.952 1.352 2.765 2.045 1.930 2.956 1.532 1.655 3.017 1.823
NOTE: 1 ft = 0.3048 m
78
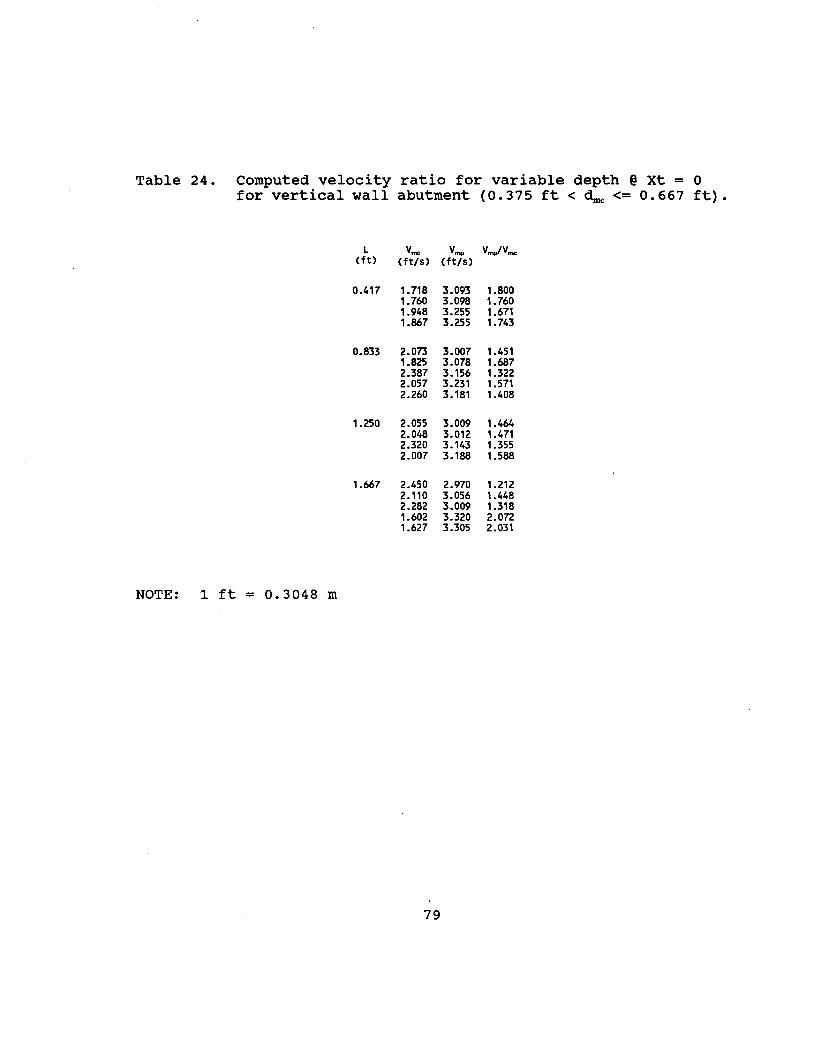
Table 24. Computed velocity ratio for variable depth @ Xt = 0 for vertical wall abutment (0.375 ft < ~c <= 0.667 ft).
L V""' vmp VmplV""' (ft) (ft/S) (ft/S)
0.417 1. 718 3.093 1.800 1.760 3.098 1.760 1.948 3.255 1.671 1.867 3.255 1.743
0.833 2.073 3.007 1.451 1.825 3.078 1.687 2.387 3.156 1.322 2.057 3.231 1.571 2.260 3.181 1.408
1.250 2.055 3.009 1.464 2.048 3.012 1.471 2.320 3.143 1.355 2.007 3.188 1.588
1.667 2.450 2.970 1.212 2.110 3.056 1.448 2.282 3.009 1.318 1.602 3.320 2.072 1.627 3.305 2.031
NOTE: 1 ft = 0.3048 m
79

Table 25. Computed velocity ratio for variable depth @ Xt = 0 for vertical wall abutment (~c > 0.667 ft).
L Vmc Vmp Vmp/Vmc (ft) (ft/s) Cft/s)
0.417 1.990 3.213 1.615 2.113 3.190 1.510 2.132 3.370 1.581 2.268 3.356 1.480
0.833 1.960 3.186 1.626 1. 793 3.253 1.815 1.932 3.449 1. 785 2.022 3.427 1.695
1.250 1.977 3.208 1.623 2.125 3.169 1.491 2.197 3.159 1.438 1.970 3.397 1. 725 1.687 3.454 2.048
1.667 2.007 3.215 1.602 2.203 3.232 1.467 2.928 3.410 1.165 2.108 3.377 1.602
NOTE: 1 ft = 0.3048 m
80

APPENDIX J
MEASURED VELOCITY RATIO FOR VARIABLE DEPTH FOR SPILL-THROUGH ABUTMENT
Table 26. Measured velocity ratio for variable depth @ Xt = 0 for spill-through abutment (~c <= 0. 375 ft).
L V'"" v"'fl Vmp/V'"" (ft) (ft/s) (ft/s)
2.083 2.090 2.576 1.233 2.125 2.573 1.211 2.373 2.590 1.092 2.233 2.575 1.153 2.555 2.869 1.123 2.480 2.863 1.154 2.475 2.769 1.119 2.403 2.806 1.168
2.500 1.845 2.525 1.369 1.920 2.531 1.318 1.753 2.527 1.442 1.923 2.537 1.319 2.288 2.738 1.197 2.395 2.765 1.154 2.083 2.740 1.315 2.390 2. 771 1.159 2.060 2.726 1.323
2.917 2.293 2.454 1.070 2.453 2.471 1.007 1.975 2.521 1.277 2.063 2.519 1.221 2.045 2.658 1.300 2.090 2.662 1.274 1.895 2.707 1.429 1.945 2.711 1.394
3.333 2.263 2.464 1.089 2.433 2.485 1.021 2.200 2.487 1.130 2.218 2.480 1.118 2.258 2.667 1.181 2.258 2.662 1.179 1.873 2.669 1.425 1.888 2.660 1.409
NOTE: 1 ft = 0.3048 m
81

Table 27. Measured velocity ratio for variable depth @ Xt = 0 for spill-through abutment (0.375 ft < dmc <= 0.667 ft).
L vmc Vmp Vm0/Vmc (ft) (ft/s) (ft/S)
2.083 2.550 2.612 1.024 2.810 2.5n 0.917 2.455 2.997 1.221 2.367 3.029 1.280
2.500 2.798 2.637 0.942 2.940 2.617 0.890 2.340 3.069 1.311 2.no 2.990 1.079 2.305 3.038 1.318
2.917 2.798 2.588 0.925 2.940 2.567 0.873 2.935 2.959 1.008 2.700 2.992 1.108 2.375 3.010 1.267
3.333 2.620 2.604 0.994 2.913 2.571 0.883 2.350 3.037 1.292 2.680 2.981 1.112
NOTE: 1 ft = 0.3048 m
82

Table 28. Measured velocity ratio for variable depth @ Xt = 0 for spill-through abutment (dmc > 0.667 ft).
L vmc Vmp VmrfVmc (ft) (ft/S) (ft/S)
2.083 2.215 2.843 1.284 2.093 2.866 1.369 2.148 3.278 1.526 2.188 3.271 1.495
2.500 1.923 2.894 1.505 1.878 2.907 1.548 1. 790 3.342 1.867 1.935 3.320 1. 716
2.917 1.898 2.881 1.518 1.863 2.896 1.554 2.303 3.238 1.406 2.270 3.249 1.431
3.333 2.023 2.889 1.428 1.958 2.893 1.478 2.045 3.298 1.613 2.458 3.243 1.319
NOTE: 1 ft = 0.3048 m
83

APPENDIX K
VELOCITY POINT DISTANCE FROM TOE OF VERTICAL WALL ABUTMENT TO CHANNEL
Table 29. Velocity point distance from toe of vertical wall abutment to channel (L = 0.417 ft; de~<= 0.375 ft).
Contracted width (Wt-e) = 5. 492 ft
v"'"" Vpmc!V,_, Vpmc/V3P Vpmc!Vcac Xt Xt/1.1,.., Cft/s) (ft)
0.090 0.066 0.064 0.062 0.061 0.011 0.610 0.451 0.434 0.422 0.186 0.034 1.580 1.167 1.123 1.092 0.394 0.072 1.590 1.174 1.130 1.099 0.602 0.110 1.580 1.167 1.123 1.092 0.810 0.147 1.510 1.115 1.073 1.044 1.019 0.186 1.540 1.137 1.095 1.064 1.227 0.223 1.500 1.108 1.066 1.037 1.436 0.261 1.490 1.100 1.059 1.030 1.644 0.299 1.490 1.100 1.059 1.030 1.853 0.337 1.490 1.100 1.059 1.030 2.061 0.375 1.440 1.064 1.023 0.995 2.269 0.413 1.450 1.071 1.031 1.002 2.478 0.451 1.430 1.056 1.016 0.988 2.686 0.489 1.400 1.034 0.995 0.968 3.519 0.641 1.450 1.071 1.031 1.002 4.353 0.793 1.370 1.012 0.974 0.947 5.186 0.944
vp.,. = 1.354 ft/s d.- = 0.363 ft v3p = 1.407 ft/s d:J. = 0.365 ft vc .. = 1.447 ft/s dcac = 0.363 ft
NOTE: 1 ft = 0.3048 m
84

Table 30o Velocity point distance from toe of vertical wall abutment to channel (L = Oo417 ft; Oo375 ft < dcac <= Oo667 ft) o
Contracted width (Wt-c) = 5o 492 ft
vpm<J Vpm<J/V_. Vpm<J/V3P Vpm<J/Vcac Xt Xt/W,-c (ft/S) (ft)
0.160 0.120 0.117 0.116 0.061 0.011 1.120 0.843 0.818 0.815 0.186 0.034 1.520 1.144 1.109 1.105 0.394 0.072 1.460 1.099 1.066 1.062 0.602 0.110 1.460 1.099 1.066 1.062 0.810 0.147 1.410 1.061 1.029 1.025 1.019 0.186 1.430 1.076 1.044 1.040 1.227 0.223 1.450 1.091 1.058 1.055 1.436 0.261 1.440 1.084 1.051 1.047 1.644 0.299 1.450 1.091 1.058 1.055 1.853 0.337 1.450 1.091 1.058 1.055 2.269 0.413 1.420 1.068 1.036 1.033 2.686 0.489 1.350 1.016 0.985 0.982 3.519 0.641 1.340 1.008 0.978 0.975 4.353 0.793
v_. = 1.319 ft/s d.n.o = 0.596 ft v3p = 1.370 ft/S d:.. = 0.605 ft vcac = 1.375 ft/S dcac = 0.594 ft
NOTE: 1 ft = Oo3048 m
85

Table 31. Velocity point distance from toe of vertical wall abutment to channel (L = 0.417 ft; de~> 0.667 ft).
Contracted width (Wt-c) = 5. 492 ft
vpmc Vpmc/V...., Vpmc/V30 Vomc/V.,.., Xt Xt/11, .. (ft/S) (ft)
0.170 0.124 0.114 0.119 0.061 0.011 1.100 0.802 0.738 0.772 0.186 0.034 1.630 1.189 1.094 1.145 0.394 0.072 1.600 1.167 1.074 1.124 0.602 0.110 1.540 1.123 1.034 1.081 0.810 0.147 1.460 1.065 0.980 1.025 1.019 0.186 1.460 1.065 0.980 1.025 1.227 0.223 1.430 1.043 0.960 1.004 1.436 0.261 1.410 1.028 0.946 0.990 1.644 0.299 1.420 1.036 0.953 0.997 1.853 0.337 1.510 1.101 1.013 1.060 2.269 0.413 1.510 1.101 1.013 1.060 2.686 0.489 1.480 1.080 0.993 1.039 3.519 0.641 1.480 1.080 0.993 1.039 4.353 0.793
v...., = 1.371 ft/s d,.. = 0.818 ft v3. = 1.490 ft/s d:J. = 0.829 ft vcao = 1.424 ft/s dcac = 0.821 ft
NOTE: 1 ft = 0.3048 m
86

Table 32. Velocity point distance from toe of vertical wall abutment to channel (L = 0.833 ft; d~ <= 0.375 ft).
Contracted width (Wt-c> = 5.076 ft
vpmc Vpmc/V..,. Vpmc/V3 p Vpmc/V._ Xt Xt/11,.., (ft/s) (ft)
0.420 0.268 0.248 0.254 0.061 0.012 0.350 0.223 0.207 0.212 0.186 0.037 1.950 1.243 1.152 1.179 0.394 0.078 1.890 1.205 1.116 1.143 0.603 0.119 1.880 1.198 1.110 1.137 0.811 0.160 1.840 1.173 1.087 1.112 1.020 0.201 1.830 1.166 1.081 1.106 1.228 0.242 1.830 1.166 1. 081 1.106 1.437 0.283 1.760 1.122 1.040 1.064 1.853 0.365 1. 720 1.096 1.016 1.040 2.270 0.447 1. 700 1.083 1.004 1.028 3.103 0.611 1.660 1.058 0.981 1.004 3.937 0.776
v..,. = 1.569 ft/s clm.c = 0.342 ft v3p = 1.693 ft/s d:.. = 0.353 ft vcac = 1.654 ft/s dcac = 0.353 ft
NOTE: 1 ft = 0.3048 m
87

Table 33. Velocity point distance from toe of vertical wall abutment to channel (L = 0.833 ft; 0 • 3 7 5 ft < dcac <= 0 • 6 6 7 ft) •
Contracted width (W1..:) = 5. 076 ft
vpmc Vpmc!V,_. Vpmc/V30 Vpmc/Vcac Xt Xt!W,_0
(ft/s) (ft)
0.330 0.259 0.231 0.246 0.061 0.012 0.110 0.086 o.on 0.082 0.186 0.037 1.520 1.194 1.063 1.134 0.394 0.078 1.520 1.194 1.063 1.134 0.603 0.119 1.550 1.218 1.084 1.157 0.811 0.160 1.490 1.170 1.042 1.112 1.020 0.201 1.500 1.178 1.049 1.119 1.228 0.242 1.480 1.163 1.035 1.104 1.437 0.283 1.490 1.170 1.042 1.112 1.853 0.365 1.500 1.178 1.049 1.119 2.270 0.447 1.400 1.100 0.979 1.045 3.103 0.611 1.390 1.092 0.972 1.037 3.937 o.n6 v,..,. = 1.273 ft/s d.nac = 0.616 ft v3. = 1.430 ft/s d,A = 0.625 ft Vcac = 1.340 ft/s dcac = 0.622 ft
NOTE: 1 ft = 0.3048 m
88

Table 34. Velocity point distance from toe of vertical wall abutment to channel (L = 0. 833 ft; dcac > 0. 667 ft).
Contracted width (W1.c) = 5. 076 ft
vpmc Vpmc/Vpf!lfl Vpmc/V3P Vpmc/Vcec Xt Xt/11,-c (ft/s) (ft)
0.400 0.253 0.219 0.241 0.061 0.012 0.120 0.076 0.066 0.072 0.186 0.037 1.890 1.194 1.034 1.137 0.394 0.078 1.920 1.213 1.051 1.155 0.603 0.119 1.900 1.200 1.040 1.143 0.811 0.160 1.840 1.162 1.007 1.107 1.020 0.201 1.830 1.156 1.002 1.101 1.228 0.242 1.800 1.137 0.985 1.083 1.437 0.283 1.810 1.143 0.991 1.089 1.853 0.365 1.810 1.143 0.991 1.089 2.270 0.447 1.850 1.169 1.013 1.113 3.103 0.611 1.820 1.150 0.996 1.095 3.937 0.776
VPf!lfl = 1.583 ft/s d.n.c = 0.785 ft v3p = 1.827 ft/s d:,. = 0.796 ft Vcoc = 1.662 ft/s dcec = 0.794 ft
NOTE: 1 ft = 0.3048 m
89
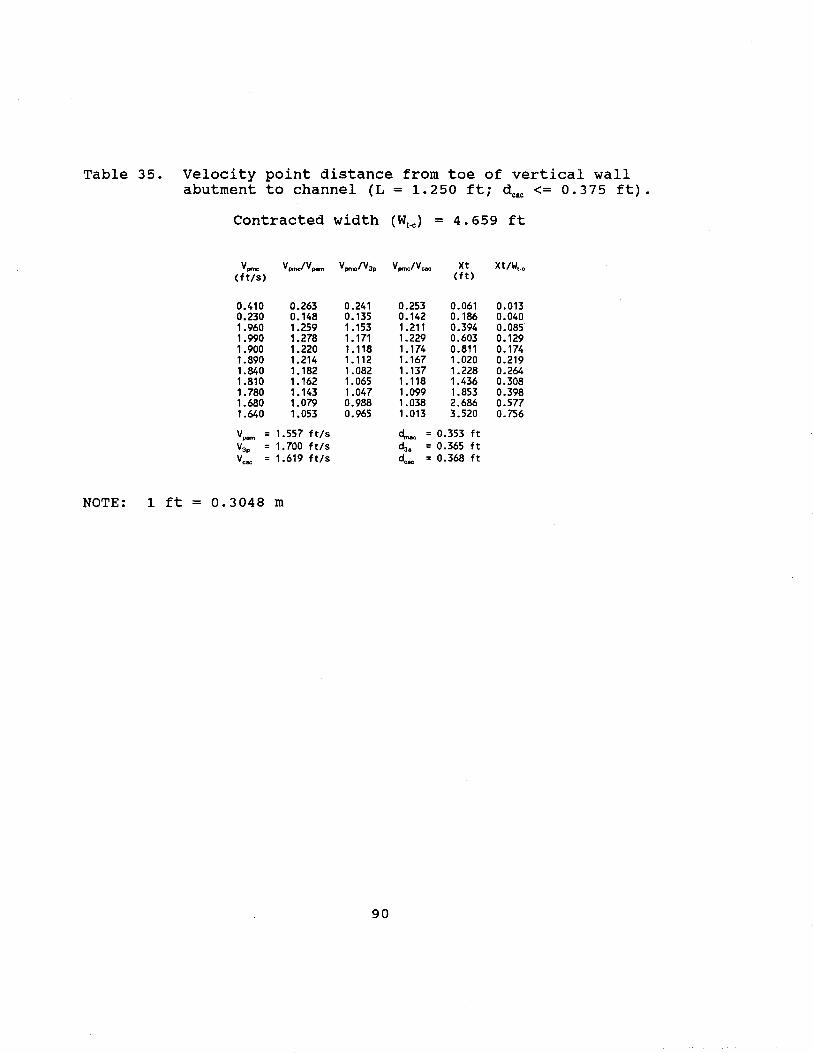
Table 35. Velocity point distance from toe of vertical wall abutment to channel (L = 1.250 ft; dcac <= 0.375 ft).
Contracted width (W1-c) = 4. 659 ft
vomc Vpme!V"""' Vomc/V30 Vomc/Vcac Xt Xt/1.1,.0
(ft/S) (ft)
0.410 0.263 0.241 0.253 0.061 0.013 0.230 0.148 0.135 0.142 0.186 0.040 1.960 1.259 1.153 1.211 0.394 0.085 1.990 1.278 1.171 1.229 0.603 0.129 1.900 1.220 1.118 1.174 0.811 0.174 1.890 1.214 1.112 1.167 1.020 0.219 1.840 1.182 1.082 1.137 1.228 0.264 1.810 1.162 1.065 1.118 1.436 0.308 1.780 1.143 1.047 1.099 1.853 0.398 1.680 1.079 0.988 1.038 2.686 0.577 1.640 1.053 0.965 1.013 3.520 0.756
v.am = 1.557 ft/s d.nac = 0.353 ft v3. = 1.700 ft/s d:.. = 0.365 ft vcac = 1.619 ft/S dcac = 0.368 ft
NOTE: 1 ft = 0.3048 m
90

Table 36. Velocity point distance from toe of vertical wall abutment to channel (L = 1.250 ft; 0.375 ft < d~ <= 0.667 ft).
contracted width (Wt-c) = 4. 659 ft
vpmc Vpmc/Vpam Vpmc/V3P Vpmc/Vcac Xt Xt/W, .. (ft/s) (ft)
0.300 0.228 0.203 0.215 0.061 0.013 0.240 0.182 0.162 0.172 0.186 0.040 1.430 1.087 0.968 1.024 0.394 0.085 1.630 1.239 1.104 1.168 0.603 0.129 1.660 1.261 1.124 1.189 0.811 0.174 1.610 1.223 1.090 1.153 1.020 0.219 1.620 1.231 1.097 1.160 1.228 0.264 1.560 1.185 1.056 1.117 1.436 0.308 1.540 1.170 1.043 1.103 1.853 0.398 1.470 1.117 0.995 1.053 2.686 0.577 1.420 1.079 0.961 1.017 3.520 0.756
vpam = 1.316 ft/s d.n.c = 0.610 ft v3p = 1.477 ft/S daa = 0.621 ft vcac = 1.396 ft/S ~ = 0.611 ft
NOTE: 1 ft = 0.3048 m
91

Table 37. Velocity point distance from toe of vertical wall abutment to channel (L = 1. 250 ft; dcac > 0. 667 ft) .
Contracted width (Wt-c) = 4. 659 ft
vpmc Vpmc/V,.,. Vpmc/V30 Vpmc/Vcac Xt Xt/W,_0
( ft/s) (ft)
0.320 0.203 0.172 0.195 0.061 0.013 0.280 0.177 0.151 0.170 0.186 0.040 1.610 1.020 0.867 0.980 0.394 0.085 1.990 1.261 1.072 1.211 0.603 0.129 1.960 1.242 1.055 1.193 0.811 0.174 1.930 1.223 1.039 1.175 1.020 0.219 1.860 1.179 1.002 1.132 1.228 0.264 1.840 1.166 0.991 1.120 1.436 0.308 1.850 1.172 0.996 1.126 1.853 0.398 1.880 1.191 1.012 1.144 2.686 0.577 1.840 1.166 0.991 1.120 3.520 0.756
v,.,. = 1.578 ft/S d,.., = 0.816 ft v3. = 1.857 ft/S d:,. = 0.830 ft vcac = 1.643 ft/S dcac = 0.824 ft
NOTE: 1 ft = 0.3048 m
92

Table 38. Velocity point distance from toe of vertical wall abutment to channel (L = 1.667 ft; dcac <= 0.375 ft).
Contracted width (Wt-c) = 4. 242 ft
vpmc Vpmc/Vpom Vpmc/V3P Vpmc/Vcac Xt Xt/W, .• (ft/s) ( ft)
0.320 0.202 0.181 0.190 0.105 0.025 0.130 0.082 0.073 0.077 0.186 0.044 2.140 1.351 1.209 1.268 0.394 0.093 2.070 1.307 1.169 1.226 0.603 0.142 2.040 1.288 1.153 1.209 0.811 0.191 1.970 1.244 1.113 1.167 1.019 0.240 1.860 1.174 1.051 1.102 1.228 0.289 1.840 1.162 1.040 1.090 1.436 0.339 1. 760 1.111 0.994 1.043 2.269 0.535 1. 710 1.080 0.966 1.013 3.103 0. 731
vpom = 1.584 ft/s d,.,. = 0.327 ft v3p = 1.770 ft/s d:.. = 0.340 ft vcac = 1.688 ft/S dcac = 0.343 ft
NOTE: 1 ft = 0.3048 m
93

Table 39. Velocity point distance from toe of vertical wall abutment to channel (L = 1.667 ft; 0 . 3 7 5 ft < dcac <= 0 . 6 6 7 ft) .
Contracted width (Wt-c) = 4. 242 ft
vomc V..,.JV..,. Vomc/V30 Vomc/V..,. Xt Xt/W,.., Cft/S) (ft)
0.320 0.203 0.181 0.183 0.105 0.025 0.220 0.140 0.124 0.126 0.186 0.044 1.950 1.240 1.102 1.118 0.394 0.093 2.070 1.315 1.169 1.187 0.603 0.142 1.960 1.246 1.107 1.124 0.811 0.191 1.960 1.246 1.107 1.124 1.019 0.240 1.940 1.233 1.096 1.112 1.228 0.289 1.850 1.176 1.045 1.061 1.436 0.339 1.760 1.119 0.994 1.009 2.269 0.535 1.700 1.081 0.960 0.975 3.103 0.731
v..,. = 1.573 ft/s d,.., = 0.569 ft v"• = 1. 770 ft/s d:J. = 0.582 ft v .... = 1.744 ft/S d..,. = 0.574 ft
NOTE: 1 ft = 0.3048 m
94

Table 40. Velocity point distance from toe of vertical wall abutment to channel (L = 1.667 ft; d~ > 0.667 ft).
Contracted width (Wt-c) = 4.242 ft
Vpmc Vpmc/V_. Vpmc/V3P Vpmc!V.._ Xt Xt/W, .. (ft/S) (ft)
0.360 0.199 0.171 0.195 0.105 0.025 0.270 0.149 0.128 0.146 0.186 0.044 2.240 1.236 1.063 1.212 0.394 0.093 2.340 1.291 1.111 1.266 0.603 0.142 2.200 1.214 1.044 1.190 0.811 0.191 2.220 1.225 1.054 1.201 1.019 0.240 2.170 1.198 1.030 1.174 1.228 0.289 2.140 1.181 1.016 1.158 1.436 0.339 2.100 1.159 0.997 1.136 2.269 0.535 2.080 1.148 0.987 1.126 3.103 0.731
V_. = 1.812 ft/s d,.., = 0.799 ft v3p = 2.107 ft/s da. = 0.817 ft
v""" = 1.848 ft/s d... = 0.817 ft
NOTE: 1 ft = 0.3048 m
95

APPENDIX L
VELOCITY POINT DISTANCE FROM TOE OF SPILL-THROUGH ABUTMENT TO CHANNEL
Table 41. Velocity point distance from toe of spill-through abutment to channel (L = 2.083 ft; dcac <= 0.292 ft).
Contracted width (W1-c) = 3. 982 ft
vpmc Vpmc/V,_. Vpmc/V3P Vpmc/V_, Xt Xt!W,.., (ft/s) (ft)
2.390 1.042 1.153 1.375 0.043 0.011 2.265 0.988 1.093 1.303 0.168 0.042 2.735 1.193 1.320 1.574 0.293 0.074 2.505 1.092 1.209 1.441 0.502 0.126 2.235 0.975 1.079 1.286 1.335 0.335 2.120 0.925 1.023 1.220 2.168 0.544 2.065 0.901 0.997 1.188 3.001 0.754 2.030 0.885 0.980 1.168 3.417 0.858
v,_. = 2.293 ft/S d.n.c =0.156ft v3p = 2.072 ft/S d:J. =0.186ft V_, = 1.718 ft/S d_, = 0.234 ft
Table 42. Velocity point distance from toe of spill-through abutment to channel (L = 2.083 ft; d~ <= 0.292 ft).
Contracted width (W1-c) = 4. 006 ft
vpmc Vpmc/V,_. Vpmc/V3P Vpmc/V_, Xt Xt/W,_0
(ft/s) (ft)
2.755 1.114 1.218 1.518 0.043 0.011 2.610 1.055 1.154 1.438 0.168 0.042 2.525 1.021 1.116 1.391 0.293 0.073 2.605 1.053 1.152 1.435 0.502 0.125 2.505 1.013 1.107 1.380 1.335 0.333
.2.285 0.924 1.010 1.259 2.168 0.541 2.250 0.910 0.995 1.240 3.001 0.749 2.250 0.910 0.995 1.240 3.417 0.853
v,_. = 2.473 ft/S d.n.c = 0.179 ft v3p = 2.262 ft/S d:J. = 0.209 ft V_, = 1.815 ft/S d_, = 0.263 ft
NOTE: 1 ft = 0.3048 m
96
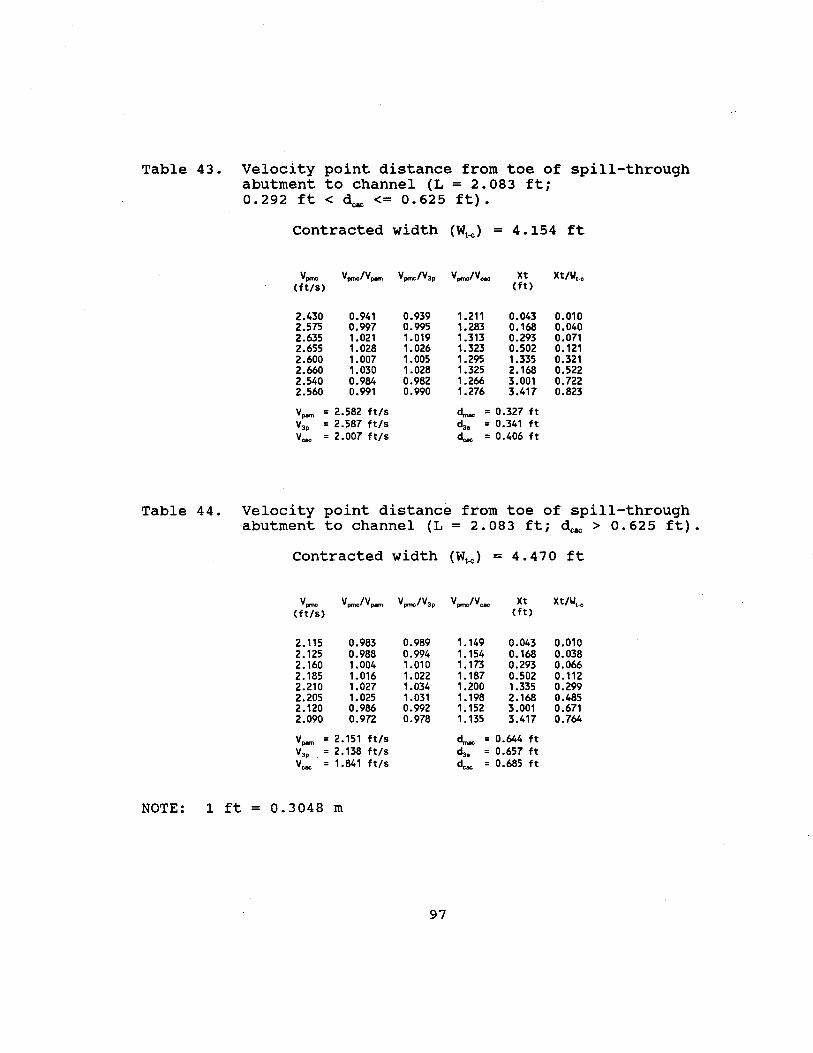
Table 43. Velocity point distance from toe of spill-through abutment to channel (L = 2.083 ft; 0.292 ft < d~ <= 0.625 ft).
Contracted width (Wt-c) = 4.154 ft
Vpme V"""'/V_. Vpmc/V3p V"""'/Vcac Xt Xt/W, .. (ft/S) (ft)
2.430 0.941 0.939 1. 211 0.043 0.010 2.575 0.997 0.995 1.283 0.168 0.040 2.635 1.021 1.019 1.313 0.293 0.071 2.655 1.028 1.026 1.323 0.502 0.121 2.600 1.007 1.005 1.295 1.335 0.321 2.660 1.030 1.028 1.325 2.168 0.522 2.540 0.984 0.982 1.266 3.001 0.722 2.560 0.991 0.990 1.276 3.417 0.823
v_. = 2.582 ft/S d,.,.. = 0.327 ft Vap = 2.587 ft/s ~. = 0.341 ft Vcac = 2.007 ft/S dcac = 0.406 ft
Table 44. Velocity point distance from toe of spill-through abutment to channel (L = 2.083 ft; d~ > 0.625 ft).
Contracted width (W~) = 4.470 ft
v"""' V"""'/V_. Vpmc/V3 P V"""'/Vcac Xt Xt/W, .. (ft/s) (ft)
2.115 0.983 0.989 1.149 0.043 0.010 2.125 0.988 0.994 1.154 0.168 0.038 2.160 1.004 1.010 1.173 0.293 0.066 2.185 1.016 1.022 1.187 0.502 0.112 2.210 1.027 1.034 1.200 1.335 0.299 2.205 1.025 1.031 1.198 2.168 0.485 2.120 0.986 0.992 1.152 3.001 0.671 2.090 0.972 0.978 1.135 3.417 0.764
v_. = 2.151 ft/s d,.,.. = 0.644 ft Yap = 2.138 ft/S ~. = 0.657 ft vcac = 1.841 ft/S dcac = 0.685 ft
NOTE: 1 ft = 0.3048 m
97

Table 45. Velocity point distance from toe of spill-through abutment to channel (L = 2.500 ft; d~ <= 0.292 ft).
contracted width (Wt-c> = 3. 537 ft
v,..., V,...,fV,_. V"""'/V3P V"""'IV ... Xt Xt/W,.., Cft/s) Cft)
2.220 1.052 1.154 1.282 0.022 0.006 2.175 1.030 1.131 1.256 0.147 0.042 2.450 1.161 1.274 1.415 0.272 o.on 2.175 1.030 1.131 1.256 0.595 0.168 2.100 0.995 1.092 1.213 0.918 0.260 1.985 0.940 1.032 1.147 1. 751 0.495 1.900 0.900 0.988 1.098 2.584 0.731 1.885 0.893 0.980 1.089 3.000 0.848
v,_. "'2.111 ft/S d,..., = 0.128 ft v3p "' 1.923 ft/S d:J. = 0.154 ft v_, = 1.731 ft/S d... = 0.209 ft
Table 46. Velocity point distance from toe of spill-through abutment to channel (L = 2.500 ft; d~ <= 0.292 ft).
Contracted width (Wt-c) = 3. 557 ft
v"""' V"""'/V,_. V"""'/V3P V"""'IV ... Xt Xt/W,.., (ft/S) (ft)
2.435 1.on 1.1n 1.329 0.022 0.006 2.335 1.028 1.129 1.275 0.147 0.041 2.400 1.057 1.161 1.310 0.272 0.076 2.490 1.096 1.204 1.359 0.595 0.167 2.305 1.015 1.115 1.258 0.918 0.258 2.105 0.927 1.018 1.149 1. 751 0.492 2.065 0.909 0.999 1.127 2.584 0.726 2.035 0.896 0.984 1.111 3.000 0.843
v,_. = 2.271 ft/S d,..., = 0.147 ft V3p = 2.068 ft/S c~:J. = 0.174 ft v_, = 1.832 ft/S d..., = 0.215 ft
NOTE: 1 ft = 0.3048 m
98
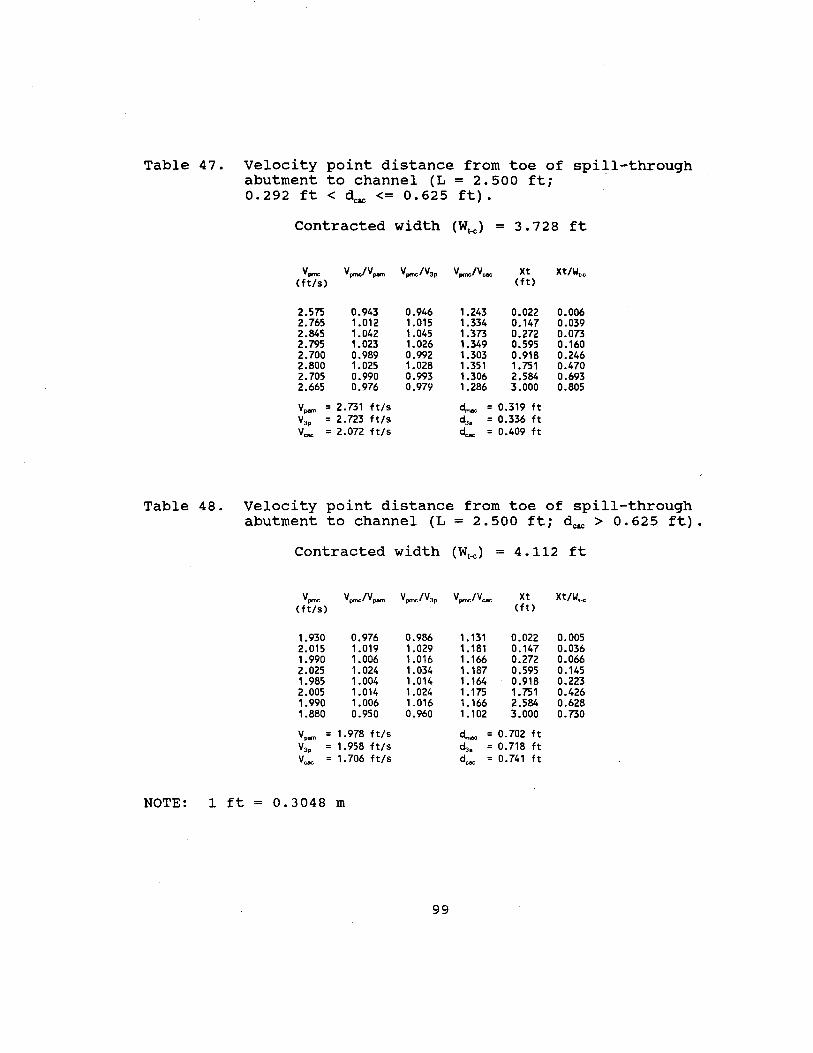
Table 47. Velocity point distance from toe of spill-through abutment to channel (L = 2.500 ft; 0.292 ft < d~ <= 0.625 ft).
Contracted width (Wt-c) = 3. 728 ft
vprnc Vprnc/Vpom Vprnc/V3• Vprnc/Vcac Xt Xt/W,.., (ft/s) (ft)
2.575 0.943 0.946 1.243 0.022 0.006 2.765 1.012 1.015 1.334 0.147 0.039 2.845 1.042 1.045 1.373 0.272 0.073 2.795 1.023 1.026 1.349 0.595 0.160 2.700 0.989 0.992 1.303 0.918 0.246 2.800 1.025 1.028 1.351 1. 751 0.470 2.705 0.990 0.993 1.306 2.584 0.693 2.665 0.976 0.979 1.286 3.000 0.805
vpom = 2.731 ft/s d.nac = 0.319 ft v3. = 2.723 ft/s d:.. = 0.336 ft Vcac = 2.072 ft/s dcac = 0.409 ft
Table 48. Velocity point distance from toe of spill-through abutment to channel (L = 2.500 ft; d~ > 0.625 ft).
Contracted width (Wt-c) = 4.112 ft
vprnc Vprnc/Vpom Vprnc!V3p Vprnc/Vcac Xt Xt/W, .• (ft/s) (ft)
1.930 0.976 0.986 1.131 0.022 0.005 2.015 1.019 1.029 1.181 0.147 0.036 1.990 1.006 1.016 1.166 0.272 0.066 2.025 1.024 1.034 1.187 0.595 0.145 1.985 1.004 1.014 1.164 0.918 0.223 2.005 1.014 1.024 1.175 1. 751 0.426 1.990 1.006 1.016 1.166 2.584 0.628 1.880 0.950 0.960 1.102 3.000 0.730
vpom = 1.978 ft/s d.nac = 0.702 ft v3. = 1.958 ft/s d:.. = 0.718 ft vcac = 1.706 ft/S dcac = 0.741 ft
NOTE: 1 ft = 0.3048 m
99
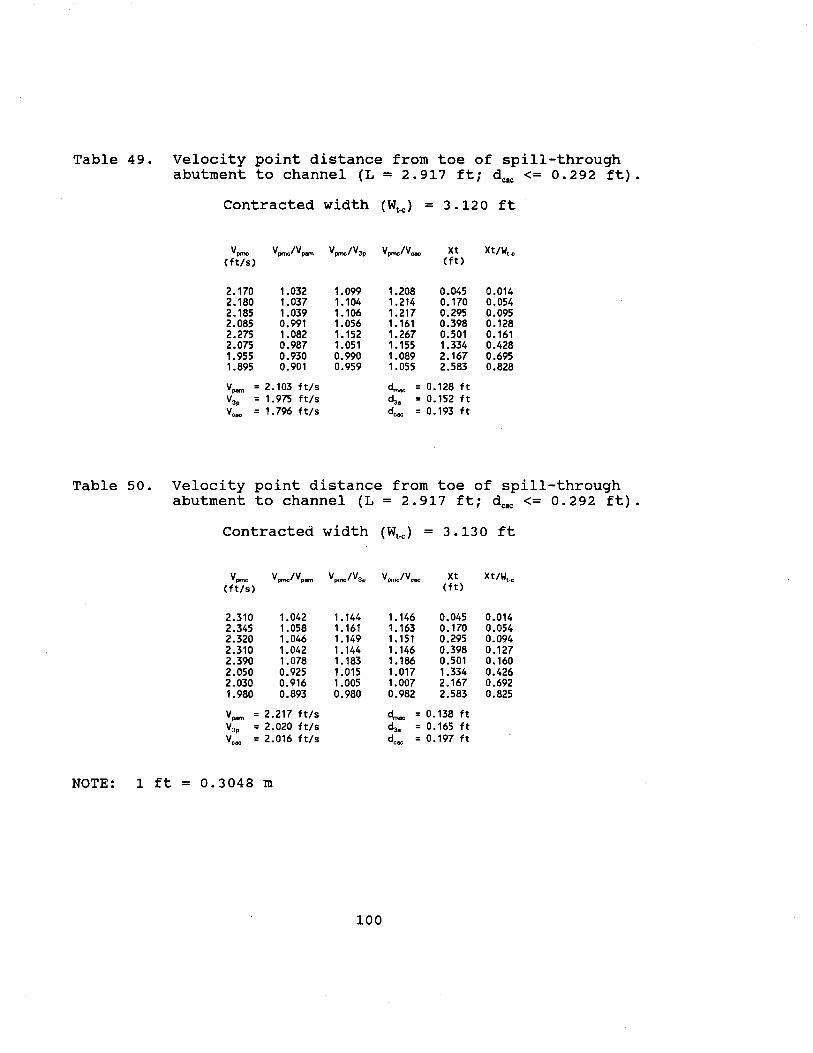
Table 49. Velocity point distance from toe of spill-through abutment to channel (L = 2.917 ft; d~ <= 0.292 ft).
Contracted width (W1-c) = 3.120 ft
vrxnc Vrxnc/V_.. Vrxnc/V30 Vrxnc/Vcac Xt Xt/W,.., (ft/s) (ft)
2.170 1.032 1.099 1.208 0.045 0.014 2.180 1.037 1.104 1.214 0.170 0.054 2.185 1.039 1.106 1.217 0.295 0.095 2.085 0.991 1.056 1.161 0.398 0.128 2.275 1.082 1.152 1.267 0.501 0.161 2.075 0.987 1.051 1.155 1.334 0.428 1.955 0.930 0.990 1.089 2.167 0.695 1.895 0.901 0.959 1.055 2.583 0.828
v_.. = 2.103 ft/s d.noc = 0.128 ft v3o = 1.975 ft/s cia. = 0.152 ft vcac = 1.796 ft/s dcac =0.193ft
Table 50. Velocity point distance from toe of spill-through abutment to channel (L = 2.917 ft; d~ <= 0.292 ft).
Contracted width (W1-c) = 3 .130 ft
vrxnc vrxnc;v._ Vrxnc/V30 Vrxnc/Vcac Xt Xt/W, .• (ft/s) (ft)
2.310 1.042 1.144 1.146 0.045 0.014 2.345 1.058 1.161 1.163 0.170 0.054 2.320 1.046 1.149 1.151 0.295 0.094 2.310 1.042 1.144 1.146 0.398 0.127 2.390 1.078 1.183 1.186 0.501 0.160 2.050 0.925 1.015 1.017 1.334 0.426 2.030 0.916 1.005 1.007 2.167 0.692 1.980 0.893 0.980 0.982 2.583 0.825
v_.. = 2.217 ft/s d.noc = 0.138 ft v3. = 2.020 ft/s cia. = 0.165 ft vcac = 2.016 ft/s d ... = 0.197 ft
NOTE: 1 ft = 0.3048 m
100

Table 51. Velocity point distance from toe of spill-through abutment to channel (L = 2.917 ft; 0.292 ft < dcac <= 0.625 ft}.
Contracted width (W1_J = 3. 292 ft
vpmc Vpmc/Vr-n Vpmc/V3• Vpmc/Vcac Xt Xt/11,_0
(ft/s) (ft)
3.105 1.035 1.083 1.456 0.045 0.014 3.160 1.054 1.102 1.482 0.170 0.052 3.060 1.020 1.067 1.435 0.295 0.090 3.055 1.019 1.066 1.433 0.398 0.121 3.015 1.005 1.052 1.414 0.501 0.152 2.935 0.979 1.024 1.377 1.334 0.405 2.900 0.967 1.012 1.360 2.167 0.658 2. 765 0.922 0.964 1.297 2.583 0.785
vpam = 2.999 ft/s d,... = 0.300 ft v3. = 2.867 ft/S d3a = 0.314 ft v ... = 2.132 ft/s dcac = 0.396 ft
Table 52. Velocity point distance from toe of spill-through abutment to channel (L = 2.917 ft; dcac > 0.625 ft).
Contracted width (W1_c) = 1. 683 ft
vpmc Vpmc/V""'" Vpmc/V3p Vpmc/V ... Xt Xt/11,_0
(ft/s) (ft)
2.030 0.974 0.990 1.178 0.045 0.012 2.090 1.003 1.020 1.213 0.170 0.046 2.120 1.017 1.034 1.230 0.295 0.080 2.135 1.024 1.041 1.239 0.398 0.108 2.150 1.032 1.049 1.248 0.501 0.136 2.100 1.008 1.024 1.219 1.334 0.362 2.040 0.979 0.995 1.184 2.167 0.588 2.010 0.964 0.980 1.167 2.583 0.701
v"""' = 2.084 ft/S d,... = 0.691 ft v3. = 2.050 ft/S d3a = 0.702 ft v ... = 1.723 ft/s d ... = 0.732 ft
NOTE: 1 ft = 0.3048 m
101

Table 53. Velocity point distance from toe of spill-through abutment to channel (L = 3.333 ft; d= <= 0.292 ft).
Contracted width (Wt-c) = 2. 705 ft
vpmc Vpmc/Vpern Vpmc/V3P VpmcNcac Xt Xt/11,_0
(ft/s) (ft)
2.325 1.048 1.120 1.237 0.049 0.018 2.445 1.102 1.178 1.301 0.174 0.064 2.190 0.987 1.055 1.165 0.299 0. 111 2.310 1.041 1.113 1.229 0.424 0.157 2.260 1.018 1.089 1.202 0.671 0.248 2.160 0.973 1.041 1.149 0.918 0.339 2.010 0.906 0.969 1.069 1.751 0.647 2.055 0.926 0.990 1.093 2.167 0.801
vpern = 2.219 ft/S d,.., = 0.129 ft-v3p = 2.075 ft/S d3• = 0.152 ft vcac = 1.880 ft/S dcac = 0.196 ft
Table 54. Velocity point distance from toe of spill-through abutment to channel (L = 3.333 ft; de~<= 0.292 ft).
Contracted width (Wt-c) = 2. 709 ft
vpmc Vpmc/Vpern Vpmc/V3P Vpmc/Vcac Xt Xt/11,_0
( ft/s) (ft)
2.565 1.097 1.171 1.339 0.049 0.018 2.600 1.112 1.187 1.357 0.174 0.064 2.320 0.992 1.059 1. 211 0.299 0.110 2.445 1.045 1.116 1.276 0.424 0.157 2.215 0.947 1.011 1.156 0.671 0.248 2.365 1.011 1.080 1.234 0.918 0.339 2.070 0.885 0.945 1.080 1. 751 0.646 2.135 0.913 0.975 1.114 2.167 0.800
vpern = 2.339 ft/S d,.., =0.133ft v3p = 2.190 ft/S d3a = 0.158 ft vcac = 1.916 ft/S dcac = 0.202 ft
NOTE: 1 ft = 0.3048 m
102

Table 55. Velocity point distance from toe of spill-through abutment to channel (L = 3.333 ft; 0.292 ft < dcac <= 0.625 ft) •
Contracted width (Wk) = 2.882 ft
vpmc Vpmc/V_. Vpmc/V3P Vpmc/Veoc Xt Xt/W,.., (ft/S) (ft)
2.850 1.043 1.022 1.318 0.049 0.017 1.780 0.651 0.638 0.823 0.174 0.060 2.980 1.090 1.068 1.378 0.299 0.104 2.985 1.092 1.070 1.380 0.424 0.147 2.895 1.059 1.038 1.338 0.671 0.233 2.860 1.046 1.025 1.322 0.918 0.319 2.790 1.021 1.000 1.290 1.751 0.608 2.720 0.995 0.975 1.258 2.167 0.752
V_. = 2.733 ft/s d..... = 0.306 ft v3p = 2.790 ft/s d:,. = 0.317 ft v ... = 2.163 ft/s d..c = 0.394 ft
Table 56. Velocity point distance from toe of spill-through abutment to channel (L = 3.333 ft; ~ > 0.625 ft).
Contracted width (Wt-c) = 3. 278 ft
vpmc Vpmc/V_. Vpmc/V3P vpmc~v_ Xt Xt/W,.., (ft/S) (ft)
2.010 0.978 0.982 1.142 0.049 0.015 2.065 1.004 1.009 1.173 0.174 0.053 2.070 1.007 1.011 1.176 0.299 0.091 2.060 1.002 1.006 1.170 0.424 0.129 2.100 1.021 1.026 1.193 0.671 0.205 2.070 1.007 1.011 1.176 0.918 0.280 2.040 0.992 0.997 1.159 1.751 0.534 2.030 0.987 0.992 1.153 2.167 0.661
v_. = 2.056 ft/s d..... = 0.702 ft v3p = 2.047 ft/s d:,. = 0.710 ft vcac = 1.760 ft/s d_ = 0.757 ft
NOTE: 1 ft = 0.3048 m
103

REFERENCES
1. E.V. Richardson, "Evaluating Scour at Bridges", Federal Highway Administration, Washington, DC, September 1990 (Draft).
2. Federal Highway Administration, "Interim Procedures for Evaluating Scour at Bridges", Federal Highway Administration, Washington, DC September 16, 1988.
3. E.M. Laursen, "Scour at Bridge Crossing", Journal of the Hydraulics Division, February 1960.
4. H.K. Liu, F.M. Chang, M.M. Skinner, "Effect of Bridge constriction on Scour and Backwater", February 1961.
5. Highway Research Board, "Scour Around Bridges", Research Report No. 13-B, 1951.
6. Federal Highway Administration, "Recording and Coding of our Nation's Bridges", Washington, DC, December 1988.
7. Federal Highway Administration, Technical Advisory "Scour at Bridges", T 5140.2, Federal Highway Administration, Washington, DC, September 16, 1988.
8. Scott A. Brown and Eric S. Clyde, "Design of Riprap Revetment", Federal Highway Administration, Hydraulic Engineering Circular (HEC) 11, Washington, DC, March 1989.
9. J.C. Blodgett and C.E. McConaughy, "Rock Riprap Design for Protection of Channels Near Highway Structures", Volume II, United States Geological Survey, Sacramento, CA, 1986.
10. Blodgett, J.C., "Rock Riprap Design for Protection of Stream Channels Near Highway Structures", Volume I, United States Geological Survey, Sacramento, CA, 1986.
11. "Sizing Riprap for the Protection of Approach Embankments & Spur Dikes and Limiting the Depth of Scour at Bridge Piers and Abutments", Arizona Department of Transportation, Volume I, Report Number FHWA-AZ-89-260, June 1989.
12. Neill, Charles R., and Yalin, M. Selim, "Quantitative Definition of Beginning of Bed Movement", Journal of the Hydraulics Division, Proceedings of the American Society of Civil Engineers, Volume 95, No. HY1, January 1969.
13. Isbash, s.v., "Construction of Dams by Depositing Rock in Running Water", Communication No. 3, Second Congress on Large Dams, Washington, D.C., 1936.
104

14. Parola, Jr., Arthur, "The Stability of Riprap Used to Protect Bridge Piers", May 1990.
15. Maynord, S.T., "Stable Riprap Size For Open Channel Flows", summer 1987.
16. Simons, D.B., and Lewis, G.L., Flood Protection at Bridge Crossings", 1971.
•U.S. COVDNMENT PRINTlNC OfFICE, 19 9 I. 3 I 2 • 6 a 7t5 5 s 55
105