Stability of Changes in Dental Arch Dimensions with ...
245
Indian Journal Of Natural Sciences www.tnsroindia.org. © IJONS Vol.5 / Issue 28/ February 2015 International Bimonthly ISSN: 0976 – 0997 2706 Stability of Changes in Dental Arch Dimensions with Orthodontic Treatment:A Comparative Study between Extraction and Non-extraction Cases A.Hamid Zafarmand 1 * and M.Mahdi Zafarmand 2 1 Department of Orthodontics,Shahid Beheshti University of Medical Sciences, School of Dentistry, Tehran IR Iran, 2 General Dentist, Private Practice,Iran. Received: 5 Dec 2014 Revised: 15 Jan 2015 Accepted: 31 Jan 2015 *Address for correspondence A.Hamid Zafarmand Associate Professor, Department of Orthodontics, Shahid Beheshti University of Medical Sciences, School of Dentistry, Tehran IR Iran,19839. E.Mail:[email protected] This is an Open Access Journal / article distributed under the terms of the Creative Commons Attribution License (CC BY-NC-ND 3.0) which permits unrestricted use, distribution, and reproduction in any medium, provided the original work is properly cited. All rights reserved. Stability after retention phase is the major goal in orthodontic treatment. Some believe that non-extraction cases are less stable than extraction ones.This study is aimed to evaluate the changes of “intercanine width”, “intermolar width”, and “arch length” in patients treated with extraction of premolarsin comparison with non-extraction cases.Dental casts of 40 patients (Extraction group=21, Non-extraction group=19) were evaluated before treatment (T1), post-treatment (T2) and at post-retention (T3). The arch measurements were in three dimensions (intercanine width, Intermolar width, arch length) in both groups at three stages of treatment. The changes within groups were analyzed with paired t-test, and inter-group changes were compared with student t-test.The changes within each group were evaluated using the Wilcoxon test and the Mann-Whitney test was used for inter-group evaluation.In both study groups “intercanine width” increased with treatment (P≤.001) but decreased at post-retention (P≤.001) period. “intermolar width”continuously decreased with treatment (P≤.001)and after post-retention, in extraction group. However in non-extraction group, this dimension increased with treatment (P≤.001) but reduced at post-retention stage.(P≤.001)“Arch length”in extraction group steadily decreased with treatment (P≤.0001)and at the end of post-retention period.(P≤.001)In non-extraction group, this measurement increased with treatment(P≤.001) butreducedat post-retention stage.(P≤.001) ABSTRACT RESEARCH ARTICLE
-
Upload
khangminh22 -
Category
Documents
-
view
0 -
download
0
Transcript of Stability of Changes in Dental Arch Dimensions with ...

Indian Journal Of Natural Sciences www.tnsroindia.org. © IJONS
Vol.5 / Issue 28/ February 2015 International Bimonthly ISSN: 0976 – 0997
2706
Stability of Changes in Dental Arch Dimensions with Orthodontic Treatment:A Comparative Study between Extraction and Non-extraction Cases A.Hamid Zafarmand1* and M.Mahdi Zafarmand2 1Department of Orthodontics,Shahid Beheshti University of Medical Sciences, School of Dentistry, Tehran IR Iran,
2General Dentist, Private Practice,Iran. Received: 5 Dec 2014 Revised: 15 Jan 2015 Accepted: 31 Jan 2015 *Address for correspondence A.Hamid Zafarmand Associate Professor, Department of Orthodontics, Shahid Beheshti University of Medical Sciences, School of Dentistry, Tehran IR Iran,19839. E.Mail:[email protected]
This is an Open Access Journal / article distributed under the terms of the Creative Commons Attribution License (CC BY-NC-ND 3.0) which permits unrestricted use, distribution, and reproduction in any medium, provided the original work is properly cited. All rights reserved. Stability after retention phase is the major goal in orthodontic treatment. Some believe that non-extraction cases are less stable than extraction ones.This study is aimed to evaluate the changes of “intercanine width”, “intermolar width”, and “arch length” in patients treated with extraction of premolarsin comparison with non-extraction cases.Dental casts of 40 patients (Extraction group=21, Non-extraction group=19) were evaluated before treatment (T1), post-treatment (T2) and at post-retention (T3). The arch measurements were in three dimensions (intercanine width, Intermolar width, arch length) in both groups at three stages of treatment. The changes within groups were analyzed with paired t-test, and inter-group changes were compared with student t-test.The changes within each group were evaluated using the Wilcoxon test and the Mann-Whitney test was used for inter-group evaluation.In both study groups “intercanine width” increased with treatment (P≤.001) but decreased at post-retention (P≤.001) period. “intermolar width”continuously decreased with treatment (P≤.001)and after post-retention, in extraction group. However in non-extraction group, this dimension increased with treatment (P≤.001) but reduced at post-retention stage.(P≤.001)“Arch length”in extraction group steadily decreased with treatment (P≤.0001)and at the end of post-retention period.(P≤.001)In non-extraction group, this measurement increased with treatment(P≤.001) butreducedat post-retention stage.(P≤.001)
ABSTRACT
RESEARCH ARTICLE

Indian Journal Of Natural Sciences www.tnsroindia.org. © IJONS
Vol.5 / Issue 28/ February 2015 International Bimonthly ISSN: 0976 – 0997
2707
Extraction and non-extraction cases have similar tendency to relapse. No correlations were found between study groups related tothe variables of study. Key Words: Post-retention, Post-treatment, Arch Length, Intermolar, Intercanine, Relapse
INTRODUCTION Long-term stability of orthodontic treatment has been related to changes in dental arch dimensions during treatment. (1-2) Some researchers believe that the increase of intercanine width is the cause of later relapse.(3-7) Others state that no correlation is evident between the incidence of relapse and changes in anterior arch width.(8-10) Decrease in arch length during post-retention period is another condition that could subject anterior teeth to relapse.(1, 11).Some others highlight the role of changes in soft tissue subsequent of extraction treatments. In a sense, in extraction cases, changes in the space between the buccal surface of the dentition and the corresponding soft tissue,the so-called “buccalcorridor” space, may prone the alignment to relapse. (12) Furthermore, this may cause an unpleasant appearance due to reduction in fullness of dentition. (13, 14) While others believe that other factors than arch constriction in extraction cases can influence in smile esthetics. (15, 16) In fact, extraction protocols initially have no effect on dental arch dimensions. (17-20)At least,extraction of premolars basically does not violate the anterior arch width. (9, 21) Due to many debates about the dimensional changes of dental arch and its role on stability of orthodontic treatment, this study was designed to assess the changes of “intercanine width”, “intermolar width”, and “arch length” after treatment(T2-T1) and at post-retention(T3-T2) in patients treated with extraction of premolarsin comparison with non-extraction cases. This would clarify whether there is a preference between extraction and non-extraction treatment in terms of stability, regardless of other facts that strongly justify extraction of teeth for orthodontic treatment.
MATERIALS AND METHODS The data for this retrospective study was gathered from records of 40 patients in 3 periods: Pretreatment (T1), Post-treatment (T2), andPost-retention[at least 4 years after debonding](T3). Patients had sought orthodontic treatment in a university orthodontic clinic.Study samples were at post-pubertal age (to minimize the effect of growth), had no history of interceptive orthodontic treatment, circumferential supracrestalfiberotomy (CSF) or reproximation (inter-proximal stripping) treatment. None had any dento-skeletal anomaly like cleft, open- or deep-bite and etc. For accuracy of measurements, a single operator was trained and calibrated for performing the measurements. As a pilot evaluation, ten study models were measured and later in a month were remeasured twice. The values for current variables were recorded and analyzed. The "casual error" was calculated based upon Dahlberg formula (Se2=∑d2/2n). The "systematic error" was also calculated according to "dependent t-test" and the level of .05probability rate. Fortunately, the differences between preliminary and secondary measurements were not statistically significant, for all variables (Table I). All patientswere treated with fix edgewise appliance and achieved successful results-i.e. good final occlusion with Class I canine and molar relationships and well-aligned arches with no crowding or residual spaces in extraction cases. All cases were delivered upper and lower Hawley appliances for retention. Initial panoramic X-Rays of all samples showed presence of third molars.The samples had sound upper and lower study models.
Hamid Zafarmand and Mahdi Zafarmand

Indian Journal Of Natural Sciences www.tnsroindia.org. © IJONS
Vol.5 / Issue 28/ February 2015 International Bimonthly ISSN: 0976 – 0997
2708
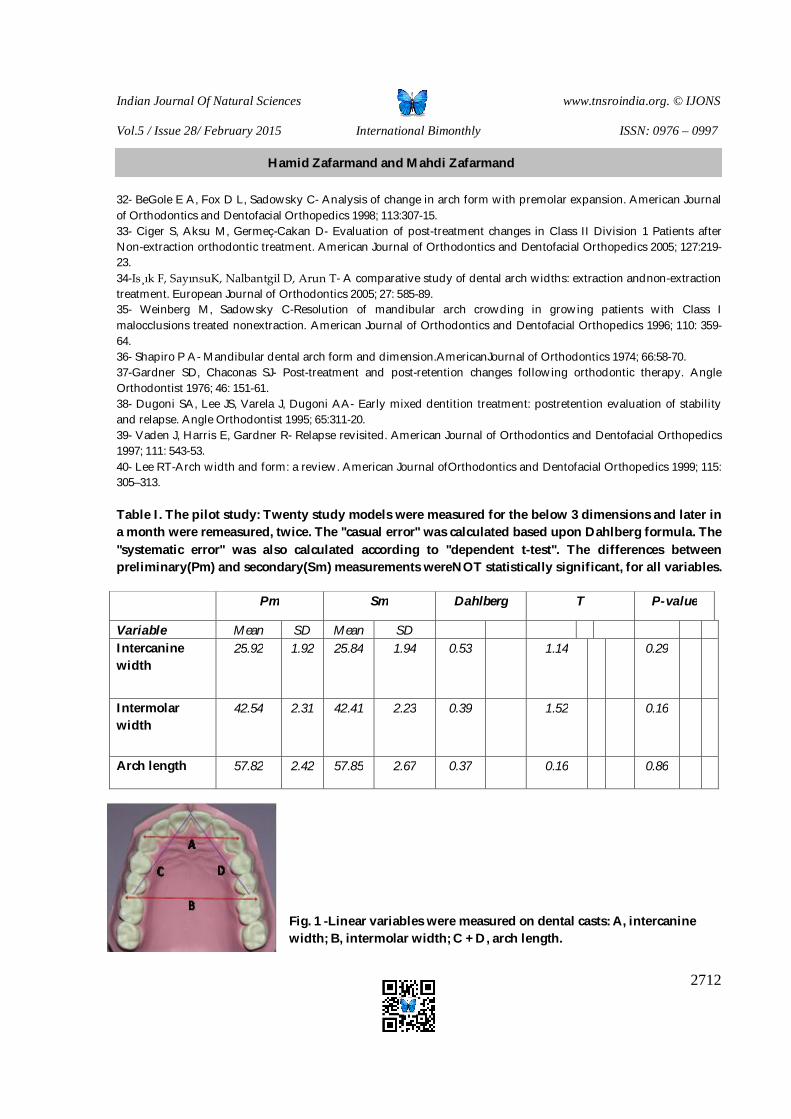
Patients in non-extraction group consisted of 4 boys and 15 girls with the mean age of 16 years and 3 months at T1, 18 years and 9 months at T2, and 24 years and 7 months at T3. For this group, treatment length was 2 years and 7 months and post-retention period was 4 years and 2 months, averagely. The extraction group comprised of 6 boys and 15 girls with the average age of 14 years and 9 months at T1, 17 years and 8 months at T2, and 24 years and 6 months at T3. They sought fix orthodontic treatment for a period of 2 years and 11 months and the post-retention length was 6 years.Only 4 first premolars were extracted for the purpose of treatment. Cast Analysis A number of 120 mandibular study models (3 casts for each stage per patient) were gathered from the archive of orthodontic department for evaluation. The following linear variables were measured with a digital caliper (Mitutoyo, America, Aurora, IL) with the precision of 0.01mm.Allanatomical points were marked with a black 0.3 mm pencil. Intercanine width: the distance between crown tips of right and left canines.(Fig 1, A) Intermolar width: the distance betweenmesiobuccal cusp tips ofright and left molars.(Fig 1, B) Arch length:the sum, in millimeters, of the right and left linear distances frommidline contact of central incisors
to the mesial aspect of the first molars.(Fig 1, C+D) Each distance was measured 3 times, and the average of the 3 values was record as the final measure. Statistical Analysis Mean and standard deviation for each variable weremeasured at the stages T1, T2, and T3 for each sample group. In addition, the differences between T1 and T2, and T2 and T3 stages were calculated. All statistical analysis were performed using the SPSS software package (SPSS for windows 98, version 10.0, SPSS, Chicago, IL)Wilcoxon Sign rank testwas used to evaluate the changes during treatment and postretention,within each group. The Student t-test analysis as well as Mann-Whitney test was performed for changes between extraction and nonextraction samples at post-retention. Statistical significance was established at P<0.05 level. To control the error rate of multiple comparisons, the "Bonferroni correction" test was also used.For assessment of measurementreliability, after one month, 10 casts were randomly selected for re-measurement and analysis by the same examiner (A.Q.). Intra Class correlation coefficient agreement (ICC) was used to assess the reliability of our results. The Casual Error was done according Dahlberg’s formula (Se2 =Σd2/2n) (Dahlberg, 1940), where Seis the error variance, and dis the difference between the 2 measures of the same variable. The Systematic Error according to Dependent t-test was also calculated at theP<0.05 level.22
RESULTS No variables had a systematic error. The casual errors were 0.53 mm for intercanine width, 0.39 mm for intermolar width, and 0.37 mm for arch length.In both groups, intercanine width increased significantly with treatment (T2) (extraction, 1.32 ± 1.52 mm; non-extraction,0.54 ± 1.06 mm, P<0.001), and decreased significantly at post-retention (T3). (Extraction, -0.64 ± 0.51 mm; non-extraction, -0.43 ± 0.37 mm, P<0.001) Intermolar widthdecreased (-2.42 ± 1.37 mm, P<0.001) at T2 and continued to decrease at T3 (-0.49 ± 0.56 mm,P<0.001) in extraction group.These changes were statistically significant. In non-extraction groupintermolar width increased significantly (1.97 ± 1.65 mm, P<0.001) at T2 and decreased significantly (-0.39 ± 0.61 mm, P<0.001) at T3. Inextraction group at T2 and T3 arch length decreased significantly (-9.78 ± 2.39 mm; -0.93 ± 0.44 mm, P<0.001), respectively. In non-extraction group arch length increased significantly (2.53 ± 1.37 mm,P<0.001) at T2, and
Hamid Zafarmand and Mahdi Zafarmand

Indian Journal Of Natural Sciences www.tnsroindia.org. © IJONS
Vol.5 / Issue 28/ February 2015 International Bimonthly ISSN: 0976 – 0997
2709
decreased significantly. (-1.13 ± 0.75 mm, P<0.001) at T3 (Tables II, III).The comparison of changes at post-retention showed no statistically significance differences between extraction and non-extraction groups, for all variables(P<0.001) (Tables IV).
DISCUSSION Long term stability of orthodontic treatment is the ideal goal for orthodontist as well as patient. Normal dental arch development happens during growing years but skeletal changes cease after the pubertal age.23, 24However, in abnormal conditions orthodontic treatment should intervene the problem. At a time, there was a dominant thought that extraction casesshow better stability than non-extraction ones. Various researches have focused on the subject of “incisor crowding relapse”. Some discussed the subject based upon “extraction” samples,2, 25, 26 and others evaluated “non-extraction” cases.3, 8, 27 Lastly, there are otherstudies that have compared the stability of orthodontic treatment between “extraction and non-extraction” samples. 5, 10, 28Thus, for many reasons there is no consensus among researchers concerning the issue. This study was based upon only the intra-arch pattern (a single arch dimension) rather than inter-arch pattern (occlusion). In some other studies that only focused on arch widths changes and compared cases only before and after treatment concluded with similar results as this study did in the similarevaluation period(19,29).In this study "the lower arch"was evaluated sincehas stated that the maxillary dental arch does not establish the dental arch width. 17 In fact, the premise for orthodontic treatment is that "the lower arch is the diagnostic arch". In addition, to purify the results, no appliances specifically were designed or used to increase mandibular arch width (posterior & anterior dimensions) because of the instability of excessive mandibular intercanine expansion (greater than 1-1.5 mm)(30). According to the results of this study,regardless of treatment modalities intercanine widthincreased (T2) but decreased during post-retentionperiod (T3). Some other studies have also concluded with same result.(8, 9, 17-20, 28, 31-33)In some of these studies adjunct treatment like the ARS procedure was also part of the treatment plan.(20) However, there are other researches that disagree with the above changes. (13, 14)Yavariet al. (3) even reported more relapse during post-retention in anterior arch width with non-extraction treatment. It seems that regardless of the treatment protocol intercanine width has a decreasing trend during post-retention period (2).It should be reminded that a slightly larger increase normally occurs in those treated with extractions, possibly reflecting minor distal movement ascuspidsmove to better alignment position.Therefore, minor anterior arch width increase is tolerable for the jaw. Furthermore, it is proved that maintenance of initial mandibular intercanine width could not guarantee the stability of the intercanine width and incisor alignment (10). Intermolar width decreased during T3 in both treatment protocols, although this dimensionincreased with treatment (T2) in non-extraction group. This is the findings that other researches have also emphasized on. (18, 34) Even if ARS technique is used as a part of procedure same results is expected as well. (20) Closure of extraction sites often results in mesial movement of molars indicative of a narrower part of the arch, as reported in many studies. (9, 18-20, 28)Eventhough the distal movement of molars is very blurred justification, interestingly enough, a study has indicated that the movement of the molars toward distalmay be the reason for arch width increase.(35) This was the contrary to those who believe the concept of long-term stability of intermolar width after treatment. (3, 27, 28, 36-38) It may be also perceived that this increment in the study was due to the selection of samples at the growing age. Arch length is very much related to the molar position and incisor angulation, concurrently. It is also reported thatphysiologicallymesial drift of molars may happen because of aging or the effect of anterior component of the functional forces.(39) According to this study, arch length significantly decreased steadily at T2 and T3 in "extraction group". Adversely, in "non-extraction group", it increased at T2 but only part of that reduced at T3. (Table 3) In their study, Ciger et al. (33)noticed significant reduction of arch length at T3 stage.
Hamid Zafarmand and Mahdi Zafarmand

Indian Journal Of Natural Sciences www.tnsroindia.org. © IJONS
Vol.5 / Issue 28/ February 2015 International Bimonthly ISSN: 0976 – 0997
2710
When comparing the results of two treatment protocols, no significant differences were found between changes of none of mandibular arch dimensions during T2 and T3. All variables of this study for extraction and non-extraction treatment showed that extraction does not provide more stability during post-retention period.The positive point of this research was that all selected patients were in the post-pubertal growth period; thus, the effects of growth were reduced (40). The other point is that, nonetheless, there is an inevitable phenomenon of change in the skeleton with aging of individual.
CONCLUSION Thisstudy generally concluded that none of the treatment protocols has priority to the other concerning the stability of treatment. The following are the summarizedpointsof the study: In both groups intercanine width increased significantly with treatment (T2)and decreased significantly at post-
retention (T3) Intermolar width decreased at T2 and continued to decrease at T3 in extraction group, these changes were
statistically significant. In non-extraction group intermolar width increased significantly at T2 and decreased significantly at T3.
In extraction group at T2 and T3 arch length decreased significantly, respectively. In non-extraction group arch length increased significantly at T2, and decreased significantly at T3.
It should be reminded that the treatment relapse partially is related to patient's compliance to retainer wear.
ACKNOWLEDGEMENTS This article was originated from a doctoral thesis of dentistry registered under #2797, the office of Academic Affairs at Shahid Beheshti University of Medical Sciences, School of Dentistry. The authors would also appreciate Dr. Ali Qamari for his assistance in data collection procedure.
REFERENCES 1.Årtun J, Garol JD, Little RM-Long-term stability of mandibular incisors following successful treatment of Class II, Division 1, malocclusions. Angle Orthodontist 1996;66: 229-38. 2-Little RM, Wallen TR, Riedel RA. Stability and relapse of mandibular anterior alignment-first premolar extraction cases treated by traditional edgewise orthodontics. American Journal of Orthodontics 1981; 80: 349-65. 3-Yavari J, Shrout MK, Russell CM, Haas AJ, Hamilton EH- Relapse in Angle Class II Division 1 malocclusion treated by tandem mechanics without extraction of permanent teeth: a retrospective analysis- American Journal of Orthodontics andDentofacial Orthopedics2000;118: 34-42. 4-Rossouw PE, Preston CB, Lombard CJ, Truter J W-A longitudinal evaluation of the anterior border of the dentition.American Journal of Orthodontics and Dentofacial Orthopedics 1993; 104: 146-52. 5-Rossouw PE, Preston C B, Lombard C- A longitudinal evaluation of extraction versus non-extraction treatment with special reference to the post-treatment irregularity of the lower incisors.Seminars inOrthodontics 1999; 5: 160-70. 6-Bishara SE, Chadha JM, Potter RB- Stability of intercanine width, overbite, and overjet correction- Am J Orthod; 1973, 63:588-95. 7-Little RM, Wallen TR, Riedel RA- Mandibular arch length increase during mixed dentition: post-retention evaluation of stability and relapse- Am J of Orthod Dentofac Orthoped, 1990; 97:393-404. 8-Freitas KMS, Freitas MR, Henriques JFC, Pinzan A, Janson G- Postretention relapse of mandibular anterior crowding in patients treated without mandibular premolar extraction. American Journal of OrthodonticsandDentofacial Orthopedics 2004; 125: 480-7.
Hamid Zafarmand and Mahdi Zafarmand

Indian Journal Of Natural Sciences www.tnsroindia.org. © IJONS
Vol.5 / Issue 28/ February 2015 International Bimonthly ISSN: 0976 – 0997
2711
9-Paquette DE, Beattie JR, Johnston LE- A long-term comparison of non-extraction and premolar extraction edgewise therapy in “borderline” Class II patients.American Journal of Orthodontics and Dentofacial Orthopedics 1992; 102: 1-14. 10-Zafarmand AH, Qamari A, Zafarmand MM-Mandibular Incisor Re-Crowding: Is It Different in Extraction and Non-extraction cases? - J Oral Health & Dental Management 2014; 13(3):669-674. 11- bKahl-Nieke B, Fischbach H, Schwarze CW- Postretention crowding and incisor irregularity: the long-term follow-up evaluation of stability and relapse. British Journal of Orthodontics 1995; 22: 249-57. 12-Johnson DK, Smith RJ- Smile esthetics after orthodontic treatment with and without extraction of four first premolars. American Journal of Orthodontics andDentofacial Orthopedics 1995; 108:162-7. 13- Dierkes JM- The beauty of face: an orthopedic perspective. Journal of the American Dental Association (1939) 1987; Spec No:89E-95E. 14-Witzig JW, Spahl TJ- The clinical management of basic maxillofacial orthopedic appliances. Vol. 1. Mechanics. 1987- 1st ed. PSG Publishing Co., Littleton, Massachusetts. 15-Zachrisson B U- Maxillary expansion, long-term stability and smile esthetics- World Journal of Orthodontics.2001; 2: 266-272. 16-Zachrisson B U- Making the premolar extraction smile full and radiant. World Journal of Orthodontics- 2002; 3: 260-265. 17- Gianelly AA- Arch width after extraction and non-extraction treatment. American Journal of Orthodontics and Dentofacial Orthopedics 2003; 123: 25-28. 18- Kim E, Gianelly AA- Extraction vs. non-extraction: arch widths and smile esthetics. Angle Orthodontist 2003; 73: 354-358. 19-Aksu M, Kocadereli I- Arch Width Changes in Extraction and Non-extraction Treatment in Class I Patients. Angle Orthodontist 2005; 75:948-52. 20-Germec-Cakan D, Taner TU, Akan S- Arch-width and perimeter changes in patients with borderline Class I malocclusion treated with extraction or without extraction with air-rotor stripping. American Journal of Orthodontics and Dentofacial Orthopedics 2010; 137:734.e1-734.e7. 21- Luppanapornlarp S, Johnston Jr LE- The effects of premolar extraction: a long term comparison of outcomes in ‘clear-cut’ extraction and non-extraction Class II patients. Angle Orthodontist 1993; 64:257-272. 22- Houston WJB- Analysis of errors in orthodontic measurements. American Journal of Orthodontics 1983; 83: 382-90. 23-Zafarmand AH, Mina M, Zafarmand MM-Maxillary Arch Dimension Changes of 3-5 Years Old Filipino ChildrenNovel Biomed- 2014;2(4):126-30. 24-Uysal T, Memilli B, Usumez S, Sari Z– Dental and alveolar Arch widths in normal occlusion, Class II division 1, and in Class II division 2- Angle Orthod 2005; 75:941-7. 25- Cole HJ- Certain results of extraction in treatment of malocclusion. Angle Orthodontist 1948; 18: 103-13. 26- Janson G, Busato MCA, Henriques JFC, Freitas MR, Freitas LMA- Alignment stability in class II malocclusion treated with 2- and 4-premolar extraction protocols. American Journal of Orthodontics andDentofacial Orthopedics 2006; 130:189-95. 27-Glenn G, Sinclair P, Alexander R- Non-extractionorthodontictherapy: post-treatment dental and skeletal stability. American Journal of Orthodontics and Dentofacial Orthopedics 1987; 92:321-8. 28- Erdinc AE, Nanda RS, Işiksal E- Relapse of anterior crowding in patients treated with Extraction and Non-extraction of premolars. American Journal of Orthodontics and Dentofacial Orthopedics 2006; 129: 775-84 29-Huth J, Staley RN, Jacobs R, Bigelow H, Jakobsen J- Arch widths in Class II-2 adults compared to Arch Widths in Class II-1 adults and Normal Occlusion- Angle Orthod 2007; 77: 837-44. 30- Burke SP, Silveira AM, Goldsmith LJ, Yancey JM, Stewart A, Scarfe WC- A meta-analysis of mandibular intercanine width in treatment and post retention. Angle Orthodontist 1998; 68:53-60. 31-Uhde MD, Sadowsky C, BeGole EA- Long-term stability of dental relationships after orthodontic treatment. Angle Orthodontist 1983; 53: 240-52.
Hamid Zafarmand and Mahdi Zafarmand
Indian Journal Of Natural Sciences www.tnsroindia.org. © IJONS
Vol.5 / Issue 28/ February 2015 International Bimonthly ISSN: 0976 – 0997
2712
32- BeGole E A, Fox D L, Sadowsky C- Analysis of change in arch form with premolar expansion. American Journal of Orthodontics and Dentofacial Orthopedics 1998; 113:307-15. 33- Ciger S, Aksu M, Germeç-Cakan D- Evaluation of post-treatment changes in Class II Division 1 Patients after Non-extraction orthodontic treatment. American Journal of Orthodontics and Dentofacial Orthopedics 2005; 127:219-23. 34-Is¸ık F, SayınsuK, Nalbantgil D, Arun T- A comparative study of dental arch widths: extraction andnon-extraction treatment. European Journal of Orthodontics 2005; 27: 585-89. 35- Weinberg M, Sadowsky C-Resolution of mandibular arch crowding in growing patients with Class I malocclusions treated nonextraction. American Journal of Orthodontics and Dentofacial Orthopedics 1996; 110: 359-64. 36- Shapiro P A- Mandibular dental arch form and dimension.AmericanJournal of Orthodontics 1974; 66:58-70. 37-Gardner SD, Chaconas SJ- Post-treatment and post-retention changes following orthodontic therapy. Angle Orthodontist 1976; 46: 151-61. 38- Dugoni SA, Lee JS, Varela J, Dugoni AA- Early mixed dentition treatment: postretention evaluation of stability and relapse. Angle Orthodontist 1995; 65:311-20. 39- Vaden J, Harris E, Gardner R- Relapse revisited. American Journal of Orthodontics and Dentofacial Orthopedics 1997; 111: 543-53. 40- Lee RT-Arch width and form: a review. American Journal ofOrthodontics and Dentofacial Orthopedics 1999; 115: 305–313. Table I. The pilot study: Twenty study models were measured for the below 3 dimensions and later in a month were remeasured, twice. The "casual error" was calculated based upon Dahlberg formula. The "systematic error" was also calculated according to "dependent t-test". The differences between preliminary(Pm) and secondary(Sm) measurements wereNOT statistically significant, for all variables.
Pm Sm Dahlberg T P-value
Variable Mean SD Mean SD Intercanine width
25.92 1.92 25.84 1.94 0.53 1.14 0.29
Intermolar width
42.54 2.31 42.41 2.23 0.39 1.52 0.16
Arch length 57.82 2.42 57.85 2.67 0.37 0.16 0.86
Fig. 1 -Linear variables were measured on dental casts: A, intercanine width; B, intermolar width; C + D, arch length.
Hamid Zafarmand and Mahdi Zafarmand

Indian Journal Of Natural Sciences www.tnsroindia.org. © IJONS
Vol.5 / Issue 28/ February 2015 International Bimonthly ISSN: 0976 – 0997
2713
Table II. Means and standard deviations of dental variables of “extraction” group (n=21) at T1, T2 and T3, and differences from T1 to T2 and T2 to T3.
T1 T2 T3 T2-T1 T3-T2
Variable Mean SD Mean SD Mean SD D SD P D SD P Intercanine width
26.15 2.44 27.48 2.32 26.84 2.29 1.33 1.52 S -0.64 0.51 S
Intermolar width
42.76 2.51 40.35 2.24 39.86 2.21 -2.41 1.37 S -0.49 0.56 S
Arch length 58.36 3.43 48.57 2.16 47.64 2.09 -9.78 2.39 S -0.93 0.44 S
SD, Standard Deviation; D, Mean of differences; P value<0.001; S: Significant; NS: Non-significant Table III. Means and standard deviations of dental variables of “non-extraction” group (n=19) at T1, T2 and T3, and differences from T1 to T2 and T2 to T3.
T1 T2 T3 T2-T1 T3-T2 Variable Mean SD Mean SD Mean SD D SD P D SD P Intercanine width
25.70 1.46 26.24 1.38 25.81 1.25 0.54 1.06 S -0.43 0.37 S
Intermolar width
41.19 2.58 43.16 2.03 42.77 2.07 1.97 1.65 S -0.39 0.61 S
Arch length 57.08 2.10 59.62 1.45 58.48 1.54 2.53 1.37 S -1.13 0.75 S
SD, Standard Deviation; D, Mean of differences; P value<0.001; S: Significant; NS: Non-significant Table IV. Comparison of changes at post-retention (T3-T2) between “extraction and non-extraction” cases.
Extraction Non-extraction Paired sample t-test Variable D SD P D SD P P Intercanine width -0.64 0.51 S -0.43 0.37 S NS
Intermolar width -0.49 0.56 S -0.39 0.61 S NS Arch length -0.93 0.44 S -1.13 0.75 S NS
SD, Standard Deviation; D, Mean of differences; P value<0.001; S: Significant; NS: Non-significant
Hamid Zafarmand and Mahdi Zafarmand

Indian Journal Of Natural Sciences www.tnsroindia.org. © IJONS
Vol.5 / Issue 28/ February 2015 International Bimonthly ISSN: 0976 – 0997
2714
A Mathematical Model for Multi-Objective Supply Chain Material Requirements Planning using Lexicograph Solution (The Topo Beverage Company) Hamid Shahbandarzadeh1, Gholamreza Jamali1 and Yaghoob Barati2*
1 Department of Industrial Management, Faculty of Humanities, Persian Gulf University,Iran. 2 Department of Industrial Management, Faculty of Humanities, Persian Gulf University,Iran.
Received:25 Dec 2014 Revised: 15 Jan 2015 Accepted: 31 Jan 2014 *Address for correspondence Yaghoob Barati Department of Industrial Management, Faculty of Humanities, Persian Gulf University, Iran.
This is an Open Access Journal / article distributed under the terms of the Creative Commons Attribution License (CC BY-NC-ND 3.0) which permits unrestricted use, distribution, and reproduction in any medium, provided the original work is properly cited. All rights reserved. The materials requirement planning is considered one of the major systems in material planning in production management section of the companies. In supply chain, the material requirement planning system (MRP) is used in product management process in order to supply material. The aim of this article is to propose a multi-objective mathematical model in material requirement planning of the Topo Aloe vera beverage company.A linear programming model, having two objectives is proposed in this article and the required data to write and to test the model is gathered from TopoCompany. In this paper, the proposed model is solved using the lexicographyy model and after modeling the problem, the model is run using the MATLAB software, and the obtained results are analyzed and the optimum values of objective functions and the decision variables of the model are determined. Key words: mathematical modeling, the material requirement planning, supply chain, lexicograph. INTRODUCTION Considering the national and international competitions in the present era, the organizations are required to provide their customer with on time products and without delay. On the other hand, the organizations must give it a thought to reduce their expenses and minimize their raw materials in warehouses so that they minimize the expenses regarding the storage and maintenance. The material requirement planning system is one of the basic measures that assist organizations in this issue. The material requirement planning is a planning method that measures the required material to meet the demands in all products in one or several parts of the industry, and using this not only the production continuity is kept, but also we can prevent excessive storage of materials.Information technology has
ABSTRACT
RESEARCH ARTICLE

Indian Journal Of Natural Sciences www.tnsroindia.org. © IJONS
Vol.5 / Issue 28/ February 2015 International Bimonthly ISSN: 0976 – 0997
2715
a major role in design and performance of systems and material requirement planning procedures as a information provider relating to production demands (related to customer demands) and also data on inventory levels (Ehsani, Naseri, &Sajadei 1388). One of themajor responsibilities in industrial units is planning and inventory control. The collected activities as the inventory control have always attracted the management, material control and order and industrial management’s attention. Therefore, the material requirement planning 1 system is considered one of the first and main tools to createand supervise the production control plan and in fact is a scheduled and planned image of the demands and requirements. In current production systems, the material requirement planning is at the heart of the systems and causes a balance between, production, demand, and offer, and keeps the financial performance in order in an organization and is considered one of the major parts of the current systems (Ghazanfari&Rezaeei Sadr Abadi 1387). The material requirement planning has a balancing position in production management and in this system, a prediction for product demand is proposed and determines the demand dependency on cases such as: the required components, the accurate quantitative components and timing of the orders to provide a production plan. In other words, MRP is a computer system to determine time and amount of the required material used in production stage. Therefore, MRP is responsible for planning, production supervision, and material control and on time delivery of the product in product management. Material planning has a vital role in production section of an organization and acts as a coordinator and a controller in production system of a government, and is considered a brain in production section of the organization, which not only has the planner, controller and a supervisor role but also is responsible to predict the customer demands.The accuracy and efficiency in the application of this system can be enhanced by using the mathematical model in material requirement planning and also the main roles of the material requirement planning such as production supervision, material control, and on time delivery of the material can be performed with greater accuracy and precision. The statement of the problem The material requirement planning is one of the basic and major responsibilities of managers in coordinating and profitability of the supply chain. Supplying the required raw materials in assembly line is one of the problems that most companies face and has always attracted managers’ attention. The growth development of industrial technology and ease of access to developed methods of production, and the increased competition domain to the changing demands of the customers, has made the producers to deliver variety of products and consider the technical and qualitative demands of the customers in production design. This issue has made the material planning and required component of the products and the management on its accurate and precise performance, so complex and time-consuming andfrequently it has increased the working capitalwhich is required to supply the raw materials. In material requirement planning, the time and amount of the production to meet market demands is determined. This leads to market demand accountability, minimizing the production costs and reduction in inventory changes. In order for this to be done in the best possible way, a suitable model to define the relation between MRP variables must be proposed by the use of a mathematical model. non-use of a suitable mathematical model in MRP, the exact timing and correct planning about material requirement will face a serious problem that will lead to high cost for the organization and assembly line which will lead to failure (bankruptcy) of the organization in long run (Rabbani 1390). The material requirement planning system has several applications and key roles in the organization and has a high effect on production section of the organization. From customer demand and order records to storage and stock control, to assembly line of the components all depend on the MRP system in a way. One of the major applications of the MRP system is the controlling and supervising role and with the lack of this system, the production system of the organization will lose it controlling role that will lead to lose of defending and controlling system of the organization
Yaghoob Barati et al. et al.

Indian Journal Of Natural Sciences www.tnsroindia.org. © IJONS
Vol.5 / Issue 28/ February 2015 International Bimonthly ISSN: 0976 – 0997
2716
and as a result, the order records section will face a problem and the demands are not received on time and the received demands won’t be delivered on time either. This issue can lead to customer complaints and destroy the prestige of the organization and therefore the rivals take the market of the organization. The continuation of this trend can stop the assembly line and lead to failure of the company or the organization (Mirmohammadi, Shadrokh, &Keyanfar 2009).Another important application of the MRP is the material planning discussion for the assembly line. If the material planning and mathematical modeling of the material plan are ignored, then the assembly line will face a fluctuation which is considered a risk for the organization and the raw material will not be received on time in the production systems which are based on on time production system, and the products won’t be delivered to customer on due time, which can lead to grievances and compliant of the customer (Monk&Wanger, 2006).Therefore, it can be said that proposing a model based on mathematical planning can be a way for optimizing of material requirement planning for the organization. Literature Review The pervasiveness of the material requirement planning, was formed at the beginning of the 1960 decade as a computerized approach to material requirement, production and logistics planning in America and was completed later with the continuation of efforts in the production and stock control of America in beginning of 1970 decade and its complete guide book was published by Orlicky4 in 1975. Without doubt, the MRP technique was also used manually and in a compilation form in different parts of the Europe before the Second World War. However, Orlicky found that computer had provided all the MRP technique details and this issue made the mentioned technique more effective in managing current stock during the production. Supply chain Supply chain is a set of methods to effectively integrate the suppliers, producers, warehouses and the department stores, so that the required products are produced in the needed amount and the due time and specific location and be delivered to the customers, so that the costs of all the chain be minimized and at the same time the customer demands be met in a high quality service (SadeghiMoghadam, Momeni&Nalchiger, 1388). The management of the supply chain is an integration of knowledge and art that improves the finding procedure of required raw materials for production and service. The stock role is the main role in success or failure of the supply chain. Therefore, coordination of stock levels in all supply chain is of great importance. The supply chain includes all the related activities of exchange of commodity from the raw material stage to delivery of the product to final consumer and also all the related information flows. In general, the supply chain is a chain that includes all the activities about the commodity flow and material conversion, from preparing the raw material to delivery of final product. Regarding the commodity flow, there are also two other flows, one is the information flow and the other is the credit and financial sources flow. Material requirement planning: The material requirement planning includes a set of notes, techniques, and rational procedures and decisions about details of the final commodity production planning that includes the subsets and final items concerning the net requirements and the amount of required materials (Orlicky, 1994). The material requirement planning first considers the final product, then analyses it to its component parts and next considering the required time for each of the materials performs the necessary plans. This system assists us to identify the related activities about the procurement of parts and material and determine their time of performance
Yaghoob Barati et al.

Indian Journal Of Natural Sciences www.tnsroindia.org. © IJONS
Vol.5 / Issue 28/ February 2015 International Bimonthly ISSN: 0976 – 0997
2717
during program (Makoui, 1390). The material requirement planning, planning and controlling the orders and stock for items depend on the demand when the demand is possible and discontinuous (Gaspersz, 2001). Some stages must be taken into account in material requirement development, which are named as basic steps in material requirement planning, these steps are as follows: (Makoui, 1390)( Sheykhan&MehrAsa, 1391). Step one: preparing a list that includes all the necessary parts in making the desired product (material and parts list5) Step two: determining a monthly production plan, so that we know how much to produce in a month. Step three: receiving the amount of parts (used in product) in warehouse Step four: information required for the delay in receiving product order Step five: information related to amount of construction Any planning and system utilized in an organization has objectives, and the organization applies the plans in order to get to its objectives. The material requirement planning also has goals which are as follows: (Sheykhan&MehrAsa, 1391). The reduction of warehouse stock The reduction in production and delivery time of the commodity The evaluation of real time of commodity delivery Avoiding delay in commodity delivery Increase in productivity
Figure 1, displays a supply chain and specifies the material requirement planning position that performs the production and material planning by using the data obtained from the customers. Multi-objective mathematical modeling The behavior analysis of a system requires an experiment on the system, and in most cases when the experiment is impossible or expensive, the system is examined on its major properties. This procedure is designed in various ways and one of these methods is the mathematical modeling. A model is a specific display of a reality; therefore the mathematical model is a simple and general display of an objective world. The mathematical models use numbers and letters to show the variables and the relation between them and in fact, demonstrate a real world topic in numerical language, and this makes them to be more general and abstract from other models and also have the higher ability of manipulation (Mehregan, 1386). The multi-objective mathematical planning is a method where the objectives are in conflict with each other and instead of a model with one goal, a model with two or more goals are proposed and in this method we try to obtain the best solution for the problem. Sometimes because of cases such as the goal changes in time period, the prioritizing possibility in objectives of the model, non-gathering objectives in question, the application of multi-objective planning method becomes necessary (Momeni, 1392). The empirical background of the research Many studies have been done on the material requirement planning (MRP) and the application of the mathematical model has been done in them. Some of these studies have been examined in this research that are follows, the rest of them are mentioned in Table 1.
Yaghoob Barati et al.

Indian Journal Of Natural Sciences www.tnsroindia.org. © IJONS
Vol.5 / Issue 28/ February 2015 International Bimonthly ISSN: 0976 – 0997
2718
Aly6 and Dolgui7 in 2013 identified the optimized parameters in MRP in uncertainty situation and examined the delay time. They proposed the delay time as the accidental variable. They pointed to the material requirement planning and showed their role in optimizing. In addition, in their article, MRP is examined with temporal order approach (AlyLouly&Dolgui, 2013). Sabater8, Maheut9, and Garcia10 in 2013, raised a formulization method in material and production planning. In their article, they discussed a model that showed the relation between material and production operations. Sabater and colleagues proposed their model by focusing on the concept of material and parts list in material planning structure. They emphasized on material transportation, capacity, and material and product substitution in their model and designed their model with a objective function and five constraints and solved it using innovative and meta-heuristic methods (Sabater, Maheut, Garcia, 2013).In 2010, Inderfurth 11examined the protection against demand and supply risks in MRP system, and analyzing the stochastic stock control showed how MRP operation control rules can be evaluated and how to determine the suitable control parameters for materials (Inderfurth, 2010).In 2007, Johnny12, Adriano13, and Chang14 examined the effect of stock reduction in material requirement planning and said that stock control had a vital role in material requirement planning. They designed a mathematical model for this problem, and evaluated the mathematical model by using meta-heuristic models to determine the required material stock (Johnny, Adriano, & Chang, 2007) In 1390, Rabbani examined the use of fuzzy approach in accumulated problem in a system based on MRP, in his article. Rabbani has proposed a multi-level mathematical model by using an expert fuzzy system in estimating the fuzzy parameters for the accumulated problem.Rabbani using α- cut concept, proposed a fuzzy mathematical planning for problem solving (Rabbani, 1390).In 2009, Mirmohammadi, Shadrokh, and Keyanfar proposed a branch and bound algorithm in their article in order to determine the material size for an item in MRP with step to step time demand and fixed cost of an order, without any delay. They attempted to obtain an optimized and efficient algorithm for the discounted value at the time of order in material requirement planning (Mirmohammadi, Shadrokh, &Keyanfar, 2009).Lee, Park, and Jeong in 2009 suggested an active network containing MRP process in distributed database environment and proposed a one approach simulation to optimize the process operation. They also pointed to use of other systems and software (Gon Lee, Park, &Jeong, 2009). The goals and research questions There are a set of objectives, questions or research hypothesis for each study that motivates the research to perform the study, therefore, the objective of this research is to propose and apply a multi-objective mathematical model in material requirement planning of the supply chain. The goals of this study are stated as follows: 1. Preparing a multi-objective mathematical model suitable to specify the relation between the material
requirement planning variables. 2. Determining the optimization in material requirement planning levels. 3. Proposing a suitable method to solve the proposed mathematical model
In addition, the research questions of this study are stated as follows: 1. What are the mathematical model variables and parameters to material requirement planning? 2. How can a model for material requirement planning be proposed? 3. How will this model be solved in this research?
Therefore, in this article a multi-objective mathematical model for the material requirement planning will be proposed to make it more efficient and accurate. The findings of this research are not only applicable for companies’ and organizations’ managers, but also they’re useful for researchers, decision makers and administrators.
Yaghoob Barati et al.

Indian Journal Of Natural Sciences www.tnsroindia.org. © IJONS
Vol.5 / Issue 28/ February 2015 International Bimonthly ISSN: 0976 – 0997
2719
METHODOLOGY The research methodologies are usually categorized according to two objective criteria and the data collection procedures. The studies are categorized to basic and applied research considering their objectives and to descriptive and experimental research by considering their data collection procedures. However, Sarmad believes that the research can be divided to three categories based on their goals: basic research, applied research and developmental research (Hafez Nia, 1382). Considering that the findings of this study are truly applicable in industry, therefore this research is considered applied regarding its goals, and it is field regarding the data and information gathering. In addition, the library approach has also been used in data collection. The population of this research is the beverage production company of KhoshNushanNikAndishanSepidan with brand of Topo. In addition, as in the mathematical model, given the assumption that focuses on non-probabilistic data, except the managers poll to determine the priority of the objectives by interviewing them, the sampling has not been done for problem modeling. In this research the lexicography multi-objective linear planning solution has been used. The lexicography method In this approach, different objectives are ranked by decision makers, according to their importance level and optimizing the most important objective begins and the process continues according to importance degree till all the problem is solved. First the problem is solved using the most important objective factor, and then we add this objective factor with its obtained amount as a constraint to the problem and substitute the next important objective factor with the previous objective factor. In this approach all objective optimize according to their importance degree and maintain in their optimum amount till we reach a unique solution. For example, if the importance of objectives is according to order of their numbers, which is f1 is the most important and fk will be the least important one, and the problem is solved as follows: Equation 1: Max f1 (x) st :gi(x) ≤ 0 , i= 1,2,…,m If the optimum of this problem is (f*1 , x*1) uniquely, then the problem has reached to its final solution and this solution is considered to be the best one. But if not, the second problem must be solved as follows: Equation 2: Max f2 (x) st :gi(x) ≤ 0 , i= 1,2,…,m f1 (x) = f*1
This process continues in this order till we reach a unique solution of the problem to finish the problem solving (Asgharpour, 1392). The linear planning model of the research As it was mentioned the objective of this research is to propose a multi-objective mathematical model in material requirement planning, therefore, a multi-objective linear planning model is proposed which is explained here: The proposed mathematical model includes two objective factors, which one of them tries to minimize the production expenses and the other attempts to maximize the production amount of the commodity. We also have three sets of constraints in the model, the first limitation is the capacity of raw materials, the second limitation is the
Yaghoob Barati et al.

Indian Journal Of Natural Sciences www.tnsroindia.org. © IJONS
Vol.5 / Issue 28/ February 2015 International Bimonthly ISSN: 0976 – 0997
2720
amount of foreign demand of the product, and the third limitation is the amount of produced commodity which must be bigger than zero. Therefore, this model is designed as follows: The definition of variable model: the mathematical model of the research T= the number of periods in planning horizon (3 periods) N= number of produced commodity (3 products)
Cit=the total expense of commodity I production in period t Xit= the amount of commodity I in period t Aij= the unit number of the raw material I to produce one unit of product j Bkt= the total capacity of raw material I in period t Uit= the total used material to produce I in period t i=1,…,n t= 1,…,T Dit= the demand of product I in period t Data collection and parameters calculations: As it was mentioned, the data of this study was gathered from the beverage company of Aloe veraTopo and the necessary information to design the model was extracted from this data. As it is obvious in the mathematical model, two items are being discussed; one is the number of items or products shown as I and the second is the number of periods in planning horizon which is shown with index of t. I or number of items is 3 and the number of periods is also 3 periods of each 10 days in a monthly planning horizon. There is foreign demand for the products and the orders are received from market. Information has been taken from the gathered data to be used in the model, which are stated in table 3 below. Considering the data in table 3, the data are added to the model and with entry of this information to the model, the final model includes 24 limitations of the first kind, 9 limitations from the second type and 9 limitations from the third type as well. In addition, to obtain the demand of each period, the following equation has been used. According to the equation, in each period the first stock amount of the period beginning is added to amount of product during the period, and at last the amount of stock which must be maintained at the end of the period is subtracted from it. I t-1= the previous period stock It= the stock at the end of the period It-1 + Xit – It = dit According to the collected data from the related company, the amount of stock which is kept in each period is 10 percent of total production of that period. Therefore, the objectives function of the final mathematical model of the problem is as follows: Z= Min 825X11+690X12+705X13+1200X21+970X22+990X23+2975X31+2270X32 +2315X33 Z=Max X11+ X12+X13+X21+X22+X23+X31+X32+X33 Also the limitations of the model are as follows:
water supply capacity constraints in first period
230X11+380X21+1140X31≤8000000
Water supply capacity constraints in second period
230X12+380X22+1140X32≤8000000
Yaghoob Barati et al.

Indian Journal Of Natural Sciences www.tnsroindia.org. © IJONS
Vol.5 / Issue 28/ February 2015 International Bimonthly ISSN: 0976 – 0997
2721
Water supply capacity constraints in third period 230X13+380X23+1140X33≤8000000 Aloevera supply capacity constraints in first period
30X11+50X21+150X31≤1000000
Aloevera supply capacity constraints in second period
30X12+50X22+150X32≤950000
Aloevera supply capacity constraint in third period
30X13+50X23+150X33≤950000
The 18 remaining constraints about the raw material capacity is also written as above for each material in each period.
The first product demand constraint in first period 330X11 ≥ 3915000 The first product demand constraint in second period
330X12 ≥ 3630000
The first product demand constraint in third period
330X12 ≥ 4154000
The 6 demand constraints related to two other products in each period as written as above as well. The constraints relating to positivity of Xs
X11,X12, … , X33 ≥ 0
The analysis of model solution The lexicography model has been used to analyze the model and the solution. In this method, first the priority of the objective functions must be determined, which was determined in this study by considering the interviews and polls with managers of the TopoCompany. Minimizing the costs was the first priority for this company.Because of large number of variables and constraints, manual model solving will be complex and time-consuming. Therefore, after determining the priorities of the objectives, the final model was coded in MATLAB and MATLAB was used to solve the model and gain the necessary responses. First the model was solved with the function in first priority and Xs were estimated, then this objective function was put equal to the obtained optimized amount for it, and added to the problem as a constraint, and model was solved with second objective function and the optimized amounts were obtained. After the model was solved using the MATLAB, the X values and also the optimum values for each objective functions were obtained. The obtained values in solving the model with first objective function are displayed in table 4. In second stage, as the first objective with its optimum value is imposed on the problem as a constraint, therefore, in solving the problem with second objective function, the Xi values will be correct. Thus, the Xis values will be the same and the optimum value will be as follows: Z2 = 56611 In solving the linear planning mathematical models with use of MATLAB, the output will give us information about problem solving. In solving this problem, the MATLAB output shows that the software has used algorithm of “large-scale: interior point” to solve the problem as well and has arrived to optimum answer with 8 repetitions of the problem.
RESULTS According to optimum values of objective functions and X values and all that was mentioned, the material requirement planning is possible in each period according to these values. After solving the model, it was obvious that the minimum amount for company production costs in planning horizon is about 54 million toman and the optimum value for production in each period is also obtained. According to this amount of production in each period
Yaghoob Barati et al.

Indian Journal Of Natural Sciences www.tnsroindia.org. © IJONS
Vol.5 / Issue 28/ February 2015 International Bimonthly ISSN: 0976 – 0997
2722
and considering the amount of raw material used in production, we can determine the necessary planning about the required material and production requirements in each period, so that not only the costs are minimized, but also the production value are coordinated to market demands.Xi values show that how much production the company should have in each period to be able to plan the material. Table 5, according to Xit optimum values of the model, will show the required material for production in each period.Moreover, to show the total amount of the material required in each period, we offer Figure 1 which graphically shows that in each period how much raw material is needed for the production of the product in the company. In this diagram it is shown that how much aloe Vera or sugar is needed in each period in order to respond the amount of theoptimized productionobtained from the mathematical model and to be able to cover the market demand. It also causes the company not to face a shortage of raw materials during the production.
CONCLUSION As stated in the previous section, the aim of this study is to provide a multi-objective mathematical model inplanning the material requirements. Therefore the model was provided and using the data collected from a production company the model was tested and was solved using MATLAB software andbased on lexicography and the optimal values of each of the two objective functionsand Xis were defined. Therefore, as an overall result it can be said that the use of mathematical modeling and linear programming in planning material requirements provides the decision making managers with an accurate and rational perspective for planning for the materials needed to enable them to act based on the output and the results of the mathematical models with a low risk coefficientin comparison tothe production in the planning horizon that has already been specified. According to the results, it is suggested for the companies to act in order to better strengthen and further improve the quantitative and mathematical models in their production for planning the materials they need. They should also consider the programs to identify employees with the needs planning system of the organization.Finally, as shown in Table 4 and 5, and in Figure 1, the value of each X and the optimized values of the objective function are determined that based on the values of Xs we can decide on planning the material needs it is also evident the output of the model that the maximum amount of production is related to the product produced in the third period and the lowest amount of production is related to thethird product in the third period. Regarding the research questions, each of the questions was answered in the article where regarding the questions, the variables of the problemwere defined and a proper solution was presented to solve the model. To achieve more accurate results, it is suggested the future research to bring the cost of lost opportunity and the shortage individually in the target function as well as restrictions such as the maximum time allowed for delivery of the product to investigate their effects on the results.
REFERENCES 1) Ehsani, A., Naseri, S., &Sajjadi, S. (1388). Material Requirements Planning (MRP) (Case Study: Reza Lighting
Company). The Second International Conference on Research in Operations in Iran. 2) Asgharpour, M. (1392). Multi-criteria decision making. Tehran: Tehran University Publications. 3) Hafezniya, M. (1382).Introduction to research methods in humanities (Vol. VIII edition). Tehran: SAMT
Publications. 4) Rabbani, A. (1390). Using a fuzzy approach in determining the size of the multi-level accumulation in MRP-
based system.Industrial Management Quarterly, Azad University of Sanandaj. 5) Sarmad, Z., Bazargan, A., &Hijazi, A. (1392).Research Methods in the Behavioral Sciences. Tehran: Agah.
Yaghoob Barati et al.

Indian Journal Of Natural Sciences www.tnsroindia.org. © IJONS
Vol.5 / Issue 28/ February 2015 International Bimonthly ISSN: 0976 – 0997
2723
6) Shaykhan, A., &Mehrasa, Sh. (1391).A comprehensive overview of the management(the first volume). Tehran: NegaheDanesh.
7) SadeghiMoghadam, M., Moemeni, M., &Nalchigar, S. (1388).Planning integrated provision, production, distribution and supply chain using genetic algorithm. Journal of Industrial Management, 71-88.
8) Ghazanfari, M., &RezaeiSadrabadi, M. (1387).Developing MRP model with demand and fuzzy supply.Conference on Industrial Engineering.
9) Makuyi, A. (1390).Anintroduction to Production Planning (First Edition, Volume III). Tehran: DaneshPazhooh. 10) Momeni, M. (1392).New issues of Research in Operations. Tehran: Author. 11) Mehrgan, M. (1386).Operations research, linear programming and its applications (third edition). Tehran:
academic publications.
Figure 1. A sample of a supply chain Table 1.A brief research background relating to this research topic
Reference Topic Year Author Number
(Ozceylan, Paksoy, & Bektas, 2014
Modeling and optimizing the required material networks in supply chain with closed ring and assembly line balance
2014 Ozceylan18, Paksoy19 Bektas20 1
(Ganstrer, Almeder, & Hartl, 2013)
The optimizing procedure based on simulation for material and production planning
2013 Ganstrer21, Almeder22, Hartl23 2
(Chirinda, 2012)
The improvement of material requirement planning improvement of small and medium companies in Zimbabwe
2012 Chirinda24 3
(Dorfer & Minner, 2011)
The simultaneous optimizing of the planned capacity and delay time in material planning of two stage production system
2011 Dorfer25, Minner26 4
(Ehrenberg & Zimmermann, 2012)
Stimulation based on optimizing in material production planning for order in glass company
2012 Ehrenberg27, Zimmermann28 5
Yaghoob Barati et al.

Indian Journal Of Natural Sciences www.tnsroindia.org. © IJONS
Vol.5 / Issue 28/ February 2015 International Bimonthly ISSN: 0976 – 0997
2724
(Sitompul & Aghezzaf, 2011)
The material planning model in hierarchal and integrated production and maintenance
2011 Sitompul29, Aghezzaf30 6
(Grubbstrom & Bogataj, 2010)
The amount of optimum storage in material requirement planning theory
2010 Grubbstorm31, Bogataj32 7
(Timm & Blecken, 2010)
A model to hierarchal structure, size and required material planning in construction systems
2010 Timm33, Blecken34 8
(Louly & Dolgui, 2011)
The optimum gradual and continuous time in material requirement planning with economic production policies
2011 Louly35, Dolgui36 9
(Masnita & Amanda Mahdani, 2012)
The application factors in material requirement planning in small and medium sized companies
2012 Manista37, Amanda38, Mahdani21
10
(Mula, Poler, & Garcia, 2009)
The material requirement planning model with flexible limitations: with a fuzzy mathematical planning approach
2009 Mula ,Poler, Garcia 11
(Stapic, Orehovacki, & Lovrencic, 2009)
Examination of material requirement planning algorithm and the improved parts list
2009 Stapic39, Orehovacki40, Lovrencic41
12
(Gonzalez & zhu, 2009)
Integration of simulation and optimizing methods in material and production planning in reconstruction
2009 Gonzalez42, Zhu43 13
(Omar & Bennell, 2009)
The main revised production schedule under high pressure processes
2009 Omer44, Bennel45 14
(Gutierrez, Diaz, & Gupta, 2008)
The stored amount in reverse material requirement planning for parts planning
2008 Gutierrez46, Diaz47, Gupta48 15
Table 2. The parameters of the model for three products of the company are shown:
The amount of parameters Model parameters Three periods T (periods) Three products N (number of items) Eight raw material id used in production K (raw material)
Yaghoob Barati et al.
Indian Journal Of Natural Sciences www.tnsroindia.org. © IJONS
Vol.5 / Issue 28/ February 2015 International Bimonthly ISSN: 0976 – 0997
2725
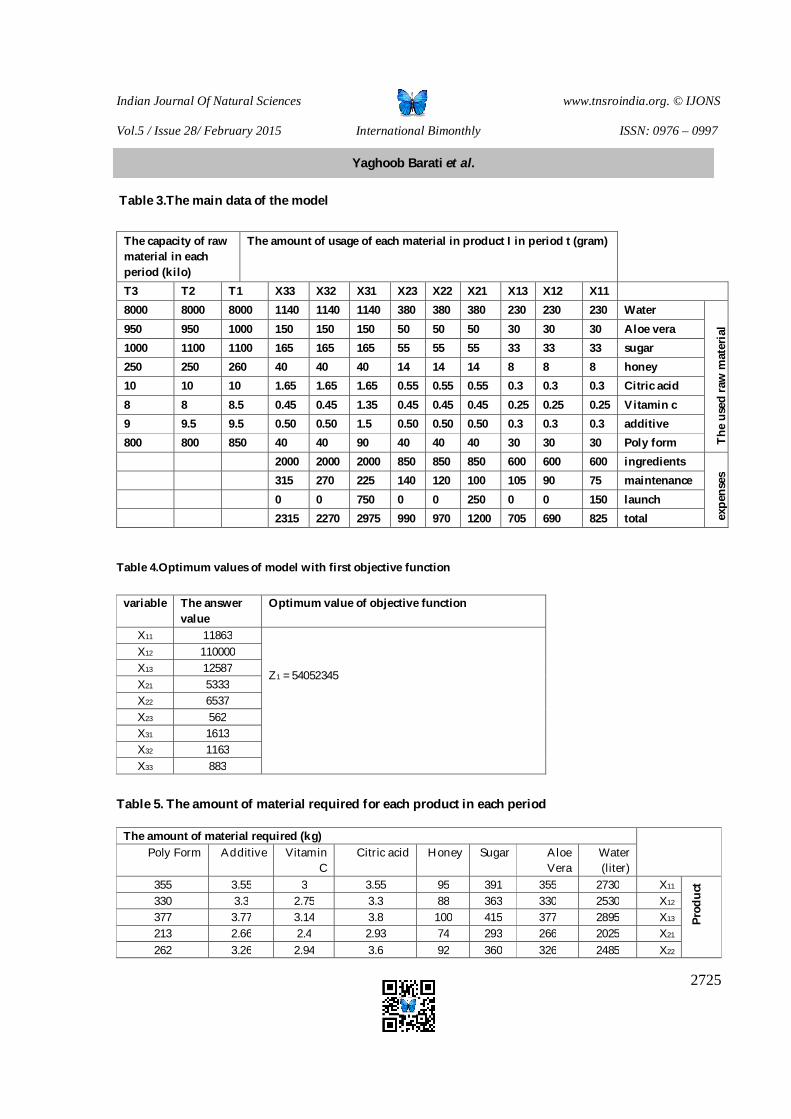
Table 3.The main data of the model
Table 4.Optimum values of model with first objective function
Table 5. The amount of material required for each product in each period
The amount of material required (kg) Water (liter)
Aloe Vera
Sugar Honey Citric acid Vitamin C
Additive Poly Form
Prod
uct
X11 2730 355 391 95 3.55 3 3.55 355 X12 2530 330 363 88 3.3 2.75 3.3 330 X13 2895 377 415 100 3.8 3.14 3.77 377 X21 2025 266 293 74 2.93 2.4 2.66 213 X22 2485 326 360 92 3.6 2.94 3.26 262
The amount of usage of each material in product I in period t (gram) The capacity of raw material in each period (kilo)
X11 X12 X13 X21 X22 X23 X31 X32 X33 T1 T2 T3
The
used
raw
mat
eria
l
Water 230 230 230 380 380 380 1140 1140 1140 8000 8000 8000 Aloe vera 30 30 30 50 50 50 150 150 150 1000 950 950 sugar 33 33 33 55 55 55 165 165 165 1100 1100 1000 honey 8 8 8 14 14 14 40 40 40 260 250 250 Citric acid 0.3 0.3 0.3 0.55 0.55 0.55 1.65 1.65 1.65 10 10 10 Vitamin c 0.25 0.25 0.25 0.45 0.45 0.45 1.35 0.45 0.45 8.5 8 8 additive 0.3 0.3 0.3 0.50 0.50 0.50 1.5 0.50 0.50 9.5 9.5 9 Poly form 30 30 30 40 40 40 90 40 40 850 800 800
expe
nses
ingredients 600 600 600 850 850 850 2000 2000 2000
maintenance 75 90 105 100 120 140 225 270 315
launch 150 0 0 250 0 0 750 0 0
total 825 690 705 1200 970 990 2975 2270 2315
Optimum value of objective function The answer value
variable
Z1 = 54052345
11863 X11
110000 X12 12587 X13 5333 X21 6537 X22 562 X23
1613 X31 1163 X32 883 X33
Yaghoob Barati et al.

Indian Journal Of Natural Sciences www.tnsroindia.org. © IJONS
Vol.5 / Issue 28/ February 2015 International Bimonthly ISSN: 0976 – 0997
2726
X23 2140 281 313 79 3.13 2.53 2.81 225 X31 1838 241 266 65 2.66 2.17 2.41 145 X32 1325 174 192 47 1.92 1.57 1.74 105 X33 1005 132 145 35 1.45 1.2 1.32 79
0
1000
2000
3000
4000
5000
6000
7000
waterAloe Vera
sugarhoneycitric acid
vitamin cadditivesPoly form
1st period 2nd period 3rd period
Chart 1. The amount of material required in each period
Yaghoob Barati et al.

Indian Journal Of Natural Sciences www.tnsroindia.org. © IJONS
Vol.5 / Issue 28/ February 2015 International Bimonthly ISSN: 0976 – 0997
2727
Evaluation of Passive Defense Considerations in Land use in Urban Master Plans (Case Study: Revision of Bushehr Master Plan)
Ali Bastin Faculty of Geography, Department of Geography, University of Tehran, Tehran, Iran.
Received:10 Dec 2015 Revised: 25 Dec 2014 Accepted: 27 Jan 2015 *Address for correspondence Ali Bastin Faculty of geography, Department of Geography, University of Tehran, Tehran, Iran.
This is an Open Access Journal / article distributed under the terms of the Creative Commons Attribution License (CC BY-NC-ND 3.0) which permits unrestricted use, distribution, and reproduction in any medium, provided the original work is properly cited. All rights reserved.
Passive defense is an urban community is to reduce vulnerability and increase security and flexibility in different situations and timely responses in order to save the lives of people living in cities and places. Vulnerability at crisis times can be minimized by considering passive defense principles in urban master plans. Current paper evaluates Bushehr master plan in terms of addressing passive defenseconsiderations in urban land uses. Bushehr is one of Iranian cities which is crucial for the country in terms of security. Bordering the Persian Gulf, adjacency to the nuclear power plant and establishment of air and naval bases are allfactors that make attention to this city from the standpoint of security and passive defense necessary. Land uses evaluated in the plan include common uses and military uses. Research method is evaluation during implementation and the research was conducted in two stages and five steps through interview with to 27 experts familiar to the research subject. To this end, one sample T-test was used for screening options and Fuzzy AHP and Fuzzy TOPSIS models were used for ranking uses proposed in the plan. Results indicate connection network has highest importance and port and customs has lowest importance I the plan. Overall, the plan addresses both types of uses identically. Finally, solutions such as formulation of Bushehr master plan, formulation of construction regulations and paying attention to location and use compatibility in the future urban master plans.
Key words: evaluation, passive defense, land use, master plan, Bushehr.
ABSTRACT
RESEARCH ARTICLE

Indian Journal Of Natural Sciences www.tnsroindia.org. © IJONS
Vol.5 / Issue 28/ February 2015 International Bimonthly ISSN: 0976 – 0997
2728
INTRODUCTION Urban master plans are type of urban development plans which are prepared in order to develop grounds for structural development of cities in a coordinated manner (Azizi and Arasteh, 2011). These plans are actually a collection of decisions made by urban authorities for more effective compatibility of city structure with changes which are not controllable (Andersson and Samartin, 1983). These plans have been prepared for over 4 decades for Iranian cities and they have been reviewed and examined in different views. One point which has been less considered is attention to passivedefense requirements.
Passive defense is a collection of measures which seek for limiting harms resulting from war, improving open space capabilities for protecting citizens’ life and minimizing physical damage caused by the accident of war. It is done without need for military equipment and firearms application and solely on the basis of designing structure and space characteristics in form and functions aspects (Lacina, 2006). According to definition by United States Department of Defense, passive defense is an urban community is to reduce vulnerability and increase security and flexibility in different situations and timely responses in order to save the lives of people living in cities and places(United States Department of Defense, 2006). In Iranian military and strategic texts, passivedefense is defined as “a collection of measures without violence which increase resistance to enemy attacks in residential areas, help sustained maintenance activities in towns and villages, and improve and facilitate the national resistance and crisis management against military threats and measures of enemy” (Iran's Fourth Development Plan, Clause 11 of the Administrative Procedures Act 121; Movahedi Nia, 2008; AsgharianJeddi, 1996; Ziari, 2001; Daeenejad and Hosseini, 2006).
Bushehr is one of southern cities in Iran which is highly important for the country in terms of security. In terms of strategic situation, large area of the city is covered bybarracks, missile sites and nuclear power plants belonged by military forces. Adjacency to the sea and protecting the city against its threats, presence of nuclear power and the air and naval bases are all factors which necessitate paying attention to this city in terms of security and passive defense.
Vulnerability at crisis times can be minimized by considering passive defense principles in urbanism plans such as master plans, and the best crisis management can be provided at the time of crisis. In fact, urban master plan specifies general policies of the city development for ten years. Thus, inclusion of passive defense considerations in urban master plans is regarded as applying passive defense considerations in general policies of a city which will influence detailed plans (Modiri & et.al, 2013). Also, land use is though part of a master plan; it is actually the core of the plan (Chapin, 1985). One of the best solutions for success of urban plans regarding passive defense is land use evaluation in these plans. According to experts, evaluation is a type ofretrospective analysis of a project, program or policy, to determine the nature and extent of their success and how to learn from their experiences (Cowan, 2005). In other words, evaluation can be defined as passing a return long path in an evolution process (Pendse, 1991). Evaluation can include evaluation during implementation or evlaauton after implementation. Of course, evaluation during implementation is more important and effective. Thus, the main purpose in the current research is evaluating extent of attention to passive defense considerations in land use in Bushehr master plan. The first master plan in Bushehr was prepared for outlook 2008 in 1983. In June 2011, second master plan of the city was developed entitled Revision of Bushehr Master Plan. Realization of proposals of the previous master plan is investigated in the second plan and new strategies are given for city development. Considering the revision plan emphasizes attention to passive defense requirements in development’s strategies, the main research questions is raised as follows: to what extent the revision plan addresses passive defense considerations in urban land use. To answer this question, proposed uses in this plan are measured and evaluated using multi-criteriadecision making methods. Evaluation during implementation is used in this research.
Ali Bastin

Indian Journal Of Natural Sciences www.tnsroindia.org. © IJONS
Vol.5 / Issue 28/ February 2015 International Bimonthly ISSN: 0976 – 0997
2729
Passive Defense Requirements in Iranian Urban Master Plans
In case application of passive defense requirements, such goals as reduced losses and damages, loss of capability of detection systems, increasing goal setting and accuracy of targeting enemy’s offensive weapons and incurring higher cost to the enemy. These principles in Iranian urban master plans include:
- Selecting safe areas in cities - Determining the optimal scale of establishment of population and activities in the space - Decentralization and fragmentation in the distribution of functions corresponding to the threats - Retrofitting strengths and safety critical structures - Locating suitable land uses - Paying attention to the principles of consistency and vicinity - Classification of important and critical uses - Optimal locating critical urban infrastructures (water, electricity, gas, etc.) - Optimal availability of communication (Movahedi Nia, 2008; Parizadi et al., 2010; Modiri et al., 2013)
Area under Study
Bushehr city with 195,222 populations in 2011 is the capital and largest city of the province with annual growth rate about 1.4 percent during 2006 – 2011 (Statistical Center of Iran, 2011). Legal area boundary of Bushehr is 8083.51 hectares, 75.33 percent of which is allocated to military lands and other lands such as salt marsh, shrubbery, watercourse, wasteland and other similar cases. In fact, current urban texture with 1993.6 hectares of area includes 24.67 percent of total city area in legal boundary. Presence of extensive areas of Air Force and Marine Corps in urban areas, discrete nature of urban texture due to military zones and being situated in boundary of nuclear power plant are characteristic of Bushehr’s urban structure (City and Plan Consultants, 2011).
SecurityProblems and Issues of City in Current Status
- Concentration of urban infrastructures and equipment in certain parts of the city that increase vulnerability - Lack of proper distribution of the vital centers of the city especially harbor and docks, and concentration on the
Northeast Cape - Establishment of nuclear power plant in the southern part of the city and risks associated with its rays - Lack of capacity in exit routes of the city in order to use in the emergency - Lack of safe spaces in existing buildings and dwellings to shelter - Lack of safety in the design of buildings, such as the prediction of safe spaces and shelter - Adjacency of military barracks with the critical centers and residential centers (City and Plan Consultants, 2011).
METHODOLOGY
It is an applied research of evaluation type. The method used for evaluation includes interview with experts familiar to the research subject and the area under study in the form of Delphi technique. Purpose for using Delphi technique is ensuring identification of respective experts and providing opportunity for participation to research for them (Delbecq et al., 1975). Research statistical population includes experts familiar to evaluation of urban plans, passive defense as well as experts familiar to the area under study. Each of experts was involved somehow in the revision plan preparation process.Snowball sampling was used, which is a form of purposive sampling (Pourahmad and EskandariNodeh, 2009). The reason for choosing snowball sampling was that experts were not identified. Thus, following identification of the first expert, the author used his help for introducing other experts for interview (Babbie, 2011). Finally, the sample was completed in the form of three groups each with nine members. It should be
Ali Bastin

Indian Journal Of Natural Sciences www.tnsroindia.org. © IJONS
Vol.5 / Issue 28/ February 2015 International Bimonthly ISSN: 0976 – 0997
2730
noted that Delphi research is not dependent on the statistical sample which represents the population. Thus, the more is number of samples, more accurate results will be obtained from interview.
The research process is passed in five steps as shown in Fig 2. Firstly, criteria and sub-criteria of urban passive defense were collected and listed using different methods such as library studies, interview, documents of master plan and organizational reports. These criteria were considered as indexes for evaluation of master plan’s land uses and they were approved by the experts. In the second step, characteristics of all urban land uses situated in the legal boundaries of Bushehr city were listed. For entry to evaluation step, first a primary screening of the land uses was done by the experts, and those land uses which were neglected or underestimated in revision plan were excluded from the main list. One-sample t-test was used at confidence level 0.95 in this step. Remaining land uses were entered into the model in the next step as alternatives of multi-criteria evaluation. Following preparation of information layers, fuzzy pairwise comparison method was applied on the data. In this method, firstly weight of criteria is specified using ideas of Delphi group, and it is entered into MATLAB software. Then, fuzzy pairwise comparison is applied on input weights and weight of five criteria is extracted from the software. Using these criteria, experts weigh and evaluate alternatives. Finally, output is provided as ranking of land uses. Fuzzy AHP and Fuzzy TOPSIS models were used for data analysis, which will be described in the following.
Fuzzy Analytic Hierarchy Process
Analytic Hierarchy Process was proposed by Saaty in 1970s. AHP enables decision makers to determine interaction and simultaneous effect of many complex and uncertain situations and set priorities based on their goals, knowledge, and experience so that their feelings and judgments are totally consideredSaaty, 1996; Lee et al, 2011Chang (1992) proposed integration of AHP and fuzzy combination to develop fuzzy AHP (Chang, 1992). Fuzzy AHP is a relatively new methodology developed by Laarhoven and Pedrycz (1983). He generalized AHP for situation leading to fuzzy and ambiguous environments (Huang et al., 2008). Using fuzzy sets has more compatibility to lingual and somehow ambiguous human explanations and thus it is better to address long term prediction and decision asking in real world using fuzzy sets (using fuzzy numbers). For example, Table 1 gives a sample of fuzzy triangular numbers and their membership functions (Buyukozkan and Cifci, 2012; Anagnostopoulos and Petalas, 2011).
Interested readers are referred to following references for more information on mathematical operators and working with fuzzy AHP in the view of Chang: Javanbarg et al., 2012; Rajput et al., 2011.
Fuzzy TOPSIS Technique
In this method, weight of criteria is obtained using pairwise comparisons (AHP method) and final ranking of alternatives using TOPSIS method and fuzzy logic in expert judgments. Following determination of criteria and formation of decision hierarchy, firstly weight of each criterion is obtained using pairwise comparisons. Interval matrices to positive and negative idea are formed with formation of decision matrix with fuzzy numerical components and calculation of interval to positive and negative ideal of each class. For each criterion, information layers of interval to positive and negative ideal is developed and final layer is obtained by integrating layers and multiplication by limitation layer (Chamodrakas and Martakos, 2012; Chu, 2002). Table 2 gives fuzzy triangular numbers defined for fuzzy TOPSIS and their membership functions.
If W=(w1, …, wm) is vector of criteria weight with ∑ wj=1, which is obtained from pairwisecomparisons, and T (Relation 1) is decision matrix for ranking, then ãij is fuzzy triangular number which shows preference of class ith of jth criterion toward other classes based on expert ideas.
Ali Bastin
Ali Bastin

Indian Journal Of Natural Sciences www.tnsroindia.org. © IJONS
Vol.5 / Issue 28/ February 2015 International Bimonthly ISSN: 0976 – 0997
2731
(1)
by multiplying wj by each of components of jth column of matrix T based on Relation 1, matrix V is formed with
following components: . Since used fuzzy numbers have the same scale, there is no need for normalization of matrix components (Bao et al, 2012; Sun, 2010).
Relations 2 and 3 show vector of positive and negative idea alternatives for matrix V.
(2)
(3)
By subtracting components of matrix V from (Relation 4) and dividing components of each fuzzy number by 3 (for de-fuzzy) (Relation 5), matrix of interval to positive ideal ((D+=(d+ij))(Relation 6) is obtained. In these relations, d+ijis interval of ith class of jthcriterion and it is an absolute number.
(4)
(5)
(6)
Matrix of interval to negative ideal (D-) (Relation 9) is obtained through Relations 7 and 8, where d-ijis interval of ith class of jth criterion to jth negative ideal.
(7)
(8)
Ali Bastin

Indian Journal Of Natural Sciences www.tnsroindia.org. © IJONS
Vol.5 / Issue 28/ February 2015 International Bimonthly ISSN: 0976 – 0997
2732
(9)
Relative closeness to the ideal solution (RCi) for each alternative is obtained using Relation 10 and final ranking of alternatives is done accordingly. M denotes the number of criteria in this relation.
(10)
Research Findings and Plan Land Use Evaluation
Revision plan specifies three general policies regarding city security promotion, including:
- Protecting security of facilities, equipment and services of the city against military threats - Protecting health of Bushehr citizens against the negative effect of the Bushehr nuclear power plant - Securing citizens against military, natural and social threats.
In addition, various action plans have been proposed for Bushehr, and only one plan entitled Promoting City Security via Imposing Passive Defense Regulations is related to passive defense. Other plans indirectly address defense issue or they are totally irrelevant.
Results of preliminary expert evaluation are given in Table 3. Mean of 27 answers given by the experts was calculated in SPSS software and it was considered as the total mean for each land use. As observed, revision plan has no defense strategy in such uses as cultural, social, sport, and educational and tourist uses. Comparison of T scores indicates sensitive and critical centers with score 4.738 have highest importance and garden and agricultural uses with score -9.256 have lowest importance in the revision plan. Following preliminaryevaluation, final screened uses were coded as Table 4.
- The plan has no approach or pays trivial attention to this use
Criteria Obtained from Interview
Data processing, analysis and integration was done considering five criteria including easy access during the crisis, suitable distribution and dispersion, stability and proximity, safety and retrofitting and appropriate locating. The main approach of experts for classification and ranking these criteria is human approach to defense and protection of residents’ life in crisis. Thus, easy access during the crisis criterion (C1) is the highest factor and appropriate locating (C5) is the lowest criterion for evaluation of land use with passive defense approach. Importance of other criteria is shown in Table 5. Compatibility coefficient = 0.092
Ali Bastin

Indian Journal Of Natural Sciences www.tnsroindia.org. © IJONS
Vol.5 / Issue 28/ February 2015 International Bimonthly ISSN: 0976 – 0997
2733
Following calculation of criteria weight, alternatives are ranked. Based on Table 7, mean of Delphi group ideas is considered for ranking alternatives.
In the next stage, decision tables obtained from mean of Delphi group ideas are normalized. Result of decision matrix normalization is fuzzy triangular matrix with triangular numbers, which is standardized as matrix 11 × 5 (Aij) through Relation and matrix R is formed. Table 8 indicates this matrix.
Following normalization of decision matrix, fuzzy positive ideal and fuzzy negative ideal is obtained. In the next stage, matrix V is formed and criteria are weighted through which.
Also, using ideal index and min from matrix V, there is:
positive ideal alternative = A+={(max Vij| jέJ), (min Vij|jέJ’)|i=1,2,…,m} = {V1*,V2*,…,Vj*,…Vn*}
Also, negative ideal alternative is given in the table 11.
Using following relation, interval criterion for ideal alternative Si* and min alternative Si- can be made.
Si* = interval of ith alternative from positive ideal; I= 1,2,…m
Following calculation of interval criterion toward positive and negative ideal, relative closeness of Si to ideal solution is calculated in this stage. Relative closeness is defined as follows:
؛ ≤0 CLi * ≤ 1 ؛ I= 1,2,…m
In the last stage of Fuzzy TOPSIS technique, alternatives are ranked in descending manner (RCi*)
DISCUSSION AND CONCLUSION
Current work aimed at evaluating proposed land uses in revision plan of Bushehr urban master plan in terms of observing passive defense considerations. Evaluation and ranking was done using Fuzzy AHP and Fuzzy TOPSIS methods. Preliminary studies indicate passive defense requirements have been included in revision plan. However, it is considered at macro level and ideas of experts should be obtained at micro level such as urban land uses. In this regards, ideas of experts who took part in preparation of the plans and are more familiar to the research subject should be taken.
Overall, land uses studied in this research can be classified into common uses (with human nature and daily used by public) and important and sensitive uses (with military and defense nature). First class includes communication network and transport equipment, law enforcement agencies, green open spaces, medical and health, business and service, and urban equipment land uses. The second class includes strategic and critical areas, workshops, industries, warehouses, and docks and harbors and customs land uses. Results obtained from ranking land uses indicate urban communication network and transport equipment has highest importance, and urban facilities such as utilities are in the next place. It can be considered as a positive point for this plan. Green open space use which is one of the main land uses in passive defenseapproach is in the fifth rank in the view of experts in this plan. However, health and medical, residential, business and service and urban equipment uses are other important land uses with human nature which did not have optimal place in this plan and they are almost in the last ranks. In addition, considering
Ali Bastin

Indian Journal Of Natural Sciences www.tnsroindia.org. © IJONS
Vol.5 / Issue 28/ February 2015 International Bimonthly ISSN: 0976 – 0997
2734
results of first stage of evaluation, important land uses such as educational, sociocultural, sport and tourist – recreational uses were not considerable and did not gainappropriate scores.
Out of second class’s land uses, highest score is related to land use for strategic and critical areas with rank 3 and lowest score is for land use for docks and harbors and customs with rank 11. Overall, according to final ranking table, it can be stated both classes of land uses have been similarly taken into account in the plan, and revision plan has relatively suitable status. However, considering the fact that the main component of passive defense and the most important purpose of implementing its regulations is saving human life and reducing enemy losses, it is necessary that urban master plans take more defense considerations into account regarding land uses. Therefore, following recommendations are made for the area under study:
- Developing passive defense master plan for Bushehr as well as other cities with security and strategic importance as the main strategic measure,
- Formulating technical regulations and passive defense consideration in urbanism, construction and urban infrastructure area for country’s cities in the form of administrative bylaws,
- Paying more attention to locating and compatibility of land uses in future urban master plans.
It should be noted that other evaluation methods such as goal – action evaluation, land use compatibility evaluation, and planning balance evaluation for other cities can be used for evaluating land uses in terms of passive defense.
REFERENCES
1. Parizadi, T., Hosseini Amini, H.& Shahriari, M. (2010). Analysis of passive defense measures in Saqhez using analytical approach,Urban Management, No. 26, pp. 191 - 202.
2. Daeenejad, F. & Aminzadeh, H. (2006). Principles and guidelines for designing and equipping open space inresidential complexes for passive defense, Tehran, Building and Housing Research Center.
3. Azizi, M.M. & Arasteh, M. (2011). Assessment of land use projections and recommendations for development in Lar master plan,Urban and Regional Studies and Research, Third Year, No. 11, pp. 1 - 22.
4. City and Plan Consultants(2011). Revision in Bushehr master plan, Department of Roads and Urbanism, Bushehr.
5. Anagnostopoulosa, K.P & Petalasb, C (2011). A fuzzy multicriteria benefit–cost approach for irrigation projects evaluation. Agricultural Water Management, 98 (9), pp 1409– 1416.
6. Andersson, R & Samartin, A (1983). A model for the economicevaluation of master city plans: a pilot study of Vtisteras, Sweden. Applied Mathematical Modelling, 7 (5), pp 345–355.
7. AsgharianJeddi, A (1996), Passive Defense in Bam citadel. Proceedings of the Congress of Architecture and Urban Planning of Iran, Bam, Kerman.
8. Babbie, E.R (2011). The Basics of Social Research, Cengage Learning, Belmont. 9. Bao, Q; Ruan, D; Shen, Y; Hermans, E &Janssens, D (2012). Improved hierarchical fuzzy TOPSIS for road safety
performance evaluation. Knowledge-based systems, 32, pp 84-90. 10. Buyukozkan, G & Cifci, G (2012). A combined fuzzy AHP and fuzzy TOPSIS based strategic analysis of
electronic service quality in healthcare industry. Expert Systems with Applications, 39 (3), pp 2341–2354. 11. Chamodrakas, I & Martakos, D (2012). A utility-based fuzzy TOPSIS method for energy efficient network
selection in heterogeneous wireless networks. Applied Soft Computing, 12 (7), pp 1929-1938. 12. Chang, D.Y (1996). Applications of the extent analysis method on fuzzy AHP. European Journal of Operational
Research, 95 (3), pp 649–655. 13. Chapin, F (1985). Urban land use planning. USA, Illinois Press. 14. Chu, T.C (2002). Facility location selection using fuzzy TOPSIS under group decisions. International journal of
uncertainty. fuzziness and knowledge-based systems, 10 (06), pp 687-701.
Ali Bastin

Indian Journal Of Natural Sciences www.tnsroindia.org. © IJONS
Vol.5 / Issue 28/ February 2015 International Bimonthly ISSN: 0976 – 0997
2735
15. Cowan, R (2005). The Dictionary of Urbanism. Streetwise Press, and Wiltshire. 16. Huang, C.C; Chu, P.Y; Chiang, Y.H (2008). A fuzzy AHP application in government sponsored Rand project
selection. Omega, 36 (6), pp 1038–1052. 17. Iran's Fourth Development Plan (2004). Passive Defence, In Persian, Available at:
vcmdrp.tums.ac.ir/files/budget/pages/...tose/ghanoon_barnameh_4.doc 18. Javanbarg, M.B; Scawthorn, C; Kiyono, J & Shahbodaghkhan, B (2012). Fuzzy AHP-based multicriteria decision
making systems using particle swarm optimization. Expert Systems with Applications, 39 (1), pp 960–966. 19. Lacina, B (2006): Explaining the Severity of Civil Wars, Journal of Conflict Resolution,. 50 (2), pp 276-289. 20. Lee, S.K; Mogi, G; Hui, K.S; Kim, J.W (2011). Econometric analysis of the Rand performance in the national
hydrogen energy technology development for measuring relative efficiency: The fuzzy AHP/DEA integrated model approach. international journal of hydrogen energy, 3 (5), pp 2236 – 2246.
21. Modiri, M & et.al (2013). Passive defense considerations in urban master plan with an emphasis on urban land uses. Journal of Science, Research and Technology in Passive Defense (JSRTPD), Quarterly, 1 (2), pp 87-99.
22. Movahedi Nia, J (2008), Fundamentals in Passive Defense. MalekAshtar University Press, Tehran, Iran. 23. Pendse ,S.H (1991). Perspective on an Economic Future. Green wood press published.G.B. 24. Pourahmad, A & EskandariNodeh, M. (2009). Qualitative research methods in human geography. The
Organization for Researching and Composing University Textbooks in the Humanities (SAMT). 25. Rajput, H.C; Milani, A.S & Labun, A (2011). Including time dependency and ANOVA in decision-making using
the revised fuzzy AHP: A case study on wafer fabrication process selection. Applied Soft Computing, 11 (8), pp 5099–5109.
26. Saaty, T.L (1996). The analytic network process: Decision making with dependence and feedback. Pittsburgh: RWS Publications.
27. Statistical Center of Iran, (2011). Results of public census of 2011. Available at: http://www.amar.org.ir/Default.aspx?tabid=1828
28. Sun, C.C (2010). A performance evaluation model by integrating fuzzy AHP and fuzzy TOPSIS methods. Expert Systems with Applications, 37 (12), pp 7745-7754.
29. United States Department of Defense (2006). Civil defense. Available at: http://www.defense.gov/ 30. Ziari , K (2001), Passive Defense and Urban Shelters Planning. Soffeh Journal, 11, Tehran, Iran.
Fig 1. Situation of Bushehr
Ali Bastin

Indian Journal Of Natural Sciences www.tnsroindia.org. © IJONS
Vol.5 / Issue 28/ February 2015 International Bimonthly ISSN: 0976 – 0997
2736
Fig 2. General research process
Table 1: A sample of fuzzy numbers defined in fuzzy AHP
Linguistic terms Triangular fuzzy numbers (TFNs)
Triangular fuzzy reciprocal scale
Just Equal (1,1,1) (1,1,1) Equal Importance (Eq) (1/2,3/4,1) (1,4/3,2) Extremely Low Importance (EL) (2/3,1,3/2) (2/3,1,3/2) Very Low Importance (VL) (1,3/2,2) (1/2,2/3,1) Low Importance (L) (3/2,2,5/2) (2/5,1/2,2/3) Moderate Importance (M) (2,5/2,3) (1/3,2/5,1/2) Strong Importance (S) (5/2,3,7/2) (2/7,1/3,2/5) Very Strong Importance (VS) (3,7/2,4) (1/4,2/7,1/3) Extremely Strong Importance (ES) (7/2,4,9/2) (2/9,1/4,2/7)
Table 2: A sample of fuzzy numbers defined in fuzzy TOPSIS method
U M L Linguistic Variables
Code
0.2 0 0 Very Low 1 0.4 0.2 0 Low 2 0.6 0.4 0.2 Medium 3 0.8 0.6 0.4 High 4 1 0.8 0.6 Very High 5 1 1 0.8 Excellent 6
Data collection
Develop evaluation
Alternative weighting
Initial evaluation of the Land Uses through
final evaluation and ranking of Land Uses
Ali Bastin

Indian Journal Of Natural Sciences www.tnsroindia.org. © IJONS
Vol.5 / Issue 28/ February 2015 International Bimonthly ISSN: 0976 – 0997
2737
Table 2: Preliminary expert evaluation for plan’s land uses
Land Use Mean T score Test value
Sig Defense approach of plan about this use
Residential 3.30 3.525 3 0.001 * Education & Higher Education 2.67 -2.065 3 0.048 - Strategic & critical areas 3.81 4.738 3 0.00 * Health 3.43 3.611 3 0.09 * Socio-cultural 2.47 -2.504 3 0.018 - Green open spaces 3.64 3.249 3 0.032 * Sports 2 -6.289 0.00 - Business, services 3.17 3.334 3 0.00 * Coastal tourism & recreation equipment
1.9 -7.940 3 0.00 -
Law enforcement agencies 3.79 4.382 3 0.00 * Urban equipment 3.5 3.746 3 0.001 * Docks & harbors and customs 3.47 3.5 3 0.002 * Utility 3.7 4.372 3 0.00 * Fisheries 2.53 -2.311 3 0.028 - Workshops, industries, warehouses
3.58 4.25 3 0.002 *
Lands under construction 2.03 -6.547 3 0.00 - Garden & Agriculture 1.63 -9.256 3 0.00 - Communication network & transport equipment
3.87 3.48 3 0.01 *
Table 5: Effective defense criteria in evaluation of Bushehr master plan in the view of experts
No. Criterion Sub-Criterion 1 easy access during the
crisis Access to infrastructure and facilities, access to means of communication, ease of access to input and output ports of city
2 suitable distribution & dispersion
Appropriate distance to crisis management service center, observing density zoning principles, observing dispersion principle, observing distribution spatial autocorrelation principle
3 stability & proximity Compatibility of each land use with neighboring land uses, observing zoning principles
4 safety & retrofitting Having lowest degree of vulnerability in the event of crisis, observing construction rules of Roads and Urbanism Ministry, observing height zoning principle
5 appropriate locating Distance to risky facilities, embedding hiding and fleeing spaces during the war, distance to natural disturbing factors such as wind.
Ali Bastin

Indian Journal Of Natural Sciences www.tnsroindia.org. © IJONS
Vol.5 / Issue 28/ February 2015 International Bimonthly ISSN: 0976 – 0997
2738
Table 6: Matrix of evaluation indexes’ weights
Code Criterion easy access during the crisis
suitable distribution & dispersion
stability & proximity
safety & retrofitting
appropriate locating
Weight
C1 easy access during the crisis
(1,1,1) (2/3,1,3/2) (1,3/2,2) (2,5/2,3) (2,5/2,3) 0.3685
C2 suitable distribution & dispersion
(3/2,2,5/2) (1,1,1) (2/3,1,3/2) (3/2,2,5/2) (3/2,2,5/2) 0.2983
C3 stability & proximity (1/2,2/3,1) (3/2,2,5/2) (1,1,1) (2/3,1,3/2) (1,3/2,2) 0.1966
C4 safety & retrofitting (1/3,2/5,1/2) (2/5,1/2,2/3) (3/2,2,5/2) (1,1,1) (1,3/2,2) 0.1248
C5 appropriate locating (1/3,2/5,1/2) (2/5,1/2,2/3) (1/2,2/3,1) (1/2,2/3,1) (1,1,1) 0.0118
Table 7: Items used as raw form in research and mean scores
T Criterion 1 Criterion 2 Criterion 3 Criterion 4 Criterion 5 P1 0.2 0.4 0.6 0.8 1 1 0.6 0.8 1 0.2 0.4 0.6 0 0.2 0.4 P2 0.6 0.8 1 0 0.2 0.4 0.8 1 1 0.2 0.4 0.6 0.4 0.6 0.6 P3 0 0 0.2 0.2 0.4 0.6 0.2 0.4 0.6 0.6 0.8 1 0.6 0.8 1 P4 0.4 0.6 0.6 0.8 1 1 0.6 0.8 1 0 0 0.2 0.2 0.4 0.6 P5 0.6 0.8 1 0.2 0.4 0.6 0 0.2 0.4 0.2 0.4 0.6 0.8 1 1 P6 0 0.2 0.4 0.4 0.6 0.6 0.6 0.8 1 0.4 0.6 0.6 0.6 0.8 1 P7 0.2 0.4 0.6 0.6 0.8 1 0.2 0.4 0.6 0.6 0.8 1 0.8 1 0.2 P8 0.4 0.6 0.6 0 0.2 0.4 0.4 0.6 0.6 0.2 0.4 0.6 0.2 0.4 0.6 P9 0.8 1 1 0.2 0.4 0.6 0.8 1 1 0 0.2 0.4 0.6 0.8 1
P10 0.2 0.4 0.6 0 0.2 0.4 0.8 1 1 0.2 0.4 0.6 0.8 1 1 P11 0.6 0.8 1 0.8 1 1 0.2 0.4 0.6 0.6 0.8 1 0.2 0.4 0.6
Table 8: Table of descaled items (Matrix R)
R Criterion 1 Criterion 2 Criterion 3 Criterion 4 Criterion 5 P1 0.2 0.4 0.6 0.8 1 1 0.6 0.8 1 0.2 0.4 0.6 0 0.2 0.4 P2 0.6 0.8 1 0 0.2 0.4 0.8 1 1 0.2 0.4 0.6 0.4 0.6 0.6 P3 0 0 0.2 0.2 0.4 0.6 0.2 0.4 0.6 0.6 0.8 1 0.6 0.8 1 P4 0.4 0.6 0.6 0.8 1 1 0.6 0.8 1 0 0 0.2 0.2 0.4 0.6 P5 0.6 0.8 1 0.2 0.4 0.6 0 0.2 0.4 0.2 0.4 0.6 0.8 1 1 P6 0 0.2 0.4 0.4 0.6 0.6 0.6 0.8 1 0.4 0.6 0.6 0.6 0.8 1 P7 0.2 0.4 0.6 0.6 0.8 1 0.2 0.4 0.6 0.6 0.8 1 0.8 1 0.2
Ali Bastin

Indian Journal Of Natural Sciences www.tnsroindia.org. © IJONS
Vol.5 / Issue 28/ February 2015 International Bimonthly ISSN: 0976 – 0997
2739
P8 0.4 0.6 0.6 0 0.2 0.4 0.4 0.6 0.6 0.2 0.4 0.6 0.2 0.4 0.6 P9 0.8 1 1 0.2 0.4 0.6 0.8 1 1 0 0.2 0.4 0.6 0.8 1
P10 0.2 0.4 0.6 0 0.2 0.4 0.8 1 1 0.2 0.4 0.6 0.8 1 1 P11 0.6 0.8 1 0.8 1 1 0.2 0.4 0.6 0.6 0.8 1 0.2 0.4 0.6
Table 9: Weighing items (Matrix V)
V Criterion 1 Criterion 2 Criterion 3 Criterion 4 Criterion 5 P1 0.0737 0.1474 0.2211 0.2386 0.2983 0.2983 0.118 0.1573 0.1966 0.025 0.0499 0.0749 0 0.0024 0.0047
P2 0.2211 0.2948 0.3685 0 0.0597 0.1193 0.1573 0.1966 0.1966 0.025 0.0499 0.0749 0.0047 0.0071 0.0071
P3 0 0 0.0737 0.0597 0.1193 0.179 0.0393 0.0786 0.118 0.0749 0.0998 0.1248 0.0071 0.0094 0.0118
P4 0.1474 0.2211 0.2211 0.2386 0.2983 0.2983 0.118 0.1573 0.1966 0 0 0.025 0.0024 0.0047 0.0071
P5 0.2211 0.2948 0.3685 0.0597 0.1193 0.179 0 0.0393 0.0786 0.025 0.0499 0.0749 0.0094 0.0118 0.0118
P6 0 0.0737 0.1474 0.1193 0.179 0.179 0.118 0.1573 0.1966 0.0499 0.0749 0.0749 0.0071 0.0094 0.0118
P7 0.0737 0.1474 0.2211 0.179 0.2386 0.2983 0.0393 0.0786 0.118 0.0749 0.0998 0.1248 0.0094 0.0118 0.0024
P8 0.1474 0.2211 0.2211 0 0.0597 0.1193 0.0786 0.118 0.118 0.025 0.0499 0.0749 0.0024 0.0047 0.0071
P9 0.2948 0.3685 0.3685 0.0597 0.1193 0.179 0.1573 0.1966 0.1966 0 0.025 0.0499 0.0071 0.0094 0.0118
P10 0.0737 0.1474 0.2211 0 0.0597 0.1193 0.1573 0.1966 0.1966 0.025 0.0499 0.0749 0.0094 0.0118 0.0118
P11 0.2211 0.2948 0.3685 0.2386 0.2983 0.2983 0.0393 0.0786 0.118 0.0749 0.0998 0.1248 0.0024 0.0047 0.0071
Table 10: Positive ideals of indexes (A+)
A+ Criterion 1 Criterion 2 Criterion 3 Criterion 4 Criterion 5 P1 0.858 0.7269 0.6067 0.5797 0.4924 0.4924 0.778 0.7102 0.6455 0.9507 0.9027 0.8558 1 0.9953 0.9906
P2 0.6067 0.4973 0.3988 1 0.8842 0.7756 0.7102 0.6455 0.6455 0.9507 0.9027 0.8558 0.9906 0.9859 0.9859
P3 1 1 0.858 0.8842 0.7756 0.6741 0.9229 0.8489 0.778 0.8558 0.8103 0.766 0.9859 0.9812 0.9765
P4 0.7269 0.6067 0.6067 0.5797 0.4924 0.4924 0.778 0.7102 0.6455 1 1 0.9507 0.9953 0.9906 0.9859
P5 0.6067 0.4973 0.3988 0.8842 0.7756 0.6741 1 0.9229 0.8489 0.9507 0.9027 0.8558 0.9812 0.9765 0.9765
P6 1 0.858 0.7269 0.7756 0.6741 0.6741 0.778 0.7102 0.6455 0.9027 0.8558 0.8558 0.9859 0.9812 0.9765
P7 0.858 0.7269 0.6067 0.6741 0.5797 0.4924 0.9229 0.8489 0.778 0.8558 0.8103 0.766 0.9812 0.9765 0.9953
P8 0.7269 0.6067 0.6067 1 0.8842 0.7756 0.8489 0.778 0.778 0.9507 0.9027 0.8558 0.9953 0.9906 0.9859
Ali Bastin

Indian Journal Of Natural Sciences www.tnsroindia.org. © IJONS
Vol.5 / Issue 28/ February 2015 International Bimonthly ISSN: 0976 – 0997
2740
P9 0.4973 0.3988 0.3988 0.8842 0.7756 0.6741 0.7102 0.6455 0.6455 1 0.9507 0.9027 0.9859 0.9812 0.9765
P10 0.858 0.7269 0.6067 1 0.8842 0.7756 0.7102 0.6455 0.6455 0.9507 0.9027 0.8558 0.9812 0.9765 0.9765
P11 0.6067 0.4973 0.3988 0.5797 0.4924 0.4924 0.9229 0.8489 0.778 0.8558 0.8103 0.766 0.9953 0.9906 0.9859
Table 11: Negative ideals of indexes (A-)
A- Criterion 1 Criterion 2 Criterion 3 Criterion 4 Criterion 5 P1 0.0054 0.0217 0.0489 0.0569 0.089 0.089 0.0139 0.0247 0.0387 0.0006 0.0025 0.0056 0 0 0 P2 0.0489 0.0869 0.1358 0 0.0036 0.0142 0.0247 0.0387 0.0387 0.0006 0.0025 0.0056 0 0.0001 0.0001 P3 0 0 0.0054 0.0036 0.0142 0.032 0.0015 0.0062 0.0139 0.0056 0.01 0.0156 0.0001 0.0001 0.0001
P4 0.0217 0.0489 0.0489 0.0569 0.089 0.089 0.0139 0.0247 0.0387 0 0 0.0006 0 0 0.0001
P5 0.0489 0.0869 0.1358 0.0036 0.0142 0.032 0 0.0015 0.0062 0.0006 0.0025 0.0056 0.0001 0.0001 0.0001
P6 0 0.0054 0.0217 0.0142 0.032 0.032 0.0139 0.0247 0.0387 0.0025 0.0056 0.0056 0.0001 0.0001 0.0001
P7 0.0054 0.0217 0.0489 0.032 0.0569 0.089 0.0015 0.0062 0.0139 0.0056 0.01 0.0156 0.0001 0.0001 0
P8 0.0217 0.0489 0.0489 0 0.0036 0.0142 0.0062 0.0139 0.0139 0.0006 0.0025 0.0056 0 0 0.0001
P9 0.0869 0.1358 0.1358 0.0036 0.0142 0.032 0.0247 0.0387 0.0387 0 0.0006 0.0025 0.0001 0.0001 0.0001 P10 0.0054 0.0217 0.0489 0 0.0036 0.0142 0.0247 0.0387 0.0387 0.0006 0.0025 0.0056 0.0001 0.0001 0.0001
P11 0.0489 0.0869 0.1358 0.0569 0.089 0.089 0.0015 0.0062 0.0139 0.0056 0.01 0.0156 0 0 0.0001
Table 12: Calculation of relative closeness of alternatives to ideal solution
Interval to positive ideal Interval to negative ideal
P1 4.3681 0.6565 P2 4.4101 0.6226 P3 4.6709 0.3679 P4 4.3567 0.6594 P5 4.4903 0.5455 P6 4.537 0.4945 P7 4.4321 0.5984 P8 4.5867 0.4421 P9 4.3215 0.7008 P10 4.5523 0.4856 P11 4.2475 0.7726
Ali Bastin

Indian Journal Of Natural Sciences www.tnsroindia.org. © IJONS
Vol.5 / Issue 28/ February 2015 International Bimonthly ISSN: 0976 – 0997
2741
Table 13: Final table of revision plan’s land use in terms of passive defense consideration
Code Land Use Final Rank P1 Law enforcement agencies 0.1307 4 P2 Green open spaces 0.1237 5 P3 Docks & harbors and customs 0.073 11 P4 Strategic & critical areas 0.1315 3 P5 Health 0.1083 7 P6 Residential 0.0983 8 P7 Workshops, industries, warehouses 0.119 6 P8 Urban equipment 0.0879 10 P9 Urban facilities 0.1395 2
P10 Business, services 0.0964 9 P11 Communication network & transport equipment 0.1539 1
Ali Bastin

Indian Journal Of Natural Sciences www.tnsroindia.org. © IJONS
Vol.5 / Issue 28/ February 2015 International Bimonthly ISSN: 0976 – 0997
2742
Investigate the Relationship between Marketing Innovation and Business Strategies and Continuity of Activity and Survival of Small and Medium-Sized Manufacturing Enterprises in Kurdistan Province Abdolnaser Shojaei, Ahmad Barati and SiamakHassanpour*
Department of Management, Sanandaj Branch, Islamic Azad University, Sanandaj, Iran Received:20 Dec 2014 Revised: 13 Jan 2015 Accepted: 28 Jan 2015 *Address for correspondence SiamakHassanpour Department of Management, Sanandaj Branch, Islamic Azad University, Sanandaj, Iran. E.Mail: [email protected]
This is an Open Access Journal / article distributed under the terms of the Creative Commons Attribution License (CC BY-NC-ND 3.0) which permits unrestricted use, distribution, and reproduction in any medium, provided the original work is properly cited. All rights reserved. During the recession periods, manufacturing companies face a sharp decline in demand; therefore, the need for marketing is quite obvious. Marketing innovation and business strategies can provide companies with some advantages to still continue their activity, including the use of new ideas for solving problems in a way that creates value, conversion of idea to applied program, new products and services, or improvement of a presentation and new action and a fulfilled creative thought. This study investigated the relationship between marketing innovation and business strategy and continuity of activity in small and medium sized enterprises. This study wasapplied – survey, and questionnaire was used to data collection in the statistical community, and SPSS and LISREL were used to data analysis. The results showed that marketing innovation and business strategy affect continuity of activity and market orientation in small and medium enterprises in Kurdistan province. Key words: Marketing innovation, Business strategy, Continuity and survival of the enterprise, Market orientation. INTRODUCTION In today's world, according to the speed and volume of information and challenges that organizations are facing them, possessing some criteria for determining the location and planning based on strengths and weaknesses seems to be necessary, more than ever. At present, our country should take basic steps to join World Trade Organization,
ABSTRACT
RESEARCH ARTICLE

Indian Journal Of Natural Sciences www.tnsroindia.org. © IJONS
Vol.5 / Issue 28/ February 2015 International Bimonthly ISSN: 0976 – 0997
2743
such as gradual elimination of monopoly, promotion of competitive approach in market, privatization and reduction of government involvement. These processes cause Iranian companies to being confronted with a competitive environment that survival in which requires its particular mechanisms, tools and strategies; for example, marketing strategic planning and using marketing strategies for achieving a sustainable competitive advantage can be mentioned. It seems that marketing strategies are useful and effective strategies for creating competitive advantage. However the other functional strategies are also necessary. Statement of the Problem Simultaneously with theexistence of recession in the economy, economic activities are entering a downward period, such as decrease of employment rate and increase of unemployment, decrease of investment and participatory profits, decrease of the tendency to industrial and production activities (Heidarzadeh, 2003). What is certain is that recession period will lead to demand reduction, not demand cutting. Thus, institutions will face serious challenges, and slower and weaker businesses will be destroyed, and strong and more resistant businesses will be remained. Global economy and consequently Iran’s economy are in downturn period of economic indicators. Almost overwhelming businesses are in complex and difficult conditions. Nevertheless, perhaps this recession period can be considered as a golden opportunity and era for the field of marketing and advertising. Because in such circumstances, economic enterprises spend more efforts for marketing activities, and marketing knowledge and expertise find higher importance and place in the continuity of the activity and survival of businesses. So, businesses that do not have the thought of change and compliance with the current situation are gradually eliminated from the competition. But enterprises that have properly understood the conditions and have adjusted themselves to the current situation will pass successfully these difficulties (Marlowe, 2009: Chen, 2006). To obtain success in recession periods, it is necessary for any institution offering services to the customersto consider marketing mix and systemin its actions (Dargy, 2008). Service marketing mix, which is considered as marketing strategies in this research, includes issues such as product, price, place, distribution, personnel, assets and physical facilities and process. Every country in its economic environment is located inone of the business cycles of growth, shortage, recession, stagflation, or inflation.Therefore, for confronting with each of these periods, marketers should make some changes in their marketing mix in order to protect their market share,at the first degree, and then increase it,at the second degree. On the other hand, in critical situations we see many companies and institutions that have been helpless confronting the occurred situation and have been incapable of doing correct actions. Therefore, conducting researches in this field can be a general guide for institutions and companies to finally know which strategies respondbetter and how marketing mix should be. Marketing mix is a short statement to explain the main functional variables controlled by an organization. Each of marketing elements is a potential source for competitive advantage. In different situations of market different mixes may be required. For example, in some markets, price will be an important factor for success, andin some of them, services, distribution, and technical skills may be more important, and in the others reputation and reliability can be the best basis for competition. Marketer’s duty is to consider customer and competitor, and to create a mix or combination of activities that both havecompetitive advantages and make organizational capabilities utilization possible (Heidarzadeh, 2007). The most common definition of competitive advantage in the field of competition strategy and in value creation framework is expressed as whatever causes the increase of revenue over expenses. During recent years, competitive advantage has been placed in the center of competitive strategies discussion, and a lot of discussions about the competitive advantage have been proposed. The basic principle of the theory of Schumpeter, “innovation”,suggests that initiatives are the basic dynamic element in all aspects of economic (Naidoo, 2003). Schumpeter’s innovation can be defined as changes in goods delivery methods, such as the introduction of new products or methods of production, creating new markets, capturing new sources in the form of raw materials or semi-industrial goods, or actions of a new organization like creating or breaking monopoly. Institutions may possess some skills to create or adaptquickly to changes. The relation between Schumpeter’s theory and industrial organization theory is also as variationsare likely to cause some changes in industry’s structure, and affect institution’s performance, and so enterprises’ survival can be protected by this innovation and generated competitive advantage. Innovation is a fundamental concept for economic growth, and it can lead to competitive
SiamakHassanpour et al.

Indian Journal Of Natural Sciences www.tnsroindia.org. © IJONS
Vol.5 / Issue 28/ February 2015 International Bimonthly ISSN: 0976 – 0997
2744
advantage of the enterprise. In today’s competitive environment, innovation plays an important role in increasing competitive advantage of economic institution (Laning, 2008). According to what mentioned above, this study aims to investigate the influence of relationship between marketing innovation and businesses strategies on continuity of activity and survival of small and medium sized manufacturingenterprises in Kurdistan province in criticalperiods. Uncertainty of these variables’ situation is the main issue of this research. Background of the Research Marketing Innovation Innovation inthe modern meaning “nova” stems from the Latin root (Innovation) and has been defined as numerous and varied definitions that each of them somehow illustrates one aspect of innovation’s process. Definitions that are commonly proposed are: application of new ideas for solving problems in a way that will create value (Walcott,2008); transforming ideas into applied programs, new products and services or improving an offering and new administrative operation; creative management of knowledge about specific demands and needs of the society, and finally achieved creative thinking in the business world (Hayj, 1999, 597-622; Larijani and Majidzadeh, 2009). Dramatic increase in global competition along with a shift to the economy based on knowledge creates reaffirmationofthe innovation. Rapid changes in the competitive environment create new competitive world. This new economy is guided faster than the other competitions by those who are innovative and creative, those who create knowledge or convert it into new products and services and methods. Innovation is placed at the top of all the things that are supported by entrepreneurial action and its aim is to create value through the usage of knowledge. Thus, superior value to customers is transferred through innovation in organizations. Innovation is the process of receiving new ideas through satisfied customers. Conversion of new knowledge into new products and services is also called innovation. One of the results of innovation is value creation and increase of efficiency and thus it will lead to business growth. It is a spark that guides organizations and individuals tomove forward or top. Without innovation, new products, new services and new ways of doing business cannot be emerged, and most organizations will be involved in the old service and outdated methods forever. Innovation in the field of marketing as well as product innovation can directly affect the industry’s structure through increasing demand. The progresses made in the fields of advertising media, marketing’s new methods and channels, and so on can help industry to achieve new consumers or to reduce buyer’s sensitivity to price or to increase product differentiation. New methods of marketing can follow the increase or decrease of scale advantages, and so affect barriers to mobility. Marketing innovations may also change purchasers’ power and may affect the balance between fixed and variable costs, and subsequently affect instability of the competition. Marketing innovation is usually perceived as a continuous process. First, the entrepreneur protectsthe potential opportunity for profit in the market. Taking into consideration the commercial benefits as a main, the entrepreneur recombines key elements of the marketing and it launches a marketing system possessing strong market competitive capabilities to facilitate offering new products and developing new markets. Features of a successful marketing innovation include appropriate marketing strategy, traveled path the market, levels of management skills within the company, and unique organizational culture that copying and imitation of which may be difficult for competitors. A specific combination of these factors determines whether or not a marketing innovation creates the strategic value for the company. Marketing factors can also be divided into four general levels that form the basis of marketing innovation. These levels are associated with product, service, distribution, sale/ promotion. Understanding these basic marketing levels is essential, because these elements are central to marketing innovation. As a result, the interest dependent to value-added activities is within these levels (Ren et al., 2010, 82). The importance of innovation in today's changing and accelerated world is obvious. Today, almost all countries of the world are encouraging and developing creativity and innovation as one of the main advantages for the continued existence of the companies, in order to increase productivity and also to improve economic situation.
SiamakHassanpour et al.

Indian Journal Of Natural Sciences www.tnsroindia.org. © IJONS
Vol.5 / Issue 28/ February 2015 International Bimonthly ISSN: 0976 – 0997
2745
Marketing Strategy The business level strategy refers to how companies are competing in an industry or market (Walkrou et al.; Olson, Slater, 1944; Hunger &Weelen, 2001; Rokert, 1984).Two common and dominant frameworks in business strategies are: Miles and Snow's typology that focuses on the rate of tendency to change in product–market, and Porter's typology that focuses on customers and competitors (Hunger &Weelen, 1992). Michael Porter's Competitive Strategies can be studied in three contexts. Sometimes companies, due to special conditions, can have lower price than the other companies; for this reason, they have a competitive ability in pricing context, such as companies that have a more desirable price than the other competitors, using cheaper resources, more appropriate human sources, and also using more production capacity that is factor of creating competitive capability in the market. In fact,they can be price determinant in the market. In some cases, the most important competitive ability of companies is caused from each of distinguishedelements of the marketing mix, such as distinguished color, packaging, appearance and model, after sales service, price and its receiving method, distribution channels and type of advertisements. These factors absorb and attract different types of customers and increase the company's market share rather than the competitors. The third strategy is called focus, it means to select one part of market and then deeply penetrate it < focal market>. Choosing markets in a way that competitors cannot or will not oppose it (Porter, 1990, 157).The organization’s position in industry determines its profit; and if an organization puts itself in a proper position than its competitors, it will obtain higher profit than the average profit of the industry. Furthermore, such an organization will have higher Return On investment (ROI) even with improper industrial structure. Creating and maintaining such a situation among competitors is related to the ability to maintain the competitive advantage of the institution in industry. According to the structure of the each industry, the competitive advantages of institutions have very wide aspects. Also, depending on the scope of the organization’s activity (the entire market or a part or some parts of the market), different strategies areimplemented in the institutions. Among the numerous aspects of competitive advantages, two basic aspects can be identified as the intersection of these approaches. Combining these two basic aspects and the organization activities’ scope in the industry creates three general strategies for managers, including: - Supplying the cheapest product to the market, or cost leadership, - Supplying a different product to the market, or differentiation strategy, - Focusing on a part of the market having price or differentiation approach.
The objectives of cost leadership and differentiation strategies are to obtain the total market, and the objective of focus strategy is to possess some parts of the market (David, 2011, 136). Theoretical Framework of the Study According tothe conducted studies on the research’s literature and also according to this research’s subject, the following conceptual model has been considered as the model of current research. In this model, independent variables include marketing innovation and business strategy. Also, dependent variables include continuity and survival of the company and market orientation. The following conceptual model (Fig.1) has been extracted from VikashNaidoo’s study (2010) entitled “The Company's Survival and the Relationship between Marketing Innovation and Business Strategy and Market Orientation. Based on the mentioned study, general or generic strategies of Michael Porter (cost leadership, differentiation, focus) are considered as business strategy. In addition, in chapter 4some indicators have been mentioned for the research’s variables.
METHODOLOGY This research is an applied study in terms of objective, and it is a survey correlation in terms of data collection method. Statistical population of this research includes all small and medium-sized manufacturing companiesof Kurdistan province, which some companies were selected among them via simple random method, and respondents
SiamakHassanpour et al.

Indian Journal Of Natural Sciences www.tnsroindia.org. © IJONS
Vol.5 / Issue 28/ February 2015 International Bimonthly ISSN: 0976 – 0997
2746
or statistical sample were selected via stratified random sampling method. Library studies were used to collect secondary data, and field method using questionnaire was used to collect primary data. The statistical population includes all small and medium sized manufacturing companies in Kurdistan province, which are working in the timeframe of this research. Simple random sampling was used to select manufacturing companies, and stratified random sampling method was used to select statistical sample (respondents). Sample size was estimated as 385 for this statistical population, according to Cochran’s formula and Morgan’s table. Library studies method was used to collect secondary data, and field method with the help of questionnaire was used to collect primary data. Research Hypotheses Main Hypotheses: - Marketing innovation is significantly related to continuity of activity and survival of small and medium sized
manufacturing companies in Kurdistan province. - Business strategies are significantly related to continuity of activity and survival of small and medium sized
manufacturing companies in Kurdistan province.
Subsidiary Hypotheses:
- Marketing innovation is significantly related to market orientation in small and medium sized manufacturing companies in Kurdistan province.
- Business strategies are significantly related to market orientation in small and medium sized manufacturing companies in Kurdistan province.
Analysis of the Data Reliability In this study, the method of Cronbach's alpha was used to determine the reliability of the test. This method is used to calculate the internal consistency of measuring tools, which measures different characteristics. The more higher the alpha, the more reliability of the scale.According to Table (1), the values of Cronbach's alpha for the four constructs were greater than 0.7, and this issue indicates the reliability.Before entering the confirmatory factor analysis discussion, it should be noted thatthere is no need for exploratory factor analysis in this research, because the questionnaire of Naidoo’s previous studies (2010) has been used in it. Because exploratory factor analysis should be used when the questionnaire is researcher-made or it is used for the first time. Also, KMO & BARTLETT test was used to measure whether or not indicators and variables are proper for factor analysis. All values were high. As can be seen, the results of both tables are greater than 0/5 and 0/05. Therefore, they are appropriate for factor analysis and they also have normal distribution.Before interpreting the results caused from estimation of structural model, we must be certain that the fitted model is proper and goodness-of-fit tests confirm appropriateness of the estimation. In this conditions, we can trust the results of model estimation. As mentioned in chapter 3, goodness-of-fit indicators can be seen in the following table.
SiamakHassanpour et al.
Indian Journal Of Natural Sciences www.tnsroindia.org. © IJONS
Vol.5 / Issue 28/ February 2015 International Bimonthly ISSN: 0976 – 0997
2747
Referring to the picture (5-4), the first 4 indicators can be simply seen. The numerical value of is 0.034, whilethe degree of freedom is equal to 4 and the desired conditions is existed, and it is in good fitting domain. Moreover, fitting indicator is in good fitting domain. The value of the indicators of P-value, RMSEA, GFI, and AGFI are also in good or acceptable good fitting domain. In can be concluded that the estimated model is a good one in terms of fitting and it is trustable, and its results are referable.
CONCLUSIONS In the following table 8, the hypothesis of this study are specified. According to T statistic and path analysis model, all hypothesis are acceptable. In the other hand, H0 cannot be accepted.According to the obtained tables and graphs, it can be said that all hypothesis of this research are confirmed. Therefore, business strategy and marketing innovation have affected the survival and continuity of manufacturing companies of Kurdistan province in critical conditions.Managers should monitor and guide the mentioned influencing factors in their companies in order to increase competitive power andflexibility in rapid environmental and technological changes, increase innovation, creativity, and productivity, creation of wealth, and effort to continuation of the company’s existence.Designing information receiving system about identifying products and services situation of the other similar companies will help managers to make their decisions according to different aspects of competitive environment, particularly possessing information about the software products and services of similar companies such as technical features and facilities of the mentioned systems can be useful. REFERENCES 1 David, Fred R (2011), Strategic Management, Translated by Seyyed Mohammad Arabi and Ali Parsaeian,
Tehran, Cultural Researches Office. 2 Waker.Avrovil C et al. (2004), Marketing Strategies with a Decision Oriented Approach. Translated by Seyyed
Mohammad Arabi and DawoudIzadi. Tehran, Cultural Researches Office. 3 MozafariMehr, Parisa (2009), Investigation of Marketing Strategy in Branches Management of Keshavarzi Bank
of Qazvin Province. Master Thesis, Tehran University, Faculty of Management. 4 Michael Porter (2004), Competitive Strategy, Analysis Techniques of Industry and Competitors. Translated by
Jahangir Majidi and Abbas MehrPouya, Tehran, Publication of Rasa. 5 Hosseini, Zahra (2009), Determining the Effect Value of Export Market Orientation on Export Performance in
Export Manufacturing Companies, Master Thesis, Ferdowsi University of Mashhad, Administrative ScienceFaculty.Dargy, Parviz (2008), Management of Iran’s Economic Institutions in the Situation of Global Economic Recession. Journal of Market Engineering Development, 2 (8), 4-6.
6 FilipKotler (2007), FilipKotler Answers Your Expertism Questions in Marketing. Translated by KambizHeidarzadeh and Reza Radfar, KasaKavoush, Tehran, The first, 86.
7 NikouMaram, Hashem; HeidarZadeh, Kambiz (2003), Evaluating the Role of Entrepreneurial Tendency, Organizational Structure, and Market Orientation in Business Performance of Manufacturing Companies Accepted in Stock Exchange. “Journal of Marketing Management”, Islamic Azad University, Sciences and Researches Branch of Tehran, No.7.
8 Kotler, Filip; Armstrong, Gary, Marketing Principles, Translated by BahmanForouzande, Isfahan, 1997. 9 JafariGhoushchi, Behzad, Place of Management Development in Organization ascendency, Tadbir, 2010, No.162,
Pages 49-55. 10 Augusto, Mário& Coelho, Filipe (2009),” Market orientation and new-to-the- worldproducts:Exploring the
moderating effects of innovativeness, competitive strength, and environmental forces“Industrial Marketing Management.vol.38,Issue1,pp.94-10
SiamakHassanpour et al.

Indian Journal Of Natural Sciences www.tnsroindia.org. © IJONS
Vol.5 / Issue 28/ February 2015 International Bimonthly ISSN: 0976 – 0997
2748
11 Chen,Shu-Ching&G.Quester,Pascale(2006),"Modelingstoreloyalty perceived value in market orientation practice", Journal of Services Marketing, Vol. 20 Issue 3, pp.188 – 198.
12 Du,Lanying&Wu, Shuilan (2008)," InformationManagement,Innovation Management and Industrial Engineering, ICIII '08. International Conference on.
13 Micheels a, Eric T & R. Gow b, Hamish(2008) " Market Orientation, Innovation and Entrepreneurship: An Empirical Examination of the Illinois Beef Industry" International Food and Agribusiness Management Review , Vol11,
14 Meydeu, Albert &Lado, Naro (2003),”Market Orientation and Business Economic Performance”, International Journal of Service Industry Management, Vol .14, No .3 , 2003 , PP.284-309-1
15 Merlo ,Omar, &Auh ,Seigyoung (2009), “The effects of entrepreneurial orientation market orientation and marketing subunit influence on firm performance "Market Lett,Vol.20,pp.295-311.
16 Prokopenko, J., Cometition, an Agenda for the 21st Century, International Labour office, Geneva, 2000. 17 Hitt, M.A., Irland, R.D. and Hosrisson, R.E., Strategic Management Competitiveness and Globalization, St., Paul,
est Publishing Company, 1995. 18 Porter, M. The Competitive Advantage of Nations. New York: Free Press., 1990, www.Pignc- ispi.com. 19 Cooke, P., 2001, “Regional innovation systems, clusters, and the knowledge economy”, IndustrialCorporate and
Change, 10(4), pp. 945-974. 20 Jensen, M.B., et al., 2007, Forms of knowledge and modes of innovation. Research Policy, 36(5), pp. 680-693. 21 Kraemer-Mbula, E. and Wamae, W. (eds.), 2010, Innovation and the DevelopmentAgenda, OECD/IDRC. 22 Lundvall, B.Å., 2005, National innovation systems - Analytical concept and development tool, in DRUID Tenth
Anniversary Summer Conference 2005 on Dynamics of Industry and Innovation: Organizations, Networks and Systems, Copenhagen, Denmark.
23 Lall, S. and Teubal, M., 1998, “Market- Stimulating Technology Policies in Developing Countries: A Framework with Examples from East Asia”, World Development, 26(8), pp. 1369-1385.
24 Wolcott D. Director of Operations for the Innovation Network- innovation November12,2008.http://www.slideshare.net/alphacat/alphacatalystconsulting-malaysian-innovation-climate-report-2010.
25 Larijani B, Majdzadeh R. Iran’s Health Innovation and Science Development Plan by 2025. Iranian Journal Public Health 2009; 38 l 1: 13-16.
26 Hage J. T. Organizational Innovation and Organizational Change. Annual Review of Sociology(Nonprofit Scientific Publisher). 1999; 25: 597-622.
27 Abernethy, M. A., and A. M. Lillis. (1995). The impact of manufacturing flexibility on management control system design. Accounting, Organizations and Society 20 (4): 241–258.
28 Aghion, P., N. Bloom, R. Blundell, R. Griffith, and P. Howitt. (2005). Competition and innovation: An inverted U relationship.Quarterly Journal of Economics 2: 701–728.
29 Bouwens, J., and M. A. Abernethy. (2000). The consequences of customization on management accounting system design.Accounting,Organizations and Society 25 (3): 221–259.
30 Chenhall R. H., J-P Kallunki, H. Silvola, (2011).Exploring the Relationships between Strategy, Innovation, and Management Control Systems: The Roles of Social Networking, Organic Innovative Culture, and Formal Controls,Journal Management Accounting Research,Vol. 23, pp. 99–128.
31 Damanpour, F. (1990).Innovation effectiveness, adoption and organizational performance, in West, M.A.In Innovation and Creativity at Work, edited by J. L. Farr, 125–141.
32 Chichester, U.K.: John Wiley. Gupta, A. K., and V. Govindarajan. (1984).Build, hold, harvest: Converting strategicintentions into reality. The Journal of Business Strategy 4 (3): 34–47
33 Merchant, K. (1981). The design of the corporate budgeting system: Influences onmanagerial behavior and performance. The Accounting Review 4: 813–829.
34 Shurchuluu.P (2002).national productivity and competitive strategies for new millennium. 35 Porter, M. E. (1985). Competitive Advantage: Creating and Sustaining Superior Performance. New York, NY:
Free Press.
SiamakHassanpour et al.

Indian Journal Of Natural Sciences www.tnsroindia.org. © IJONS
Vol.5 / Issue 28/ February 2015 International Bimonthly ISSN: 0976 – 0997
2749
36 Simons, R. (1990). The role of management control systems in creating competitiveadvantage: New perspectives. Accounting,Organizations and Society 12: 49–42.
37 Ren, L., Xie, G. andKrabbendam, K. (2010).“Sustainable competitive advantage and marketing innovation with in firms”. Management Research Review, Vol.32.
38 Manu, F. (1992).Innovation Orientation, Environment andPerformanceComparisonof U.S. and European Markets.Journal of International Business Studies.
39 Grinstein, A. (2008). The Relationships between Market Orientation and Alternative Strategic Orientations: A Meta-Analysis. European Journal of Marketing
40 Barden, P.(2008). The basics of innovation: creating sustainable innovation., StrategicDirection, Vol.24, No.2, pp.29-31. McFadzean, E.; Oloughlin, A. & Shaw, E.(2005). Corporate entrepreneurship and innovation part1: the missing link, European performance in cultural organizations,” European Journal of Innovation Management, 11,413-434
41 Wheelen, T.L. & Hunger, J.D. (1992). Strategic management and business policy; 4th ed Wokingham:Addison-Wesley.
42 Walker, O.C. &Ruekert, R.W. (1987). Marketing’s role in the implement-tation of business strategies: A critical Review and conceptall framework; Journal of Marketing; V. 51, July: pp. 15-33.
43 Hunger, J.D. &Wheelen, T.L. (2001). Essentials of strategic management; 2th ed. New Jersy: Prentice-Hall
Fig.1.Theoretical Framework of the Study (Reference: VikashNaidoo, 2010)
Table 1: Results of the items’ reliability test
Variable Item Cronbach's
alpha Marketing Innovation Inno1…..……..inno7 0.711
Business Strategy Stra1……....…..Stra5 0.773 Market Orientation Mo1……….…...Mo4 0.860
Continuity of the Company’s Activity Surv1……...….surv4 0.839 Table (2): Normality test with Kaiser- Myer-Oklin, KMO
Variable Kaiser- Myer- Oklin
Marketing Innovation 0.714 Business Strategy 0.825
Market Orientation 0.777 Survival and Continuity of Activity 0.846
SiamakHassanpour et al.

Indian Journal Of Natural Sciences www.tnsroindia.org. © IJONS
Vol.5 / Issue 28/ February 2015 International Bimonthly ISSN: 0976 – 0997
2750
Table (3): Normality test
Variable Sig Marketing Innovation 0/0505
Business Strategy 0/0837 Market Orientation 0/0655
Survival and Continuity of Activity 0/0540
Chart 2: T values of the structural model of marketing innovation and business strategy on
continuity of activity
SiamakHassanpour et al.

Indian Journal Of Natural Sciences www.tnsroindia.org. © IJONS
Vol.5 / Issue 28/ February 2015 International Bimonthly ISSN: 0976 – 0997
2751
Table (7-4): Domain of goodness-of-fit indicators
Fitting Indicator Good Fitting Accepted Fitting 2χ
20 χ 2df 22df χ 3df
2χ df 20 χ df 2
22 χ df 3 P-value .05 p 1.00 .01 p .05 RMSEA 0 RMSEA .05 .05 RMSEA .08
GFI .95 GFI 1.00 .90 GFI .95 AGFI .90 AGFI 1.00 .85 AGFI .90
Table 8.: Hypothesis of the Study
Hypothesis T Situation Marketing innovation on the continuity of activity 5.77 Accepted
Business strategy on the continuity of activity 8.69 Accepted Business strategy on the market orientation 5.77 Accepted Marketing innovation on market orientation 6.79 Accepted
SiamakHassanpour et al.

Indian Journal Of Natural Sciences www.tnsroindia.org. © IJONS
Vol.5 / Issue 28/ February 2015 International Bimonthly ISSN: 0976 – 0997
2752
Constraints Faced By The Sericulturists Under Cluster Promotion Programme
Syed Shakir Ali1, N.R.Koshti2*, K.T.Lahariya3 and K.U.Bidwe4
1Krishi Vigyan Kendra, Baramati, District, Pune (M.S.),India. 2Directorate of Extension Education, Dr.PDKV, Akola (M.S.)444004,India. Received: 25 Dec 2014 Revised: 13 Jan 2015 Accepted: 17 Jan 2015 *Address for correspondence N.R.Koshti Associate Professor, Dr.Panjabrao Deshmukh Krishi Vidyapeeth, Krishinagar, Akola, Maharashtra, India-444004 E.mail: [email protected].
This is an Open Access Journal / article distributed under the terms of the Creative Commons Attribution License (CC BY-NC-ND 3.0) which permits unrestricted use, distribution, and reproduction in any medium, provided the original work is properly cited. All rights reserved. CentralSericulture Board together with Directorate of Sericulture, Maharashtra implemented Cluster Promotion Programme (CPP) throughout the year 2007-10. The present paper analyzes the various constraints faced by beneficiaries after their participation in CPP in Osmanabad district. In all total, a hundred and fifty sericulturists were selected by “probability proportionate sampling size technique” from eight talukas covering twenty five villages. Information was collected by personal interviews with sericulturists on a pre-structured interview schedule. The findings discovered that the common constraints faced by beneficiaries under CPP are improper electricity due to load shading (95.33%) and no support for chemical fertilizers and pesticides (92.00%) The technical constraints faced for mulberry cultivation are non assistance for irrigation and other water conservation techniques (92.00%) and non assistance for drip irrigation (78.00%). Constraints faced during marketing of cocoons, the fact reported is that 99.33 per cent of the respondents are facing the constraints about improper grading of cocoons at government marketing centers, unavailability of nearer proper market for cocoon marketing (98.66%), unawareness about harvesting and marketing of cocoons (62.00%) and lack of awareness about mounting, density of mounting and time of harvesting of cocoons (56.66%) respectively. Key words: Constraints, Sericulturists, Cluster Promotion Programme.
ABSTRACT
RESEARCH ARTICLE

Indian Journal Of Natural Sciences www.tnsroindia.org. © IJONS
Vol.5 / Issue 28/ February 2015 International Bimonthly ISSN: 0976 – 0997
2753
INTRODUCTION Under Catalytic Development Project(CDP) implemented by Central Silk Board (CSB)Ministry of Textiles, Govt. of India, Sericulture Production cluster were identified and Cluster Promotion Programme (CPP) were implemented by CSB in collaboration with Directorate of sericulture, Maharashtra in Osmanabad district during the year 2007-10.Success of any new technology depends on its acceptance /adoption by Sericulturists and the user acceptance is much dependent on carefully drawn and implemented extension programme [7].Considering the above mentioned facts, the present investigation was conducted in Osmanabad district of Maharashtra State wherein hundred and one villages are below mulberry plantation with an area of 274 ha (685acres) and having a Cocoon production of 76380.2 kgs [1]. The aim of study was to the various constraints faced by beneficiaries after their participation in CPP in Osmanabad district. So that efforts should be taken by extension agencies to minimize the constraints in future sericulture development programmes.
MATERIALS AND METHODS location of study The present investigation was undertaken in Osmanabad district. It is situated in the southern part of the State abutting Andhra Pradesh in south and lies between north latitudes 17°37’ and 18°42’ and east longitude 75°1 6’ and 76°47’. Sampling plan and data collection
Three stages sampling technique was adopted for this investigation. Cluster wise mulberry planted eight talukas were selected wherever Cluster Promotion Programme was implemented throughout 2007-08. On the basis of this, list of mulberry growing villages were prepared, arranged in descending order of area and in all 25 villages were selected on number proportionate basis. The percentages of area under mulberry plantation in each block was calculated and converted into proportion for selection of 150 respondents. The respondents those have taken the advantage of CPP between 2007-2010 were selected from the selected villages; the list of sericulturist under CPP was drawn. Thus, in all 150 respondents were selected for study from the list by adopting “proportionate Probability sampling to the size technique. Information on pre-structured interview schedule was collected by conducting personal interviews with sericulturists.
RESULTS AND DISCUSSION Constraints faced by the Sericulturist under Cluster Promotion Programme
Constraints experienced by the sericulturist in adoption of recommended sericulture practices under cluster promotion programme were divided into six parts namely common constraints, technical constraints for mulberry cultivation, natural constraints, economic constraints, constraints in cocoon production and marketing constraints and are presented in the Table 1. The data presented in Table 1 revealed the common constraints faced by farmers under CPP are improper electricity due to load shading (95.33%), no support for chemical fertilizers and pesticides (92.00%) and non assistance for training (28.00%). The technical constraints faced for mulberry cultivation are non assistance for irrigation and support for other water conservation techniques (92.00%), non assistance for drip irrigation (78.00%), no support for maintenance of existing mulberry trees (52.00%), non assistance for replacement of old mulberry varieties with new varieties (35.33%), no support for high yielding mulberry plantation and non availability of setts/ seedlings (22.66%) respectively. [5] Reported that major constraints faced by the farmers are
Syed Shakir Ali et al.

Indian Journal Of Natural Sciences www.tnsroindia.org. © IJONS
Vol.5 / Issue 28/ February 2015 International Bimonthly ISSN: 0976 – 0997
2754
fluctuation in cocoon price, lack of separate rearing house, lack of finance, non availability of inputs in time which confirms the findings. The findings are in consonance with the findings of [2] .
As regards natural constraints, poor economic condition (79.33%), non-availability of FYM (78.66%) and unavailability of water for irrigation (70.00%) are the major one. Pertaining to economic constraints it was observed that cent percent of the constraint faced under CPP is very less quality linked best support price for cocoons as compare to Mysore market, followed by non assistance for shoot rearing facility and separate rearing houses (96.66%), lack of support for increased wages (93.33%) and no crop insurance support (62.00%).The findings are in accordance with the findings of [3].
The constraints faced during cocoon production are lack of support for uzifly control (95.33%), no support for purchasing rearing appliances (93.33%), unavailability of eggs or dfls at proper time (87.33%), non assistance for chawki rearing facilities (62.00%), improper disinfection of rearing houses (60.00%), no support for purchasing quality disinfectants and other crop protection measures (56.66%), insufficient facilities for black boxing (50.00%) and insufficient facilities for incubation (40.00%) respectively.
Pertaining to constraints faced during marketing of cocoons, the facts reported that 99.33 per cent of the respondents are facing the constraints about improper grading of cocoons at government marketing centers, unavailability of nearer proper market for cocoon marketing (98.66%), unawareness about harvesting and marketing of cocoons (62.00%) and lack of awareness about mounting, density of mounting and time of harvesting of cocoons (56.66%) respectively. [6] Reported that major constraints of sericulturist farmers were lack of government regulated market, economic motivation, awareness and timely extension support etc. which is in line of research.
Suggestions obtained from the respondent to overcome the constraints Suggestions obtained from respondents to overcome the constraints under Cluster Promotion Programme on sericulture are presented in Table 2. It can be revealed from Table 2 that as regards the suggestions to overcome the constraints in mulberry cultivation practices 82.00% respondents suggested conducting exposure visit to the field of well known sericulturist and 28.00% respondents suggested providing pre-plantation training. To avoid constraints in use of fertilizers 90.66 percent suggested that fertilizers should be provided in bulk and on door basis while 92.00% suggested providing government subsidy on purchase of fertilizers. To overcome the constraints in use of intercultural practices 52.00% respondents suggested that cent percent subsidy should be provided on power tiller while 25.33 % recommended providing pruning machine to each sericulturist. As regards to irrigation practices 94.00% suggested that assured irrigation facilities should be provided by the government and 80.66% respondents suggested that subsidy on drip irrigation to be increased up to cent percent. This might be due to non-availability of assured irrigation facility in the district as Osmanabad is mostly falls under rainfed area in Maharashtra state. To overcome the constraints in construction of rearing house, nearly 99.33 per cent respondents suggested that existing norms on unit cost and subsidy for construction of rearing house should be increased and 80.66% opinion that the bank loan should be easily available. This might be due to high cost involved in construction of silkworm rearing house as per recommendations. The findings of [8] show that microfinance or sharing of gains in an equitable and fair manner would make sericulture more viable. As regards the constraints in the transportation of eggs, 67.33 percent respondents suggested to provide egg masses at proper time on door step and 30.00% respondents suggested to provide frequent technical guidance. As far as suggestions to overcome constraints in black boxing of dfl’s 83.33% suggested providing frequent technical guidance and 34.66% suggested that sufficient facilities for black boxing should be provided under CPP. As regards the constraints in chawki rearing 73.33 percent suggested that assistance for chawki rearing should be made and 23.33% suggested providing frequent technical guidance. As regards the suggestion to avoid constraints in disinfection of rearing house and equipments, 66.00% suggested to provide
Syed Shakir Ali et al.

Indian Journal Of Natural Sciences www.tnsroindia.org. © IJONS
Vol.5 / Issue 28/ February 2015 International Bimonthly ISSN: 0976 – 0997
2755
support for purchasing quality disinfectants and other crop protection inputs and 50.00% suggested to organize practical training on the same subject. Pertaining to avoid constraints regarding silk worm rearing 95.33% of the respondents opinion that support should be made to control uzifly menace at village level, 92.66% suggested that silkworm rearing equipments should be made free of cost by the government, 60.00% suggested skill oriented trainings should be conducted at village level and chawki reared silkworms should be provided free of cost, are suggested by 40 percent of respondents. As regards the suggestion to overcome the constraints in cocoon production nearly 96.66% suggested providing subsidy for construction of mounting hall and 30.00% suggested providing technical guidance.To avoid the constraints in marketing of cocoons, cent percent respondents suggested increasing the price of cocoons so that net income of the sericulturist from sericulture enterprise would be increase. Likewise 98.66 percent suggested that proper grading cocoons should be done at government marketing centre for best price and 96.66% suggested to easy access to the proper market for cocoon marketing should be available at nearer places for easy marketing. [4] stated that a policy is advocated to introduce minimum support price for commercial cocoon producers to increase both productivity and profitability. Likewise findings of [9] are also in line with the findings of study.
CONCLUSION It might be concluded that the common constraints faced by beneficiaries under CPP are improper electricity due to load shading (95.33%) and no support for chemical fertilizers and pesticides (92.00%) The technical constraints faced for mulberry cultivation are non assistance for irrigation and other water conservation techniques (92.00%) and non assistance for drip irrigation (78.00%). Constraints faced during marketing of cocoons, the fact reported is that 99.33 per cent of the respondents are facing the constraints about improper grading of cocoons at government marketing centers, unavailability of nearer proper market for cocoon marketing (98.66%), unawareness about harvesting and marketing of cocoons (62.00%) and lack of awareness about mounting, density of mounting and time of harvesting of cocoons (56.66%) respectively.Efforts should be taken by implementing agency to resolve the constraints of beneficiaries for better implementation of CPP in sericulture.
REFERENCES 1. Anonymous (2010): “Area and production of mulberry and silk cocoon” Annual report of Department of Sericulture, Osmanabad, M.S. PP: 1-2. 2. Dandin S.B., Kumaresan, P and Geetha Devi, R.G. (2005): “Sericulture technology dissemination – A model approach” Indian Silk 44 (7) PP: 5-8. 3. Deepa,P and Sujathamma,P (2007) : “Information source and consultancy pattern of different sericultural technologies at field level and technology adoption in the semi-arid conditions of Chittoor District in Andhra Pradesh” Indian Journal of Sericulture 46 (1) PP:86-88. 4. Lakshmanan, S and Mallikarjuna, B (2006) : “An economic analysis of sericultural farming business in Tamil Nadu –an empirical study. Mysore Journal of Agricultural Sciences 40 (1) PP:96-101. 5. Munikrishnappa, H.M., Lakshmanan, S., Geethadevi, R.G and Mallikarjuna, B. (2009): “A study on economics of sericulture in drought prone region of Andhra Pradesh” Indian Journal of Sericulture 48 (2) PP: 201-203. 6. Pandit, D., Bagchi, S.N., Ghosh, S and Das, N.K (2007) : “A study of mulberry sericulture- adoptions and constraints” Journal of Interacedemica XI (4) ,PP.492-497. 7. Rama Mohana Rao, P and Kambale, C.K. (2009): “Impact of demonstration of technology package in Sericulture extension and future extension strategies” Indian Journal of Sericulture 48 (2) PP: 178-181. 8. Shankar Rao, K.V.,Brahma, K.C., and Sahu, R (2007) : “Development of sericulture in Chhatisgarh: Challenges and Prospects” Indian Silk 46 (7) PP: 14-17. 9. Sharma, V.P. (2008): “Silk industry: new millennium aspirations for rural development and economic growth in North-Eastern India” Bulletin of Indian Academy of Sericulture XII (1) PP: 20-40.
Syed Shakir Ali et al.

Indian Journal Of Natural Sciences www.tnsroindia.org. © IJONS
Vol.5 / Issue 28/ February 2015 International Bimonthly ISSN: 0976 – 0997
2756
Table 1. Constraints faced by Farmers under Cluster Promotion Programme.
*The percentage is more than hundred due to multiple responses.
Sr. No Constraints
Respondents (n=150) Number Percentage(*)
I Common constraints 1. Non assistance for training 42 28.00 2. No support for chemical fertilizer and pesticides 132 92.00 3. Improper electricity due to load shading 143 95.33 II Technical Constraints for Mulberry Cultivation 1. Non availability of Setts/seedlings 34 22.66 2. No support for high yielding mulberry plantation 38 25.33 3. No support for maintenance of existing mulberry trees. 78 52.00 4. Non assistance for replacement of old mulberry varieties with new
varieties 53 35.33
5. Non assistance for drip irrigation 105 70.00 6. Non assistance for irrigation and other water conservation
techniques 138 92.00
III Natural constraints 1. Non- availability of FYM 118 78.66 2. Unavailability of water for irrigation 105 70.00 IV Economic constraints 1. No crop insurance support 93 62.00 2. Non assistance for shoot rearing facility and separate rearing houses 145 96.66 3. Very less quality linked best support price for cocoons as compare
to Mysore 150 100.00
4. Lack of support for high cost wages 140 93.33 5. Poor economic condition 119 79.33 V Constraints in Cocoon production 35 23.33 1. Unavailability of Eggs at proper time 131 87.33
2. Insufficient facilities for Black boxing 75 50.00
3. Non assistance for chawki rearing facilities 93 62.00
4. No support for purchasing rearing appliances 140 93.33
5. Insufficient facilities for incubation 60 40.00
6. No support for purchasing quality disinfectants and other crop protection measures
85 56.66
7. Improper disinfection of rearing houses 90 60.00
8. Lack of support for uzifly control 143 95.33
VI Marketing Constraints 1. Lack of awareness about mounting, density of mounting and time of
harvesting of cocoons 82 54.66
2. Unawareness about harvesting and marketing of cocoons 93 62.00 3. Unavailability of nearer proper market for cocoon marketing (Easy
Accessability) 148 98.66
4. Improper grading of cocoons at Govt. marketing centers 149 99.33
Syed Shakir Ali et al.

Indian Journal Of Natural Sciences www.tnsroindia.org. © IJONS
Vol.5 / Issue 28/ February 2015 International Bimonthly ISSN: 0976 – 0997
2757
Table 2: Suggestions obtained from the respondent to overcome the constraints
Sr. No Suggestions
Respondents (n=150) Number Percentage(*)
I Mulberry cultivation Practices 1. Pre-plantation training should be provided 42 28.00 2. Exposure visits should be conducted to the field of well
known sericulturist 123 82.00
II Use of fertilizers 1 Government should provide subsidy on purchase of
fertilizers 138 92.00
2 Fertilizer should be provided in bulk on door step 136 90.66 III Intercultural Practices
1 Cent percent subsidy should be provided on Power tiller 78 52.00
2 Pruning machine should provided to each sericulturist 38 25.33
IV Support / Assistance for Irrigation
1 Assured irrigation facilities should provided by Government 141 94.00 2 Cent percent subsidy should be provided on drip irrigation 121 80.66
V Construction of rearing house
1 Subsidy for construction of rearing should be increased 149 99.33
2 Easy bank loans with low interest rate should be made available
121 80.66
VI Transportation of dfl’s
1. Egg masses should be made available at proper time on door basis
101 67.33
2. Frequent technical guidance should provided 45 30.00
VII Black boxing of dfl’s
1 Sufficient facilities for Black boxing should be provided 52 34.66
2. Frequent technical guidance should provided 125 83.33
VIII Chawki rearing
1 Assistance for chawki rearing facilities should be made 110 73.33
2 Frequent technical guidance should provided 35 23.33
IX Disinfection of rearing house and equipments
1. Provide support for purchasing quality disinfectants and other crop protection inputs.
99 66.00
2. Practical training should be provided 75 50.00
Syed Shakir Ali et al.

Indian Journal Of Natural Sciences www.tnsroindia.org. © IJONS
Vol.5 / Issue 28/ February 2015 International Bimonthly ISSN: 0976 – 0997
2758
*The percentage is more than hundred due to multiple responses.
X Silk worm rearing
1. Chawki reared silkworms should be provided free of cost 60 40.00
2 Silkworm rearing equipments should be provided free of cost by the government
139 92.66
3 Skill oriented trainings should be provided 90 60.00
4 Support for uzifly control should be made 143 95.33
XI Cocoon production 1. Subsidy should be provided for construction of mounting hall 144 96.00 2. Frequent technical guidance should provided 45 30.00
XII Marketing of Cocoons 1 Proper market for cocoon marketing should be made available
at nearer places (Accessability) 145 96.66
2. Proper grading of cocoons should be done at Govt. marketing centers for best price
148 98.66
3. Cocoon prices should be increased 150 100.00
Syed Shakir Ali et al.

Indian Journal Of Natural Sciences www.tnsroindia.org. © IJONS
Vol.5 / Issue 28/ February 2015 International Bimonthly ISSN: 0976 – 0997
2759
Designing Power System Stabilizer using Adaptive Back-stepping Approach to Improve Power System Stability Saied Iranpour1*,Saeed Abazari2 and Mohammad Danesh3
1Department of Electrical Engineering, Isfahan (Khorasgan) Branch, Islamic Azad University, Isfahan, Iran.
2Department of Electrical Engineering, Shahrekord University, Shahrekord, Iran. 3Department of Mechanical Engineering, Isfahan University of Technology, 84156-83111 Isfahan, Iran.
Received: 28 Oct 2014 Revised: 10 Dec 2014 Accepted: 18 Dec 2014 *Address for correspondence Saied Iranpour Department of Electrical Engineering, Isfahan (Khorasgan) Branch, Islamic Azad University,Isfahan, Iran E.Mail: [email protected]
This is an Open Access Journal / article distributed under the terms of the Creative Commons Attribution License (CC BY-NC-ND 3.0) which permits unrestricted use, distribution, and reproduction in any medium, provided the original work is properly cited. All rights reserved. This article studies the ways for improving dynamic stability of power system through back-stepping method. In the proposed control approach, dynamic stability of power system through back-stepping method has been improved significantly in comparison with classic approaches. Back-stepping is a systematic method based on iterative methods resetting to zero dynamic errors of the system in a stepwise manner. This method is unique and its implementation is simple. Because the range of change in the parameters of power system is high, this method is suitable for power systems. This method had been implemented on a single-machine system connected to infinite bus. Third order synchronous generator model is used to design the stabilizer. Comparison of results of simulations with that of the conventional power system stabilizer indicates that the designed PSS improves dynamic stability, transient and steady-state stability, and the response speed of the system. Keywords: Dynamic stability, power system stabilizer, Adaptive control, back-stepping method.
INTRODUCTION One of the most important issues in the operation of the power system is stability. Power systems are always exposed to unwanted disturbances and complex conditions that lead to oscillation in frequency, voltage and load angle on the
RESEARCH ARTICLE
ABSTRACT

Indian Journal Of Natural Sciences www.tnsroindia.org. © IJONS
Vol.5 / Issue 28/ February 2015 International Bimonthly ISSN: 0976 – 0997
2760
power unit. Low frequency oscillation is a phenomenon resulting in undesirable effects on the system. If the frequencies are not damped, they will cause the instability of the system [1-3]. With the increasing energy demand and interconnected networks of power, many power plants are equipped with automatic voltage regulator (AVR) [1]. Increasing the number of stations equipped with AVR shows that the use of voltage regulators negatively affect the stability of the power system. One of the most economical solutions proposed to address this problem is placing a feedback control loop for the auxiliary signal applied at the input of reference voltage regulating the voltage; this is known as power system stabilizer (PSS) [2]. Extensive research has been done on improving the performance of PSS in the past few decades [3-9]. PSS control parameters are determined based on a linear model of the power system. Therefore, the parameters parameters should be carefully adjusted to have adequate damping over a wide range of operating points; it is essential for local and inter-area oscillation damping. One of the ways of linear control is the use of linear quadratic regulator (LQR) [10]. This method requires accurate measurement of system parameters, which are not practical or cost effective. Moreover, selection of an appropriate weighting function for obtaining the optimal parameters of the controller, one of the problems that limit the use of these procedures. Linear matrix inequality (LMI) is another technique of linear control. This method requires the solution of a Riccati nonlinear equation to obtain feedback rules. Moreover, choice of the weighting functions in this way is very important. In addition, the need for an estimator increases the cost of controller. In recent years, other optimization methods have been proposed to select the PSS parameters including genetic algorithm and PSO [14-12]. It is noteworthy that since the structure of the controller is fixed, problems of lack of coordination between the controller and system for changing operating conditions remain after optimal selection of the controller parameters. In practice, due to successive changes in the operating point, using detailed models of the system dynamic and the design of PSS is important. Thus, to solve the problem of power system stability, when there are some uncertain points in system parameters, it is important to detect the uncertain points. The most common reasons for presence of uncertain points in power systems are: (1) Changes in the structure of the power system, including changes in generation, transmission and load. (2) Changes in the network structure resulted from short-circuit or change in this number production units. Due to the presence of uncertain points in power systems, power systems are highly nonlinear in terms of shape and parameters’ change with time [15]. Therefore, to achieve appropriate attenuation and ensure high reliability in a wide range of operating points, it is important to look for new ways to take advantage of the nonlinearity to ensure stability in this range. Many researchers have been interested in the design of controllers that quickly adapted to the operating conditions of the system, in other words to be resistant against the system changes [16-17]. In [16], a comparison of the dynamic performance of the system using three different adaptive PSS is presented. In all discussed controller in this paper, the controllers used identification algorithm to estimate the unknown parameters (Indirect controls) are preferred in applications of power system. The problem of these types of PSS relates to their use of linear model in design. In [18], direct feedback linearization (DFL) is presented. In this way, the system is linear with changing variables and choosing appropriate input signal; it becomes stable by designing state feedback. This method requires accurate identification of system parameters. In addition, some useful nonlinear sentences that reduce control energy and improve the stability of controller are removed in the linear system. In [19], the combination of feedback linearization method and back-stepping method is used for the PSS design. Although significant results have been achieved, this method has problems with feedback linearization techniques and ignores the uncertain points of system. In this article, PSS is designed based on adaptive back-step method in a single machine connected to infinite bus system. Due to of the complexity of accurate measurement of damping coefficient (D), this parameter is considered as one of
Saied Iranpour et al.

Indian Journal Of Natural Sciences www.tnsroindia.org. © IJONS
Vol.5 / Issue 28/ February 2015 International Bimonthly ISSN: 0976 – 0997
2761
uncertain points system. In the following, the article discusses power system modeling and controller design for improving the dynamic stability and implementation results of the controller. Studied Models of power System
Figure 1 shows a single machine connected to infinite bus. This model consists of a synchronous generator connected to a very large power networks modeled with infinite bus through two lines. Generator dynamic model is shown by the following third-order nonlinear equations [22]:
(1) 0
(2)
1 ( )m eD P PM M
(3) 0
1 [ ( ) ]q q d d d fdd
E E X X I ET
In the above equations, , , 0 , D , M , mP , eP , qE , dX , dX , and fdE are respectively the rotor angle, pu-
speed, synchronous angular velocity, attenuation coefficient, constant inertia, mechanical power input to the generator, electrical power generator output, voltage proportional to the flux leakage-driven, unsaturated synchronous reactance axis, unsaturated transient reactance axis d , transient open-circuit time constant of axis d , and circuit voltage of the generator excitation. Equations (1) and (2) show dynamic model of the generator’s mechanical part and equation (3) shows the dynamic model of its electrical parts. It is assumed that the input mechanical power is held constant so that the deviation of the input power from the initial value is negligible compared to other dynamics of the system. According to the equations of the network and the stator, Pe, qI
and dI currents of the output electrical power are
calculated as follows:
(4)
cosq Bd
d e
E VI
X X
(5)
sinBq
q e
VIX X
(6)
2
sin
1 1 sin 22
Be q
d e
B
q e d e
VP EX X
VX X X X
Putting (6) in (2) the dynamic equation is obtained as follows:
(7) 0
(8)
2
1 sin
1 1 sin 22
Bq
d e
mB
q e d e
VD EM M X X
PVM X X X X M
Saied Iranpour et al.

Indian Journal Of Natural Sciences www.tnsroindia.org. © IJONS
Vol.5 / Issue 28/ February 2015 International Bimonthly ISSN: 0976 – 0997
2762
(9)
0
0
1
1 cos
q fd qd
d dq B
d d e
E E ET
X XE V
T X X
In the following, designation of power system stabilizer using adaptive back-stepping method will be discussed. Designing Power System Stabilizer Using Adaptive Back-stepping Method
The primary principle of using adaptive stabilizer is to transform system equations to equations of state; then, control law is designed so that system state variable can be placed near to its first point after an error. Two issues should be considered for deigning a controller. First, to find an adaptive law for uncertain parameters; second, designing a control law with the above condition. Adapt law is designed in such a way to prevent its influence of on the performance of controller. In the dynamic equations of the system (7) to (9), there are uncertain parameters. For example, D (damping coefficient) is a quantity that is not simply measurable; it is regarded as an uncertain part of
the system. eX Reactance of transformers and transmission lines are also uncertain parameters changing constantly due to changes in structure of the system. The value of synchronous reactants is not stable because of its slow changes with time; they may be considered as uncertain points of the system [23]. In this article parameter D is considered as uncertain point of the system and the adaptive controller is designed so that to take into consideration the uncertain points; it is instantaneous applied to the system. For simplicity in calculation, coefficients of dynamic equations obtained in the first part of single machine infinite bus (SMIB) system are considered as following:
1 0
21B
d e
VM X X
2
31 1
2B
q e d e
VM X X X X
(10) 4
0
1 1 d d
d d e
X XT X X
50
d dB
d d e
X XVT X X
6mP
M
0
E
d
KaT
1DM
According to relations (10) and equations (7) to (9), nonlinear system model is expressed by the following relations:
(11)
Saied Iranpour et al.

Indian Journal Of Natural Sciences www.tnsroindia.org. © IJONS
Vol.5 / Issue 28/ February 2015 International Bimonthly ISSN: 0976 – 0997
2763
In order to design the controller, one should first transfer equations the system to the initial balance point. For this purpose, we have:
(12)
In the above equations, , 0 , and qE are respectively angular deviation power, the initial work point, and q -
axis transient voltage deviation from its initial operating point or 0qE .
In order to place system at its initial point after the transient state, input control function in is defined according to the above like equation (13): (13) 0f f fu u u
According to equation (13), the initial values of 0qE and uf 0 is obtained as follows:
(14)
(15) 4 0 5 00
cosqf
Eu
a
By considering the state variables as (16), equation (11) is transformed as follows: (16) 1x ، 2x ، 3 qx E
(17)
Adaptive Back-Stepping Method for the Design of PSS
In the past decades, back-stepping method has been used as a powerful approach in non-linear control system. This method is based on a systematic and recursive design techniques based on linear feedback control. In situations where a model system includes uncertain parameters with a wide extent of the variation, the use of adaptive back-stepping method is good [22]. Back-stepping approach is applicable to equations with the below standard form:
(18)
In the above equations, 1 2 3[ , , ]Tx x x x and vector are system state variables and vector of unknown parameters.
1 , 2 , 3 , 1 , 2 and 3 are certain nonlinear functions and b is Fixed non-controlling interest with known sign.
Saied Iranpour et al.

Indian Journal Of Natural Sciences www.tnsroindia.org. © IJONS
Vol.5 / Issue 28/ February 2015 International Bimonthly ISSN: 0976 – 0997
2764
Equation (17), which is extracted for SMIB system at the start point, is not in mere feedback form because each virtual
control variables in the equations of state has not the same coefficient. For example, coefficient of 2x in the first
equation and the coefficient of 3x in the second equation are 2 1 0sin( )x . For the coefficient to be the same and for back-stepping method to be applicable to power system stabilizer, the equations should be transformed to proper form by two times change.
The First Phase of Variations
In the first stage, variables are defined as follows:
(19)
According to relations (17) and (19), variable in the new form will be as follows:
(20)
Therefore, system state equations become equations (20) with variable first stage shift. In equations (20), 3ax coefficient should be unified to enable researcher to state system equations in form of system feedback of equations (18). this requires another change in variable.
The Second Phase of Variations
In this stage, new x variables are defined in the following form:
(21)
According to relation (21), system state equations in the form of pure feedback to use adaptive back-stepping method will be as follows:
1 2x x
Saied Iranpour et al.

Indian Journal Of Natural Sciences www.tnsroindia.org. © IJONS
Vol.5 / Issue 28/ February 2015 International Bimonthly ISSN: 0976 – 0997
2765
(23)
2 3 2 1 2 0 1 0
1 3 1 0 1 6
sin( )
sin 2( )qx x x E x
x
(24)
1 03 2 3
1 0
4 3 1 2 4 0 1 0
1 2 5 1 0 1 0
cos( )sin( )
sin( )
1 sin( ) cos( )2
y
q
xx au x xx
x E x
x x
Equations (22) to (24) are system state equations in a format acceptable to impose on adaptive back-stepping method.
The number of designing steps for above system is 3 (system level). In each step, error variable of iz , stable function
of i , and regulation function of i (for implementation) are produced. The following steps are performed at each stage of the change of coordinates:
1 1 rz x x (25) ( 1)
1 , 2,3ii i i rz x x i
Where i is virtual controllers; stabilizer design is 0rx . The design process will follow in the following steps:
The first step
The first step begins from equation (22). By considering 2x as virtual control variables, Derivative of 1z tracking error is:
(26) 1 1 2 1 1 1T
rz x x z
Where 1 0 and 1 0T ; thus:
(27) 1 2 1z z And
(28) 1 1 1c z Where 1c is positive interest; ̂ is estimation value of parameter . Lyapunov function is chosen as follows:
(29) 2 1
1 11 12 2
TV z
Where is positive definite matrix. Derivative of the Lyapunov function is:
1
1 1 1ˆTV z z
(30)
11 1 1
11 2 1 1 1
ˆ
ˆ( ) ( )
T
T
V z z
z z
In the above equation, 1 0 because coefficient of in equation (22) is zero. According to relations (28) and (30), the derivative of the Lyapunov function will be as follows:
(31) 2 1
1 1 1 1 2ˆ 0TV c z z z
This relationship proves that the equation of state is stable.
Saied Iranpour et al.

Indian Journal Of Natural Sciences www.tnsroindia.org. © IJONS
Vol.5 / Issue 28/ February 2015 International Bimonthly ISSN: 0976 – 0997
2766
The Second step The second step continues using equations (23) by considering 3x as virtual control variables and dynamic construction of 2z error. The aim of this step is stabilization of ( 1 2,z z ) system.
(32)
2 2 1
13 2 2 2 1 1
1
1 1
13 2 2 2 1
1
1 1 12 1
1
ˆˆ
ˆˆ
r
rr
T
rr
z x x
x xx
xx
z xx
xx x
2 3 2 1 2 0 1 0
1 3 1 0 1 6 1 2 2
sin( )
sin 2( )qz z E x
x c x x
The following 2V Lyapunov function is selected for stabilization:
(33) 22 1 1
12
V V z
Derivative of the Lyapunov function will be as follows:
(34)
22 1 1 2 3 2
1 2 0 1 0 1 3 1 0
11 6 1 2 2 2 2
[sin( ) sin 2( )
ˆ] ( )
q
T
V c z z zE x x
c x x x z
Regulatory function in the second stage is as follows:
(35) 2 2 2x z The rule of virtual control for second stage is as follows:
(36) 2 1 2 0 1 0
1 3 1 0 1 6 1 2 2
sin( )ˆsin 2( )
qE x
x c x x
By choosing control law (36), derivative of the definite Lyapunov function is negative and stability of ( 1 2,z z ) system is proved.
(37) 2 2 12 1 1 2 2 2 3 2
ˆ( )TV c z c z z z
The third step
Ultimate control is achieved in the last step. The last step begins by construction of 3z dynamic error.
Saied Iranpour et al.

Indian Journal Of Natural Sciences www.tnsroindia.org. © IJONS
Vol.5 / Issue 28/ February 2015 International Bimonthly ISSN: 0976 – 0997
2767
(2)3 3 2
1 02 3
1 0
4 3 1 2 4 0 1 0
1 2 5 1 0
2 22 1 3 2
1 2
2 2 23 1 2
1 2
cos( )sin( )
sin( )1 sin 2( )2
ˆˆ
r
q
T
z x xxbv x xx
x E x
x
x xx x
x x
(38)
1 03 2 3 4 3
1 0
1 2 4 0 1 0
1 2 5 1 0
1 2 0 2 1 0
1 3 2 1 0
1 2 2
cos( )sin( )
sin( )1 sin 2( )2
cos( )
2 cos 2( )
ˆ ˆ
q
q
xz bv x x x
xE x
x
E x x
x x
c x x
At last, feedback controller is designed in such a way to reset to zero the variable of third phase error in equation (38). Lyapunov function for the stability of the whole system is as follows:
(39)
2 2 2 23 2 1 2 3
1 2
1 1 12 2 2 2
12 2
T
bV V p z z z
bp
ˆp p p and p̂ are estimation error of controlling interest and value estimation of 1pb
. Derivative of Lyapunov
function is:(40)
2 23 1 1 2 2 2 3
12 3 3
2 2 1 01 1 2 2 3 2 2 3
1 0
4 3 1 2 4 0 1 0 1 2 5 1 0
1 2 0 2 1 0 1 3 2 1 0
1 3 2 1
ˆ ˆ
cos( )sin( )
1sin( ) sin 2( )2
cos( ) 2 cos 2( )
ˆ ˆ
T
q
q
V c z c z z zb
z z pp
xc z c z z bv z x x
x
x E x x
E x x x x
c x x
2 0 1 0
1 3 1 0 1 6 2
12 1 2 3 3
sin( )
ˆsin 2( )
ˆ ˆ ˆ
q
T
E x
x x
bc x z p p bz v
Saied Iranpour et al.

Indian Journal Of Natural Sciences www.tnsroindia.org. © IJONS
Vol.5 / Issue 28/ February 2015 International Bimonthly ISSN: 0976 – 0997
2768
Thus, according to equation (40), the stabilizer function and regulation function are as follows:
(41)
1 03 2 3 4 3
1 0
1 2 4 0 1 0
1 2 5 1 0 1 2 0 2 1 0
1 3 2 1 0
1 3 2 1 2 0 1 0
1 3 1 0 1 6 2
cos( )1ˆ sin( )
sin( )
1 sin 2( ) cos( )2
2 cos 2( )ˆ ˆ sin( )
ˆsin 2( )
q
q
q
x x x xbp x
E x
x E x x
x x
c x x E x
x x
(42) 3 2 1 2 3ˆ( )c x z
By putting relations (41) and (42) in the equation (40), derivative value of Lyapunov function is as follows:
(43)
2 2 23 1 1 2 2 3 3
13 3
ˆ ˆ( ) ( )T
V c z c z c zb
p p bz v
Thus, the main control law will be: (44) ˆv pv Where 3v . Adaptation laws are achieved by the following equation:
(45) 3̂
(46) 3ˆ ( )p sign b vz
and p̂ are fixed positive number and 1pb
estimation. The value of 3 is obtained from the following equation:
(47) 3 2 1 2 3ˆ( )c x z
The implementation of above equations in single machine systems is discussed in the followings.
SIMULATION RESULTS This section evaluates the designed PSS efficiency through extensive simulations using MATLAB / Simulink; the simulation results prove its advantages in comparison with the conventional stabilizers. Figure 1 describes circuit diagram of SMIB system including a synchronous generator, excitation system and AVR with PSS in adaptive back-stepping method. Two scenarios are considered for the behavior of systems that include: 1) Three phase fault at the generator terminal voltage. 2) Increase in the mechanical strength as much as 20% of the initial value. The considered error consists of a three-phase fault placed exactly the generator bus. The first simulation to characterize the effects of three-phase fault on system performance is applied as follows: The system is in normal operation between 0t and 2t seconds. At 2t , a three-phase fault occurs at the terminals of the generator. At 2.18t seconds, three-phase fault is removed and the system is restored.
Saied Iranpour et al.

Indian Journal Of Natural Sciences www.tnsroindia.org. © IJONS
Vol.5 / Issue 28/ February 2015 International Bimonthly ISSN: 0976 – 0997
2769
When an error occurs in the interval between 2 to 2.18 seconds, terminal voltage and active power simultaneously become zero. At the same time, the rotor angle and its proportion velocity begin to increase. In these conditions, the excitation voltage reaches its maximum to increase the terminal voltage and active power. When the fault is removed, the rotor speed decreases and reaches its maximum active power. In these circumstances, control system applies a suitable negative voltage to excitation to prevent backswing and reduction of the first oscillation range. As a result, electrical power and rotor angle decrease. This causes the terminal voltage decrease. After this phase, control system excites zero voltage to action. Therefore, electrical power, terminal voltage, rotor angle and axis speed are driven to reach the steady value before the error. As Figures 4-A and 4-B show, rotor angle and axis speed are reset to the steady value before the error without any backswing in less than 1 second. It is noteworthy that the first oscillation occurs with smaller amplitude. Thus, the designed PSS causes improvement of the transient stability. In conventional PSS, the response time of the system to the disturbance is about 6 seconds. It is remarkable that longer response time may endanger the stability of the power system.One of the major disadvantages of power system stabilizers is their sensitivity to changes in mechanical power that will lead to adverse changes in reactive power. This is more important for the stabilizers using input power as control signal. The second simulation has been carried out to test the effectiveness of system behavior compared to a 20% change in input mechanical power.System is in normal operation mode between 0t and 3t seconds. At
3t seconds, input mechanical power increases 20% and remains at this amount.With increasing mechanical power, generator speed, rotor angle and generator terminal voltage increase. These changes are shown in Figure 5. As seen in Figure 5-A, SMIB system follows a desirable pattern with adaptive back-stepping stabilizer; it reaches a new operation point with no overshoot in less than 0.5 seconds. In the conventional PSS, there is an amplitude fluctuation in such a way that the oscillation is more than 40 degrees. Figure 5-b shows the variation of the rotor speed. The speed increases with an increase in mechanical power; when the mechanical power and electrical power become equal, speed changes become zero. As seen in this figure, the rotor speed returns to its nominal speed without any fluctuations in less than 1 second.
CONCLUSION This article has designed power system stabilizer using adaptive back-stepping method for a single machine non-linear system connected to infinite bus. It is a systematic method based on systematic and backswing design. Moreover, it removes problems of linear techniques and considers uncertain parameters of the system; it establishes asymptotic stability. Adaptive back-stepping approach is divided into three parts in each step: (1) Introducing dynamics of state error and rewriting the equations in the form of error; (2) selecting a suitable Lyapunov function based on the error; (3) selecting stabilizing feedback sentence and regulation function according to Lyapunov function. Due to difficulties in the measurement of damping coefficient, this parameter is considered as an uncertain point; the researcher has also considered the as controller interest an uncertain point to allow the designed controller to have optimal performance during disturbances. Simulation results show that this method increases significantly damping speed of rotor oscillation and load angle; it causes improvement of dynamic stability of the power system.
REFERENCES 1. M.J. Basler and R. C. Schaefer, “Understanding power system stability,” IEEE Trans. Ind. App, vol. 44, no. 2, pp. 463-
474 March/April 2008. 2. P. Kundur, “Power system stability and control,” McGraw-Hill,New York, 1994. 3. P. Kundur, Klein, M. Rogres, G.J., Zywno, M.S. “Application of power system stabilizers for enhancement of
overall system stability,” IEEE Trans. Power Syst., 1989, 4, (2), pp. 614–626.
Saied Iranpour et al.

Indian Journal Of Natural Sciences www.tnsroindia.org. © IJONS
Vol.5 / Issue 28/ February 2015 International Bimonthly ISSN: 0976 – 0997
2770
4. F. P. DeMello, P. J. Nolan, T. F. Laskowski, and J.M.Undrill, “Coordinated application of stabilizers in multi machine power systems,” IEEE Trans. on Power Apparatus and Systems, vol. PAS-99, pp. 892–901, May/June 1980.
5. F.P.Demello, C. Concordia, “Concepts of synchronous machine stability as affected by excitation control,” IEEE Trans. Power App. Syst., 1969, PAS-88, (4), pp. 316–329.
6. S. Chen and O. P. Malik, “H∞ optimization- based power system stabilizer design,” IEE proceedings Part-C, vol. 142, no. 2, March 1995, pp. 179–184.
7. P. Shrikant Rao and I. Sen “Robust pole placement stabilizer design using linear matrix inequalities,” IEEE Trans. Power App. Syst., vol 15 , no.1, February 2000.
8. G.E. Boukarim, S. Wang, J.H. Chow, “A comparison of classical, robust, and decentralized control designs for multiple power system stabilizers,” IEEE Trans. App. Syst., vol. 15, no. 4, November 2000.
9. C. Zhu, M. Khammash, “Robust power system stabilizer design using H loop shaping approach,” IEEE TRANS. App. Power. Syst., vol. 18, no. 2, May 2003.
10. M. Aldeen, F. Crusca “Multimachine power system stabiliser design based on new LQR approach,” Paper 2043 (PI), IEE. 1995.
11. H. Werner, P. Korba, and T. C. Yang “Robust tuning of Power system stabilizers using LMI-techniques,” IEEE Trans. App. Control. Syst., vol. 11, no. 1, January 2003.
12. M.A Abido and Y.L. Abdel-Magid, “Hybridizing rule-based power system stabilizers with genetic algorithms,” IEEE Trans. App. Power Syst., vol. 14, no. 2, May 1999.
13. M. A. Abido “Optimal design of power system stabilizers using particle swarm optimization,” IEEE Trans. App. Energy Convers., vol. 17, no. 3, September 2002.
14. [14] E. Babaei; S. Galvani and M. Ahmadi Jirdehi, “Design of robust power system stabilizer based on PSO,” IEEE Symposium on Industrial Electronics & Applications, ISIEA 2009.
15. Y. Cao, L. Jiang, S. Cheng, D.Chen, O.P. Malik and G.S. Hope, “A nonlinear variable structure stabilizer for power system stability,” IEEE Trans. Energy Convers., 1994, 9, (3), pp. 489–495.
16. A.Ghosh, G. Ledwich, O.P. Malik and G.S. Hope, “Power system stabilizer based on adaptive control techniques,” IEEE Trans. App. Power Syst. Vol. Pas-103, no. 8, August 1984.
17. M.L. Kothari,K. Bhattacharya, J.Nanda, “Adaptive power system stabiliser based on pole-shifting technique,” IEE Proceedings, Generation, Transmission and Distribution, Vol. 143 , Issue: 1, 1996.
18. G. Kenne, R. Goma, H. Nkwowa, F. Lamnabhi-Lagarrigue, A. Arzande, J.C. Vanner, “An improved direct feedback linearization technique for transient stability enhancement and voltage regulation of power generators,” Electr. Power Energy Syst., 2010, 32,pp. 809–816.
19. E. Babaei, S.A.K.H.M. Niapour, M. Tabarraie, “Design of a non-linear power system stabiliser using the concept of the feedback linearisation based on the back-stepping technique,” IET Generation, Transmission & Distribution September 2010.
20. L. SUN, J. ZHAO,“A novel adaptive back-stepping design of turbine main steam valve control,” Control Theory Appl. 2010 vol. 8 (4) 425–428
21. P. M. Anderson and A. A. Fouad, “Power system control and stability,” Ames, Iowa: 1977. 22. I. Kanellakopoulos, M. Krstic and P. Kokotovic, “Nonlinear and adaptive control design,” John Wiley and sons. Inc.
1995. 23. K. Wang; H. Xin, D. Gan and Y. Ni, “Non-linear robust adaptive excitation controller design in power systems
based on a new back-stepping method,” IET Control Theory & Applications, Volume: 4 , Issue: 12, 2010.
Saied Iranpour et al.
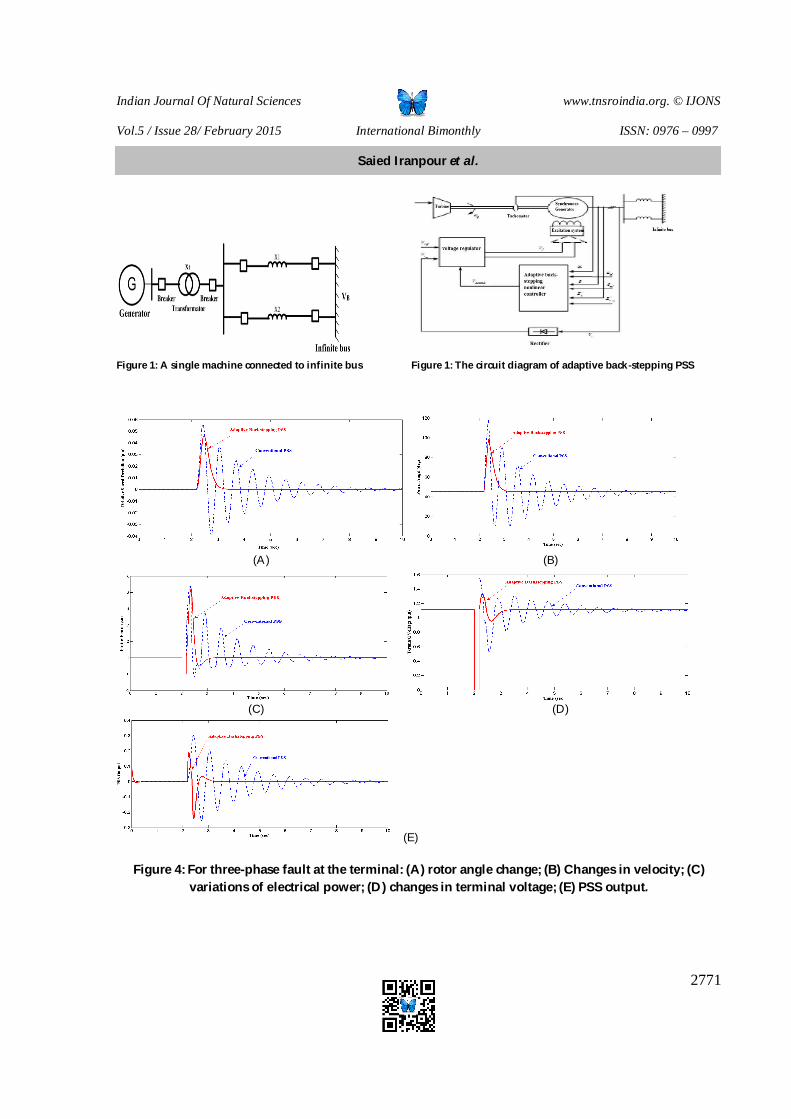
Indian Journal Of Natural Sciences www.tnsroindia.org. © IJONS
Vol.5 / Issue 28/ February 2015 International Bimonthly ISSN: 0976 – 0997
2771
Figure 1: A single machine connected to infinite bus Figure 1: The circuit diagram of adaptive back-stepping PSS
(A) (B)
(C) (D)
(E)
Figure 4: For three-phase fault at the terminal: (A) rotor angle change; (B) Changes in velocity; (C) variations of electrical power; (D) changes in terminal voltage; (E) PSS output.
Saied Iranpour et al.

Indian Journal Of Natural Sciences www.tnsroindia.org. © IJONS
Vol.5 / Issue 28/ February 2015 International Bimonthly ISSN: 0976 – 0997
2772
(A) (B)
(B) (D)
(E)
Figure 5: For 20% of change in mechanical power: (A) rotor angle change; (B) Changes in velocity; (C) variations of electrical power; (D) changes in terminal voltage; (E) PSS output.
Saied Iranpour et al.

Indian Journal Of Natural Sciences www.tnsroindia.org. © IJONS
Vol.5 / Issue 28/ February 2015 International Bimonthly ISSN: 0976 – 0997
2773
Information Behaviour of Orange Growers Concerning Production System Anita Deshmukh1 , D.M.Mankar2,Syed Shakir Ali3 and N.R.Koshti4*
1Extension Education, KVK Sagar (MP) ,India. 2Department of Extension Education, Dr.Panjabrao Deshmukh Krishi Vidyapeeth,Krishinagar, Akola, 3KVK,Baramati,India. 4 Dr.Panjabrao Deshmukh Krishi Vidyapeeth,Krishinagar, Akola (M.S),India. Received: 5 Dec 2014 Revised: 15 Dec 2014 Accepted: 9 Jan 2015 *Address for correspondence Dr.N.R.Koshti Associate Professor, Dr.Panjabrao Deshmukh Krishi Vidyapeeth, Krishinagar, Akola, Maharashtra, India-444004. E.mail: [email protected]
This is an Open Access Journal / article distributed under the terms of the Creative Commons Attribution License (CC BY-NC-ND 3.0) which permits unrestricted use, distribution, and reproduction in any medium, provided the original work is properly cited. All rights reserved. The cultivation of orange in Maharashtra is mostly confined to Vidarbha region. The orange crop plays a vital role within the economy of the region. Among the fruit crops, orange crop covers about 45,226 ha area in Vidarbha. There is still a good potential toward bringing a lot of area below orange in Vidarbha region. The present paper analyses the information behaviour of orange growers concerning production of the oranges. The study was conducted in purposively selected Amravati district of the Vidarbha region of Maharashtra state. Five Panchayat samities from Amravati district were hand-picked purposively covering ten villages from every Panchayat samiti. Thus, total 50 villages and five orange growers from each selected village were selected .250 orange growers constituted the sample size for the present investigation. Study findings indicated that almost all of the orange growers had complete data concerning suggested variety (100.00%), intercropping system (88.80%) and intercrops (87.20%), plants/ha (76.00%), choice of root stock (73.60%), suggested numbers of irrigation (71.60%), interval for irrigation orchards and suggested amount for stopping irrigation before gather of fruits (71.20%).Further it was found that only 23.20 per cent of the orange growers had sufficient information about improved orange cultivation system and this might be one of the reasons for low productivity of oranges in the region. It is suggested that extension agencies should therefore arrange suitable training programmes for improving the knowledge of orange grower’s regarding production system. Key words: Information behaviour, Orange growers, Production
ABSTRACT
RESEARCH ARTICLE

Indian Journal Of Natural Sciences www.tnsroindia.org. © IJONS
Vol.5 / Issue 28/ February 2015 International Bimonthly ISSN: 0976 – 0997
2774
INTRODUCTION The Nagpur mandarin orange (Citrus reticulate Blanco) is one among the foremost important fruit crops of Maharashtra state. It is an excellent natural gift to the Vidarbha region and could be a far-famed for its exceptional quality of fruit within the world. Hence, Nagpur has created its own standing as “Orange City” within the globe. Nagpur mandarin is grown in Vidarbha region of Maharashtra over 1, 46,040 ha area with the production of 5, 97,758 million tons. The cultivation of orange in Maharashtra is mostly confined to Vidarbha region. The orange crop plays a vital role within the economy of the region. Among the fruit crops, orange crop covers about 45,226 ha area in Vidarbha. There is still a good potential toward bringing a lot of area below orange in Vidarbha region. The Amravati & Nagpur districts contribute concerning 80%of the overall area below orange orchards Maharashtra State sharing 48.55% and 31.45% respectively. just in case of production of Oranges in Vidarbha, larger production is in Amravati districts i.e. 37.36% whereas that in Nagpur district is 23.87%.,thus, it is, seen that the oranges created in Amravati district possessed the biggest share of oranges within the Vidarbha orange market [1].The biggest orange cultivation and production is in Warud, Morshi, Chandu Bazar, Achalpur and Anjangaon talukas of Amravati district. Orange from these centers has major contribution in Nagpur orange market. The efforts to increase orange production have been made by central and state government by starting horticulture development programmes. The subsidy on purchase of fertilizers and plant protection chemicals has also made available to the orchards. Despite this, the production of orange per hectare in attributed as non suitability of technology, lack of knowledge, and characteristics of orange growers, price policy and the situational factors. The present study is therefore confined to this region to assess the information behaviour of orange growing especially in production of oranges.
MATERIALS AND METHODS The study was conducted in Amravati district of the Vidarbha region of Maharashtra state was hand-picked purposively attributable to larger area below mandarin orange cultivation within the state. The exploratory research design was used. On the basis of maximum area below mandarin orange cultivation five panchayat samities from Amravati district were hand-picked purposively. Considering the said knowledge Chandur Bazar, Warud, Morshi, Achalpur and Anjangaon from Amravati district were hand-picked and ten villages from every taluka were purposively selected. Taluka Agriculture Officer of the chosen} talukas was contacted and list of 10 villages having a lot of area below orange Mandarin fruits was selected. Thus, total 50 villages were selected from five talukas and five orange growers having more area under orange cultivation was selected thus, total 250 orange growers constituted the sample size for the present study. Construction of interview schedule for assortment of knowledge was the foremost necessary aspects, and therefore the basis for the social analysis. Data were collected by pre-tested structured interview schedule through face to face interviews.
RESULT AND DISCUSSION Information behaviour of orange growers concerning production system
The assembly of oranges for promoting purpose is somewhat completely different than the employment of oranges in native market. Relating to promoting the farmers have to be compelled to see the size, colour, texture and style of the orange fruits and its demand within the involved market wherever to sale it. So the production technology plays a vital role in production and sale oranges commercially. In currently this the variable is taking into account below the study.
The orange growers were asked to state on what extent and the way data concerning suggested cultivation practices of production of orange were received to them and the way it\'s been used. relating to data concerning suggested cultivation practices concerning production of orange, it's seen from Table that almost all of the orange growers had complete data concerning suggested variety (100.00%), intercropping system (88.80%) and intercrops (87.20%), plants/ha (76.00%), choice of root stock (73.60%), suggested numbers of irrigation (71.60%), interval for irrigation
Anita Deshmukh et al.

Indian Journal Of Natural Sciences www.tnsroindia.org. © IJONS
Vol.5 / Issue 28/ February 2015 International Bimonthly ISSN: 0976 – 0997
2775
orchards and suggested amount for stopping irrigation before gather of fruits (71.20%).Then close to concerning the three fourth of the orange growers had information regarding production of orange planting space (68.00%), method of irrigation (64.80%), recommended time for water stress (64.00%), plantation method (62.00%) and major disease (58.00%) of orange. The data unconcealed that over half the orange growers possessed complete information concerning suggested bahar treatment/year (52.80%), propagation technique (47.60%), soil type (46.80%), pest control measure (46.60%) planting seasons (46.00%), and three fourth of the orange growers didn't have complete data concerning production of orange, disease control measure (38.80%) suggested tillage operation at the time of fruiting stage (32.00%), suggested month for Bordeaux mixture (31.20%), suggested hormone use for fruit dropping (30.00%) and really few of the orange growers had less data concerning production of orange, suggested dose for application of Bordeaux mixture (24.00%), applying Bordeaux mixture to trunk from ground level (22.40%), recommended percent of hormone for management of fruit dropping (15.20%), and fertilizers recommendation (8.00%) of orange crop.
As far as data concerning partial information behaviour majority of the orange growers have data concerning fertilizers recommendation (77.60%), size of pits (62.40%), disease control measure (50.00%), hormone use for fruit dropping (47.20%), suggested dose for application of Bordeaux mixture (43.60%), suggested tillage operation at the time of fruiting stage (42.00%), propagation technique (40.80%) and soil type (40.00%) to the information behaviour concerning production system.It was observed that Orange growers have no information concerning the production system of orange crop like suggested percent of hormone for control of fruit dropping (54.40%), suggested month for Bordeaux mixture (48.80%) and applying Bordeaux mixture to trunk from ground level (46.40%).
Regarding information about recommended cultivation production system of orange, it is seen from Table that higher proportion (63.60%) of the orange growers possessed medium level of information about production system. this was followed by slightly more than one fourth (23.20%) of the orange growers who belonged to high category of information about production system. very few (13.20%) were found to be in the low category of information about production system knowing only a few of the practices, by and large, it may be said that the orange growers had moderate level of information about orange cultivation system. The findings about the information about production system were not quite encouraging since only 23.20 per cent of the orange growers had sufficient information about improved orange cultivation system. Inadequate information about the recommended cultivation practices of orange on the part of orange growers may be one of the reasons for low productivity of orange. Majority of orange growers possess information to medium extent (63.60%) whereas 13.20.orange growers observed in low category of information level.
CONCLUSION It might be concluded that only 23.20 per cent of the orange growers had sufficient information about improved orange cultivation system and might be one of the reasons for low productivity of oranges in the region. It is therefore suggested that extension agencies should therefore arrange suitable training programmes for improving the knowledge of orange grower’s regarding production system.
REFERANCE
Anonymous, (2009): www.agri.maha.nic.in.
Anita Deshmukh et al.
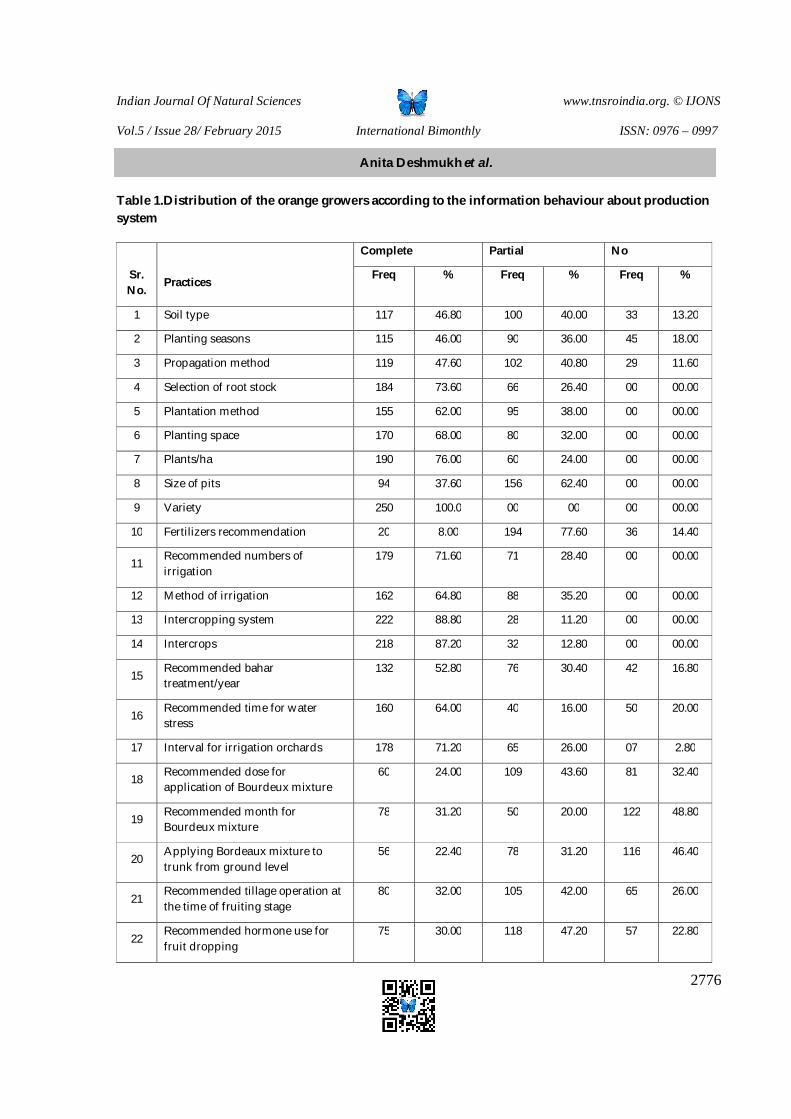
Indian Journal Of Natural Sciences www.tnsroindia.org. © IJONS
Vol.5 / Issue 28/ February 2015 International Bimonthly ISSN: 0976 – 0997
2776
Table 1.Distribution of the orange growers according to the information behaviour about production system
Complete Partial No
Sr. No.
Practices Freq % Freq % Freq %
1 Soil type 117 46.80 100 40.00 33 13.20
2 Planting seasons 115 46.00 90 36.00 45 18.00
3 Propagation method 119 47.60 102 40.80 29 11.60
4 Selection of root stock 184 73.60 66 26.40 00 00.00
5 Plantation method 155 62.00 95 38.00 00 00.00
6 Planting space 170 68.00 80 32.00 00 00.00
7 Plants/ha 190 76.00 60 24.00 00 00.00
8 Size of pits 94 37.60 156 62.40 00 00.00
9 Variety 250 100.0 00 00 00 00.00
10 Fertilizers recommendation 20 8.00 194 77.60 36 14.40
11 Recommended numbers of irrigation
179 71.60 71 28.40 00 00.00
12 Method of irrigation 162 64.80 88 35.20 00 00.00
13 Intercropping system 222 88.80 28 11.20 00 00.00
14 Intercrops 218 87.20 32 12.80 00 00.00
15 Recommended bahar treatment/year
132 52.80 76 30.40 42 16.80
16 Recommended time for water stress
160 64.00 40 16.00 50 20.00
17 Interval for irrigation orchards 178 71.20 65 26.00 07 2.80
18 Recommended dose for application of Bourdeux mixture
60 24.00 109 43.60 81 32.40
19 Recommended month for Bourdeux mixture
78 31.20 50 20.00 122 48.80
20 Applying Bordeaux mixture to trunk from ground level
56 22.40 78 31.20 116 46.40
21 Recommended tillage operation at the time of fruiting stage
80 32.00 105 42.00 65 26.00
22 Recommended hormone use for fruit dropping
75 30.00 118 47.20 57 22.80
Anita Deshmukh et al.

Indian Journal Of Natural Sciences www.tnsroindia.org. © IJONS
Vol.5 / Issue 28/ February 2015 International Bimonthly ISSN: 0976 – 0997
2777
23 Recommended percent of hormone for control of fruit dropping
38 15.20 76 30.40 136 54.40
24 Recommended period for stopping irrigation prior to harvesting of fruit
178 71.20 53 21.20 19 7.60
25 Major disease of orange 145 58.00 56 22.40 49 19.60
26 Disease control measure 97 38.80 125 50.00 28 11.20
27 Pest control measure 109 46.60 60 24.00 81 32.40
Table 2.Distribution of the orange growers as per their information level
Sr.No. Category Respondents (N=250)
Information Production system Frequency Percentage
1 Low ( upto 20) 33 13.20
2 Medium ( 21 to 31) 159 63.60
3 High ( Above 31) 58 23.20
Total 250 100
Mean = 25.56 SD =5.37
Anita Deshmukh et al.

Indian Journal Of Natural Sciences www.tnsroindia.org. © IJONS
Vol.5 / Issue 28/ February 2015 International Bimonthly ISSN: 0976 – 0997
2778
The effect of Dual-Scaled Seismographs in Time History Analysis on Seismic Performance of Concrete Structures Kamran Abubakri Department of Civil Engineering, College of Engineering, Mahabad Branch, Islamic Azad University, Mahabad, Iran. Received: 25 Oct 2014 Revised: 20 Dec 2014 Accepted:26 Jan 2015 *Address for correspondence Kamran Abubakri Department of Civil Engineering, College of Engineering, Mahabad Branch, Islamic Azad University, Mahabad, Iran E.Mial: [email protected]
This is an Open Access Journal / article distributed under the terms of the Creative Commons Attribution License
(CC BY-NC-ND 3.0) which permits unrestricted use, distribution, and reproduction in any medium, provided the original work is properly cited. All rights reserved. Currently, there are a multitude of reasons that many buildings are unable to meet current seismic codes and require to retrofit. However, it is essential to evaluate seismic design of a structure before proceeding to its seismic strengthening. To achieve accurate results in time history analysis requires seismographs which are effectively scaled. On requirement of this method is to select the type of a record and then scale it according to design spectra, for which several methods have been proposed. Generally for dynamic analysis of structures using earthquake records to select a suitable mapping, compatibility with response spectrum is usually emphasized rather than seismic parameters. Therefore, maps are based on strong motion parameters such as peak ground acceleration (PGA), peak ground velocity (PGV) and duration of adaptation with response spectrum. Conventional methods to scale seismographs in time history analysis include 1) frequency domain and 2) time domain. In this way, spectral acceleration values of the selected time history are scaled uniformly up or down, or, primary functions are added or subtracted from the real time history in order to adapt the spectral range of the matching process. This study first evaluates different scaling methods of seismographs in time history analysis; then, it presents a new method for dual scale of different seismic earthquakes and examines the effect of this method compared to other methods on seismic behaviour of concrete frames in results of time history analysis. A method discussed to scale seismographs for time history analysis is to modify seismographs based on two scale factors; in this method, both general scale factor (PGA) and time scale factor are used to scale seismic records in order to compare and evaluate the effect of this method on reduced response of steel frames. Keywords: scaling, seismographs, time history, seismic performance, concrete structure.
RESEARCH ARTICLE
ABSTRACT

Indian Journal Of Natural Sciences www.tnsroindia.org. © IJONS
Vol.5 / Issue 28/ February 2015 International Bimonthly ISSN: 0976 – 0997
2779
INTRODUCTION Currently, there are a multitude of reasons that many buildings are unable to meet current seismic codes and require to retrofit. However, it is essential to evaluate seismic design of a structure before proceeding to its seismic strengthening. Design of seismic resistant structures should both tolerate many deformations under strong earthquakes whereby easily absorb and dissipate energy and have enough resistance and stiffness. Performance-based seismic design of structures have been recently interested by researchers. The main objective of this approach is to design structures with predictable performance in design earthquakes. However, performance of structures in this method is directly influenced by the used loadings, i.e. seismographs or design spectra. Among five conventional performance-based designing methods, including linear static, nonlinear static, spectra and finally linear and nonlinear time history methods, the first three methods directly and two others indirectly are based on the used design spectrum. These design spectra are generally developed for earthquakes with a return period of approximately 500 years and, as described above, form the basis for performance-based design approach. It is important to note that the seismographs used for seismic analysis are consistent with design spectra [1]. The conventional methods for scaling seismographs in time history analyses include 1) frequency domain (where the recorded frequency content of ground motions are made manually in order to adapt to the target design spectrum) and 2) time domain (which limits itself only to make the range of recorded ground motions manually). Accordingly, spectral acceleration values of the selected time history are scaled uniformly up or down, or, primary functions are added to or subtracted from the real time history in order to adapt the spectral range of the matching process [2, 3]. To adopt a proper seismograph, compatibility with response spectrum has been usually emphasized more than seismology parameters. As noted earlier, the time history analysis adopts seismographs based on parameters of severe motions such as PGA, PGV and duration of adaptation with response spectrum; these seismographs are modified by design spectrum of the Code 2800. The method used in Code 2800 is a time domain approach. Scale number of this method depends on resistance, initial stiffness, stiffness deterioration and soil type. However, this scaling method is not able to change frequency content of records and ignores its effect. Describing the above problem, adoption of records, the number of required records and the type of record scaling should be particularly considered for dynamic analysis of structures using seismic records. Accordingly, the present study evaluates different types of seismograph scaling methods in time history analysis and presents a new method for dual scale of different seismic records. Then, this study evaluates the effect of this method on seismic behavior of concrete frames in results of time history analysis. A method discussed to scale seismographs for time history analysis is to modify seismographs based on two scale factors; in this method, both general scale factor (PGA) and time scale factor are used to scale seismic records in order to compare and evaluate the effect of this method on reduced response of steel frames.For comparability of results from time history dynamic analysis by spectral analysis methods, it is essential to modify the considered seismic records. There are different methods to scale seismic records, which are discussed here. Moreover, this study evaluates the effect of scaling on time history analysis of concrete flexural frames. For this purpose: Several seismographs are evaluated from different points; The considered structures are residential with average ductility; The considered structures have concrete flexural frame in 5, 8 and 11 stories; The main objectives of this study is to: Compare the seismic behavior of concrete flexural frames through time history analysis using different methods
of scaling seismographs; Evaluate the reduced response of concrete flexural frames to earthquake by modifying scale of seismographs
through time history analysis;
Kamran Abubakri

Indian Journal Of Natural Sciences www.tnsroindia.org. © IJONS
Vol.5 / Issue 28/ February 2015 International Bimonthly ISSN: 0976 – 0997
2780
Evaluate the effect of modified seismographs through time history analysis using time scale and PGA on improved seismic response of concrete structures.
Literature Review Since the devastating earthquake in Loma Prieta (1989) and Northridge (1994), this fact was made clear that the past procedural methods cannot meet the stringent seismic design of structures. Due to the dynamic nature of earthquake phenomena and discarding parameters such as loading time function, flexibility and damping of constituents in the static methods, therefore, an exact method to evaluate structural behavior during earthquake was dynamic analyses. On the other hand, dynamic analysis, in many cases, was seemingly uneconomic due to the large volume of calculations. This factors encouraged researchers to look for more practical methods and wider use of this type of analysis [1].Instead of procedural methods to adopt 7 seismic records (which are adopted by certain criteria) through time history analysis of structures, Naeim et al (2004) presented a new method and used genetic algorithm technique to search in a space with 1000 records in order to adopt 7 cases of records which both met the procedural criteria on primary records and had the least squares of deviation from the target spectrum [2]. Watson and Norman (2006) limited the time interval of seismographs for scaling the selected records by a suggested procedure which depended on magnitude, distance and type of the seismicity region; then, they found that the procedure caused higher adaptation of response spectrum to the design spectrum [3].Fahjan and Keypour (2007) studied adoption and scale of seismographs through structural analysis for higher adaptation of the results with design spectrum. They conducted analyses on scaling method of seismographs in time and frequency domains. Comparing the results, each of the scaling methods had better results on some structures [4, 5]. Riahi et al (2009) presented a simple method to adopt and scale records on structures and used single degree of freedom (SDOF) frame instead of nonlinear dynamic analysis of shear frame. Their results showed a relatively good adaptation of structural response to the design spectrum [6].Ay and Akkar (2010) studied adoption and scale of natural seismographs by two methods based on parameters of peak acceleration and velocity (PGA and PGV). Their results showed that scaling by PGV and PGA provided better results in shorter and longer periods, respectively [7]. Craifaleano and Sorin (2012) discussed adoption of seismographs and their dual scaling. They used time and domain parameters separately in the scaling. Their studies were conducted on SDOF and MDOF (multiple degree of freedom) structures by dynamic analysis based on European procedural regulations. Their results showed that the range of response spectra adopted in this study based on above methods was not less than 90% procedural elastic response spectrum [8].Shahrozi and Sajhini (2012) used exploratory optimization algorithm to adopt and scale records. Their results showed high adaptation of the design spectrum with average response spectrum of the selected seismic records [9]. Martinez-Rueda (2012) presented two general approached for simultaneous scale of peak domain and time domain of records. The first approach depended on ground motion prediction equations for spectral acceleration. The second approach predicted parameters of ground motion defined in terms of time and frequency using one pair of ground motion prediction method [10].To modify and scale seismographs in order to use in dynamic analyses, Ay and Akkar (2012) presented a procedure to adopt and scale the selected seismic records. They evaluated and compared their suggested model with results obtained from older methods (CSM-based); accordingly, they could estimate structural responses more accurately in the assumed level [11]. Scaling Methods of Seismographs To conduct time history analysis, it is essential to scale seismographs. Some scaling methods include [14, 15]:
Kamran Abubakri

Indian Journal Of Natural Sciences www.tnsroindia.org. © IJONS
Vol.5 / Issue 28/ February 2015 International Bimonthly ISSN: 0976 – 0997
2781
To use arithmetic mean of spectral linear acceleration in the main period for records with 5% damping (Sa(T0)): in this method, all records are scaled to the mean (Sa(T0)). The rate of spectral acceleration is calculated and averaged in the main period of the structure; then, all records are multiplied by factors of which spectral acceleration is identified in the main vibrational period of the structure.
To use arithmetic mean of spectral acceleration in the linear period of the first vibrational model and nonlinear period of the first vibrational model (Sa(T0 - Tμ)) for different records with 5% damping: in this method, all records are scaled to the mean (Sa(T0 - Tμ)). In the range of linear and nonlinear period, the main vibrational mode of the structure is averaged from the spectral acceleration Sa(T0 - Tμ) in each record; then, the mean averages are calculated and scaled to identify the average spectral acceleration ranging from T0 to Tμ in all modified records. The following approximate relation is suggested for estimation of nonlinear period Tμ:
nlin0
y
=1
T T
(1)
where, Tμ denotes the nonlinear period and T0 is the main period, μ is the ductility factor, α is the slope of nonlinear area in the equivalent force-deformation plot resulting from structural analysis, ∆nlin is the peak nonlinear displacement and ∆y is the peak linear displacement. The factor obtained in the first and second methods is the primary factor, by comparing which to the standard spectrum, the secondary factor is obtained. Scaling in time domain: in this method, records are scaled for the best adaptation of elastic response spectrum with standard spectrum in a certain range of period. The procedure is based on minimum difference between elastic spectrum and the standard spectrum. For this purpose, the square difference is calculated between the selected spectrum and an unknown factor γ of the target spectrum. Then, integration is performed in a range of the period and the derivative difference is set to zero to minimize the difference.
2arg
arg
2min 0
A
B
B
A
B
A
T actual t eta aT
Tactual t eta a
T T
Tactuala
T T
Difference S T S T dT
S T S Td Difference
Differenced S T
(2)
where, γ denotes the scale factor, ( )actualaS T is acceleration response spectrum of earthquake records, arg ( )t et
aS T is
the standard acceleration response spectrum; TA and TB denote the scaling period range, which here 00.2AT T and
01.5BT T .
Scaled nonlinear dynamic analysis: in the FEMA 440 guidelines, scaling is conducted to equalize the maximum displacement of center of mass to the target displacement determined by PushOver analysis. In this method, the maximum displacement resulting from earthquake is determined by nonlinear dynamic analysis in the roof level. The target displacement can be determined by nonlinear static analyses and methods provided in FEMA356 and ATC-40 and by modified relations of FEMA440. In fact, a structural model is exposed to a dynamic load (instead of static load) and the lateral load increases until the center of mass reaches the target displacement; therefore, any scaled seismic record indicates a different dynamic loading model.
Kamran Abubakri

Indian Journal Of Natural Sciences www.tnsroindia.org. © IJONS
Vol.5 / Issue 28/ February 2015 International Bimonthly ISSN: 0976 – 0997
2782
Scaling based on the Standard 28000: a. All seismographs are scaled to their maximum value, that is, their maximum acceleration is equal to the
gravitational acceleration g. b. Acceleration response spectrum of each paired seismograph is determined by considering 5% damping. c. Response spectra of each paired seismograph are combined by square root of the sum of the squares (SRSS) and a
single combined spectrum is produced for each pair. d. Combined response spectra of three paired seismographs are averaged and compared in the period ranging from
0.2T to 1.5T to the standard spectrum. Then, scale factor is determined providing that the average values are not <1.4 times the equivalent value in the standard spectrum.
e. The determined scale factor is multiplied by the scaled seismographs scaled in the section a and it is used in the dynamic analysis.
The next section models the behavior of concrete structures with different number of stories under dual-scaled seismographs; then, the assumptions used to design structural models as well as the results from design are provided. Design and Analysis of the Studied Concrete Frames
Static Analysis
Despite multiple variable parameters in an analytic model, it is inevitable to use some constant characteristics in models. These can include story height, spans, materials, and loads etc. which, in many cases, depend on non-structural dimensions such as architectural considerations, materials and land use. By the developed models, this study provides reasonable characteristics according to practical realities of concrete buildings. This study models three 5-, 8- and 11-story concrete structures equipped with average flexural frame. The plan of all structures is considered type, as shown in Figure 1. The site of structures is located in an area with very high risk zoning; accordingly, the baseline acceleration is considered A=0.35 and the land is type II. Resistance of the concrete is considered 250Kg/cm2 and the modelled rebars are type AIII. In conventional concrete buildings, the height of stories range from 2.8 to 3.2m; thus, the height 3.2m is adopted for the models. The spans vary from 4 to 5.5m. Gravitational loadings of the frames are based on the sixth chapter of National Building Regulations. Dead load and live load of the stories as well as live load of the roof (snow) are considered 480, 200 and 150 Kg/cm2, respectively. The seismic loading is based on the Standard 2800. The baseline acceleration and importance factor are considered A=0.35 and I=1, respectively. The structural system of models is the average concrete flexural frame (behavior factor R=7). Table 1 lists structural period T and reflection factor B and other parameters. Design of frames is based on loads from gravitational and seismic loadings. Then, the modelled structures are evaluated by the equivalent static analysis according to the loading guidelines and the Standard 2800. According the Standard 2800, the whip force is imposed on structures with period >0.7s. Therefore, the seismic force is imposed according to the UBC94. It is noteworthy that variables are imposed to apply the whip force calculated by the software, according to the Standard 2800. Accordingly three 5-, 8- and 11-story structures are modelled and designed; Table 2 determines their optimal sections for beams and columns of the stories. Through designing process, those sections are used which are used in real structures with similar number of stories in order to provide more realistic results.
Linear Time History (Dynamic) Analysis
In this method, the structure is analysed under several recorded or simulated seismographs. Seismographs should be equivalent to mechanism of the seismic source, equivalent magnitude of the earthquake, distance from the epicenter to the site, geological and tectonic features and layers of alluvium; their compatibility is provided in any case by design spectrum or maximum earthquake spectrum. Duration of strong ground motion recorded by seismographs
Kamran Abubakri

Indian Journal Of Natural Sciences www.tnsroindia.org. © IJONS
Vol.5 / Issue 28/ February 2015 International Bimonthly ISSN: 0976 – 0997
2783
should be at least 10 seconds, or 3 times the main period of the structure, whichever is greater. The duration of strong ground motion can be determined by validated methods such as cumulative distribution of energy. Forces and deformations, in this way, are determined by assuming elastic behavior. Regular structure with resistant lateral members which are independent in two directions can be analyzed in two dimensions in two independent lines, otherwise the structure must be analyzed in three dimensions.
Adoption of Seismographs and Their Scaling Methods through Linear Dynamic Analysis
As noted earlier, response of time history analysis is highly dependent on characteristics of the used seismographs; minor changes in these seismographs leads large difference in responses. One of the major problems associated with response history analysis is to adopt proper earthquakes. The used seismographs should be related to earthquakes with characteristics (magnitude, distance to fault and soil conditions) similar to the conditions of the design earthquake. Any earthquake has two horizontal and vertical components. In three-dimensional dynamic analysis, both horizontal components of the earthquake should be imposed on the structure, in the way that will be explained in the next section. In this study, 7 pairs of real seismographs are adopted for linear response history analyses.
Alignment of Seismographs According to the Standard 2800, seven pairs of seismographs are used for the dynamic analysis. The following three methods are used for alignment:
Standard 2800
Based on the aforementioned, seismographs used for linear dynamic analyses are shown in table 3. Figure 3 plots the paired seismographs. As the seismographs are adopted, their response spectrum is obtained by the software Seismosignal with 5% damping. Figure 4 shows a sample of calculated spectra.Thus, a single combined spectrum is obtained for each pair of seismographs by SRSS method according to the Standard 2800. The obtained spectra are then averaged. According to the Standard 2800, the obtained average is compared to the product of reflection spectrum multiplied by 1.3 baseline acceleration. As the ASCE guideline shows, the average response spectra of 7 seismographs ranging from 0.2T to 1.5T should be at last 10% more than 1.3 times the product of reflection spectrum multiplied by the baseline acceleration. The Standard 2800 does not consider a value for it and only relies on high value of the average. Figure 5 shows the modifications. According to the Standard 2800, the scale factor is calculated for primary seismographs. Table 4 lists the obtained scale factors.
Combined Scaling (Combination of the Standard 2800 and Dual Scaling)
Another method to calculate scale factor for seismographs is a combination of methods. In this method, the time of seismographs is first normalized and then is multiplied by the scale factor. Then, a spectrum of new seismographs is taken; according to the Standard 2800, it is calculated by comparing the average spectra to the value of scale factor for seismographs. Next steps are as follows: 1. Dividing spectra by PGA in order to normalize them 2. Calculating the value of Tatp of seismographs from response spectrum (Tatp is the time when response spectrum
returns to 1) 3. Obtaining Tatp of the reflection spectrum (B) of the considered soil
4. Obtaining time scale factor by ( ) ( .)/t atp Mean atp accelSF T T
5. Inserting the time scale factor into the time axis of normalized seismographs 6. SRSS and averaging 7. Comparing to the reflection spectra within the considered range and calculating the scale factor By calculating the above factors, they are inserted in the seismographs. By SRSS and comparing average values to the standard spectrum, values of scale factors are calculated for seismographs, as shown in Table 6. By calculating scale
Kamran Abubakri

Indian Journal Of Natural Sciences www.tnsroindia.org. © IJONS
Vol.5 / Issue 28/ February 2015 International Bimonthly ISSN: 0976 – 0997
2784
factors, they are inserted in the seismographs and structures are dynamically analyzed under the scaled seismographs. Values of the calculated forces are as follows.
Dual Scaling
In this method, which is a new method, both acceleration axis and time axis are scaled. Acceleration axis and time axis are scaled based on Housner intensity of seismographs and based on Tatp factor, respectively. This method is used in engineering applications to simplify and facilitate dynamic computation. For dual scaling method, see Martinez’s Analysis of Practical Engineering Applications to Direct Dual-Scaling of Earthquake Motion for Nonlinear History Analysis [14].
Parameters such as type of the fault, distance to the epicenter, type of the site, magnitude of the earthquake influence the earthquake forces acting on the structure. Generally, this method is a general method which can be used for a variety of sites with any seismograph. In the dual-scaling method, as Martinez described, those earthquakes are used which have occurred on normal faults and the structure have been built on rocky sites. By the above descriptions, steps of dual scaling are as follows:
1. Dividing seismographs by PGA to normalize them 2. Calculating the value of Tatp of seismographs from their response spectrum 3. Obtaining Tatp of the reflection spectrum (B) of the considered soil, according to the above relation 4. Obtaining time scale factor 5. Inserting the time scale factor into the time axis of normalized seismographs 6. Calculating the Housner intensity of seismographs (by the software Seismosignal) 7. Averaging the Housner intensities by ./a Mean AccelSF HI HI
8. Calculating the scale factor of intensity 9. Inserting the scale factor of intensity to the acceleration axis, seismographs scaled to the time scale factor 10. SRSS and averaging 11. Comparing to the reflection spectrum within the considered range and calculating scale factor
Table 7 lists the above factors. Figure 6 presents an example of dual scaling for seismograph of Chalan. 12. Therefore, the above factors are inserted in the seismographs; by SRSS and comparing the average values to the standard spectrum, values of the average factor are calculated for seismographs, as described in Table 8. Once all scale factors are calculated by above methods, these factors are inserted in seismographs and structures are exposed to the dynamic analysis. Results of analyses are described as follows. For comparing methods, the values of forces and displacements such as shear, anchor, torsion, displacement and drift of stories are compared. According to the Standard 2800, results from dynamic analysis are multiplied by I/R (here, I=1 and R=7). Thus, raw results from analyses are multiplied by 0.142857 and then plotted.
RESULTS OF ANALYSES FOR CONCRETE FRAMES
Comparison of Shears
Seven seismographs are used in analyses. According to the Standard 2800, the average values of forces and displacements are calculated as the outputs for each story. The shear component is imposed in two directions simultaneously; thus, two components of shear are converted to one shear by SRSS; then, they are used in plots. Figure 7 presents values of shear in the modelled structures. Comparing the above figures, it is obvious that shear values of the three dynamic methods are more than static mode. The modelled structures are regular in plan and their height is 35.2m at maximum. According to the Standard 2800, they can be designed by static method; therefore, the results from static analysis are reasonable for these
Kamran Abubakri

Indian Journal Of Natural Sciences www.tnsroindia.org. © IJONS
Vol.5 / Issue 28/ February 2015 International Bimonthly ISSN: 0976 – 0997
2785
structures. Considering the fact that static analysis resulted in the lowest shear among conducted analyses, the most optimal method of dynamic analysis is a method with the least distance from static analysis. Here, the combined scaling method provided the most optimal results for short structures, while the Standard 2800 and combined method calculated similar shear values for high and average structures (8 and 11 story). However, the Standard 2800 is more reliable, because it is a tested and older method.
Comparison of Torsions
The torsion occurring in any structure is due to the difference in the center of mass and the center of stiffness. Torsion is an additional force which is considered in designs, particularly design of irregular structures. This section compares the torsion resulting from static and dynamic analyses to different scales. Figure 8 shows the plot related to structural torsion. Since the plans are equal, the distance from center of mass and center of stiffness is similar for models. Values of torsion are directly related to values of shears and the distance from center of mass and center of stiffness. It is noteworthy that an accidental torsion (5%) is required in the static analysis for imposing lateral force, which itself increases the values of torsion. As the Figure 8 shows, the same procedure of shear is true for different analytical modes. Obviously, as the height increases, torsion increases and approaches the value of torsion from dynamic analyses. Because torsion results from shear, the values from different analyses are expected to behave similar to the values of shear, which is obvious in figures. As the height increases, the scaling method 2800 and the combined method calculated relatively similar values for torsion.
Comparison of Anchor Figure 9 shows values of anchor obtained from different structures under dynamic analyses by different methods of scaling. When a horizontal force is imposed on the structure, the force produces an anchor in that structure. The main effect of anchor is structural collapse. In some areas, the anchor has been extremely high that has caused structural collapse. Here, values related to anchor are presented. Since the components X and Y of the anchor are two separate components (X axis and Y axis), the largest one is considered for design. For values of anchor, the method of Standard 2800 is a better method for dynamic analysis. Considering the plots of lateral forces, it is clear that values of the forces calculated by dual-scaling are relatively higher than other two methods. As a result, designs using this method eventually provides stronger sections. Therefore, it is better to use this method in highly important structures for higher reliable designs.
Comparison of Displacement
Because simultaneous displacements occur in the X-axis and Y-axis, two above values are combined by SRSS and become one single value. Figure 10 shows the value of displacement.
Comparison of Drifts
Drift is in fact displacement of the ceiling to the story below. The Standard 2800 limits these values. Particularly in designing concrete structures, this variable is considered as an important parameter. Figure 11 shows values of drift for different structures under the considered analyses. Because the software outputs calculate drifts once in the x-axis and again the y-axis, the larger component is selected and inserted in the plots. It is noteworthy that the value strongly depends on the stiffness and the change in members, particularly beams, results in different values. Discarding this, the comparison of plots reveals that the
Kamran Abubakri
Indian Journal Of Natural Sciences www.tnsroindia.org. © IJONS
Vol.5 / Issue 28/ February 2015 International Bimonthly ISSN: 0976 – 0997
2786
values of drift calculated by the method 2800 are nearly static and dual-scaling provides higher values; therefore, it can be reliable to use results of this method.
RESULTS For structures with different, results from dynamic analyses show that values resulting from dual-scaling are higher than other values of analysis and this type of scaling can be reliable. However, it is noteworthy that larger values of forces result in strong section, which may not be cost-effective. Thus, it is better to use this method for highly important structures.By increasing height, the combined method and the method 2800 calculate relatively similar results.By increasing the number of stories, the results from static and dynamic analyses by the Standard 2800 approach together.Values of the forces calculated by the method 2800 are generally lower than two other methods. Considering the fact that the modelled structures are regular and their top height is less than 50m, the results from static analysis can be accepted. Since the results from dynamic analysis by the method 2800 are higher than that, the method 2800 provides more optimal results compared to other two methods.In 8- and 11-story structures, results from method 2800 and combined method are relatively similar; therefore, both methods can be used.For values of anchor, dual-scaling method provided higher and more reliable values.
CONCLUSION In conclusion, the present study achieved higher values of forces calculated by dual-scaling for concrete structures. These values are sometimes 1.7 times the forces calculated by two other methods. According to the Standard 2800, results from dynamic analysis are modified only when they are less than the static analysis. Therefore, better results may be achieved when results from dynamic analysis are closer to the static analysis. Moreover, design may be more optimal by these forces. Thus, the optimal methods are the method 2800 for 5-story structures and both method 2800 and combined method for 8- and 11-story structures.
REFERENCES 1. FEMA-356. (2000), “Pre-Standard and Commentary for the Seismic Rehabilitation of Buildings,” Federal. 2. Naeim, F., Alimoradi A. and Pezeshk S. 2004, ”Selection and scaling of ground motion time histories for structural
design using genetic algorithms”, Earthquake Spectra, Vol. 20 No 2, pp. 413-426. 3. Jennie Watson-Lamprey, Norman Abrahamson, (2006), ”Selection of ground motion time series and limits on
scaling”, Soil dynamics and Earthquake Engineering, 26, pp. 477-482. 4. Y. M-Fahjan, Z. Ozdemir and H. Keypour, 2007, ”Procedures For Real Earthquake Time Histories Scaling and
Application to Fit Iranian Design Spectra”, IIEES, 16 (9), pp. 1264-1283. 5. Fahjan Y.M., Ozdemir Z., Keypour H. Procedures for real earthquake time histories scaling application to fit
Iranian design spectra. 5th International Conference on Seismology and Earthquake Engineering1385. 6. H. T. Riahi, H. E. Estekanchi and A. Vafaei. (2009), Endurance Time Method-Application in Nonlinear Seismic
Analysis Of single Degree Of Freedom System, journal of applied sciencse 9 (10): 1817-1832, (2009), ISSN 1812- 5654
7. B. Ö. Ay & S. Akkar, ”Selecting and Scaling of Real Accelerograms”, 14ECEE, 2010. 8. Iolanda-Gabriela Craifaleano, Ioan Sorin BORCIA, ”Useof Combined Scaling of Real Seismic Records to Obtain
Code-Compliant Sets of Accelerograms, Application For the City of Bucharest”, ConstructII, 2012, 13 (8), Issue 2, pp.38-48.
9. Mohsen Shahrouzi, Mohammad Sazjini, 2012, ”Refind harmony search for optimal scaling and selection of accelerograms”, Scientia Iranica A (2012), 19 (2), pp. 218-224.
Kamran Abubakri

Indian Journal Of Natural Sciences www.tnsroindia.org. © IJONS
Vol.5 / Issue 28/ February 2015 International Bimonthly ISSN: 0976 – 0997
2787
10. J. E., Martinez-Rueda, 2012, ”Analysis of practical engineering approaches to guide the dual scaling of earthquake ground motion for non-linear time-history analysis”, 15WCEE, LISBOA 2012.
11. B. O. Ay and Akkar, 2012, ”Scaling and selection of ground motion records for nonlinear response History Analysis of structures”, 15WSEE, LISBOA 2012.
12. Buratti, N., Stafford, P.J. and Bommer, J.J. (2011). Earthquake accelerogram selection and scaling procedures for estimating the distribution of drift response. Journal of Structural Engineering, 137(3), 345-357.
13. Martinez-Rueda, J.E. (2006b). Proposal of an attenuation relationship of Housner spectrum intensity in Europe, Proceedings of the First European Conference on Earthquake Engineering and Seismology. (CDROM).
14. Martinez-Rueda, J.E. and Vlachos, T. (2010) Instrumental earthquake intensities vs. ductility demand:correlation study using data from Europe and the Middle East. Seventh International Conference on UrbanEarthquake Engineering and Fifth International Conference on Earthquake Engineering. (CDROM).
15. Beyer, K. and Bommer, J.J. ‘‘Selection and scaling of real accelerograms for bi-directional loading: a review of current practice and code provisions’’,Journal of Earthquake Engineering, 11(1), pp. 13–45 (2007).
16. Antoniou, S. and Pinho, R., (2004a), “Advantages and Limitations of Adaptive and Non-Adaptive Forced- Based Pushover procedure,” Journal of Earthquake Engineering, 8 (5), pp 643-661.
17. Foley, C. M., Pezeshk, S., and Alimoradi, A., 2003. State of the art in performance-based design optimization, 2003 Proceedings of the ASCE Structures Congress, Seattle, Washington.
Figure 1: plan of the modelled structures
Kamran Abubakri

Indian Journal Of Natural Sciences www.tnsroindia.org. © IJONS
Vol.5 / Issue 28/ February 2015 International Bimonthly ISSN: 0976 – 0997
2788
c)
b)
a)
Figure 2: a) 5-story structure, b) 8-story structure, c) 12-story structure
Figure 3: paired seismographs used for dynamic analysis
Kamran Abubakri

Indian Journal Of Natural Sciences www.tnsroindia.org. © IJONS
Vol.5 / Issue 28/ February 2015 International Bimonthly ISSN: 0976 – 0997
2789
Figure 4: an example of calculated seismograph spectrum
Figure 5: average response spectra and the modified standard
Figure 6: scaled and non-scaled seismograph, the horizontal component of Chalan earthquake
Kamran Abubakri

Indian Journal Of Natural Sciences www.tnsroindia.org. © IJONS
Vol.5 / Issue 28/ February 2015 International Bimonthly ISSN: 0976 – 0997
2790
Figure 7: comparison of shears in stories by different methods
Kamran Abubakri

Indian Journal Of Natural Sciences www.tnsroindia.org. © IJONS
Vol.5 / Issue 28/ February 2015 International Bimonthly ISSN: 0976 – 0997
2791
Figure 8: comparison of torsion by different methods
Kamran Abubakri

Indian Journal Of Natural Sciences www.tnsroindia.org. © IJONS
Vol.5 / Issue 28/ February 2015 International Bimonthly ISSN: 0976 – 0997
2792
Figure 9: comparison of anchor by different methods
Kamran Abubakri

Indian Journal Of Natural Sciences www.tnsroindia.org. © IJONS
Vol.5 / Issue 28/ February 2015 International Bimonthly ISSN: 0976 – 0997
2793
Figure 10: comparison of displacements by different methods
Figure 11: comparison of drift by different methods
Kamran Abubakri

Indian Journal Of Natural Sciences www.tnsroindia.org. © IJONS
Vol.5 / Issue 28/ February 2015 International Bimonthly ISSN: 0976 – 0997
2794
MODEL Story Beams5 B40X404 B40X403 B40X502 B40X501 C60-20F20 C50-12F18 B40X508 B40X407 B40X406 C40-12F18 C40-16F18 B40X405 C40-12F18 C50-12F18 B40X504 B40X503 C50-16F18 C50-12F18 B40X502 C60-20F20 C50-16F18 B40X501 B50X50
11 B40X4010 B40X409 B40X408 C40-12F18 C40-16F18 B40X507 C50-12F18 C50-16F18 B40X506 B40X505 C60-16F18 C50-16F18 B50X504 B50X503 B50X602 B50X601 B50X60C70-20F20
5STORY
8STORY
11STORY
C40-12F18C40-12F18
C50-16F18
C60-16F18C60-16F18C60-20F20
C40-12F18C40-12F18
C50-12F18
C60-20F20C40-12F18
ColumnsC40-12F18C50-12F18C50-12F18C50-12F18
Table 1: seismic characteristics of the analyzed structures
Number of stories Height (m) Period (sec) Reflection factor B behavior factor R Seismic factor C 5 16 0.56 2.31 7 0.1159 8 25.6 0.796 1.83 7 0.0917 11 35.2 1.011 1.56 7 0.0782
Table 2: characteristics of sections of beam and columns in the modelled structures
Table 3: characteristics of the used seismographs Seismograph Time
(sec) PGA (g)
Component Y
Component X
Parkfield 30.32 0.357 0.272 Avaj 32.46 0.431 0.494
Chalan 32.48 0.347 0.431 Tabas 23.8 0.406 0.327
Northridge 39.98 0.514 0.568 Kooshk 32.28 0.394 0.328
Italy 32.74 0.342 0.333
Kamran Abubakri
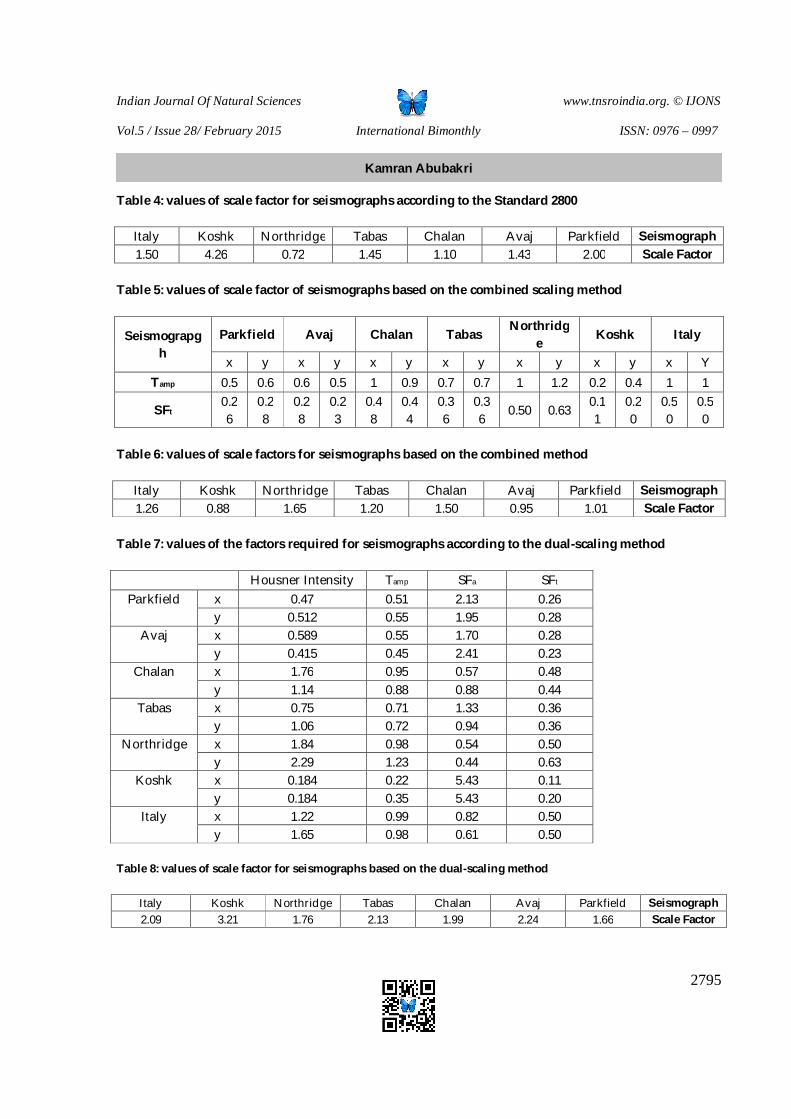
Indian Journal Of Natural Sciences www.tnsroindia.org. © IJONS
Vol.5 / Issue 28/ February 2015 International Bimonthly ISSN: 0976 – 0997
2795
Table 4: values of scale factor for seismographs according to the Standard 2800
Italy Koshk Northridge Tabas Chalan Avaj Parkfield Seismograph 1.50 4.26 0.72 1.45 1.10 1.43 2.00 Scale Factor
Table 5: values of scale factor of seismographs based on the combined scaling method
Seismograpgh
Parkfield Avaj Chalan Tabas Northridg
e Koshk Italy
x y x y x y x y x y x y x Y Tamp 0.5 0.6 0.6 0.5 1 0.9 0.7 0.7 1 1.2 0.2 0.4 1 1
SFt 0.26
0.28
0.28
0.23
0.48
0.44
0.36
0.36
0.50 0.63 0.11
0.20
0.50
0.50
Table 6: values of scale factors for seismographs based on the combined method
Italy Koshk Northridge Tabas Chalan Avaj Parkfield Seismograph 1.26 0.88 1.65 1.20 1.50 0.95 1.01 Scale Factor
Table 7: values of the factors required for seismographs according to the dual-scaling method
Housner Intensity Tamp SFa SFt Parkfield x 0.47 0.51 2.13 0.26
y 0.512 0.55 1.95 0.28 Avaj x 0.589 0.55 1.70 0.28
y 0.415 0.45 2.41 0.23 Chalan x 1.76 0.95 0.57 0.48
y 1.14 0.88 0.88 0.44 Tabas x 0.75 0.71 1.33 0.36
y 1.06 0.72 0.94 0.36 Northridge x 1.84 0.98 0.54 0.50
y 2.29 1.23 0.44 0.63 Koshk x 0.184 0.22 5.43 0.11
y 0.184 0.35 5.43 0.20 Italy x 1.22 0.99 0.82 0.50
y 1.65 0.98 0.61 0.50 Table 8: values of scale factor for seismographs based on the dual-scaling method
Italy Koshk Northridge Tabas Chalan Avaj Parkfield Seismograph 2.09 3.21 1.76 2.13 1.99 2.24 1.66 Scale Factor
Kamran Abubakri

Indian Journal Of Natural Sciences www.tnsroindia.org. © IJONS
Vol.5 / Issue 28/ February 2015 International Bimonthly ISSN: 0976 – 0997
2796
Correlates of Rural Livelihood Status of Dairy Farmers A.A.Dhamdhere, K.U.Bidwe , N.R.Koshti* and K.T.Lahariya
Dr.Panjabrao Deshmukh Krishi Vidyapeeth, Krishinagar, Akola, Maharashtra-444004, India. Received: 12 Dec 2014 Revised: 1 Jan 2015 Accepted: 9 Jan 2015 *Address for correspondence N.R.Koshti, Associate Professor, Dr.Panjabrao Deshmukh Krishi Vidyapeeth, Krishinagar, Akola, Maharashtra-444004, India E.mail: [email protected]
This is an Open Access Journal / article distributed under the terms of the Creative Commons Attribution License (CC BY-NC-ND 3.0) which permits unrestricted use, distribution, and reproduction in any medium, provided the original work is properly cited. All rights reserved. The present study was carried out in distress prone Akola district of Vidarbha region in order to identify the correlates of rural livelihood through dairy farming. The data were collected from 100 randomly selected dairy farmers from 5 villages for year 2008 and 2013. The findings revealed that amongst all the selected independent variables, the important variables found significant and correlated with improvement in rural livelihood through dairy farming were education; family size, land holding, amount received after crop sell number of milch animals, amount received after milk sell were highly significant at 0.01 level of probability . The development departments should therefore consider these factors while undertaking any programme of dairy development in the district so as to improve the rural livelihood status of farmers in general and dairy farmers in particular. Key words: Correlates, Dairy Farmers, Rural Livelihood INTRODUCTION The importance of dairying in our country hardly needs emphasizing. The vast resources (57.3 percent of the world's buffalos and 14.7 percent of its cattle) of livestock in the country play an important role in the national economy as well as in the socio-economic development of millions of rural households. The operation flood programme, which was launched during 1970, organizing dairy farmers' cooperatives in rural areas and linking them with urban consumers created a strong network for procurement, processing, and distribution of milk over a lakh villages in rural India. During the past three decades, milk production in the country has increased from about 21.2 million tons in 1969 to 133 million tons in 2012-13 (Department of Animal Husbandry and Dairying (DAHD), GOI, 2013). The Indian Dairy sector has acquired substantial growth momentum from 9th Plan onwards as a result of which we now rank first among the world’s milk producing nations, achieving an annual output of about 127.9 million tonnes of
ABSTRACT
RESEARCH ARTICLE

Indian Journal Of Natural Sciences www.tnsroindia.org. © IJONS
Vol.5 / Issue 28/ February 2015 International Bimonthly ISSN: 0976 – 0997
2797
milk during 2011-12 compared to 121.8 million tonnes in 2010- 11. This represents sustained growth in the availability of milk and milk products for our growing population. Dairying has become an important secondary source of income for millions of rural families and has assumed the most important role in providing employment and income generating opportunities particularly for marginal and women farmers. Livestock sector provides employment to 20.5 million people and nearly 70 per cent of them are women. Among these, 65 to 70 per cent are small, marginal farmers and land-less labour. Keeping all this in view, the study was undertaken to assess the important attributes of dairy farmers found to be associated with improvement in livelihood status of dairy farmers.
MATERIALS AND METHODS Locale of study The study was conducted in Akola district of Vidarbha region in Maharashtra state. It lies between 200 17’ and 210 18’ North Latitude and 760 17’ and 770 14’ East Latitude. It covers an area of 5417 sq.km accounting for 1.76% of the total area of Maharashtra. Research Design The Exploratory Survey Research design was used for the present study. Selection of villages Five villages from Akola district were selected on the basis of maximum population of milch animals and maximum number of dairy farmers undertaking dairy farming as their main occupation. The villages selected were as follows Selection of respondents and collection of data A list of dairy farmers having milch animals was obtained with the help of Sarpanch and Livestock Development Officer of each village. 20 dairy farmers from each village were selected randomly. The data were collected by personally interviewing the dairy farmers. Measurements of variables The independent variables were quantified by adopting the scoring procedure. An index was developed to find out the percentage change in livelihood status on human capital, physical capital, natural capital, social capital and financial capital due to dairy farming for which sub indices were computed and summed up to arrive at the livelihood index for measurement of dependent variable. The coefficients of correlation (r) were worked out to find out the relationship of selected independent attributes of dairy farmers with their improvement in livelihood status due to dairy farming. The significance of calculated coefficient of correlation (r) was tested against the table value of `r’ at n-2 degree of freedom. The relationship was considered to be significant if the calculated value of `r’ was greater than the Table value of either 0.01 or 0.05 level of probability.
RESULTS AND DISCUSSION The results of co-relational analysis pertaining to present study are given in Table.2 .A closer look at the values of correlation coefficient in Table 2 brings into light that out of 11 attributes, five attributes namely, the age, herd size, dung produced, labourer work and feed and fodder purchased of the dairy farmers’ did not shown any significant relationship with their improvement in livelihood status due to dairy farming, whereas, all the other remaining six
Dhamdhere et al.

Indian Journal Of Natural Sciences www.tnsroindia.org. © IJONS
Vol.5 / Issue 28/ February 2015 International Bimonthly ISSN: 0976 – 0997
2798
attributes have established significant relationship with their improvement in livelihood status due to dairy farming. The perusal of the data presented in Table 2 clearly indicates that attributes of dairy farmers like education, family size, land holding, amount received after crop sell in market, amount received from milk sell and number of milch animals showed positive and significant correlation with livelihood status at 0.01 level of probability. The bird eye view of Table 2 indicates that, in the base year 2008 out of 11 variables education, family size, land holding, amount received after crop sold in market, amount received from milk sell, number milch animals shows positive and significant correlation with overall livelihood status at 0.01 level of probability and variables such as, herd size, showed positive and significant correlation with overall livelihood status at 0.05 level of probability.With respect to age had found non-significantly correlated with livelihood status of dairy farmers in the year2013. The result was similar for the year base year 2008. These findings were in accordance with the findings of [3] it clearly indicates that age is not related with improvement in rural livelihood.With respect to education of dairy farmers there was positive and significant relationship with their livelihood status. Result was similar for the year 2013 and base year 2008. Education broadens the vision of an individual. An educated farmer can acquire the information in scientific management through personal, as well as, cosmopolite sources like extension agencies, mass media. Thus, these factors help an individual to improve his livelihood status. Hence, education was the influencing factor of livelihood status for dairy farmers. These findings are in accordance with the findings of [2].With respect to family size of dairy farmers, there was positive and significant relationship with their livelihood status. Result was similar in the year 2013 and base year 2008. Thus, these factors help an individual to improve his livelihood status. Hence, family size was the influencing factor of livelihood status for dairy farmers. These findings were in accordance with the findings of [3]. With regard to land holding and annual income from crop sell by dairy farmers’ correlation was found positive and established significant relationship with their livelihood status. Results were similar in the year 2013 and base year 2008. Thus, land holding and income was interrelated factors reflecting the livelihood status of an individual. The probable reason for present findings might be that respondent with some size of land holding, could have more opportunities and potentialities to got more income and also there was no required to purchase extra amount of feed and fodder because they can easily be grown on their own field which in turn positive reflects on their livelihood status. Therefore, size of land holding and annual income has showed positive and significant relationship with livelihood status. These findings were similar with the findings of [1].Herd size had found non-significantly correlated with livelihood status in year 2013 but in base year 2008 it showed positive and significant relationship with their livelihood status. The probable reason for present findings might be that, in herd size there was more number of the unproductive animals like calves, bullocks. The rearing of these animals in study year was not profitable because of the fact that the cost on feed and fodder purchased has been increased and also increases in labourer cost as compared to base year 2008. Therefore in year 2013, correlation between herd size and livelihood status might be observed. The finding of year 2013 was in accordance with the findings of [5] .
With regard to number of milking animals, it was found that, it established positive and significant relationship with livelihood status. Result was similar for both the year’s i.e. study year and base year. It could be inferred that as the number of milking animals increases there was increase in the livelihood status of dairy farmers.As regards to amount received from milk sell, findings revealed that as the income from milk sell by the respondents increased, the livelihood status of dairy farmers was also increased. Result was similar in the year 2013 and base year 2008. This might have been happened because the respondents who have more income from milk sell have greater ability to do well and adopted expensive technologies than that of poorer farmers and also they sustained in adverse conditions than that of the poorer farmers. These findings are in line with the findings of [4].In respect to labourer work and feed and fodder purchased, both variables had found non-significantly correlated with livelihood status of dairy farmers. Result was similar for the year 2013 and base year 2008.The probable reason for non-significant relationship may be the higher expenses on these aspects in dairy farming as discussed in above lines
Dhamdhere et al.

Indian Journal Of Natural Sciences www.tnsroindia.org. © IJONS
Vol.5 / Issue 28/ February 2015 International Bimonthly ISSN: 0976 – 0997
2799
CONCLUSION The findings revealed that amongst all the selected independent variables, the important variables found significant and positively correlated with improvement in rural livelihood through dairy farming were education; family size, land holding, amount received after crop produce sell, number of milch animals, amount received after milk sell were highly significant at 0.01 level of probability .
REFERENCES 1. Chaudhari, R. R., 2006. A Study on Entrepreneurial Behaviour of Dairy Farmers. M.Sc. (Agri.) Thesis(Unpub.), Univ. Agric. Sci., Dharwad. 2. Jabina Shaikh 2013., Entrepreneurial Behavior of Dairy Farmers, Department of Extension Education, M.Sc. Agri thesis (Unpub.) Dr.Panjabrao Deshmukh Krishi Vidyapeeth, Akola, 3. Madiwalar A. M ,2012. Assessment of Sustainable Livelihood Status of Farmers’ in Distress Prone Areas, Msc (Agri) Thesis (Unpub.)Dr.PDKV, Akola. 4. Monika Desai. 2009. Contribution of Livestock Production System to Farmers Livelihood in Western Region of Maharashtra. M.Sc. (Agri.) Thesis(Unpub.), Univ. Agric. Sci., Dharwad. 5. Pushpa, P., 2006. A Study on Livestock Production Systems of Rural and Semi-Urban Livestock Owners. M.Sc. (Agri.) Thesis (Unpub.), Univ. Agric. Sci., Dharwad. Table 1. Villages selected for research study
Table 2.Relationship between selected independent variables and rural livelihood status
Sr.No. Variables ‘r’ value
2013 2008
1. Age 0.0592 NS 0.033 NS
2. Education 0.3131** 0.3858**
3. Family size 0.3569** 0.3734**
4. Land holding 0.4701** 0.4299**
5. Amount received after crop sold 0.5807** 0.5609**
6. Herd size 0.1202 NS 0.2358*
7. Number of milch animals 0.3181** 0.3073**
8. Amount received from milk sell 0.3798** 0.3225**
9. Dung produced 0.1600 NS 0. 1736 NS
10. Labourer work 0.2123 NS 0.1910 NS
11. Feed and Fodder purchased -0.0291NS 0.1026 NS * = Significant at 0.05 level of probability * * =Significant at 0.01 level of probability NS = Non significant
Sr.no. Name of Village Dairy Farmers 1 Kanheri Sarap 20 2 Babhulgaon 20 3 Chandur 20 4 Shivapur 20 5 Vijora 20 Total -05 100
Dhamdhere et al.

Indian Journal Of Natural Sciences www.tnsroindia.org. © IJONS
Vol.5 / Issue 28/ February 2015 International Bimonthly ISSN: 0976 – 0997
2800
Comparative Evaluation of Internet Banking and Mobile Banking Channels Based on NEL Model
Ali Akbar Ahmadi , Muhammad Mahmoudi Meymandi and Setareh Mohajeri Khameneh*
Payaam Noor University of Tehran, Information technology (IT) dep., Tehran, Iran.
Received: 24 Dec 2014 Revised: 12 Jan 2015 Accepted:26 Jan 2015
*Address for correspondence Setareh Mohajeri Khameneh Payaam Noor University of Tehran, Information technology (IT) dep., Tehran, Iran. E.Mail:
This is an Open Access Journal / article distributed under the terms of the Creative Commons Attribution License
(CC BY-NC-ND 3.0) which permits unrestricted use, distribution, and reproduction in any medium, provided the original work is properly cited.All rights reserved. Ongoing progress in technologies encourages most banks to adopt with novel ways of communication with their customers so that they can create better status in the minds of customers compared to competitors using various and better channels. While, characteristics and perceptions of the customers regarding some channels influence their perception on some related channels. Current work aims at investigating impact of internet banking characteristics including perceived trust of internet banking, perceived risk of internet banking, perceived ease of use of internet banking and perceived self-efficacy of internet banking on mobile banking characteristics such as perceived usefulness if mobile banking and perceived ease of use of mobile banking which eventually affects intention to use mobile banking. Statistical population includes customers of Tejarat Bank branches which either uses only internet banking or both channels of internet banking and mobile banking. Almost 300 customers were selected using multi-step cluster sampling. Research findings indicate various characteristics of internet banking influence characteristics in intention to use mobile banking in most cases. Keywords: Multiple Distribution Channel, Internet Banking, Mobile Banking, NEL Model. INTRODUCTION Revolution of technological innovations considerably influenced banking industry. This revolution and changes are related to distribution channels of banking services, some of which include: ATM, phone banking, mobile banking and the newest innovation, i.e. internet banking (Laukkanen and Kiviniemi, 2010). Banks currently have found
RESEARCH ARTICLE
ABSTRACT

Indian Journal Of Natural Sciences www.tnsroindia.org. © IJONS
Vol.5 / Issue 28/ February 2015 International Bimonthly ISSN: 0976 – 0997
2801
importance of distinguishing themselves with other financial institutions using novel channels of service distribution, and it leads to development and utilization of new channels to access to the customers by the banks (Laukkanen and Kiviniemi, 2010). Some channels are interrelated and influence each other’s progress path. For banks, which invest highly on development of service delivery channels in order to obtain competitive advantages over other competitors, identification of such influences and impact of strengthening various aspects of a channel on intention to use other channels by the customers seems necessary. Thus, current work aims at investigating impact of internet banking characteristics including perceived trust of internet banking, perceived risk of internet banking, perceived ease of use of internet banking and perceived self-efficacy of internet banking on mobile banking characteristics such as perceived usefulness if mobile banking and perceived ease of use of mobile banking which eventually affects intention to use mobile banking. Theoretical Foundations Marketing is an activity including a collection of institutions and processes for development, coordination, delivery and exchange of items which are valuable for customers, partners, and in wider aspect, for the whole community (American Marketing Association, 2012). The term Customer Value has different meanings. The first meaning of value for customer refers to the value perceived by the customer or the value received by the customer. The second meaning refers to the value for the organization which includes customer value and customer lifelong value (Smith and Colgate, 2007). Distribution: It is one of the marketing mix elements which transfer the product from production place to purchase place in its simplest state. In other words, the main task of distribution management is providing the goods in due time and place for the potential customers. Distribution Channel: It is a collection of dependent organizations and individuals which provides respective good or product for the end customers. Distribution channel connects producer and customers of the goods. Mediators constitute distribution channel elements (Maleki et al., 2011). Physical distribution of products is the major task of distribution channels. Physicial distribution includes transportation, inventory management (storekeeping) and service delivery to customer (Yari et al., 2009). Frazer provides two definitions for multiple distribution channels. According to the first definition, supplier uses more than one channel for supplying its products; that is, supplier classifies customers considering different factors and conditions and uses specific channels for a specific class of customers. Second definition is using more than one channel for each of target customers. That is, supplier may use more than one channel for providing services to the target customers. In other words, several distribution channels are considered to access to one customer (Bashokuh Ajirloo and Alipour, 2012). Coordination in distribution channel seeks for paralleling activities of distribution channel members in achieving optimal results. Coordination in distribution channel mean consistent organization of channel members. Electronic banking includes all electronic channels which are used for customers to access personal accounts and money transfer or paying their accounts. These channels include telephone, internet, cellphone, and digital TV and similar technologies (Yaghubi et al., 2011). Lao (1997) defines internet banking as delivery of banking services through internet network with free access directly to the customers’ home or personal address (Yiu et al., 2007). Electronic business was introduced originally in 1997 by IBM Co. electronic business covers a more general concept than electronic commerce. Electric commerce mostly relies on external relationship of institution or individual, while electronic business refers to both external relationships and internal strategy of the organization includes electronic
Setareh Mohajeri Khameneh et al.

Indian Journal Of Natural Sciences www.tnsroindia.org. © IJONS
Vol.5 / Issue 28/ February 2015 International Bimonthly ISSN: 0976 – 0997
2802
commerce (EC), business intelligence (BI), customer relationship management (CRM), supply chain management (SCM) and enterprise resource planning (ERP). Overall, electronic business is integration of systems, processes, and supply chains and the whole market using principles and technologies related to internet use. Electronic banking includes providing access of customers to banking services using safe media without physical presence. Mobile banking is a form of banking exchanges which occurs through cellphone. This form of banking enables controlling accounts, performing banking operation through credit cards, and being informed of latest exchanges in their accounts (Amin et al., 2007). Review of Literature Related literature is reviewed in this section, which is summarized in Table 1.
METHODOLOGY It is a research of development – applied type, because methods discovered in previous literature in applied ways are utilized and it seeks for acquiring additional knowledge for utilizing this method in a applied special purpose, which is studying domestic Iranian banks and specifically branches of Tejarat Bank. This research study is descriptive type in terms of data collection and path analysis and correlation is used as research design. Data collection methods are library studies and field study through questionnaire. Research Model According to the model proposed in Fig 1, research hypotheses include as follows: H1. Perceived trust in internet banking influences perceived usefulness of mobile banking positively. H2. Perceived risk of internet banking influences perceived usefulness of mobile banking positively. H3. Perceived ease of use of internet banking influences perceived ease of use of mobile banking positively. H4. Perceived effectiveness of internet banking influences perceived ease of use of mobile banking positively. H5. Perceived self-efficacy of internet banking influences perceived ease of use of mobile banking positively. H6. Perceived ease of use of mobile banking influences perceived usefulness of mobile banking positively. H7. Perceived usefulness of mobile banking influences intention to use mobile banking positively. H8. Perceived ease of use of mobile banking influences intention to use mobile banking positively. Statistical Population and Sample Statistical population includes customers of Tejarat Bank branches which either uses only internet banking or both channels of internet banking and mobile banking. Multi-step cluster sampling method was used. Firstly, Tehran City was divided into five districts including north, south, east, west and center. Then, four branches of Tejarat Bank were randomly selected from each district. In the next step, questionnaires were distributed among customers of selected branches who had used internet banking services or had used internet banking and mobile banking simultaneously in Tejarat Bank in Tehran province. Sample size selection is a function if population size, cost, time and facilities of the authors. In addition, experts of path analysis model propose sample sizes as 100 to 200 for this type of research works. In order to ensure adequacy of the sample size in this work, 300 questionnaires were distributed among customers.
Setareh Mohajeri Khameneh et al.

Indian Journal Of Natural Sciences www.tnsroindia.org. © IJONS
Vol.5 / Issue 28/ February 2015 International Bimonthly ISSN: 0976 – 0997
2803
Data Analysis Data analysis procedure in this work includes two steps including structural equation model and factor analysis using LISREL software. Relaiblity and validity of the questionaire items are fristly measured so that it is ensured that items reflect related concepts well. In the next step, research’s structural model is tested through investigation of level and direction of relatinoship between concepts in the model. Content validty method was used to test questionaire valdity, because cotent validty of the questionaire should be confirmed by the experts for initial imlmentation of the questionaire. The questionaires were give to the experts and their ideas were taken to promote validty of the questionaires. Following content validty approval for the research tool, the questionaire was implmented among 35 from the sapmle in order to ensure relbiality of the questionaire. In order to determine reliability, Cronbach's alpha was used. Questionnaires were extracted using questionnaires proposed by Nel (2013). Demographic characteristics of respondents are as follows: 2% were below 20, 41% were 20 – 29, 36% were 30 – 39, 14% were 40 – 49, and 7% were above 50. In terms of gender, 55% were male and 45% were female. In terms of educational level, 3% had high school degree, 20% had high school diploma, 14% had associate degree, 50% had BA degree, 10% had MA degree and 3% had PhD degree. In terms of background of using mobile banking services, 83% used also mobile banking and 17% did not use mobile banking. Confirmatory factor analysis was used in order to determine validity of research constructs. Following determining validity of the measurement tools, identification of relationship between variables using Pearson correlation coefficient is the next step to enter path analysis. Findings obtained from correlation coefficient between research variables are in Table 2. Testing Research Hypotheses Based on Path Analysis Model Results of variables’ direct, indirect, and overall effects coefficients are in Table 3. Testing Research Hypotheses H1 states perceived trust in internet banking influences perceived usefulness of mobile banking positively. Findings in Table 20-4 indicates impact factor of perceived trust in internet banking on perceived usefulness of mobile banking is β = 0.22 which is positive and significant at p < 0.01. Thus, H1 is supported and perceived trust in internet banking has positive impact on perceived usefulness of mobile banking. H2 states perceived risk of internet banking influences perceived usefulness of mobile banking positively. Findings suggest that impact factor of perceived risk of internet banking on perceived usefulness of mobile banking is β = 0.23 which is positive and significant at p < 0.05. Thus, H2 is supported. H3 states Perceived ease of use of internet banking influences perceived ease of use of mobile banking positively. Findings in Table 18-4 indicates impact factor of ease of use of internet banking on perceived usefulness of mobile banking is β = 0.07 which is not significant at p < 0.01. Thus, H3 is rejected and perceived ease of use of internet banking has no significant impact on ease of use of mobile banking. H4 states perceived effectiveness of internet banking influences perceived ease of use of mobile banking positively. Findings in Table 18-4 indicates impact factor of perceived effectiveness of internet banking on ease of use of mobile banking is β = 0.05 which is not significant at p < 0.01. Thus, H4 is not supported and perceived effectiveness of internet banking has no significant impact on perceived ease of use of mobile banking.
Setareh Mohajeri Khameneh et al.

Indian Journal Of Natural Sciences www.tnsroindia.org. © IJONS
Vol.5 / Issue 28/ February 2015 International Bimonthly ISSN: 0976 – 0997
2804
H5 states perceived self-efficacy of internet banking influences perceived ease of use of mobile banking positively. Findings from path analysis (Table 18-4) indicate impact factor of perceived self-efficacy of internet banking on perceived ease of use of internet banking is β = 0.33 which is positive and significant at p < 0.05. Thus, H5 is supported and perceived self-efficacy of internet banking has positive impact on perceived ease of use of internet banking. H6 states perceived ease of use of mobile banking influences perceived usefulness of mobile banking positively. Findings indicate impact factor of perceived ease of use of internet banking on perceived usefulness of mobile banking is β = 0.54 which is positive and significant at p < 0.01. Thus, H6 is supported and perceived ease of use of mobile banking has positive impact on perceived usefulness of mobile banking. H7 states perceived usefulness of mobile banking influences intention to use mobile banking positively. Findings indicate impact factor of perceived usefulness of mobile banking on intention to use mobile banking is β = 0.08 which is not statistically significant at alpha level 0.01. Thus, H7 is rejected. H8 states perceived ease of use of mobile banking influences intention to use mobile banking positively. Findings indicate impact factor of perceived ease of use of mobile banking on intention to use mobile banking is β = 0.78 which is significant at 0.01. Thus, H8 is supported. Fig 2 shows tested model along with values standardized on the paths. Findings indicate path coefficients were mostly significant and had positive impact on each other. Fit indexes obtained for the tested model in Table 4 suggest that index RMSEA in the estimated model is in acceptable level (0.075), and other fit indexes such as CFI, GFI, NFI, NNFI, and AGFI as 0.91, 0.93, 0.90, 0.90, and 0.90, respectively, are in suitable level and these goodness of fit characteristics indicate that research data have good fit with factor structure of the model. Practical Recommendations 1. Role of various variables which directly or indirectly influence intention to use mobile banking was
investigated in this work. Thus, bank managers and authorities are recommended to consider characteristics of their complex considering these variables and act for their improvement, and hence improve service delivery and increase customer satisfaction. Because more attention to service distribution channels leads to improvement in other service distribution channels, which influence each other according to research findings.
2. Findings in the current work showed that various factors regarding internet banking considerably influence perception of customers about mobile banking and their intention to use this channel. Thus, the bank managers and authorities are suggested to provide facilities for improvement of service delivery through internet banking channel and utilize benefits which are created due to customer satisfaction via this channel for the bank. It is because of positive impact on the perception of customers about other banking channels including mobile banking.
3. Research findings indicated users of internet banking consider internet banking and mobile banking as similar channels. hence, their perceptions about risk or trust in internet banking many also influence their perceptions about risk and trust in mobile banking. In order to increase such trust, internet banking system should be reliable. Thus, it is recommended that banking system is carefully maintained and system inactive times are minimized, and it acts as expected in periods of the months which high numbers of users use the system. Also, in order to reduce internet banking risk some actions should be taken including improvement of security features, training users on protecting the password and informing them on security threats.
Setareh Mohajeri Khameneh et al.

Indian Journal Of Natural Sciences www.tnsroindia.org. © IJONS
Vol.5 / Issue 28/ February 2015 International Bimonthly ISSN: 0976 – 0997
2805
Recommendations for Future Works 1. It is recommended comparative evaluation model of multiple channels is implemented also in industries
other than banking, which was explored in this work, and obtained results are compared with the findings in the current research work.
2. Future authors can extend this model and include many other variables such as perceived time saving in internet banking, factors facilitating internet banking, etc., which may have direct or indirect impact on intention to use mobile banking, and retest the model.
3. Considering other service delivery channels in the banks such as physical presence, telephone banking, etc. and exploring influence of these channels on each other is also suggested for future research studies.
Research Limitations
One of the limitations in this work was problems in implementing the questionnaires including: reluctance to answer by some sample members, lack of due accuracy in answering items, and biases which some respondents may have in some items.
Research data were collected through self-reporting tools. Mixing these ideas and perceptions with
biases, thoughts, and judgments may influence accuracy of the research findings.
REFERENCES 1. Bashokuh Ajirloo, M. & Alipour, V. (2012). Role of communication in coordination of multiple distribution
channels in electronic industry. Information Technology Management: Spring, No. 1, pp. 10 – 24. 2. Maleki, M., Nowroozzadeh Thani, A., Alishah, M. & Nemati, R. (2011). Distribution channels and its types
in industrial and consumer products. Indexed in management scientific papers database available at: www.SYSTEM.PARSIBLOG.com
3. Yari, A.R., Moslehi, A. & Musazadeh, N. (2009). Providing a method for determining services distribution channel (case study: a telecommunications company). Journal of Management Studies, Year 20, No. 60.
4. Yaghubi, N.M. & Shakeri, R. (2009). Evaluation of internet banking acceptance based on DTPB developed model. Journal of Administrative Management, Year 9, No. 2 (36).
5. Agarwal R., Rastogi S., Mehrotra A. (2009). "Customers' perspectives regarding e-banking in an emerging economy", Journal of Retailing and Consumer Services, Vol. 16, pp.340–351
6. American Marketing Association. 2012. Definition of marketing [Online]. Available: http://www.marketingpower.com/AboutAMA/Pages/DefinitionofMarketing.aspx[Accessed 15 October 2012].
7. Amin, H., Baba, R. and Muhammad, M. Z. (2007), Universiti Malaysia Sabah. 8. Eriksson K., Kerem K., Nilsson D. (2005). "Customer acceptance of internet banking in Estonia", Journal of
International Journal of Bank Marketing, Vol. 23, No.2, pp.200-216. 9. Hanudin A. (2007). "Internet Banking Adoption among Young Intellectuals", Journal of Internet
Banking and Commerce, Vol. 12, No.3, pp.1-13. 10. Laukkanen, T., Sinkonen, S., Kivijarvi, M. and Laukkanen, P. (2007), “Innovation resistance among mature
consumers” Journal of Consumer Marketing, Vol. 27, No. 7, pp. 419-427. 11. Nel, jacques.2013. Cellphone banking adoption and continuance of use in an internet banking context: a study of
consumers’ cross-channel cognitive evaluations. Philosophiae doctor, stellenbosch university, department of business management,faculty of economic and management sciences,promotor: prof. Christo boshoff, march 2013.
12. Pikkarainen T., Pikkarainen K., Karjaluto H., Pahnila S. (2004). "Consumer acceptance of online banking: an extension of the technology acceptance model", Internet Research, Vol. 14, No.3, pp. 224–235.
Setareh Mohajeri Khameneh et al.
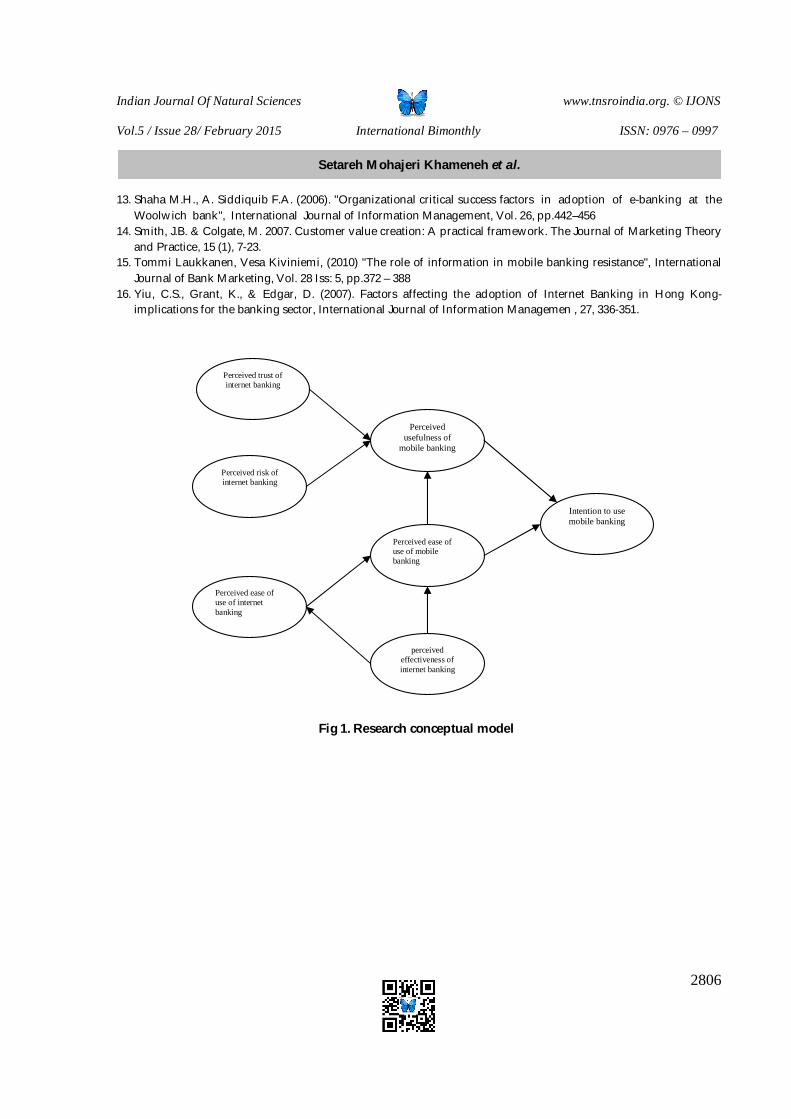
Indian Journal Of Natural Sciences www.tnsroindia.org. © IJONS
Vol.5 / Issue 28/ February 2015 International Bimonthly ISSN: 0976 – 0997
2806
13. Shaha M.H., A. Siddiquib F.A. (2006). "Organizational critical success factors in adoption of e-banking at the Woolwich bank", International Journal of Information Management, Vol. 26, pp.442–456
14. Smith, J.B. & Colgate, M. 2007. Customer value creation: A practical framework. The Journal of Marketing Theory and Practice, 15 (1), 7-23.
15. Tommi Laukkanen, Vesa Kiviniemi, (2010) "The role of information in mobile banking resistance", International Journal of Bank Marketing, Vol. 28 Iss: 5, pp.372 – 388
16. Yiu, C.S., Grant, K., & Edgar, D. (2007). Factors affecting the adoption of Internet Banking in Hong Kong-implications for the banking sector, International Journal of Information Managemen , 27, 336-351.
Fig 1. Research conceptual model
Perceived trust of internet banking
Perceived risk of internet banking
Perceived ease of use of internet banking
Perceived usefulness of
mobile banking
perceived effectiveness of internet banking
Perceived ease of use of mobile banking
Intention to use mobile banking
Setareh Mohajeri Khameneh et al.

Indian Journal Of Natural Sciences www.tnsroindia.org. © IJONS
Vol.5 / Issue 28/ February 2015 International Bimonthly ISSN: 0976 – 0997
2807
Table 1: Review of Literature
Authors Subject Variables / Main Findings Nel (2013) Cellphone
banking adoption & continuance of use in an internet banking context: a study of consumers’ cross-channel cognitive evaluations.
Findings in this work indicate perceived ease of internet banking and saving time positively influence perceived usefulness of mobile banking for usrs of both internet banking and mobile banking channels. On the other hand, only perceived ease of mobile banking influences perceived usefulness by the internet banking customers. The perceived trust and risk of internet only influences perceived usefulness of mobile banking in users who only use internet banking. The positive relationship between perceived ease of use of mobile banking and perceived ease of use of internet banking. Findings also confirm that the conditions facilitating internet banking have a negative impact on perceived usefulness of mobile banking.
Agarwal et al. (2009)
Customers' perspectives regarding e-banking in an emerging economy
Safety and trust are the most important factors in customer satisfaction in use of electronic banking
Hanudin (2007)
Internet Banking Adoption among Young Intellectuals
Usefulness, ease of use and reliability of factors influencing students' intention to use internet banking in Malaysia. The computer self-efficacy significantly influence perceived usefulness and ease of use
Shaha & Siddiquib (2006)
Organizational critical success factors in adoption of e-banking at the Woolwich bank
The most important factors affecting success of e-banking include: understanding of customers, organizational flexibility, resources, safety of systems, having multiple channels, systematic change management, systems integration and support of senior management
Eriksson et al. (2005)
Customer acceptance of internet banking in Estonia", Journal of International Journal of Bank Marketing
Ease of use of internet banking does not influence increased internet banking functions directly, rather ease of use increases usefulness of internet banking and thus affects internet banking through
Pikkarainen et al. (2004)
Consumer acceptance of online banking: an extension of the technology acceptance model
Perceptions about usefulness and information about the online banking are factors influencing adoption of Internet banking
Setareh Mohajeri Khameneh et al.

Indian Journal Of Natural Sciences www.tnsroindia.org. © IJONS
Vol.5 / Issue 28/ February 2015 International Bimonthly ISSN: 0976 – 0997
2808
Table 2: Coefficient of correlation between research variables No. Variables 1 2 3 4 5 6 7
1 Perceived ease of use of Internet Banking
1
2 Perceived usefulness of Mobile Banking
0.12**
1
3 Perceived ease of use of mobile banking
0.08** 0.56** 0
1
4 Intention to use Mobile Banking
0.08** 0.51** 0
0.83** 1
5 Perceived trust in internet banking
0.15** 0.34** 0
0.03** 0
0.05** 1
6 Perceived risk of Internet Banking
0.16** 0.35** 0
0.03** 0
0.05** 0.45** 1
7 Perceived self-efficacy of Internet Banking
0.33** 0.25** 0
0.07** 0
0.07** 0.44** 0
0.50** 0
1
Table 3: Results of direct, indirect and overall effects coefficients Paths Direct effect Indirect
effect Overall effect
To perceived ease of use of internet baking from:
Perceived effectiveness of internet banking
0.33** 0 0.33**
To perceived usefulness of mobile banking from:
Perceived trust in internet baking
0.22** - 0.22**
Perceived risk of internet banking
0.23** - 0.23**
Setareh Mohajeri Khameneh et al.

Indian Journal Of Natural Sciences www.tnsroindia.org. © IJONS
Vol.5 / Issue 28/ February 2015 International Bimonthly ISSN: 0976 – 0997
2809
Paths Direct effect Indirect effect
Overall effect
Perceived self-efficacy of internet banking
- 0.04** 0.04**
Perceived ease of use of internet banking
- 0.04** 0.04**
Perceived ease of use of mobile banking
0.54** - 0.54**
To intention to use mobile banking from:
Perceived trust in internet banking
- 0.02** 0.02**
Perceived risk of internet banking
- 0.02** 0.02**
Perceived self-efficacy of internet banking
- 0.06** 0.06**
Perceived ease of use of internet banking
- 0.06** 0.07**
Perceived ease of use of mobile banking
0.78** 0.04** 0.82**
Perceived usefulness of mobile banking
0.08 0 0.08**
Table 4: Fit characteristics of the fitted model
AGFI NFI NNFI GFI CFI RMSEA x/df
0.90 0.90 0.90 0.93 0.91 0.075 5.59
Setareh Mohajeri Khameneh et al.
Indian Journal Of Natural Sciences www.tnsroindia.org. © IJONS
Vol.5 / Issue 28/ February 2015 International Bimonthly ISSN: 0976 – 0997
2810
Empowerment of Beneficiaries through Mahatma Gandhi National Rural Employment Guarantee Act (MGNREGA) in Eastern Vidarbha
Shubhangi Parshuramkar1 , D.M. Mankar2 , N.R.Koshti3 and Y.B.Shambharkar2
1Agriculture College, Dr.Panjabrao Deshmukh Krishi Vidyapeeth, Nagpur, Maharashtra, India 2Department of Extension Education, Dr.Panjabrao Deshmukh Krishi Vidyapeeth Akola, Maharashtra, India. 3Directorate of Extension Education, Dr.Panjabrao Deshmukh Krishi Vidyapeeth Akola, Maharashtra, India. Received: 5 Dec 2014 Revised: 25 Dec 2014 Accepted: 9 Jan 2015 *Address for correspondence N.R.Koshti, Associate Professor, Dr.Panjabrao Deshmukh Krishi Vidyapeeth, Krishinagar, Akola, Maharashtra-444004, India. E.mail: [email protected].
This is an Open Access Journal / article distributed under the terms of the Creative Commons Attribution License (CC BY-NC-ND 3.0) which permits unrestricted use, distribution, and reproduction in any medium, provided the original work is properly cited. All rights reserved. The present study was undertaken with an objective to assess the empowerment of beneficiaries through the Mahatma Gandhi National Rural Employment Guarantee Act (MGNREGA) in the four districts of eastern Vidarbha region of Maharashtra namely, Bhandara, Gondia, Gadchiroli and Chandrapur. For the study, total thirty two villages were selected and from each selected village, ten beneficiaries were selected randomly constituted a sample size of 320 beneficiaries. The results indicated that there was significant difference in various aspects of empowerment among the beneficiaries after participation in MGNREGA. Before MGNREGA 60.31 per cent respondents could purchase food items of the choice like non vegetarian food and sweets, now 73.43 per cent beneficiaries reported, they could afford to purchase those food items after MGNREGA. Majority of beneficiaries, (98.75%) felt that MGNREGA has provided them an opportunity for economic development. Similarly, 98.12 per cent beneficiaries were operating seasonal bank accounts after participation in MGNREGA, previously only 0.93 per cent had seasonal bank accounts. Before introduction of MGNREGA, only 5.93 per cent beneficiaries were aware about human rights, but after MGNREGA, 40.00 per cent developed the awareness. Similarly, only 5.31 per cent beneficiaries were aware about the legislation for women, but after MGNREGA 27.50 per cent awareness amongst women beneficiaries was developed. It is, evident that the majority of beneficiaries who were in very low category of empowerment had shifted to a higher category of low empowerment. Key words: Beneficiaries, Empowerment, MGNREGA, Vidarbha
ABSTRACT
RESEARCH ARTICLE

Indian Journal Of Natural Sciences www.tnsroindia.org. © IJONS
Vol.5 / Issue 28/ February 2015 International Bimonthly ISSN: 0976 – 0997
2811
INTRODUCTION The Mahatma Gandhi National Rural Employment Guarantee Act (MGNREGA) is an Indian job guarantee scheme, enacted by legislation on 25 August, 2005. The act has become operative in the notified districts from 2nd February 2006 with an objective of enhancing livelihood security of rural households by providing at least 100 days of guaranteed wage employment in every financial year to every household whose adult members volunteer to do unskilled manual work. In Maharashtra state, first phase of MGNREGA started in 12 districts since 2006.These districts were identified as poorest districts of Maharashtra (Source: www.nrega.nic.in). The present study was carried out amongst four districts namely Bhandara, Gondia, Gadchiroli and Chandrapur located in eastern Vidarbha region. The MGNREGA programme in selected districts aims to provide livelihood support for the families of landless labourers, small farmers and those from poor households who have irregular income and are often unable to have enough money to purchase their entire month’s food quota at the fair price shop, all at once. It is therefore necessary to find out the impact of MGNREGA in terms of empowerment of beneficiaries on several indicators of empowerment for better implementation and achieving the objective of scheme.
MATERIALS AND METHODS Locale of the study The study was carried out in eastern Vidarbha region, which comprises the districts namely Bhandara, Gondia, Gadchiroli and Chandrapur. These four districts are well known for paddy growing belt of Vidarbha region. Selection of tahsils The higher number of registered persons since beginning of the scheme was the criterion for selection of the tahsils for the study. The talukas namely 1) Deori, 2) Sadak Arjuni, 3) Lakhandur, 4) Sakoli 5) Nagbhir 6) Brahmapuri 7) Kurkheda 8) Wadsa were observed having more number of registered persons on the job. Hence, these tahsils were selected for the study. Selection of villages From each selected tahsils, four villages were selected for the study based on higher number of beneficiaries under MGNREGA working in a selected village. Thus, total thirty two villages were selected. Selection of beneficiaries The list of beneficiaries who worked under MGNREGA since five years was obtained from Gram Panchayat of the selected villages and from each selected village ten beneficiaries were selected randomly to constitute a sample size of 320 beneficiaries. Extent of impact of MGNREGA on rural livelihood of individual beneficiary was worked out as the differences of rural livelihood between before and after working in MGNREGA by an individual beneficiary. Research Design An exploratory research design was used for the present study.
Shubhangi Parshuramkar et al

Indian Journal Of Natural Sciences www.tnsroindia.org. © IJONS
Vol.5 / Issue 28/ February 2015 International Bimonthly ISSN: 0976 – 0997
2812
Development of data collection instrument Interview schedule was prepared and pre-tested with a great caution so that it becomes perfect as per the objective set for the investigation. Data were collected in face to face situation. The interview with the beneficiaries was conducted at their resident or place with comfort situation. Variables and their measurements A teacher made scale was developed on the lines of scale developed by [5] to measure the extent of empowerment of beneficiaries before and after completion of five years in MGNREGA.
RESULTS AND DISCUSSION Empowerment of beneficiaries through MGNREGA The MGNREGA scheme provided the base for social and economic up-liftment of the beneficiaries and villagers; it directly induces the empowerment of poor’s and deprived sections of the village community. The consequences of guaranteed wage employment and economic support resulted in psychological, cultural, social, economical and political empowerment of beneficiaries Psychological empowerment The feeling of self confidence in social relationships comes with betterment in the economic condition of the individual. The MGNREGA provides gainful employment to the individuals, from economically weaker sections of rural society. The improvement in economic condition, indirectly results in sense of well being among the beneficiaries. The findings regarding psychological empowerment of beneficiaries before and after participation in MGNREGA are presented in the Table 2. . The findings presented in Table 2 indicate that, there was significant difference in psychological empowerment among the beneficiaries before and after participation in MGNREGA, as indicated by the Z value. Comparatively greater percentage of beneficiaries reported, improvement in contacts with relatives and family relations. Similarly, there was improvement in self image and confidence after participation in MGNREGA. [3] also reported improvement in the level of aspiration, self confidence, self reliance and self esteem among the beneficiaries of NREGA in West Bengal. It could be inferred that, the MGNREGA scheme helped to develop the feeling of psychological empowerment among the beneficiaries.
Cultural empowerment The improvement in culture is preceded by economic development of the family. Due to assured employment for 100
days in a year through MGNREGA the family members get some freedom to spend money on the items of their choice which they are otherwise deprived. Most common items of expenditure for cultural activities are food items and clothing. The cultural celebrations like marriages and festivals are incomplete without these items. The cultural empowerment resulting from income generated in the rural families is considered as component of empowerment of the beneficiaries of MGNREGA.
The findings presented in Table 3 indicated that, there was significant difference in cultural empowerment among the beneficiaries before and after participation in MGNREGA, as indicated by the Z value. Comparatively greater percentage of beneficiaries reported improvement in the choice of food items, clothing and liberty to attend marriage
Shubhangi Parshuramkar et al

Indian Journal Of Natural Sciences www.tnsroindia.org. © IJONS
Vol.5 / Issue 28/ February 2015 International Bimonthly ISSN: 0976 – 0997
2813
ceremonies. The beneficiaries of MGNREGA mostly belonged to low income group; they find it difficult to fulfill their basic needs of food, shelter and clothing. After getting assured employment and wages through MGNREGA, they could make some positive changes in their eating and clothing habits. Before MGNREGA 60.31 per cent respondents could purchase food items of the choice like non vegetarian food and sweets, now 73.43 per cent beneficiaries reported that, they could afford, to purchase those food items after MGNREGA. It is evident from the findings MGNREGA had brought about improvement in the cultural empowerment of the beneficiaries. [2] also observed that, almost 70 to 80 per cent of sample of NREGA workers had meaningful income, other than unpaid family work after NREGA. Majority of the workers felt that they were now in better position to fulfill their own requirements without looking at others. Social empowerment The employment generated through MGNREGA and the subsequent increase in the income of beneficiaries is bound to improve the social empowerment among them. The level of socio-economic status also gets elevated as a consequence of improvement in the source of income.The findings presented in Table 4 indicate a significant difference in social empowerment among the beneficiaries before and after participation in MGNREGA, as indicated by the Z value. The beneficiaries reported significant improvement in freedom to work outside the family for wages as working on the family farm mostly remains unpaid. The beneficiaries also reported greater freedom in health care and decisions about family planning. However there was no increase in feeling in social security, involvement in social organization and gaining desired social status among beneficiaries after participation in MGNREGA. The findings indicate that social empowerment was a result of improvement in capacity to fulfill the basic requirements of the family among the beneficiaries. Ramlingam et al (1987) stated that the socio-economic status of both marginal farmers and agricultural labours increase from low to medium status after participation in IRDP. The increase socio –economic status was due to the additional income they derived by the mulch animals, bullock carts etc. which the beneficiaries purchased under IRDP. There was no increase in status among farmers already belonging to high level economic status group. Economic empowerment The empowerment of deprived begins with, their economic development. The prime objective of MGNREGA scheme is to support the livelihood of the economically weaker sections of the rural society by providing them assured and gainful employment, in the form of wages for their manual labour. Thereby enabling them to lead their life in a dignified manner and fulfill the basic requirements of their families. The findings presented in Table 5 indicate a significant difference in economic empowerment among the beneficiaries before and after participation in MGNREGA, as indicated by the Z value. Majority of beneficiaries, (98.75%) felt that MGNREGA has provided them an opportunity for economic development. Similarly, 98.12 per cent beneficiaries were operating seasonal bank accounts after participation in MGNREGA, previously only 0.93 per cent had seasonal bank accounts. Before MGNREGA only 7.81 per cent had the capacity to give presents during marriages etc, where as 52.18 per cent beneficiaries reported of economic capacity to offer the presents to their loved ones. [4] observed that significant changes had taken place among the beneficiaries of MGNREGA, in respect of the socio-economic variables like annual per capita income, monthly per capita food expenditure, annual per child expenditure on education, per capita savings, condition of the dwelling houses, access to healthcare facility and possession of other assets or luxury items for those households. Political empowerment Empowerment of the economically weaker deprived sections of the society, begins with, awareness and ability to voice their opinion through the process of consensual politics and dialogue. The process of political empowerment
Shubhangi Parshuramkar et al

Indian Journal Of Natural Sciences www.tnsroindia.org. © IJONS
Vol.5 / Issue 28/ February 2015 International Bimonthly ISSN: 0976 – 0997
2814
obviously requires, the economic and social empowerment, to begin. The introduction of MGNREGA and the consequential economic and social empowerment of the beneficiaries may initiate the political empowerment among them. It is observed from the findings presented in Table 6 that there was a significant difference in political empowerment among the beneficiaries before and after participation in MGNREGA, as indicated by the Z value. Before introduction of MGNREGA, only 5.93 per cent beneficiaries were aware about human rights but after MGNREGA, 40.00 per cent developed the awareness. Similarly, only 5.31 per cent beneficiaries were aware about the legislation for women, but after MGNREGA 27.50 per cent developed the awareness. However, there was no difference in respect of political participation and awareness about political institutions before and after working in MGNREGA. [1] reported that, MGNREGA had positive impact on employment pattern of women. Women were benefitted both, as individual and community. Women are benefitted individually because, they are able to earn independently, spend money for their own needs and contribute in family expenditure. The benefits gained by women as community could be understood by their increased presence in the Gram sabha, increase in number of women in speaking out in the meeting and increasing capacity of interaction. Empowerment of beneficiaries: The overall empowerment of beneficiaries was considered as cumulative impact of psychological, cultural, social, economical and political empowerment, achieved by providing livelihood support to them, through MGNREGA. It is observed from the findings presented in Table 7 that, there was a significant difference in overall empowerment, among the beneficiaries before and after participation in MGNREGA, as indicated by the Z value. Before introduction of MGNREGA, 74.07 per cent beneficiaries were in the very low empowerment categories while after working in MGNREGA only 06.88 per cent of them were in very low empowerment categories. Majority i. e. 88.44 per cent beneficiaries were in the low empowerment categories after working in MGNREGA. CONCLUSION The findings revealed that majority of beneficiaries under MGNREGA, who were in very low category of empowerment had shifted to a higher category of low empowerment. The feeling of improvement in the, psychological, cultural, social, economical and political empowerment, among the beneficiaries though seems minor but, definitely positive in nature after availment of the benefits of MGNREGA.
REFERENCES
1.Das, D. 2012.Examining India’s Mahatma Gandhi National Rural Employment Guarantee Act: Its impact and women’s participation. International Jour. of Res. in Management. Vol. VI (2): 209 -218. 2.Hazarika, P. G. 2009. Promoting women empowerment and gender equality through the right to decent work: Implementation of NREGP in Assam state (India) : A case study. 3.Roy, S. and B. Singh. 2010. Impact of NREGA on Empowerment of the beneficiaries in West Bengal. Indian Res J. Ext. Edu. 10 (2): 21-24. 4.Sarkar, P., J. Kumar and Supriya . 2011. Impact of MGNREGA on reducing rural roverty and improving socio- economic status of rural Poor: A Study in Burdwan District of West Bengal. Agricultural Economics Research Review. Vol. 24 : 437- 448. 5.Vidya Tayde. 2006. Empowerment of rural women in Marathwada region of Maharashtra state. Ph. D. Thesis (Unpub.), MAU, Parbhani.
Shubhangi Parshuramkar et al
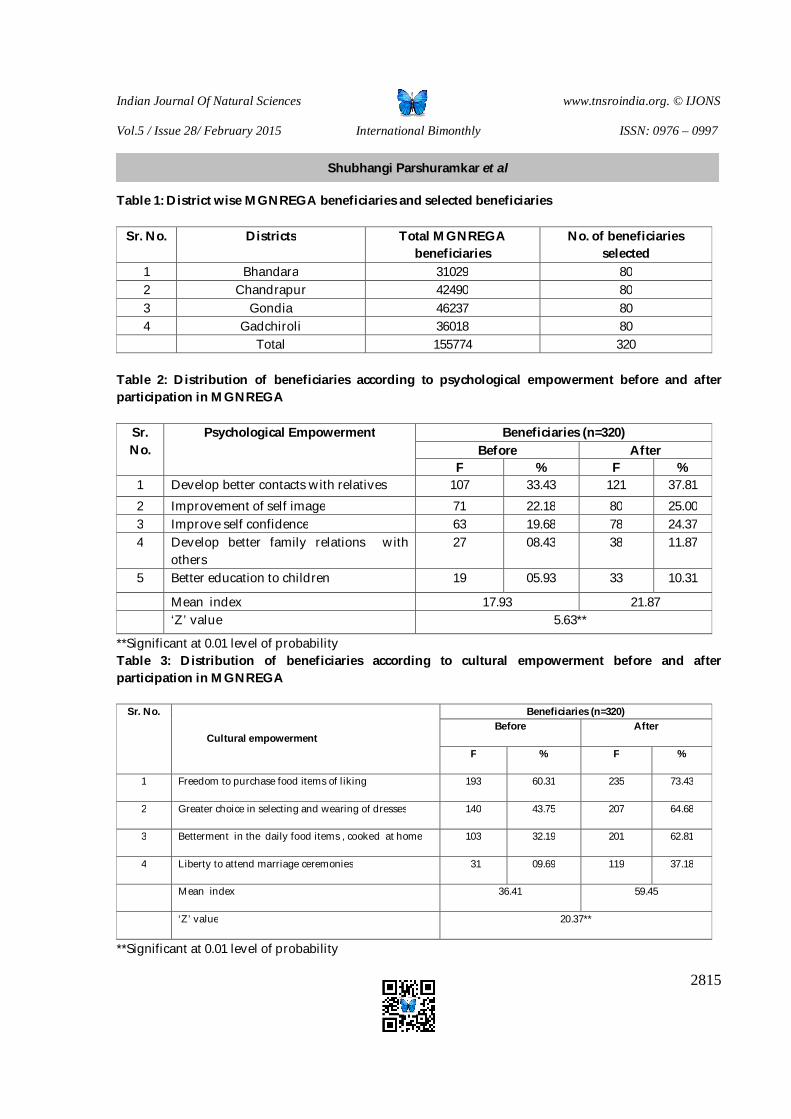
Indian Journal Of Natural Sciences www.tnsroindia.org. © IJONS
Vol.5 / Issue 28/ February 2015 International Bimonthly ISSN: 0976 – 0997
2815
Table 1: District wise MGNREGA beneficiaries and selected beneficiaries
Sr. No. Districts Total MGNREGA beneficiaries
No. of beneficiaries selected
1 Bhandara 31029 80 2 Chandrapur 42490 80 3 Gondia 46237 80 4 Gadchiroli 36018 80 Total 155774 320
Table 2: Distribution of beneficiaries according to psychological empowerment before and after participation in MGNREGA
Sr. No.
Psychological Empowerment Beneficiaries (n=320) Before After
F % F % 1 Develop better contacts with relatives 107 33.43 121 37.81 2 Improvement of self image 71 22.18 80 25.00 3 Improve self confidence 63 19.68 78 24.37 4 Develop better family relations with
others 27 08.43 38 11.87
5 Better education to children 19 05.93 33 10.31
Mean index 17.93 21.87 ‘Z’ value 5.63**
**Significant at 0.01 level of probability Table 3: Distribution of beneficiaries according to cultural empowerment before and after participation in MGNREGA
Sr. No.
Cultural empowerment
Beneficiaries (n=320) Before After
F % F %
1 Freedom to purchase food items of liking 193 60.31 235 73.43
2 Greater choice in selecting and wearing of dresses 140 43.75 207 64.68
3 Betterment in the daily food items , cooked at home 103 32.19 201 62.81
4 Liberty to attend marriage ceremonies 31 09.69 119 37.18
Mean index 36.41 59.45
‘Z’ value 20.37**
**Significant at 0.01 level of probability
Shubhangi Parshuramkar et al

Indian Journal Of Natural Sciences www.tnsroindia.org. © IJONS
Vol.5 / Issue 28/ February 2015 International Bimonthly ISSN: 0976 – 0997
2816
Table 4: Distribution of beneficiaries according to social empowerment before and after participation in MGNREGA
Sr. No.
Social empowerment
Beneficiaries (n=320) Before After
F % F %
1 Freedom to work outside the family for paid work 184 57.50 248 77.50 2 Participation in decision making about family planning 56 17.50 114 35.62 3 Possible to visit Doctor /hospital for health care 54 16.87 135 42.18
4 Possible to adopt practices for maintaining health 49 15.31 110 34.37 5 Participation in decision making about education of children 44 13.75 64 20.00
6 Participation in community action 04 01.25 05 01.56 7 Greater feeling of social security 02 00.62 02 00.62 8 Involvement in social organization 72 22.50 72 22.50 9 Possessing desired social status 07 02.18 07 02.18 Mean index 16.38 25.59
‘Z’ value 10.66** **Significant at 0.01 level of probability Table 5: Distribution of beneficiaries according to economic empowerment before and after participation in MGNREGA Sr. No. Economic empowerment Beneficiaries (n=320)
Before After F % F %
1 Opportunity for economic development 00 00.00 316 98.75 2 Possible to support / start the business 00 00.00 04 01.25 3 Savings in the form of fixed deposit in the bank 01 00.31 16 05.00 4 Operate seasonal account in the bank 03 0.93 314 98.12 5 Thinking of adopting modern technology in farm and
home 06 01.87 06 01.87
6 Thinking about purchase of building/ house 34 10.62 35 10.93 7 Can give presents to relatives during ceremonies/
marriages 25 07.81 167 52.18
Mean index 2.89 33.71 ‘Z’ value 68.15** **Significant at 0.01 level of probability
Shubhangi Parshuramkar et al

Indian Journal Of Natural Sciences www.tnsroindia.org. © IJONS
Vol.5 / Issue 28/ February 2015 International Bimonthly ISSN: 0976 – 0997
2817
Table 6: Distribution of beneficiaries according to political empowerment before and after participation in MGNREGA
Sr. No.
Political empowerment
Beneficiaries (n=320) Before After
F % F %
1 Position in a political party and formal institutions 00 00.00 01 00.31
2 Freedom for participation in active politics 00 00.00 00 00.00
3 Awareness of human rights 19 05.93 128 40.00
4 Awareness of legislation for women 17 05.31 88 27.50
5 Awareness of political institutions 00 00.00 00 00
Mean index 2.25 13.81
‘Z’ value 13.92**
**Significant at 0.01 level of probability
Table 7: Distribution of beneficiaries according to their level of empowerment before and after participation in MGNREGA Sr. No.
Level of Empowerment Before (n=320) After (n=320) Number Percentage Number Percentage
1 Very Low
275
74.07
48
06.88
2 Low 45 25.93 238 88.44 3 Medium
00 00.00 33 04.68
4 High
00 00.00 01 00.00
5 Very High 00 00.00 00 00.00
Mean score 13.91 30.55 ‘Z’ value 42.36**
**Significant at 0.01 level of probability
Shubhangi Parshuramkar et al

Indian Journal Of Natural Sciences www.tnsroindia.org. © IJONS
Vol.5 / Issue 28/ February 2015 International Bimonthly ISSN: 0976 – 0997
2818
Prevalence of Attention Deficit Hyperactivity Disorder 8-12 Year-Old Children and its Relation to Mothers Depression and Anxiety Ghasemnegad S1 and Hydary F2
1Department of Nursing, Islamic Azad University of Lahijan. Lahijan, Iran. 2 Department of Nursing, Guilan University of Medical Sciences. Rasht, Iran. Received:20 Dec 2014 Revised:5 Jan 2015 Accepted: 20 Jan 2015 *Address for correspondence Ghasemnegad S MSc in Nursing, Department of Nursing, Islamic Azad University of Lahijan, Lahijan, Iran.
This is an Open Access Journal / article distributed under the terms of the Creative Commons Attribution License (CC BY-NC-ND 3.0) which permits unrestricted use, distribution, and reproduction in any medium, provided the original work is properly cited.All rights reserved. Attention Deficit Hyperactivity Disorder is a Common Psychiatric Disorder in Children and 3 to 15 Percent School-Aged Children are Suffering. The Goal of this study was assessment frequency of Attention Deficit- Hyperactivity Disorder 8-12 Year-old Children and its Relation to Mothers Depression and Anxiety. Cross-Sectional Study in which 145 children 8-12 Years old, were selected by convenient sampling, and from the Symptoms of ADHD were evaluated based on Parental Information .In this study on The Demographic Questionnaire, Conners Questionnaire, Spillberger Anxiety and Beck Depression was used.The Overall Prevalence of ADHD in this Study was 13/8%.There was significant association between Mothers Depression and Anxiety and Children ADHD and Between ADHD and Sex, Birth, Looking TV. ( p<0/05).According to the Prevalence of ADHD in Children of Mothers with Depression and Anxiety, Attention to the Healthy Family Environment and Helping to Mothers Treatment, Actually Help to Healthy Community Environment. Key words: Attention Deficit- Hyperactivity Disorder, Anxiety, Depression, Communication. INTRODUCTION Attention deficit and hyperactivity disorder (ADHD) is one of the most common psychiatric disorders in school-aged children. This disorder in recent years has deserved much attention from clinical, scientific and public attention (1). It is defined as a consistent pattern of attention deficit disorder or active and impulsive behavior that is more severe than what is usually seen in children of the same age and the same level. The symptoms should have been started before the age of 7 and should also pay attention to deficiency disorder or hyperactivity impulsivity in at least two
RESEARCH ARTICLE
ABSTRACT

Indian Journal Of Natural Sciences www.tnsroindia.org. © IJONS
Vol.5 / Issue 28/ February 2015 International Bimonthly ISSN: 0976 – 0997
2819
areas of the home and school and is disrupted person performance depending on the amount of growth and social and education background. Also the disease should not been created in the context of pervasive developmental disorders, schizophrenia and other psychotic disorders. Or other psychiatric symptoms should be justified (2). According to the studies, different frequencies of ADHD have been reported, for example in Bangkok 6.5%, in Colombia 16.4%, in Tehran 11%, the Gonabad 9% and in Mashhad 15% have been reported. (3) Human being in the last century have been suffered in the vortex of mental disorders due to the consequences of industrialization in different aspects of life, in which anxiety and depression are the most common mental disorders. On the other hand, researchers know deficit disorder and hyperactivity as a child's reaction to the ravages of the family such as alcoholism, anxiety and depression in parents (4). The relationship between parent and child is important in discussing mental health. Because it is so closely related and intertwined that any change in one affects the other. The maternal psychological disorder affects the relationship between mother and her child and the child's behavior affects mother. (5) Parents without mental health have destroying effect on their children's body and spirit (4). Also parents of children with Hyperactivity Disorder - ADHD faced more parental stress because they endure more challenges. The researches show that these parents have more depression disorder (51.7%), stress disorder (41.7%) and feelings of inadequacy in their parenting and lack of consent from their parenting (5). It seems that mental health of parents in these children is less than those with normal children, (6) in fact child characteristics are in direct relationship with parenting characteristics. Parental stress affects their ability to effectively educate the children. The feelings of inefficacy can lead to poor outcomes in children. Therefore, intervention measures and social support leads to promote mental health for parents of children with attention deficit hyperactivity disorder.(5) According to these disorders in children and their serious effects on child's academic performance and personal, early recognition and appropriate help can have invaluable role in preventing or reducing complications(3) and as the mothers of children with attention deficit and hyperactivity, endure more anxiety and stress, attention to the role of mental health of mothers and their effects on children treatment and improvement of family relationship,(5), attention to the disorder and having the knowledge of this disorder in country and determination of programs to inform the parents and school staff and quick and on time recognizing of the disorder are the most priorities of Heath System in every country.(7)
METHODS AND MATERIALS This study was a cross – sectional that was conducted on 8 to 12 year-old children in Gillan. Over 145 children were selected through convenient sampling. Data collection consisted of four questionnaires. Demographic questionnaire included gender, birth rank, mother's education, family size, and looking at the TV. ADHD symptoms were studied based on the parents' information in the Conners questionnaire. The questionnaire were used specially for children and teenagers and parents form consists of 27 items which each item is scored between zero and three based on the scores, the children were divided into two groups of "with ADHD" and "without ADHD". Institute of Cognitive Sciences in Iran, has been translated this questionnaire and validated. Validity was 0.85 and reliability was 0.91. (8) Speilberger anxiety questionnaire was used for maternal anxiety which showed acceptable reliability and Validity. The reliability of the questionnaire in Mahram research was extracted and translated by calculating Cronbach's alpha for Clear Anxiety was 0.91 and for Hidden anxiety was 0.90, and for total test it was 0.94 (9). The questionnaire consists of 40 questions which 20 are about clear anxiety and 20 about hidden anxiety. Each question has four choices with scores between zero and three. Then samples were divided into three groups of mild, moderate or severe Anxiety according to scores of clear or hidden anxiety. Beck Depression Inventory was used to assess maternal depression. The original form of the questionnaire consists of 21 questions and answers are multiple-choice and are scored from zero to three. This test focuses on cognitive content of depression and divided samples into non-depressed and depressed categories based upon depression in three categories: mild, moderate and severe. Beck test have been analyzed psychometrically many times since creation.
Ghasemnegad and Hydary

Indian Journal Of Natural Sciences www.tnsroindia.org. © IJONS
Vol.5 / Issue 28/ February 2015 International Bimonthly ISSN: 0976 – 0997
2820
Efforts to explain the internal consistency have been conducted. Coefficient of internal consistency tests have shown as 0.86. The reliability coefficient for this scale has been 0.86. (5) The information collected and the analysis of data was performed using spss 16. To investigate the relationship between the variables of Fisher Chi Square was used.
RESULTS This study analyzed 145 children which were 78 boys and 67 girls. Overall frequency of ADHD among children were 13.8% that the frequency among boys were higher than girls and there was a statistical relationship with ADHD and sex (p<0.05). Most of the children were at the age of 8-10 (55.1%) and least were among 10-12 years (44.9%). most frequently of the birth order in the family related to the first place (40%) and lowest to the third grade (13.8%) and there was statistically significant relationship between ADHD and birth rank (P <0/05). Educations of mothers of most children were primary school (27.5%) and the lowest percentage of mothers was MA and higher (6.9%). However, there was no significant relationship between ADHD and maternal education. About the family size and looking at the TV, the highest frequency related to family of 3 persons (48.2%) and those with 6 or more hours a day watching television (48.2%) and least frequency related to the 5-person family (6.9%) and those with less than 3 hours of watching TV (24.2%). There was no significant relationship between ADHD and the number of family members but there was significant relationship between ADHD and higher level of watching TV (P<0/05) Table 1. Highest percentage of stress among mothers (48.2%) was in normal rate and the least percentage was (20%) was in severing rate. There was no statistically significant relationship between maternal stress and depression with five studied variables, but there was a statistically significant relationship between ADHD and stress (Table2) and also between ADHD and depression (Table3) (p<0.05).
CONCLUSION In this study the prevalence of attention deficit and hyperactivity disorder was obtained as 13.8% that is close to the prevalence of ADHD among school children with 2-20%. Akhavan Karbassi and colleagues at the Research about the prevalence of ADHD in 6 –year old children of Yazd reported 16.3% (3) which the frequency is close to the frequency of our own research, while in another study that carried out in Zanjan the frequency of ADHD reported as 4.9% (7). Both the researchers reported higher frequency of ADHD among boys which was in line with our findings. While the disorder among boys was 19.5% more than girls 13%, it was not meaningful (3). As Davidson and other studies about relationship between ADHD and sex, unlike the results of our study there was no significant relationship (10 and 7). Maybe one of the causes of this disorder in boys was due to their embolden nature, unlike the delicate nature of girls and more motor activities. Vloet and colleagues in their study that was conducted among children 15-8 years found that there was no significant relationship between ADHD and sex (11). Penick in his research showed that there was a significant relationship between these two (4) and it seems that boys are more to face Attention Deficit and Hyperactivity Disorder than girls. Present study shows that there is a significant relationship between ADHD and birth rank but the results of Akhavan Larbasi et al were not in line with ours (3). Another research in Zanjan about the disorder and child birth rank in family showed no relationship (7), while the research in Arak showed that birth was significantly associated with ADHD (3). Parenting method seems strange in first child because the parent are not familiar with the right methods of training, and the children is most at risk for psychological disorders. Also in this study significant differences between ADHD and mother's education and family size were not found. Other studies in Yazd have also confirmed the results of our research. It has been shown that parental education is not associated with ADHD. In a study in Abhar showed a significant relationship between maternal education and ADHD. Also in another study, the illiteracy
Ghasemnegad and Hydary

Indian Journal Of Natural Sciences www.tnsroindia.org. © IJONS
Vol.5 / Issue 28/ February 2015 International Bimonthly ISSN: 0976 – 0997
2821
or primary education of mother was significantly related with ADHD (3). In a study in Zanjan, like our study, no significant relationship was seen (7). There was a significant relationship between most watching TV and ADHD. It seems that the children with higher hours in front of TV and watching any types of programs alone or along with parents are highly face this kind of disorder. The results of the Penick confirm our results (4). While there was no relationship between stress and depression of mothers with five studied variables, it is clear that there is significant relationship between ADHD of child and maternal stress and also between ADHD of child and maternal depression. It should be noted that children are reflections of parents' life and learn everything under their behaviors, use their patterns in their own life. The results of many studies such as Kashdan et al showed that there was a significant relationship between child ADHD and parents' stress and depression in fact stress and depression of parents has negative effects on children and causes negative load on them and depressed and stressed parents has unsuitable analysis of the environment and conditions and it will have negative effects on personal action and structure and may affect personal power or reactions against children. (12) In a study analyzing the symptoms of stress and depression in mothers with ADHD children and comparison with control group specific results have been determined. Mothers with ADHD children had 20% and10% weak and medium depression, respectively, while in control group, maternal depression is 6.7% for weak depression and 3.3% for medium. There is a significant relationship between depression rate between two groups and mothers with ADHD children had higher levels of depression compared to other group. There is no meaningful relationship between maternal stresses of ADHD children in two groups and generally there is no meaningful relationship between kinds of ADHD of children and maternal depression and stress. The higher the stress of parents is, the more children with ADHD. So the effect of family should not be ignored and attempts should be done for purification and treatment of children and their parents specially mothers to save the negative outcomes since mothers spend more time with children and deserve higher stress and tension.
REFERENCES 1. Russell A, Barkle Y, Fischer M, Smallisn L, Fletcher K. Young Adult Outcome of Hyperactive Children. Journal
of the American of Child & Adolescents Psychiatry.2006; 2(6): 192-202. 2. Sadock BG, Sadock VA. Synopsis of psychiatry (Behavioral science clinical psychiatry). 11edition. Philadelphia:
Loppincott Williams & Wilkins; 2011. 3. Achavankarbacy, Sedigeh. Golestan, Motahareh. Falah, Razieh. Sadrbafogi, Mahdocht. Prevalence of Attention
Deficit- Hyperactivity Disorder 6 Year-Old Children Yazd City.Journal of Yazd University of Medical Sciences.2007; 15(4):29-34. (Persian).
4. Penick J, Defor R, Acsfgh N. Parent anxiety and psychopathology associated with attention-deficit hyperactivity disorder in children. Journal of Psychology.2008; 23(16):287-294.
5. Abdolkarimy, Mandana. Mosavi, Siedvaliollah. Kosha, Maryam. Chosrojavid, Mahnaz. The Effectiveness of Training Behavier Proper management practices in Depression and anxiety Mothers of Children with Attention Deficit Hyperactivity Disorder. Scientific Research Journal of Shahed University. 2012; (6):45-56. (Persian).
6. Rahimzadeh, Sosan. Poratamad, Hamidreza. Samieekarany, Samsam. Assessment of Children Mental Health with Attention Deficit Hyperactivity Disorder and Recommendations Regarding Methods of Intervention Measures. Journal of Iranian Psychologists.2008; 4(16):355-356. (Persian).
7. Shabany, Mina. Yadegary, Amir. Prevalence of Attention Deficit- Hyperactivity Disorder in Primary School Students Zanjan City from 2004-2005. Journal of Zanjan University of Medical Sciences.2005; 13(51):42-48. (Persion).
8. Karahmadi, Mojgan. Esmaili, Homa. Comparative Efficacy of Iranian and Foreign Methylphenidate in Children with Attention Deficit Hyperactivity Disorder. Journal of Knowledge Armaghane. 2008; 13(1):37-44. (Persian).
9. Mahram B. Normalization of Spilberger Anxiety Scale in Mashhad city. [Dissertation]. Mashhad: Mashhad Allameh Tabatabai University; 1994. (Persian).
10. Davidson A. Anesthesia Induction, Emergence, and Postoperative Behaviors in Children with Attention Deficit Hyperactivity Disorders. Pediatric Anesthesia. 2010; 20(9): 323–329.
Ghasemnegad and Hydary
Indian Journal Of Natural Sciences www.tnsroindia.org. © IJONS
Vol.5 / Issue 28/ February 2015 International Bimonthly ISSN: 0976 – 0997
2822
11. Vloet & etal. Impact of Anxiety Disorders on Attentional Functions in Children with ADHD. Journal of Affective Disorders.2010; 8(10):1-8.
12. Kashdan & etal. Depression and Anxiety in Parents of Children with ADHD and Varying Levels of Oppositional Defiant Behaviors: Modeling Relationships with Family Functioning. Journal of Clinical Child and Adolescent Psychology.2004; 33(1):169-181.
13. Soltanifar A; Moharreri F; Soltanifar A. Depressive and Anxiety Symptoms in Mothers of Children with ADHD Compared to the Control Group. Iran J Psychiatry.2009:4(5):112-115.
Table 1: Determining the characteristics of the studied sample units
Number (%) Profile
78)8/53( 67)2/46(
Boy Girl
sex
58)40( 32)1/22( 20)8/13( 35)1/24(
First child Second child Third child Forth child
Birth rank
30)8/20( 40)5/27( 33)8/22(
32)22( 10)9/6(
Illiterate Elementary
diploma BA MA
And higher
Maternal education
70)2/48( 30)7/20(
10)9/6( 35)2/24(
3 persons 4 persons 5 persons
6 persons and higher
Family member
35)2/24( 40)6/27( 70)2/48(
3 hours and less 3-6 hours
6hours and more
Watching TV
Table 2: Relative and frequency distribution of children according to maternal anxiety and ADHD
ADHDA
maternal stress
Rare number (percent)
medium number (percent)
sever number (percent)
all number (percent)
without 18)4/12( 26)9/17( 22)2/15( 66)5/45( with 19)2/13( 29)20( 31)3/21( 79)5/54( all 37)6/25( 55)9/37( 53)5/36( 145)100(
=0/005 P df=2 X2=17/332
Ghasemnegad and Hydary

Indian Journal Of Natural Sciences www.tnsroindia.org. © IJONS
Vol.5 / Issue 28/ February 2015 International Bimonthly ISSN: 0976 – 0997
2823
Table 3: Relative and frequency distribution of children according to maternal depression and ADHD
ADHD
maternal depression
Non-depressed number (percent)
Rare depression
number (percent)
Medium depression
number (percent)
Severe depression
number (percent)
All number (percent)
without 6)2/4( 21)5/14( 19)1/13( 14)6/9( 60)4/41(
with 10)9/6( 16)1/11( 32)22( 27)6/18( 85)6/58( all 16)1/11( 37)6/25( 51)1/35( 41)2/28( 145)100(
=0/005 P df=3 X2=19/768
Ghasemnegad and Hydary

Indian Journal Of Natural Sciences www.tnsroindia.org. © IJONS
Vol.5 / Issue 28/ February 2015 International Bimonthly ISSN: 0976 – 0997
2824
Correlates of Selected Characteristics of Beneficiaries under MGNREGA with Impact on Rural Livelihood Shubhangi Parshuramkar1 , D.M. Mankar2 , N.R.Koshti3 and K.T.Lahariya3
1Agriculture College, Dr.Panjabrao Deshmukh Krishi Vidyapeeth, Nagpur, Maharashtra, India 1Department of Extension Education, Dr.Panjabrao Deshmukh Krishi Vidyapeeth Akola, Maharashtra, India. 3Directorate of Extension Education, Dr.Panjabrao Deshmukh Krishi Vidyapeeth Akola, Maharashtra, India. Received:20 Dec 2014 Revised:10 Jan 2015 Accepted:17 Jan 2015 *Address for correspondence Dr.N.R.Koshti Associate Professor, Dr.Panjabrao Deshmukh Krishi Vidyapeeth, Krishinagar, Akola, Maharashtra-444004, India. E.mail: [email protected].
This is an Open Access Journal / article distributed under the terms of the Creative Commons Attribution License (CC BY-NC-ND 3.0) which permits unrestricted use, distribution, and reproduction in any medium, provided the original work is properly cited. All rights reserved.
The Mahatma Gandhi National Rural Employment Guarantee Act (MGNREGA) is an Indian job guarantee scheme, enacted by legislation on 25 August, 2005. The act has become operative in the notified districts from 2nd February 2006 with an objective of enhancing livelihood security of rural households by providing at least 100 days of guaranteed wage employment in every financial year to every household whose adult members volunteer to do unskilled manual work. The paper analyzes the relationship of the selected characteristics of MGNREGA beneficiaries with their impact on rural livelihood by the MGNREGA in the four districts of eastern Vidarbha region of Maharashtra namely, Bhandara, Gondia, Gadchiroli and Chandrapur.For the study eight tahsils and a sample size of 320 beneficiaries were selected. The results indicated that education had significant impact on rural livelihood and its components viz.physical capital index, natural capital index and financial capital index. The social capital index had negatively significant relationship with education revealing that educated beneficiaries had less social relationships. Education and annual income emerged as key variables producing highly significant relationship with impact on rural livelihood. Key words : MGNREGA, livelihood, physical capital index, natural capital index, financial capital index.
RESEARCH ARTICLE
ABSTRACT

Indian Journal Of Natural Sciences www.tnsroindia.org. © IJONS
Vol.5 / Issue 28/ February 2015 International Bimonthly ISSN: 0976 – 0997
2825
INTRODUCTION
The Mahatma Gandhi National Rural Employment Guarantee Act (MGNREGA) is an Indian job guarantee scheme, enacted by legislation on 25 August, 2005. The act has become operative in the notified districts from 2nd February 2006 with an objective of enhancing livelihood security of rural households by providing a minimum of 100 days of guaranteed wage employment in every financial year to every household whose adult members volunteer to do untrained manual work. “This employment Guarantee Act is the most vital legislation of our times in some ways. For the first time, rural communities are given not simply a development programme, however a regime of rights. This act, will also unlock the potential of the rural poor to contribute to the reconstruction of their setting. The NREGA offers hope to people who had all, but lost their hope. It has a clear focus on the poorest of the poor. It seeks to reach out to those in need of livelihood security. The NREGA offers employment, offers financial gain, offers a living and it offers an opportunity to measure a lifetime of self-esteem and dignity. Considering the importance of act, it felt essential to find out the relationships of various characteristics of beneficiaries under MGNREGA with impact on rural livelihood so as to identify the key variables to put emphasis by the implementing agencies in future.
MATERIALS AND METHODS Locale of the study: The study was carried out in eastern Vidarbha region, which comprises the districts namely Bhandara, Gondia, Gadchiroli and Chandrapur. These four districts are well known for paddy growing belt of Vidarbha region. Selection of tahasil’s: The higher number of registered persons since beginning of the scheme was the criterion for selection of the tahsils for the study. The talukas namely 1) Deori, 2) Sadak Arjuni, 3) Lakhandur, 4) Sakoli 5) Nagbhir 6) Brahmapuri 7) Kurkheda 8) Wadsa were observed having more number of registered persons on the job. Hence, these tahasil’s were selected for the study. Selection of villages: From each selected tahasil’s, four villages were selected for the study based on higher number of beneficiaries under MGNREGA working in a selected village. Thus, total thirty two villages were selected. Selection of beneficiaries: The list of beneficiaries who worked under MGNREGA since five years was obtained from Gram Panchayat of the selected villages and from each selected village ten beneficiaries were selected randomly to constitute a sample size of 320 beneficiaries. Research Design & data collection: An exploratory research design was used for the present study. Interview schedule was prepared and pre-tested. Data were collected in face to face situation. The interview with the beneficiaries was conducted at their resident or place with comfort situation. Assessment of relationship between selected characteristics with impact on rural livelihood: In order to find out the relationship between selected characteristics of beneficiaries with their impact on rural livelihood, Karl Pearson’s Co-efficient of Correlation ‘r’ was worked out. The correlation analysis helps the researcher in determining the relationship of selected characteristics of the respondents with their impact on rural livelihood under MGNREGA.
RESULTS AND DISCUSSION Correlates with impact on rural livelihood: The relationship between selected personal, socio-economic and psychological characteristics of beneficiaries with the Index of impact on rural livelihood (IIRL) was statistically
Shubhangi Parshuramkar et al.

Indian Journal Of Natural Sciences www.tnsroindia.org. © IJONS
Vol.5 / Issue 28/ February 2015 International Bimonthly ISSN: 0976 – 0997
2826
tested by using coefficient of correlation. Similarly, the ‘r’ values for the relationship between selected variables and human capital index (HCI), physical capital index (PCI), social capital index (SCI), natural capital index (NCI) and financial capital index (FCI) are presented in Table 2. It is observed from the findings presented in Table 2 that, there was no significant relationship between index of impact on rural livelihood and gender, age and caste of beneficiaries. Education had significant impact on rural livelihood and its components viz. physical capital index, natural capital index and financial capital index. The social capital index had negatively significant relationship with education revealing that educated beneficiaries had less social relationships. Family size and its type had no significant relationship with index of impact on rural livelihood; however, it had a significant relationship with social capital index indicating that the beneficiaries with larger family size and joint families had more social relationships. Size of land holding had significant relationships with index of impact on rural livelihood, however, negatively significant relationship was observed between size of land holding and financial capital index. It indicates that the respondents with no or smaller land holding benefitted more in respect of financial capital index, as the income generated wages earn through MGNREGA made significant difference in their financial capital index.Occupational status of the family of beneficiaries had no significant relationship with index of impact on rural livelihood; however it had significant relationship with natural capital index and negatively relationship with financial capital index. It indicated that those with lower occupational status of the family financially benefitted more by working in MGNREGA as compare to beneficiaries with higher occupational status of the family. Annual income of the family had highly significant relationship with index of impact on rural livelihood and its components. Similarly, mean man days of work done by the beneficiaries had significant relationship with index of impact on rural livelihood and all other component of livelihood index except human capital index and natural capital index. Social participation had significant relationship with impact of rural livelihood and its components viz. physical capital index and human capital index with level of social participation. Socio economic status of the family of beneficiaries had a significant relationship with index of impact on rural livelihood and more particularly, with physical capital index, natural capital index and social capital index. However, there was negatively correlation significant with human capital index and index of impact on rural livelihood indicating the fact that the beneficiaries from lower socio –economic status category were financially benefitted more as compared to beneficiaries from higher socio economic status categories.The utilization of information sources had no significant relationship with index of impact on rural livelihood in fact negatively significant correlation existed between financial capital index indicating the fact that the use of information sources had no significant impact on the growth of financial capital index through MGNREGA. The level of economic motivation had significant relation with index of impact on rural livelihood and its component viz. physical capital index and natural capital index. The level of availing other Govt. scheme had no significant relationship with index of impact on rural livelihood and its constituent capital indices. Regression analysis: To study the impact of selected 15 independent variables on rural livelihood index. The multiple linear regression was fitted between the 15 independent variables viz. gender, age , education, caste, family size, family type, land holding, occupational status, annual income, mean man days, social participation, socio-economic status, information sources, motivation behind participation and availing other Govt. scheme and dependent variable rural livelihood impact index. The total contribution explain by these variables was 57.00 per cent. However, all the variables could not exhibit significant contribution in determination of rural livelihood impact index. Hence the six independent variables viz. caste, socio-economic status, occupational status, land holding, social participation and gender were deleted one by one using step down regression method and finally selected variables are presented in Table 3.
Shubhangi Parshuramkar et al.

Indian Journal Of Natural Sciences www.tnsroindia.org. © IJONS
Vol.5 / Issue 28/ February 2015 International Bimonthly ISSN: 0976 – 0997
2827
It is revealed that from Table 3 all the variables contributed significantly in determining the rural livelihood impact index and the total contribution explain was 56.00 per cent. The finally selected variables are age, education, family size, family type, annual income, mean man days, information sources, motivation and availing other Govt. scheme. The family size, family type and information sources were the inversed contributor in co-efficient of determination (R2), while the remaining six variables were contributing positively. The selected variables were used to study the impact on the capital of rural livelihood i.e. human capital, physical capital, natural capital, social capital, financial capital and vulnerability were studied among the selected nine variables 2-7 variables were found significant contribution for the impact index of these selected capitals. The total contribution explains by the selected variables range is within 06.00 per cent to 46 per cent. Chi –square test: The chi square test is an approximate test to study the association between the attribute. It is distribution free test in the present study this test has been used to study the association between selected personal and socio economic characteristics and rural livelihood impact index. The frequencies are classified according to the variation in the attributes as observed frequencies. The expected frequencies for each observed frequencies are worked out and presented in parenthesis. The association between the following attributes was studied. viz. 1) Gender and rural livelihood 2) Age and rural livelihood 3) Education and rural livelihood 4) Caste and rural livelihood 5) Land holding and rural livelihood 6) occupational status and rural livelihood 7) Annual income and rural livelihood 8) Mean man days and rural livelihood and 9) Socio-economic status and rural livelihood. Among these selected paired attributes those are non significant chi-square value are not presented for the discussion only significant association attributes are presented for the discussion. The calculated values of chi-square are presented in the Table 4. The Table 4 presented the distribution of selected beneficiaries according to education and level of rural livelihood impact index. It is revealed that the chi-square value is highly significant indicating the attributes are associated. It is concluded that education has significant impact on rural livelihood impact index. The beneficiaries with higher qualification possessed medium to high rural livelihood impact index, while, the beneficiaries having relatively lower level of education have low to medium rural livelihood impact index. The data in Table 5 presented the distribution of selected beneficiaries according to annual income and level of rural livelihood impact index. It is revealed that the chi-square value is highly significant indicating the attributes are associated. It is concluded that annual income has significant impact on rural livelihood impact index. The beneficiaries with low annual income category possess medium to low rural livelihood impact index while the beneficiaries having relatively medium level of annual income have medium to high rural livelihood impact index.
CONCLUSION It might be concluded that education had significant impact on rural livelihood and its components viz.physical capital index, natural capital index and financial capital index. The social capital index had negatively significant relationship with education revealing that educated beneficiaries had less social relationships. Education and annual income emerged as key variables producing highly significant relationship with impact on rural livelihood.
Shubhangi Parshuramkar et al.

Indian Journal Of Natural Sciences www.tnsroindia.org. © IJONS
Vol.5 / Issue 28/ February 2015 International Bimonthly ISSN: 0976 – 0997
2828
Table 1: District wise MGNREGA beneficiaries and selected beneficiaries
Sr. No. Districts Total MGNREGA beneficiaries No. of beneficiaries selected
1 Bhandara 31029 80 2 Chandrapur 42490 80 3 Gondia 46237 80 4 Gadchiroli 36018 80 Total 155774 320
Table 2: Table showing co-relation values between selected variables and impact of MGNREGA on rural livelihood
Sr.No.
Variables
IIRL
HCI
PCI
NCI
FCI
SCI
1 Gender 0.052 -0.028 0.004 0.140* 0.051 0.053 2 Age -0.052 0.024 -0.026 0.046 -0.074 -0.001 3 Education 0.257** -0.096 0.141* 0.117* 0.200** -0.24** 4 Caste -0.029 -0.036 -0.116* -0.047 0.007 -0.070 5 Family size 0.074 0.037 0.074 0.042 -0.099 0.168** 6 Family type 0.021 -0.056 0.000 0.033 -0.121* 0.134* 7 Land holding 0.129* 0.006 0.099 0.228** -0.20** 0.105 8 Occupational status 0.072 0.010 0.039 0.276** -0.20** 0.107 9 Income of family 0.591** 0.192** 0.235** 0.155** 0.323** 0.130* 10 Mean man days 0.631** 0.038 0.196** -0.014 0.406** 0.179** 11 Social Participation 0.047 0.001 0.132* -0.020 0.021 0.118* 12 Socio- economic status 0.113* -0.070 0.212** 0.305** -0.104* 0.224** 13 Information Source -0.073 0.000 -0.046 -0.038 -0.14** 0.024 14 Motivation 0.251** 0.061 0.227** 0.130* 0.070 0.091 15 Availing other Govt.
schemes -0.013 -0.030 0.021 -0.041 -0.001 -0.039
**Significant at 0.01 level of probability *Significant at 0.05 level of probability Table 3: Effect of selected variables on rural livelihood impact index
Sr. No. Variables Partial b Standard Partial ‘b’ values
1 Age 0.046621 * 0.032912 2 Education 0.321015** 0.075891 3 Family size -0.72866** 0.314763 4 Family type -1.4298* 0.923301 5 Annual income 0.00015** 1.94E-05 6 Mean man days 0.107352** 0.012666 7 Information sources -0.37371** 0.108547 8 Motivation 0.604052** 0.201416 9 Availing other Govt. scheme 0.847554* 0.652047
**Significant at 0.01 level of probabilityR2=0.56 **
Shubhangi Parshuramkar et al.

Indian Journal Of Natural Sciences www.tnsroindia.org. © IJONS
Vol.5 / Issue 28/ February 2015 International Bimonthly ISSN: 0976 – 0997
2829
Table4: Impact of education on rural livelihood
Rural livelihood Education Low Medium High Frequency Illiterate 9
(7.01) 19
(22.07)
5 (3.92)
33
Primary school 27 (12.33)
25 (38.79)
6 (6.89)
58
Middle school 19 (16.79)
44 (52.83)
16 (9.38)
79
High school 13 (31.88)
126 (100.31)
11 (17.81)
150
68 214 38 320
**Significant at 0.01 level of probability X2 = 47.97**
Table 5: Impact of annual income on rural livelihood
Rural livelihood Annual income Low Medium High Frequency
Low 67 (54.83)
174 (172.54)
17 (30.64)
258
Medium 1 (13.18)
40 (41.46)
21 (7.36)
62
68 214 38 320
**Significant at 0.01 level of probability X2 =45.35**
Shubhangi Parshuramkar et al.

Indian Journal Of Natural Sciences www.tnsroindia.org. © IJONS
Vol.5 / Issue 28/ February 2015 International Bimonthly ISSN: 0976 – 0997
2830
Detection of Phosphorus Deficiencies in Corn using Spectral Radiance Measurements
Padmavathi T 1*, Sivasamy2 R and R. Jagadeeswaran2
1Department of Soil Science and Agricultural Chemistry,Tamil Nadu Agricultural University, Coimbatore 641003, Tamil Nadu,India. 2 Department of Remote Sensing and GIS, Tamil Nadu Agricultural University, Coimbatore 641003, Tamil Nadu,India Received:13 Dec 2014 Revised:18 Jan 2015 Accepted: 31 Jan 2015 *Address for correspondence Padmavathi T Research Scholar, Department of Soil Science and Agricultural Chemistry, Tamil Nadu Agricultural University, Coimbatore 641003, Tamil Nadu,India. E.mail: [email protected].
This is an Open Access Journal / article distributed under the terms of the Creative Commons Attribution License
(CC BY-NC-ND 3.0) which permits unrestricted use, distribution, and reproduction in any medium, provided the original work is properly cited.All rights reserved.
In situ, non-destructive and real time mineral nutrient stress monitoring is an important aspect of precision farming for rational use of fertilizers. A study was conducted during 2013 at TNAU, India, to determine the relationship between leaf hyperspectral reflectance (350-1050 nm) and leaf P content in corn (Zea mays L.) grown in controlled condition under five nitrogen rates (0, 50, 75, 100 and 125 % recommended level of nitrogen) was measured at key developmental stages. Canopy P status was varied by implementing five levels of P in Hoagland’s nutrient solution.Canopy reflectance measurements were made at five growth stages with a handheld spectroradiometer.The relationship between leaf N and spectral reflectance were computed by using three major indices namely NDVI, GNDVI and red edge. Among these, NDVI was the most appropriate spectral indices for estimation of leaf P at tasseling stage followed by GNDVI. The results revealed that there existed a strong correlation between leaf P and spectral reflectance at tasseling stage (R2 = 0.676*) by using NDVI.Green Normalized vegetation index was found to be significantly correlated with canopy P at 5% level in the tasseling stage (R2 = 0.628*).The results showed that leaf phosphorus status can be best predicted at tasseling stage by using NDVI followed by GNDVI.The study indicated that leaf spectral reflectance can be effectively used as nondestructive, quick, and reliable technique for real time monitoring of canopy nitrogen status in corn and important tool for P fertilizer management. Key words: Hyperspectral remote sensing, phosphorus content, spectral reflectance, corn.
RESEARCH ARTICLE
ABSTRACT

Indian Journal Of Natural Sciences www.tnsroindia.org. © IJONS
Vol.5 / Issue 28/ February 2015 International Bimonthly ISSN: 0976 – 0997
2831
INTRODUCTION Phosphorus (P) is one of the most important elements for crop growth. It is a component of many cell constituents and plays a major role in several physiological process including photosynthesis, respiration, energy storage and transfer, cell division, and cell enlargement (Fohse et al., 1988; Blevins, 1995). Also, P is necessary in nodule metabolism in legumes (Bethlenfalvay and Yoder, 1981; Ibijbijen et al., 1996).P is the second most crop limiting nutrient in most soils, and most cropping systems require supplemental P to maximize their Yield potential. Bean plants (Phaseolus vulgaris L.) showed a strong yield increase due to different rate of P fertilizer in field trails (Fohse et al., 1988; Singh and Singh, 2002; Roy and Partasaranthy, 2003).The second most limiting nutrient for corn production is often P. Current methods for estimating the amount of P available to growing crops include soil sampling or in-season plant sampling, both of which can be costly and labor intensive. The use of remote sensing techniques to estimate nutrient status could decrease the amount of labor needed for sampling, and could reduce the cost associated with sampling and analysis. There has been limited research investigating the potential of using remote sensing techniques to detect P and other nutrient deficiencies. Milton et al. (1991) grew soybean [Glycine max (L.) Merr.] plants in hydroponic solutions at three P concentrations and measured weekly changes in leaf spectral reflectance. They found that P-deficient plants had a higher reflectance in the green and yellow portions of the spectrum and did not show the normal shift of the red edge (chlorophyll absorption band at 680 nm). Al-Abbas et al. (1974) found that absorption at 830, 940, and 1100 nm was lower for P- and Ca-deficient corn leaves, whereas leaves deficient in S,Mg, K, and N had higher absorption in these wavelengths. Work by Masoni et al. (1996) found that Fe, S, Mg, and Mn deficiencies decreased absorption and increased reflectance and transmittance in corn, wheat, barley (Hordeum vulgare L.) and sunflower (Helianthus annuus L.) leaves. They also noted that mineral deficiency affected leaf concentration of other elements in addition to the deficient element, with nutrient concentrations varying according to species and deficiency level. Sembiring et al. (1998) found that by using a covariate of 435 nm, a 695/405 nm ratio was a good indication of P uptake by bermudagrass [Cynodon dactylon (L.) Pers.]. In this study, we used ground-based hyperspectral remote sensing for determining vegetation indices to rapidly estimate leaf P contents of corn at different growth stages during growing season across a wide range of P fertilization rates. The specific objectives were to: (i) to study the effect of different levels of nutrients on nutrient content at five key stages of corn and (ii) to study the relationship between crop canopy reflectance and P content in corn.
MATERIALS AND METHODS
Pot experiment involving sand culture was conducted in 2013 in a glasshouse. Large (30-cm dia x 30-cm depth) free-draining polyvinyl chloride (PVC) pots were filled with washed sand. Each pot was placed in a plastic basin. Corn (Co 6 hybrid) was sown on 6 November 2013. After dibbling the seeds, 1L of demineralized water was applied to the surface of the sand, and 2 L water was poured in the basin to wet the sand from bottom. Watering was done at regular interval (need based) with demineralized water and the nutrients were added with Hoagland’s Nutrient Solution (Hoagland and Arnon, 1950) with varying P concentration (Table 1). The crop was maintained for 20 days with half strength Hoagland solution applied at the rate of one litre per pot twice a week after sowing. The P level was varied after 20 days of crop establishment by eliminating the nitrogen (0 % P) or altering the levels (50, 75, 100, 125 % P) in the nutrient solution. After establishment, full-strength nutrient solution was added at weekly intervals @ 1 L per pot. Three plants were initially established in each pot. One plant was harvested at vegetative stage (30 DAS). The remaining two plants were maintained throughout the season. Spectral reflectance measurements were made from 30 days after sowing at 3 days interval using the spectroradiometer (model: GER1500; range: 350 to 1050 nm; make: Spectra Vista Corporation, USA) which is available in the Department of Remote Sensing and GIS, TNAU, Coimbatore. This hyperspectral device measures the reflectance in visible (VIS) and near infrared (NIR) spectrum
Padmavathi et al.

Indian Journal Of Natural Sciences www.tnsroindia.org. © IJONS
Vol.5 / Issue 28/ February 2015 International Bimonthly ISSN: 0976 – 0997
2832
with 512 channels in the 350- 1050 nm region. The uppermost fully expanded leaf was selected for spectral measurement and the reading was taken between 10.30 AM and 12.00 noon. The date of appearance of visual deficiency symptoms was also recorded. Pots with corn plants were arranged in a completely randomized blocks design with three replications. Treatment Structure: Sand Culture Experiment T1: 0% N + 100% of P, K, Secondary & Micronutrients T2: 50% N + 100% of P, K, Secondary & Micronutrients T3: 75% N+ 100% of P, K, Secondary & Micronutrients T4: 125% N + 100% of P, K, Secondary & Micronutrients T5: 0% P + 100% of N, K, Secondary & Micronutrients T6: 50% P + 100% of N, K, Secondary & Micronutrients T7: 75% P + 100% of N, K, Secondary & Micronutrients T8: 125% P + 100% of N, K, Secondary & Micronutrients T9: 0% Zn + 100% NPK, Secondary & Micronutrients (except Zn) T10: 50% Zn + 100% NPK, Secondary & Micronutrients (except Zn) T11: 75% Zn + 100% NPK, Secondary & Micronutrients (except Zn) T12: 100% NPK, Secondary & Micronutrients Note 1. Secondary and all other essential nutrients were applied optimally. 2. Nutrients were supplied through Hoagland’s Nutrient Solution. Chemical analysis The collected plant samples were oven dried at 60º and ground in a Wiley mill. From the ground samples 0.5g were weighed and transferred to a digestion tube. To this, about 12-15 ml of triacid mixture (Nitric acid: sulphric acid: perchloric acid in the ratio of 9: 2:1) was added and kept overnight. On the next day the digestion was done in Kelplus-KES 12 INL digestion block. After the digestion was over, the contents were diluted with distilled water and volume made up to 100 ml with distilled water in a volumetric flask. The acid digested samples were used for the determination of total P by Vanadomolybdate method (Jackson, 1973).
RESULTS Leaf phosphorus contents under different P rates Leaf phosphorus contents significantly differed among different P levels across five growth stages throughout the growing season. In the present study, leaf P contents were closely related to the applied P and consistently increase with the increasing amount of P concentration throughout the growing season (Table 2). Leaf P contents were significantly differed at all P fertilization application during the growing season. The highest P contents were observed in 125% P treatment at vegetative, tasseling, silking, cob initiation and grain filling stages. Maximum leaf P was reached at silking and vegetation stages. Leaf P contents changed over growth period and decreased with age. Similar results were reported by Gitelson & Merzlvak, (1998) and Mubeen, et al., (2013).
Padmavathi et al.

Indian Journal Of Natural Sciences www.tnsroindia.org. © IJONS
Vol.5 / Issue 28/ February 2015 International Bimonthly ISSN: 0976 – 0997
2833
Leaf Hyperspectral Reflectance spectra under different P rates
Reflectance spectra, measured at vegetative stage of corn grown with varying rates of P are shown in Fig. 1. Phosphorus levels affected leaf reflectance in the visible range and in the red edge. Specifically, the leaf reflectance at 550 nm and 680 nm rapidly increased with the decrease in the concentration rate. Several studies have shown that leaf reflectance values around these wavelengths were closely associated with chlorophyll (Chl) level (Thomas & Gausman, 1977; Blackmer et al., 1994). Therefore, P through Hoagland’s Nutrient Solution mainly affected leaf reflectance in the visible range and the red edge position by changing leaf Chl content. Leaf reflectance around these two wavelengths could be used to detect crop plant P deficiency. Relationship between leaf N and Spectral Reflectance The relationship between leaf P and spectral reflectance were computed by using three major indices namely NDVI, GNDVI and red edge. The results revealed that there existed a strong correlation between leaf P and NDVI at tasseling stage (R2 = 0.676*). GNDVI index was found to be significantly correlated with canopy P at 5% level in the tasseling stage (R2 = 0.628*).
DISCUSSION The main objective of this study was to identify relationship between spectral reflectance and leaf P content at different growth stages and develop strategies for nondestructive measurement of leaf P contents under varied rates of P application for corn grown in controlled condition. Distinct spectral response was recorded for varying P rates. This may be due to the effect of P levels on leaf structure and composition, including pigment concentrations. Near infrared reflectance increased due to increase in vegetation cover as a result of reflectance from multiple leaf layers. Therefore, the spectral reflectance is a good indicator for determining the P application rates.
Leaf P is a major indicator to characterize the P status in the corn crop. The important reflectance wavelengths for predicting P concentration change with sampling date due to differences in ground cover and growth stage (Osborne et al., 2002). The results of this study showed that there was strong correlation between leaf P and indices based on spectral reflectance and highest correlation was found at vegetative stage and silking stages. Therefore, vegetative stage and silking stage are more appropriate for accurate estimation of leaf P contents. Bausch and Duke (1996) reported that vegetative stages were the most appropriate stages for estimation of leaf P contents in corn crop under varied phosphorus rates. During early stages, treatment differences were less recognizable because the spectral response of the soil dominated the canopy response due to less soil cover (Colwell 1974; Walburg et al., 1981). Later towards the end of the season, senescence caused treatment difference to decreased.
Vegetation index is a simple and effective measurement of terrestrial vegetation activity and plays a very important role in qualitative and quantitative remote sensing. Hatifield & Prueger (2010) stated that multiple vegetation indices need to be used to best determine agricultural crop characteristics. So, different spectral vegetation indices were chosen for further analysis. The results showed that NDVI registered highest R2 value with leaf P content at tasseling stage followed by NDVI. Earlier studied reported that the NDVI is the most widely used vegetation index but it became less sensitive when the biochemical and biophysical variables of crops reached high values. Gitelson et al., (1996) indicated that green NDVI (GNDVI) was more sensitive than NDVI under these conditions. Osborne et al., (2004), Elwadie et al., (2005) and Mistele and Schmidhalter (2008) also reported that using green reflectance values such as GNDVI are better suited for P prediction.
CONCLUSION
A comprehensive study was performed to identify different spectral vegetation indices for real-time monitoring of leaf P status of corn crop at different growth stages. It was established that leaf phosphorus status can be best
Padmavathi et al.

Indian Journal Of Natural Sciences www.tnsroindia.org. © IJONS
Vol.5 / Issue 28/ February 2015 International Bimonthly ISSN: 0976 – 0997
2834
predicted at silking stage by NDVI followed by GNDVI. The study showed that hyperspectral reflectance can be used for nondestructive, fast, reliable and real time monitoring of leaf P status at different growth stages of corn.
REFERENCES
1. Afanasyev Y D, Nezlin N P, Kostianoy A G. Patterns of seasonal dynamics of remotely sensed chlorophyll and physical environment in the New foundland region. Remote Sens. Environ 2001;76: 268-282.
2. Bausch W C. Soil background effects on reflectancebased crop coefficients for corn. Remote Sens. Environ 1993; 46(2): 213-222.
3. Bell P F, Boquet D J, Millhollon E, Moore S, Ehelhar W, Mitchell C C, Varco J, Funderburg ER, Kennedy C, Breiten beck G A, Craig C, Holman M, Baker W, McConnell J.F. Relationships between leaf-blade nitrogen and relative seed cotton yields. Crop Sci., 2003; 43:1367-1374.
4. Blackmer T M, Schepers J S, Varvel G E. Light reflectance compared with other nitrogen stress measurements in corn leaves. J. Agron.1994; 86: 934-938.
5. Colwell J E, Rice D P, Nalepka R F . Wheat yield forecasts using Landsat data. In: Proceedings of the 11th International Symposium on Remote Sensing of Environment, Ann Arbor, MI, USA. 1977. pp. 1245-1254.
6. Daughtry C S T, Walthall C L, Kim M S, De Colstoun E B, McMurtrey III J E. Estimating corn leaf chlorophyll concentration from leaf and canopy reflectance. Remote Sens. Environ., 2000;74: 229-239.
7. Filella I, Serrano L, Serra J, Penuelas J. Evaluating wheat nitrogen status with canopy reflectance indices and discriminant analysis. Crop Sci., 1995;35: 1400-1405.
8. Gerik T J, Jackson B S, Stockle C O, Rosenthal W D. Plant nitrogen status and boll load of cotton. J. Agron., 1994;86: 514-518.
9. Gitelson A A, Merzlyak M N. Remote sensing of chlorophyll concentration in higher plant leaves. Advances Space Res.,1998; 22: 689-692.
10. Haneklaus S, Schnug E. An agronomic, ecological and economic assessment of site-specific fertilization. Landbauforsch. Volkenrode. 2002;52: 123-133.
11. Hatfield J L, Prueger J H. Nitrogen over-use, underuse and efficiency. In Proc. Int. Crop Sci., Congress, 4th, Brisbane, Australia. 2004;26 Sept-1 Oct.
12. Hoagland D R, Arnon D I. The water-culture method for growing plants without soil. California Agricultural Experiment Station Circular 1950; 347:1-32.
13. Huang W, Wang J, Liu L, Zhao C, Wang J, Du X. The red edge parameters diversification discipline and its application for nutrition diagnosis. Remote Sens. Tech. Appl., 2003; 18(4): 206-211.
14. Jackson R D, Clark T R, Moran M S. Bidirectional calibration results for 11 spectralon and 16 BaSO4 reference reflectance panels. Remote Sens. Environ., 1992; 40(3): 231-239.
15. Jaynes D B, Colvin T S, Karlen D L, Cambardella C A, Meek D W. Nitrate loss in subsurface drainage as affected by nitrogen fertilizer rate. J. Environ. Qual., 2001; 30:1305-1314.
16. Jia L L, Buerkert A, Chen X P, Romheld V, Zhang F S. Low altitude aerial photography for optimum N fertilization of winter wheat on the North China Plain. Field Crops Res., 2004; 89: 389-395.
17. Khan M S, Marwat K B, Gul B, Hussain Z. Effect of weed density on leaf area index and biological yield of maize. Pak. J. Bot. 2012; 44(6): 1923-1931.
18. Kolberg R L, Westfall D G, Peterson G A. Influence of cropping intensity and nitrogen fertilizer rates of in situ nitrogen mineralization. Soil Sci. Soc. Am. J. 1999; 63: 129-134.
19. LaRuffa J M, Raun W R, Phillips S B, Solie J B, Stone M L, Johnson G V. Optimum field element size for maximum yields in winter wheat, using variable nitrogen rates. J. Plant Nutr. 2001; 24: 313-325.
20. Li J, Dong Z, Zhu J. Present application and outlook for method of nitrogen nutrition diagnosis. J. Shihezi Univ. Nat. Sci., 2003;7(1): 80-83.
21. Link A, Panitzki M, Reusch S. Hydro N-Sensor: Tractor mounted remote sensing for variable nitrogen fertilization. In Proc. Int. Conf. on Prec. Agric., 6th, Minneapolis, MN. 2005; p. 1012-1018.
Padmavathi et al.

Indian Journal Of Natural Sciences www.tnsroindia.org. © IJONS
Vol.5 / Issue 28/ February 2015 International Bimonthly ISSN: 0976 – 0997
2835
22. Long D S, Engel R E, Carlson G R. Grain protein sensing for precision N management: II. In Proc. Of Intensive Wheat Management Conf., Denver, CO. 4–5 March. Potash & Phosphate Inst., Brookings, SD. 1998;pp. 56-61.
23. Mubeen M A, Ahmad Wajid A, Bakhsh A. Evaluating different irrigation scheduling criteria for autumn-sown maize under semi-arid environment. Pak. J. Bot. 2013; 45(4): 1293-1298.
24. Mulla D J, Schepers J S. Key processes and properties for site-specific soil and crop management. In: (Ed.): F.J. Pierce and E.J. Sadler, the site-specific management for agricultural systems. ASA, CSSA, and SSSA, Madison, WI. 1997; pp. 1-18.
25. Osborne S L, Schepers J S, Francis D D, Schlemmer M R. Use of spectral radiance to estimate inseason biomass and grain yield in nitrogen- and waterstressed corn. Crop Science, 2002;42: 165-171.
26. Raun W R, Solie J B, Johnson G V, Stone M L, Mullen R W, Freemann K W, Thomason W E, Lukina E V. Improving nitrogen use efficiency in cereal grain production with optical sensing and variable rate application. Agron. J., 2002; 94: 815-820.
27. Roth G W, Fox R H. Plant tissue test for predicting nitrogen fertilizer requirement of winter wheat. Agron. J., 1989; 81: 502-507.
28. Schmidhalter U, Bredemeier C, Geesing D, Mistele B, Selige T, Jungert S. Precision agriculture: spatial and temporal variability of soil water, soil nitrogen and plant crop response. Bibliotheca Fragmenta Agronomica, 2006;11: 97-106.
29. Shah A, Akmal M, Asim M, Farhaullah, Raziuddin, Ragi A. Maize growth and yield under changing climate. Pak. J. Bot., 2012; 44(6): 1933-1938
30. Thenkabail P S, Smith R B, De Pauw E. Hyperspectral Vegetation Indices for Determining Agricultural Crop Characteristics. Yale University, New Haven. 2000; 16-19.
31. Thomas J R, Gausman H W. Leaf reflectance vs. leaf chlorophyll and carotenoid concentrations for eight crops. Agron. J., 1977; 69: 799-802
32. Walburg G, Bauer M E, Daughtry C S T, Housley T L. Effects of nitrogen nutrition on the growth, yield and reflectance characteristics of corn canopies. Agron. J., 1982;74: 677-683.
33. Zarco-Tejada P J, Miller J R, Mohammed G H, Noland T L. Chlorophyll fluorescence effects on vegetation apparent reflectance: I. Leaf-level measurements and model simulation. Remote Sens. Environ., 2000a; 74: 582-595.
34. Zarco-Tejada P J, Miller J R, Mohammed G H, Noland T L, Sampson P H. Chlorophyll fluorescence effects on vegetation apparent reflectance: II. Laboratory and airborne canopy-level measurements with hyperspectral data. Remote Sens. Environ., 2000b; 74: 596-608.
Fig. 1. Change in spectral reflectance under different P rates
Padmavathi et al.
Indian Journal Of Natural Sciences www.tnsroindia.org. © IJONS
Vol.5 / Issue 28/ February 2015 International Bimonthly ISSN: 0976 – 0997
2836
Table 1. Hoagland’s Nutrient Solution Composition For 100% NPK and Micronutrients Nutrient mg/L Salt N 200 KNO
3 , Ca(NO
3)
2.4H
2O & (NH
4)6Mo7O24.4H
2O
P 20 KH2PO
4
K 243 KNO3 & KH
2PO
4
Ca 175 Ca(NO3)
2.4H
2O
Mg 25 MgSO4.H
2O
Fe 7.33 FeEDTA Mn 0.25 MnSO
4.H
2O
B 0.26 H3BO
3
Cl 7 NaCl Zn 0.05 ZnSO
4.7H
2O
Cu 0.01 CuSO4.5H
2O
Mo 0.01 (NH4)6Mo7O24.4H
2O
S 33 MgSO4.H
2O, ZnSO
4.7H
2O & CuSO
4.5H
2O
Table 2. Effect nutrient treatments on leaf phosphorus contents (%) of corn leaf at different growth stages
Treatments Vegetative Tasseling Silking Cob Initiation Grain Filling T1 0.28 0.19 0.33 0.20 0.25 T2 0.24 0.20 0.40 0.24 0.21 T3 0.28 0.23 0.56 0.27 0.22 T4 0.28 0.22 0.43 0.20 0.21 T5 0.28 0.14 0.35 0.17 0.16 T6 0.39 0.24 0.31 0.16 0.29 T7 0.32 0.31 0.34 0.27 0.27 T8 0.34 0.30 0.37 0.15 0.16 T9 0.39 0.31 0.84 0.19 0.20 T10 0.35 0.28 0.39 0.22 0.25 T11 0.35 0.26 0.32 0.37 0.21 T12 0.36 0.34 0.51 0.27 0.18
Mean 0.32 0.25 0.43 0.23 0.22 SEd 0.04 0.04 0.07 0.03 0.05
CD(.05) 0.08 0.09 0.14 0.05 NS CV% 14.87 20.16 18.70 14.41 26.32
Table 3. Simple correlation between leaf phosphorus and spectral indices at different growth stages of maize
Growth stages of maize
Correlation coefficient NDVI Red edge GNDVI
Vegetative stage 0.373 0.353 0.464 Tasseling Stage 0.676* 0.381 0.628* Silking Stage 0.144 0.250 0.087 Cob Initiation Stage 0.218 0.136 0.098
** Correlation is significant at 1% level * Correlation is significant at 5% level
Padmavathi et al.

Indian Journal Of Natural Sciences www.tnsroindia.org. © IJONS
Vol.5 / Issue 28/ February 2015 International Bimonthly ISSN: 0976 – 0997
2837
Studying the Failure Mechanism of Base Plate Connection Hooman BarjoieRoshan Pour1*, Habib AllahPoornamaziyan Najaf Abadi2, Milad Saffary3 and Ahmad Momeni4
1Department of Civil Engineering, Faculty of Engineering, Maybod Branch, Islamic Azad University,Maybod, Iran. 2Department of Civil Engineering, Faculty of Engineering, Science and Research Branch, Islamic Azad University,Isfahan, Iran. 3Department of Civil Engineering, Faculty of Engineering, Isfahan Industrial University,Isfahan, Iran. 4Department of Civil Engineering, Faculty of Engineering, Bahonar University,Kerman,Iran. Received: 25 Nov 2014 Revised: 2 Dec 2014 Accepted:18 Dec 2014 *Address for correspondence Hooman BarjoieRoshan Pour Department of Civil Engineering, Faculty of Engineering, Maybod Branch, Islamic Azad University, Maybod, Iran. E.Mail: [email protected]
This is an Open Access Journal / article distributed under the terms of the Creative Commons Attribution License
(CC BY-NC-ND 3.0) which permits unrestricted use, distribution, and reproduction in any medium, provided the original work is properly cited. All rights reserved. Parametric Studies aiming to investigate failure mechanism of conventional plate connections have been under the influence of interaction between bending anchor and shear. This study uses ABAQUS finite element software and considers both non-linear material behavior and non-linear geometric behavior. According to the results, for enhancing lateral stiffness, the appropriate solution would be to increase the thickness of angles instead of increasing the thickness of the bottom of the column. The reason can be the control of column scaling up at the connection of angle to the column and its bottom. In addition, lateral behavior of construction in elastic range is controlled mostly by the behavior of angle. However, inelastic behavior of structures is controlled by the interaction between angle and base plate. According to the investigation, it is recommended that lumped element models should consider the corner weld defects in the way of connecting angle to column and its bottom. Keywords: Base Plate, Failure Mechanism, Lumped Element Model, Steel Fasteners, Structural Stiffness;
RESEARCH ARTICLE
ABSTRACT
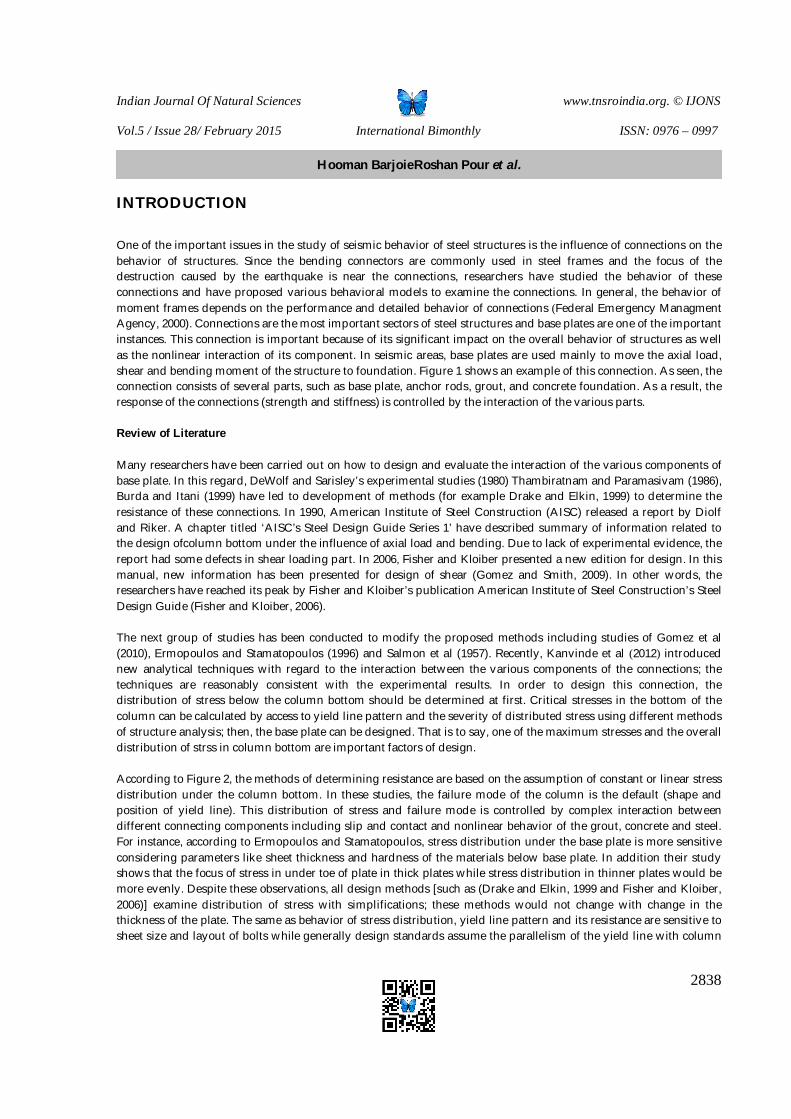
Indian Journal Of Natural Sciences www.tnsroindia.org. © IJONS
Vol.5 / Issue 28/ February 2015 International Bimonthly ISSN: 0976 – 0997
2838
INTRODUCTION One of the important issues in the study of seismic behavior of steel structures is the influence of connections on the behavior of structures. Since the bending connectors are commonly used in steel frames and the focus of the destruction caused by the earthquake is near the connections, researchers have studied the behavior of these connections and have proposed various behavioral models to examine the connections. In general, the behavior of moment frames depends on the performance and detailed behavior of connections (Federal Emergency Managment Agency, 2000). Connections are the most important sectors of steel structures and base plates are one of the important instances. This connection is important because of its significant impact on the overall behavior of structures as well as the nonlinear interaction of its component. In seismic areas, base plates are used mainly to move the axial load, shear and bending moment of the structure to foundation. Figure 1 shows an example of this connection. As seen, the connection consists of several parts, such as base plate, anchor rods, grout, and concrete foundation. As a result, the response of the connections (strength and stiffness) is controlled by the interaction of the various parts. Review of Literature Many researchers have been carried out on how to design and evaluate the interaction of the various components of base plate. In this regard, DeWolf and Sarisley’s experimental studies (1980) Thambiratnam and Paramasivam (1986), Burda and Itani (1999) have led to development of methods (for example Drake and Elkin, 1999) to determine the resistance of these connections. In 1990, American Institute of Steel Construction (AISC) released a report by Diolf and Riker. A chapter titled ‘AISC’s Steel Design Guide Series 1’ have described summary of information related to the design ofcolumn bottom under the influence of axial load and bending. Due to lack of experimental evidence, the report had some defects in shear loading part. In 2006, Fisher and Kloiber presented a new edition for design. In this manual, new information has been presented for design of shear (Gomez and Smith, 2009). In other words, the researchers have reached its peak by Fisher and Kloiber’s publication American Institute of Steel Construction’s Steel Design Guide (Fisher and Kloiber, 2006). The next group of studies has been conducted to modify the proposed methods including studies of Gomez et al (2010), Ermopoulos and Stamatopoulos (1996) and Salmon et al (1957). Recently, Kanvinde et al (2012) introduced new analytical techniques with regard to the interaction between the various components of the connections; the techniques are reasonably consistent with the experimental results. In order to design this connection, the distribution of stress below the column bottom should be determined at first. Critical stresses in the bottom of the column can be calculated by access to yield line pattern and the severity of distributed stress using different methods of structure analysis; then, the base plate can be designed. That is to say, one of the maximum stresses and the overall distribution of strss in column bottom are important factors of design. According to Figure 2, the methods of determining resistance are based on the assumption of constant or linear stress distribution under the column bottom. In these studies, the failure mode of the column is the default (shape and position of yield line). This distribution of stress and failure mode is controlled by complex interaction between different connecting components including slip and contact and nonlinear behavior of the grout, concrete and steel. For instance, according to Ermopoulos and Stamatopoulos, stress distribution under the base plate is more sensitive considering parameters like sheet thickness and hardness of the materials below base plate. In addition their study shows that the focus of stress in under toe of plate in thick plates while stress distribution in thinner plates would be more evenly. Despite these observations, all design methods [such as (Drake and Elkin, 1999 and Fisher and Kloiber, 2006)] examine distribution of stress with simplifications; these methods would not change with change in the thickness of the plate. The same as behavior of stress distribution, yield line pattern and its resistance are sensitive to sheet size and layout of bolts while generally design standards assume the parallelism of the yield line with column
Hooman BarjoieRoshan Pour et al.

Indian Journal Of Natural Sciences www.tnsroindia.org. © IJONS
Vol.5 / Issue 28/ February 2015 International Bimonthly ISSN: 0976 – 0997
2839
wing. The assumptions are probably regarded because of design simplification and lack of accurate method in the measurement of stress distribution. Research Objectives Parametric studies to investigate the failure mechanisms of conventional connections are conducted in Iran under the influence of bending and shear interaction. According to part 1, stress distribution in base plate is sensitive to the size of connection components including sheet and column size. The exact behavior of structures with scale models will not be accepted. In this regard, this article employs finite element and full simulation of connection components to investigate the behavior of column bottom. The paper will study the effect of element thickness on failure mechanism after presentation and introduction of models, load-displacement diagram, and the behavior of connection components. Simulation and analysis are carried out by software ABAQUS V.6.10 (2010). It is noteworthy that the study considers both material nonlinearity and geometric nonlinearity behaviors. Numerical Simulation in ABAQUS Software S4R shell element is used for modeling the beam components, base plate, angle, and foundation. The element takes into consideration all shear deformations in plate thickness. Theoretical relationships governing the element are the reflected in such a way that the results of applying it in thin sheets are consistent with the results of the classical theory of plates. With increasing thickness, the results of applying the element will be led to the results of the theory of thick plates (Mindlin Shell Theory) (ABAQUS, 2010). In modeling, the soil around the foundation is considered rigid; moreover, there is no relative motion between the two elements by assuming full anchorage of bolts in the foundation. Area under the foundation is bounded in all respects to create support situation. In terms of large deformations, hard contact, or prohibition of element penetration, is defined to simulate accurately the behavior of the elements. Friction coefficient of 0.30 is used for the interaction between the steel components, column and foundation bottom (Diaz et al, 2006). It is notable that the linear elastic behavior of the the bolts is considered during the analysis. For column, column bottom, foundation and connection angles, nonlinear material properties have been considered. Furthermore, analysis method of Riks, which is able to identify the equilibrium path, is used in nonlinear analyses (ABAQUS, 2010). According to the regulations of AASHTO (2010) materials used for steel components are M270M class 345 steel. Engineering stress-strain curve of the materials is based on data obtained from tensile and compressive test specimens in laboratory (Hartmann, 2005); finally, it is introduced to the software by transforming it to true stress - strain curve, as seen in Figure (3). One should be aware that average modulus of elasticity of steel materials is equal to 200GPa. Finite element software ABAQUS has different behavioral models for the confined concrete. All models are designed to have the capability of modeling reinforced concrete and non-reinforced concrete (ABAQUS, 2010). Concrete Damage Plasticity (CDP) has been used widely for modeling the behavior of concrete in finite element model. This article employs CDP presented by Lubliner et al (1989) and Lee and Fenves (1998) in this regard (ABAQUS, 2010). Two major failure mechanisms in this model are cracking due to tensile and smashing because of crush in concrete materials. Failure rate is evaluated by plastic strains equivalent to tensile and compressive. In order to study accurately the concrete behavior, specification of Jong experimental results is chosen (Jung and White, 2006). In the research, six compressive strength tests were performed on cylindrical samples that the average test data shown in Figure (4-A) based on a9-point description. Average compressive strength of concrete is equal to 33.58 MPa. Initial yield stress running of the concrete on stress according to the definition of Regulations ACI 318-02 is
'c0.45 f that indicates 15.11(Mpa) in this experiment. According to this regulation, elastic modulus of concrete, Ec,
is equal to the slope of connecting line from zero compressive stress to a point with 'c0.45 f stress. According to data
obtained from the experiments, the average tensile strength of concrete isctf =3.45 (M pa) . Figure (4-B) shows the
tensile behavior of concrete.
Hooman BarjoieRoshan Pour et al.

Indian Journal Of Natural Sciences www.tnsroindia.org. © IJONS
Vol.5 / Issue 28/ February 2015 International Bimonthly ISSN: 0976 – 0997
2840
Geometric Features and Details of the Models According to Table (1), 20 connections were considered for column base. Figure (5) shows a sample of meshing and connecting the components of column bottom. Two selected columns are 2IPE140 and 2IPE180 3m in length and angles of L80x80x8 and L80x80x10 with 10 cm length because they are widely used sections in construction industry. In order to investigate the failure mechanisms of connection and to disregard disconnection caused by a punch, foundation dimensions are selected so that to be consistent with provisions in the regulations (more than 2 times bigger than the area of the column); in addition, they should have enough depth to cut punch. In other words, foundation dimensions were chosen to be 200 x200x100 cm in accordance with the dimensions of column bottom that is 50x50 cm. In the location of bolts in foundation, 8 holes were created with dimensions of bolts, or 25 mm. Distance from the center of screws to the corners of the sheet is 6 cm. As shown in Figure (5-B), the angles are connected to column and column bottom by fillet welds and the elastic behavior. ‘Tie’ command in ABAQUS software is used to implement the behavior of weld and complete connection of angles. In order to establish the actual welding situation, a defect in the form of a 5-mm gap was articulated at the end of angle connections to column bottom and column. Loading is in form of a horizontal concentrated load at top of column so that the maximum bending is centered on a strong column. In this manner, the failure mechanisms of connection are checked with increasing load. Structural analysis will be conducted under the influence of the structure weight and concentrated load.
DISCUSSION AND CONCLUSION After construction and analysis of models according to the process described in section 2 and 3, load changes as a response to tip load deformation are plotted for models 1 to 20 in Figures (6) and (7). Evaluation of failures models of 1 to 5 and 11 to 15 indicates that initial stiffness of the structure is increased by increasing the thickness of column bottom. This increase in the thickness of column from 20 to 25 millimeters is significantly considerable; then, increasing the thickness will not affect the stiffness of the structure. Evaluation of failures models of 1 to 5 and 11 to 15 indicates that no significant change will be observed after changing sheet thickness from 20 to 25 millimeters. General comparison of models 1 to 20 indicates that increasing the thickness of the connection angles must be considered in order to increase the lateral stiffness in the design. The reason can be the control of column scaling up at the connection of angle to the column and its bottom. In order to evaluate the process of failure, as shown in Figure (8) to (10), the failures Model 1 is checked. The structural behavior is linear at the beginning of the load-displacement curve. With increasing load, arriving at point A, the first yielding point occurred in the connection angles; then, less nonlinear behavior is observed in the structures. However, with continuation of loading and reaching point B considerable nonlinear behavior is revealed. The reason for this phenomenon is simultaneous running off column bottom and expansion of plastic connections in angles. As seen, the behavior of elastic structures is controlled mostly by the behavior of connection angles. That is to say, it is recommended to increase thickness of angle and base plate to increase the initial stiffness of the structure. The one should increase thickness of angle and base plate to control the nonlinear behavior. The most important results of this study can be summarized as follows: 1. The results show that in the same conditions, increasing the thickness of angles instead of increasing the
thickness of the bottom of column would be an appropriate approach in order to increase the elastic stiffness of the structure. The reason can be the control of column scaling up at the connection of angle to the column and its bottom. Note that increasing the thickness of the bottom of column after a certain depth will not lead to a change in structural behavior. Therefore, optimizations should be made in this regard.
2. In the elastic range, the lateral behavior of structure is mostly controlled by the behavior of the connection angles while inelastic behavior of the structure is controlled by the combination behavior of angle and base plate.
Hooman BarjoieRoshan Pour et al.

Indian Journal Of Natural Sciences www.tnsroindia.org. © IJONS
Vol.5 / Issue 28/ February 2015 International Bimonthly ISSN: 0976 – 0997
2841
3. In order to evaluate the behavior of column bottom connection, it is recommended that the corner weld defects (lack of connection at the angle) in connection angles to base plate and column should be entered into the finite element models because the actions of the defect play important roles in the control of results.
REFERENCES
1. Federal Emergency Managment Agency, (2000). Prestandard and Commentary for the Seismic Rehabilitation of Buildings. Washington, D.C.: American Society of Civil Engineers. Available from: http: www.nehrp.gov/pdf/fema356.pdf
2. DeWolf, JT., and Sarisley, EF., (1980). Column base plates with axial loads and moments. J Struct Div, ASCE 1980, 106(11):2167–84. Available from: http://cedb.asce.org/cgi/WWWdisplay.cgi?9843
3. Thambiratnam, DP., and Paramasivam, P., (1986). Base plates under axial loads and moments. J Struct Eng ASCE 1986; 112(5):1166–81. Available from: http://dx.doi.org/10.1061/(ASCE)0733-9445(1986)112:5(1166)
4. Burda, J.J., Itani, A.M. 1999, Studies of seismic behavior of steel base plates. Report no CCEER 99-7. Reno, NV: Center of Civil Engineering Earthquake Research, Department of Civil and Environmental Engineering, University of Nevada. Available from: www.nehrp.gov/pdf/nistgcr11-917-13.pdf
5. Astaneh, A., Bergsma, G. 1993, Cyclic behavior and seismic design of steel base plates. Proceedings, structures congress. ASCE, 409–14.
6. Drake, R.M., Elkin, S.J. 1999, Beam–column base plate design—LRFD method. Eng J, AISC , 36(1):29–38. Doi:10.1016/j.advengsoft.2011.05.008
7. Gomez, I.R., Smith, C.H. 2009, Shear Transfer in Exposed Column Base Plates. Final report presented to the American Institute of Steel Construction. Report Presented to the American Institute of Steel Construction. Pp 1-134.
8. Fisher, J.M., Kloiber, L.A. 2006, Base plate and anchor rod design. AISC steel design guide one. 2nd ed. Chicago, IL: American Institute of Steel Construction. ISBN: 978-0-7844-7718-2.
9. Gomez, I.R., Kanvinde, A.M., Deierlein, G.G. 2010, Exposed column base connections subjected to axial compression andflexure. Final report presented to the American Institute of Steel Construction, Chicago, IL. Available from: http://nees.org/resources/839.
10. Ermopoulos, J., Stamatopoulos, G. 1996, Mathematical modeling of column base plate connections. Journal of constructional steel research, 36. Elsevier; 79–100. Available from: http://dx.doi.org/10.1590/S1679-78252014000800008
11. Salmon, C.G., Shaker, L., Johnston, B.G., 1957, Moment–rotation characteristics of column anchorages. Trans ASCE, 122:132–54.
12. Kanvinde, A.M., Grilli, D.A., Zareian, F. 2012, Rotational stiffness of exposed column base connections—experiments and analytical models. J Struct Eng ASCE, 138(5):549–60. Available from: http://dx.doi.org/10.1061/(ASCE)ST.1943-541X.0000495
13. ABAQUS v.6.10, Standard User’s Manual. Hibbitt, Karlsson & Sorensen Inc., 2010 . 14. Diaz J.J. et. al. 2006, Non-linear analysis of unbolted base plates by the FEM and experimental validation. thin-
walled structures, 44, pp 529-541. DOI: 10.1016/j.tws.2006.04.008.
15. AASHTO LRFD Bridge Design Specifications, 2010, 5th Edition, American Association of State and 16. Highway Transportation Officials, Washington, D.C.
17. Hartmann, J. 2005, An-Experimental-Investigation-on the-Flexural-Resistance-of Horizontally Curved Steel I-Girder Systems, Ph.D.thesis, Department Of Civil and Environmental Engineering, University of Maryland.
18. Jung, S.K., White, D.W. 2006, Shear Strength of Horizontally Curved Steel I-Girders — Finite Element Analysis Studies. J. Constr. Steel Res. 62 (4), PP. 329-342. DOI: 10.1016/j.jcsr.2005.08.003
Hooman BarjoieRoshan Pour et al.

Indian Journal Of Natural Sciences www.tnsroindia.org. © IJONS
Vol.5 / Issue 28/ February 2015 International Bimonthly ISSN: 0976 – 0997
2842
Figure 1 – A view from the the constituents of the column bottom connections in steel structures
Figure 2: Linear and uniform stress distribution in the column’s bottom
Figure 3 The stress-strain diagram for steel
Hooman BarjoieRoshan Pour et al.

Indian Journal Of Natural Sciences www.tnsroindia.org. © IJONS
Vol.5 / Issue 28/ February 2015 International Bimonthly ISSN: 0976 – 0997
2843
Figure 4 concrete compressive and tensile stress-strain curve - derived from experimental Opening size of 5 mm Due to lack of continuity of the weld
Figure 5: A view of meshing and connecting the components of column bottom
Hooman BarjoieRoshan Pour et al.

Indian Journal Of Natural Sciences www.tnsroindia.org. © IJONS
Vol.5 / Issue 28/ February 2015 International Bimonthly ISSN: 0976 – 0997
2844
0
5
10
15
20
25
30
0 50 100 150 200 250 300 350 400
Shea
r fo
rce
(kN
)
Lateral Deflection (mm)
Model - 1
Model - 2
Model - 3
Model - 4
Model - 5
Model - 6
Model - 7
Model - 8
Model - 9
Model - 10
Figure 6 - Diagram of load-horizontal shift for models 1 to 10
0
5
10
15
20
25
30
35
0 50 100 150 200 250
Shea
r fo
rce
(kN
)
Lateral Deflection (mm)
Model - 11
Model - 12
Model - 13
Model - 14
Model - 15
Model - 16
Model - 17
Model - 18
Model - 19
Model - 20
Figure 7 - Diagram of load-horizontal shift for models 1 to 10
Hooman BarjoieRoshan Pour et al.

Indian Journal Of Natural Sciences www.tnsroindia.org. © IJONS
Vol.5 / Issue 28/ February 2015 International Bimonthly ISSN: 0976 – 0997
2845
Point A
Point B
Point C
Point D
0
5
10
15
20
25
0 50 100 150 200 250 300 350 400
Shea
r fo
rce
(kN
)
Lateral Deflection (mm)
Model - 1
Point A
Point B
Point C
Point D
Figure 8 - Diagram of load-horizontal shift for models 1
Figure 9 – The process of destruction of column bottom’s connection - sample 1 - (zoom ratio: 2)
Hooman BarjoieRoshan Pour et al.

Indian Journal Of Natural Sciences www.tnsroindia.org. © IJONS
Vol.5 / Issue 28/ February 2015 International Bimonthly ISSN: 0976 – 0997
2846
Figure 10 – The process of destruction of base plate connection - sample 1 - (zoom ratio: 2) Table 1: Components geometry of parametric studies (dimensions are in millimeters)
10 9 8 7 6 5 4 3 2 1 Model 2IPE 140 2IPE 140 Column section
40 35 30 25 20 40 35 30 25 20 Thickness of column bottom
L 80x80x10 L 80x80x8 Connection Angle 20 19 18 17 16 15 14 13 12 11 Model
2IPE 180 2IPE 180 Column section
40 35 30 25 20 40 35 30 25 20 Thickness of column bottom
L 80x80x10 L 80x80x8 Connection Angle
Hooman BarjoieRoshan Pour et al.

Indian Journal Of Natural Sciences www.tnsroindia.org. © IJONS
Vol.5 / Issue 28/ February 2015 International Bimonthly ISSN: 0976 – 0997
2847
Socio–Economic Profile of the Beneficiaries and Employment Generated under MGNREGA Shubhangi Parshuramkar1 , D.M. Mankar2 , N.R.Koshti3 and N.M.Kale3
1Agriculture College, Dr.Panjabrao Deshmukh Krishi Vidyapeeth, Nagpur, Maharashtra, India. 2Department of Extension Education, Dr.Panjabrao Deshmukh Krishi Vidyapeeth Akola, Maharashtra, India. 3Directorate of Extension Education,Dr.Panjabrao Deshmukh Krishi Vidyapeeth Akola, Maharashtra, India. Received: 20 Dec 2014 Revised: 12 Jan 2014 Accepted: 17 Jan 2015 *Address for correspondence N.R.Koshti Associate Professor, Dr. Panjabrao Deshmukh Krishi Vidyapeeth, P.O.Krishi Nagar,Akola-444104 Maharashtra, India. E.mail: [email protected].
This is an Open Access Journal / article distributed under the terms of the Creative Commons Attribution License (CC BY-NC-ND 3.0) which permits unrestricted use, distribution, and reproduction in any medium, provided the original work is properly cited.All rights reserved. The Mahatma Gandhi National Rural Employment Guarantee Act (MGNREGA) is an Indian job guarantee scheme, enacted by legislation on 25 August, 2005. The act has become operative in the notified districts from 2nd February 2006 with an objective of enhancing livelihood security of rural households by providing at least 100 days of guaranteed wage employment in every financial year to every household whose adult members volunteer to do unskilled manual work. The study was undertaken with an objective to analyze the socio-economic profile of beneficiaries as well as to assess the extent of employment generated by the MGNREGA in the four districts of eastern Vidarbha region of Maharashtra namely, Bhandara, Gondia, Gadchiroli and Chandrapur. For the study eight tahsils and a sample size of 320 beneficiaries were selected. The results indicated that 69.37 per cent beneficiaries received 50 – 100 days of employment on average during last five years through MGNREGA. A small percentage (5.62 %) of beneficiaries received employment for more than 100 days on average. However, 25.00 per cent beneficiaries reported less than 50 days of average employment during last five years. On an average 65.67 man days employment have been generated by the MGNREGA in eastern Vidarbha.
Keywords- socio–economic profile, beneficiaries, employment generated, MNREGA
RESEARCH ARTICLE
ABSTRACT

Indian Journal Of Natural Sciences www.tnsroindia.org. © IJONS
Vol.5 / Issue 28/ February 2015 International Bimonthly ISSN: 0976 – 0997
2848
INTRODUCTION The Mahatma Gandhi National Rural Employment Guarantee Act (MGNREGA) is an Indian job guarantee scheme, enacted by legislation on 25 August, 2005. The act has become operative in the notified districts from 2nd February 2006 with an objective of enhancing livelihood security of rural households by providing a minimum of 100 days of guaranteed wage employment in every financial year to every household whose adult members volunteer to do untrained manual work. “This employment Guarantee Act is the most vital legislation of our times in some ways. For the first time, rural communities are given not simply a development programme, however a regime of rights. This act, will also unlock the potential of the rural poor to contribute to the reconstruction of their setting. The NREGA offers hope to people who had all, but lost their hope. It has a clear focus on the poorest of the poor. It seeks to reach out to those in need of livelihood security. The NREGA offers employment, offers financial gain, offers a living and it offers an opportunity to measure a lifetime of self-esteem and dignity. Considering the importance of act, it felt essential to check the Socio–economic and Psychological Profile of the Beneficiaries participated in MGNREGA and employment generated beneath MGNREGA.
MATERIALS AND METHODS Locale of the study:The study was carried out in eastern Vidarbha region, which comprises the districts namely Bhandara, Gondia, Gadchiroli and Chandrapur. These four districts are well known for paddy growing belt of Vidarbha region
. Selection of tahasil’s:The higher number of registered persons since beginning of the scheme was the criterion for selection of the tahsils for the study. The talukas namely 1) Deori, 2) Sadak Arjuni, 3) Lakhandur, 4) Sakoli 5) Nagbhir 6) Brahmapuri 7) Kurkheda 8) Wadsa were observed having more number of registered persons on the job. Hence, these tahasil’s were selected for the study.
Selection of villages: From each selected tahasil’s, four villages were selected for the study based on higher number of beneficiaries under MGNREGA working in a selected village. Thus, total thirty two villages were selected. Selection of beneficiaries: The list of beneficiaries who worked under MGNREGA since five years was obtained from Gram Panchayat of the selected villages and from each selected village ten beneficiaries were selected randomly to constitute a sample size of 320 beneficiaries.
Research Design & data collection: An exploratory research design was used for the present study. Interview schedule was prepared and pre-tested. Data were collected in face to face situation. The interview with the beneficiaries was conducted at their resident or place with comfort situation.
RESULTS AND DISCUSSION The personal, socio – economic and psychological characteristics of the beneficiaries were studied. The profile of beneficiaries in respect of these characteristics is presented and described in this section. Personal Characteristic Personal characteristics of beneficiaries’ viz. gender, age, educational qualification, caste, family size and family type of the beneficiaries were included in the study. The findings pertaining to distribution of beneficiaries on these characteristics are presented in the succeeding paragraphs.
Shubhangi Parshuramkar et al.

Indian Journal Of Natural Sciences www.tnsroindia.org. © IJONS
Vol.5 / Issue 28/ February 2015 International Bimonthly ISSN: 0976 – 0997
2849
Gender: Gender plays important role in participation of family members in deciding their role, particularly in income generating activities. The gender wise distribution of beneficiaries of MGNREGA is presented in the Table 2.
The gender wise distribution of MGNREGA beneficiaries indicated that 71.56 per cent of the beneficiaries were male and only 28.44 per cent beneficiaries were female. [1] In a study on “Impacts and Implications of MGNREGA on labour supply and income generation for agriculture in central dry zone of Karnataka”, reported that the share of women in total employment of MGNREGA was 46.22 per cent. Age: Age is normally an indicator of the maturity, experience, depth of knowledge and physical strength/fitness of the beneficiary. This factor is important for the participants of MGNREGA because it involves physical labour. The age wise distribution of beneficiaries is presented in Table 3.
The age wise distribution of beneficiaries in Table 3 reveals that 35.00 per cent beneficiaries belonged to age group between 31 to 40 years. It was followed by 34.38 per cent of beneficiaries belonging to age group of 41 to 50 years and 18.44 per cent belonged age group of 51 to 60 years. Similarly, one tenth (10.93%) beneficiaries were in the age group of 18 to 30 years, while; only 1.25 per cent beneficiaries were above 60 years. It is observed that majority of the beneficiaries were in the age group of 31-40 years and 41 to 50 years (69.38%). It might be due to the reason, that mostly middle and young age group people are the key generators of income, which constitute the main work force in the society. The people of this age group shouldering the responsibility of the family. Hence, they were actively engaged in money generating for fulfilling the needs of the family. [2] Also reported that majority (75%) of the MGNREGA workers belonged to the age group of 30-50 years. Educational qualification: Education is considered as an important factor, which can positively influence the knowledge, understanding, and working efficiency of the individual. The distribution of beneficiaries according to their level of educational qualification is presented in Table 4.
The data presented in Table 4 showed that nearly one third beneficiaries (29.38%) were educated up to high school, followed by 21.87 per cent having college level of education. Sizeable percentage (20.31%) of beneficiary’s had attended middle school education level. About one fifth (18.13%) beneficiaries were educated up to primary school and 10.31 per cent beneficiaries were illiterate. From the above data it can be revealed that 90.00 per cent of beneficiaries were educated. It was also observed that this level of education was available in their respective villages. The above findings are supported by the findings of [2] observed that 40.50 per cent of MGNREGA beneficiaries in Wayanad district had studied up to high school, followed by middle school (25%) and primary level (20.5%). The findings of the study indicated that educated rural men and women participated in the MGNREGA. It shows that MGNREGA provided succor, not only to illiterates, but also helped educated by providing gainful employment in their villages Caste: Caste is the hereditarily ascribed class of the individual. Caste category wise distribution of beneficiaries of MGNREGA in the area of study is presented in Table 5.
From the Table 5, it is observed that 35.32 per cent beneficiaries belonged to OBC category,which included Kunbis and Kohalis, domiciled in large numbers, in eastern Vidarbha. Other caste categories observed in the area of study were, Scheduled Tribe19.06per cent, Nomadic Tribes (NT- B)15.00 per cent, Scheduledcaste12.81 per cent, followed by SBCs (7.81%), Nomadic Tribe-C category (4.06%), Nomadic Tribe-D(1.56) and Vimukta Jati (VJ-A) category (1.25 %). It is observed from the findings that the beneficiaries included, men and women from all the caste categories, as MGNREGA provided employment opportunities for all the needy individuals irrespective of their caste categories.
Shubhangi Parshuramkar et al.

Indian Journal Of Natural Sciences www.tnsroindia.org. © IJONS
Vol.5 / Issue 28/ February 2015 International Bimonthly ISSN: 0976 – 0997
2850
Family type: Various studies have shown that family type is an important variable affecting the role of individual in income generating activities of the family. Distribution of beneficiaries according to their family type is presented below.
The distribution of the beneficiaries in Table 6 according to their family type indicated that, little more than one half (59.06%) were from nuclear families, followed by 40.94 per cent beneficiaries from joint family. The findings are supported by the findings of [3] in their study on empowerment effects of MGNREGA through field survey in Bihar, Jharkhand, Rajasthan and Himachal Pradesh, observed that most of the beneficiaries were married and were from nuclear families. Family size: The size of family can facilitate or constraints the participation in income generating activities of its members, depending on the personal and situational factors.
The data presented in Table 7 reveals that, nearly two third (68.12%) beneficiaries were from medium size of family, one fourth (25.32%) beneficiaries reported, having small families i.e. up to 3 family members. Only 6.56 per cent beneficiaries were having large family size (7 to 9 members). It is thus, evident from the findings that, majority of beneficiaries of MGNREGA belonged to medium size of families, with four to six members, while the participation in MGNREGA was lowest among big size families, with more than seven members. These findings are supported by the findings of [4] observed that the family size up to four members was predominant among, both beneficiaries (65.9%) and non-beneficiaries (85%) of MGNREGA. Socio- economic characteristics
Under the socio-economic characteristics, land holding, occupation, annual income of family, social participation, sources of information, availing other Govt. Schemes and socio-economic status of the beneficiaries were included in the study. Land holding: Land holding is the key component of farm occupation. It is indicative of the economic status of an individual, as well as his occupational and income generation capacity. The landless and marginal farmers need more support from programmes, like MGNREGA for their livelihood. Table 8 shows that, 48.13 per cent beneficiaries of MGNREGA were marginal farmers were having land holding up to 1.00 hectare, followed by 41.87 per cent landless beneficiaries. Nearly, one tenth (9.69%) beneficiaries were small farmers having land holding between 1.01 to 2.00 hectares. There was no single beneficiary from medium and large land holding group. The livelihood development programme of MGNREGA specifies that, the beneficiaries of the programme should be from, poor and downtrodden classes of the village. The findings of the study are in conformity to this norm. Occupational status: Occupation is an important indicator of source of earning and livelihood. The data presented in Table 9 indicated that 57.19 per cent of the selected beneficiaries were engaged in agriculture plus labour for wage earning as a supportive endeavor to farming, followed by, 41.57 per cent who were working as labour for wage earning in MGNREGA and other farmers field. Only, 0.62 per cent beneficiaries were engaged as daily wages plus farming plus livestock wagers category. Only one (0.31%) beneficiary, each, reported wages plus business and wages plus farming plus business as occupation. The above findings revealed that all the wage holders’ beneficiaries were landless, whereas, the beneficiaries under the category of wage + farming were mostly marginal farmers. Annual income of family: Family income is a main determinant of financial status of an individual. From Table 10, it is observed that 80.63 per cent of the families of the beneficiaries had lower level of annual family income i. e. below
Shubhangi Parshuramkar et al.

Indian Journal Of Natural Sciences www.tnsroindia.org. © IJONS
Vol.5 / Issue 28/ February 2015 International Bimonthly ISSN: 0976 – 0997
2851
Rs. 53,333 whereas, 17.50 per cent beneficiaries reported medium level of family income. Only 1.87 per cent beneficiaries reported higher level of annual income of their families.The average annual income of all families was computed to Rs. 42336/-. It is observed that majority (80.63%) of families of the beneficiaries’ belonged to lower category of annual income of up to Rs53333. It is evident that the families belonging to lower income categories need economic support for their livelihood and MGNREGA has benefited exactly this segment of rural population by providing gainful employment to them in their villages Social participation: It refers to the participation/position occupied by beneficiaries in various formal and informal social organizations in the village or outside. The levels of social participation were calculated and the distribution of beneficiaries is presented in Table 11. From the Table 11, it is seen that nearly three fourth of the beneficiaries (73.13%) had no social participation. One fourth of beneficiaries (25.31%) having low level of social participation. Only 1.25 percent beneficiaries reported medium and 0.31 per cent reported higher level of social participation. It is evident from findings that nearly three fourth of the beneficiaries had no involvement in any of the social organizations functioning in the area of study. At least twelve important formal and non formal social organizations were active in the sample villages, included in the study. However, participation of MGNREGA beneficiaries in those organizations was very poor. Sources of information: The timely and appropriate use of available information sources is essential for progress. The participants in MGNREGA mostly come from poor segment of the rural community. The data recorded in Table 12 shows that, majority i.e 84.37 per cent beneficiaries regularly used formal sources like Gramsevak/VDO whereas, 28.13 per cent of Agriculture Assistant of Agriculture Department for regularly seeking information. Among informal information sources, Sarpanch and Local leaders were the regularly consulted as sources of information by 60.00 per cent and 30.63 per cent of the beneficiaries, respectively. Neighbours, relatives and friends were, sometimes used as source of information by 33.03 per cent, 32.5 per cent and 31.56 per cent of beneficiaries respectively, while 60.0 per cent,61.56 per cent and 57.19 per cent of them never consulted the same source. Among information sources from mass media 34.06 per cent, 30.00 per cent used television and newspaper sometimes, respectively. Majority of MGNREGA beneficiaries never used mass media to seek information. Only 6.87 per cent beneficiaries sometimes used radio, to get information. The findings indicated that the Gramsevak /VDO and Sarpanch of village Grampanchayat were mostly used by the villagers for seeking information about MGNREGA. The mass media did not play significant role in the providing information about MGNREGA. It is apparent that the functioning of MGNREGA is at local level the information is available at village itself. However, the newspapers and television contributed towards creating awareness among, 34.06 per cent and 30.00 per cent beneficiaries respectively. Socio– economic status: Socio–economic status of the beneficiaries influences availability of various farm input and necessities like land holding, accessibility to information sources etc. The distribution of the beneficiaries according to their socio –economic status is presented in Table 13. The socio - economic status profile of the beneficiaries, depicted in Table 13 indicated that 42.50 per cent beneficiaries belonged to lower socio-economic status category. This was followed by 31.88 per cent beneficiaries occupying medium position in socio-economic hierarchy. It was followed by 14.37 per cent the beneficiaries belonging to medium- high and 9.38 per cent to very low socio -economic status group. Only 1.87 per cent beneficiaries of MGNREGA were from high socio-economic status category. The findings indicated that majority of beneficiaries of MGNREGA were from low and medium socio –economic status categories. The percentages of beneficiaries from high and high medium categories were low. Psychological Characteristics
Shubhangi Parshuramkar et al.

Indian Journal Of Natural Sciences www.tnsroindia.org. © IJONS
Vol.5 / Issue 28/ February 2015 International Bimonthly ISSN: 0976 – 0997
2852
The motive behind participation by MGNREGA beneficiaries was studied as a psychological characteristic of the beneficiaries. The distribution of beneficiaries according to their motives and level of motivation is presented in this section. Motives behind participation: Distribution of beneficiaries according to their motives behind participation in MGNREGA scheme is presented in Table 14. It is observed from the findings presented in Table 14 that earning money for fulfillment of various family and farm needs was important motive behind participation in MGNREGA. The wages earned through MGNREGA were mostly needed for improvement of economic condition of the family (84.06%), maintenance of house (69.06%), providing health care to family members (55.94%). Interestingly, 39.00 per cent beneficiaries wanted to develop self confidence, through MGNREGA, as it provided gainful employment. Similarly 47.81 per cent beneficiaries reported, need money to purchase farm inputs as a motive behind earning wages through MGNREGA. It is, thus, evident that, earning more money for the family, marriages, purchase of equipments, maintenance of house, expenditure on health care, were the important motivating factors behind the participation of villagers in MGNREGA. Employment generated through MGNREGA One of the important objectives of MGNREGA is to provide at least 100 days of guaranteed wage employment, in every financial year to every household whose adult members volunteer to do unskilled manual work. The average of annual employment provided to the beneficiaries under study for last five years was calculated and the findings are presented in Table 15. It is observed from the findings that majority i. e. 69.37 per cent beneficiaries received 50 – 100 days of employment, on average during last five years through MGNREGA. A small percentage (5.62 %) of beneficiaries received employment for more than 100 days on average. However, 25.00 per cent beneficiaries reported less than 50 days of average employment during last five years. It is, evident from the findings that MGNREGA has provided employment to the needy adults for 65.67 man days on average. The generation of employment, obviously, depends upon the sites available for labourious work and availability of men and women in the village to participate in the project. Kenchanagouda (2007) revealed that forty per cent of the beneficiaries received 50 to 100 man days of employment, while 42.00 per cent got employment for 100 to150 man daysunder “Sampoorna Grameen Rozgar Yojana (SGRY) in Gadag district of Karnataka.
CONCLUSION It might be concluded that 69.37 per cent beneficiaries received 50 – 100 days of employment on average during last five years through MGNREGA. A small percentage (5.62 %) of beneficiaries received employment for more than 100 days on average. However, 25.00 per cent beneficiaries reported less than 50 days of average employment during last five years. On an average 65.67 man days employment have been generated by the MGNREGA in eastern Vidarbha.
REFERENCES 1. Harish, B.G., N. Nagaraj, M.G. Chandrakanth, P.S. Srikanth, Murthy., P.G. Chengappa and G. Basvaraj ( 2011):
Impacts and implications of MGNREGA on labour supply and income generation for agriculture in Central Dry Zone of Karnataka.Agricultural Economics Research Review . Vol. 24. (Conference number) : 485-494 .
2. Thadathil, M. S. and V. Mohandas(2012):Impact of MGNREGS on labour supply to agricultural sector of Wayanad district in Kerala.Agricultural economics Research Review Vol. 25(1) : 151-155.
Shubhangi Parshuramkar et al.

Indian Journal Of Natural Sciences www.tnsroindia.org. © IJONS
Vol.5 / Issue 28/ February 2015 International Bimonthly ISSN: 0976 – 0997
2853
3. Pankaj, A. and R. Tankha (2010): Empowerment effects of the NREGS on Women workers: A study in four States. Economic and Political weekly, 30: 45-55.
4. Sarkar, P., J. Kumar and Supriya (2011): Impact of MGNREGA on reducing rural roverty and improving socio-economic status of rural Poor: A Study in Burdwan District of West Bengal. Agricultural Economics Research Review. Vol. 24: 437- 448
Table 1: District wise MGNREGA beneficiaries and selected beneficiaries Sr. No. Districts Total MGNREGA beneficiaries No. of beneficiaries selected
1 Bhandara 31029 80 2 Chandrapur 42490 80 3 Gondia 46237 80 4 Gadchiroli 36018 80 Total 155774 320
Table 2: Distribution of beneficiaries according to their gender
Sr. No. Gender Beneficiaries ( n = 320) Number Percentage
1 Male 229 71.56 2 Female 91 28.44 Total 320 100
SD =0.49 Table 3: Distribution of beneficiaries according to their age categories
Sr. No. Age (Years) Beneficiaries ( n = 320) Number Percentage
1 18 to 30 35 10.93 2 31 to 40 112 35.00 3 41 to 50 110 34.38 4 51 to 60 59 18.44 5 Above 60 04 01.25 Total 320 100
Mean =42.46 SD =9.16 Table 4: Distribution of beneficiaries according to their level of education
Sr. No. Level of Education
Beneficiaries ( n = 320) Number Percentage
1. Illiterate 33 10.31 2. Can read and write 00 00.00 3. Primary school 58 18.13 4. Middle school 65 20.31 5 High school 94 29.38 6. College 70 21.87
Total 320 100
Mean = 7.31 SD =4.07
Shubhangi Parshuramkar et al.

Indian Journal Of Natural Sciences www.tnsroindia.org. © IJONS
Vol.5 / Issue 28/ February 2015 International Bimonthly ISSN: 0976 – 0997
2854
Table 5: Distribution of respondents according to their caste categories
Sr. No. Caste category Beneficiaries ( n = 320) Number Percentage
1. Scheduled Caste (SC) 41 12.81 2. Scheduled Tribe (ST) 61 19.06 3. Vimukta Jati (VJ -A) 04 01.25 4. Nomadic Tribe (NT-B) 48 15.00 5 Nomadic Tribe (NT-C) 13 04.06 6. Nomadic Tribe (NT-D) 05 01.56 7 Other Backward Classes (OBC) 113 35.32
8 Special Backward Classes (SBC) 25 07.81 9 Open 10 03.13
Total 320 100 Mean = 4.82 SD =2.56
Table 6: Distribution of beneficiaries according to their family type
Sr.No. Family type
Beneficiaries ( n = 320) Number Percentage
1. Nuclear family 189 59.06 2. Joint family 131 40.94 Total 320 100.00
Mean = 1.40 SD =0.49
Table 7: Distribution of beneficiaries according to their family size
Sr.No. Family Size
Beneficiaries ( n = 320) Number Percentage
1. Small 81 25.32 2. Medium 218 68.12 3. Large 21 06.56 Total 320 100
Mean = 4.38 SD =1.50
Table 8: Distribution of beneficiaries according to land holding Sr. No.
Land holding Beneficiaries ( n = 320) Number Percentage
1 Landless 134 41.87 2 Marginal 154
48.13
3 Small 31 09.69 4 Semi-medium 01
00.31
5 Medium 00
00.00 6 Large 00
00.00
Total 320 100 Mean = 0.39 SD =0.46
Shubhangi Parshuramkar et al.

Indian Journal Of Natural Sciences www.tnsroindia.org. © IJONS
Vol.5 / Issue 28/ February 2015 International Bimonthly ISSN: 0976 – 0997
2855
Table 9: Distribution of beneficiaries according to their occupational category
Sr. No. Occupational category
Beneficiaries ( n = 320) Number Percentage
1 Wages 133 41.57 2 Wages +Skilled wages 00 00.00 3 Wages + Farming 183 57.19 4 Wages + Livestock 00 00.00 5 Wages + Business 01 00.31 6 Wages + Farming + Livestock 02 00.62 7 Wages + Farming + Business 01 00.31 Total 320 100
Mean = 2.20 SD =1.07 Table 10: Distribution of beneficiaries according to annual income of family Sr.No. Annual Income Category Beneficiaries ( n = 320)
Number Percentage 1 Low (up to Rs53333) 258 80.63
2 Medium ( Rs 53334 – Rs. 95666) 56 17.50 3 High (above Rs. 95666) 06 01.87 Total 320 100.00
Mean=Rs.42335.94 SD =19783.95
Table 11: Distribution of beneficiaries according to level of social participation
Sr. No Level of Social Participation
Beneficiaries (n=320)
Number Percentage
1 No participation 234 73.13
2 Low 81 25.31
3 Medium 04 01.25
4 High 01 00.31
Total 320 100
Mean= 0.29 SD =0.54
Shubhangi Parshuramkar et al.

Indian Journal Of Natural Sciences www.tnsroindia.org. © IJONS
Vol.5 / Issue 28/ February 2015 International Bimonthly ISSN: 0976 – 0997
2856
Table 12: Distribution of beneficiaries according to their sources of information
Sr. No.
Information Sources
Beneficiaries (n=320)
Regular Sometime Never
F % F % F %
1 Formal Sources a) Gramsevak / Village Development Officer b)Agri. Asstt. of Agri. Dept c) Personnel from Agri. University d) Extension officer/ Agri. Officer e)Block Development Officer f) Taluka Agri. Officer
270 90 04 35 17 02
84.37 28.13 01.25 10.94 05.31 00.63
46 105 13 162 135 28
14.38 32.81 04.06 50.62 42.19 08.75
04 125 303 123 168 290
01.25 39.06 94.69 38.44 52.50 90.62
2 Informal Sources a)Sarpanch b)Local leaders c)Friends d)Relatives e)Neighbours
192 98 36 19 22
60.00 30.63 11.25 05.94 06.87
119 174 101 104 106
37.19 54.37 31.56 32.50 33.13
09 48 183 197 192
02.80 15.00 57.19 61.56 60.00
3 Mass media a)Radio b)Television c)New papers
00 03 08
00.00 00.94 02.50
22 109 96
06.87 34.06 30.00
298 208 216
93.13 65.00 67.50
Table 13: Distribution of beneficiaries according to socio- economic status categories
Sr. No
Socio economic status Categories
Beneficiaries (n = 320)
Number Percentage
1 Very low 30 09.38
2 Low 136 42.50
3 Medium 102 31.88
4 Medium – High 46 14.37
5 High 06 01.87
Total 320 100
Mean= 40.74 SD =15.46
Shubhangi Parshuramkar et al.

Indian Journal Of Natural Sciences www.tnsroindia.org. © IJONS
Vol.5 / Issue 28/ February 2015 International Bimonthly ISSN: 0976 – 0997
2857
Table 14: Table showing distribution of beneficiaries according to motives behind participation in MGNREGA
Sr. No.
Motives Beneficiaries (n=320) Number Percentage
1 2 3 4 5 6 7 8
To improve economic condition of the family To earn money for maintenance of house To earn money for health care of family members To earn money purchase of farm inputs To develop self confidence by earning wages through manual work To earn money for purchase of better facilities at home To earn money for celebration of marriage To earn money for financing business
269 221 179 44
125 64
125 14
84.06 69.06 55.94 47.81 39.00 20.00 13.75 04.37
Table 15: Distribution of beneficiaries according to mean man days of employment generated through MGNREGA
Sr.No Mean man days Beneficiaries (n=320)
Frequency Percentage
1 Up to 50 days 80 25.00
2 51 – 100 days 222 69.37
3 Above 100 days 18 05.62
Total 320 100.00
Mean = 65.67 SD=21.13
Shubhangi Parshuramkar et al.

Indian Journal Of Natural Sciences www.tnsroindia.org. © IJONS
Vol.5 / Issue 28/ February 2015 International Bimonthly ISSN: 0976 – 0997
2858
How can We Develop Job Involvement of Employees and Customers Satisfaction with their Performance? (Case study: Keshavarzi Bank of Tehran) Nooshin Arian*, Mahmoud Nooraii and Bahaalddin Mousavi Makoyi Department of Management, Faculty of Humanity, Abhar Branch, Islamic Azad University, Abhar, Iran. Received: 20 Nov 2014 Revised: 28 Nov 2014 Accepted: 18 Dec 2014 *Address for correspondence Nooshin Arian Department of Management, Faculty of Humanity, Abhar Branch, Islamic Azad University, Abhar, Iran. E.Mial: [email protected]
This is an Open Access Journal / article distributed under the terms of the Creative Commons Attribution License (CC BY-NC-ND 3.0) which permits unrestricted use, distribution, and reproduction in any medium, provided the
original work is properly cited. All rights reserved.
The present study aimed to explain how to develop job involvement of employees and customers satisfaction of their performance (case study: Keshavarzi bank of Tehran city). This study is a descriptive-survey method. The study population is including all managers, employees and customers of Keshavarzi bank branches of Tehran city. The managers and employees are 2641. The study population is including 335 managers and employees of bank being selected randomly based on the statistics of bank employees in 24 regions of Tehran city. The data collection method is field and the study measure is questionnaire. Its validity by content, construct and face validity is supported acceptable and reliability is supported as 0.954 by Cronbach’s alpha. A standard questionnaire is used for data collection. For data analysis, the normality of data is investigated via kolmogorovsmirnov test. Then, the data analysis is done by Pearson correlation coefficient and regression. The results of the study showed that supervisor support has positive relation with job involvement of employees. Giving feedback by supervisors has positive relation with job involvement of employees. Job involvement is positively associated with evaluation of employees’ performance. Job independence increases the relationship between supervisors support with job involvement of employees. Job independence increases the relationship between presenting feedback by supervisors with job involvement of employees. Job involvement of employees intervenes with the relationship between supervisors support and evaluation of employees’ performance. Job involvement of the employees doesn’t intervene in relationship between giving feedback of supervisors and evaluation of the employees’ performance. Keywords: Job involvement, Job independence, Supervisors support, Giving feedback, Performance evaluation.
RESEARCH ARTICLE
ABSTRACT

Indian Journal Of Natural Sciences www.tnsroindia.org. © IJONS
Vol.5 / Issue 28/ February 2015 International Bimonthly ISSN: 0976 – 0997
2859
INTRODUCTION
Today, employees work involvement is one of the effective factors from the view of authorities on organization management and improving employees’ performance is of great importance. The results of the studies showed that in the past decade, determining the effective factors on creating work involvement of employees in organization received much attention from managers of human resources, commercial leaders and academic researchers (Harter et al., 2003). On the other hand, Bakker et al., (2005) believe that labor force involvement increases commercial return and reduces labor force costs. The specialized, loyal and those employees consistent with organizational goals and values have strong motivation and can continue organizational membership and they are the main needs of each organization. The presence of such forces in each office and organization reduce absence, delay and turnover and also increase organization performance and mental happiness of employees and also it leads to high fulfillment of organization and employees goals (CheshmiMoghadam, 2006, 15). Job involvement is defined as the individual psychological identity or his commitment to job (Azizi et al., 2008, 256). Managers and supervisors as important factors of organizational policies play important role in work involvement and support of employees. In recent years, it is attempted to present suitable services from qualitative and quantitative aspects in banks and attract the attention of customers. It seems that by creating private and state banks, we have a far distance from the real position of presenting good services to customers. Today, authorities are aware of the importance and role of human resources as country development factor. The most important asset of any organization is its human resources (Asefzade, 2003, 18). This study is based on the relevant concepts of human resources and investigates the relationship between supervisors support with employees’ involvement in work and their autonomy. This is a new step and by using its results, we can improve productivity of human resources. Creating and increasing involvement of employees to jobs and duties is a step to improving morale, commitment, growth, progress and self-belief of the employees and it brings the profitability and economic prosperity of organizations. As it was said, the present study attempted to study the relationship between supervisors support with work involvement among the employees and the role of freedom of employees in Keshavarzi bank and the results of the study can be applied by the authorities of Keshavarzi bank and by supporting the employees and giving work autonomy to them, their attempt and involvement in the affairs and customers satisfaction can be improved.
Theoretical background
Organizational support
Organizational support theory states that perception of organizational support is improved by inclination of employees to giving organizational quasi- humanistic features. Perceived organizational support is the organization belief as the organization gives importance to it and his aid for organization success is of great importance. Perceived organizational support refers to the perception of employees regarding the amount in which organization gives importance for their collaboration and gives importance for their welfare. The organizational support perception has importance outcomes of performance and welfare of employee (Krishnan et al., 2012, 2). Such perceived organizational support increases the employees’ commitment to help the organization to achieve its goals, their effective commitment to organization and expectations as progress includes reward. The behavioral results of organizational support perception include the increase of in-role and extra-role performance and reduction of negative behaviors as absence and turnover (Krishnan et al., 2012, 2).
Based on the investigation regarding the review of literature and the results of organizational support perception by Sitesh Kumar, the backgrounds of organizational support perception are divided into three groups:
1. Fairness and justice (procedural justice in performance assessment, creating opportunity of issues and etc.)
2. Supervisors support (e.g. Culture of family work, organizational perceived support and etc.)
Nooshin Arian et al.

Indian Journal Of Natural Sciences www.tnsroindia.org. © IJONS
Vol.5 / Issue 28/ February 2015 International Bimonthly ISSN: 0976 – 0997
2860
3. Rewards and job conditions (e.g. Job stress, growth opportunity and etc.)(Krishnan et al, 2012, 3).
Perceived organizational support includes the outcomes and impacts including seven general types: The more the people feel they are under the organization support, the more their commitment to the organization. 1. Organizational commitment 2. Job satisfaction 3. Job performance 4. Intention to stay in organization (Krishnan et al., 2012, 3).
Organizational support includes the job relevant effects as job satisfaction and job satisfaction is the positive general reactions and attitudes of the staffs to the job. The more the employees feel they are supported by organization, the more their job satisfaction. In addition, organizational support is effective on increasing job involvement and it is involvement with the work related interests. Perceived organizational support from the personnel has positive effect on performance and intention to stay and reduces job pressures and feedback behaviors (e.g. intention to leave and leaving)(Zaki, 2004, 3).
The concept and definitions of job involvement
Kanungo (1982) referred to an important issue and distinguished between job involvement and work involvement. He believed that job involvement is a type of descriptive belief with job activities but work involvement is a normative belief created over time. Job involvement states how people use their efforts to their job performance. In addition, job involvement besides the recognition includes active use of emotions and behaviors. Mi et al., shows that job involvement is considered as effective factors in job involvement and those with high job involvement in their roles have better understanding of their job (Mi et al., 2004). Attachment is the emotional factor of involvement, attachment leads to discovery of meaning and goal in benefits and wage and involvement and honor refer to reward. Attraction is with the cognitive component of involvement. Attraction is consistent with reward as the time passes rapidly and it is difficult to separate the employee from work (Ibid, 2).
Performance management
Literally, performance means the state or quality of function. Thus, organizational performance is a general construct referring to the organizational operation method. Based on the process of determining the quality of effectiveness and efficiency of previous measurements, performance is divided into two components: 1) The efficiency describing the use of resources in service production or products by organization, the relationship between real and good combination of inputs for producing definite outputs, 2) Effectiveness describing the degree of achieving organizational goals (Neely et al., 8, 2002). Performance management process is established as it can be designed via guaranteeing the continuous improvement of people and groups performance for strategic improvement and organizational effectiveness (Armstrong, 2001, 127). Performance management is a part of management of human resources and its duty is creating relationship between management and it considers innovations and creativities of people in performance evaluation. Performance management besides improving current competence of people and entire system considers the relationship between one’s competence with their real function (coordination of potential competence with the actual performance and ability) and it also follows the improvement and development of new competences of people for coordination with modern technologies and one’s changing world (Almasi, 1995, 28).
Job satisfaction and performance
One of the most challenging issues of job satisfaction is its relation with performance. There are three different views in this regard: Job satisfaction increases performance.
Nooshin Arian et al.

Indian Journal Of Natural Sciences www.tnsroindia.org. © IJONS
Vol.5 / Issue 28/ February 2015 International Bimonthly ISSN: 0976 – 0997
2861
Job performance provides job satisfaction. There is no inherent relation between job satisfaction and performance and they are varied rewards interfering. A weak research support is for two first views. 20 studies in this regard show that there is a weak relation between job satisfaction and performance and it shows the satisfied employee has no high performance. The results of the studies showed that second view is supported to some extent and high performance leads to high satisfaction. However, the third view introduces reward as intervening variable in relationship between performance and job satisfaction and is supported more. It means performance is not the outcome of job satisfaction.
Review of Literature
Hakanen et al., (2005) in their study investigated the relationship between job demands, job resources and job involvement. They selected a sample of 1919 graduated dentists. By the data analysis of hierarchy regression analysis, they found that job resources are associated with the intention to stay of dentists, job involvement and their commitment to their job. Cathcart et al., (2004) in their study investigated the relationship between control of nursing managers and nursing personnel involvement on 651 working group of nursing personnel (a caring system) and found that there is a high correlation between high work involvement and control of nursing manager. Laschinger&Leiter (2006) applied professional nursing working environment. Their selected sample is 8597 employees, nurses of hospital. The results of the study showed that mental burn out moderates the relationship between work life factors and contrasting events: Work environment with the support of authorities of higher fields for professional jobs leads to more involvement and safe caring of patient. In their study, a fundamental role of nursing management in the impact on work life quality, availability of people for organizations, supporting nursing model of physician-nurse relations was supported. Harter et al., (2003) investigated the relationship between job involvement, employee satisfaction, customer satisfaction, return, profit, employees’ movement and safety in business unit. They selected a sample of 7939 business units, 36 independent companies of 5 various industries. The results showed that there are generalized relations between job involvement and 5 levels of organizational outcomes (productivity, customer satisfaction, employee safety, employees turnover and profit).
Study hypotheses 1. There is a positive relation between supervisors support and job involvement of employees. 2. There is a positive relation between feedback by supervisors and job involvement of employees. 3. There is a positive relation between employees’ performance evaluation and job involvement of employees. 4. Job autonomy increases the relationship between supervisors support and job involvement of employees. 5. Job autonomy increases the relationship between giving feedback by supervisors and job involvement of
employees. 6. Job involvement of employees intervenes in the relationship between supervisors support and evaluation of
employees’ performance. 7. Job involvement of employees intervenes in the relationship between giving supervisors feedback and
evaluation of the performance of employees.
Study population and sample size
In the present study, the study population is including all managers, employees and customers of branches of Keshavarzi bank of Tehran city and the number of managers and employees are 2641 and the number of customers is infinite. The study sample including 335 managers and bank employees are selected based on the bank employees’ statistics in 24 regions of Tehran city as random and the statistical sample of customers is 335 as selected equally in bank branches as convenient sampling.
Nooshin Arian et al.

Indian Journal Of Natural Sciences www.tnsroindia.org. © IJONS
Vol.5 / Issue 28/ February 2015 International Bimonthly ISSN: 0976 – 0997
2862
Study measures This study applied the questionnaire of various researchers and scientists and the validity of questionnaire is supported. In addition, to obtain the validity of questionnaire, content and face validity is used. Content validity: It assures that scale is including a series of adequate items to use concept. To achieve content validity, after designing questions of questionnaires, based on the theoretical basics and study goals, the questionnaire is tested on a 25-people group and based on their views, the ambiguous, irrelevant questions are identified and corrected or excluded. Cronbach’s alpha coefficient is used to determine reliability of questionnaire. By initial distribution of 50 questionnaires, reliability coefficient with 34 questions and Cronbach’s alpha for each variable and entire questionnaire are presented in Table 1. Based on the study method principles and coefficients above 0.7, questionnaire reliability is supported.
Pearson correlation test The table 2 shows the coefficients of Pearson correlation test between the supervisors support, giving feedback by supervisors and job involvement and evaluation of employees’ performance. Study hypotheses First hypothesis: There is a positive relation between supervisors support and job involvement of employees.
Table 3 shows the regression variance analysis to investigate the absolute linear relation between two variables.Based on the results of statistical tests, it can be said that at the significance level 5%, supervisors support has positive and significant impact on job involvement of employees. Thus, first hypothesis is supported at the confidence interval 95%. Second hypothesis: There is a positive relation between supervisors feedback and job involvement of employees. Table 5 shows the regression variance analysis to investigate the absolute linear relation between two variables. Based on the results of statistical tests, it can be said that at the significance level 5%, supervisors’ feedback has positive and significant impact on job involvement of employees. Thus, second hypothesis is supported at the confidence interval 95%. Third hypothesis: There is a positive relation between supervisors’ performance and job involvement of employees. Table 6 shows the regression variance analysis to investigate the absolute linear relation between two variables.Based on the results of statistical tests, it can be said that at the significance level 5%, supervisors’ performance has positive and significant impact on job involvement of employees. Thus, third hypothesis is supported at the confidence interval 95%. Fourth hypothesis: There is a positive relation between supervisors’ support and job involvement of employees.To test this hypothesis, two regression models are applied as another variable as job autonomy has moderating role on the relationship between these two variables, supervisors support and job involvement. In the first model, the impact of supervisors support alone on employees’ involvement is defined. The correlation coefficient between these two variables is 0.493 and it shows the positive correlation between two variables. The estimated R2 is 0.243 and it shows that 24% of the changes of job involvement of employees depend upon the supervisors’ support variable. Based on F test, linearity of regression model is supported as the F is 102.147 and is significant with degree of freedom (1, 318) at confidence interval 0.01. Also, Durbin-Watson statistics is equal to 1.5095 and it indicates the lack of correlation between the residuals.
Nooshin Arian et al.

Indian Journal Of Natural Sciences www.tnsroindia.org. © IJONS
Vol.5 / Issue 28/ February 2015 International Bimonthly ISSN: 0976 – 0997
2863
Table 8 shows the regression variance analysis to investigate the absolute linear relation between two variables.As shown, Sig =0.000 and less than 5% (P- value <0.05) and linearity of the relationship between independent variables of supervisors support and moderating variable of job autonomy to job involvement as dependent variable is supported. Thus, job autonomy can increase job involvement and supervisors support. Based on its significance level (sig=0.000<0.05), null hypothesis regarding the zero value of this coefficient is rejected and this correlation is significant and by confidence interval 95%, the hypothesis regarding the job autonomy of the relationship between supervisors support and job involvement of employees is increased and it is supported. Fifth hypothesis: Job autonomy increases the relationship between giving feedback and job involvement of employees.To test this hypothesis, two regression models are used as another variable as job autonomy has moderating role on the relationship between these two variables, giving feedback and job involvement. In the first model, the impact of supervisors’feedback alone on employees’ involvement is defined. The correlation coefficient between these two variables is 0.399 and it shows the positive correlation between two variables. The estimated R2 is 0.159 and it shows that 16% of the changes of job involvement of employees depend upon the supervisors’ support variable. Based on F test, linearity of regression model is supported as the F is 60.242 and is significant with degree of freedom (1, 318) at confidence interval 0.01. Also, Durbin-Watson statistics is equal to 1.556 and it indicates the lack of correlation between the residuals. As shown, Sig =0.000 and less than 5% (P- value <0.05) and linearity of the relationship between independent variables of supervisors feedback and moderating variable of job autonomy to job involvement as dependent variable is supported. Thus, job autonomy can increase job involvement and supervisors feedback. Based on its significance level (sig=0.000<0.05), null hypothesis regarding the zero value of this coefficient is rejected and this correlation is significant and by confidence interval 95%, the hypothesis regarding the job autonomy of the relationship between supervisors feedback and job involvement of employees is increased and it is supported. Sixth hypothesis: The job involvement of employees intervenes in the relationship between supervisors support and evaluation of employees’ performance.To test this hypothesis, hierarchy regression is used in which supervisors support is independent variable, evaluation of employees’ performance dependent variable and job involvement is intervening variable. Based on Baron&Kenny (1986), the following conditions should be fulfilled to test the intervening variable effect. 1. Independent variable affects the intervening variable. The independent variables of supervisors support and
giving feedback affect intervening variable of job involvement. 2. Independent variable should affect dependent variable. 3. Table 11 indicates that independent variables of supervisors support and giving feedback affect the dependent
variable of evaluation of employees’ performance. 4. Moderating variable should affect dependent varaible. 5. Job involvement as moderating variable affects the evaluation of employees’ performance as dependent variable.
In addition to the above conditions, the impact of each of independent variables on dependent variable when moderating variable is added to regression equation is less than the time when moderating variable is not in regression equation. As shown in Table 12, when moderating variable is added to regression equation, the impact of supervisor support variableon performance evaluation variable is not less than when the moderating variable is not in equation.Thus, job involvement affects dependent variable. Based on coefficient of determination in cases 1, 2, job involvement adds about 0.085 (0.586-0.501=0.085) in increasing the impact of supervisors support on evaluation of employees performance and moderates in the relationship between them. Thus, null hypothesis is rejected and hypothesis 1 is supported.
Nooshin Arian et al.

Indian Journal Of Natural Sciences www.tnsroindia.org. © IJONS
Vol.5 / Issue 28/ February 2015 International Bimonthly ISSN: 0976 – 0997
2864
Seventh hypothesis: Job involvement of employees moderates in relationship between giving feedback and evaluation of employees’ performance. As shown in Table 13, when intervening variable, job involvement is added to regression equation, the effect of giving feedback by supervisors on evaluation of employees’ performance is higher than the case in which there is no intervening variable in equation. Thus, it can be said job involvement variable as intervening variable can not affect significantly the relationship between giving feedback and evaluation of employees’ performance. Thus, null hypothesis is supported and H1 is rejected.
DISCUSSION AND CONCLUSION It is proposed the top leaders of banks with direct daily contact with most of their labor forces affect them as the researches showed that those leaders in touch with their employees with their physical presence or their policies can have considerable impact on the perception of their supervisors. Thus, by training and developing the skills of bank managers can have independent and considerable impact on job involvement of their employees and their intention to stay in organization and they can improve work morale among the employees. It is proposed a good feedback system is created in organizations for achievement of employees to their job feedback as it is required the employees are aware of the quality of their work and they received the feedback of their work timely to let them to adjust their behaviors accurately to receive good rewards on time. Also, high level of information feedback regarding the results of work activities and return presents a tool to achieve good goals and job involvement and goal-tool relations are clarified. It is proposed the bank authorities by empathy, participation, support and continuous interaction provide the ground for development of employees’ performance and customers’ satisfaction. To increase good organizational outcomes namely job involvement and performance improvement, adequate educational courses can be held as the managers can be familiar with the principles of performance evaluation and using it. Also, managers are encouraged to use suitable behaviors in interaction with their subordinates. The banks should increase responsibilities and power by giving relative autonomy to the employees and increase the employees’ commitment. This creates the actualization, job promotion, satisfaction and collaboration among them. Managers should consider the spiritual needs of people and attempt to create a dynamic organizational climate for job involvement. By such measurements, it can be hoped the employees enjoy doing the duties in organization; they are satisfied and present a good behavior in organization. To improve involvement and job satisfaction, the managers can improve employees’ perception of meaning in work by job turnover, job enrichment and employees’ empowerment and considering enjoyment with work. The bank managers should consider the survey from the employees regarding organization values and considering health, morale and life conditions of employees to accept more organizational goals and values from the employees. Bank managers can focus more on involvement among the employees to their job and return positive outcomes to themselves and their organization and by identification of the employee’s needs and can attempt to improve social relations, using ethical codes and charters to improve job involvement of employees in organization.
REFERENCES 1. Armstrong, Michel. 2001. The strategies of human resources management. Translated by KhodayarAbili and
Hassan Movafaghi. Tehran: Fara publications. 2. Alvani, Seyed Mehdi. 2003. General management. 19th edition. Ney publications. 2003. 3. Beikzade, Jafar; Alayi, Mohammad Bagher; Eskandari, Karim. 2010. The investigation of the relationship between
organizational intelligence of managers with their performance in state organizations of AzarbayijanSharghi province. Management researches. Year 3. No. 8. p. 143-163.
4. Jafari, Mohammad Mehdi. 2011. The study of dependency between organizational climate and job performance of Bank Tejarat bank employees (case study: Employees of Bank Tejarat in Tehran city”. MA thesis of Islamic Azad University of Qazvin branch. Management and accounting school.
Nooshin Arian et al.

Indian Journal Of Natural Sciences www.tnsroindia.org. © IJONS
Vol.5 / Issue 28/ February 2015 International Bimonthly ISSN: 0976 – 0997
2865
5. CheshmiMoghadam, Hassan. 2006. The study of the relationship between organizational commitment of managers with their performance in state high schools of Sabzevar town. MA thesis of Tehran University. Phycology and educational Sciences School. Management and educational planning department. Educational planning and management department. Educational management.
6. Hosseini, M. H; Ahmadinejad, M. Ghaderi, S. 2010. The study and evaluation of services quality and its relation with satisfaction of customers. Case study of Bank Tejarat. Trading investigation. No. 42.
7. Khishi, Behruz. 2009. The study of the relationship between organizational health of schools with performance of the managers of schools of three academic regions of education of Maraghe town. MA thesis. Islamic Azad University of Banab.
8. Robins, Stephen. P. 2009. The theory of organization, organization plan. Translated by Seyed Mehdi Alvani, Hassan Danayifard, SafarAshrafi publications. Edition 29.
9. Robins, Stephen. P. 2009. The basics of organizational behavior. Translated by Ali Parsayian, Seyed Mohammad Arabi. Cultural researches office. Edition 22. 2009.
10. Robins, Stephen. 1997. Organization theory (organizational plan and structure). Translators: Seyed Mehdi Alvani and Hassan Danayifard. Eights edition. Safar-Ashraghi publications. Tehran.
11. Ackfeldt ,Anna-Lena a, Coote,Leonard V ,2005,A study of organizational citizenship behaviors in a retail setting, Journal of Business Research 58 , pp:151– 159.
12. Ahmad, Z.K. and Bakar, R.A. (2003), “The association between training and organizational commitment among the white-collar workers in Malaysia”, International Journal of Training and Development, Vol. 7 No. 3, pp. 166-85.
13. Aktaş, Hüseyin (2001), “İşletmePerformansınınÖlçülmesindeVeriZarflamaAnaliziYaklaşımı”, Celal Bayar Üniversitesi İ.İ.B.F. YönetimveEkonomiDergisi, 7(1), 163–175.
14. Alliger, G.M. and Janak, E.A. (1989), “Kirkpatrick’s levels of training criteria: thirty years later”, Personnel Psychology, Vol. 42, pp. 331-41.
15. Alliger, G.M., Tannenbaum, S.I., Bennett, W., Traver, H. and Shotland, A. (1997), “A meta-analysis of the relations among training criteria”, Personnel Psychology, Vol. 50, pp. 341-58.
16. AMOS, T.L., RISTOW, A. and RISTOW, L. 2004. Human Resource Management (2nd Edition). Lansdowne: Juta and Co Ltd.
17. ARMSTRONG, M. and BARON, A. 1998. Performance Management – The New Realities. London: IPD. 18. ASELAGE JUSTIN AND EISENBERGER ROBERT,2003 Perceived organizational support and psychological
contracts: a theoretical integration ,Journal of Organizational BehaviorJ. Organiz. Behav. 24, 491–509 , Published online in Wiley InterScience (www.interscience.wiley.com). DOI: 10.1002/job.211.
19. Bakker, A. B., Demerouti, E., &Euwema, M. C. (2005). Job resources buffer the impact of job demands on burnout. Journal of Occupational Health Psychology, 10, 170–180. doi:10.1037/1076-8998.10.2.170
20. Banai, M., &Reisel, W. D. (2007). The influence of supportive leadership and job characteristics on work alienation: A six-country investigation. Journal of World Business, 42: 463–476.
Table 1- Cronbach’s alpha coefficients based on variables Variable Cronbach’s alpha
Job involvement 0.865 Job autonomy 0.776
Job feedback 0.866 Perceiving supervisors support 0.893 Performance 0.914 Total Cronbach’s alpha 0.954
Nooshin Arian et al.

Indian Journal Of Natural Sciences www.tnsroindia.org. © IJONS
Vol.5 / Issue 28/ February 2015 International Bimonthly ISSN: 0976 – 0997
2866
Table 2- Pearson correlation test Variable Pearson
coefficient Error level Significance
level Result
Supervisors support 0.493 0.01 0.000 H0 is rejected. There is a relationship.
Giving feedback by supervisors
0.399 0.01 0.000 H0 is rejected. There is a relationship.
Job involvement 0.602 0.01 0.006 H0 is rejected. There is a relationship.
Table 3- The analysis of regression variance of supervisors support to job involvement
Model Sum of
squares Degree of freedom
Square of mean
F statistics Significance level
The changes of dependent variable via independent variable
26.864 1 26.864
102.147 0.000 The changes of dependent variable via random factors
83.631 318 0.263
Sum 110.495 319 Table 5- The analysis of regression variance of supervisors’feedback to job involvement
Model Sum of
squares Degree of freedom
Square of mean
F statistics Significance level
The changes of dependent variable via independent variable
17.598 1 17.598
60.242 0.000 The changes of dependent variable via random factors
92.896 318 0.292
Sum 110.495 319 Table 6- The analysis of regression variance of supervisors’ performance to job involvement
Model Sum of
squares Degree of freedom
Square of mean
F statistics Significance level
The changes of dependent variable via independent variable
86.201 1 86.201
235.160 0.000 The changes of dependent variable via random factors
116.567 318 0.367
Sum 202.767 319
Nooshin Arian et al.

Indian Journal Of Natural Sciences www.tnsroindia.org. © IJONS
Vol.5 / Issue 28/ February 2015 International Bimonthly ISSN: 0976 – 0997
2867
Table 7- The summary of the results of models 1, 2 of fourth hypothesis regression
Independe-nt variable
Dependent variable
Model R R2 F df1 df2 F significance
Durbin-Watson statistics
Supervisors support
Job involvement
1 0.493 0.243 102.14 1 318 0.000 1.5095
*Supervisors support Job autonomy
Job involvement
2 0.531 0.282 62.101 2 317 0.000 1.864
Table 8- The analysis of regression variance of job autonomy and supervisors support to job involvement
Model Sum of squares
Degree of freedom
Square of mean
F statistics Significance level
The changes of dependent variable via independent variable
31.105 2 15.553
62.101 0.000 The changes of dependent variable via random factors
79.390 317 0.250
Sum 110.495 319 Table 9- The summary of the results of models 1, 2 and fifth hypothesis regression Independent variable
Dependent variable
Model R R2 F df1 df2 F significance
Durbin-Watson statistics
Giving feedback
Job involvement 1 0.399 0.159 60.242 1 318 0.000 1.556
Giving feedback
* Job autonomy
Job involvement 2 0.485 0.235 48.695 2 317 0.000 1.939
Nooshin Arian et al.

Indian Journal Of Natural Sciences www.tnsroindia.org. © IJONS
Vol.5 / Issue 28/ February 2015 International Bimonthly ISSN: 0976 – 0997
2868
Table 10- The analysis of regression variance of job autonomy and supervisors feedback to job involvement
Model Sum of squares
Degree of freedom
Square of mean
F statistics Significance level
The changes of dependent variable via independent variable
25.969 2 12.948
48.695 0.000 The changes of dependent variable via random factors
84.526 317 0.267
Sum 110.495 319 Table 11- The coefficients of regression equation of supervisors support and giving feedback to performance evaluation of employees Independent variables
Non-standardized coefficients
Standardized coefficients T statistics
Significance level
B Std.Error Supervisors support 0.408 0.040 0.493 10.107 0.000
Giving feedback 0.310 0.032
0.415 11.112 0.000
Table 12-The results of hierarchy regression of supervisors’ support and job involvement to performance evaluation
Y2 equation Y1 equation Variables
0.310 0.493 Supervisors support
0.134 --- Job involvement
0.501 0.586 R2
118.109 319.536 F
319 319 df
Nooshin Arian et al.

Indian Journal Of Natural Sciences www.tnsroindia.org. © IJONS
Vol.5 / Issue 28/ February 2015 International Bimonthly ISSN: 0976 – 0997
2869
Table 13- The results of hierarchy regression of giving feedback and job involvement to performance evaluation
Y2 equation Y1 equation Variables
0.521 0.415 Supervisors support
0.211 --- Job involvement
0.391 0.414 R2
117.200 211.320 F
319 319 df
Nooshin Arian et al.

Indian Journal Of Natural Sciences www.tnsroindia.org. © IJONS
Vol.5 / Issue 28/ February 2015 International Bimonthly ISSN: 0976 – 0997
2870
The Design of Residential Complex with Emphasis on Improving Collective Morale of Residents Ali Reza Ahmadi *,Gholam Reza Teimor Jalal Boresh and MohamadJafar Karbaschi
Department of Architectural, Faculty of Engineering Darolfonon, Damghan Branch, Islamic Azad University, Damghan, Iran. Received: 10 Dec 2014 Revised: 28 Dec 2014 Accepted: 27 Jan 2015 *Address for correspondence Ali Reza Ahmadi Department of Architectural, Faculty of Engineering Darolfonon, Damghan Branch, Islamic Azad University, Damghan, Iran. E.Mail: [email protected]
This is an Open Access Journal / article distributed under the terms of the Creative Commons Attribution License (CC BY-NC-ND 3.0) which permits unrestricted use, distribution, and reproduction in any medium, provided the original work is properly cited. All rights reserved. Most of the views and predictions regarding population explosion are regarding economic factors namely the shortage of food and natural resources. However, there are other risks and it is the risk of “creating ugly works”. Some people consider this point as not important but it is not true. Human health depends upon physical, neural and feeling effects to the environment. The term “being together” and its concept is taken granted but increasing separation of people from each other and other life signs in this planet is a serious problem. In the current residential complexes, the importance changes in people relations are not considered. The purpose of the study is to evaluate the methods of improving collective morale among the residents of residential complexes and achieves its architecture solutions for problem solving. To do this, at first the creation of vitality in a person and in a group can be evaluated. As architecture is an art with physical environmental as its tool, one of the most important solutions to achieve this aim is increasing living environment quality and it is ignored in most of living complexes as generally and residential complexes as specifically. By the investigations in this study, we were successful to design residential complexes and by increasing environment quality it brings happiness and comfort in people and improving collective morale in residents of residential complexes. Keywords: Being Together, Residential Complex, Morale, Vitality, Happiness, Comfort, Improving Collective Morale
RESEARCH ARTICLE
ABSTRACT

Indian Journal Of Natural Sciences www.tnsroindia.org. © IJONS
Vol.5 / Issue 28/ February 2015 International Bimonthly ISSN: 0976 – 0997
2871
INTRODUCTION By increasing the population of cities, shortage and qualitative and quantitative crisis of housing in urban communities were started as qualitative and quantitative issues of housing were the main issue of the researches of cultural authorities and various sciences including architecture, urbanization, social sciences, economic and even politics. This crisis is occurred in Iranian cities recently and it is increased. In addition to the increase of demand for housing as the result of increasing population of cities, other factors also increase this crisis as the demand for qualitative demand of housing, the changes of building construction methods, high costs of land in cities, thinking as standard to the quantitative features of housing and development of foreign living models and etc. cause that all authorities are obliged to take decisions to provide housing for high percentage of population in society with specific plans as cheap housing, minimum housing, optimized housing, workers housing and housing for low income people. The important point in these types of issues is as most of criteria for evaluation of existing housing and plans and providing the shortage and formulation of plans can be used, quantitative criteria are restricted to economic criteria and qualitative criteria are not considered indeed. The one-dimensional attitude to this issue cannot present full solutions and considering housing as a statistical quantity or a construction elements separation of housing is of vital complexes giving form to it. This doesn’t mean the negation of economic principles and the importance of considering it in housing issue. The important part of production, distribution and consumption depends upon planning and considering project economic conditions. Ignoring the spatial organizing of residential complexes and effective qualitative factors and its effects on mental conditions of human being and social life of residents in residential unit scale and in complex scale leads to giving much importance to quantity and this is true at least regarding the construction of mass housing or cheap houses. The final satisfaction of housing residents is not in quantity but it is in its quality. In our country conditions, quantitative production and supply of housing is less than its demand as rapid population growth and development of living centers and urban centers is more than housing construction facilities. Thus, in social division, low-income and deprived houses have many problems in achieving their residential space. In current conditions of Iran, housing and its shortage is not dedicated to low-income classes of society and a wide range of average and above average-income people as government employees, teachers, tradesmen and etc. are encountered with this problem and housing in Iran is turned into a universal issue and solving this problem in short-term and mid-term is impossible based on present trend of increasing urban population. The current housing in Iran is not consistent with mental, social and cultural conditions of people and has minimum standards and people are obliged to live in it and they are obliged to live in a dull environment and until they have good economic status, they can provide good housing in accordance to their family and individual features and they are obliged to tolerate this new condition and this period based on the economic conditions of society is more than 5-10 years and sometimes due to the lack of affordability of household in buying house as they like, they are obliged to live forever in this condition. Housing is one of important social goals and the importance of housing and providing its availability grounds is one of the items reflected in the plans of government regarding social goals and they have special position. The purpose of study is to investigate the methods of improving collective morale among the residents of residential complexes and achieve its architectural solutions for problem solving. Thus, a new solution in economic field is necessary and this issue is out of the scope of this study. As it was said, it is required a group of economists, architects, sociologists, anthropologists, psychologists, urban planners, experts of statistics and social sciences and other relevant groups of housing (even minor specializations) get together and solve this problem and provide financial sources of housing for the household that cannot meet the initial demands as food and clothing as suitably. Theoretical basics The term housing is mostly a shelter and human protector and his activities against the danger of natural elements. To answer this question that what are the shortcomings of this definition is very difficult and based on some factors as climate, religion and ethnic group, a part of income should be dedicated to housing cost and the historical past of a
Ali Reza Ahmadi et al.
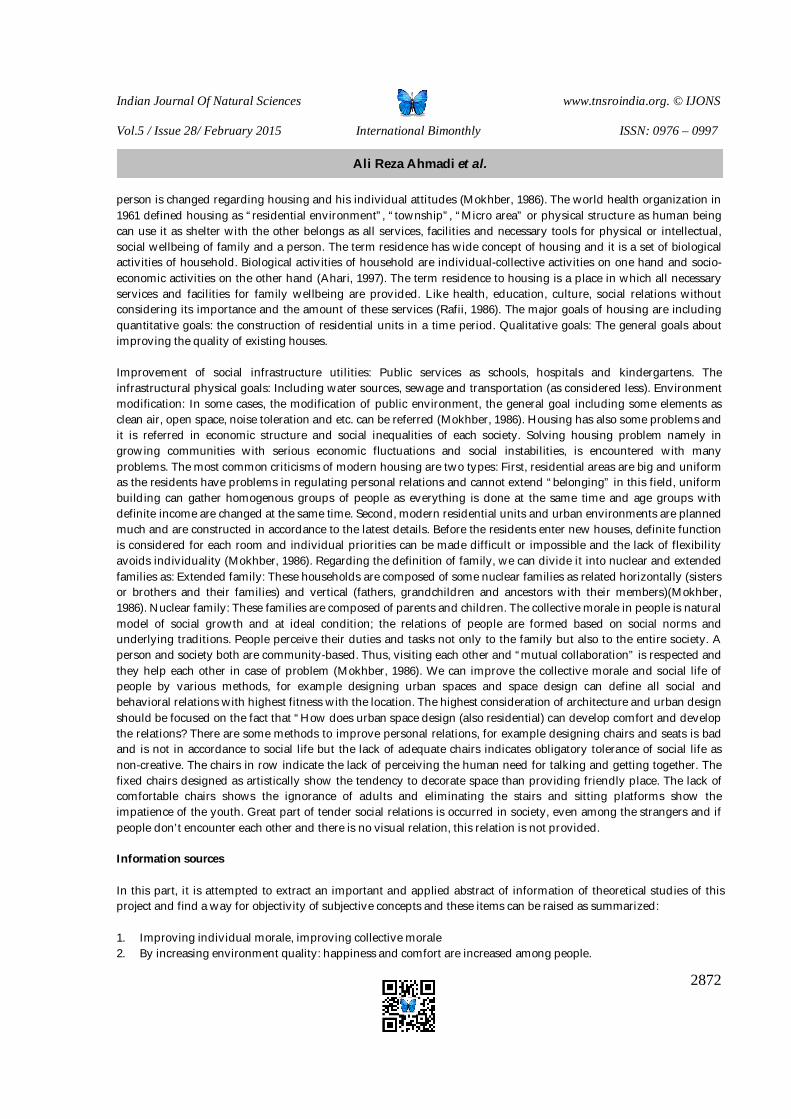
Indian Journal Of Natural Sciences www.tnsroindia.org. © IJONS
Vol.5 / Issue 28/ February 2015 International Bimonthly ISSN: 0976 – 0997
2872
person is changed regarding housing and his individual attitudes (Mokhber, 1986). The world health organization in 1961 defined housing as “residential environment”, “township”, “Micro area” or physical structure as human being can use it as shelter with the other belongs as all services, facilities and necessary tools for physical or intellectual, social wellbeing of family and a person. The term residence has wide concept of housing and it is a set of biological activities of household. Biological activities of household are individual-collective activities on one hand and socio-economic activities on the other hand (Ahari, 1997). The term residence to housing is a place in which all necessary services and facilities for family wellbeing are provided. Like health, education, culture, social relations without considering its importance and the amount of these services (Rafii, 1986). The major goals of housing are including quantitative goals: the construction of residential units in a time period. Qualitative goals: The general goals about improving the quality of existing houses. Improvement of social infrastructure utilities: Public services as schools, hospitals and kindergartens. The infrastructural physical goals: Including water sources, sewage and transportation (as considered less). Environment modification: In some cases, the modification of public environment, the general goal including some elements as clean air, open space, noise toleration and etc. can be referred (Mokhber, 1986). Housing has also some problems and it is referred in economic structure and social inequalities of each society. Solving housing problem namely in growing communities with serious economic fluctuations and social instabilities, is encountered with many problems. The most common criticisms of modern housing are two types: First, residential areas are big and uniform as the residents have problems in regulating personal relations and cannot extend “belonging” in this field, uniform building can gather homogenous groups of people as everything is done at the same time and age groups with definite income are changed at the same time. Second, modern residential units and urban environments are planned much and are constructed in accordance to the latest details. Before the residents enter new houses, definite function is considered for each room and individual priorities can be made difficult or impossible and the lack of flexibility avoids individuality (Mokhber, 1986). Regarding the definition of family, we can divide it into nuclear and extended families as: Extended family: These households are composed of some nuclear families as related horizontally (sisters or brothers and their families) and vertical (fathers, grandchildren and ancestors with their members)(Mokhber, 1986). Nuclear family: These families are composed of parents and children. The collective morale in people is natural model of social growth and at ideal condition; the relations of people are formed based on social norms and underlying traditions. People perceive their duties and tasks not only to the family but also to the entire society. A person and society both are community-based. Thus, visiting each other and “mutual collaboration” is respected and they help each other in case of problem (Mokhber, 1986). We can improve the collective morale and social life of people by various methods, for example designing urban spaces and space design can define all social and behavioral relations with highest fitness with the location. The highest consideration of architecture and urban design should be focused on the fact that “How does urban space design (also residential) can develop comfort and develop the relations? There are some methods to improve personal relations, for example designing chairs and seats is bad and is not in accordance to social life but the lack of adequate chairs indicates obligatory tolerance of social life as non-creative. The chairs in row indicate the lack of perceiving the human need for talking and getting together. The fixed chairs designed as artistically show the tendency to decorate space than providing friendly place. The lack of comfortable chairs shows the ignorance of adults and eliminating the stairs and sitting platforms show the impatience of the youth. Great part of tender social relations is occurred in society, even among the strangers and if people don’t encounter each other and there is no visual relation, this relation is not provided. Information sources In this part, it is attempted to extract an important and applied abstract of information of theoretical studies of this project and find a way for objectivity of subjective concepts and these items can be raised as summarized: 1. Improving individual morale, improving collective morale 2. By increasing environment quality: happiness and comfort are increased among people.
Ali Reza Ahmadi et al.

Indian Journal Of Natural Sciences www.tnsroindia.org. © IJONS
Vol.5 / Issue 28/ February 2015 International Bimonthly ISSN: 0976 – 0997
2873
3. Life quality and “emphasis on collective morale” are important issues in mass housing. 4. Five factors of 6 factors raised by Christopher Alexander and SerjChermaiof as architecture evaluation factors are
(Environment, people, sizes and standards, spatial order and visual and artistic quality) have close relation directly with people, society and mental issues of people and it shows the high emphasis of psychology issues in architecture and environment quality.
5. Based on the definition of family from the view of sociology and investigation of 4 features, it can be said 2 features of 4 important features of family structure are associated to society and establishing social relations of people. Thus, the importance of establishing collective morale in family is defined as the smallest core of society and then in society as well.
6. The emphasis on nuclear family “tendency to private limit” creating social dissolution 7. One of the industrialization outcomes is creating wide and relatively uniform residential areas for an age group 8. One of the problems of modern big housing is the lack of belonging due to the lack of variety and magnitude
and flexibility due to high planning for details even for people behavior. 9. Creating variety in environment 10. Variety is not the taste of life and it is its content. 11. Today, mechanical tools and mechanized civilization as increasingly can prevent personal, direct and various
experiences of life to people and in daily experiences of people life, an original variety is lost. 12. Human scale encourages a person to have belonging to space and helps people to approach or be far from each
other. 13. Façade plays important role in expressing the individual features of residents to express their identity to outside
world. If the residents can select the façade components regarding their life style, residential unit identity is improved and variety of residential fields is increased (Habraken et al.,1997).
14. The façade of building is its face to the people as the face of a person. This face can be friendly, aggressive, open, emotional, calm or sad. The building façade can facilitate the exchange among people inside building via open windows, doors or balcony in suitable height or this relation is avoided by close windows, long and dull walls.
15. The awareness that windows and balconies dominate the surrounding space and the residents can easily watch outside has good effect and increase social feeling and avoids anti-social activities.
16. Entrances are the most common elements of invitation as they are built for this purpose. This impact is achieved by any hole (e.g. windows and etc.).
17. The best designed public places are those encouraging voluntarily and social activities. When public activities are privatized, much control is applied on environment and the users have less freedom in their behaviors. Empty walls as dull façade of administrative buildings, can decrease the leveled activities of street. Dull walls in sidewalk (buildings without window) create dull spaces crossing the wall of shops and service units overlooking street (Robertson, 2001).
18. The experience of comfort in cities is composed of the set of behaviors, relations and other experiences with people during day. Comfort is arising from enjoyable contacts and for happiness is the contacts supporting people as members of society. Live city (active residential environment) provides some places and situations to create friendly experiences (Croherstlenard, 1999).
The evaluation of relevant constructional examples House construction by public sources, Belgium The architecture measurements considered to improve collective morale of residents are as:This complex is including 15 blocks in two rows and the access to all units is via wide and beautiful central space (Figure 1).In this complex, wide central space is a friendly space for establishing much relations and space for leisure time of residents beside each other. This is achieved by establishing restricted and extended space and various places in terms of behavior, form and aesthetics. It is worth to mention that this space is an obligatory transition space to have access to units.
Ali Reza Ahmadi et al.

Indian Journal Of Natural Sciences www.tnsroindia.org. © IJONS
Vol.5 / Issue 28/ February 2015 International Bimonthly ISSN: 0976 – 0997
2874
Residential complexes, strips and yards, Netherland In this complex, architectural measurements to improve collective morale of residents are as follows: Common porch in the third floor feeling the eastern units (Figure 2):Creating various opening in façade scale, in the scale of each unit and high penetration and creating much collective feeling (Figure 3): Some recommendations in design trend Design is a process of information collection, creative composition and returning to realities: Research, “planning”, concepts, drawing sketch, modeling, innovation and modification, end of task (array). Indeed, design is a state of mind, trend of becoming and doing, continuous evolution of people with some interpretations of environment and reflects the environment and they have the opportunity to guide the desires of their employers and ideals of their culture. By restricting space as the point of doing design- and by a factor as ceiling, the main constituent elements, each building is completed in three dimensions. Indeed, design and architecture is a complex activity and an idea as “restricting” has its simplicity and is suitable for starting. Structure The buildings have different structures and skeleton and bearing wall are two initial examples of them, after discussing about ceiling, wall and floor, we should recognize main materials to enter real world. Materials system is a major factor and the type of system form economic issues is a directing factor in this regard. The building structure or its restricting elements, they are highly costly components of a complete project (Figure 4). Systems and utilities Another important part of building not exposed is a system meeting the physical and basic needs of the building residents and keep the basis of qualitative environment conditions and continues the activities in this space. Gas cooler is considered in this project for cooling of all units and radiator and hot water supply is used for thermal system and also a package (independent radiator) is considered. The reason for this independence is saving current and initial costs, easy maintenance and space problem of engine place. In addition, in apartment complex, a residential floor is suitable and for heating the ground floor, floor heating is used. Memory Creating the contrasts- different and abnormal use of colors- mental use of colors as comforting and alleviating anxiety as pink, directing people in communicative spaces- considering finish and applied materials in each space- considering flooring, considering mental effect of materials, considering materials to show movement paths Movement in the paths Considering the path from outside to inside, and form inside to outside- the presence of restrictions at first sight and their gradual elimination at second sight. View The view is the result of continuity and direction in a space or set of space. Most of the views create consciously are associated with functional, aesthetic and psychological views. We can identify the sequence of scales in a space, from one point to another one, from one space to another one and from inside to outside (vice versa. In all scales, the designer selects the starting points in accordance to the type of task (Figure 5).
Ali Reza Ahmadi et al.

Indian Journal Of Natural Sciences www.tnsroindia.org. © IJONS
Vol.5 / Issue 28/ February 2015 International Bimonthly ISSN: 0976 – 0997
2875
Purpose: Improving collective morale of residents- improving saying hello tradition.Generally, considering central space in relation to all units Spatial-physical planning In a scale of a final expert plan, based on required plan to design a residential complex, we can evaluate the general nature of required symbolic image in interaction with mental images in current society (media era): Residence, mobility (residence field and mobility and work field), thus, two other macro fields of formation process of a residential complex is evaluated in the form of macro and uniform framework: House design field (as the purest static space in complex) The private collective spaces field as located in residential and calm field of complex. Physical planning of plan Figure 6 shows plan site and general planning of interior spaces of complex. The sum of pure area: 860 m2-12% recreation space:103.2 m2-10% walls and structure:86m2- gross sum:1050m2 These points should be considered in design: 1. Beauty of collective environments: Apartment plants 2. Beauty of each sub-space: Using nature at home, pasio, view to nature, color and suitable light of each sub-space,
considering suitable furniture of each space (suitable furniture of each room for gathering of at least 2 people), quality of furniture, light and color
3. Designing transparent and semi-transparent spaces for view 4. Designing porch:1- Private porch- much private for a unit- (involving semi-open space with house), 2-Shared
porch- public part (the sum of at least two units) 5. Designing a guest unit for shared use 6. The design of multi-purpose hall for common festivals of families (common presence, common activity) Turning to form Irregular placement of floors to create shared porch (Figure 7) Creating collective space between the units in the scale of a floor (Figure 8) Putting shared and collective space in the center of plan: as the access of the rest of spaces is facilitated- the spaces their use can be involved with this space or presence in this space is associated for them (Figure 10). It can be said that in this stage, the new idea of formation of communication system, stairs, access in design are used (Figure 11) and in Table 2, the communications and volumetric modeling in each floor is observed: Presenting design Figure 12 shows the plan of ground floor (1), first floor plan (2), second floor plan (3), third floor plan (4). Figures 13-15 show northwestern, north eastern facades and preview of three-dimensional display.
CONCLUSION It is possible that we don’t take being together and its concept as serious but the increasing separation of people from each other and other life signs in this plant is a serious issue. In current residential complexes, we don’t consider the important changes in people relations and all residents as men, women or children are neither completely together nor separated. The population with people of positive morale has collective activities and social morale. Although we consider the methods of creating collective morale in people, more than considering the good and high quality
Ali Reza Ahmadi et al.

Indian Journal Of Natural Sciences www.tnsroindia.org. © IJONS
Vol.5 / Issue 28/ February 2015 International Bimonthly ISSN: 0976 – 0997
2876
environment, the happy life of people is considered as the benefits of increasing environment quality is improving individual morale and then improving collective morale of people. Considering the collective morale without considering constituent factors of individual morale is not good. Thus, urban design and considering city quality has close relation with people morale and the study aim is to evaluate the methods of improving collective morale among the residents of residential complexes and achieves its architectural solutions for problem solving. Thus, these factors are evaluated with this aim and the residential complex is designed. In physical planning, based on the results of Table 1 and comparative investigation of data in use in residential complex, considering the results of comparative studies of residential complexes is necessary. Based on theoretical studies, the complex can have the following spaces:1- Residential+ A guest unit, 2- Parking, 3- Children playground, 4- Green space (open and semi-open) and 5- Open collective spaces and closed gathering space and this complex can meet the needs in the study question.
REFERENCES 1. Ahari, Zahra. Minimum housing.Tehran Markaz.Building and housing researches. 1997. Journal 101. 2. Habraken, Bokhelt, Dinjense, Tichsen, Variety of house construction. Translated by GolaraFaridian,
NaserYazdkhasti, Tehran. 1997. 3. Kruherst Lenard, Susane. Design of urban space and social life.Architecture nature.RasulMojtabapour, Khorshid
publications. Tehran. 1999. p. 49. 4. Mokhber, Abas. Social dimensions of housing (goals, criteria, social indices and people participation). Tehran. 5. Rafiie, Mino, Urban housing (an introduction to issues). Tehran. Iran consulting community. 1986. 6. Robertson, The strategies of walking for planners, urban centers.ultra-passes, Pedestrian malls.
RahmatMohammadzade, Safe journal. 2001. NO. 32, p. 96.
Figure 1- Wide and beautiful central space. Figure 2- Shared porches.
Ali Reza Ahmadi et al.

Indian Journal Of Natural Sciences www.tnsroindia.org. © IJONS
Vol.5 / Issue 28/ February 2015 International Bimonthly ISSN: 0976 – 0997
2877
Figure 3- Openness in façade Figure 4- Restricting structure
Figure 5- Relation via central space
Figure 6- Plan site Figure 7- Shared porch in section
Ali Reza Ahmadi et al.

Indian Journal Of Natural Sciences www.tnsroindia.org. © IJONS
Vol.5 / Issue 28/ February 2015 International Bimonthly ISSN: 0976 – 0997
2878
Figure 8-Collective space between the units in plan Figure 9- Collective space between the units in scale
Figure 10- The display of main idea ofgathering space in the center of volume
Figure 11- Long and broken corridors
Ali Reza Ahmadi et al.

Indian Journal Of Natural Sciences www.tnsroindia.org. © IJONS
Vol.5 / Issue 28/ February 2015 International Bimonthly ISSN: 0976 – 0997
2879
Figure 12- Floors plan
Ali Reza Ahmadi et al.

Indian Journal Of Natural Sciences www.tnsroindia.org. © IJONS
Vol.5 / Issue 28/ February 2015 International Bimonthly ISSN: 0976 – 0997
2880
Figure 13- The north western façade of plan
Ali Reza Ahmadi et al.

Indian Journal Of Natural Sciences www.tnsroindia.org. © IJONS
Vol.5 / Issue 28/ February 2015 International Bimonthly ISSN: 0976 – 0997
2881
Figure 14- The north eastern façade of plan
Ali Reza Ahmadi et al.

Indian Journal Of Natural Sciences www.tnsroindia.org. © IJONS
Vol.5 / Issue 28/ February 2015 International Bimonthly ISSN: 0976 – 0997
2882
Figure 15- Three-Dimensional preview of plan Table 1- General planning of the spaces inside the complex
Space name No Unit area (m2) Field Residential units:3 bedrooms 3 200 Private Residential units:2 bedrooms 2 100-120 Private
Guest room 1 110-80 Private Warehouses 6 48 Private
Closed parking 6 200 Public Collective space and family
gathering In unit and ground
floor 25-150 Public
Children play In ground floor 150 Public Yard WC 1 4 Private
Ali Reza Ahmadi et al.

Indian Journal Of Natural Sciences www.tnsroindia.org. © IJONS
Vol.5 / Issue 28/ February 2015 International Bimonthly ISSN: 0976 – 0997
2883
Table 2- The relations and volumetric modeling
Volume modeling Volume of units-third floor
Volume of units-second floor
Volume of units-first floor
Final plan
Section relations method
Section relations method
Plan relations method Volumetric relations method
Final plan
Ali Reza Ahmadi et al.

Indian Journal Of Natural Sciences www.tnsroindia.org. © IJONS
Vol.5 / Issue 28/ February 2015 International Bimonthly ISSN: 0976 – 0997
2884
Hybrid Genetic Algorithm and Parallel Annealing Simulation for Dynamic Facilities Layout Problem with Budget Constraint Bahman Naderi1 and Hamed Faraji2*
1Department of Industrial Engineering, Faculty of Engineering, Islamic Azad University, Qazvin, Iran 2Department of Industrial Engineering Science and Research Branch, Islamic Azad University, Qazvin, Iran. Received: 20 Dec 2014 Revised: 28 Dec 2014 Accepted: 27 Jan 2015 *Address for correspondence Hamed Faraji MSc. Department of Industrial Engineering Science and Research Branch, Islamic Azad University, Qazvin, Iran. E.Mail: [email protected]
This is an Open Access Journal / article distributed under the terms of the Creative Commons Attribution License (CC BY-NC-ND 3.0) which permits unrestricted use, distribution, and reproduction in any medium, provided the
original work is properly cited. All rights reserved. The purpose of dynamic facility layout problem is to find the best arrangement for a number of manufacturing facilities at a specified time horizon. One of the most important aspects of the problem is to consider the budget constraint when handling facilities. According to the results of United States Department of Industry, layout design is a low priority in most organizations and many projects would be impractical due to the lack of funds. Thus, compliance with the allocated seems essential for layout design. Because of the large and complex structure of the problem, little research has been done to solve this problem; the purpose of all these studies is to find a near optimal solution by developing a meta-heuristic algorithm. For the first time, this study used a genetic meta-heuristic algorithm and parallel annealing simulation simultaneously for solving the problem. Results have been recorder on a range of problems in literature. Computational results show that the proposed algorithm can improve quality of answers by previous researchers. Keywords: multi-period facility layout problem, budget constraints, genetic algorithm, annealing simulating algorithm INTRODUCTION The purpose of facility layout problem is to determine the most efficient layout of facilities in a system. Facility can be a manufacturing unit, office building or machines within the factory. Proper arrangement can lead to a more efficient
RESEARCH ARTICLE
ABSTRACT

Indian Journal Of Natural Sciences www.tnsroindia.org. © IJONS
Vol.5 / Issue 28/ February 2015 International Bimonthly ISSN: 0976 – 0997
2885
flow of materials between facilities and thus reduction of the maintenance cost and flow of the materials. Suitable arrangement can also reduce the cost of transporting materials between facilities. Transportation cost is the most important indicator for efficiency of layout pattern; since 20 to 40 percent of operating expenses and 15 to 70 percent of total costs related to the production system depends on transportation cost [1], it is often considered as the main indicator of efficiency. If the layout is not optimized, transportation of materials will enormously cost and thus the finished cost of product will increase. Transportation costs depend on the flow rate and the distance between facilities. The transport system used also affects the cost of transportation; in other words, material handling system influences the layout pattern which mutually affects the type of material handling system. In real world, if the transportation of materials between departments does not change for a long time, the static layout problems can meet our needs; but when demand changes, it causes changes in the material flow; as a result, the current arrangement loses its efficiency and needs to be changed to match the new situation. Reassessment of the arrangement takes place when the flow material is increased or reduced. Rearrangement of a factory facilities in order to minimize the total cost of handling is called dynamic facility layout problem (DFLP). Need to change the layout of a plant is because of one of the following reasons [2]:
1. Changes in demand or product mix 2. Changes in the sequence of operations 3. Changes in production strategies 4. Changes in equipment and supplies 5. Changes in laws and safety standards
Changes in product demand is the most important factor in changing the layout, so that transportation costs fluctuate and often increase. In addition, the introduction of product-new machine or disposal of a product- machine can change the pattern of material handling. The changes will lead to lost efficiency of current layout and will impose additional costs on the system. To solve this problem, the arrangement should be flexible and changeable. Further explanation is that, in a manufacturing factory, production of each product requires transportation of raw materials and work in process between facilities. This material transportation costs in each planned period. If in the course of planning, organization is to change planning or modify products or processes, the transportation path will undergo changes, which may impose more costs on the system. To reduce the costs of transportation, changing the layout of facilities is considered. It should be noted that this in turn costs. A dynamic facility layout problem looks for an arrangement by which the costs of transportation between facilities is minimized. This selection considers changes in material flow at future planning periods and keeps the need for change in arrangement of equipment during future periods in the lowest level. According to Ben Jaafar and Sheikh Zadeh [3], a good layout design requires continuous material flow estimation between machines for several periods. Data from material flow is predicted for each period; it is assumed that material flow is constant during each period. Therefore, the layout problem of each period can be considered as static facility layout problem. When we solve the problem in the form of separate periods, handling cost of facilities will not be considered. Therefore, the separate problems of SFLP should become a DFLP problem. A solution for DFLP includes a set of designs, each for a period of time. Optimization of the dynamic facility layout problems is important for two reasons: First, the cost of transporting materials covers 15 to 70 percent of total production costs. Therefore, any reduction in these costs through better facility layout is a direct participation in improving the overall effectiveness of operations. Secondly, the change in layout is very costly and any future changes in layout of facilities should be planned in advance.
Hamed Faraji and Bahman Naderi

Indian Journal Of Natural Sciences www.tnsroindia.org. © IJONS
Vol.5 / Issue 28/ February 2015 International Bimonthly ISSN: 0976 – 0997
2886
Hence, the dynamic layout problem specifies the layout design for each period in the planning horizon, in order to minimize the total costs of material handling for all periods and the total costs of rearrangement between time periods. Costs of rearrangement should be considered when the facility requires to move. Therefore, total costs includes material handling costs at all periods and transportation costs of machines. In recent years, many attempts have been made to solve the dynamic facility layout problem. Rosenblatt [4] was first to present the dynamic layout problem taking into account the handling costs of machines; later, various approaches were proposed by next authors. One important aspect is to consider the budget constraint when handling facilities. As mentioned earlier, changing the layout needs to spend huge budget. Thus, one realistic aspect of a problem is to respect the budget while modeling and problem solving. Hence, the algorithm presented in this paper attempts to solve dynamic facility layout problems with regard to budget constraints. The remainder of this paper is organized as follows: In the next section, we will give an overview of the history of dynamic facility layout problem. The third part describes the mathematical relationships and modeling. The fourth section deals with design of the proposed algorithm and explains its processes in details and illustrates examples. The fifth section provides results from the suggested algorithm by setting the parameters of the algorithm; the obtained results are used to demonstrate the effectiveness of algorithm by methods available in the literature. Finally, conclusions and recommendations are presented for future work. Literature Review According to current study, there are two approaches of detailed procedures and heuristic methods for solving DFLP. Since this problem is computationally very complex, most effort is to develop heuristic methods which can generate appropriate solutions in an acceptable computational time. Balakrishnan [5] has done an exhaustive study on methods of solving DFLP. Rosenblatt [4] used dynamic planning to solve DFLP. In dynamic planning technique, every period is considered as a step and layout design each period is called position. A design for a period among a series of suggested designs is selected to have the most improvement in the objective function. Thus, the dynamic planning is used for solving large computational complexity. Rosenblatt [4] used two methods to reduce the complexity: 1. The first method is based on a heuristic approach of Ballou [5] in which the dynamic planning is used to solve
the problem of inventory layout. 2. The second method is randomly generated layout designs.
Both methods were tested on small scale problems and the results showed that the former is more efficient. Lacksonen and Enscore [6] suggested five algorithms including CRAFT, shear plates, branch and bound, dynamic planning and shear trees for solving DFLP. The five algorithms were evaluated using the sample data; shear plate method outperformed the other algorithms. Urban [7] used a binary shift algorithm to solve DFLP. He used prediction valves. The implication of this technique is to allow any layout pattern to run in all periods discarding the handling cost. Balakrishnan and Cheng [9] presented two ways to improve Urban binary shift algorithm [7]. In the first method, the final result of Urban algorithm [7] was presented as the final result; by recursive method, then, better solutions were searched. In the second method, the algorithm proposed in [7] was combined with dynamic planning. Conway and Venkataramanan [10] were first to use genetic algorithms to solve DFLP. Balakrishnan and Cheng [11] improved the solution proposed by [10]. Their algorithm consisted of two nested internal and external loops. In the inner loop, intersection and mutation operators were used to produce children, then justified solutions were selected and those with the least cost were replaced by
Hamed Faraji and Bahman Naderi

Indian Journal Of Natural Sciences www.tnsroindia.org. © IJONS
Vol.5 / Issue 28/ February 2015 International Bimonthly ISSN: 0976 – 0997
2887
the most expensive solutions. In the outer ring, some weak solutions were replaced by random solutions. The outer ring caused the inner ring not to continue its work by a series of similar solutions; so that, the diversity of population increased. Cheng et al [12] introduced a heuristic genetic algorithm for solving DFLP. In this way, any solution of the population was selected and evaluated by inserting one-period layout designs in solutions. The results showed that this method was effective in some situations. Dunker et al [13] used a combination of genetic algorithm with dynamic planning. Kaku and Mazzola [14] used a heuristic tabu search (TS) algorithm to solve DFLP. TS was performed in two stages in which the mechanisms of diversification and concentration were well respected. They used three mechanisms of random initial design, initial designs using a heuristic method and diversity based on abundance of some solutions available in the tabu list. The proposed algorithm was tested on data [6] and proved that the proposed method is better compared to the method [7]. Baykasoglu and Gindy [15] were first to use simulation annealing algorithm (SA) to solve DFLP. Their algorithm was the same traditional SA algorithm in which the layout design was chosen as the initial solution and given to the algorithm to improve. In their approach, to make the neighborhood, one period of two facilities were first randomly selected. Then, the selected facilities changed their positions. McKendall et al [16] developed SA heuristic algorithm for solving DFLP. First, they traditionally run SA. Their initiative was to choose the parameters effective on the algorithm. In the second method, they integrated the algorithm with control strategy of the previous steps and control of the steps ahead. Earl et al [17] proposed a three-step approach to solve DFLP. In the first stage, the flow matrices with various weights were combined. As a result, the problem was converted from a static to a dynamic one to determine a series of ideal static solutions. In the second stage, the multi-period layout designs were determined using solutions from the first step and dynamic planning method. In the third step, the solutions obtained in the previous stage were improved by binary handling method. Baykasoglu et al [18] compared the results obtained from algorithms presented by [11] and [17] for small-scale problems; they found no significant difference between solutions. However, the algorithm presented by grip and Balakrishnan [11] performed relatively better for large-scale problems. Balakrishnan et al. [19] were first to introduce the dynamic facility layout problem with budget constraints and showed how these constraints are applied. Balakrishnan considered a specific budget for the entire time periods by which limited the relocation of facilities at different times. The allocated budget was obtained by the following method. The problem was first considered and resolved without budget constraint. Then, a fraction of the budget allocated to handling of facilities was considered as budget constraint. Balakrishnan used two values of permissive 90% and strict 50% [18]. For each time period, Balakrishnan considered a separate budget constraint and solved the problem by ant colony algorithm. The budget allocated to each period was determined as [19], with the exception that the amount of budget available for each period was separately determined. The budget remaining from the previous period will be used in future periods. Sahin et al [20] solved the problem presented in [18] by simulation annealing algorithm. They adopted a different method to determine the initial parameters. The initial solution was determined through a heuristic approach. Mathematical Model DFLP problem can be modeled as an exponential allocation problem. The variables used in this problem are as follows:
Symbols and Parameters
Symbols and parameters considered in this problem are as follows: N is the number of facilities or positions. T is the number of planned periods.
Hamed Faraji and Bahman Naderi

Indian Journal Of Natural Sciences www.tnsroindia.org. © IJONS
Vol.5 / Issue 28/ February 2015 International Bimonthly ISSN: 0976 – 0997
2888
Ctijkl is the cost of transporting materials between facility i in period t at position j and facility k at position l. Atijl is the cost of handling facility i from position j to l i in period t. LBt is the remaining budget from period t for period t +1. Bt is the budget available for the period t. ABt is the budget allocated for the period t.
The Objective Function and the Constraints
(1)
Subject to:
(2)
(3)
(4)
(5)
(6)
(7)
(8)
In this problem, the objective function (1) tries to minimize the total cost of handling and transportation of materials. Constraint (2) ensures that each facility is only in one position and constraint (3) ensures that there is only one facility in every position. The constraint (4) also states that the budget transferred to the next period is equal to the budget of current period minus transportation costs in the current period. Constraint (5) sets the budget available for each period equal to the total budget allocated to that period and the remaining budget from the previous period. Constraint (6) indicates the budget for each period. It can be shown that design should be assessed in a dynamic facility layout problem with N department and T period of planning to find the optimal solution. A simple calculation shows that even for a problem with 6 departments and 5 periods, there is 1014 × 1.93 feasible composition (layout) that should be examined, which in fact
Hamed Faraji and Bahman Naderi

Indian Journal Of Natural Sciences www.tnsroindia.org. © IJONS
Vol.5 / Issue 28/ February 2015 International Bimonthly ISSN: 0976 – 0997
2889
is a very big problem. Therefore, the question presented is a NP-Hard problem [21]. This will make this problem difficult to solve indicating the need to develop efficient algorithms for solving this problem [7]. Solution Algorithm As mentioned above, because the problem is NP-hard, using accurate methods for solving the problem in a reasonable time is not practical and heuristic or meta-heuristic methods are used to solve the problem. Because in the literature, the genetic algorithm has been more fortunate than other meta-heuristic methods, this article tries to use a hybrid genetic algorithm-parallel annealing simulation in order to improve the quality of solutions obtained so far in previous studies.
Genetic Algorithm
Genetic algorithm is a powerful random search based on the mechanism of natural selection. The algorithm is derived from nature, using random search for optimization problems and learning processes. In the nature, the right combination of chromosomes generates better generations. Meanwhile, some mutations may also occur in chromosomes which may make the next generation better. The genetic algorithm can search for different areas of solution simultaneously; however, there is no structure for small objective changes and sequential movement toward better solutions. As a result, genetic algorithm is not capable of a complete local search. This weakness can be solved by a local search algorithm such as annealing simulator.
Simulation Annealing Algorithm
Simulation annealing algorithm (SA) is a probabilistic improving search method, which starts from an initial solution and then moves toward neighborhood solutions in a loop. If the neighborhood solution is better than the current solution, the algorithm will consider (move toward) it as the current solution. Otherwise, the algorithm accepts that solution by probability as current solution. By a gradual decrease in temperature in the final steps, the worse solutions are less likely to be accepted. Therefore, the algorithm converges to better solutions (or the same quality). Experiments show that the algorithm starting with a good initial solution leads to faster convergence. In addition, searching for solution by several initial solution in parallel leads to better quality results. This technique is called multiple independent runs. In MIR method, any initial solution independently acts to search for solutions.
Hybrid Genetic Algorithm - Parallel Simulation Annealing Algorithm (GA-PSAA)
GA has no structure for small objective changes and sequence movement to the best solution. As a result, this algorithm is not capable of a complete local search. This weakness of genetic algorithm can be solved by combining with a local search algorithm such as annealing simulator. This combination improves the performance of both algorithms. In the hybrid approach, genetic algorithm produces a series of solutions using intersection and mutation operators. Some of the solutions are selected as initial solutions of SA algorithm and local search process starts in parallel on the selected solutions. For variety, a number of mean good and bad solutions are selected.
Strings of the algorithm GA-PSAA
The chromosome designed in this paper used the binary encoding. Each line represents a period of time, and each bit is either zero or one; the latter indicates the desired location of the facility in the bit location. To introduce a layout design with 5 facilities in 3 periods requires a string of 5*5*3 bits, as shown in Figure (1). For example, above chromosomes show the layout pattern in three periods. In the first period, facility 1 is in location 1, facility 2 is in location 4, facility 3 is in location 5, facility 4 is in location 2 and facility 5 is in location 3.
Intersection Operator
The main operator to produce new chromosomes in genetic algorithms is the intersection operator. This operator, similar to its counterpart in nature, produces new individuals the components (genes) of which are formed from their parents. The operator acts on a pair of chromosomes in a single-point, multi-point and uniform form. In the proposed
Hamed Faraji and Bahman Naderi

Indian Journal Of Natural Sciences www.tnsroindia.org. © IJONS
Vol.5 / Issue 28/ February 2015 International Bimonthly ISSN: 0976 – 0997
2890
algorithm, the intersection is uniform. A random vector (reference vector) is produced by zero and one digits as long as the number of time periods to determine the combination of parents and children by reference vector. Each cell of the reference vector represents how the child follows parents. Accordingly, let it be 1, the child will act similar to the first parent (father); let it be zero, the child will act similar to the second parent (mother) (Fig. (2 )).
Adaptive Mutation Operator of GA-PSAA
In the course of natural evolution, mutation is a random process in which the content of a gene is replaced by other genes to produce a new genetic structure. In genetic algorithms, mutation happens randomly with a low probability (usually between 0.001 and 0.01) and changes the elements of the chromosome. The mutation is often used as a guarantee for diversity of chromosomes during the search process. When the population converges towards a particular solution, this mutation is more likely to prevent this action; in contrast, when the population has non-identical results, the probability of mutation decreases. Thus, mutation probability is an inverse function of the number of non-identical solutions. Thus, mutation in populations should be rational and intelligent, as much as possible. Consequently, we used an adaptive mutation operator where the mutation is applied whensimilarity of chromosomes in each population reaches a certain level. The similarity coefficient between two chromosomes is calculated by:
(9)
Where Xita and Xitb are locations of facility i in period t, in chromosomes a and b. The rate of two bits Xitb and Xita is calculated by:
(10)
The mean similarity coefficient between chromosomes of a population is determined by:
(11)
As a result, mutation operator can be applied on chromosomes in every generation, provided that SC ≥γ. γ is a value between zero and one obtained from pre-designed experiments. To apply mutation on chromosomes (in the case of the initial conditions), we follow the following steps:
1. The first chromosomes in the population is selected. 2. A real random number is produced between zero and one (r).
If r <Pm, a chromosome is subjected to mutation operator. To apply the mutation, a time period is first selected; then, the facilities are randomly located at time period of interest. As Figure (3) shows, the first time period is randomly selected and the location of facilities is randomly replaced at the first period; as a result, the layout design related to the first period will change. Mechanism of Neighbourhood Solution One of the important things in parallel annealing simulation algorithm is how to create a neighborhood solution. The solution needs to have two important characteristics, including: 1. Randomly selected. 2. Obtained partially from the previous solution. For this purpose, two facilities and one period of time were initially selected and then the location of selected facilities was replaced at the desired time period. In Figure 4, the first time period selected randomly and location of the first and third facilities were replaced.
Hamed Faraji and Bahman Naderi

Indian Journal Of Natural Sciences www.tnsroindia.org. © IJONS
Vol.5 / Issue 28/ February 2015 International Bimonthly ISSN: 0976 – 0997
2891
Stop Condition
Stop condition on the outer ring (GA) and the inner ring (parallel annealing simulation algorithm) of the suggested algorithm is as follows:GA continues the evolution with no limit, until the best chromosome obtained in 100 consecutive generations is the same and no improvement is observed. In each iteration, the parallel annealing simulator algorithm iterates until the probability of accepting a non-improving solution becomes zero; then the algorithm stops when quality of the solutions obtained in 100 consecutive iterations does not change. Parameter Setting and Computational Results Parameter Setting
One of the most effective ways to design experiments is Taguchi method. In this method, a warning noise ratio is used to determine the best combination of tests. Given the purpose of experiments, the equation of warning noise ratio NS was used:
(12)
where, n and yi represent the number of tests and the value of solutions obtained from process in i-th experiment, respectively. To find the optimal algorithm GA_PSAA, the present study examined six factors including intersection rate, mutation rate, initial temperature, the rate of heat loss and the number of initial solutions to start SA algorithm, and adaptive mutation rate (γ). The number of initial population and maximum number of iterations were considered as the seventh pairs of factors. These factors were studied at four levels. Each experiment was iterated ten times and optimal levels are listed in Table 1.
Evaluation of the Performance of Hybrid Genetic Algorithm-Parallel Annealing Simulation for DFLPBC
All calculations were performed by a PC (4gb RAM, 2 duo (2.2 GHz) processor, Core i5); to set the parameters of the algorithm, the software Minitab16 was used. To evaluate the proposed algorithm, the problems derived from Chang and Balakrishnan (2000), which contains data for problems with 6, 15 and 30 facilities in a time horizon with 5 and 10 periods, were studied and the results were compared with Sahin et al. (2010) and Baykasoglu (2006). How to allocate funds to each period was similar to Sahin et al. (2010). To evaluate the algorithms, this study used relative percentage deviation (RPD). RPD is calculated according to the following formula:
(13)
where, i and j are the number of algorithm and the number of problem, respectively and is the best solution obtained in j. Table 2 shows the mean RPD in any size of the problem. RPD value indicates the distance from solutions in each algorithm from the best solution. Because this gap is large in the algorithm provided by Baykasoglu, the Baykasoglu algorithm provides poor solutions and there is no need for a deeper study of this algorithm. While Sahin and GA-PSAA produce better solutions; therefore, they are more efficient algorithms. Based on 95% confidence interval in terms of RPD, as shown in Figure (5), the proposed algorithm by Baykasoglu for both mean and standard deviation is in worse condition than Sahin and GA-PSAA, which is a proof of the necessity to remove this algorithm in future comparisons. To evaluate GA-PSAA and Sahin in different periods, the mean and confidence interval of the RPD are calculated in terms of the number of time periods and number of facilities (Figure (6) and (7)).
Hamed Faraji and Bahman Naderi

Indian Journal Of Natural Sciences www.tnsroindia.org. © IJONS
Vol.5 / Issue 28/ February 2015 International Bimonthly ISSN: 0976 – 0997
2892
As shown in Figure 6, the performance of GA-PSAA algorithm is more stable than Sahin. So that, the increase in number of periods reveals the performance of the proposed algorithm more and more; this shows that the proposed algorithm is more acceptable for large sized problems. The results of Figure (7) shows that the performance of algorithms is not significantly different when the number of facilities is 6. However, increasing the number of facilities, particularly for N = 30, will improve the efficiency of the proposed algorithm. Therefore, it can be hoped that the algorithm GA-PSAA will be more efficient for real world problems which may be much larger. For statistical comparisons of the results of the algorithms, the T-test is used. The null hypothesis of T-test states that the mean RPD of two algorithms is not significantly different.
μ1 and μ2 are mean RPD of the algorithm GA-PSAA and Sahin. T-test results are listed in Table 3. T-test based on 95% confidence interval indicates a significant difference between the means of both groups. In other words, T and P-value show that the mean RPD of algorithms is not equal. Due to the rejection of null hypothesis, it can be stated that the mean RPD of GA-PSAA algorithm is lower, which is itself a proof of the superiority of the proposed algorithm in terms of quality.
CONCLUSION Recommendations for Future Research Given the budget constraints, dynamic layout problem is a problem that has been widely used in the real world; however, little research has been done on the problem. This study developed and tested a meta-heuristic algorithm effective for dynamic layout problem with budget constraints. To compare the proposed algorithm with other existing algorithms, a screening was first performed to select algorithms which are able to compete with each other. By statistical tests and a comprehensive comparison was conducted by RPD on algorithms. The results indicate that the proposed algorithm using advantages of genetic algorithm and annealing simulation could improve the quality of solutions already been proposed by previous researchers. In conclusion, although the research directly considers production sites, i.e. arrangement of machinery in industries, the totality of the results of this research can be used for any other arrangements, especially office layouts. The following considerations are recommended for future works: 1. Taking into account the transportation costs and their fixed and variable costs 2. Taking into account the time value of money at different periods, as well as the fuzziness of costs 3. Performance of the proposed algorithm on problems which are computationally complex 4. Solving multi-objective DFLPBC (goals stated in the first chapter on locating problems) 5. Considering the variable and uneven size of facilities and solving the problem using the proposed algorithm.
REFERENCES 1. Tompkins, J.A., White, J.A., Bozer, Y.A., Frazelle, E.H., Tanchoco, J.M.A., Trevino,
J. (1996) Facilities Planning, NY: John Wiley & Sons, Inc. 2. Francis, R.L., McGinnis Jr., L.F., White, J.A., 1992,“Facility Layout and Location:An Analytical Approach,”
Englewood Cliffs, NJ: Prentice-Hall. 3. Benjaafar, S. and Sheikhzadeh, M., (2000), Design of flexible plant layouts. IIE Transactions, 32, 309–322 4. Rosenblatt, M. J. (1986). The dynamics of plant layout. Management Science, 32(1), 76–86. 5. Ballou, R.H. (1967), Improving the physical layout of merchandise in warehouses, Journal
of Marketing 31(3), 60-64 6. Lacksonen, T.A., Enscore, E. E. (1993) Quadratic assignment algorithms for the dynamic layout problem.
International Journal of Production Research;31(3):503–17. 7. Urban, T. L. (1993). A heuristic for the dynamic facility layout problem. IIE Transactions, 25(4), 57–63.
Hamed Faraji and Bahman Naderi

Indian Journal Of Natural Sciences www.tnsroindia.org. © IJONS
Vol.5 / Issue 28/ February 2015 International Bimonthly ISSN: 0976 – 0997
2893
8. Balakrishnan, J., Cheng, C. H. (2000). Genetic search and the dynamic layout problem: An improved algorithm. Computers and Operations Research, 27(6), 587–593.
9. Balakrishnan, J., Cheng, C.H. (2000), “An improved pairwise exchange for the dynamic plant layout problem,” International Journal of Production Research, Vol. 38, No. 13, pp. 3067-3077.
10. Conway, D. G., Venkataramanan, M. A. (1994). Genetic search and the dynamic facility layout problem. Computers and Operations Research, 21(8), 955– 960.
11. Balakrishnan, J., Cheng, C. H. (2000). Genetic search and the dynamic layout problem. Computers and Operations Research, 27(6), 587–593.
12. Chang, M., Sugiyama, M., Ohkura, K., Ueda, K. (2002) .A coevolutionary genetic algorithm approach to the dynamic facility layout problem,’ Proceedings of 2002 Japan-USA Symposium on Flexible Automation (2002 JUSFA), pp. 93-96.
13. Dunker, T., Radons, G., Westkamper, E. (2005). Combining evolutionary computation and dynamic programming for solving a dynamic facility layout problem. European Journal of Operational Research, 165(1), 55–69.
14. Kaku, B. K., Mazzola, J. B. A tabu search heuristic for the dynamic plant layout problem. INFORMS Journal on Computing 1997; 9(4):374–84.
15. Baykasoglu, A., Gindy, N. N. Z. (2001). A simulated annealing algorithm for dynamic facility layout problem. Computers and Operations Research, 28(14), 1403–1426.
16. McKendall, A.R., Shang, J., Kuppusamy, S. (2006). Simulated annealing heuristics for the dynamic facility layout problem. Computers and Operations Research, 33 (8), 2431–2444.
17. Erel, J.B., Ghosh, J., Simon, J. T. (2003). New heuristic for the dynamic layout problem. Journal of the Operational Research Society;54:1275–82.
18. Baykasoglu, A., Dereli, T., Sabuncu, I. (2006). An ant colony algorithm for solving budget constrained and unconstrained dynamic facility layout problems. Omega, 34(4), 385–396.
19. Balakrishnan, J., Jacobs, F. R., Venkataramanan, M. A. (1992). Solutions for the constrained dynamic facility layout problem. European Journal of Operational Research, 57(2), 280–286.
20. Sahin, R., Ertogral, K., Turkbey, O., (2010). A simulated annealing heuristic for the dynamic facility layout problem with budget constraint. Computers & Industrial Engineering, 59, 308-313.
21. Garey, M. R., Johnson, D.S.( 1979) Computers and Intractability: A Guide to the Theory of NP-completeness, Freeman & Co., San Francisco.
First facility Second facility Third facility Fourth facility Fifth facility
Location 1 2 3 4 5 1 2 3 4 5 1 2 3 4 5 1 2 3 4 5 1 2 3 4 5 First period 1 0 0 0 0 0 0 0 1 0 0 0 0 0 1 0 1 0 0 0 0 0 1 0 0
Second period 1 0 0 0 0 0 0 0 0 1 0 0 1 0 0 1 0 0 0 0 0 0 1 0 Third period 0 0 0 0 1 1 0 0 0 1 0 0 0 0 0 0 0 1 0 0 0 1 0 0
Figure 1: View of a N2 × T bit chromosome
First facility Second facility Third facility Fourth facility Fifth facility
First period 1 0 0 0 0 0 0 0 1 0 0 0 0 0 1 0 1 0 0 0 0 0 1 0 0 Second period 1 0 0 0 0 0 0 0 0 1 0 0 1 0 0 0 1 0 0 0 0 0 0 1 0 Third period 0 0 0 0 1 0 1 0 0 0 1 0 0 0 0 0 0 0 1 0 0 0 1 0 0
First facility Second facility Third facility Fourth facility Fifth facility
First period 0 0 0 0 0 0 0 0 1 0 1 0 0 0 0 0 1 0 0 0 0 0 1 0 0 Second period 0 1 0 0 0 1 0 0 0 0 0 0 1 0 0 0 1 0 0 0 0 0 0 0 0 Third period 0 0 0 0 0 0 0 0 1 0 0 0 1 0 0 0 1 0 0 0 1 0 0 0 0
Hamed Faraji and Bahman Naderi

Indian Journal Of Natural Sciences www.tnsroindia.org. © IJONS
Vol.5 / Issue 28/ February 2015 International Bimonthly ISSN: 0976 – 0997
2894
0
1
0
First facility Second facility Third facility Fourth facility Fifth facility First period 0 0 0 0 1 0 0 0 1 0 1 0 0 0 0 0 1 0 0 0 0 0 1 0 0
Second period 1 0 0 0 0 0 0 0 0 1 0 0 1 0 0 0 1 0 0 0 0 0 0 1 0 Third period 0 0 0 0 1 0 0 0 1 0 0 0 1 0 0 0 1 0 0 0 1 0 0 0 0
Figure 12: intersection operator
First facility Second facility Third facility Fourth facility Fifth facility First period 1 0 0 0 0 0 0 0 1 0 0 0 0 0 1 0 1 0 0 0 0 0 1 0 0
Second period 1 0 0 0 0 0 0 0 0 1 0 0 1 0 0 0 1 0 0 0 0 0 0 1 0 Third period 0 0 0 0 1 0 1 0 0 0 1 0 0 0 0 0 0 0 1 0 0 0 1 0 0
First facility Second facility Third facility Fourth facility Fifth facility
First period 0 0 0 0 1 0 0 1 0 0 1 0 0 0 0 0 1 0 0 0 0 1 0 0 0 Second period 1 0 0 0 0 0 0 0 0 1 0 0 1 0 0 0 1 0 0 0 0 0 0 1 0 Third period 0 0 0 0 1 0 1 0 0 0 1 0 0 0 0 0 0 0 1 0 0 0 1 0 0
Figure 13: how the mutation operator works
First facility Second facility Third facility Fourth facility Fifth facility
First period 1 0 0 0 0 0 0 0 1 0 0 0 0 0 1 0 1 0 0 0 0 0 1 0 0 Second period 1 0 0 0 0 0 0 0 0 1 0 0 1 0 0 0 1 0 0 0 0 0 0 1 0 Third period 0 0 0 0 1 0 1 0 0 0 1 0 0 0 0 0 0 0 1 0 0 0 1 0 0
First facility Second facility Third facility Fourth facility Fifth facility First period 0 0 0 0 1 0 0 0 1 0 1 0 0 0 0 0 1 0 0 0 0 0 1 0 0
Second period 1 0 0 0 0 0 0 0 0 1 0 0 1 0 0 0 1 0 0 0 0 0 0 1 0 Third period 0 0 0 0 1 0 1 0 0 0 1 0 0 0 0 0 0 0 1 0 0 0 1 0 0
Figure 14: How to create vicinity structure in parallel annealing simulation algorithm
Hamed Faraji and Bahman Naderi

Indian Journal Of Natural Sciences www.tnsroindia.org. © IJONS
Vol.5 / Issue 28/ February 2015 International Bimonthly ISSN: 0976 – 0997
2895
BaykasogluS ahinGA-PS AA
0.05
0.04
0.03
0.02
0.01
0.00
Rel
ativ
e Pe
rcen
tage
Dev
iati
on (
RPD
)
Figure 5: 95% confidence interval for RPD
Figure 6: the behavior of algorithms in terms of RPD for different the number of time periods
Figure7: the behavior of algorithms in terms of RPD for different number of facilities
Hamed Faraji and Bahman Naderi

Indian Journal Of Natural Sciences www.tnsroindia.org. © IJONS
Vol.5 / Issue 28/ February 2015 International Bimonthly ISSN: 0976 – 0997
2896
Table 1: Optimal levels of algorithm parameters
Factors Optimal level
Intersection rate 0.8 Mutation rate 0.15
0.95 Initial temperature 1000
Rate of heat loss 0.985 The number of initial results of SA 5
Maximum iteration- initial population (50, 500) Table 2: Mean RPD per number of facilities and time periods
T N Algorithms
GA-PSAA Sahin Baykasoglu
5 6 0.5245 1.3051 0.1661 15 0.1407 6.3176 0.3916 30 0.062 5.6295 0.7034
10 6 0.4747 1.8185 0.5227
15 0.0337 6.9997 0.264 30 0.1694 5.3834 0.7508
Mean 0.234167 4.575633 0.466433
Hamed Faraji and Bahman Naderi

Indian Journal Of Natural Sciences www.tnsroindia.org. © IJONS
Vol.5 / Issue 28/ February 2015 International Bimonthly ISSN: 0976 – 0997
2897
The Impact of Various Factors on Energy Intensity in the Short-term and Long-term Dynamic Model in Industrial Firms of Iran (Case Study: Asphalt Plant of Chaharmahal and Bakhtiari Municipalities Community Organization) Salim Ghahremani *, Aliakbar Nikoueghbal and Siavash Moridi
1Department of Economics, Aligoudarz Branch, Islamic Azad University, Aligoudarz, Lorestan, Iran. Received: 2 Nov 2014 Revised: 21 Nov 2014 Accepted: 18 Dec 2014 *Address for correspondence Salim Ghahremani Department of Economics, Aligoudarz Branch, Islamic Azad University, Aligoudarz, Lorestan, Iran. E.Mail: [email protected]
This is an Open Access Journal / article distributed under the terms of the Creative Commons Attribution License (CC BY-NC-ND 3.0) which permits unrestricted use, distribution, and reproduction in any medium, provided the original work is properly cited. All rights reserved. Energy intensity is an important index to evaluate how energy is used. This article aims to study effective factors on energy intensity in Iran industrial firms according to short-term and long-term criterion. The method of this article is autoregressive distributed lag. In this regard, Asphalt Plant of Chaharmahal and Bakhtiari Municipalities Community Organization is considered as a case study. This descriptive - analytical study uses the model proposed by other researchers to assess the factors affecting the intensity of energy. According to the results, firm size and intensity of physical capital have negative influence on energy intensity in the short-term period; but in long-term period, firm size, physical capital, wages, cost of maintenance and production equipment have positive and significant effect on energy intensity. Long-term assumptions are confirmed. Keywords: energy intensity, firm size, physical capital, wages, repairs costs.
INTRODUCTION Population of developing countries is grown increasing while these countries try to pass the economic transition period rapidly to become industrialized countries with higher income levels and modern lifestyles. Undoubtedly, the move of developing countries to the change in lifestyle is desirable, but increasing energy demand by these countries has negative external effects and result in a global puzzle for energy.
RESEARCH ARTICLE
ABSTRACT

Indian Journal Of Natural Sciences www.tnsroindia.org. © IJONS
Vol.5 / Issue 28/ February 2015 International Bimonthly ISSN: 0976 – 0997
2898
According to the International Energy Agency, energy demand in the horizon 2030 will be increased between 50 and 60 percent (World Energy Outlook 2007). The major share is related to developing countries, particularly China and India. This increasing demand takes place while oil, gas and coal will remain the world’s most important energy sources. During 2005 to 2030, share of gas and coal will reach from 21 and 25 to 22 and 28 percent; and share of oil will reduce with a slight decrease from 35 to 32 percent. In addition to the predictions of the International Energy Agency, other world valid institutions such as World Energy Council and the Petroleum Association of America have predicted future energy demand by presenting different scenarios. All are agree on the increasing energy demand in the future. Energy intensity Energy intensity is an important index to evaluate how energy is used. Energy intensity shows the amount of energy used for the production of a certain amount of goods and services. In other words, energy intensity is the amount of energy consumed to produce one unit of gross domestic product (GDP) at constant prices. A major change in recent decades is the significant reduction of energy intensity in the developed countries. During 1997 to 2007, energy intensity in the countries of the Organization for Economic Co-operation and Development (OECD), G-7 and United States had reduced respectively with rates of 14.4, 15, and 18.8 percent (Energy Information Administration, 2008). Energy intensity is measured in terms of physical units in an industry or a particular production process. It is calculated as amount of spent energy (eg in terms of joules) per the product being produced (eg. In terms of liter unit or tonnes). However, using index of physical energy intensity at the macro level is not possible due to the heterogeneity of products and their physical mutually. Thus, the former units should be used to measure the products. In this manner, the energy intensity index will be economic (but not of physical) that is amount of spent energy (eg. In terms of Bt U) per the value of products (eg. In terms of Dollars) (Nanduri, 1998). Objectives 1. To study the effect of firm size on energy intensity in shot-term and long-term period for Asphalt Plant of
Chaharmahal and Bakhtiari Municipalities Community Organization.
2. To study the effect of physical capital on energy intensity in shot-term and long-term period for Asphalt Plant of Chaharmahal and Bakhtiari Municipalities Community Organization.
3. To study the effect of wages on energy intensity in shot-term and long-term period for Asphalt Plant of Chaharmahal and Bakhtiari Municipalities Community Organization.
4. To estimate each of the variables’ effective pauses including energy intensity, wages, physical capital intensity
and firm size on energy intensity in Asphalt Plant of Chaharmahal and Bakhtiari Municipalities Community Organization.
Review of Literature In their research titled “Analysis of the energy-consumption intensity in Iranian manufacturing”, Jahangard and Tajali (2011) have concluded that the share of intensity in total change is higher than the share of structure. The effect of intensity is more influential than the effect of structure in most of the industries while both if the effects are influential in some industries. In most of the cases, the effect of intensity has been directed toward reducing the effect of energy-consumption.
Salim Ghahremani et al.

Indian Journal Of Natural Sciences www.tnsroindia.org. © IJONS
Vol.5 / Issue 28/ February 2015 International Bimonthly ISSN: 0976 – 0997
2899
Sharifi et al (2008) have concluded in a research titled “Analysis of the energy intensity in Iranian industry” that the effect of structure plays a trivial role in changes of total impact of energy intensity in most of the nine industries; the intensity effect contributes more in changes of total impact. During different years, the intensity effect has been directed to reduce energy intensity in most industries; the structural effect plays trivial role in the reduction of energy intensity. Ghasemi Nezhad (2005) has analyzed energy intensity and consumption of ground transportation (rail and road) during 1991-2002 in his M.A. thesis. He uses two patterns of changes in energy consumption and changes in energy intensity and two parametric methods. He has concluded that the structural effect has a very weak contribution in explaining changes in energy consumption and intensity of transportation sector; and net energy intensity has the highest share in explaining changes in energy consumption and intensity of ground transportation.Papadogonas et al. (2005) have studied the effect of firm size on the intensity of electric power in Greek industries and showed that contrary to expectations, small firms have significantly lower energy intensity and the the effect of firm size on the intensity of electrical energy is positive. Fisher-Vanden et al. (2002) have investigated the effective factors in the decline of energy intensity in Chinese industries during 1997 to 1999 using statistical information of 2500 large and medium firms. They have represented that changes in energy price and research and development expenses are the most important factors that reduce energy intensity; changes in the ownership, settlement region, circumstances of the industry have no significant influence on energy intensity.Studying more than 5000 Indian industrial firms during 1995 to 2002 Kumar (2003) have shown by estimating energy intensity that research and development expenses are the most important factor affecting energy intensity of a firm.
METHODS This is a descriptive – analytical research because it aims to study the relationship between the components of the hypotheses. Data have been collected from energy and financial information and statistics of Asphalt Plant of Chaharmahal and Bakhtiari Municipalities Community Organization. Data are collected in three ways. First, they are collected through library base studies and available data in literature. Second, information about energy consumption and energy intensity available at Asphalt plant of Chaharmahal and Bakhtiari Municipalities Community Organization are gathered. Third, experiences and opinions of some experts and scholars of Energy Economy in Chaharmahal and Bakhtiari are investigated. Chaharmahal and Bakhtiari Municipalities Community Organization has been established to help the provision of municipalities’ self-sufficiency through incomes generated from economic activities – services according to commercial principles with an independent legal personality. According to the memorandum terms, it may engage in all financial, commercial and business activities and operations including import and export of products, the representation of manufacturing companies and institutions, domestic and foreign services, accepting contractors directly or on behalf of member municipalities. The research model In this study, the following model is used to evaluate and test hypotheses (Kumar, 2003):
LnE=c0+ c1LnSi+ c2LnCapi+ c3R&Di+ c4O1i+ c5 O2i + c6LnWi+ c7LnRepi+ui LnE: Logarithm of the firm’s energy intensity. In this study, energy intensity index is considered as the ratio of firm’s energy consumption value in Rials per the value of firm’s production in Rials. LnSi: Logarithm of the firm’s size. Two variables of the number of employees and the selling amount can be used to evaluate the firm’s size.
Salim Ghahremani et al.

Indian Journal Of Natural Sciences www.tnsroindia.org. © IJONS
Vol.5 / Issue 28/ February 2015 International Bimonthly ISSN: 0976 – 0997
2900
LnCapi: Logarithm of the firm’s intensity of physical capital. It is the ratio of physical capital per firm’s production. The above model is estimated using firm-level statistical data. This study employs descriptive statistics. Measures of statistical methods, EXCEL and SPSS software are using for inferential analysis of obtained data.
FINDINGS According to the information, the total figures of sales, costs and energy intensity for each year are shown in Table 1. Moreover, the analysis of variance (test F) for the coefficients of Table 1 will be Table 2.The relationship among some of the presented variables in the previous section with energy intensity in Asphalt plant of Chaharmahal and Bakhtiari Municipalities Community Organization will be analyzed according to the collected data. In Figure 1, the relationship between logarithm of energy intensity (LnE) and logarithm of physical capital (LnCap) are shown. The scatter plot indicates a positive relationship between these two variables. According to available theoretical foundations, it was expected that the increase in physical capital enhance energy intensity. Figure 2 represents the relationship between logarithm of energy intensity (LnE) and logarithm of wages rates (LnW). As seen, the figure shows the positive relationship between wage rates and energy intensity. In other words, increase in wages will finally result in the replacement of capital to labor force; then, intensity of physical capital will enhance. Thus, energy intensity will be increased. Figure 3 shows the relationship between logarithm of energy intensity (LnE) and logarithm of firm size (LnS). Accordingly, the figure uncovers the positive relationship between of energy intensity and firm size. In other words, increase in firm size has a positive influence on firm’s energy intensity.After analyzing the relationship between variables, the research is going to estimate the proposed template. In this regard, the multivariate linear regression model using SPSS software is used. The results are shown in Table 3. Based on the data, factory has not research and development unit and it is dominated by the state sector. Therefore, the virtual variables are excluded from the relationship. According to the regression line equation, the coefficients of all variables are positive. It means that their increase results in an increase in energy intensity. The coefficient of LnS is positive and indicates that with a percent increase in firm size, energy intensity in factory will increase 0.425 percent.The coefficient of LnCap is positive and significant. It shows the positive influence of physical capital intensity on energy intensity in factory. The coefficient of LnW is positive and significant. As noted, the positive relationship between these two variables is affected by a positive relationship between physical capital intensity and energy intensity. The rate of the cost of repairing machinery and equipment per sales (LnR) is positive and significant that represents the influence of equipment quality on energy intensity. According to the results, four hypotheses of this study are confirmed.
CONCLUSION Results show a direct relationship between firm size and energy intensity in the factory. Accordingly, it can be concluded that the greater is a firm size, the higher will be its energy intensity.Based on the results, physical capital intensity and wage rate have positive effects on plant’s energy intensity. This result suggests that energy intensity in the firm will be increased with the increase in wages or advancement of technology and replacement of mechanized equipment instead of the traditional production tools and inputs, including labor.Results indicate that the cost of repairing manufacturing equipment has positive and significant influence on energy intensity; it seems worn out capital equipment are effective in the increase of energy intensity.
Salim Ghahremani et al.
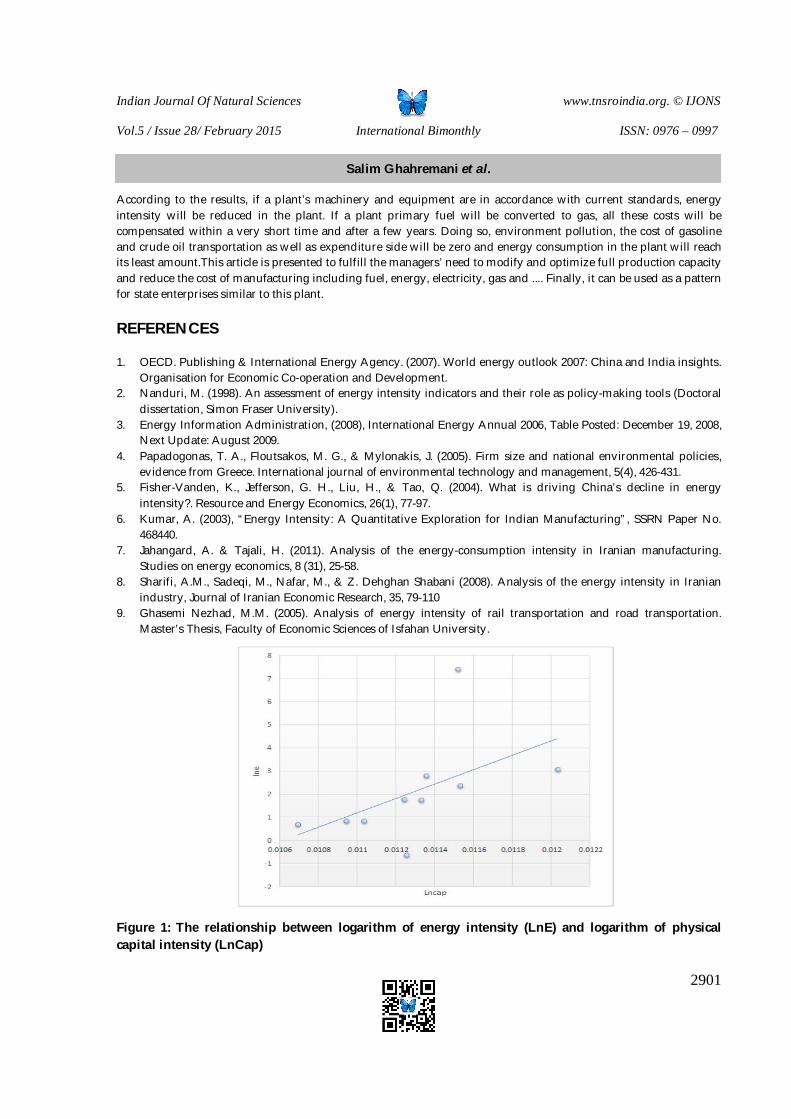
Indian Journal Of Natural Sciences www.tnsroindia.org. © IJONS
Vol.5 / Issue 28/ February 2015 International Bimonthly ISSN: 0976 – 0997
2901
According to the results, if a plant’s machinery and equipment are in accordance with current standards, energy intensity will be reduced in the plant. If a plant primary fuel will be converted to gas, all these costs will be compensated within a very short time and after a few years. Doing so, environment pollution, the cost of gasoline and crude oil transportation as well as expenditure side will be zero and energy consumption in the plant will reach its least amount.This article is presented to fulfill the managers’ need to modify and optimize full production capacity and reduce the cost of manufacturing including fuel, energy, electricity, gas and .... Finally, it can be used as a pattern for state enterprises similar to this plant.
REFERENCES 1. OECD. Publishing & International Energy Agency. (2007). World energy outlook 2007: China and India insights.
Organisation for Economic Co-operation and Development. 2. Nanduri, M. (1998). An assessment of energy intensity indicators and their role as policy-making tools (Doctoral
dissertation, Simon Fraser University). 3. Energy Information Administration, (2008), International Energy Annual 2006, Table Posted: December 19, 2008,
Next Update: August 2009. 4. Papadogonas, T. A., Floutsakos, M. G., & Mylonakis, J. (2005). Firm size and national environmental policies,
evidence from Greece. International journal of environmental technology and management, 5(4), 426-431. 5. Fisher-Vanden, K., Jefferson, G. H., Liu, H., & Tao, Q. (2004). What is driving China’s decline in energy
intensity?. Resource and Energy Economics, 26(1), 77-97. 6. Kumar, A. (2003), “Energy Intensity: A Quantitative Exploration for Indian Manufacturing”, SSRN Paper No.
468440. 7. Jahangard, A. & Tajali, H. (2011). Analysis of the energy-consumption intensity in Iranian manufacturing.
Studies on energy economics, 8 (31), 25-58. 8. Sharifi, A.M., Sadeqi, M., Nafar, M., & Z. Dehghan Shabani (2008). Analysis of the energy intensity in Iranian
industry, Journal of Iranian Economic Research, 35, 79-110 9. Ghasemi Nezhad, M.M. (2005). Analysis of energy intensity of rail transportation and road transportation.
Master’s Thesis, Faculty of Economic Sciences of Isfahan University.
Figure 1: The relationship between logarithm of energy intensity (LnE) and logarithm of physical capital intensity (LnCap)
Salim Ghahremani et al.
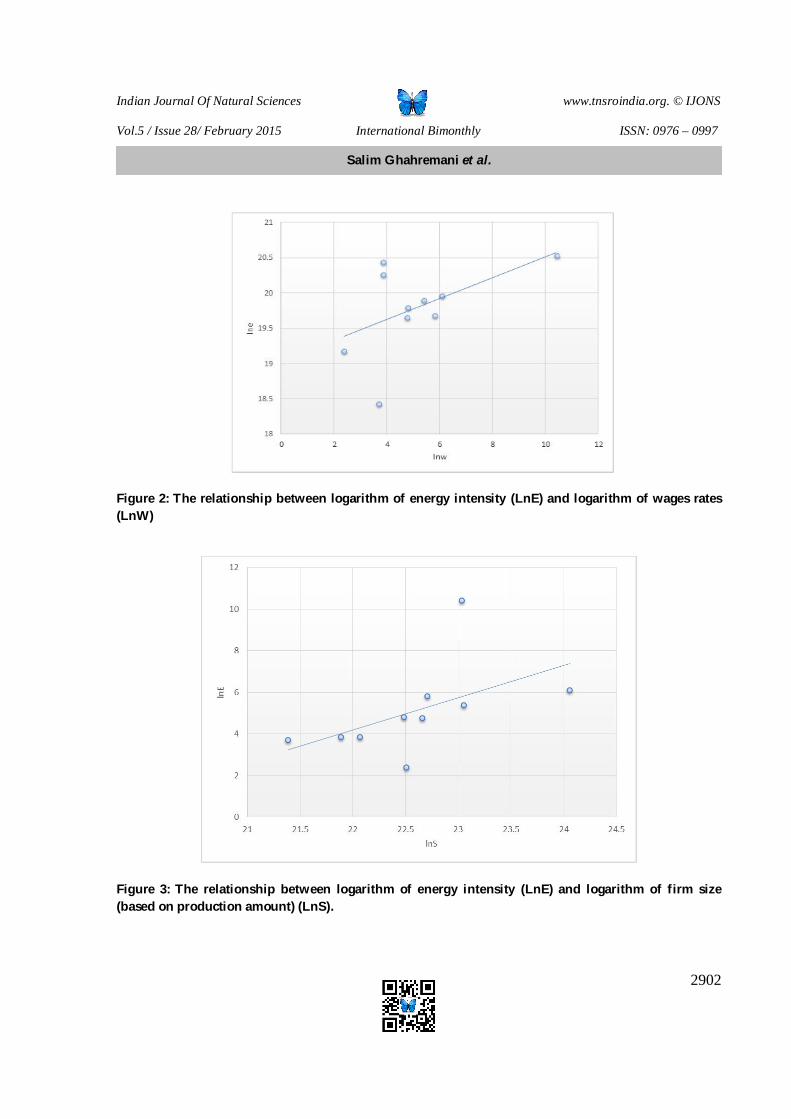
Indian Journal Of Natural Sciences www.tnsroindia.org. © IJONS
Vol.5 / Issue 28/ February 2015 International Bimonthly ISSN: 0976 – 0997
2902
Figure 2: The relationship between logarithm of energy intensity (LnE) and logarithm of wages rates (LnW)
Figure 3: The relationship between logarithm of energy intensity (LnE) and logarithm of firm size (based on production amount) (LnS).
Salim Ghahremani et al.

Indian Journal Of Natural Sciences www.tnsroindia.org. © IJONS
Vol.5 / Issue 28/ February 2015 International Bimonthly ISSN: 0976 – 0997
2903
Table 1: The total figures of sales, costs and energy intensity for each year
Year Sales Costs Energy intensity
83 5.97E+09 1.52E+09 0.091779
84 5.82E+09 1.93E+09 0.008317
85 1.95E+09 3.07E+08 0.024562
86 6.94E+09 9.14E+08 0.008615
87 7.3E+09 8.55E+08 0.003013
88 2.81E+10 2.56E+09 0.002277
89 1.03E+10 1.21E+09 0.004578 90 3.21E+09 1.06E+09 0.021345
91 3.85E+09 1.27E+09 0.021245
92 1.01E+10 8.82E+08 0.009577
Table 2: Results of variance analysis for costs, sales and energy using intensity Descriptive unilateral ANOVA
Sum of squares Df Mean-square F Sig. s83
Between groups 1.925E19 2 9.626E18 . . Within groups .000 0 . Total 1.925E19 2
s84
Between groups 1.758E19 2 8.788E18 . . Within groups .000 0 . Total 1.758E19 2
s85
Between groups 2.199E18 2 1.099E18 . . Within groups .000 0 . Total 2.199E18 2
s86
Between groups 2.844E19 2 1.422E19 . . Within groups .000 0 . Total 2.844E19 2
s87
Between groups 3.185E19 2 1.593E19 . . Within groups .000 0 . Total 3.185E19 2
s88
Between groups 4.828E20 2 2.414E20 . . Within groups .000 0 . Total 4.828E20 2
s89
Between groups 6.339E19 2 3.170E19 . . Within groups .000 0 . Total 6.339E19 2
s90
Between groups 5.350E18 2 2.675E18 . . Within groups .000 0 . Total 5.350E18 2
Salim Ghahremani et al.

Indian Journal Of Natural Sciences www.tnsroindia.org. © IJONS
Vol.5 / Issue 28/ February 2015 International Bimonthly ISSN: 0976 – 0997
2904
s91
Between groups 7.697E18 2 3.849E18 . . Within groups .000 0 . Total 7.697E18 2
Table 3: The results of relationship estimation using multivariate linear regression model
Model Coefficients
t Sig. B Error 1 Intercept .097 .004 3.685 .001
LnS .425 .061 4.407 .000 Lncap .101 .039 3.682 .001 LnW . 581 .080 5.323 .000 LnR .198 .052 3.334 .001
Salim Ghahremani et al.

Indian Journal Of Natural Sciences www.tnsroindia.org. © IJONS
Vol.5 / Issue 28/ February 2015 International Bimonthly ISSN: 0976 – 0997
2905
Current Developments in Turkey (Battle of FethullahGülenand and Justice -Development Party) Aboozar Nazari* and Hamed Hosseinzadeh
Department of Political Sciences, Faculty of Humanities, Azadshahr Branch, Islamic Azad University, Azadshahr, Iran. Received: 22 Dec 2014 Revised: 21 Jan 2015 Accepted: 25 Jan 2015 *Address for correspondence Aboozar Nazari Department of Political Sciences, Faculty of Humanities, Azadshahr Branch, Islamic Azad University, Azadshahr, Iran. E.Mail: [email protected]
This is an Open Access Journal / article distributed under the terms of the Creative Commons Attribution License (CC BY-NC-ND 3.0) which permits unrestricted use, distribution, and reproduction in any medium, provided the original work is properly cited. All rights reserved. After various failures of the Turkish government in foreign policy which led to a review of their foreign objectives and strategy and after facing public unrest for Ghezi park affair, the government of justice and development is now facing his third great challenge in one year: some 70 people have been arrested for money washing and financial corruption in Turkey (October 17, 2013). It is 11 years that the cabinet of justice and developing is governing Turkey and Ardoghan has been elected the prime minister for the third time. Since justice and development party has overtaken power in Turkey, this country has experienced a boost in his economical state and stability and economic growth has returned to this crisis beaten country which was struggling against a great economic crisis and an inflation rate of 120 percent in late 1990s. The main question of this paper is “what forces contribute to the recent developments in this country and what are the forces (or potential forces) involved in this conflict?” The hypothesis of the present research believes that in addition to internal conflicts in governing justice and development party (due to his governing and administrating methods and his mottos and claims), fierce competition between FathollahGulun the religious and influential Turkish leader living in America and Ardoghan over winning the councils election (March 30, 2014) is another major factor which is contributing to the current condition in Turkey. This research attempts to analyze current developments in Turkey with an analytical-descriptive method. Keywords: Ardoghan, Gulun, Justice and development party, Turkey.
RESEARCH ARTICLE
ABSTRACT

Indian Journal Of Natural Sciences www.tnsroindia.org. © IJONS
Vol.5 / Issue 28/ February 2015 International Bimonthly ISSN: 0976 – 0997
2906
INTRODUCTION FathollahGulun was born on April 27, 1941 in Eastern Anatoly in Pasinler village, Arz Room province (http://tr.fgulen.com). In 1959, Gulen became Imam and religious preacher and the head of religious affairs sent him to Aderneh in border area between Turkey and Bulgaria. In 1962 and when he was a conscript, Gulen was accused of provoking a riot and sedition in Skandaroon city. The logic of this accusation was his unofficial sermons and speeches. Later on, this accusation was ignored and completely forgotten. After his military service, Gulun temporarily returned to Arz Room. There, he participated in founding the local branch of anti-communism movement (KMD). During the Cold War, this extremely nationalist organization was controlled by Turkey and American intelligence services. In this period, Gulen was active in local relations center (HE) which was basically an organization partially controlled by the government. It was considered a cultural organization which was established during the administration of people’s Kamalistrepublican party (CHP) (Seufert, 2014:7).In 1964, Gulen resumed his activities as Imam and became the preacher of Aderne. He began speaking for a small group of his followers in one of the mosques. His compelling speeches soon began to make a name for him.Gulen wasthen sent to supercity of Ezmir where he got promoted to the position of the preacher of Turkish Aegean Sea region. This new position involved him in large sermons and speeches. Over these years, the first settlements whose residents were followers of Gulen were established (Seufert, 2014: 7). On March 12, 1971, the Turkish army disrupted the parliamentary-political process of this country for the second time during the republics. The officers who had orchestrated this coup tried to justify their act by pointing at the danger of reactionary religious activities. Gulen was among those arrested. He was condemned of abusing and manipulating religious sentiments in the service of his own political agenda. However, Gulen managed to use this military intervention as a key to advance his own interests. Muslims were usually arrested in order to keep one balance (between the right and left wings). Gulen was known guilty but was soon released afterwards. He resumed preaching in late February 1972 (http://hurarsiv.hurriyet.com.tr/goster//haber.aspx?id). His followers increased and Ark Yazili foundation was established in Ezmir in 1978 (under the influence of Gulen) which is still active there. In 1979 and when the first number of Sizinti magazine was being published, he wrote an editorial. Influenced by Gulen’s teachings, the first grammar schools were established in this period to get the students prepared for the entrance exam of universities. In early 1970s, the Islamic communities of Turkey formed their first political parties. NajmeldinArbakan established the national survival party (MSP) who preached creation of a strong and independent Turkey whose goal was to protect and support western Muslims. This party managed to get only 11.8 percent of the votes in 1973 parliamentary elections, although this number fell to 6.4 percent in 1977 elections. Other extremist groups used to consider Turkey the Islamic State rather than the pagan state which was the result of the secular system. Amidst these tensions, FathollahGulen placed himself on a par with the governing system and objected the direct politicalization of Islam. He believed that the main duty of the Muslims was not to fight the secular government, but to restore ethical virtues and individual conscience. In 1977, chairmanship of the Islamic affairs gave Gulen opportunity to deliver his sermons in 2 main mosques of Istanbul. After him, prime ministerSuleymanDemirel and his secretary of state SabirKaglayangil were the most prominent members of the community who supported Gulen. When the army generals orchestrated a coup against Demirel (3 years later on September 12, 1980), Gulen obeyed the lines drawn by the coup leaders. 17 years later, Gulen’s support of the coup showed his party authentic for immunity from prosecution. As the observation of secular powers was worrying, Gulen’s movement managed to win even the practical support of the secular rulers from 1986 to 1997. Recent critics of Gunel have considered the views he had adapted those days as his real approach and believe that his more liberal views are more superficial than real (Cobanoglu, 2012: 233 - 300) .
Aboozar Nazari and Hamed Hosseinzadeh

Indian Journal Of Natural Sciences www.tnsroindia.org. © IJONS
Vol.5 / Issue 28/ February 2015 International Bimonthly ISSN: 0976 – 0997
2907
Gulen’s political views Despite his political objections with NajmoldinArbakan, Gulen’sworld view was only slightly different from his other Islamist opponents and succeeding parties. Gulen and Arbakan jointly abandoned westernization and social norms and the lifestyle associated with that (Agai, 2004 : 140). Condemnation of west adherents, glorification of the Ottoman empire as the main power of Islamic Turkey and pioneer of Islamic world, aggression against non-Muslims, especially Christians (Seufert, 2014: 9). Assuming that the Turkish nation can not be imagined without Islam, along with all the political components resulting from this religious nation and may be, more importantly, the idea that Turkish Muslims must renew their ethical and spiritual life. On the other hand, what finally led to separation Gulen from Arbakan and other extremist groups in that period were: the idea that the republican government was a repression tool on the first hand which must be objected against. Gulen did not accept and rejected the alternatives preached by radical Islamists that Turkey could become an Islamic state governed by Muslims. He called Turkey the service state where Muslims needed to work for other Muslims and help promote Muslims’ ethical development (Agai, 2004: 140). The idea that it was necessary for the Islamic groups to seize the government and modify her organization (governmental system and rules) in order to change Islam into the dominant social force. On the other hand, Gulen emphasized that this issue can be really effective for educating the experts’ mentality to govern the country and survive struggle against west which also required enough moral and ethical bases to resist the temptations of the west. The idea that transition to power is only made possible through gaining people’s support in election or public actions and that the goal is to create this necessary support to respond to the demands of the faithful voters. Gulen refrained from participating in debates about the stronger or weaker presence of Islam in the public life. He did not make any comments on the issue of Hijab, Hajj, or governmental schools for preacher and this approach made secular parties think that he is not a threat to their European life style. As a result, public opinion basically considered Gulen’s movement as a non-political trend (Laciner, 2012: 19-25). However, the basic ideas and believes of Gunel did not exhibit much overlapping with the Islamists’ movement. His ideas were greatly in harmony with the educational and cultural policies implemented by coup government generals which was known as the synthesis and outcome of the Turkish Islam. By that time, conductors of the coup had accepted the important elements of Gulen’s and Arbakan’s mentality, a fact that seem contradictory upon the first gaze. To fight the politicalization of the youth and expansion of leftist (Marxism) and rightist (Liberalism) ideology among the youth, the generals and officers of the coup incorporated religion into integrated republic ideology which caused the formation of one identity with 2 elements in Turkey. This procedure can be described as Kamalism in Islamic disguise and in the form of actions such as reviewing history text books and civil educations and rebuilding governmental organizations for lingual and historical policies in order to introduce the obligatory education of Islam in schools and increase the number of faculties in theology universities. Over this era of ideological reviewing of government, Gulen’s movement had nearly turned into the civil society equivalent of the government’spolicies, of course never on purpose. Similar to government, Gulen’s supporters consisted of a mixture of national religious people and social-ethical conservatives who were committed to forming a strong government, while they objected the formation of an Islamic party at the same time. Great similarity between his worldview and the ideology of the newgovernment along with refraining from obvious objections can clearly explain why Gulen was greatly safe from prosecution after the coup and why his followers managed to continue their activities. Firing and removing 100 students of Gulen from police bureau in 1982 damaged this unofficial cooperation. Exploiting the support of authorities, he managed to deliver religious sermons and speeches in all major mosques of Istanbul, Ankara, Ezmir, and his birth place, Arz Room, in the years that followed.
Aboozar Nazari and Hamed Hosseinzadeh

Indian Journal Of Natural Sciences www.tnsroindia.org. © IJONS
Vol.5 / Issue 28/ February 2015 International Bimonthly ISSN: 0976 – 0997
2908
Gulen’s movement in 1980s and 1990s However, Gulen’s popularity did not reach its zenith until mid 1990s. In terms of domestic policies, this was made possible due to growth of Islamist movements in the form of welfare party under the leadership of NajmoldinArdakan. The welfare party won 19 % of the votes in 1994 national election. In the parliamentary election held after this in December 1995, this party managed to win a majority of 21%. After many months of discussion and tension over the form of the government, Arbakan was chosen as the coalition prime minister in 1996. The threat of the Islamists which had stricken horror in society had made Gulen the formal champion of non-political Islam, alternative Islam, the pivotal feature of public discourse about the legacy of religion and government. Gulen established his first school out of the country with the support of the Turkish government, more precisely, with the aid of bureau of education outside the country as a portion of Ministry of National Education. After the emergence of new states in Balkan and central Asia in early 1990s, Turkey adapted a new foreign policy. Turkey was somehow unprepared for these developments. Consequently, Gulen’s network of private schools turned into the most influential foreign policy and cultural and educational tool of that country (Agai, 2004: 156). The following year, a magazine named Axion which was adherent of Gulen’s movement published a report about the membership and participation of the next prime ministerTurgutOuzal (passed away in April 1993) in Gulen’s schools in Balkan and former Turkish republics of soviet union. This put Gulen in the center of domestic and foreign challenges of the Turkish government. Gulen had close relations with high ranking politicians such as Turgut Ouzel founder of Fatherland party (ANAP) who was the prime minister of Turkey from 1983 to 1989 and from 1989 to 1993, and TansloChiler the secretary of truth path party (DYP) and future prime minister and even BolnetEjevit the secretary of Democratic leftist party (DSP) and four times prime minister who was well-known as a completely secular politician (Seufert, 2014: 10). In 1994, Gulen delivered a public speech in the ceremony of establishment of writers’ and journalists’ foundation (GYV) which came to be considered as means to channel political thoughts to social circles. In 1997, Gulen began to make contact with Christian church and founded the first interreligious discourse. He had a meeting with Pope John Pole the second in February 1998. When military leaders realized that Islamic revival has somewhat promoted and reached the warning level by the militaries’ activities since 1980, Gulen and his movement were rejected. From that point, Gulen set about to attack Arbakan’s party as hard as he could and limited the range of Islamic civil society.In national security meeting on February 28, 1997, army men reached an agreement about a legal, administrative and media accord that led to resigning of Arbakan’s government in June 1997 and his party was banned in January 1998.Gulen had always expressed his disagreement with Arbakan’s policies. Unlike Arbakan, Gulen had ignored Hijab as the duty of a fully Muslim female (http://tr.fgulen.com/content/view//5/) After the above-mentioned national security meeting, Gulen supported the demands of the army and military men which finally pointed to Arbakan’s government. Generals had requested the following points: restriction on training Imams and religious activists, removal of religious activists from public organizations, restricting the budget spent for religious activities by private sectors, and assigning the management of private schools from Imams to the government. Gulen supported all these military decisions, although they were against all schools and foundations that his supporters had established. After the farewell party was removed from power, Gulen lost his central political function for the experts who were in control of power (he was used as a tool) and public pressures began to mount on him. On December 23, 1997, Gulen felt that he had to assign the management of more than 300 private schools formerly controlled by his followers inside and outside Turkey to Department of Education. In June 1999, a press campaign started against him which used his real and fake speeches and made him subject to certain accusations. However, Gulen immigrated to united states in 1999 to cure his disease. He has lived in the State of Pennsylvania. The previous year, the foundation of journalists and writers (GYV) began organizing their conference named “Abant Platform”. These incidents might be interpreted as the response of the semi-civic society of Gulen’s movement to his political condition on that time which was first associated with defending the religious freedoms of Muslims inside the secular government. This
Aboozar Nazari and Hamed Hosseinzadeh

Indian Journal Of Natural Sciences www.tnsroindia.org. © IJONS
Vol.5 / Issue 28/ February 2015 International Bimonthly ISSN: 0976 – 0997
2909
conference put human rights and government of law in the focal point of the discussions between militaries and generals. Later on, the conference switched his attention towards issues such as social pluralism and the minority groups. FathoullahGulen’s move and the religious framework of Turkey The contribution of FathollahGulen in Islamic theology has been the subject of various works. However, Gulen was not a reformist theologist (i.e. someone who stated points and information about understanding Quran, Hadith and Sunnah outside the lines drawn the main orthodox move of Turkey). Gulen also had no influence on reformist researchers that studied Koran from a hermeneutic view and historical-critical approach (Korner, 2006). Gulen supports the Koranic view that a woman’s testimony is worth half of a guy’s testimony, while preachers who are associated to government and governmental religion believe that such things were precisely for the period when Koran was descended. So, today they must be partially implemented, not absolutely. A) The influence NaghshBandiye cult From a religious view, Gulen’s move is considered to be a part of NaghshBandiye cult which dates back to the period of BahaodinNaghsh Band (1938-2005). Unlike other mystical brotherhood societies, the main feature of NaghsBandiye cult was a fear of gradual reduction of divine guidance (Mardin, 1991: 121-44, here 123). The teachings of this cult are based on this hypothesis that Muslims’ society is constantly deviating from the virtues of the prophet’s era. In this cult’s view, the spiritual fall must reduce through 4 views or approaches: 1- first, by accurately following the Koranic rules, 2- second, by giving up individual search for God which must be replaced by active attempt for preserving protecting social communities and also ethical-conscience order, 3- third, the belief that God sends a religious reviver for Muslims each century, and 4- fourth, we must be aware of God’s presence in all situations and conditions and see this world as the realm of divine act. Gulen’s religious views and the approaches he has taken are like a modernized version of these 4 principles of NaghshBandiye doctrine. B) The influence of SaieedNoorsi on Gulen’s move In all officially recognized aspects of Gulen’s move in Germany and also international arena, Gulen has stood on the shoulders of Noorsi. Noorsi founded the compatibility between Islam and modern sciences. Far from the main trend of the Muslims, he fostered participation and democratic forms of government and confirmed the existence of religious bases for them. He broke the rigid religious structures of his era and created an effective and open organizational form just like his own study group. Furthermore, he was the first person to create a harmony between the interests of Christians and Muslims in their competition with seculars and the model drawn by seculars of the world. In a social and political scale, Noorsi always sought to improve the unity between his readers and students in the times of constant badgering, banning, books confiscation, and arbitrary arrests and prosecutions.Noorsi’s concern was extension of the life of religion. Yet Gulen considered his main duty a revival of Islamic ethics and collection of enough support for his view of an Islamic society. His main concern was not the survival of Islam, but to prepare faithful genius as the main tools in creating a new society. Nooris has experienced the autocratic government of the previous republics, moreover, he has also witnessed the severe crisis which had overrun the Ottoman empire and government. He was fully aware of the weakness of Ottoman empire and its organizations, that’s why he believed in political freedoms and development ideals. On the contrary, Gulen joins the main movement of Muslim conservatives in idealizing the ottoman empire. Noorsi who has experienced the nationalistic republics of Turkey
Aboozar Nazari and Hamed Hosseinzadeh

Indian Journal Of Natural Sciences www.tnsroindia.org. © IJONS
Vol.5 / Issue 28/ February 2015 International Bimonthly ISSN: 0976 – 0997
2910
with her secularism and suppression supports the liberal forms of government and, unlike the Turkish nationalists, supports the IslamicUmmah. On the other hand, for Gulen who had been born in Turkey and afterwards passed many years in the atmosphere of Turkish nationalism, the concept of nation was an inseparable part of his ideology about Islam. In Gulen’s view, religion must be in the service of people and it is never one of the political views of the future. In his early notes, Gulen has expressed great dislike and disgust for those who are a threat against the internal unity of government and nation which includes the Kurds and, then, Turkish prolocutors. Comparing Gulen’s move against today’s governing party (justice and development party) Both forces of justice and development party and Gulen’s move are witnesses to the fact that moderate Muslims have emerged, or are emerging, who do not seek to confront the Kamalist move, rather they prefer to blend their followers inside the current government and economical structures and reconstruct government and society in this process. They both trust the dynamics by the conservative populations of Muslims. Both forces have prepared and educated their own experts with different degrees to the level that justice and development party relies more on his Islamist staff. The worldview supported by both moves is a combination of Islamic ethics and national Turkish sentiments and ethics (Seufert, 2014: 14), while their discourse has been recognized with an awareness of the inherent power of Turkey and both forces have a lot in common in development view of their country within the region and the whole world. In addition, both have assigned Turkey to act as a balance against Western intervention in the whole region and also beyond the Turkish borders. This duty has demonstrated itself in the form of geopolitical reforms of justice and development Party or in the level of ethical values and social ideals of Gulen’s society. Anyway, Gulen’s activities were not restricted to preparing the faithful for the modernity in the form of Secular education and empowering Muslim identity through providing services to Turkish Muslims community. Gulen and his followers knew themselves as the defendants of conservative ethics and individual conscience. This aspect of his move created anxiety and discomfort among his followers since the claimed goal of ethical ideals was stated simultaneously as the necessary order and condition for the Islamic nation, thus these aspects make Gulen’s move seem more revisionist. Fall of traditional social structures over the period of urban development was very effective in reducing the supportive and punitive aspects of villages as self-sufficient and non-industrial areas. As a result, people did not have any direct social control in the new environment and faced problems such as alcohol addiction, crime, and immorality in the form of anomie, anarchy and social rejection. In the idea of those who had a common ethical tradition, strengthening ethical rules and religious awareness seemed synonym. Gulen’s move and his organizations as a new society of the faithful revived the previous direct social controls based on voluntary work which was designed to trigger internalization of methods and ethical norms by strengthening faith. In other words, in pursuit of creating ethical stability and religious commitment in the face of modernization and the crisis that result from it, Gulen’s move remembers Christianity revival move in Germany during the industrial revolution which is known as domestic mission. This shows more symmetry between FathollahGulen’s move and the current governing party. Prime ministerArdoghan was worried that the young generation might become too secular (Olk and Rolf G. Heinze, 1981: 71 - 233). As a result, one of the central goals of Ardoghan’s administration was to increase the number of faithful youth through governmental schools. Justice and development party has fulfilled his commitment to this issue under the motto of serving people just like Gulen’s move. The fact that FathollahGulen’s community is as popular as justice and development party shows the most important social trend in today’s Turkey, a trend that exists independently from Gulen’s move and can be found in the civic and political society even if Gulen’s move did not exist in his current form.
Aboozar Nazari and Hamed Hosseinzadeh

Indian Journal Of Natural Sciences www.tnsroindia.org. © IJONS
Vol.5 / Issue 28/ February 2015 International Bimonthly ISSN: 0976 – 0997
2911
FathollahGulen’s move and recent Turkish democratic policy The distinction between administration and government in Turkish domestic policy discussions has always been a matter of attention. This distinction was caused in 1950 when the democratic party DP won a shaking triumph in the election and removed people’s republican party from power. However, military, bureaucratic, and economical genius, the majority of university professors, and ministry of justice continued to support people’s Republican Party. This block of power was known as system by the majority of people and media. Army’s interventions in 1960, 1971, and 1980 had always forces right wing governments to resign. In 1997, the army chose to remain in his barracks, yet NajmodinArbakan’s government faced similar political pressures and was forced to resign a few months later. Soon after justice and development party had come to power in 2002, a group of joint staff officers were ready to resume military intervention, but this was delayed several times. On April 27, 2007, joint staff officers published a joint statement expressing their wish that AbdollahGul the former secretary of state be not chosen as president. 2 days later, the constitution court officially dismissed the selection of Gul by the parliament. On March 14, 2008, the attorney general of the supreme court of the country began taking legal measures to ban justice and development party that had managed to increase his share of the votes to 47 percent in previous election on June. Police attack against an illegal gun arsenal on June 12, 2007 was the beginning of a blow against government. In several waves, the criminals and nationalists who were ready to cause riot and unrest were arrested. These people were used by the military to conduct secret operations. Next, unofficial organizations and journalists who were close to army began to cause tension. Eventually, when the public face of the army had suffered a devastating blow, high ranking generals and officers and former head of staff of the army attended the court. In all cases, those who were associated with these events were accused of planning to remove government and the famous Ergincon courts were held in the framework of antiterrorism laws as a trial of those involved. Through vast and large activities such as publicizing the classified military documents about the coup and secret actions and constant waves of arrests and prosecutions, thousands of pages of indictments were prepared against the militarist and this actions cause the coup to be dismissed for the first time in history of Turkey. This experience which had great consequences for the militarists in future was actually an action against previous and current officers and it was codenamed “Mallet”. On the whole, some 365 militarists were known guilty. In this experience, 250 of them were arrested. In September 2012, prison verdicts between 16 to 20 years were issued for 297 people including 11 former generals for planning criminal actions, planning for coup and terrorist attacks (Seufert, 2012: 538). All these actions taken in the name of supporting the selected government, law governance, democracy and historical advancement were equally welcomed by both liberal and conservative forces. However, these campaigns were being conducted simultaneously by police and ministry of justice that were ardent adherents of law government, while the previous operations were always either political or influenced by personal interests. Over these campaigns, Gulen’s move was against the opposition group and sympathized with justice and development party for the first time. The secretary of justice and development party who had previously supported an Islamic ideology announced the ideas of his previous leadership once more and approached Gulen’s line to rebuild the society and government in a long term policy. Recent hatred between Gunel’s move and justice and development party FathollahGulen’s reconsideration appeal on August 1, 2010 was the most explicit support for justice and development party in all political affairs up to this date. He invited the citizens to participate in the referendum held on September 12 the same year for changing the constitution which won a majority of 58 percent. Gulen believed that this issue was so imprtant that even the dead had to be summoned from their graves to vote. This was the last example of cooperation between the political leaders and government. The first seeds of discontent were sown in June 2010 when Gulen and justice and development party failed to reach an agreement about the fleet designed to break the naval blockade of Gaza strip by Israel (http://www.beyazgazete.com/video/ anahaber/trt-haber-67/2013/04/04/mavi-marmara-sehitleri). This initiative was proposed by IHH which was an auxiliary agency close to AKP through gaining the agreement of Ankara. Ahmad DavoudArdoghan called the 9 Turkish soldiers killed by Israel in his attack to MAVI Mamara ship martyrs and summoned his ambassador from Tel Aviv. On the other hand,
Aboozar Nazari and Hamed Hosseinzadeh

Indian Journal Of Natural Sciences www.tnsroindia.org. © IJONS
Vol.5 / Issue 28/ February 2015 International Bimonthly ISSN: 0976 – 0997
2912
Gulen started a movement in Wall street journal about the illegal challenge on Israeli government. However, the current hatred between Gulen’s move and justice and development party is much greater than the initial general clashes (Lauria, 2010). Three complicated and complex sets of issues are responsible for the present chaos: 1- a network of people close to Gulen was witnessed among the security forces and ministry of justice and other governmental organizations of Turkey who aided the government in has battle against Argenkon conspiracy. This network is currently condemned of political activities in the direction of his own interests. Even the observers who are adherents of this movement (and not just government critics in bureaucratic organizations) attribute those who do not obey Ardoghan’s control to the network of Gulen’s supporters.Ardoghan explicitly condemned special courts and described governmentsattorney generals’ behaviors like a government within another government. The press and media who supported government openly accused Gulen’s movement of trying to gain control over the whole bureaucratic system and creating a new provincial regime in place of the militaries who were recently overthrown by justice and development party (http://t24.com.tr). On the other hand, the political views of the governing party and Gulen’s movement are fluctuating. The disagreement started over the issue of Kurds. In September 2011, secret information was revealed about negotiations between national intelligence agency (MIT) and Kurdish people’s unions. In February 2012, the governmental attorney general in the special court summoned prime minister. He had to answer to accusations such as disclosure of governmental secrets to KCK and attempts to create a government. Prime ministerArdoghan had personally issued the order of negotiations and now saw himself accused of treason. He condemned the governmental attorney general of going beyond his power and authorities. He quickly made changes in the constitution through parliament which gave more immunity to Intelligent service employees and also decreased the number of special courts in July 2010. These courts are currently responsible for the cases of crimes against government. This action paved the way for shaking the judges and attorney generals and letgovernment to push networks associated with Gulen’s movement to the margin. Today, the spokesperson of the network rejects all responsibilities concerning the intervention of governmental attorney general in KCK story. They are referring to Gulen’s recent statements that shows he is an adherent of granting cultural freedoms to Kurds. However, during these clashes, the journals of the movement patiently supported these investigations of Turkish Intelligence service. Thus, those media who were adherents of the government pictured Gulen’s movement as a major obstacle for solving the Kurds’ problem over last 20 months. These political disputes seemed to be the real reason of government’s hatred of Gulen’s movement. These courts not only remained responsible for trial of Argenkon, they also tried the case of KCK. Finally, some 2000 people (900 of them were already in prison) accused of membership in a terrorist group had to defend themselves. In many cases, these accusations only led to a very broad definition of terrorism in Turkish law. Thus an appeal was made to terminate the negotiations of the main Turkiesh government element with PKK. The fact that government did not lose his faith in special courts with these trials shows views of power balance and common political tricks in environment of Turkey. When the special courts were totally abandoned, the government had to pay attention to waves of releasing the accused after Argenkon trials and revival of the military power. Government had to directly answer to Kurds as stated in constitution about challenging judgments made in KCK trials. Keeping the special courts for trying the crimes committed against government reduces the pressures on government significantly. At the same time, new cases of crimes against government and political system are tried in the senior criminal court of the district that protects them against the actions of Gulen’s network inside police forces and ministry of justice. Sudden adaptation of a confrontational position against government by Gulen’s adherents has not been considered a total shock by international society, because it was considered a strong social force in the bureaucratic system which could be a serious threat to the government without any military supports. Thus, the political suicide of this movement was completely predictable (Taskin, 2012: 31).
Aboozar Nazari and Hamed Hosseinzadeh

Indian Journal Of Natural Sciences www.tnsroindia.org. © IJONS
Vol.5 / Issue 28/ February 2015 International Bimonthly ISSN: 0976 – 0997
2913
CONCLUSION There are three main reasons that explain why Gulen’s movement has given up his former political continence and conservation. Firstly, his great popularity in previous decade had increased the financial, economical and political options of the movement and the followers’ expectations of this movement had increased simultaneously in mental and financial dimensions. Economical corruption had also increased which was fostered by bureaucratic posts, appointive directives of the government, and financial revenues of the government from previously private educational institute inside and outside the country. Secondly, increasing the expectations of this movement in the face of Gulen’s death would threaten to destroy the movement without him (Balci, 2012: 52-66). At the same time, the expansion of Gulen’s network outside the country had come to a halt. In central Asiatic countries, a considerable freedom of act was granted to the movement initially by some governments. In the face of increasing extremism of religious environments, Gulen’s movement did not manage to publicize his moderated version of Islam. Third, the movement was suffering from a series of obstructions from the intelligent services of Turkey even before his open clash with the government. In March 2011, the government relegated the greatest observations system of Turkey which was formerly handled by the general staff of the army to national intelligence service (MIT). Thus, weakening of the army was not accompanied by strengthening police were Gulen’s supporters were completely organized. Instead, national intelligence service which was under the control of Ardoghan gained all the benefits (Seufert, 2014: 21). Last year, HakanFidan deputy head of the intelligence service who was made to attend the special court in February 2012 was promoted to MIT head. After announcing the closure of all educational centers which were the main sources of revenue for Gulen’s movement in September and October 2013, government even put more pressure on this movement to scatter and dissolve it. As this action was taken without any other educational reforms, it was practically an actions taken to weaken Gulen’s movement. This fact indicates that government is clearly on a clash course with Gulen’s movement. REFERENCES 1. BayramBalcı. (2013). The Development of the FethullahGülen Community in Central Asia, the USA and Europe,
(Turkish), Birikim 282 (October 2012): 52–66, and personal communi- cation with journalist Ali Topuz in Istanbul on 11 September 2013.
2. BekimAgai. (2004). Between Network and Discourse: The Educational Network Surrounding FethullahGülen (born 1938): The Flexible Implementation of Modern Islamic Thought (German), Bonner Islam- studien, vol. 2, 140.
3. CengizÇandar. (2013). Interview by the news website T24 with Turkish journalist. 26 November 2012, http://t24.com.tr/haber/ cengiz-candar-ortadoguda-sinirlar-degisecek-turkiye-de-buna- dahil/218234 (accessed 21 November 2013).
4. Cf. BinnazToprak. (1989). Religion as a State Ideology in a Laicist State: The Turkish-Islamic Synthesis, (German), ZeitschriftfürTürkeistudien 2, no. 1 (1989): 55–62.
5. Cf. Felix Körner. (2006). Old Text – New Context: Koran Hermeneutics in Contemporary Turkey (German), (Freiburg i. Br.).
6. Cf. here ÖmerLaçiner. (2012). Community Politics. (Turkish), Birikim, 282: 19–25. 7. Cf. Olk T. and Heinze R. G. (1981). The Bureaucratisation of Benevolence: the Example of the History and
Development of the ‘Inner Mission, (German), in ChristophSachße and Florian Tennstedt, Jahrbuch der Sozialarbeit 4 (Reinbek): 233–71.
Aboozar Nazari and Hamed Hosseinzadeh

Indian Journal Of Natural Sciences www.tnsroindia.org. © IJONS
Vol.5 / Issue 28/ February 2015 International Bimonthly ISSN: 0976 – 0997
2914
8. Cf. YavuzÇobanoğlu (2012). The Goal of a “Golden Generation”: Society, State, Morality and Authority According to FethullahGülen (Turkish), 233–300.
9. DiyanetİşleriBaşkanlığı. (2002). (DİB, Presidency of Religious Affairs), Final Declaration by the First Consultative Assembly on Daily Religious Problems (Turkish) (Ankara).
10. Günter Seufert. (2012). Turkey, (German), in Jahrbuch der Euro päischen Integration 2012, ed. Werner Weidenfeld and Wolfgang Wessels (Baden-Baden, 2012): 538
11. Lauria J. (2010). Reclusive Turkish Imam Criticizes Gaza Flotilla, The Wall Street Journal (online), 4 June 2010, http:// online.wsj.com/news/articles/SB10001424052748704025304575284721280274694 (accessed 14 November 2013).
12. Şerif Mardin. (1989). Religion and Social Change in Modern Turkey: The Case of Bediüzzaman Said Nursi (Albany, NY), 213. With this, Nursi became the first Muslim to develop a concrete con-ception of what is now known as intelligent design.
13. Şerif Mardin. (1991). The Nakşibendiye Order in Turkish History, in Islam in Modern Turkey, ed. Richard Tapper (London), 121–44, here 123.
14. Seufert G. (2014). Is the FethullahGülen Move ment Overstretching Itself? A Turkish Religious Community as a National and International Player, SWP Research Paper, RP 2 January 2014, Berlin.
15. YavuzÇobanoğlu. (2012). A Movement without a Female Archetype, (Turkish), Birikim, 282:77–84, here 81. 16. Yüksel Taşkın. (2012). The Gülenists, a Movement between Religious Nationalism and Transnational Dynamics”
(Turkish), Birikim 282 (October): 31.
Aboozar Nazari and Hamed Hosseinzadeh

Indian Journal Of Natural Sciences www.tnsroindia.org. © IJONS
Vol.5 / Issue 28/ February 2015 International Bimonthly ISSN: 0976 – 0997
2915
Evaluation of Knowledge and Practice of Mothers Attending to Tabriz Dental School about the Effects of Fluoride on Teeth and the Ways of Getting Fluoride in 2013 Maryam Pourkazemi1, Leila Erfanparast 1*, Ardalan Abdollahi 2 and Saiid Esamilzadegan 1 1Department of Pediatric Dentistry,Faulty of Dentistry ،Tabriz University of Medical Sciences, Tabriz , Iran. 2Department of Endodontic , Faulty of Dentistry , Tabriz University of Medical Sciences , Tabriz , Iran. Received: 22 Dec 2014 Revised: 11 Jan 2015 Accepted: 19 Jan 2015 *Address for correspondence Leila Erfanparast Department of Pediatric Dentistry, Faulty of Dentistry,Tabriz University of Medical Sciences, Tabriz, Iran.
This is an Open Access Journal / article distributed under the terms of the Creative Commons Attribution License (CC BY-NC-ND 3.0) which permits unrestricted use, distribution, and reproduction in any medium, provided the original work is properly cited. All rights reserved. Mothers are considered as the main primary caregivers for children dental care measures. The use of different forms of fluoride has been proven as a safe and high performance method in caries prevention.The aim of this study was to determine the knowledge levels of mothers about the effects of fluoride on teeth and the ways to take it and mothers practice in using various forms of fluoride.The researcher made questionnaire was used to assess the knowledge and practice of mothers. Data was statistically analyzed by SPSS v.18 software using descriptive methods and distribution indices. For evaluating the relationship between study variables, ANOVA and Pearson correlation coefficient were used.Mothers' knowledge and practice was average. There was a significant direct relationship between knowledge and practice levels. Results revealed a significant inverse relationship between knowledge and practice levels with mothers’ age(r=-0.28, p<0.001 and r=-0.16, p<0.001) respectively. Mothers with higher educational levels had higher levels of knowledge and practice (p<0.001). Knowledge and practice of mothers who were employed outside the home were significantly higher than mothers who were housewives or working at home (p<0.001). Knowledge and practice of mothers who had equal amounts of family income and expenditure were significantly higher (p<0.001). knowledge and practice of mothers who had one or two children were higher. (p<0.001).Considering the influential factors and efficiency of important information sources for parents especially mothers, steps should be taken by provider to promote their knowledge and practice level. Key words: Fluoride, Knowledge, Practice, Preventive dentistry.
RESEARCH ARTICLE
ABSTRACT

Indian Journal Of Natural Sciences www.tnsroindia.org. © IJONS
Vol.5 / Issue 28/ February 2015 International Bimonthly ISSN: 0976 – 0997
2916
INTRODUCTION According to WHO report, tooth decay is an important public health issue in most industrialized countries affecting 60-90% of children and most adults[1]. Systemic or topical use of fluoride has been confirmed to be a safe and high efficiency method in preventing and controlling tooth decay. Systemic use of fluoride (water fluoridation and use of fluoride supplements) has been proposed as an important means of preventing tooth decay[2,3,4]. If the amount of fluoride in drinking water is less than 0.6 ppm, supplement fluoride will be considered for children. After assessing water fluoride levels, nutritional sources of fluoride, and risk of caries in children, the daily dose of fluoride is determined using the AAPD table[5,6]. Fluoride supplements are available in tablets, Lozenge, and liquids (including fluoride-vitamin compounds) and must be only prescribed by a dentist or a physician[7]. Treatment with local fluoride includes professional use of varnish, fluoride solutions and gels and domestic use of toothpaste and mouthwash[8]. Based on studies, the mean reduction in caries after the use of fluoridated mouthwash, gel, and toothpaste in children was 31%[9], 26%[10], and 15-30%[11], respectively. A study was carried out in schoolgirls of Tehran (Iran) in 2013 to assess knowledge levels of schoolgirls’ mothers’ level of knowledge about of fluoride therapy and fissure sealants. Results showed that only 5.4% of the subjects had acceptable level of knowledge on preventive dentistry methods[12]. In 1- to 3-year-old children, parents are considered as the main primary caregivers for oral and dental hygiene measures. Parents train children how to brush teeth and how much toothpaste to use, and monitor the use of fluoride supplements by children, if necessary. In the pre-school period (3 to 6 years), advances in child self oral health care begins, but parents are still the main suppliers of oral hygiene measures[13]. Children at ages 6 to 12 years are responsible for their own oral hygiene, although mothers’ active monitoring is required[14]. Considering that in 91.3% of the drinking water sources of Tabriz, fluoride content is less than 0.5 mg/L, all children of the age groups older than 6 months are in a high risk of having caries and require prescription of fluoride supplements based on their age[14,15].Given the importance of fluoride in preventing tooth decay and mothers’ essential role in maintaining oral health of children and lack of similar studies in this field, we decided to study knowledge levels of mothers about the effects of fluoride on the teeth and the ways to take it and their practice in using various forms of fluoride. The results of this study can be used for evaluating the quality and the quantity of preventive dental measures at the community level, also can urge the authorities to take actions in informing about the effect of fluoride and methods of taking it.
MATERIAL AND METHODS Study subjects and data collection The current study is a descriptive cross-sectional study. Research population of this study consists of mothers of children admitted to the pediatric ward of dental school in 2013. Sample size needed for the study was estimated to be 250. Mothers attending the pediatric ward were randomly selected. After giving the necessary explanations, mothers who have the inclusion criteria and were interested in participating in the study were included. Inclusion criteria consisted of the ability to read and write, and inhabitance in Tabriz. Mothers who had a child with mental or physical disorders and special needs or who were not interested in participating in the study were excluded. Data collection tool in this study was a researcher made questionnaire containing close questions. Questionnaire The first part of the questionnaire included demographic information such as age, occupation, educational level, family income and number of children. The second part of the questionnaire consisted of 23 questions to assess knowledge about the sources of fluoride, effects of fluoride on teeth before and after tooth eruption(systemic and topical fluoride) , how to use different forms of fluoride , the frequency of using of fluoridated mouthwash and
Leila Erfanparast et al.
Indian Journal Of Natural Sciences www.tnsroindia.org. © IJONS
Vol.5 / Issue 28/ February 2015 International Bimonthly ISSN: 0976 – 0997
2917
fluoride therapy and the age which using of fluoridated toothpaste and mouthwash starts . Third part of questionnaire consisted of 5 questions for assessing practice in getting fluoride through different sources(Table 2and 4). Content and construct validity of the questionnaire was evaluated by 5 faculty members of pediatric department of dental school (pediatric dental specialists), 2 ordinary persons, and 2 statistics specialists. The reliability was determined through a pilot study involving 20 mothers attending pediatric ward using Cronbach’s alpha test. Cronbach’s alpha for the questionnaire was calculated 0.87. Response to questions about the knowledge included the options “yes”, “no”, or “don’t know”. The answers were scored based on the distribution of them in the normal distribution curve. A score of 1 was given to right answers in the knowledge part, and a score of 0 to wrong or “don’t know” answers. In the practice part, “yes” answers were rewarded with a score of 1 and “no” answers with a score of 0.
Given that the number of questions assessing the knowledge of mothers about fluoride effects was 23 questions and the number of practice questions were 5, the scores of knowledge and practice range from 0 to 23, and 0 to 5, respectively.
Statistical methods Collected data was statistically analyzed by SPSS v.18 software using descriptive methods and distribution indices. Right answers were summed and the mean values were calculated to assess knowledge and practice levels of mothers. For evaluating the relationship between study variables, ANOVA and Pearson correlation coefficient were used.
RESULTS Mothers participating in the study were 31.11 ± 7.78 years of age with a minimum age of 18 years and maximum of 48 years. Frequency of mothers having elementary education, middle education, diploma, higher diploma, and bachelor or higher degrees were 12.8%, 24%, 39.6%, 18%, and 5.6%, respectively. The mode was diploma in distribution of mothers’ level of education. 60.4% of mothers were housewives, 27.6% have worked outside the home, and 12% of them have worked at home. In 15.1% of families income was more than expenditure, 47.1% of them had equal income and expenditure, and in 37.8% of them expenditure have exceeded income. Number of children was one, two, three, and four or more in 31.2%, 43.2%, 19.6%, and 6% of mothers, respectively.
According to the table 1, we can observe that the average knowledge level of mothers about fluoride effects and ways to get it was 11.39 ± 5.48 with a minimum of zero and maximum of 22. Given the mean theoretical knowledge score of about 11.5, maternal knowledge level was mediocre. Table 2 shows the frequencies of correct and incorrect answers to the questions assessing mothers’ knowledge about fluoride effects on children’s teeth. As shown in the table, maximum knowledge were related to the questions “Fluoride found in toothpaste reduces dental caries” and “Using mouthwash containing fluoride has an effect in preventing tooth decay” with 85% and 79.2% of mothers giving correct answers, respectively. Minimum knowledge were related to questions “Using oral fluoride supplements (fluoride pill or drop) in children is necessary” and “Fluoride affects teeth only after dental eruption” with 17.2% and 20% of mothers giving correct answers, respectively.
The results showed that the average practice level of mothers in using different forms of fluoride is 2.38 ± 1.27 with a minimum of zero and a maximum of 5. Given the number of questions which was 5 questions and the theoretical mean of 2.5, maternal practice level about fluoride is mediocre (table 3).As shown in the table, the highest rate of practice is related to using fluoridated toothpaste (78.4%) and the lowest rate of practice is related to using fluoride supplements (2.8%).
Leila Erfanparast et al.

Indian Journal Of Natural Sciences www.tnsroindia.org. © IJONS
Vol.5 / Issue 28/ February 2015 International Bimonthly ISSN: 0976 – 0997
2918
Pearson correlation test results revealed a significant inverse relationship between knowledge and practice levels with mothers’ age(r=-0.28, p<0.001 and r=-0.16, p<0.001, respectively). In other words, younger mothers have higher level of knowledge about fluoride effects and higher practice level in using different forms of fluoride for their children. ANOVA showed a significant difference of knowledge and practice scores among mothers of different educational levels. Mothers with higher educational levels had higher levels of knowledge and practice than mothers with low educational levels (p<0.001). Scheffe post-hoc test determined that the knowledge and practice rates of mothers are pair wise different based on their educational level (p<0.001). ANOVA showed that the knowledge and practice of mothers who were employed outside the home were significantly higher than mothers who were housewives or working at home. Scheffe post-hoc test revealed that the lowest level of knowledge and practice belongs to housewives (p<0.001). ANOVA showed that the knowledge and practice of mothers who had equal amounts of family income and expenditure were significantly higher than other two groups. Scheffe post-hoc test revealed that knowledge and practice rates of mothers whom their income exceeds expenditure were lower than other two groups (p<0.001). The results showed that the knowledge and practice of mothers who had one or two children were higher than mothers with 3 or more children (p<0.001). Scheffe post-hoc test revealed that mothers with 3 children had lowest rates of practice (p<0.001). The Pearson correlation coefficient also showed a significant direct relationship between knowledge and practice levels of mothers (r=0.601, p<0.001).
DISCUSSION Despite the fundamental role of mothers in preserving oral health of children, few studies have examined mothers’ knowledge and practice about components of prevention tools of dental caries. Because mothers are the primary caregivers for oral and dental care of children, also the first educators of health tips to them; in the present study, we selected mothers as study population. Also mothers can make great strides along with educational programs of specialized organizations in order to promote public health. Therefore, acquiring information on maternal knowledge and practice in this area can be a basis for planning health programs. The results of this study showed that the level of maternal knowledge about fluoride effects and their practice level in using different forms of fluoride for their children were mediocre. The results indicated that the majority of parents know about the effects of fluoride in preventing dental caries in children and adults, but they know little about the period that fluoride can affect teeth and different fluoride sources. The present study examined the relationship between knowledge and maternal age which showed a significant negative correlation between mothers’ knowledge levels and their age. This means that with increasing age, there was less parental knowledge and younger mothers know more about fluoride effects and how to take it. It was true about their practice, too. This finding is inconsistent with the results of Naderifar’s study about knowledge and practice of mothers about children’s oral health, also with Najafi’s and Bhawna and Wigen studies[16,17,18,19].In a study carried out by Ghasemi on knowledge level of mothers visiting health centers in Zahedan, investigators found no significant relationship between maternal age and knowledge level[20]. The difference in results could be due to differences in population being studied and contents of the questionnaire being used in these studies. For instance, the populations being studied in Naderifar’s study were mothers visiting health centers of Zahedan and maternal knowledge was assessed about milk teeth importance, milk teeth decay and how to prevent it, nutrition, and oral health of children[16].In examining the relationship between knowledge and educational level, ANOVA test results showed that the knowledge and practice of mothers were significantly different based on their educational level. Mothers with higher educational levels had higher levels of knowledge and practice. This finding is consistent with the results of studies taken place by Najafi, Ansari-Moghaddam and Ghasemi[17,20,21].
Leila Erfanparast et al.

Indian Journal Of Natural Sciences www.tnsroindia.org. © IJONS
Vol.5 / Issue 28/ February 2015 International Bimonthly ISSN: 0976 – 0997
2919
Maternal employment status was also effective on mothers’ knowledge and practice about fluoride effects and ways to get it. Mothers working outside the home had higher rates of knowledge and practice than mothers working at home or who were housewives. This finding is in agreement with the results of Bahramani (2000) and Abdolhosseini’s (2001) studies, but inconsistent with findings of Ansari-Moghaddam’s study[21,22,23]. They found no significant relationship between practice and occupation. It seems that mothers working outside the home have higher knowledge and practice levels due to communication with wider community. Results showed that maternal knowledge and practice were significantly different in terms of their income. Knowledge and practice levels in mothers who had equal income and expenditure amounts were higher than other two groups. In other studies, a significant relationship between socio-economic status of families and children’s oral health is seen. In Naderifar’s study, mothers with higher income had higher knowledge and practice levels [16]. McDonald also believes that there is an inverse relationship between socioeconomic status and dental caries in children [14]. King et al suggested that about 75 percent of children suffering from tooth decay have low socioeconomic status [24].In studies done by Stella and Peterson, findings showed a direct relationship between knowledge and attitudes of parents towards oral health with economic and demographic status[25]. Manal also reported the effect of socioeconomic status on parents’ knowledge and lower rate of dental caries in high socioeconomic statuses[26].Results also showed that knowledge and practice of mothers about fluoride effects and ways of taking it, were different based on number of children. Mothers with one or two children knew more than others about fluoride effects and how to take it. The Pearson correlation coefficient showed a significant positive correlation between maternal knowledge and practice. This means that mothers with higher knowledge about fluoride and ways to get it; have used different forms of fluoride for their children more than others. The highest knowledge level was about the effect of fluoride found in toothpaste and mouthwash in preventing dental caries and the lowest level was related to the necessity of using oral fluoride supplements. It can be concluded that easy availability of toothpaste and widely distributing fluoridated mouthwash by community-based oral health systems lead to the increased maternal knowledge and practice. In the current study, 79.2% of mothers know about anti-caries effect of fluoridated mouthwash and 69.2% of them have used it for their children. In the other hand, only 17.2% of mothers know about the necessity of fluoride supplements and 2.8% of them have used it for their children. It should be noticed that oral health promotion and public knowledge increase, requires primary oral and dental health care's to be available easily for people. Thus, systematically application of health plans by government can play an important role in increasing knowledge and practice of individuals and institutionalizing healthy behaviors in society.
Since this study was performed in Tabriz, the results are not generalizable to the whole country, principally. Therefore, it is proposed that a similar study be conducted for the whole country to allow planning for training mothers and giving them information about how to take fluoride and what effects it has.
CONCLUSION According to mediocre knowledge and practice level of mothers about fluoride effects and ways to get it and considering the influential factors and efficiency of important information sources for parents specially mothers, steps should be taken to promote their knowledge and practice level. These measures include health education sessions, TV programs encouraging healthy behaviors, and presenting educational pamphlets about fluoride intake.
REFERENCES 1. Peterson PE, Lennon MA. Effective use of fluorides for the prevention of dental caries in the 21st century; the
WHO approach. Community Dent Oral Epidemiol 2004; 32:319-21.
Leila Erfanparast et al.

Indian Journal Of Natural Sciences www.tnsroindia.org. © IJONS
Vol.5 / Issue 28/ February 2015 International Bimonthly ISSN: 0976 – 0997
2920
2. Adair SM. Evidence – based use of fluoride in contemporary pediatric dental practice. Pediatr Dent 2006; 28:133-42.
3. Narendram S, Chan JL, Turner SD, Keene HJ. Fluoride knowledge and prescription practices among dentists. J Dent Edue 2006;70: 956-64.
4. World Health Organization. Environmental health criteria 36: fluorine and fluorides .Geneva: World Health Organization. 1984.
5. American Academy of Pediatric Dentistry. Clinical guideline on flouride therapy. Chicago, American Academy of Pediatric Dentistry. 2003.
6. Meskin LH,ed . Caries diagnosis and risk assessment: a review of preventive strategies and management. J Am Dent Assoc 1995; 126:15-245.
7. D,Hoore W, Van Nieuwenhuysen JP. Benefits and risks of fluoride supplementation: caries prevention versus dental fluorosis. Eur J pediatr 1992; 151: 613-6.
8. CDS Rev. Facts about fluoride. 2006; 99: 44. 9. Stamm JW. The value of dentifrices and mouth rinses in caries prevention. Int Dent J 1993; 43:517-27. 10. Hagen pp, Rozier RG, Bawden JW. The caries-preventive effect of full-and half strength topical acidulated
phosphate fluorlde. Pediatr Dent 1985;7:185-91. 11. Koch G, Petersson LG, Kling L. 1982. Effect of 250 and 1000 ppm fluoride dentifrice on caries: a three-year clinical
study. Swed Dent J 1982;6:233-8 12. Pashmi J. Knowledge and perception of fluoride among dentists in Tabriz 2008 [dissertation]. Tabriz university;
2008. Persian. 13. Whaley L, Wong D. Nursing care of infant and children .Washington: Mosby; 2003. p. 727-8, 781-3. 14. Mc Donald RE, Avery DR ,Stookry GK, Chin JR, Kowolik JE. Dental caries in child and adolescent.In: Dean JA,
Avery DR , Mc Donald RE, , Dentistry for the child and adolescent , 9th ed . Mosby ; 2011. p. 218-20. 15. Kazemyian G. Evaluation of fluoride in drinking water of Tabriz And determine the amount required in the year
1389 [dissertation].Tabriz iran.Tabriz university; 2010. Persian. 16. Naderifar M, Akbarsharifi T, Pairovi H, Haghani H. Mothers' Awareness, regarding Orodental Health of their
Children at age of 1-6 Years old . IJN 2006;19:15-27. 17. Najafi A. Parents’s knowledge about orodental health referred to Shahid Beheshti dentistry [dissertation]. Shahid
Beheshti University; 2000. Persian. 18. Bhavna Talekar P, Gary Rozier R Gary D .Parental perceptions of children's oral health: The Early Childhood Oral
Health Impact Scale (ECOHIS) Health and Quality of Life Outcomes 2007, 5:6 online at: http://www.hqlo.com/content/5/1/6.
19. Wigen TI, Wang NJ. Caries and background factors in Norwegian and immigrant's 5-year-old children. Community Dent Oral Epidemiol 2010;38: 19-28.
20. Ghasemi, B. Knowledge of mothers referring to health centers in Zahedan, about the importance of oral health. [dissertation]. Zahedan unviversity; 2004. Persian.
21. Ansari-Moghaddam S. Mothers´ knowledge and attitude towards factors affecting orodental health infants and children. [dissertation]. Zahedan University of Medical Sciences and Health Services; 2003. Persian.
22. Bahramani M. Evaluation knowledge of parents attending pediatric department of Islamic azad university about caries preventive methods. [dissertation]. Tehran Iran. Islamic azad university; 2000. Persian.
23. Abdolhoseini M. Assess the knowledge, attitude and practice of girl students towards preventive dentistry in Tehran schools [dissertation]. Tehran university; 2001. Persian.
24. 24. King NM, Wu II, Tsai JS. Caries prevalence and distribution and oral health habits of zero- to fouryear-old children. J dent child 2003;70:243-9.
25. Petersen PE, Stella YL. Health promoting schools: an opportunity for oral health promotion. Bull world health organ 2005; 83: 677-684.
26. Manal L, Malik AL, Holt RD, Bedi R. Prevalenceand patterns of caries, rampant caries, and oral health in two- to five- year- old children in Saudi Arabia. J dent child 2003;70: 235-241.
Leila Erfanparast et al.

Indian Journal Of Natural Sciences www.tnsroindia.org. © IJONS
Vol.5 / Issue 28/ February 2015 International Bimonthly ISSN: 0976 – 0997
2921
Table 1.Distribution of mothers’ level of knowledge about fluoride effects.
maximum minimum standard deviation
Variance Mean Number
22 0 5.48 30.039 11.39 250 Table 2. Frequencies of correct and incorrect answers to the questions assessing mothers’ knowledge about fluoride effects on children’s teeth (correct answers are marked).
Questions of knowledge Yes No Don’t know frequency percent
1- Fluoride is an essential substance for tooth health. 151 60.4 43 17.2 56 22.4 2- Fluoride can be found in foods. 133 53.2 37 14.8 80 32 3- The most important source of fluoride is medications.
59 23.6 105 42 86 34.4
4- Fluoride prevents tooth decay. 188 75.2 14 5.6 48 19.2 5- Fluoride is the treatment for tooth with extensive decay.
42 16.8 138 55.2 70 28
6- Fluoride has effect on oral microbes. 165 66 25 10.4 59 23.6 7- Fluoride has effect on adult’s teeth. 151 60.4 37 14.8 62 24.8 8- Fluoride affects teeth only after dental eruption. 112 44.8 50 20 88 35.2 9- Fluoride found in foods can have effect on teeth. 103 41.2 44 17.6 103 41.2 10- Fluoride found in foods can enter tooth structure. 84 33.6 41 16.4 125 50 11- Adding fluoride into drinking water can be effective in preventing tooth decay.
121 48.4 43 17.2 86 34.4
12- Using oral fluoride supplements (fluoride pill or drop) in children is necessary.
43 17.2 29 11.6 178 71.2
13- Fluoride contact with tooth surface has an effect on tooth resistance against decay.
172 68.8 10 4 68 27.2
14- Fluoride can be use as a gel on teeth surface. 130 52 12 4.8 103 43.2 15- Use of fluoride gel on children’s teeth is done at home by parents.
21 8.4 60 24 169 67.8
16- Using of topical fluoride (gel) is also necessary on children’s teeth without tooth decay.
77 30.8 34 13.6 139 55.6
17- If the child brush his/her tooth regularly, there is no need to use fluoride gel on teeth surface.
43 17.2 120 48 87 34.8
18- One time use of topical fluoride (gel) will suffice for all the life.
14 5.6 135 54 101 40.4
19- Using mouthwash containing fluoride has an effect in preventing tooth decay.
198 79.2 10 4 42 16.8
20- Fluoride containing mouthwashes are used after 6 years of age.
163 65.2 12 4.8 75 30
21- Fluoride containing mouthwashes are used once a month.
23 9.2 156 62.4 71 28.4
22- Fluoride found in toothpaste reduces dental caries. 213 85.2 14 5.6 23 9.2 23- Using fluoridated toothpaste should be started after first year of age.
42 16.8 132 52.8 76 30.4
Leila Erfanparast et al.

Indian Journal Of Natural Sciences www.tnsroindia.org. © IJONS
Vol.5 / Issue 28/ February 2015 International Bimonthly ISSN: 0976 – 0997
2922
Table 3. Distribution of mothers’ level of practice about fluoride use.
maximum minimum standard deviation
Variance Mean Number
5 0 1.27 1.61 2.38 250
Table 4. Frequencies of answers to the questions assessing mothers’ practice about fluoride use.
Questions of practice yes no 1- Do you take your children to a dentist for fluoride therapy? 17.2 82.8 2- Do you use fluoridated mouthwash (sodium fluoride mouthwash) for your children? 69.2 30.8 3- Do you use fluoride supplement pills or drops for your children? 2.8 97.2 4- Do you use fluoridated toothpaste for your children? 78.4 21.6 5- When purchasing toothpaste for your children do you take attention whether it contains fluoride or not?
71.2 28.8
Leila Erfanparast et al.
Indian Journal Of Natural Sciences www.tnsroindia.org. © IJONS
Vol.5 / Issue 28/ February 2015 International Bimonthly ISSN: 0976 – 0997
2923
Designing a Low-Noise High-Gain Amplifier within 3.1-10.6 GHz for Ultra Wideband Radio Receiver R. Jahani1* ,H. A. Shayanfar2 and M. Tamaddon3
1 Young Researchers and Elite Club, Science and Research Branch, Islamic Azad University, Tehran, Iran. 2 Department of Electrical Engineering, South Tehran Branch, Islamic Azad University, Tehran, Iran. 3 Department of Electrical Engineering, Amirkabir University of Technology , Tehran, Iran. Received: 22 Dec 2014 Revised: 21 Jan 2015 Accepted: 31 Jan 2015 *Address for correspondence R. Jahani Young Researchers and Elite Club, Science and Research Branch, Islamic Azad University, Tehran, Iran. E.Mail: [email protected]
This is an Open Access Journal / article distributed under the terms of the Creative Commons Attribution License (CC BY-NC-ND 3.0) which permits unrestricted use, distribution, and reproduction in any medium, provided the original work is properly cited. All rights reserved. In this paper a low noise amplifier which works within 3.1GHz-10.6GHz is designed and simulated. The wideband impedance match, wide band and constant (distortion-less) gain are among the significant characteristics of this ultra-wide band amplifier. In addition to these two major parameters, the low noise and high gain characteristic of this amplifier are of particular interest. In proposed design, a common gate topology in conjunction with a 3-order passive Butterworth filter is used to yield the wide band performance and wide band impedance match. For the purpose of high and flat gain a combination of inductance and resistor is embedded in drain of blocks. The amplifier is designed based on 0.13um CMOS standard and simulated by ADS2009 software. Throughout the band, the amplifier gain is within 12~15 dB, the Figer noise is about 3~4.5 and the power consumption is 16 mW.
Keywords: low noise amplifier, ultra wide band, Butterworth filter, common gate. INTRODUCTION The UWB technology was introduced by FCC in February 2002 as a wireless design which fulfils the criterion BW/fc > %20 [1]. In this criterion, fc is the central frequency of band. In a UWB system, the total bandwidth should be more than 500 MHz. The objective bandwidth is supposed to be 3.1~10.6 GHz.If all 7.5 GHz band be used effectively, the most accessible power of UWB transmitters will be approximately 0.556mW. This value is just a little portion of delivered power which is used in medical science industry and ISM such as IEEE 802.11a/b/g. This property makes
RESEARCH ARTICLE
ABSTRACT

Indian Journal Of Natural Sciences www.tnsroindia.org. © IJONS
Vol.5 / Issue 28/ February 2015 International Bimonthly ISSN: 0976 – 0997
2924
the UWB to be very effective in short distance low-power high-rate application. For distances between1~ 4, the bit rate can reach up to hundreds of MHz. for distances more than 20 m, the bit rate accessible to UWB is less than current WLAN system such as 802.11 a/b/g [2]. The low noise amplifiers (LNA) play a great role in viruses communicating systems either in wide band applications or applications in which the narrow band signals are simultaneously processed. As an example for those that have wide band application, the new technology of ultra wide band (UWB) which is used in short-distance low-power and high-rate communications. As regards the second application of LNA, the multi state- multi standard systems are prime examples. Providing a desired gain with low noise in presence of intrinsic noise which throughout enters to the band, account for a major challenge in designing the radio band amplifiers especially in design with CMOS based technologies. In this project, a methodology for designing a low noise wide band amplifier with CMOS technology is presented. The kernel of this work is a common gate amplifier accompany with a 3-order filter. Since the common gate amplifiers intrinsically have wide band, they have become one of popular and effective alternatives as wide band amplifier circuits. These amplifiers are able to match the input impedance within a wide range of frequency band and are befitted to be employed for UWB system. Although because of some problems with respect to the internal characteristic of the common base structures they are not as popular as common source structures, the common gate ones are still among the popular alternatives for wide band applications. Structure of low-noise ultra wide-band amplifier The block diagram of proposed LNA structure is depicted in fig. 1 Block 1) this block is the input filter which is used to match the wide band impedance as well as to control the LNA performance in the UWB. The various structures of conventional Chebichouv and Butterworth filters have been examined for the purpose of filter design. However, herein the Butterworth filter is chosen due to its flat characteristic in frequency. Block 2) this block is the primary input of the circuit which is used in designed in common gate structure adjusting the 50 ohm input resistance. Block 3) this block is to compensate the low gain of the common gate block and as well as to improve the bandwidth and reverse isolation (S12) in order to prevent the possible oscillations throughout the circuit. Block 4) this block is quiet commonly used in all LNAs for the purpose of post implement metering ans is attributed as a major block. Herein, in addition to the metering, this structure is utilized for wide band impedance matching in output. The schematic of the circuit is presented in fig.2 while the biasing sources are not taken into account. Design of input filter Basically, the input filters of such circuits are made of passive elements because these filters neither add additional noise nor attenuate the input power. The chosen filter is a non-band path filter of order 3 which is designed and simulated for two states of Chebichouv and Butterworth. Eventually the model with better results would be of interest for input filter. Fig. 3. Presents the explanatory filter [3] also corresponding equations for low pass filter are as follows.
Jahani et al.

Indian Journal Of Natural Sciences www.tnsroindia.org. © IJONS
Vol.5 / Issue 28/ February 2015 International Bimonthly ISSN: 0976 – 0997
2925
The transform function of the low path Butterworth filter is
n
c
HjH 202
/1
(1)
Where n is the order of filter, H0 is the DC attenuation which is no more than 1. In fig.3 the frequency response of Butterworth filter is shown. Replacing the Butterworth filter with Chebichov loads to the following transform function
1
2202
cos.cos
/1
nC
CHjH
n
cn (2)
Where is ripple amplitude and c is cut off frequency of 3dB.
The frequency response of the Chebichov filter is shown in fig. 5 From figures 4 and 5 it can be seen that the Butterworth filter has a flat and distortion-less characteristic. As usual method of band pass filter is that first the filter is designed as low pass and then using following relationships, the results of low pass filter is transformed to band pass domain.
(3)
Where Lk and Ck are the values of Inductance and capacitance of band pass filter of Fig(6) To sum up, the outcomes of both filters is brought in Table (1). Values are calculated for band of3.1~10.6 GHz. Low noise amplifier The filtered signal is introduced to a common gate transistor whose input impedance is 1/gm. This impedance is considered as a load for input filter. The accurate value of this impedance is calculated by to increase the band with of second block, the shunt-peak technique which is consist of a series combination of an inductance and a resistance in Drain M1 is employed. The low output resistor of CG is considered because of small rds of the new short-channel apparatus. For example, the rds value for 180 nm technology is 500 ohm. The low rsd level results in gain decline and noise increment [4]. To attain a high gain and a better reverse isolation, the output of common gate block is introduced to a cascade structure. The Lp is used to resonant with the parasite capacitor of the node to neutralize it. Moreover, This action helps in bandwidth and gain improvement. For generating whole of biasing voltages, the following structure is applied.
Jahani et al.

Indian Journal Of Natural Sciences www.tnsroindia.org. © IJONS
Vol.5 / Issue 28/ February 2015 International Bimonthly ISSN: 0976 – 0997
2926
The C-DC is about 10 pf and is shorted throughout the band width UWB. In this way, the parasite capacitors have no longer the devastating effect of NF and band width; however, this capacitor CB is needed to bias M1. The RG value is about 2~3 k ohm. Simulation results The final cures are associated with major factors of LNA such as, Figer noise, dispersal parameters, gain, linearity, and power consumption of circuit after test. Also, the significant and optimal errors of the values have been simulated with ADS2009 for 0.13 um CMOS. Table 2. provides a comparison between the proposed circuit and some other works
CONCLUSION
In this article, a low-noise UWB amplifier was designed and simulated based on 0.13 um CMOS technology. Primarily, this paper aimed to increase the bandwidth and to provide a flat characteristic to the key parameters of the LNA within the UWB. Wide band characteristic and the ability of wide band impedance matching have made the common gate topology to be used in this study. To achieve a flat frequency response as well as to provide a UWB impedance match within 3.1~10.6 GHz, the received signal introduced to a 3-order band path
Chebichov filter. Passed from the filter, the UWB signal was introduced to a common gate block after which a cascade circuit was used for more gain. At the end, to match the output and to reach some testing and measuring objectives, the output passes a buffer block.
REFERENCES
1. Frank Ellinger," Radio Frequency Integrated Circuits And Technologies"Springer-Verilag Berlin Heidlberg 2007. 2. Mohammed Ismail," Silicon-Based Rf Front-Ends For Ultra Wideband Radios"2008 Springer Science+Business
Media B. 3. Reza Molavi , "On The Design Of Wideband Cmos Low Noise Amplifier " The University Of British Columbia,
September 2005. 4. Yang Lu, Kiat Seng Yeo, Alper Cabuk, Jianguo Ma," A Novel Cmos Low-Noise Amplifier Design For 3.1- To
10.6-Ghz Ultra-Wide-Band Wireless Receivers"Ieee Transactions On Circuits And Systems—I: Regular Papers, Vol. 53, No. 8, August 2006
5. Andrea Bevilacqua, Student Member, Ieee, And Ali M. Niknejad, Member, Ieee," An Ultrawideband Cmos Low-Noise Amplifier For 3.1–10.6-Ghz Wireless Receivers"Ieee Journal Of Solid-State Circuits, Vol. 39, No. 12, December 2004
6. Ke-Hou Chen, Jian-Hao Lu, Bo-Jiun Chen, And Shen-Iuan Liu," An Ultra-Wide-Band 0.4–10-Ghz Lna In 0.18-_M Cmos," Ieee Transactions On Circuits And Systems—Ii: Express Briefs, Vol. 54, No. 3, March 2007.
Jahani et al.

Indian Journal Of Natural Sciences www.tnsroindia.org. © IJONS
Vol.5 / Issue 28/ February 2015 International Bimonthly ISSN: 0976 – 0997
2927
Fig. 1. The structure of proposed amplifier Fig. 2. Structure of LNA (without bias)
Fig. 3. Low path filter
Fig. 4. The frequency response of low-pass Butterworth
Jahani et al.

Indian Journal Of Natural Sciences www.tnsroindia.org. © IJONS
Vol.5 / Issue 28/ February 2015 International Bimonthly ISSN: 0976 – 0997
2928
fig. 5. Frequency response of the Chebichov filter
Fig. 6. Band pass filter
Fig. 7. Circuit related to the common gate block with showing the input filter by Ls
Jahani et al.

Indian Journal Of Natural Sciences www.tnsroindia.org. © IJONS
Vol.5 / Issue 28/ February 2015 International Bimonthly ISSN: 0976 – 0997
2929
3.9 4.8 5.7 6.6 7.5 8.4 9.3 10.2 11.13.0 12.0
2
4
6
8
0
10
freq, GHz
NFm
in m1
m1freq=NFmin=4.903
10.59GHz
Fig. 8. Biasing circuit of transistor Fig. 9. NF_min(dB) curve
3.9 4.8 5.7 6.6 7.5 8.4 9.3 10.2 11.13.0 12.0
2
4
6
8
0
10
freq, GHz
nf(2
) m1
m1freq=nf(2)=4.936
10.60GHz
Fig. 10. Figer noise (db)
3.9 4.8 5.7 6.6 7.5 8.4 9.3 10.2 11.13.0 12.0
-20
-15
-10
-5
-25
0
freq, GHz
dB(S
(1,1
))
Fig. 11. The factor associated with input impedance matching (S11 (db)),
Jahani et al.

Indian Journal Of Natural Sciences www.tnsroindia.org. © IJONS
Vol.5 / Issue 28/ February 2015 International Bimonthly ISSN: 0976 – 0997
2930
3.9 4.8 5.7 6.6 7.5 8.4 9.3 10.2 11.13.0 12.0
-20
-15
-10
-5
-25
0
freq, GHz
dB(S
(2,2
))
Fig. 12. The factor associated with output impedance matching (S22)
3.333 6.667 10.000 13.333 16.6670.000 20.000
-120
-100
-80
-60
-40
-20
0
-140
20
freq, GHz
dB(S
(2,1
))
m1
m1freq=dB(S(2,1))=10.986
7.770GHz
Fig. 13. The factor associated with power gain (S21 (db))
3.333 6.667 10.000 13.333 16.6670.000 20.000
-240
-220
-200
-180
-160
-140
-120
-100
-260
-80
freq, GHz
dB(S
(1,2
))
m1
m1freq=dB(S(1,2))=-97.626
7.770GHz
Fig. 14. The factor associated with inverse isolation (S12)
Jahani et al.

Indian Journal Of Natural Sciences www.tnsroindia.org. © IJONS
Vol.5 / Issue 28/ February 2015 International Bimonthly ISSN: 0976 – 0997
2931
-50 -40 -30 -20-60 -10
-120
-100
-80
-60
-40
-20
-140
0
RFPwr
dBm
(Pou
t[::,3
])dB
m(P
out[:
:,1])
IIP3= -19 dBm
Fig. 15. IIP3 calculation with crossing method (IIP3= -19 dBm)
Table . 1. Values of designed filter for to state
C3(PF) L3(NH) C2(PF) L2(NH) C1(PF) L1(NH)
424.4 1.817 363.5 2.12 424.4 1.817 BUTTERWORTH
440 1.756 632.5 1.22 440 1.754 CHEBICHOV
Table 2. Comparison between current work and others
Jahani et al.

Indian Journal Of Natural Sciences www.tnsroindia.org. © IJONS
Vol.5 / Issue 28/ February 2015 International Bimonthly ISSN: 0976 – 0997
2932
Influence of Irrigation Conditions and Micronutrients Spraying on Soybean Yield Soheil Kobraee * and Keyvan Shamsi
Department of Agronomy and Plant Breeding, College of Agriculture, Kermanshah Branch, Islamic Azad University, Kermanshah, Iran. Received: 22 Oct 2014 Revised: 21 Nov 2014 Accepted: 28 Dec 2014 *Address for correspondence Soheil Kobraee Department of Agronomy and Plant Breeding, College of Agriculture, Kermanshah Branch, Islamic Azad University, Kermanshah, Iran. E.mail: [email protected]
This is an Open Access Journal / article distributed under the terms of the Creative Commons Attribution License (CC BY-NC-ND 3.0) which permits unrestricted use, distribution, and reproduction in any medium, provided the original work is properly cited. All rights reserved. A field experiment was conducted at the agriculture research and experimental station of the faculty of agriculture at Kermanshah, Iran in 2010 growing season. In this study, the impact of zinc, iron and manganese foliar application and withholding irrigation at different growth stages of soybean plants on oil, protein, economic and biological yield, harvest index and grain dry weight was studied. The experiment was conducted as a split plot based on Randomized Complete Block with three replications. Four irrigation regimes and eight micronutrients foliar treatments are replaced in main and sub plot, respectively. Based on results obtained, irrigation regimes and micronutrient foliar application had significant effects on oil, protein and grain and biological yield of soybean. Regular Irrigation produced the highest oil per cent, grain and biological yield. Whereas, protein content in soybean seed with water deficit at seed filling period was increased. Furthermore, the highest oil concentration in soybean seed was recorded when that zinc used separately. In this study, zinc and manganese foliar application decreased the adverse effects of drought stress on grain and biological yield of soybean plants. Also, iron foliar application increased grain dry weight of soybean. Keywords: grain dry weight, harvest index, irrigation regimes, soybean, yield.
RESEARCH ARTICLE
ABSTRACT
Indian Journal Of Natural Sciences www.tnsroindia.org. © IJONS
Vol.5 / Issue 28/ February 2015 International Bimonthly ISSN: 0976 – 0997
2933
INTRODUCTION Crops differ greatly in foliar micronutrients concentration. Appropriate concentrations depend on the species, genotype, and environmental conditions. Micronutrients are required in small amounts and are well suited for foliar application. Foliar application may have higher economic benefits than soil application (Sarkar et al., 2007), particularly, during flowering when soil moisture is unfavorable for root growth. In a study Ziaeian and Malakoti, (2002) emphasized the role of micronutrients in protein synthesis. Also, foliar micronutrients applications have been reported to increase yield and its components in soybean (Zocchi et al., 2007). Moreover, effects of micronutrients on crop quality such as oil and protein content, and storage longevity are important for the price of agricultural products in markets (Bell and Dell, 2008). Turk et al., (1980) reported that seeds produced under well watered and drought conditions were smaller than those produced when water supplies were intermediate, indeed, in this study the largest seeds produced under intermediate water supply. Also, Babaeian et al., (2011) stated that occurrence of water stress in grain filling stage had maximum effect on grain yield. These researchers emphasized that micronutrient fertilization had a significant effect on seed yield under water stress conditions in every growth stage. The aim of the present study was to evaluate the influence of micronutrient fertilization treatments on soybean quantity and quality traits in agri-environmental condition of western part of Iran.
MATERIALS AND METHODS An experiment was carried out at the Research Farm of Islamic Azad University of Kermanshah province, Iran (34023' N, 4708' E; 1351 m elevation) in 2010 growing season. A field trial was conducted as a split plot based on Randomized Complete Block with three replicates in 32 plots. The main plot includes: four irrigation regimes: (I1) Irrigation at all of growth stages, (I2) Irrigation Withholding at flowering stage, (I3) Irrigation Withholding at pod set stage and (I4) Irrigation Withholding at seed filling period. There were eight foliar treatments which consisted: (1) spray with distilled water, (2) zinc spray, (3) manganese spray, (4) iron spray, (5) zinc and manganese spray, (6) zinc and iron spray, (7) manganese and iron spray, and (8) zinc, manganese and iron spray, are replaced in sub plot. Before planting, soil samples were collected from experimental area at 0-30 cm depth. The soil texture was silty clay with pH 7.3, electrical conductivity 0.96dsm-1, total organic matter 2.6%, total nitrogen 0.11%, available phosphorus 8.2ppm, available potassium 531ppm, and zinc, iron and manganese 0.81, 2.76, 4.49 mg.kg-1, respectively. Soybean seeds (cv. Williams) were inoculated with BradyRhizobium japonicum and sown at a high-planting rate the field. When the unifoliate leaves were expanded, the plots were hand-thinned to obtain a uniform plant population of 33 plants per m2. The quantity of irrigation water in each plot was calculated according to Karam et al., (2005), controlled by counter and exercise irrigation treatments at different growth stages according to Fehr and Caviness, (1977). At the V4 growth stage, the plats were sprayed twice (with one week interval) with 0.5% (w/v) or distilled water until the leaves were wet. At the end of growth season and harvesting time, the grain yield and yield components were determined. To calculate final and biological yield, 1m2 middle rows of each plot were completely harvested by taking margins into account. After deducting 13% moisture, grains dry weight was calculated and considered as economic yield. Also, oil and protein percent in soybean seed were measured according to Emami, (1996) and Jung et al., (2003). Data for evaluated traits were statistically analyzed using a standard analysis of Variance technique for the factorial experiment in randomized complete block design using the statistical software MSTATC. Means were separated by the LSD (Least Significant Difference Test) at 5 percent probability level. Excel software was used to draw figures.
RESULTS AND DISCUSSION The results of analysis variance revealed that irrigation regimes (IR) and micronutrient foliar application (MFA) had significant effects on oil, protein and grain and biological yield of soybean (P<0.01). Also, IR×MFA interaction influenced biological yield (P<0.01) and economic yield (P<0.05), While, harvest index was not affected by these
Soheil Kobraee and Keyvan Shamsi

Indian Journal Of Natural Sciences www.tnsroindia.org. © IJONS
Vol.5 / Issue 28/ February 2015 International Bimonthly ISSN: 0976 – 0997
2934
treatment and their interaction effects. Moreover, IR×MFA had no effect on oil and protein percentage in soybean seeds (Table 2). Previously, we have focused on the effect of micronutrient soil application on nutritional value (Kobraee et al., 2011a), nodulation and chlorophyll concentration (kobraee et al., 2011b), and micronutrients concentration, distribution and partitioning (Kobraee et al., 2011c; 2011d and 2013) in soybean, But less was considered to combination of micronutrients foliar application and drought stress, Simultaneously. Therefore, in this study, impact of zinc, manganese and iron foliar application and withholding irrigation at different growth stages on oil, protein, economic and biological yield, harvest index and grain dry weight of soybean were analyzed. Irrigation at all of growth stages produced the highest oil per cent, grain and biological yield and harvest index, although differences between harvest indexes in I1 to I4 treatments was negligible. The oil concentration in soybean seed increased from 17.86% with withholding irrigation (I2) to 20.28% with regular irrigation (I1). Increases oil concentration in oilseed well watered plants was emphasized by (Zaman and Das, 1991). Whereas, protein content in soybean seed with water deficit was increased (38.54% with water deficit at seed filling period compared 37.66% at regular irrigation). El Fiel et al., (2002) and Movahhedy-Dehnavy et al., (2009) stated that there was a positive relative between water deficit and protein concentration in grains. The highest oil content in soybean seed was recorded when that zinc used separately. Whereas, zinc and combined it with iron and manganese had the greatest impact on the percentage of protein. In the other side, manganese had the greatest impact on grain and biological yield. These results indicated that manganese foliar application increased grain and biological yield up to 2149 and 5683 kgha-1, respectively. In contrast, M0 treatment led to lower oil, protein contents; and reduction in grain and biological yield (Table 3). The results of IR×MFA interaction effects were shown in Table (4). Based on results obtained in regular irrigation (I1 treatment), zinc foliar application increases oil and protein concentration in soybean seed up to 21.8 (%) and 39.6 (%), respectively. Movahhedy-Dehnavy et al., (2009) reported that zinc and manganese foliar application had positive effects on seed protein content and increased it significantly. Also, at these terms, the highest grain and biological yield were obtained when that manganese was used. The average of grain and biological yield were minimal when that drought was occurred at flowering stage (I2 treatment). In this study, applying Fe increased soybean economical and biological yields when the plants were well-watered, but not under water stress (Table 4). At all of irrigation treatments, with manganese foliar application grain yield increased up to 2539, 1940, 2150 and 1967 kgha-1 and for biological yield the highest values were recorded 6572, 5106, 5847 and 5205 kgha-1 for I1 to I4, respectively. Generally, based on the data shown in Table (4), zinc and manganese foliar application decreased the adverse effects of drought stress on grain and biological yield of soybean plants. The result is in agreement with Waraich et al., (2011) reported that better plant nutrition can effectively alleviate the adverse effects of drought stress by a number of mechanisms. As an important result, the occurrence of drought stress at the late of growing season of soybean was caused that oil percentage decreased and in contrast protein content increased (Table 3). The highest harvest index was observed in M0I1 treatment (regular irrigation with spray with distilled water). As seen in Fig (1) withholding irrigation at flowering stage (I2) reduces grain dry weight per plant (GDW) up to 2.93(gr) and the most GDW belonged to I1 treatment with 3.88 g/plant. These results were similar to Dornbos and Mullen, (1989); Vieira et al., (1991); Ney et al., (1994). Also, Fe foliar application had the greatest impact on GDW (Fig 2). Fe foliar application increased GDW 13.3% compared M0 (Check treatment). These results were in accordance with the findings of Maralian, (2009); Zeidan et al., (2010) and Khan et al., (2010). While, zinc and manganese combined effect on GDW was higher than the other fertilizer combinations (Fig 3). In addition, there is a little different between Fe used and it’s combined with other micronutrients concerning GDW.
ACKNOWLEDGMENTS The authors wish to thank from the Islamic Azad University of Kermanshah Branch for supporting projects.
Soheil Kobraee and Keyvan Shamsi

Indian Journal Of Natural Sciences www.tnsroindia.org. © IJONS
Vol.5 / Issue 28/ February 2015 International Bimonthly ISSN: 0976 – 0997
2935
REFERENCES
1. Sarkar, D., Mandal, B.and Kundu ,M. C. Increasing use efficiency of boron fertilizers by rescheduling the time and methods of application for crops in India. Plant and Soil 2007; 301, 77-85.
2. Ziaeian, A. H. and Malakoti, M. J. Effects of Fe, Mn, Zn and Cu fertilization on the yield and grain quality of wheat in the calcareous soils of Iran. Plant Nutr 2002; 92, 840-841.
3. Zocchi, G., De Nisi, P., Dell’Orto, M., Espen, L. and Marino, G. P. Iron deficiency differently affects metabolic responses in soybean roots. J. Exp. Bot 2007; 58(5), 993–1000.
4. Bell, R. W. and Dell, B. Micronutrients for SustainableFood, Feed, Fibre and Bioenergy Production. International Fertilizer Industry Association (IFA) Paris, France. 2008.
5. Turk, K. J., Hall, A. E. and Asbell, C. W. Drought adaptation of cowpea. I .Influence of drought on yield. Agronomy Journal 1980; 72, 413 - 420.
6. Babaeian, M., Piri, I., Tavassoli, A., Esmaeilian, Y. and Gholami, H. Effect of water stress and micronutrients (Fe, Zn and Mn) on chlorophyll fluorescence, leaf chlorophyll content and sunflower nutrient uptake in Sistan region. African Journal of Agricultural Research 2011; 6(15), 3526-3531.
7. Karam, F., Masaad, R., Sfeir, T. Mounzer, O. and Rouphael., Y. Evapotranspiration and seed yield of field grown soybean under deficit irrigation conditions. Agricultural Water Management 2005; 75, 226-244.
8. Fehr, W. R. and Caviness, C. E. Stages of soybean development, Spec, Rep, 80, Iowa State Univ., Ames. 1977. 9. Emami, A. Plant analysis methods. Soil and water research institute. Technical Paper. 79. In Persian. 1996. 10. Jung, S., Rickert, D. A., Deak, N. A., Aldin, E. D., Recknor, J., Johnson, L. A. and Murphy, P. A. Comparison of
Kjeldahl and Dumas Methods for Determining Protein Contents of Soybean Products. Journal of American Oil Chemists’ Society 2003; 80, 1169-1173.
11. Kobraee, S., NoorMohamadi, Gh., HeidariSharifabad, H., DarvishKajori, F. and Delkhosh, D. Influence of micronutrient fertilizer on soybean nutrient composition. Indian Journal of Science and Technology 2011a; 4(7), 763-769.
12. Kobraee, S., Shamsi, K. and Ekhtiari, S. Soybean nodulation and chlorophyll concentration (SPAD value) affected by some of micronutrients. Annals of Biological Research 2011b; 2(2), 414-422.
13. Kobraee, S. and Shamsi, K. Determination of zinc, iron and manganese concentration and partitioning during reproductive stages of soybean grown under field conditions. Research on Crops 2011c; 12(3), 752-760.
14. Kobraee, S. and Shamsi, K. Measurement of zinc, iron and manganese ratios in different parts of soybean plant. Research on Crops 2011d; 12(3), 761-765.
15. Kobraee, S., NoorMohamadi, Gh., HeidariSharifabad, H., DarvishKajori, F. and Delkhosh, D. Micronutrients Distribution in Soybean Plant with Zn, Fe, and Mn Application. Annual Review & Research in Biology 2013; 3(2), 83-91.
16. Zaman, A. and Das, P. K. Effect of irrigation and nitrogen on yield and quality of safflower. Indian Journal of Agronomy, New Delhi 1991; 36(3), 177-179.
17. El Fiel, H. E. A., El Tinay, A. H. and Elsheikh, E. A. E. Effect of nutritional status of faba bean (Vicia faba L.) on protein solubility profiles. Food Chem 2002; 76, 219–223.
18. Movahhedy-Dehnavy, M., Modarres- Sanavy, S. A. M. and Mokhtassi-Bidgoli, A. Foliar application of zinc and manganese improves seed yield and quality of safflower (Carthamus tinctorius L.) grown under water deficit stress. Industrial Crops Product 2009; 30, 82-92.
19. Waraich, E. A., Rashid, A., Saifullah, M. Y. and Ashraf, E. Role of mineral nutrition in alleviation of drought stress in plants. Australian Journal of Crop Science 2011; 5(6), 764-777.
20. Dornbos, D. L., Mullen, R. E. Drought stress effects during seed fill on soybean seed germination and vigor. Crop Sci 1989; 29, 476–480.
21. Vieira, R. D., TeKrony, D. M. and Egli, D. B. Effect of drought stress on soybean seed germination and vigor. Crop Sci 1991; 32, 471–475.
Soheil Kobraee and Keyvan Shamsi

Indian Journal Of Natural Sciences www.tnsroindia.org. © IJONS
Vol.5 / Issue 28/ February 2015 International Bimonthly ISSN: 0976 – 0997
2936
22. Ney, B., Duthion, C. and Ture, O. Phenological responses of pea to water stress during reproductive development. Crop Sci 1994; 34, 141–146.
23. Maralian, H. Effect of foliar application of Zn and Fe on wheat yield and quality. African J. Biotech 2009; 8, 6795–6798.
24. Zeidan, M. S., Mohamed, M. F. and Hamouda, H. A. Effect of foliar fertilization of Fe, Mn and Zn on wheat yield and quality in low sandy soils fertility. World J. Agric. Sci 2010; 6(6), 696- 699.
25. Khan, M. B., Farooq, M., Shahnawaz, M. H. and Shabir, G. Foliar application of micronutrients improves the wheat yield and net economic return. International J. Agric. & Biol 2010; 12(6), 953–956.
Figure1- The effect of different irrigation regimes (IR) on grain dry weight per plant
-I1: Irrigation at all of growth stages, I2: Irrigation Withholding at flowering stage, I3: Irrigation Withholding at pod set stage, and I4: Irrigation Withholding at seed filling period
Figure2- The effect of micronutrients foliar application (MFA) on grain dry weight
per plant - M0: distilled water spray
Soheil Kobraee and Keyvan Shamsi

Indian Journal Of Natural Sciences www.tnsroindia.org. © IJONS
Vol.5 / Issue 28/ February 2015 International Bimonthly ISSN: 0976 – 0997
2937
Figure3- Grain dry weight affected by combination of micronutrients foliar application (MFA) Table 2-Analysis of variance of soybean traits at experimental conditions
Ms Source of variation df Oil Protein Grain yield Biological yield Harvest
index Block 2 0.01 0.09 1568.9 1690.41 1.64
Irrigation regimes (IR)
3 32.17** 4.26** 2295148.71** 12830651.29** 2.05ns
Error a 6 1.48 0.10 1834.54 8184.02 0.72 Micronutrient foliar application (MFA)
7 2.49** 6.73** 333493.47** 1880095.01** 2.08ns
(IR) × ( MFA) 21 0.46ns 0.71ns 20166.45* 279186.89** 2.08ns Error b 56 0.35 1.32 9208.44 8175.35 1.52
Coefficient of variation (%)
- 9.85 8.76 10.26 10.85 9.13
-ns, * and **: non-significant, significant at 5% and 1% levels of probability, respectively
Soheil Kobraee and Keyvan Shamsi

Indian Journal Of Natural Sciences www.tnsroindia.org. © IJONS
Vol.5 / Issue 28/ February 2015 International Bimonthly ISSN: 0976 – 0997
2938
Table3- Means comparison of soybean traits at different irrigation regimes (IR) and micronutrients foliar application (MFA)
Treatments
Means Oil
(%) Protein
(%) Grain
yield (kgha-1)
Biological yield
(kgha-1)
Harvest index
(%) Irrigation regimes (IR)
I1 20.28 37.66 2274 5952 39.71 I2 17.86 37.96 1608 4346 39.65 I3 18.01 37.64 1776 4794 39.42 I4 18.05 38.54 1637 4475 39.38
Micronutrient foliar application (MFA)
M0 18.08 36.97 1629 4449 38.81 Zn 19.51 38.78 1824 4885 39.50 Mn 18.61 37.08 2149 5683 39.25 Fe 18.67 38.08 1658 4511 39.05
ZnMn 18.69 37.75 1864 5046 38.92 ZnFe 18.15 38.75 1716 4616 39.42 MnFe 18.20 37.75 1925 5066 39.93
ZnMnFe 18.51 38.73 1823 4880 39.95 -I1: Irrigation at all of growth stages, I2: Irrigation Withholding at flowering stage, I3: Irrigation Withholding at pod set stage, I4: Irrigation Withholding at seed filling period, and M0: distilled water spray.
Soheil Kobraee and Keyvan Shamsi

Indian Journal Of Natural Sciences www.tnsroindia.org. © IJONS
Vol.5 / Issue 28/ February 2015 International Bimonthly ISSN: 0976 – 0997
2939
Table 4-Means comparison of soybean traits (IR × MFA)
Similar letters in each column shows non-significant difference according to LSD test in %5 level -I1: Irrigation at all of growth stages, I2: Irrigation Withholding at flowering stage, I3: Irrigation Withholding at pod set stage, I4: Irrigation Withholding at seed filling period, and M0: distilled water spray.
Harvest index (%)
Biological yield
(kgha-1)
Grain yield
(kgha-1)
Protein (%) Oil (%)
Treatments
41.2a 4967h 1972d 38.32abcdef 19.60def M0I1 40.2abc 5585e 2171bc 39.60a 21.8a ZnI1
40.1abcd 6572a 2539a 37.85abcdefgh 20.97ab MnI1 38.9bcde 5819d 2215bc 38.31abcdef 20.70bc FeI1 39.7abcd 5991c 2290bc 38.93abc 19.95cde ZnMnI1 39.0bcde 5913cd 2208bc 39.33ab 19.50def ZnFeI1 39.1bcde 6476a 2482a 37.21cdefgh 19.70de MnFeI1 39.5abcde 6291b 2315b 38.96abc 20.16bcd ZnMnFeI1
37.6e 4121o 1432i 36.20h 17.30kl M0I2 39.7abcd 4401jklm 1627efgh 39.20ab 19.00efg ZnI2 40.0abcd 5106gh 1940d 37.68bcdefgh 17.77hijk MnI2 39.1bcde 3966pq 1483i 37.73bcdefgh 17.90hijk FeI2 38.5cde 4525ijk 1674e 37.65bcdefgh 17.87hijk ZnMnI2
38.8bcde 4098op 1480ghi 38.63abcd 18.07hijk ZnFeI2 40.7ab 4175no 1650ef 38.07abcdefgh 17.20l MnFeI2 40.7ab 4380klm 1674e 38.77abcd 17.83hijk ZnMnFeI2 38.1de 4535ij 1617efgh 36.76efgh 17.50jkl M0I3
39.1bcde 5047h 1866d 37.85abcdefgh 18.70fgh ZnI3 38.5cde 5847cd 2150c 36.52fgh 17.54jkl MnI3
39.5abcde 3937q 1471hi 38.22abcdefg 18.30ghij FeI3 38.4cde 5327f 1861d 37.31cdefgh 18.50ghi ZnMnI3
40.1abcd 4295mn 1675e 38.52abcde 17.61ijkl ZnFeI3 40.2abc 4967h 1897d 37.69bcdefgh 17.82hijkl MnFeI3
40.1abcd 4397jklm 1667e 38.50abcde 18.22ghijk ZnMnFeI3 38.3cde 4421jklm 1610efgh 36.74efgh 17.93hijkl M0I4
39.0bcde 4507ijk 1632efg 38.50abcde 18.51ghi ZnI4 38.4cde 5205fg 1967d 36.44gh 18.27ghijk MnI4
38.7bcde 4073opq 1448i 38.12abcdefg 17.85hijkl FeI4 39.1bcde 4339lm 1630efg 37.26cdefgh 18.54ghi ZnMnI4 39.7abcd 4159no 1501fghi 38.57abcde 17.56jkl ZnFeI4 39.6abcde 4647i 1670e 37.06defgh 18.11ghijkl MnFeI4 39.3abcde 4452jkl 1635efg 38.82abcd 17.93hijkl ZnMnFeI4
Soheil Kobraee and Keyvan Shamsi

Indian Journal Of Natural Sciences www.tnsroindia.org. © IJONS
Vol.5 / Issue 28/ February 2015 International Bimonthly ISSN: 0976 – 0997
2940
Investigating the Relationship Between Job Stress and Burnout with Time Management (Case Study: Public Managers Kohkiluyeh Boyer Ahmad) TahmuresDastan and Ahmad Reza Oji Nejad* Department of Psychology, Marvdasht Branch , Islamic Azad University, Marvdasht,Iran. Received: 22 Dec 2014 Revised: 11 Jan 2015 Accepted: 20 Jan 2015 *Address for correspondence Ahmad Reza Oji Nejad Department of Psychology, Marvdasht Branch , Islamic Azad University, Marvdasht,Iran.
This is an Open Access Journal / article distributed under the terms of the Creative Commons Attribution License (CC BY-NC-ND 3.0) which permits unrestricted use, distribution, and reproduction in any medium, provided the original work is properly cited. All rights reserved. To investigate the relationship between job stress and burnout with time management.The study population included all managers of government departments in the Kohkiluyeh Boyer Ahmad province have been120 people. So the whole community were selected. Questionnaires is used. To collect data about time management, job stress and burnout .Validity based onthe opinions of scholars and experts and its reliability by using Cronbach's alpha was approved. Then, were analyzed by the two methods descriptive and inferential. Statistical tests used in this study were, correlation, linear regression.This research showed that significant negative relationship between job stress and time management, there is a significant negative relationship between time management and burnout. Time management is also predicts about 36% to about 39% change in job stress and burnout changes. Keywords: time management, job stress, burnout, KohkiluyehBoyer Ahmad. INTRODUCTION
Managers follow a process in performing tasks that includes elements such as planning, organization, control, motivation, communication, and decision guidance. These activities form the management and coordination of them make possible the achievement of the goals. There are lots of definition for management: Soe say it is of using others to get the job done. Here the role of other people and them accepting the dual is emphasized. Some experts have described it use of resources to achieve specific goals,stated and analyzed in terms of management tasks such as planning, organizing, monitoring and controlling (Alwan, 1384). In the other dimension, burnout is: a state of physical exhaustion, emotional and mental pressure emerge due to continuous and repeated emotional impact of intensive and long-term clients. The main symptoms of burnout include: feelings of helplessness, hopelessness,
RESEARCH ARTICLE
ABSTRACT

Indian Journal Of Natural Sciences www.tnsroindia.org. © IJONS
Vol.5 / Issue 28/ February 2015 International Bimonthly ISSN: 0976 – 0997
2941
frustration, growing negative attitude towards themselves and others, burnout, caused by severe, persistent stress, is created when the environmental control demands more than personal abilities of the job to adapt to the success(Bordbar, 1387). Given that at least a third of our life is spent at work, and also many of our social relationships formed during working hours. Work-related stress or psychological stress can occur in the health and happiness of mankind, in addition to effective performance. People who are under a lot of stress generally be less than the health and happiness.There is stress in everyone’s life who works and puts pressure on them. (Robins, 1372).
from studies that have been done on this field we can point to these: (martin 1989) studied the level of school manager's burnout in New Hamshire and found out had average burn out in three dimensions in emotionaltiredness , personality metamorphosis, depersonalization and lack of personal success there. In this study, school management career, were known with uncertainty, gender, history, management, job satisfaction, and organizational factors had an impact on burnout among managers (AziziMoghadam, 1385). (Stephen Robbins, 1991) did research as the role of stress in physical and Emotional Health.His sample was formed of 187 Physiotherapist persons were employed in the state of Missouri. The results of the relationship showed conflict between role and emotional exhaustion, insomnia and stress of the job. He also reported that using inappropriate allocation of resources and shortage of human resources and getting inappropriate offers are counted as important stress factors which cause disorder in physical and emotional health. (Kashtidar 1381).
Richardson in 1993 did a research under the title of the job stress and job satisfaction among Canadian women physicians to study the relationship between job stress, job satisfaction, personal characteristics and the variables of jobs in a sample of women doctors of 303 people. The results show that the pressure of time and careless examination of patients is a major source of stress and a lack of job satisfaction among doctors such as to ask for more money, and change in medical procedures,and some other factors such as time pressure are some of the components stress of given in this paper(AziziMoqaddam, 1385). (Brin, 2007) studied the key for success in time management, identify and understand critical situations, be flexible and adjust to the situation and the proper use of the flexibility of the crisis there. He said many people claim they work and excelled in a better position, but unfortunately the research results indicated that these issues rarely receive positive qualities. Also, due to the effects of plans and priorities,tasks get attention in long-terms and people endure and have a high level of stress and have to identify duties better and do them better.
(Hasumy and Sarykhany, 1389) studied the relationship between time management and burnout among staff in Islamic Azad University, 12zone.the most important result was that the studied sample was almost at same level of burnout to other staff of Azad university There are slightly more than the average level with time management. In addition,there is a significant relationship between the management of time and burnout. Between time management and burnout dimensions and between burnout and time management dimensions relationships are observed. (Mozayanani, 1388) studied the relationship between emotional intelligence and stress management in education managers.
He found out exciting intelligence can control life stresses better and by reducing stress cause efficient use of time.He counts peopleabilities essential component of population tochange stressful environments and not leaving the workplace. (Hematian, 1387) to study the relationship between time management and management skills in Yasooj pay school administrators. Based on the findings of this study, there is a relationship between time management and each of school administrators’ skills of the technical, human and conceptual. Also between time management and their population analyze ability only age and management experience had insignificant relationship with time management. A study organizationed (Nikneshan et al., 1387) to determine the relationship between job stress, burnout, perfectionism of municipal employees in 1387. A descriptive correlational research staff (60), the 4-item questionnaire 22 Cooper job stress, burnout questionnaire has 40 questions, 40 questions questionnaire of perfectionism and Questionnaire of population characteristics of the unit to recognize gender, age, education, work experience and job type was investigated. Results showed a significant positive relationship between job stress and negative perfectionism with burnout , but none of the demographic variables of job stress, 2/13, 4/12 of the
TahmuresDastan and Ahmad Reza Oji Nejad

Indian Journal Of Natural Sciences www.tnsroindia.org. © IJONS
Vol.5 / Issue 28/ February 2015 International Bimonthly ISSN: 0976 – 0997
2942
positiveperfectionism total 1/46% of variance in predicting burnout.There were no differences between women and men in terms of variables. Based on the results it can be concluded that increased job stress and negative perfectionism leads to an increase in the burnout and gender played no role in this connection. (Mlkara, 1386) investigate the relationship between time management employees of the State Tax Administration of the West Azerbaijan burnout.The research population was staff of the State Tax Administration of the West Azerbaijan. This study Measuring applied two standard Burnout Inventory (Moslash) and time management questionnaire (AziziMoghadam) respectively.Pearson correlation test results have shown that the level of 001%, there is a significant correlation between time management and job burnout. Also all other aspects of time managementother than saying no have significant relationship to job depression.(Pourzahiri and Javaherizade, 1380) operating research identify in 16 major waste of time in Tehran schools management and classified them in this order: 1.Planning 2. Reporting 3. Too friendly transactions 4. Responsibilities 5. Meetings unscheduled 6. Telephone interrupts7.Bureaucracy 8. Meetings9. Lack of information 11. 10.Lack of saying no 12. Unqualified staff delegation13. Crisis 14. Choice Communication 15. Dishonesty 16. Lack of personal discipline.A study by Keshavarz (1380) the study of the relationship between the management of occupational stress among school administrators have been performed. The results suggest that the negative relationship between job stress and time management and organizational skills there. Scores male managers are higher than female managers in managing time and mean female executives in the field of occupational stress is higher than male managers.Empirical evidence shows that burnout among managers Kohkiluyeh and Boyer offices,arrangers and people do not have the necessary motivation to do the job. Time management is one of the variables affecting reducing burnout. But it certainly cannot be claimed that time management, job stress and burnout are related.The present study sought to investigate whether there is a relationship between the management with job stress, job depression of administration offices of executives in Kohkiluyeh?
METHODS
Given the purpose of the study, as described in the present study and the study of what is discussed in terms of the method of data collection is a descriptive study. The study population consists of all provincial government departments, managers of Kohkiluyeh 120 is the number of directors. In this study, since the size of the study population was limited, so the number of directors of provincial government departments of Kohkiluyeh have chosen as sample.The sample is the same number of public managers in the sample of 120 of government managers of Kohkiluyeh are using census sampling is done.In this study, the secondary data (data that has already been produced and the resources are available) using a literature review of the literature, including books, articles, theses, English and Persian on the subject, Internet resources and databases available on the Internet, were collected.The next step is to complete secondary data and research to answer questions and collect initial data (data that already does not exist and must be created by the researcher) for the collection of data analysis questionnaires have been used. To analyze research data on the demographic variables, descriptive statistics such as mean, standard deviation, and to analyze the research questions and hypotheses of inferential statistics such as correlation, and multiple regression analysis were used. It should be noted that this study was to evaluate the research hypotheses spss software was used. Researcher to avoid duplication of content and compelling the reader to think and accuracy of the results obtained.
The results in tabular form to classify and summarize Data collected by questionnaires for the study variables are presented
Descriptive findings Table (1): The mean and standard deviations of variables
Inferential findings According to Table 1, the result is obtained.
TahmuresDastan and Ahmad Reza Oji Nejad

Indian Journal Of Natural Sciences www.tnsroindia.org. © IJONS
Vol.5 / Issue 28/ February 2015 International Bimonthly ISSN: 0976 – 0997
2943
According to the above table it can be seen that the value of the correlation is significant at the alpha level less than 05/0.Therefore, one can say with 95% confidence that the negative moderate and significant relationship exist between job stress and time management,To test the above hypothesis and calculate the correlation between two variables, Pearson's correlation coefficient was used to burnout and time management. The results of this test are shown in Table (3) shows, the correlation coefficient between the two variables 52/0's. The two variables are linearly and inversely related.The overall increase in the amount of staff time management skills, they reduced the amount of burnout. In behavioral sciences, regardless of the sign of the correlation coefficient is generally considered to be a high correlation coefficient. According to this table, the relationship between these two variables is significant at a significance level of 001/0. Linear regression analysis was used to test the above hypothesis, the results of these tests are presented in Table 5 beta has been shown to vary between 49/0, which is approximately the average coefficient is negative. And almost 36% of job stress changes through time management is calculated. This means that 36% of job stress change is anticipated by management.
Linear regression analysis was used to test the above hypothesis, the results of these tests are presented in Table 5 beta has been shown to vary between 56/0, which is approximately a multiple medium to high negative and almost 39 percent of the variation of burnout, through a linear relationship with time management is calculated. This means that a 39% change in the burnout time is anticipated by management.
DISCUSSION AND CONCLUSION
The main objective of this study was to investigate the relationship between job stress and burnout among managers manage with governmental agencies is Kohkiluyeh.
Based on the results obtained
To investigate the relationship between job stress and time management, and Pearson's correlation coefficient was used and the correlation between these two variables 45 / 0- which are significant at the 95% level this correlation indicates that are significant and negative relationship between job stress and time management and there was a significant increase in scores of time management is to reduce job stress and vice versa., time management Includes skills such as self-discipline, goal setting, interrupt handling, and so is the way the organization. These skills are well able to eliminate many sources of organizational stress and reduce its negative effects
Mostly time management as a way of coping with stress is recommended. It is believed most of daily pressures can be salved or reduced by time management.The results indicate that there is a significant negative correlation between time management and job stress. Male managersscore more than female managers in managing time and mean female executives in the field of occupational stress is higher than male managers. The expert and non-expert and experienced managers and non-expert there is a significant correlation too and time management behaviors have also showed reduced job stress.
To investigate the relationship between time management and burnout of the Pearson correlation coefficient was used. The results of this test are shown in Table (3) shows the correlation between these two variables 52/0's. The two variables are linearly and inversely related. The overall increase in the amount of staff time management skills, they reduced the amount of burnout. In behavioral sciences, regardless of the sign of the correlation coefficient is generally considered to be a high correlation coefficient. According to this table, the relationship between these two variables is significant at a significance level of 001/0.Accurately predict burnout 56/0 and approximately 27% of the change in the burnout, is calculated from a linear relationship with time management. The Pearson correlation test showed a significant relationship between the level of 001% of the time there job depression. All the aspects of time
TahmuresDastan and Ahmad Reza Oji Nejad

Indian Journal Of Natural Sciences www.tnsroindia.org. © IJONS
Vol.5 / Issue 28/ February 2015 International Bimonthly ISSN: 0976 – 0997
2944
management in relation to burnout than any aspect. Between time management and burnout dimensions and there is also a relationship between burnout and time management are observed.
To investigate the relationship between job stress and time management are able to predict.The results of linear regression analysis in Table 5 beta has been shown to vary between 49/0, which is approximately a factor of negative average. And almost 36 percent of the variation of occupational stress, time management is calculated through a linear relationship. This means that 36% of job stress change is anticipated by management.
The results of this test are shown in Table 5 beta has been shown to vary between time management and burnout predicts 56/0, which is approximately a multiple medium to high negative and almost 39 percent of the variation of burnout, through a linear relationship with time management is calculated. This means that a 39% change in the burnout time is anticipated by management.
REFERENCES
1. Alwani, M. (1368). Mental stress in organization and ways of coping with stress. Journal of Public Administration, No. III, pp. 45-59.
2. Bordbar, A. (1387). Burnout and coping with it. Probation Journal, No. 74. 3. Pour Zahir, T., JavaheriZadeh, N. (1380). Providing a model for the efficient use of time management for the
directors of secondary schools in Tehran, Journal of Economics and Management, 51-79. 4. Jamshid M. A., B. (1388). Studyingthe relationship between management and job burnout in West Azerbaijan
Tax Administration office in fiscal year 1386, spring tax, Volume 7, Number 52, 81-98. 5. Hosoomi, T. and Sarikhany, N. (1389). Investigating the relationship between time management and burnout
among Islamic Azad University staff in 12th district, sixth year, the first issue, 89-107. 6. Schaefer, M. (1367). Mental stress, nature, mitigation and adaptation. Translated by ParvinBolourchi, Tehran:
Pazhang Publications. 7. AziziMoqaddam, A. (1385). Investigating the relationship between time management and burnout among school
administrators of Mahabadcity in the 85-86 school year. Unpublished paper. 8. Keshavarz, K. (1380). Investigating organizational skills of time management and occupational stress among the
institute managers of Firoozabad, master thesis, Shiraz University. 9. Kashtidar, M. (1381). Investigating the relationship between deterioration with control source and comparing it
between college managers and physical education groups of higher education Universities, doctoral dissertation, Tehran, University of Tehran, Faculty of Physical Education.
10. Mozayanani, F. (1388). The relationship between emotional intelligence and stress management in education 11. managers, Master's thesis, University of Isfahan. 12. Robbins, S.(2002).Organizational behavior (9thed).Prentice-hall,Inc.
Table (1): The mean and standard deviations of variables
SD Mean Variable
0.755 3.12 Job stress
0.925 2.97 Time management
TahmuresDastan and Ahmad Reza Oji Nejad

Indian Journal Of Natural Sciences www.tnsroindia.org. © IJONS
Vol.5 / Issue 28/ February 2015 International Bimonthly ISSN: 0976 – 0997
2945
Table 2: Results of correlation between job stress and time management
Level of significance
The amount of Pearson correlation
Variable
0.004 - 0.45 Job stress
Time management
Table 3: Correlation coefficient between two variables, burnout and Time Management
Time management - 0.522 Pearson correlation coefficient Job fatigue
0.001 Level of significance Table 4: Results of the linear regression analysis of the two variables of job stress and time management
Significance Adjusted 2R t Standard correlation
Non-standard correlation
Status
Beta SD Non-standard Beta
0.66 1.734 ____ 0.001 0.36 0.17 - 0.49 0.34 - 1.835 Time management
0.001 - 8.22
Table 5 - Results of linear regression analysis for two variables of burnout and Time Management
Significance Adjusted 2R t Standard correlation
Non-standard correlation
Status
Beta SD Non-standard Beta
0.001 0.389 0.21 - 0.56 0.71 2.125 _____
0.001 - 9.44 0.33 - 1.870 Time management
TahmuresDastan and Ahmad Reza Oji Nejad

Indian Journal Of Natural Sciences www.tnsroindia.org. © IJONS
Vol.5 / Issue 28/ February 2015 International Bimonthly ISSN: 0976 – 0997
2946
Correlates of Knowledge and Adoption of Sericulturists in Cluster Promotion Programme Syed Shakir Ali1, N.R.Koshti2*, K.T.Lahariya2 and K.U.Bidwe2 1Programme Coordinator, Krishi Vigyan Kendra, Baramati, District, Pune (M.S.) 2Directorate of Extension Education, Dr.Panjabrao Deshmukh Krishi Vidyapeeth, Akola (M.S.)444004, India. Received: 22 Dec 2014 Revised: 11 Jan 2015 Accepted:17 Jan 2015 *Address for correspondence Dr. N.R.Koshti Associate Professor, Dr.Panjabrao Deshmukh Krishi Vidyapeeth, Krishinagar, Akola, Maharashtra, India. Email: [email protected],Mobile : 09921511299
This is an Open Access Journal / article distributed under the terms of the Creative Commons Attribution License (CC BY-NC-ND 3.0) which permits unrestricted use, distribution, and reproduction in any medium, provided the original work is properly cited. All rights reserved. Central Sericulture Board together with Directorate of Sericulture, Maharashtra implemented Cluster Promotion Programme (CPP) throughout the year 2007-10. The present paper analyzes the correlates of knowledge and adoption of sericulturists participated in CPP in Osmanabad district. In all total, a hundred and fifty sericulturists were selected by “probability proportionate sampling size technique” from eight talukas and twenty five villages. Information was collected by made interviews with sericulturists. The findings discovered that Out of 15 variables, Four variables namely age, caste, family size and risk orientation did not show any significant relationship with their knowledge about mulberry cultivation and cocoon production whereas, all the other remaining 11 variables were found to be positively and highly significant (at 0.01 level of probability) with knowledge. In case of adoption age, caste and extension contact shows negative relation with adoption of sericulture technology under Cluster Promotion Programme. The other 13 variables namely education, family size, social participation, cosmopoliteness, risk orientation, attitude towards sericulture, innovativeness, land holding, area under mulberry, annual income and socio-economic status were found to be positive and highly significant at 0.01 level of probability with adoption. Keywords- Adoption, Correlates, Cluster Promotion Programme, Sericulturists, Knowledge.
RESEARCH ARTICLE
ABSTRACT

Indian Journal Of Natural Sciences www.tnsroindia.org. © IJONS
Vol.5 / Issue 28/ February 2015 International Bimonthly ISSN: 0976 – 0997
2947
INTRODUCTION Under Catalytic Development Project(CDP) implemented by Central Silk Board (CSB)Ministry of Textiles, Govt. of India, Sericulture Production cluster were identified and Cluster Promotion Programme (CPP) were implemented by CSB in collaboration with Directorate of sericulture, M.S in Osmanabad district during the year 2007-10.Success of any new technology depends on its acceptance /adoption by Sericulturists and the user acceptance is much dependent on carefully drawn and implemented extension programme [10]. Considering the above mentioned facts, the present investigation was conducted in Osmanabad district of Maharashtra State wherein hundred and one village are below mulberry plantation with an area of 274 ha (685acres) and having a Cocoon production of 76380.2 kgs [1]. The aim of study was to assess the relationship of different characteristics of sericulturists with their knowledge and adoption about scientific mulberry cultivation and cocoon production under CPP for identifying the key variables to put emphasis by extension agencies in future sericulture development programmes.
MATERIALS AND METHODS location of study: The present investigation was undertaken in Osmanabad district. It is situated in the southern part of the State abutting Andhra Pradesh in south and lies between north latitudes 17°37’ and 18°42’ and east longitude 75°1 6’ and 76°47’. Sampling plan and data collection: Three stages sampling technique was adopted for this investigation. Cluster wise mulberry planted eight talukas were selected wherever Cluster Promotion Programme was implemented throughout 2007-08. On the basis of this, list of mulberry growing villages were prepared, arranged in descending order of area and in all 25 villages were selected on number proportionate basis. The percentages of area under mulberry plantation in each block was calculated and converted into proportion for selection of 150 respondents. The respondents those have taken the advantage of CPP between 2007-2010 were selected from the selected villages; the list of sericulturist under CPP was drawn. Thus, in all 150 respondents were selected for study from the list by adopting “proportionate Probability sampling to the size technique. Information on pre-structured interview schedule was collected by conducting personal interviews with sericulturists. Assessment of relationship between selected characteristics with knowledge and adoption: In order to find out the relationship between selected characteristics of sericulturists with their knowledge and adoption about scientific mulberry cultivation and cocoon production, Karl Pearson’s Co-efficient of Correlation ‘r’ was worked out. The correlation analysis helps the researcher in determining the relationship of selected personal, situational, socio-economic communication and psychological characteristics of the respondents with their knowledge, adoption, of sericulturists under cluster promotion programme.
RESULTS AND DISCUSSION
Correlates with Knowledge
The correlation coefficients were computed which indicate the relationships of the selected characteristics of the farmers with their knowledge about mulberry cultivation and cocoon production have been depicted in Table 1.A closer look at the values of correlation coefficient in Table 1 brings into light that out of 15 variables, Four variables namely age, caste, family size and risk orientation did not show any significant relationship with their knowledge about mulberry cultivation and cocoon production whereas, all the other remaining 11 variables viz education, social participation, cosmopoliteness, economic motivation, attitude towards sericulture, innovativeness, extension contact, land holding, area under mulberry, annual income and socio-economic status were found to be positively and highly
Syed Shakir Ali et al.

Indian Journal Of Natural Sciences www.tnsroindia.org. © IJONS
Vol.5 / Issue 28/ February 2015 International Bimonthly ISSN: 0976 – 0997
2948
significant (at 0.01 level of probability) with knowledge.Education had established significant relationship with knowledge. The higher the farmers level of education the higher the knowledge gain. The implication is that with higher levels of education, the sericulturist more likely to gain knowledge about sericulture technology. Present findings argue with the findings of [9] Social participation had significant positive impact on gain in knowledge. Moreover, the findings related to social participation was in conformity with the findings of [9]. It could be concluded that the respondents with cosmopoliteness, economic motivation, having positive attitude towards sericulture and innovativeness possess more knowledge about recommended mulberry cultivation and cocoon production technology under CPP on sericulture. The findings related to cosmopoliteness was in conformity with the findings of [12] and the findings related to innovativeness was in conformity with the findings of [14].Extension contact established significant association. Extension contact enable farmers to get knowledge about sericulture technologies, so that they can make more informed to knowledge gain. Land holdings point out positive relationship with gain in knowledge. Larger the land holding helps farmers to experiment new ideas hence more the gain in knowledge. The findings related to land holding was contradictory with the findings of [8]. Area under mulberry shows positive and significant relationship with gain in knowledge. More the area under mulberry more is the gain in knowledge. The findings related to area under mulberry were in conformity with the findings of [5] Annual income shows significant relationship. Low income group were considered the most vulnerable group to gain in knowledge .Higher the annual income more likely the gain in knowledge about sericulture technologies under CPP. The findings related to annual income were in conformity with the findings of [2] Socio- economic status established strong and positive relationship possesses more knowledge about sericulture technology under cluster promotion programme. The findings related to socioeconomic status was in conformity with the findings of [7]. Correlates with Adoption The correlation coefficient of personal, situational, socio-economic communication and psychological characteristics of the respondents with their adoption have been presented in Table 2. Data depicted in Table 2 revealed that among selected characteristics of respondents viz, age, caste and extension contact shows negative relation with adoption sericulture technology under Cluster Promotion Programme. The other 13 variables namely education, family size, social participation, cosmopoliteness, risk orientation, attitude towards sericulture, innovativeness, land holding, area under mulberry, annual income and socio-economic status were found to be positive and highly significant at 0.01 level of probability with adoption. The logical reasoning behind the farmer’s orientation towards scientific farming may increase due to education which leads them to adopt modern technologies related to mulberry cultivation and cocoon production under CPP. The findings related to education were similar to the findings of [11] and [9] Family size established significant relationship. More the number of members in a family more are the adoption rate. Hence it can be concluded that family size have positive and significant relationship on adoption of various technology related to sericulture [5] [4] also found the variable namely family size had a positive significant correlation with the level of adoption. The findings related to social participation was in conformity with the findings of [2]. Social participation had significant and positive related to adoption of various technologies under CPP on sericulture. It is proved that, respondents with high risk orientation, cosmopoliteness, higher innovativeness and higher level of economic motivation, having positive attitude towards sericulture who took more risk, naturally adopted more innovative technology. These farmers have desire to apply innovative ideas in sericulture and also have courage to face difficult situations. This indicates that higher the risk orientation factor, innovativeness, cosmopoliteness, economic motivation and positive attitude towards sericulture of the sericulturist higher the adoption of technologies under CPP on sericulture. The findings related to economic motivation was contradictory with the findings of [12]. Likewise, larger land holding and larger area under sericulture also enable the respondents to try new technology on trial basis on their farm and subsequently leading to adoption of only those practices which have been proved to be better in his local setting and the resources available with him. The findings of [12] are in line with the findings of research. Similarly, annual income and socio-economic status are also contributing factors in adoption of sericulture technologies under CPP,
Syed Shakir Ali et al.

Indian Journal Of Natural Sciences www.tnsroindia.org. © IJONS
Vol.5 / Issue 28/ February 2015 International Bimonthly ISSN: 0976 – 0997
2949
because of his potentially of sustenance due to loss occurred, if any, as a result of adoption of the technology. Better and well to do farmers possess adequate resources at their disposal. The availability of various resources with them allows the use of sericulture technologies under CPP for getting better returns. The findings related to land holding was contradictory with the findings of [8].The findings related to area under mulberry was in conformity with the findings of [5]. The findings related to annual income were in conformity with the findings of [13]. The findings related to socio-economic status was in conformity with the findings of [6].
CONCLUSION
It could be concluded from the above table that the respondents those who have big family size, high social participation, cosmopoliteness, risk orientation, economic motivation, positive attitude towards sericulture, higher level of annual income, land holding, area under mulberry, and knowledge had higher level of adoption. Similarly, the educated respondents with higher socio-economic status and innovativeness were also adopted the recommended technology under CPP on sericulture to the higher extent in their field conditions.
REFERANCES 1. Anonymous (2010):“Area and production of mulberry and silk cocoon” Annual report of Department of
Sericulture, Osmanabad, M.S. PP:1-2. 2. Dhane, V.P and Dhane, A.V (2004):“Constraints faced by the farmers in mulberry cultivation and silkworm
rearing” Indian Journal of Sericulture 43 (2) PP:155-159. 3. 3.Geetha, G.S., Srinivasa, G., Jayaram, H., Iyengar, MNS and Vijayaprakash, NB (2001a,b): “Socio-economic
determinants of farmer oriented technology packages for sericulture- a field study” Indian Journal of Sericulture 40 (1) PP:96-99.
4. Jaishankar and Dandin, S.B. (2004): “Socio-economic attributes in the adoption of improved sericultural technologies by farmers in Kolar District, Karnataka” Indian Journal of Sericulture 43 (2) PP: 194-199.
5. 5. Lakshmanan, S and Geethadevi, R.G (2007a, b): “Studies on economics of sericulture under dry farming condition in Chamarajanagar district of Karnataka” Indian Journal of Sericulture 44 (2) PP: 183-185.
6. 6. Mazumder, G., Majumder, AK., Sarkar, A., Bandyopadhyay., P and Bhattacharyya, K (2000 a,b): 7. “Contribution of Socio-psychological attributes towards adoption of sericultural practices among the farmers of
West Bengal” Journal of Interacademicia IV (2) PP:332-335. 8. Meenal, R and Rajan, R.K (2007) “Impact of socio-economic characters of sericulturist on knowledge, adoption
and cocoon production in Tamilnadu” Indian Journal of Sericulture 46 (1) PP:49-51. 9. Munikrishnappa, H.M., Jagadish, K. and Srinivasa, G (2002a, b): “Association of socio-economic characters with
knowledge and adoption of improved sericulture practices by sericulturists in Mysore district.”Indian J. Seric. 41(1) :89-91.
10. 9.Prasad, V.L.M., Lakshiminarayana, M.T and Ramakrishna Naika (2008a,b,c):“Entrepreneurial behavior of commercial chawki rearing centre owners in Kolar district of Karnataka” Research on Crops IX (2) PP:430-433.
11. Rama Mohana Rao, P and Kambale, C.K. (2009):“Impact of demonstration of technology package in Sericulture extension and future extension strategies”Indian Journal of Sericulture 48 (2) PP: 178-181.
12. Shankar, L., Jayaram, H and Geethadevi, RG (2000):“An analysis of factors discriminating technology use among sericulturist in Karnataka” Indian Journal of Sericulture 39 (1) PP: 52-59.
13. 12.Srinivas,V., Delvi, M.R., Srinivasagowda, R., Manjula, G and Amarnatha, N (2006 a,b):“Socio-economic participation of sericulture farmers of Kolar District” Environment and Ecology 24S(Special4) PP:1053-1055.
14. 13.Srinivasa, G., Rahmathulla, V.K., Vindhya,G.S and Rajan, R.K (2007 a,b): “Training programmes in sericulture: their evaluation and impact on extension personnel and sericulturists” Indian Journal of Sericulture 46 (1) PP:26-31.
15. 14.Sujatha,B., Reddy, P.L., Naik, S.S and Sujathamma, P (2006): “A study on adoption of recommended mulberry cultivation practices by sericulturists in Chitoor District of Andhra Pradesh” Indian Journal of Sericulture 45 (2) PP:142-148.
Syed Shakir Ali et al.

Indian Journal Of Natural Sciences www.tnsroindia.org. © IJONS
Vol.5 / Issue 28/ February 2015 International Bimonthly ISSN: 0976 – 0997
2950
Table 1.Correlation Coefficient of Independent Variables with Knowledge
Sr. No. Independent variables Coefficient of correlation ‘r’ value
1. Age 0.023045 NS 2. Education 0.258183 ** 3. Caste 0.058976 NS 4. Family Size 0.028475 NS
5. Social Participation 0.292735 ** 6. Cosmopoliteness 0.254395 ** 7. Risk orientation 0.024715 NS 8. Economic motivation 0.231006 ** 9. Attitude towards sericulture 0.304653 ** 10. Innovativeness 0.491962 ** 11 Extension Contacts 0.242678 ** 12 Size of Land holding 0.226417 ** 13 Area under Mulberry 0.276633 ** 14 Annual Income 0.250791 ** 15 Socioeconomic status 0.297782 **
*-Significant at 0.05 level of probability **-Significant at 0.01 level of probability Table 2. Correlation Coefficient of Independent Variables with Adoption.
Sr. No. Independent variables Coefficient of correlation ‘r’ value
1. Age 0.015692 NS
2. Education 0.255167 ** 3. Caste 0.015614 NS 4. Family Size 0.324518 ** 5. Social Participation 0.32448 ** 6. Cosmopoliteness 0.288775 ** 7. Risk orientation 0.292821 ** 8. Economic motivation 0.193901 ** 9. Attitude towards sericulture 0.382617 ** 10. Innovativeness 0.572447 ** 11 Extension Contacts 0.037157 NS 12 Size of Land holding 0.26874 ** 13 Area under Mulberry
0.327776 ** 14 Annual Income 0.30712 ** 15 Socioeconomic status 0.38876 ** 16 Knowledge 0.372038 **
*-Significant at 0.05 level of probability **-Significant at 0.01 level of probability
Syed Shakir Ali et al.