Stability and change in levels and structure of subjective well-being: USA 1972 and 1988
30
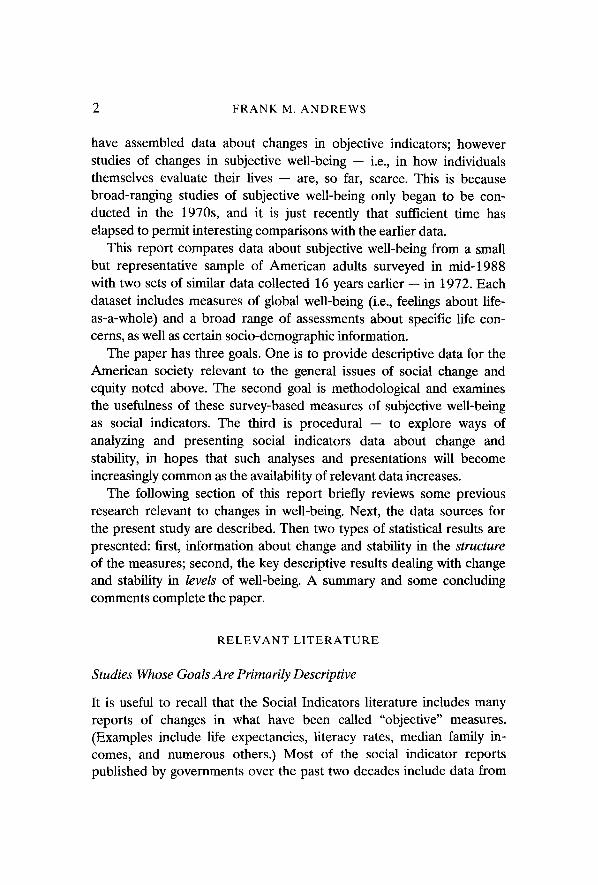
FRANK M. ANDREWS STABILITY AND CHANGE IN LEVELS AND STRUCTURE OF SUBJECTIVE WELL-BEING: USA 1972 AND 1988" (Received 21 November, 1990) ABSTRACT. It has long been recognized that more needs to be known about the dynamic behavior of measures of subjective well-being. As the Social Indicators Move- ment matures, it becomes possible to explore issues of stability and change in measures of perceived life quality. To contribute to this research need, this paper reports results of administering similar measures of subjective well-being to several representative samples of the adult American population assessed 16 years apart -- in 1972 and in 1988. Results show that in the United States, which has experienced reasonably continuous economic prosperity and no major social disruptions during these 16 years, the structure of the subjective well-being measures (i,e. how they relate to one another and how concern-level measures predict global-level measures) has remained remark- ably constant. This is in accord with expectation and enhances confidence in the validity and usefulness of the measures. Changes were found in the levels of some of the measures: For the total population, feelings about life-as-a-whole, oneself, and one's own health became notably more positive; evaluations of own income and the national government also gained; but assessments of one's own family life, social relationships, community, and job remained fairly stable. Some of these gross changes were general throughout the population, but others occurred only for certain age, racial, or socio- economic groups. Younger cohorts and people with higher educations and incomes showed more gains in subjective well-being than other groups. INTRODUCTION The prospect of examining changes in well-being has been one of the compelling attractions of the Social Indicators Movement from its very beginning. Such information has an intrinsic interest in its own right and provides direct answers to important questions about social change and equity such as: Are life conditions getting better or worse? Are some groups prospering (or declining) more than others? In addition, such information, in combination with data and theories about government policies and historical and social developments, can lead to better understanding of ways to improve the quality of life. From the beginning of the Social Indicators Movement, researchers Social Indicators Research 25: l --30, 1991. © 1991 Kluwer Acadernic Publishers. Printed in the Netherlands.
-
Upload
independent -
Category
Documents
-
view
3 -
download
0
Transcript of Stability and change in levels and structure of subjective well-being: USA 1972 and 1988
F R A N K M. ANDRE WS
S T A B I L I T Y A N D C H A N G E I N L E V E L S A N D
S T R U C T U R E O F S U B J E C T I V E W E L L - B E I N G :
U S A 1 9 7 2 A N D 1 9 8 8 "
(Received 21 November, 1990)
ABSTRACT. It has long been recognized that more needs to be known about the dynamic behavior of measures of subjective well-being. As the Social Indicators Move- ment matures, it becomes possible to explore issues of stability and change in measures of perceived life quality. To contribute to this research need, this paper reports results of administering similar measures of subjective well-being to several representative samples of the adult American population assessed 16 years apart -- in 1972 and in 1988. Results show that in the United States, which has experienced reasonably continuous economic prosperity and no major social disruptions during these 16 years, the structure of the subjective well-being measures (i,e. how they relate to one another and how concern-level measures predict global-level measures) has remained remark- ably constant. This is in accord with expectation and enhances confidence in the validity and usefulness of the measures. Changes were found in the levels of some of the measures: For the total population, feelings about life-as-a-whole, oneself, and one's own health became notably more positive; evaluations of own income and the national government also gained; but assessments of one's own family life, social relationships, community, and job remained fairly stable. Some of these gross changes were general throughout the population, but others occurred only for certain age, racial, or socio- economic groups. Younger cohorts and people with higher educations and incomes showed more gains in subjective well-being than other groups.
I N T R O D U C T I O N
T h e p r o s p e c t of examin ing changes in wel l -be ing has been one of the
compe l l ing a t t rac t ions o f the Socia l I nd i ca to r s M o v e m e n t f rom its ve ry
beginning. Such in fo rma t ion has an intr insic in te res t in its own right and
p r o v i d e s d i rec t answers to i m p o r t a n t ques t ions a b o u t social change and
equi ty such as: A r e life cond i t ions get t ing be t t e r o r wor se? A r e s o m e
g roups p r o s p e r i n g (or decl in ing) m o r e than o the r s? In addi t ion , such
in format ion , in c o m b i n a t i o n with da t a and theor ies a b o u t g o v e r n m e n t
pol ic ies and h is tor ica l and social deve lopmen t s , can lead to be t t e r
u n d e r s t a n d i n g of ways to i m p r o v e the qual i ty o f life.
F r o m the beginning of the Socia l I nd i ca to r s M o v e m e n t , r e sea rche r s
Social Indicators Research 25: l --30, 1991. © 1991 Kluwer Acadernic Publishers. Printed in the Netherlands.
FRANK M. ANDREWS
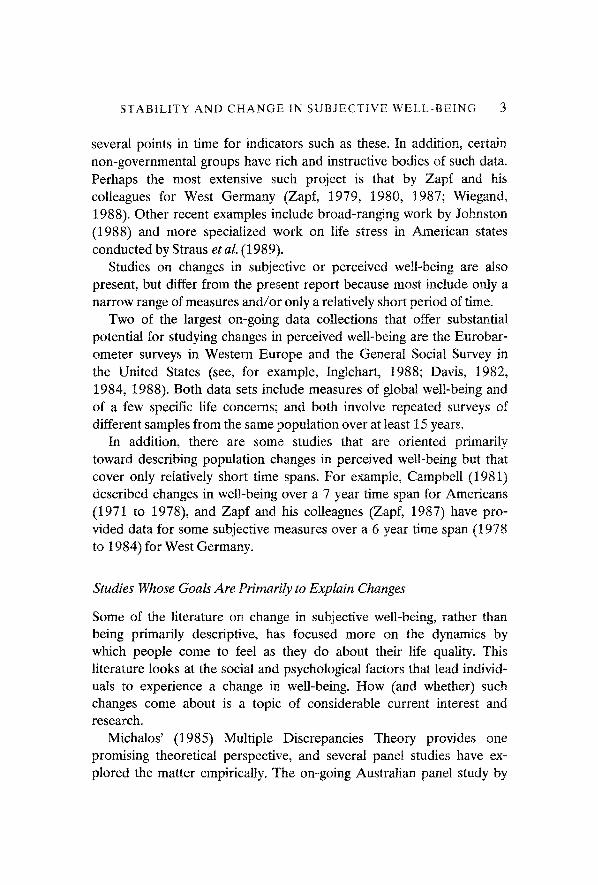
have assembled data about changes in objective indicators; however studies of changes in subjective well-being -- i.e., in how individuals themselves evaluate their lives -- are, so far, scarce. This is because broad-ranging studies of subjective well-being only began to be con- ducted in the 1970s, and it is just recently that sufficient time has elapsed to permit interesting comparisons with the earlier data.
This report compares data about subjective well-being from a small but representative sample of American adults surveyed in mid-1988 with two sets of similar data collected 16 years earlier -- in 1972. Each dataset includes measures of global well-being (i.e., feelings about life- as-a-whole) and a broad range of assessments about specific life con- cerns, as well as certain socio-demographic information.
The paper has three goals. One is to provide descriptive data for the American society relevant to the general issues of social change and equity noted above. The second goal is methodological and examines the usefulness of these survey-based measures of subjective well-being as social indicators. The third is procedural -- to explore ways of analyzing and presenting social indicators data about change and stability, in hopes that such analyses and presentations will become increasingly common as the availability of relevant data increases.
The following section of this report briefly reviews some previous research relevant to changes in well-being. Next, the data sources for the present study are described. Then two types of statistical results are presented: first, information about change and stability in the structure of the measures; second, the key descriptive results dealing with change and stability in levels of well-being. A summary and some concluding comments complete the paper.
RELEVANT LITERATURE
Studies Whose Goals Are Primarily Descriptive
It is useful to recall that the Social Indicators literature includes many reports of changes in what have been called "objective" measures. (Examples include life expectancies, literacy rates, median family in- comes, and numerous others.) Most of the social indicator reports published by governments over the past two decades include data from
STABILITY AND CHANGE IN SUBJECTIVE WELL-BEING 3
several points in time for indicators such as these. In addition, certain non-governmental groups have rich and instructive bodies of such data. Perhaps the most extensive such project is that by Zapf and his colleagues for West Germany (Zapf, 1979, 1980, 1987; Wiegand, 1988). Other recent examples include broad-ranging work by Johnston (1988) and more specialized work on life stress in American states conducted by Straus et al. (1989).
Studies on changes in subjective or perceived well-being are also present, but differ from the present report because most include only a narrow range of measures and/or only a relatively short period of time.
Two of the largest on-going data collections that offer substantial potential for studying changes in perceived well-being are the Eurobar- ometer surveys in Western Europe and the General Social Survey in the United States (see, for example, Inglehart, 1988; Davis, 1982, 1984, 1988). Both data sets include measures of global welt-being and of a few specific life concerns; and both involve repeated surveys of different samples from the same population over at least 15 years.
In addition, there are some studies that are oriented primarily toward describing population changes in perceived well-being but that cover only relatively short time spans. For example, Campbell (1981) described changes in well-being over a 7 year time span for Americans (1971 to 1978), and Zapf and his colleagues (Zapf, 1987) have pro- vided data for some subjective measures over a 6 year time span (1978 to 1984) for West Germany.
Studies Whose Goals Are Primarily to Explain Changes
Some of the literature on change in subjective well-being, rather than being primarily descriptive, has focused more on the dynamics by which people come to feel as they do about their life quality. This literature looks at the social and psychological factors that lead individ- uals to experience a change in well-being. How (and whether) such changes come about is a topic of considerable current interest and research.
Michalos' (1985) Multiple Discrepancies Theory provides one promising theoretical perspective, and several panel studies have ex- plored the matter empirically. The on-going Australian panel study by

FRANK M. ANDREWS
Headey and his colleagues (e.g., Headey et al., 1984, 1985) provides some of the most extensive work in this area. Other examples include that by Abbey and Andrews (1985), Atkinson (1982), and Kennedy and Mehra (1985).
One theme in the literature has been whether subjective measures can show changes over time. For example, McNeil et aL (1986) found little evidence for meaningful change over an 18 month period in a sample of elderly Canadians, nor did Kozma and Stones (1983) over a 1.5 year period, Palmore and Kivett (1977) over a 4 year period, or George and Maddox (1977) over a 5 year period. Costa et al. (1987) have suggested that the subjective well-being of particular individuals may not change much and that changes observed over time for popula- tions might instead be attributed primarily to cohort replacement. For example, measures of satisfaction with government might decrease because older, more satisfied individuals die off and are "replaced" by more skeptical persons. This argument is an interesting one, but it seems to be contradicted by several data sets demonstrating change even within individual cohorts (e.g., results presented in Exhibit 4, below, and by Inglehart, 1985, and by Headey et al., 1985).
Studies on the Stability of the Structure of Well-Being Assessments
It is widely agreed that if measures of subjective well-being are to be useful as social indicators their "meaning" should be similar to people of different groups and should remain stable over time. Inferences about the meaning of the measures can be obtained by examining the pattern of their interrelationships -- as summarized by their factor or cluster structure and by how some measures act to "predict" others.
Few studies have examined the stability of the structure of subjective well-being measures across time. (The empirical results presented below help to fill this gap.) There have, however, been several investiga- tions of cross-group stability of subjective well-being measures. The results and interpretations from these studies are not completely con- sistent, but in general substantial stability has been demonstrated. Examples include Andrews and Inglehart's (1978) comparison across nine western nations; McKennell, Atkinson, and Andrews' (1980) match of three countries; Herzog and Rodgers' (1981) exploration
STABILITY AND CHANGE IN SUBJECTIVE WELL-BEING 5
across age groups; and Liang and Bollen's (1985) examination of men and women. (Chamberlain (1988) provides a useful summary of this work.)
DATA SOURCES: THE 1972 DATA
The present paper draws on data from two independent but parallel surveys conducted in 1972. One was conducted in May, the other in November. The following subsections briefly present the most impor- tant information; both surveys are more fully described by Andrews and Withey (1976).
Population, Sampling, and Data Collection
Both of the 1972 surveys were based on probability samples designed to represent the adult population of the United States who lived in households. Data were collected in face-to-face interviews by the professional interviewing staff of the University of Michigan's Survey Research Center. There were 1 297 respondents to the May 1972 survey and 1 072 to the November survey}
In both of the 1972 surveys, the life quality questions that are the focus of attention here were presented in one section of a longer interview that included other unrelated material. The measures used for the analyses that follow are only a subset of the life quality measures originally assessed. (The selection of the subset was made many years before the analysis of change presented below was even contemplated.)
Measures
The life quality measures analyzed here fall into two sets: there are two measures of global well-being and 24 assessments of specific life concerns. (All 24 concern-level measures occur in the May data; 11 of them also occur in the November data.) In both the May and Novem- ber surveys, the life quality measures were presented in a battery with the following introduction: "In the next section of this interview we want to find out how you feel about parts of your life, and life in this country as you see it. Please tell me the feelings you have now -- taking
FRANK M. ANDREWS
into account what has happened in the last year and what you expect in the near future." Instructions for answering followed, and then the individual questions, each of which began "How do feel a b o u t . . . ? "
Both global measures asked "How do you feel about your life as a whole?" One of these questions was located as the second item in the battery, the other as the last item. (The intervening material -- the concern-specific questions -- was sufficiently long and diverse that respondents expressed no objection to being asked twice about their life-as-a-whole.) Their answers to the two global items were subse- quently averaged to produce an index of global well-being that was more reliable and valid than a measure based on just a single survey question would have been. 2
The 24 assessments of specific life concerns were chosen from larger sets in both the May and November surveys so as to span a wide range of life domains and values that were shown in previous analyses to be relevant to people's sense of life quality. Summarized wordings for each item appear in the exhibits below. 3
All questions were answered on a response scale with seven mare categories ranging from "I feel delighted" to "I feel terrible." The intervening categories were: "pleased," "mostly satisfied," "mixed -- about equally satisfied and dissatisfied," "mostly dissatisfied," and "unhappy." In addition, there were several off-scale categories: "neutral - - neither satisfied nor dissatisfied," "I never thought about it," and "does not apply to me." This response scale was designed to reflect a combination of affective and cognitive reactions to life conditions and to provide good discrimination at the positive end (where some other response scales produce substantial bunching of respondents). Data about the psychometric properties of the Delighted-Terrible Scale are available in Andrews and Withey (1976). This response scale has been used by many life quality investigators and has performed well.
THE 1988 DATA
The 1988 data were designed to be as similar as was feasible to those collected in 1972. As before, the sample represents adult Americans living in households; the life quality questions constituted a battery of items within a questionnaire that also inquired about other topics; and
S T A B I L I T Y A N D C H A N G E IN S U B J E C T I V E W E L L - B E I N G 7
the introduction to the battery, the wording of all life quality questions, and the response scale were all essentially identical to what had been used in 1972. 4
Administrative constraints, however, required two potentially impor- tant differences. (1) The 1988 data were collected in June and July rather than May or November, and (2) they were collected in telephone rather than face-to-face interviews. As shown in analyses below, a modest seasonal effect seems to be present (but can be allowed for). Previous studies have shown no evidence of an important or consistent difference attributable to whether the Delighted-Terrible Scale is ad- ministered face-to-face to by telephone. 5
The number of cases available for analysis in the 1988 data is 616.
R E S U L T S
The analysis results are presented in two sections. The first examines change and stability in the structure of the well-being measures and is concerned with the extent the interrelationships -- and hence the meaning -- of the measures was similar in 1988 to what it had been in 1972; this material is essentially methodological, but a crucial pre- requisite to what follows. The second section looks at changes in levels of well-being and hence presents the fundamental descriptive findings of the paper.
C H A N G E A N D S T A B I L I T Y IN T H E S T R U C T U R E OF W E L L - B E I N G
Two analyses explore the stability of the interrelationships among the well-being measures: (1) a pair of parallel factor analyses, and (2) a pair of parallel multiple classification analyses.
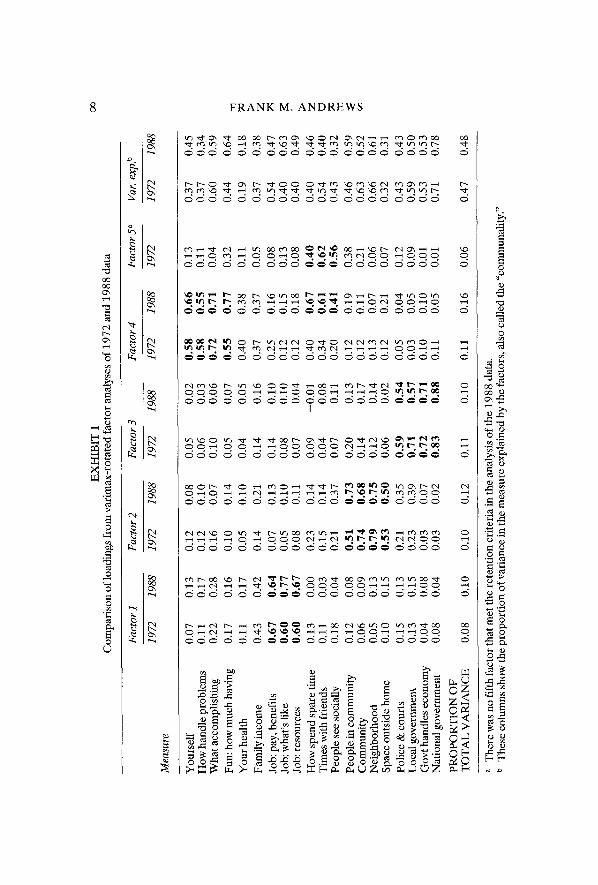
Interrelationships Among 20 Life Concerns
Exhibit 1 presents the results of two factor analyses -- one based on the interrelationships among 20 items from the May 1972 data, the other based on interrelationships among the same items in the 1988 data. 6 It should be stressed that these factor analyses were done "blind": There was no attempt to make them match. In each case, a principal corn-
F R A N K M. A N D R E W S
0
0
0
I : ~ ~" ~ ~ ~ ' ~ ~ " ¢'~ ~ ~'~ ~'~I ~ ' ~ ~-~ I ~
I
~ ~r~ ~" ~ ~-~I ~ ~ ~ ~- ('~I ~ ~
. . . . . . . . . . . . ° ° . . . . . .
o o o o o o ~ o o o o o o o o o o o
oo
o ©
00
o~
STABILITY AND CHANGE IN SUBJECTIVE WELL-BEING 9
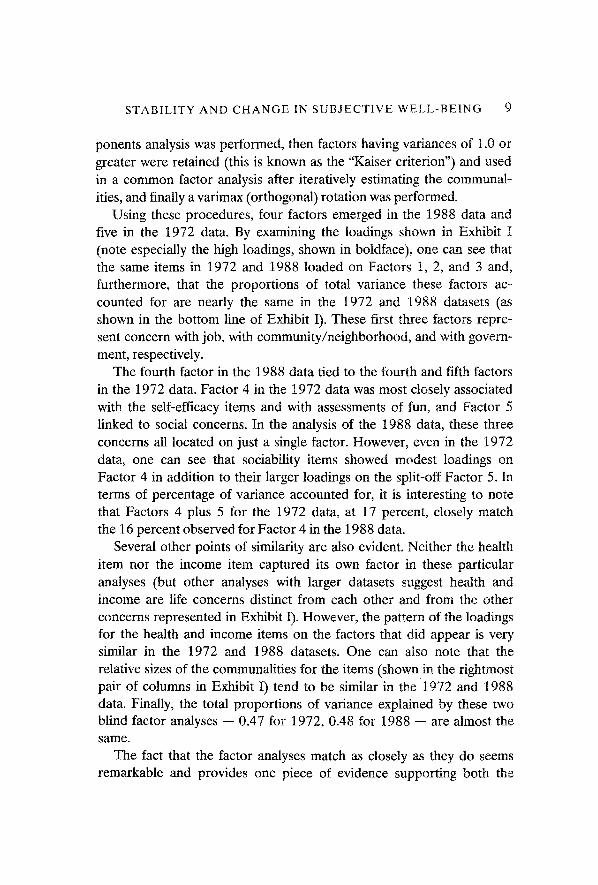
ponents analysis was performed, then factors having variances of 1.0 or greater were retained (this is known as the "Kaiser criterion") and used in a common factor analysis after iterafively estimating the communal- ities, and finally a varimax (orthogonal) rotation was performed.
Using these procedures, four factors emerged in the 1988 data and five in the 1972 data. By examining the loadings shown in Exhibit ! (note especially the high loadings, shown in boldface), one can see that the same items in 1972 and 1988 loaded on Factors 1, 2, and 3 and, furthermore, that the proportions of total variance these factors ac- counted for are nearly the same in the 1972 and 1988 datasets (as shown in the bottom line of Exhibit I). These first three factors repre- sent concern with job, with community/neighborhood, and with govern- ment, respectively.
The fourth factor in the 1988 data fled to the fourth and fifth factors in the 1972 data. Factor 4 in the 1972 data was most closely associated with the self-efficacy items and with assessments of fun, and Factor 5 linked to social concerns. In the analysis of the 1988 data, these three concerns all located on just a single factor. However, even in the 1972 data, one can see that sociability items showed modest loadings on Factor 4 in addition to their larger loadings on the split-off Factor 5. In terms of percentage of variance accounted for, it is interesting to note that Factors 4 plus 5 for the 1972 data, at 17 percent, closely match the 16 percent observed for Factor 4 in the 1988 data.
Several other points of similarity are also evident. Neither the health item nor the income item captured its own factor in these particular analyses (but other analyses with larger datasets suggest health and income are life concerns distinct from each other and from the other concerns represented in Exhibit I). However, the pattern of the loadings for the health and income items on the factors that did appear is very similar in the 1972 and 1988 datasets. One can also note that the relative sizes of the communalities for the items (shown in the rightmost pair of columns in Exhibit I) tend to be similar in the 1972 and 1988 data. Finally, the total proportions of variance explained by these two blind factor analyses -- 0.47 for 1972, 0.48 for 1988 -- are almost the same.
The fact that the factor analyses match as closely as they do seems remarkable and provides one piece of evidence supporting both the
10 F R A N K M. A N D R E W S
stability of the meaning of the subjective well-being measures over the 16 year interval and the comparability of the face-to-face and telephone interviewing modes.
Predicting Global Well-being
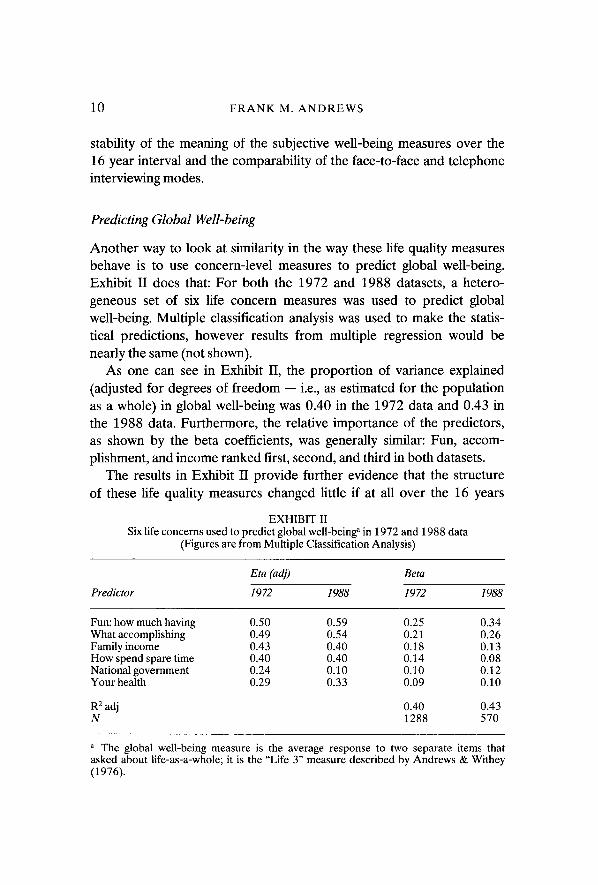
Another way to look at similarity in the way these life quality measures behave is to use concern-level measures to predict global well-being. Exhibit II does that: For both the 1972 and 1988 datasets, a hetero- geneous set of six life concern measures was used to predict global well-being. Multiple classification analysis was used to make the statis- tical predictions, however results from multiple regression would be nearly the same (not shown).
As one can see in Exhibit II, the proportion of variance explained (adjusted for degrees of freedom -- i.e., as estimated for the population as a whole) in global well-being was 0.40 in the 1972 data and 0.43 in the 1988 data. Furthermore, the relative importance of the predictors, as shown by the beta coefficients, was generally similar: Fun, accom- plishment, and income ranked first, second, and third in both datasets.
The results in Exhibit II provide further evidence that the structure of these life quality measures changed little if at all over the 16 years
EXHIBIT II Six life concerns used to predict global well-being" in 1972 and 1988 data
(Figures are from Multiple Classification Analysis)
Eta (adj) Beta
Predictor 1972 1988 1972 1988
Fun: how much having 0.50 0.59 0,25 0.34 What accomplishing 0.49 0.54 0.21 0.26 Family income 0.43 0.40 0,18 0.13 How spend spare time 0.40 0.40 0.14 0.08 National government 0.24 0.10 0.10 0.12 Your health 0.29 0.33 0.09 0.10
R 2 adj 0.40 0.43 N 1288 570
a The global well-being measure is the average response to two separate items that asked about life-as-a-whole; it is the "Life 3" measure described by Andrews & Withey (1976).
STABILITY AND CHANGE IN SUBJECTIVE WELL-BEING 11
from 1972 to 1988. Accordingly, it seems reasonable to proceed to the next analyses and use these measures to assess change and stability in levels of subjective well-being over this period.
CHANGE AND STABILITY IN LEVELS OF WELL-BEING
Before turning to the statistical results, it will be helpful to briefly review some of the cultural and economic trends in the United States during the 16 year period 1972 to 1988. At the most general level, one might characterize the period as a time of prosperity and stability -- there was no external war, no violent internal revolution, and no major economic depression. A more detailed consideration might note that 1972 was near the end of the very unpopular engagement in Vietnam when confidence in the national government and many other institu- tions seemed to be eroding, that the "women's movement" was an important factor throughout the period and increasing proportions of women joined the labor force, that civil rights for minorities received considerable attention and debate, that the divorce rate continued to rise, and that concerns for health and exercise and general self-develop- ment were popular. In 1972 and 1988 the unemployment rates were just about the same -- approximately 5% (though periods of much higher unemployment intervened). Real per capita gross national pro- duct increased significantly -- from about 12 to 16 thousands of 1982 dollars, which suggests the occurrence of real economic gains during the period.
What happened to people's sense of well-being? The following tables provide at least a partial answer.
Stabilities and Changes for the General Population
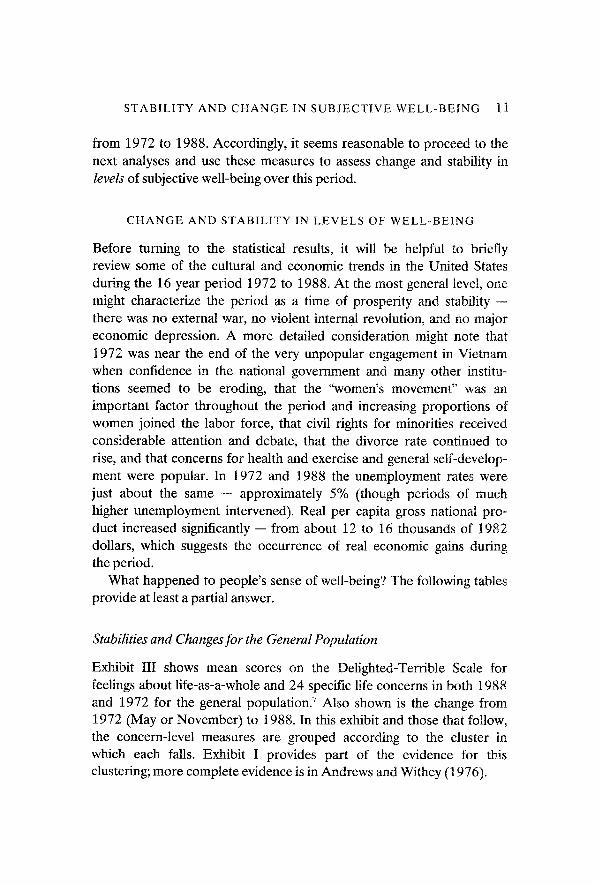
Exhibit III shows mean scores on the Delighted-Terrible Scale for feelings about life-as-a-whole and 24 specific life concerns in both 1988 and 1972 for the general population. 7 Also shown is the change from 1972 (May or November) to 1988. In this exhibit and those that follow, the concern-level measures are grouped according to the cluster in which each fails. Exhibit I provides part of the evidence for this clustering; more complete evidence is in Andrews and Withey (1976).
12 F R A N K M. A N D R E W S
EXHIBIT IlI Levels and changes in mean levels of well-being: 1972, 1988
Figures show mean scores on the 7-point Delighted-Terrible Scale A " • "indicates that data were not collected at this time
Measure
1988 1972 data Change from a
data May Nov May Nov
Life-as- a-whole b 5.8 5.5 5.3 0.3 0.5
Yourself 6.0 5.2 5.1 0.8 0.9 How handle problems 5.5 5.2 0.3 What accomplishing 5.5 5.1 5.0 0.4 0.5
Fun: how much having 5.4 5.2 4.9 0.2 0.5
Your health 5.7 5.3 5.1 0.4 0.6
Family income 4.9 4.8 4.5 0.1 0.4 Standard of living 5.6 5.2 5.1 0.4 0.5
Job: pay, benefits 5.1 5.0 0.1 Job: what's like 5.0 5.2 -0 .2 Job: resources 5.3 5.3 0.0
Your marriage 6.2 6.2 0.0 Your wife/husband 6.4 6.3 0.1 Your children 6.6 6.5 0.1
How spend spare time 5.4 5.4 5.1 0.0 0.3 Times with friends 5.7 5.6 0.1 People see socially 6.1 5.8 0.3
People in community 5.3 5.4 -0 .1 Community 5.4 5.5 5.2 -0 .1 0.2 Neighborhood 5.5 5.4 0.1 Space outside home 5.4 5.3 0.1
Police & courts 4.4 4.3 0.1 Local government 4.3 4.2 4.1 0.1 0.2 Govt handles economy 4.0 3.7 3.4 0.3 0.6 National government 4.2 4.0 4.0 0.2 0.2
Survey N c 616 1297 1072
a A conventional t test would indicate that most changes of 0.1 or more are "statisti- cally significant" at the 0.05 level of probability. b Mean shown is the average response to two separate items that asked about life-as-a- whole. c Most items were answered by at least 90% of respondents; exceptions are items about jobs, which were answered by about 67% in 1988 and 60% in 1972, and items about children and marriage, which were answered by about 60% in 1988 and 70% in 1972.
S T A B I L I T Y A N D C H A N G E IN S U B J E C T I V E W E L L - B E I N G 13
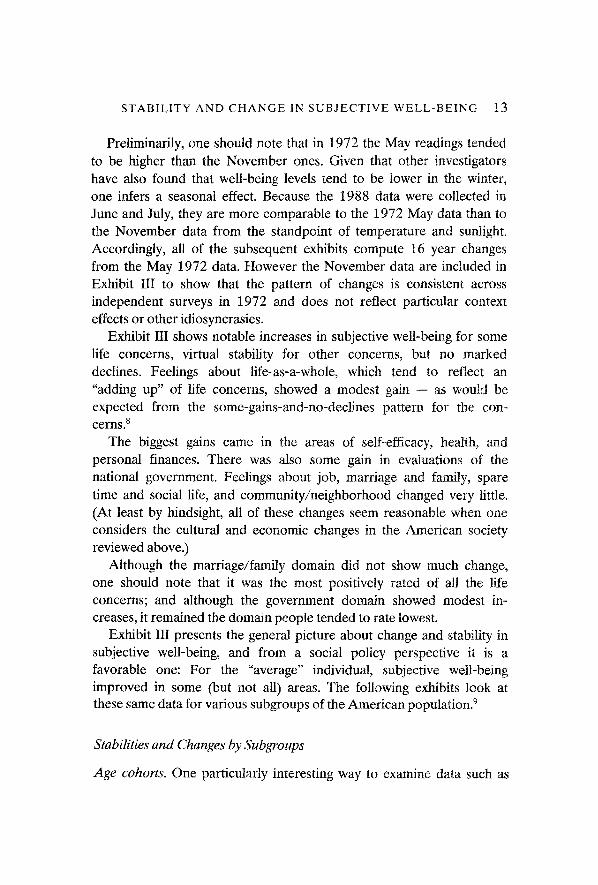
Preliminarily, one should note that in 1972 the May readings tended to be higher than the November ones. Given that other investigators have also found that well-being levels tend to be lower in the winter, one infers a seasonal effect. Because the 1988 data were collected in June and July, they are more comparable to the 1972 May data than to the November data from the standpoint of temperature and sunlight. Accordingly, all of the subsequent exhibits compute 16 year changes from the May 1972 data. However the November data are included in Exhibit III to show that the pattern of changes is consistent across independent surveys in 1972 and does not reflect particular context effects or other idiosyncrasies.
Exhibit III shows notable increases in subjective well-being for some life concerns, virtual stability for other concerns, but no marked declines. Feelings about life-as-a-whole, which tend to reflect an "adding up" of life concerns, showed a modest gain -- as would be expected from the some-gains-and-no-declines pattern for the con- cerns, s
The biggest gains came in the areas of self-efficacy, health, and personal finances. There was also some gain in evaluations of the national government. Feelings about job, marriage and family, spare time and social life, and community/neighborhood changed very little. (At least by hindsight, all of these changes seem reasonable when one considers the cultural and economic changes in the American society reviewed above.)
Although the marriage/family domain did not show much change, one should note that it was the most positively rated of all the life concerns; and although the government domain showed modest in- creases, it remained the domain people tended to rate lowest.
Exhibit III presents the general picture about change and stability in subjective well-being, and from a social policy perspective it is a favorable one: For the "average" individual, subjective well-being improved in some (but not all) areas. The following exhibits look at these same data for various subgroups of the American population. 9
Stabffities and Changes by Subgroups
Age cohorts. One particularly interesting way to examine data such as

14 FRANK M. ANDREWS
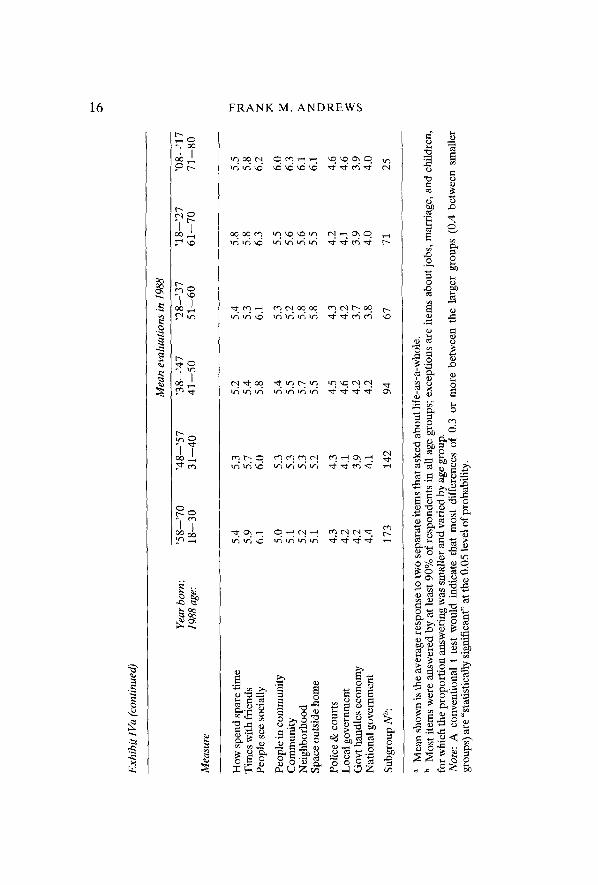
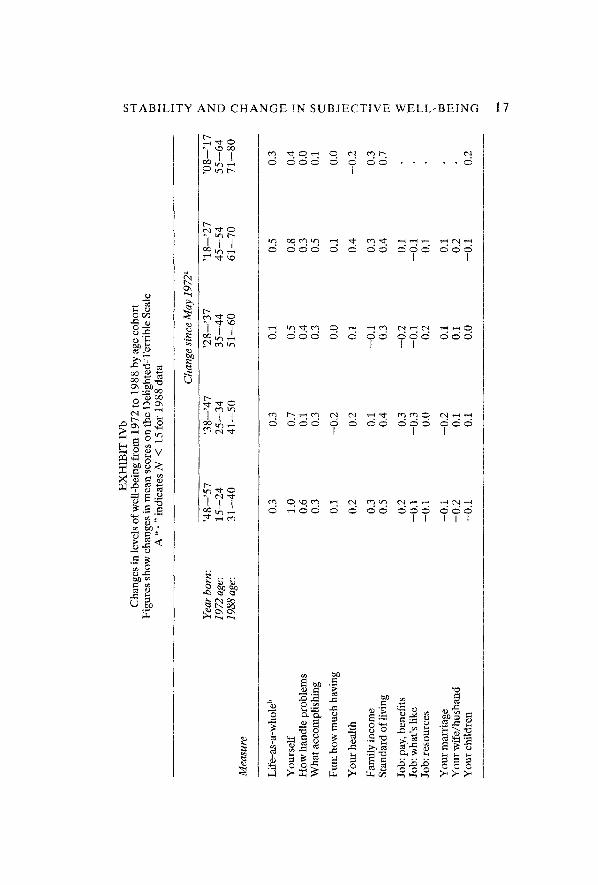
these is according to age cohort. Because representative samples have been taken from the same population, we know that the respondents who were (for example) aged 51--60 in 1988 represent the same group as the respondents who were aged 35--44 in 1972. (Both sets of respondents, of course, were born between 1928 and 1937.) Looking at age cohorts lets us see how the subjective well-being of particular sets of individuals has changed over the 16 year period. Exhibit 1Va presents the 1988 well-being data by age cohort, and Exhibit IVb shows changes for each cohort from its 1972 level. (Given the results in Exhibits IVa and IVb one can calculate the 1972 levels.) ~°
Looking first at Exhibit IVb, one can see that all age cohorts showed increases in global well-being. The data for specific life concerns show, however, that these increases were derived from different sources for different cohorts.
Interesting cohort differences emerge for the government domain. Recall (from Exhibit II1) that when all respondents were analyzed together, there was a notable improvement between 1972 and 1988 in feelings about the government, particularly about the national govern- ment. Exhibit IVb shows that it was mainly the people who were young adults in 1972 who felt more positive about the government by 1988; in contrast, people who were 35 or older in 1972 showed little or no change.
Another life concern of interest is the marriage/family domain. As observed in Exhibit III, for the general population this domain showed little change over the 16 year period. Exhibit IVb, however, hints that the youngest cohort felt less good about their families and marriages in 1988 than they did in 1972, whereas other cohorts felt about the same or slightly better.
A surprising pattern occurs in Exhibit IVb for the health domain. There is abundant evidence in the social indicators literature that people's evaluation of their health tends to decline as they age, and the reasons for this seem obvious. Exhibit IVa shows the expected pattern - - the older age groups evaluated their health less positively than younger age groups. However when we look at actual changes, in Exhibit IVb, we see that despite the fact that each cohort has aged by 16 years, only the oldest group (most of whom were in their 70s in 1988) evaluated their health less positively. Instead, all other groups

S T A B I L I T Y A N D C H A N G E IN S U B J E C T I V E W E L L - B E I N G 15
©
[...,
r~
O
t"-- t"q ~ I~ r--
~ t-e) t"e) t",l ~ ¢'¢'1 r...~ t t3
~ ' ~ t g 3 t t ~ t"q ~ t"q~l~ ~ ¢ ' , 1 ' ~ " ' ~ ' ~ ' ~ e e)
It3 ~ I,~ q') ~ tt~ ~'3 t¢'l t t3 '~" i t3 ~ k l ~
r~ ~-~
:z ~-z~: ~ ~ ~; .~...~°°° ~oo~.~
16 F R A N K M. A N D R E W S
i!
tt~ ~
~2
"2,~ = o = o
E
t.~
~D
©
O
S T A B I L I T Y A N D C H A N G E I N S U B J E C T I V E W E L L - B E I N G 1 7
cD
e q ~ ' - 2
i o ¢ ~ v
" ~ # ~
~Br~
~ . , ~ O
q') v.,.~
t
t"q "~-
I I I
I I I I t
a z ~ x~

18 F R A N K M . A N D R E W S
8
I I
I I I
8
I
I I I
I I I I
I
m ~ 0 . . g= ~ .-=
0
8
"6 t~
d
cq
0
o=&
STABILITY AND C H A N G E IN S U B J E C T I V E W E L L - B E I N G 19
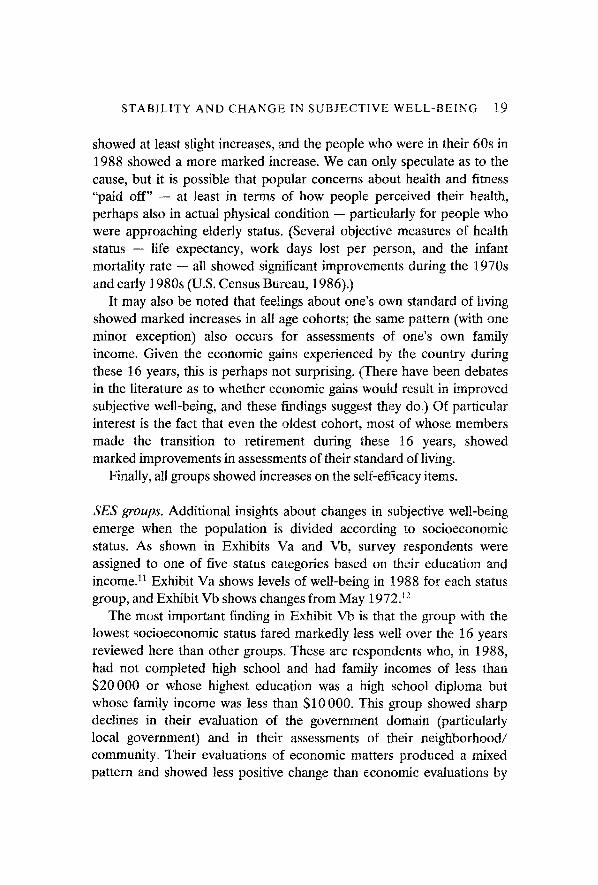
showed at least slight increases, and the people who were in their 60s in 1988 showed a more marked increase. We can only speculate as to the cause, but it is possible that popular concerns about health and fitness "paid off" -- at least in terms of how people perceived their health, perhaps also in actual physical condition -- particularly for people who were approaching elderly status. (Several objective measures of health status -- life expectancy, work days lost per person, and the infant mortality rate -- all showed significant improvements during the 1970s and early 1980s (U.S. Census Bureau, 1986).)
It may also be noted that feelings about one's own standard of living showed marked increases in all age cohorts; the same pattern (with one minor exception) also occurs for assessments of one's own family income. Given the economic gains experienced by the country during these 16 years, this is perhaps not surprising. (There have been debates in the literature as to whether economic gains would result in improved subjective well-being, and these findings suggest they do.) Of particular interest is the fact that even the oldest cohort, most of whose members made the transition to retirement during these 16 years, showed marked improvements in assessments of their standard of living.
Finally, all groups showed increases on the self-efficacy items.
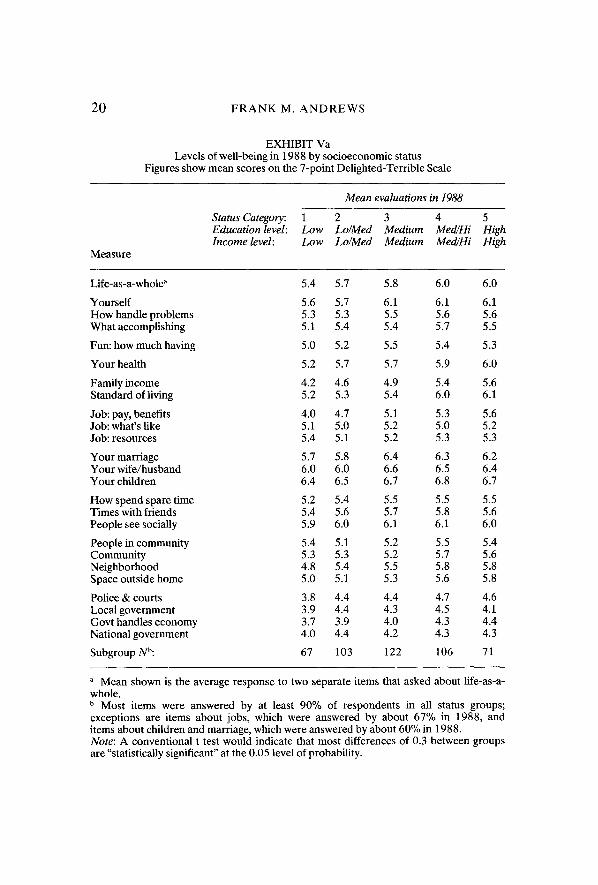
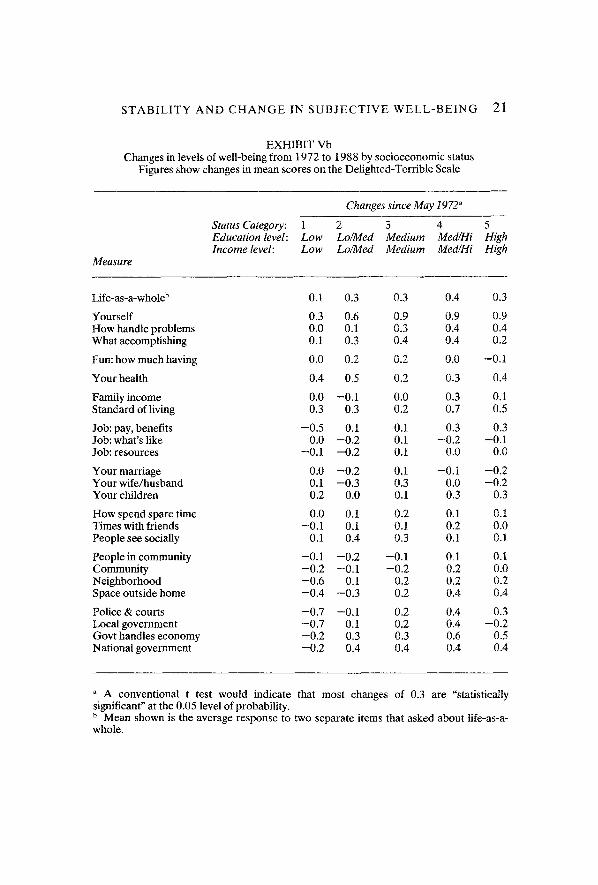
SES groups. Additional insights about changes in subjective well-being emerge when the population is divided according to socioeconomic status. As shown in ExbSbits Va and Vb, survey respondents were assigned to one of five status categories based on their education and income. 11 Exhibit Va shows levels of well-being in 1988 for each status group, and Exhibit Vb shows changes from May 1972.12
The most important finding in Exhibit Vb is that the group with the lowest socioeconomic status fared markedly less well over the 16 years reviewed here than other groups. These are respondents who, in 1988, had not completed high school and had family incomes of less than S20 000 or whose highest education was a high school diploma but whose family income was less than $10 000. This group showed sharp declines in their evaluation of the government domain (particularly local government) and in their assessments of their neighborhood/ community. Their evaluations of economic matters produced a mixed pattern and showed less positive change than economic evaluations by
20 F R A N K M. A N D R E W S
EXHIBIT Va Levels of well-being in 1988 by socioeconomic status
Figures show mean scores on the 7-point Delighted-Terrible Scale
Measure
Mean evaluations in 1988
Status Category: 1 2 3 4 5 Education level: Low Lo/Med Medium Med/Hi High Income level: Low Lo/Med Medium Med/Hi High
Life-as-a-whole a 5.4 5.7 5.8 6.0 6.0
Yourself 5.6 5.7 6.1 6.1 6.1 How handle problems 5.3 5.3 5.5 5.6 5.6 What accomplishing 5.1 5.4 5.4 5.7 5.5
Fun: how much having 5.0 5.2 5.5 5.4 5.3
Your health 5.2 5.7 5.7 5.9 6.0
Family income 4.2 4.6 4.9 5.4 5.6 Standard of living 5.2 5.3 5.4 6.0 6.1
Job: pay, benefits 4.0 4.7 5.1 5.3 5.6 Job: what's like 5.1 5.0 5.2 5.0 5.2 Job: resources 5.4 5.1 5.2 5.3 5.3
Your marriage 5.7 5.8 6.4 6.3 6.2 Your wife/husband 6.0 6.0 6.6 6.5 6.4 Your children 6.4 6.5 6.7 6.8 6.7
How spend spare time 5.2 5.4 5.5 5.5 5.5 Times with friends 5.4 5.6 5.7 5.8 5.6 People see socially 5.9 6.0 6.1 6.1 6.0
People in community 5.4 5.1 5.2 5.5 5.4 Community 5.3 5.3 5.2 5.7 5.6 Neighborhood 4.8 5.4 5.5 5.8 5.8 Space outside home 5.0 5.1 5.3 5.6 5.8
Police & courts 3.8 4.4 4.4 4.7 4.6 Local government 3.9 4.4 4.3 4.5 4.1 Govt handles economy 3.7 3.9 4.0 4.3 4.4 National government 4.0 4.4 4.2 4.3 4.3
Subgroup Nb: 67 103 122 106 71
a Mean shown is the average response to two separate items that asked about life-as-a- whole. b Most items were answered by at least 90% of respondents in all status groups; exceptions are items about jobs, which were answered by about 67% in 1988, and items about children and marriage, which were answered by about 60% in 1988. Note: A conventional t test would indicate that most differences of 0.3 between groups are "statistically significant" at the 0.05 level of probability.
S T A B I L I T Y A N D C H A N G E 1N S U B J E C T I V E W E L L - B E I N G 21
EXHIBIT Vb Changes in levels of well-being from 1972 to 1988 by socioeconomic status
Figures show changes in mean scores on the Delighted-Terrible Scale
Measure
Changes since May 1972"
Status Category: 1 2 3 4 5 Education level: Low Lo/Med Medium Med/Hi High Income level: Low Lo/Med Medium Med/Hi High
Life-as-a-whole b 0.1 0.3 0.3 0.4 0.3
Yourself 0.3 0.6 0.9 0.9 0.9 How handle problems 0.0 0.1 0.3 0.4 0.4 What accomplishing 0.1 0.3 0.4 0.4 0.2
Fun: how much having 0.0 0.2 0.2 0.0 -0 .1
Your health 0.4 0.5 0.2 0.3 0.4
Family income 0.0 -0 .1 0.0 0.3 0.1 Standard of living 0.3 0.3 0.2 0.7 0.5
Job: pay, benefits - 0 .5 0.1 0.1 0.3 0.3 Job: what's like 0.0 - 0 , 2 0.1 - 0 . 2 -0 .1 Job: resources -0 .1 - 0 . 2 0.1 0.0 0.0
Your marriage 0.0 - 0 . 2 0.1 -0 .1 - 0 . 2 Your wife/husband 0.1 -0 .3 0.3 0.0 - 0 . 2 Your children 0.2 0.0 0.1 0.3 0.3
How spend spare time 0.0 0.1 0.2 0.1 0.1 Times with friends -0 .1 0.1 0.1 0.2 0.0 People see socially 0.1 0.4 0.3 0.1 0.1
People in community -0 .1 - 0 . 2 -0 .1 0A 0.1 Community - 0 . 2 -0 .1 - 0 . 2 0.2 0.0 Neighborhood -0 .6 0A 0.2 0.2 0.2 Space outside home - 0 . 4 -0 .3 0.2 0.4 0.4
Pol ice&courts - 0 . 7 -0 .1 0.2 0.4 0.3 Local government --0.7 0.1 0.2 0.4 --0.2 Govt handles economy - 0 . 2 0.3 0.3 0.6 0.5 National government - 0 . 2 0.4 0.4 0.4 0.4
a A conventional t test would indicate that most changes of 0.3 are "statistically significant" at the 0.05 level of probability. b Mean shown is the average response to two separate items that asked about life-as-a- whole.
22 FRANK M. ANDREWS
other status groups: For the lowest status group there was a decline in evaluations of their pay and fringe benefits, but evaluations of family income showed no change and evaluations of standard of living actually improved. The major bright spot for the lowest status group had to do with health -- evaluations of own health showed a substantial improvement.
The second lowest status group had a pattern of changes somewhat similar to those just described for the lowest group, but less extreme. The second lowest group tended to fare next-to-worst. It is not the case, however, that each succeeding higher status group gained more. In general Groups 3, 4, and 5 -- i.e., those with medium to high educa- tions and incomes -- all showed roughly similar amounts of positive change over this 16 year period, though there were some domain differences. For example, the two highest groups outpaced the medium group with regard to improvements in feelings about standard of living, but this pattern was reversed with regard to feelings about marriage.
Although the main focus of this paper is on stability and change in well-being between 1972 and 1988, even a brief look at Exhibit Va will indicate notable differences among the groups. The pattern for most life concerns, and also for global well-being, is for members of higher status groups to feel better about their lives than members of lower status groups. One of the surprises in the early years of the Social Indicators Movement was that education and income proved to be only weakly related to subjective well-being. However, given the changes discussed above, those relationships must have been stronger in 1988 than they were in 1972. This suggests a deterioration of social equity over the 16 year period.
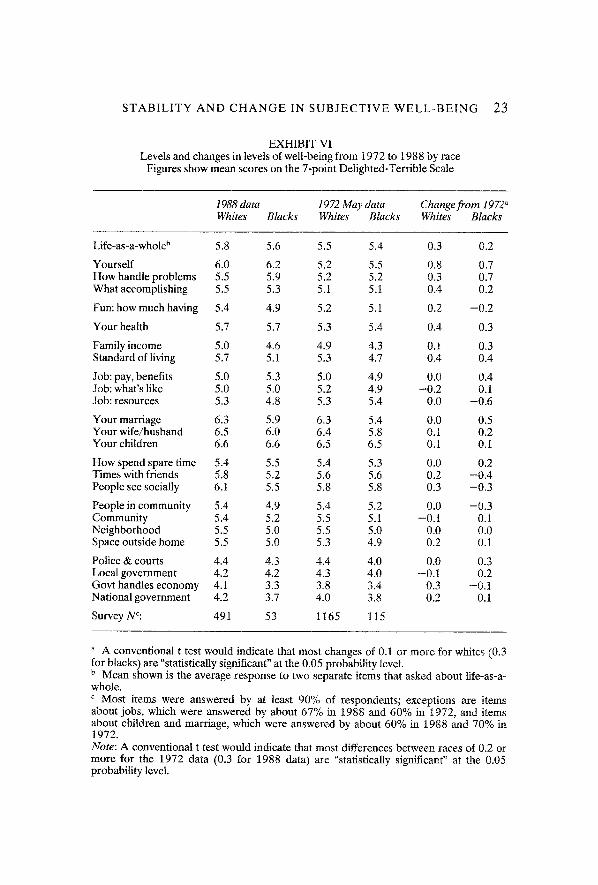
Race groups. Exhibit VI shows levels of well-being in 1972 (May) and 1988 and changes over the 16 year period for respondents classified by race (whites and blacks; other races were omitted). The key finding is that the differences between blacks and whites with regard to changes in subjective well-being were complex and inconsistent and that there is no clear evidence that one group fared markedly better than the other between 1972 and 1988.13 Both groups showed notable increases in their evaluations of their own personal self-efficacy, health, and stan- dard of living.
S T A B I L I T Y A N D C H A N G E IN S U B J E C T I V E W E L L - B E I N G 23
EXHIBIT VI Levels and changes in levels of well-being from 1972 to 1988 by race
Figures show mean scores on the 7-point Delighted-Terrible Scale
1988data 1972 May data Change from 1972" Whites Blacks Whi t e s Blacks Whi t e s Blacks
Life-as-a-whole ~ 5.8 5.6 5.5 5.4 0.3 0.2
Yourself 6.0 6.2 5.2 5.5 0.8 0.7 How handle problems 5.5 5.9 5.2 5.2 0.3 0.7 What accomplishing 5.5 5.3 5.1 5.1 0.4 0.2
Fun: how much having 5.4 4.9 5.2 5.1 0.2 -0 .2
Your health 5.7 5.7 5.3 5.4 0.4 0.3
Family income 5.0 4.6 4.9 4.3 0.1 0.3 Standard of living 5.7 5.1 5.3 4.7 0,4 0.4
Job: pay, benefits 5.0 5.3 5.0 4.9 0.0 0.4 Job: what's like 5.0 5.0 5.2 4.9 -0 .2 0.1 Job: resources 5.3 4.8 5.3 5.4 0.0 -0 .6
Your marriage 6.3 5.9 6.3 5.4 0.0 0.5 Your wife/husband 6.5 6.0 6.4 5.8 0.1 0,2 Your children 6.6 6.6 6.5 6.5 0. I 0.1
How spend spare time 5.4 5.5 5.4 5.3 0.0 0,2 Times with friends 5.8 5.2 5.6 5.6 0.2 - 0 . 4 People see socially 6.1 5,5 5.8 5.8 0.3 -0 .3
People in community 5.4 4.9 5.4 5.2 0.0 -0 .3 Community 5.4 5.2 5.5 5.1 -0 .1 0.t Neighborhood 5.5 5.0 5.5 5.0 0.0 0.0 Space outside home 5.5 5.0 5.3 4.9 0,2 0.1
Police & courts 4.4 4.3 4.4 4.0 0.0 0.3 Local government 4.2 4.2 4.3 4.0 -0 .1 0.2 Govt handles economy 4.1 3.3 3.8 3.4 0.3 -0 .1 National government 4.2 3.7 4.0 3.8 0.2 0.1
Survey NO: 491 53 1165 115
a A conventional t test would indicate that most changes of 0.1 or more for whites (0.3 for blacks) are "statistically significant" at the 0.05 probability level. b Mean shown is the average response to two separate items that asked about life-as-a- whole. c Most items were answered by at least 90% of respondents; exceptions are items about jobs, which were answered by about 67% in 1988 and 60% in 1972, and items about children and marriage, which were answered by about 60% in 1988 and 70% in 1972. Note: A conventional t test would indicate that most differences between races of 0.2 or more for the 1972 data (0.3 for 1988 data) are "statistically significant" at the 0.05 probability level.
24 F R A N K M. A N D R E W S
This is not to say that there were no differences in well-being levels between whites and blacks. In 1988 blacks showed lower levels of well- being than did whites in the domains of family income (but not pay and fringe benefits), marriage (but not children), friends, neighborhood/ community, and national government (but not local government); on the other hand, for two of the self-efficacy items (out of three), blacks rated themselves higher than did whites.
(Thomas and Hughes, 1986, using data from the General Social Survey, also found that whites tended to score higher than blacks on many aspects of well-being and that this difference did not change much between 1972 and 1985.)
Gender. No data are shown comparing women and men because the results are very simple to describe. There were few marked differences between men and women with respect to their levels of reported well- being in either 1972 or 1988; furthermore, the changes in well-being assessments shown by each group over this 16 year period were almost identical (and very close to those presented for the the general popula- tion in Exhibit III).
The one exception came for the items that asked about marriage and spouse. Men and women hardly differed in their feelings about these in 1972, but men showed modest positive changes and women slight negative changes, which left men feeling somewhat more positive than women in 1988 about these aspects of their families. (In contrast, both men and women showed modest positive changes in their evaluations of their children.)
From a social policy perspective the general lack of differences should be regarded as highly favorable. In terms of people's feelings about their life-as-a-whole and about the life concerns assessed here, women and men fared about equally well in the American society, and (with a possible exception regarding the institution of marriage) devel- opments between 1972 and 1988 were not experienced as markedly favoring one gender group over the other.
S U M M A R Y A N D C O N C L U S I O N S
This paper examines changes in subjective well-being for American
S T A B I L I T Y A N D C H A N G E IN S U B J E C T I V E W E L L - B E I N G 25
adults over the 16 year period 1972 to 1988. The paper has three major goals. One is descriptive -- to see the extent perceptions of life quality changed (or remained stable) over these 16 years for the population as a whole and for various subgroups. The second is methodological -- to investigate the suitability of survey measures that ask for evaluations of various aspects of one's own life for use as social indicators to monitor change. The third goal is procedural -- to explore ways of analyzing and presenting a kind of social indicators data that will become increasingly available.
Three datasets are examined. All are based on surveys of probability samples representing adult Americans living in households. Two of these surveys were conducted face-to-face in May and November 1972; the other was a telephone survey in June/July 1988. The key well-being measures include a pair of items that asked for respondents' feelings about life-as-a-whole and 24 other items that obtained feelings about various life concerns. The life concerns included assessments of oneself (self-efficacy), fun, health, income and standard of living, several aspects of one's job, marriage and children, spare time and social activities, community/neighborhood, and local and national govern- ment.
Two sets of analyses -- a pair of factor analyses and a pair of multiple classification analyses -- showed that the structure of these well-being measures remained remarkably constant during this 16 year period. There was high stability in the way the concern-level measures related to each other and in the way they "predicted" feelings of global well-being (life-as-a-whole). Accordingly, it was concluded that the "meaning" of the measures -- i.e., the way people interpreted and used them -- had not changed, and hence that it was appropriate to use these measures to assess changes in the level of people's reported welt-being.
With respect to feelings about life-as-a-whole, all groups showed some increase over the 16 year period, and differences between groups were not large. People with low education and income showed below average gains on this indicator of well-being.
Among the specific life concerns, three areas showed widespread gains.
Feelings about oneself and one's own self-efficacy was the domain that showed the largest increases. All groups showed gains here, though
26 F R A N K M. A N D R E W S
the gains tended to be less strong for the eldest respondents and for people with low socioeconomic status. Men and women, blacks and whites, and three socioeconomic groups in the middle and upper ranges all showed roughly equal gains.
Feelings about one's own health also showed substantial gains over the 16 year period, and all groups except the oldest age cohort showed this change. As might be expected, people who advanced in age over the 16 year period from their later-50s/early-60s into their 70s did not feel as good about their health in 1988 as they had in 1972. Surpris- ingly, however, the group that advanced from their mid-40s/early-50s into their 60s showed larger than average gains.
The third life concern to show fairly general increases was feelings about standard of living. All groups showed substantial increases here (including blacks, women, the elderly, and people with low educations and incomes). Feelings about one's own family income also showed favorable shifts, but these gains were not as general as were the gains in feelings about standard of living.
One other domain -- feelings about government -- showed a modest improvement over the 16 year period, but in contrast to the three life concerns just mentioned, changes in feelings about government differed across subgroups. People aged under 35 in 1972 (and hence 50 or under in 1988) were the one's whose feelings about the government became more favorable. Older groups showed little or no gains. In addition, there were sharp differences according to socioeconomic status. People with the lowest educations and incomes felt much less favorable about government -- particularly local government -- in 1988 than they had in 1972, whereas the higher status groups tended to show positive changes.
Four life concern areas showed little or no change over the 16 year period for the population as a whole: job, marriage/family, spare time and social activities, and community/neighborhood. The lack of change seemed to be general across the population for feelings about job and feelings about spare time and social activities. For marriage/family, however, there was some evidence that declines experienced by the youngest cohort and by women were being offest by modest gains experienced by older cohorts and by men. There was an even sharper offsetting evident for the community/neighborhood domain: People
S T A B I L I T Y A N D C H A N G E IN S U B J E C T I V E W E L L - B E I N G 27
lowest on socioeconomic status showed substantial declines in their evaluations of several indicators pertaining to community and neighbor- hood, but middle and high status groups showed improvements.
What does this all add up to? A good argument could be made for interpreting the numbers as showing real social progress. Progress seems to have occurred in a variety of different areas and for most groups in the American society. Even the group with the least favorable changes -- the lowest socioeconomic status group (those who did not complete high school and had family incomes in 1988 of less than $20 000, and those who had no more than a high school education and a family income of no more than $10 000) - showed a slight gain in feelings about life-as-a-whole. The fact that groups that have often been the subject of social concern -- blacks, women, and the elderly -- showed positive changes that, overall, were not notably less than the general population is an important finding. It can also be noted, how- ever, that the well-being differences that favored whites over blacks were not significantly diminished during this period.
One could argue that improvements in well-being should be evident: We are considering data from one of the wealthiest countries during an extended period of relative social stability. Nevertheless, wealth and stability have not been translated into improvements in subjective well- being by all societies over the course of human history. Documenting the extent, and the social extensiveness, of such changes is one of the missions of the Social Indicators Movement, and it is of considerable interest to discover that the survey-based measures used here seem able to provide such documentation. It will be of great interest to monitor changes in subjective well-being as they occur over longer periods in the United States, and to undertake similar monitorings in other societies as data for them become available.
N O T E S
* This is a revised version of a paper presented at the International Conference on Social Reporting in Berlin in September 1989 and may be included in a volume of conference papers being prepared by the Berlin Social Research Center (WZB). I am grateful to Richard Curtin, who facilitated collection of the 1988 data, and to Laura Klem for her assistance with the analysis of these data. 1 The November 1972 data used in this report are part of the "Form 2" November data described by Andrews and Withey (1976).

28 F R A N K M. A N D R E W S
2 Andrews and Withey (1976) present estimates of the reliability and validity of this index, which they call "Life 3." 3 The exact phrasing for each question is presented in Appendix A of Andrews and Withey (1976). 4 A copy of the 1988 interview schedule is available from the author on request. 5 As reported by Andrews and Withey (1976, Chapter 6, footnote 30), among 191 respondents who said their lives were "about the same" when they were interviewed by telephone in October 1973 as when they had been interviewed face-to-face in April 1973, mean scores on the Delighted-Terrible Scale were lower by 0.08 in the telephone interviews. In two random subsamples of the American population interviewed in April 1976, one face-to-face and the other by telephone, mean scores on the Delighted- Terrible Scale were higher by 0.09 for the telephone interviews (Groves and Kahn, 1979, report distributions for these data but not the means). Given that both compar- ison studies show only small differences, and that those differences are in opposite directions, there seems no evidence for an important effect of mode of data collection on the levels of expressed well-being. 6 The fact that four of the available concern-level measures are omitted from these factor analyses merely reflects the somewhat serendipitous way this paper developed. These factor analyses were initially prepared as examples for a class the author teaches. There is no reason to expect that including the additional four measures would alter the conclusion that the patterns of relationships in the 1972 and 1988 data sets are highly similar. 7 This exhibit and those that immediately follow present the 1988 data for the first time; most of the 1972 data appear in Chapter 8 or 9 of Andrews and Withey (1976). 8 A footnote in Exhibit III and the exhibits that follow provides an estimate of the statistical significance of the changes. In general we prefer to focus on consistency across multiple measures and magnitudes of change rather than estimates of statistical significance, which can be only rough approximations because of the complex design of the samples, imprecisions of measurement, etc. 9 The General Social Survey includes a few items that are conceptually similar to some of those included in Exhibit III. Using tabulations from the GSS Cumulative Code Book (Davis, 1982, 1988), one can compare changes in well-being over approximately the same time period and for approximately the same population with changes reported in Exhibit III. The pattern of relative changes is similar, but the GSS tends to show less positive change: Exhibit III shows increases in evaluations of health and personal finances, whereas the GSS shows stability for these; and Exhibit III shows little change in evaluations of job, marriage, and friends, whereas the GSS shows slight declines in these three domains. (Both data sources agree that evaluations of community showed little change.) The reason for this discrepancy is not known. "~ In considering the several results in Exhibit IVb, one needs to recall the extensive literature on age-period-cohort effects. An observed difference may be due to any one or any combintion of these effects, and additional information beyond that presented in Exhibit IVb would be required to determine the type of cause. ~ This socioeconomic scale assigns people with inconsistent combinations of income and education (e.g., a high income and a low education) to special categories, and these inconsistent cases were excluded from the analysis presented in Exhibits Va and Vb. Full details on construction of the socioeconomic scale for the 1972 respondents are presented in Appendix L of Andrews and Withey (1976); a similar procedure was used for the 1988 respondents after allowing for changes over the 16 year period in the distributions of income and education. J2 The 1972 data can be derived by subtraction. 13 In considering the changes shown in Exhibit VI, one should recall that the change data for Blacks is subject to more than the usual amount of sampling variation because of the limited numbers of cases (which are reported in the exhibit).
STABILITY AND CHANGE IN SUBJECTIVE WELL-BEING 29
REFERENCES
Abbey, A. and Andrews, F. M.: 1985, 'Modeling the psychological determinants of life quality', Social Indicators Research 16, pp. 1--34.
Andrews, F. M. and Inglehart, R. F.: 1978, 'The structure of subjective well-being in nine western societies', Social Indicators Research 6, pp. 73--90.
Andrews, F. M. and Withey, S. B.: 1976, Social Indicators of Well-Being: Americans' Perceptions of Life Quality (Plenum, New York).
Atkinson, T.: 1982, 'The stability and validity of quality of life measures', Social Indicators Research 10, pp. 113--132.
Campbell, A.: 1981, The Sense of Well-Being in America (McGraw-Hill, New York). Chamberlain, K.: 1988, 'On the structure of subjective well-being', Social Indicators
Research 20, pp. 581--604. Costa, P. T., Zonderman, A. B., McRae, R. R., Cornoni-Huntley, J., Lock, B. Z. and
Barbano, H. E.: 1987, 'Longitudinal analyses of psychological well-being in a national sample: Stability of mean levels', Journal of Gerontology 42, pp. 50--55.
Davis, J. A.: 1982, General Social Survey, 1972--1982: Cumulative Codebook (National Opinion Research Center, Chicago).
Davis, J. A.: 1984, 'New money, an old man/lady, and "two's company": Subjective welfare in the NORC General Social Surveys, 1972--1982', Social Indicators Research 15, pp. 319--350.
Davis, J. A.: 1988, General Social Surveys, 1972--1988: Cumulative Codebook (National Opinion Research Center, Chicago).
George, L. K. and Maddox, G. L.: 1977, 'Subjective adaptation to loss of work role: A longitudinal study', Journal of Gerontology 32, pp. 456--462.
Groves, R. M. and Kahn, R. L.: 1979, Surveys by Telephone: A National Comparison with Personal Interviews (Academic Press, New York).
Headey, B., Glowacki, T., Holmstrom, E. and Wearing, A.: 1985, 'Modeling change in perceived quality of life', Social Indicators Research 17, pp. 267--298.
Headey, B., Holmstrom, E. and Wearing, A.: 1984, 'The impact of life events and changes in domain satisfactions on well-being', Social Indicators Research 15, pp. 203--228.
Herzog, A. R. and Rodgers, W. L.: 1981, 'The structure of subjective well-being in different age groups', Journal of Gerontology 36, pp. 472--479.
Ingleliart, R.: 1985, 'Aggregate stability and individual-level flux in mass belief systems: The level of analysis paradox', American Political Science Review 79, pp. 97-- 116.
Johnston, D.: 1988, ~Toward a comprehensive 'quality of life' index', Social Indicators Research 20, pp. 473--496.
Kennedy, L. W. and Mehra, N.: 1985, 'Effects of social change on well-being: Boom and bust in a western Canadian city', Social Indicators Research 17, pp. 101--114.
Kozma, A. and Stones, M. J.: 1983, 'Predictors of happiness', Journal of Gerontology 38, pp, 626--628.
Liang, J. and Bollen, K. A.: 1985, 'Gender differences in the structure of the Philadelphia Geriatric Center Morale Scale', Journal of Gerontology 40, pp. 468-- 477.
McKennell, A., Atkinson, T. and Andrews, F. M.: 1980, 'Structural constancies in surveys of perceived well-being'. In Szalai, A. and Andrews, F. M. (eds.) The Quality of Life: Comparative Studies (Sage, London).
McNeil, J. K., Stones, M. J. and Kozma, A.: 1986, 'Longitudinal variation in domain indicators of happiness', Social Indicators Research 18, pp. 119-- 124.
Michalos, A. C.: 1985, 'Multiple discrepancies theory', Social Indicators Research 16, pp. 347--413.
Palmore, E. and Kivett, V.: 1977, 'Changes in life satisfaction: A longitudinal study of persons aged 46--70', Journal of Gerontology 32, pp. 31 l w316.
30 FRANK M. ANDREWS
Straus, M. A., Linsky, A. S. and Bachman-Prehn, R.: 1989, 'Change in the stressfulness of life in American states and regions from 1976 to 1982', Social Indicators Research 21, pp. 229--258.
Thomas, M. E. and Hughes, M.: 1986, 'The continuing significance of race: A study of race, class, and quality of life in America, 1972--1985', American Sociological Review 51, pp. 830--841.
Wiegand, E.: 1988, 'Current work on the social indicators system for the Federal Republic of Germany', Social Indicators Research 20, pp. 399--416.
United States Census Bureau: 1986, Statistical Abstract of the United States, 1987 (U.S. Department of Commerce, Washington, DC).
Zapf, W.: 1979, 'Applied social reporting: A social indicators system for West German society', Social Indicators Research 6, pp. 397--419.
Zapf, W.: 1980, 'The SPES social indicators system in comparative perspective'. In Szalai, A. and Andrews, F. M. (eds.) The Quality of Life: Comparative Studies (Sage, London).
Zapf, W. (ed.): 1987, 'German social report', Social Indicators Research 19, pp. 1--171.
Institute for Social Research, University of Michigan, Ann Arbor, M148109 U.S.A.