S.R. Cole, J.T. Haynes, P.C. Lucas, and R.A. Lambert. 2015. Faunal and sedimentological analysis of...
16
1 3 Facies (2015) 61:12 DOI 10.1007/s10347-015-0440-x ORIGINAL ARTICLE Faunal and sedimentological analysis of a latest Silurian stromatoporoid biostrome from the central Appalachian Basin Selina R. Cole 1 · John T. Haynes 2 · Philip C. Lucas 3 · Richard A. Lambert 4 Received: 8 January 2015 / Accepted: 28 April 2015 © Springer-Verlag Berlin Heidelberg 2015 composition as the buildup grew. The results of this study provide unique insight into reef development in one of the oldest Silurian reefal buildups from the central Appalachian Basin during a time interval when reefal buildups were poorly represented. Keywords Carbonate sedimentology · Reef paleoecology · Facies analysis · Silurian–Devonian boundary · Eastern Laurentia · Appalachian Basin Introduction Stromatoporoid and coral reefs were common in eastern Laurentia from the Silurian through the Devonian, with peaks in reef size and abundance occurring during the mid- dle Silurian and Middle Devonian (Copper 2002). Few eastern Laurentian buildups are known from strata depos- ited around the Siluro–Devonian boundary, which marks a time of decreased reef abundance and size that occurred between these two peaks (Smith 1985; Copper 2002). Of the reefs known from this time, most were restricted to higher latitudes in areas like the Great Lakes Region of Michigan, Illinois, and Indiana (Droste and Shaver 1985; Whitaker 1988; Lehman and Simo 1989; Shaver 1991), and New York and Quebec (Copper and Brunton 1991; Flügel and Flügel-Kahler 1992; Brunton et al. 1998; Copper 2002). South and east of the Illinois and Michigan Basins, reefs and other carbonate buildups are rare in the Silurian of the Appalachian Basin. This geographic distribution of buildups in eastern Laurentia is attributed to a relative rise in sea level that caused northward transgression in the Appalachian Basin and shifted reefs progressively north- ward (Precht 1988). Because of the scarcity of well-devel- oped reefal deposits from this time, paleoecologic details Abstract A period of reduced reefal abundance and size occurred around the time of the Silurian–Devonian bound- ary, between the middle Silurian and Middle Devonian reef building peaks. In southeastern Laurentia, stromato- poroid and coral reefs became especially rare during this time, and very few buildups have been reported from the region. This paper reports on the sedimentological, faunal, and paleoenvironmental characteristics of a newly discov- ered latest Silurian stromatoporoid-dominated buildup in the Keyser Limestone of the Virginia Appalachians. The buildup is classified as a parabiostrome, because over 95 % of the stromatoporoids in the buildup have been disturbed. Based on qualitative and statistical comparisons of facies characteristics, the buildup most likely formed from a stromatoporoid-tabulate buildup that was repeatedly dam- aged by high-energy events. Multivariate analyses of point count data reveal a decrease in stromatoporoids and an increase in tabulate corals and matrix moving vertically upward through the buildup, indicating changes in faunal Electronic supplementary material The online version of this article (doi:10.1007/s10347-015-0440-x) contains supplementary material, which is available to authorized users. * Selina R. Cole [email protected] 1 School of Earth Sciences, The Ohio State University, 275 Mendenhall Lab, 125 South Oval Mall, Columbus, OH 43210, USA 2 Department of Geology and Environmental Science, James Madison University, Harrisonburg, VA 22807, USA 3 Virginia Speleological Survey, 587 Limestone Lane, Burnsville, VA 24487, USA 4 Virginia Speleological Survey, PO Box 151, Monterey, VA 24456, USA
Transcript of S.R. Cole, J.T. Haynes, P.C. Lucas, and R.A. Lambert. 2015. Faunal and sedimentological analysis of...

1 3
Facies (2015) 61:12 DOI 10.1007/s10347-015-0440-x
ORIGINAL ARTICLE
Faunal and sedimentological analysis of a latest Silurian stromatoporoid biostrome from the central Appalachian Basin
Selina R. Cole1 · John T. Haynes2 · Philip C. Lucas3 · Richard A. Lambert4
Received: 8 January 2015 / Accepted: 28 April 2015 © Springer-Verlag Berlin Heidelberg 2015
composition as the buildup grew. The results of this study provide unique insight into reef development in one of the oldest Silurian reefal buildups from the central Appalachian Basin during a time interval when reefal buildups were poorly represented.
Keywords Carbonate sedimentology · Reef paleoecology · Facies analysis · Silurian–Devonian boundary · Eastern Laurentia · Appalachian Basin
Introduction
Stromatoporoid and coral reefs were common in eastern Laurentia from the Silurian through the Devonian, with peaks in reef size and abundance occurring during the mid-dle Silurian and Middle Devonian (Copper 2002). Few eastern Laurentian buildups are known from strata depos-ited around the Siluro–Devonian boundary, which marks a time of decreased reef abundance and size that occurred between these two peaks (Smith 1985; Copper 2002). Of the reefs known from this time, most were restricted to higher latitudes in areas like the Great Lakes Region of Michigan, Illinois, and Indiana (Droste and Shaver 1985; Whitaker 1988; Lehman and Simo 1989; Shaver 1991), and New York and Quebec (Copper and Brunton 1991; Flügel and Flügel-Kahler 1992; Brunton et al. 1998; Copper 2002). South and east of the Illinois and Michigan Basins, reefs and other carbonate buildups are rare in the Silurian of the Appalachian Basin. This geographic distribution of buildups in eastern Laurentia is attributed to a relative rise in sea level that caused northward transgression in the Appalachian Basin and shifted reefs progressively north-ward (Precht 1988). Because of the scarcity of well-devel-oped reefal deposits from this time, paleoecologic details
Abstract A period of reduced reefal abundance and size occurred around the time of the Silurian–Devonian bound-ary, between the middle Silurian and Middle Devonian reef building peaks. In southeastern Laurentia, stromato-poroid and coral reefs became especially rare during this time, and very few buildups have been reported from the region. This paper reports on the sedimentological, faunal, and paleoenvironmental characteristics of a newly discov-ered latest Silurian stromatoporoid-dominated buildup in the Keyser Limestone of the Virginia Appalachians. The buildup is classified as a parabiostrome, because over 95 % of the stromatoporoids in the buildup have been disturbed. Based on qualitative and statistical comparisons of facies characteristics, the buildup most likely formed from a stromatoporoid-tabulate buildup that was repeatedly dam-aged by high-energy events. Multivariate analyses of point count data reveal a decrease in stromatoporoids and an increase in tabulate corals and matrix moving vertically upward through the buildup, indicating changes in faunal
Electronic supplementary material The online version of this article (doi:10.1007/s10347-015-0440-x) contains supplementary material, which is available to authorized users.
* Selina R. Cole [email protected]
1 School of Earth Sciences, The Ohio State University, 275 Mendenhall Lab, 125 South Oval Mall, Columbus, OH 43210, USA
2 Department of Geology and Environmental Science, James Madison University, Harrisonburg, VA 22807, USA
3 Virginia Speleological Survey, 587 Limestone Lane, Burnsville, VA 24487, USA
4 Virginia Speleological Survey, PO Box 151, Monterey, VA 24456, USA

Facies (2015) 61:12
1 3
12 Page 2 of 16
of Silurian reefs in the central Appalachian Basin remain poorly known (Wilson 1975; Isaacson and Curran 1981).
The upper Keyser Limestone of western Virginia is located within the central Appalachian Basin and spans the Silurian–Devonian boundary. It contains two prominent stratigraphic horizons in which buildups of stromatoporoids and corals are present (Woodward 1943). A well-developed bioherm is present in the upper of these two horizons at Mustoe. The paleoecology (Smosna and Warshauer 1979), stromatoporoid systematics (Stock and Holmes 1986), geo-logic setting (Dorobek and Read 1986), and diagenetic his-tory (Smosna 1984) of this buildup, which is known as the Mustoe reef, have been described. This buildup at Mustoe is classified as a true ecological reef, and it represents one of the oldest stromatoporoid reefs known from anywhere in the Appalachian Basin (Smosna and Warshauer 1979; Precht 1988). In the lower reefal horizon of the Keyser, most previously identified exposures contain only isolated or thinly bedded corals and stromatoporoids, rather than in situ framework builders.
Discovery and exploration of the Water Sinks Subway Cave (the Subway) in 2007 resulted in identification of an outstanding exposure of the lower horizon of stromato-poroid and coral buildups in the Keyser Formation. This buildup is up to 3 m thick, and it provides new material for examining local patterns of reefal evolution during the late Silurian in the central Appalachian Basin. This paper reports on the stratigraphy, sedimentology, taphonomy, and faunal composition of this exposure, known as the Subway biostrome. Multivariate analyses were utilized to compare the biofacies of the Subway biostrome with those identi-fied at Mustoe reef, and to explore the faunal changes in the Subway biostrome through time. Questions addressed include: (1) How should the Subway biostrome be classi-fied (Riding 2002; Kershaw 1994)? (2) What similarities or differences exist between the Mustoe reef and the Subway biostrome in terms of faunal and sedimentological charac-teristics? (3) What measurable paleoecological trends occur in the Subway biostrome?
Location and stratigraphic correlation
The two coral-stromatoporoid buildups examined in this study are located in Highland County, Virginia, USA, and they represent the southernmost reefal deposits known from the Silurian of the Appalachian Basin (Fig. 1). The primary exposure considered is the Subway biostrome, located in the Water Sinks Cave system (coordinates 38°19′17″ N, 79°38′17″ W). A second exposure, a reef near Mustoe, Vir-ginia, (referred to as “Mustoe reef”, coordinates 38°13′19″ N, 79°36′19″ W), was also studied for comparison of facies, faunal composition, and sedimentology. The Water Sinks
Cave system is located approximately 12 km SSW of Mus-toe reef, and a complete exposure of the Keyser Limestone occurs there, including both an upper biostrome (referred to as the “upper Water Sinks biostrome”) and a lower bios-trome (referred to as the “Subway biostrome”). Other than qualitative observations, no data were collected for the upper Water Sinks biostrome. Stromatoporoid exposures have been identified nearby in other exposures of the Keyser Limestone, but because the stratigraphic placement of some of these occurrences is uncertain, this study focused only on the Subway biostrome and the reef at Mustoe.
Stratigraphy and geological setting
Stratigraphic sections
The Subway biostrome and the Mustoe reef bioherm are both in the Jersey Shore Member of the upper Keyser Limestone (Fig. 2), which spans the Silurian–Devonian boundary and is the lowest formation of the Helderberg Group (Denkler and Harris 1988). The Helderberg Group is composed of mixed carbonate and siliciclastic rocks that formed on a carbonate ramp on the eastern side of the cen-tral Appalachian Foreland Basin during a period of rela-tive tectonic quiescence between the Taconic and Acadian orogenies (Dorobek and Read 1986; Linn et al. 1990). Rocks within the Helderberg Group were deposited by a northward-advancing transgression, and thus the southern
Fig. 1 Map of Highland County, Virginia, USA, with study locations denoted by solid circles and towns denoted by open squares. Mustoe reef is located east of Mustoe along the NE side of State Road 607 (coordinates 38°19′17″ N, 79°38′17″ W). The Water Sinks is located just east of State Road 609 (coordinates 38°13′19″ N, 79°36′19″ W). The location of Highland County relative to the states of Virginia (VA) and West Virginia (WV) is shown in the shaded inset

Facies (2015) 61:12
1 3
Page 3 of 16 12
portions of units are older than their counterparts in the north (Precht 1988).
In the study area, the Keyser Limestone unconformably overlies the Tonoloway Limestone, a thick unit of mostly algal laminated carbonate mudstone. At some localities, this unconformity is marked by the presence of a flat-pebble conglomerate between the Keyser and Tonoloway Limestones (Woodward 1941, 1943; Bell and Smosna 1999); in the Water Sinks, this flat-pebble conglomerate ranges in thickness from 1 to 140 cm.
At the Water Sinks section, the Keyser Limestone is approximately 43 m thick (Haynes and Whitmeyer 2010), and three of the five regionally recognized members of the Keyser are present (Head 1972). The Byers Island Mem-ber, the lowest member of the Keyser, was deposited in an open-marine environment during a basinal transgression (Denkler and Harris 1988), but it is absent from the Water Sinks section. Minor regression accompanied by progra-dation of clastic sediments resulted in deposition of the overlying Clifton Forge Sandstone Member, a quartz-rich
Fig. 2 Stratigraphic columns from exposures at the Water Sinks and Mustoe reef sections. Inferred correlation between Mustoe reef and the upper Water Sinks biostrome are shown with dashed lines (modified from Haynes and Whitmeyer 2010)

Facies (2015) 61:12
1 3
12 Page 4 of 16
crinoidal and peloidal grainstone to calcarenaceous sand-stone with several cross-bedded intervals (Barwis and Makurath 1978). Just to the north of the Water Sinks, the Clifton Forge Sandstone undergoes a facies change into the Big Mountain Shale Member. At the Water Sinks section, the Clifton Forge is 11 m thick, and it unconformably over-lies thin-bedded and laminated dark gray lime mudstones of the upper Tonoloway Limestone. It is unknown if either the Clifton Forge Sandstone/Big Mountain Shale Member or the Byers Island Member are present in the subsurface at Mustoe.
A second, less extensive transgression deposited the Jersey Shore Member (Dorobek and Read 1986; Denkler and Harris 1988). This heterogeneous member contains (1) argillaceous nodular-bedded bioclastic wackestones and packstones, (2) thick to massively bedded gray to pink cri-noidal grainstones with common low-angle cross-bedding, (3) thin-bedded argillaceous lime mudstones and bioclastic wackestones with a few thin chert beds and lenses, and (4) the aforementioned two beds of stromatoporoid-dominated buildups. These four Jersey Shore lithologies, including the stromatoporoid buildups, are all present at the Water Sinks, whereas at Mustoe the stromatoporoid bioherm comprises nearly all of the exposed Jersey Shore Mem-ber. The LaVale Member, a peritidal dark gray bioclastic wackestone with some anastomosing thin beds and lami-nae of quartz sand grains, accumulated during a second regression (Denkler and Harris 1988). The LaVale Mem-ber is the uppermost member of the Keyser Limestone in this region and is about 3 m thick at the Water Sinks and 2 m thick at Mustoe.
The Keyser Limestone is conformably overlain by the New Creek Limestone, a cross-bedded to massive encri-nal calcarenite deposited in a shelf-edge environment on the outer portion of the carbonate platform. The New Creek Limestone was formed during a sea level rise that likely drowned any remaining stromatoporoid buildups in the upper Keyser Limestone that had survived the LaVale regression (Smosna and Warshauer 1979; Dorobek and Read 1986; Linn et al. 1990). The overlying cherty Corri-ganville and Licking Creek Limestones, the two uppermost formations of the Helderberg, are interpreted as deep-water carbonates that record a continued sea level rise after dep-osition of the New Creek Limestone (Dennison and Head 1975; Dorobek and Read 1986).
Age and stratigraphic correlation
Bowen (1967) placed the Silurian–Devonian boundary 30–37 m below the top of the Keyser based on brachi-opod data, whereas Dennison and Head (1975) placed the boundary at the top of the Clifton Forge Sand-stone Member based on lithostratigraphic data. More
recent conodont biostratigraphic work has constrained the Silurian–Devonian boundary to between 10 m and 3 m below the top of the Keyser Limestone (Helfrich 1978; Denkler and Harris 1988). This placement of the boundary based on conodonts is consistent with a car-bon isotope excursion that occurs in the upper Keyser Limestone (Saltzman 2002), an excursion that is con-sidered global in nature and is observed worldwide at Silurian–Devonian boundary sections (Buggisch and Mann 2004). Assignment of the boundary to the upper few meters of the Keyser Limestone designates both the Mustoe reef and the Subway biostrome as latest Silurian (Pridoli) in age.
We correlate the reef at Mustoe with the upper Water Sinks biostrome rather than with the Subway biostrome (Fig. 2). This correlation is based on stratigraphic position, thickness of the interval between the upper buildup and the Keyser–New Creek contact, the absence of a younger buildup in the overlying beds of the Keyser at Mustoe, and the arenaceous character of the overlying LaVale Mem-ber at both locations. Based on this stratigraphic correla-tion, the Subway buildup is the lower of the two region-ally extensive stromatoporoid buildups in the upper Keyser (Woodward 1943), and thus it is older than the Mustoe reef buildup.
Materials and methods
Qualitative data collection
Qualitative data were collected from the Subway bios-trome, the upper Water Sinks biostrome, and two distinct facies from Mustoe reef. The facies comprising Mustoe reef were identified by Smosna and Warshauer (1979) as the “reef core facies” and the “muddy blanket sediment;” these designations are adopted in the subsequent discus-sion. For each location, information was collected on the thickness of the exposure, faunal composition, sedimento-logical characteristics, and taphonomy. From the Subway biostrome, four thin-sections were made from samples of the biostrome to assess the composition of the matrix and framework grains, and to gain insight into cementation his-tory; these thin-sections were deemed sufficient to char-acterize vertical variation within the Subway biostrome because of the limited height of the buildup (1.5–3 m). In addition, two thin-sections were made from samples of the underlying sediment and the basal contact of the biostrome. All thin-sections were stained by etching with 1.5 % HCl for 15 s, staining with an acidified mixture of alizarin red S and potassium ferricyanide for 40 s, and staining with acidified alizarin red S for 15 s before rinsing and drying (Dickson 1965).

Facies (2015) 61:12
1 3
Page 5 of 16 12
Quantitative data collection
A system for point counting outcrop-scale exposures was developed based on standardized point-counting tech-niques (Chayes 1954; Ingersoll et al. 1984), and this sys-tem was used to collect quantitative data from the stro-matoporoid buildups for statistical analysis. Point-counting grids were drawn directly onto the exposures with chalk at 5-cm intervals horizontally and vertically for a total of 400 points in a 1 m × 1-m grid. Grids were photographed in 25 cm × 25-cm sections, then manually stitched using Adobe Photoshop into one composite photograph for each grid. From the photographs, individual stromatoporoids and corals were digitally outlined. Sections were point-counted directly from the composite photographs scaled to actual size on a computer screen. This method expedited the point-counting process by saving time spent in the field, providing digital archives of the sections for re-anal-ysis, and allowing close magnification of high-resolution images. The reliability of point counting from composite photos was confirmed by comparing point-count data from a 1 m × 1-m gridded section of the Subway biostrome that was collected directly from the outcrop versus from a com-posite photograph.
A Chi-square test for similarity indicated that collect-ing data from composite photos versus directly from the outcrop introduced no statistically detectable difference (p values greater than 0.05) for grain type (p = 0.88), stro-matoporoid orientation (p = 0.72), or stromatoporoid morphology (p = 0.13 with all forms included, p = 0.22 with fragmented and irregular forms excluded). For each grid point, the type of grain directly below the chalk mark was recorded as stromatoporoid, Favosites, Cladopora, or matrix. Taxonomic identification and study of stromato-poroids was intended, but pervasive dolomitization pre-vented identification to lower taxonomic levels. For stro-matoporoids, maximum height and maximum width was recorded, along with orientation (in growth orientation or disturbed) (Kissling and Lineback 1967; Hodges and Roth 1986). Because the degree of stromatoporoid transport can be difficult to ascertain (Kershaw and Brunton 1999), espe-cially when taxonomic data is lacking, this categorization of orientation aims to quantify only relative abundance of stromatoporoids in life position versus those that are not in life position. “Growth orientation” refers to stromato-poroids in their original life position and location, as well as those that may have been reoriented after movement. Stromatoporoids in growth orientation were identified using factors such as orientation of internal laminae and conformable growth over the underlying substrate. The term “disturbed” refers to stromatoporoids not in original growth position with no implication for the magnitude of movement or transport; thus, a disturbed stromatoporoid
could be toppled from original growth position, parautoch-thonous, or allochthonous. Disturbed stromatoporoids were identified using a combination of factors such as damage of margins and rotation from growth orientation based on alignment of internal laminae. Broken and fragmented stromatoporoids were also classified as disturbed. For stro-matoporoid morphology, damaged stromatoporoids were classified as broken, and unbroken stromatoporoids were assigned to one of six growth morphologies based on the classification outlined by Kershaw and Riding (1978) with additional parameters applied by Łuczynski (2005) (Fig. 3). Growth habits, primarily encrusting and interdigitation with sediment, were also recorded for stromatoporoids. Encrust-ing specimens were defined as such if they were growing conformably on the underlying material, and interdigitation with sediment (typically called “raggedness” or “ragged edges”) was identified from the jagged patterns along the lateral margins of some stromatoporoids (Broadhurst 1966; Stearn 1982; Kershaw 1984; Kershaw et al. 2006).
From the exposures in the Subway, 500 points were sampled from the base of the biostrome to a height of 125 cm. The lowest 400 points from the 0–100-cm inter-val were sampled from a 1 m × 1-m grid on a large block of cave breakdown (Fig. 4a), the stratigraphic position of which could be correlated with certainty to exposures
Fig. 3 Summary of growth forms found in Mustoe reef and the Sub-way biostrome (classification after Kershaw and Riding 1981)

Facies (2015) 61:12
1 3
12 Page 6 of 16
in the nearby cave walls using distinctive horizons in the unit (Figs. 4b–d). Another 100 points were sampled from a 1-m-wide by 0.25-m-high grid on an exposure in the walls of the Subway for the 100–125-cm interval of the bios-trome. At the Mustoe reef core, 800 points were sampled from two 1 m × 1-m grids; a greater number of samples were collected from this facies because of the heterogene-ity of the section and the large size of the stromatoporoids (Bennington 2003). In the muddy blanket sediment facies of the Mustoe reef exposure, 400 data points were col-lected from one 1 m × 1-m grid. All gridded sections were point-counted from composite photos using the methods described above. In summary, 500 points were collected from a 1 m × 1.25-m section of the Subway biostrome, 800 points were collected from two 1 m × 1-m sections of the Mustoe reef core, and 400 points were collected from a 1 m × 1-m section of the Mustoe muddy blanket sediment.
Statistical analyses
Two sets of analyses were performed using the point-count data; all statistical tests and ternary plots were performed in PAST (Hammer et al. 2001). The first set of analyses
compared the Subway biostrome facies with the two facies present at Mustoe reef. Percent composition of all three biofacies was plotted on ternary diagrams as percentages in order to visualize differences in stromatoporoid, matrix, and tabulate coral abundance. For each of the three facies, percent stromatoporoid orientation (in growth orientation versus disturbed) was plotted on a 100 % stacked histo-gram and percent stromatoporoid morphology was plotted on a histogram. Chi-square tests were performed to assess whether there are significant differences between the Sub-way biostrome and the two Mustoe reef biofacies. For each facies, point-count data were standardized for sample size and separate analyses were performed to compare grain type, orientation, and morphology between the different sample localities. A Bonferroni correction was run follow-ing Chi-square tests to account for multiple analyses.
The second set of analyses was used to explore potential faunal and sedimentological trends within the Subway bios-trome. Vertical variations in composition of the Subway biostrome were plotted on a ternary diagram to show com-positional changes within the exposure. Principal compo-nent analysis (PCA) was used to ordinate the data and visu-alize upsection changes in the faunal and sedimentological
Fig. 4 The Water Sinks Subway biostrome in the Jersey Shore Mem-ber of the Keyser. a Block of cave breakdown exposing a nearly com-plete thickness of the biostrome. Total height of the block is ~3 m. b Stromatoporoids (S) and Favosites (F) from the upper portion of the biostrome. Scale bar 5 cm. c Sharp contact between stromatoporo-
ids and the underlying substrate at the base of the biostrome. Arrow indicates rounded stromatoporoid at contact. Scale bar 10 cm. d Dis-continuous bed of cross-laminated quartz sand 30 cm below the bios-trome-substrate contact. Scale bar 10 cm

Facies (2015) 61:12
1 3
Page 7 of 16 12
characteristics of the Subway biostrome. The PCA analy-sis used data on grain type, average stromatoporoid height and width, and stromatoporoid morphology that had been collected from 5-cm intervals. The 5-cm intervals were lumped into five 25-cm intervals and coded to visualize vertical changes through the Subway biostrome.
Results
Facies analysis of stromatoporoid buildups
The Subway biostrome in the Water Sinks Cave system ranges from 1.5 to 3 m in thickness and is exposed approxi-mately 15 m horizontally. Because the cave passageway dissects the buildup, lateral exposure of the buildup is dis-continuous within the cave system and this measurement represents a minimum estimate for the lateral extent of the biostrome. The buildup is primarily composed of stro-matoporoid rudstones with minor occurrences of the tabu-late corals Favosites and Cladopora (Figs. 4a, b, 5). Most of the stromatoporoids are rotated out of growth position and their sizes range from broken fragments to specimens over 30 cm in diameter (Figs. 4b, c, 5). The well-defined contact between the biostrome and the underlying cross-bedded quartzose peloidal and crinoidal grainstone is undu-latory, and some stromatoporoids appear rounded, possibly by abrasion (Fig. 4c). Thin starved ripples of quartz sand
occur in the underlying crinoidal grainstone at distances of 20 and 30 cm below the base of the biostrome (Fig. 4d), and indicate siliciclastic input and moderately high water turbulence in the depositional environment preceding for-mation of the biostrome.
The upper Water Sinks biostrome is exposed for approx-imately 30 m horizontally and contains diverse reef-build-ing organisms including stromatoporoids, rugose corals, tabulate corals, and bryozoans. Many of the corals and stro-matoporoids in the upper biostrome are in original growth position and form framestones. The average size of reef builders appears to be larger than those in the lower bios-trome. No quantitative data were collected from the upper biostrome because of the highly weathered condition of all accessible surfaces and subterranean exposures in the vicinity of the Water Sinks; qualitative data is reported only for comparison to the correlative Mustoe reef.
Mustoe reef is approximately 13 m thick, but its lower contact is not exposed. Smosna and Warshauer (1979) iden-tified two distinct biofacies in the Mustoe buildup: the reef core and the muddy blanket sediment. The reef core biofa-cies makes up the majority of the exposure and is character-ized by framestones of large stromatoporoids and tabulate corals ranging in size from 18 to 40 cm in diameter (Fig. 6). The 6-m-thick muddy blanket environment is found on the western edge of the outcrop overlying the reef core facies. The muddy blanket biofacies is a bindstone of laminar stro-matoporoids ranging from 2 to 10 cm in width (Fig. 7).
Fig. 5 a Composite photograph from a 75 cm × 75-cm section at the base of the Subway biostrome point-count grid (0–75-cm interval). b Outlines of prominent stromatoporoids and corals from the same sec-
tion as a; blue stromatoporoids, red Favosites, green Cladopora, grey matrix. Note abundance of matrix and broken and disturbed stromato-poroids

Facies (2015) 61:12
1 3
12 Page 8 of 16
Fig. 6 a Composite photograph from a 75 cm × 75-cm section from the Mustoe reef core point count grid. b Outlines of prominent stro-matoporoids and corals from the same section as a; blue stromato-poroids, red Favosites, green Cladopora, grey matrix. Note large
(>40 cm across) in situ stromatoporoids with diverse morphologies dominating the section, many of which are in original growth posi-tion; broken stromatoporoids and fragments of Favosites and Clado-pora occur in spaces between larger stromatoporoids
Fig. 7 a Composite photograph from a 75 cm × 75-cm section from the Mustoe muddy blanket sediment point count grid. b Outlines of prominent stromatoporoids and corals from the same section as a;
blue stromatoporoids, red Favosites, green Cladopora, grey matrix. Note stromatoporoids are dominantly tabular and irregular forms with encrusting habits, and ragged edges are common

Facies (2015) 61:12
1 3
Page 9 of 16 12
Petrography
Petrographic analysis of six stained thin-sections from the exposures in the Subway biostrome shows distinct com-positional differences between the substrate and the bios-trome. The framework grains in the matrix of the buildup are primarily coral and stromatoporoid fragments (Fig. 8a–c), whereas framework grains of crinoid fragments, peloids, and monocrystalline quartz dominate the sediment of the substrate (Fig. 8c–e). The substrate also contains rare mic-ritized bioclasts that may be Renalcis or foraminifera tests (Fig. 8e).
The textural and compositional features seen in thin-sections from the Subway are consistent with previous descriptions of burial and diagenesis of the Keyser Lime-stone and associated strata (Smosna 1984; Dorobek and Read 1986; Dorobek 1987). Elevated burial temperatures led to the development of quartz overgrowths on many quartz grains that are common in the substrate beneath the Subway biostrome (Fig. 8c–e), as well as the widespread dolomitization of both the substrate and the biostrome. The presence of ferroan baroque dolomite, which replaced original calcareous sediment and reduced residual inter-particle pore spaces as a late-stage cement (Fig. 8a, b, f), further indicates high-temperature diagenesis at depth (Smosna 1984; Dorobek 1987). Because of patchy but per-vasive dolomitization at the Water Sinks, internal morpho-logic details of skeletal material was significantly reduced, thereby preventing species-level identification of stromato-poroids like that done at Mustoe reef (Smosna 1984; Stock and Holmes 1986).
Results of statistical analyses
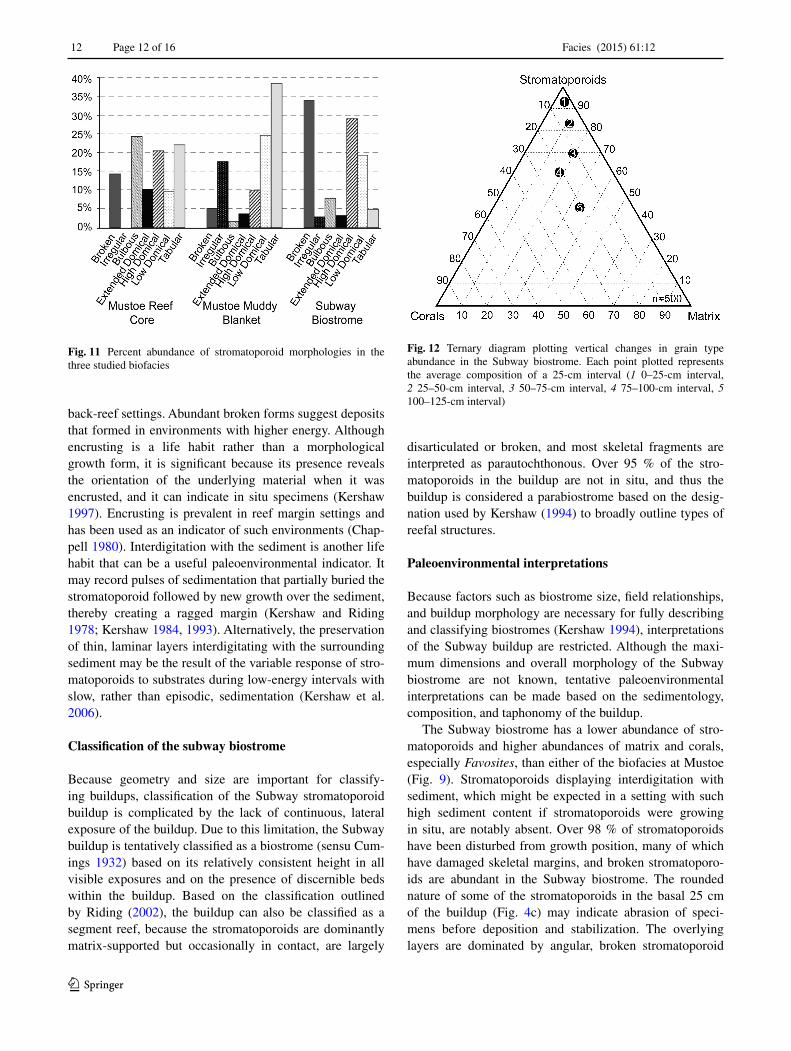
Results of the Chi-square tests indicate that the Subway biostrome is significantly different from both the Mus-toe reef core and the Mustoe muddy blanket biofacies in terms of composition, stromatoporoid orientation, and stromatoporoid morphology (Table 1). Average composi-tion of the Subway biostrome is 70.2 % stromatoporoids, 17.2 % matrix, 10.0 % Favosites, and 2.6 % Cladopora (Fig. 9). Stromatoporoid orientation is 98.6 % disturbed and 1.4 % in growth orientation (Fig. 10). Stromatoporoid morphology is dominated by broken (33.6 %), high domi-cal (28.8 %), and low domical (19.1 %) morphologies, with fewer bulbous (7.7 %) and other forms (Fig. 11). Intergrowth of stromatoporoid margins with the sediment is not observed, and 0.3 % of stromatoporoids are encrust-ing. Average dimensions for stromatoporoids in the Sub-way biostrome are 6.3 cm high by 10.0 cm wide. Two horizons at 0–25 cm and 50–100 cm have specimens with higher average dimensions of 9.6 cm high by 12.7 cm wide and 7.7 cm high by 13.4 cm wide, respectively, whereas
stromatoporoids in the 25–50-cm horizon have smaller average dimensions of 1.6 cm high by 2.9 cm wide.
The Mustoe reef core contains 86.6 % stromatoporo-ids, 7.1 % matrix, 3.0 % Favosites, and 3.3 % Cladopora (Fig. 9). Stromatoporoid orientation is 33.8 % disturbed and 66.2 % in growth orientation (Fig. 10). Encrusting habits occur in 26.1 % of stromatoporoids and ragged edges occur in 2.0 % of stromatoporoids. Morphology is dominated by bulbous (24.1 %), tabular (21.9 %), and high domical (20.4 %) forms, with fewer broken (14.1 %), extended domical (10.0 %), and low domical (9.5 %) forms (Fig. 11). Irregular forms are absent. Average dimensions for stromatoporoids in the reef core are 12.3 cm high by 16.6 cm wide.
Composition of the muddy blanket sediment at Mustoe is 79.0 % stromatoporoids, 14.3 % matrix, 2.0 % Favosites, and 4.7 % Cladopora (Fig. 9). Stromatoporoids are 89.9 % in growth orientation and 10.1 % disturbed (Fig. 10). Dom-inant morphologies for this section are tabular (38.3 %), low domical (24.4 %), irregular (17.4 %), and high domical (9.8 %) forms; other growth forms are relatively uncom-mon (Fig. 11). The habit of encrusting is present in 78.2 % of stromatoporoids, and ragged edges are found in 13.6 % of stromatoporoids. Average stromatoporoid dimensions are 3.7 cm high by 10.8 cm wide.
Vertical changes in the Subway biostrome
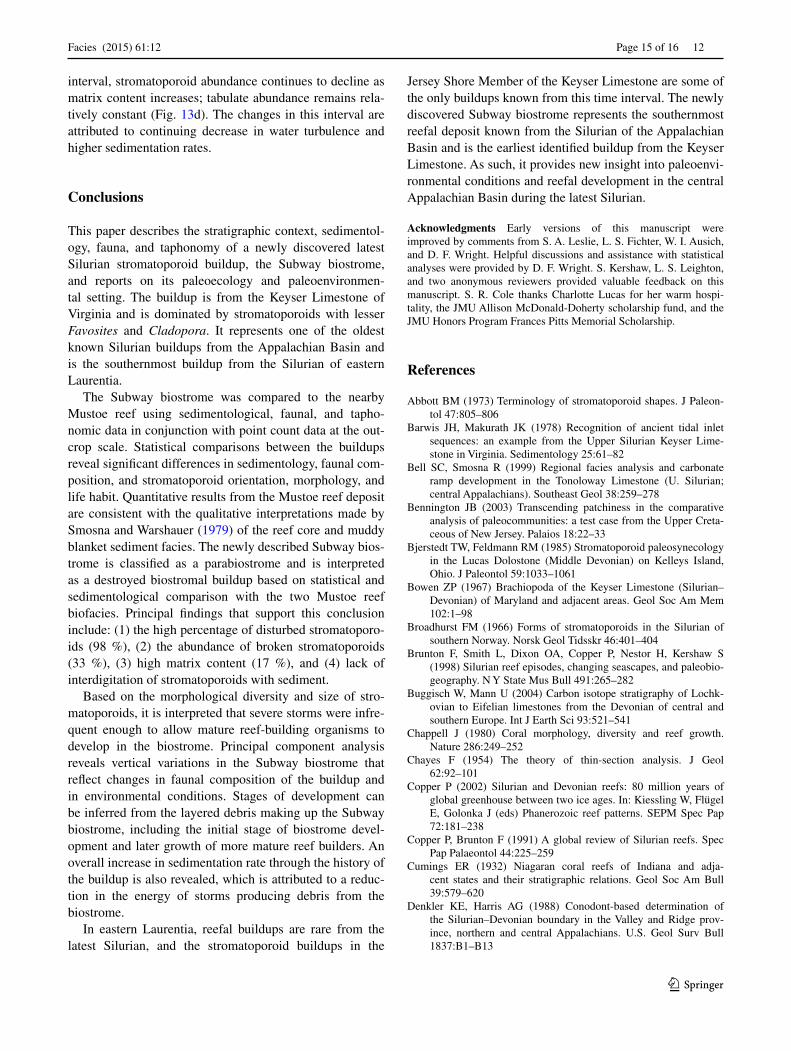
Composition of the Subway biostrome changes vertically through the buildup. Abundance of matrix and tabulate corals increases upsection whereas stromatoporoid abun-dance decreases (Fig. 12). The lowest and oldest interval (0–25 cm) is composed of 93 % stromatoporoids, 4 % matrix, and 3 % corals; the uppermost and youngest inter-val (100–125 cm) is composed of 45 % stromatoporoids, 34 % matrix, and 21 % corals.
Principal component analysis reveals vertical changes in both stromatoporoid abundance and size in the Subway biostrome (Fig. 13). The first three principal components explain 82.9 % of the total variation in the data, and are the only principal components that can be interpreted (Table 2, Online Resource 1). Although there is overlap between samples from the five successive 25-cm intervals, the over-all trend upsection is that of decreasing along the first prin-cipal component (PC1) and increasing along the second principal component (PC2). PC1 accounts for 42.9 % of the total variation within the data, and it primarily reflects stromatoporoid size, with average height and width of stromatoporoids decreasing upsection. PC2 accounts for 28.7 % of the total variation, and it reflects composition, i.e., faunal and sedimentological makeup, with stromato-poroid abundance decreasing upsection as abundance of matrix and tabulate corals increases. The third principal

Facies (2015) 61:12
1 3
12 Page 10 of 16
component (PC3) accounts for 11.3 % of the total varia-tion and represents changes in stromatoporoid morphol-ogy. The trajectory of this axis is necessarily more complex
than the others because the six morphological forms identi-fied must be considered. The highest loadings are for high domical and tabular forms, which are inversely correlated,
Fig. 8 Photomicrographs of stained thin-sections from the Subway biostrome and underlying substrate. a–b Fossil-rich matrix of the biostrome dominantly composed of corals with ferroan calcite reduc-ing intraparticle pore space of corallites and large ferroan baroque dolomite cement-reducing larger interparticle pores, PPL. c Sharp contact between the biostrome (above) and the peloidal and quartz-
rich substrate (below), PPL. d Quartz-rich peloidal and bioclastic grainstone and packstone of the substrate, PPL. e Possible micritized Renalcis or foram test in underlying substrate; note quartz overgrowth on quartz grain at left, PPL. f Ferroan calcite and ferroan baroque dolomite-reducing interparticle porosity in the substrate, XPL. All scale bars 0.5 mm

Facies (2015) 61:12
1 3
Page 11 of 16 12
with smaller loadings for low domical and bulbous forms. Loadings for irregular and extended domical forms indicate that the contribution of these forms to PC3 is negligible (Table 2).
Discussion
Stromatoporoid morphology as an environmental indicator
Use of stromatoporoid morphology as an environmental indicator is based on the assumption that certain environ-mental controls exert ecological pressures that are strong enough to modify stromatoporoid growth in response. The degree of phenotypic plasticity that individuals can exhibit is, in part, genetically controlled and variable by species (Kershaw 1981), so care must be taken when attribut-ing morphology exclusively to ecophenotypic variation. The morphotype of some species may show little change across diverse environments; likewise, some growth forms may occur in multiple environments under widely differing conditions (Kershaw 1981). However, it is widely accepted that aspects of stromatoporoid growth form can be used as a paleoenvironmental indicator (Abbott 1973; Kershaw 1981, 1984, 1990, 1998; Bjerstedt and Feldmann 1985; Łuczynski 1998, 2003; Kershaw and Brunton 1999), espe-cially when used in conjunction with sedimentological and other contextual data. Ideally, stromatoporoid growth form should not be the only line of evidence used when making paleoenvironmental interpretations. For this reason, this study used stromatoporoid morphologic data in conjunc-tion with sedimentological, taphonomic, and statistical data to interpret paleoenvironmental conditions of the buildups.
Generalized patterns for distribution of stromatoporoid morphology within a reefal setting have been constrained through studies of stromatoporoid hydrodynamics (Ker-shaw and Brunton 1999), functional morphology (Bjerstedt
and Feldmann 1985; Kershaw 1998), and taphonomy (Ker-shaw 1990; Kershaw and Brunton 1999). Unstable bulbous forms are interpreted to have grown in the quiet waters of back-reef lagoons. Hydrodynamically stable forms such as low or high domical morphologies could withstand the higher water turbulence of fore-reefs and reef cores. Tab-ular and laminar forms could grow in areas of high water turbulence because of their low profile; however, their broad base also suited them for growth on the soft sedi-ment of quiet, muddy environments such as lagoons and
Table 1 Chi-square test results for grain type, stromatoporoid mor-phology, and orientation between the Subway biostrome and the two biofacies at Mustoe
Test df χ2 p value
Mustoe reef core vs. Subway biostrome
Grain type 3 48.674 <0.0001
Morphology 6 191.83 <0.0001
Orientation 1 469.09 <0.0001
Muddy blanket sediment vs. Subway biostrome
Grain type 3 33.791 <0.0001
Morphology 6 357.42 <0.0001
Orientation 1 788.29 <0.0001
Fig. 9 Ternary diagram plotting relative abundance of grain types in the three studied biofacies. Grain type endmembers are divided into stromatoporoids, corals (Favosites and Cladopora combined), and matrix
Fig. 10 Percent orientation of stromatoporoids in the three studied biofacies
Facies (2015) 61:12
1 3
12 Page 12 of 16
back-reef settings. Abundant broken forms suggest deposits that formed in environments with higher energy. Although encrusting is a life habit rather than a morphological growth form, it is significant because its presence reveals the orientation of the underlying material when it was encrusted, and it can indicate in situ specimens (Kershaw 1997). Encrusting is prevalent in reef margin settings and has been used as an indicator of such environments (Chap-pell 1980). Interdigitation with the sediment is another life habit that can be a useful paleoenvironmental indicator. It may record pulses of sedimentation that partially buried the stromatoporoid followed by new growth over the sediment, thereby creating a ragged margin (Kershaw and Riding 1978; Kershaw 1984, 1993). Alternatively, the preservation of thin, laminar layers interdigitating with the surrounding sediment may be the result of the variable response of stro-matoporoids to substrates during low-energy intervals with slow, rather than episodic, sedimentation (Kershaw et al. 2006).
Classification of the subway biostrome
Because geometry and size are important for classify-ing buildups, classification of the Subway stromatoporoid buildup is complicated by the lack of continuous, lateral exposure of the buildup. Due to this limitation, the Subway buildup is tentatively classified as a biostrome (sensu Cum-ings 1932) based on its relatively consistent height in all visible exposures and on the presence of discernible beds within the buildup. Based on the classification outlined by Riding (2002), the buildup can also be classified as a segment reef, because the stromatoporoids are dominantly matrix-supported but occasionally in contact, are largely
disarticulated or broken, and most skeletal fragments are interpreted as parautochthonous. Over 95 % of the stro-matoporoids in the buildup are not in situ, and thus the buildup is considered a parabiostrome based on the desig-nation used by Kershaw (1994) to broadly outline types of reefal structures.
Paleoenvironmental interpretations
Because factors such as biostrome size, field relationships, and buildup morphology are necessary for fully describing and classifying biostromes (Kershaw 1994), interpretations of the Subway buildup are restricted. Although the maxi-mum dimensions and overall morphology of the Subway biostrome are not known, tentative paleoenvironmental interpretations can be made based on the sedimentology, composition, and taphonomy of the buildup.
The Subway biostrome has a lower abundance of stro-matoporoids and higher abundances of matrix and corals, especially Favosites, than either of the biofacies at Mustoe (Fig. 9). Stromatoporoids displaying interdigitation with sediment, which might be expected in a setting with such high sediment content if stromatoporoids were growing in situ, are notably absent. Over 98 % of stromatoporoids have been disturbed from growth position, many of which have damaged skeletal margins, and broken stromatoporo-ids are abundant in the Subway biostrome. The rounded nature of some of the stromatoporoids in the basal 25 cm of the buildup (Fig. 4c) may indicate abrasion of speci-mens before deposition and stabilization. The overlying layers are dominated by angular, broken stromatoporoid
Fig. 11 Percent abundance of stromatoporoid morphologies in the three studied biofacies
Fig. 12 Ternary diagram plotting vertical changes in grain type abundance in the Subway biostrome. Each point plotted represents the average composition of a 25-cm interval (1 0–25-cm interval, 2 25–50-cm interval, 3 50–75-cm interval, 4 75–100-cm interval, 5 100–125-cm interval)

Facies (2015) 61:12
1 3
Page 13 of 16 12
fragments, indicating minimal transport after breakage. Of the unbroken specimens, low domical and high domi-cal morphologies are most common. The abundance of these forms is attributed to their compact, relatively equant shapes, making these forms more resistant to breakage dur-ing high-energy events than other morphologies. The low abundance of Cladopora is also attributed to the fragility of
the specimens, and thus an inability to withstand periods of increased water turbulence.
The best-supported interpretation is that the Subway biostrome formed as a stromatoporoid-tabulate buildup that was destroyed by high-energy events that eroded the buildup, transported the reef building organisms, and re-deposited them. Similar interpretations have been made for stromatoporoid buildups from the Silurian of Gotland (Ker-shaw 1990), which are largely composed of debris from destroyed biostromes. This interpretation of the forma-tion of the Subway biostrome is supported by the signifi-cant abundance of disturbed stromatoporoids, high matrix content, appreciable percentage of broken specimens, and absence of stromatoporoids with ragged edges. Although the majority of stromatoporoids are disturbed and thus not strictly in situ, they are interpreted as being locally derived. Because the degree of stromatoporoid transport is difficult to ascertain, however, the stromatoporoids may have been transported off the original buildup to nearby areas. Alter-natively, the buildup may have formed as a deposit of reef flank debris sourced from a nearby reefal buildup rather than being from a biostrome that was destroyed roughly in situ. Understanding the lateral extent of the Subway bios-trome would allow better constraint of these interpretations.
Fig. 13 Scatter plot from principal component analysis of the Sub-way biostrome plotting first and second principal components. PC1 is interpreted as stromatoporoid size; PC2 is interpreted as abundance of stromatoporoids versus matrix and corals. Numbers plotted indicate the interval sampled from the biostrome. Insets are representative sec-
tions from the sampled intervals with overlays for composition: blue stromatoporoids, red Favosites, green Cladopora, uncolored matrix; all scale bars 5 cm. For scatter plot and insets, 1 and inset A 0–25-cm interval; 2 and inset B 25–50-cm interval; 3 and inset C 50–75-cm interval; 4 75–100-cm interval; 5 and inset D 100–125-cm interval
Table 2 Loadings for the first three principal components
PC1 PC2 PC3
Stromatoporoid 0.3155 −0.7129 −0.0786
Matrix −0.1946 0.4180 −0.0763
Favosites −0.0888 0.3283 0.2607
Cladopora −0.0321 −0.0334 −0.1057
Height 0.5172 0.1257 0.2394
Width 0.6966 0.4086 −0.3681
Tabular 0.0226 0.0703 −0.4014
Low domical 0.0262 0.0348 0.2441
High domical 0.2831 0.0055 0.6717
Extended dom. 0.0318 −0.0458 0.0563
Bulbous 0.1231 −0.1156 −0.1967
Irregular 0.0590 −0.0622 −0.0472

Facies (2015) 61:12
1 3
12 Page 14 of 16
If the Subway biostrome is more extensive than exposures currently reveal, the second interpretation would be less likely because a very large source reef would be required to form such an extensive deposit of reef flank debris, and there is no evidence for such a source reef.
Interpretations of data collected from the Mustoe reef core are consistent with those made by Smosna and War-shauer (1979). The reef core is composed almost entirely of stromatoporoids, with tabulate corals making up less than 7 % of the core population (Fig. 9). It has the high-est morphological diversity of stromatoporoids and the most even distribution of growth forms of the three biofa-cies (Fig. 11). This diversity of forms, with tabular, high domical, bulbous, and broken forms dominating, indicates a mature reef with numerous ecological niches that per-mitted growth of diverse morphologies. The abundance of bulbous forms suggests either moderate water turbulence in the reef core or, more likely, the presence of sheltered depressions or cavities where these somewhat unstable forms could grow alongside fragile corals like Cladopora. Approximately two-thirds of stromatoporoids are in growth orientation (Fig. 10), and some of the specimens, especially domical forms, appear to be in their original growth posi-tion (Fig. 6). Most specimens not in growth position show no signs of transport and appear to have accumulated in situ after falling over. The moderate abundance of encrust-ing stromatoporoids suggests growth of organisms in place as the reef built up over time. Very few (2 %) of the stro-matoporoids have ragged edges and the matrix component is low (7 %), a further indication of moderate water turbu-lence that prevented fine sediment from accumulating on the reef. The average size of stromatoporoids in the Mustoe reef core is measurably larger than in the other two biofa-cies, again indicating a mature reef and conditions suitable for prolonged growth.
The environmental interpretation of Smosna and War-shauer (1979) that the Mustoe muddy blanket sediment was deposited in a quiet, shallow environment sheltered behind the larger reef complex is also supported by point count data. Stromatoporoid and tabulate coral abundances in the Mustoe muddy blanket sediment are similar to those in the reef core, but the matrix content is twice that of the reef core. The tabular and low domical morphologies that dominate this biofacies grew together into boundstones that trapped the sediment, indicating low water turbulence that allowed fine sediment to settle. Irregular growth forms are abundant and are indicative of growth restrictions in the muddy blanket biofacies; this morphology has been attrib-uted to stagnant water, low nutrient availability, or limited accommodation space (St. Jean 1971). Few broken or trans-ported stromatoporoids are found in this section, suggest-ing high-energy episodes were uncommon or the area was protected from such events. A moderately high percentage
of stromatoporoids have ragged edges, suggesting either periodic episodes of increased sedimentation or quiet envi-ronmental conditions where sediment accumulated more gradually (Stearn 1982; Kershaw et al. 2006). Encrusting is widespread and nearly all stromatoporoids are in their original growth position, providing evidence that they were rarely disturbed. Although it is possible that the prevalence of tabular and low domical morphologies indicates high water turbulence rather than a shallow, restricted setting, this is unlikely given the abundance of matrix, the lack of transported and broken specimens, and the large number of stromatoporoids that interdigitate with the surrounding sediment.
Faunal and environmental trends in the subway biostrome
Vertical changes in the Subway biostrome record chang-ing environmental conditions during growth of the buildup. These changes are visualized in the ternary diagram and PCA scatter plot, which both divide the buildup into five 25-cm intervals (Figs. 12, 13). Most of these intervals occupy distinct regions of the ternary diagram and scatter plot, although intervals three and four largely overlap in the scatter plot.
The basal 25 cm of the deposit records the initial for-mation of the biostrome based on the presence of large domical stromatoporoids (up to 40 cm across). Stromato-poroids dominate the interval; abundance of tabulate cor-als and matrix is low (Fig. 13a). This is somewhat unu-sual and notable, given that most reports of early or initial colonization indicate that corals are the first to colonize the substrate rather than stromatoporoids (Precht 1988; Brunton et al. 1998). The 25–50-cm interval is dominantly composed of very small (~2 cm) stromatoporoids, and it has higher matrix content (11 %) and few tabulate corals (Fig. 13b). The changes observed in this interval indicate increased sedimentation, potentially because of decreasing severity of storms. The 50–75-cm and 75–100-cm intervals both represent the development of mature reef builders with an increase in evenness and size of reef builders (Brun-ton et al. 1998; Racki and Sobstel 2004). In the 50–75-cm interval, tabulate corals increase in abundance, especially the delicate Cladopora, likely in response to development of sheltered areas in the mature biostrome (Precht 1988). The stromatoporoids are large (up to 38 cm across), simi-lar in size to those in the 0–25-cm interval, and are mor-phologically diverse, but the high matrix content indicates high sedimentation continued (Fig. 13c). Characteristics of the 75–100-cm interval are largely the same as those of the underlying 50–75-cm interval except for an increase in tabulate corals from 12 to 21 %, mostly attributable to an increase in Favosites. In the uppermost, 100–125-cm
Facies (2015) 61:12
1 3
Page 15 of 16 12
interval, stromatoporoid abundance continues to decline as matrix content increases; tabulate abundance remains rela-tively constant (Fig. 13d). The changes in this interval are attributed to continuing decrease in water turbulence and higher sedimentation rates.
Conclusions
This paper describes the stratigraphic context, sedimentol-ogy, fauna, and taphonomy of a newly discovered latest Silurian stromatoporoid buildup, the Subway biostrome, and reports on its paleoecology and paleoenvironmen-tal setting. The buildup is from the Keyser Limestone of Virginia and is dominated by stromatoporoids with lesser Favosites and Cladopora. It represents one of the oldest known Silurian buildups from the Appalachian Basin and is the southernmost buildup from the Silurian of eastern Laurentia.
The Subway biostrome was compared to the nearby Mustoe reef using sedimentological, faunal, and tapho-nomic data in conjunction with point count data at the out-crop scale. Statistical comparisons between the buildups reveal significant differences in sedimentology, faunal com-position, and stromatoporoid orientation, morphology, and life habit. Quantitative results from the Mustoe reef deposit are consistent with the qualitative interpretations made by Smosna and Warshauer (1979) of the reef core and muddy blanket sediment facies. The newly described Subway bios-trome is classified as a parabiostrome and is interpreted as a destroyed biostromal buildup based on statistical and sedimentological comparison with the two Mustoe reef biofacies. Principal findings that support this conclusion include: (1) the high percentage of disturbed stromatoporo-ids (98 %), (2) the abundance of broken stromatoporoids (33 %), (3) high matrix content (17 %), and (4) lack of interdigitation of stromatoporoids with sediment.
Based on the morphological diversity and size of stro-matoporoids, it is interpreted that severe storms were infre-quent enough to allow mature reef-building organisms to develop in the biostrome. Principal component analysis reveals vertical variations in the Subway biostrome that reflect changes in faunal composition of the buildup and in environmental conditions. Stages of development can be inferred from the layered debris making up the Subway biostrome, including the initial stage of biostrome devel-opment and later growth of more mature reef builders. An overall increase in sedimentation rate through the history of the buildup is also revealed, which is attributed to a reduc-tion in the energy of storms producing debris from the biostrome.
In eastern Laurentia, reefal buildups are rare from the latest Silurian, and the stromatoporoid buildups in the
Jersey Shore Member of the Keyser Limestone are some of the only buildups known from this time interval. The newly discovered Subway biostrome represents the southernmost reefal deposit known from the Silurian of the Appalachian Basin and is the earliest identified buildup from the Keyser Limestone. As such, it provides new insight into paleoenvi-ronmental conditions and reefal development in the central Appalachian Basin during the latest Silurian.
Acknowledgments Early versions of this manuscript were improved by comments from S. A. Leslie, L. S. Fichter, W. I. Ausich, and D. F. Wright. Helpful discussions and assistance with statistical analyses were provided by D. F. Wright. S. Kershaw, L. S. Leighton, and two anonymous reviewers provided valuable feedback on this manuscript. S. R. Cole thanks Charlotte Lucas for her warm hospi-tality, the JMU Allison McDonald-Doherty scholarship fund, and the JMU Honors Program Frances Pitts Memorial Scholarship.
References
Abbott BM (1973) Terminology of stromatoporoid shapes. J Paleon-tol 47:805–806
Barwis JH, Makurath JK (1978) Recognition of ancient tidal inlet sequences: an example from the Upper Silurian Keyser Lime-stone in Virginia. Sedimentology 25:61–82
Bell SC, Smosna R (1999) Regional facies analysis and carbonate ramp development in the Tonoloway Limestone (U. Silurian; central Appalachians). Southeast Geol 38:259–278
Bennington JB (2003) Transcending patchiness in the comparative analysis of paleocommunities: a test case from the Upper Creta-ceous of New Jersey. Palaios 18:22–33
Bjerstedt TW, Feldmann RM (1985) Stromatoporoid paleosynecology in the Lucas Dolostone (Middle Devonian) on Kelleys Island, Ohio. J Paleontol 59:1033–1061
Bowen ZP (1967) Brachiopoda of the Keyser Limestone (Silurian–Devonian) of Maryland and adjacent areas. Geol Soc Am Mem 102:1–98
Broadhurst FM (1966) Forms of stromatoporoids in the Silurian of southern Norway. Norsk Geol Tidsskr 46:401–404
Brunton F, Smith L, Dixon OA, Copper P, Nestor H, Kershaw S (1998) Silurian reef episodes, changing seascapes, and paleobio-geography. N Y State Mus Bull 491:265–282
Buggisch W, Mann U (2004) Carbon isotope stratigraphy of Lochk-ovian to Eifelian limestones from the Devonian of central and southern Europe. Int J Earth Sci 93:521–541
Chappell J (1980) Coral morphology, diversity and reef growth. Nature 286:249–252
Chayes F (1954) The theory of thin-section analysis. J Geol 62:92–101
Copper P (2002) Silurian and Devonian reefs: 80 million years of global greenhouse between two ice ages. In: Kiessling W, Flügel E, Golonka J (eds) Phanerozoic reef patterns. SEPM Spec Pap 72:181–238
Copper P, Brunton F (1991) A global review of Silurian reefs. Spec Pap Palaeontol 44:225–259
Cumings ER (1932) Niagaran coral reefs of Indiana and adja-cent states and their stratigraphic relations. Geol Soc Am Bull 39:579–620
Denkler KE, Harris AG (1988) Conodont-based determination of the Silurian–Devonian boundary in the Valley and Ridge prov-ince, northern and central Appalachians. U.S. Geol Surv Bull 1837:B1–B13

Facies (2015) 61:12
1 3
12 Page 16 of 16
Dennison JM, Head JW (1975) Sealevel variations interpreted from the Appalachian Basin Silurian and Devonian. Am J Sci 275:1089–1120
Dickson JAD (1965) A modified staining technique for carbonates in thin section. Nature 205:587
Dorobek SL (1987) Petrography, geochemistry, and origin of burial diagenetic facies, Siluro-Devonian Helderberg Group (carbonate rocks), central Appalachians. AAPG Bull 71:492–514
Dorobek SL, Read JF (1986) Sedimentology and basin evolution of the Siluro–Devonian Helderberg Group, central Appalachians. J Sediment Petrol 56:601–613
Droste JB, Shaver RH (1985) Comparative stratigraphic framework for Silurian reefs—Michigan Basin to surrounding platforms. In: Circone KR, Budai JM (eds) Ordovician and Silurian rocks of the Michigan Basin and its margins, Michigan Basin. Geol Soc Am Spec Pap 4:73–93
Flügel E, Flügel-Kahler E (1992) Phanerozoic reef evolution: basic questions and data base. Facies 26:167–278
Hammer Ø, Harper DAT, Ryan PD (2001) PAST: palaeontological statistics package for education and data analysis. Palaeontol Electron 4:1–9
Haynes JT, Whitmeyer SJ (2010) Geologic map of the north half of the Williamsville 7½ minute quadrangle, Highland and Bath Counties, Virginia: unpublished geologic map submitted to Edu-cational Component of the National Cooperative Geologic Map-ping Program (EDMAP), U.S. Geological Survey
Head JW III (1972) Upper Silurian-Lower Devonian stratigraphy and nomenclature in the central Appalachians, In: 37th Annual Field Conference of Pennsylvania Geologists: Stratigraphy, sedimentol-ogy, and structure of Silurian and Devonian rocks along the Alle-gheny front in Bedford County, Pennsylvania, Allegheny County, Maryland, and Mineral and Grant Counties, West Virginia. Penn-sylvania Bureau of Topographic and Geologic Survey, Harrisburg, PA
Helfrich CT (1978) A conodont fauna from the Keyser Limestone of Virginia and West Virginia. J Paleontol 52:1133–1142
Hodges LT, Roth AA (1986) Orientation of corals and stromatoporo-ids in some Pleistocene, Devonian, and Silurian reef facies. J Paleontol 60:1147–1158
Ingersol RV, Bullard TF, Ford RL, Grimm JP, Pickle JD, Sares SW (1984) The effect of grain size on detrital modes: a test of the Gazzi-Dickinson point-counting method. J Sediment Petrol 54:103–116
Isaacson PE, Curan HA (1981) Anatomy of an Early Devonian car-bonate buildup, central New York. J Paleontol 55:1225–1236
Kershaw S (1981) Stromatoporoid growth form and taxonomy in a Silurian biostrome, Gotland. J Paleontol 55:1284–1295
Kershaw S (1984) Patterns of stromatoporoid growth in level-bottom environments. Palaeontology 27:113–130
Kershaw S (1990) Stromatoporoid palaeobiology and taphonomy in a Silurian biostrome on Gotland, Sweden. Palaeontology 33:681–705
Kershaw S (1993) Sedimentation control on growth of stromatoporoid reefs in the Silurian of Gotland, Sweden. J Geol Soc London 150:197–205
Kershaw S (1994) Classification and geological significance of bios-tromes. Facies 31:81–92
Kershaw S (1997) Palaeoenvironmental change in Silurian stromato-poroid reefs, Gotland, Sweden. Bol Real Soc Esp Historia Nat Seccion Geol 91:329–342
Kershaw S (1998) The applications of stromatoporoid palaeobiology in palaeoenvironmental analysis. Palaeontology 41:509–544
Kershaw S, Brunton FR (1999) Palaeozoic stromatoporoid taphon-omy: ecological and environmental significance. Palaeogeogr Palaeoclimatol Palaeoecol 149:313–328
Kershaw S, Riding R (1978) Parameterization of stromatoporoid shape. Lethaia 11:233–242
Kershaw S, Wood R, Guo L (2006) Stromatoporoid response to muddy substrates in Silurian Limestones. GFF 128:131–138
Kissling DL, Lineback JA (1967) Paleoecological analysis of corals and stromatoporoids in a Devonian biostrome, Falls of the Ohio, Kentucky-Indiana. Geol Soc Am Bull 78:157–174
Lehman PJ, Simo A (1989) Depositional facies and diagenesis of the Pipe Creek Jr. Reef, Silurian, Great Lakes region, Indiana. In: Geldsetzer HHJ, James NP, Tebbutt GE (eds) Reefs, Canada and Adjacent Areas. Canadian Society of Petroleum Geologists Memoir 13:319–329
Linn FM, Textoris DA, Dennison JM (1990) Syn-depositional tec-tonic influence on lithofacies of the Helderberg Group (Silu-rian–Devonian) of the central Appalachians. In: Shumaker RC (ed) Appalachian Basin Industrial Associates Fall Program 17:190–213
Łuczynski P (1998) Stromatoporoid morphology in the Devonian of the Holy Cross Mountains, Poland. Acta Palaeontol Pol 43:653–663
Łuczynski P (2003) Stromatoporoid morphology in the Devonian of the Holy Cross Mountains, Poland, and its paleoenvironmental significance. Acta Geol Pol 53:19–27
Łuczynski P (2005) Improving the parameterization of stromato-poroid shapes–a detailed approach to stromatoporoid morphom-etry. Lethaia 38:143–154
Precht WF (1988) Lower Devonian Reefs of the Coeymans Formation in the northern Appalachian Basin. In: Geldsetzer HHJ, James NP, Tebbutt GE (eds) Reefs, Canada and Adjacent Areas. Cana-dian Society of Petroleum Geologists Memoir 13:514–519
Racki G, Sobstel M (2004) Very large stromatoporoid indicating Early Frasnian reef core. Geol Q 48:83–88
Riding R (2002) Structure and composition of organic reefs and carbon-ate mud mounds: concepts and categories. Earth Sci Rev 58:163–231
Saltzman MR (2002) Carbon isotope (δ13C) stratigraphy across the Silurian–Devonian transition in North America: evidence for a perturbation of the global carbon cycle. Palaeogeogr Palaeocli-matol Palaeoecol 187:83–100
Shaver RH (1991) A history of study of Silurian reefs in the Michi-gan Basin environs. Catacosinos PA, Daniels PA Jr (eds) Early sedimentary evolution of the Michigan Basin. Geol Soc Am Spec Pap 256:101–138
Smith GP (1985) The distribution and significance of Lower Devo-nian carbonate buildups in time and space. B Can Petrol Geol 33:479–482
Smosna RA (1984) Diagenesis of a stromatoporoid patch reef. J Sedi-ment Petrol 54:1000–1011
Smosna RA, Warshauer SM (1979) A very Early Devonian patch reef and its ecological setting. J Paleontol 53:142–152
St. Jean J (1971) Paleobiologic considerations of reef stromatoporo-ids. Proceedings of the North American Paleontology Conven-tion, Lawrence, Kansas, 2:1389–1429
Stearn CW (1982) The shapes of Paleozoic and modern reef-builders: a critical review. Paleobiology 8:228–241
Stock CW, Holmes AE (1986) Upper Silurian/Lower Devonian Stro-matoporoidea from the Keyser Formation at Mustoe, Highland County, west-central Virginia. J Paleontol 60:555–580
Whitaker ST (1988) Ramp-platform model for Silurian pinnacle reef distribution in the Illinois basin. Oil Gas J 86:102–108
Wilson JL (1975) Carbonate facies in geologic history. Springer, New York
Woodward HP (1941) Silurian System of West Virginia. West Virginia Geological Survey XIV
Woodward HP (1943) Devonian System of West Virginia: West Vir-ginia Geological Survey XV