spring nutrition technical brief - JSI
12
This document is part of a series of research briefs produced by USAID’s Strengthening Partnerships, Results, and Innovations in Nutrition Globally (SPRING) project that use secondary analysis of Demographic and Health Survey data to determine barriers to distribution and consumption of iron–folic acid (IFA) through antenatal care systems in a range of countries. This brief describes key characteristics of and barriers to successful IFA supplementation in Tanzania. SPRING NUTRITION TECHNICAL BRIEF SEPTEMBER 2014 A RAPID INITIAL ASSESSMENT OF THE DISTRIBUTION AND CONSUMPTION OF IRON–FOLIC ACID TABLETS THROUGH ANTENATAL CARE IN TANZANIA
-
Upload
khangminh22 -
Category
Documents
-
view
3 -
download
0
Transcript of spring nutrition technical brief - JSI
This document is part of a series of research briefs produced by USAID’s Strengthening Partnerships, Results, and Innovations in Nutrition Globally (SPRING) project that use secondary analysis of Demographic and Health Survey data to determine barriers to distribution and consumption of iron–folic acid (IFA) through antenatal care systems in a range of countries. This brief describes key characteristics of and barriers to successful IFA supplementation in Tanzania.
SPRING NUTRITION TECHNICAL BRIEF
SEPTEMBER 2014
A RAPID INITIAL ASSESSMENT OF THE DISTRIBUTION AND CONSUMPTION OF IRON–FOLIC ACID TABLETS THROUGH ANTENATAL CARE IN TANZANIA
2 SPRING NUTRITION TECHNICAL BRIEF SERIES
ABOUT SPRINGThe Strengthening Partnerships, Results, and Innovations in Nutrition Globally (SPRING) project is a five-year USAID-funded Cooperative
Agreement to strengthen global and country efforts to scale up high-impact nutrition practices and policies and improve maternal and
child nutrition outcomes. The project is managed by JSI Research & Training Institute, Inc., with partners Helen Keller International,
The Manoff Group, Save the Children, and the International Food Policy Research Institute. SPRING provides state-of-the-art technical
support and focuses on the prevention of stunting and maternal and child anemia in the first 1,000 days.
RECOMMENDED CITATIONFiedler, Jack, D’Agostino, Alexis, and Sununtnasuk, Celeste. 2014. Nutrition Technical Brief: A Rapid Initial Assessment of the Distribution and
Consumption of Iron–Folic Acid Tablets through Antenatal Care in Tanzania. Arlington, VA: USAID/Strengthening Partnerships, Results and
Innovations in Nutrition Globally (SPRING) Project.
DISCLAIMERThis report is made possible by the generous support of the American people through the U.S. Agency for International Development
(USAID) under the terms of the Cooperative Agreement AID-OAA-A-11-00031 (SPRING), managed by JSI Research & Training
Institute, Inc. (JSI). The contents are the responsibility of JSI, and do not necessarily reflect the views of USAID or the U.S. Government.
SPRINGJSI Research & Training Institute, Inc.1616 Fort Myer Drive, 16th FloorArlington, VA 22209 USAPhone: 703-528-7474Fax: 703-528-7480Email: [email protected]: www.spring-nutrition.org
A RAPID INITIAL ASSESSMENT OF THE DISTRIBUTION AND CONSUMPTION OF IFA TABLETS THROUGH ANC IN TANZANIA 3
OVERVIEW OF THE GLOBAL ANEMIA PROBLEM, INCLUDING IRON DEFICIENCY ANEMIA
The World Health Organization (WHO) defines anemia among women of childbearing age as the condition of having a hemoglobin concentration of <12.0 g/dL at sea level; among pregnant women it is defined as <11.0 g/dL. The hemoglobin concentration cutoff level that defines anemia varies by age, gender, physiological status, smoking status, and the altitude at which the assessed population lives.
The primary cause of anemia is iron deficiency, a condition caused by inadequate intake or low absorption of iron, the increased demands of repeated pregnancies—particularly if not well spaced (e.g., fewer than 36 months between pregnancies)—and loss of iron through menstruation. Other causes of anemia include vitamin deficiencies (such as a deficiency of folic acid or vitamin A), genetic disorders, malaria, parasitic infections, HIV, tuberculosis, common infections, and other inflammatory conditions. While iron deficiency anemia (IDA) accounts for about one-half of all anemia cases, it often coexists with these other causes.
Iron deficiency anemia is most common during pregnancy and in infancy, when physiological iron requirements are the highest and the amount of iron absorbed from the diet is not sufficient to meet many individuals’ requirements (Stoltzfus and Dreyfuss 1998). Anemia’s effects include increased risk of premature delivery, maternal and child mortality, negative impacts on the cognitive and physical development of children, and reduced physical stamina and productivity of people of all ages (Horton and Ross 2003). Globally, IDA annually contributes to over 100,000 (22 percent of all maternal deaths) of all maternal deaths and over 600,000 perinatal deaths (Stoltzfus, Mullany, and Black 2004). Key anemia control interventions include promoting a diversified diet, iron-folic acid (IFA) supplementation during pregnancy, iron fortification of staple foods, prevention and treatment of malaria, use of insecticide-treated bed nets, helminth prevention and control, delayed cord clamping, and increased birth spacing.
MATERNAL ANEMIA IN TANZANIA
The prevalence of anemia among pregnant women in Tanzania is 23 percent, making it a moderate public health problem as defined by WHO standards1 (NBS and ICF Macro 2011). Regarding anemia severity, the majority of cases among pregnant and breastfeeding or non-pregnant women reported in the 2010 Tanzania Demographic and Health Survey (TDHS) are classified as mild or moderate.2 Only 1.8 percent of anemia cases in pregnant women and roughly one percent in breastfeeding and non-pregnant women are diagnosed as severe. Between 2005 and 2010, the prevalence of anemia fell to 53 percent (from 58 percent), 39 percent (from 48 percent), and 39 percent (from 47 percent) among pregnant, breastfeeding, and nonpregnant women, respectively (NBS 2011 and ORC Macro 2005).
FALTER POINTS IN WOMEN’S CONSUMPTION OF IRON–FOLIC ACID DURING PREGNANCY
WHO recommends that all pregnant women receive a standard dose of 30–60 mg iron and 400 µg folic acid beginning as soon as possible during gestation (WHO 2012a). Ideally, women should receive iron-containing supplements no later than the first trimester of pregnancy, which means ideally taking 180 tablets before delivery. It is important to note, that many countries aim for women to receive 90 or more tablets during pregnancy.
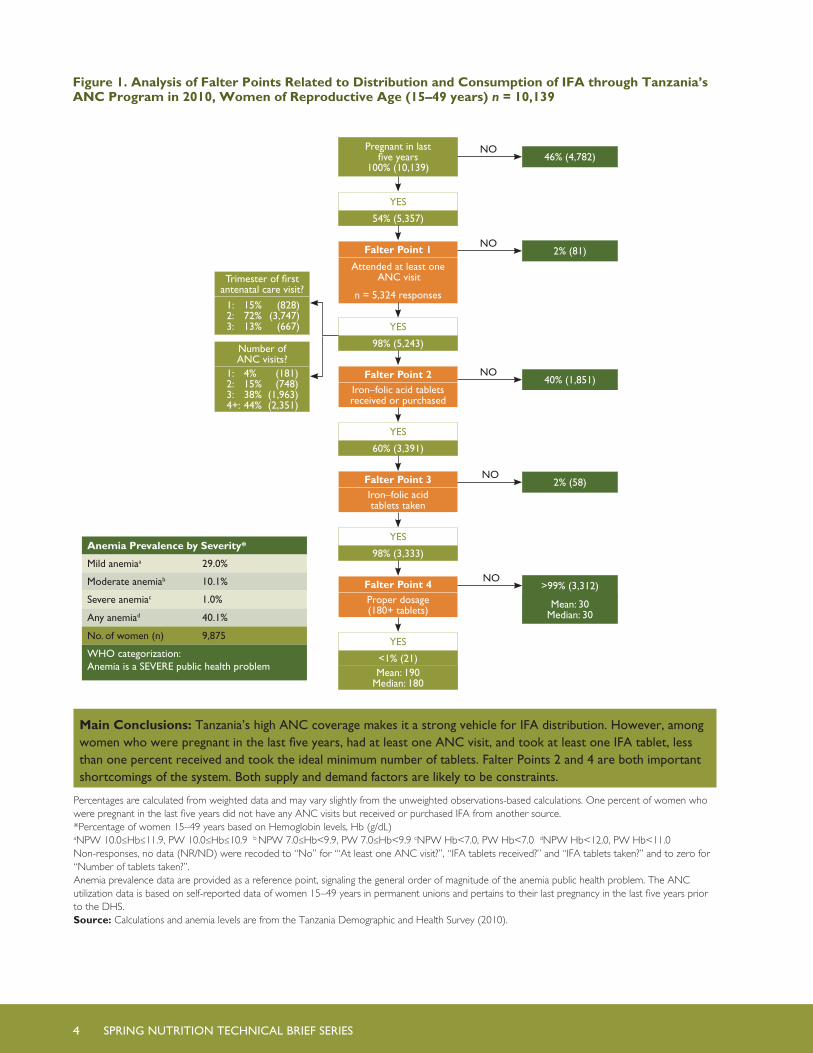
Figure 1 on the following page shows a decision-tree analysis of how well the Tanzanian antenatal care (ANC) system distributes IFA, and identifies four potential points at which the system might falter (highlighted in orange). The figure tracks the number and percentage of women who obtained ANC, those who subsequently received and consumed at least one IFA tablet, and those who consumed the ideal
1The WHO categorizes the severity of anemia as a public health problem according to its prevalence: <5%, no public health problem; 5–19.9%, mild; 20–39.9% moderate; ≥40%, severe.2The DHS hemoglobin levels used to diagnose the severity of anemia in non-pregnant women are different than those specified by the WHO. The DHS cutoffs for pregnant and non-pregnant women in hemoglobin grams/deciliter are: Mild 10.0-10.9 (P) 10.0-11.9 (NP); Moderate 7.0-9.9 (P) 7.0-9.9 (NP); Severe <7.0 (P) <7.0 (NP); Any <11.0 (P) <12.0 (NP).
4 SPRING NUTRITION TECHNICAL BRIEF SERIES
Figure 1. Analysis of Falter Points Related to Distribution and Consumption of IFA through Tanzania’s ANC Program in 2010, Women of Reproductive Age (15–49 years) n = 10,139
Main Conclusions: Tanzania’s high ANC coverage makes it a strong vehicle for IFA distribution. However, among women who were pregnant in the last five years, had at least one ANC visit, and took at least one IFA tablet, less than one percent received and took the ideal minimum number of tablets. Falter Points 2 and 4 are both important shortcomings of the system. Both supply and demand factors are likely to be constraints.
Anemia Prevalence by Severity*
Mild anemiaa 29.0%
Moderate anemiab 10.1%
Severe anemiac 1.0%
Any anemiad 40.1%
No. of women (n) 9,875
WHO categorization: Anemia is a SEVERE public health problem
Percentages are calculated from weighted data and may vary slightly from the unweighted observations-based calculations. One percent of women who were pregnant in the last five years did not have any ANC visits but received or purchased IFA from another source.*Percentage of women 15–49 years based on Hemoglobin levels, Hb (g/dL)aNPW 10.0≤Hb≤11.9, PW 10.0≤Hb≤10.9 b NPW 7.0≤Hb<9.9, PW 7.0≤Hb<9.9 cNPW Hb<7.0, PW Hb<7.0 dNPW Hb<12.0, PW Hb<11.0Non-responses, no data (NR/ND) were recoded to “No” for ‘“At least one ANC visit?”, “IFA tablets received?” and “IFA tablets taken?” and to zero for “Number of tablets taken?”. Anemia prevalence data are provided as a reference point, signaling the general order of magnitude of the anemia public health problem. The ANC utilization data is based on self-reported data of women 15–49 years in permanent unions and pertains to their last pregnancy in the last five years prior to the DHS. Source: Calculations and anemia levels are from the Tanzania Demographic and Health Survey (2010).
Pregnant in last five years
100% (10,139)
NO46% (4,782)
YES
54% (5,357)
Trimester of first antenatal care visit?
1: 15% (828) 2: 72% (3,747) 3: 13% (667)
Number of ANC visits?
1: 4% (181) 2: 15% (748) 3: 38% (1,963) 4+: 44% (2,351)
Attended at least one ANC visit
n = 5,324 responses
Falter Point 1NO
2% (81)
YES
98% (5,243)
Iron–folic acid tablets received or purchased
Falter Point 2 NO40% (1,851)
YES
60% (3,391)
Iron–folic acid tablets taken
Falter Point 3 NO2% (58)
YES
98% (3,333)
Proper dosage (180+ tablets)
Falter Point 4NO
>99% (3,312)
YES
<1% (21)
Mean: 30Median: 30
Mean: 190Median: 180

A RAPID INITIAL ASSESSMENT OF THE DISTRIBUTION AND CONSUMPTION OF IFA TABLETS THROUGH ANC IN TANZANIA 5
minimum number of tablets.3 All data are based on TDHS questions that were asked of women who were in a permanent union and had been pregnant in the five years prior to being interviewed4 (NBS and ICF Macro 2011).
Many supply-side aspects—including both adequacy of IFA tablet supplies and technical knowledge and practices of ANC providers—need to be considered when assessing how well an ANC program delivers IFA. In addition, Falter Point 4 in Figure 1 clearly shows that the provision of IFA tablets to a pregnant woman is a necessary but not sufficient condition for the woman to consume the tablets, particularly at the ideal minimum. Thus, demand-side factors also play a critical role in determining the coverage and effectiveness of this program. These include whether or not women seek antenatal care and the timing and number of visits, as well as the extent to which women are aware of the significance of anemia and IFA, ask for IFA tablets, and comply with the IFA regimen.
Understanding the relative significance of each falter point enables them to be prioritized for more in-depth analysis, providing a first step in an evidence-based approach to systematically improving the program. The DHS does not collect information on the number of IFA tablets received by women. In the case of Falter Point 4, this lack of data creates ambiguities that make it impossible to fully understand whether shortcomings of the system relate primarily to supply- or to demand-side factors. Despite this limitation, the decision-tree analysis presented in Figure 1 still enables prioritizing the falter points for more in-depth analysis and action at the national, district, and health center levels.
ANALYSIS OF FALTER POINTS
FALTER POINT 1:Did not attend at least one ANC visitOnly two percent of women did not obtain at least one ANC visit.
3The TDHS asked about IFA tablets or capsules; this brief refers to all types as “tablets.”4The TDHS provides a population-based, nationally representative sample of all women in Tanzania.
ANC’s high coverage provides outstanding potential as a platform for achieving high IFA coverage among pregnant women.
FALTER POINT 2: Did not receive or purchase at least one IFA tablet Of the women with at least one ANC visit, 40 percent of women did not receive or purchase any IFA.
This supply-side constraint is relatively large and may be due to various system/supply-side performance shortcomings which could reflect: (1) Inadequate supply (e.g., stockouts); (2) Provider knowledge; (3) Provider practices that would lead to failure to provide IFA. This is the second most important falter point among all pregnant women in Tanzania.
Unfortunately, the TDHS does not report the source(s) of the IFA tablets women received or purchased, and there is a small percentage of women attending ANC who get IFA tablets from a different source. While less than one percent of Tanzanian women who received or purchased IFA did not have any ANC visits (not shown), we cannot ascertain whether or not those who received ANC care obtained their IFA from their ANC provider. It is likely, however, that women who attend ANC are more likely to be aware of, to value and to be inclined to also take IFA, regardless of where they obtain them. Thus we would expect there to be a high correlation between the number of women who had at least one ANC visit and those who received or purchased IFA, which is consistent with the data. Women who have one or more ANC visits and who did not receive any IFA, constitute a missed opportunity to reduce the risk of anemia among a high-risk population.
FALTER POINT 3:Did not take at least one IFA tablet Of the women who received IFA, two percent did not consume any tablets.
This demand-side constraint is small and may be due to women not understanding the significance of anemia and/or the significance of IFA. This misunderstanding may reflect: (1) inadequate provider counseling and follow-up; (2) women’s beliefs about actual or possible side-effects; or (3) sociocultural factors.
6 SPRING NUTRITION TECHNICAL BRIEF SERIES
FALTER POINT 4: Did not consume 180 or more IFA tablets Of the women who received and took IFA, more than 99 percent did not consume the ideal minimum of 180 IFA tablets.
This is a combination of supply and/or demand-side factors. Figure 1 sheds some light on two possible causes of this falter point: 85 percent of women who received ANC began their care after the first trimester, and the 57 percent of women who had less than WHO’s recommended four ANC visits during their last pregnancy may have started their ANC too late or may not have had enough visits to receive 180 tablets (given IFA distribution protocols). Both of these are likely contributing factors, but further research is needed to establish their relative importance, as well as the significance of other possible causes.
Globally, research has found that other common causes of Falter Point 4 include: (1) providers do not have access to adequate supply; (2) women do not receive adequate tablets because they have little access to care, start ANC late, or do not have enough ANC visits making it difficult to obtain 180 tablets (given IFA distribution protocols); (3) providers do not provide adequate counseling or follow-up; (4) women do not adhere to the regimen, which may be due to difficulty in remembering to
take the tablets daily, not knowing all the tablets are necessary, fear of having a big baby, side effects, or tablet-related issues (taste, size, color, coating, packaging/storage problem). Further research is needed to determine the specific reasons for this falter point in Tanzania.
ANALYSIS BY SOCIODEMOGRAPHIC VARIABLES AND TRENDS OVER TIME
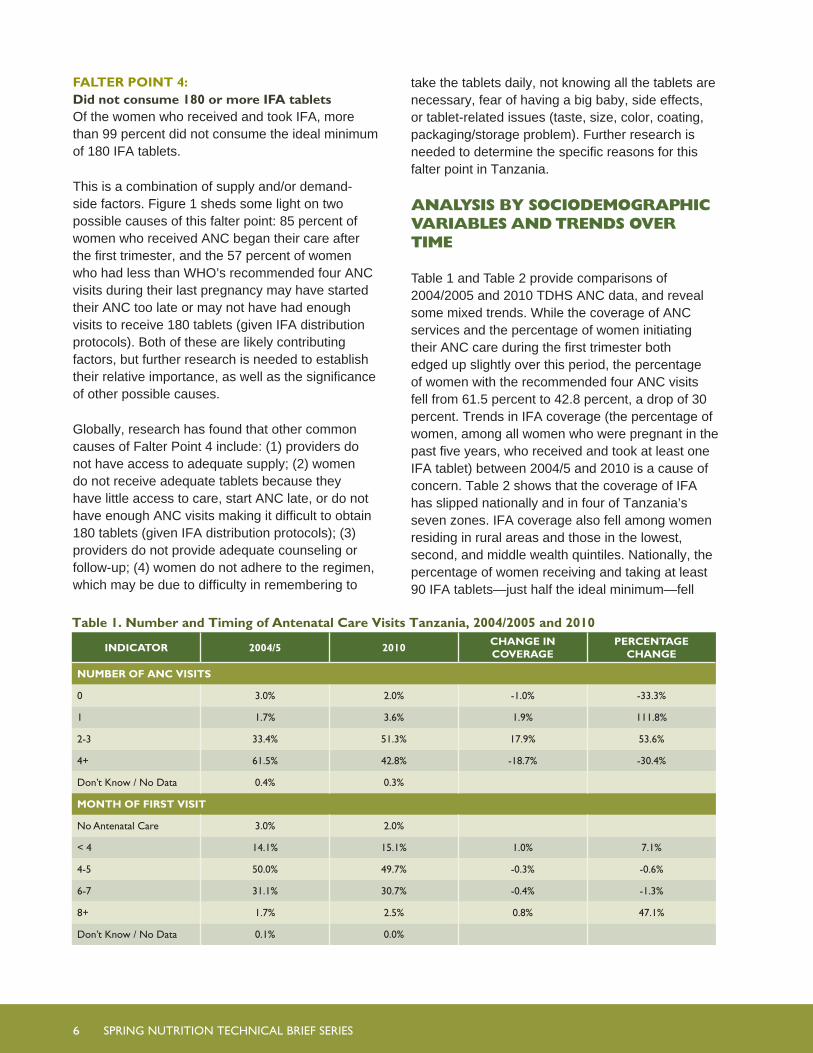
Table 1 and Table 2 provide comparisons of 2004/2005 and 2010 TDHS ANC data, and reveal some mixed trends. While the coverage of ANC services and the percentage of women initiating their ANC care during the first trimester both edged up slightly over this period, the percentage of women with the recommended four ANC visits fell from 61.5 percent to 42.8 percent, a drop of 30 percent. Trends in IFA coverage (the percentage of women, among all women who were pregnant in the past five years, who received and took at least one IFA tablet) between 2004/5 and 2010 is a cause of concern. Table 2 shows that the coverage of IFA has slipped nationally and in four of Tanzania’s seven zones. IFA coverage also fell among women residing in rural areas and those in the lowest, second, and middle wealth quintiles. Nationally, the percentage of women receiving and taking at least 90 IFA tablets—just half the ideal minimum—fell
Table 1. Number and Timing of Antenatal Care Visits Tanzania, 2004/2005 and 2010
INDICATOR 2004/5 2010CHANGE IN COVERAGE
PERCENTAGE CHANGE
NUMBER OF ANC VISITS
0 3.0% 2.0% -1.0% -33.3%
1 1.7% 3.6% 1.9% 111.8%
2-3 33.4% 51.3% 17.9% 53.6%
4+ 61.5% 42.8% -18.7% -30.4%
Don’t Know / No Data 0.4% 0.3%
MONTH OF FIRST VISIT
No Antenatal Care 3.0% 2.0%
< 4 14.1% 15.1% 1.0% 7.1%
4-5 50.0% 49.7% -0.3% -0.6%
6-7 31.1% 30.7% -0.4% -1.3%
8+ 1.7% 2.5% 0.8% 47.1%
Don’t Know / No Data 0.1% 0.0%
A RAPID INITIAL ASSESSMENT OF THE DISTRIBUTION AND CONSUMPTION OF IFA TABLETS THROUGH ANC IN TANZANIA 7
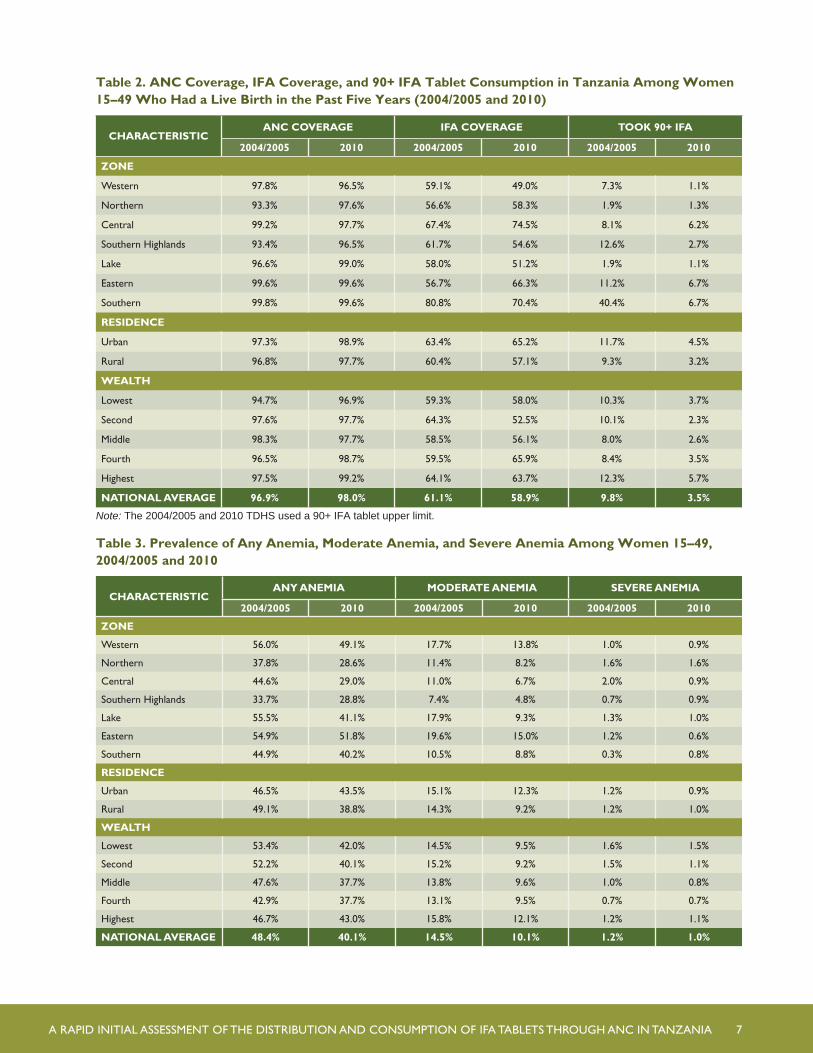
Table 2. ANC Coverage, IFA Coverage, and 90+ IFA Tablet Consumption in Tanzania Among Women 15–49 Who Had a Live Birth in the Past Five Years (2004/2005 and 2010)
CHARACTERISTICANC COVERAGE IFA COVERAGE TOOK 90+ IFA
2004/2005 2010 2004/2005 2010 2004/2005 2010
ZONE
Western 97.8% 96.5% 59.1% 49.0% 7.3% 1.1%
Northern 93.3% 97.6% 56.6% 58.3% 1.9% 1.3%
Central 99.2% 97.7% 67.4% 74.5% 8.1% 6.2%
Southern Highlands 93.4% 96.5% 61.7% 54.6% 12.6% 2.7%
Lake 96.6% 99.0% 58.0% 51.2% 1.9% 1.1%
Eastern 99.6% 99.6% 56.7% 66.3% 11.2% 6.7%
Southern 99.8% 99.6% 80.8% 70.4% 40.4% 6.7%
RESIDENCE
Urban 97.3% 98.9% 63.4% 65.2% 11.7% 4.5%
Rural 96.8% 97.7% 60.4% 57.1% 9.3% 3.2%
WEALTH
Lowest 94.7% 96.9% 59.3% 58.0% 10.3% 3.7%
Second 97.6% 97.7% 64.3% 52.5% 10.1% 2.3%
Middle 98.3% 97.7% 58.5% 56.1% 8.0% 2.6%
Fourth 96.5% 98.7% 59.5% 65.9% 8.4% 3.5%
Highest 97.5% 99.2% 64.1% 63.7% 12.3% 5.7%
NATIONAL AVERAGE 96.9% 98.0% 61.1% 58.9% 9.8% 3.5%
Note: The 2004/2005 and 2010 TDHS used a 90+ IFA tablet upper limit.
Table 3. Prevalence of Any Anemia, Moderate Anemia, and Severe Anemia Among Women 15–49, 2004/2005 and 2010
CHARACTERISTICANY ANEMIA MODERATE ANEMIA SEVERE ANEMIA
2004/2005 2010 2004/2005 2010 2004/2005 2010
ZONE
Western 56.0% 49.1% 17.7% 13.8% 1.0% 0.9%
Northern 37.8% 28.6% 11.4% 8.2% 1.6% 1.6%
Central 44.6% 29.0% 11.0% 6.7% 2.0% 0.9%
Southern Highlands 33.7% 28.8% 7.4% 4.8% 0.7% 0.9%
Lake 55.5% 41.1% 17.9% 9.3% 1.3% 1.0%
Eastern 54.9% 51.8% 19.6% 15.0% 1.2% 0.6%
Southern 44.9% 40.2% 10.5% 8.8% 0.3% 0.8%
RESIDENCE
Urban 46.5% 43.5% 15.1% 12.3% 1.2% 0.9%
Rural 49.1% 38.8% 14.3% 9.2% 1.2% 1.0%
WEALTH
Lowest 53.4% 42.0% 14.5% 9.5% 1.6% 1.5%
Second 52.2% 40.1% 15.2% 9.2% 1.5% 1.1%
Middle 47.6% 37.7% 13.8% 9.6% 1.0% 0.8%
Fourth 42.9% 37.7% 13.1% 9.5% 0.7% 0.7%
Highest 46.7% 43.0% 15.8% 12.1% 1.2% 1.1%
NATIONAL AVERAGE 48.4% 40.1% 14.5% 10.1% 1.2% 1.0%
8 SPRING NUTRITION TECHNICAL BRIEF SERIES
sharply by nearly two-thirds. Marked decreases in the percentage of women consuming 90 or more IFA tablets occurred in all zones and wealth quintiles, and among women residing in urban and rural areas.
Table 3 shows the prevalence of anemia among Tanzanian women 15–49 years old in 2004/5 and 2010, nationwide and by zone, residence, and wealth. From 2004/2005 to 2010, the prevalence of anemia in Tanzania fell from 48.4 percent to 40.1 percent. While prevalence is high throughout the country, there is significant variation by zone. In 2004/2005, two zones—Northern and Southern Highlands—had rates that categorized their anemia prevalence as a moderate public health problem as defined by WHO criterion; in the remaining five zones, it was a severe public health problem. The largest reductions in prevalence rates over the five year period were in the Northern, Central and Lake zones. The 35 percent reduction in Central zone resulted in its anemia prevalence being recategorized as a moderate public health problem in 2010. Central was the only zone where the severity of the anemia public health problem changed. It is noteworthy that the declines in anemia prevalence among the lowest 40 percent in wealth of households were much larger than the reduction in rates in the highest 40 percent. In addition, progress was more pronounced in rural than urban areas, where they declined by 34 percent and 19 percent, respectively. Nationally, moderate and severe anemia rates also fell by 4.4 and 0.2 percentage points, respectively. A disproportionate amount of the reduction in anemia between 2004/2005 and 2010 was due to reductions in moderate anemia. While the prevalence of any anemia (mild, moderate, and severe) fell by roughly eight percentage points, or 17 percent, moderate anemia fell by 30 percent; nearly twice as fast. The size and proportion of the reductions varied by zone, but were realized throughout the country.
ANALYSIS BY GEOGRAPHIC REGION
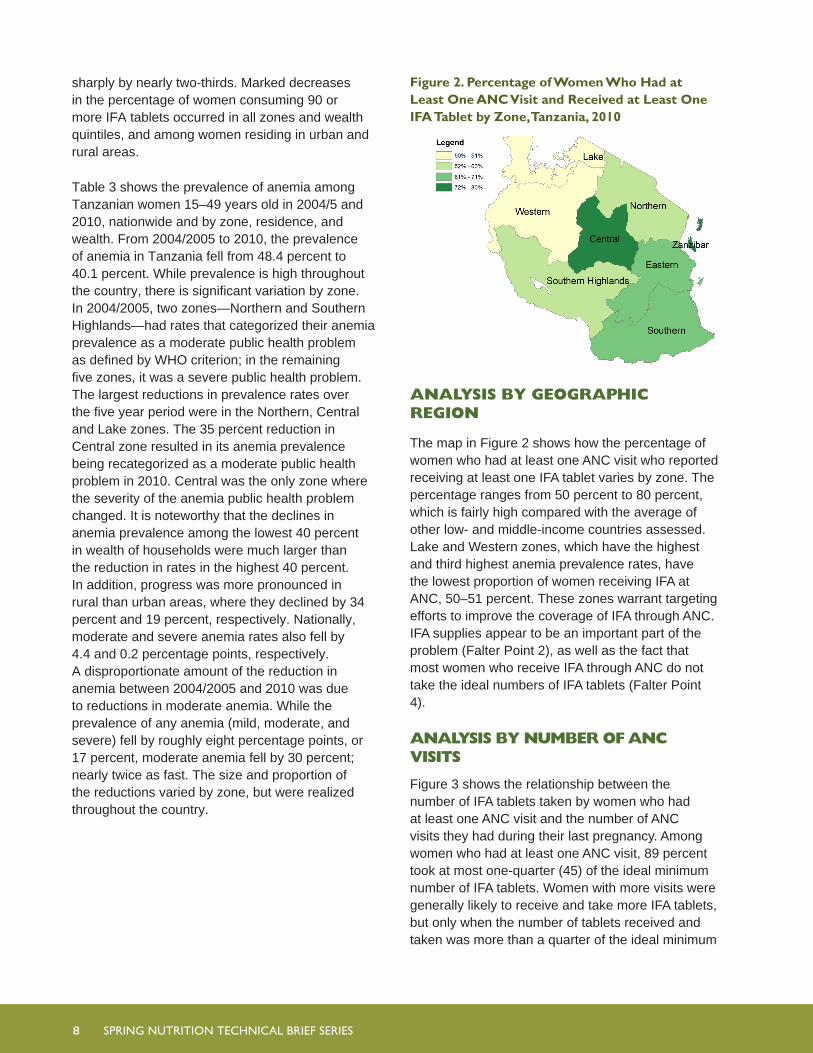
The map in Figure 2 shows how the percentage of women who had at least one ANC visit who reported receiving at least one IFA tablet varies by zone. The percentage ranges from 50 percent to 80 percent, which is fairly high compared with the average of other low- and middle-income countries assessed. Lake and Western zones, which have the highest and third highest anemia prevalence rates, have the lowest proportion of women receiving IFA at ANC, 50–51 percent. These zones warrant targeting efforts to improve the coverage of IFA through ANC. IFA supplies appear to be an important part of the problem (Falter Point 2), as well as the fact that most women who receive IFA through ANC do not take the ideal numbers of IFA tablets (Falter Point 4).
ANALYSIS BY NUMBER OF ANC VISITS
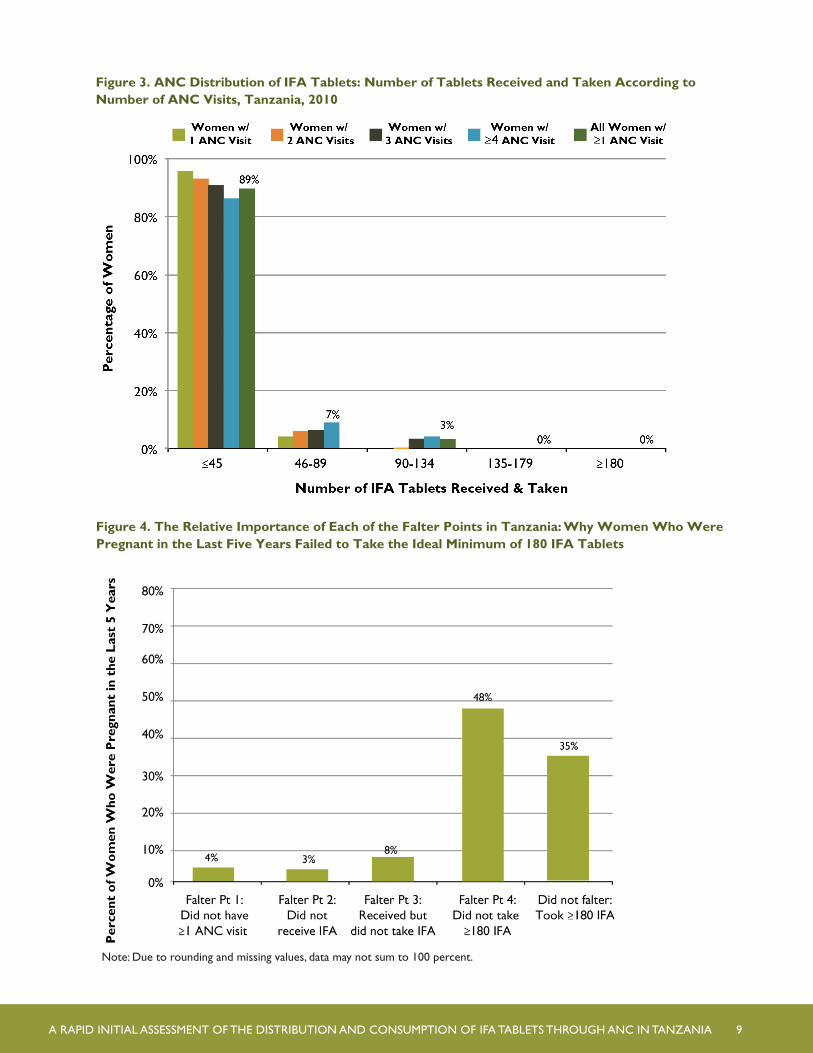
Figure 3 shows the relationship between the number of IFA tablets taken by women who had at least one ANC visit and the number of ANC visits they had during their last pregnancy. Among women who had at least one ANC visit, 89 percent took at most one-quarter (45) of the ideal minimum number of IFA tablets. Women with more visits were generally likely to receive and take more IFA tablets, but only when the number of tablets received and taken was more than a quarter of the ideal minimum
Figure 2. Percentage of Women Who Had at Least One ANC Visit and Received at Least One IFA Tablet by Zone, Tanzania, 2010
A RAPID INITIAL ASSESSMENT OF THE DISTRIBUTION AND CONSUMPTION OF IFA TABLETS THROUGH ANC IN TANZANIA 9
Note: Due to rounding and missing values, data may not sum to 100 percent.
Figure 3. ANC Distribution of IFA Tablets: Number of Tablets Received and Taken According to Number of ANC Visits, Tanzania, 2010
Figure 4. The Relative Importance of Each of the Falter Points in Tanzania: Why Women Who Were Pregnant in the Last Five Years Failed to Take the Ideal Minimum of 180 IFA Tablets
10 SPRING NUTRITION TECHNICAL BRIEF SERIES
amount. Even among those women who received IFA tablets and had four or more ANC visits, 87 percent took at most only 45 tablets. Moreover, less than one percent of women surveyed got more than 134 IFA tablets.
OVERALL CONCLUSIONS AND RECOMMENDATIONS
Figure 4 presents the obstacles among all women, including those who did not receive ANC during their pregnancy, to taking the ideal minimum number of IFA tablets. In Tanzania, Falter Point 4 is the greatest barrier. Improving the delivery of IFA supplementation in Tanzania will require identifying and addressing program gaps in IFA supply management and health workers’ practices (to improve performance at Falter Points 2 and 4). Modifying some women’s long term adherence behaviors (i.e., addressing Falter Point 4), and addressing other points mentioned earlier under “Analysis of Falter Points”, may result in more women taking a minimum of 180 tablets.
Tanzania has made notable progress in steadily reducing its maternal mortality rate; from 610 maternal deaths per 100,000 live births in 2005 to 460 in 2010 (WHO 2012), a reduction of 25 percent, but it looks unlikely that it will achieve its fifth Millennium Development Goal (MDG 5) target of reducing the MMR to 147 or less. To accelerate its progress toward achieving that goal and to further reduce anemia, Tanzania needs to reverse the slow deterioration that has occurred throughout much of the country in the distribution of IFA through ANC services.
This rapid assessment of the distribution of IFA tablets through ANC in Tanzania suggests that there is substantial room for improvement in both the supply- and demand sides of the program. Tanzania will need to undertake formative research to better understand the specific causes of the trends and shortcomings manifested by the falter points noted above, which will be essential to developing a strategy to address them as expeditiously as possible. Improving the distribution of IFA through the ANC program is an important strategy to prevent and control anemia in Tanzania, and to improve the nutrition and health status, as well as the mental and physical capacity of women of reproductive age.
A RAPID INITIAL ASSESSMENT OF THE DISTRIBUTION AND CONSUMPTION OF IFA TABLETS THROUGH ANC IN TANZANIA 11
REFERENCES
Galloway, Rae. 2003. Anemia Prevention and Control: What Works. Washington, DC: USAID.
Horton, Sue and Jay Ross. 2003. “The Economics of Iron Deficiency.” Food Policy 28(1):51-75.
National Bureau of Statistics (NBS) [Tanzania] and ORC Macro. 2005. Tanzania Demographic and Health Survey 2004-05. Dar es
Salaam, Tanzania: NBS and ORC Macro.
NBS [Tanzania] and ICF Macro. 2011. Tanzania Demographic and Health Survey 2010. Dar es Salaam, Tanzania: NBS and ICF Macro.
Stoltzfus, Rebecca J., and Michele L. Dreyfuss. 1998. Guidelines for the use of Iron Supplements to Prevent and Treat Iron Deficiency Anemia. Washington DC: ILSI Press.
Stoltzfus, Rebecca J., Luke Mullany, and Robert E. Black. 2004. “Iron Deficiency Anemia.” In Comparative Quantification of Health Risks: Global and Regional Burden of Disease Attributable to Selected Major Risk Factors, edited by Majid Ezzati, Alan D. Lopez, Anthony
Rodgers, and Christopher J. L. Murray, 163-209. Geneva, Switzerland: World Health Organization.
World Health Organization (WHO). 2012a. “Guideline: Daily Iron and Folic Acid Supplementation in Pregnant Women.” Geneva: WHO.
WHO. 2012b. Indicator and Measurement Registry version 1.6.0. Maternity mortality rate. http://apps.who.int/gho/indicatorregistry/
App_Main/view_indicator.aspx?iid=26. [August 28, 2012].
12 SPRING NUTRITION TECHNICAL BRIEF SERIES