Essential Newborn Care Corps - JSI
53
1 Essential Newborn Care Corps Baseline Results Sophia Magalona Savitha Subramanian JSI Research & Training Institute, Inc. July 2014
-
Upload
khangminh22 -
Category
Documents
-
view
4 -
download
0
Transcript of Essential Newborn Care Corps - JSI

1
Essential Newborn Care Corps Baseline Results
Sophia Magalona Savitha Subramanian JSI Research & Training Institute, Inc. July 2014

2

3
Table of Content
List of Figures............................................................................................................................... 5
List of Tables ................................................................................................................................ 5
Acronyms and Abbreviations .......................................................................................................... 7
Executive Summary ........................................................................................................................ 8
Introduction .................................................................................................................................. 10
Research Questions ................................................................................................................... 11
Conceptual Framework ............................................................................................................. 12
Methodology ................................................................................................................................. 13
Study Design .............................................................................................................................. 13
Sample design ........................................................................................................................... 16
Data collection tools .................................................................................................................. 16
Data collection platform ........................................................................................................... 18
Training of field staff ................................................................................................................. 18
Data collection........................................................................................................................... 18
Data processing ......................................................................................................................... 18
Data analysis .............................................................................................................................. 18
Limitations ................................................................................................................................. 19
Results ........................................................................................................................................... 19
1. Household wealth and transportation .................................................................................. 20
2. Characteristics of survey respondents .................................................................................. 22
3. Knowledge and perceptions in key MNCH topics ................................................................. 23
3.1 Knowledge of serious health problems during pregnancy, delivery, and postpartum ... 23
3.2 Birth preparedness knowledge........................................................................................ 27
4. Birth preparedness behaviors ............................................................................................... 29

4
5. Pregnancy outcomes ............................................................................................................. 31
5.1 Antenatal care visits ........................................................................................................ 31
5.2 Antenatal care services .................................................................................................... 32
5.3 Pregnancy complications ................................................................................................. 35
6. Labor and delivery outcomes ................................................................................................ 36
6.1 Facility births and skilled birth attendance ..................................................................... 36
6.2 Labor and delivery complications .................................................................................... 38
7. Postnatal care outcomes ....................................................................................................... 39
7.1 Postnatal care visits for mother’s health ......................................................................... 39
Maternal complications six weeks after delivery .................................................................. 40
7.2 Postnatal care visits for baby’s health ............................................................................. 41
Immediate newborn care ...................................................................................................... 43
Immunizations ....................................................................................................................... 44
Newborn complications six weeks after delivery .................................................................. 45
8. TBA service provision ............................................................................................................ 46
8.1 Pregnancy care ................................................................................................................ 46
8.2 Postnatal care .................................................................................................................. 48
9. Decision-making .................................................................................................................... 49
Conclusion and Programmatic Implications ................................................................................. 50
References .................................................................................................................................... 53

5
List of Figures
Figure 1. Theory of Change ........................................................................................................... 12
Figure 2. Characteristics of the three study groups in Bo District ................................................ 15
Figure 3. Number of households, number of interviews, and numbers included in analysis ...... 20
List of Tables
Table 1. Percent distribution of wealth quintiles and select household variables included in wealth index calculation, by study arm ........................................................................................ 21
Table 2. Percent distribution of transportation characteristics by study arm* .......................... 22
Table 3. Percent Distribution of women ages 15-49 by selected background characteristics .... 22
Table 4. Percent distribution of women who named health problems that can occur during pregnancy and believe these problems can be fatal, by group .................................................... 25
Table 5. Percent distribution of women who named serious health problems that can occur during labor and delivery and believe these problems can be fatal, by group ............................ 25
Table 6. Percent distribution of women who named serious health problems that can occur immediately postpartum and to newborns and believe these problems can be fatal, by group 26
Table 7. Percent distribution of MNCH knowledge by currently pregnant women and women who have had a live birth in the past 12 months who accept advice by TBAs, by study arm...... 27
Table 8. Percent distribution of MNCH behaviors by currently pregnant women and women who have had a live birth in the past 12 months who accept advice by TBAs, by study arm...... 30
Table 9. Percent distribution of antenatal care behaviors by currently pregnant women and by women who have had a live birth in the past 12 months, by study arm ..................................... 32
Table 10. Percent distribution of danger sign advice for currently pregnant women and by women who have had a live birth in the past 12 months, by study arm ..................................... 33
Table 11. Percent distribution of antenatal services received by currently pregnant women and by women who have had a live birth in the past 12 months, by study arm ................................ 34
Table 12. Percent distribution of iron supplement services for currently pregnant women and women who have had a live birth in the past 12 months, by study arm ..................................... 35
Table 13. Percent distribution of pregnancy complication behaviors by currently pregnant women and women who have had a live birth in the past 12 months, by study arm ................. 36
Table 14. Percent distribution of facility births and skilled birth attendance by currently pregnant women and women who have had a live birth in the past 12 months, by study arm . 37

6
Table 15. Percent distribution of delivery complication behaviors by currently pregnant women and women who have had a live birth in the past 12 months, by study arm .............................. 38
Table 16. Percent distribution of postnatal care visits for mother’s health by currently pregnant women and women who have had a live birth in the past 12 months, by study arm ................ 40
Table 17. Percent distribution of maternal complication behaviors six weeks after delivery by currently pregnant women and women who have had a live birth in the past 12 months, by study arm ...................................................................................................................................... 41
Table 18. Percent distribution of postnatal care visits for baby's health by currently pregnant women and women who have had a live birth in the past 12 months, by study arm ................. 42
Table 19. Percent distribution of immediate newborn care practices by women who have had a live birth in the past 12 months, by study arm ............................................................................. 43
Table 20. Percent distribution of timing of breastfeeding by women who have had a live birth in the past 12 months, by study arm ................................................................................................ 44
Table 21. Percent distribution of postnatal care services received by women who have had a live birth in the past 12 months, by study arm ............................................................................. 45
Table 22. Percent distribution of newborn complication behaviors six weeks after delivery by currently pregnant women and women who have had a live birth in the past 12 months, by study arm ...................................................................................................................................... 45
Table 23. Percent distribution of TBA advice received by currently pregnant women and women who have had a live birth in the past 12 months, by study arm ..................................... 47
Table 24. Percent distribution of TBA referrals received by women who have had a live birth in the past 12 months, by study arm ................................................................................................ 48
Table 25. Percent distribution of women by decision making characteristics by study arm ...... 49

7
Acronyms and Abbreviations
ANC Antenatal care CHO Community Health Officer DHS Demographic and Health Survey EA Enumeration area EMOC Emergency Obstetric Care ENCC Essential Newborn Care Corps FHCI Free Health Care Initiative GoSL Government of Sierra Leone IPT Intermittent Preventive Treatment PNC Postnatal Care PPS Probability proportional to size PHU Primary Health Unit SP Sulphadoxine-pyrimethamine TT Tetanus injection TBA Traditional birth attendant WHO World Health Organization

8
Executive Summary Sierra Leone has one of the highest maternal mortality and neonatal mortality rates in the world with 1033 maternal deaths per 100,000 live births, and 30 stillbirths and 49 neonatal deaths per 1000 births. A contributing factor is poor care at delivery, with less than half of deliveries attended by a skilled birth attendant and one in four carried out in health facilities. Within this context, traditional birth attendants (TBAs) are a potential resource to help Sierra Leone achieve its Millennium Development Goals to reduce child mortality and improve maternal health. TBAs provide health services widely; however, a 2010 policy change disallows TBA-led childbirth, creating challenges in working with this key group of actors in the health system. The Essential Newborn Care Corps (ENCC) pilot of the Innovations for Maternal, Newborn and Child Health (MNCH), an initiative led by Concern Worldwide in collaboration with John Snow, Inc., explores solutions for TBAs’ role in health service delivery.
Piloting the intervention in the resource-poor setting of Bo District, Sierra Leone, the project provides standardized training to TBAs as MNCH health promoters to ensure quality care for pregnant women and newborns and to properly refer complications during home visits while selling health-related products. MNHPs provide a linkage between the community and government health facilities by referring women to the facilities for medical care. Selling products complements the MNHPs’ primary role in referring women to health facilities and the income they earn from sales provides an incentive for them to do so.
The following report outlines the activities and results for the baseline assessment of ENCC. The study design includes two intervention groups and one comparison group across all 14 chiefdoms in Bo District. One intervention group will receive both MNCH Health Promotion training and social enterprise training and support; the second intervention group will receive only MNCH training; the third group will serve as a control group.
The baseline data were comparable to the 2013 and 2008 Sierra Leone DHS estimates. For antenatal care services, more than half (68%) of women across the three groups received or planned to receive the WHO recommended four or more ANC visits. This percentage is higher than the estimate from the 2008 Sierra Leone DHS, where only half (52%) of rural women received at least four ANC visits. Among these women, all received or planned to receive antenatal care from a health professional for both their first (1% from a doctor and 99% from a nurse/CHO/midwife) and last (100% from a nurse/CHO/midwife) ANC visit, which is similar to the estimate from the 2013 Sierra Leone DHS, where almost all (99.5%) women from Bo District received ANC from a skilled provider.
For delivery services, only 76% of women from Bo District in the 2013 Sierra Leone DHS delivered at a health facility; whereas baseline data show that a majority of women (84%) across the three arms delivered or would deliver at a health facility. For postnatal care services, most women (98%) saw or planned to see a nurse/CHO/midwife and a small percentage saw or planned to see a doctor (3%) for postnatal care for their health. These estimates are much higher than the 2008 Sierra Leone DHS estimates, where only 21% of rural women saw a doctor/nurse/midwife for the mother’s first postnatal check-up.
Although results from baseline show that service utilization for antenatal care, labor and delivery, and postpartum care are relatively high and comparable to DHS estimates, the ENCC team identified areas that were low and where the ENCC project could be most influential in

9
improving. ENCC can help increase the knowledge of women and correct misconceptions about pregnancy and preparations for pregnancy. At baseline, most women believed that serious health problems can occur during pregnancy (87%), labor and delivery (86%), postpartum (85%), and to newborns (90%) and that these problems can be fatal; however, majority of women were only able to name a few of these complications. Few women (13%) agree that preparations need to be made as soon as a woman knows she is pregnant; whereas, more than half of women across the three arms (56% in comparison, 68% in health promotion plus, and 60% in health promotion only arms) agree that preparations need to be made during the last few months of pregnancy.
ENCC can help increase women’s immediate newborn care knowledge and practices. Although more than half of women know that newborns need to be dried with a clean cloth (72%), breastfed (61%), and that the cord needs to be cut with a clean instrument (53%), less than half of women know to cover the newborn with a blanket (39%) and to keep the cord clean and dry (35%), and even fewer know to keep the newborn’s head covered (18%) and to provide kangaroo care (10%).
ENCC can also help increase the adaption of key MNCH behaviors such as having someone who is a blood donor accompany the woman to facility, identifying a health center to deliver, or making transportation plans. Majority of women (95%) identified or plan to identify a facility for delivery; however, almost four out of five (78%) women who had a live birth in the 12 months preceding the survey did not make transportation plans. Most women also did not and were not planning to save money for transport (79%) or for supplies (94%). Less than two in three (60%) women were accompanied or planning to be accompanied to the facility by a blood donor.
These results support the need for a program such as the ENCC project in Sierra Leone, which leverages MNHP communities to reach MNCH country targets. The results from the baseline assessment provide base evidence for the status of key MNCH indicators in Bo District, which will be used to feed into the ENCC project design and to assess the pilot’s effect after the duration of the intervention. The results will be used to guide analysis, with some variables significantly differing across the three arms to be controlled for when comparing baseline and endline. The results also helped the ENCC team identify which areas during pregnancy, delivery, and postpartum can be most impacted by the project, as well as areas that need to be further investigated to understand what they mean with regards to the ENCC project.

10
Introduction Maternal and child health statistics in Sierra Leone rank among the world’s lowest. The 2008 Demographic and Health Survey (DHS) estimated the national maternal mortality rate at 857 deaths per 100,000 live births (SSL and ICF Macro, 2009). The World Health Organization estimates maternal mortality at 970 deaths per 100,000 live births (World Health Organization, 2010). The majority of deliveries (72%) are home based. Among all births, less than half (42%) are delivered with the help of a skilled health care provider.
In response to such realities, in 2010 the Government of Sierra Leone (GoSL) initiated the Free Health Care Initiative (FHCI), aiming to provide free care to all children under five years of age and women who are pregnant or lactating. Significant gaps in human resources continue to contribute to ineffective delivery of health care. Sierra Leone only has 111 skilled and trained midwives in the whole country, and a handful of specialist obstetricians. This effectively has meant that there is only one midwife available per 1000 live births (UNFPA, 2011).
Health facilities are severely understaffed, trust in the formal health sector is low, and women often seek the services of traditional birth attendants (TBAs). While TBAs have the potential to become important health resources in addressing non-delivery care needs in the community and act as links between the formal and informal health sectors, shifting TBAs away from their traditional role as birth attendants has had limited success. This is due in part to the lack of substitute sources of revenue for the TBAs and, as it appears, compromised social status when they abandon delivery care.
The potential role of TBAs must be viewed in the context of another recent policy decision in Sierra Leone. Introduced in 2010, the Basic Package for Essential Health Services is the main document which lays out how the health system is structured and services are delivered for mothers and children (Government of Sierra Leone, 2010). The document acknowledges that TBAs provide services widely and that it would be strategic to work with them: they are included in the service provision as community level workers. The current policy however clearly disallows TBA-led childbirth. It should be noted that no specific legislation has been introduced to this purpose. Similarly, even though there are by-laws which prevent home deliveries, evidence on how these are being enforced was not found.
The “Essential Newborn Care Corps” (ENCC) project will transform the role of TBAs within the health sector. It is part of Concern Worldwide’s Innovations for Maternal, Newborn, and Child Health (MNCH) (Innovations), an initiative funded by the Gates Foundation which develops and tests innovative interventions and strategies that can address common barriers to improving coverage of basic MNCH health services. The initiative is designed to complement national efforts to achieve the 2015 Millennium Development Goals related to improving maternal and child health. There are currently five innovations to be developed and implemented from 2013 to 2015 across three countries: Kenya, Ghana, and Sierra Leone. Each innovation incorporates learning from private, NGO, health and non-health sector experience and has been developed in consultation with a range of national and international experts as well as communities themselves. Each pilot project is supported in research, monitoring and evaluation during the plan and execute phase by the Global Research Partner, John Snow Research and Training Institute Inc. (“JSI R&T”).

11
The ENCC project is composed of a network of independently-certified frontline health workers addressing an unmet need by providing care, advice, specific products for sale, and free health commodities including basic medicines to children and new mothers. ENCC will recruit TBAs to form an elite corps of health service providers. By re-training, re-positioning and re-branding TBAs within a new role, the ENCC will harness their potential to help address the shortage of health workers while complying with the ban on their involvement in delivery. Most significantly, the TBAs will provide these services while building their own sustainable source of revenue. ENCC will provide investment funds for its members to purchase certain products in exchange for agreeing to refer mothers to appropriate health facilities for delivery and emergency care, a strong incentive for TBAs to become a part of and a bridge to the formal health system. This approach may inform other districts and actors seeking to find complementary roles for TBAs in line with the CHW policy.
There will be 2 intervention groups and 1 comparison group across all 14 chiefdoms in Bo District. One intervention group will receive both MNCH Health Promotion training and social franchising training/support; the second intervention group will receive only MNCH training; the third group will serve as a control group and not receive any training on MNCH or social franchising.
Research Questions
The following research questions were developed to define the evaluation questions for the ENCC intervention:
How are knowledge levels on appropriate MNCH practices related to antenatal care (ANC), delivery and postnatal care (PNC) among women improved among those who received MNCH health promotion from MNHPs? Does this differ among women who received MNCH health promotion information and bought goods from MNHPs compared to mothers only who received MNCH health promotion?
What are the current MNCH practices among women relating to ANC, Delivery and PNC among those who received MNCH health promotion from MNHPs? Does this differ among women who received MNCH health promotion information and bought goods from MNHPs compared to mothers only who received MNCH health promotion?
What types of referrals are women getting from MNHPs for ANC, delivery and PNC? Does this differ among women who received MNCH health promotion information and bought goods from MNHPs compared to mothers only who received MNCH health promotion?
What facility services are women utilizing for ANC, delivery and PNC? Does this differ among women who received MNCH health promotion information and bought goods from MNHPs compared to mothers only who received MNCH health promotion? What are barriers that prevent women from utilizing services?
How have MNHPs adopted into their new roles as MNCH health promoters and does this differ among MNHPs who provide both MNCH health promotion and sell goods?

12
Conceptual Framework
The ENCC model seeks to leverage the existing trust and status of MNHPs within communities and the study hypothesizes that this network of respected individuals has the potential to considerably improve coverage of essential care for mothers and newborns. The ENCC model builds on existing literature in developing a training manual for MNCH messages specifically for an illiterate cadre of community health workers. In addition, the ENCC pilot seeks to test the feasibility of a social franchise model in Sierra Leone as an income-generating activity linked to healthcare, similar to what has been developed in other countries.
The conceptual framework below summarizes the pathway of change this project seeks to undertake to ultimately contribute to improvements in maternal and newborn health. The conceptual framework also recognizes the various barriers that impact utilization of facilities for MNCH services and therefore hypothesizes that the ENCC model could in part impact utilization behaviors among women, but that other factors may play a role as well in influencing these behaviors which is beyond the scope of the ENCC model.
Figure 1. Theory of Change

13
Methodology
Study Design
The project will have a three-arm design, with two intervention groups across six chiefdoms and one comparison group in three chiefdoms in Bo District, Sierra Leone. The selection of the groups was done in discussion with Innovations and JSI R&T. The characteristics considered for the selection of the intervention and comparison group included: (i) total catchment population, (ii) density of primary health units (PHUs), (iii) average distance between PHU and

14
MCH referral hospital, and (iv) the number of active MNHPs. PHUs and the number of MNHPs attached to each were divided so that characteristics considered would be relatively comparable across the three groups (See Annex A for group distribution).
The groups are summarized below:
Group 1: Health promotion arm, which will be implemented in Valunia, Gbo, Selenga, Kakua and Niawa Lenga chiefdoms
Group 2: Health promotion plus arm, which will be implemented in Bumpe and Tikonko chiefdoms
Group 3: Comparison arm, which will be in Baoma, Kakua, Wonde and Jiama-Bongor chiefdoms
MNHPs in the health promotion arm (group 1) are trained on key messages on MNCH during ANC, delivery and PNC and conduct home visits during pregnancy and postpartum as MNCH health promoters. The MNHPs are expected to make four visits during ANC and three visits during PNC. During these visits MNHPs promote facility level deliveries and make referrals for any complications. In addition, MNHPs distribute Sp/fancidar and FeFo during the household visits. MNHPs will receive supervision from MCH Aides and HPA supervisors. MNHPs will also participate in monthly meetings, where supervisors review their reporting on drugs and home visits, facility referrals, process transport reimbursements, and restock drugs. In addition, retraining of MNHPs on selected MNCH topics, and discussions on successes and challenges related to health promotion will take place during the monthly meetings.
MNHPs in the health promotion plus arm (group 2) will conduct all activities described in group 1 and in addition will be selling products as part of the social franchise model. The product loan structure for the social franchise model provides MNHPs a one-time no-interest product loan as part of ENCC. No fee is charged for joining ENCC. MNHPs are then expected to pay back 20% of the loan monthly to HPA into a return to project account. The products that are purchased from HPA are slightly marked up in terms of price. Products sold by the MNHP will include: Benimix1, bath soap, iodized salt, laundry bar soap, powder soap, toothpaste, toothbrush, Vaseline jelly, sanitary pads, Dettol, baby blanket, baby soap, baby diapers (cloth and plastic), baby powder, baby oil, clothes pins, baby lotion, baby hat, and baby diaper pins. In addition, discussions on product sales and on successes and challenges related to social franchise will be take place during the monthly meetings.
Group 3 will serve as a comparison arm.
The purpose of this design is to allow the evaluation to tease out the added value of the social franchise model to the MNCH training approach for MNHPs. From meetings and discussions between Innovations and JSI R&T in breaking down groups, the three arms are relatively similar in terms of the selection criteria and chiefdoms are dispersed across Bo district, thereby minimizing the risks of contamination. The only exception is that in Kakua Chiefdom, some
1 Local food mix

15
villages have been assigned to the health promotion arm or health promotion plus arm. This chiefdom is quite large; therefore, crossover between these two groups may be limited. However, the project will seek to measure the level of contamination during implementation and at endline so as to be able to control for it during analysis.
Figure 2 below provides a summary of the estimated number of households, women and children that will be exposed to the project intervention as well as the estimated number of individuals in the comparison areas.
Figure 2. Characteristics of the three study groups in Bo District

16
Sample design
Out of 15 chiefdoms in Bo District, the baseline assessment was carried out in a total of ten chiefdoms across the three arms. An initial sample size of 270 women in each arm for a total number of 810 eligible women2 was calculated to be able to detect a 15% difference on key outcomes at endline with power of 0.75 and a 5% margin of error. Eligible women were defined as women who are currently pregnant or women who had a live birth in the last 12 months. If women were currently pregnant, but had had a live birth in the 12 months preceding the survey, they were asked about their live birth and not their current pregnancy. The 2004 DHS data was used to determine the percentage of eligible women in rural households, which was calculated to be a total of 38.4% of rural households. Applying this percentage, it was calculated that each EA should have approximately 33 households with one or more eligible women3. Therefore, a total of 2178 households across 66 enumeration areas (as defined by DHS) were needed to reach the target sample of 270 eligible women per arm.
The sample was selected in two stages. In the first stage, 66 enumeration areas (EAs) were selected using probability proportional to size (PPS) sampling, in which the selection probability of each EA is set to be proportional to the number of households in the EA. In the second stage, a complete listing of households was carried out in each selected EA. Thirty-three households were then systematically selected from the household listing for each EA for participation in the survey. Systematic selection was based on a sampling interval that was calculated using the total number of households in the EA divided by the sample of households needed for each EA4. Household listings were conducted for all selected households and the woman’s questionnaire was administered to women who were found to be eligible for this survey. This design resulted in a final sample of 2,601 households: 258 households in the comparison arm, 241 in the health promotion plus arm, and 246 in the health promotion only arm.
Data collection tools
The baseline assessments includes one household listing, one household and one woman’s survey to be used primarily to provide evidence of the project’s effect on the three key indirect outcomes and four out of six direct outcomes as listed below:
Indirect outcomes:
(i) Increased utilization of facilities for 4 ANC visits
(ii) Increased utilization of facilities for deliveries
(iii) Increased utilization of facilities for PNC services
Direct outcomes:
2 Due to data collection in the field, only 795 eligible women were interviewed for the baseline survey 3 It was calculated that a total of 34,230 households are in the selected chiefdoms based on the 2004 census data. This resulted in a total of 398 EAs, which each have, on average, 86 households. Based on these numbers, it was calculated that each EA should have approximately 33 households with one or more eligible woman (0.384 * 86). 4 It was calculated that each EA should have approximately 33 households with one or more eligible women

17
(i) Women accepting advice provided by MNHPs
(ii) MNHPs providing increased referrals for 4 ANC visits
(iii) MNHPs providing increased referrals for facility deliveries within functional EMOC referral network
(iv) MNHPs providing increased referrals for newborns within 24-48 hours for birth.
The content of these questionnaires were based on the Sierra Leone 2008 DHS questionnaires developed by the MEASURE DHS program and the Skilled Care Initiative questionnaires developed by Family Care International. JSI R&T, in collaboration with Innovations, adapted the questionnaires for the Sierra Leone and Bo District context specifically regarding relevant issues in MNCH.
The household listing was used to list all the usual members in the selected households. Household members were defined as a group of people living under the same roof who eat from the same pot. Primary caregivers were interviewed to collect some basic information on the characteristics of each person listed, including age, sex, and relationship to the head of household. For women listed in the household, primary caregivers were asked an additional series of questions on the woman’s pregnancy history. The main purpose of the household listing was to identify women who were eligible for the woman’s questionnaire.
Once it was determined that at least one eligible woman was living in the household, data collectors proceed to interview the primary caregiver with the household questionnaire. This was used to collect information on the characteristics of the household dwelling unit, such as the source of water, type of toilet facilities, materials used for the floor and roof, ownership of various durable goods, and ownership of land. Data from the household questionnaires were used to calculate the wealth index in the analysis as well as provide data on transportation and road access.
The woman’s questionnaire was used to collect information from all women age 15-49 years who were currently pregnant or had a live birth within the past year. The following topics were covered:
Background characteristics (education, ethnicity, marital status, etc.)
Pregnancy history
Birth preparedness and knowledge of MNCH practices
Antenatal, delivery, and postnatal care
Immediate newborn care
MNHP behaviors and practices
The household and woman’s questionnaires can be found in Annex B and C of this report.

18
Data collection platform
A mobile platform called SurveyCTO was used to collect data in order to streamline data collection and analysis efforts. The paper-based household and woman’s questionnaires were programmed into Microsoft Excel 2010 and then uploaded into SurveyCTO’s online platform. The electronic forms were then downloaded on to Samsung Galaxy phones, ready for use by data collectors. To address challenges of reliable electrical charging availability in Bo District, solar panel battery packs were used to charge the mobile phones.
Training of field staff
Twenty qualified candidates were recruited and trained to serve as supervisors and data collectors. Training was conducted during a weeklong period from October 15-19, 2013. The training was conducted by the RME lead and RA from JSI R&T for ENCC. Training consisted of lectures, demonstrations, and practice interviews in small groups.
Training also included a SurveyCTO component where data collectors were taught how to navigate, to start a questionnaire, to save a completed questionnaire, and to conduct quality checks in the mobile data collection platform. Supervisors were instructed to do another round of data quality checks prior to finalizing the completed questionnaires. Due to the very limited availability of internet connections in the field, two research staff were trained to retrieve the data from the phones by saving the finalized questionnaires to their laptops during field visits. Once they had internet connection, research staff sent the data to the JSI R&T team in Washington, DC where data was uploaded into the server for storage by the data manager.
During the final day of training, supervisors and data collectors had a whole day to conduct field practice, and research staff practiced retrieving the data from the phones.
Data collection
Fieldwork for the baseline assessment took place over a three-month period from the end of October to mid-December 2013. Five teams of four data collectors and one supervisor carried out the data collection. Senior research staff visited teams regularly to review the work, monitor data quality, and save finalized questionnaires on to their laptops.
Data processing
The processing of the baseline results by JSI R&T began shortly after fieldwork commenced. Research staff regularly sent finalized questionnaires to JSI R&T staff in Washington, DC, where the data manager uploaded the finalized questionnaires to the SurveyCTO server for storage. The concurrent processing of data was a distinct advantage for assessing data quality to advise field teams of errors detected during data entry. All finalized questionnaires were uploaded to the server by December 2013.
Data analysis
Data was cleaned and analyzed using STATA 11. The wealth quintiles were calculated using principal component analysis of household variables similar to the Sierra Leone Demographic Health Survey wealth quintile calculation (See Annex D for list of variables). To assess differences between intervention scores, Chi-squared tests were used. For data with frequency of five or less in one or more cells, Fischer’s exact test was used.

19
Limitations
The target sample size of 810 eligible women was not reached due to data collection issues (see Sample Design), reducing the power to detect differences between the three arms; therefore, results should be interpreted with caution. Some factors that contributed to these issues include poor real-time monitoring of data collection progression to track the number of eligible women per group, as well as misallocation of some EAs into the wrong study group when selecting households to be visited. Furthermore, some questions have a low response rate and as a result have smaller numbers of respondents. This could be due to questions applying only to a subset of respondents or data collector error in survey administration, resulting in missing data.
Indicators are calculated combining the responses of both currently pregnant women and those who had a live birth in the 12 months preceding the survey, and little evidence exists showing the relationship between intention to use services and the actual use of services (Jhpiego, 2004). The two groups were combined to reach the target sample size. This strategy has implications on the interpretation of data, as currently pregnant women have not yet completed their pregnancies and may not have yet had the opportunity or need to make arrangements related to pregnancy, labor and postnatal care. Pregnant women are only able to provide information on whether or not they plan to use health services. In addition, currently pregnant women are also in different stages of their pregnancies, which could affect their responses to certain questions. Women who are further along in their pregnancy have had more time and greater need to make preparations for their delivery. Results should therefore also be interpreted with caution for these reasons.
Results The results for the baseline assessment are described in this section of the report. First, household wealth and village transportation options are presented using data from the household questionnaire. Second, data from the woman’s questionnaire is presented, covering the following: respondent characteristics, pregnancy outcomes, labor and delivery outcomes, and postnatal care outcomes. These are followed by data on MNHP-related behaviors and services, as well as data on women’s knowledge and practices of birth preparedness topics.
The tables presented below include percent estimates for currently pregnant and women who had a live birth combined unless otherwise noted. The percent responses for women who had a live birth in the year preceding the survey are presented for key indicators in a separate column to draw a comparison of the responses between the two groups of eligible women. The p-values presented in the tables correspond to percent differences across the three arms.
A total of 2,601 households were selected in the sample, from which 761 households included an eligible woman (Figure 3). Eligible women were defined as between the ages 15-49 years who were currently pregnant or had a live birth within the past year. Primary caregivers from these households were interviewed. Within these households, 812 women were successfully interviewed. A total of 745 households and 795 eligible women were included in the analysis. Eleven households could not be matched to corresponding eligible women, and seven women could not be matched to corresponding households, so they were dropped from the analysis. Nine women were dropped after reassessing eligibility and finding them ineligible due to reasons such as not falling within 15-49 years of age or having a live birth more than 12 months ago. One woman was dropped from the analysis due to duplicate data entry.

20
Figure 3. Number of households, number of interviews, and numbers included in analysis
1. Household wealth and transportation
The household questionnaire provided an opportunity to obtain information about the distribution of Bo District’s population by wealth quintiles. Table 1 shows the percent distribution of the wealth quintiles in Bo District, with a significant difference in wealth quintile distribution across the three study arms. More than half (53%) of the households in health promotion plus arm are in the two lowest quintiles compared to only one third of households from the health promotion or comparison arms (35% and 33% respectively).
Table 1 also shows a select number of variables included in the wealth index calculation that were significantly different across the three groups (See Annex D for a complete list of wealth index variables). The source of drinking water is an indicator of whether or not the water is suitable for drinking. Improved sources of drinking water that are believed to be relatively free of disease include tube wells or bore holes and protected wells. Non-improved sources such as unprotected wells and surface water are more likely to have disease-causing agents that have a negative impact on health. For main source of drinking water, more than half of households from the comparison (75%) and health promotion only (55%) arms use a protected well; whereas most households in the health promotion plus arm use a tube well or borehole (41%) followed by a protected well (30%).
Poor sanitation also increases the risk of water-borne diseases and illnesses due to poor hygiene. Households with improved sanitation facilities have members who are less likely to contract these diseases. Only 5% of households have shared ventilated improved latrines across the three arms. More households have shared traditional latrines without slab. This percentage is more than double in the comparison (17%) and health promotion only (15%) arms compared to households from the health promotion plus arm (7%).
For characteristics of household dwellings, approximately three in four (72%) households use zinc as the main roof material, although a significantly lower percentage (54%) of households from the health promotion plus arm do so compared to households from the comparison (80%)
Households listed

21
and health promotion only (81%) arms. And for the main material of their exterior walls, more than three in five (62%) households use dirt or mud; however, only half (52%) of households from the health promotion only arm do so compared to 65% and 70% of households in the comparison and health promotion plus arms, respectively.
Table 1. Percent distribution of wealth quintiles and select household variables included in wealth index calculation, by study arm
Comparison
Health Promotion
Plus
Health Promotion
only Total P value
N 258 241 246 745
Wealth quintile Pr = 0.000
Lowest 14% 32% 15% 20%
Second 19% 21% 20% 20%
Middle 25% 15% 20% 20%
Fourth 19% 17% 24% 20%
Highest 24% 16% 20% 20%
Main source of drinking water
Tube well or borehole 15% 41% 19% 25% Pr = 0.000
Protected well 75% 30% 55% 54% Pr = 0.000
Unprotected well 3% 8% 3% 5% Pr = 0.011
Spring 1% 2% 18% 7% Pr = 0.000
Surface water 7% 18% 5% 10% Pr = 0.000
Type of toilet facilities*
Shared ventilated improved latrine 6% 8% 1% 5% Pr = 0.003
Private traditional latrine with slab 2% 1% 7% 3% Pr = 0.003
Shared traditional latrine without slab 17% 7% 15% 13% Pr = 0.003
Main floor material: dung 2% 1% 5% 3% Pr = 0.018
Main roof material
Thatch/palm leaf 19% 41% 15% 25% Pr = 0.000
Tarp 0% 2% 0% 1% Pr = 0.005
Zinc 80% 54% 81% 72% Pr = 0.000
Main material of exterior walls*
Dirt/mud 65% 70% 52% 62% Pr = 0.000
Mud bricks/ clay blocks 11% 8% 26% 15% Pr = 0.000
Household has a mobile phone 48% 56% 40% 48% Pr = 0.002
Household owns seeds 69% 43% 67% 60% Pr = 0.000
Household member owns agricultural land 72% 66% 78% 72% Pr = 0.016 *Percentages do not add up to 100% because some answer options were not included in the analysis. Variables included are based on wealth index calculation for the 2008 Sierra Leone Demographic Health Survey.
Households were also asked about the availability of household durable goods such as household effects and ownership of agricultural land. In Bo District, less than half (48%) of households have a mobile phone (Table 1). This percentage is higher in the health promotion plus arm (56%) compared to the other two arms (48% in the comparison and 40% in the health

22
promotion only arms). However when asked about owning seeds, less than half (43%) of households in the health promotion plus arm own seeds compared to 69% of households in the comparison and 67% in the health promotion only arms.
Almost three in four (72%) households own agricultural land (Table 1). This percentage is higher (78%) is in the health promotion only arm compared to only 72% and 66% in the comparison and health promotion plus arms.
Information was collected in both the household and woman’s questionnaires on the means of transportation in Bo District. Table 2 shows the percent distribution of means of transport across the three study arms. Paved roads are the most common paths to access the villages in both the health promotion plus (68%) and health promotion only arms (66%); whereas in the comparison arm, respondents reported that the villages are accessible by paved road (52%) and foot path (41%), with only a small percentage having access by tar road (9%). Respondents say that health facilities are mainly accessed by walking from the village (89%).
Table 2. Percent distribution of transportation characteristics by study arm*
Comparison
Health Promotion
Plus
Health Promotion
only Total P value
N 276 264 255 795
Village is accessible by:
paved road 52% 68% 66% 62% Pr = 0.000
tar road 9% 16% 13% 13% Pr = 0.057
foot path 41% 16% 23% 27% Pr = 0.000
Main type of transportation to get to health facility from village
Pr = 0.000
On foot 96% 89% 81% 89%
Ocada 3% 8% 19% 10%
Other 0% 3% 0% 1% *Included in Woman’s Questionnaire
2. Characteristics of survey respondents
Background characteristics of 795 eligible women interviewed at baseline are presented in Table 3. The distribution of women according to age shows that the majority (73%) are between the ages 20-34 years old. Nearly eight in ten are Muslim, and almost all (92%) are of Mende ethnicity. Approximately three in four (74%) are married. About two-thirds (64%) are not educated, and majority (80%) cannot read at all.
Table 3. Percent Distribution of women ages 15-49 by selected background characteristics
Comparison
Health Promotion Plus
Health Promotion only Total P value
Age n=276 n=264 n=254 n=795 Pr = 0.021
15-19 years old 15% 18% 9% 14%
20-24 years old 36% 28% 36% 34%
25-29 years old 20% 25% 22% 22%

23
30-34 years old 20% 14% 17% 17%
35-49 years old 8% 12% 14% 14%
Pregnancy status Pr = 0.046
currently pregnant woman 39% 38% 29% 36%
woman with a live birth in the past year
61% 63% 71% 65%
Education level* Pr = 0.681
Primary 45% 47% 48% 47%
Junior secondary 45% 40% 40% 42%
Senior secondary 10% 11% 12% 11%
Vocational/commercial/nursing/technical/teaching
0% 2% 0% 1%
Literacy Pr = 0.658
Cannot read at all 83% 79% 78% 80%
Able to read only parts of sentence 8% 11% 10% 10%
Able to read whole sentence 9% 10% 12% 10%
Religion Pr = 0.000
Christian 13% 27% 38% 26%
Muslim 87% 73% 62% 74%
Other 0% 0% 0% 0%
Ethnicity Pr = 0.127
Temne 4% 3% 3% 3%
Mende 91% 90% 94% 92%
Mandingo 2% 1% 0% 1%
Sherbro 1% 1% 1% 1%
Limba 0% 2% 2% 1%
Other 2% 2% 0% 2%
Marital status Pr = 0.144
Never married 13% 13% 9% 12%
Married 73% 69% 79% 74%
Living with a partner 14% 18% 12% 15% *Out of 282 respondents who attended school (n=91 for comparison, n=104 for health promotion plus, and n=87 for health promotion only)
3. Knowledge and perceptions in key MNCH topics
At baseline, data was collected on women’s knowledge and perception of maternal, child, and newborn health topics to assess whether they have adequate knowledge on key messages provided by MNHPs. The tables in this section do not provide a separate column of percent estimates for women who had a live birth because the questions test only knowledge and perceptions of women, not their intended actions.
3.1 Knowledge of serious health problems during pregnancy, delivery, and postpartum
Women were asked about their knowledge of serious health problems that can occur during pregnancy. Out of 795 eligible women, 87% believed that serious health problems can occur

24
during pregnancy, with a significantly lower percentage (80%) of women from the comparison arm compared to the two other arms (92% of health promotion plus and 89% of health promotion only arms)(Table 4). In all three groups, the most common problems that women believed to occur during pregnancy were severe bleeding, convulsions, and high fever. Almost all women (98%) believed that these problems can be fatal.

25
Table 4. Percent distribution of women who named health problems that can occur during pregnancy and believe these problems can be fatal, by group
Group Total n
Believe problems can happen during pregnancy*
Health Problems Named %(n)** Believe problems can be fatal
Severe bleeding*
Severe headache*
Convulsions*
Swollen hands/feet*
High fever*
Severe weakness
Severe abdominal pain*
Water breaks w/o labor*
Other Don’t know
Comparison 276 80 (222)
77 (170)
10 (22)
69 (152)
10 (22)
49 (108)
10 (23)
15 (34)
2 (5)
28 (77)
0 (1)
97 (221)
Health Promotion Plus
264 92 (243)
73 (177)
10 (23)
71 (172)
21 (50)
40 (96)
7 (17)
13 (32)
14 (33)
31 (83)
0 (0)
99 (243)
Health Promotion Only
255 89 (227)
83 (189)
18 (40)
47 (106)
21 (47)
53 (120)
13 (29)
33 (75)
5 (12)
35 (89)
1 (2)
97 (225)
Total 795 87 (692)
78 (536)
12 (85)
62 (430)
17 (119)
47 (324)
10 (69)
20 (141)
7 (50)
31 (249)
0 (3)
98 (689)
**Percentage may total more than 100 because some respondents gave multiple responses *There is a statistically significant difference across the three arms (Pr <0.05)
When asked about labor and delivery, 86% of women believe serious health problems can occur with a statistically lower percentage (77%) of women in the comparison arm compared to the health promotion plus (91%) and health promotion only (89%) arms (Table 5). Severe bleeding, retained placenta, and convulsions were the most commonly named labor and delivery problems. All women believe these problems can be fatal.
Table 5. Percent distribution of women who named serious health problems that can occur during labor and delivery and believe these problems can be fatal, by group
Total n
Believe problems can happen during labor and delivery*
Health Problems Named %(n)**
Believe problems can be fatal
Severe bleeding
Severe headache
Convulsions* High fever* Labor >12 hours
Retained Placenta*
Other Don’t know
Comparison 274 77 (212)
81 (171)
5 (10)
55 (116)
51 (107)
30 (63)
57 (121)
6 (14)
2 (4)
100 (208)

26
Health Promotion Plus
264 91 (240)
75 (181)
5 (13)
63 (150)
32 (76)
33 (78)
47 (113)
8 (20)
1 (3)
99 (234)
Health Promotion Only
255 89 (227)
83 (189)
8 (19)
37 (83)
49 (112)
40 (90)
69 (156)
6 (15)
1 (3)
100 (222)
Total 793 86 (679)
80 (541)
6 (42)
51 (349)
43 (295)
34 (231)
57 (390)
7 (49)
1 (10)
100 (664)
**Percentage may total more than 100 because some respondents gave multiple responses *There is a statistically significant difference across the three arms (Pr <0.05)
Almost all women believe that problems can occur immediately postpartum (85%) and to newborns (90%) (Table 6). For immediate postpartum health problems, 97% of women believe that the problems can be fatal. Among the problems named, severe bleeding, high fever, and convulsions were the most common.
Table 6. Percent distribution of women who named serious health problems that can occur immediately postpartum and to newborns and believe these problems can be fatal, by group
Total n
Believe problems can happen to newborns
Believe problems can happen immediately postpartum
Health Problems Named (%(n))** Believe immediate postpartum problems can be fatal*
Severe bleeding
Severe headache
Blurred vision
Convulsions*
Swollen hands/face*
High Fever*
Loss of consciousness*
Difficulty breathing
Severe weakness*
Other
Don't know
Comparison
274 89 (244)
85 (234)
73 (170)
7 (17)
5 (12)
40 (94)
5 (11)
58 (135)
6 (13)
5 (12)
14 (32)
10 (26)
0 (1)
94 (232)
Health Promotion Plus
264 92 (243)
88 (232)
80 (185)
7 (17)
9 (21)
56 (129)
13 (30)
42 (98)
3 (6)
7 (16)
14 (33)
7 (17)
0 (1)
100 (231)
Health Promotion Only
255 90 (230)
82 (210)
74 (156)
7 (14)
9 (18)
45 (94)
11 (24)
63 (133)
10 (21)
7 (15)
27 (57)
14 (31)
0 (0)
99 (210)
Total 793 90 (717)
85 (676)
76 (511)
7 (48)
8 (51)
47 (317)
10 (65)
54 (366)
6 (40)
6 (43)
18 (122)
10 (74)
0 (2)
97 (673)
**Percentage may total more than 100 because some respondents gave multiple responses *There is a statistically significant difference across the three arms (Pr <0.05)

27
3.2 Birth preparedness knowledge
Birth preparedness promotes the timely use of skilled maternal and neonatal care, based on the theory that preparing for childbirth reduces delays in obtaining this care (Jhpiego, 2004). MNHPs are trained as part of the ENCC pilot to advise women on preparing to have the cleanest, safest childbirth possible. At baseline, eligible women were asked about their birth preparedness knowledge.
Only about half (56%) of women agree that matters related to childbirth are not only a woman’s responsibility. Between the three arms, majority (74%) of women in the health promotion only arm agree; whereas more women (60%) from the health promotion plus arm believe it is mostly a woman’s responsibility.
Leaving the house is important for women to access to services after delivery. Only 41% of women agree that it is okay for a woman to leave the house in the first seven days after birth. The percentage of women who disagree is higher in the health promotion plus (68%) and health promotion only (60%) arms compared to the comparison arm (45%). More women (68%) agree that it is okay for a woman to leave the house in the first six weeks after birth, and majority (82%) of women agree that a woman should go for a checkup in the first 6 days after delivering at home.
Women need to be motivated and empowered to start preparing for skilled care during delivery and early postpartum period as soon as possible. Few women (13%) agree that preparations need to be made as soon as a woman knows she is pregnant. More than half of women across the three arms (56% in comparison, 68% in health promotion plus, and 60% in health promotion only arms) agree that preparations need to be made during the last few months of pregnancy.
The most common birth preparations that women mentioned across the three arms are deciding to go to a facility and keeping money for delivery. About one in three women said to prepare by purchasing essential items. Very few mentioned making plans for transport (8%), to discuss with family (4%), for finance (3%), and most especially to identify a blood donor (1%) or to get plan approval (1%).
When asked about ANC preparations, most women (92%) knew that a pregnant woman should go for four or more ANC visits at a facility as recommended. Overall, more than half of women know that pregnant women should have their weight measured (73%), the baby checked (95%), their blood pressure checked (50%), and a tetanus injection (83%) during ANC visits. But less than half of women know that they can get malaria medication (41%) and advice on danger signs (21%) and where to deliver (20%) during these visits.
Table 7. Percent distribution of MNCH knowledge by currently pregnant women and women who have had a live birth in the past 12 months who accept advice by TBAs, by study arm
Comparison Health Promotion Plus
Health Promotion only
Total P-value
Matters related to childbirth are mostly a woman’s responsibility. n=275 n=264 n=255 n=794 Pr = 0.000

28
Disagree 55% 39% 74% 56%
Agree 43% 60% 26% 43%
don't know 2% 1% 1% 1%
It is okay for a woman to leave the house in the FIRST SEVEN DAYS after birth n=275 n=264 n=255 n=794 Pr = 0.000
Disagree 45% 68% 60% 57%
Agree 53% 32% 38% 41%
don't know 2% 0% 2% 1%
It is okay for a woman to leave the house in the FIRST SIX WEEKS after birth n=275 n=264 n=254 n=793 Pr = 0.000
Disagree 12% 39% 44% 31%
Agree 88% 60% 55% 68%
don't know 1% 1% 1% 1%
When should a woman go for a check-up after delivering at home? n=270 n=248 n=237 n=755 Pr = 0.000
first 6 days 83% 77% 84% 82%
after 1 wk 13% 16% 5% 11%
Other 4% 7% 11% 7%
Women know when during pregnancy should plans and preparations for delivery be made n=268 n=264 n=255 n=794 Pr = 0.000
as soon as she knows she is pregnant 4% 11% 26% 13%
during 1st few months 5% 6% 8% 6%
during last few months 56% 68% 60% 61%
a few days before delivery 15% 15% 5% 12%
Other 20% 0% 2% 8%
Women know what plans to make for health problems n=251 n=242 n=196 n=689
decide to go to facility 75% 70% 75% 73% Pr = 0.413
keep money 76% 69% 84% 76% Pr = 0.001
financial plans 2% 3% 6% 3% Pr = 0.036
transport plans 2% 12% 10% 8% Pr = 0.000
blood donor 0% 3% 1% 1% Pr = 0.036
discuss with family 2% 5% 7% 4% Pr = 0.030
get plan approval 0% 2% 1% 1% Pr = 0.030
purchase items 27% 34% 28% 30% Pr = 0.213
Other 4% 4% 2% 3% Pr = 0.050
How many times should a pregnant woman go for ANC at facility? n=206 n=209 n=179 n=594 Pr = 0.001
less than 4 visits 9% 11% 2% 8%
4 or more visits 91% 89% 98% 92%
Women know ANC services for women at health facility n=274 n=264 n=255 n=793

29
take weight 65% 74% 80% 73% Pr = 0.000
check baby 95% 96% 94% 95% Pr = 0.623
check BP 40% 50% 59% 50% Pr = 0.000
marklate injection 84% 83% 81% 83% Pr = 0.634
malaria drugs 34% 46% 43% 41% Pr = 0.008
advice on where to deliver 30% 14% 15% 20% Pr = 0.000
advice about danger signs 30% 16% 17% 21% Pr = 0.000
Other 14% 11% 3% 9% Pr = 0.000
Women know of place where a woman can go to deliver a baby with assistance n=274 n=264 n=255 n=793 Pr = 0.445
No 0% 1% 0% 1%
Yes 100% 99% 100% 99%
Women know where to deliver with provider: n=273 n=261 n=254 n=788
Health Center/PHU/Public hospital 96% 88% 99% 94% Pr = 0.000
NGO* 5% 15% 4% 8% Pr = 0.000
Other 0% 5% 2% 3% Pr = 0.003
Women know after birth newborn care: n=274 n=264 n=255 n=793
dried with clean cloth 73% 70% 74% 72% Pr = 0.000
kangaroo care 4% 22% 3% 10% Pr = 0.000
head covered 10% 19% 26% 18% Pr = 0.000
covered with blanket 45% 35% 35% 39% Pr = 0.023
cord cut with clean instrument 54% 50% 53% 53% Pr = 0.708
cord clean and dry 39% 36% 29% 35% Pr = 0.058
Breastfed 41% 62% 82% 61% Pr = 0.000
Other 11% 8% 6% 8% Pr = 0.193 *NGO refers to MSF hospital
For delivery preparations, almost all women (99%) know where to deliver with assistance. Across the three arms, most women (94%) identified the Health Center/PHU/Public hospital as a place to deliver with assistance.
For newborn care, more than half of women know that newborns need to be dried with a clean cloth (72%), breastfed (61%), and that the cord needs to be cut with a clean instrument (53%); however, less than half of women know to cover the newborn with a blanket (39%) and to keep the cord clean and dry (35%), and even fewer know to keep the newborn’s head covered (18%) and to provide kangaroo care (10%).
4. Birth preparedness behaviors
Both currently pregnant women and women who have had a live birth in the past 12 months were asked about the actual preparations that they make during their pregnancy. Less than two in three (60%) women were accompanied or will be accompanied to the facility by a blood donor. This percentage was significantly lower in the health promotion only arm with 36% compared to 73% in the comparison and 66% in the health promotion plus arms.

30
During antenatal care, majority of women (95%) identified or plan to identify a facility for delivery. Majority (93%) of women were also advised to deliver at a Health Center/PHU/Public hospital, followed by an NGO (7%). The percentage of women who were advised to deliver at an NGO was higher in the health promotion plus arm (16%) compared to the two other arms.
Two in three (63%) women did not and will not discuss transportation plans for delivery with a significantly higher percentage of women in the health promotion only arm compared to the other two (58% in the comparison and 59% in the health promotion plus arms). Almost four out of five (78%) women who had a live birth in the 12 months preceding the survey did not make transportation plans. Most women also did not and do not plan to save money for transport (79%) or for supplies (94%).
Table 8. Percent distribution of MNCH behaviors by currently pregnant women and women who have had a live birth in the past 12 months who accept advice by TBAs, by study arm
Live birth in past 12 months
(all 3 arms)
Live births and pregnancies
P-value
Comparison Health Promotion Plus
Health Promotion only
Total
Woman’s company to facility was/will be blood donor n=392 n=235 n=198 n=186 n=619
a Pr = 0.000
No 66% 73% 66% 36% 60%
Yes 5% 3% 22% 2% 9%
don't know 24% 18% 12% 55% 27%
don't understand meaning of blood donor 4% 6% 1% 8% 5%
During ANC, woman identified health facility to deliver n=512 n=251 n=237 n=241 n=729
b Pr = 0.238
No 3% 2% 6% 5% 4%
Yes 97% 97% 93% 95% 95%
don't know 0% 0% 0% 0% 0%
Where woman was advised to deliver n=496 n=244 n=221 n=230 n=695
c Pr = 0.000
Health Center/PHU/Public hospital 92% 96% 82% 98% 93%
NGO* 7% 4% 16% 1% 7%
Private hospital 1% 0% 1% 0% 1%
Discussed transport for delivery n=511 n=274 n=264 n=255 n=793 Pr=0.000
no, did not and will not 78% 58% 59% 73% 63%
yes, I have discussed 21% 17% 23% 11% 17%
no, but will 0% 14% 18% 14% 15%
don't know 0% 11% 0% 2% 5%
Woman put aside money for transport n=80 n=33 n= 40 n=24 n=97
d Pr = 0.121
No 78% 91% 75% 71% 79%

31
Yes 23% 9% 25% 29% 21%
Woman put aside money for supplies n=315 n=161 n=111 n=141 n=413
e Pr = 0.001
No 95% 95% 87% 99% 94%
Yes 5% 5% 13% 1% 6% aOnly asked of women who were accompanied to the facility
bOnly women who attended ANC
cOnly women who attended ANC and given advice about where to deliver
dOnly among women who put money aside and discussed transport with partner/family
eOnly among women who put money aside
*NGO refers to MSF hospital
5. Pregnancy outcomes
The following results present findings on ENCC outcomes related to antenatal care and pregnancy complications.
5.1 Antenatal care visits
Women can make sure they have a healthy pregnancy and receive important health services by going to antenatal clinics, which is now free of charge in Sierra Leone. In the ENCC pilot, MNHPs will be trained to refer pregnant women to antenatal services.
The major objective of ANC is to identify and treat problems during pregnancy. During antenatal care visits, women are screened for complications and given advice on a range of issues including place of delivery and referral for complications. The baseline assessment collected information on the type of service provider, the number of antenatal care visits, and the stage of pregnancy at the time of the first and last visits.
ANC is most beneficial when it is sought early in pregnancy and is continued through to delivery (Lincetto et al, 2006; Hailu et al, 2011; Moran et al, 2006). The World Health Organization (WHO) recommends that a woman without complications has at least four ANC visits, the first of which takes place during the first trimester (SSL and ICF Macro, 2009). Table 9 presents information on antenatal care for women age 15-49 who are currently pregnant or who had a live birth in the year preceding the survey.
In the 2008 Sierra Leone DHS, 52% of rural women received the recommended four or more ANC visits. In the baseline sample, more than half of women (68%) received or planned to receive at least four ANC visits, but a significant difference across the three arms can be observed with three in four women from the health promotion arm receiving the recommended four visits compared to approximately two in three women for the other two arms (68% for comparison and 61% for health promotion arms). The data shows that all women across all three arms received or planned to receive antenatal care from a health professional (doctor, nurse, midwife, or community health officer (CHO)) for both their first and last ANC visit. This is comparable to the estimate from the 2013 Sierra Leone DHS, where all women from Bo District received ANC from a skilled provider.
The results also shows that women across all three arms do not receive antenatal care services early during their pregnancy, with only 44% of women obtaining antenatal care in the first three months of pregnancy. This percentage is higher than the 28% of rural women reported in the 2008 Sierra Leone DHS. More than half of women at baseline made their first visit in the

32
fourth to sixth month (52.7%). Almost all women (94.7%) received or planned to receive ANC in the seventh to ninth month of their pregnancy. There is no significant difference across the three arms for timing of ANC visits.
The table also shows that there are no major differences in response patterns between women with a live birth in the 12 months preceding the survey versus women who are currently pregnant.
Table 9. Percent distribution of antenatal care behaviors by currently pregnant women and by women who have had a live birth in the past 12 months, by study arm
Live birth in past 12 months
(all 3 arms)
Live births and pregnancies
P-value Comparison
Health Promotion
Plus
Health Promotion
only Total
Women received or planned to receive ANC 4+ at a clinic n=510 n=263 n=248 n=250 n=761 Pr = 0.000
No 10% 9% 17% 5% 10%
Yes 70% 68% 61% 74% 68%
Depends on health professional/don’t know 21% 23% 22% 22% 23%
Who women saw or planned to see on FIRST ANC visit n=512 n= 250 n=237 n=241 n=728 Pr = 0.144
Doctor 1% 0% 1% 0% 1%
Nurse/CHO/midwife 99% 100% 99% 100% 99%
Who women saw on LAST ANC visit** n=512 n=167 n=165 n=180 n=512 Pr = 0.322
Doctor 0% 0% 1% 0% 0%
Nurse/CHO/midwife 100% 100% 99% 100% 100%
Timing of first or planned first ANC visit n=512 n=274 n=259 n=255 n=788 Pr = 0.044
1-3 months 47% 46% 41% 44% 44%
4-6 months 50% 52% 55% 51% 53%
7-9 months 1% 2% 3% 3% 2%
depends on health professional/don’t know 1% 0% 0% 3% 1%
Timing of last or planned last ANC visit n=462 n=250 n=243 n=238 n=731 Pr = 0.246
1-3 months 0% 0% 0% 0% 0%
4-6 months 1% 0% 2% 0% 1%
7-9 months 98% 94% 95% 96% 95%
depends on health professional/don’t know 1% 6% 3% 4% 4%
**Includes only women who have had a child in the past year
5.2 Antenatal care services
Pregnancy complications are a primary source of maternal and child morbidity and mortality; therefore, in antenatal care visits, it is important to ensure that women receive information on signs of complications during pregnancy and that women are tested for complications (Jhpiego,

33
2004; Lincetto et al, 2006). To help assess antenatal care services in Bo District, women were asked whether they had received advice on possible pregnancy complications or certain screening tests and preventative measures during at least one of their ANC visits. Table 10 and Table 11 present information on the percentage of women who were informed of pregnancy complication signs and received selected services during antenatal care visits.
The results for ANC services indicate no major differences in response patterns between women with a live birth in the 12 months preceding the survey versus women who are currently pregnant, so the following results will focus on the on the combined group of eligible women.
The data show that 85% of women in Bo District who received antenatal care reported that they were informed of danger signs during pregnancy, childbirth or soon after. There is a significant difference across groups, with only 79% of women in the health promotion plus arm being informed compared to 86% in the comparison and 91% in the health promotion only arms. Almost all women (99%) were advised where to go if they experienced any danger signs. As summarized in Table 10, majority of women (94%) were advised to go to a Health Center/PHU/Public hospital for danger signs. There is a significant difference across the three arms regarding the type of health facility where woman was advised to go. In the health promotion plus arm, 17% of women were advised to go to an NGO facility compared to less than 2% of women from the other two arms.
In Table 11, for screening tests conducted during antenatal care visits, weight and blood pressure measurements were taken for 98% and 91% of women, respectively; however, there is a significant difference across all three arms in blood pressure measurements, with 98% of women from the comparison arm having their blood pressure checked compared to only 86% from the health promotion plus arm and 87% in the health promotion only arm.
A high proportion of deliveries in developing countries are conducted at home or in places where hygienic conditions may be poor. These conditions can lead to neonatal tetanus, which is one of the leading causes of neonatal death in developing countries (SSL and ICF Macro, 2009). Tetanus toxoid (TT) immunization is given to pregnant women to prevent neonatal tetanus. For full protection, a pregnant woman needs at least two doses of TT during pregnancy (WHO, 2006). Table 11 shows that almost all (97%) women received at least one TT injection during pregnancy with a slightly significantly lower (93%) percentage of women in the health promotion plus arm compared to the other two arms (99% for both health promotion only and comparison arms). Majority (88%) of women received the recommended two or more TT injections during ANC. This percentage is slightly higher than the reported 71% for rural women in the 2008 Sierra Leone DHS.
Table 10. Percent distribution of danger sign advice for currently pregnant women and by women who have had a live birth in the past 12 months, by study arm
Live birth in past 12 months
(all 3 arms)
Live births and pregnancies
P-value Comparison
Health Promotion Plus
Health Promotion only
Total
% (total n) % (total n) % (total n) % (total n) % (total n)

34
Woman informed of danger signs during pregnancy, childbirth, or soon after during ANC
87 (511) 86 (250) 79 (237) 91 (241) 85 (728) Pr = 0.004
Woman advised where to go if experienced danger signs
99 (447) 98 (215) 99 (187) 99 (219) 99 (621)* Pr = 0.410
Where woman was advised to go for danger signs
n=441 n=210 n=185 n=217 n=612 Pr = 0.000
Health Center/PHU/Public Hospital
94% 98% 83% 99% 94%
NGO** 6% 2% 17% 1% 6%
Private Hospital 0% 0% 1% 0% 0% *Question only applied to respondents who were informed of danger signs during pregnancy, childbirth, or soon after during their ANC visit (n=621) **NGO refers to MSF hospital
Pregnant women are more susceptible to malaria infection, which may lead to the development of anaemia during pregnancy (WHO, 2010). One of the strategies the Sierra Leone National Malaria Strategy has adopted is Intermittent Preventive Treatment (IPT) for malaria control among pregnancy women with sulphadoxine-pyrimethamine (SP), also known as Fansidar (MOHS, 2006). Table 11 shows that 80% of women surveyed received drugs to prevent getting malaria during ANC, which is much higher than the 31% reported for rural women who received any anti-malarial drug in the 2008 Sierra Leone DHS. Women were asked about the malaria drug they received, and the data are summarized in Table 11. Less than one in three women (29%) received Sp/Fansidar, and the coverage is consistently low across all three arms. This estimate is also lower compared to that reported in the 2013 Sierra Leone DHS, where 44% of rural mothers received any SP/Fansidar during an ANC visit. More than half of the women (60%) received chloroquine/amodiaquine; however, a significant difference is observed across the three arms. A higher percentage of women (70%) from the health promotion only arm received chloroquine/amodiaquine compared to the other arms (59% in the comparison and 51% in the health promotion plus arms).
Table 11. Percent distribution of antenatal services received by currently pregnant women and by women who have had a live birth in the past 12 months, by study arm
Live birth in past 12 months
(all 3 arms)
Live births and pregnancies
P-value Comparison
Health Promotion Plus
Health Promotion only
Total
Weighed during ANC visit 98 (512) 99 (251) 97 (237) 97 (241) 98 (729) Pr = 0.130
Blood pressure checked during ANC
92 (510) 98 (250) 86 (235) 87 (241) 91 (726) Pr = 0.000
Received at least one TT injection during ANC
98 (512) 99 (251) 93 (237) 99 (241) 97 (729) Pr = 0.000
Received at least two TT injections during ANC
88 (501) 90 (249) 84 (220) 89 (239) 88 (708) Pr = 0.353
Received malaria drugs during ANC
86 (512) 81 (251) 80 (237) 80 (241) 80 (729) Pr = 0.967
Type of malaria drugs taken n=438 n=203 n=190 n=193 n=586 Pr = 0.000

35
Sp/Fansidar 28% 28% 34% 27% 29%
Chloroquine/Amodiaquine 61% 59% 51% 70% 60%
Other 1% 0% 3% 1% 1%
Don't know 10% 13% 13% 3% 10%
MNHPs will also be trained to bring folic acid and iron to women in the community to avoid anemia. Anemia is dangerous because it can result in problems in the mother and can cause premature delivery, low birth weight baby, birth defects, or even a stillbirth (SSL and ICF Macro, 2009). Across the three arms, majority of women (92%) consumed IFA tablets, with a significantly lower percentage of women (84%) from the health promotion plus arm compared to the other two study arms (98% in the comparison and 93% in the health promotion only arms)(Table 12).
The results for ANC services indicate no major differences in response patterns between women with a live birth in the 12 months preceding the survey versus women who are currently pregnant.
Table 12. Percent distribution of iron supplement services for currently pregnant women and women who have had a live birth in the past 12 months, by study arm
Live birth in past 12 months
(all 3 arms)
Live births and pregnancies
P-value Comparison
Health Promotion Plus
Health Promotion only
Total
% (total n) % (total n) % (total n) % (total n) % (total n)
Women who took IFA tablets 93 (510) 98 (250) 84 (236) 93 (240) 92 (726) Pr = 0.000
5.3 Pregnancy complications
One of the biggest responsibilities of MNHPs in the ENCC project is to become a link between the community and the health facility. They can help to save the lives of women and their babies by recognizing those with health problems and promptly referring them to the health facility or hospital for special care. MNHPs will be trained to check for danger signs including the following: vaginal bleeding, cramping, lower abdominal pain, rapid but dull pulse, or fast breathing. The health facilities have lifesaving medicines and technology that can treat illnesses and deal with complications during and after delivery. In the baseline questionnaire, women were asked about their experience when they experienced or if they experience pregnancy complications. The percent distribution of these behaviors is summarized in Table 13.
Only 17% of women experienced at least one complication during pregnancy. When asked about whom they saw or would see for the complication, most women (97%) said that they saw or would see a nurse, midwife, or CHO. Fewer women saw or would see a doctor (5%), although a significantly higher percentage (11%) of women from the health promotion plus arm saw or would see a doctor compared to women from the comparison (0%) and health promotion only (3%) arms.
Most women (89%) reported that they went or would go to a Health Center/PHU/Public hospital, followed by an NGO facility (10%); however, there is a significant difference among

36
women across the three arms regarding where they went or would go to seek help for a complication. A lower percentage of women (81%) from the health promotion plus arm went or would go to a Health Center/PHU/Public hospital compared to the other two arms (93% from the comparison and 97% from the health promotion only arms). A higher percentage of women (17%) from the same arm went or would go to an NGO facility compared to the other two arms (only 7% from comparison and 4% from health promotion only arms).
Again no major differences are observed in pregnancy complication behaviors between women with a live birth in the 12 months preceding the survey and women who are currently pregnant.
Table 13. Percent distribution of pregnancy complication behaviors by currently pregnant women and women who have had a live birth in the past 12 months, by study arm
Live birth in past 12 months
(all 3 arms)
Live births and pregnancies
P-value Comparison
Health Promotion Plus
Health Promotion only
Total
Woman experienced at least one complication during pregnancy* n=510 n=274 n=263 n=254 n=791 Pr = 0.189
No 79% 85% 83% 79% 83%
Yes 21% 15% 17% 21% 17%
Who woman saw or would see for complication n=107 n=136 n=134 n=115 n=385
a
Doctor 3% 0% 11% 3% 5% Pr = 0.000
Nurse/CHO/midwife 96% 99% 94% 97% 97% Pr = 0.059
Other 2% 2% 2% 0% 2% Pr = 0.330
Which facility women went or would go to for complication help n=106 n=136 n=133 n=114 n=383
b Pr = 0.000
Health Center/PHU/Public hospital 88% 93% 81% 97% 89%
NGO** 11% 7% 17% 4% 10%
Other 1% 0% 2% 0% 1% a
n=385 includes currently pregnant women (despite whether or not they experienced a complication) who sought or would seek help for complication and only those women with a live birth in the 12 months preceding the survey who had experienced at least one complication and sought help for complication b
missing 2 observations *The most common complications during pregnancy were swelling (13%, n=103) and bleeding (6%, n=45) **NGO refers to MSF hospital
6. Labor and delivery outcomes
This section presents findings on ENCC outcomes related to labor and delivery practices and complications.
6.1 Facility births and skilled birth attendance
Part of MNHP training in ENCC is promoting facility based delivery with a skilled attendant present. It is important to increase the proportion of deliveries under the supervision of a trained health provider so that proper medical attention and hygienic conditions are practiced during delivery to help reduce the risk of complications and infections that can lead to sickness or death to either mother or baby (Graham et al, 2001; UNFPA, 2011). Table 14 presents the

37
percent distribution of women with a live birth in the year preceding the survey and of currently pregnant women by place of delivery, according to the three study arms.
In the 2013 Sierra Leone DHS, 72% of women from Bo District delivered in a health facility. Baseline data show that majority of women (84%) across the three arms delivered or would deliver at a health facility, mostly in a Health Center/PHU/Public hospital; compared to a few women (15%) who delivered or would deliver at a home. There is a significant difference across the three arms. A higher percentage of women (89%) from the comparison group having or planning to have delivered at a Health Center/PHU/Public hospital, whereas only 65% and 75% of women from the health promotion plus and health promotion only arms, respectively, did or would do so. Also a higher percentage of women from these two arms (17% and 22%, respectively) delivered or would deliver at a home compared to very few women (only 6%) from the comparison arm.
Table 14. Percent distribution of facility births and skilled birth attendance by currently pregnant women and women who have had a live birth in the past 12 months, by study arm
Live birth in past 12 months
(all 3 arms)
Live births and pregnancies
P-value Comparison
Health Promotion Plus
Health Promotion only
Total
Where women delivered or planned to deliver for birth n=510 n=274 n=261 n=255 n=790 Pr = 0.000
Respondent's home 8% 2% 10% 6% 6%
Nurse/CHO/Midwife home 3% 4% 1% 6% 4%
TBA home 8% 0% 6% 10% 5%
Health Center/PHU/Public hospital 72% 89% 65% 75% 76%
NGO* 6% 4% 15% 2% 7%
Private hospital 1% 0% 2% 0% 1%
Other 1% 1% 1% 2% 1%
Who woman delivered or planned to deliver under the assistance of n=511 n=274 n=263 n=255 n=792
Doctor 2% 0% 5% 3% 3% Pr = 0.003
Nurse/CHO/midwife 82% 96% 81% 83% 87% Pr = 0.000
TBA 23% 8% 24% 22% 18% Pr = 0.000
Other 3% 2% 4% 3% 3% Pr = 0.279 *NGO refers to MSF hospital
Women were subsequently asked whether they delivered or planned to deliver in the presence of a skilled attendant. The presence of a skilled birth attendant can reduce the likelihood of post-partum hemorrhage, sepsis and other complications of delivery (SSL and ICF Macro, 2009). In Table 14, majority of women delivered or planned to deliver with the assistance of a health professional (doctor 3% and nurse/CHO/midwife 87%), and 18% delivered or planned to delivery with the help of a TBA. A significantly higher percentage of women (96%) in the comparison arm delivered or would deliver in the presence of a nurse/CHO/midwife compared to women in the health promotion plus (81%) and health promotion only (83%) arms. These

38
estimates are higher from that reported in the 2013 Sierra Leone DHS, with 76% of women from Bo District delivering in the assistance of a skilled provider.
No major differences are observed between the actions of women with a live birth in the 12 months preceding the survey and the intended actions of women who are currently pregnant.
6.2 Labor and delivery complications
MNHPs will be trained to identify complications during delivery and refer the woman to a health facility for proper care. Table 15 shows the percent distribution of women who experienced a complication during labor and delivery as well as to whom and where women went or would go to for labor and delivery complications.
Among women who had a live birth in the year preceding the survey, one in four (25%) experienced a complication during labor and delivery. When all eligible women (including currently pregnant women) were asked who they saw or planned to see for labor and delivery complications, a majority (92%) of women said they saw or would see a nurse/CHO/midwife. A small percentage saw or would see a TBA (4%). Only 7% of women saw or would see a doctor for labor and delivery complications, with a significantly higher percentage of women (10%) from the health promotion plus arm compared to the comparison (3%) and health promotion only (6%) arms.
When asked where they went or would go to first for any labor and delivery complication, almost all women (98%) said a health facility, and the majority a Health Center/PHU/Public hospital. There is a significant difference between the three arms, with only 83% of women in the health promotion plus arm going or planning to go to a Health Center/PHU/Public hospital first compared to 94% and 93% of women from the comparison and health promotion only arms, respectively. In the health promotion plus arm, more women (13%) went or would go to an NGO facility than the other two arms (only 3% for both).
No major differences were observed between the actions of women with a live birth in the 12 months preceding the survey and the intended actions of women who are currently pregnant, except when asked about where they would go to first for labor complication. A lower percentage of women with a live birth in the past 12 months would go to a Health Center/PHU/Public hospital compared to currently pregnant women, and 9% would go to a TBA.
Table 15. Percent distribution of delivery complication behaviors by currently pregnant women and women who have had a live birth in the past 12 months, by study arm
Live birth in past 12 months
(all 3 arms)
Live births and pregnancies
P-value Comparison
Health Promotion Plus
Health Promotion only
Total
Woman experienced a complication during labor and
delivery* a
n=510 n=166 n=165 n=179 n=510 Pr = 0.000
No 75% 78% 62% 84% 75%
Yes 25% 22% 37% 16% 25%

39
don't know 0% 0% 1% 0% 0%
Who woman saw or would see for complication (n=395) n=127 n=143 n=155 n=97 n=395
b
Doctor 4% 3% 10% 6% 7% Pr = 0.032
Nurse/CHO/midwife 83% 95% 91% 91% 92% Pr = 0.311
TBA 10% 2% 4% 5% 4% Pr = 0.436
Other 2% 0% 1% 4% 2% Pr = 0.014
Which facility woman went or would go to FIRST for labor complication n=75 n=123 n=132 n=89 n=344 Pr = 0.000
Health Center/PHU/Public hospital 78% 94% 83% 93% 90%
NGO** 7% 3% 13% 3% 7%
Other 16% c
3% 4% 3% 4% *Includes only women who have had a child in the past year a
The most common complications during labor and delivery were long labor or regular contractions lasting more than 12 hours (21%, n=108) and excessive bleeding (7%, n=35). b
n=395 includes all currently pregnant women who would seek help for complication and only those women with a live birth in the 12 months preceding the survey who had experienced at least one complication and sought help for complication
c9% would go to a TBA compared to 0% of currently pregnant women
***NGO refers to MSF hospital
7. Postnatal care outcomes
This section presents findings on ENCC outcomes related to postnatal care and post-delivery complications. Questions were asked of women who are currently pregnant and women who have had a live birth in the past 12 months unless otherwise noted.
7.1 Postnatal care visits for mother’s health
The woman and the baby are most vulnerable in the first week after birth, especially the first 48 hours after delivery when a large proportion of maternal and neonatal deaths occur. A woman who has just given birth can reduce many of the risks related to the postpartum period for herself and her baby if she regularly attends the postnatal clinic and receives proper care (SSL and ICF Macro, 2009). During a postpartum visit, women receive preventive treatments and education her on how to keep herself healthy and to care for her baby.
MNHPs will be trained to make three home visits in the first week and encourage the mother to go to postnatal care at the health facility. For ENCC, MNHPs are trained to advice women to attend postnatal check-ups at health facility at days 1, 3 and 7 post-delivery. Table 16 shows the percent distribution of postnatal care visits among eligible women.
Across all three arms, most women (98%) saw or planned to see a nurse/CHO/midwife and a small percentage saw or planned to see a doctor (3%) for postnatal care for their health. These estimates are much higher than the 2008 Sierra Leone DHS estimates, where only 21% of rural women saw a doctor/nurse/midwife for the mother’s first postnatal check-up. At baseline, there is a significant difference across the study arms, with almost all women from the comparison and health promotion only arms seeing or planning to see a nurse/CHO/midwife compared to women from the health promotion plus arm. Also higher percentage of women

40
(7%) in the health promotion plus arm saw or planned to see a doctor compared to the other two arms (1% in the comparison and 2% in the health promotion only arms).
Nine out of ten (92%) went or would go to a health facility for their first PNC visit—a majority to a Health Center/PHU/Public hospital—with fewer women (86%) from the health promotion only arm compared to women from the other arms (93% from the comparison and 95% from the health promotion plus arms).
No major differences between the actions of women with a live birth in the 12 months preceding the survey and the intended actions of women who are currently pregnant were observed.
Table 16. Percent distribution of postnatal care visits for mother’s health by currently pregnant women and women who have had a live birth in the past 12 months, by study arm
Live birth in past 12 months
(all 3 arms)
Live births and pregnancies
P-value Comparison
Health Promotion Plus
Health Promotion only
Total
Health professional who checked on woman’s health post birth n=412 n=210 n=153 n=158 n=521
Doctor 3% 1% 7% 2% 3% Pr = 0.005
Nurse/CHO/midwife 98% 100% 94% 99% 98% Pr = 0.001
Other 0% 0% 3% 1% 1% Pr = 0.037
Where did/would the first PNC check for mother take place? n=412 n=210 n=153 n=158 n=521 Pr = 0.000
Respondent's home 2% 2% 4% 2% 3%
Nurse/CHO/Midwife home 6% 4% 1% 12% 6%
Health Center/PHU/Public hospital 83% 88% 76% 84% 83%
NGO* 5% 5% 16% 1% 7%
Private hospital 1% 0% 3% 0% 1%
Private clinic 0% 0% 0% 1% 0%
Other 0% 0% 1% 1% 0% *NGO refers to MSF hospital
Maternal complications six weeks after delivery
MNHPs will be trained to refer women to a health facility for any maternal complication post-birth. Table 17 presents a summary of complications women experienced after birth and the actions they took or would take to seek care. Only one in ten women (9%) experienced a post-delivery complication. There’s a significant difference across the three arms, with a higher percentage of women (15%) experiencing a complication after birth in the health promotion plus arm compared to the other study arms (8% in the comparison and 5% health promotion only arms).
When asked who they saw or would see for the complication, majority of women (94%) said a nurse/CHO/midwife followed by a doctor (11%). There is a significant difference between

41
arms, with two in five women from the health promotion plus arm saying they went or would go to a doctor for help for the complication compared to less than one in five women from the other two arms (3% in comparison and 9% in health promotion only arms).
Most women (89%) reported that they went or would go to a Health Center/PHU/Public hospital for help, and very few (8%) went or would go to an NGO facility.
No major difference in pattern of responses was observed between women with a live birth in the 12 months preceding the survey and women who are currently pregnant with regards to maternal complication behaviors.
Table 17. Percent distribution of maternal complication behaviors six weeks after delivery by currently pregnant women and women who have had a live birth in the past 12 months, by study arm
Live birth in past 12 months
(all 3 arms)
Live births and pregnancies
P-value Comparison
Health Promotion Plus
Health Promotion only
Total
Woman experienced a
complication postpartum*a n=501 n=163 n=160 n=178 n=501 Pr = 0.013
No 90% 91% 84% 95% 90%
Yes 9% 8% 15% 5% 9%
don't know 1% 1% 1% 0% 1%
Woman saw or would see for complication n=44 n=119 n=119 n=79 n=317
b
Doctor 11% 3% 19% 9% 11% Pr = 0.000
Nurse/CHO/midwife 86% 98% 92% 92% 94% Pr = 0.170
Other 5% 1% 0% 3% 1% Pr = 0.191
Which facility woman went or would go to for postpartum complication? n=41 n=120 n=115 n=78 n=313
c Pr = 0.000
Health Center/PHU/Public hospital 83% 94% 81% 98% 89%
NGO** 7% 6% 14% 1% 8%
Other 10% 0% 6% 1% 3% *Includes only women who have had a child in the past year a
The most common complication women experienced was high fever (7%, n=35) followed by excessive bleeding (4%, n=20) b
n=317 includes all currently pregnant women who would seek help for complication and only those women with a live birth in the 12 months preceding the survey who had experienced at least one complication and sought help for complication c missing 4 observations
**NGO refers to MSF hospital
7.2 Postnatal care visits for baby’s health
Less than half of women attended or planned to attend PNC for the baby’s health within 48 hours of delivery (Table 18). There is a significant difference across the arms: only one in three women attended or planned to attend from the comparison arm compared to two in three women from the health promotion only arm. In the 2008 Sierra Leone DHS, 54% of rural

42
women attended PNC for the baby’s health, which is comparable to the 52% of women with a live birth in the 12 months preceding the survey.
Almost all women (98%) saw or planned to see a nurse/CHO/midwife, with a significantly lower percentage of women from the health promotion plus arm compared to the other arms (100% and 99% from the comparison and health promotion only arms, respectively); however, 8% of women from the health promotion plus arm saw or would see a doctor for their baby’s postnatal care compared to only 5% of women from the health promotion only arm and 0% of women from the comparison arm.
Nine out of ten women (91%) across all three arms went or would go to a health facility, majority Health Center/PHU/Public hospital (84%), for the first postnatal care check for their baby’s health. A higher percentage of women from the health promotion plus arm went or would go to a health facility than women from the comparison (89%) or health promotion only (86%) arms. Fewer women (3%) from the health promotion plus arm had or planned to have the checkup at a home (either the respondent’s own, nurse/CHO/midwife, or TBA) compared to women from the other arms (10% and 11% of women from comparison and health promotion only arms, respectively).
Responses of women with a live birth in the 12 months preceding the survey and women who are currently pregnant were similar with regards to postnatal care visits for baby’s health.
Table 18. Percent distribution of postnatal care visits for baby's health by currently pregnant women and women who have had a live birth in the past 12 months, by study arm
Live birth in past 12 months
(all 3 arms)
Live births and pregnancies
P-value Comparison
Health Promotion Plus
Health Promotion only
Total
Woman attended PNC for BABY within 48 hours of delivery n=450 n=260 n=228 n=236 n=724 Pr = 0.000
No 47% 67% 54% 37% 53%
Yes 52% 32% 45% 61% 46%
don't know 0% 2% 1% 2% 2%
Woman saw or would see provider for BABY’s health post birth n=472 n=265 n=246 n=241 n=752
Doctor 3% 0% 8% 5% 4% Pr = 0.000
Nurse/CHO/midwife 98% 100% 96% 99% 98% Pr = 0.002
Other 0% 0% 0% 0% 0% Pr = 0.357
Where did/would the first PNC check for baby take place? n=472 n=265 n=246 n=241 n=752 Pr = 0.000
Respondent's home 2% 2% 1% 0% 1%
TBA home 0% 0% 0% 0% 0%
Nurse/CHO/Midwife home 8% 8% 2% 11% 7%
Health Center/PHU/Public hospital 82% 86% 79% 85% 84%

43
Private hospital 1% 0% 2% 0% 1%
Private clinic 0% 0% 0% 0% 0%
NGO* 6% 3% 14% 1% 6%
Other 1% 0% 1% 1% 1% *NGO refers to MSF hospital
Immediate newborn care
All babies need to be safely delivered, kept warm, and breastfed immediately. Low birth weight or premature babies may get cold, hungry, or sick more easily; therefore, these babies have special needs that an MNHP should be familiar with (WHO, 2006). A trained MNHP can help teach a mother who has given birth to a low birth weight or premature baby how to properly care for the baby so that the baby grows healthily. In the ENCC pilot, MNHPs are trained to begin advice on essential newborn care, such as kangaroo mother care, dry cord care, and the importance of exclusive breastfeeding.
In the baseline questionnaire, women who had a live birth in the year preceding the survey were asked about newborn care practices following delivery. Both women with facility and those with non-facility births are included in Table 19 and Table 20 to present the percent distribution of these practices by study arm.
WHO and UNICEF recommend early initiation of breastfeeding, within one hour of birth, to protect the newborn from acquiring infections and to reduce newborn mortality (WHO and UNICEF, 2003). In Bo District, all women breastfed their newborns, which is comparable to the 2008 Sierra Leone DHS where 95% of rural children born in the five years preceding the survey were ever breastfed (Table 19). Most of these women initiated breastfeeding less than 1 hour after birth (71%) as seen in Table 20Error! Reference source not found.. There is a significant difference across all three groups, with 82% of women in the comparison arm breastfeeding their babies within one hour after birth compared to only 71% in the health promotion plus and 63% in the health promotion only arms.
Table 19. Percent distribution of immediate newborn care practices by women who have had a live birth in the past 12 months, by study arm
Comparison Health Promotion Plus
Health Promotion only
Total P-value
% (total n) % (total n) % (total n) % (total n)
Newborn was EVER breastfed 100 (166) 100 (165) 100 (180) 100 (511) -
Baby was placed on bare chest immediately after delivery 33 (166) 49 (165) 16 (179) 32 (510) Pr = 0.000
Baby was dried after birth 84 (166) 87 (165) 72 (179) 81 (510) Pr = 0.002
Baby was bathed immediately after delivery 21 (166) 10 (164) 24 (180) 18 (510) Pr = 0.025
Baby's bath took place within 6 hours of delivery 50 (166) 34 (165) 36 (180) 40 (511) Pr = 0.007
Something applied to cord after it was cut 73 (166) 66 (163) 54 (180) 64 (509) Pr = 0.000

44
Skin-to-skin contact (kangaroo care)with the mother, drying the newborn immediately after birth, and delaying bath until six hours after birth are essential care practices for keeping the newborn warm (Moore et al, 2012; Save the Children, 2004). These strategies can improve newborn health and survival. Kangaroo mother care method is an effective way of maintaining the body temperature in low birth weight babies, at birth for all babies, or during transport of sick babies. Drying after delivery is one of several thermal care practices that can improve infant health outcomes, as well as delaying first bath.
Only one in three (32%) women in Bo District practice kangaroo care. Almost half of women (49%) in the health promotion plus arm practice this method, which is significantly higher than less than a third of women in the comparison (33%) and health promotion only (16%) arms. Four in five women in Bo District dried their newborns after birth. There is a significant difference across the three arms, with a lower percentage (72%) of women in the health promotion only arm adhering to this practice than women in the comparison (84%) and health promotion plus (87%) arms. More than half of women in Bo District delayed the first bath, although 40% of women bathed their newborn within six hours of delivery and 18% immediately after delivery. There is a significant difference between the arms, with half of women in the comparison group bathing their newborns within six hours of delivery compared to only 34% and 36% in the two ENCC intervention arms.
Keeping the newborn’s cord clean and dry is essential for avoiding life-threatening illness in the newborn (Save the Children, 2004). At baseline, women who have had a live birth in the year preceding the questionnaire were asked if anything was applied to the cord after it was cut. Two in three (64%) women in Bo District reported that something was applied to the cord post-delivery, with a significantly higher percentage (73%) in the comparison arm than the health promotion plus and health promotion only arms (66% and 54%, respectively). It is important to note that applying an antiseptic to the cord at the health facility is not harmful; however, it is not possible to differentiate antiseptic from other substances in the baseline data.
Table 20. Percent distribution of timing of breastfeeding by women who have had a live birth in the past 12 months, by study arm
Comparison Health Promotion Plus
Health Promotion only
Total P-value
Length of time after birth when baby was first breastfed
n=166 n=165 n=180 n=511 Pr = 0.000
Immediately 23% 32% 36% 30%
less than 1 hour 59% 39% 27% 41%
less than 24 hours 9% 27% 30% 22%
more than 24 hours 9% 3% 7% 7%
Immunizations
The baseline questionnaire collected information on vaccination coverage for all living children born in the year preceding the survey. Information was gathered on children who received vaccination against tuberculosis (BCG) and three doses of polio vaccines. BCG should be given at birth or at first clinical contact, whereas polio should be given within the first 14 days after birth (Save the Children, 2004). Table 21 presents the percent distribution of these

45
vaccinations among the three study arms. Across the three arms, majority of newborns (94%) received BCG vaccination, which is similar to the 99% of newborns from Bo District given BCG vaccination in the 2013 Sierra Leone DHS; however, in our data only one in four newborns (26%) received the vaccine within 24 hours after delivery at baseline. For polio, almost all newborns received the vaccine (93%), but only half of newborns (50%) received their first polio vaccine within 14 days of birth. There is a significant difference across the three study arms, with only 39% of newborns in the comparison arm receiving the first vaccine within 24 hours of birth compared to 48% in the health promotion plus and 64% in the health promotion only arms.
Table 21. Percent distribution of postnatal care services received by women who have had a live birth in the past 12 months, by study arm
Comparison Health Promotion Plus
Health Promotion only
Total P-value
% (total n) % (total n) % (total n) % (total n)
Newborn received BCG vaccination 96 (166) 90 (165) 94 (180) 94 (511) Pr = 0.065
BCG vaccination administered within 24 hours 25 (147) 22 (124) 31 (135) 26 (406) Pr=0.220
Newborn received polio vaccine 93 (166) 92 (164) 94 (180) 93 (510) Pr = 0.802
Newborns received first polio vaccine within 14 days of birth 39 (145) 48 (120) 64 (139) 50 (404) Pr = 0.000
Newborn complications six weeks after delivery
MNHPs from the ENCC pilot will be trained to refer newborns for complications to receive proper care. Table 22 presents a summary of complications newborns experienced six weeks after delivery by study arm. Approximately one quarter (23%) of newborns experienced a complication at baseline, with a significantly higher percentage (32%) from the health promotion plus arm compared to the other two arms (18% from the comparison and 21% from the health promotion only arms).
Most mothers (95%) saw or would see a nurse/CHO/midwife for the newborn complication, followed by a doctor (9%). A lower percentage of women (89%) from the health promotion plus arm saw or would see a nurse/CHO/midwife and a higher percentage (17%) saw or would see a doctor compared to the other two arms.
To seek help for the complication, most women (91%) went or would go to a Health Center/PHU/Public hospital, and very few (8%) women went or would go to an NGO. A lower percentage of women (83%) from the health promotion plus arm went or would go to a Health Center/PHU/Public hospital compared to the other arms (93% from the comparison and 91% from the health promotion only arms) and more (14%) went or would go to an NGO facility.
There were no major differences in pattern of responses between women with a live birth in the 12 months preceding the survey and women who are currently pregnant with regards to newborn complication behaviors.
Table 22. Percent distribution of newborn complication behaviors six weeks after delivery by currently pregnant women and women who have had a live birth in the past 12 months, by study arm

46
Live birth in past 12 months
(all 3 arms)
Live births and pregnancies
P-value Comparison
Health Promotion Plus
Health Promotion only
Total
Newborn experienced at least
one complication after delivery*a n=511 n=166 n=165 n=180 n=511 Pr = 0.037
No 76.3% 81.9% 67.9% 78.9% 76.3% Yes 23.1% 17.5% 31.5% 20.6% 23.1% Don’t know 0.6% 0.6% 0.6% 0.6% 0.6% Woman saw or would see
someone for newborn complication n=108 n=133 n=148 n=101 n=382
b
Doctor 7% 2% 17% 8% 9% Pr = 0.000
Nurse/CHO/midwife 93% 100% 89% 95% 95% Pr = 0.000
Other 2% 2% 2% 0% 2% Pr = 0.330
Which facility woman went or would go to FIRST for newborn complication n=95 n=131 n=120 n=100 n=351
c Pr = 0.000
Health Center/PHU/Public hospital 88% 93% 83% 96% 91%
NGO** 8% 6% 14% 3% 8%
Other 3% 1% 3% 1% 1% *Includes only women who have had a child in the past year a
The most common newborn complications were fever (20%, n=100) and difficulty feeding (4%, n=20). b
n=382 includes all currently pregnant women who would seek help for complication and only those women with a live birth in the 12 months preceding the survey who had experienced at least one complication and sought help for complication cn=351 includes currently pregnant women who would go somewhere for help for complication and only those women with a live birth in the
12 months preceding the survey who had experienced at least one complication and went somewhere for medical help **NGO refers to MSF hospital
8. TBA service provision
Although the policy change disallows TBA-led childbirth, TBAs provide health services widely in the community. For the baseline assessment, information was collected regarding practices and services provided by TBAs to women and newborns in the community.
8.1 Pregnancy care
Communities must understand that emergencies can occur at any given time during pregnancy, even if a woman receives good antenatal care. Therefore, women must be ready to seek prompt medical attention. They should know what to do and where to seek care for timely intervention to prevent maternal and neonatal deaths. In ENCC, MNHPs are trained to talk to women about birth plans and how planning ahead will help ensure that a woman has everything in place to get to a facility quickly and deliver her baby safely when the time comes, or if any problems arise during or after pregnancy.
Information on the advice TBAs provided to women and their newborns were collected at baseline. Table 23 presents a summary of this data across the three study arms. Out of women who saw a TBA during pregnancy, majority (84%) were advised by the TBA to make

47
preparations for delivery of her baby. Mainly, TBAs advised women to keep money (87%), followed by to make transport plans (15%), and to discuss plan with family (11%). Very few women were advised to get approval for plans (5%), to make other financial plans (2%), and to arrange for blood donor (1%).
In addition to providing birth plan advice, TBAs assess women for pregnancy danger signs. More than half of women who saw a TBA during their pregnancy were assessed by the TBA for headaches (64%), convulsions (52%), fever (67%), swelling of feet and limbs (64%), and bleeding (60%). Almost all women (94%) were advised by the TBAs on where to go if they had these symptoms. Nine in ten women (93%) were advised to go to a Health Center/PHU/Public hospital, although a higher percentage (15%) of women from the health promotion plus arm were advised to go to an NGO facility than women from the comparison (3%) and health promotion only (0%) arms.
Table 23. Percent distribution of TBA advice received by currently pregnant women and women who have had a live birth in the past 12 months, by study arm
Live birth in past 12 months
(all 3 arms)
Live births and pregnancies
P-value Comparison
Health Promotion Plus
Health Promotion only
Total
TBA advised woman to make preparations for delivery of baby n=264 n=153 n=115 n=98 n=366 Pr=0.001
No 15% 9% 16% 28% 16%
Yes 85% 91% 84% 72% 84%
TBA advised woman to: n=223 n=139 n=97 n=70 n=306
keep money 85% 86% 89% 86% 87% Pr=0.771
make other financial plans 2% 1% 3% 1% 2% Pr=0.363
make transport plans 17% 1% 26% 29% 15% Pr=0.000
arrange for blood donor 1% 0% 4% 0% 1% Pr=0.013
discuss plan with family 12% 5% 11% 24% 11% Pr=0.000
get approval for plans 6% 1% 5% 11% 5% Pr=0.007
Other 40% 53% 35% 17% 39% Pr=0.000
TBA assessed woman for: n=263 n=153 n=114 n=98 n=365
Headaches 60% 85% 37% 64% 64% Pr=0.000
Convulsion 49% 75% 32% 40% 52% Pr=0.000
Fever 64% 84% 49% 62% 67% Pr=0.000
swelling of feet/limbs 62% 83% 40% 63% 64% Pr=0.000
Bleeding 59% 82% 34% 57% 60% Pr=0.000
Woman was advised by TBA on where to go if she had symptoms n=198 n=137 n=69 n=76 n=282 Pr=0.180
No 8% 7% 10% 3% 6%
Yes 92% 93% 90% 97% 94%
Where woman was advised to go by TBA for symptoms n=183 n=128 n=62 n=74 n=264 Pr=0.000
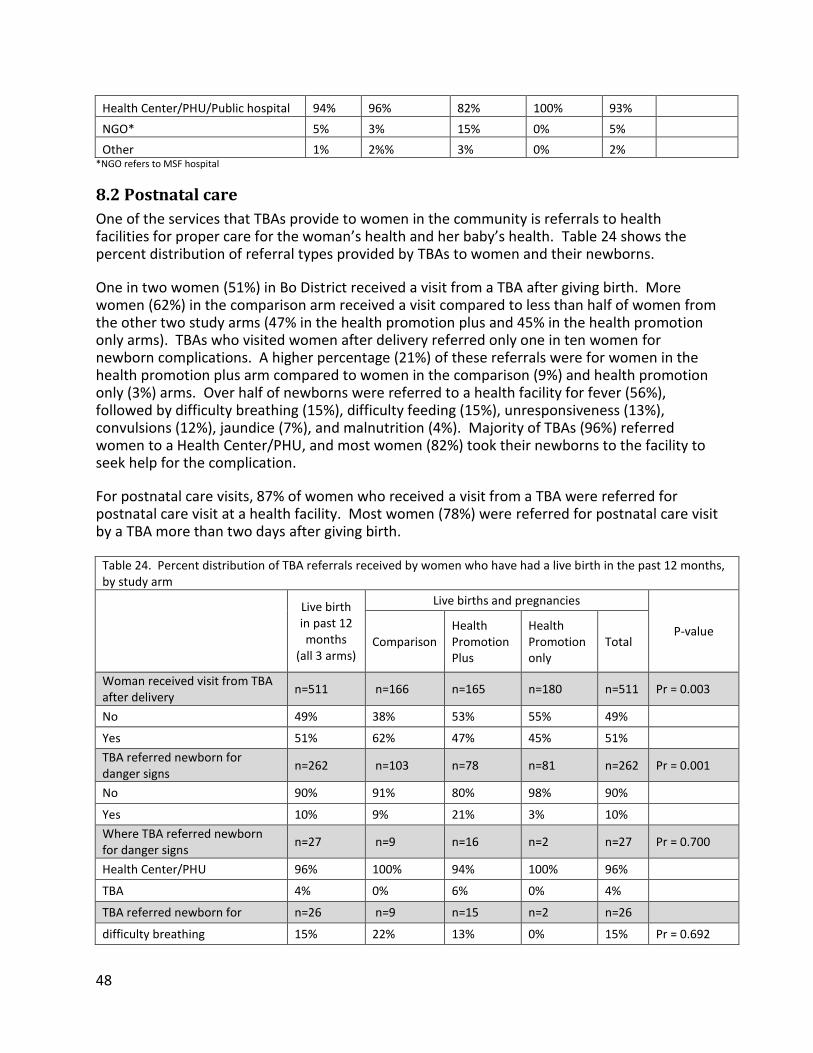
48
Health Center/PHU/Public hospital 94% 96% 82% 100% 93%
NGO* 5% 3% 15% 0% 5%
Other 1% 2%% 3% 0% 2% *NGO refers to MSF hospital
8.2 Postnatal care
One of the services that TBAs provide to women in the community is referrals to health facilities for proper care for the woman’s health and her baby’s health. Table 24 shows the percent distribution of referral types provided by TBAs to women and their newborns.
One in two women (51%) in Bo District received a visit from a TBA after giving birth. More women (62%) in the comparison arm received a visit compared to less than half of women from the other two study arms (47% in the health promotion plus and 45% in the health promotion only arms). TBAs who visited women after delivery referred only one in ten women for newborn complications. A higher percentage (21%) of these referrals were for women in the health promotion plus arm compared to women in the comparison (9%) and health promotion only (3%) arms. Over half of newborns were referred to a health facility for fever (56%), followed by difficulty breathing (15%), difficulty feeding (15%), unresponsiveness (13%), convulsions (12%), jaundice (7%), and malnutrition (4%). Majority of TBAs (96%) referred women to a Health Center/PHU, and most women (82%) took their newborns to the facility to seek help for the complication.
For postnatal care visits, 87% of women who received a visit from a TBA were referred for postnatal care visit at a health facility. Most women (78%) were referred for postnatal care visit by a TBA more than two days after giving birth.
Table 24. Percent distribution of TBA referrals received by women who have had a live birth in the past 12 months, by study arm
Live birth in past 12 months
(all 3 arms)
Live births and pregnancies
P-value Comparison
Health Promotion Plus
Health Promotion only
Total
Woman received visit from TBA after delivery
n=511 n=166 n=165 n=180 n=511 Pr = 0.003
No 49% 38% 53% 55% 49%
Yes 51% 62% 47% 45% 51%
TBA referred newborn for danger signs
n=262 n=103 n=78 n=81 n=262 Pr = 0.001
No 90% 91% 80% 98% 90%
Yes 10% 9% 21% 3% 10%
Where TBA referred newborn for danger signs
n=27 n=9 n=16 n=2 n=27 Pr = 0.700
Health Center/PHU 96% 100% 94% 100% 96%
TBA 4% 0% 6% 0% 4%
TBA referred newborn for n=26 n=9 n=15 n=2 n=26
difficulty breathing 15% 22% 13% 0% 15% Pr = 0.692

49
Convulsions 12% 22% 7% 0% 12% Pr = 0.446
Unresponsive 13% 13% 14% 0% 13% Pr = 0.849
Malnutrition 4% 0% 0% 50% 4% Pr = 0.002
difficulty feeding 15% 11% 19% 0% 15% Pr = 0.725
Jaundice 7% 0% 13% 0% 7% Pr = 0.476
Fever 56% 56% 56% 50% 56% Pr = 0.986
Woman took baby to facility due to danger signs (based on TBA referral)
n=27 n=9 n=16 n=2 n=27 Pr=0.048
No 19% 44% 6% 0% 19%
Yes 82% 56% 94% 100% 82%
Woman received referrals from TBA for PNC* n=16
n=61 n=36 n=21 n=118 Pr=0.000
No 0% 2% 19% 33% 13%
Yes 100% 98% 81% 67% 87%
How many days after delivery woman was referred by TBA for PNC* n=16 n=57 n=25 n=12 n=94
Pr = 0.003
1 day 13% 4% 16% 33% 11%
2 days 19% 7% 16% 25% 12%
more than 2 days 69% 90% 68% 42% 78% *Totals include both women who have had a child in the past year and women who are currently pregnant
9. Decision-making
Women were asked who the decision-makers are for whether they should seek medical help for problems that may occur during pregnancy, delivery, or postpartum (Table 25). This is important for both women’s empowerment and health. More than half (57%) of women responded that their husbands are the decision-makers for these situations, with only half women from the health promotion only arm compared to 66% from the health promotion plus and 55% from the comparison arm. As decision-makers, husbands are followed by the woman (37%), a health professional (33%), and the woman’s mother (20%).
Table 25. Percent distribution of women by decision making characteristics by study arm
Comparison Health Promotion Plus
Health Promotion only
Total P-value
Decision-maker for whether or not to seek medical help for problem during pregnancy, delivery, or postpartum n=274 n=264 n=255 n=793
No decision made 1% 10% 15% 8% Pr=0.000
God 11% 16% 5% 11% Pr=0.000
Respondent 33% 40% 37% 37% Pr=0.212
Husband 55% 66% 50% 57% Pr=0.001
Respondent's mother 18% 20% 22% 20% Pr=0.379
Mother-in-law 6% 8% 8% 7% Pr=0.676

50
Health professional 52% 19% 28% 33% Pr=0.000
TBA 19% 11% 4% 11% Pr=0.000
Other 12% 12% 10% 11% Pr=0.680
Women were also asked about their reasons for not going somewhere to seek medical help for problems they may face during pregnancy, delivery, or postpartum. Out of 12 women who did not go somewhere for help, eight women responded that the facility was too far, four that going somewhere for help was necessary, three that transport was not available, and three that money was not available.
Conclusion and Programmatic Implications The results presented in this report were collected to feed into the ENCC design and provide evidence for the indirect and direct outcomes of the ENCC pilot. As the results show, there is a need for a program such as the ENCC pilot to help countries such as Sierra Leone reach their MNCH targets by leveraging their MNHP communities. Many areas during pregnancy, delivery, and postpartum were identified in which the ENCC pilot may make the most impact; however, there are also other areas that still need to be investigated to comprehend what they imply with regards to the ENCC program.
These results provide base evidence for the status of key MNCH indicators in Bo District, which will be used to assess the pilot’s effect after the duration of the intervention. The results will be used to guide analysis, with some variables significantly differing across the three arms to be controlled for when comparing baseline and endline.
Based on the results, the ENCC team identified areas where the ENCC project could be most influential in improving indicators as well as areas where there needs to be further investigation of results.
During pregnancy, there is room for ENCC to improve the number of ANC visits, with only 68% of women receiving or planning to receive the recommended four or more ANC visits; as well as the timing of the first ANC visit, with only 44% of women obtaining ANC in the first three months of pregnancy. ENCC has also help increase the update of SP/Fansidar for malaria, as results show that only 29% of women reported taking the drug, compared to 60% of women who reported taking chloroquine. Baseline data also showed that very few women (17%) reported experiencing any complications during pregnancy. ENCC can help women recognize complications so that they can seek proper care.
For specific areas that can be improved during labor and delivery, ENCC could help increase women’s knowledge of immediate newborn care practices, as only 32% of women at baseline reported practicing kangaroo care and only 40% bathed their baby 6 hours after delivery. ENCC could also help decrease the practice of applying something to the cord after cutting it and bathing the baby immediately after delivery, which were reportedly 64% and 18% across the three arms, respectively. MNHPs will be trained to identify newborn complications after the first week after birth, and there is room for ENCC to improve this as low reporting on newborn complications six weeks after delivery was observed at baseline.
For areas after delivery, there is room for ENCC to improve breastfeeding behaviors and the length of timing for breastfeeding. On average at baseline, 30% of women reported breastfeeding their baby immediately after delivery, 41% reported breastfeeding within an

51
hour of birth, and 22% of women reported breastfeeding within 24 hours of birth. These figures seem low compared to the Sierra Leone 2008 DHS, which showed 45% of women reported breastfeeding within an hour and 87% within 24 hours. ENCC can also increase attendance for PNC for mother and baby within 48 hours of delivery.
The ENCC team identified areas in MNHP practices in which there is an opportunity for ENCC to improve. ENCC could help to increase the number of visits by MNHPs after delivery, the referrals by MNHPs for newborn dangers signs, and the timely referrals by MNHPs for PNC, which were all reportedly low at baseline. ENCC can also increase the advice provided by MNHPs for birth preparedness.
For areas in women’s knowledge and birth preparedness practices, ENCC can help increase knowledge among women on developing a birth preparedness plan. Majority of women at baseline were only able to name a few complications during pregnancy, labor, immediately postpartum, and for newborns. There is an opportunity for ENCC to increase the knowledge of women in identifying these complications. ENCC can also help increase the knowledge of women and correct misconceptions about pregnancy and preparations for pregnancy (e.g. women being able to leave the home after birth after 7 days or first 6 weeks; when a woman can go for check-up after delivering at home; when plans and preparations should be made for pregnant women; what plans to make in case woman experiences any problems during pregnancy; increase knowledge on services received at ANC, specifically blood pressure and receiving malaria drugs; and increase knowledge of newborn care). There is an opportunity for ENCC to help increase the adaption of key MNCH behaviors such as having someone who is a blood donor accompany the woman to facility during delivery; identifying a health center to deliver; discussing transport for delivery; putting aside money for delivery; and overall increasing the number of women who listen to MNCH advice provided by TBAs. These areas were reported to be relatively low at baseline. ENCC can also target key decision makers including husband, woman’s mother, and health professionals to increase care seeking behaviors.
The team also identified some areas where further investigated needs to be made to fully understand what the results imply. For areas prior to labor and delivery, the project will specifically look at the first versus second dose of Sp/Fansidar during monitoring. For areas during delivery, the team will continue to investigate the implications of a high percentage of women delivering or planning to deliver at a health facility, which is similar with the results from the 2008 Sierra Leone DHS. The team will also investigate whether women are actually going to a health center/PHU/public hospital for delivery, as 76% of women on average said they went or would go here for delivery. In the 2008 Sierra Leone DHS, only 30 % of women from rural areas reported delivering at a PHU/Health center and in Bo specifically, this was 51%,
When women were asked about delivery in the presence of skilled provider, on average 87% of women at baseline reported that they delivered or would deliver in the presence of a nurse/CHO/midwife. In the 2008 DHS, on average in rural areas, 76% of women reported delivering in front of nurse/midwife. Further investigation of why this percentage is higher at baseline compared to DHS data is needed. Also 18% of women from the baseline reported that they delivered in front of a TBA compared to 44% in the 2008 DHS. This percentage has gone down, probably due to GoSL discouraging TBA delivery. The ENCC team will investigate whether this question captured if TBAs are accompanying mothers to the facility. It is also necessary to further investigate the reportedly high percentage of women who plan to go to a

52
health center/PHU/public hospital or NGO for a complication. The ENCC team will check and see if this is actually happening.
In terms of who the women saw or would see for PNC, the baseline survey shows 98% of women said that they saw or would see nurse/CHO/midwife compared to 15.2% reported in the 2008 DHS. It is necessary to investigate why baseline results are high compared to the DHS data. Also in the DHS 2013, the percentage of children receiving BCG within 24 hours or receiving their first polio vaccine is high compared to what was recorded at baseline, so it is necessary to investigate this difference.

53
References
Government of Sierra Leone Ministry of Health and Sanitation (2010). Basic Package of Essential Health Services for Sierra Leone.
Graham, W.J., Bell, J.S., & Bullough C.H.W. (2001). Can skilled attendance at delivery reduce maternal mortality in developing countries? In W.V. Lerberghe and V. De Brouwere (Eds.), Safe Motherhood Strategies: A review of the evidence. Antwerp, Belgium: ITG Press.
Hailu, M., Gebremariam, A., Alemseged, F., and Deribe, K. (2011) Birth preparedness and complication readiness among pregnant women in Southern Ethiopia. PLoS One, 6 (6), e21432. doi:10.1371/journal.pone.0021432.
Jhpiego (2004). Monitoring birth preparedness and complication readiness tools and indicators for maternal and newborn health. Baltimore, Maryland, USA: Jhpiego.
Lincetto, O., Mothebesoane-Anoh, S., Gomez, P., and Munjanja, S. (2006). Antenatal Care. In J. Lawn and K. Kerber (Eds.), The partnership for maternal, newborn, and child health, opportunities for Africa’s newborns (pp 51-62). Geneva, Switzerland: WHO.
Ministry of Health and Sanitation (MOHS) [Sierra Leone]. 2006. Malaria control programme mission, objectives and aims. Freetown, Sierra Leone: MHS. Available at: http://www.health.sl/drwebsite/publish/printpage_46.shtml
Moore ER, Anderson GC, Bergman N, Dowswell T. Early skin-to-skin contact for mothers and their healthy newborn infants. Cochrane Database of Systematic Reviews 2012, Issue 5.
Moran, A.C., Sangli, G., Dineen, R., Rawlins, B., Yameogo, M., and Baya, B. Birth-preparedness for maternal health: findings from Koupela District, Burkina Faso. Journal of Health, Population Nutrition, 24 (4): 489-497.
Save the Children (2004). Every Newborn’s Health: Recommendations for Care for All Newborns. Washington, DC: Save the Children.
Statistics Sierra Leone (SSL) and ICF Macro (2009). Sierra Leone Demographic and Health Survey 2008. Calverton, Maryland, USA: Statistics Sierra Leone (SSL) and ICF Macro.
UNFPA 2011. State of the World’s Midwifery Sierra Leone Country Profile.
World Health Organization and UNICEF (2003). Global strategy for infant and young child feeding. Geneva, Switzerland: World Health Organization.
Word Health Organization (2006). Standards for Maternal and Neonatal Care. Department of Making Pregnancy Safer. Geneva, Switzerland: World Health Organization.
World Health Organization (2010). Guidelines for the treatment of malaria. Second edition. Geneva, Switzerland: World Health Organization.
World Health Organization (2012). Trends in maternal mortality: 1990 to 2010. WHO, UNICEF, UNFPA and The World Bank estimates. Geneva, Switzerland: World Health Organization.