Spitzer's View on Aromatic and Aliphatic Hydrocarbon Emission in Herbig Ae Stars
37
arXiv:1006.1130v1 [astro-ph.SR] 6 Jun 2010 Spitzer’s view on aromatic and aliphatic hydrocarbon emission in Herbig Ae stars B. Acke 1,2 , J. Bouwman 3 ,A.Juh´asz 3 , Th. Henning 3 , M.E. van den Ancker 4 , G. Meeus 5 , A.G.G.M. Tielens 6 and L.B.F.M. Waters 1,7 [email protected] ABSTRACT The chemistry of astronomical hydrocarbons, responsible for the well-known infrared emission features detected in a wide variety of targets, remains enigmatic. Here we focus on the group of young intermediate-mass Herbig Ae stars. We have analyzed the aliphatic and polycyclic aromatic hydrocarbon (PAH) emission features in the infrared spectra of a sample of 53 Herbig Ae stars, obtained with the Infrared Spectrograph aboard the Spitzer Space Telescope. We confirm that the PAH-to-stellar luminosity ratio is higher in targets with a flared dust disk. However, a few sources with a flattened dust disk still show relatively strong PAH emission. Since PAH molecules trace the gas disk, this indicates that gas disks may still be flared, while the dust disk has settled due to grain growth. There are indications that the strength of the 11.3-μm feature also depends on dust disk structure, with flattened disks being less bright in this feature. We confirm that the CC bond features at 6.2 and 7.8 μm shift to redder wavelengths with decreasing stellar effective temperature. Moreover, we show that this redshift is accompanied by a relative increase of aliphatic CH emission and a decrease of the aromatic 8.6-μm CH feature strength. Cool stars in our sample are surrounded by hydrocarbons with a high aliphatic/aromatic CH ratio and a low aromatic CH/CC ratio, and vice versa for the hot stars. We conclude that, while the overall hydrocarbon emission strength depends on the dust disk’s geometry, the relative differences seen in the IR emission features in disks around Herbig Ae stars are mainly due to chemical differences of the hydrocarbon molecules induced by the stellar UV field. Strong UV flux reduces the aliphatic component and emphasizes the spectral signature of the aromatic molecules in the IR spectra. Subject headings: astrochemistry, stars: pre-main sequence, planetary systems: protoplanetary disks, infrared: general 1 Instituut voor Sterrenkunde, K.U.Leuven, Celestijnen- laan 200D, B-3001 Leuven, Belgium 2 Postdoctoral Fellow of the Fund for Scientific Research, Flanders. 3 Max-Planck-Institute for Astronomy, K¨ onigstuhl 17, D-69117 Heidelberg, Germany 4 European Southern Observatory, Karl-Schwarzschild- Strasse 2, D-85748 Garching bei M¨ unchen, Germany 5 Universidad Aut´onoma de Madrid, Departamento de F´ ısica Te´ orica C-XV, 28049 Madrid, Spain 6 Leiden Observatory, P.O. Box 9513, NL-2300 RA Lei- den, the Netherlands 7 Astronomical Institute “Anton Pannekoek”, University of Amsterdam, Science Park 904, 1098 XH Amsterdam, the 1. Introduction Herbig Ae stars are pre- and zero-age main- sequence stars of a few solar masses. They are surrounded by a circumstellar disk, a rem- nant of the star-formation process. Meeus et al. (2001) have classified the spectral energy distribu- tions (SEDs) of these targets into two groups, which reflect the geometry of the dust disk. Group I sources have a strongly flared outer disk, while the disks in group II sources are flatter. Netherlands 1
-
Upload
natuurwetenschappen -
Category
Documents
-
view
1 -
download
0
Transcript of Spitzer's View on Aromatic and Aliphatic Hydrocarbon Emission in Herbig Ae Stars
arX
iv:1
006.
1130
v1 [
astr
o-ph
.SR
] 6
Jun
201
0
Spitzer’s view on aromatic and aliphatic
hydrocarbon emission in Herbig Ae stars
B. Acke1,2, J. Bouwman3, A. Juhasz3, Th. Henning3, M.E. van den Ancker4, G. Meeus5,
A.G.G.M. Tielens6 and L.B.F.M. Waters1,7
ABSTRACT
The chemistry of astronomical hydrocarbons, responsible for the well-known infrared emissionfeatures detected in a wide variety of targets, remains enigmatic. Here we focus on the group ofyoung intermediate-mass Herbig Ae stars. We have analyzed the aliphatic and polycyclic aromatichydrocarbon (PAH) emission features in the infrared spectra of a sample of 53 Herbig Ae stars,obtained with the Infrared Spectrograph aboard the Spitzer Space Telescope. We confirm thatthe PAH-to-stellar luminosity ratio is higher in targets with a flared dust disk. However, afew sources with a flattened dust disk still show relatively strong PAH emission. Since PAHmolecules trace the gas disk, this indicates that gas disks may still be flared, while the dust diskhas settled due to grain growth. There are indications that the strength of the 11.3-µm featurealso depends on dust disk structure, with flattened disks being less bright in this feature. Weconfirm that the CC bond features at 6.2 and 7.8µm shift to redder wavelengths with decreasingstellar effective temperature. Moreover, we show that this redshift is accompanied by a relativeincrease of aliphatic CH emission and a decrease of the aromatic 8.6-µm CH feature strength.Cool stars in our sample are surrounded by hydrocarbons with a high aliphatic/aromatic CHratio and a low aromatic CH/CC ratio, and vice versa for the hot stars. We conclude that, whilethe overall hydrocarbon emission strength depends on the dust disk’s geometry, the relativedifferences seen in the IR emission features in disks around Herbig Ae stars are mainly due tochemical differences of the hydrocarbon molecules induced by the stellar UV field. Strong UV fluxreduces the aliphatic component and emphasizes the spectral signature of the aromatic moleculesin the IR spectra.
Subject headings: astrochemistry, stars: pre-main sequence, planetary systems: protoplanetary disks,
infrared: general
1Instituut voor Sterrenkunde, K.U.Leuven, Celestijnen-
laan 200D, B-3001 Leuven, Belgium2Postdoctoral Fellow of the Fund for Scientific Research,
Flanders.3Max-Planck-Institute for Astronomy, Konigstuhl 17,
D-69117 Heidelberg, Germany4European Southern Observatory, Karl-Schwarzschild-
Strasse 2, D-85748 Garching bei Munchen, Germany5Universidad Autonoma de Madrid, Departamento de
Fısica Teorica C-XV, 28049 Madrid, Spain6Leiden Observatory, P.O. Box 9513, NL-2300 RA Lei-
den, the Netherlands7Astronomical Institute “Anton Pannekoek”, University
of Amsterdam, Science Park 904, 1098 XH Amsterdam, the
1. Introduction
Herbig Ae stars are pre- and zero-age main-sequence stars of a few solar masses. Theyare surrounded by a circumstellar disk, a rem-nant of the star-formation process. Meeus et al.(2001) have classified the spectral energy distribu-tions (SEDs) of these targets into two groups,which reflect the geometry of the dust disk.Group I sources have a strongly flared outer disk,while the disks in group II sources are flatter.
Netherlands
1
The outer disk surface of the latter lies in theshadow of the inner disk (Dullemond et al. 2001;Dullemond & Dominik 2004a; Acke et al. 2009).Both theory (Dullemond & Dominik 2004b; Meijer et al.2008) and observations (Acke et al. 2004) indicatethat this difference in disk geometry is due to dustgrain growth and subsequent settling to the mid-plane. Also the smallest dust grains in the disksurface layer appear to show evidence for sedimen-tation, although the correlation between grain sizeand flaring could also be due to a radial gradientin grain size (Bouwman et al. 2008; Furlan et al.2009, Juhasz et al. 2010).
The material content of these circumstellardisks has been primarily studied based on in-frared (IR) spectra obtained with ground-basedinstruments and spectrographs aboard satellitemissions such as the Infrared Space Observa-tory (ISO, Kessler et al. 1996) and, more re-cently, the Spitzer Space Telescope (Werner et al.2004a). IR spectroscopy probes the thermalemission of the warm surface layer of the disk.Micrometer-sized silicate dust grains, both amor-phous and crystalline, are commonly detectedboth because of their abundance and the factthat their optical properties give rise to strongbands in this wavelength regime (see the reviewby Henning & Meeus 2009). The spectral finger-print of the silicates has been interpreted in termsof grain growth and crystallisation of the small-est grains in the disk (e.g., Bouwman et al. 2001;Acke & van den Ancker 2004; van Boekel et al.2005; Sargent et al. 2009). Besides silicate bands,the IR spectra of many Herbig Ae stars displaystrong emission features from polycyclic aromatichydrocarbon (PAH) molecules. In this paper, wefocus on these molecules. They trace the carbona-ceous component of the circumstellar matter.
Next to its detection in Herbig Ae stars,PAH emission is observed in a multitude of ob-jects and environments, including the interstellarmedium (ISM), T Tauri stars, reflection nebu-lae (RNe), and, occasionally, evolved stars. Theemission features are the result of IR fluorescenceof PAH molecules pumped by ultraviolet radia-tion. Ionized PAHs can also be excited by opti-cal and near-IR photons (e.g., Li & Draine 2002;Mattioda et al. 2005a,b). Because of the stochas-tic nature of the heating process, PAH emissioncan be seen even far from the illuminating UV
source. For a comprehensive review on interstel-lar PAHs, we refer to Tielens (2008).
Astronomical PAH features come in differentflavors and show a broad variety in shape, wave-length position and relative intensity. It is be-lieved that this diversity has its origin in a dif-ferent chemical constitution and ionization stateof the carriers. The wealth of laboratory mea-surements and theoretical computations of hydro-carbon IR spectra has deepened our understand-ing of the emission features. While the featuresat 3.3µm, 8.6µm and in the 10–14-µm range areattributed to CH stretching and bending modes,the features at 6.2µm and 7–9µm are due to CCstretching modes (Allamandola et al. 1989). Ion-ization enhances the strength of the CC modes(6–9µm) relative to the CH modes (10–14µm).The molecular size mainly affects the CC fea-tures, while the changes in the CH modes are ex-pected to be more subtle. The 8.6-µm feature, at-tributed to the CH in-plane bending mode, is sug-gested to be produced by large (NC ∼ 100) com-pact PAHs only (Bauschlicher et al. 2008). The7–9-µm complex consists of several sub-bands,with the most prominent at 7.6 and 7.8µm pro-duced by small and large ionized PAHs respec-tively (Bauschlicher et al. 2008, 2009).
Despite our theoretical and experimental knowl-edge of PAHs, none of the astronomical spectracan be satisfactorily fitted with the available setof computed/laboratory spectra. Many analysestherefore focus on observational correlations. Fea-tures produced by CC modes correlate better witheach other than with CH-mode features, and viceversa. Hony et al. (2001) have investigated theCH out-of-plane modes (10–14µm) in a sampleof various astronomical targets. The 11.3-µm fea-ture is ascribed to lone (solo) CH groups found inPAH molecules with long straight edges, while thefeatures at 12.0, 12.7, 13.5 and 14.2µm are linkedto duo, trio, quartet and quintet CH modes, in-dicative of corners in the molecular structure.
Peeters et al. (2002) categorized the astronom-ical PAH spectra in 3 classes, reflecting the peakposition of the major features in the 6–9-µm range.Class A contains the targets with the bluest fea-tures, mainly general ISM sources, Hii regionsand RNe. Class C, characterized by the red-dest features, consists mainly of cool carbon-rich(post-)AGB and red giant stars (Sloan et al. 2007;
2
Gielen et al. 2009; Smolders et al. 2010); Class Bsources have intermediate feature peak positions,and include the Herbig Ae stars and most PNe.Sloan et al. (2005) and Sloan (2008) propose tocategorize the PAH spectra of Herbig Ae stars ina new class (dubbed Class B′). Their 7–9-µm fea-tures show an extended red wing beyond 8.0µm,which is absent in the Class B features of PNe.
The wavelength shift of the features has beenobservationally linked to the effective temperatureof the central star (Sloan et al. 2007; Boersma et al.2008; Keller et al. 2008), with cooler stars display-ing redshifted IR emission features. This indicatesthat the chemistry of the emitting hydrocarbonmolecules depends on the properties of the stellarradiation field.
A plateau with superimposed narrow fea-tures has been detected in the 15–21-µm rangein a number of targets (Beintema et al. 1996;Van Kerckhoven et al. 2000; Sturm et al. 2000;Werner et al. 2004b; Sellgren et al. 2007). It is ourobservation that most of these targets, if not all,belong to Class A. Peeters et al. (2004) attributethe narrow features to out-of-plane skeletal CCCmodes of gas-phase PAH molecules. The authorsargue that the latter are large elongated PAHswith straight edges and few pendant rings.
All features mentioned above are ascribedto PAHs. Their fundamental constituents arearomatic (i.e. benzenoid) rings. Aliphatic hy-drocarbon molecules do not have such rings.The features at 6.8 and 7.2µm, detected in anumber of sources, are attributed to aliphaticbonds (e.g., Furton et al. 1999; Chiar et al. 2000;Dartois et al. 2007; however, see also Bauschlicher et al. 2009).The 6.8-µm feature is linked to CH bending modesin both CH2 and CH3 functional groups, the 7.2-µm feature only to CH3. Hydrocarbon moleculeswith mixed hybridization display aromatic as wellas aliphatic emission features.
The work presented in this paper is performedin the framework of an infrared study of a largesample of Herbig Ae stars, based on IR spec-tra collected with the Spitzer Space Telescope.Acke et al. (2009) investigated the geometry of thedust disk based on the strength and slope of thethermal infrared emission. We refine the interpre-tation of the Meeus group I/group II classificationand show that the height of the inner disk variesover the sample. This leads to a varying amount
of shadowing of the outer disk and a change in theshape of the infrared continuum emission. Juhaszet al. (2010, submitted to ApJ; hereafter J10)present the full spectral decomposition into dustand continuum components. The characteristicsof the amorphous and crystalline silicate contentof the upper disk layers are related to stellar anddisk properties. The current paper focuses onthe IR emission features produced by aromaticand aliphatic hydrocarbon molecules. Given theirimportance in the surface layers of circumstellardisks, where they increase the gas temperaturethrough photoelectric heating and provide the sur-face for chemical reactions, a better characteri-zation of their chemical properties is needed toimprove our understanding of circumstellar diskstructure and evolution. Furthermore, the life cy-cle of hydrocarbon molecules in space is poorlyunderstood (e.g., Henning & Salama 1998). Here,we aim to contribute to these topics.
2. Data set
2.1. Spitzer IRS spectra
We have gathered infrared spectra of 53 iso-lated Herbig Ae stars obtained with the InfraredSpectrograph (IRS, Houck et al. 2004) aboard theSpitzer Space Telescope. Most of these sourceswere observed within the programs The miner-alogy of proto-planetary disks surrounding Her-big Ae/Be stars (PID 3470, PI J. Bouwman) andProbing the disk mineralogy and geometry of Her-big Ae/Be stars (PID 20308, PI B. Acke). Thespectra are characterized by a very high signal-to-noise ratio, typically several hundreds. For adetailed description of the data reduction process,the reduced spectra, and the sample targets, werefer to J10.
For each of the sample targets, published photo-metric data are gathered to compile the spectralenergy distributions. A reddened Kurucz (1991)model was fitted to the observed UV-optical pho-tometry. The circumstellar IR excess flux is char-acterized by several parameters such as excessmagnitudes and spectral indices in the near-to-far-IR and at (sub-)mm wavelengths. Table 1summarizes a few of these parameters. Based onthe SED, we have classified the sample into theMeeus groups according to the method proposedby van Boekel et al. (2005). For details, we refer
3
to J10.
2.2. Extraction of the PAH spectrum
In this section, we describe how the hydrocar-bon emission features are separated from the ther-mal emission of the circumstellar dust. The IRSspectrum was split into two wavelength intervals(5–7 and 7–14µm) which are treated differently.
The 5–7-µm wavelength range is characterizedby the presence of carbonaceous features on top ofa relatively smooth dust continuum. In this inter-val, the continuum was approximated with a sin-gle spline through anchor points at 5.35, 5.45, 5.58,5.82, 6.66, 7.06, 7.37, 7.40, 7.55 and 7.70µm. Notethat the broad 7–9-µm PAH feature is treated asa continuum to the weaker features that are lo-cated on top of it. The features in the continuum-subtracted spectrum are measured according tothe procedure described in Sect. 2.3.
The PAH features in the 7–14-µm wavelengthrange are less easily extracted from the originalspectrum, as the underlying “continuum” maycontain strong features of amorphous and crys-talline silicate dust. Keller et al. (2008) show thatspline fits are only applicable to spectra with ahigh feature-to-continuum contrast. In spectrawith strong silicate bands, artificial features arecreated. Keller et al. (2008) therefore only con-sider the strongest PAH sources in their analy-sis. In an attempt to reach weak PAH features,we follow a different approach. Six of our sampletargets have a spectrum characterized by strongPAH emission and by the absence/weakness ofsilicate features. These sources are HD34282,RR Tau, HD97048, HD 135344B, HD141569 andHD169142. Their PAH profiles are representa-tive for those observed in the entire sample, cov-ering the observed range in feature peak posi-tion, shape and width. A single spline was fittedthrough continuum anchor points at 5.52, 5.83,6.66, 7.06, 9.54, 10.32, 13.08 and 13.85µm. Thespline-subtracted spectra were used as PAH tem-plate spectra. Each template spectrum is cut intofive separate “PAH feature complexes” at 5.5–7.0,7.0–8.2, 8.2–9.2, 10.5–12.3 and 12.2–13.5µm. Theprocedure to obtain full 5–16-µm spectral decom-position of the IRS spectra makes use of these tem-plates. For each of the PAH complexes, the fit-ting routine picks one of the six template spectra,appropriately rescaled. The best fit for a certain
target includes a PAH spectrum which is a scaledcombination of five template spectra. The inclu-sion of PAH template spectra prevents the fittingroutine from compensating for the PAH featuresusing the dust species in the model. Hence, the re-sults of the dust fit should be more reliable. More-over, after subtraction of the dust+continuumpart of the best spectral fit to the original spec-trum, the residual spectrum is the real PAH spec-trum of the target. Fig. 1 shows the residual spec-tra. A detailed description of the dust modelingcan be found in J10.
The procedure works well for most spectra.However, some residuals of the crystalline sili-cate features remain. This is due to a slight mis-match in peak wavelength between the observa-tions and the computed silicate opacities (see J10for details). The residuals hamper an accurateextraction of the PAH features with low peak-to-continuum ratios, especially in the 10–14-µmregion. Fig. 2 shows the resulting PAH spectraof two silicate-dominated targets. In the case ofHD 35187, the procedure leads to an excellent re-sult; for HD244604, the extraction method cre-ates strong artifacts in the 7–12-µm region. Thefeatures in this region cannot be detected with 3-sigma significance.
The aromatic-CCC bending-mode feature ispresent in the 16–19-µm range of a handful ofsources. A spline through anchor points at 14.0,14.8, 15.0, 15.4, 15.6, 18.1, 18.6, 19.3 and 19.5µm,approximating the underlying continuum, is sub-tracted.
2.3. Derivation of the observables
We aim at investigating whether the aliphaticand aromatic features observed in the spectra dis-play the signature of chemical diversity and evo-lution of their carriers. To do so, the detectedfeatures are captured in a number of representa-tive parameters. We stay as close as possible tothe real measurements, and avoid the use of ap-proximate line profiles such as Gaussian curves. Inthis section, we describe how the observables areobtained.
For each feature, a wavelength interval indi-cating its blue and red limits is defined based onthe best-quality PAH-dominated spectra wherethe feature is detected (HD34282, HD97048,
4
HD169142 and RR Tau). This wavelength inter-val was visually checked for each individual targetin order to avoid false detections. To minimize theeffect of residuals of the continuum subtraction, ei-ther the spline or dust model, a straight line whichconnects the blue and red limit is subtracted fromthe spectrum. The integrated line flux is the to-tal integral of the resulting continuum-subtractedfeature. Furthermore, the centroid position ofthe feature (i.e. the flux-weighted barycenter), thefull width at half maximum (FWHM), the peakposition and the peak flux are determined. Uncer-tainties on the first two parameters were deduceddirectly from the error bars on the spectrum. Forthe FWHM, peak position and peak flux, the fol-lowing approach was taken: 100 spectra of thefeature were simulated around the original spec-trum, assuming a Gaussian error distribution witha sigma equal to the error in each spectral pixel.In each of these spectra, we determine the FWHM,peak position and peak flux of the feature. Thestandard deviation of these measurements is takenas the error on the feature parameter determinedfrom the original spectrum.
To quantify the influence of our choice of thefeature wavelength limits on the measurements,the procedure described above was repeated overa slightly larger wavelength interval: the blue limitwas shifted one spectral pixel to the blue, andthe red limit one pixel to the red. The differencebetween the two values for each parameter wasused to estimate the error induced by the choiceof wavelength limits. The final error on our mea-surements is the square root of the quadratic sumof the latter, systematic, error and the observa-tional error described above.
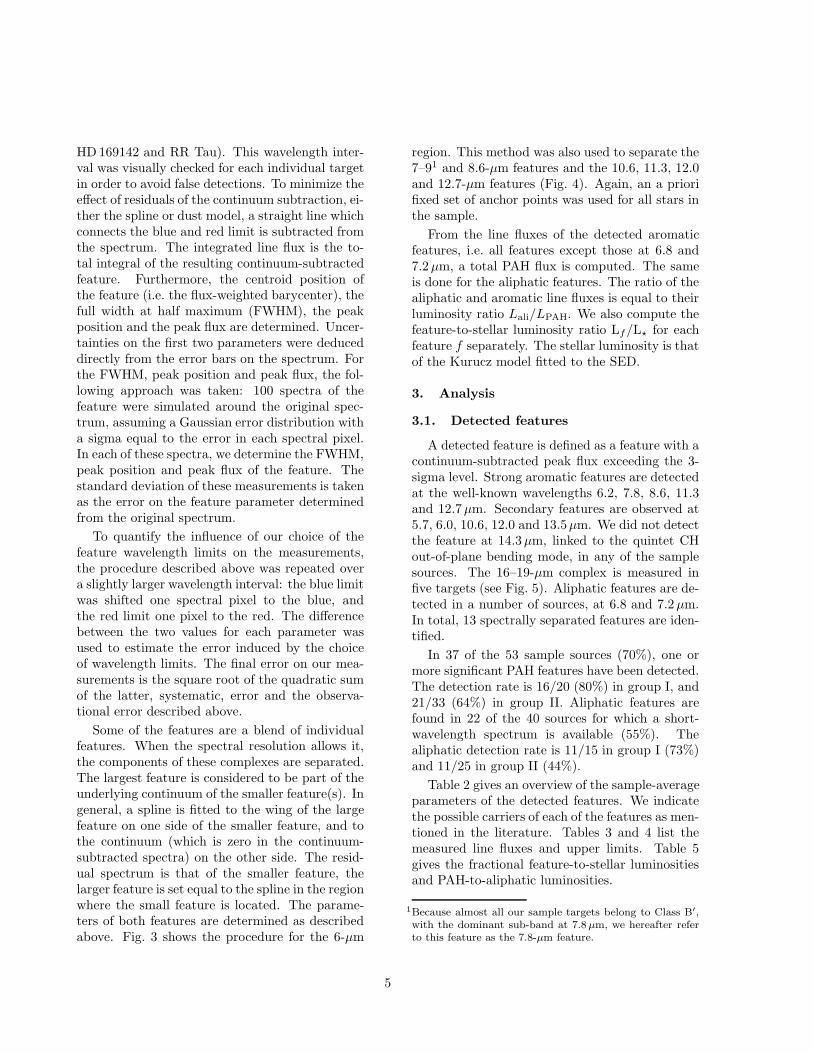
Some of the features are a blend of individualfeatures. When the spectral resolution allows it,the components of these complexes are separated.The largest feature is considered to be part of theunderlying continuum of the smaller feature(s). Ingeneral, a spline is fitted to the wing of the largefeature on one side of the smaller feature, and tothe continuum (which is zero in the continuum-subtracted spectra) on the other side. The resid-ual spectrum is that of the smaller feature, thelarger feature is set equal to the spline in the regionwhere the small feature is located. The parame-ters of both features are determined as describedabove. Fig. 3 shows the procedure for the 6-µm
region. This method was also used to separate the7–91 and 8.6-µm features and the 10.6, 11.3, 12.0and 12.7-µm features (Fig. 4). Again, an a priorifixed set of anchor points was used for all stars inthe sample.
From the line fluxes of the detected aromaticfeatures, i.e. all features except those at 6.8 and7.2µm, a total PAH flux is computed. The sameis done for the aliphatic features. The ratio of thealiphatic and aromatic line fluxes is equal to theirluminosity ratio Lali/LPAH. We also compute thefeature-to-stellar luminosity ratio Lf/L⋆ for eachfeature f separately. The stellar luminosity is thatof the Kurucz model fitted to the SED.
3. Analysis
3.1. Detected features
A detected feature is defined as a feature with acontinuum-subtracted peak flux exceeding the 3-sigma level. Strong aromatic features are detectedat the well-known wavelengths 6.2, 7.8, 8.6, 11.3and 12.7µm. Secondary features are observed at5.7, 6.0, 10.6, 12.0 and 13.5µm. We did not detectthe feature at 14.3µm, linked to the quintet CHout-of-plane bending mode, in any of the samplesources. The 16–19-µm complex is measured infive targets (see Fig. 5). Aliphatic features are de-tected in a number of sources, at 6.8 and 7.2µm.In total, 13 spectrally separated features are iden-tified.
In 37 of the 53 sample sources (70%), one ormore significant PAH features have been detected.The detection rate is 16/20 (80%) in group I, and21/33 (64%) in group II. Aliphatic features arefound in 22 of the 40 sources for which a short-wavelength spectrum is available (55%). Thealiphatic detection rate is 11/15 in group I (73%)and 11/25 in group II (44%).
Table 2 gives an overview of the sample-averageparameters of the detected features. We indicatethe possible carriers of each of the features as men-tioned in the literature. Tables 3 and 4 list themeasured line fluxes and upper limits. Table 5gives the fractional feature-to-stellar luminositiesand PAH-to-aliphatic luminosities.
1Because almost all our sample targets belong to Class B′,
with the dominant sub-band at 7.8µm, we hereafter refer
to this feature as the 7.8-µm feature.
5
3.2. Correlations
We searched for correlations between the fea-ture parameters, the stellar parameters and thedisk parameters derived from the SED. To com-pare two parameters, the Kendall tau-rank corre-lation coefficient was computed, which is a non-parametric statistic (Kendall 1938). A correlationis marked statistically significant if its p-value isless than 1%, under the assumption that no cor-relation is present, before and after removal of theoutliers. Hence, apparent correlations based ononly a few data points are removed, as well asthose induced by outliers.
The sample targets are classified in the twoMeeus groups. In all figures presented in this pa-per, group I sources are the black dots, group IIthe red dots. For all feature parameters, wechecked whether their values are significantly dif-ferent in one group with respect to the other. Weused the non-parametric Wilcoxon rank-sum testfor assessing whether two independent samplesof observations come from the same distribution(Mann & Whitney 1947).
4. Results
4.1. The chemical diversity of PAHs in
Herbig Ae stars
The Peeters spectral classification is interpretedin terms of chemical diversity of the hydrocar-bon carriers of the features. The CC stretch-ing feature at 6.2µm in astronomical spectra isshifted with respect to its theoretical position at6.4µm. This is also the case in our sample. Theshift has been ascribed to the inclusion of nitrogenatoms in the PAH skeletal structure. The featureis increasingly bluer when the N atom is substi-tuted deeper in the PAH molecule (Hudgins et al.2005). Also the anion-to-cation ratio may play arole (Bauschlicher et al. 2009). However, the peakpositions of the 6.2 and 7.8-µm features correlate(Fig. 6). While the general blueshift of the fea-ture from 6.4 to 6.2µm may still be attributed tonitrogen pollution, the latter cannot account forthe progressive shift of the 6.2 and 7.8-µm fea-tures. Pino et al. (2008) have performed labora-tory measurements and show that a shift of the6.2-µm feature to longer wavelengths points to ahigher aliphatic/aromatic content of the hydrocar-
bon mixture.
The feature-to-stellar luminosity ratios of al-most all PAH features (at 5.7, 6.0, 6.2, 7.8, 8.6,10.6, 11.3, 12.0 and 12.7µm) correlate with eachother. This indicates that these PAH features ap-pear together in the spectrum of a Herbig Ae star,and roughly scale together in strength. The rel-ative strengths of the aliphatic and aromatic fea-tures, on the other hand, are not connected. Wealso find dozens of significant correlations of lineflux ratios. The strongest correlation in our sam-ple is between the 6.2 and 7.8-µm features, bothlinked to CC modes. Tight connections were alsofound between the 6.2 and 8.6-µm, the 7.8 and8.6-µm, and the 11.3 and 12.7-µm features. Fig. 7shows two examples of such correlations. The6.2, 7.8 and 8.6-µm features, attributed to ionizedPAHs, are closely related to each other, as well asthe features in the 11–14-µm range, due to out-of-plane CH bending modes of neutral and ionizedPAHs.
Hony et al. (2001) and Keller et al. (2008) dis-cuss the link between the 6.2/11.3 and 12.7/11.3line flux ratios. The first is interpreted as a mea-sure for the degree of ionization, the second asa measure for the irregularity of the PAH’s edge.The authors conclude that both ratios point to thedegree of processing of the molecules. An increasein PAH molecular size also enhances the 11.3-µmfeature with respect to the 6.2 and 12.7-µm fea-tures. We confirm this correlation between lineflux ratios (p-value 1%). Keller et al. (2008) alsofind a decrease of the 12.7/11.3 ratio with decreas-ing stellar temperature. Our data do not show aclear correlation for the entire sample, but a corre-lation may be present for the group I sources only(Fig. 8). In any case, it appears that the 12.7/11.3ratio is different in group I and II. We come backto this issue in the Sect. 4.4.
4.2. The 16−19-µm feature
Five stars (HD34282, HD36917, HD97048,HD 100453 and HD135344B) display an emissionfeature at 16–19µm. The complex is attributed tothe out-of-plane skeletal modes of large elongatedPAH molecules (Peeters et al. 2004). The detec-tion is remarkable because our sample targets areClass B′ sources, while this feature complex ismostly seen in ISM-like Class A objects.
6
The strength and shape of the 16–19-µm fea-ture is not correlated to those of other features atshorter wavelengths. This is consistent with theinterpretation that the short- and long-wavelengthfeatures are produced by different PAH popula-tions. Four of the five targets with detected 16–19-µm emission have a very red SED: their 30/13.5continuum flux ratios are among the highest in thesample (see Table 1). Possibly, these sources arestill surrounded by an envelope or extended outerdisk in which the chemistry of the PAH moleculesis governed by the tenuous but harsh interstellarUV field rather than that of the central star (seealso Boersma et al. 2008).
Alternatively, the detection or otherwise of thefeature may be due to a contrast effect. The con-tinuum emission at 20µm is dominated by warmdust grains close to the central star, while the fea-ture is produced in the outer disk via stochasticheating. The extreme 30/13.5 continuum flux ra-tio could indicate that, while the outer disk is stillstrongly flared, the inner disk has started to set-tle. An additional indication for this hypothesiscould be the absence of the 10-µm silicate emis-sion feature in HD34282, HD 97048, HD 100453and HD135344B2: when silicate dust coagulatesand grows beyond several µms, the emission bandsin the mid-IR range disappear. The settling of theinner disk implies a reduction of the warm con-tinuum emission at 20µm and hence an increasedfeature-to-continuum contrast. Later on, when theouter disk eventually starts to settle as well, thestrength of the 16–19-µm complex decreases to-gether with the degree of flaring.
4.3. Hydrocarbon molecules and silicate
grains
Based on the IR spectra, the properties of the(sub-)µm-sized silicate grains in the upper layersof the disk can be derived. J10 show that only afew dust species contribute to the emission-bandspectrum: amorphous silicates with olivine andpyroxene stoichiometry, the Mg-rich crystalline sil-icates forsterite and enstatite, and silica. Differentgrain sizes (0.1, 2 and 5µm) are included in the
2 On the other hand, HD37411, RR Tau, HD141569 and
HD169142 are also PAH sources without a 10-µm silicate
feature, but their spectra do not show the 16–19-µm fea-
ture.
spectral fit. The fitting routine was performed ontwo wavelength ranges, 5–17µm and 17–35µm, tosample the hot dust close to the star and the coolerdust further out and deeper in the disk. Thisyielded the mass fraction of each of the species,for each grain size and in both intervals. For de-tails, we refer to J10.
We have taken the dust mass fractions andsearched for correlations with the hydrocarbonfeature parameters derived here. None were foundwith a p-value below 5%, with one marked excep-tion. The FWHM of the 6.2-µm feature appears tobe strongly correlated to the mass fraction of the0.1-µm silica grains, derived from the spectral fitto the 17–35µm spectrum (Fig. 9). Targets with abroad 6.2-µm feature have less small silica grainsin the cold/outer disk. It is conceivable that thisis a statistical false-positive correlation out of the∼3000 investigated comparisons between silicateand PAH parameters. However, the correlationhas a very low p-value (1×10⁻⁵). The probabilitythat such a strong random correlation would occurhere is only 3%. Also the fact that both parame-ters were measured in disjunct wavelength rangesin the spectrum, strengthens our confidence in thereality of the correlation.
The relation is unexpected and we can onlyspeculate about its origin. PAHs are stochasti-cally heated and their emission comes from fur-ther out in the disk surface, where grains in ther-mal equilibrium are much colder. It is likely thatthe PAHs producing the 6.2-µm feature and thecold silica grains are located in the same physi-cal region. (Hudgins et al. 2005) mention that pe-ripheral oxygen groups can influence the 6.2-µmfeature position. Perhaps the cumulative effectof a population of PAH molecules with such pe-ripheral groups broadens the 6.2-µm feature. Theobserved correlation would then indicate that the0.1-µm silica grains and the PAH molecules arechemically competing for oxygen atoms: the oxy-gen is either locked in peripheral groups of PAHmolecules, or included in 0.1-µm silica grains.
4.4. Influence of the disk geometry
We checked for differences between Meeusgroup I and II sources. This classification is basedon the thermal infrared emission seen in the SED,and thus indicates the geometry of the dust disk.Group I sources have a flared dust disk, while the
7
dust disk in the group II members has flattened,probably as a result of dust grain growth andsedimentation to the midplane.
In a number of papers (Meeus et al. 2001;Acke & van den Ancker 2004; Habart et al. 2004),it has been claimed that the strength of the PAHfeatures depends on the disk geometry. A flareddisk has a larger illuminated surface. Group Isources are therefore expected to produce strongerPAH emission. However, Keller et al. (2008) donot find this correlation in their sample of HerbigAe/Be stars. Here, we elaborate on this.
Making use of radiative transfer models, Meijer et al.(2008) demonstrate that the degree of flaring ofthe dust disk largely depends on one parameter:the mass in sub-µm-sized dust grains. A higherdust mass results in a higher opacity at opticalwavelengths, a warmer outer disk, and more flar-ing. Acke et al. (2009) show in their Fig. 3 thatthe flux excess above the stellar photosphere at60µm is a tracer for the dust mass, and hence forthe degree of flaring. Fig. 10 compares the IRAS60-µm excess to the excess at 30µm. The latteris determined from the Spitzer IRS spectra andthe Kurucz model for the star3. A very strongcorrelation is noted, which indicates that also theexcess at 30µm traces the disk geometry. BecauseIRAS 60-µm photometry is not available for allsample sources, and to rely only on the SpitzerIRS spectra, we use the excess at 30µm in thefollowing.
We investigate whether the luminosity of indi-vidual PAH features, relative to the stellar lumi-nosity, correlates with the excess at 30µm. Theformer is the fraction of stellar flux captured andre-emitted by the PAH molecules. We find thatthe feature-to-stellar luminosity of most of the fea-tures (5.7, 6.0, 6.2, 7.8, 8.6, 10.6, and 12.7µm)increases significantly with increasing 30-µm ex-cess. Fig. 11 shows the correlation for the most fre-quently detected feature, at 6.2µm. Also the totalPAH-to-stellar luminosity ratio correlates with thefar-IR excess (p-value 9× 10⁻⁵).
It is clear that the disk geometry influencesthe PAH-to-stellar luminosity ratio. However, thelarge amount of scatter indicates that the degreeof flaring is not the only parameter. Source-to-source differences in PAH abundance are certainly
3The excess magnitude is defined as M = 2.5 logFtot/F⋆.
important. Furthermore, there are targets whichhave a flattened dust disk (group II), but are stillstrong PAH emitters. A solution to this apparentdiscrepancy has been proposed in a few recent pa-pers. van der Plas et al. (2008) and Fedele et al.(2008) show that the dust disk can decouple fromthe gas disk, probably due to dust grain growthand subsequent settling to the midplane. This re-sults in a flattened dust disk, while the gas diskcan still have a flared structure. Verhoeff et al.(2010) have further elaborated on this idea andperformed detailed modeling of HD95881, a tar-get with an extremely blue group II-type SED, butstrong PAH emission.
Along the same lines, Dullemond et al. (2007)have modeled dust sedimentation in protoplane-tary disks with PAHs. They find that, if thePAH abundance stays the same, sources withsedimented dust disks should display more pro-nounced PAH features than disks with perfect ver-tical mixing. Two effects are important: the re-duction of the continuum emission (increased con-trast) and the increased amount of UV-exposedPAH molecules (increased PAH luminosity). Un-der the assumptions of the models, a decrease infar-IR continuum emission should be accompaniedby an increase of PAH luminosity. The oppo-site trend is observed, however. Dullemond et al.(2007) speculate that a significant fraction of thePAHs is removed through aggregation. In anycase, a reduction of PAH abundance in the flaredgas disk above the dust disk, e.g. through PAHphotodestruction, is necessary to reconcile theoryand observations.
We found indications that there is indeed asmall difference in PAH chemistry between flaredand flattened disks. There is a strong correlationbetween the peak flux ratios 11.3/6.2 and 11.3/7.8(Fig. 12). This is not surprising, as the 6.2 and 7.8-µm features are both CC modes and thus stronglylinked to each other (see Sect. 4.1). From the fig-ure, however, it seems that the distributions ofthe 11.3/6.2 and the 11.3/7.8 ratios are shifted to-wards lower values in group II. Also the 12.7/11.3line flux ratio appears to be higher in this group(0.29 ± 0.08 vs. 0.22 ± 0.05 in group I, p-value0.5%). This suggests that the 11.3-µm feature isweak in the targets with a small far-IR excess, andmay indicate that the PAH molecules in targetswith a flattened dust disk are more processed, i.e.
8
rough-edged and/or smaller, than those in flareddisks.
4.5. Aliphatic versus aromatic hydrocar-
bons
Almost all stars in our sample display Class B′
PAH features, but it is clear that even within thisclass, spectral differences occur. Here we arguethat these changes are mainly due to the stellarUV field to which the hydrocarbon molecules areexposed.
The centroid (and peak) position of the 7.8-µmfeature decreases with increasing effective temper-ature. Fig. 13 shows the data for our sample ofHerbig Ae stars. We have expanded the samplewith a set of pre-main-sequence stars of differentstellar masses, obtained in other Spitzer IRS pro-grams. On the low-mass end, we have includedfive T Tauri stars with detected PAH emission.RX J1842.9−3532, RX J1852.3−3700, HD 143006,RX J1612.6−1859A and 1RXS J132207.2−693812were observed within the Formation and Evolu-tion of Planetary Systems (FEPS) Legacy Sci-ence Program (PID 148, PI M. Meyer). Thespectra and stellar effective temperatures weretaken from Bouwman et al. (2008). On the high-mass end, six Herbig Be stars were added. Thespectra of HD 290770, Hen 3−180, LkHα 257,PDS 216, PDS 344 and RNO 6 were acquiredwithin the Spitzer Program Structure and compo-sition of disks surrounding Herbig Be stars (PID50180, PI M. van den Ancker). Their effectivetemperature has been estimated based on theirspectral type. The correlation between 7.8-µmcentroid position and Teff is clear for the HerbigAe stars, and is even more prominent when in-cluding the lower- and higher-mass young stars.The contribution of the red sub-bands appears tobe more significant in cooler stars than in hot-ter stars, which is supported by the fact that thewidth of the 7.8-µm feature increases with redshift(Fig. 14). Finally, also the peak and centroid po-sition of the 6.2-µm feature are correlated to thestellar effective temperature (p-value 5×10⁻⁴ and4× 10−3 resp.): cool stars display red features.
The correlation between Teff and 7.8-µm wave-length position was already found in smaller sam-ples by Sloan et al. (2007), Boersma et al. (2008)and Keller et al. (2008). As we have shown, itholds for a broad variety of pre-main-sequence
stars, with spectral types ranging from M0 toearly B. Smolders et al. (2010) have recently ex-tended the correlation to lower Teff and redderfeatures with the detection of hydrocarbon emis-sion in S-type AGB stars. The stellar radiationfield strongly influences the chemistry of the sur-rounding hydrocarbon molecules, regardless of theobject’s evolutionary status or specificities of thecircumstellar environment.
Sloan et al. (2007) propose that a red featureindicates the presence of a hydrocarbon mixturewith a higher aliphatic/aromatic ratio, an ideathat is supported by laboratory measurements(Pino et al. 2008). Here we report a few newlyfound correlations in our sample of Herbig Ae starsthat provide further evidence for this interpreta-tion.
The position and width of the 7.8-µm featureare linked to the effective temperature of the cen-tral star. Moreover, the strength of the aromatic8.6-µm CH in-plane bending mode, relative to the6.2 and 7.8-µm CC features, and the aliphatic-to-aromatic luminosity ratio4 depend on Teff as well.In fact, all these parameters are interconnected.Table 6 summarizes these correlations. Figs. 15and 16 show that, while targets with a red 7.8-µm feature (i.e. cool stars) have a low flux ratio ofthe aromatic 8.6-µm CH and 7.8-µm CC features,they produce fractionally more aliphatic emission.It is clear that illuminated hydrocarbon moleculesaround stars with different effective temperatureare chemically different.
Herbig Ae stars are by nature strong photo-spheric UV emitters. Because of the rather lowaccretion rates in most targets, the additional UVexcess due to accretion energy dissipation is rela-tively unimportant for these stars. We can there-fore consider the effective temperature as a directindicator of the stellar UV radiation field.
Strong UV radiation appears to preferentiallydestroy or convert the aliphatic component inthe disks. Photodestruction of the CH bondsis expected from laboratory experiments (e.g.,Munoz Caro et al. 2001). This effect is strongerfor aliphatic molecules, as aromatic rings givemore stability to the molecule by allowing distri-
4This is the ratio of the summed line fluxes of the aliphatic
6.8 and 7.2-µm features with respect to those of the de-
tected PAH features in the covered wavelength range.
9
bution of the UV-induced excitation energy. Thisis consistent with the lower line fluxes of the 8.6-µm feature relative to the aliphatic CH featuresobserved in cooler stars. The disappearance ofthe 6.8 and 7.2-µm features, both linked to CHbonds in aliphatic hydrocarbons, could thereforepoint to a more rapid dehydrogenation of thealiphatic molecules, rather than a complete re-moval of this component. However, the experi-ments of Munoz Caro et al. (2001) show that thearomatic CH bonds are also eventually destroyedby the UV radiation. The aromatic feature at8.6µm should therefore become weaker with in-creasing UV strength as well. The opposite trendis observed: sources with strong UV fields displaya higher aromatic CH/CC flux ratio. We note thatthis interpretation relies on the identification ofthe 8.6-µm feature as due to aromatic CH modes.Alternatively, it may be that also aromatic CCmodes contribute to its strength. In the lattercase, the observations show that the aromatic hy-drocarbons undergo structural changes induced byUV field, resulting in Class A features and an in-creased contribution of CC modes to the 8.6-µmfeature.
The observed increase in the aromatic CHstrength at higher temperatures is consistent withexperimental work by Mennella et al. (2001), whosuggest that the heating of carbon grains shouldreduce the number of aliphatic CH bonds and in-crease the number of aromatic CH bonds. AlsoUV irradiance increase the relative degree of aro-matic clustering, but in thermal annealing at tem-peratures above 300K, this increase is accom-panied with a growth of the graphitic clusters.Under UV irradiation, the clusters remain small(Mennella et al. 1998).
In diffuse interstellar clouds, large (> 30 Catoms) PAHs are expected to have normal hy-drogen coverage (i.e. one H atom per peripheralC atom; aromatic bond), while very large PAHsmay be fully hydrogenated (i.e. two H atoms;aliphatic bond, Le Page et al. 2003). The tran-sition of full to normal hydrogen coverage couldoccur through UV photolysis of the aliphatic CHbonds and replacement with aromatic CH bonds.This would reduce the aliphatic fingerprint in theinfrared spectrum and pump the aromatic CH/CCratio. Because UV processing keeps the clustersizes small, thermal annealing may be needed to
grow the clusters and increase the aromatic CHemission strength. The observational trends in oursample then indicate that not only UV photode-struction, but also thermal annealing of carbongrains and hydrogenation in the UV-shielded diskinterior, is important in circumstellar disks aroundHerbig Ae stars.
5. Conclusions
In this paper, we have investigated hydrocarbonemission in the Spitzer IRS spectra of a sampleof 53 Herbig Ae stars. We find that 70% of thesources display PAH emission, and 55% aliphaticfeatures at 6.8 and/or 7.2µm. Five targets (9%)display a feature complex at 16–19µm. Below welist our main conclusions.
• We confirm the correlation between the PAHfeature-to-stellar luminosity ratio and theshape of the infrared spectral energy dis-tribution, first mentioned by Meeus et al.(2001). PAHs are a tracer of the gas disk,while the SED probes the thermal dust emis-sion. If the dust and gas disk are colocated,the trend indicates that the illuminated sur-face of a flared disk is larger than that ofa flattened disk. The volume occupied byexcited PAHs is therefore larger in the firstgroup. It is suggested in the literature thatsources with settled dust disks can nonethe-less produce strong PAH emission if theirgas disk is still flared and exposed to stellarUV flux. This could explain the existenceof the few targets with flattened dust disksbut strong PAH emission. However, mosttargets follow the general trend. We con-clude that PAHs in the dust-poor disk atmo-sphere are either rapidly removed from thegas phase, or that the gas and dust in mostdisks are well coupled and settle together.
• The stellar radiation field determines thechemistry of the hydrocarbon population inthe circumstellar disk. Ranked accordingto increasing stellar effective temperature,the infrared spectra of Herbig Ae stars showan increase of the aromatic CH emission,but a decrease of the aliphatic CH emis-sion. Aliphatic CH bonds are more easilydestroyed than aromatic CH bonds, which
10
explains the decrease in aliphatic signature.However, this effect cannot explain the in-crease in the aromatic CH/CC ratio withincreasing UV strength. The solution maybe found in thermal annealing and the hy-drogenation balance of the PAHs. The lat-ter can only influence the PAH chemistryif turbulent vertical mixing is important atthe disk’s surface, and brings PAH moleculesfrom UV-immersed regions to the disk inte-rior and back.
• The 6.2 and 7.8-µm CC features are redderin cooler stars. The link with the relativestrength of the aliphatic features indicatesthat the wavelength shift indeed is a measurefor the aliphatic/aromatic content ratio ofthe hydrocarbon mixture.
• The strong connection between spectral fin-gerprint and stellar effective temperatureshows that hydrocarbons immediately re-act to the UV field to which they are ex-posed. Therefore, the chemistry of hydrocar-bon molecules does not in general trace diskevolution. However, the observations indi-cate that targets with a flattened dust diskharbor hydrocarbons which may be moreprocessed. They appear to have roughermolecular edges and/or are smaller thanthose in flared dust disks.
We have expanded the knowledge of the chem-istry of hydrocarbon molecules in disks. Onceirradiated, the free-flying molecules are quicklychemically altered by the stellar UV field andtheir history is deleted. However, PAHs in disksmust have a significant aliphatic component whenthey are appear at the disk surface. Labora-tory experiments have shown that the formationof aliphatic (CH2) groups on the edges of PAHmolecules can already occur under very mild con-ditions (Jager et al. 2006, T ≈ 400K). Such con-ditions are available in the warm regions of disksaround Herbig Ae stars, which makes it probablethat in-situ production and (re-)hydrogenation ofthe hydrocarbon mixture are processes which takeplace below the disk surface.
This work is based on observations made withthe Spitzer Space Telescope, which is operated by
the Jet Propulsion Laboratory, California Insti-tute of Technology under a contract with NASA.BA thanks Kees Dullemond for helpful discus-sions.
11
REFERENCES
Acke, B., Min, M., van den Ancker, M. E., et al.2009, A&A, 502, L17
Acke, B. & van den Ancker, M. E. 2004, A&A,426, 151
Acke, B., van den Ancker, M. E., Dullemond,C. P., van Boekel, R., & Waters, L. B. F. M.2004, A&A, 422, 621
Allamandola, L. J., Tielens, G. G. M., & Barker,J. R. 1989, ApJS, 71, 733
Bauschlicher, C. W., Peeters, E., & Allamandola,L. J. 2009, ApJ, 697, 311
Bauschlicher, Jr., C. W., Peeters, E., & Allaman-dola, L. J. 2008, ApJ, 678, 316
Beintema, D. A., van den Ancker, M. E., Molster,F. J., et al. 1996, A&A, 315, L369
Boersma, C., Bouwman, J., Lahuis, F., et al. 2008,A&A, 484, 241
Bouwman, J., Meeus, G., de Koter, A., et al. 2001,A&A, 375, 950
Bouwman, J., Henning, T., Hillenbrand, L. A.,et al. 2008, ApJ, 683, 479
Chiar, J. E., Tielens, A. G. G. M., Whittet,D. C. B., et al. 2000, ApJ, 537, 749
Dartois, E., Geballe, T. R., Pino, T., et al. 2007,A&A, 463, 635
Dullemond, C. P. & Dominik, C. 2004a, A&A, 417,159
Dullemond, C. P. & Dominik, C. 2004b, A&A,421, 1075
Dullemond, C. P., Dominik, C., & Natta, A. 2001,ApJ, 560, 957
Dullemond, C. P., Henning, Th., Visser, R., et al.2007, A&A, 473, 457
Fedele, D., van den Ancker, M. E., Acke, B., et al.2008, A&A, 491, 809
Furlan, E., Watson, D. M., McClure, M. K., et al.2009, ApJ, 703, 1964
Furton, D. G., Laiho, J. W., & Witt, A. N. 1999,ApJ, 526, 752
Gielen, C., van Winckel, H., Matsuura, M., et al.2009, A&A, 503, 843
Habart, E., Natta, A., & Krugel, E. 2004, A&A,427, 179
Henning, T. & Meeus, G. 2009, arXiv:0911.1010
Henning, T. & Salama, F. 1998, Science, 282, 2204
Hony, S., Van Kerckhoven, C., Peeters, E., et al.2001, A&A, 370, 1030
Houck, J. R., Roellig, T. L., van Cleve, J., et al.2004, ApJS, 154, 18
Hudgins, D. M., Bauschlicher, Jr., C. W., & Alla-mandola, L. J. 2005, ApJ, 632, 316
Jager, C., Krasnokutski, S., Staicu, A., et al. 2006,ApJS, 166, 557
Keller, L. D., Sloan, G. C., Forrest, W. J., et al.2008, ApJ, 684, 411
Kendall, M. 1938, Biometrika, 30 (1-2), 81
Kessler, M. F., Steinz, J. A., Anderegg, M. E.,et al. 1996, A&A, 315, L27
Kurucz, R. L. 1991, BAAS, 23, 1047
Le Page, V., Snow, T. P., & Bierbaum, V. M. 2003,ApJ, 584, 316
Li, A. & Draine, B. T. 2002, ApJ, 572, 232
Mann, H. B. & Whitney, D. R. 1947, Annals ofMathematical Statistics, 18, 50
Mattioda, A. L., Allamandola, L. J., & Hudgins,D. M. 2005a, ApJ, 629, 1183
Mattioda, A. L., Hudgins, D. M., & Allamandola,L. J. 2005b, ApJ, 629, 1188
Meeus, G., Waters, L. B. F. M., Bouwman, J.,et al. 2001, A&A, 365, 476
Meijer, J., Dominik, C., de Koter, A., et al. 2008,A&A, 492, 451
Mennella, V., Colangeli, L., Bussoletti, E.,Palumbo, P., & Rotundi, A. 1998, ApJ, 507,L177
12
Mennella, V., Munoz Caro, G. M., Ruiterkamp,R., et al. 2001, A&A, 367, 355
Munoz Caro, G. M., Ruiterkamp, R., Schutte,W. A., Greenberg, J. M., & Mennella, V. 2001,A&A, 367, 347
Peeters, E., Hony, S., Van Kerckhoven, C., et al.2002, A&A, 390, 1089
Peeters, E., Mattioda, A. L., Hudgins, D. M., &Allamandola, L. J. 2004, ApJ, 617, L65
Pino, T., Dartois, E., Cao, A., et al. 2008, A&A,490, 665
Sargent, B. A., Forrest, W. J., Tayrien, C., et al.2009, ApJ, 690, 1193
Sellgren, K., Uchida, K. I., & Werner, M. W. 2007,ApJ, 659, 1338
Sloan, G. C. 2008, in IAU Symposium, Vol. 251,IAU Symposium, ed. S. Kwok & S. Sandford,191–194
Sloan, G. C., Jura, M., Duley, W. W., et al. 2007,ApJ, 664, 1144
Sloan, G. C., Keller, L. D., Forrest, W. J., et al.2005, ApJ, 632, 956
Smolders, K., Acke, B., Verhoelst, T., et al. 2010,A&A, 514, L1+
Sturm, E., Lutz, D., Tran, D., et al. 2000, A&A,358, 481
Tielens, A. G. G. M. 2008, ARA&A, 46, 289
van Boekel, R., Min, M., Waters, L. B. F. M.,et al. 2005, A&A, 437, 189
van der Plas, G., van den Ancker, M. E., Fedele,D., et al. 2008, A&A, 485, 487
Van Kerckhoven, C., Hony, S., Peeters, E., et al.2000, A&A, 357, 1013
Verhoeff, A. P., Min, M., Acke, B., et al. 2010,arXiv:1004.2208
Werner, M. W., Roellig, T. L., Low, F. J., et al.2004a, ApJS, 154, 1
Werner, M. W., Uchida, K. I., Sellgren, K., et al.2004b, ApJS, 154, 309
This 2-column preprint was prepared with the AAS LATEX macros v5.2.
13
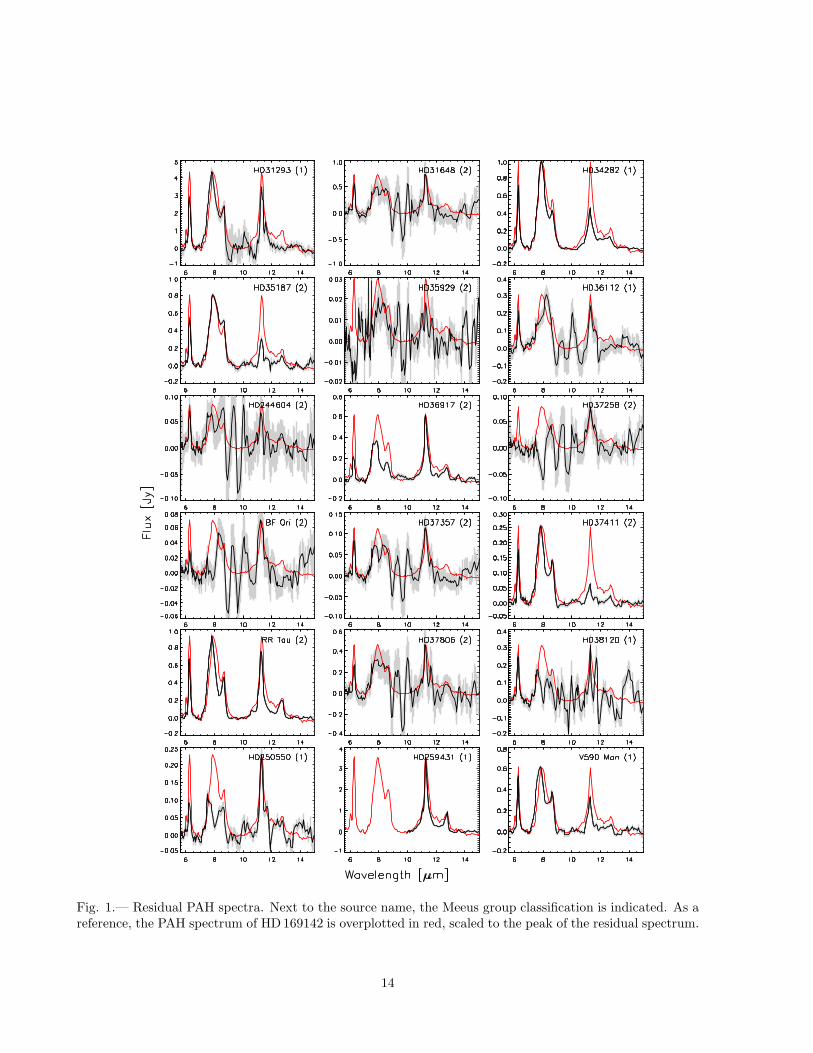
Fig. 1.— Residual PAH spectra. Next to the source name, the Meeus group classification is indicated. As areference, the PAH spectrum of HD169142 is overplotted in red, scaled to the peak of the residual spectrum.
14
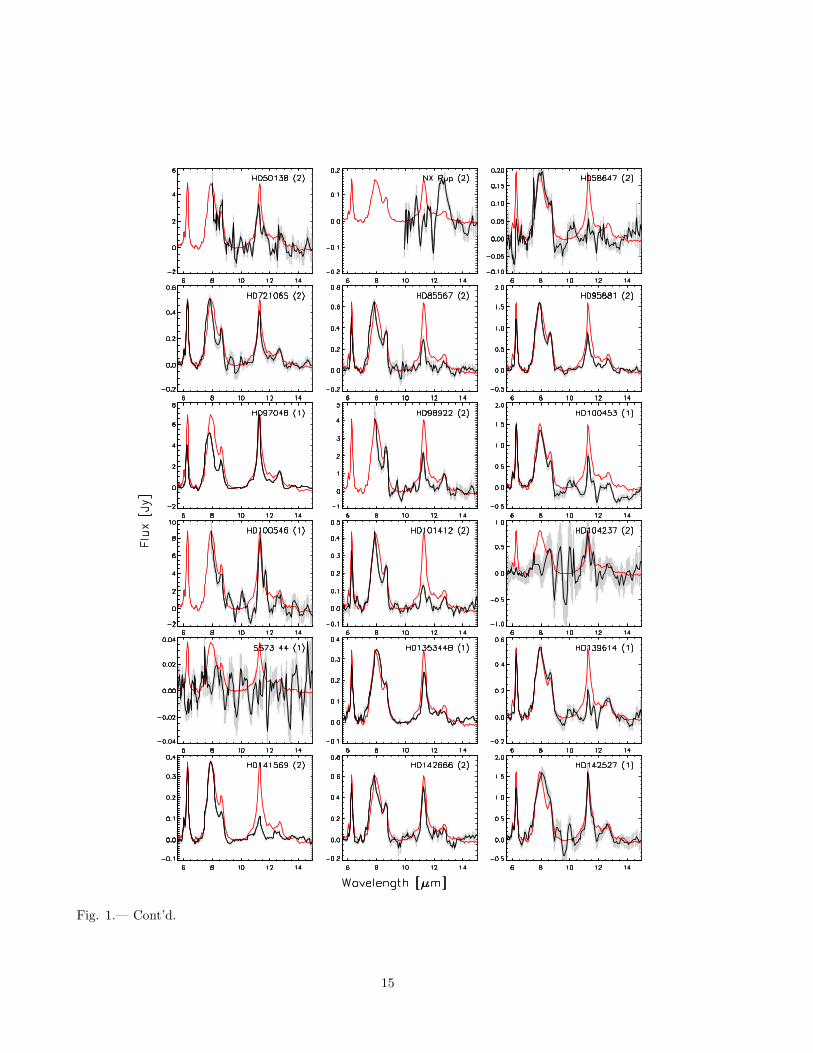
Fig. 1.— Cont’d.
15
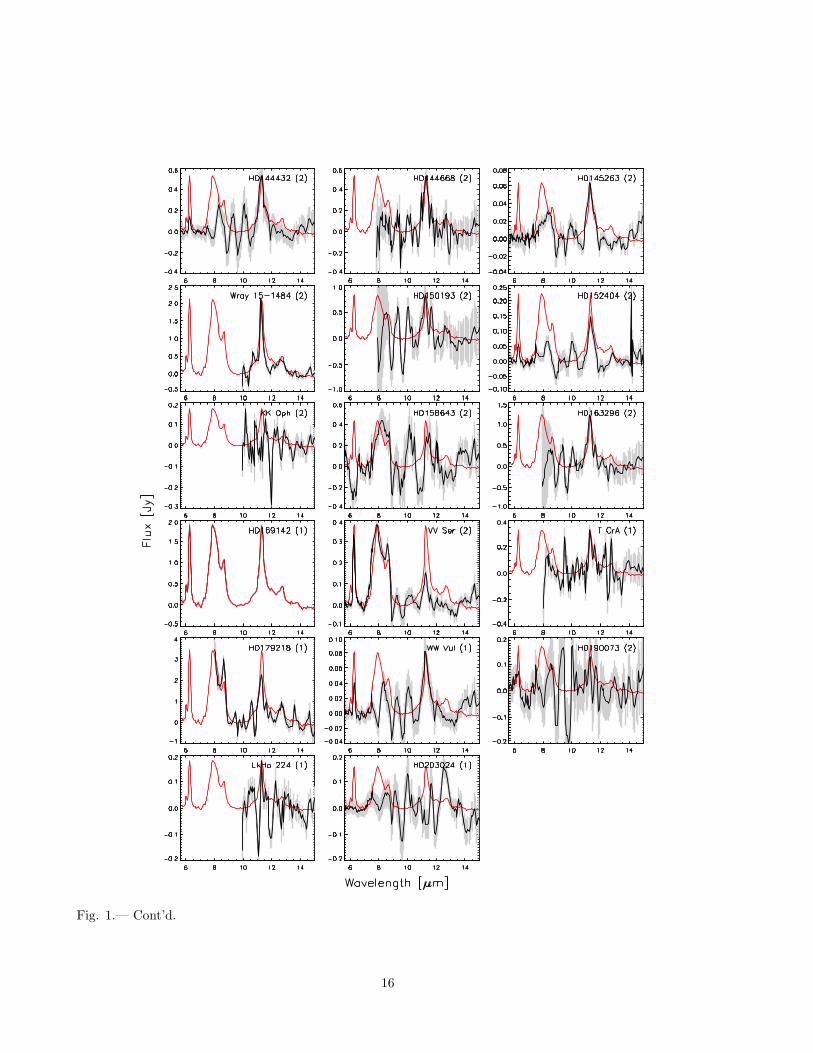
Fig. 1.— Cont’d.
16
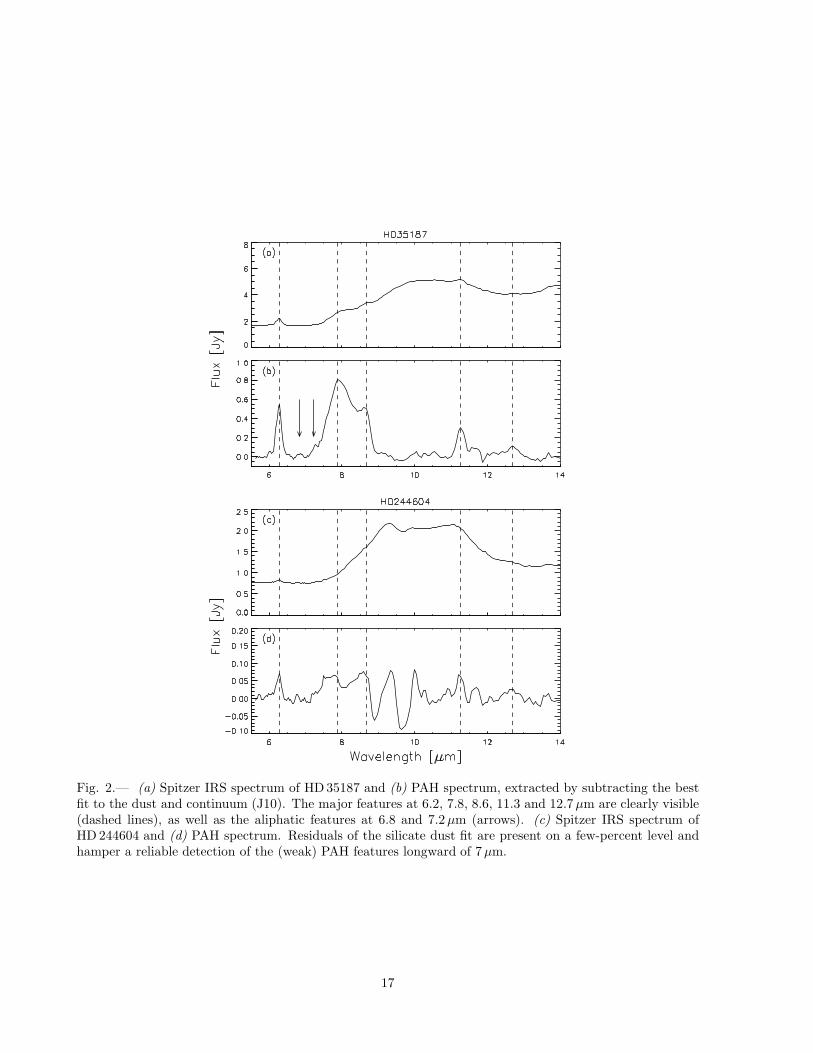
Fig. 2.— (a) Spitzer IRS spectrum of HD35187 and (b) PAH spectrum, extracted by subtracting the bestfit to the dust and continuum (J10). The major features at 6.2, 7.8, 8.6, 11.3 and 12.7µm are clearly visible(dashed lines), as well as the aliphatic features at 6.8 and 7.2µm (arrows). (c) Spitzer IRS spectrum ofHD244604 and (d) PAH spectrum. Residuals of the silicate dust fit are present on a few-percent level andhamper a reliable detection of the (weak) PAH features longward of 7µm.
17
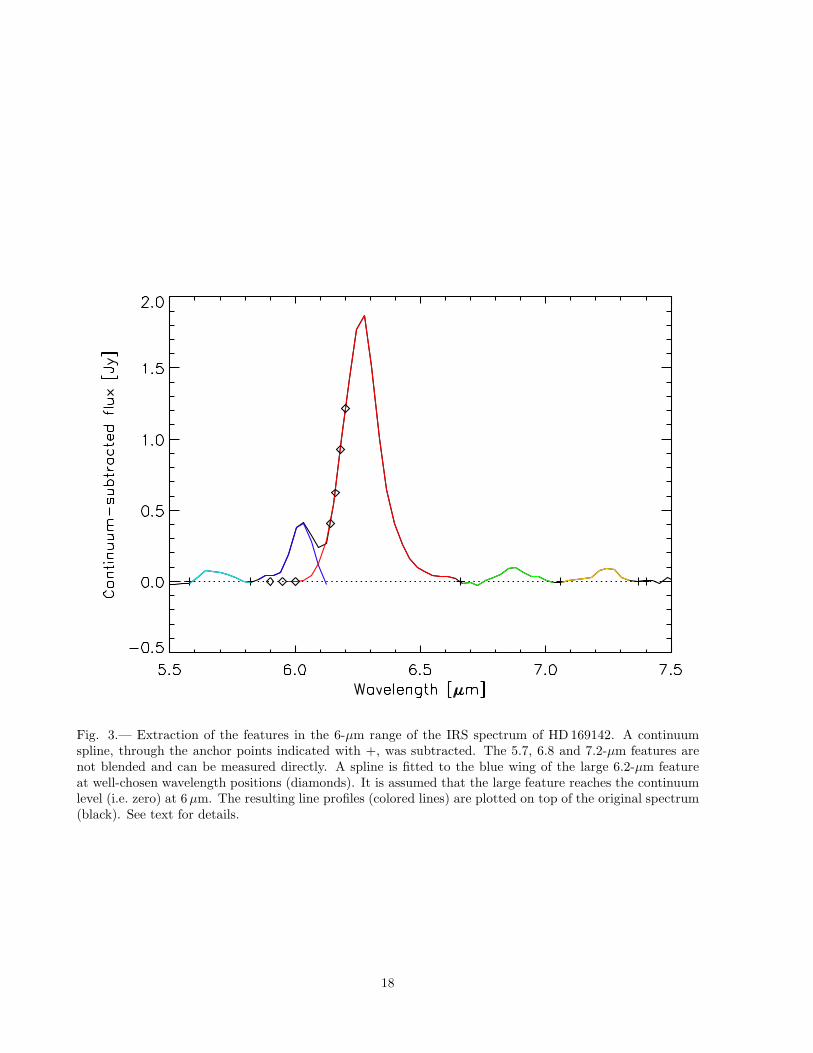
Fig. 3.— Extraction of the features in the 6-µm range of the IRS spectrum of HD169142. A continuumspline, through the anchor points indicated with +, was subtracted. The 5.7, 6.8 and 7.2-µm features arenot blended and can be measured directly. A spline is fitted to the blue wing of the large 6.2-µm featureat well-chosen wavelength positions (diamonds). It is assumed that the large feature reaches the continuumlevel (i.e. zero) at 6µm. The resulting line profiles (colored lines) are plotted on top of the original spectrum(black). See text for details.
18
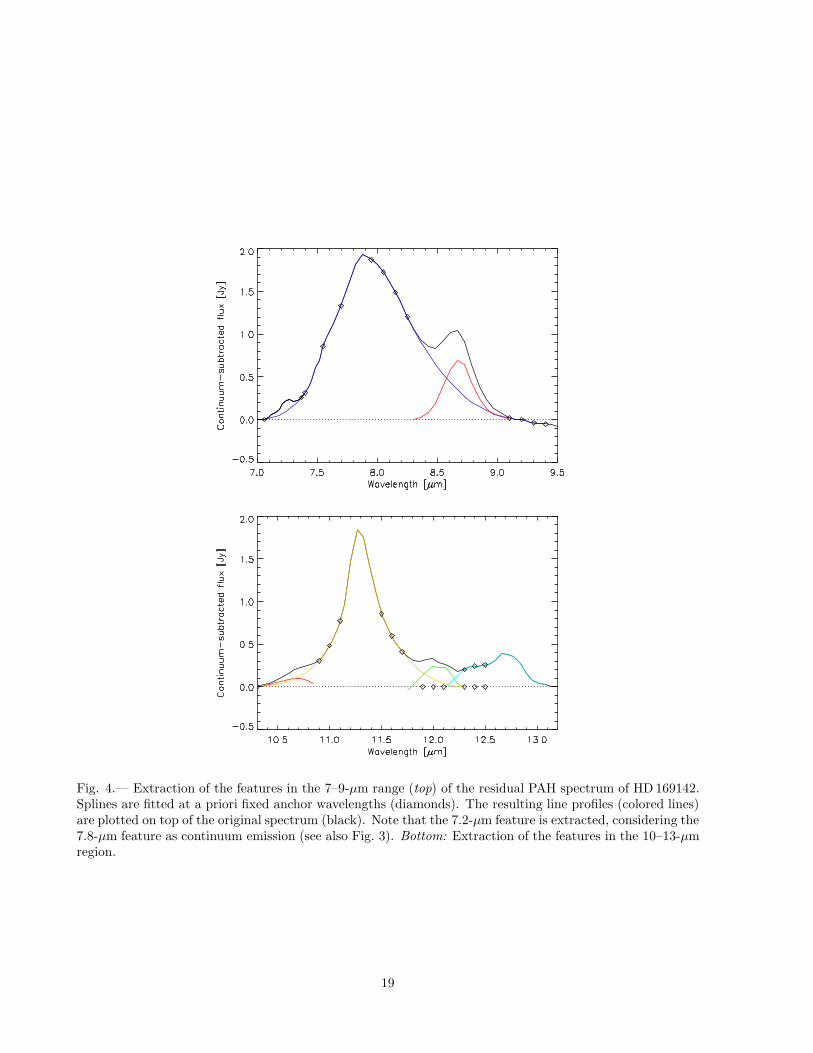
Fig. 4.— Extraction of the features in the 7–9-µm range (top) of the residual PAH spectrum of HD169142.Splines are fitted at a priori fixed anchor wavelengths (diamonds). The resulting line profiles (colored lines)are plotted on top of the original spectrum (black). Note that the 7.2-µm feature is extracted, considering the7.8-µm feature as continuum emission (see also Fig. 3). Bottom: Extraction of the features in the 10–13-µmregion.
19
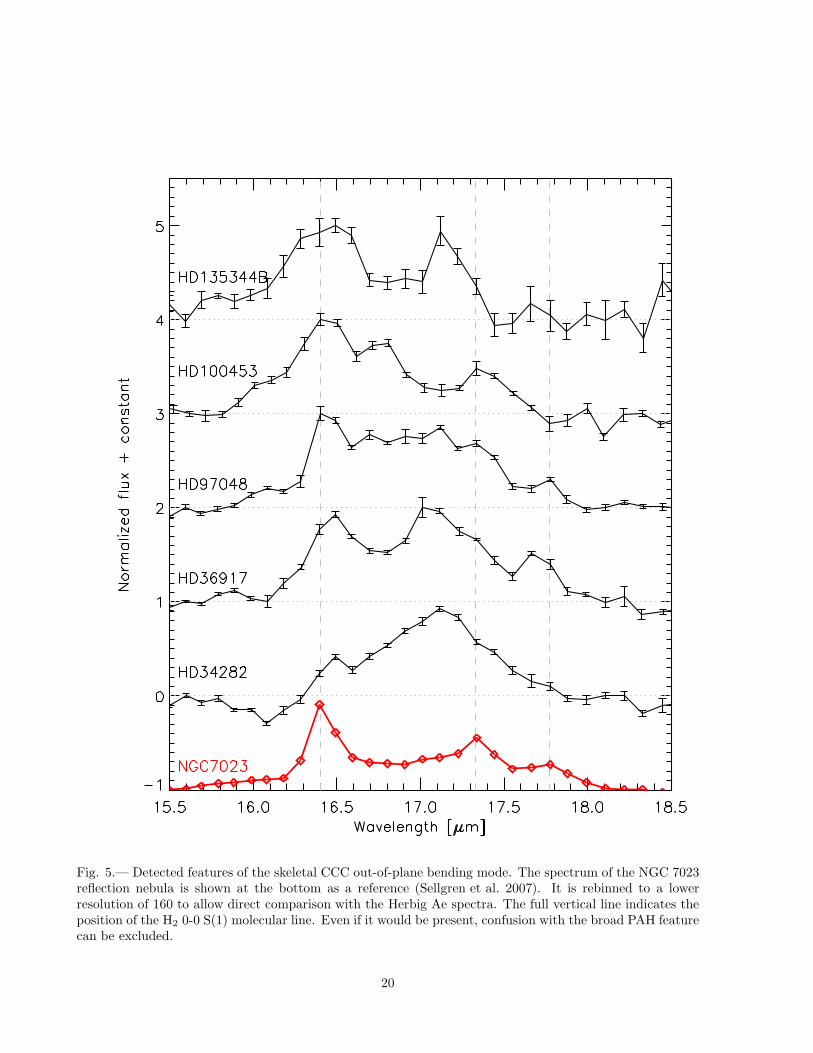
Fig. 5.— Detected features of the skeletal CCC out-of-plane bending mode. The spectrum of the NGC 7023reflection nebula is shown at the bottom as a reference (Sellgren et al. 2007). It is rebinned to a lowerresolution of 160 to allow direct comparison with the Herbig Ae spectra. The full vertical line indicates theposition of the H2 0-0 S(1) molecular line. Even if it would be present, confusion with the broad PAH featurecan be excluded.
20
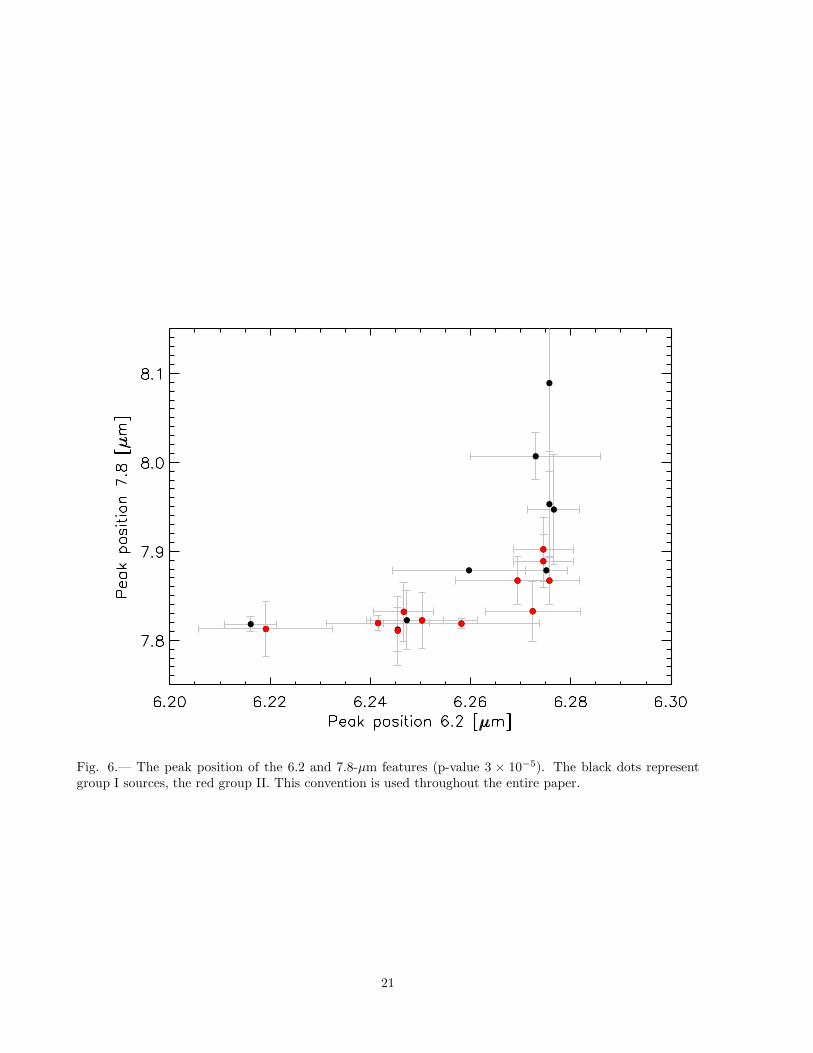
Fig. 6.— The peak position of the 6.2 and 7.8-µm features (p-value 3 × 10⁻⁵). The black dots representgroup I sources, the red group II. This convention is used throughout the entire paper.
21
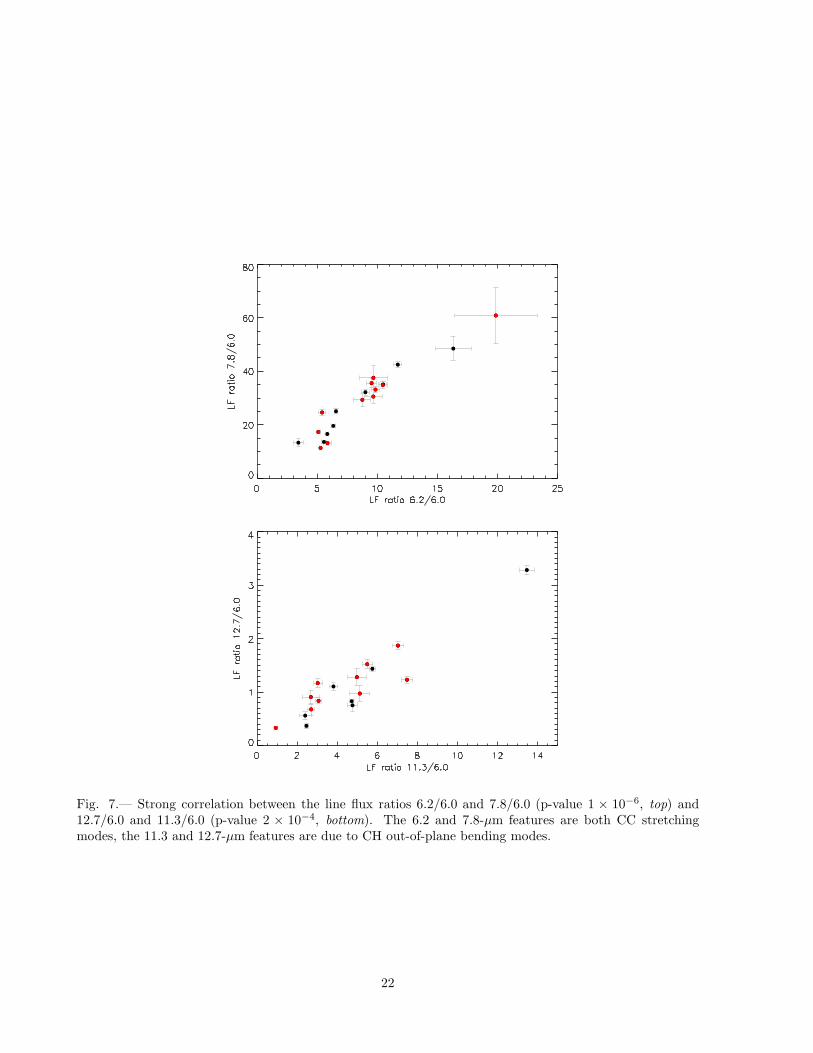
Fig. 7.— Strong correlation between the line flux ratios 6.2/6.0 and 7.8/6.0 (p-value 1 × 10⁻⁶, top) and12.7/6.0 and 11.3/6.0 (p-value 2 × 10⁻⁴, bottom). The 6.2 and 7.8-µm features are both CC stretchingmodes, the 11.3 and 12.7-µm features are due to CH out-of-plane bending modes.
22
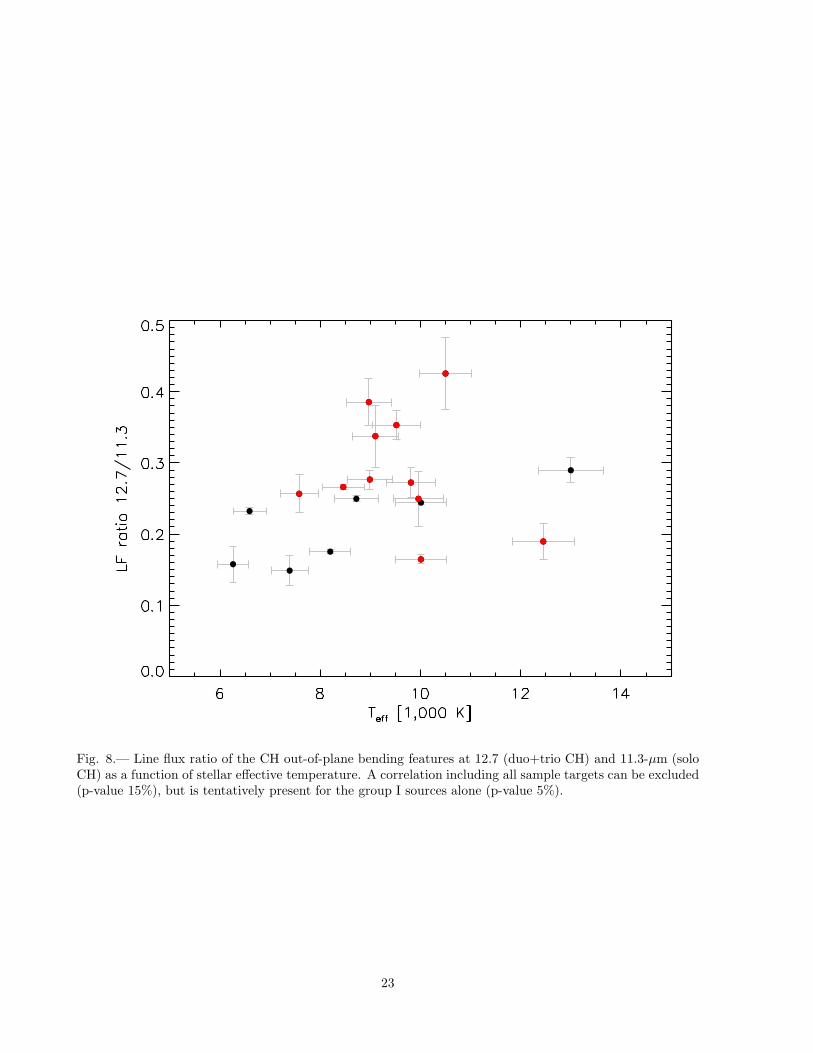
Fig. 8.— Line flux ratio of the CH out-of-plane bending features at 12.7 (duo+trio CH) and 11.3-µm (soloCH) as a function of stellar effective temperature. A correlation including all sample targets can be excluded(p-value 15%), but is tentatively present for the group I sources alone (p-value 5%).
23
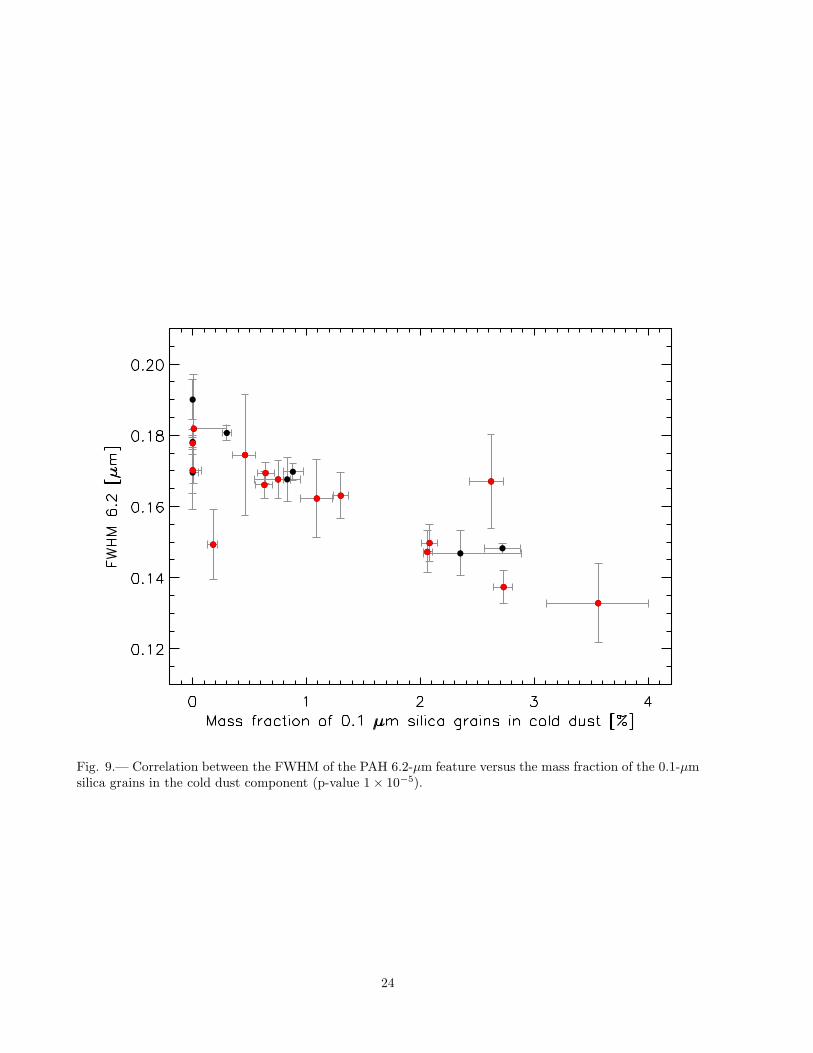
Fig. 9.— Correlation between the FWHM of the PAH 6.2-µm feature versus the mass fraction of the 0.1-µmsilica grains in the cold dust component (p-value 1× 10⁻⁵).
24
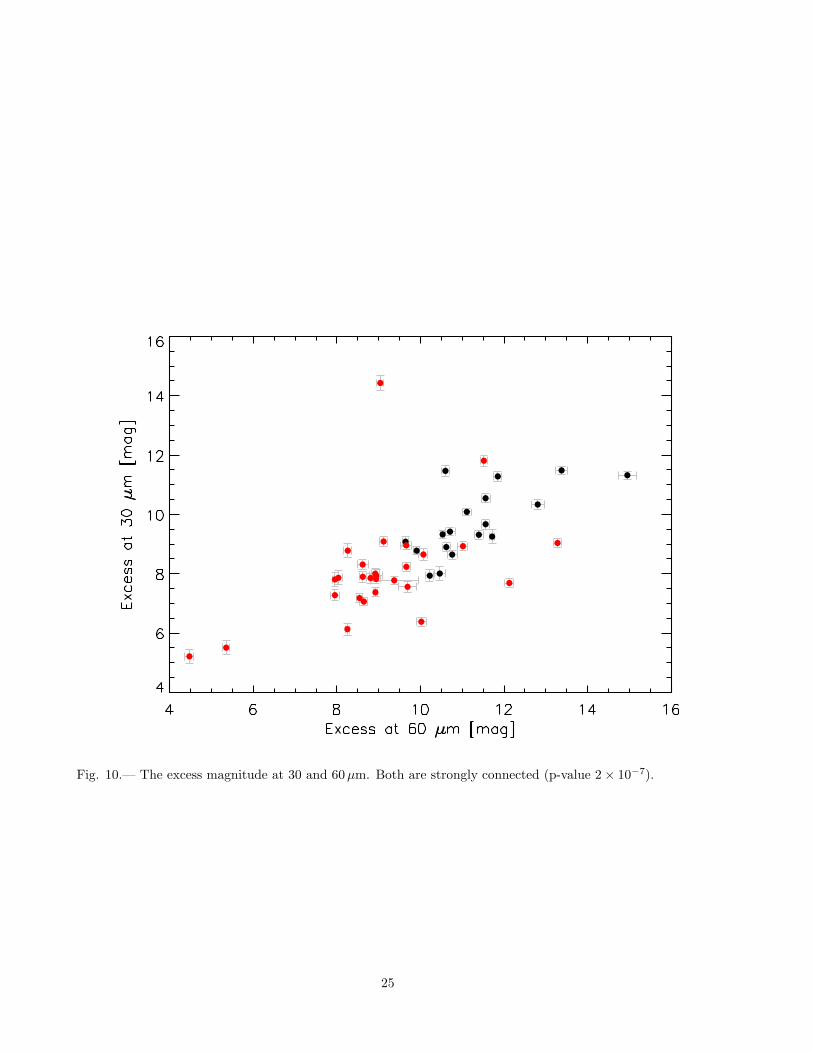
Fig. 10.— The excess magnitude at 30 and 60µm. Both are strongly connected (p-value 2× 10⁻⁷).
25
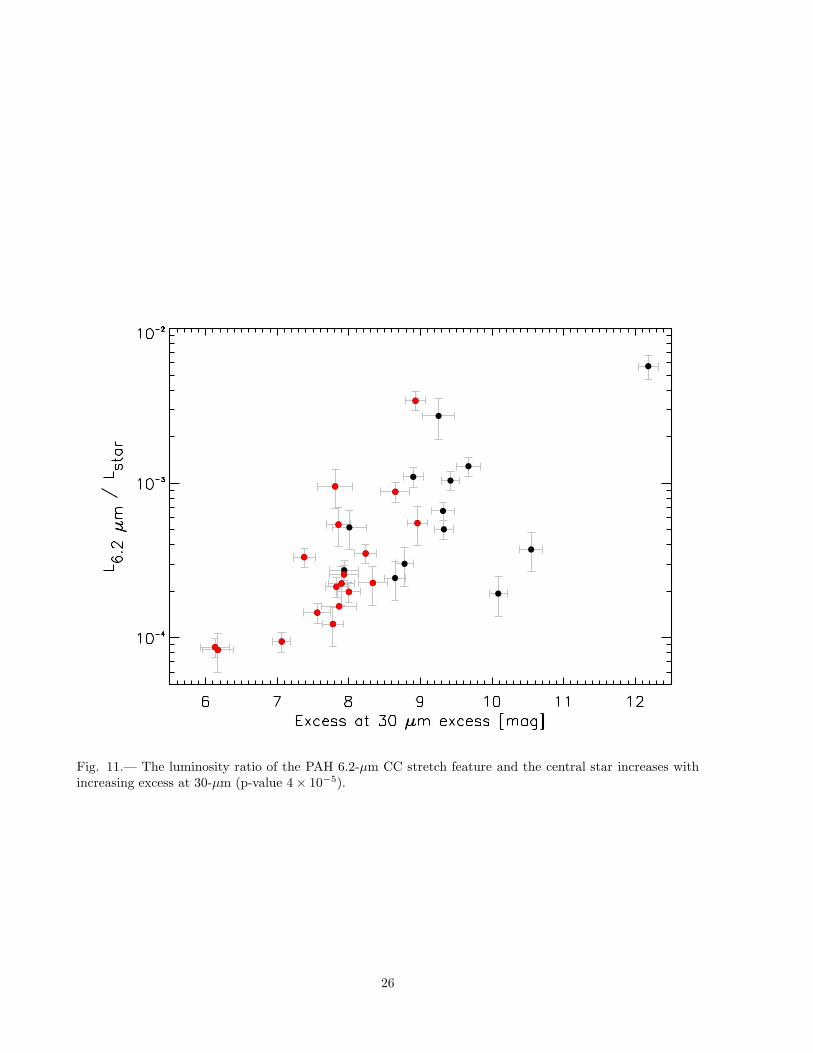
Fig. 11.— The luminosity ratio of the PAH 6.2-µm CC stretch feature and the central star increases withincreasing excess at 30-µm (p-value 4× 10⁻⁵).
26
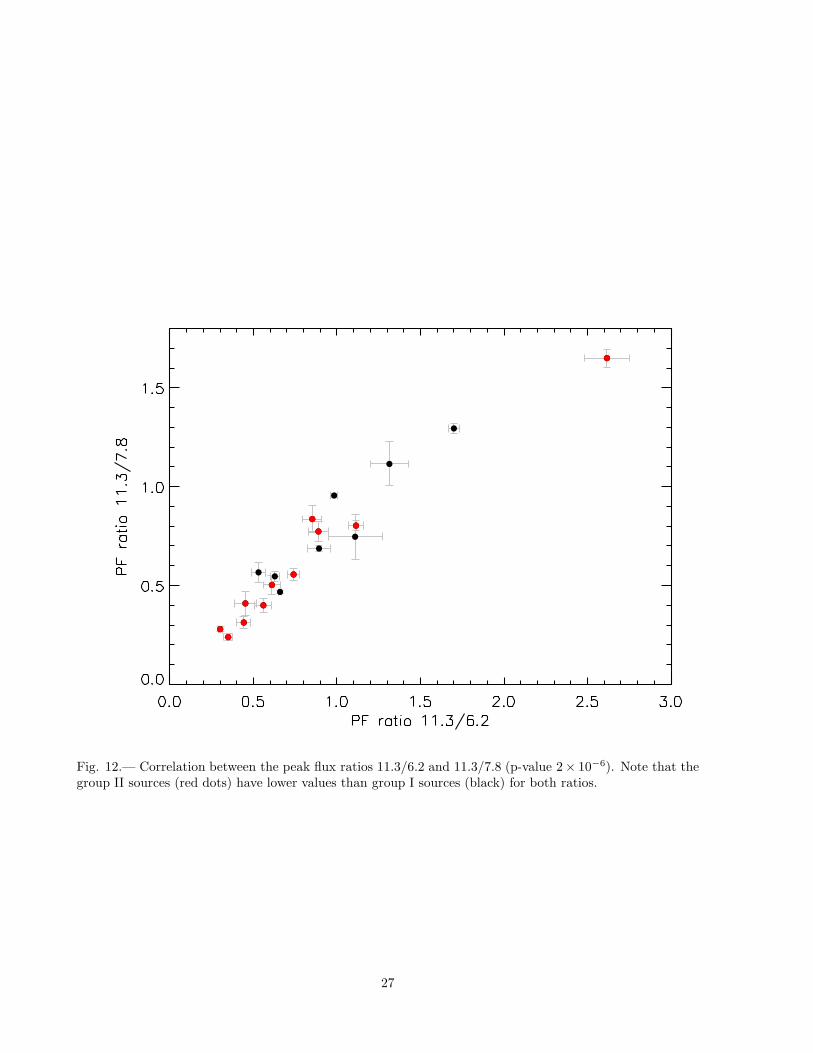
Fig. 12.— Correlation between the peak flux ratios 11.3/6.2 and 11.3/7.8 (p-value 2× 10⁻⁶). Note that thegroup II sources (red dots) have lower values than group I sources (black) for both ratios.
27
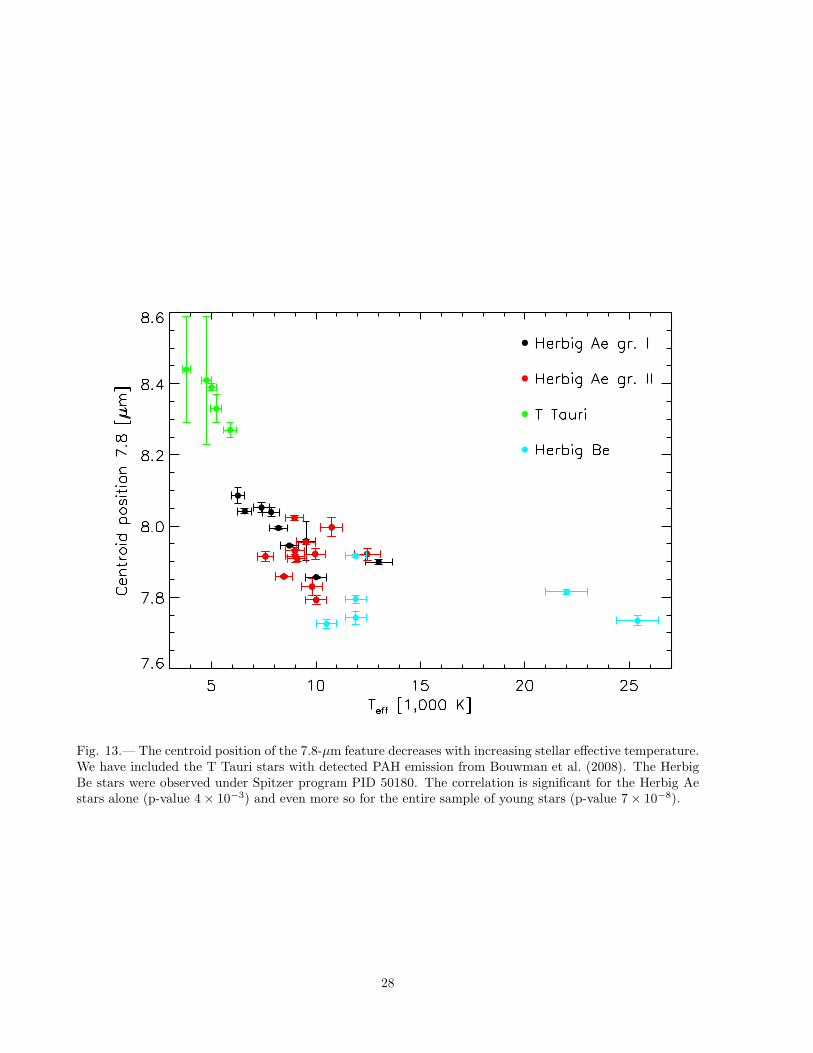
Fig. 13.— The centroid position of the 7.8-µm feature decreases with increasing stellar effective temperature.We have included the T Tauri stars with detected PAH emission from Bouwman et al. (2008). The HerbigBe stars were observed under Spitzer program PID 50180. The correlation is significant for the Herbig Aestars alone (p-value 4× 10⁻³) and even more so for the entire sample of young stars (p-value 7× 10⁻⁸).
28
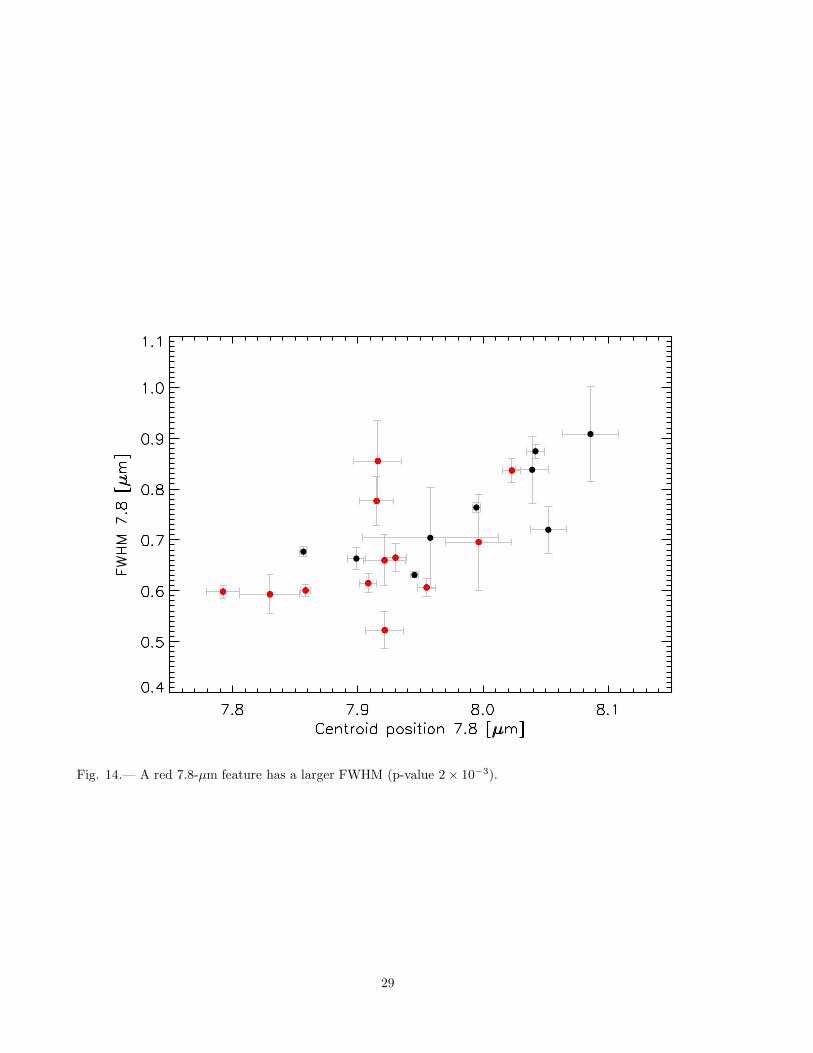
Fig. 14.— A red 7.8-µm feature has a larger FWHM (p-value 2× 10⁻³).
29
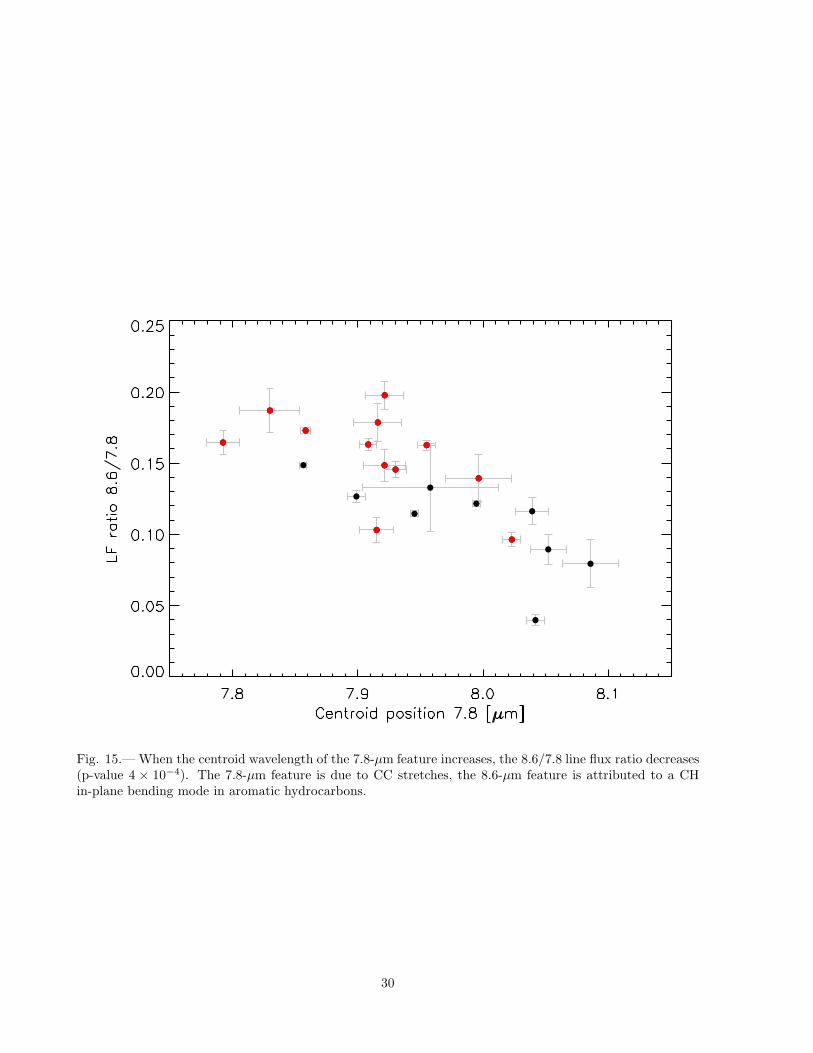
Fig. 15.— When the centroid wavelength of the 7.8-µm feature increases, the 8.6/7.8 line flux ratio decreases(p-value 4 × 10⁻⁴). The 7.8-µm feature is due to CC stretches, the 8.6-µm feature is attributed to a CHin-plane bending mode in aromatic hydrocarbons.
30
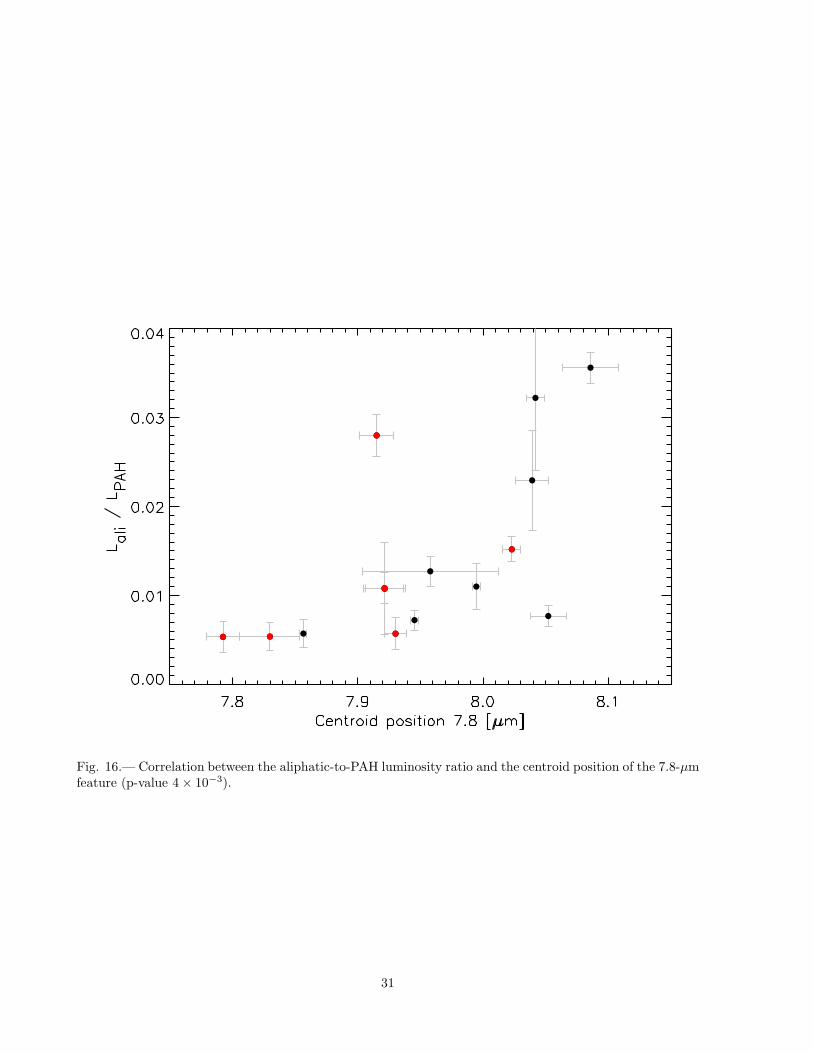
Fig. 16.— Correlation between the aliphatic-to-PAH luminosity ratio and the centroid position of the 7.8-µmfeature (p-value 4× 10⁻³).
31
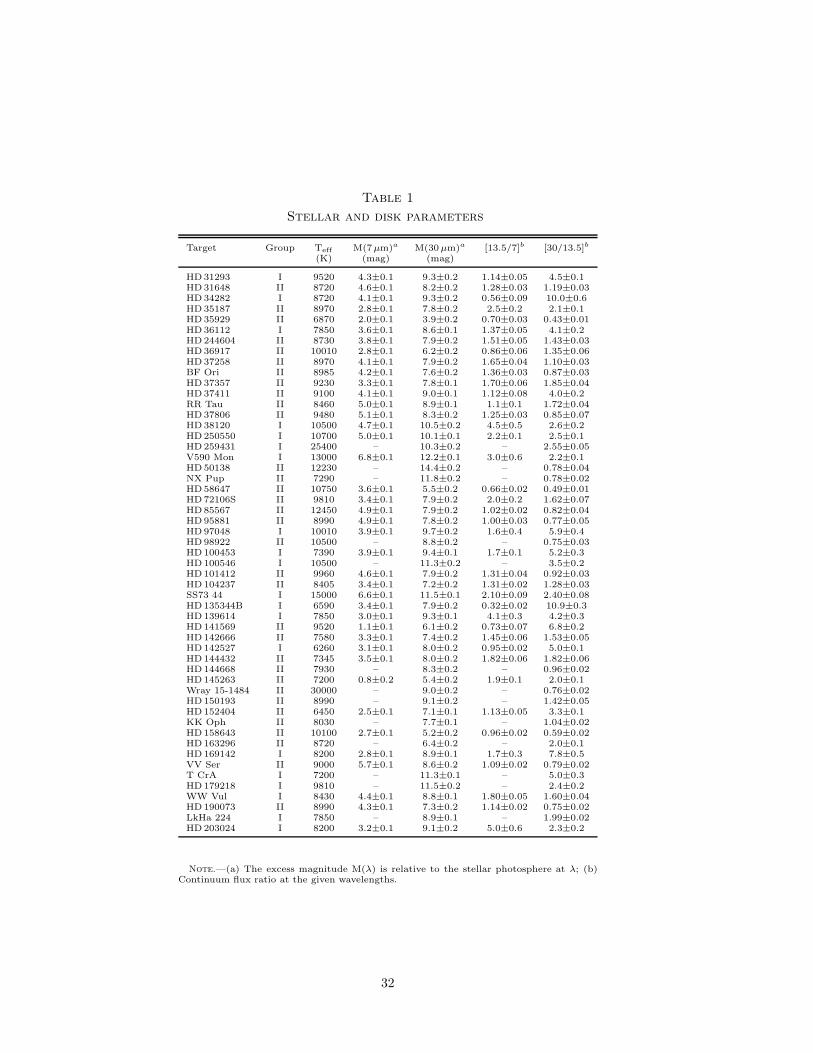
Table 1
Stellar and disk parameters
Target Group Teff M(7µm)a M(30µm)a [13.5/7]b [30/13.5]b
(K) (mag) (mag)
HD31293 I 9520 4.3±0.1 9.3±0.2 1.14±0.05 4.5±0.1HD31648 II 8720 4.6±0.1 8.2±0.2 1.28±0.03 1.19±0.03HD34282 I 8720 4.1±0.1 9.3±0.2 0.56±0.09 10.0±0.6HD35187 II 8970 2.8±0.1 7.8±0.2 2.5±0.2 2.1±0.1HD35929 II 6870 2.0±0.1 3.9±0.2 0.70±0.03 0.43±0.01HD36112 I 7850 3.6±0.1 8.6±0.1 1.37±0.05 4.1±0.2HD244604 II 8730 3.8±0.1 7.9±0.2 1.51±0.05 1.43±0.03HD36917 II 10010 2.8±0.1 6.2±0.2 0.86±0.06 1.35±0.06HD37258 II 8970 4.1±0.1 7.9±0.2 1.65±0.04 1.10±0.03BF Ori II 8985 4.2±0.1 7.6±0.2 1.36±0.03 0.87±0.03HD37357 II 9230 3.3±0.1 7.8±0.1 1.70±0.06 1.85±0.04HD37411 II 9100 4.1±0.1 9.0±0.1 1.12±0.08 4.0±0.2RR Tau II 8460 5.0±0.1 8.9±0.1 1.1±0.1 1.72±0.04HD37806 II 9480 5.1±0.1 8.3±0.2 1.25±0.03 0.85±0.07HD38120 I 10500 4.7±0.1 10.5±0.2 4.5±0.5 2.6±0.2HD250550 I 10700 5.0±0.1 10.1±0.1 2.2±0.1 2.5±0.1HD259431 I 25400 – 10.3±0.2 – 2.55±0.05V590 Mon I 13000 6.8±0.1 12.2±0.1 3.0±0.6 2.2±0.1HD50138 II 12230 – 14.4±0.2 – 0.78±0.04NX Pup II 7290 – 11.8±0.2 – 0.78±0.02HD58647 II 10750 3.6±0.1 5.5±0.2 0.66±0.02 0.49±0.01HD72106S II 9810 3.4±0.1 7.9±0.2 2.0±0.2 1.62±0.07HD85567 II 12450 4.9±0.1 7.9±0.2 1.02±0.02 0.82±0.04HD95881 II 8990 4.9±0.1 7.8±0.2 1.00±0.03 0.77±0.05HD97048 I 10010 3.9±0.1 9.7±0.2 1.6±0.4 5.9±0.4HD98922 II 10500 – 8.8±0.2 – 0.75±0.03HD100453 I 7390 3.9±0.1 9.4±0.1 1.7±0.1 5.2±0.3HD100546 I 10500 – 11.3±0.2 – 3.5±0.2HD101412 II 9960 4.6±0.1 7.9±0.2 1.31±0.04 0.92±0.03HD104237 II 8405 3.4±0.1 7.2±0.2 1.31±0.02 1.28±0.03SS73 44 I 15000 6.6±0.1 11.5±0.1 2.10±0.09 2.40±0.08HD135344B I 6590 3.4±0.1 7.9±0.2 0.32±0.02 10.9±0.3HD139614 I 7850 3.0±0.1 9.3±0.1 4.1±0.3 4.2±0.3HD141569 II 9520 1.1±0.1 6.1±0.2 0.73±0.07 6.8±0.2HD142666 II 7580 3.3±0.1 7.4±0.2 1.45±0.06 1.53±0.05HD142527 I 6260 3.1±0.1 8.0±0.2 0.95±0.02 5.0±0.1HD144432 II 7345 3.5±0.1 8.0±0.2 1.82±0.06 1.82±0.06HD144668 II 7930 – 8.3±0.2 – 0.96±0.02HD145263 II 7200 0.8±0.2 5.4±0.2 1.9±0.1 2.0±0.1Wray 15-1484 II 30000 – 9.0±0.2 – 0.76±0.02HD150193 II 8990 – 9.1±0.2 – 1.42±0.05HD152404 II 6450 2.5±0.1 7.1±0.1 1.13±0.05 3.3±0.1KK Oph II 8030 – 7.7±0.1 – 1.04±0.02HD158643 II 10100 2.7±0.1 5.2±0.2 0.96±0.02 0.59±0.02HD163296 II 8720 – 6.4±0.2 – 2.0±0.1HD169142 I 8200 2.8±0.1 8.9±0.1 1.7±0.3 7.8±0.5VV Ser II 9000 5.7±0.1 8.6±0.2 1.09±0.02 0.79±0.02T CrA I 7200 – 11.3±0.1 – 5.0±0.3HD179218 I 9810 – 11.5±0.2 – 2.4±0.2WW Vul I 8430 4.4±0.1 8.8±0.1 1.80±0.05 1.60±0.04HD190073 II 8990 4.3±0.1 7.3±0.2 1.14±0.02 0.75±0.02LkHa 224 I 7850 – 8.9±0.1 – 1.99±0.02HD203024 I 8200 3.2±0.1 9.1±0.2 5.0±0.6 2.3±0.2
Note.—(a) The excess magnitude M(λ) is relative to the stellar photosphere at λ; (b)Continuum flux ratio at the given wavelengths.
32
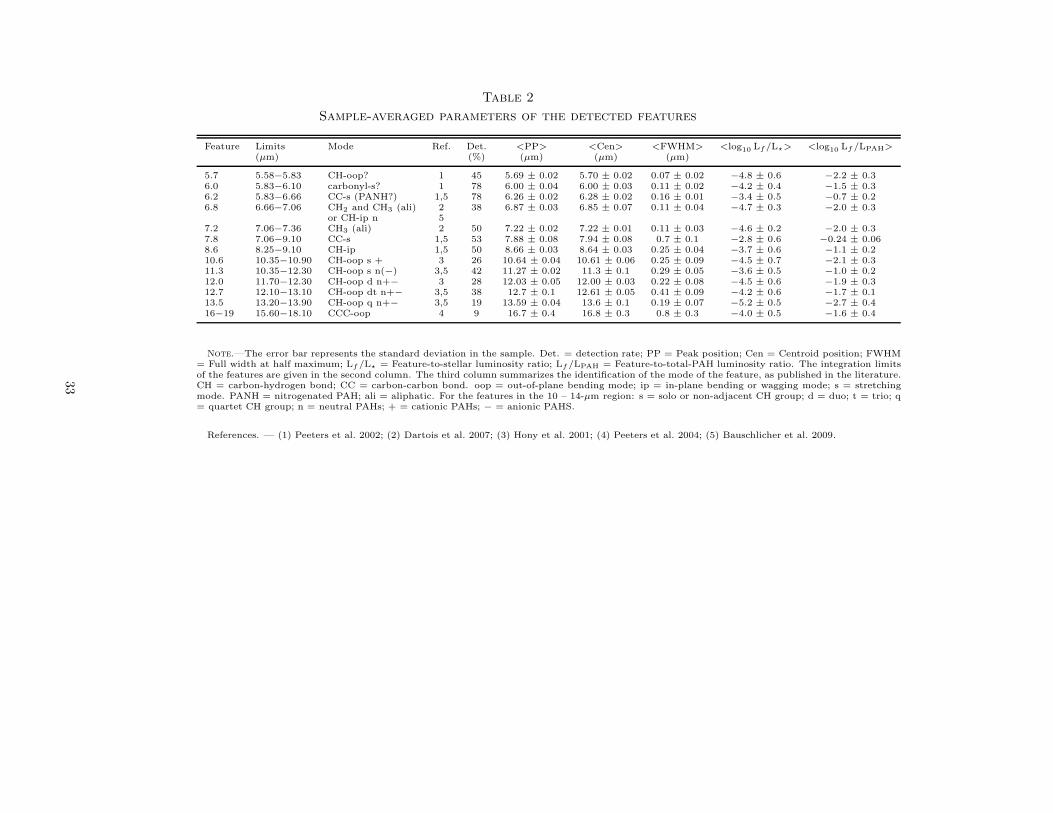
Table 2
Sample-averaged parameters of the detected features
Feature Limits Mode Ref. Det. <PP> <Cen> <FWHM> <log10 Lf/L⋆> <log10 Lf/LPAH>(µm) (%) (µm) (µm) (µm)
5.7 5.58−5.83 CH-oop? 1 45 5.69 ± 0.02 5.70 ± 0.02 0.07 ± 0.02 −4.8 ± 0.6 −2.2 ± 0.36.0 5.83−6.10 carbonyl-s? 1 78 6.00 ± 0.04 6.00 ± 0.03 0.11 ± 0.02 −4.2 ± 0.4 −1.5 ± 0.36.2 5.83−6.66 CC-s (PANH?) 1,5 78 6.26 ± 0.02 6.28 ± 0.02 0.16 ± 0.01 −3.4 ± 0.5 −0.7 ± 0.26.8 6.66−7.06 CH2 and CH3 (ali) 2 38 6.87 ± 0.03 6.85 ± 0.07 0.11 ± 0.04 −4.7 ± 0.3 −2.0 ± 0.3
or CH-ip n 57.2 7.06−7.36 CH3 (ali) 2 50 7.22 ± 0.02 7.22 ± 0.01 0.11 ± 0.03 −4.6 ± 0.2 −2.0 ± 0.37.8 7.06−9.10 CC-s 1,5 53 7.88 ± 0.08 7.94 ± 0.08 0.7 ± 0.1 −2.8 ± 0.6 −0.24 ± 0.068.6 8.25−9.10 CH-ip 1,5 50 8.66 ± 0.03 8.64 ± 0.03 0.25 ± 0.04 −3.7 ± 0.6 −1.1 ± 0.210.6 10.35−10.90 CH-oop s + 3 26 10.64 ± 0.04 10.61 ± 0.06 0.25 ± 0.09 −4.5 ± 0.7 −2.1 ± 0.311.3 10.35−12.30 CH-oop s n(−) 3,5 42 11.27 ± 0.02 11.3 ± 0.1 0.29 ± 0.05 −3.6 ± 0.5 −1.0 ± 0.212.0 11.70−12.30 CH-oop d n+− 3 28 12.03 ± 0.05 12.00 ± 0.03 0.22 ± 0.08 −4.5 ± 0.6 −1.9 ± 0.312.7 12.10−13.10 CH-oop dt n+− 3,5 38 12.7 ± 0.1 12.61 ± 0.05 0.41 ± 0.09 −4.2 ± 0.6 −1.7 ± 0.113.5 13.20−13.90 CH-oop q n+− 3,5 19 13.59 ± 0.04 13.6 ± 0.1 0.19 ± 0.07 −5.2 ± 0.5 −2.7 ± 0.416−19 15.60−18.10 CCC-oop 4 9 16.7 ± 0.4 16.8 ± 0.3 0.8 ± 0.3 −4.0 ± 0.5 −1.6 ± 0.4
Note.—The error bar represents the standard deviation in the sample. Det. = detection rate; PP = Peak position; Cen = Centroid position; FWHM= Full width at half maximum; Lf/L⋆ = Feature-to-stellar luminosity ratio; Lf/LPAH = Feature-to-total-PAH luminosity ratio. The integration limitsof the features are given in the second column. The third column summarizes the identification of the mode of the feature, as published in the literature.CH = carbon-hydrogen bond; CC = carbon-carbon bond. oop = out-of-plane bending mode; ip = in-plane bending or wagging mode; s = stretchingmode. PANH = nitrogenated PAH; ali = aliphatic. For the features in the 10 – 14-µm region: s = solo or non-adjacent CH group; d = duo; t = trio; q= quartet CH group; n = neutral PAHs; + = cationic PAHs; − = anionic PAHS.
References. — (1) Peeters et al. 2002; (2) Dartois et al. 2007; (3) Hony et al. 2001; (4) Peeters et al. 2004; (5) Bauschlicher et al. 2009.
33
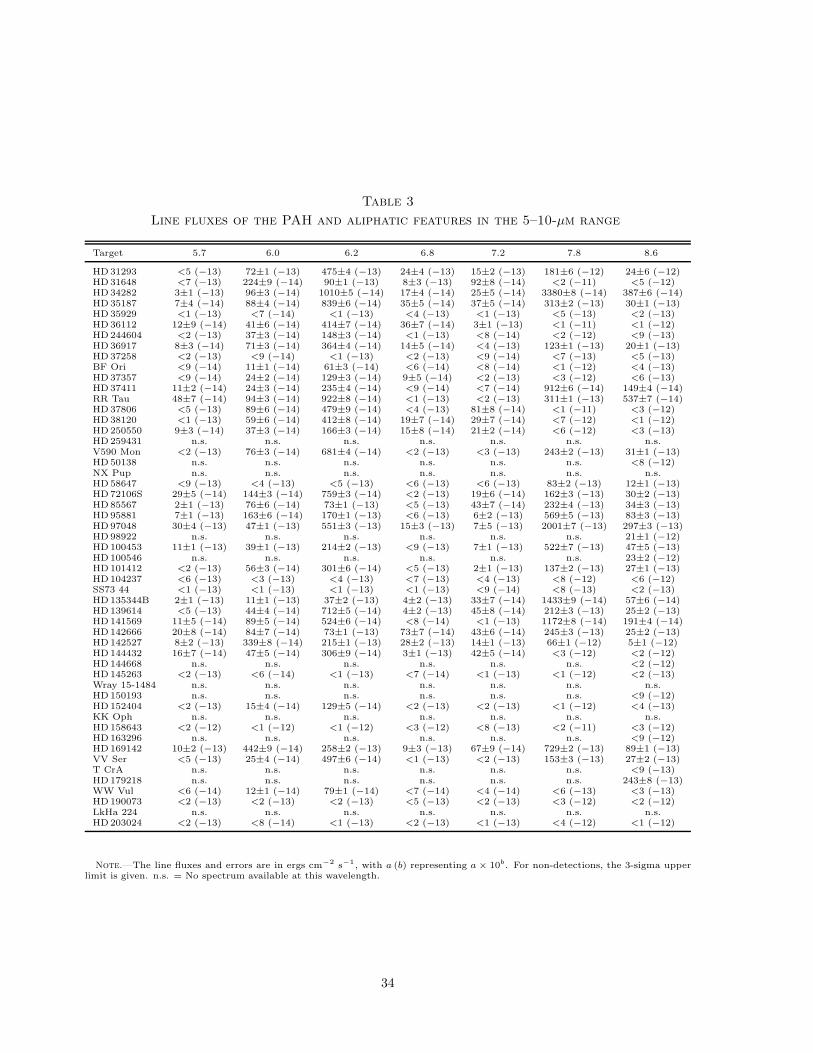
Table 3
Line fluxes of the PAH and aliphatic features in the 5–10-µm range
Target 5.7 6.0 6.2 6.8 7.2 7.8 8.6
HD31293 <5 (−13) 72±1 (−13) 475±4 (−13) 24±4 (−13) 15±2 (−13) 181±6 (−12) 24±6 (−12)HD31648 <7 (−13) 224±9 (−14) 90±1 (−13) 8±3 (−13) 92±8 (−14) <2 (−11) <5 (−12)HD34282 3±1 (−13) 96±3 (−14) 1010±5 (−14) 17±4 (−14) 25±5 (−14) 3380±8 (−14) 387±6 (−14)HD35187 7±4 (−14) 88±4 (−14) 839±6 (−14) 35±5 (−14) 37±5 (−14) 313±2 (−13) 30±1 (−13)HD35929 <1 (−13) <7 (−14) <1 (−13) <4 (−13) <1 (−13) <5 (−13) <2 (−13)HD36112 12±9 (−14) 41±6 (−14) 414±7 (−14) 36±7 (−14) 3±1 (−13) <1 (−11) <1 (−12)HD244604 <2 (−13) 37±3 (−14) 148±3 (−14) <1 (−13) <8 (−14) <2 (−12) <9 (−13)HD36917 8±3 (−14) 71±3 (−14) 364±4 (−14) 14±5 (−14) <4 (−13) 123±1 (−13) 20±1 (−13)HD37258 <2 (−13) <9 (−14) <1 (−13) <2 (−13) <9 (−14) <7 (−13) <5 (−13)BF Ori <9 (−14) 11±1 (−14) 61±3 (−14) <6 (−14) <8 (−14) <1 (−12) <4 (−13)HD37357 <9 (−14) 24±2 (−14) 129±3 (−14) 9±5 (−14) <2 (−13) <3 (−12) <6 (−13)HD37411 11±2 (−14) 24±3 (−14) 235±4 (−14) <9 (−14) <7 (−14) 912±6 (−14) 149±4 (−14)RR Tau 48±7 (−14) 94±3 (−14) 922±8 (−14) <1 (−13) <2 (−13) 311±1 (−13) 537±7 (−14)HD37806 <5 (−13) 89±6 (−14) 479±9 (−14) <4 (−13) 81±8 (−14) <1 (−11) <3 (−12)HD38120 <1 (−13) 59±6 (−14) 412±8 (−14) 19±7 (−14) 29±7 (−14) <7 (−12) <1 (−12)HD250550 9±3 (−14) 37±3 (−14) 166±3 (−14) 15±8 (−14) 21±2 (−14) <6 (−12) <3 (−13)HD259431 n.s. n.s. n.s. n.s. n.s. n.s. n.s.V590 Mon <2 (−13) 76±3 (−14) 681±4 (−14) <2 (−13) <3 (−13) 243±2 (−13) 31±1 (−13)HD50138 n.s. n.s. n.s. n.s. n.s. n.s. <8 (−12)NX Pup n.s. n.s. n.s. n.s. n.s. n.s. n.s.HD58647 <9 (−13) <4 (−13) <5 (−13) <6 (−13) <6 (−13) 83±2 (−13) 12±1 (−13)HD72106S 29±5 (−14) 144±3 (−14) 759±3 (−14) <2 (−13) 19±6 (−14) 162±3 (−13) 30±2 (−13)HD85567 2±1 (−13) 76±6 (−14) 73±1 (−13) <5 (−13) 43±7 (−14) 232±4 (−13) 34±3 (−13)HD95881 7±1 (−13) 163±6 (−14) 170±1 (−13) <6 (−13) 6±2 (−13) 569±5 (−13) 83±3 (−13)HD97048 30±4 (−13) 47±1 (−13) 551±3 (−13) 15±3 (−13) 7±5 (−13) 2001±7 (−13) 297±3 (−13)HD98922 n.s. n.s. n.s. n.s. n.s. n.s. 21±1 (−12)HD100453 11±1 (−13) 39±1 (−13) 214±2 (−13) <9 (−13) 7±1 (−13) 522±7 (−13) 47±5 (−13)HD100546 n.s. n.s. n.s. n.s. n.s. n.s. 23±2 (−12)HD101412 <2 (−13) 56±3 (−14) 301±6 (−14) <5 (−13) 2±1 (−13) 137±2 (−13) 27±1 (−13)HD104237 <6 (−13) <3 (−13) <4 (−13) <7 (−13) <4 (−13) <8 (−12) <6 (−12)SS73 44 <1 (−13) <1 (−13) <1 (−13) <1 (−13) <9 (−14) <8 (−13) <2 (−13)HD135344B 2±1 (−13) 11±1 (−13) 37±2 (−13) 4±2 (−13) 33±7 (−14) 1433±9 (−14) 57±6 (−14)HD139614 <5 (−13) 44±4 (−14) 712±5 (−14) 4±2 (−13) 45±8 (−14) 212±3 (−13) 25±2 (−13)HD141569 11±5 (−14) 89±5 (−14) 524±6 (−14) <8 (−14) <1 (−13) 1172±8 (−14) 191±4 (−14)HD142666 20±8 (−14) 84±7 (−14) 73±1 (−13) 73±7 (−14) 43±6 (−14) 245±3 (−13) 25±2 (−13)HD142527 8±2 (−13) 339±8 (−14) 215±1 (−13) 28±2 (−13) 14±1 (−13) 66±1 (−12) 5±1 (−12)HD144432 16±7 (−14) 47±5 (−14) 306±9 (−14) 3±1 (−13) 42±5 (−14) <3 (−12) <2 (−12)HD144668 n.s. n.s. n.s. n.s. n.s. n.s. <2 (−12)HD145263 <2 (−13) <6 (−14) <1 (−13) <7 (−14) <1 (−13) <1 (−12) <2 (−13)Wray 15-1484 n.s. n.s. n.s. n.s. n.s. n.s. n.s.HD150193 n.s. n.s. n.s. n.s. n.s. n.s. <9 (−12)HD152404 <2 (−13) 15±4 (−14) 129±5 (−14) <2 (−13) <2 (−13) <1 (−12) <4 (−13)KK Oph n.s. n.s. n.s. n.s. n.s. n.s. n.s.HD158643 <2 (−12) <1 (−12) <1 (−12) <3 (−12) <8 (−13) <2 (−11) <3 (−12)HD163296 n.s. n.s. n.s. n.s. n.s. n.s. <9 (−12)HD169142 10±2 (−13) 442±9 (−14) 258±2 (−13) 9±3 (−13) 67±9 (−14) 729±2 (−13) 89±1 (−13)VV Ser <5 (−13) 25±4 (−14) 497±6 (−14) <1 (−13) <2 (−13) 153±3 (−13) 27±2 (−13)T CrA n.s. n.s. n.s. n.s. n.s. n.s. <9 (−13)HD179218 n.s. n.s. n.s. n.s. n.s. n.s. 243±8 (−13)WW Vul <6 (−14) 12±1 (−14) 79±1 (−14) <7 (−14) <4 (−14) <6 (−13) <3 (−13)HD190073 <2 (−13) <2 (−13) <2 (−13) <5 (−13) <2 (−13) <3 (−12) <2 (−12)LkHa 224 n.s. n.s. n.s. n.s. n.s. n.s. n.s.HD203024 <2 (−13) <8 (−14) <1 (−13) <2 (−13) <1 (−13) <4 (−12) <1 (−12)
Note.—The line fluxes and errors are in ergs cm−2 s−1, with a (b) representing a × 10b. For non-detections, the 3-sigma upperlimit is given. n.s. = No spectrum available at this wavelength.
34
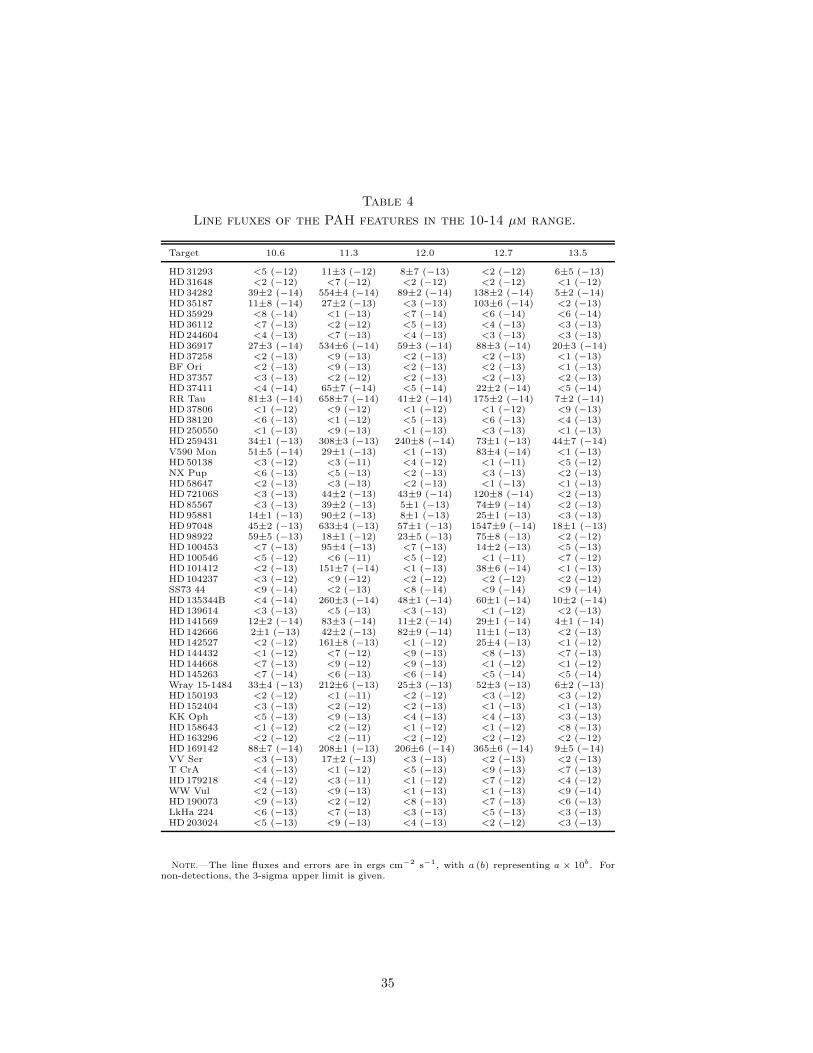
Table 4
Line fluxes of the PAH features in the 10-14 µm range.
Target 10.6 11.3 12.0 12.7 13.5
HD31293 <5 (−12) 11±3 (−12) 8±7 (−13) <2 (−12) 6±5 (−13)HD31648 <2 (−12) <7 (−12) <2 (−12) <2 (−12) <1 (−12)HD34282 39±2 (−14) 554±4 (−14) 89±2 (−14) 138±2 (−14) 5±2 (−14)HD35187 11±8 (−14) 27±2 (−13) <3 (−13) 103±6 (−14) <2 (−13)HD35929 <8 (−14) <1 (−13) <7 (−14) <6 (−14) <6 (−14)HD36112 <7 (−13) <2 (−12) <5 (−13) <4 (−13) <3 (−13)HD244604 <4 (−13) <7 (−13) <4 (−13) <3 (−13) <3 (−13)HD36917 27±3 (−14) 534±6 (−14) 59±3 (−14) 88±3 (−14) 20±3 (−14)HD37258 <2 (−13) <9 (−13) <2 (−13) <2 (−13) <1 (−13)BF Ori <2 (−13) <9 (−13) <2 (−13) <2 (−13) <1 (−13)HD37357 <3 (−13) <2 (−12) <2 (−13) <2 (−13) <2 (−13)HD37411 <4 (−14) 65±7 (−14) <5 (−14) 22±2 (−14) <5 (−14)RR Tau 81±3 (−14) 658±7 (−14) 41±2 (−14) 175±2 (−14) 7±2 (−14)HD37806 <1 (−12) <9 (−12) <1 (−12) <1 (−12) <9 (−13)HD38120 <6 (−13) <1 (−12) <5 (−13) <6 (−13) <4 (−13)HD250550 <1 (−13) <9 (−13) <1 (−13) <3 (−13) <1 (−13)HD259431 34±1 (−13) 308±3 (−13) 240±8 (−14) 73±1 (−13) 44±7 (−14)V590 Mon 51±5 (−14) 29±1 (−13) <1 (−13) 83±4 (−14) <1 (−13)HD50138 <3 (−12) <3 (−11) <4 (−12) <1 (−11) <5 (−12)NX Pup <6 (−13) <5 (−13) <2 (−13) <3 (−13) <2 (−13)HD58647 <2 (−13) <3 (−13) <2 (−13) <1 (−13) <1 (−13)HD72106S <3 (−13) 44±2 (−13) 43±9 (−14) 120±8 (−14) <2 (−13)HD85567 <3 (−13) 39±2 (−13) 5±1 (−13) 74±9 (−14) <2 (−13)HD95881 14±1 (−13) 90±2 (−13) 8±1 (−13) 25±1 (−13) <3 (−13)HD97048 45±2 (−13) 633±4 (−13) 57±1 (−13) 1547±9 (−14) 18±1 (−13)HD98922 59±5 (−13) 18±1 (−12) 23±5 (−13) 75±8 (−13) <2 (−12)HD100453 <7 (−13) 95±4 (−13) <7 (−13) 14±2 (−13) <5 (−13)HD100546 <5 (−12) <6 (−11) <5 (−12) <1 (−11) <7 (−12)HD101412 <2 (−13) 151±7 (−14) <1 (−13) 38±6 (−14) <1 (−13)HD104237 <3 (−12) <9 (−12) <2 (−12) <2 (−12) <2 (−12)SS73 44 <9 (−14) <2 (−13) <8 (−14) <9 (−14) <9 (−14)HD135344B <4 (−14) 260±3 (−14) 48±1 (−14) 60±1 (−14) 10±2 (−14)HD139614 <3 (−13) <5 (−13) <3 (−13) <1 (−12) <2 (−13)HD141569 12±2 (−14) 83±3 (−14) 11±2 (−14) 29±1 (−14) 4±1 (−14)HD142666 2±1 (−13) 42±2 (−13) 82±9 (−14) 11±1 (−13) <2 (−13)HD142527 <2 (−12) 161±8 (−13) <1 (−12) 25±4 (−13) <1 (−12)HD144432 <1 (−12) <7 (−12) <9 (−13) <8 (−13) <7 (−13)HD144668 <7 (−13) <9 (−12) <9 (−13) <1 (−12) <1 (−12)HD145263 <7 (−14) <6 (−13) <6 (−14) <5 (−14) <5 (−14)Wray 15-1484 33±4 (−13) 212±6 (−13) 25±3 (−13) 52±3 (−13) 6±2 (−13)HD150193 <2 (−12) <1 (−11) <2 (−12) <3 (−12) <3 (−12)HD152404 <3 (−13) <2 (−12) <2 (−13) <1 (−13) <1 (−13)KK Oph <5 (−13) <9 (−13) <4 (−13) <4 (−13) <3 (−13)HD158643 <1 (−12) <2 (−12) <1 (−12) <1 (−12) <8 (−13)HD163296 <2 (−12) <2 (−11) <2 (−12) <2 (−12) <2 (−12)HD169142 88±7 (−14) 208±1 (−13) 206±6 (−14) 365±6 (−14) 9±5 (−14)VV Ser <3 (−13) 17±2 (−13) <3 (−13) <2 (−13) <2 (−13)T CrA <4 (−13) <1 (−12) <5 (−13) <9 (−13) <7 (−13)HD179218 <4 (−12) <3 (−11) <1 (−12) <7 (−12) <4 (−12)WW Vul <2 (−13) <9 (−13) <1 (−13) <1 (−13) <9 (−14)HD190073 <9 (−13) <2 (−12) <8 (−13) <7 (−13) <6 (−13)LkHa 224 <6 (−13) <7 (−13) <3 (−13) <5 (−13) <3 (−13)HD203024 <5 (−13) <9 (−13) <4 (−13) <2 (−12) <3 (−13)
Note.—The line fluxes and errors are in ergs cm−2 s−1, with a (b) representing a × 10b. Fornon-detections, the 3-sigma upper limit is given.
35
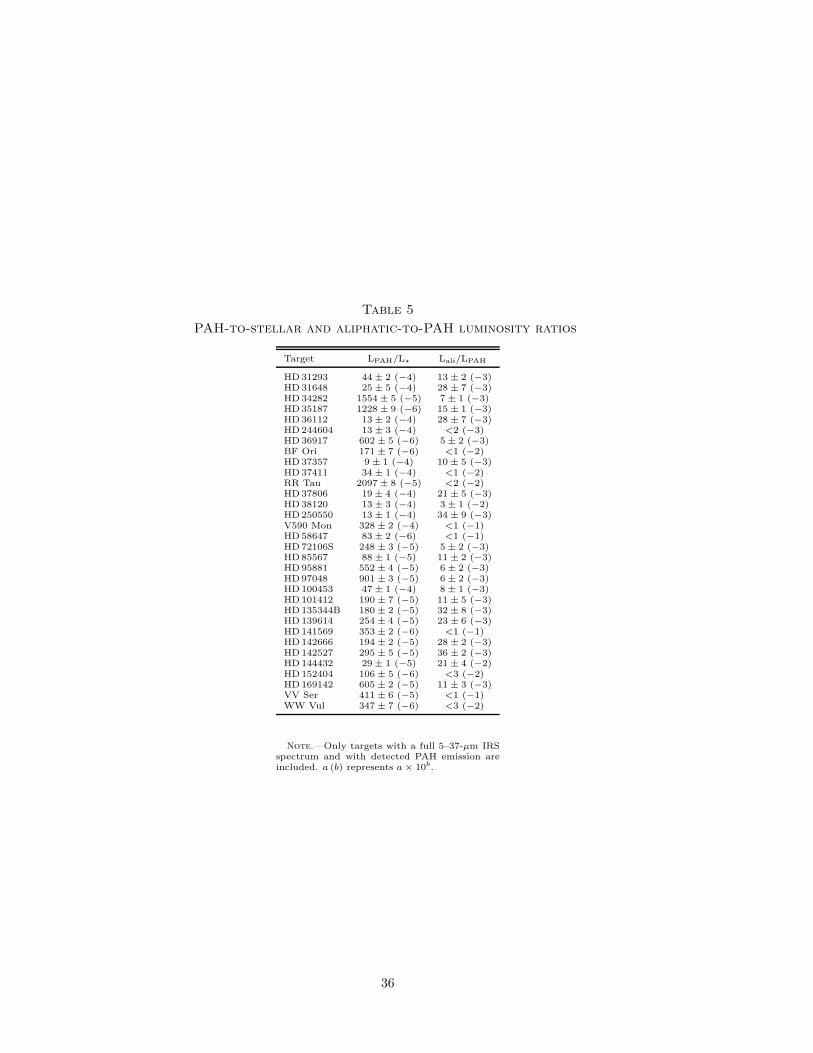
Table 5
PAH-to-stellar and aliphatic-to-PAH luminosity ratios
Target LPAH/L⋆ Lali/LPAH
HD31293 44 ± 2 (−4) 13 ± 2 (−3)HD31648 25 ± 5 (−4) 28 ± 7 (−3)HD34282 1554 ± 5 (−5) 7 ± 1 (−3)HD35187 1228 ± 9 (−6) 15 ± 1 (−3)HD36112 13 ± 2 (−4) 28 ± 7 (−3)HD244604 13 ± 3 (−4) <2 (−3)HD36917 602 ± 5 (−6) 5 ± 2 (−3)BF Ori 171 ± 7 (−6) <1 (−2)HD37357 9 ± 1 (−4) 10 ± 5 (−3)HD37411 34 ± 1 (−4) <1 (−2)RR Tau 2097 ± 8 (−5) <2 (−2)HD37806 19 ± 4 (−4) 21 ± 5 (−3)HD38120 13 ± 3 (−4) 3 ± 1 (−2)HD250550 13 ± 1 (−4) 34 ± 9 (−3)V590 Mon 328 ± 2 (−4) <1 (−1)HD58647 83 ± 2 (−6) <1 (−1)HD72106S 248 ± 3 (−5) 5 ± 2 (−3)HD85567 88 ± 1 (−5) 11 ± 2 (−3)HD95881 552 ± 4 (−5) 6 ± 2 (−3)HD97048 901 ± 3 (−5) 6 ± 2 (−3)HD100453 47 ± 1 (−4) 8 ± 1 (−3)HD101412 190 ± 7 (−5) 11 ± 5 (−3)HD135344B 180 ± 2 (−5) 32 ± 8 (−3)HD139614 254 ± 4 (−5) 23 ± 6 (−3)HD141569 353 ± 2 (−6) <1 (−1)HD142666 194 ± 2 (−5) 28 ± 2 (−3)HD142527 295 ± 5 (−5) 36 ± 2 (−3)HD144432 29 ± 1 (−5) 21 ± 4 (−2)HD152404 106 ± 5 (−6) <3 (−2)HD169142 605 ± 2 (−5) 11 ± 3 (−3)VV Ser 411 ± 6 (−5) <1 (−1)WW Vul 347 ± 7 (−6) <3 (−2)
Note.—Only targets with a full 5–37-µm IRSspectrum and with detected PAH emission areincluded. a (b) represents a × 10b.
36
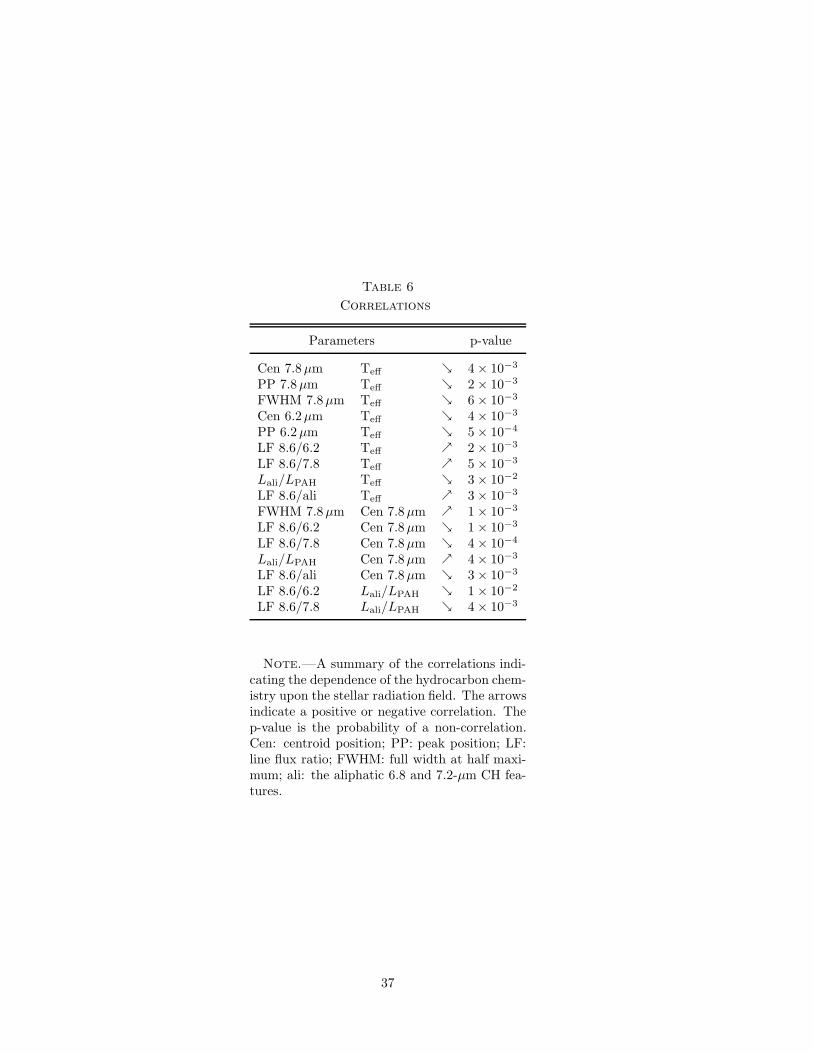
Table 6
Correlations
Parameters p-value
Cen 7.8µm Teff Ů 4× 10⁻³
PP 7.8µm Teff Ů 2× 10⁻³
FWHM 7.8µm Teff Ů 6× 10⁻³
Cen 6.2µm Teff Ů 4× 10⁻³
PP 6.2µm Teff Ů 5× 10⁻⁴
LF 8.6/6.2 Teff Ű 2× 10⁻³
LF 8.6/7.8 Teff Ű 5× 10⁻³
Lali/LPAH Teff Ů 3× 10⁻²
LF 8.6/ali Teff Ű 3× 10⁻³
FWHM 7.8µm Cen 7.8µm Ű 1× 10⁻³
LF 8.6/6.2 Cen 7.8µm Ů 1× 10⁻³
LF 8.6/7.8 Cen 7.8µm Ů 4× 10⁻⁴
Lali/LPAH Cen 7.8µm Ű 4× 10⁻³
LF 8.6/ali Cen 7.8µm Ů 3× 10⁻³
LF 8.6/6.2 Lali/LPAH Ů 1× 10⁻²
LF 8.6/7.8 Lali/LPAH Ů 4× 10⁻³
Note.—A summary of the correlations indi-cating the dependence of the hydrocarbon chem-istry upon the stellar radiation field. The arrowsindicate a positive or negative correlation. Thep-value is the probability of a non-correlation.Cen: centroid position; PP: peak position; LF:line flux ratio; FWHM: full width at half maxi-mum; ali: the aliphatic 6.8 and 7.2-µm CH fea-tures.
37