SPECTROSCOPIC STUDY OF THE HST /ACS PEARS EMISSION-LINE GALAXIES
17
arXiv:1011.4064v3 [astro-ph.CO] 15 Dec 2010 Spectroscopic Study of the HST/ACS PEARS Emission-Line Galaxies Lifang Xia 1 , Sangeeta Malhotra 1 , James Rhoads 1 , Norbert Pirzkal 2 , Zhenya Zheng 1,3 , Gerhardt Meurer 4 , Amber Straughn 5 , Norman Grogin 6 , David Floyd 7 ABSTRACT We present spectroscopy of 76 emission-line galaxies (ELGs) in CDF-S taken with the LDSS3 spectrograph on Magellan Telescope. These galaxies are selected to have emission lines with ACS grism data in the Hubble Space Telescope Probing Evolution and Reionization Spectroscopically (PEARS) grism Survey. The ACS grism spectra cover the wavelength range 6000-9700 ˚ A and most PEARS grism redshifts are based on a single emission line + photometric redshifts from broad- band colors; the Magellan spectra cover a wavelength range from 4000 ˚ A to 9000 ˚ A, and provide a check on redshifts derived from PEARS data. We find an accuracy of σ z = 0.006 for the ACS grism redshifts with only one catastrophic outlier. We probe for AGN in our sample via several different methods. In total we find 7 AGNs and AGN candidates out of 76 galaxies. Two AGNs are identified from the X-ray full-band luminosity, L X−ray,F B > 10 43 erg s −1 , the line widths and the power-law continuum spectra. Two unobscured faint AGN candidates are identified from the X-ray full-band luminosity L X−ray,F B ∼ 10 41 erg s −1 , the hardness ratio and the column density, and the emission-line and X-ray derived SFRs. Two candidates are classified based on the line ratio of [NII]λ6584/Hα versus [OIII]λ5007/Hβ (BPT diagram), which are between the 1 School of Earth and Space Exploration, Arizona State University, AZ, 85287; [email protected] 2 Space Telescope Science Institute, Baltimore, MD, 21218; [email protected] 3 Center for Astrophysics, University of Science and Technology of China, Hefei, Anhui, 230026, China; [email protected] 4 Department of Physics and Astronomy, Johns Hopkins University, Baltimore, MD, 21218; [email protected] 5 NASA Goddard Space Flight Center, Greenbelt, MD, 20771; [email protected] 6 Space Telescope Science Institute, Baltimore, MD, 21218; [email protected] 7 AAO/OCIW Magellan fellow, School of Physics, University of Melbourne, VIC, 3010, Australia; dfl[email protected]
-
Upload
independent -
Category
Documents
-
view
0 -
download
0
Transcript of SPECTROSCOPIC STUDY OF THE HST /ACS PEARS EMISSION-LINE GALAXIES
arX
iv:1
011.
4064
v3 [
astr
o-ph
.CO
] 1
5 D
ec 2
010
Spectroscopic Study of the HST/ACS PEARS Emission-Line
Galaxies
Lifang Xia1, Sangeeta Malhotra1, James Rhoads1, Norbert Pirzkal2, Zhenya Zheng1,3,
Gerhardt Meurer4, Amber Straughn5, Norman Grogin6, David Floyd7
ABSTRACT
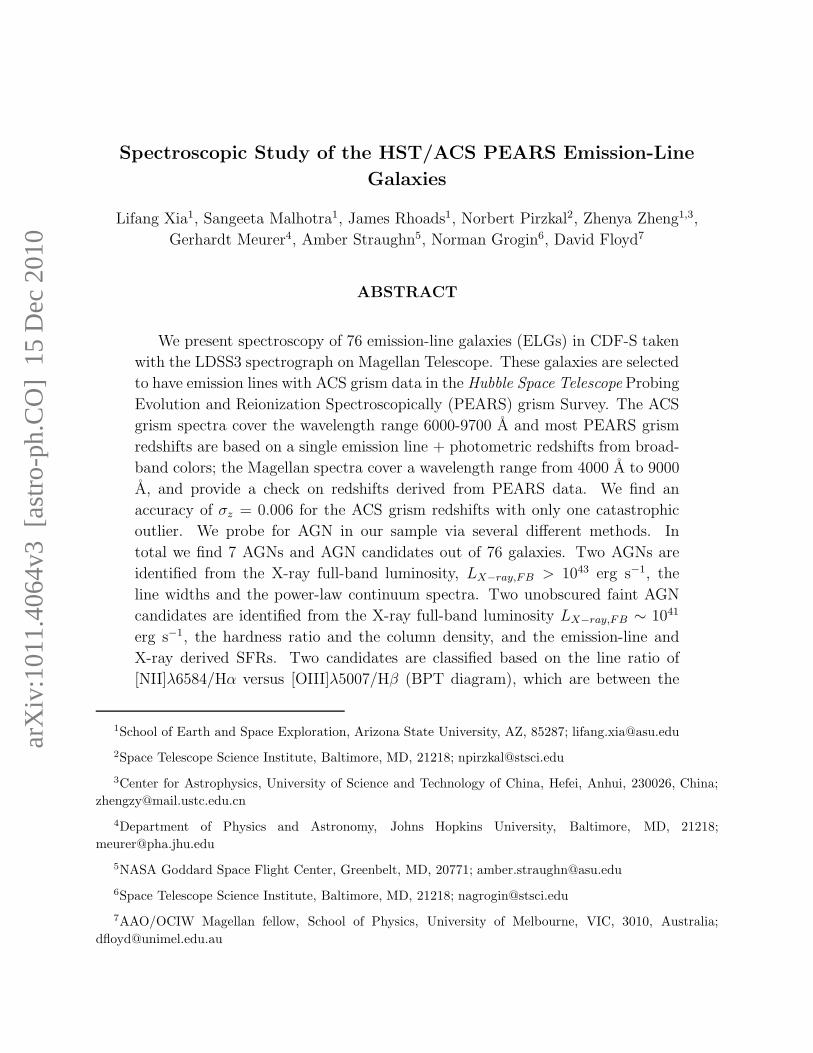
We present spectroscopy of 76 emission-line galaxies (ELGs) in CDF-S taken
with the LDSS3 spectrograph on Magellan Telescope. These galaxies are selected
to have emission lines with ACS grism data in the Hubble Space Telescope Probing
Evolution and Reionization Spectroscopically (PEARS) grism Survey. The ACS
grism spectra cover the wavelength range 6000-9700 A and most PEARS grism
redshifts are based on a single emission line + photometric redshifts from broad-
band colors; the Magellan spectra cover a wavelength range from 4000 A to 9000
A, and provide a check on redshifts derived from PEARS data. We find an
accuracy of σz = 0.006 for the ACS grism redshifts with only one catastrophic
outlier. We probe for AGN in our sample via several different methods. In
total we find 7 AGNs and AGN candidates out of 76 galaxies. Two AGNs are
identified from the X-ray full-band luminosity, LX−ray,FB > 1043 erg s−1, the
line widths and the power-law continuum spectra. Two unobscured faint AGN
candidates are identified from the X-ray full-band luminosity LX−ray,FB ∼ 1041
erg s−1, the hardness ratio and the column density, and the emission-line and
X-ray derived SFRs. Two candidates are classified based on the line ratio of
[NII]λ6584/Hα versus [OIII]λ5007/Hβ (BPT diagram), which are between the
1School of Earth and Space Exploration, Arizona State University, AZ, 85287; [email protected]
2Space Telescope Science Institute, Baltimore, MD, 21218; [email protected]
3Center for Astrophysics, University of Science and Technology of China, Hefei, Anhui, 230026, China;
4Department of Physics and Astronomy, Johns Hopkins University, Baltimore, MD, 21218;
5NASA Goddard Space Flight Center, Greenbelt, MD, 20771; [email protected]
6Space Telescope Science Institute, Baltimore, MD, 21218; [email protected]
7AAO/OCIW Magellan fellow, School of Physics, University of Melbourne, VIC, 3010, Australia;
– 2 –
empirical and theoretical demarcation curves, i.e, the transition region from star-
forming galaxies to AGNs. One AGN candidate is identified from the high-
ionization emission line HeIIA4686.
Subject headings: galaxies: emission lines – galaxies: star formation – techniques:
spectroscopic
1. Introduction
The HST/ACS/G800L grism survey Probing Evolution and Reionization Spectroscop-
ically (PEARS, PI: S. Malhotra) produces low-resolution (R ∼ 100) slitless spectra in the
wavelength range from 6000A to 9700A. The survey covers four ACS pointings in GOODS
North (GOODS-N) and five ACS pointings Chandra Deep Field South (CDF-S) fields yield-
ing spectra of all objects up to z = 27 magnitude up to z = 28 magnitude in the Hubble
Ultra Deep Field (HUDF). We selected emission-line galaxies in CDF-S from the samples of
Xu et al. (2007), and Straughn et al. (2008, 2009), regardless of the broad-band magnitude
for followup with Magellan telescope for R ∼ 1900 spectroscopy. Thus we are able to get
spectra for much fainter objects than have been selected traditionally (e.g. Vanzella et al.
2006, 2008). One of the aims of the followup spectroscopy is to confirm the redshifts obtained
from the grism data.
The grism data, due to the limited wavelength coverage and low spectral resolution,
often yields only a single unresolved line. For single-line spectra, the lines are identified as:
[OII]λ3727A, [OIII]λλ4959,5007A and Hα based on photometric redshifts derived from the
broad-band colors (Xu et al. 2007, Straughn et al. 2008, 2009).
In this paper, we present the confirmation of the ACS grism redshifts by the follow-
up Magellan LDSS-3 multislit spectroscopic observation of a sample of 107 emission-line
galaxies (ELGs) pre-selected by Straughn et al. (2009) in the GOODS-S field. We also
compare the flux calibration in the two observations. The normal star-forming galax-
ies and AGNs are classified by the emission-line ratios of the BPT diagnostics diagram
(Baldwin, Phillips, & Terlevich 1981) and X-ray observations. The paper is organized as be-
low. We briefly describe the observation and the data reduction in § 2. The result of redshift
comparison with grism measurement, flux calibration comparison and AGNs classification
are illustrated in § 3. Finally, we present the summary in § 4.
– 3 –
2. Data and Reduction
From the HST/ACS PEARS grism survey, Straughn et al. (2009) selected 203 emission-
line galaxies by a 2-dimensional detection and extraction procedure in the GOODS-S field.
The line luminosities of grism observations extend the studies of star-forming galaxies to
M ∼ −18.5 at z ∼ 1.5. Starting from 107 pre-selected emission-line galaxies, we obtain 89
emission-line galaxies spectra from the follow-up Magellan LDSS-3 multislit spectroscopic
observation after excluding the undetected spectra and bad spectra. With 13 galaxies ob-
served twice, the final sample includes 76 different galaxies. Figure 1 shows the apparent
magnitude distribution of the total pre-selected ELGs put on masks (dashed line) and the
sample of 76 different galaxies with follow-up spectroscopic observation (solid line). The
pre-selected emission-line galaxies cover magnitude range from 18.0 to 27.0 with a peak at
23.5. The subsample for follow-up observation follows the same distribution.
The spectroscopic follow-up was done in a total of four nights in November 2007 and
December 2008 using the Magellan LDSS-3 spectrograph and using the VPH-Blue and VPH-
Red grisms. The LDSS-3 instrument has a scale of 0.′′189/pixel. The VPH-Blue grism covers
the wavelength range from 4000A to 6500A with a resolution of R = 1810, dispersion of
0.682A/pixel@5200A. The VPH-Red grism covers the wavelength range from 6000A to 9000A
with OG590 filter used to eliminate contamination from the second order. The red grism
has a resolution of R = 1900 and dispersion of 1.175A/pixel@8500A. We used slit widths of
0.′′8.
Five masks were created to contain all of the science objects with 4-6 alignment stars
located at different parts of each mask. The fields were observed with integration times
of 5400s, 7200s, and 8100s. For masks observed in 2007, the spectroscopic standard star
LTT1020 was observed for calibration; in 2008, the spectroscopic standard stars, LTT1020,
LTT2415, EG21 and LTT3864 were observed for flux calibration.
We reduced the spectra using the COSMOS software package (Oemler et al. 2009, COSMOS Version 2.13
which is designed for multislit spectra obtained using the IMACS and LDSS3 spectrographs
on Magellan. Following the reduction process of making alignment, subtracting bias, flat-
tening, wavelength calibration, sky subtraction and 2-dimensional spectra extraction, the
blue-end and red-end spectra were obtained for all objects. The 1-d spectra extraction and
flux calibration were accomplished in IRAF .
To check the flux calibration from year to year we compared the calibrated spectra for
objects observed in both years. Upon doing this, we realized that the flux calibration of
2007 data, which was based on a single calibration star was systematically higher. This, we
conjectured, must be due to misplacement of the standard star in the slit. The sensitivity

– 4 –
18 20 22 24 26 280
5
10
15
20
i (mag)
Fig. 1.— Histogram of the distribution of i-band (ACS F775W) apparent magnitudes. The
dashed line is that of the total 107 emission-line galaxies put on masks. The solid line is
that of the 76 emission-line galaxies with good quality redshift measurements from LDSS3.
The magnitudes of the sample peak at i = 23.5.
– 5 –
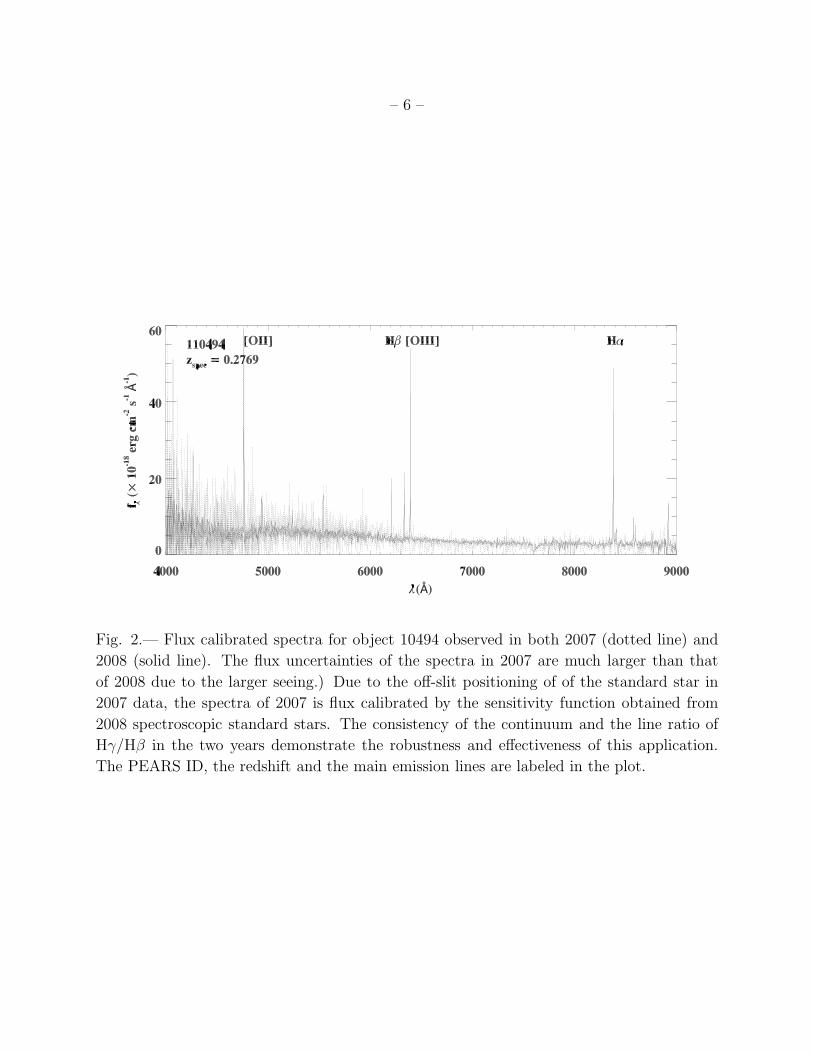
function of the CCD obtained from the spectroscopic standard stars observation in 2008 is
applied to the flux calibration of the 2007 data. To check its robustness, we then used object
110494, which has strong continuum and is observed in both years. Figure 2 shows the two
flux calibrated spectra for the object. The blue and red spectra are combined together to
cover wavelength range from 4000A to 9000A. The spectra show consistency in the junction
point at 6500A of the blue and red ends. The dotted line shows the spectra obtained from
2007 data and the solid line represents that of 2008. The main strong emission lines emerging
in the spectra are [OII]λ3727, Hβ, [OIII]λλ4959,5007, and Hα. We fit the continuum of the
two spectra and find a difference of 5% in the continuum flux from 5000 A to 9000 A.
We measure the line fluxes and errors for Hβ and Hγ, and obtain the ratio of Hγ/Hβ =
0.45±0.05, and 0.48±0.07, separately. The ratios are in good agreement with each other
and with the theoretical value, 0.469. The good agreement of the continuum and the line
ratios of the two years spectra demonstrate that the calibration is sufficiently robust for our
purpose.
From the 2-dimensional spectra, we finally obtained 89 sources which show clear detec-
tion of emission lines. The galaxy redshifts are first visually determined from the pattern of
the emission lines. The accurate redshifts and uncertainties are determined by the average
and variance of the redshifts obtained from the main emission lines in the spectra. In the 89
spectra, there are 13 objects which were observed in both years. We finally obtain 76 unique
redshifts which are used to assess the accuracy of the grism redshifts at 0.1 < z < 1.3.
Excluding objects only observed in blue or red end, objects with signal to noise ratio
less than 3 in Hβ, and [OIII]λλ4959,5007, and objects with one or more emission lines out of
spectral coverage, we measure the line fluxes for 55 well extracted 1-d spectra with whole set
of [OII]λλ3727,3729, Hβ, and [OIII]λλ4959,5007 lines. The emission-line fluxes are measured
by Gaussian fitting (gaussfit in idl) expanding 40A around the line peak. Most of the
FWHM of the line profiles are in the range from 2 A to 9 A with line velocities < 500 km
s−1, except two objects, 92839 and 102156, of 28 and 79 A, corresponding to velocities ∼
1000, 3800 km s−1 (discussed in § 3.3).
3. Results
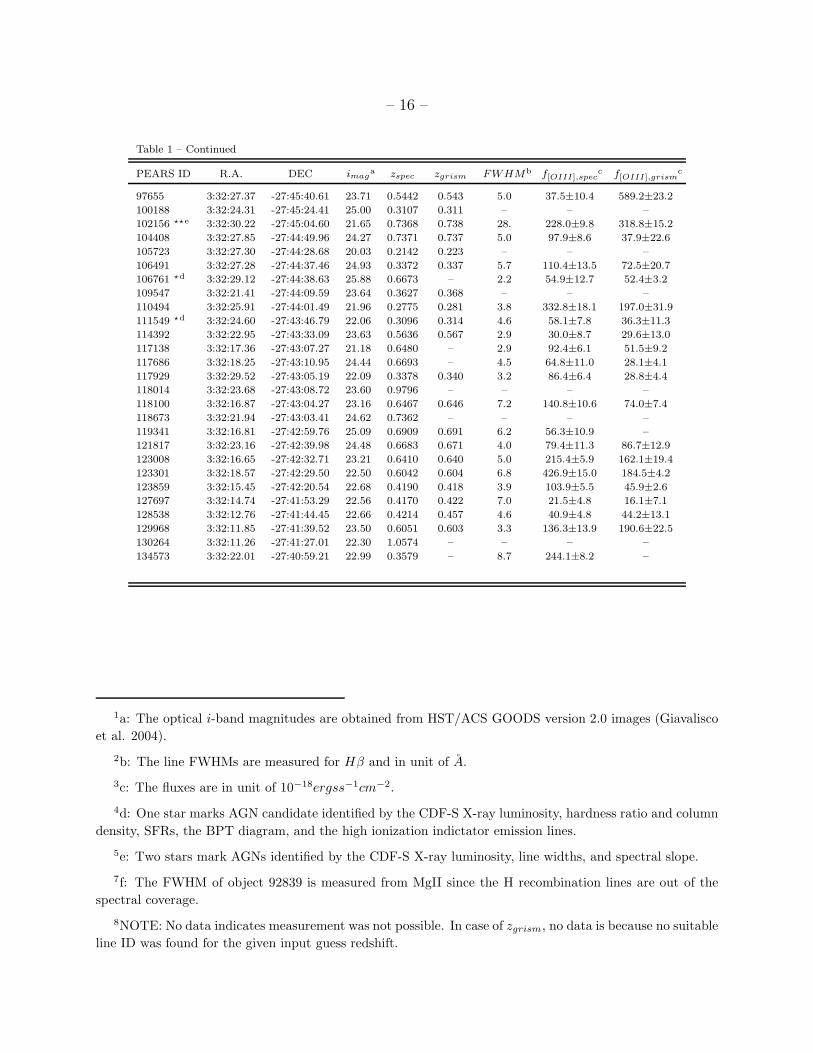
Table 1 lists the general information and the measurement results of the galaxy sample,
the PEARS ID (column 1), R.A. (column 2), Dec. (column 3), i magnitude (column 4),
spectroscopic redshifts (column 5), grism redshifts (column 6), the FWHM of line Hβ (column
7), the flux and flux error of [OIII]λ4959,5007 in the Magellan spectroscopy (column 8) and
the PEARS grism survey (column 9).
– 6 –
Fig. 2.— Flux calibrated spectra for object 10494 observed in both 2007 (dotted line) and
2008 (solid line). The flux uncertainties of the spectra in 2007 are much larger than that
of 2008 due to the larger seeing.) Due to the off-slit positioning of of the standard star in
2007 data, the spectra of 2007 is flux calibrated by the sensitivity function obtained from
2008 spectroscopic standard stars. The consistency of the continuum and the line ratio of
Hγ/Hβ in the two years demonstrate the robustness and effectiveness of this application.
The PEARS ID, the redshift and the main emission lines are labeled in the plot.
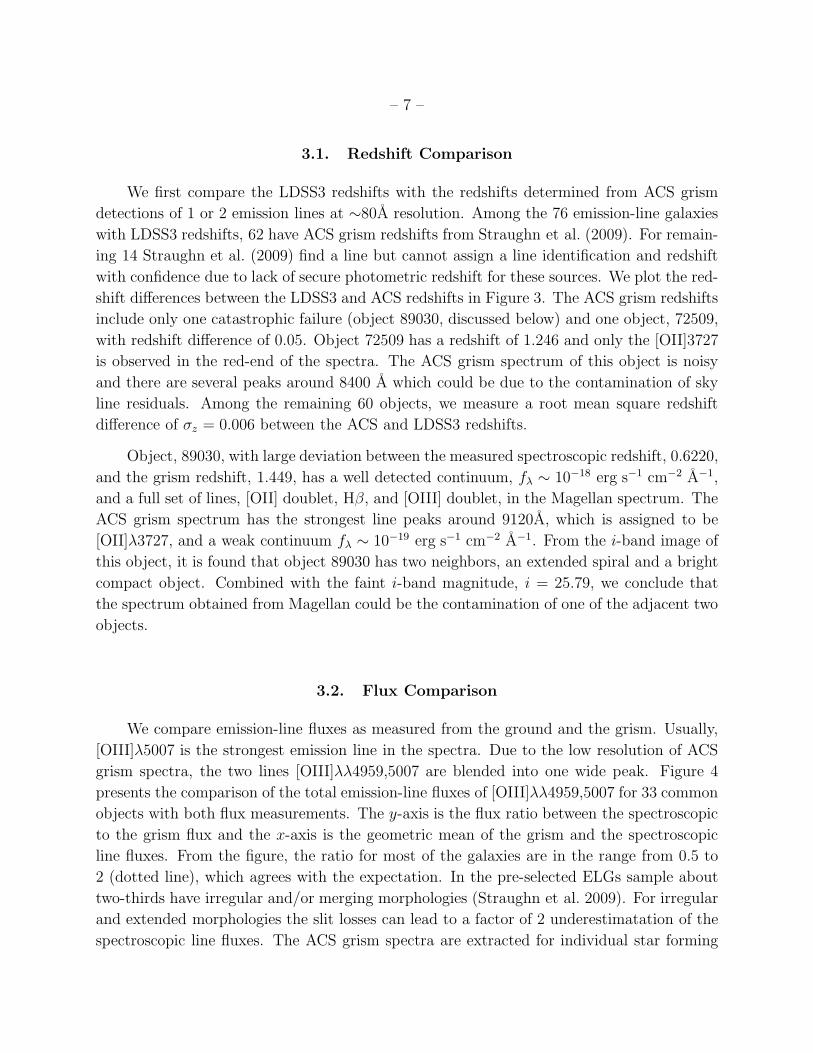
– 7 –
3.1. Redshift Comparison
We first compare the LDSS3 redshifts with the redshifts determined from ACS grism
detections of 1 or 2 emission lines at ∼80A resolution. Among the 76 emission-line galaxies
with LDSS3 redshifts, 62 have ACS grism redshifts from Straughn et al. (2009). For remain-
ing 14 Straughn et al. (2009) find a line but cannot assign a line identification and redshift
with confidence due to lack of secure photometric redshift for these sources. We plot the red-
shift differences between the LDSS3 and ACS redshifts in Figure 3. The ACS grism redshifts
include only one catastrophic failure (object 89030, discussed below) and one object, 72509,
with redshift difference of 0.05. Object 72509 has a redshift of 1.246 and only the [OII]3727
is observed in the red-end of the spectra. The ACS grism spectrum of this object is noisy
and there are several peaks around 8400 A which could be due to the contamination of sky
line residuals. Among the remaining 60 objects, we measure a root mean square redshift
difference of σz = 0.006 between the ACS and LDSS3 redshifts.
Object, 89030, with large deviation between the measured spectroscopic redshift, 0.6220,
and the grism redshift, 1.449, has a well detected continuum, fλ ∼ 10−18 erg s−1 cm−2 A−1,
and a full set of lines, [OII] doublet, Hβ, and [OIII] doublet, in the Magellan spectrum. The
ACS grism spectrum has the strongest line peaks around 9120A, which is assigned to be
[OII]λ3727, and a weak continuum fλ ∼ 10−19 erg s−1 cm−2 A−1. From the i-band image of
this object, it is found that object 89030 has two neighbors, an extended spiral and a bright
compact object. Combined with the faint i-band magnitude, i = 25.79, we conclude that
the spectrum obtained from Magellan could be the contamination of one of the adjacent two
objects.
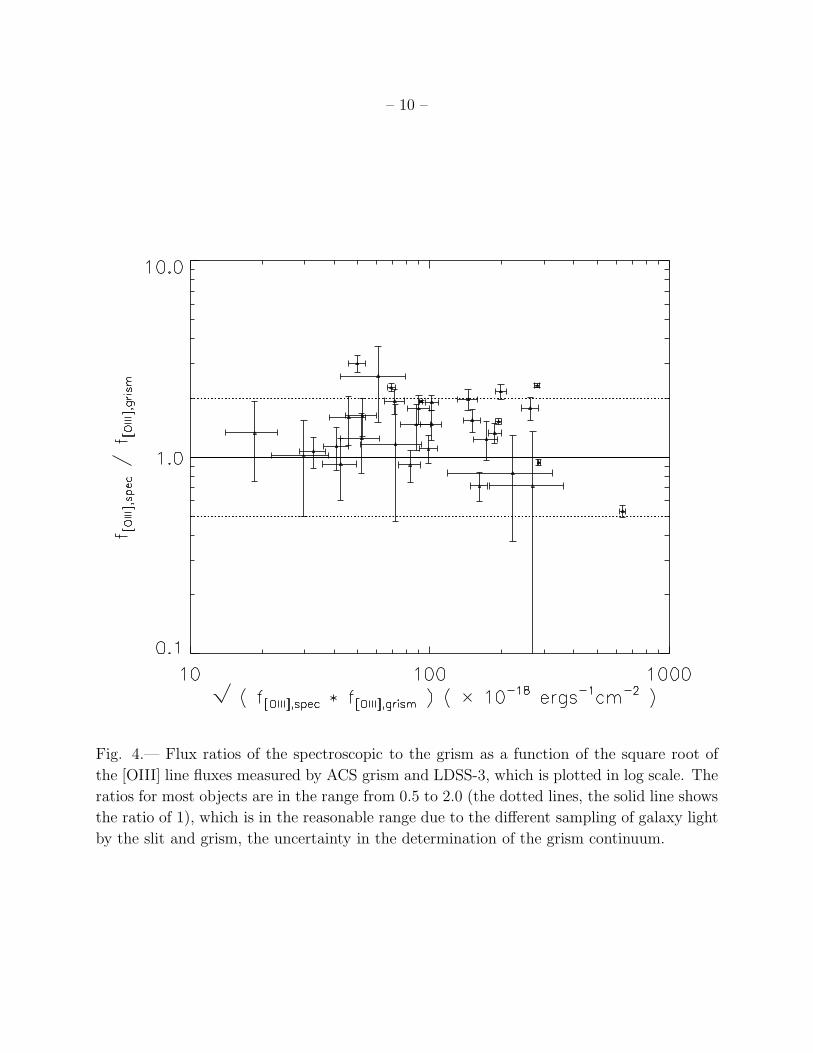
3.2. Flux Comparison
We compare emission-line fluxes as measured from the ground and the grism. Usually,
[OIII]λ5007 is the strongest emission line in the spectra. Due to the low resolution of ACS
grism spectra, the two lines [OIII]λλ4959,5007 are blended into one wide peak. Figure 4
presents the comparison of the total emission-line fluxes of [OIII]λλ4959,5007 for 33 common
objects with both flux measurements. The y-axis is the flux ratio between the spectroscopic
to the grism flux and the x-axis is the geometric mean of the grism and the spectroscopic
line fluxes. From the figure, the ratio for most of the galaxies are in the range from 0.5 to
2 (dotted line), which agrees with the expectation. In the pre-selected ELGs sample about
two-thirds have irregular and/or merging morphologies (Straughn et al. 2009). For irregular
and extended morphologies the slit losses can lead to a factor of 2 underestimatation of the
spectroscopic line fluxes. The ACS grism spectra are extracted for individual star forming

– 8 –
Fig. 3.— Redshift differences between the spectroscopic and the grism redshifts as a function
of the spectroscopic redshifts. The accuracy of the grism redshift is measured to be σz =
0.006.

– 9 –
knots based on the 2D detection (Straughn et al. 2009), which could introduce big differences
for flux comparison also. Other factors, such as the uncertainty in the background continuum
determination of the ACS spectra, the contamination of the Hβ can introduce some factor
to the line fluxes. Therefore, we assume that the factor from 0.5 to 2 in the flux ratio is in
the reasonable range of the measurements.
3.3. AGN Identification
The contribution to the emission lines in spectra includes the ionized HII region by
massive stars in normal star-forming galaxies and the narrow-line region (NLR) of AGNs.
To classify the emission-line galaxies in our sample to be star-forming galaxies or AGNs, we
use two methods: catalog matching to the CDF-S X-ray sources catalog of Luo et al. (2008),
and comparison of the [NII]λ6584/Hα versus [OIII]/Hβ line ratios (i.e. the well known BPT
diagram; (Baldwin, Phillips, & Terlevich 1981). The cross-check with the X-ray detections
gives 5 X-ray counterparts with separation within 2′′, which are possible AGNs and are
marked in Table 1. By checking the X-ray full-band flux, the two objects, 92839 and 102156,
have a luminosity of LFB = 6.36×1043 ergs s−1 and 3.36×1043 erg s−1, respectively. From the
spectra, these two objects show strong exponential-slope continuum. From the line widths,
the lines of these two AGNs have velocities ∼ 3800 km s−1, ∼ 1000 km s−1. Thus, these two
are determined to be broad-line AGNs.
The other three objects, 59018, 60143, and 79483, show LFB ∼ 1041 ergs s−1 and
are possible starburst galaxies and faint AGNs. We derive the hardness ratios, HR=(H-
S)/(H+S), where S and H are counts in the soft-band (0.5-2 keV) and in the hard-band
(2-7 keV), for the two galaxies, 59018 and 79483. The HRs are < – 0.13 and < – 0.29,
respectively, which implies an intrinsic absorption of X-ray column density NH < 8.8 and
2.4 ×1021 cm−2 (68% confidence level, for γ = 2.0 and solar metallicity). This suggests that
the X-ray fluxes are dominated by star formation or unobscured faint AGN.
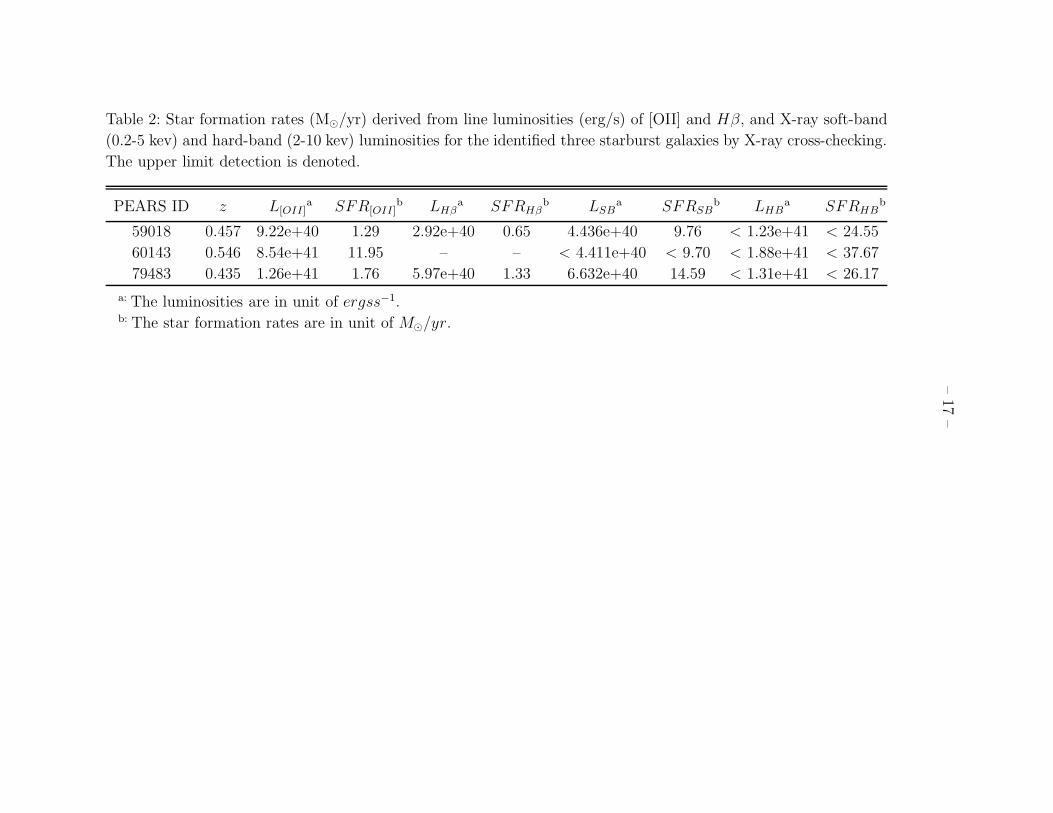
We use the extinction corrected (the extinction is obtained by the continuum SED fitting
with the BC03 stellar population synthesis model, Bruzual & Charlot 2003) line fluxes of
[OII] andHβ to derive the star formation rates (SFR) for the three possible starburst galaxies
by the calibrations given by Kennicutt (1998), and use the soft-band (0.5-2 kev) and hard-
band (2-10 kev) X-ray fluxes to get SFR by the relations given by Ranalli et al. (2003). The
results are given in Table 2. The “<” in Table 2 denotes the upper limit X-ray detection.
The X-ray flux of galaxy 60143 is only detected in the full band (0.5-7 keV). The SFRs of
object 60143 agree very well between the [OII]-derived and soft-band derived results, ∼ 10
M⊙/yr, so galaxy 60143 are more likely a starburst galaxy. For object 59018 and 79483, the
– 10 –
Fig. 4.— Flux ratios of the spectroscopic to the grism as a function of the square root of
the [OIII] line fluxes measured by ACS grism and LDSS-3, which is plotted in log scale. The
ratios for most objects are in the range from 0.5 to 2.0 (the dotted lines, the solid line shows
the ratio of 1), which is in the reasonable range due to the different sampling of galaxy light
by the slit and grism, the uncertainty in the determination of the grism continuum.

– 11 –
X-ray calibrations give the SFR ∼ 10 M⊙/yr, and the emission lines calibrations give the
SFR ∼ 1 M⊙/yr. While the SFRs from X-ray are an order larger than the SFRs from the
extinction-corrected emissions for galaxies 59018 and 79483, we treat these two galaxies as
unobscured faint AGNs.
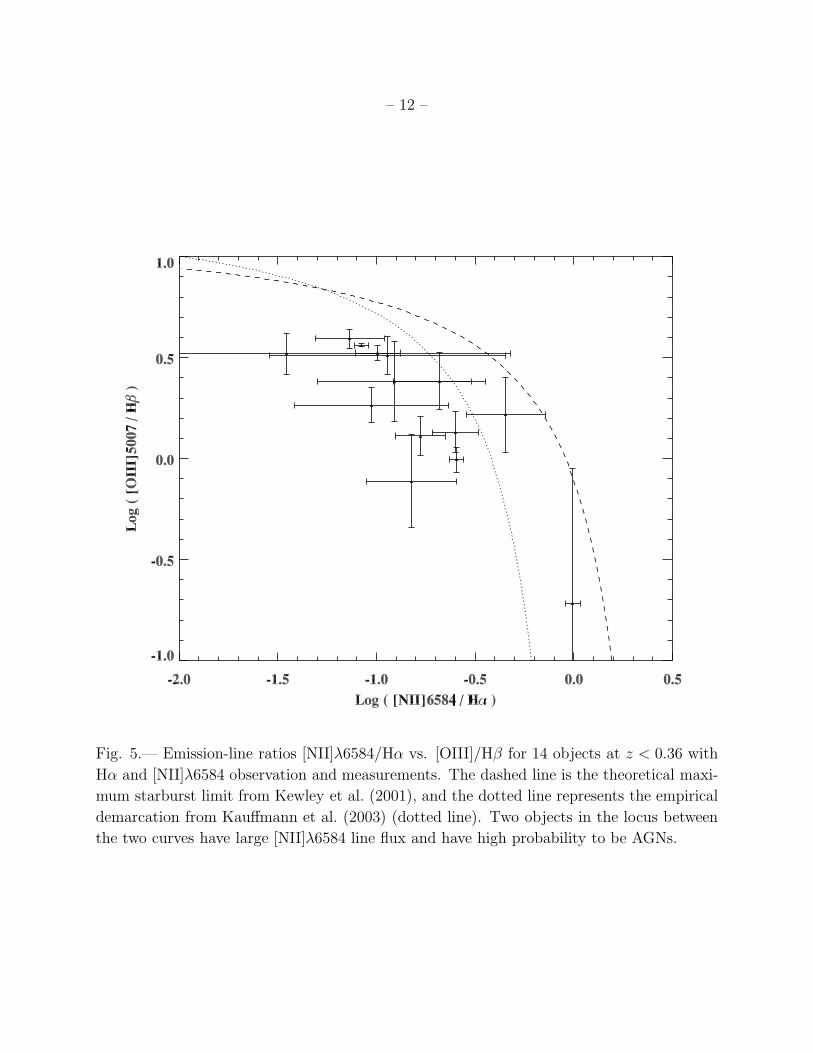
For the emission-line sources, the lines Hα and [NII]λ6584 can only be observed for
galaxies at z < 0.36 due to the wavelength coverage of our spectra. The above 5 objects
with X-ray detection all have redshift z > 0.36 and hence out of the analysis of the BPT
diagonostic method. For 14 galaxies with good line flux measurements at z < 0.36, Figure 5
shows the plot of the [NII]λ6584/Hα and [OIII]/Hβ ratios for these objects. The theoretical
maximum starburst limit (dashed line) from Kewley et al. (2001) and the empirical demar-
cation from Kauffmann et al. (2003) (dotted line) are also plotted. All of the 14 objects are
below the theoretical upper limit (Kauffmann et al. 2003). Two object, 89923 and 111549,
lie in the transition region between the empirical and theoretical demarcation curves. There
are no X-ray detections for these two objects, no other distinct AGN high ionization indic-
tator emission lines, e.g. [NeV] and HeII, and no broad lines. Hence, these objects could be
star-forming galaxies, or low-luminosity AGNs, or some combination of the two.
For galaxies at z > 0.36 and without Hα and [NII] observation, we use the HeIIλ4686
as the indicator of the AGN activity. Only one object, 106761, has prominent HeII in the
spectra and could be AGN.
The above analysis of the X-ray detection, line width, hardness ratio and column density,
SFRs, BPT diagram and high ionization emission line, give 7 AGNs in our sample. We mark
these objects in Table 1 with stars besides the object ID as the AGNs and AGN candidates
identified in this paper.
4. Summary
We investigate the accuracy of the grism redshifts using the Magellan LDSS-3 follow-up
spectroscopic observation of a sample of 76 emission-line galaxies. The galaxies are pre-
selected to have emission lines (Straughn et al. 2009) in the GOODS-S field. The galaxies
span the magnitude range 19.0 < i < 26.0 and the redshift range 0.1 < z < 1.3. In the
spectral coverage from 6500A to 9700A, the most important emission line observed are [OII],
Hβ, [OIII], and some Hα, and [NII] for low redshift galaxies. The spectroscopic redshifts are
measured from the pattern of the emission lines. The spectroscopic redshifts of 76 galaxies
are obtained. The accuracy of the grism redshifts is assessed using 62 galaxies with both
redshift measurements. An accuracy of σz = 0.006 is found for the grism redshifts.
– 12 –
Fig. 5.— Emission-line ratios [NII]λ6584/Hα vs. [OIII]/Hβ for 14 objects at z < 0.36 with
Hα and [NII]λ6584 observation and measurements. The dashed line is the theoretical maxi-
mum starburst limit from Kewley et al. (2001), and the dotted line represents the empirical
demarcation from Kauffmann et al. (2003) (dotted line). Two objects in the locus between
the two curves have large [NII]λ6584 line flux and have high probability to be AGNs.
– 13 –
For 33 galaxies with both LDSS-3 flux measurements and grism fluxes, the emission-
line fluxes of [OIII] are compared. A general agreement is found with the [OIII] flux ratio
ranging from 0.5 to 2. The different sampling of light by the slit and the ACS grism, and
the uncertainty in the continuum determination of the ACS grism spectra may result in this
factor of 2.
By cross-checking with CDF-S X-ray catalog (Luo et al. 2008), two AGNs, 92839 and
102156, are identified with luminosities of LFB > 1043 erg s−1. Another three X-ray detected
galaxies show luminosity of LFB ∼ 1041 ergs s−1 and are possible starburst galaxies or
obscured faint AGNs. The SFRs for the three objects are derived from extinction corrected
emission-line fluxes and X-ray soft-band and hard-band fluxes. One object, 60143, shows
good agreement in the derived-SFRs, which is ∼ 10 M⊙/yr, and is more likely a starburst
galaxy. For another two galaxies, 59018 and 79483, the hardness ratio, HR < – 0.13 and
< – 0.29, and the X-ray column density, NH < 8.8 and 2.4 ×1021 cm−2, suggests possible
star formation or unobscured faint AGNs. Since the extinction corrected emission-line [OII]
and Hβ derived SFRs are ∼ 1 M⊙/yr, while the X-ray derived SFR is ∼ 10 M⊙/yr, we treat
these two galaxies as unobscured faint AGNs.
For 14 galaxies at z < 0.36 (without X-ray counterparts) and with Hα and [NII] emission
lines observed in the spectra, we use the BPT diagram to identify star-forming galaxies
and AGNs. All of the 14 objects locate below the theoretical upper limit (Kauffmann et al.
2003). Two objects, 89923 and 111549, locating in the transition region between star-forming
galaxies and AGNs, could be possible AGNs. From the high ionization indictator emission
lines, HeIIλ4686, one more object, 106761, is identified as possible AGN.
This paper includes data gathered with the 6.5 meter Magellan Telescopes located at
Las Campanas Observatory, Chile. PEARS is an HST Treasury Program 10530 (PI: Malho-
tra). Support for program was provided by NASA through a grant from the Space Telescope
Science Institute, which is operated by the Association of Universities for Research in As-
tronomy, Inc., under NASA contract NASA5-26555 and is supported by HST grant 10530.
REFERENCES
Baldwin, J. A., Phillips, M. M., & Terlevich, R. 1981, PASP, 93, 5
Bruzual, G., & Charlot, S. 2003, ApJ, 405, 538
Oemler, A., Clardy, K., Kelson, D., Walth, G., Villanueva, E. 2009, COSMOS Version 2.13
– 14 –
Giavalisco, M., et al. 2004, ApJ, 600, 93
Kauffmann, G. et al. 2003, MNRAS, 346, 1055
Kennicutt, J. R. 1998, ARAA, 36, 189
Kewley, L. J., Dopita, M. A., Sutherland, R. S., Heisler, C. A. & Trevena, J. 2001, ApJ, 556,
121
Luo, B., et al. 2008, ApJS, 179, 19
Malhotra, S. 2005, HST, prop10530
Ranalli, P., Comastri, A., Setti, G. 2003, A&A, 339, 39
Straughn, A. N. et al. 2008, AJ, 135, 1624
Straughn, A. N. et al. 2009, AJ, 138, 1022
Vanzella, E. et al. 2006, A&A, 454, 423
Vanzella, E. et al. 2008, A&A, 478, 83
Xu, C. et al. 2007, AJ, 134, 169
This preprint was prepared with the AAS LATEX macros v5.0.

– 15 –
Table 1:: Spectroscopic redshifts and emission line fluxes of the emission line
galaxies obtained from the Magellan follow-up LDSS-3 observation. The cor-
responding grism redshifts and grism fluxes are listed in the table. The stars
besides object ID represent AGNs and AGN candidates.
PEARS ID RA DEC imaga zspec zgrism FWHMb f[OIII],spec
c f[OIII],grismc
12250 3:32:37.61 -27:55:32.63 24.69 0.3391 – 6.1 100.5±10.7 –
13541 3:32:38.03 -27:55:08.07 21.41 0.3730 0.370 4.8 191.9±10.6 155.1±34.3
17587 3:32:38.60 -27:54:49.85 24.81 0.6447 0.650 1.2 58.3±8.5 46.6±15.5
17686 3:32:27.87 -27:54:51.56 29.73 0.6697 – – – –
18862 3:32:32.72 -27:54:22.91 19.24 0.2018 – 3.3 82.6±35.8 –
19422 3:32:41.30 -27:54:34.74 24.51 0.5506 0.553 4.9 104.0±9.9 94.1±13.7
19639 3:32:34.92 -27:54:13.83 19.90 0.2802 0.280 3.0 178.9±17.2 125.0±83.3
22829 3:32:39.54 -27:54:00.67 21.52 0.5606 0.559 5.0 239.3±13.4 157.2±4.3
26009 3:32:33.10 -27:53:40.68 23.60 0.4356 0.439 – – –
31362 3:32:43.68 -27:53:05.90 24.17 0.6672 0.665 4.8 275.9±0.5 293.8±8.7
33294 3:32:38.08 -27:52:48.68 23.49 1.0354 1.047 – – –
37690 3:32:40.74 -27:52:16.92 23.57 0.3644 – 1.8 44.9±3.7 –
41078 3:32:43.39 -27:51:54.54 24.25 0.8573 0.866 – – –
43170 3:32:37.49 -27:51:38.84 24.02 0.6874 0.692 7.0 123.4±4.3 84.1±15.6
45454 3:32:43.63 -27:51:22.37 22.73 0.4233 0.425 4.1 43.6±0.1 38.2±9.0
46994 3:32:39.45 -27:51:13.16 24.29 0.6665 0.668 6.7 187.1±7.1 121.1±17.6
49766 3:32:42.00 -27:50:51.80 23.53 0.2184 0.213 1.9 30.1±10.9 –
52086 3:32:37.87 -27:50:39.52 23.47 0.5227 0.526 4.9 145.0±8.6 243.9±46.5
54022 3:32:41.93 -27:50:26.81 22.29 0.3360 0.336 5.6 120.0±3.0 67.7±13.7
55102 3:32:42.15 -27:50:18.71 21.83 0.4567 0.458 3.8 77.7±6.1 66.7±38.1
56801 3:32:34.82 -27:50:14.56 23.93 0.6491 0.653 4.3 45.6±7.1 –
56875 3:32:36.72 -27:50:15.70 24.48 0.5346 0.541 4.1 34.6±2.7 32.6±3.3
58985 3:32:47.98 -27:50:02.64 23.78 0.5650 0.563 – – –
59018 ⋆d 3:32:42.32 -27:49:50.33 20.59 0.4571 0.464 5.8 20.2±3.4 –
60143 3:32:35.61 -27:49:43.95 21.21 0.5464 0.542 – – –
65825 3:32:41.22 -27:49:18.45 23.51 0.9329 – – – –
70651 3:32:36.75 -27:48:43.51 23.33 0.2143 0.212 3.1 179.1±27.5 102.9±15.4
72509 3:32:40.92 -27:48:23.73 24.46 1.2461 1.294 – – –
72557 3:32:32.19 -27:48:24.41 23.52 0.3378 – – – –
73619 3:32:44.26 -27:48:18.58 24.77 0.6699 0.652 – – –
75506 3:32:35.34 -27:48:03.06 26.33 0.2794 0.277 – 33.9±6.9 31.6±4.4
75753 3:32:44.97 -27:47:39.22 21.57 0.3451 0.343 4.9 291.4±1.0 134.9±14.8
76154 3:32:36.29 -27:47:55.32 23.68 0.6049 0.600 5.2 34.1±11.3 66.4±0.7
79283 3:32:34.11 -27:47:12.10 20.75 0.2266 0.230 4.1 34.3±3.9 –
79483 ⋆d 3:32:45.11 -27:47:24.00 20.81 0.4345 0.438 5.9 13.5±1.9 –
80500 3:32:35.32 -27:47:18.53 23.34 0.6677 0.658 4.5 66.9±12.0 41.0±9.6
81944 3:32:34.73 -27:47:07.62 22.48 0.2469 0.228 3.5 525.9±9.7 875.7±37.8
83381 3:32:42.37 -27:46:57.17 24.92 0.3318 0.329 – – –
85517 3:32:42.32 -27:46:51.06 24.79 0.5358 0.530 7.2 65.5±5.0 –
89030 3:32:38.50 -27:46:30.82 25.79 0.6220 1.449 5.0 15.8±6.8 –
89853 3:32:33.02 -27:46:08.76 21.63 0.3689 0.364 – – –
89923 ⋆d 3:32:41.76 -27:46:19.39 21.25 0.3331 0.333 5.4 9.7±6.4 –
90116 3:32:46.76 -27:46:24.05 25.45 0.6250 0.630 – – –
91205 3:32:36.13 -27:46:16.37 23.18 0.2178 – 4.2 87.3±18.4 –
91789 3:32:35.29 -27:46:12.21 23.80 0.5313 0.533 4.2 21.0±5.2 –
92839 ⋆⋆e 3:32:39.08 -27:46:01.78 20.95 1.2222 1.215 79.f – –
95471 3:32:42.56 -27:45:50.16 22.38 0.2191 0.219 – – –
96123 3:32:34.30 -27:45:49.21 23.12 0.5313 0.535 4.1 21.0±5.3 –
96627 3:32:40.91 -27:45:40.91 21.50 0.1516 0.136 4.1 288.0±40.1 –
Continued on Next Page. . .
– 16 –
Table 1 – Continued
PEARS ID R.A. DEC imaga zspec zgrism FWHMb f[OIII],spec
c f[OIII],grismc
97655 3:32:27.37 -27:45:40.61 23.71 0.5442 0.543 5.0 37.5±10.4 589.2±23.2
100188 3:32:24.31 -27:45:24.41 25.00 0.3107 0.311 – – –
102156 ⋆⋆e 3:32:30.22 -27:45:04.60 21.65 0.7368 0.738 28. 228.0±9.8 318.8±15.2
104408 3:32:27.85 -27:44:49.96 24.27 0.7371 0.737 5.0 97.9±8.6 37.9±22.6
105723 3:32:27.30 -27:44:28.68 20.03 0.2142 0.223 – – –
106491 3:32:27.28 -27:44:37.46 24.93 0.3372 0.337 5.7 110.4±13.5 72.5±20.7
106761 ⋆d 3:32:29.12 -27:44:38.63 25.88 0.6673 – 2.2 54.9±12.7 52.4±3.2
109547 3:32:21.41 -27:44:09.59 23.64 0.3627 0.368 – – –
110494 3:32:25.91 -27:44:01.49 21.96 0.2775 0.281 3.8 332.8±18.1 197.0±31.9
111549 ⋆d 3:32:24.60 -27:43:46.79 22.06 0.3096 0.314 4.6 58.1±7.8 36.3±11.3
114392 3:32:22.95 -27:43:33.09 23.63 0.5636 0.567 2.9 30.0±8.7 29.6±13.0
117138 3:32:17.36 -27:43:07.27 21.18 0.6480 – 2.9 92.4±6.1 51.5±9.2
117686 3:32:18.25 -27:43:10.95 24.44 0.6693 – 4.5 64.8±11.0 28.1±4.1
117929 3:32:29.52 -27:43:05.19 22.09 0.3378 0.340 3.2 86.4±6.4 28.8±4.4
118014 3:32:23.68 -27:43:08.72 23.60 0.9796 – – – –
118100 3:32:16.87 -27:43:04.27 23.16 0.6467 0.646 7.2 140.8±10.6 74.0±7.4
118673 3:32:21.94 -27:43:03.41 24.62 0.7362 – – – –
119341 3:32:16.81 -27:42:59.76 25.09 0.6909 0.691 6.2 56.3±10.9 –
121817 3:32:23.16 -27:42:39.98 24.48 0.6683 0.671 4.0 79.4±11.3 86.7±12.9
123008 3:32:16.65 -27:42:32.71 23.21 0.6410 0.640 5.0 215.4±5.9 162.1±19.4
123301 3:32:18.57 -27:42:29.50 22.50 0.6042 0.604 6.8 426.9±15.0 184.5±4.2
123859 3:32:15.45 -27:42:20.54 22.68 0.4190 0.418 3.9 103.9±5.5 45.9±2.6
127697 3:32:14.74 -27:41:53.29 22.56 0.4170 0.422 7.0 21.5±4.8 16.1±7.1
128538 3:32:12.76 -27:41:44.45 22.66 0.4214 0.457 4.6 40.9±4.8 44.2±13.1
129968 3:32:11.85 -27:41:39.52 23.50 0.6051 0.603 3.3 136.3±13.9 190.6±22.5
130264 3:32:11.26 -27:41:27.01 22.30 1.0574 – – – –
134573 3:32:22.01 -27:40:59.21 22.99 0.3579 – 8.7 244.1±8.2 –
1a: The optical i-band magnitudes are obtained from HST/ACS GOODS version 2.0 images (Giavalisco
et al. 2004).
2b: The line FWHMs are measured for Hβ and in unit of A.
3c: The fluxes are in unit of 10−18ergss−1cm−2.
4d: One star marks AGN candidate identified by the CDF-S X-ray luminosity, hardness ratio and column
density, SFRs, the BPT diagram, and the high ionization indictator emission lines.
5e: Two stars mark AGNs identified by the CDF-S X-ray luminosity, line widths, and spectral slope.
7f: The FWHM of object 92839 is measured from MgII since the H recombination lines are out of the
spectral coverage.
8NOTE: No data indicates measurement was not possible. In case of zgrism, no data is because no suitable
line ID was found for the given input guess redshift.
–17
–Table 2: Star formation rates (M⊙/yr) derived from line luminosities (erg/s) of [OII] and Hβ, and X-ray soft-band
(0.2-5 kev) and hard-band (2-10 kev) luminosities for the identified three starburst galaxies by X-ray cross-checking.
The upper limit detection is denoted.
PEARS ID z L[OII]a SFR[OII]
b LHβa SFRHβ
b LSBa SFRSB
b LHBa SFRHB
b
59018 0.457 9.22e+40 1.29 2.92e+40 0.65 4.436e+40 9.76 < 1.23e+41 < 24.55
60143 0.546 8.54e+41 11.95 – – < 4.411e+40 < 9.70 < 1.88e+41 < 37.67
79483 0.435 1.26e+41 1.76 5.97e+40 1.33 6.632e+40 14.59 < 1.31e+41 < 26.17
a: The luminosities are in unit of ergss−1.b: The star formation rates are in unit of M⊙/yr.