The Dispositionalist Deity: How God Creates Laws and Why Theists Should Care
doi: 10.1152/jn.00040.2009102:1004-1016, 2009. First published 10 June 2009;J Neurophysiol
Diana Coomes Peterson, Kiran Nataraj and Jeffrey WenstrupSpectral Integration in Nuclei of the Lateral LemniscusGlycinergic Inhibition Creates a Form of Auditory
You might find this additional info useful...
63 articles, 35 of which you can access for free at: This article citeshttp://jn.physiology.org/content/102/2/1004.full#ref-list-1
3 other HighWire-hosted articles: This article has been cited by http://jn.physiology.org/content/102/2/1004#cited-by
including high resolution figures, can be found at: Updated information and serviceshttp://jn.physiology.org/content/102/2/1004.full
can be found at: Journal of Neurophysiology about Additional material and informationhttp://www.the-aps.org/publications/jn
This information is current as of March 21, 2013.
http://www.the-aps.org/. Copyright © 2009 the American Physiological Society. ISSN: 0022-3077, ESSN: 1522-1598. Visit our website attimes a year (monthly) by the American Physiological Society, 9650 Rockville Pike, Bethesda MD 20814-3991.
publishes original articles on the function of the nervous system. It is published 12Journal of Neurophysiology
at Iowa S
tate Univ on M
arch 21, 2013http://jn.physiology.org/
Dow
nloaded from
Glycinergic Inhibition Creates a Form of Auditory Spectral Integrationin Nuclei of the Lateral Lemniscus
Diana Coomes Peterson, Kiran Nataraj, and Jeffrey WenstrupDepartment of Anatomy and Neurobiology, Northeastern Ohio Universities College of Medicine, Rootstown, Ohio
Submitted 14 January 2009; accepted in final form 2 June 2009
Peterson DC, Nataraj K, Wenstrup J. Glycinergic inhibition createsa form of auditory spectral integration in nuclei of the laterallemniscus. J Neurophysiol 102: 1004–1016, 2009. First publishedJune 10, 2009; doi:10.1152/jn.00040.2009. For analyses of complexsounds, many neurons integrate information across different spectralelements via suppressive effects that are distant from the neurons’excitatory tuning. In the mustached bat, suppression evoked by soundswithin the first sonar harmonic (23–30 kHz) or in the subsonar band(�23 kHz) alters responsiveness to the higher best frequencies ofmany neurons. This study examined features and mechanisms asso-ciated with low-frequency (LF) suppression among neurons of thelateral lemniscal nuclei (NLL). We obtained extracellular recordingsfrom neurons in the intermediate and ventral nuclei of the laterallemniscus, observing different forms of LF suppression related to thetwo above-cited frequency bands. To understand the mechanismsunderlying this suppression in NLL neurons, we examined the roles ofglycinergic and GABAergic input through local microiontophoreticapplication of strychnine, an antagonist to glycine receptors (GlyRs),or bicuculline, an antagonist to �-aminobutyric acid type A receptors(GABAARs). With blockade of GABAARs, neurons showed an in-crease in firing rate to best frequency (BF) and/or LF tones butretained LF suppression of BF sounds. For neurons that displayed LFsuppression tuned to 23–30 kHz, the suppression was eliminated ornearly eliminated by GlyR blockade. In contrast, GABAAR blockadedid not eliminate nor had any consistent effect on suppression tunedto these frequencies. We conclude that LF suppression tuned in the23- to 30-kHz range results from neuronal inhibition within the NLLvia glycinergic inputs. For neurons displaying suppression tuned �23kHz, neither GlyR nor GABAR blockade altered LF suppression. Weconclude that such suppression originates at a lower auditory level,perhaps a result of cochlear mechanisms. These findings demonstratethat neuronal interactions within NLL create a particular form of LFsuppression that contributes to the analysis of complex acousticsignals.
I N T R O D U C T I O N
Our understanding of information processing in ascendingauditory pathways is shaped by the view that individual neu-rons respond to a limited range of sound frequencies and thatdifferent groups of neurons represent different frequencies ofsound. Although this seems to be true to a first approximation,in fact many auditory neurons respond to a broader frequencyrange based on forms of spectral integration. This begins in thecochlea, where hair cells and auditory nerve (AN) fibersrespond to low-frequency (LF) signals in addition to the higherfrequencies to which they are more sensitive (Russell andSellick 1978; Sachs and Kiang 1968). As early as the dorsal
cochlear nucleus (DCN), neuronal responses are influenced bya wideband inhibitor that projects onto frequency-tuned DCNneurons (Nelken and Young 1994). In the auditory forebrain, avariety of forms of spectral integration include multipeakedtuning, broad tuning, and a variety of nonlinear interactions inresponse to distinct spectral inputs (Abeles and Goldstein Jr1972; Fuzessery and Feng 1983; Kadia and Wang 2003;Rauschecker et al. 1995; Shamma and Symmes 1985; Sugaet al. 1979; Sutter and Schreiner 1991), The central mecha-nisms that underlie these spectrally integrative responses are inmost cases not understood. The present study provides evi-dence that types of spectral integration in which LF soundssuppress a neuron’s response to its best (characteristic) fre-quency originate in the early stages of the ascending auditorypathway.
The types of spectral integration studied here are character-ized by suppression of responses to sounds near a neuron’s bestfrequency (BF) by sounds at least an octave lower in fre-quency. Such neurons are common throughout the mustachedbat’s auditory midbrain (Mittmann and Wenstrup 1995; Nat-araj and Wenstrup 2006; O’Neill 1985; Portfors and Wenstrup1999), thalamus (Wenstrup 1999), and cortex (Kanwal et al.1999). They also occur in other species and/or auditory centers(Imig et al. 1997; Kadia and Wang 2003; Portfors and Felix2nd 2005; Rauschecker et al. 1995; Shamma and Symmes1985; Sutter et al. 1999). These response properties serve tolimit the responsiveness of neurons to complex spectra withenergy at the lower, suppressive frequencies.
Low-frequency suppression of high-frequency responses oc-curs in the majority of mustached bat IC neurons. There appearto be two major classes of LF suppression, distinguished in partby frequency tuning and associated excitatory responses. Oneclass is generally tuned to frequencies �23 kHz and is inde-pendent of the neuron’s BF. For this class of responses, somelow-frequency excitation may occur, always preceding or oc-curring simultaneously with the suppression of high-frequencyresponses. We have speculated that this LF suppression iscochlear in origin (Marsh et al. 2006; Nataraj and Wenstrup2006). A second class of suppression is best activated by soundenergy in the 23- to 30-kHz range associated with the funda-mental of the biosonar signal. This class may or may not beassociated with an excitatory response to the 23- to 30-kHzband, but excitation that occurs typically follows the suppres-sion. We have speculated that this suppression is not ofcochlear origin (Gans et al. 2009; Nataraj and Wenstrup 2006).For either class, however, blockade of the GABAergic and/orglycinergic inputs in the inferior colliculus (IC) generally failsto eliminate the LF suppression. This suggests that LF sup-pression originates below the IC (Nataraj and Wenstrup 2006).
Address for reprint requests and other correspondence: J. Wenstrup, Depart-ment of Anatomy and Neurobiology, Northeastern Ohio Universities Collegeof Medicine, 4209 State Route 44, PO Box 95, Rootstown, OH 44272 (E-mail:[email protected]).
J Neurophysiol 102: 1004–1016, 2009.First published June 10, 2009; doi:10.1152/jn.00040.2009.
1004 0022-3077/09 $8.00 Copyright © 2009 The American Physiological Society www.jn.org
at Iowa S
tate Univ on M
arch 21, 2013http://jn.physiology.org/
Dow
nloaded from
Since we observed suppression in nuclei of the lateral lemnis-cus (NLL) (Portfors and Wenstrup 2001), we hypothesized thatneural interactions underlying suppression may originate there.The present study tests this hypothesis by blocking GABAergicand glycinergic inhibition in NLL neurons. The results indicatethat the second class of LF suppression, tuned to 23–30 kHz,arises in the ventral and intermediate nuclei of the laterallemniscus through glycinergic inhibition. This work thus iden-tifies a contribution of processing within NLL to higher-orderauditory responses in the auditory midbrain and forebrain.
M E T H O D S
We examined auditory responses in the NLL of seven awakemustached bats (Pteronotus parnellii), captured in Trinidad and To-bago. All procedures used in this study were approved by the Insti-tutional Animal Care and Use Committee of the Northeastern OhioUniversities College of Medicine and follow guidelines set by theNational Institutes of Health for the care and use of laboratoryanimals.
Surgical procedures
Each bat was sedated with butorphanol (5 mg/kg, administeredintraperitoneally [ip]; Torbugesic, Fort Dodge Animal Health, FortDodge, IA), anesthetized with isoflurane (1.5–2.0%; Abbott Labora-tories, North Chicago, IL), and placed in a stereotaxic holder. Depil-atory lotion was used to remove hair on the skin overlying the skull.The skin on the head was then disinfected with betadine. To exposethe dorsal surface of the skull, a midline incision was made in the skinand the underlying muscles were reflected laterally. A metal pin wascemented onto the rostral portion of the skull to secure the head duringphysiological experiments. A tungsten wire, cemented into the skulloverlying the cerebral cortex, served as ground for electrophysiolog-ical recordings. For access to the lateral lemniscal nuclei, surfacefeatures and stereotaxic coordinates guided the placement of a smallhole in the skull (diameter, �1.0 mm) over the caudal IC, which lieson the dorsal surface of the brain. After surgery, lidocaine (a localanesthetic) was applied to the surgical area and the bat was returnedto the holding cage. The bat was allowed to recover for 2–3 daysbefore physiological experiments began.
Acoustic stimulation
Single-tone bursts (11-ms duration, 0.5-ms rise/fall time, fourpresentations/s) and combinations of tone bursts were computer syn-thesized, downloaded to a digital signal processor (AP2 Multi-Pro-cessor DSP card; Tucker-Davis Technologies [TDT], Alachua, FL),converted to analog signals at a sampling rate of 500 kHz (modelDA3-2; TDT), filtered (model FT6-2; TDT), attenuated (model PA4;TDT), summed (model SM3; TDT), and amplified (Parasound modelHCA-800II). The signal was sent to a loudspeaker (Infinity EMIT-Btweeter; Harmon International Industries, Woodbury, NY) that wasplaced 10 cm from the animal and 25° into the sound field contralat-eral to the NLL under study.
The performance of the acoustic system speakers was tested with acalibrated microphone (model 4135; Bruel & Kjær,) placed in aposition normally occupied by the animal’s head. There was a smoothdecrease of about 3 dB per 10 kHz from 10 to 120 kHz. Distortioncomponents were not detectable 60 dB below the signal level.
Recording procedures
Recordings and microiontophoresis were similar to previous de-scriptions (Nataraj and Wenstrup 2005, 2006; Sanchez et al. 2007,2008). Briefly, physiological experiments were conducted inside a
single-walled Industrial Acoustics chamber lined with polyurethanefoam to reduce echoes. On experimental days, the animal was lightlysedated (butorphanol, 2.5 mg/kg, administered subcutaneously) priorto placement in a stereotaxic apparatus inside the heated acousticchamber. If at any time the animal showed signs of discomfort ordistress, it was removed from the stereotaxic apparatus. Recordingsbegan �1 h after sedation. The animal was offered water from amedicine dropper between electrode penetrations. The recording ses-sions did not exceed 6 h and were limited to one recording session perday.
Physiological activity was amplified, band-pass filtered (600–6,000Hz), and sent through a spike signal enhancer (model 40-46-1; FHC,Bowdoin, ME) before being digitized at a sampling rate of 40 kHz(model AD2; TDT). The digitized signal was uploaded to the com-puter via a second digital signal-processing card (AP2 Multi-Proces-sor DSP card; TDT). Custom-made software calculated the time ofoccurrence of the spikes and displayed poststimulus time histograms(PSTHs), raster plots, and statistics on the neural responses in realtime.
All recordings were obtained from well-isolated single neuronscharacterized by stable amplitude and consistent shape. Once single-neuron activity was isolated, tone bursts varying in frequency andamplitude were used to determine the best frequency (BF), thefrequency at which the lowest sound pressure level (SPL) inducedstimulus-locked action potentials, and the minimum threshold at BF.BFs were measured to tenths of kilohertz but are rounded to kilohertzin RESULTS. Since the response of many NLL neurons to BF tones wassuppressed by a second, lower-frequency tone, a two-tone stimulusparadigm was used to reveal and then evaluate the underlying inter-actions. For this, a high-frequency tone at the neuron’s BF waspresented 10 dB above its threshold. Then, a second tone was set at asufficiently high level to reveal suppressive interactions (�65 dBSPL) and systematically varied across frequencies �40 kHz, in 0.5- or1.0-kHz steps. The test was performed when the two signals werepresented simultaneously or, if necessary, when the BF signal wasdelayed. In neurons for which the LF signal suppressed the responseto the BF signal, quantitative measures of delay-sensitive suppressionwere obtained and compared with the single-tone responses. Rate-level functions were obtained by increasing the sound level of BF tonebursts in 5-dB increments. Initially, we tested suppressive interactionsin the range 23–40 kHz, then investigated suppression �23 kHz asthis suppression became more apparent. Our later observations sug-gest that suppression �23 kHz occurs in most if not all NLL neurons.
The evoked activity of single neurons was obtained using a mi-cropipette electrode mounted on a five-barrel pipette (Havey andCaspary 1980) for iontophoretic application of drugs. The tip of themultibarrel pipette was broken to a diameter of 15–30 �m; theunbroken tip of the single-barrel electrode extended 10–25 �mbeyond the multibarrel pipette and was filled with physiological saline(resistance 5–30 M�). The center barrel of the multibarrel pipette wasfilled with 0.9 M NaCl and connected to a sum channel to balance allcurrents used to apply or retain drugs. The remaining four barrels werefilled with the �-aminobutyric acid type A receptor (GABAAR)antagonist bicuculline (10 mM, pH 3.0; Sigma, St. Louis, MO) and theglycine receptor (GlyR) antagonist strychnine (10 mM, pH 3.0; Fluka,Milwaukee, WI). Bicuculline and strychnine were retained with neg-ative current (�15 nA) and ejected using positive currents (�15 to�40 nA). Iontophoresis currents for drug application and retentionwere established previously, with control tests for current and pH(Nataraj and Wenstrup 2005, 2006).
Each barrel of the multibarrel pipette was connected via silver wireto a microiontophoresis current generator (programmable currentgenerator, model 6400; Dagan, Minneapolis, MN). The current gen-erator controlled the retention and ejection currents for each barrelseparately. The piggyback multibarrel electrode assembly was ad-vanced into the brain by a hydraulic micropositioner (model 650;David Kopf Instruments). Drug injection times and ejection currents
1005SPECTRAL INTEGRATION IN NUCLEI OF THE LATERAL LEMNISCUS
J Neurophysiol • VOL 102 • AUGUST 2009 • www.jn.org
at Iowa S
tate Univ on M
arch 21, 2013http://jn.physiology.org/
Dow
nloaded from
varied depending on the effect of the drug(s) monitored both audio-visually and quantitatively. Low ejection currents were used initially.If no effect was observed, the ejection current was gradually in-creased. For every current setting, rate-level functions were obtaineduntil no further change in response was observed. With currents usedin this study, effects of bicuculline and strychnine could be observedas early as 2 min after application began. Complete or partial recoverycould be observed as early as 4 min after drug application was stoppedand was dependent on the particular drug, ejection currents, and theduration of drug application.
Histological reconstruction
In four animals, 14 recording sites were marked by iontophoreticdeposit of a neural tracer: biotinylated dextran amine (BDA; MW10,000, 10% in saline; Molecular Probes, Eugene, OR); Fluoro-Gold(FG; 4% in saline; FluoroChrome, Englewood, CO); Fluoro-Ruby(FR; tetramethylrhodamine dextran, MW 10,000, 10% in saline;Molecular Probes); or fluorescein dextran (FD; MW 10,000, 10% insaline; Molecular Probes). Tracers were deposited with either apositive or negative current (5–7 �A; variable ON– OFF) for 5–10 min.No more than four sites were marked in each animal.
Animals with tracer injections survived 5–14 days before they werekilled. All other animals were killed and perfused after the lastrecording session. Each animal was killed with an overdose of FatalPlus (100 mg/kg, ip; Vortech, Dearborn, MI). Following loss ofcorneal and withdrawal reflexes, the animal was perfused through theleft ventricle with 0.1 M phosphate-buffered saline, followed by 4%paraformaldehyde in 0.1 M phosphate buffer (pH 7.4). The brain wasthen removed and stored overnight at 4°C in 4% paraformaldehydewith 30% sucrose. Brains were frozen, sectioned at 50 �m in thetransverse plane, and collected into three series. One or two series (tobe used for fluorescence) were mounted on gelatin-coated slides andcoverslipped with DPX. One series was mounted on gelatin-coatedslides and stained with cresyl violet for cytoarchitecture. In cases withBDA injections, one series was treated with avidin-biotin-peroxidaseand then stained with diaminobenzidine enhanced with nickel ammo-nium sulfate (Adams 1981). The sections were then mounted ongelatin-coated slides, air-dried, and coverslipped with DPX.
The lateral lemniscus and tracer deposit sites were photographedwith a Magnifire camera (Optronics, Goleta, CA) mounted onto aZeiss Axioplan microscope. Adobe Photoshop was used to overlayinjection sites onto cresyl violet–stained sections and to outline laterallemniscal divisions. These were identified by comparison with thosedescribed previously in mustached bats (Wenstrup et al. 1999; Zookand Casseday 1982). Electrode tracks from the large multibarrelpipettes were visible in all seven experimental cases. These trackswere microscopically analyzed in cresyl violet–stained sections toverify location within lateral lemniscus nuclei.
Data analysis
Quantitative data were obtained for all neurons using 32 repetitionsof each stimulus. Many neurons in NLL were spontaneously active(mean � SD: 32 � 36 spikes/s). We therefore defined an excitatoryresponse as a 20% increase in spike discharge, within a 10- to 20-mstime window. Suppression of background activity was based on a 20%reduction. Neurons were considered to show LF suppression if theresponses to the combined signals, separated by a given delay, were�20% lower than the response of the BF signal. The strength ofinteractions was quantified by an interaction index, where the index �(Rc � Rh � Rl)/(Rc � Rh � Rl). Rc represents the neuron’s responseto the combination of low- and high-frequency signals, Rh representsthe neuron’s response to the high-frequency signal presented alone,and Rl represents the neuron’s response to the low-frequency signalpresented alone. An interaction index value of �1 corresponds to thestrongest suppression. The 20% criterion corresponds to an interaction
index value of �0.11. In some neurons, high background dischargeaffected calculation of the interaction index; this was minimized byanalyzing responses within a 10- or 20-ms window that included anyresponses to the low and high frequencies. We use the term “suppres-sion” to include two types of LF effects on BF responses: 1) inhibitionthat results from demonstrable neural interactions and 2) suppressionthat is of uncertain, possibly cochlear, origin.
Suppressive interactions were characterized by the delay at whichthe interaction was maximum (best delay), the range of delays atwhich the interaction occurred (delay width), and the maximumstrength of the interaction (interaction index). Paired two-tailed t-tests,testing for differences between the control and drug conditions, wereperformed with an error level of 0.05, corrected for repeated tests. Formany measures, average values are reported with the SE.
R E S U L T S
This report is based on responses of 120 well-isolatedneurons in the NLL of awake mustached bats. A later sectiondescribes criteria for localizing these neurons to individuallateral lemniscal nuclei. Of these 120 neurons, 103 displayedLF suppression of responses to BF tones bursts. We firstdescribe some functional properties of neurons showing LFsuppression, then examine whether these two-tone suppressiveresponses depended on inhibitory mechanisms acting withinthe NLL.
Functional properties of neurons displaying LF suppression
NLL neurons displaying low-frequency suppression hadhigh-frequency BFs in the range 33–104 kHz. Most neurons(74%) displayed a purely excitatory response to BF signals, but26% showed an excitatory response that was followed bysuppression of background activity. Response latencies at 10dB above threshold were in the range 3–13 ms.
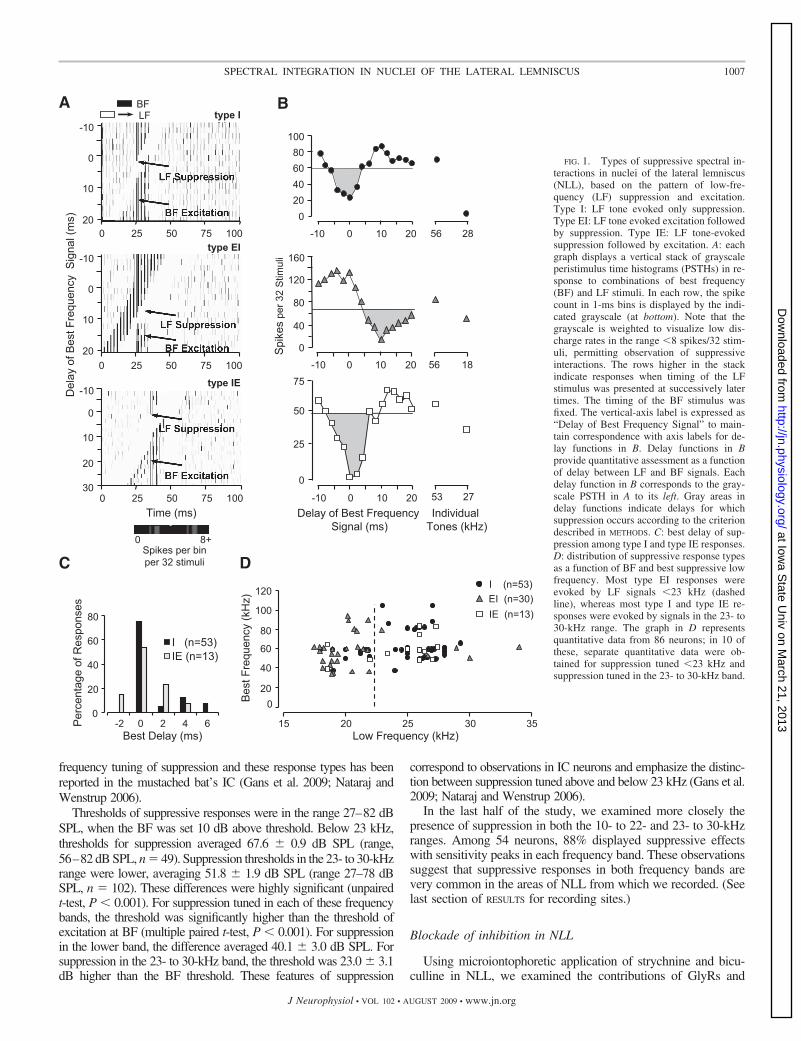
This study focused on LF suppression tuned at least anoctave below the BF. Of the 103 neurons showing LF suppres-sion, 96 fit this criterion. As in IC (Nataraj and Wenstrup2006), we observed three distinct types of LF suppressiveresponse based on the presence or absence of LF excitation(Fig. 1A). For the majority of suppressive responses, LF signalswere purely suppressive (type I, 59%), reducing both back-ground discharge and the response to BF tones. Other suppres-sive responses were accompanied by LF excitation prior to thesuppression (type EI, 28%) or after the suppression (type IE,13%). To analyze features of the suppression, we plotted spikecount as a function of delay, using windowed responses tominimize the influence of background discharge (Fig. 1B). Fortype I and type IE responses, LF suppression was typicallystrongest when the BF and LF signal were presented simulta-neously (best delay of 0 ms) (Fig. 1C), similar to previousobservations in IC neurons (Nataraj and Wenstrup 2006). Wedid not evaluate best delay in type EI responses because the LFexcitation appears to mask strong suppression of the BF re-sponse (Nataraj and Wenstrup 2006).
Lower-frequency suppression was usually tuned �30 kHz, butthere was a pronounced frequency dependence of the different types(Fig. 1D). For most type I (83%) and type IE (77%) responses, the LFsuppression was tuned �23 kHz. In contrast, most type EI responseshad suppression tuned �23 kHz (83%). In ten neurons for which weobtained quantitative data on suppression over both frequency ranges,we observed both type EI responses tuned �23 kHz and type I ortype IE responses tuned �23 kHz. A similar relationship between the
1006 D. C. PETERSON, K. NATARAJ, AND J. WENSTRUP
J Neurophysiol • VOL 102 • AUGUST 2009 • www.jn.org
at Iowa S
tate Univ on M
arch 21, 2013http://jn.physiology.org/
Dow
nloaded from
frequency tuning of suppression and these response types has beenreported in the mustached bat’s IC (Gans et al. 2009; Nataraj andWenstrup 2006).
Thresholds of suppressive responses were in the range 27–82 dBSPL, when the BF was set 10 dB above threshold. Below 23 kHz,thresholds for suppression averaged 67.6 � 0.9 dB SPL (range,56–82 dB SPL, n � 49). Suppression thresholds in the 23- to 30-kHzrange were lower, averaging 51.8 � 1.9 dB SPL (range 27–78 dBSPL, n � 102). These differences were highly significant (unpairedt-test, P � 0.001). For suppression tuned in each of these frequencybands, the threshold was significantly higher than the threshold ofexcitation at BF (multiple paired t-test, P � 0.001). For suppressionin the lower band, the difference averaged 40.1 � 3.0 dB SPL. Forsuppression in the 23- to 30-kHz band, the threshold was 23.0 � 3.1dB higher than the BF threshold. These features of suppression
correspond to observations in IC neurons and emphasize the distinc-tion between suppression tuned above and below 23 kHz (Gans et al.2009; Nataraj and Wenstrup 2006).
In the last half of the study, we examined more closely thepresence of suppression in both the 10- to 22- and 23- to 30-kHzranges. Among 54 neurons, 88% displayed suppressive effectswith sensitivity peaks in each frequency band. These observationssuggest that suppressive responses in both frequency bands arevery common in the areas of NLL from which we recorded. (Seelast section of RESULTS for recording sites.)
Blockade of inhibition in NLL
Using microiontophoretic application of strychnine and bicu-culline in NLL, we examined the contributions of GlyRs and
Time (ms)
type IE
0 25 50 75 100
BA
Del
ay o
f Bes
t Fre
quen
cy S
igna
l (m
s)
type EI
0 25 50 75 100
type IBFLF
0 25 50 75 10020
10
0
-10
20
10
0
-10
20
10
0
-10
30
0
40
80
100
56 28-10 0 10 20
20
60
Delay of Best FrequencySignal (ms)
Individual Tones (kHz)
53 27-10 0 10 20
0
25
50
75
56 18-10 0 10 20
0
40
80
120
160
Spi
kes
per
32 S
timul
i
Spikes per binper 32 stimuli
0 8+
BF Excitation
LF Suppression
LF Suppression
BF Excitation
BF Excitation
LF Suppression
I (n=53)IE (n=13)
0
20
40
60
80
-2 0 2 4 6Best Delay (ms)
Per
cent
age
of R
espo
nses
C
IE (n=13)
D
Low Frequency (kHz)
20
40
60
80
100
120
Bes
t Fre
quen
cy (
kHz)
0
EI (n=30)
I (n=53)
15 20 25 30 35
FIG. 1. Types of suppressive spectral in-teractions in nuclei of the lateral lemniscus(NLL), based on the pattern of low-fre-quency (LF) suppression and excitation.Type I: LF tone evoked only suppression.Type EI: LF tone evoked excitation followedby suppression. Type IE: LF tone-evokedsuppression followed by excitation. A: eachgraph displays a vertical stack of grayscaleperistimulus time histograms (PSTHs) in re-sponse to combinations of best frequency(BF) and LF stimuli. In each row, the spikecount in 1-ms bins is displayed by the indi-cated grayscale (at bottom). Note that thegrayscale is weighted to visualize low dis-charge rates in the range �8 spikes/32 stim-uli, permitting observation of suppressiveinteractions. The rows higher in the stackindicate responses when timing of the LFstimulus was presented at successively latertimes. The timing of the BF stimulus wasfixed. The vertical-axis label is expressed as“Delay of Best Frequency Signal” to main-tain correspondence with axis labels for de-lay functions in B. Delay functions in Bprovide quantitative assessment as a functionof delay between LF and BF signals. Eachdelay function in B corresponds to the gray-scale PSTH in A to its left. Gray areas indelay functions indicate delays for whichsuppression occurs according to the criteriondescribed in METHODS. C: best delay of sup-pression among type I and type IE responses.D: distribution of suppressive response typesas a function of BF and best suppressive lowfrequency. Most type EI responses wereevoked by LF signals �23 kHz (dashedline), whereas most type I and type IE re-sponses were evoked by signals in the 23- to30-kHz range. The graph in D representsquantitative data from 86 neurons; in 10 ofthese, separate quantitative data were ob-tained for suppression tuned �23 kHz andsuppression tuned in the 23- to 30-kHz band.
1007SPECTRAL INTEGRATION IN NUCLEI OF THE LATERAL LEMNISCUS
J Neurophysiol • VOL 102 • AUGUST 2009 • www.jn.org
at Iowa S
tate Univ on M
arch 21, 2013http://jn.physiology.org/
Dow
nloaded from
GABAARs to LF suppression of BF responses. Responses ofthese neurons were examined before, during, and after successfulblockade of GABAARs via bicuculline (n � 17 neurons), GlyRsby strychnine (n � 17 neurons), or both (n � 10 neurons). Therewere two major results. First, blockade of GlyRs, but not ofGABAARs, consistently eliminated or greatly reduced LF sup-pression of BF responses in NLL neurons. Second, GlyR block-ade affected only LF suppression that was tuned in the range23–30 kHz and was of type I or type IE.
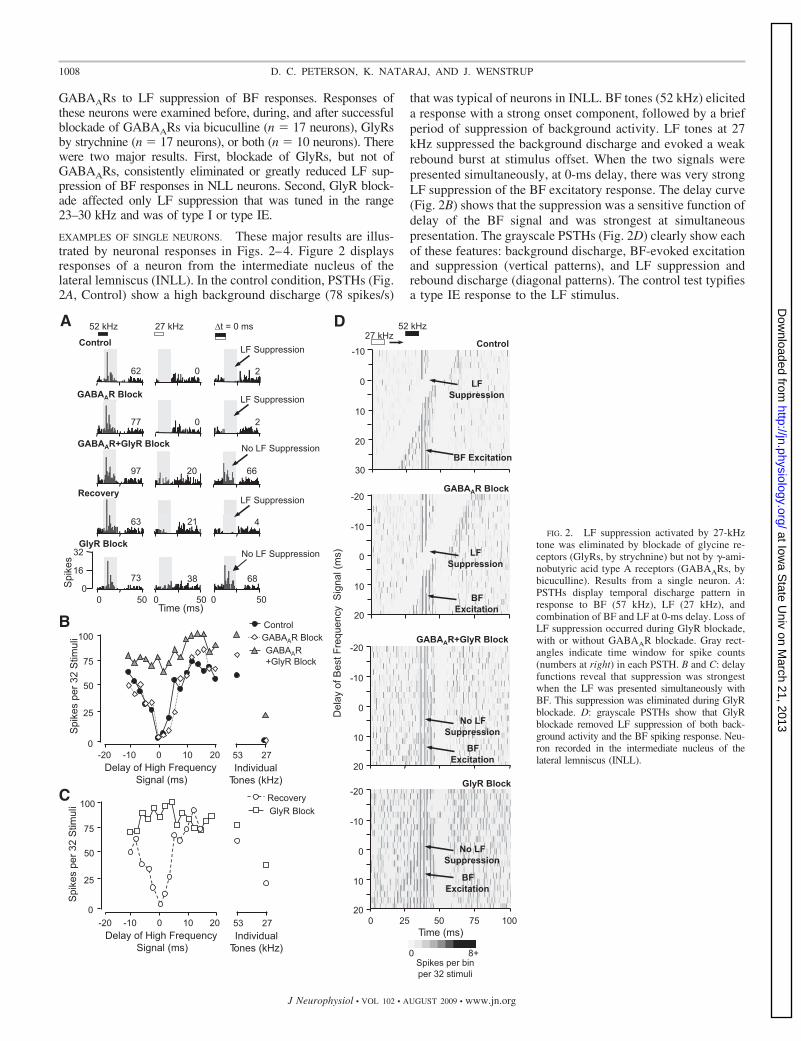
EXAMPLES OF SINGLE NEURONS. These major results are illus-trated by neuronal responses in Figs. 2–4. Figure 2 displaysresponses of a neuron from the intermediate nucleus of thelateral lemniscus (INLL). In the control condition, PSTHs (Fig.2A, Control) show a high background discharge (78 spikes/s)
that was typical of neurons in INLL. BF tones (52 kHz) eliciteda response with a strong onset component, followed by a briefperiod of suppression of background activity. LF tones at 27kHz suppressed the background discharge and evoked a weakrebound burst at stimulus offset. When the two signals werepresented simultaneously, at 0-ms delay, there was very strongLF suppression of the BF excitatory response. The delay curve(Fig. 2B) shows that the suppression was a sensitive function ofdelay of the BF signal and was strongest at simultaneouspresentation. The grayscale PSTHs (Fig. 2D) clearly show eachof these features: background discharge, BF-evoked excitationand suppression (vertical patterns), and LF suppression andrebound discharge (diagonal patterns). The control test typifiesa type IE response to the LF stimulus.
No LF Suppression
BF Excitation
BF Excitation
Del
ay o
f Bes
t Fre
quen
cy S
igna
l (m
s)
D
LF Suppression
BF Excitation
No LF Suppression
BF Excitation
LF Suppression
A
C
52 kHz 27 kHz 52 kHz 27 kHz
B Control
GABAAR +GlyR Block
GABAAR Block
30
20
10
0
-10
20
10
0
-10
-20
20
10
0
-10
-20
Time (ms)
20
10
0
-10
-20
0 25 50 75 100
GABAAR Block
Control
GlyR Block
GABAAR+GlyR Block
GlyR Block
Recovery
GABAAR Block
Recovery
62 0
GlyR Block
73 38
No LF Suppression
68
y
63 21
LF Suppression
4
97 20 66
A
77 0
LF Suppression
2
LF Suppression
2
GABAAR+GlyR Block No LF Suppression
0
16
32
Spi
kes
Time (ms) 50 0 50 0 50 0
Control
Spi
kes
per
32 S
timul
i
0
25
50
75
100
Delay of High Frequency Signal (ms)
-10 0 10 20 -20 53 27
Individual Tones (kHz)
Spi
kes
per
32 S
timul
i
0
25
50
75
100
Delay of High Frequency Signal (ms)
-10 0 10 20 -20 53 27
Individual Tones (kHz)
Spikes per bin per 32 stimuli
0 8+
FIG. 2. LF suppression activated by 27-kHztone was eliminated by blockade of glycine re-ceptors (GlyRs, by strychnine) but not by �-ami-nobutyric acid type A receptors (GABAARs, bybicuculline). Results from a single neuron. A:PSTHs display temporal discharge pattern inresponse to BF (57 kHz), LF (27 kHz), andcombination of BF and LF at 0-ms delay. Loss ofLF suppression occurred during GlyR blockade,with or without GABAAR blockade. Gray rect-angles indicate time window for spike counts(numbers at right) in each PSTH. B and C: delayfunctions reveal that suppression was strongestwhen the LF was presented simultaneously withBF. This suppression was eliminated during GlyRblockade. D: grayscale PSTHs show that GlyRblockade removed LF suppression of both back-ground activity and the BF spiking response. Neu-ron recorded in the intermediate nucleus of thelateral lemniscus (INLL).
1008 D. C. PETERSON, K. NATARAJ, AND J. WENSTRUP
J Neurophysiol • VOL 102 • AUGUST 2009 • www.jn.org
at Iowa S
tate Univ on M
arch 21, 2013http://jn.physiology.org/
Dow
nloaded from
This pattern did not change during GABAAR blockade.Although there were increases in both the background dis-charge (78 to 97 spikes/s) and BF-evoked response (62 to 77spikes per 32 stimuli), the LF-evoked suppression of back-ground activity or of the BF response was largely unaffected(Fig. 2A, GABAAR Block). Moreover, the delay sensitivity ofLF suppression (Fig. 2, B and D) was unchanged. The additionof GlyR blockade to GABAAR blockade further elevatedbackground discharge (to 109 spikes/s) and the BF response (to97 spikes per 32 stimuli; Fig. 2A, GABAAR � GlyR Block).The major effect of addition of GlyR blockade is seen inresponses to the LF and combination stimuli: both the LFsuppression of background activity and the LF suppression ofthe BF response were significantly weaker (Fig. 2A). Delay-tuned suppression of the BF response was very weak or notapparent (Fig. 2, B and D). After recovery from combined drugapplication, strychnine alone was applied to block GlyRs.GlyR blockade reproduced all the effects of combined drugapplication on LF suppression: on suppression of backgrounddischarge and BF responses (Fig. 2A, GlyR Block), as well ason the delay-tuned suppression of the BF response (Fig. 2, C
and D). Thus in this neuron, GlyRs appeared to mediate all ofthe major features of LF suppression of BF responses, whereasGABAARs appeared to play no significant role.
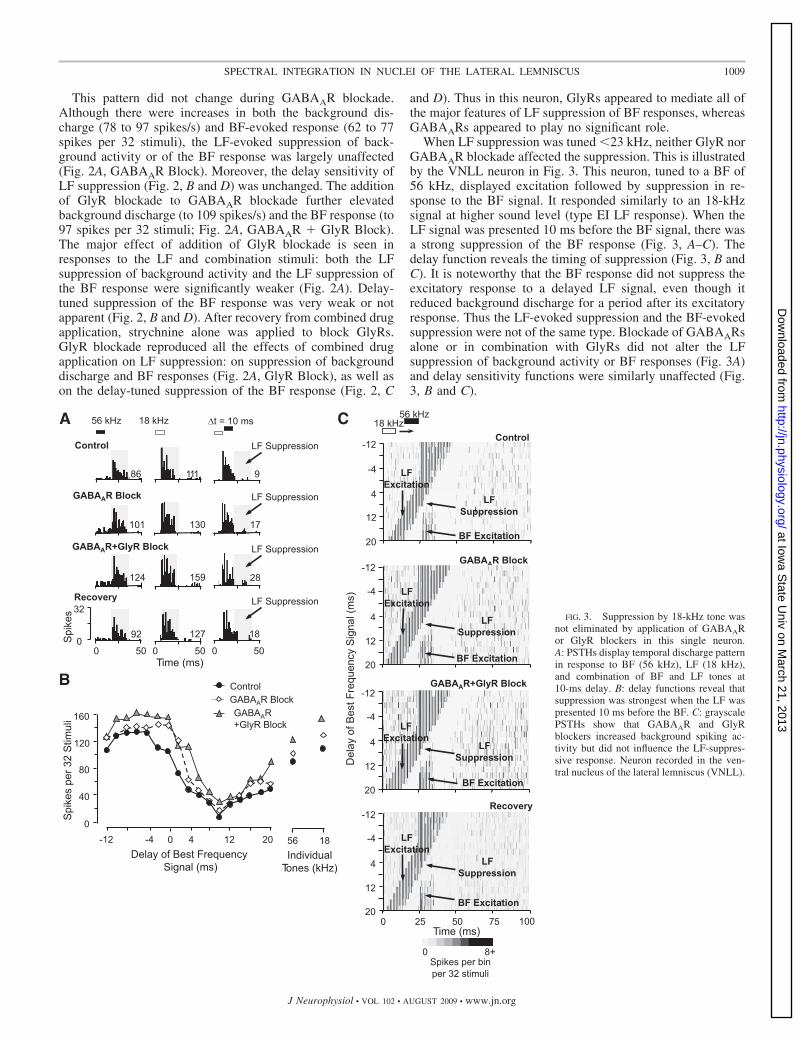
When LF suppression was tuned �23 kHz, neither GlyR norGABAAR blockade affected the suppression. This is illustratedby the VNLL neuron in Fig. 3. This neuron, tuned to a BF of56 kHz, displayed excitation followed by suppression in re-sponse to the BF signal. It responded similarly to an 18-kHzsignal at higher sound level (type EI LF response). When theLF signal was presented 10 ms before the BF signal, there wasa strong suppression of the BF response (Fig. 3, A–C). Thedelay function reveals the timing of suppression (Fig. 3, B andC). It is noteworthy that the BF response did not suppress theexcitatory response to a delayed LF signal, even though itreduced background discharge for a period after its excitatoryresponse. Thus the LF-evoked suppression and the BF-evokedsuppression were not of the same type. Blockade of GABAARsalone or in combination with GlyRs did not alter the LFsuppression of background activity or BF responses (Fig. 3A)and delay sensitivity functions were similarly unaffected (Fig.3, B and C).
Del
ay o
f Bes
t Fre
quen
cy S
igna
l (m
s)
C
B
GABAAR Block
Recovery
GABAAR+GlyR Block
A
Recovery
0
32
Spi
kes
0 50
92
Time (ms) 0 50
127
0 50
18 1
101 130 17 1
86 111 9
56 kHz 18 kHz
124 159 28 2
GABAAR Block
GABAAR+GlyR Block
Control
GABAAR +GlyR Block
GABAAR Block
56 18
Delay of Best Frequency Signal (ms)
-4 4 12 20 -12
Individual Tones (kHz)
0
Spi
kes
per
32 S
timul
i
0
40
80
120
160
56 kHz 18 kHz
Control
LF Suppression
BF Excitation 20
12
4
-4
-12
AAAAA
LF Suppression
BF Excitation 20
12
4
-4
-12
LF Suppression
BF Excitation 20
12
4
-4
-12
LF Suppression
BF Excitation
Time (ms)
20
12
4
-4
-12
0 25 50 75 100
Control
Spikes per bin per 32 stimuli
0 8+
LF Suppression
LF Suppression
LF Suppression
LF Suppression
LF Excitation
LF Excitation
LF Excitation
LF Excitation
FIG. 3. Suppression by 18-kHz tone wasnot eliminated by application of GABAARor GlyR blockers in this single neuron.A: PSTHs display temporal discharge patternin response to BF (56 kHz), LF (18 kHz),and combination of BF and LF tones at10-ms delay. B: delay functions reveal thatsuppression was strongest when the LF waspresented 10 ms before the BF. C: grayscalePSTHs show that GABAAR and GlyRblockers increased background spiking ac-tivity but did not influence the LF-suppres-sive response. Neuron recorded in the ven-tral nucleus of the lateral lemniscus (VNLL).
1009SPECTRAL INTEGRATION IN NUCLEI OF THE LATERAL LEMNISCUS
J Neurophysiol • VOL 102 • AUGUST 2009 • www.jn.org
at Iowa S
tate Univ on M
arch 21, 2013http://jn.physiology.org/
Dow
nloaded from
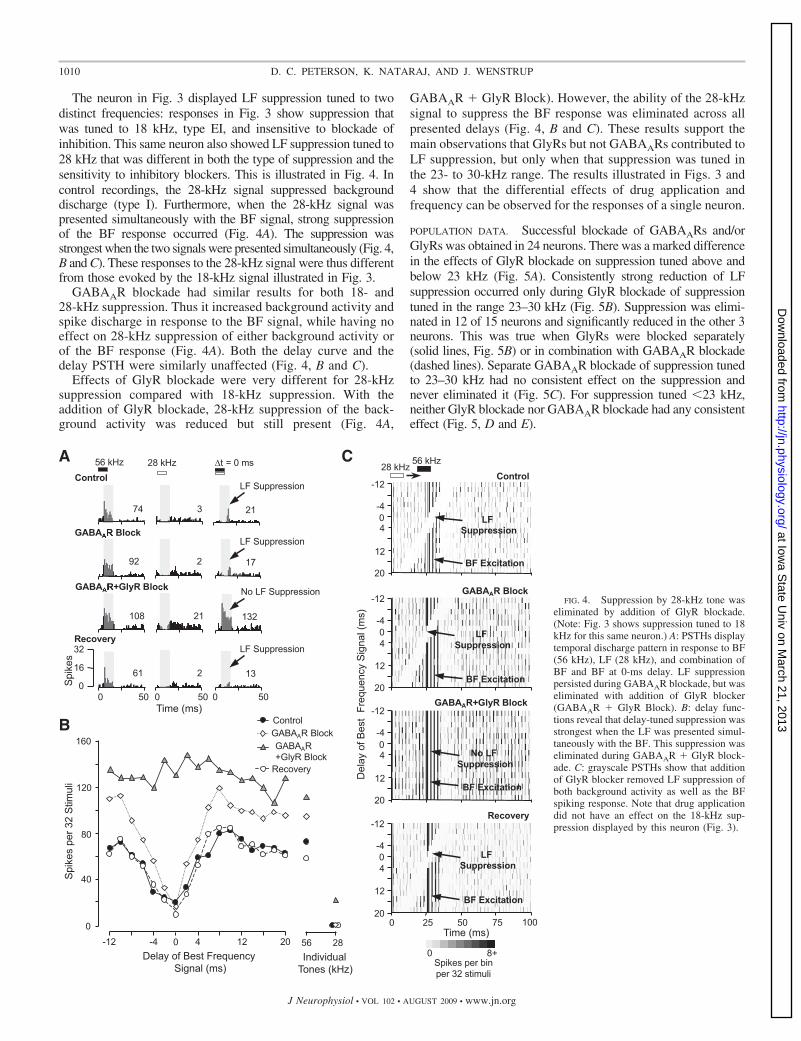
The neuron in Fig. 3 displayed LF suppression tuned to twodistinct frequencies: responses in Fig. 3 show suppression thatwas tuned to 18 kHz, type EI, and insensitive to blockade ofinhibition. This same neuron also showed LF suppression tuned to28 kHz that was different in both the type of suppression and thesensitivity to inhibitory blockers. This is illustrated in Fig. 4. Incontrol recordings, the 28-kHz signal suppressed backgrounddischarge (type I). Furthermore, when the 28-kHz signal waspresented simultaneously with the BF signal, strong suppressionof the BF response occurred (Fig. 4A). The suppression wasstrongest when the two signals were presented simultaneously (Fig. 4,B and C). These responses to the 28-kHz signal were thus differentfrom those evoked by the 18-kHz signal illustrated in Fig. 3.
GABAAR blockade had similar results for both 18- and28-kHz suppression. Thus it increased background activity andspike discharge in response to the BF signal, while having noeffect on 28-kHz suppression of either background activity orof the BF response (Fig. 4A). Both the delay curve and thedelay PSTH were similarly unaffected (Fig. 4, B and C).
Effects of GlyR blockade were very different for 28-kHzsuppression compared with 18-kHz suppression. With theaddition of GlyR blockade, 28-kHz suppression of the back-ground activity was reduced but still present (Fig. 4A,
GABAAR � GlyR Block). However, the ability of the 28-kHzsignal to suppress the BF response was eliminated across allpresented delays (Fig. 4, B and C). These results support themain observations that GlyRs but not GABAARs contributed toLF suppression, but only when that suppression was tuned inthe 23- to 30-kHz range. The results illustrated in Figs. 3 and4 show that the differential effects of drug application andfrequency can be observed for the responses of a single neuron.
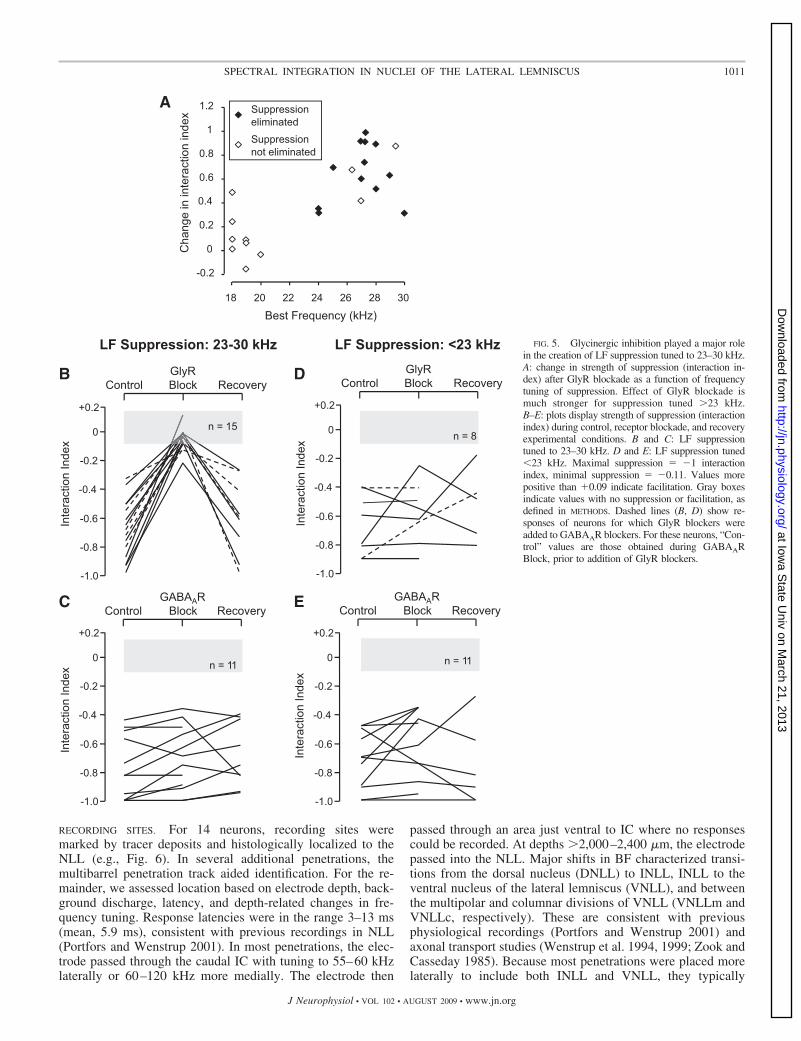
POPULATION DATA. Successful blockade of GABAARs and/orGlyRs was obtained in 24 neurons. There was a marked differencein the effects of GlyR blockade on suppression tuned above andbelow 23 kHz (Fig. 5A). Consistently strong reduction of LFsuppression occurred only during GlyR blockade of suppressiontuned in the range 23–30 kHz (Fig. 5B). Suppression was elimi-nated in 12 of 15 neurons and significantly reduced in the other 3neurons. This was true when GlyRs were blocked separately(solid lines, Fig. 5B) or in combination with GABAAR blockade(dashed lines). Separate GABAAR blockade of suppression tunedto 23–30 kHz had no consistent effect on the suppression andnever eliminated it (Fig. 5C). For suppression tuned �23 kHz,neither GlyR blockade nor GABAAR blockade had any consistenteffect (Fig. 5, D and E).
B
Del
ay o
f Bes
t F
requ
ency
Sig
nal (
ms)
Recovery
GABAAR+GlyR Block
GABAAR Block
Control
LFSuppression
No LF Suppression
LFSuppression
LFSuppression
BF Excitation
BF Excitation
BF Excitation
BF Excitation
C56 kHz 28 kHz t = 0 ms
Control
Recovery
0
16
32
61 2 13
Time (ms)
Spi
kes
500500 500
108 21 132
92 2 17
74 3 21
GABAAR Block
GABAAR+GlyR Block
Control
GABAAR+GlyR Block
GABAAR Block
Recovery
56 28
Delay of Best Frequency Signal (ms)
-4 4 12 20-12
IndividualTones (kHz)
0
Spi
kes
per
32 S
timul
i
0
40
80
120
160
Time (ms)
20
12
4
-4
-12
0 25 50 75 100
20
12
4
-4
-12
20
12
4
-4
-12
20
12
4
-4
-12
56 kHz28 kHz
0
0
0
0
Spikes per binper 32 stimuli
0 8+
LF Suppression
LF Suppression
No LF Suppression
LF Suppression
A
FIG. 4. Suppression by 28-kHz tone waseliminated by addition of GlyR blockade.(Note: Fig. 3 shows suppression tuned to 18kHz for this same neuron.) A: PSTHs displaytemporal discharge pattern in response to BF(56 kHz), LF (28 kHz), and combination ofBF and BF at 0-ms delay. LF suppressionpersisted during GABAAR blockade, but waseliminated with addition of GlyR blocker(GABAAR � GlyR Block). B: delay func-tions reveal that delay-tuned suppression wasstrongest when the LF was presented simul-taneously with the BF. This suppression waseliminated during GABAAR � GlyR block-ade. C: grayscale PSTHs show that additionof GlyR blocker removed LF suppression ofboth background activity as well as the BFspiking response. Note that drug applicationdid not have an effect on the 18-kHz sup-pression displayed by this neuron (Fig. 3).
1010 D. C. PETERSON, K. NATARAJ, AND J. WENSTRUP
J Neurophysiol • VOL 102 • AUGUST 2009 • www.jn.org
at Iowa S
tate Univ on M
arch 21, 2013http://jn.physiology.org/
Dow
nloaded from
RECORDING SITES. For 14 neurons, recording sites weremarked by tracer deposits and histologically localized to theNLL (e.g., Fig. 6). In several additional penetrations, themultibarrel penetration track aided identification. For the re-mainder, we assessed location based on electrode depth, back-ground discharge, latency, and depth-related changes in fre-quency tuning. Response latencies were in the range 3–13 ms(mean, 5.9 ms), consistent with previous recordings in NLL(Portfors and Wenstrup 2001). In most penetrations, the elec-trode passed through the caudal IC with tuning to 55–60 kHzlaterally or 60–120 kHz more medially. The electrode then
passed through an area just ventral to IC where no responsescould be recorded. At depths �2,000–2,400 �m, the electrodepassed into the NLL. Major shifts in BF characterized transi-tions from the dorsal nucleus (DNLL) to INLL, INLL to theventral nucleus of the lateral lemniscus (VNLL), and betweenthe multipolar and columnar divisions of VNLL (VNLLm andVNLLc, respectively). These are consistent with previousphysiological recordings (Portfors and Wenstrup 2001) andaxonal transport studies (Wenstrup et al. 1994, 1999; Zook andCasseday 1985). Because most penetrations were placed morelaterally to include both INLL and VNLL, they typically
B
C E
n = 15
Control GlyR Block Recovery
n = 11
Control GABAAR
Block Recovery
+0.2
Inte
ract
ion
Inde
x
-1.0
-0.8
-0.6
-0.4
-0.2
0
+0.2
Inte
ract
ion
Inde
x
-1.0
-0.8
-0.6
-0.4
-0.2
0
D
n = 8
Control GlyR Block Recovery
+0.2
Inte
ract
ion
Inde
x
-1.0
-0.8
-0.6
-0.4
-0.2
0
n = 11
Control GABAAR
Block Recovery
+0.2
Inte
ract
ion
Inde
x
-1.0
-0.8
-0.6
-0.4
-0.2
0
LF Suppression: 23-30 kHz LF Suppression: <23 kHz
A
-0.2
0
0.2
0.4
0.6
0.8
1
1.2
18 20 22 24 26 28 30
Cha
nge
in in
tera
ctio
n in
dex
Best Frequency (kHz)
Suppression eliminated
Suppression not eliminated
FIG. 5. Glycinergic inhibition played a major rolein the creation of LF suppression tuned to 23–30 kHz.A: change in strength of suppression (interaction in-dex) after GlyR blockade as a function of frequencytuning of suppression. Effect of GlyR blockade ismuch stronger for suppression tuned �23 kHz.B–E: plots display strength of suppression (interactionindex) during control, receptor blockade, and recoveryexperimental conditions. B and C: LF suppressiontuned to 23–30 kHz. D and E: LF suppression tuned�23 kHz. Maximal suppression � �1 interactionindex, minimal suppression � �0.11. Values morepositive than �0.09 indicate facilitation. Gray boxesindicate values with no suppression or facilitation, asdefined in METHODS. Dashed lines (B, D) show re-sponses of neurons for which GlyR blockers wereadded to GABAAR blockers. For these neurons, “Con-trol” values are those obtained during GABAARBlock, prior to addition of GlyR blockers.
1011SPECTRAL INTEGRATION IN NUCLEI OF THE LATERAL LEMNISCUS
J Neurophysiol • VOL 102 • AUGUST 2009 • www.jn.org
at Iowa S
tate Univ on M
arch 21, 2013http://jn.physiology.org/
Dow
nloaded from
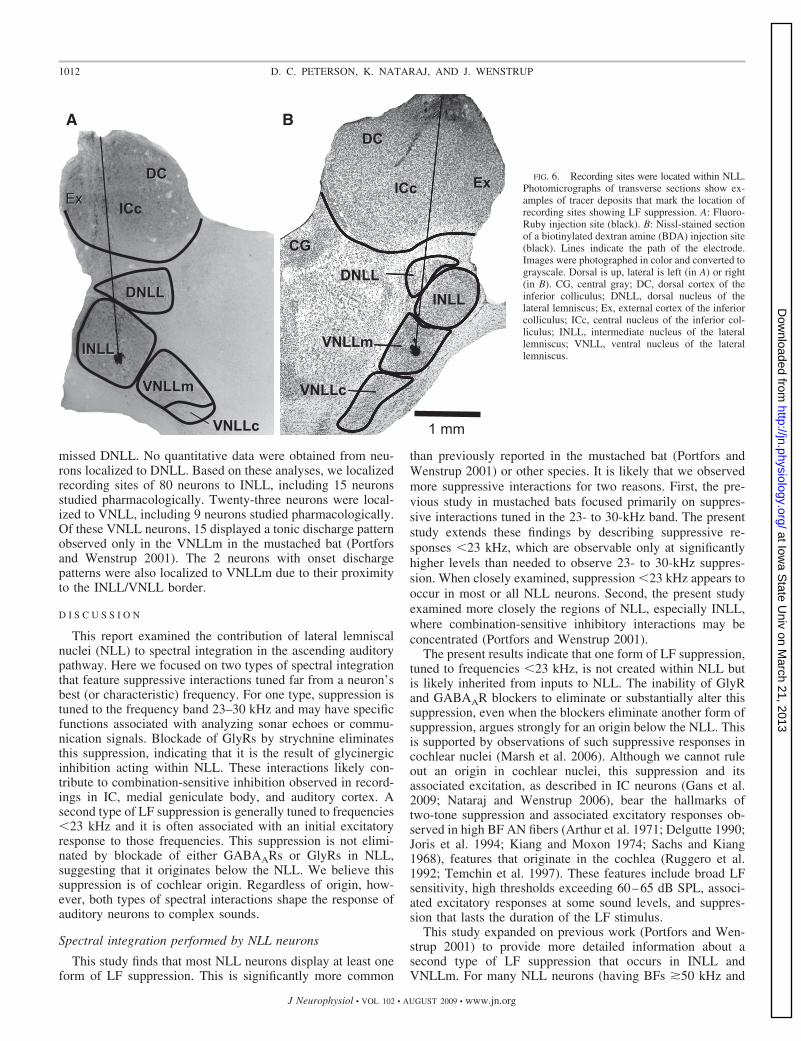
missed DNLL. No quantitative data were obtained from neu-rons localized to DNLL. Based on these analyses, we localizedrecording sites of 80 neurons to INLL, including 15 neuronsstudied pharmacologically. Twenty-three neurons were local-ized to VNLL, including 9 neurons studied pharmacologically.Of these VNLL neurons, 15 displayed a tonic discharge patternobserved only in the VNLLm in the mustached bat (Portforsand Wenstrup 2001). The 2 neurons with onset dischargepatterns were also localized to VNLLm due to their proximityto the INLL/VNLL border.
D I S C U S S I O N
This report examined the contribution of lateral lemniscalnuclei (NLL) to spectral integration in the ascending auditorypathway. Here we focused on two types of spectral integrationthat feature suppressive interactions tuned far from a neuron’sbest (or characteristic) frequency. For one type, suppression istuned to the frequency band 23–30 kHz and may have specificfunctions associated with analyzing sonar echoes or commu-nication signals. Blockade of GlyRs by strychnine eliminatesthis suppression, indicating that it is the result of glycinergicinhibition acting within NLL. These interactions likely con-tribute to combination-sensitive inhibition observed in record-ings in IC, medial geniculate body, and auditory cortex. Asecond type of LF suppression is generally tuned to frequencies�23 kHz and it is often associated with an initial excitatoryresponse to those frequencies. This suppression is not elimi-nated by blockade of either GABAARs or GlyRs in NLL,suggesting that it originates below the NLL. We believe thissuppression is of cochlear origin. Regardless of origin, how-ever, both types of spectral interactions shape the response ofauditory neurons to complex sounds.
Spectral integration performed by NLL neurons
This study finds that most NLL neurons display at least oneform of LF suppression. This is significantly more common
than previously reported in the mustached bat (Portfors andWenstrup 2001) or other species. It is likely that we observedmore suppressive interactions for two reasons. First, the pre-vious study in mustached bats focused primarily on suppres-sive interactions tuned in the 23- to 30-kHz band. The presentstudy extends these findings by describing suppressive re-sponses �23 kHz, which are observable only at significantlyhigher levels than needed to observe 23- to 30-kHz suppres-sion. When closely examined, suppression �23 kHz appears tooccur in most or all NLL neurons. Second, the present studyexamined more closely the regions of NLL, especially INLL,where combination-sensitive inhibitory interactions may beconcentrated (Portfors and Wenstrup 2001).
The present results indicate that one form of LF suppression,tuned to frequencies �23 kHz, is not created within NLL butis likely inherited from inputs to NLL. The inability of GlyRand GABAAR blockers to eliminate or substantially alter thissuppression, even when the blockers eliminate another form ofsuppression, argues strongly for an origin below the NLL. Thisis supported by observations of such suppressive responses incochlear nuclei (Marsh et al. 2006). Although we cannot ruleout an origin in cochlear nuclei, this suppression and itsassociated excitation, as described in IC neurons (Gans et al.2009; Nataraj and Wenstrup 2006), bear the hallmarks oftwo-tone suppression and associated excitatory responses ob-served in high BF AN fibers (Arthur et al. 1971; Delgutte 1990;Joris et al. 1994; Kiang and Moxon 1974; Sachs and Kiang1968), features that originate in the cochlea (Ruggero et al.1992; Temchin et al. 1997). These features include broad LFsensitivity, high thresholds exceeding 60–65 dB SPL, associ-ated excitatory responses at some sound levels, and suppres-sion that lasts the duration of the LF stimulus.
This study expanded on previous work (Portfors and Wen-strup 2001) to provide more detailed information about asecond type of LF suppression that occurs in INLL andVNLLm. For many NLL neurons (having BFs �50 kHz and
ExEx
DCDC
ICc
DNLLDNLL
INLLINLL
VNLLmVNLLm
A
ExEx
DCDC
ICcICc
DNLLDNLL
INLLINLL
VNLLmVNLLm
1 mm
CGCG
B
VNLLcVNLLc
VNLLcVNLLc
FIG. 6. Recording sites were located within NLL.Photomicrographs of transverse sections show ex-amples of tracer deposits that mark the location ofrecording sites showing LF suppression. A: Fluoro-Ruby injection site (black). B: Nissl-stained sectionof a biotinylated dextran amine (BDA) injection site(black). Lines indicate the path of the electrode.Images were photographed in color and converted tograyscale. Dorsal is up, lateral is left (in A) or right(in B). CG, central gray; DC, dorsal cortex of theinferior colliculus; DNLL, dorsal nucleus of thelateral lemniscus; Ex, external cortex of the inferiorcolliculus; ICc, central nucleus of the inferior col-liculus; INLL, intermediate nucleus of the laterallemniscus; VNLL, ventral nucleus of the laterallemniscus.
1012 D. C. PETERSON, K. NATARAJ, AND J. WENSTRUP
J Neurophysiol • VOL 102 • AUGUST 2009 • www.jn.org
at Iowa S
tate Univ on M
arch 21, 2013http://jn.physiology.org/
Dow
nloaded from
mostly within frequency ranges associated with higher har-monics of the echolocation signal), spike discharge to BF tonesis suppressed by low frequencies in the 23- to 30-kHz range, arange associated with the first harmonic of the bat’s echoloca-tion signal. The timing of this suppression appears closelymatched to BF-evoked excitation, so that the maximum sup-pressive effect is usually observed when the BF and LF signalsare presented simultaneously. Overall, these response proper-ties correspond closely to those in IC neurons that we havetermed “combination-sensitive inhibition” (Leroy and Wen-strup 2000; Mittmann and Wenstrup 1995; Portfors and Wen-strup 1999).
The major finding of this study is that this second form of LFsuppression—combination-sensitive inhibition—depends onLF inhibitory (glycinergic) input acting within VNLLm andINLL. Blockade of GABAARs has no consistent effect on thissuppression, but GlyR blockade always eliminates or greatlyreduces it. Further, the effect of GlyR blockade is selective forsuppression in the 23- to 30-kHz range. Among neurons thatshow both this and the other form of suppression, only the 23-to 30-kHz suppression is eliminated with GlyR blockade (e.g.,compare Figs. 3 and 4). These results strongly suggest that thisform of suppression is created within the NLL and they aresupported by previous work showing that combination-sensi-tive inhibition is rare in cochlear nuclei (Marsh et al. 2006).Based on both the past and present work, we conclude thatINLL and some VNLLm neurons perform a specific form offrequency integration in which the presence of acoustic energyin the 23- to 30-kHz band excites an LF-tuned glycinergicinput to these neurons. If timed correctly, this input will reducethe responsiveness of these NLL neurons to sounds in theirexcitatory receptive fields. The source of this glycinergic inputis most likely to originate in the medial or lateral nuclei of thetrapezoid body (Glendenning et al. 1981; Huffman and Covey1995; Sommer et al. 1993; Spangler et al. 1985; Zook andCasseday 1987). However, local glycinergic circuits withinINLL/VNLL may provide another possible source of glycin-ergic input (Nayagam et al. 2005).
At present it is unclear whether similar spectral interactionsoccur in NLL of other species, although INLL and VNLL areknown to receive inputs from glycinergic nuclei, including themedial and lateral nuclei of the trapezoid body (Glendenninget al. 1981; Huffman and Covey 1995; Irfan et al. 2005; Kellyet al. 2009; Sommer et al. 1993; Spangler et al. 1985; Yavuzo-glu and Wenstrup 2009; Zook and Casseday 1987). However,few studies have attempted to assess the role of inhibitoryspectral interactions in NLL through presentation of more thansingle tonal stimuli or through blockade of inhibitory neuro-transmitters. The most closely related studies in different spe-cies have yielded varied results. In rufous horseshoe bats(Rhinolophus rouxi), Metzner and Radke-Schuller (1987) re-ported evidence of spectrally distant inhibition that suppressesbackground activity in NLL neurons. In the free-tailed bat(Tadarida brasiliensis), Xie and colleagues (2005) addressedissues similar to the present study but reported very differentresults. In both INLL and DNLL, they found that blockade ofinhibition had virtually no effect on the width of tonal excita-tory tuning curves or on the responses to a suite of the bat’svocal signals. They concluded that inhibition in INLL andDNLL does not contribute to frequency tuning or responses tocomplex sounds. Surprisingly, even the discharge rate of INLL
neurons is generally unaffected by blockade of GABAergic orglycinergic inhibition. In contrast, we often observe increasesin spike discharge with GABAAR or GlyR blockade (e.g., Figs.2–4) and 23- to 30-kHz inhibition is always susceptible toGlyR blockade. Given the experience of both laboratories inmicroiontophoretic methods, species differences may be thebest explanation for the dramatically different results amongINLL neurons. We thus concur with Xie and colleagues (2005)that substantial species differences exist in auditory processingwithin INLL. Similarly, we believe that differences in spectraltuning (width or presence of multiple sensitivity peaks) ortemporal responses properties (e.g., temporal pattern of dis-charge) among VNLL neurons represent adaptations in audi-tory processing among chiropteran (Covey and Casseday 1991;Metzner and Radke-Schuller 1987; Portfors and Wenstrup2001; Xie et al. 2005) and other mammalian groups (Batra andFitzpatrick 1999; Zhang and Kelly 2006).
Distant spectral inhibition underlies various forms ofcomplex sound processing
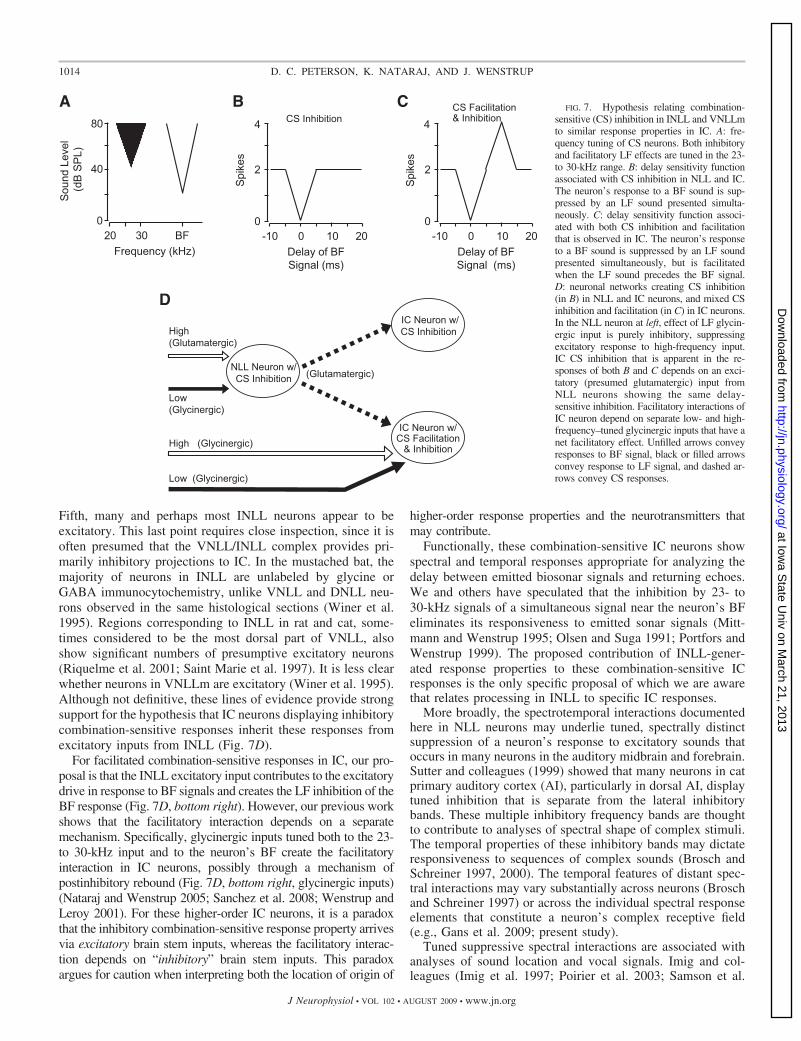
The present results support our hypothesis that spectrotem-poral processing within INLL and possibly VNLL provides thebasis for specific response properties observed in IC neurons.We propose that IC neurons displaying two kinds of spectrallyintegrative responses inherit the inhibitory combination-sensi-tive response property from neurons in INLL and possiblyVNLLm (Fig. 7). One type of IC response, comprising about25% of neurons in high-frequency regions of the IC (Natarajand Wenstrup 2006), displays two-tone frequency interactionsthat are nearly identical to the 23- to 30-kHz inhibition ob-served within NLL of this study (Fig. 7B) (Mittmann andWenstrup 1995; Nataraj and Wenstrup 2006; O’Neill 1985;Portfors and Wenstrup 1999). A second type (Fig. 7C), includ-ing about 20% of the same population (Nataraj and Wenstrup2005), shows both inhibition and facilitation by 23- to 30-kHzsounds, but at different timing relative to the BF signal (Mitt-mann and Wenstrup 1995; Nataraj and Wenstrup 2005; Port-fors and Wenstrup 1999). For this second type, the inhibitionoccurs when the two signals are presented simultaneously,whereas the facilitation occurs when the BF signal is delayedby several milliseconds.
Our proposal is that the 23- to 30-kHz inhibition displayedby both types of IC neurons is the result of a direct excitatoryprojection from the inhibitory combination-sensitive neuronsin INLL and perhaps VNLLm (Fig. 7D). There are severallines of evidence that support the inheritance hypothesis. First,many features of 23- to 30-kHz inhibition are similar in NLLand IC neurons, including the best inhibitory delay of 0 ms,thresholds of LF inhibition, and relationship to LF excitatoryresponses (Gans et al. 2009; Nataraj and Wenstrup 2006;Portfors and Wenstrup 1999). Second, among combination-sensitive IC neurons of both types, the 23- to 30-kHz inhibitionis not eliminated by local application of GlyR or GABAARblockers (Nataraj and Wenstrup 2005, 2006). Third, over halfof IC neurons showing 23- to 30-kHz inhibition do not displayLF-evoked inhibitory postsynaptic potentials (Peterson et al.2008). Both of these points suggest that the inhibition origi-nates below the IC. Fourth, INLL and VNLLm project stronglyto tracer deposit sites in IC that display inhibitory combination-sensitive responses as shown in Fig. 7B (Wenstrup et al. 1999).
1013SPECTRAL INTEGRATION IN NUCLEI OF THE LATERAL LEMNISCUS
J Neurophysiol • VOL 102 • AUGUST 2009 • www.jn.org
at Iowa S
tate Univ on M
arch 21, 2013http://jn.physiology.org/
Dow
nloaded from
Fifth, many and perhaps most INLL neurons appear to beexcitatory. This last point requires close inspection, since it isoften presumed that the VNLL/INLL complex provides pri-marily inhibitory projections to IC. In the mustached bat, themajority of neurons in INLL are unlabeled by glycine orGABA immunocytochemistry, unlike VNLL and DNLL neu-rons observed in the same histological sections (Winer et al.1995). Regions corresponding to INLL in rat and cat, some-times considered to be the most dorsal part of VNLL, alsoshow significant numbers of presumptive excitatory neurons(Riquelme et al. 2001; Saint Marie et al. 1997). It is less clearwhether neurons in VNLLm are excitatory (Winer et al. 1995).Although not definitive, these lines of evidence provide strongsupport for the hypothesis that IC neurons displaying inhibitorycombination-sensitive responses inherit these responses fromexcitatory inputs from INLL (Fig. 7D).
For facilitated combination-sensitive responses in IC, our pro-posal is that the INLL excitatory input contributes to the excitatorydrive in response to BF signals and creates the LF inhibition of theBF response (Fig. 7D, bottom right). However, our previous workshows that the facilitatory interaction depends on a separatemechanism. Specifically, glycinergic inputs tuned both to the 23-to 30-kHz input and to the neuron’s BF create the facilitatoryinteraction in IC neurons, possibly through a mechanism ofpostinhibitory rebound (Fig. 7D, bottom right, glycinergic inputs)(Nataraj and Wenstrup 2005; Sanchez et al. 2008; Wenstrup andLeroy 2001). For these higher-order IC neurons, it is a paradoxthat the inhibitory combination-sensitive response property arrivesvia excitatory brain stem inputs, whereas the facilitatory interac-tion depends on “inhibitory” brain stem inputs. This paradoxargues for caution when interpreting both the location of origin of
higher-order response properties and the neurotransmitters thatmay contribute.
Functionally, these combination-sensitive IC neurons showspectral and temporal responses appropriate for analyzing thedelay between emitted biosonar signals and returning echoes.We and others have speculated that the inhibition by 23- to30-kHz signals of a simultaneous signal near the neuron’s BFeliminates its responsiveness to emitted sonar signals (Mitt-mann and Wenstrup 1995; Olsen and Suga 1991; Portfors andWenstrup 1999). The proposed contribution of INLL-gener-ated response properties to these combination-sensitive ICresponses is the only specific proposal of which we are awarethat relates processing in INLL to specific IC responses.
More broadly, the spectrotemporal interactions documentedhere in NLL neurons may underlie tuned, spectrally distinctsuppression of a neuron’s response to excitatory sounds thatoccurs in many neurons in the auditory midbrain and forebrain.Sutter and colleagues (1999) showed that many neurons in catprimary auditory cortex (AI), particularly in dorsal AI, displaytuned inhibition that is separate from the lateral inhibitorybands. These multiple inhibitory frequency bands are thoughtto contribute to analyses of spectral shape of complex stimuli.The temporal properties of these inhibitory bands may dictateresponsiveness to sequences of complex sounds (Brosch andSchreiner 1997, 2000). The temporal features of distant spec-tral interactions may vary substantially across neurons (Broschand Schreiner 1997) or across the individual spectral responseelements that constitute a neuron’s complex receptive field(e.g., Gans et al. 2009; present study).
Tuned suppressive spectral interactions are associated withanalyses of sound location and vocal signals. Imig and col-leagues (Imig et al. 1997; Poirier et al. 2003; Samson et al.
High (Glycinergic)
High(Glutamatergic)
Low(Glycinergic)
IC Neuron w/CS Inhibition
NLL Neuron w/CS Inhibition
Low (Glycinergic)
IC Neuron w/CS Facilitation
& Inhibition
D
-10 0 10 200
2
4
Delay of BF Signal (ms)
Spi
kes
BCS Inhibition
-10 0 10 200
2
4
Delay of BF Signal (ms)
Spi
kes
C CS Facilitation& Inhibition
20 30 BF0
40
80
Frequency (kHz)
Sou
nd L
evel
(d
B S
PL)
A
(Glutamatergic)
FIG. 7. Hypothesis relating combination-sensitive (CS) inhibition in INLL and VNLLmto similar response properties in IC. A: fre-quency tuning of CS neurons. Both inhibitoryand facilitatory LF effects are tuned in the 23-to 30-kHz range. B: delay sensitivity functionassociated with CS inhibition in NLL and IC.The neuron’s response to a BF sound is sup-pressed by an LF sound presented simulta-neously. C: delay sensitivity function associ-ated with both CS inhibition and facilitationthat is observed in IC. The neuron’s responseto a BF sound is suppressed by an LF soundpresented simultaneously, but is facilitatedwhen the LF sound precedes the BF signal.D: neuronal networks creating CS inhibition(in B) in NLL and IC neurons, and mixed CSinhibition and facilitation (in C) in IC neurons.In the NLL neuron at left, effect of LF glycin-ergic input is purely inhibitory, suppressingexcitatory response to high-frequency input.IC CS inhibition that is apparent in the re-sponses of both B and C depends on an exci-tatory (presumed glutamatergic) input fromNLL neurons showing the same delay-sensitive inhibition. Facilitatory interactions ofIC neuron depend on separate low- and high-frequency–tuned glycinergic inputs that have anet facilitatory effect. Unfilled arrows conveyresponses to BF signal, black or filled arrowsconvey response to LF signal, and dashed ar-rows convey CS responses.
1014 D. C. PETERSON, K. NATARAJ, AND J. WENSTRUP
J Neurophysiol • VOL 102 • AUGUST 2009 • www.jn.org
at Iowa S
tate Univ on M
arch 21, 2013http://jn.physiology.org/
Dow
nloaded from
2000), studying neurons in the cat auditory midbrain, thalamus,and cortex, described monaural spatial selectivity that is asso-ciated with inhibitory frequency bands outside the main exci-tatory tuning curve. Some of the inhibitory bands are adjacentto the excitatory tuning curve, but others are distinct. Theseinteractions may underlie the ability of monaurally hearing-impaired individuals to localize sounds. Several researchershave noted the correspondence of spectrally distinct inhibitorybands to elements of social vocalizations. Kadia and Wang(2003) found that many distant spectral interactions, bothinhibitory and excitatory, are tuned to frequencies that areharmonically related to the best excitatory frequency of mar-moset cortical neurons. They speculate that the distant inhibi-tory interactions may contribute to analyses of fundamentalfrequency in communication calls.
As in marmosets, spectrally distant inhibitory interactions inmustached bats are tuned to distinct harmonic elements invocal signals. For the majority of neurons, the inhibitoryfrequencies are tuned to the fundamental of the sonar signal,23–30 kHz. The presence of relatively higher threshold inhi-bition, tuned to the sonar fundamental, is thought to suppressresponses to emitted sonar signals. In returning echoes, anattenuated fundamental component may be too weak to acti-vate the inhibition. This allows the neuron to discharge inresponse to the higher harmonics in the echo. In sonar, thismechanism creates “echo-only” neurons (Mittmann and Wen-strup 1995). This well-timed inhibition also contributes toneuronal responses that are selective for pulse-echo delay, themajor cue for analyses of object/target distance in echolocatingbats (Nataraj and Wenstrup 2005; Olsen and Suga 1991;Portfors and Wenstrup 1999).
In mustached bats, suppressive interactions in both 10- to22- and 23- to 30-kHz bands will alter neural responsiveness toseveral social vocalizations that have energy within thesebands. Such suppressive interactions, in mustached bats orother species, appear to limit neural responsiveness to socialvocalizations with energy in the suppressive-frequency band(Leroy and Wenstrup 2000; Rauschecker et al. 1995)—predic-tions of responses to complex sounds are more accurate whenthese inhibitory bands are taken into account (Holstrom et al.2007). The present results establish that these types of analysesoccur in the nuclei of the lateral lemniscus and that glycine-dependent inhibitory mechanisms acting within these nucleimay play a substantial role.
A C K N O W L E D G M E N T S
We thank the Auditory Neuroscience Group at Northeastern Ohio Univer-sities College of Medicine for discussion of the data, C. Grose for assistancewith the manuscript, and the Wildlife Section of the Ministry of Agriculture,Land and Marine Resources of Trinidad and Tobago for permission to exportsbats.
Present addresses: D. Peterson (as of July 1 2009), Department of BiologicalSciences, College of Veterinary Medicine, Iowa State University, Ames, IA50011-1250; K. Nataraj, Department of Biology, Brandeis University, 415South St., Waltham, MA 02454.
G R A N T S
This work was supported by National Institute on Deafness and OtherCommunication Disorders (NIDCD) Grants R01 DC-00937 to J. J. Wenstrupand NIDCD/U.S. Public Health Service National Research Service Award F32DC-007786 to D. C. Peterson.
R E F E R E N C E S
Abeles M, Goldstein MH Jr. Responses of single units in the primaryauditory cortex of the cat to tones and to tone pairs. Brain Res 42: 337–352,1972.
Adams JC. Heavy metal intensification of DAB-based HRP reaction product(Letter). J Histochem Cytochem 29: 775, 1981.
Arthur RM, Pfeiffer RR, Suga N. Properties of “two-tone inhibition” inprimary auditory neurones. J Physiol 212: 593–609, 1971.
Batra R, Fitzpatrick DC. Discharge patterns of neurons in the ventral nucleusof the lateral lemniscus of the unanesthetized rabbit. J Neurophysiol 82:1097–1113, 1999.
Brosch M, Schreiner CE. Time course of forward masking tuning curves incat primary auditory cortex. J Neurophysiol 77: 923–943, 1997.
Brosch M, Schreiner CE. Sequence sensitivity of neurons in cat primaryauditory cortex. Cereb Cortex 10: 1155–1167, 2000.
Covey E, Casseday JH. The monaural nuclei of the lateral lemniscus in anecholocating bat: parallel pathways for analyzing temporal features ofsound. J Neurosci 11: 3456–3470, 1991.
Delgutte B. Physiological mechanisms of psychophysical masking: observa-tions from auditory-nerve fibers. J Acoust Soc Am 87: 791–809, 1990.
Fuzessery ZM, Feng AS. Mating call selectivity in the thalamus and midbrainof the leopard frog (Rana p. pipiens): single and multiunit analyses. J CompPhysiol A Sens Neural Behav Physiol 150: 333–344, 1983.
Gans D, Sheykholeslami K, Peterson D, Wenstrup JJ. Temporal features ofspectral integration in the inferior colliculus: effects of stimulus duration andrise time. J Neurophysiol 102: 167–180, 2008.
Glendenning KK, Brunso-Bechtold JK, Thompson GC, Masterton RB.Ascending auditory afferents to the nuclei of the lateral lemniscus. J CompNeurol 197: 673–703, 1981.
Havey DC, Caspary DM. A simple technique for constructing “piggy-back”multibarrel microelectrodes. Electroencephalogr Clin Neurophysiol 48:249–251, 1980.
Holmstrom L, Roberts PD, Portfors CV. Responses to social vocalizationsin the inferior colliculus of the mustached bat are influenced by secondarytuning curves. J Neurophysiol 98: 3461–3472, 2007.
Huffman RF, Covey E. Origin of ascending projections to the nuclei of thelateral lemniscus in the big brown bat, Eptesicus fuscus. J Comp Neurol 357:532–545, 1995.
Imig TJ, Poirier P, Irons WA, Samson FK. Monaural spectral contrastmechanism for neural sensitivity to sound direction in the medial geniculatebody of the cat. J Neurophysiol 78: 2754–2771, 1997.
Irfan N, Zhang H, Wu SH. Synaptic transmission mediated by ionotropicglutamate, glycine and GABA receptors in the rat’s ventral nucleus of thelateral lemniscus. Hear Res 203: 159–171, 2005.
Joris PX, Carney LH, Smith PH, Yin TC. Enhancement of neural synchro-nization in the anteroventral cochlear nucleus. I. Responses to tones at thecharacteristic frequency. J Neurophysiol 71: 1022–1036, 1994.
Kadia SC, Wang X. Spectral integration in A1 of awake primates: neuronswith single- and multipeaked tuning characteristics. J Neurophysiol 89:1603–1622, 2003.
Kanwal JS, Fitzpatrick DC, Suga N. Facilitatory and inhibitory frequencytuning of combination-sensitive neurons in the primary auditory cortex ofmustached bats. J Neurophysiol 82: 2327–2345, 1999.
Kelly JB, van Adel BA, Ito M. Anatomical projections of the nuclei of thelateral lemniscus in the albino rat (Rattus norvegicus). J Comp Neurol 512:573–593, 2009.
Kiang NY, Moxon EC. Tails of tuning curves of auditory-nerve fibers. JAcoust Soc Am 55: 620–630, 1974.
Leroy SA, Wenstrup JJ. Spectral integration in the inferior colliculus of themustached bat. J Neurosci 20: 8533–8541, 2000.
Marsh RA, Nataraj K, Gans D, Portfors CV, Wenstrup JJ. Auditoryresponses in the cochlear nucleus of awake mustached bats: precursors tospectral integration in the auditory midbrain. J Neurophysiol 95: 88–105,2006.
Metzner W, Radtke-Schuller S. The nuclei of the lateral lemniscus in therufous horseshoe bat, Rhinolophus rouxi. A neurophysiological approach.J Comp Physiol A Sens Neural Behav Physiol 160: 395–411, 1987.
Mittmann DH, Wenstrup JJ. Combination-sensitive neurons in the inferiorcolliculus. Hear Res 90: 185–191, 1995.
Nataraj K, Wenstrup JJ. Roles of inhibition in creating complex auditoryresponses in the inferior colliculus: facilitated combination-sensitive neu-rons. J Neurophysiol 93: 3294–3312, 2005.
1015SPECTRAL INTEGRATION IN NUCLEI OF THE LATERAL LEMNISCUS
J Neurophysiol • VOL 102 • AUGUST 2009 • www.jn.org
at Iowa S
tate Univ on M
arch 21, 2013http://jn.physiology.org/
Dow
nloaded from
Nataraj K, Wenstrup JJ. Roles of inhibition in complex auditory responsesin the inferior colliculus: inhibited combination-sensitive neurons. J Neuro-physiol 95: 2179–2192, 2006.
Nayagam DAX, Clarey JC, Paolini AG. Powerful, onset inhibition in theventral nucleus of the lateral lemniscus. J Neurophysiol 94: 1651–1654,2005.
Nelken I, Young ED. Two separate inhibitory mechanisms shape the re-sponses of dorsal cochlear nucleus type IV units to narrowband andwideband stimuli. J Neurophysiol 71: 2446–2462, 1994.
Olsen JF, Suga N. Combination-sensitive neurons in the medial geniculatebody of the mustached bat: encoding of target range information. J Neuro-physiol 65: 1275–1296, 1991.
O’Neill WE. Responses to pure tones and linear FM components of theCF-FM biosonar signal by single units in the inferior colliculus of themustached bat. J Comp Physiol A Sens Neural Behav Physiol 157: 797–815,1985.
Peterson DC, Voytenko S, Gans D, Galazyuk A, Wenstrup J. Intracellularrecordings from combination-sensitive neurons in the inferior colliculus.J Neurophysiol 100: 629–645, 2008.
Poirier P, Samson FK, Imig TJ. Spectral shape sensitivity contributes to theazimuth tuning of neurons in the cat’s inferior colliculus. J Neurophysiol 89:2760–2777, 2003.
Portfors CV, Felix RA 2nd. Spectral integration in the inferior colliculus ofthe CBA/CaJ mouse. Neuroscience 136: 1159–1170, 2005.
Portfors CV, Wenstrup JJ. Delay-tuned neurons in the inferior colliculus ofthe mustached bat: implications for analyses of target distance. J Neuro-physiol 82: 1326–1338, 1999.
Portfors CV, Wenstrup JJ. Responses to combinations of tones in the nucleiof the lateral lemniscus. J Assoc Res Otolaryngol 2: 104–117, 2001.
Rauschecker JP, Tian B, Hauser M. Processing of complex sounds in themacaque nonprimary auditory cortex. Science 268: 111–114, 1995.
Riquelme R, Saldana E, Osen KK, Ottersen OP, Merchan MA. Colocal-ization of GABA and glycine in the ventral nucleus of the lateral lemniscusin rat: an in situ hybridization and semiquantitative immunocytochemicalstudy. J Comp Neurol 432: 409–424, 2001.
Ruggero MA, Robles L, Rich NC. Two-tone suppression in the basilarmembrane of the cochlea: mechanical basis of auditory-nerve rate suppres-sion. J Neurophysiol 68: 1087–1099, 1992.
Russell IJ, Sellick PM. Intracellular studies of hair cells in the mammaliancochlea. J Physiol 284: 261–290, 1978.
Sachs MB, Kiang NY. Two-tone inhibition in auditory-nerve fibers. J AcoustSoc Am 43: 1120–1128, 1968.
Saint Marie RL, Stanforth DA, Jubelier EM. Substrate for rapid feedfor-ward inhibition of the auditory forebrain. Brain Res 765: 173–176, 1997.
Samson FK, Barone P, Irons WA, Clarey JC, Poirier P, Imig TJ. Direc-tionality derived from differential sensitivity to monaural and binaural cuesin the cat’s medial geniculate body. J Neurophysiol 84: 1330–1345, 2000.
Sanchez JT, Gans D, Wenstrup JJ. Contribution of NMDA and AMPAreceptors to temporal patterning of auditory responses in the inferior col-liculus. J Neurosci 27: 1954–1963, 2007.
Sanchez JT, Gans D, Wenstrup JJ. Glycinergic “inhibition” mediates selec-tive excitatory response to combinations of sounds. J Neurosci 28: 80–90,2008.
Shamma SA, Symmes D. Patterns of inhibition in auditory cortical cells inawake squirrel monkeys. Hear Res 19: 1–13, 1985.
Shofner WP, Young ED. Excitatory/inhibitory response types in the cochlearnucleus: relationships to discharge patterns and responses to electricalstimulation of the auditory nerve. J Neurophysiol 54: 917–939, 1985.
Sommer I, Lingenhohl K, Friauf E. Principal cells of the rat medial nucleusof the trapezoid body: an intracellular in vivo study of their physiology andmorphology. Exp Brain Res 95: 223–239, 1993.
Spangler KM, Warr WB, Henkel CK. The projections of the principal cellsof the medial nucleus of the trapezoid body in the cat. J Comp Neurol 238:249–262, 1985.
Suga N, O’Neill WE, Manabe T. Harmonic-sensitive neurons in the auditorycortex of the mustache bat. Science 203: 270–274, 1979.
Sutter ML, Schreiner CE. Physiology and topography of neurons withmultipeaked tuning curves in cat primary auditory cortex. J Neurophysiol65: 1207–1226, 1991.
Sutter ML, Schreiner CE, McLean M, O’Conner KN, Loftus WC. Orga-nization of inhibitory frequency receptive fields in cat primary auditorycortex. J Neurophysiol 82: 2358–2371, 1999.
Temchin AN, Rich NC, Ruggero MA. Low-frequency suppression of audi-tory nerve responses to characteristic frequency tones. Hear Res 113:29–56, 1997.
Wenstrup JJ. Frequency organization and responses to complex sounds in themedial geniculate body of the mustached bat. J Neurophysiol 82: 2528–2544, 1999.
Wenstrup JJ, Larue DT, Winer JA. Projections of physiologically definedsubdivisions of the inferior colliculus in the mustached bat: targets in themedial geniculate body and extrathalamic nuclei. J Comp Neurol 346:207–236, 1994.
Wenstrup JJ, Leroy SA. Spectral integration in the inferior colliculus: role ofglycinergic inhibition in response facilitation. J Neurosci 21: RC124 (1–6),2001.
Wenstrup JJ, Mittmann DH, Grose CD. Inputs to combination-sensitiveneurons of the inferior colliculus. J Comp Neurol 409: 509–528, 1999.
Winer JA, Larue DT, Pollak GD. GABA and glycine in the central auditorysystem of the mustache bat: structural substrates for inhibitory neuronalorganization. J Comp Neurol 355: 317–353, 1995.
Xie R, Meitzen J, Pollak GD. Differing roles of inhibition in hierarchicalprocessing of species-specific calls in auditory brainstem nuclei. J Neuro-physiol 94: 4019–4037, 2005.
Yavuzoglu A, Wenstrup J. A possible substrate of frequency integration innuclei of the lateral lemniscus. Assoc Res Otolaryngol Abstr 860, 2009.
Zhang H, Kelly JB. Responses of neurons in the rat’s ventral nucleus of thelateral lemniscus to monaural and binaural tone bursts. J Neurophysiol 95:2501–2512, 2006.
Zook JM, Casseday JH. Cytoarchitecture of auditory system in lower brain-stem of the mustache bat, Pteronotus parnellii. J Comp Neurol 207: 1–13,1982.
Zook JM, Casseday JH. Projections from the cochlear nuclei in the mustachebat, Pteronotus parnellii. J Comp Neurol 237: 307–324, 1985.
Zook JM, Casseday JH. Convergence of ascending pathways at the inferiorcolliculus of the mustache bat, Pteronotus parnellii. J Comp Neurol 261:347–361, 1987.
1016 D. C. PETERSON, K. NATARAJ, AND J. WENSTRUP
J Neurophysiol • VOL 102 • AUGUST 2009 • www.jn.org
at Iowa S
tate Univ on M
arch 21, 2013http://jn.physiology.org/
Dow
nloaded from
Copyright © 2022 FDOKUMEN