Specific insight of active sites in Cs 2Te x V y PMo 12O 40 catalysts efficient for selective...
10
This article appeared in a journal published by Elsevier. The attached copy is furnished to the author for internal non-commercial research and education use, including for instruction at the authors institution and sharing with colleagues. Other uses, including reproduction and distribution, or selling or licensing copies, or posting to personal, institutional or third party websites are prohibited. In most cases authors are permitted to post their version of the article (e.g. in Word or Tex form) to their personal website or institutional repository. Authors requiring further information regarding Elsevier’s archiving and manuscript policies are encouraged to visit: http://www.elsevier.com/copyright
-
Upload
independent -
Category
Documents
-
view
2 -
download
0
Transcript of Specific insight of active sites in Cs 2Te x V y PMo 12O 40 catalysts efficient for selective...
This article appeared in a journal published by Elsevier. The attachedcopy is furnished to the author for internal non-commercial researchand education use, including for instruction at the authors institution
and sharing with colleagues.
Other uses, including reproduction and distribution, or selling orlicensing copies, or posting to personal, institutional or third party
websites are prohibited.
In most cases authors are permitted to post their version of thearticle (e.g. in Word or Tex form) to their personal website orinstitutional repository. Authors requiring further information
regarding Elsevier’s archiving and manuscript policies areencouraged to visit:
http://www.elsevier.com/copyright
Author's personal copy
Specific insight of active sites in Cs2TexVyPMo12O40 catalysts efficient for selectiveoxidation of isobutane by operando resonance Raman spectroscopy
Stephane Loridant *, Quyen Huynh, Jean-Marc M. Millet
Institut de Recherches sur la Catalyse et l’Environnement de Lyon, IRCELYON, UMR5256 CNRS-Universite Claude Bernard Lyon 1, 2 av. Einstein, F-69626 Villeurbanne Cedex, France
1. Introduction
The operando methodology is powerful to establish relation-ships between catalytic activity and catalyst structure by couplingcharacterization experiments and catalytic measurements in asame cell. It is a tool to design and prepare better catalysts [1–3].However, in heterogeneous catalysis, it is sometimes difficult toidentify active sites because they are located at the surface ofcatalysts and can be present in very limited number. Therefore,well-chosen techniques are required to determine the structure ofthese sites. Resonance Raman spectroscopy allows observation ofdiluted chromophores enhancing bands of molecules or crystalsowning electronic transition in the UV–near IR range when thewavelength of the laser exciting line coincides with that of thetransition. Additionally, resonance Raman spectroscopy probes
much less layers of matter than other bulk techniques since theresonance process is often associated with strong (re)-absorption[4,5]. Therefore, it can be key technique to characterize catalyticactive sites as previously illustrated in the literature [6–10].
Recently, new catalysts based on phosphomolybdic acidsubstituted by cesium, tellurium and vanadium cations wereshown to be efficient and stable for selective oxidation of isobutaneto methacrylic acid [11]. This direct reaction is particularlyattractive to replace the current ‘‘acetone–cyanohydrin’’ processthat generates numerous toxic wastes [12]. Incorporation oftellurium led to improved selectivity to methacrylic acid andincorporation of vanadium to improved catalytic activity [13].
The catalysts had been characterized by various bulk techni-ques before and after reaction revealing limited features. Indeed,XRD patterns only revealed a cubic structure typical of cesiumheteropolysalt and IR spectra only contained vibration bandstypical of [PMo12O40]3� Keggin anions. However, X-absorptionspectroscopies were much more informative since the oxidationstate of both tellurium and vanadium was determined to be IV
Catalysis Today 155 (2010) 214–222
A R T I C L E I N F O
Article history:
Available online 18 November 2009
Keywords:
Keggin-type phosphomolybdate
Tellurium
Vanadium
Reduced heteropolyanion
Resonance Raman spectroscopy
Operando Raman spectroscopy
Active sites
A B S T R A C T
Keggin-type phosphomolybdates with cesium, tellurium and vanadium as counter-cations, recently
shown to be efficient for selective oxidation of isobutane, were characterized by diffuse reflectance and
Raman spectroscopy. In the present study, it was shown that the Raman bands appearing in addition to
those of [PMo12O40]3� in these catalysts after reaction were observed with much better sensitivity using
exciting lines at 647.1 and 785 nm. This phenomenon, linked to the existence of d–d transitions and
intervalence charge transfers at 680 and 860 nm, respectively, arises mainly from reduction of the
probed depth and to a lesser extent, from enhancement effect using resonance Raman spectroscopy. The
better sensitivity of this technique was used to follow specifically the additional bands before, during
and after reaction. They were attributed to highly reduced phosphomolybdates stabilized under reaction
mixture and possibly capped by Te4+ and (V55O)2+. The reduced species would be present in a layer lying
over unreduced Keggin salt and specifically probed using resonance Raman spectroscopy. Substitution
by tellurium cations was shown to favour reduction of Keggin heteropolyanions under reaction mixture.
Operando resonance Raman experiments evidenced that, for the samples without vanadium, reduced
phosphomolybdates were formed above 120 8C during the raise up to the reaction temperature whereas
for the samples with vanadium, small amount of these species was already observed before reaction
because of oxidation of V3+ to V4+ cations during drying. This amount also increased during the thermal
activation under reaction feed. The relative intensity of the additional bands was maximal when the
catalysts were active and selective under reaction mixture. After reaction, this parameter was related to
the selectivity to methacrolein and methacrylic acid suggesting that reduced phosphomolybdates are
more selective active sites.
� 2009 Elsevier B.V. All rights reserved.
* Corresponding author. Tel.: +33 (0)4 72 44 53 34; fax: +33 (0)4 72 44 53 99.
E-mail address: [email protected] (S. Loridant).
Contents lists available at ScienceDirect
Catalysis Today
journa l homepage: www.e lsev ier .com/ locate /cat tod
0920-5861/$ – see front matter � 2009 Elsevier B.V. All rights reserved.
doi:10.1016/j.cattod.2009.10.009
Author's personal copy
before and after reaction and the presence of [TeO4] clusterscapping Keggin anions has been proposed [13]. Raman spectra ofthe catalysts achieved before reaction with exciting line at514.5 nm were typical of Keggin units with cesium as counter-cations [14]. However, small additional bands were evidencedafter reaction for the best compounds [13]. These bands cannot beattributed to any allotropic form of MoO3 nor to fragments ofKeggin units as previously described [15].
In this paper, enhancement of additional bands by resonanceeffect has been evidenced using exciting lines at 647.1 and 785 nm.The use of resonance Raman spectroscopy allowed specific insightof the corresponding species thanks to much better sensitivity.From visible diffuse reflectance spectra, this better sensitivity wasexplained at first by strong re-absorption using red or near IRexciting line and to a lesser extent by resonance effect. It allowed amore precise comparison of additional bands with referencespectra for attribution, to investigate the influence of the counter-cations composition on their intensity and to establish relation-ships with catalytic properties. The formation of the correspondingspecies and their stability depending on the redox strength of theatmosphere were investigated achieving in situ and operandomeasurements.
2. Experimental
2.1. Preparation of the Cs2TexVy catalysts and references
The catalysts were prepared substituting protons contained inphosphomolybdic acid by cesium, tellurium and vanadiumcations [13] and were labelled according to their atomiccounter-cations content (Cs2TexVy). During typical preparation,8.16 g of H3PMo12O40�xH2O (Fluka, Ref. 79560) and variousamounts of telluric acid were dissolved in 140 ml of deionisedwater. A second solution containing 1.3 g of Cs2CO3 in 0.4 ml ofdeionised water was added dropwise leading to the formation of aprecipitate. The mixture was kept under stirring for 1 h at 80 8Cbefore evaporation at reduced pressure using a rotavapor, wasthen dried at 125 8C and finally calcined under air flow at 360 8Cfor 6 h. The preparation of Cs2Tex samples was achieved at thisstep. To obtain the Cs2TexVy samples, remaining protons weresubstituted by maintaining Cs2Tex salts in a solution of toluenecontaining vanadium acetylacetonate for 6 h under stirring atroom temperature. Finally, the substituted solids were only driedunder reduced pressure at 60 8C using a rotavapor. For testingmeasurements, the Cs2TexVy samples were directly heated underreaction mixture.
(MoO2)0.5(PMo14O42) reference compound was obtainedaccording to a procedure published by Marosi et al. [16,17]calcining the (NH4)3PMo12O40�xH2O ammonium salt (Aldrich, Ref.342165) under N2 flow at 470 8C for 6 h. The XRD pattern of theprepared compounds was completely indexed with that of(MoO2)0.5(PMo14O42) (PDF-ICDD 056-0165). IR vibration bandsof this sample were located at 1057, 1052, 1009, 994, 972, 961, 866,786, 768, 715, 675, 579, 550, 534, 508, 466, 451, 440 and 423 cm�1.Four electron reduced (TBA)7PMo12O40 salt was also prepared byreduction of H3PMo12O40 (Fluka, Ref. 79560) using N2H4�H2O(Aldrich, Ref. 207942) in 50% dioxane–50% water solution followedby precipitation using TBABr salt (Fluka, Ref. 86857). The sampleevidenced 31P-NMR band at �13.3 ppm typical of b-IV reducedKeggin anion [18].
2.2. Characterization techniques
Raman experiments were achieved using UV–vis–NIR Lab-Ram HR spectrometer (Horiba–Jobin Yvon) equipped with BXFMconfocal microscope, interference and Notch filters and CCD
detector cooled at �76 8C by Peltier effect. The diffused light wasspatially dispersed with a 1800 grooves/mm or a 300 grooves/mm diffraction grating. The influence of the laser wavelength onthe Raman spectra of catalysts has been investigated. For thatpurpose, the exciting lines at 457.9, 514.5 and 647.1 nmdelivered by a 2018 RM Ar–Kr laser (Spectra physics) and theexciting line at 785 nm obtained from a diode laser were used.After evidencing resonance effect of additional bands both at647.1 and 785 nm, the first one was preferred to the second onebecause black body emission is intense in near IR range even atmoderate temperature and can limit in situ and operandoexperiments.
For all the exciting lines, an extreme care has been taken tochoose a working laser power for which the heating effect wasnegligible. Therefore, the power at the samples was limited to only100 mW for all the experiments. In that regard, it is important tomention that the enhancement of additional bands cannot beobserved in ambient air using a too much high laser power becauseof the heating of samples.
An objective with magnification 100� was selected for ex situmeasurements whereas a long working distance objective withmagnification 50� was used for in situ and operando studies.During ex situ measurements, several areas were analysed undermicroscope for each composition. The comparison of spectra fromone point to the other has shown good homogeneity of thecatalysts before and after reaction.
In situ Raman spectra were recorded during thermal treat-ments of samples located in a crucible lying on the heating sole ofa THMS600 cell linked a TMS94 programmer (Linkam). The set-up for operando experiments was previously described in detail[19]. It consists of a home-made furnace containing four heatingplugs and fixed-bed quartz micro-reactor specially designed forsuch measurements. The last one contained a quartz window forlight transmission, thermocouple hollow, inlet–outlet gas con-nections and a porous disc on which the investigated catalystslaid. The feedstock composition used for operando experimentswas 27%iC4H10/13.5O2/10H2O/49.5He and corresponded to anoptimised mixture [13]. The temperature was varied from 20 8Cup to 376 8C under a 20 ml min�1 gas flow at atmosphericpressure. iC4H10 and O2 conversions were determined using a VGProLab mass spectrometer (Thermo Electron Corporation)located after the cell. Selectivities to methacrolein (MA) andmethacrylic acid (MAA) products were obtained from gaschromatography analysis using a GC 2012 (Shimatzu) after ice-cooled trapping. They were calculated from the formula Si = ni/DniC4H10 where Si is the selectivity to MA or MAA, ni the numberof moles produced during the time of trapping and DniC4H10 thenumber of moles of isobutane converted at the same time. CO andCO2 products were detected with the mass spectrometer but notquantified. Traces of acetic acid were also formed duringoperando experiments.
Diffuse reflectance spectra were carried out on powders in thevisible–near IR range using a Lambda 35 spectrometer (PerkinEl-mer) equipped with integrating sphere. A Spectralon1 standardsample was used as reference. The spectra are reported using theKubelka–Munk function given by FR(l) = (1 � R(l))2/2R(l) whereR(l) corresponds to the reflectance at the l wavelength.
Chemical analysis of Mo, V, Te and P cations was obtained byatomic emission using an induced plasma technique and using anair–acetylene flame for Cs cations. X-ray diffraction patterns wereachieved from 38 to 808 (2u) with a step of 0.028 using a SiemensD5005 diffractometer and Cu Ka radiation. The ICDD database wasused for indexation. Transmission FTIR spectra of samplesdispersed in KBr were recorded with a Bruker Vector 22 spectro-meter. Finally, 31P-NMR spectra were acquired on a Bruker DSX400 spectrometer.
S. Loridant et al. / Catalysis Today 155 (2010) 214–222 215
Author's personal copy
3. Results
3.1. Electronic properties
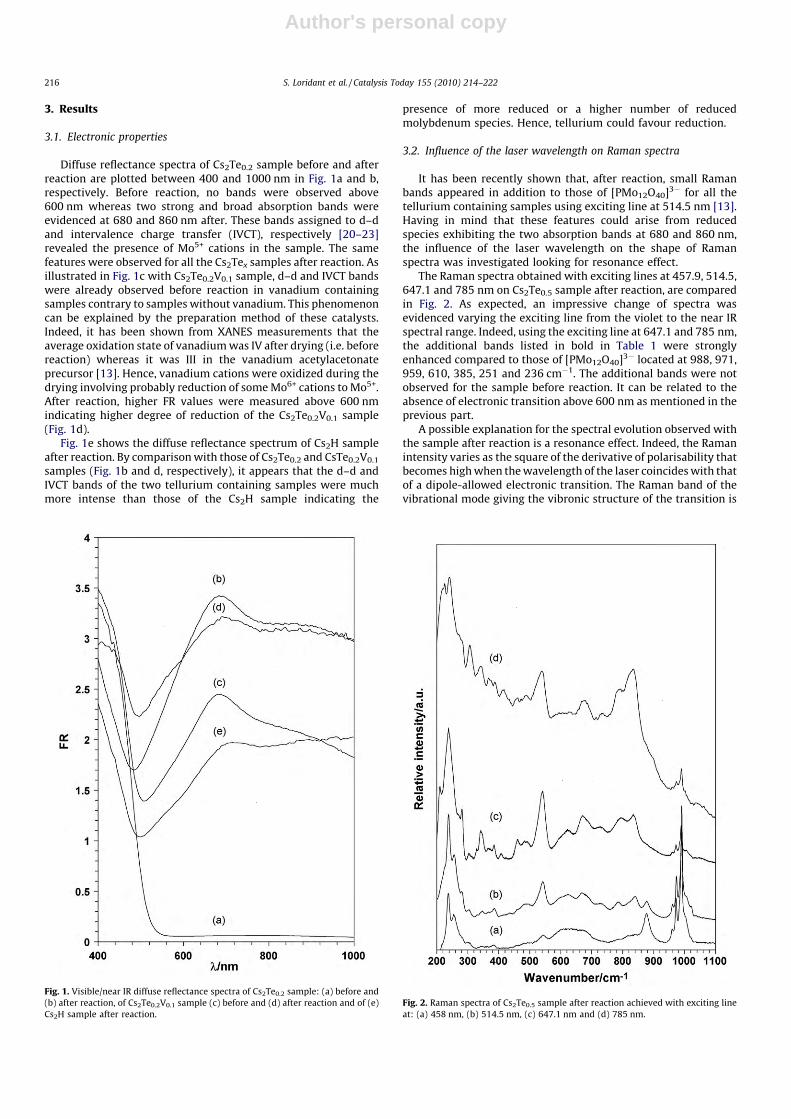
Diffuse reflectance spectra of Cs2Te0.2 sample before and afterreaction are plotted between 400 and 1000 nm in Fig. 1a and b,respectively. Before reaction, no bands were observed above600 nm whereas two strong and broad absorption bands wereevidenced at 680 and 860 nm after. These bands assigned to d–dand intervalence charge transfer (IVCT), respectively [20–23]revealed the presence of Mo5+ cations in the sample. The samefeatures were observed for all the Cs2Tex samples after reaction. Asillustrated in Fig. 1c with Cs2Te0.2V0.1 sample, d–d and IVCT bandswere already observed before reaction in vanadium containingsamples contrary to samples without vanadium. This phenomenoncan be explained by the preparation method of these catalysts.Indeed, it has been shown from XANES measurements that theaverage oxidation state of vanadium was IV after drying (i.e. beforereaction) whereas it was III in the vanadium acetylacetonateprecursor [13]. Hence, vanadium cations were oxidized during thedrying involving probably reduction of some Mo6+ cations to Mo5+.After reaction, higher FR values were measured above 600 nmindicating higher degree of reduction of the Cs2Te0.2V0.1 sample(Fig. 1d).
Fig. 1e shows the diffuse reflectance spectrum of Cs2H sampleafter reaction. By comparison with those of Cs2Te0.2 and CsTe0.2V0.1
samples (Fig. 1b and d, respectively), it appears that the d–d andIVCT bands of the two tellurium containing samples were muchmore intense than those of the Cs2H sample indicating the
presence of more reduced or a higher number of reducedmolybdenum species. Hence, tellurium could favour reduction.
3.2. Influence of the laser wavelength on Raman spectra
It has been recently shown that, after reaction, small Ramanbands appeared in addition to those of [PMo12O40]3� for all thetellurium containing samples using exciting line at 514.5 nm [13].Having in mind that these features could arise from reducedspecies exhibiting the two absorption bands at 680 and 860 nm,the influence of the laser wavelength on the shape of Ramanspectra was investigated looking for resonance effect.
The Raman spectra obtained with exciting lines at 457.9, 514.5,647.1 and 785 nm on Cs2Te0.5 sample after reaction, are comparedin Fig. 2. As expected, an impressive change of spectra wasevidenced varying the exciting line from the violet to the near IRspectral range. Indeed, using the exciting line at 647.1 and 785 nm,the additional bands listed in bold in Table 1 were stronglyenhanced compared to those of [PMo12O40]3� located at 988, 971,959, 610, 385, 251 and 236 cm�1. The additional bands were notobserved for the sample before reaction. It can be related to theabsence of electronic transition above 600 nm as mentioned in theprevious part.
A possible explanation for the spectral evolution observed withthe sample after reaction is a resonance effect. Indeed, the Ramanintensity varies as the square of the derivative of polarisability thatbecomes high when the wavelength of the laser coincides with thatof a dipole-allowed electronic transition. The Raman band of thevibrational mode giving the vibronic structure of the transition is
Fig. 1. Visible/near IR diffuse reflectance spectra of Cs2Te0.2 sample: (a) before and
(b) after reaction, of Cs2Te0.2V0.1 sample (c) before and (d) after reaction and of (e)
Cs2H sample after reaction.
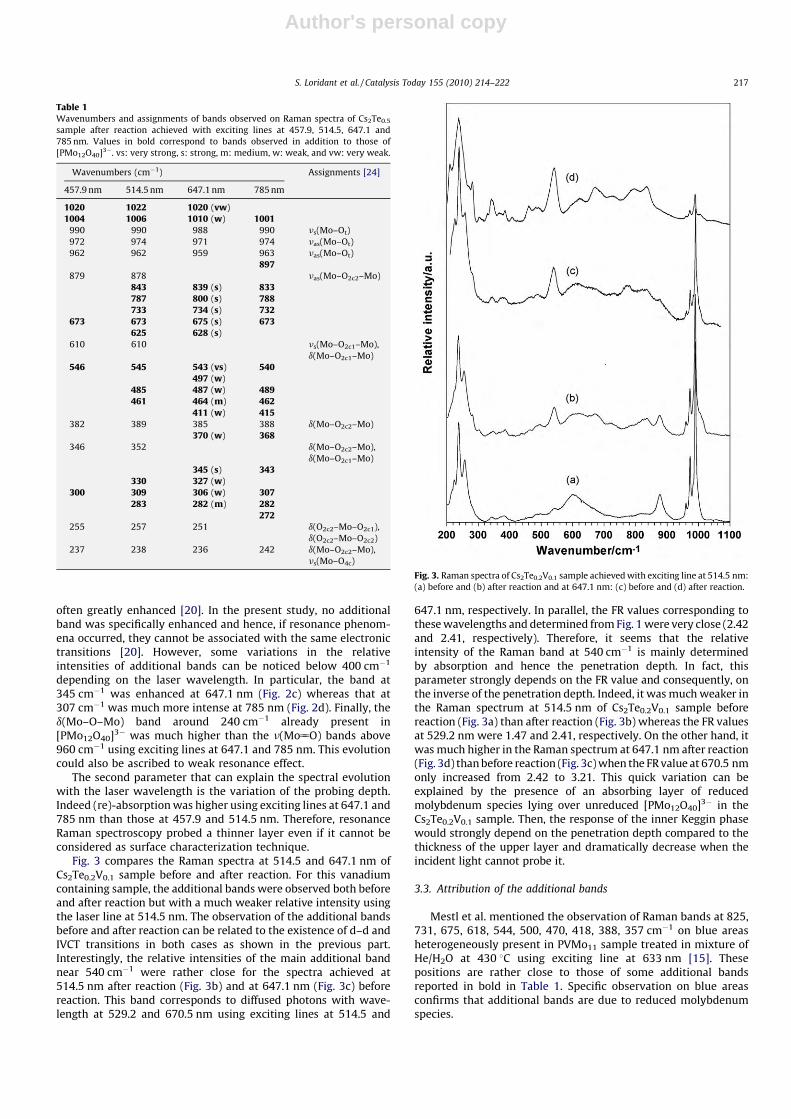
Fig. 2. Raman spectra of Cs2Te0.5 sample after reaction achieved with exciting line
at: (a) 458 nm, (b) 514.5 nm, (c) 647.1 nm and (d) 785 nm.
S. Loridant et al. / Catalysis Today 155 (2010) 214–222216
Author's personal copy
often greatly enhanced [20]. In the present study, no additionalband was specifically enhanced and hence, if resonance phenom-ena occurred, they cannot be associated with the same electronictransitions [20]. However, some variations in the relativeintensities of additional bands can be noticed below 400 cm�1
depending on the laser wavelength. In particular, the band at345 cm�1 was enhanced at 647.1 nm (Fig. 2c) whereas that at307 cm�1 was much more intense at 785 nm (Fig. 2d). Finally, thed(Mo–O–Mo) band around 240 cm�1 already present in[PMo12O40]3� was much higher than the n(Mo55O) bands above960 cm�1 using exciting lines at 647.1 and 785 nm. This evolutioncould also be ascribed to weak resonance effect.
The second parameter that can explain the spectral evolutionwith the laser wavelength is the variation of the probing depth.Indeed (re)-absorption was higher using exciting lines at 647.1 and785 nm than those at 457.9 and 514.5 nm. Therefore, resonanceRaman spectroscopy probed a thinner layer even if it cannot beconsidered as surface characterization technique.
Fig. 3 compares the Raman spectra at 514.5 and 647.1 nm ofCs2Te0.2V0.1 sample before and after reaction. For this vanadiumcontaining sample, the additional bands were observed both beforeand after reaction but with a much weaker relative intensity usingthe laser line at 514.5 nm. The observation of the additional bandsbefore and after reaction can be related to the existence of d–d andIVCT transitions in both cases as shown in the previous part.Interestingly, the relative intensities of the main additional bandnear 540 cm�1 were rather close for the spectra achieved at514.5 nm after reaction (Fig. 3b) and at 647.1 nm (Fig. 3c) beforereaction. This band corresponds to diffused photons with wave-length at 529.2 and 670.5 nm using exciting lines at 514.5 and
647.1 nm, respectively. In parallel, the FR values corresponding tothese wavelengths and determined from Fig. 1 were very close (2.42and 2.41, respectively). Therefore, it seems that the relativeintensity of the Raman band at 540 cm�1 is mainly determinedby absorption and hence the penetration depth. In fact, thisparameter strongly depends on the FR value and consequently, onthe inverse of the penetration depth. Indeed, it was much weaker inthe Raman spectrum at 514.5 nm of Cs2Te0.2V0.1 sample beforereaction (Fig. 3a) than after reaction (Fig. 3b) whereas the FR valuesat 529.2 nm were 1.47 and 2.41, respectively. On the other hand, itwas much higher in the Raman spectrum at 647.1 nm after reaction(Fig. 3d) than before reaction (Fig. 3c) when the FR value at 670.5 nmonly increased from 2.42 to 3.21. This quick variation can beexplained by the presence of an absorbing layer of reducedmolybdenum species lying over unreduced [PMo12O40]3� in theCs2Te0.2V0.1 sample. Then, the response of the inner Keggin phasewould strongly depend on the penetration depth compared to thethickness of the upper layer and dramatically decrease when theincident light cannot probe it.
3.3. Attribution of the additional bands
Mestl et al. mentioned the observation of Raman bands at 825,731, 675, 618, 544, 500, 470, 418, 388, 357 cm�1 on blue areasheterogeneously present in PVMo11 sample treated in mixture ofHe/H2O at 430 8C using exciting line at 633 nm [15]. Thesepositions are rather close to those of some additional bandsreported in bold in Table 1. Specific observation on blue areasconfirms that additional bands are due to reduced molybdenumspecies.
Table 1Wavenumbers and assignments of bands observed on Raman spectra of Cs2Te0.5
sample after reaction achieved with exciting lines at 457.9, 514.5, 647.1 and
785 nm. Values in bold correspond to bands observed in addition to those of
[PMo12O40]3�. vs: very strong, s: strong, m: medium, w: weak, and vw: very weak.
Wavenumbers (cm�1) Assignments [24]
457.9 nm 514.5 nm 647.1 nm 785 nm
1020 1022 1020 (vw)
1004 1006 1010 (w) 1001990 990 988 990 ns(Mo–Ot)
972 974 971 974 nas(Mo–Ot)
962 962 959 963 nas(Mo–Ot)
897879 878 nas(Mo–O2c2–Mo)
843 839 (s) 833787 800 (s) 788733 734 (s) 732
673 673 675 (s) 673625 628 (s)
610 610 ns(Mo–O2c1–Mo),
d(Mo–O2c1–Mo)
546 545 543 (vs) 540497 (w)
485 487 (w) 489461 464 (m) 462
411 (w) 415382 389 385 388 d(Mo–O2c2–Mo)
370 (w) 368346 352 d(Mo–O2c2–Mo),
d(Mo–O2c1–Mo)
345 (s) 343330 327 (w)
300 309 306 (w) 307283 282 (m) 282
272255 257 251 d(O2c2–Mo–O2c1),
d(O2c2–Mo–O2c2)
237 238 236 242 d(Mo–O2c2–Mo),
ns(Mo–O4c)
Fig. 3. Raman spectra of Cs2Te0.2V0.1 sample achieved with exciting line at 514.5 nm:
(a) before and (b) after reaction and at 647.1 nm: (c) before and (d) after reaction.
S. Loridant et al. / Catalysis Today 155 (2010) 214–222 217
Author's personal copy
The observation of numerous additional bands is a goodindication that the symmetry of reduced species is low. Twodistinct groups of bands can be distinguished in the spectra: thefirst one ranging from 500 to 900 cm�1 contains broad and intensebands that can be attributed to n(Mo5+–O–Mo6+) or n(Mo5+–O–Mo5+) stretching vibrations. In the second one, spreading from 200to 500 cm�1, much thinner bands were observed. These bands canbe tentatively assigned to d(Mo5+–O–Mo6+) or d(Mo5+–O–Mo5+)vibrations. As mentioned above, some of them were slightlyenhanced using exciting lines at 647.1 and 785 nm and conse-quently, they are more sensitive to the electronic structure.
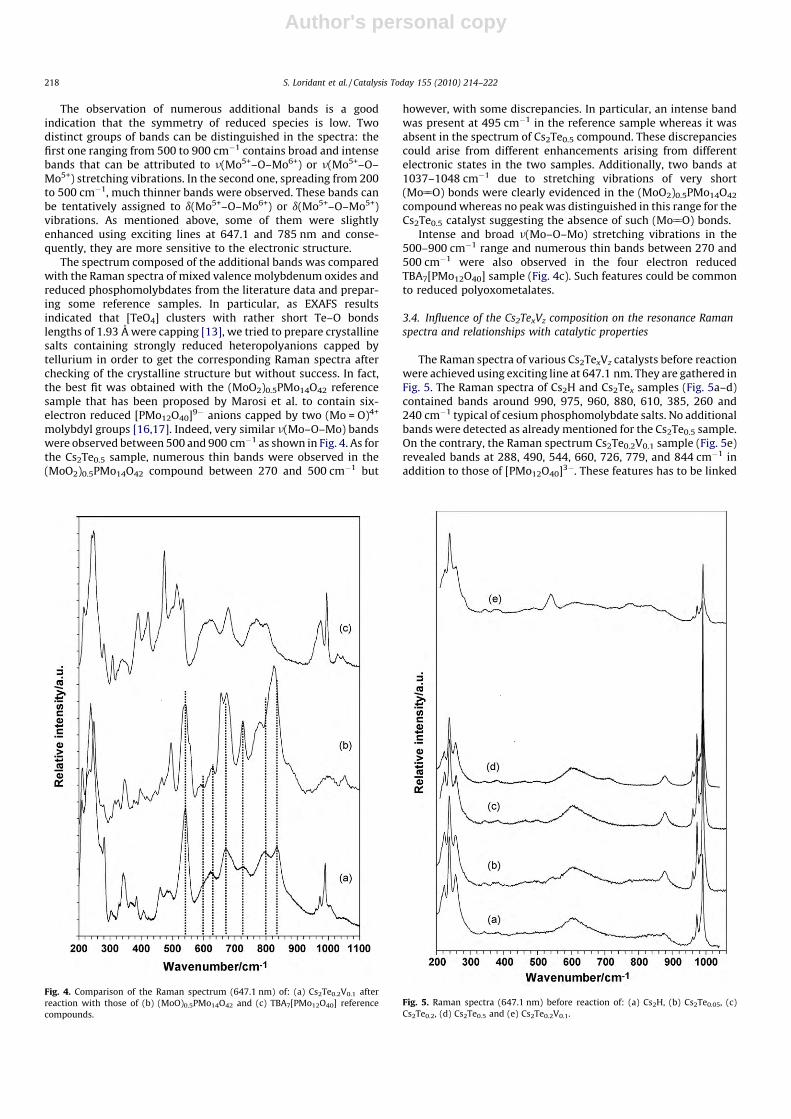
The spectrum composed of the additional bands was comparedwith the Raman spectra of mixed valence molybdenum oxides andreduced phosphomolybdates from the literature data and prepar-ing some reference samples. In particular, as EXAFS resultsindicated that [TeO4] clusters with rather short Te–O bondslengths of 1.93 A were capping [13], we tried to prepare crystallinesalts containing strongly reduced heteropolyanions capped bytellurium in order to get the corresponding Raman spectra afterchecking of the crystalline structure but without success. In fact,the best fit was obtained with the (MoO2)0.5PMo14O42 referencesample that has been proposed by Marosi et al. to contain six-electron reduced [PMo12O40]9� anions capped by two (Mo = O)4+
molybdyl groups [16,17]. Indeed, very similar n(Mo–O–Mo) bandswere observed between 500 and 900 cm�1 as shown in Fig. 4. As forthe Cs2Te0.5 sample, numerous thin bands were observed in the(MoO2)0.5PMo14O42 compound between 270 and 500 cm�1 but
however, with some discrepancies. In particular, an intense bandwas present at 495 cm�1 in the reference sample whereas it wasabsent in the spectrum of Cs2Te0.5 compound. These discrepanciescould arise from different enhancements arising from differentelectronic states in the two samples. Additionally, two bands at1037–1048 cm�1 due to stretching vibrations of very short(Mo55O) bonds were clearly evidenced in the (MoO2)0.5PMo14O42
compound whereas no peak was distinguished in this range for theCs2Te0.5 catalyst suggesting the absence of such (Mo55O) bonds.
Intense and broad n(Mo–O–Mo) stretching vibrations in the500–900 cm�1 range and numerous thin bands between 270 and500 cm�1 were also observed in the four electron reducedTBA7[PMo12O40] sample (Fig. 4c). Such features could be commonto reduced polyoxometalates.
3.4. Influence of the Cs2TexVz composition on the resonance Raman
spectra and relationships with catalytic properties
The Raman spectra of various Cs2TexVz catalysts before reactionwere achieved using exciting line at 647.1 nm. They are gathered inFig. 5. The Raman spectra of Cs2H and Cs2Tex samples (Fig. 5a–d)contained bands around 990, 975, 960, 880, 610, 385, 260 and240 cm�1 typical of cesium phosphomolybdate salts. No additionalbands were detected as already mentioned for the Cs2Te0.5 sample.On the contrary, the Raman spectrum Cs2Te0.2V0.1 sample (Fig. 5e)revealed bands at 288, 490, 544, 660, 726, 779, and 844 cm�1 inaddition to those of [PMo12O40]3�. These features has to be linked
Fig. 4. Comparison of the Raman spectrum (647.1 nm) of: (a) Cs2Te0.2V0.1 after
reaction with those of (b) (MoO)0.5PMo14O42 and (c) TBA7[PMo12O40] reference
compounds.
Fig. 5. Raman spectra (647.1 nm) before reaction of: (a) Cs2H, (b) Cs2Te0.05, (c)
Cs2Te0.2, (d) Cs2Te0.5 and (e) Cs2Te0.2V0.1.
S. Loridant et al. / Catalysis Today 155 (2010) 214–222218
Author's personal copy
with the observation of d–d and IVCT bands in its diffusereflectance spectrum (Fig. 1c) due to formation of Mo5+ cationsafter oxidation of V3+ to V4+ cations during the sample drying.
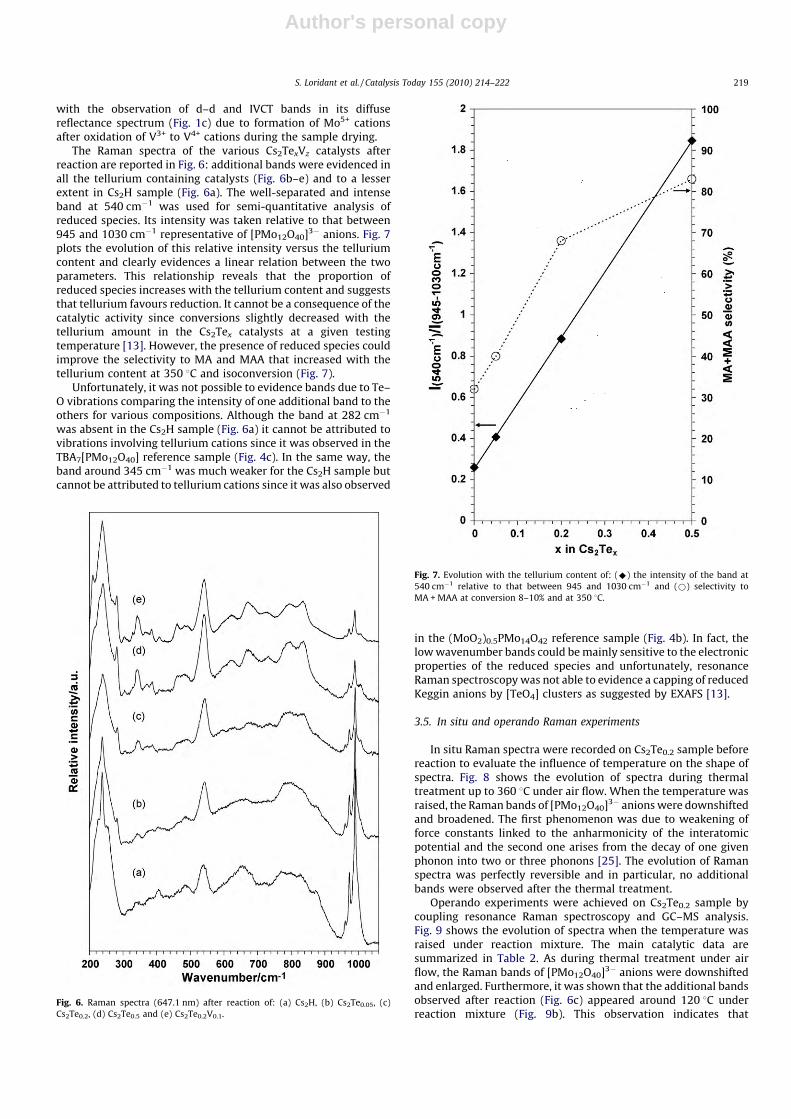
The Raman spectra of the various Cs2TexVz catalysts afterreaction are reported in Fig. 6: additional bands were evidenced inall the tellurium containing catalysts (Fig. 6b–e) and to a lesserextent in Cs2H sample (Fig. 6a). The well-separated and intenseband at 540 cm�1 was used for semi-quantitative analysis ofreduced species. Its intensity was taken relative to that between945 and 1030 cm�1 representative of [PMo12O40]3� anions. Fig. 7plots the evolution of this relative intensity versus the telluriumcontent and clearly evidences a linear relation between the twoparameters. This relationship reveals that the proportion ofreduced species increases with the tellurium content and suggeststhat tellurium favours reduction. It cannot be a consequence of thecatalytic activity since conversions slightly decreased with thetellurium amount in the Cs2Tex catalysts at a given testingtemperature [13]. However, the presence of reduced species couldimprove the selectivity to MA and MAA that increased with thetellurium content at 350 8C and isoconversion (Fig. 7).
Unfortunately, it was not possible to evidence bands due to Te–O vibrations comparing the intensity of one additional band to theothers for various compositions. Although the band at 282 cm�1
was absent in the Cs2H sample (Fig. 6a) it cannot be attributed tovibrations involving tellurium cations since it was observed in theTBA7[PMo12O40] reference sample (Fig. 4c). In the same way, theband around 345 cm�1 was much weaker for the Cs2H sample butcannot be attributed to tellurium cations since it was also observed
in the (MoO2)0.5PMo14O42 reference sample (Fig. 4b). In fact, thelow wavenumber bands could be mainly sensitive to the electronicproperties of the reduced species and unfortunately, resonanceRaman spectroscopy was not able to evidence a capping of reducedKeggin anions by [TeO4] clusters as suggested by EXAFS [13].
3.5. In situ and operando Raman experiments
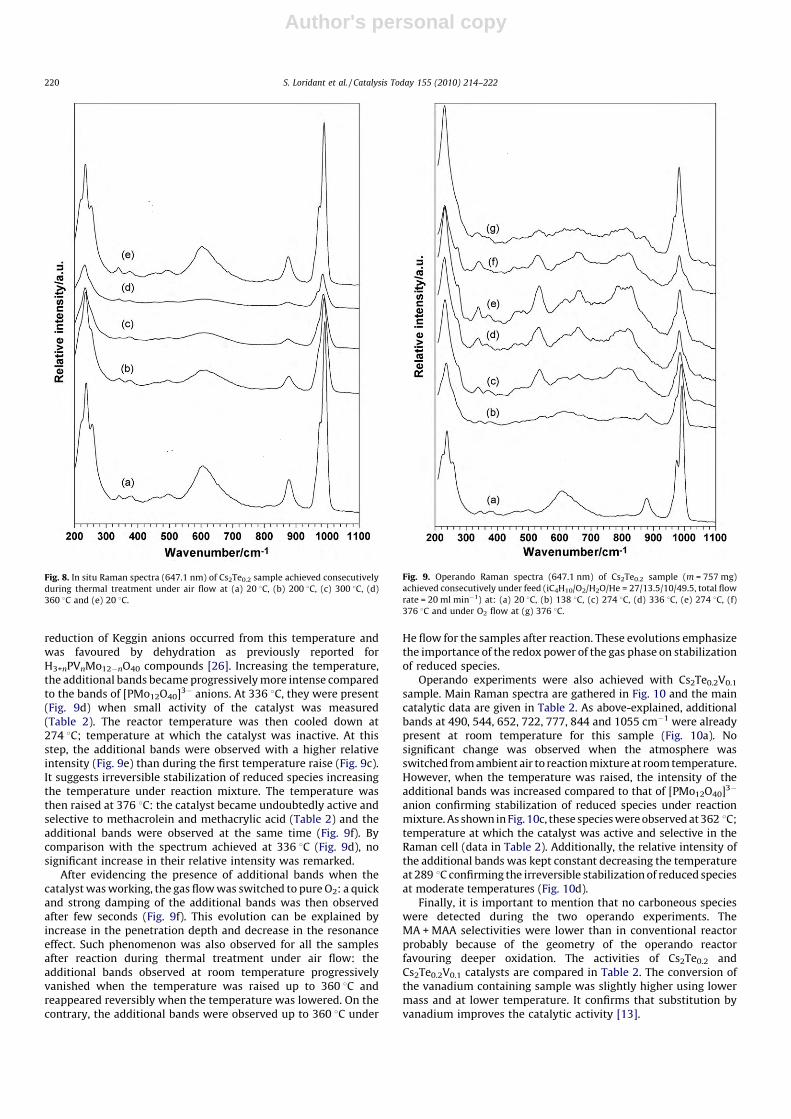
In situ Raman spectra were recorded on Cs2Te0.2 sample beforereaction to evaluate the influence of temperature on the shape ofspectra. Fig. 8 shows the evolution of spectra during thermaltreatment up to 360 8C under air flow. When the temperature wasraised, the Raman bands of [PMo12O40]3� anions were downshiftedand broadened. The first phenomenon was due to weakening offorce constants linked to the anharmonicity of the interatomicpotential and the second one arises from the decay of one givenphonon into two or three phonons [25]. The evolution of Ramanspectra was perfectly reversible and in particular, no additionalbands were observed after the thermal treatment.
Operando experiments were achieved on Cs2Te0.2 sample bycoupling resonance Raman spectroscopy and GC–MS analysis.Fig. 9 shows the evolution of spectra when the temperature wasraised under reaction mixture. The main catalytic data aresummarized in Table 2. As during thermal treatment under airflow, the Raman bands of [PMo12O40]3� anions were downshiftedand enlarged. Furthermore, it was shown that the additional bandsobserved after reaction (Fig. 6c) appeared around 120 8C underreaction mixture (Fig. 9b). This observation indicates that
Fig. 6. Raman spectra (647.1 nm) after reaction of: (a) Cs2H, (b) Cs2Te0.05, (c)
Cs2Te0.2, (d) Cs2Te0.5 and (e) Cs2Te0.2V0.1.
Fig. 7. Evolution with the tellurium content of: (^) the intensity of the band at
540 cm�1 relative to that between 945 and 1030 cm�1 and (*) selectivity to
MA + MAA at conversion 8–10% and at 350 8C.
S. Loridant et al. / Catalysis Today 155 (2010) 214–222 219
Author's personal copy
reduction of Keggin anions occurred from this temperature andwas favoured by dehydration as previously reported forH3+nPVnMo12�nO40 compounds [26]. Increasing the temperature,the additional bands became progressively more intense comparedto the bands of [PMo12O40]3� anions. At 336 8C, they were present(Fig. 9d) when small activity of the catalyst was measured(Table 2). The reactor temperature was then cooled down at274 8C; temperature at which the catalyst was inactive. At thisstep, the additional bands were observed with a higher relativeintensity (Fig. 9e) than during the first temperature raise (Fig. 9c).It suggests irreversible stabilization of reduced species increasingthe temperature under reaction mixture. The temperature wasthen raised at 376 8C: the catalyst became undoubtedly active andselective to methacrolein and methacrylic acid (Table 2) and theadditional bands were observed at the same time (Fig. 9f). Bycomparison with the spectrum achieved at 336 8C (Fig. 9d), nosignificant increase in their relative intensity was remarked.
After evidencing the presence of additional bands when thecatalyst was working, the gas flow was switched to pure O2: a quickand strong damping of the additional bands was then observedafter few seconds (Fig. 9f). This evolution can be explained byincrease in the penetration depth and decrease in the resonanceeffect. Such phenomenon was also observed for all the samplesafter reaction during thermal treatment under air flow: theadditional bands observed at room temperature progressivelyvanished when the temperature was raised up to 360 8C andreappeared reversibly when the temperature was lowered. On thecontrary, the additional bands were observed up to 360 8C under
He flow for the samples after reaction. These evolutions emphasizethe importance of the redox power of the gas phase on stabilizationof reduced species.
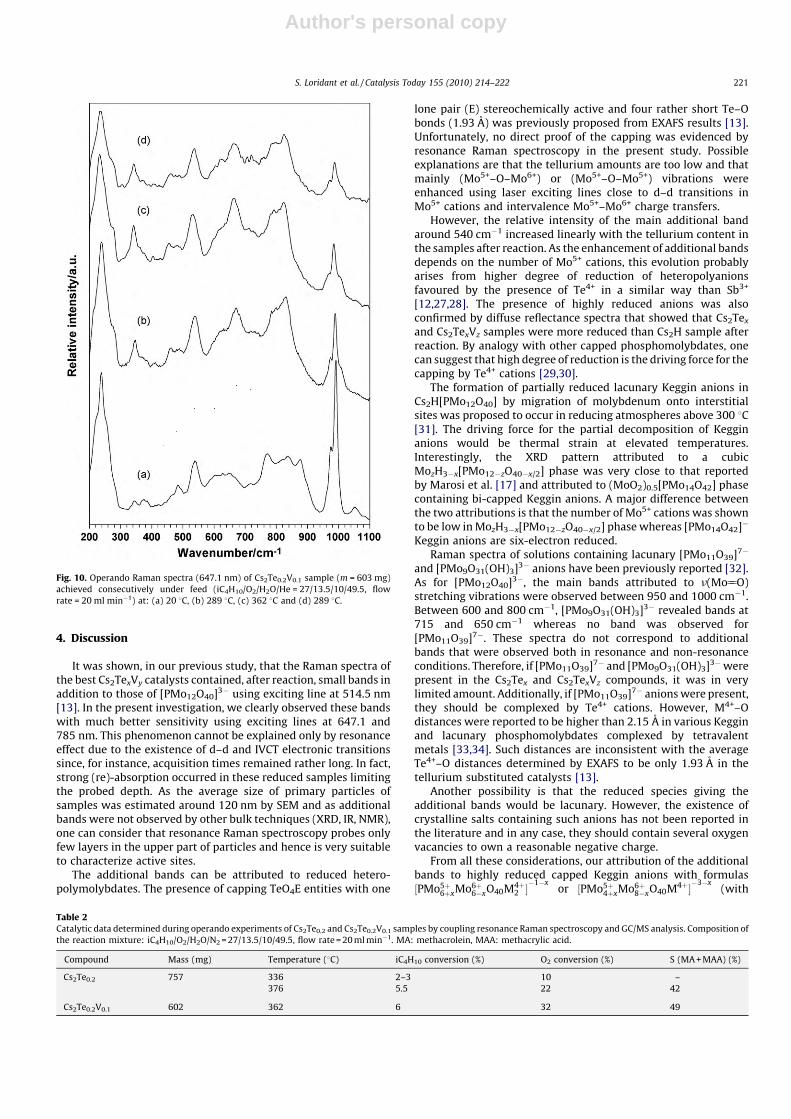
Operando experiments were also achieved with Cs2Te0.2V0.1
sample. Main Raman spectra are gathered in Fig. 10 and the maincatalytic data are given in Table 2. As above-explained, additionalbands at 490, 544, 652, 722, 777, 844 and 1055 cm�1 were alreadypresent at room temperature for this sample (Fig. 10a). Nosignificant change was observed when the atmosphere wasswitched from ambient air to reaction mixture at room temperature.However, when the temperature was raised, the intensity of theadditional bands was increased compared to that of [PMo12O40]3�
anion confirming stabilization of reduced species under reactionmixture. As shown in Fig. 10c, these species were observed at 362 8C;temperature at which the catalyst was active and selective in theRaman cell (data in Table 2). Additionally, the relative intensity ofthe additional bands was kept constant decreasing the temperatureat 289 8C confirming the irreversible stabilization of reduced speciesat moderate temperatures (Fig. 10d).
Finally, it is important to mention that no carboneous specieswere detected during the two operando experiments. TheMA + MAA selectivities were lower than in conventional reactorprobably because of the geometry of the operando reactorfavouring deeper oxidation. The activities of Cs2Te0.2 andCs2Te0.2V0.1 catalysts are compared in Table 2. The conversion ofthe vanadium containing sample was slightly higher using lowermass and at lower temperature. It confirms that substitution byvanadium improves the catalytic activity [13].
Fig. 8. In situ Raman spectra (647.1 nm) of Cs2Te0.2 sample achieved consecutively
during thermal treatment under air flow at (a) 20 8C, (b) 200 8C, (c) 300 8C, (d)
360 8C and (e) 20 8C.
Fig. 9. Operando Raman spectra (647.1 nm) of Cs2Te0.2 sample (m = 757 mg)
achieved consecutively under feed (iC4H10/O2/H2O/He = 27/13.5/10/49.5, total flow
rate = 20 ml min�1) at: (a) 20 8C, (b) 138 8C, (c) 274 8C, (d) 336 8C, (e) 274 8C, (f)
376 8C and under O2 flow at (g) 376 8C.
S. Loridant et al. / Catalysis Today 155 (2010) 214–222220
Author's personal copy
4. Discussion
It was shown, in our previous study, that the Raman spectra ofthe best Cs2TexVy catalysts contained, after reaction, small bands inaddition to those of [PMo12O40]3� using exciting line at 514.5 nm[13]. In the present investigation, we clearly observed these bandswith much better sensitivity using exciting lines at 647.1 and785 nm. This phenomenon cannot be explained only by resonanceeffect due to the existence of d–d and IVCT electronic transitionssince, for instance, acquisition times remained rather long. In fact,strong (re)-absorption occurred in these reduced samples limitingthe probed depth. As the average size of primary particles ofsamples was estimated around 120 nm by SEM and as additionalbands were not observed by other bulk techniques (XRD, IR, NMR),one can consider that resonance Raman spectroscopy probes onlyfew layers in the upper part of particles and hence is very suitableto characterize active sites.
The additional bands can be attributed to reduced hetero-polymolybdates. The presence of capping TeO4E entities with one
lone pair (E) stereochemically active and four rather short Te–Obonds (1.93 A) was previously proposed from EXAFS results [13].Unfortunately, no direct proof of the capping was evidenced byresonance Raman spectroscopy in the present study. Possibleexplanations are that the tellurium amounts are too low and thatmainly (Mo5+–O–Mo6+) or (Mo5+–O–Mo5+) vibrations wereenhanced using laser exciting lines close to d–d transitions inMo5+ cations and intervalence Mo5+–Mo6+ charge transfers.
However, the relative intensity of the main additional bandaround 540 cm�1 increased linearly with the tellurium content inthe samples after reaction. As the enhancement of additional bandsdepends on the number of Mo5+ cations, this evolution probablyarises from higher degree of reduction of heteropolyanionsfavoured by the presence of Te4+ in a similar way than Sb3+
[12,27,28]. The presence of highly reduced anions was alsoconfirmed by diffuse reflectance spectra that showed that Cs2Tex
and Cs2TexVz samples were more reduced than Cs2H sample afterreaction. By analogy with other capped phosphomolybdates, onecan suggest that high degree of reduction is the driving force for thecapping by Te4+ cations [29,30].
The formation of partially reduced lacunary Keggin anions inCs2H[PMo12O40] by migration of molybdenum onto interstitialsites was proposed to occur in reducing atmospheres above 300 8C[31]. The driving force for the partial decomposition of Kegginanions would be thermal strain at elevated temperatures.Interestingly, the XRD pattern attributed to a cubicMozH3�x[PMo12�zO40�x/2] phase was very close to that reportedby Marosi et al. [17] and attributed to (MoO2)0.5[PMo14O42] phasecontaining bi-capped Keggin anions. A major difference betweenthe two attributions is that the number of Mo5+ cations was shownto be low in MozH3�x[PMo12�zO40�x/2] phase whereas [PMo14O42]�
Keggin anions are six-electron reduced.Raman spectra of solutions containing lacunary [PMo11O39]7�
and [PMo9O31(OH)3]3� anions have been previously reported [32].As for [PMo12O40]3�, the main bands attributed to n(Mo55O)stretching vibrations were observed between 950 and 1000 cm�1.Between 600 and 800 cm�1, [PMo9O31(OH)3]3� revealed bands at715 and 650 cm�1 whereas no band was observed for[PMo11O39]7�. These spectra do not correspond to additionalbands that were observed both in resonance and non-resonanceconditions. Therefore, if [PMo11O39]7� and [PMo9O31(OH)3]3�werepresent in the Cs2Tex and Cs2TexVz compounds, it was in verylimited amount. Additionally, if [PMo11O39]7� anions were present,they should be complexed by Te4+ cations. However, M4+–Odistances were reported to be higher than 2.15 A in various Kegginand lacunary phosphomolybdates complexed by tetravalentmetals [33,34]. Such distances are inconsistent with the averageTe4+–O distances determined by EXAFS to be only 1.93 A in thetellurium substituted catalysts [13].
Another possibility is that the reduced species giving theadditional bands would be lacunary. However, the existence ofcrystalline salts containing such anions has not been reported inthe literature and in any case, they should contain several oxygenvacancies to own a reasonable negative charge.
From all these considerations, our attribution of the additionalbands to highly reduced capped Keggin anions with formulas½PMo5þ
6þxMo6þ6�xO40M4þ
2 ��1�x
or ½PMo5þ4þxMo6þ
8�xO40M4þ��3�x(with
Table 2Catalytic data determined during operando experiments of Cs2Te0.2 and Cs2Te0.2V0.1 samples by coupling resonance Raman spectroscopy and GC/MS analysis. Composition of
the reaction mixture: iC4H10/O2/H2O/N2 = 27/13.5/10/49.5, flow rate = 20 ml min�1. MA: methacrolein, MAA: methacrylic acid.
Compound Mass (mg) Temperature (8C) iC4H10 conversion (%) O2 conversion (%) S (MA + MAA) (%)
Cs2Te0.2 757 336 2–3 10 –
376 5.5 22 42
Cs2Te0.2V0.1 602 362 6 32 49
Fig. 10. Operando Raman spectra (647.1 nm) of Cs2Te0.2V0.1 sample (m = 603 mg)
achieved consecutively under feed (iC4H10/O2/H2O/He = 27/13.5/10/49.5, flow
rate = 20 ml min�1) at: (a) 20 8C, (b) 289 8C, (c) 362 8C and (d) 289 8C.
S. Loridant et al. / Catalysis Today 155 (2010) 214–222 221
Author's personal copy
M = Te4+ or (VO)2+) was kept as previously reported [13] but has tobe confirmed.
It has been shown that reduction of the average Mo valencecoincides with the onset of catalytic activity for H4[PVMo11O40]precursors [35]. In the present study, reduction of Mo6+ cationswas observed at much lower temperatures than the onset ofcatalytic activity since the reduced species started to be stabilizedunder reaction mixture from 120 8C for Cs2Tex catalysts and fromroom temperature for Cs2TexVy catalysts. Such low reductiontemperatures confirm that substitution of protons by Te4+ cationsfavours reduction of polyoxometalate (POM) under reactionmixture improving the selectivity to MA and MMA in similarway than substitution by Sb3+ [27,28,36]. It also confirms theimportance of having reduced POM to reach high selectivities tooxygenated products from light alkanes [36–39]. Additionally,bands corresponding to the reduced species were observed byresonance Raman spectroscopy when the catalysts were active andselective. It does not prove that they are active species since theycould be only spectator. However, a strong interaction betweentellurium and vanadium cations and reduced anions is probablyfavoured by the high negative charge of the last ones that couldlead to the existence of functionalized clusters able to activateisobutane, achieve oxidative dehydrogenation and oxygen inser-tion steps. Additionally, in the present study, a relationship wasestablished between the relative intensity of the bands arisingfrom reduced species and the selectivity to MA and MAA. Thesefeatures strongly suggest that reduced species containing tell-urium cations are active and more selective sites.
5. Conclusion
Resonance Raman spectroscopy is very powerful to specificallyinsight reduced species present in Cs2Tex and Cs2TexVy catalyststhanks to a much better sensitivity. Indeed, in the presentinvestigation, an impressive enhancement of additional bandsdue to these species was evidenced using exciting lines at 647.1and 785 nm when the wavelength of the laser was close to those d–d and IVCT transitions. This phenomenon was explained mainly bydecrease in the probed depth allowing characterization of theupper part of particles and to a lesser extent, by resonance effect.The additional bands were attributed to highly reduced hetero-polymolybdates. Reduction was shown to be favoured by thepresence of tellurium that leads also to increase in the selectivitiesto MA and MAA. Unfortunately, no proof of the capping by Te4+ or(V55O)2+ cations was obtained by resonance Raman spectroscopyusing exciting line at 647.1 nm. It could arise from specificenhancement of (Mo5+–O–Mo6+) and (Mo5+–O–Mo5+) vibrations inresonance conditions. For Cs2Tex catalysts, reduced species wereformed around 120 8C during activation under reaction mixture.For Cs2TexVy catalysts, small amount of these species was alreadyobserved after drying but the main part was also formed during thethermal activation.
The additional bands were observed by operando resonanceRaman spectroscopy when the catalysts were active and selectiveto MA and MAA. This feature and the relationship establishedbetween the relative intensity of the additional bands and the
selectivity to MA and MAA strongly suggest that reducedphosphomolybdates stabilized under gas mixture at the reactiontemperature are active and more selective sites.
Acknowledgements
S. Prakash is acknowledged for his help during UV–visexperiments. The authors thank also Pr.G. Lucazeau and Pr.E.Cadot for fruitful discussions on resonance Raman scattering andcapped reduced heteropolyanions, respectively.
References
[1] M.A. Banares, Catal. Today 100 (1–2) (2005) 71–77.[2] B.M. Weckhuysen, Phys. Chem. Chem. Phys. 5 (20) (2003) 4351–4360.[3] M.A. Banares, G. Mestl, Adv. Catal. 52 (2009) 43–128.[4] M. Dieterle, G. Weinsberg, G. Mestl, Phys. Chem. Chem. Phys. 4 (2002) 812–821.[5] M. Dieterle, G. Mestl, Phys. Chem. Chem. Phys. 4 (2002) 822–826.[6] G. Ricchiardi, A. Damin, S. Bordiga, C. Lamberti, G. Spano, R. Guido, F. Rivetti, A.
Zecchina, J. Am. Chem. Soc. 123 (46) (2001) 11409–11419.[7] H.-S. Kim, P.C. Stair, J. Phys. Chem. A 113 (16) (2009) 4346–4355.[8] A. Damin, F. Bonino, S. Bordiga, E. Groppo, C. Lamberti, A. Zecchina, Chem. Phys.
Chem. 7 (2) (2006) 342–344.[9] C. Li, J. Catal. 216 (1–2) (2003) 203–212.
[10] O. Demoulin, M. Navez, E.M. Gaigneaux, P. Ruiz, A.-S. Mamede, P. Granger, E.Payen, Phys. Chem. Chem. Phys. 5 (2003) 4394–4401.
[11] Q. Huynh, P. Lacorre, J.M.M. Millet, French Patent 0,601,284 (2006).[12] F. Cavani, R. Mezzogori, A. Pigamo, F. Trifiro, Top. Catal. 23 (1–4) (2003) 119–124.[13] Q. Huynh, Y. Schuurman, P. Delichere, S. Loridant, J.M.M. Millet, J. Catal. 261
(2009) 166–176.[14] M. Langpape, J.M.M. Millet, U.S. Ozhan, M. Boudeulle, J. Catal. 181 (1999) 80–90.[15] G. Mestl, T. Ilkenhans, D. Spielbauer, M. Dieterle, O. Timpe, J. Krohnert, F. Jentoft,
H. Knozinger, R. Schlogl, Appl. Catal. A: Gen. 210 (2001) 13–24.[16] L. Marosi, J. Cifre, C.O. Arean, Powder Diffraction 18 (3) (2003) 236–239.[17] L. Marosi, C.O. Arean, J. Catal. 213 (2003) 235–240.[18] J.N. Barrows, T. Michael, Adv. Chem. Ser. 226 (1990) 403–417.[19] H. Launay, S. Loridant, D.-L. Nguyen, A.M. Volodin, J.-L. Dubois, J.M.M. Millet, Catal.
Today 128 (2007) 176–182.[20] R.I. Buckley, R.J.H. Clark, Coord. Chem. Rev. 65 (1985) 167–218.[21] S. Klokishner, J. Melsheimer, R. Ahmad, F.C. Jentoft, G. Mestl, R. Schogl, Spectro-
chim. Acta Part A 58 (2002) 1–15.[22] C. Sanchez, J. Livage, J.P. Launay, M. Fournier, Y. Jeannin, J. Am. Chem. Soc. 104
(1982) 3194–3202.[23] J. Melsheimer, J. Krohnert, R. Ahmad, S. Klokishner, F.C. Jentoft, G. Mestl, R. Schlogl,
Phys. Chem. Chem. Phys. 4 (2002) 2398–2408.[24] A.J. Bridgeman, Chem. Phys. 287 (2003) 55–69.[25] G. Lucazeau, J. Raman Spectrosc. 34 (7/8) (2003) 478.[26] J.K. Lee, J. Melsheimer, S. Berndt, G. Mestl, R. Schlogl, K. Kohler, Appl. Catal. A: Gen.
214 (2001) 125–148.[27] F. Cavani, R. Mezzogori, A. Pigamo, F. Trifiro, Stud. Surf. Sci. Catal. 140 (2001) 141–
152.[28] F. Cavani, A. Tanguy, F. Trifiro, M. Koutrev, J. Catal. 174 (1998) 231–241.[29] C. Qin Chen, C.L. Hill, Inorg. Chem. 35 (1996) 2403.[30] S. Chang, C. Qin, X.-L. Wang, Y.-G. Li, E.-B. Wang, Chem. Res. Chin. Univ. 22 (1)
(2006) 17–20.[31] J. Wienold, O. Timpe, T. Ressler, Chem. Eur. J. 9 (2003) 6007–6017.[32] J.A. Rob van Veen, O. Sudmeijer, C.A. Emeis, H. de Wit, J. Chem. Soc. Dalton Trans.
(1986) 1825–1831.[33] R. Copping, L. Jonasson, A.J. Gaunt, D. Drennan, D. Collison, M. Helliwell, R.J.
Pirttijarvi, C.J. Jones, A. Huguet, D.C. Apperley, N. Kaltsoyannis, L. May, Inorg.Chem. 47 (2008) 5787–5798.
[34] A.J. Gaunt, I. May, D. Collison, O.D. Fox, Inorg. Chem. 42 (2003) 5049–5051.[35] T. Ressler, O. Timpe, F. Girgsdies, J. Wienold, T. Neisius, J. Catal. 231 (2005) 279–
291.[36] F. Cavani, R. Mezzogori, A. Pigamo, F. Trifiro, E. Etienne, Catal. Today 71 (2001) 97–
110.[37] F. Cavani, R. Mezzogori, A. Pigamo, F. Trifiro, Chem. Eng. J. 82 (2001) 33–42.[38] W. Ueda, Y. Suzuki, Chem. Lett. 7 (1995) 541–542.[39] W. Li, K. Oshihara, W. Ueda, Appl. Catal. A: Gen. 182 (1999) 357–363.
S. Loridant et al. / Catalysis Today 155 (2010) 214–222222