
Species-specific differences in follicular antral sizes result from diffusion-based limitations on...
45
Speciesspecific differences in follicular antral sizes result from diffusion 1 based limitations on the thickness of the granulosa cell layer. 2 3 M. Bächler 1,§ , D. Menshykau 1,2,§ , Ch. De Geyter 3 , D. Iber 1,2,* 4 5 1 Department for Biosystems, Science, and Engineering (D-BSSE), ETH Zürich 6 2 Swiss Institute of Bioinformatics, Switzerland 7 3 Clinic of Gynecological Endocrinology and Reproductive Medicine, Women's Hospital, University 8 of Basel, Switzerland 9 § These authors contributed equally 10 11 *Corresponding Author and Contact Person for Reprint Requests: 12 Dagmar Iber 13 Department for Biosystems, Science, and Engineering (D-BSSE), 14 ETH Zurich 15 Mattenstraße 26 16 4058 Basel 17 Switzerland 18 Tel + 41 61 387 3210 19 Fax + 41 61 387 31 94 20 [email protected] 21 22 23 Running Title: Scaling of Ovarian Follicles 24 Key words: human follicle development; scaling; gradients, gonadotropins, computational modelling 25 Disclosure Summary: All authors declare no conflict of Interest 26
Transcript of Species-specific differences in follicular antral sizes result from diffusion-based limitations on...

Species-‐specific differences in follicular antral sizes result from diffusion-‐1
based limitations on the thickness of the granulosa cell layer. 2
3
M. Bächler1,§, D. Menshykau1,2,§, Ch. De Geyter3, D. Iber1,2,* 4
5
1 Department for Biosystems, Science, and Engineering (D-BSSE), ETH Zürich 6
2 Swiss Institute of Bioinformatics, Switzerland 7
3 Clinic of Gynecological Endocrinology and Reproductive Medicine, Women's Hospital, University 8
of Basel, Switzerland 9
§ These authors contributed equally 10
11
*Corresponding Author and Contact Person for Reprint Requests: 12
Dagmar Iber 13
Department for Biosystems, Science, and Engineering (D-BSSE), 14
ETH Zurich 15
Mattenstraße 26 16
4058 Basel 17
Switzerland 18
Tel + 41 61 387 3210 19
Fax + 41 61 387 31 94 20
22
23
Running Title: Scaling of Ovarian Follicles 24
Key words: human follicle development; scaling; gradients, gonadotropins, computational modelling 25
Disclosure Summary: All authors declare no conflict of Interest 26

2
Abstract 27
The size of mature oocytes is similar across mammalian species, yet the size of ovarian follicles 28
increases with species size, with some ovarian follicles reaching diameters more than1000-fold the 29
size of the enclosed oocyte. Here we show that the different follicular sizes can be explained with 30
diffusion-based limitations on the thickness of the hormone-secreting granulosa layer. By analysing 31
published data on human follicular growth and granulosa cell expansion during follicular maturation 32
we find that the 4-fold increase of the antral follicle diameter is entirely driven by an increase in the 33
follicular fluid volume, while the thickness of the surrounding granulosa layer remains constant at 34
about 45±10 µm. Based on the measured kinetic constants, the model reveals that the observed fall in 35
the gonadotropin concentration from peripheral blood circulation to the follicular antrum is a result of 36
sequestration in the granulosa. The model further shows that as a result of sequestration, an increased 37
granulosa thickness cannot substantially increase estradiol production but rather deprives the oocyte 38
from gonadotropins. Larger animals (with a larger blood volume) require more estradiol as produced 39
by the ovaries to downregulate FSH-secretion in the pituitary. Larger follicle diameters result in larger 40
follicle surface areas for constant granulosa layer thickness. The reported increase in follicular surface 41
area in larger species indeed correlates linearly both with species mass and with the predicted increase 42
in estradiol output. In summary, we propose a structural role for the antrum in that it determines the 43
volume of the granulosa layer and thus the level of estrogen production. 44

3
Introduction 45
Ovarian follicle development has been studied for decades and has enabled major progress in animal 46
breeding and in human reproductive medicine (Adams, et al., 2012, Richards and Pangas, 2010). The 47
overall process appears to be similar across mammals: during menstruation, increased secretion of 48
follicle stimulating hormone (FSH) in the pituitary promotes the recruitment of a new cohort of 49
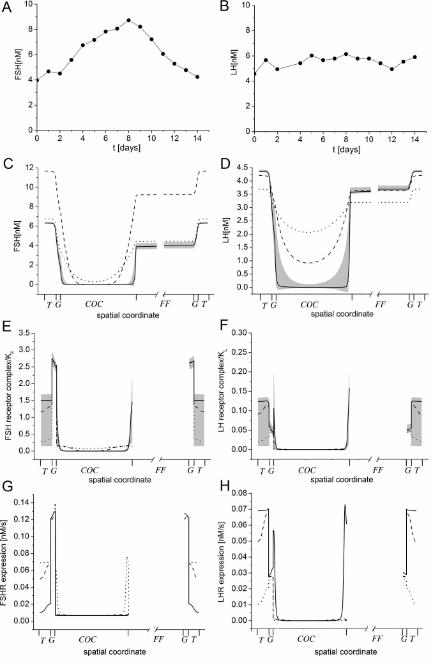
growing follicles in the ovaries. FSH and luteinizing hormone (LH) are both transported via the blood 50
circulation to the theca (Richards and Pangas, 2010) (Figure 1A,B), and stimulate there the production 51
of androgens, which are converted to oestrogens in the granulosa cell layer of the follicle (Bao and 52
Garverick, 1998, Erickson, et al., 1979, Silva and Price, 2002). The oestrogens, in turn, enter the 53
blood and down-regulate the production and secretion of FSH in the pituitary (Kumar, et al., 1997). 54
As the FSH concentration in the blood circulation subsequently falls, an increasing number of 55
follicles undergoes atresia, and only the one follicle that can best compensate the lower FSH 56
signalling with LH signalling survives and becomes the dominant, ovulating follicle (Xu, et al., 1995). 57
While the size of mature oocytes is similar across different mammalian species, the size of ovarian 58
follicles differs greatly (Table 1), with some ovarian follicles reaching diameters more than 1000-fold 59
the size of the oocyte that develops inside (Gosden and TELFER, 1987). Larger follicles are mainly 60
characterized by a larger size of the fluid-filled cavity, the antrum. No direct role of the antrum in 61
follicular function has so far been identified and it is an open question why the size of the antrum (and 62
thus that of the follicle) is so variable among species. The follicular fluid that fills the antral cavity 63
contains water, electrolytes, serum proteins and high concentrations of steroid hormones secreted by 64
the surrounding granulosa cells (Rodgers and Irving-Rodgers, 2010). The membrana granulosa of the 65
follicle is avascular and can therefore only be reached by diffusion from the vascularized theca 66
(Figure 1A,B). The oocyte together with the surrounding cumulus cells forms the COC. The COC 67
resides eccentrically in the follicle and is attached to the granulosa cell layer. 68

4
The geometry, the timing of the maturation process, and the core regulatory network that controls the 69
follicle maturation process have been defined (Richards and Pangas, 2010). Within the ovarian 70
follicle, FSH and LH regulate a large number of target genes and proteins, which interact in a 71
complex regulatory network (Gloaguen, et al., 2011). Within the follicle, the most important 72
regulatory factors are steroid hormones (androgens and oestrogens) but also insulin-like hormones, as 73
summarized in Figure 1C. The regulatory network is further complicated by the spatial restriction of 74
many of the gene expression domains. Thus, many of the signalling components are produced only in 75
parts of the follicle, with some diffusing and others being cell-bound within the tissue. 76
77
Computational models have the potential to integrate large amounts of published information and can 78
be used to evaluate the consistency of available data. A number of computational models have 79
previously been developed to analyse aspects of the follicle maturation process (for a review, see 80
(Vetharaniam, et al., 2010), but only few models explore the processes within the follicle itself. We 81
have recently developed a model for the spatiotemporal signaling dynamics of the core regulatory 82
network during bovine folliculogenesis (Iber and Geyter, 2013). The model was solved on a 1D-83
domain and demonstrated that the observed bovine gene expression patterns can indeed result from 84
these core regulatory interactions. The time-dependent 3D-geometry of the human follicle and the rate 85
of cellular expansion have been measured in great detail during the maturation process (Gougeon, 86
1986, McNatty, 1981). Recently, the gene expression levels have also been measured in human 87
follicles at various stages of their development (Jeppesen, et al., 2012). Given the availability of these 88
quantitative datasets, it is now feasible to construct a 3D-computational model for the human follicle 89
maturation process. To this end, we extended the bovine model to human folliculogenesis using 90
published quantitative human data on follicle growth, cell expansion, hormone concentrations and 91
gene expression kinetics. Based on detailed quantitative growth data, the granulosa layer retains a 92
constant thickness of about 45 µm during follicular growth, even though granulosa cells proliferate 93
strongly. Thus, the massive expansion of the follicle from a diameter of 5 mm to 2 cm within 10-14 94
days of development is driven entirely by an increase in the volume of the follicular fluid. Based on 95

5
the measured kinetic constants, the model further predicts that the granulosa cell layer would 96
sequester hormones and that this would result in a concentration difference between the serum and the 97
follicular fluid. The predicted concentration differences have been noted previously (Stone, et al., 98
1988) and we confirmed in measurements that model predictions and experiments agree quantitatively 99
for a range of serum concentrations. We subsequently used the validated model to test the impact of 100
altering either the size of the follicle or the thickness of the granulosa cell layer, and we find that, 101
because of the diffusion-limitations, oestradiol production can rise substantially only by increasing the 102
size of the follicle and thus the surface of the granulosa cell layer. We propose the diffusion-103
limitations across the granulosa cell layer as the reason for the follicular expansion in larger animals. 104
105
106
Material and Methods 107
The model 108
Folliculogenesis in cattle and humans bears great similarity (Aerts and Bols, 2010). We therefore 109
based the model for human folliculogenesis on our previous work on bovine folliculogenesis (Iber and 110
Geyter, 2013). The model is formulated as isotropic advection-reaction-diffusion equations for a 111
compound ci with diffusion coefficient Di and external velocity field u 112
!!!! + ! !"! = !!!!!! +!(!!) (1) 113
!(ci) denotes the reaction terms that describe the regulatory interactions of the hormones FSH (F), 114
LH (L) and their receptors, of androgens (A), oestradiol (E), and the oestradiol receptor for steroid-115
dependent signaling, as well as of IGF signaling (I) as shown in Figure 1C. The reaction terms !(ci) 116
are listed in the Supplementary Material. Much as in the bovine model we use zero flux boundary 117

6
conditions for all hormones, receptors and their complexes. The parameter values are listed in Table 118
S1 in the Supplementary Material. 119
120
Simulations 121
The PDEs were solved with finite element methods as implemented in COMSOL Multiphysics 4.3a. 122
COMSOL Multiphysics is a well-established software package and several studies confirm that 123
COMSOL provides accurate solutions to reaction-diffusion equations both on constant (Cutress, et al., 124
2010) and growing domains (Carin, 2006, Thummler and Weddemann, 2007, Weddemann and 125
Thummler, 2008). Simulations on growing domains were carried out using the Arbitrary-Lagrangian 126
Eulerian (ALE) Method. Details on how biological models in general, and reaction-diffusion-127
advection equations on a domain comprising several subdomains in particular are implemented in 128
COMSOL have been described by us previously (Germann, et al., 2011, Menshykau and Iber, 2012). 129
The accuracy of the calculation for the components with sharpest concentration profiles (FSHR and 130
LHR) was 2% or higher, except for a narrow range of time where the accuracy was 8% or higher. 131
132
Measurements of the concentrations of FSH, LH and hCG 133
In eight women treated with exogenous gonadotropins for ovarian hyperstimulation in assisted 134
reproduction the follicular fluid of the first ovarian follicle in the right and in the left ovary were 135
collected together with serum for the measurement of the concentrations of FSH, LH and HCG, 136
respectively. The gonadotropin levels both in the serum and in the follicular fluid were measured by 137
quantitative determination using the Elecsys System, Roche Diagnostics, Rotkreuz, Switzerland. All 138
partipants were informed about the rationale of the project and signed informed consent. 139
140
141

7
Results 142
The growth of human ovarian follicles 143
Detailed quantitative data sets on the growth of human follicles and on the expansion of the different 144
compartments are available. The thickness of the granulosa cell layer and the follicular volume are the 145
most important compartments in our model and detailed knowledge of their expansion (Gougeon, 146
1986, McNatty, 1981) allows us to simulate the regulatory network on a 3-dimensional axisymmetric 147
follicular domain (Figure 1B) with realistic tissue layer sizes rather than on an idealized, linearly 148
expanding 1D-domain, as was the case in our previous bovine model (Iber and Geyter, 2013). The 149
thickness of the theca and the size of the COC have not been reported over time. However, the exact 150
thickness of the theca does not impact on our model predictions because the theca is vascularised by 151
blood capillaries. Therefore, the hormone concentrations in this layer are considered to directly reflect 152
the serum hormone concentrations and to not be affected significantly by reaction and diffusion 153
processes in this layer. In line with previous reports we will use 100 µm for the thickness of the theca 154
throughout follicular development (Singh and Adams, 2000). The diameter of the mature COC at 155
ovulation is about 3 mm. While the COC is well known to expand during follicle maturation we have 156
not found detailed size measurements at earlier stages, and we therefore assume that the diameter of 157
the COC expands at a similar rate as that of the follicle. 158
159
The preovulatory phase starts at a follicle diameter of around 5 mm and ends after around 14 days at 160
25 mm (Gougeon, 1986). The growth rate remains grossly constant which implies vF = 1.74 x 10⁻⁵ 161
mm s−1 as growth rate of the follicle diameter. Both the volume of the follicular fluid (Figure 2A) and 162
the number of granulosa cells (Figure 2B) have been reported for the entire preovulatory phase 163
(Gougeon, 1986, McNatty, 1981). The follicle is about spherical (Figure 1B,C) and we can therefore 164
use the relation VFF = 4/3πrFF 3 to convert the follicular fluid volume VFF into the radius of the 165
follicular fluid compartment, rFF (Figure 2C). We note that the radius and follicular volume obtained 166

8
with such a spherical approximation are very close to the measured data (compare measurements 167
(dots) and spherical approximation (solid lines) in Figure 2A,C). The volume of human ovarian 168
granulosa cells has been determined as VC = 1140 µm3 (Dhar, et al., 1996). By multiplying the number 169
of granulosa cells with the cell volume we obtain the volume of the granulosa layer. Using again the 170
spherical shape of the follicle we note that the volume of the granulosa layer is VG = 4/3π(rG3 − rFF
3) 171
where rG = rF + sG is the combined radius of follicular fluid and granulosa layer and sG is the thickness 172
of the granulosa layer. We can thus calculate the thickness sG of the granulosa layer at different 173
follicle sizes and find that the granulosa thickness is 45±10 µm throughout follicular development 174
(Figure 2D). Finally we can use the growth rate vF to relate the follicle diameter to developmental 175
time (Figure 2E, F). Again we stress that the approximations fit the measured data very well as 176
evident by comparing the measurements (dots) and spherical approximation (solid lines) in Figure 177
2A-F. 178
179
The conversion of the measured diameters and cell numbers and volumes permits us to approximate 180
the radii of the different compartments in our simulations over time (Figure 2G). The growth kinetics 181
are described by six parameter values, as listed in Table S1. The geometry of the follicle used for 182
modeling the 3D-follicle (Figure 1B) has a rotational axis of symmetry going through the center of 183
follicle and the center of COC (Figure 2H). It should be noted that only the follicular fluid and the 184
COC layers expand at speed vF; the thickness of the thecal and granulosa cell layers do not change 185
over time (Figure 2D,F) and the endpoints are thus only shifted as the follicular fluid and COC 186
expand together (Figure 2G). The final diameter of the cumulus oocyte complex is 3 mm in the 187
model. 188
A model for human folliculogenesis 189
Building on our model for bovine folliculogenesis (Iber and Geyter, 2013), we next sought to develop 190
a model for the regulatory network that controls the development of the dominant human ovarian 191

9
follicle in the preovulatory phase, aiming at integrating the known core regulatory interactions into a 192
consistent framework. We formulated the model as a set of isotropic advection-reaction-diffusion 193
equations that describe the regulatory interactions of the hormones FSH (F), LH (L), androgens (A), 194
and oestradiol (E) as well as of IGF signalling (I). The ligands can diffuse inside the entire follicle, 195
while their receptors are restricted to cells, thus diffuse at much lower speeds (Table S1) and cannot 196
diffuse between the different tissue layers or in the follicular fluid (Figure 1A,B). Previous studies 197
have successfully described the in vivo distribution of diffusible signalling molecules with continuous 198
reaction-diffusion equations on a domain with a length scale as small as 10 cells (Iber and Zeller, 199
2012), and we therefore expect that the ligands in our model can also be adequately described by 200
continuous reaction-diffusion equations. The receptors are more of a concern as these are restricted to 201
cells and their diffusion is thus limited by the cell boundaries in the tissue. We have previously noted 202
that during the receptor half-life receptors can diffuse over distances of less than the diameter of one 203
epithelial cell (Menshykau, et al., 2012). For simplicity, we therefore also use continuous reaction-204
diffusion equations for the receptors. 205
The modelled core network regulating the development of the follicle is shown in Figure 1C and the 206
reaction terms are listed in the Supplementary Material. In the mathematical formulation we consider 207
four types of reactions: complex formation at rate kon and complex dissolution at rate koff, linear decay 208
at rate δ ci, where ci refers to the concentration of the component i, and production at a constant rate ρ 209
or at a modulated rate ρ f(σ(ci ,Ki)). Here the σ term indicates a Hill function 210
211
!! =!!!
!!!!!!
! , 212
213
with Hill constant Ki , which specifies the concentration of ci where half-maximal activity is observed, 214
and Hill coefficient n which defines the steepness of the response; we are using n = 2 throughout. The 215
Hill functions can be used in different combinations to either specify activating influences, or by 216

10
using 1 – σi for inhibitory impacts of ci. The regulatory interactions along with the evidence have 217
been discussed previously (Iber and Geyter, 2013). In brief, the following regulatory interactions are 218
included in the model: FSH and LH, secreted by the pituitary gland and transported through the blood, 219
move through the endothelium and sub-endothelial basal lamina of the thecal vasculature into the 220
thecal layer of the follicle (Rodgers and Irving-Rodgers, 2010) and bind their receptors to form FSH 221
and LH receptor ligand complexes (Fig. 1C, arrows (abbreviated as A# in the following) 1 and 2). 222
FSH-receptor is constitutively expressed in granulosa and COC and its expression can be induced by 223
signalling interactions in all tissue layers. FSH- and LH-signalling reduces the stability of the FSH 224
and LH receptor mRNA (A3, A4) (Nair, et al., 2002, Schwall and Erickson, 1984, Themmen, et al., 225
1991), supports IGF signalling (A5) and enhances the production of androgens (A6) (Bao and 226
Garverick, 1998), as well as the production and activity of aromatase (A7) (Erickson, Wang and 227
Hsueh, 1979, Silva and Price, 2002), the enzyme that catalyses androgens into oestradiol (A8). 228
Production of androgens is restricted to the theca, while its conversion to oestradiol is restricted to 229
granulosa and COC. Oestradiol binds to its receptor, forming an oestrogen receptor-ligand complex 230
(A9). Oestrogen signalling enhances the production of aromatase (A10), as well as the production of 231
the receptors for FSH (A11), LH (A12), and oestradiol (A13) (Couse, et al., 2005, Richards, 1975, 232
Sharma, et al., 1999). IGF signalling is necessary for the gonadotropin-dependent expression of 233
aromatase (A14) (Silva and Price, 2002), enhances the production of FSH and LH receptors (A15, 234
A16) (Hirakawa, et al., 1999, Minegishi, et al., 2000) and reduces oestrogen receptor beta expression 235
(A17). We aimed at developing a parsimonious model with the simplest possible set of regulatory 236
interactions that reproduce the measurements. Aromatase is therefore not explicitly included because 237
its activity can well be approximated as the direct result of IGF signalling and of the regulation 238
through FSH and LH. 239
The reaction terms are identical to those used in the bovine model (Iber and Geyter, 2013) except for 240
two new regulatory interactions that had to be added to the human model to account for a marked 241
difference in the bovine and human gene expression data. Thus, in the human granulosa cells FSH-242

11
receptor expression is high in small follicles (6 mm) and subsequently decreases (Jeppesen, 243
Kristensen, Nielsen, Humaidan, Dal Canto, Fadini, Schmidt, Ernst and Yding Andersen, 2012), 244
whereas in bovine follicles FSH-receptor expression is lower and increases during follicular growth 245
(Bao and Garverick, 1998, Xu, Garverick, Smith, Smith, Hamilton and Youngquist, 1995). To 246
account for this difference we needed to introduce a previously neglected negative feedback of 247
gonadotropin signalling on FSH- and LH-receptor expression (Figure 1C, A3,A4) and increase the 248
rate of FSH/LH/oestradiol-independent FSH-receptor expression, as described in the Supplementary 249
Material. 250
We initiate the model without any hormones, receptors and hormone-receptor complexes, because we 251
want to study the mechanisms that result in the emergence of the characteristic gene expression 252
patterns in the follicle. We note that other homogenous initial conditions within the physiological 253
range do not affect our model predictions. The only exception is the initial concentration of the IGF-254
signalling complex in the theca, which is important to reproduce the early expression of LH-receptors 255
in the theca. 256
257
Model consistency with human data 258
Even though the model has 35 kinetic parameters and 6 growth parameters it is very well constrained 259
(Table S1). We discussed the data-based derivation of the growth parameters in the previous section. 260
The first 28 kinetic parameters values in Table S1 are the same as in the bovine model and all but two 261
of these parameter values have been directly measured, sometimes in several independent 262
experiments; two parameter values were previously established in the bovine model based on gene 263
expression data (Iber and Geyter, 2013). The remaining seven parameter values had to be changed to 264
account for the differences in the measured gene expression time courses and steroid concentrations in 265
women and cattle. Thus the androgen concentration is higher in human than in bovine follicles 266
whereas the oestradiol concentration is lower (Bao and Garverick, 1998, Jeppesen, Kristensen, 267
Nielsen, Humaidan, Dal Canto, Fadini, Schmidt, Ernst and Yding Andersen, 2012, Xu, Garverick, 268

12
Smith, Smith, Hamilton and Youngquist, 1995). The reported human concentration ranges are shown 269
in Fig. 3A as shadings. To reproduce the human follicular androgen concentration the androgen 270
production rate ρA had to be increased fourfold. To reproduce the measured human oestrogen 271
concentration the Hill constant for IGF-‐dependent regulatory processes, KI, had to be lowered. The 272
FSH-receptor expression has been found to decrease over time (Jeppesen, Kristensen, Nielsen, 273
Humaidan, Dal Canto, Fadini, Schmidt, Ernst and Yding Andersen, 2012). The LH and FSH receptor 274
mRNAs have previously been reported to be destabilized in response to gonadotropin receptor 275
dependent signalling (Nair, Kash, Peegel and Menon, 2002, Schwall and Erickson, 1984, Themmen, 276
Blok, Post, Baarends, Hoogerbrugge, Parmentier, Vassart and Grootegoed). To achieve such a 277
negative feedback (Figure 1C, arrows 3,4) the signalling threshold KF had to be lowered (Figure 3B). 278
Since both FSH and LH-receptors are G-protein-coupled receptors that link to the same signalling 279
machinery (Richards, et al., 2002, Wood and Strauss) we now use equal thresholds for FSH and LH 280
signalling, i.e. KL = KF. To still obtain similar LH-receptor expression levels we had to increase the 281
production rate for the IGF receptor complex, ρI, some 5-fold. Finally, there is an FSH/LH/oestrogen-282
independent regulation of FSH-receptor expression in granulosa and COC (Couse, Yates, Deroo and 283
Korach, 2005, Zhou, et al., 1997), which we assume has a constant activity !G and !COC. This value 284
had to be increased in the granulosa to achieve a high initial rate of FSH-receptor expression that can 285
then decrease as a result of the negative feedback (Figure 3B). The activity in the COC, !COC, had to 286
be lowered to limit the total receptor concentration to a physiologically realistic range. With these 287
changes, the measured gene expression rates for FSH- and LH- receptors as well as for aromatase are 288
well reproduced (Figure 3B) and the total LH receptor concentration remains below 3 nM (Figure 3C) 289
as measured in experiments (Erickson, Wang and Hsueh, 1979). 290
291
Spatiotemporal dynamics of the regulatory network in the follicle 292
With the model and parameters all set we first simulated the physiological situation of follicle 293
maturation in healthy women. The human serum levels of FSH and LH change during the menstrual 294
cycle (Brindle, et al., 2006) and we used the measured FSH ad LH concentrations as the thecal 295

13
gonadotropin concentrations (Figure 4A,B). The simulations show how the hormones enter the 296
follicle from the theca by diffusion, and how the concentration increases slowly inside the follicle 297
(Figure 4C,D). Interestingly, also the final hormone concentrations in the follicular fluid are much 298
lower than in the serum (Figure 4C,D, solid lines). This is the result of hormone sequestration in the 299
membrana granulosa by receptor binding (Figure 4E,F). We notice that most FSH is bound in the 300
granulosa layer (Figure 4E, white layer), while most LH is bound in the theca (Figure 4F, dark grey 301
layer), and some less in the granulosa (Figure 4F, white layer). These distributions are also in good 302
agreement with the reported expression patterns of FSH- and LH-receptors (Figure 4G,H). Thus FSH-303
receptors are mainly expressed in the membrane granulosa (Rhind, et al., 1992), while LH-receptors 304
are initially expressed mainly in the theca and later also in the granulosa (Bao and Garverick, 1998, 305
Xu, Garverick, Smith, Smith, Hamilton and Youngquist, 1995). As a result of hormone sequestration 306
little FSH and LH reaches the COC (Figure 4E,F, lightly shaded layer) and little receptor is expressed, 307
which agrees well with the measured low receptor expression rates in the COC (Assou, et al., 2006, 308
Eppig, et al., 1997, Jeppesen, Kristensen, Nielsen, Humaidan, Dal Canto, Fadini, Schmidt, Ernst and 309
Yding Andersen, 2012). In the follicular fluid, hormones have a uniform concentration because they 310
are mixed rapidly as compared to the timescale of development due to convection with moving fluid 311
(Figure 4C,D, grey-shaded area). 312
313
Sensitivity to parameter values and initial conditions 314
While the parameter values are all based on experimental measurements (Table S1), these 315
measurements were carried out in a range of different systems and may suffer from experimental 316
errors and inaccuracies. We therefore checked the robustness of the observed concentration difference 317
between serum and follicular fluid to changes in the parameter values. To that end we re-simulated 318
our model with parameter values that were drawn from a Gaussian distribution with mean value as 319
given in Table S1 and relative standard deviation 0.1. The standard deviation of the simulations at the 320
final time point (day 14, depicted as grey shadow in Figure 4C-F) demonstrates little impact of such 321
deviations in the parameter values on the relative FSH and LH concentrations between serum and 322

14
follicular fluid (Figure 4C,D). We, however, noted considerable variance in the extent to which FSH- 323
or LH-bound receptor complexes emerge in the theca (Figure 4E,F). 324
To identify the parameters with the largest impact on the relative gonadotropin concentration in 325
follicular fluid and serum we carried out a sensitivity analysis. Here we calculated the relative change 326
in the FSH concentration ratio (referred to as Ratio) in the two compartments in response to a 1% 327
change in the parameter values pi, i.e. 328
! =∆!"#$%
!"#$%∆!! !!
.
Figure 5 includes all parameters for which S > 0.001. We note that the largest impact is observed for 329
the gonadotropin diffusion coefficient DH, the FSH receptor production rates ρFR , ρFRG, and ρFRcoc, the 330
decay rate of the FSH-receptor complex δFRc, and the FSH response threshold KFR. This further 331
supports the observation that the gonadotropin concentration difference between serum and follicular 332
fluid results from receptor-dependent sequestration in the theca and granulosa (Figure 4E,F). The 333
initial conditions on the other hand have little impact, as long as they are homogenous in space. 334
335
Concentration differences between the serum and the follicular fluid as a result of hormone 336
sequestration in the granulosa cell layer 337
The predicted concentration differences between serum and follicular fluid are evident already in 25-338
year old published data (Stone, Serafini, Batzofin, Quinn, Kerin and Marrs, 1988). However, since 339
these concentration differences have received no prior attention and are central to the predictions of 340
the present model, we sought to confirm these concentration differences between serum and follicular 341
fluid by measuring the FSH, LH, and hCG concentrations in women. Thus, we assayed the hormone 342
concentrations in the first aspirated left and right follicle of eight infertile patients undergoing oocyte 343
retrieval for assisted reproduction and in their serum. These patients were treated with exogenous 344
human menopausal gonadotropins or with recombinant FSH and had received one single 345
subcutaneous bolus injection of human urinary chorionic gonadotropin (hCG) for ovulation induction, 346
a substitute for LH with a longer serum half-life, but with a receptor-dependent turn-over rate of hCG 347

15
similar to that of LH (Nakamura, et al., 2000). To compare the measured values to the simulations we 348
converted the reported IU/l units into SI units using the following conversion factors: 1 IU/l FSH = 349
1.5 nM FSH, 1 IU/l LH = 0.75 nM (Olivares, et al., 2000) and 1IU/l hCG = 2.88 pM hCG (Stenman, 350
2004). We subsequently combined the measured LH and hCG concentrations as both proteins bind to 351
the LH receptor with comparable affinity. As predicted by the model we find a much lower FSH and 352
LH/hCG concentration in the follicular fluid compared to the serum (Figure 6A,B). As predicted by 353
the model we find much lower concentrations of FSH, LH and hCG in the follicular fluid as compared 354
to the serum (Figure 6A,B). During ovarian hyperstimulation the patients received different daily 355
doses of FSH and LH, and we note that the differences between serum and follicular fluid 356
concentrations decreases as the serum gonadotropin levels increase (Figure 6A,B). We checked 357
whether we would obtain a similar saturation effect in the model, and we indeed obtain a similar 358
result in the model (Figure 6C,D). For ease of comparison we include the line that best fitted the 359
experimental data in the simulation plots. This line aligns well with the simulated predictions (Figure 360
6C,D). 361
362
Diffusion-based limits in granulosa cell layer thickness can explain scaling of follicle size 363
with species weight 364
It has long been noticed that the size of follicles scales with the average species size (Table 1, Figure 365
7A) (Gosden and TELFER, 1987). It has been argued that this serves to increase the volume of the 366
granulosa, and thus hormone production (Gosden and TELFER, 1987), but it has remained unclear 367
why the volume of the granulosa would be increased via an expansion of the fluid-filled antrum rather 368
than by a thickening of the granulosa layer. We used our parameterized model to explore the impact 369
of increasing either the size of the fluid-filled antrum (as observed in nature) or the thickness of the 370
granulosa on the oestradiol production. When we analyse the oestradiol production during follicle 371
development relative to the surface area of the follicle (while keeping the thickness of the granulosa 372
and the diameter of the COC constant) we observe a linear relationship (Figure 7B, slope 0.991+/-373
0.002, R2=0.99996), much as is observed in the differently sized species (Figure 7A, slope 1.02 +/-374

16
0.08, R2=0.885). Assuming that heavier animals require more oestrogens because their blood volume 375
increases in parallel to body mass, the present analysis suggests that larger follicles can provide the 376
required higher oestradiol levels by accommodating more granulosa cells in the granulosa layer lining 377
the follicular wall. 378
379
We next analysed the alternative option of increasing the thickness of the granulosa cell layer. We 380
find, that even if the thickness of the granulosa is strongly increased (while keeping the diameters of 381
the follicle and of the COC constant), the total production of oestradial rises by at most threefold., 382
presumably because, as the thickness of the granulosa cell layer increases, insufficient gonadotropins 383
and androgen precursors reach the inner part of the granulosa layer, thereby limiting the activity of 384
aromatase. A tenfold decrease in granulosa thickness on the other hand, reduces the oestradiol 385
concentration to almost zero (Figure 7C). A further limitation in altering oestradiol production via the 386
granulosa thickness results from the follicular gonadotropin concentration: a fourfold increase in the 387
thickness of the granulosa layer reduces the intrafollicular gonadotropin concentration to almost zero, 388
while a reduction in granulosa thickness doubles the follicular gonadotropin concentration (Figure 389
7C). There is therefore little room for the up-regulation of the oestradiol production by increasing the 390
granulosa thickness without affecting other processes. In summary, larger animals require the 391
production of more oestradiol to achieve the same oestradiol serum concentration despite their higher 392
blood circulation volumes, but this necessity cannot be accommodated by increasing the thickness of 393
the granulose cell layer. Instead, their follicles need to become larger to accommodate more granulosa 394
cells in a layer with similar thickness. 395
Gonadotropins are sequestered by their receptors, and polymorphisms in the α-oestrogen and the 396
FSH-receptor genes have been associated with infertility (M'rabet, et al., 2012, Perez Mayorga, 397
et al., 2000). The detailed biochemical impact of the changes in the FSH-receptor gene is not known 398
but it has previously been noticed that reduction in binding capacity (NOT affinity) of LH- and FSH-399
receptor results in severe defects (Aittomäki, et al., 1995). While changes in the LH- and FSH-400
receptor expression levels have a much milder effect in the model than altering the granulosa cell 401

17
layer thickness, a tenfold change in receptor expression rates still raises the levels of FSH and of 402
oestradiol (but not of LH) in the follicular fluid by about twofold (Figure 7D), thus potentially 403
providing a mechanistic explanation for the observed clinical effects of the polymorphisms. 404
Finally, we note that variations in granulosa cell layer thickness within a species are likely to lead to 405
disease as the hormone balance will be altered and the system is not self-correcting. Thus, a thicker 406
granulosa layer will result in a reduced intrafollicular FSH concentration and a higher oestradiol 407
concentration; the higher oestradiol concentration will down-regulate the release of FSH from the 408
pituitary, thus further reducing the serum FSH-concentration (Figure 7C). Infertile women are often 409
treated with exogenous FSH to stimulate ovarian function thereby increasing the proliferation of 410
granulosa cells and circulating levels of oestradiol. We therefore tested whether the observed defects 411
could be alleviated by adding FSH. To that end we increased and decreased the granulosa cell layer 412
width and FSH-concentrations in parallel (Figure 7E). Raising the FSH-concentration in the serum 413
compensates only for minor thickening of the granulosa. As the granulosa cell layer reaches 7-fold its 414
normal thickness FSH may no longer reach the follicular fluid and therefore not reach the enclosed 415
COC, even if additional external FSH is applied. In contrast, compensation by exogenous 416
gonadotropins would be successful in case of increased FSH-receptor expression levels (Figure 7D.). 417
418
419
Discussion 420
Growth of the ovarian follicle is mainly driven by the expansion of a fluid-filled cavity, the antrum. 421
Follicular size is a key marker of successful follicular development, and sonographic measurement of 422
follicular size is the single most reliable parameter for clinical decision making in ovarian 423
hyperstimulation. Despite its eminent importance in the monitoring of ovarian follicular growth, no 424
direct role of the antrum has, however, so far been identified, and it is also an open question why the 425
size of the antrum (and thus that of the follicle) differs to such an extent among different species. 426
427

18
By analysing published data on granulosa cell expansion and by computing the 4D-spatiotemporal 428
events during follicular growth we demonstrate that the massive expansion of the follicle from a 429
diameter of 5 mm to 2 cm within 10-14 days is entirely driven by an increase of the volume of the 430
follicular fluid, while the thickness of the granulosa cell layer remains constant at about 45±10 µm, 431
even though granulosa cells strongly proliferate (Figure 2). A similar thickness (~50 µm) of the 432
granulosa cell layer has also been observed in other species, i.e. bovine (van Wezel, et al., 1999), goat 433
and sheep (Mohammadpour, 2007). Based on the measured kinetic constants we predict that 434
granulosa cells sequester gonadotropins as they diffuse from the peripheral blood circulation into the 435
follicular antrum (Figure 4,5) and we confirm the existence of a FSH- and LH-concentration gradient 436
between the serum and the follicular fluid (Figure 6). Based on these calculations, we conclude that a 437
thicker granulosa cell layer would sequester and deplete important signalling factors, including FSH, 438
delivered from the blood circulation towards the COC (Figure 7). 439
440
The fluid-filled follicular antrum determines the surface area of the follicle and thereby the volume of 441
the oestrogen-secreting granulosa cell layer. In mono-ovulatory species, the appropriate serum 442
concentration of oestrogens is crucial for the selection of the dominant follicle through the fine-tuning 443
of the FSH-secretion in the pituitary (Xu, Garverick, Smith, Smith, Hamilton and Youngquist, 1995). 444
Due to their copious circulating blood volume, larger animals require the production of more 445
oestrogen and hence more granulosa cells to achieve the same modulatory effects in the pituitary. 446
Increasing the size of the antrum in large animals allows for the expansion of the volume of the 447
granulosa cell layer (and thus the production of more oestrogens) without increasing the thickness of 448
the granulosa cell layer. 449
450
In bovine follicles a thickness range of 40-100 µm has been reported for small antral follicles 451
(diameter ~5 mm), and a much narrower range (close to 50 µm) for later stages of follicular 452
development (van Wezel, Krupa and Rodgers, 1999). The observed variability may result from 453
differences in cell shape and from an uncorrelated proliferation of granulosa cells and antrum 454

19
expansion (Rodgers, et al., 2001). According to our model, a narrow range of thickness of the 455
granulosa cell layer is important, because a thin granulosa cell layer would fail to produce sufficient 456
amounts of oestrogens to downregulate FSH secretion in the pituitary, while a thicker granulosa cell 457
layer, while producing more oestradiol, would result in insufficient intrafollicular LH and FSH 458
signalling due to limited diffusion (Figure 7). In addition, higher oestrogen levels would potentially 459
prematurely lower the secretion of FSH by the pituitary and thereby additionally compromise the 460
development of the oocyte in the COC. The small variability of granulosa cell layer thickness during 461
the later stages of follicular development may thus derive from the sensitive impact of the oestradiol-462
producing granulosa cell layer on the delicate balance between the acquisition of follicular dominance 463
and atresia of follicles. 464
465
In assisted reproductive medicine, the addition of exogenous hormones during ovarian 466
hyperstimulation not only increases the number of growing follicles but also raises the oestrogen 467
levels per mature follicle and the proliferation rate of the granulosa cells, in particular in those cases 468
with high follicle numbers (Attaran, et al., 1998, Chanchal Gupta, 2012, De Geyter, et al., 1992). As a 469
result, exaggerate thickening of the mural granulosa cell layer may block the diffusion of 470
gonadotropins and other hormones to the COC. During final follicular development, these constraints 471
may be compensated to some extent by the increased formation of perifollicular capillaries. 472
Interestingly, increased density of blood capillaries in the theca after wedge resection has been shown 473
to revert the ovulatory function of polycystic ovaries due to enhanced delivery of FSH to the 474
granulosa (Inzunza, et al., 2007). Moreover, earlier reports show that increasing the doses 475
of gonadotropins during ovarian hyperstimulation (step-up regimen) results in more collected oocytes 476
(Christin-Maitre et al., 2003), while lower numbers of oocytes are collected if the administration of 477
FSH is withheld at the end of follicular development, as in prolonged coasting (D’Angelo et al., 478
2011). 479
480

20
Data-based, validated computational models of biomedical processes are still rare, but they are likely 481
to become invaluable tools to define the molecular causes of disease and to develop novel and 482
individual therapeutic approaches that respect the complex regulatory logic of biological systems. 483
Currently, in clinical reproductive medicine, the choice of the daily FSH-dosage to be administered is 484
exclusively based on a quantitative assessment of ovarian reserve, as given by the antral follicle count 485
or the concentration of the anti-Muellerian hormone in the serum, but not on the FSH-receptor density 486
or the capacity of the granulosa cells to proliferate. Mathematical models encompassing individual 487
differences in receptor densities and activity may help to understand these effects in individual 488
patients during ovarian hyperstimulation and perhaps assist in designing appropriate treatment 489
modalities in each case prospectively. 490
491
492
Author contributions 493
DI and CDG designed the study; MB, DM, and DI carried out the analysis; DI, CDG, DM wrote the 494
paper; all authors approved the final manuscript. 495
496
497
Funding 498
This work was supported by the Repronatal Foundation, Basel Switzerland. 499

21
Reference list 500
Adams GP, Singh J and Baerwald AR. Large animal models for the study of ovarian 501 follicular dynamics in women. Theriogenology 2012. 502 Aerts JMJ and Bols PEJ. Ovarian follicular dynamics: a review with emphasis on the 503 bovine species. Part I: Folliculogenesis and pre-‐antral follicle development. 504 Reproduction in domestic animals = Zuchthygiene 2010; 45:171-‐179. 505 Aittomäki K, Lucena JL, Pakarinen P, Sistonen P, Tapanainen J, Gromoll J, Kaskikari R, 506 Sankila EM, Lehväslaiho H, Engel AR et al. Mutation in the follicle-‐stimulating hormone 507 receptor gene causes hereditary hypergonadotropic ovarian failure. Cell 1995; 82:959-‐508 968. 509 Assou S, Anahory T, Pantesco V, Le Carrour T, Pellestor F, Klein B, Reyftmann L, 510 Dechaud H, De Vos J and Hamamah S. The human cumulus-‐-‐oocyte complex gene-‐511 expression profile. Human reproduction (Oxford, England) 2006; 21:1705-‐1719. 512 Attaran M, Frasor J, Mascha E, Radwanska E and Rawlins RG. The relationship of human 513 granulosa-‐lutein cell proliferative index to follicular diameter and serum estradiol. 514 Obstetrics and gynecology 1998; 91:449-‐453. 515 Aurich C. Reproductive cycles of horses. Animal Reproduction Science 2011; 124:220-‐516 228. 517 Bao B and Garverick HA. Expression of steroidogenic enzyme and gonadotropin 518 receptor genes in bovine follicles during ovarian follicular waves: a review. Journal of 519 animal science 1998; 76:1903-‐1921. 520 Bravo PW, Stabenfeldt GH, Lasley BL and Fowler ME. The effect of ovarian follicle size 521 on pituitary and ovarian responses to copulation in domesticated South American 522 camelids. Biology of reproduction 1991; 45:553-‐559. 523 Brindle E, Miller RC, Shofer JB, Klein NA, Soules MR and O'Connor KA. Urinary 524 beta-‐luteinizing hormone and beta-‐follicle stimulating hormone immunoenzymometric 525 assays for population research. Clinical biochemistry 2006; 39:1071-‐1079. 526 Carin M. Numerical Simulation of Moving Boundary Problems with the ALE Method: 527 Validation in the Case of a Free Surface and a Moving Solidification Front. Excert from 528 the Proceedings of the COMSOL Conference 2006. 529 Chanchal Gupta TCYCPSSSKL. Differential response to sustained stimulation by hCG 530 & LH on goat ovarian granulosa cells. The Indian Journal of Medical Research 2012; 531 135:331. 532 Chiou CM, Yang TS, Yeh SP and Tsai MZ. Changes in number of granulosa cells, follicular 533 fluid levels and diameter of oocytes during folliculogenesis in pre-‐pubertal gilts at 534 marketing weight. … JOURNAL OF ANIMAL … 2004. 535 Couse JF, Yates MM, Deroo BJ and Korach KS. Estrogen receptor-‐beta is critical to 536 granulosa cell differentiation and the ovulatory response to gonadotropins. 537 Endocrinology 2005; 146:3247-‐3262. 538 Cutress IJ, Dickinson EJF and Compton RG. Analysis of commercial general engineering 539 finite element software in electrochemical simulations. J Electroanal Chem 2010; 540 638:76-‐83. 541 De Geyter C, De Geyter M, Schneider HP and Nieschlag E. Interdependent influence of 542 follicular fluid oestradiol concentration and motility characteristics of spermatozoa on 543 in-‐vitro fertilization results. Human reproduction (Oxford, England) 1992; 7:665-‐670. 544 Dhar A, Dockery P, O WS, Turner K, Lenton EA and Cooke ID. The human ovarian 545 granulosa cell: a stereological approach. Journal of anatomy 1996; 188 ( Pt 3):671-‐676. 546

22
Eppig JJ, Wigglesworth K, Pendola F and Hirao Y. Murine oocytes suppress expression of 547 luteinizing hormone receptor messenger ribonucleic acid by granulosa cells. Biology of 548 reproduction 1997; 56:976-‐984. 549 Erickson GF, Wang C and Hsueh AJ. FSH induction of functional LH receptors in 550 granulosa cells cultured in a chemically defined medium. Nature 1979; 279:336-‐338. 551 Evans ACO. Characteristics of ovarian follicle development in domestic animals. 552 Reproduction in domestic animals = Zuchthygiene 2003; 38:240-‐246. 553 Germann P, Menshykau D, Tanaka S and Iber D. Simulating Organogensis in COMSOL 554 Proceedings of COMSOL Conference 2011. 2011. 555 Gloaguen P, Crépieux P, Heitzler D, Poupon A and Reiter E. Mapping the follicle-‐556 stimulating hormone-‐induced signaling networks. Frontiers in endocrinology 2011; 557 2:45. 558 Gosden RG and TELFER E. Scaling of follicular sizes in mammalian ovaries. Journal of 559 Zoology 1987; 211:157-‐168. 560 Gougeon A. Dynamics of follicular growth in the human: a model from preliminary 561 results. Human reproduction (Oxford, England) 1986; 1:81-‐87. 562 Griffin J, Emery BR, Huang I, Peterson CM and Carrell DT. Comparative analysis of 563 follicle morphology and oocyte diameter in four mammalian species (mouse, hamster, 564 pig, and human). Journal of experimental & clinical assisted reproduction 2006; 3:2. 565 Hermes R, Göritz F and Streich WJ. Assisted reproduction in female rhinoceros and 566 elephants–current status and future perspective. … in Domestic Animals 2007. 567 Hirakawa T, Minegishi T, Abe K, Kishi H, Ibuki Y and Miyamoto K. A role of insulin-‐like 568 growth factor I in luteinizing hormone receptor expression in granulosa cells. 569 Endocrinology 1999; 140:4965-‐4971. 570 Iber D and Geyter CD. Computational modelling of bovine ovarian follicle development. 571 Bmc Systems Biology 2013; 7:60. 572 Iber D and Zeller R. Making sense-‐data-‐based simulations of vertebrate limb 573 development. Curr Opin Genet Dev 2012; 22:570-‐577. 574 Inzunza J, Morani A, Cheng G, Warner M, Hreinsson J, Gustafsson J-‐A and Hovatta O. 575 Ovarian wedge resection restores fertility in estrogen receptor beta knockout (ERbeta-‐576 /-‐) mice. Proceedings of the National Academy of Sciences of the United States of America 577 2007; 104:600-‐605. 578 Izumi T, Sakakida S, Muranishi Y and Nagai T. Allometric study on the relationship 579 between the growth of ovarian follicles and oocytes in domestic cats. The Journal of 580 reproduction and development 2012; 58:484-‐489. 581 Jeppesen JV, Kristensen SG, Nielsen ME, Humaidan P, Dal Canto M, Fadini R, Schmidt KT, 582 Ernst E and Yding Andersen C. LH-‐Receptor Gene Expression in Human Granulosa and 583 Cumulus Cells from Antral and Preovulatory Follicles. The Journal of clinical 584 endocrinology and metabolism 2012; 97:E1524-‐1531. 585 Kumar TR, Wang Y, Lu N and Matzuk MM. Follicle stimulating hormone is required for 586 ovarian follicle maturation but not male fertility. Nat Genet 1997; 15:201-‐204. 587 Lueders I, Taya K, Watanabe G, Yamamoto Y, Yamamoto T, Kaewmanee S, Niemuller C, 588 Gray C, Streich WJ and Hildebrandt TB. Role of the double luteinizing hormone peak, 589 luteinizing follicles, and the secretion of inhibin for dominant follicle selection in Asian 590 elephants (Elephas maximus). Biology of reproduction 2011; 85:714-‐720. 591 M'rabet N, Moffat R, Helbling S, Kaech A, Zhang H and de Geyter C. The CC-‐allele of 592 the PvuII polymorphic variant in intron 1 of the α-‐estrogen receptor gene is 593

23
significantly more prevalent among infertile women at risk of premature ovarian aging. 594 Fertility and sterility 2012. 595 Manjunatha BM, Pratap N, Al-‐Bulushi S and Hago BE. Characterization of ovarian 596 follicular dynamics in dromedary camels (Camelus dromedarius). Theriogenology 2012; 597 78:965-‐973. 598 McNatty KP. Hormonal correlates of follicular development in the human ovary. 599 Australian journal of biological sciences 1981; 34:249-‐268. 600 Menshykau D and Iber D. Simulating Organogenesis with Comsol: Interacting and 601 Deforming Domains Proceedings of COMSOL Conference 2012 2012. 602 Menshykau D, Kraemer C and Iber D. Branch Mode Selection during Early Lung 603 Development. Plos Computational Biology 2012; 8:e1002377. 604 Minegishi T, Hirakawa T, Kishi H, Abe K, Abe Y, Mizutani T and Miyamoto K. A role of 605 insulin-‐like growth factor I for follicle-‐stimulating hormone receptor expression in rat 606 granulosa cells. Biology of reproduction 2000; 62:325-‐333. 607 Mohammadpour AA. Comparative histomorphological study of ovary and ovarian 608 follicles in Iranian Lori-‐Bakhtiari sheep and native goat. Pakistan journal of biological 609 sciences: PJBS 2007; 10:673-‐675. 610 Nair AK, Kash JC, Peegel H and Menon KMJ. Post-‐transcriptional regulation of luteinizing 611 hormone receptor mRNA in the ovary by a novel mRNA-‐binding protein. The Journal of 612 biological chemistry 2002; 277:21468-‐21473. 613 Nakamura K, Liu X and Ascoli M. Seven non-‐contiguous intracellular residues of the 614 lutropin/choriogonadotropin receptor dictate the rate of agonist-‐induced 615 internalization and its sensitivity to non-‐visual arrestins. The Journal of biological 616 chemistry 2000; 275:241-‐247. 617 Olivares A, Cárdenas M, Timossi C, Zariñán T, Díaz-‐Sánchez V and Ulloa-‐Aguirre A. 618 Reactivity of different LH and FSH standards and preparations in the world health 619 organization matched reagents for enzyme-‐linked immunoassays of gonadotrophins. 620 Human reproduction (Oxford, England) 2000; 15:2285-‐2291. 621 Osteen KG and Mills TM. Changes in the size, distribution and steroid content of rabbit 622 ovarian follicles during early pseudopregnancy. Biology of reproduction 1980; 22:1040-‐623 1046. 624 Perez Mayorga M, Gromoll J, Behre HM, Gassner C, Nieschlag E and Simoni M. Ovarian 625 response to follicle-‐stimulating hormone (FSH) stimulation depends on the FSH 626 receptor genotype. The Journal of clinical endocrinology and metabolism 2000; 85:3365-‐627 3369. 628 Reynaud K, de Lesegno CV, Chebrout M, Thoumire S and Chastant-‐Maillard S. Follicle 629 population, cumulus mucification, and oocyte chromatin configuration during the 630 periovulatory period in the female dog. Theriogenology 2009; 72:1120-‐1131. 631 Rhind SM, Bramley TA, Wright IA and McMillen SR. FSH and LH receptor concentrations 632 in large ovarian follicles of beef cows in high and low levels of body condition at nine 633 weeks post partum. Reproduction, fertility, and development 1992; 4:515-‐522. 634 Richards JS. Estradiol receptor content in rat granulosa cells during follicular 635 development: modification by estradiol and gonadotropins. Endocrinology 1975; 636 97:1174-‐1184. 637 Richards JS and Pangas SA. The ovary: basic biology and clinical implications. The 638 Journal of clinical investigation 2010; 120:963-‐972. 639

24
Richards JS, Russell DL, Ochsner S, Hsieh M, Doyle KH, Falender AE, Lo YK and Sharma 640 SC. Novel signaling pathways that control ovarian follicular development, ovulation, and 641 luteinization. Recent progress in hormone research 2002; 57:195-‐220. 642 Rodgers RJ and Irving-‐Rodgers HF. Formation of the ovarian follicular antrum and 643 follicular fluid. Biology of reproduction 2010; 82:1021-‐1029. 644 Rodgers RJ, Irving-‐Rodgers HF, van Wezel IL, Krupa M and Lavranos TC. Dynamics of 645 the membrana granulosa during expansion of the ovarian follicular antrum. Molecular 646 and cellular endocrinology 2001; 171:41-‐48. 647 SANGHA GK and GURAYA SS. DNA, RNA and protein changes in rat ovarian follicles. Proc 648 Indian natn'$ ci Acad B55 No 1989. 649 Schwall RH and Erickson GF. Inhibition of synthesis of luteinizing hormone (LH) 650 receptors by a down-‐regulating dose of LH. Endocrinology 1984; 114:1114-‐1123. 651 Sharma SC, Clemens JW, Pisarska MD and Richards JS. Expression and function of 652 estrogen receptor subtypes in granulosa cells: regulation by estradiol and forskolin. 653 Endocrinology 1999; 140:4320-‐4334. 654 Silva JM and Price CA. Insulin and IGF-‐I are necessary for FSH-‐induced cytochrome P450 655 aromatase but not cytochrome P450 side-‐chain cleavage gene expression in oestrogenic 656 bovine granulosa cells in vitro. The Journal of endocrinology 2002; 174:499-‐507. 657 Simões J, Almeida JC, Valentim R, Baril G, Azevedo J, Fontes P and Mascarenhas R. 658 Follicular dynamics in Serrana goats. Animal Reproduction Science 2006; 95:16-‐26. 659 Singh J and Adams GP. Histomorphometry of dominant and subordinate bovine ovarian 660 follicles. The Anatomical Record 2000; 258:58-‐70. 661 Stenman U-‐H. Standardization of assays for human chorionic gonadotropin. Clinical 662 chemistry 2004; 50:798-‐800. 663 Stone BA, Serafini PC, Batzofin JH, Quinn P, Kerin JF and Marrs RP. Interrelationships 664 between plasma hormone levels and the content of total protein, gonadotropins and 665 steroid hormones in antral fluids of women undergoing in vitro fertilization. Fertility 666 and sterility 1988; 50:102-‐109. 667 Taneja M, Ali A and Singh G. Ovarian follicular dynamics in water buffalo. 668 Theriogenology 1996. 669 Themmen AP, Blok LJ, Post M, Baarends WM, Hoogerbrugge JW, Parmentier M, Vassart 670 G and Grootegoed JA. Follitropin receptor down-‐regulation involves a cAMP-‐dependent 671 post-‐transcriptional decrease of receptor mRNA expression. Molecular and cellular 672 endocrinology 1991; 78:R7-‐13. 673 Thummler V and Weddemann A. Computation of Space-‐Time Patterns via ALE Methods. 674 Excert from the Proceedings of the COMSOL Conference 2007. 675 van Wezel IL, Krupa M and Rodgers RJ. Development of the membrana granulosa of 676 bovine antral follicles: structure, location of mitosis and pyknosis, and 677 immunolocalization of involucrin and vimentin. Reproduction, fertility, and development 678 1999; 11:37-‐48. 679 Vetharaniam I, Peterson A and McNatty K. Modelling female reproductive function in 680 farmed animals. Animal reproduction … 2010. 681 Weddemann A and Thummler V. Stability Analysis of ALE-‐Methods for Advection-‐682 Diffusion Problems. Excert from the Proceedings of the COMSOL Conference 2008. 683 Wood JR and Strauss JF. Multiple signal transduction pathways regulate ovarian 684 steroidogenesis. Reviews in endocrine & metabolic disorders 2002; 3:33-‐46. 685 Xu Z, Garverick HA, Smith GW, Smith MF, Hamilton SA and Youngquist RS. Expression of 686 follicle-‐stimulating hormone and luteinizing hormone receptor messenger ribonucleic 687

25
acids in bovine follicles during the first follicular wave. Biology of reproduction 1995; 688 53:951-‐957. 689 Zhou J, Kumar TR, Matzuk MM and Bondy C. Insulin-‐like growth factor I regulates 690 gonadotropin responsiveness in the murine ovary. Molecular endocrinology (Baltimore, 691 Md) 1997; 11:1924-‐1933. 692 693

26
TABLES 694
Table I: The diameter of the mature follicle and characteristic weight in different mammalian species. 695
Follicle [mm] Weight [kg] Specie Ref
0.42 0.03 Mouse (Griffin, et al., 2006)
0.55 0.2-0.25 Albino Rat (SANGHA and GURAYA, 1989)
0.64 0.2 Hamster (Griffin, Emery, Huang, Peterson
and Carrell, 2006)
2.8 2.7 Rabbit (Osteen and Mills, 1980)
4 3 Cat (Izumi, et al., 2012)
6 9-10 Beagle (Dog) (Reynaud, et al., 2009)
6 23 Sheep (Aurich, 2011)
7.5 35 Serrana Goat (Simões, et al., 2006)
8 150 Gilt (Chiou, et al., 2004)
7-12 48-84 Alpaca (Bravo, et al., 1991)
7-12 130-200 Llama (Bravo, Stabenfeldt, Lasley and
Fowler, 1991)
16 250-800 Water Buffalo (Taneja, et al., 1996)
20 700 Cow (Evans, 2003)
20 2700 Elephant (Lueders, et al., 2011)
23 60 Human (Evans, 2003)
20-25 800 Summatran
rhinoceros (Hermes, et al., 2007)
27-38 300-550 Camel dromedarius (Manjunatha, et al., 2012)
30-34 1800 White rhinoceros (Hermes, Göritz and Streich,
2007)
50 1000 Black rhinoceros (Hermes, Göritz and Streich,

27
2007)
55 450 Horse (Aurich, 2011)
120 1900 Indian rhinoceros (Hermes, Göritz and Streich,
2007)
696
697
698

28
Legends of the Figures 699
Figure 1 - (A) A schematic 2D representation of an ovarian follicle. The follicle is a multilayered 700
structure. Inside the follicle is the fluid-filled antrum, which is surrounded by a granulosa cell layer. 701
The outer layer, the theca, is surrounded by a mesh of capillary blood vessels. All other parts of the 702
follicle are avascular. The oocyte together with the surrounding cumulus cells forms the COC. The 703
COC lies on one side of the follicle and is attached to the granulosa cell layer. (B) The 3D 704
computational domain for the follicle. (C) The modeled signaling network for the regulation of 705
follicular development, including FSH, LH, oestrogens [E], androgens [A], and IGF [I] signaling. 706
Receptors and ligand-receptor complexes of component j are indicated as Rj and Cj respectively. 707
Black dotted arrows indicate exchange with the blood, black solid arrows indicate chemical reactions 708
(binding or catalysis), light gray arrows indicate activating impacts and arrows in darker grey indicate 709
inhibitory impacts. All components also decay, but for greater clarity decay reactions have not been 710
included in the scheme. For a more detailed discussion of the reaction network along with the 711
evidence see the main text; numbers in brackets refer to single reactions as called out in the main text. 712
713
714
Figure 2 - Follicular growth. (A) The volume of the follicular fluid at different follicle diameters dF. 715
The data (dots) was reproduced from [12]. The line shows the follicular fluid volume obtained with 716
VFF =4/3 π rFF3 where rFF was obtained by fitting the data points. (B) The number of granulosa cells in 717
human Graafian follicles at different follicle diameters dF. The data (dots) was reproduced from [12]. 718
The light grey solid line shows the number of granulosa cells obtained by fitting the data points. The 719
dark grey solid line shows number of granulosa cells obtained when converting a constant granulosa 720
thickness sG = rG -rFF = 44 μm into the number of granulosa cells NG = VG/VC, where VG = 4/3π(rG3 721
− rFF3) is the granulosa layer volume and VC = 1140 μm3 is the measured granulosa cell volume. (C) 722
The radius of the follicular fluid as obtained by fitting the volume data in panel (A) using the relation 723
VFF =4/3 π rFF3. (D) The granulosa layer thickness sG in human graafian follicles at different follicle 724

29
diameters. The thickess was calculated by determining the granulosa volume VG = NG x VC as the 725
product of granulosa cell number NG and cell volume VC = 1140 μm3. The granulosa thickness sG= rG 726
- rFF was then obtained from VG = 4/3πsG 3. (E) The radius of the follicular fluid and (F) the thickness 727
of the granulosa layer versus developmental time as obtained by converting follicle diameter in panels 728
(C) and (D) using dF = 5mm + vF t. (G) The radii of the different compartments over simulation time. 729
The radius rFF represents the radius of the fluid filled cavity (dotted dark-grey line). The radius rCOC = 730
rFF − dCOC defines the start of the COC domain (black dash-dot line); dCOC is the diameter of the 731
cumulus oocyte complex. The radius of the sphere that includes both follicular fluid and granulosa 732
cells layer has radius rG= sG + rFF (light grey dashed line), where sG is the thickness of the granulosa 733
layer. The outer delimeter of the follicle is given by the radius rT = rG + sT (black solid line),where sT 734
is the thickness of the the thecal tissue. (H) A section along the axis of symmetry of the computational 735
domain. 736
737
Figure 3 –Model Consistency with human data. (A) The measured (shaded areas) and simulated 738
(lines) steroid concentrations of androgens (dash-dotted line, darker shading) and oestradiol (solid 739
line, lighter shading) in the follicular fluid over time. The data was recorded by (Jeppesen, Kristensen, 740
Nielsen, Humaidan, Dal Canto, Fadini, Schmidt, Ernst and Yding Andersen, 2012). (B) Data 741
(markers) and simulation output (lines) of the relative expression of FSH-receptor (solid), LH-742
receptor (dashed), and aromatase (dotted) in the granulosa over developmental time. The data was 743
recorded by (Jeppesen, Kristensen, Nielsen, Humaidan, Dal Canto, Fadini, Schmidt, Ernst and Yding 744
Andersen, 2012) for follicles of different diameters. Data were converted from diameter into time by 745
using the relation dF = 5mm + vF t. The vertical axis shows mRNA expression levels normalized to 746
Gapdh expression. (C) The predicted maximal concentration of the LH receptor in theca (solid), 747
granulosa (dash-dotted) and COC (dashed line) over developmental time. 748
749
Figure 4 – Dynamics of spatiotemporal signalling in the follicle. 750

30
(A,B) Measured serum hormone concentrations of (A) FSH and (B) LH as reproduced (Brindle, 751
Miller, Shofer, Klein, Soules and O'Connor, 2006). The solid lines show the interpolations used 752
in the simulations. (C-F) Simulated concentration profiles of (C) FSH, (D) LH, (E) FSH receptor 753
complex and (F) LH receptor complex relative to their signalling thresholds KF and KL. The shaded 754
areas indicate the standard deviation in the response when parameter values are sampled from a 755
normal distribution with mean value as given in Table S1 and standard deviation σ = 0.1. Simulated 756
(G) FSH receptor expression, and (H) LH receptor expression in the follicle at three time points: 2 757
(dotted), 6 (dashed), and 14 days (solid lines). Note that the simulations were carried out on a growing 758
domain but are represented on a domain that is scaled such that all compartment sizes remain 759
constant. The compartments on the horizontal axes indicate the different parts of the follicle, i.e. the 760
theca (T), granulosa (G), COC (COC), and follicular fluid (FF). Note that in panels C-H only part of 761
the follicular fluid domain is shown as the levels are constant within this domain. 762
763
764
Figure 5 – Sensitivity of the Model Output to changes in Parameter Values and Initial Conditions. 765
Sensitivity of the relative FSH concentration in the follicular fluid and the serum to 1% changes in the 766
kinetic parameter values; only parameters with a sensitivity coefficient larger than 0.001 are included. 767
768
769
Figure 6 – Predicted and Experimentally Confirmed FSH and LH gradients in the Follicle. 770
(A-B) The relative concentrations of (A) FSH, (B) hCG and LH in follicular fluid and serum for 771
different serum concentrations. The data are based on measurements in the left and right ovary of 8 772
patients undergoing assisted reproduction. The trend-line shows the dependency of the ratio on the 773
gonadotropin serum concentration. The shaded area marks the range of the serum concentrations used 774
in the simulation based on the measured data in Fig 4A,B, the dotted line represents the serum 775
concentration at the last time point (14 days). (C, D) The model predicts a gonadotropin concentration 776
difference between the serum and the follicular fluid. The extent of the difference depends on the 777

31
serum concentration. The dependency obtained in the model is similar to the one observed in the data; 778
the trend line from the data is reproduced in panels C and D for ease of comparison. In the simulations 779
constant serum levels were used over developmental time. 780
781
782
Figure 7 - Diffusion-based limits in granulosa cell layer thickness can explain scaling of follicle size 783
with species weight. (A) The follicle surface area correlates with the weight of mammalian species 784
(Table 1). (B) The rate of oestradiol production of the mature follicle scales with the surface area of 785
the mature follice. Here only the volume of the antrum was increased; the thickness of the granulosa 786
and the diameter of the COC was kept constant. (C-F) Receptor levels and granulosa width determine 787
the extent of gonadotropin sequestration in the granulosa. The average FSH (black solid line), LH 788
(black, broken line) and oestradiol (grey) concentration in the follicular fluid at day 14 (C) as the 789
granulosa thickness is changed from its standard value denoted by 1, (D) as the FSH- and LH- 790
receptor expression rates are changed from their standard value denoted by 1, (E) as both the 791
granulosa thickness and the FSH serum levels are changed from their standard value denoted by 1, 792
and (F) as both FSH serum levels and the FSH- and LH-receptor expression rates are changed from 793
their standard value denoted by 1. Panels a and b were simulated on a constant 3D-domain of 794
different radius as indicated. All other panels were simulated on growing domains. 795
796


1
Scaling of antral follicle size with species size as a result ofdiffusion-based limitations on ovarian granulosa thickness
Supplementary Material
Mirjam Baechler1,†, Denis Menshykau1,2,†, Christian De Geyter3, Dagmar Iber1,2,∗
1 Department for Biosystems Science and Engineering (D-BSSE), ETH Zurich, Switzerland2 Swiss Institute of Bioinformatics, Basel, Switzerland3 Division of Gynecological Endocrinology and Reproductive Medicine, Women’s Hospital, University ofBasel, Switzerland† The authors contributed equally.∗ Corresponding Author: Dagmar Iber ([email protected])
The ModelThe model is based on our previous model for bovine folliculogenesis [1] and is formulated as a set ofisotropic advection-reaction-dispersion equations for a compound ci with diffusion coefficient Di andreaction terms R(ci):
∂tci +∇ (uci) = Di∇2ci +R (ci) (1)
where u denotes the external velocity field. The reaction terms R(ci) are:
R(F ) = ( ρF︸︷︷︸delivery
−∆F︸ ︷︷ ︸removal
)Θ−konFRF + kFoffCF︸ ︷︷ ︸complex formation
−δFF︸ ︷︷ ︸decay
R(L) = ( ρL︸︷︷︸delivery
−∆L︸ ︷︷ ︸removal
)Θ−konLRL + kLoffCL︸ ︷︷ ︸complex formation
−δLL︸ ︷︷ ︸decay
R(A) = −∆A︸ ︷︷ ︸removal
Θ +ρAΘ(1 + σG)︸ ︷︷ ︸production
−δAA︸ ︷︷ ︸decay
−ρE(Γ + χ)A
A+KMI(1 + σEσG)(1 + σG)︸ ︷︷ ︸
catalytic decay
R(E) = −∆E︸ ︷︷ ︸removal
Θ−konERE + kEoffCE︸ ︷︷ ︸complex formation
−δEE︸ ︷︷ ︸decay
+ρE(Γ + χ)A
A+KMI(1 + σEσG)(1 + σG)︸ ︷︷ ︸
catalytic production
R(RF ) = ρRF (1− σF)(1− σL)(ΓϑG + χϑCOC + σI(1 + σE))︸ ︷︷ ︸production
−konFRF + kFoffCF︸ ︷︷ ︸complex formation
−δRRF︸ ︷︷ ︸decay
R(RL) = ρRL(1− σF)(1− σL)σI(1 + σE)︸ ︷︷ ︸production
−konLRL + kLoffCL︸ ︷︷ ︸complex formation
− δRRL︸ ︷︷ ︸decay
R(RE) = ρRE (1 + σE)(1− σI1)︸ ︷︷ ︸production
−konERE + kEoffCE︸ ︷︷ ︸complex formation
−δRRE︸ ︷︷ ︸decay

2
and
R(CF ) = konFRF − kFoffCF︸ ︷︷ ︸complex formation
−δCFCF︸ ︷︷ ︸decay
R(CL) = konLRL − kLoffCL︸ ︷︷ ︸complex formation
−δCLCL︸ ︷︷ ︸decay
R(CE) = konERE − kEoffCE︸ ︷︷ ︸complex formation
−δCECE︸ ︷︷ ︸decay
R(I) = ρIσG︸ ︷︷ ︸production
−δII︸ ︷︷ ︸decay
(2)
The reaction terms Rci are identical to those used in the bovine model [1], except for two new regula-tory interactions (Fig. 1C A3, A4) that had to be added to the human model to account for a markeddifference in the bovine and human gene expression data. Thus in human granulosa cells FSH receptorexpression is high in small follicles (6mm) and subsequently decreases [2] while in bovine follicles FSHreceptor expression is lower and increases over developmental time [3, 4]. To account for this differencewe needed to introduce a previously neglected negative feedback of gonadotropin signaling on FSH andLH receptor expression. The bold terms in the equations for RRF and RRL reflect this negative feedback.
Note that the spatial restriction of reactions to one of the compartments (Fig. 1A,B) is incorporatedby multiplication with Θ which is one in the theca and zero elsewhere, Γ which is one in the granulosalayer and zero elsewhere, or χ which is 1 in the COC and zero elsewhere.
The σ terms indicate Hill functions that we use to describe such regulatory influences. To describeactivating influences of a component ci we write
σi =cnji
cnii +Knii
. (3)
and we use 1 − σi to describe inhibitory impacts of ci. Here i denotes the component i. Ki is the Hillconstant which specifies the concentration of ci where half-maximal activity is observed, and the Hillcoefficient ni defines the steepness of the response. We are using ni = 2 throughout.
All other parameter values are listed in Table 1.
Boundary ConditionsWe use zero flux boundary conditions for all hormones, receptors and their complexes, i.e.
∇ci = 0. (4)
The receptors can diffuse slowly within a tissue but not between different cell layers, i.e. no flux betweentheca/granulosa, granulosa/COC, granulosa/fluid, COC/fluid. In this way it is ensured that receptorslocalize into/on their cells and are not present inside the follicular fluid. Gonadotropins and steroids canfreely diffuse throughout the follicle. The diffusion constant in in the follicular fluid is set to a very highvalue (DFF = 0.1 mm2 s−1) to account for the rapid mixing in the fluid as the women move.

3
Initial ConditionsAs initial conditions we use zero for the hormones, receptors and hormone-receptor complexes, because wewant to study the mechanisms that result in the emergence of the characteristic gene expression patternsin the follicle, i.e.
F (0) = L(0) = E(0) = A(0) = 0
RF (0) = RL(0) = RE(0) = 0
CF (0) = CL(0) = CE(0) = 0. (5)
The only exception is the initial concentration of the IGF-receptor complex. IGF-2 and the IGF typereceptor are expressed in the theca already at the time of antrum formation [5], and the early presenceof the IGF-receptor complex in the theca is important in the model to reproduce the experimentallyobserved early expression of LH receptors in the theca [3, 4]. To reproduce the measured LH receptorproduction rate in the early follicle we require
I(0) = 0.3KIΘ. (6)
where Θ indicates the restriction to the theca and KI is the Hill constant for IGF-dependent regulatoryprocesses.

4
Tables
Table 1. Parameter Values. The table summarizes all parameter values used in the model alongwith the evidence. The first 26 parameter values are the same as in the bovine model [1] and almostentirely reflect directly measured values. The 7 further parameter values in the second block had to bealtered to account for differences in the bovine and human data as discussed in the main text. Thegeometry parameters in the third block were directly derived from measured data as summarized inFigure 2. In addition to the parameters listed above we usedF (0) = L(0) = E(0) = A(0) = Ri(0) = Ci(0) = 0 as initial conditions to study the emergence of patternfrom zero initial conditions. The serum levels of FSH and LH change over the menstrual cycle and ρF (t)and ρL(t) are set to the measured hormone concentrations [6] shown in Figure 4A,B times the bloodflux rate ∆ that determines how quickly the local serum concentration is replenished. The flux rate ∆ isnot known, but as long as ∆ ≥ 1 s−1 the flux does not impact on the predicted expression patterns inthe follicle; we use ∆ = 1 s−1. δRi refers to the decay rates of all receptors, i.e. i = {F,L,E}.
Source Parameter Simulation Value Reference Value References
From
bovinemodel
[1]
DH 6.7 × 10⁻⁵ mm 2 s−1 average 6.7 × 10⁻⁵ mm 2 s−1 for FSH [7,8]DS 10−4 mm 2 s−1 small molecule Diff coeff 10−4 mm 2 s−1 [9, 10]DCL
2 × 10⁻⁸ mm 2 s−1 1.9 ± 1 × 10⁻⁸ mm 2 s−1 [11]
DR 10−7 mm 2 s−1 10−9 − 5 × 10⁻⁷ mm 2 s−1 [12–15]DI 4 × 10⁻⁹ mm 2 s−1 3 − 5 × 10⁻¹⁰ cm2 s−1 at 23 C; immobilization at 37 C [12]DFF 0.1 mm 2 s−1 rapid mixing in follicular fluid,i.e. fast diffusion D � 10−4 mm 2 s−1 [9, 10]kon 10−3 nM−1s−1 standard value [16]kFoff 5 × 10⁻⁴ s−1 average: KD = 5 × 10⁻¹⁰M−1 [17–22]
kLoff 10−2 s−1 KD = 9 nM [23]
kEoff 10−4 s−1 KD = 0.1 nM [24]
δF 10−5 s−1 half-life of FSH in ovariectomized ewes is 20 h [25]δL 5 × 10⁻⁴ s−1 half-life of LH in ovariectomized rats is 23 minutes [26]
δRi= δCE
= δE = δA 3 × 10⁻⁵ s−1 half-life 1-6 hours [27–31]
δCL7.5 × 10−4 s−1 half-life LH/hCG-bound receptor 17 min [26,27,32],
δCF6.4 × 10−5 s−1 half-life of FSH is 3 hours [25]
δI 10−6 s−1 half-life 6 − 10 hours, i.e ∼ δ = 10−6 s−1 [33]ρRF
= ρRL500 × 0.5 pM s−1 21 receptors/cell/min = 0.5 pM s−1, surface receptor [27,34–37]
ρE 0.06 s−1 kcat = 0.06 s−1 [38,39]ρRE
1.25 pM s−1 45000 estrogen receptors are detected per cell [40]KM 44 nM KM = 44 nM [38,39]KE 35 nM reproduce bovine FSH and LH receptor expression kinetics [1, 3, 4]I(0) 0.3KIΘ reproduce bovine LH receptor expression kinetics [1, 3, 4]
Humandata ρI 13.5KIδI reproduce measured granulosa LH receptor numbers (≤ 3 nM) [34]
ρA ∆ × 400 nM reproduce androgen concentration in follicular fluid, Fig. 3A [2]KI 35 nM reproduce estradiol concentration in follicular fluid, Fig. 3A [2]
KF = KL 0.45 ϑ× 500 reproduce steepness of expression kinetics in Fig. 3B [2]ϑG 3 reproduce early FSH receptor expression rate in Fig. 3B [2]
ϑCOC 0.009 × ϑG limit total receptor expression in COC to physiological range [34]
Geometry
rFF (0) 2.292 mm ordinate intercept in Fig. 2E [41]rG(0) − rFF (0) 44 µm constant fit of data points in Fig. 2F [41]rT (0) − rG(0) 100 µm ∼ 50 − 100 µm [42]rCOC (0) 1.942 mm ordinate intercept in Fig. 2G [41]vFF 0.8 × 10⁻⁵ mm s−1 fit of data points in Fig. 2C [41]vF 1.74 × 10⁻⁵ mm s−1 ∼ 5 - 25 mm in 14 days [43]

5
References1. Iber D, De Geyter C (2013) A computational Model of bovine follicle Development. submitted .
2. Jeppesen JV, Kristensen SG, Nielsen ME, Humaidan P, Dal Canto M, et al. (2012) LH-ReceptorGene Expression in Human Granulosa and Cumulus Cells from Antral and Preovulatory Follicles.The Journal of clinical endocrinology and metabolism 97: E1524–31.
3. Bao B, Garverick HA (1998) Expression of steroidogenic enzyme and gonadotropin receptor genesin bovine follicles during ovarian follicular waves: a review. Journal of animal science 76: 1903–1921.
4. Xu Z, Garverick HA, Smith GW, Smith MF, Hamilton SA, et al. (1995) Expression of follicle-stimulating hormone and luteinizing hormone receptor messenger ribonucleic acids in bovine folli-cles during the first follicular wave. Biology of reproduction 53: 951–957.
5. Armstrong DG, Gutierrez CG, Baxter G, Glazyrin AL, Mann GE, et al. (2000) Expression ofmRNA encoding IGF-I, IGF-II and type 1 IGF receptor in bovine ovarian follicles. The Journalof endocrinology 165: 101–113.
6. Brindle E, Miller RC, Shofer JB, Klein NA, Soules MR, et al. (2006) Urinary beta-luteinizing hor-mone and beta-follicle stimulating hormone immunoenzymometric assays for population research.Clinical biochemistry 39: 1071–1079.
7. LI CH, PEDERSEN KO (1952) Physicochemical characterization of pituitary follicle-stimulatinghormone. The Journal of general physiology 35: 629–637.
8. STEELMAN SL, LAMONT WA, BALTES BJ (1956) Preparation of highly active follicle stimu-lating hormone from swine pituitary glands. Acta endocrinologica 22: 186–190.
9. Yu SR, Burkhardt M, Nowak M, Ries J, Petrásek Z, et al. (2009) Fgf8 morphogen gradient formsby a source-sink mechanism with freely diffusing molecules. Nature 461: 533–536.
10. Dayel MJ, Hom EF, Verkman AS (1999) Diffusion of green fluorescent protein in the aqueous-phaselumen of endoplasmic reticulum. Biophysical journal 76: 2843–2851.
11. Niswender GD, Roess DA, Sawyer HR, Silvia WJ, Barisas BG (1985) Differences in the lateral mo-bility of receptors for luteinizing hormone (LH) in the luteal cell plasma membrane when occupiedby ovine LH versus human chorionic gonadotropin. Endocrinology 116: 164–169.
12. Schlessinger J, Shechter Y, Cuatrecasas P, Willingham MC, Pastan I (1978) Quantitative determi-nation of the lateral diffusion coefficients of the hormone-receptor complexes of insulin and epider-mal growth factor on the plasma membrane of cultured fibroblasts. Proceedings of the NationalAcademy of Sciences of the United States of America 75: 5353–5357.
13. Ries J, Yu SR, Burkhardt M, Brand M, Schwille P (2009) Modular scanning FCS quantifiesreceptor-ligand interactions in living multicellular organisms. Nature methods 6: 643–645.
14. Kumar M, Mommer MS, Sourjik V (2010) Mobility of Cytoplasmic, Membrane, and DNA-BindingProteins in Escherichia coli. Biophysical journal 98: 552–559.
15. Hebert B, Costantino S, Wiseman P (2005) Spatiotemporal image correlation Spectroscopy(STICS) theory, verification, and application to protein velocity mapping in living CHO cells.Biophysical journal 88: 3601–3614.

6
16. Fersht (1999) Structure and Mechanism in Protein Science.
17. Aittomäki K, Lucena JL, Pakarinen P, Sistonen P, Tapanainen J, et al. (1995) Mutation in thefollicle-stimulating hormone receptor gene causes hereditary hypergonadotropic ovarian failure.Cell 82: 959–968.
18. Dias JA, Reeves JJ (1982) Testicular FSH receptor numbers and affinity in bulls of various ages.Journal of reproduction and fertility 66: 39–45.
19. Cheng KW (1975) Properties of follicle-stimulating-hormone receptor in cell membranes of bovinetestis. Biochem J 149: 123–132.
20. Bhalla VK, Reichert LE (1974) Properties of follicle-stimulating hormone-receptor interactions.Specific binding of human follicle-stimulating hormone to rat testes. The Journal of biologicalchemistry 249: 43–51.
21. Nakamura K, Krupnick JG, Benovic JL, Ascoli M (1998) Signaling and phosphorylation-impairedmutants of the rat follitropin receptor reveal an activation- and phosphorylation-independent butarrestin-dependent pathway for internalization. The Journal of biological chemistry 273: 24346–24354.
22. Fletcher PW, Reichert LE (1984) Cellular processing of follicle-stimulating hormone by Sertoli cellsin serum-free culture. Molecular and cellular endocrinology 34: 39–49.
23. Galet C, Ascoli M (2005) The differential binding affinities of the luteinizing hormone(LH)/choriogonadotropin receptor for LH and choriogonadotropin are dictated by different ex-tracellular domain residues. Molecular endocrinology (Baltimore, Md) 19: 1263–1276.
24. Méster J, Rbertson DM, Feherty P, Kellie AE (1970) Determination of high-affinity oestrogenreceptor sites in uterine supernatant preparations. Biochem J 120: 831–836.
25. Fry RC, Cahill LP, Cummins JT, Bindon BM, Piper LR, et al. (1987) The half-life of follicle-stimulating hormone in ovary-intact and ovariectomized booroola and control merino ewes. Journalof reproduction and fertility 81: 611–615.
26. Weick RF (1977) A comparison of the disappearance rates of luteinizing hormone from intact andovariectomized rats. Endocrinology 101: 157–161.
27. Lloyd CE, Ascoli M (1983) On the mechanisms involved in the regulation of the cell-surface recep-tors for human choriogonadotropin and mouse epidermal growth factor in cultured Leydig tumorcells. J Cell Biol 96: 521–526.
28. Valley CC, Solodin NM, Powers GL, Ellison SJ, Alarid ET (2008) Temporal variation in estrogenreceptor-alpha protein turnover in the presence of estrogen. Journal of molecular endocrinology40: 23–34.
29. Woods MN, Gorbach SL, Longcope C, Goldin BR, Dwyer JT, et al. (1989) Low-fat, high-fiber dietand serum estrone sulfate in premenopausal women. The American journal of clinical nutrition 49:1179–1183.
30. Ginsburg ES, Gao X, Shea BF, Barbieri RL (1998) Half-life of estradiol in postmenopausal women.Gynecologic and obstetric investigation 45: 45–48.

7
31. Singh AB, Norris K, Modi N, Sinha-Hikim I, Shen R, et al. (2001) Pharmacokinetics of a transder-mal testosterone system in men with end stage renal disease receiving maintenance hemodialysisand healthy hypogonadal men. The Journal of clinical endocrinology and metabolism 86: 2437–2445.
32. Nakamura K, Liu X, Ascoli M (2000) Seven non-contiguous intracellular residues of thelutropin/choriogonadotropin receptor dictate the rate of agonist-induced internalization and itssensitivity to non-visual arrestins. The Journal of biological chemistry 275: 241–247.
33. Prager D, Yamasaki H, Weber MM, Gebremedhin S, Melmed S (1992) Human insulin-like growthfactor I receptor function in pituitary cells is suppressed by a dominant negative mutant. TheJournal of clinical investigation 90: 2117–2122.
34. Erickson GF, Wang C, Hsueh AJ (1979) FSH induction of functional LH receptors in granulosacells cultured in a chemically defined medium. Nature 279: 336–338.
35. Jeppesen JV, Nielsen ME, Kristensen SG, Yding Andersen C (2012) Concentration of activin Aand follistatin in follicular fluid from human small antral follicles associated to gene expression ofthe corresponding granulosa cells. Molecular and cellular endocrinology 356: 48–54.
36. Nielsen ME, Rasmussen IA, Kristensen SG, Christensen ST, Møllgård K, et al. (2011) In humangranulosa cells from small antral follicles, androgen receptor mRNA and androgen levels in follicularfluid correlate with FSH receptor mRNA. Molecular human reproduction 17: 63–70.
37. Findlay JK (1993) An update on the roles of inhibin, activin, and follistatin as local regulators offolliculogenesis. Biology of reproduction 48: 15–23.
38. Burger HG (2002) Androgen production in women. Fertility and sterility 77 Suppl 4: S3–5.
39. Sohl CD, Guengerich FP (2010) Kinetic analysis of the three-step steroid aromatase reaction ofhuman cytochrome P450 19A1. The Journal of biological chemistry 285: 17734–17743.
40. Bezwoda WR, Meyer K (1990) Effect of alpha-interferon, 17 beta-estradiol, and tamoxifen onestrogen receptor concentration and cell cycle kinetics of MCF 7 cells. Cancer research 50: 5387–5391.
41. McNatty KP (1981) Hormonal correlates of follicular development in the human ovary. Australianjournal of biological sciences 34: 249–268.
42. Singh J, Adams GP (2000) Histomorphometry of dominant and subordinate bovine ovarian follicles.The Anatomical Record 258: 58–70.
43. Gougeon A (1986) Dynamics of follicular growth in the human: a model from preliminary results.Human reproduction (Oxford, England) 1: 81–87.