Spatio-temporal surface soil heat flux estimates from satellite data; results for the AMMA...
12
Agricultural and Forest Meteorology 154–155 (2012) 55–66 Contents lists available at SciVerse ScienceDirect Agricultural and Forest Meteorology jou rn al h om epa g e: www.elsevier.com/locate/agrformet Spatio-temporal surface soil heat flux estimates from satellite data; results for the AMMA experiment at the Fakara (Niger) supersite Anne Verhoef a,∗ , Catherine Ottlé b , Bernard Cappelaere c , Ty Murray a , Stephane Saux-Picart d , Mehrez Zribi e , Fabienne Maignan b , Nicolas Boulain c,f , Jerome Demarty c , David Ramier g a The University of Reading, Soil Research Centre, Department of Geography and Environmental Science, Reading, United Kingdom b LSCE/CEA-CNRS, L’Orme des Merisiers Bat 7, 91191 Gif-sur-Yvette, France c IRD, UMR HydroSciences, 911 AvenueAgropolis, BP 64501, 34394 Montpellier Cedex 05, France d Plymouth Marine Laboratory, Prospect Place, The Hoe, Plymouth PL1 3DH, United Kingdom e CESBIO (CNRS/IRD/UPS/CNES), 18, Avenue Edouard Belin, 31401 Toulouse, France f Plant Functional Biology and Climate Change Cluster, P.O. Box 123, Broadway, NSW 2207, Australia g Laboratoire HydroSciences Montpellier, France a r t i c l e i n f o Article history: Received 11 May 2011 Received in revised form 5 August 2011 Accepted 16 August 2011 Keywords: Land surface temperatures MSG Soil heat flux AMMA Sahel a b s t r a c t This paper describes a method that employs Earth Observation (EO) data to calculate spatiotemporal esti- mates of soil heat flux, G, using a physically-based method (the Analytical Method). The method involves a harmonic analysis of land surface temperature (LST) data. It also requires an estimate of near-surface soil thermal inertia; this property depends on soil textural composition and varies as a function of soil moisture content. The EO data needed to drive the model equations, and the ground-based data required to provide verification of the method, were obtained over the Fakara domain within the African Mon- soon Multidisciplinary Analysis (AMMA) program. LST estimates (3 km × 3 km, one image 15 min −1 ) were derived from MSG-SEVIRI data. Soil moisture estimates were obtained from ENVISAT-ASAR data, while estimates of leaf area index, LAI, (to calculate the effect of the canopy on G, largely due to radiation extinc- tion) were obtained from SPOT-HRV images. The variation of these variables over the Fakara domain, and implications for values of G derived from them, were discussed. Results showed that this method pro- vides reliable large-scale spatiotemporal estimates of G. Variations in G could largely be explained by the variability in the model input variables. Furthermore, it was shown that this method is relatively insensitive to model parameters related to the vegetation or soil texture. However, the strong sensitivity of thermal inertia to soil moisture content at low values of relative saturation (<0.2) means that in arid or semi-arid climates accurate estimates of surface soil moisture content are of utmost importance, if reli- able estimates of G are to be obtained. This method has the potential to improve large-scale evaporation estimates, to aid land surface model prediction and to advance research that aims to explain failure in energy balance closure of meteorological field studies. Crown Copyright © 2011 Published by Elsevier B.V. All rights reserved. 1. Introduction The surface energy balance describes the energy exchange between the land surface and the atmosphere: R n = H + LE + G (1) where R n is the net radiation, H is the sensible heat flux, LE is the latent heat flux, i.e. the evapotranspiration, and G is the surface soil heat flux (all fluxes in W m −2 ). A key variable that plays a role in all these fluxes is the land surface temperature, LST. ∗ Corresponding author. Tel.: +44 118 3786074; fax: +44 118 3786660. E-mail address: [email protected] (A. Verhoef). Recently, determination of the surface soil heat flux, G, has received renewed attention, predominantly to help explain fail- ure in energy balance closure (e.g. Heusinkveld et al., 2004; Foken, 2008; Jacobs et al., 2008), i.e. the occurrence of a consistent dis- crepancy between R n and H + LE + G, or rather between R n − G (the available energy) and H + LE (the atmospheric turbulent fluxes), for a particular data set. The main focus of these studies was to draw attention to problems related to the calculation of G when using in situ sensors, such as the influence of measurement errors and instrument shortcomings on G estimates (Liebethal et al., 2005; Ochsner et al., 2006, 2007; Sauer et al., 2007), or the effect of latent heat transfer on soil heat flux measurements (Mayocchi and Bristow, 1995; Heitman et al., 2010). Assessment of the degree of energy balance closure is particularly important when 0168-1923/$ – see front matter. Crown Copyright © 2011 Published by Elsevier B.V. All rights reserved. doi:10.1016/j.agrformet.2011.08.003
-
Upload
independent -
Category
Documents
-
view
2 -
download
0
Transcript of Spatio-temporal surface soil heat flux estimates from satellite data; results for the AMMA...

St
AMa
b
c
d
e
f
g
a
ARRA
KLMSAS
1
b
R
wlht
0d
Agricultural and Forest Meteorology 154– 155 (2012) 55– 66
Contents lists available at SciVerse ScienceDirect
Agricultural and Forest Meteorology
jou rn al h om epa g e: www.elsev ier .com/ locate /agr formet
patio-temporal surface soil heat flux estimates from satellite data; results forhe AMMA experiment at the Fakara (Niger) supersite
nne Verhoefa,∗, Catherine Ottléb, Bernard Cappelaerec, Ty Murraya, Stephane Saux-Picartd,ehrez Zribie, Fabienne Maignanb, Nicolas Boulainc,f, Jerome Demartyc, David Ramierg
The University of Reading, Soil Research Centre, Department of Geography and Environmental Science, Reading, United KingdomLSCE/CEA-CNRS, L’Orme des Merisiers Bat 7, 91191 Gif-sur-Yvette, FranceIRD, UMR HydroSciences, 911 AvenueAgropolis, BP 64501, 34394 Montpellier Cedex 05, FrancePlymouth Marine Laboratory, Prospect Place, The Hoe, Plymouth PL1 3DH, United KingdomCESBIO (CNRS/IRD/UPS/CNES), 18, Avenue Edouard Belin, 31401 Toulouse, FrancePlant Functional Biology and Climate Change Cluster, P.O. Box 123, Broadway, NSW 2207, AustraliaLaboratoire HydroSciences Montpellier, France
r t i c l e i n f o
rticle history:eceived 11 May 2011eceived in revised form 5 August 2011ccepted 16 August 2011
eywords:and surface temperaturesSG
oil heat fluxMMAahel
a b s t r a c t
This paper describes a method that employs Earth Observation (EO) data to calculate spatiotemporal esti-mates of soil heat flux, G, using a physically-based method (the Analytical Method). The method involvesa harmonic analysis of land surface temperature (LST) data. It also requires an estimate of near-surfacesoil thermal inertia; this property depends on soil textural composition and varies as a function of soilmoisture content. The EO data needed to drive the model equations, and the ground-based data requiredto provide verification of the method, were obtained over the Fakara domain within the African Mon-soon Multidisciplinary Analysis (AMMA) program. LST estimates (3 km × 3 km, one image 15 min−1) werederived from MSG-SEVIRI data. Soil moisture estimates were obtained from ENVISAT-ASAR data, whileestimates of leaf area index, LAI, (to calculate the effect of the canopy on G, largely due to radiation extinc-tion) were obtained from SPOT-HRV images. The variation of these variables over the Fakara domain, andimplications for values of G derived from them, were discussed. Results showed that this method pro-vides reliable large-scale spatiotemporal estimates of G. Variations in G could largely be explained bythe variability in the model input variables. Furthermore, it was shown that this method is relatively
insensitive to model parameters related to the vegetation or soil texture. However, the strong sensitivityof thermal inertia to soil moisture content at low values of relative saturation (<0.2) means that in arid orsemi-arid climates accurate estimates of surface soil moisture content are of utmost importance, if reli-able estimates of G are to be obtained. This method has the potential to improve large-scale evaporationestimates, to aid land surface model prediction and to advance research that aims to explain failure inenergy balance closure of meteorological field studies.Crown Copyright © 2011 Published by Elsevier B.V. All rights reserved.
. Introduction
The surface energy balance describes the energy exchangeetween the land surface and the atmosphere:
n = H + LE + G (1)
here Rn is the net radiation, H is the sensible heat flux, LE is the
atent heat flux, i.e. the evapotranspiration, and G is the surface soileat flux (all fluxes in W m−2). A key variable that plays a role in allhese fluxes is the land surface temperature, LST.∗ Corresponding author. Tel.: +44 118 3786074; fax: +44 118 3786660.E-mail address: [email protected] (A. Verhoef).
168-1923/$ – see front matter. Crown Copyright © 2011 Published by Elsevier B.V. All rioi:10.1016/j.agrformet.2011.08.003
Recently, determination of the surface soil heat flux, G, hasreceived renewed attention, predominantly to help explain fail-ure in energy balance closure (e.g. Heusinkveld et al., 2004; Foken,2008; Jacobs et al., 2008), i.e. the occurrence of a consistent dis-crepancy between Rn and H + LE + G, or rather between Rn − G (theavailable energy) and H + LE (the atmospheric turbulent fluxes),for a particular data set. The main focus of these studies wasto draw attention to problems related to the calculation of Gwhen using in situ sensors, such as the influence of measurementerrors and instrument shortcomings on G estimates (Liebethal
et al., 2005; Ochsner et al., 2006, 2007; Sauer et al., 2007), orthe effect of latent heat transfer on soil heat flux measurements(Mayocchi and Bristow, 1995; Heitman et al., 2010). Assessment ofthe degree of energy balance closure is particularly important whenghts reserved.
5 orest
e(av
gtfaescowoe
afVET
c(BatptwetRvf
enVib1fi(vsL(fIowttcus
um(5wm
6 A. Verhoef et al. / Agricultural and F
valuating the reliability of energy balance fluxes at FLUXNET siteshttp://www.fluxnet.ornl.gov/fluxnet/), for example, as these datare used widely by the meteorological research community (e.g. forerification of land surface models, see Blyth et al., 2010).
However, no matter how accurate the estimates of G fromround-based methods are, a major unresolved problem is the facthat G obtained by standard in situ methods represents a land sur-ace area of <1 m2 compared to the km2 scale associated with Hnd LE flux estimates obtained by the eddy-covariance (Moncriefft al., 1997) or scintillometry methods (Evans et al., 2010). Large-cale estimates of G are not only useful for testing of energy balancelosure, but also in the context of reliable regional to global evap-ration products (e.g. WACMOS, http://wacmos.itc.nl/, or WATCH,ww.eu-watch.org) and of providing verification data for Regional
r Global Circulation Models (see e.g. Boone et al., 2009 and Kergoatt al., 2011, in the AMMA framework).
For this reason, over the years researchers have turned theirttention on obtaining G by use of variables that can be obtainedrom remote sensing, using proximal (Wang and Bras, 1999;erhoef, 2004; Murray and Verhoef, 2007a,b) to satellite-basedarth Observation (EO) instruments (Bastiaanssen et al., 1998a,b;suang, 2005).
Remotely sensed variables used in these methods generallyomprise net radiation, surface temperature, albedo and NDVIe.g., Choudhury et al., 1987; Kustas et al., 1993; Friedl, 2002;astiaanssen et al., 1998a,b; Jacobsen and Hansen, 1999; Santanellond Friedl, 2003). Albedo serves as a proxy for soil moisture con-ent, as this variable strongly affects soil thermal properties. NDVIrovides an estimate of vegetation coverage fraction, as, underhe same atmospheric driving conditions, vegetation-covered soilill have a smaller soil heat flux than bare soil, due to radiation-
xtinction by the canopy. A large number of these papers focus onhe determination of G/Rn, from which G can be derived, providedn is known; experimentally it has been shown that the G/Rn ratiosary approximately between 0.05 for dense vegetation to 0.3–0.4or bare soil (e.g. Verhoef, 2004; Murray and Verhoef, 2007b).
Unfortunately, the majority of these approaches are largelympirical, nor are these methods universal. Some of these tech-iques and their (dis)advantages, were discussed by Murray anderhoef (2007a,b) and a case was made for replacing these empir-
cal equations with a universal, more physically-based, methodased on the Analytical Method (see also Horton and Wierenga,983; Verhoef, 2004), which involves a harmonic analysis of sur-ace temperatures and also requires estimates of surface thermalnertia. This method has been tested on the field-scale by Verhoef2004) for bare soil and by Murray and Verhoef (2007a,b) foregetated surfaces, using proximal remote sensing to determineurface temperature. Another physically-based method that usesST (in this case satellite-based) to derive G, discussed in Tsuang2005), only considers annual and diurnal variations and no lower-requency components, so the number of harmonics is much less.t also requires estimates of an effective soil depth, which is hard tobtain, and uses a constant thermal inertia of 1789 J m−2 K−1 s−1/2,hich is unrealistic. Furthermore, this method directly uses skin
emperatures at the top of the canopy, but does not correct forhe effect of the canopy (see Section 2.1). In Tsuang’s paper thisaused a discrepancy between the ground fluxes calculated bysing radiometric temperatures and those observed at the studyites.
Here, the method derived by Murray and Verhoef (2007a,b),ntil now used only with proximal LST data, will be tested for auch larger area: the African Monsoon Multidisciplinary Analysis
AMMA; Redelsperger et al., 2006) Fakara domain (approximately0 km × 50 km) in SW Niger, using satellite remote sensing data. Itill allow the Analytical Method to be evaluated for large-scale esti-ation of G. The relatively dry and sandy soils of this geographical
Meteorology 154– 155 (2012) 55– 66
area represent a challenging test-bed for this method. Recommen-dations for its successful use over different surface types and fordifferent climatic regimes will also be made.
2. Materials and methods
2.1. Calculation of surface soil heat flux from remote sensing data
Calculation of the surface soil heat flux, G, is performed usingthe method described by Murray and Verhoef (2007b); from hereon referred to as (MV2007b) for vegetated surfaces, as based onVerhoef (2004; method valid for bare soils only). Here, the Analyt-ical soil heat flux method, which is originally based on a harmonicanalysis of below-ground soil temperatures (Van Wijk and De Vries,1963; Horton et al., 1983), is employed. However, in this casethe harmonic analysis is performed on surface temperatures, Ts,obtained from infrared thermometry (IRT). The following equationwas derived by MV2007b (see also Verhoef, 2004):
G = �
M∑n=1
An√
nω sin[
nωt + �n + �
4
]= �Js (2)
where � is the thermal inertia, M (=20) is the total number ofharmonics used (the use of 20 harmonics should ensure that highfrequency temporal fluctuations, e.g. due to temporary cloud cover,are captured satisfactorily), An is the amplitude of the nth harmonic,ϕn is the phase shift of the nth harmonic, t is time and ω is the angu-lar frequency. Js is used to denote the sum of the harmonic termsderived from the timeseries of Ts, to allow for brevity of notationlater on in the manuscript. This equation is considerably less com-plicated than when using below-ground soil temperatures, becauseall terms containing depth, z, have disappeared. Verhoef (2004) suc-cessfully used Eq. (2) to calculate soil heat fluxes for a bare UK soil.In this study � was derived from the nighttime drop in soil sur-face temperature and the average net radiation received during thisperiod. Note that this approach to calculate � cannot be used forvegetated surfaces. For this purpose, Murray and Verhoef (2007a)developed an alternative method (see Eq. (5)).
For vegetated surfaces, calculation of G with Eq. (2) ideallyrequires a harmonic analysis of below-canopy soil surface tempera-ture, to obtain the shape of the diurnal course of G, as determined byJs. However, when using remote sensing, generally only one singlecomposite (vegetation plus soil) radiometric brightness temper-ature, TB, is available. A new approach was therefore adopted inMV2007b, where a direct relationship was inferred between thesum of the harmonic terms of below-canopy soil surface temper-atures, i.e. Js, and the sum of the harmonic terms of radiometricbrightness (composite of soil and canopy) temperatures, JB, respec-tively. The rationale behind this approach was that absolute valuesof below-canopy soil surface temperatures are not required in Eq.(2). Although they can be obtained from remotely observed radio-metric temperatures (see e.g. Norman et al., 1995; Franc ois et al.,1997; Zhaoliang et al., 2001; Friedl, 2002), this involves simultane-ous infrared thermometer (IRT) observations at different viewingangles over homogeneous pixels, which is not currently possiblefrom operational satellite or airborne instruments. Only the rela-tionship between instantaneous and daily averaged temperaturereadings (used in defining An and ϕn) is important (see MV2007b).
Hence, JB was simply altered by a fractional soil cover factor,fs (to account for the relative contribution of soil and canopy), toobtain an estimate of Js:( )
Js = 12fs(�) + 1
2JB (3)
This equation was tested for a number of vegetation types anddensities in MV2007b. Here, fs(�) is the fractional soil cover as a

orest
fcl
f
wcao
fpcoaata
2
aoam
�
wo(dtt
�
hp(pvh
(
�
�
g
K
ws
taiis(i
at
A. Verhoef et al. / Agricultural and F
unction of instrument (IRT) viewing angle, �; fs(�) = 1.0 for a surfaceonsisting of entirely bare soil. Values for fs(�) are calculated fromeaf area index, LAI, and �:
s(�) = e[−ˇ(LAI/ cos(�))] (4)
here is the radiation extinction coefficient (taken as 0.5, whichorresponds to a spherical leaf angle distribution, which is deemeddequate for the canopies under consideration). For MSG-SEVIRIbservations over the Sahel, � is assumed 0.
As in MV2007b, remote G was shifted by 1.5 h to further accountor the effect of the canopy, which will dampen and delay the tem-erature signal, when we compare the soil temperature below theanopy to the surface temperature at the top of the canopy. In the-ry this shift depends to a certain extent on vegetation structure,nd on vegetation density or LAI. However, MV2007b showed that
single value of phase shift was sufficient for the various canopyypes and densities tested in their paper, so for reasons of simplicitynd consistency this value was selected also in the current study.
.1.1. Calculation of thermal inertia, �Eq. (2) also requires an estimate of thermal inertia, � . Murray
nd Verhoef (2007a), from here on referred to as (MV2007a) devel-ped an equation to calculate � from soil porosity (which wasssumed equal to saturated soil moisture content, �*) and an esti-ate of soil moisture content, �:
= Ke(�∗ − �0) + �0 (5)
here Ke is the Kersten number (which depends on the degreef saturation, �/�*), � * is the maximum value of thermal inertiaat saturation) and � 0 is the thermal inertia when the soil is air-ry. These authors based their values of � (for 11 standard USDAextural classification soils, see Clapp and Hornberger, 1978) on theheoretical definition of this composite thermal soil property:
=√
C (6)
Here, is the soil thermal conductivity (W m−1 K−1) and C is theeat capacity (J m−3 K−1). was calculated with the model recentlyroposed by Lu et al. (2007), and C from the standard equatione.g. Van Wijk and De Vries, 1963), which assumes soil is com-osed of solids, water and air and that C linearly depends on theolume fractions of these phases, multiplied by their respectiveeat capacities.
Based on an analysis of the eleven general soil textural typessee Table 1 in MV2007a) � 0 and � * are given by:
0 = −1062.4�∗ + 1010.8 (7a)
∗ = 788.2�−1.29∗ (7b)
For the Kersten number, an amended version of the equationiven by Lu et al. (2007) was employed:
e = exp{
[
1 − S−ır
]}(8)
here Sr is �/�*, is a soil-texture dependent parameter and ı is ahape parameter.
Parameters and ı were optimised so as to adequately describehe shape of normalised � , because the Kersten number in Lu etl. (2007) was used to describe the shape of thermal conductiv-ty (rather than thermal inertia) versus soil moisture content. Son Eq. (8), ı = 2.0 and = 1.78 for coarse-textured soils (fraction ofand content, FS > 0.8), ı = 1.5 and = 0.93 for fine-textured soilsFS < 0.4) and ı = 4.0 and = 3.84 for medium textured soils, with
ntermediate FS values (see MV2007a).At this point it is worth mentioning that Lu et al. (2009) presentn updated version of the MV2007a thermal inertia model. For � 0
hey also use Eq. (7a), but they explicitly define � * as �∗ =√
∗C∗,
Meteorology 154– 155 (2012) 55– 66 57
where the symbol * again denotes saturation, rather than usingEq. (7b). This caused � * to be slightly higher, at least for the twoChinese silt loam soils presented in their Fig. 3. They used a similartype of equation to represent the shape of the curve (Kersten curve),and determined model-specific parameters ε and m for two groupsof soils: 2.95 and 0.16, respectively, for coarse soils (FS > 0.4), and0.60 and 0.71 for fine soils (FS < 0.4). The implications, for remote Gestimates, of using this marginally different equation for � will betested in Section 3.3.
2.1.2. Overview of methodThe method described above to calculate G from remote sensing
requires the following variables: brightness temperature estimates(TB, required for the harmonic analysis employed to derive theparameters used in Eq. (2): An and �n), soil moisture content, �,to obtain the relative saturation, Sr, used in Eq. (8), and LAI neededfor calculation of fractional soil coverage, fs.
Required parameters comprise soil porosity (i.e. saturated soilmoisture content, �*) and soil textural information; the fraction ofsand, FS, is required to establish what ı and values to use in Eq.(8)). If values of �* are not available, pedotransfer functions could beused to derive �* from texture, see e.g. Cosby et al. (1984). Alterna-tively, porosity values could be determined for a few choice texturalgroups (coarse, medium, fine; see also MV2007a).
2.2. The study-area: AMMA Fakara domain
The remote sensing data needed to drive the model equationspresented in Section 2.1, and the ground-based data needed to pro-vide verification of the method, were obtained in the framework ofthe African Monsoon Multidisciplinary Analysis (AMMA) program(Redelsperger et al., 2006; http://www.amma-international.org/).In this paper we focus on the Fakara domain, which is situated inthe south-western part of Niger (Cappelaere et al., 2009); latitude:13.5–13.9◦ N, longitude 2.2–2.8◦ E. A detailed description of themain characteristics of the study area can be found in Cappelaereet al. (2009) and Ramier et al. (2009).
The micrometeorological data, as described in Section 2.4, weregathered during the AMMA-Catch experiment (Lebel et al., 2009)at the Wankama site. Spatio-temporal estimates of G were calcu-lated using the method described in Section 2.1, for June–October2005. During this period remote sensing as well as in situ data wereavailable. This period comprises the rainy season, characterised byrainfall events and well-defined dry-downs, thereby offering theopportunity to rigorously test the methodology.
2.3. Earth observation data
2.3.1. Land surface temperature (LST)The land surface temperature product (LST for 3 km × 3 km,
one image 15 min−1) derived from Meteosat Second Generation(MSG)-SEVIRI data and provided by the EUMETSAT-Satellite Appli-cation Facility on Land Surface Analysis (Land SAF) has been usedto represent values of brightness temperatures, TB. Note thatthese data were averaged to half-hourly values for the harmonicanalysis required in Eq. (2). In order to remove remaining cloud-contaminated data not detected by the Land SAF processing, asimple filtering methodology was applied on the LST timeseries.The algorithm, based on smoothing and thresholding techniques,is applied at the pixel scale. It derives from the diagnosis that cloudydata are usually observed at the end of the afternoon and are colderthan the expected surface temperature cooling. The methodology
comprises three steps: (1) the raw LST signal is smoothed; (2)cloudy data are eliminated by application of a 2 K threshold onthe signal difference smooth minus raw LST; (3) A final smooth-ing procedure is applied to the remaining data. This methodology
58 A. Verhoef et al. / Agricultural and Forest Meteorology 154– 155 (2012) 55– 66
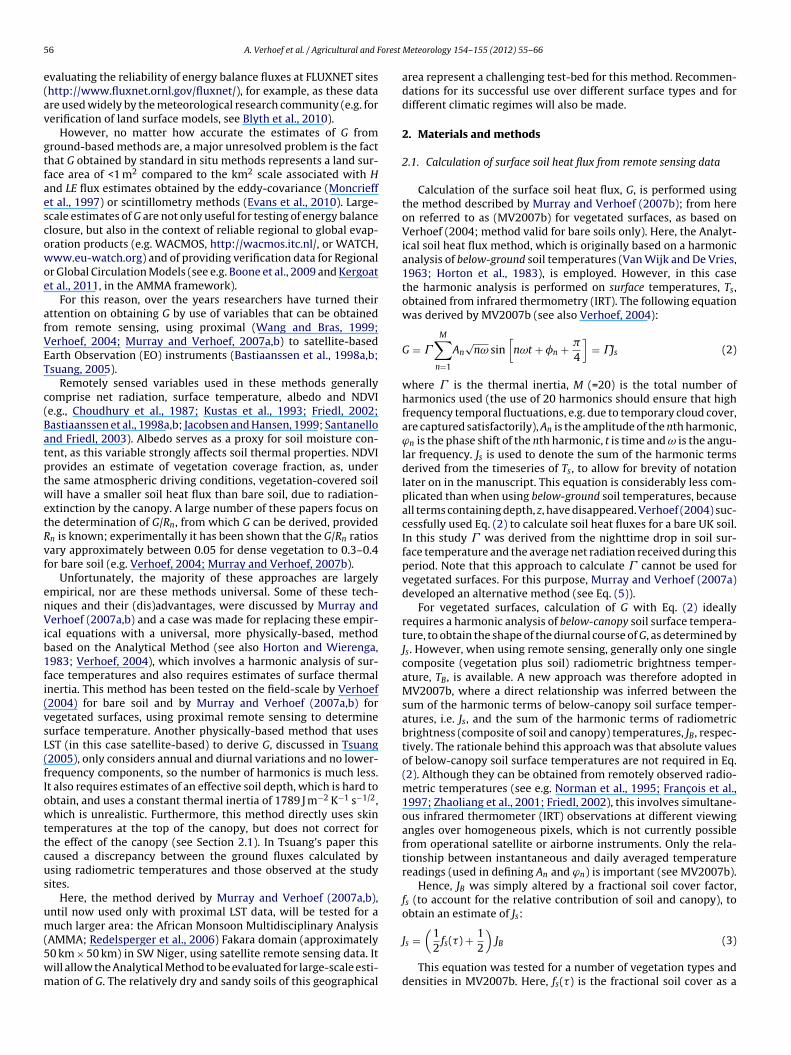
Fig. 1. The 3-by-3 km pixel land use cover fraction, over the entire Fakara domain, for the three most important vegetation types: a) old fallow; b) recent fallow and c) crop.T
sl
ATsw
2
abiaibw1
dbww
he X denotes the pixel where the Wankama experimental sites are situated.
uccessfully eliminated cloudy data, which were especially preva-ent during the rainy season (see Saux-Picart et al., 2009a).
A regular grid of 3 km by 3 km pixels was used to cover theMMA Fakara domain, an approximately 50 km by 40 km region.he data were provided for 266 grid-boxes (19 columns, 14 rows,ee e.g. Figs. 1 and 2), but strictly speaking only 190 of these wereithin the Fakara domain.
.3.2. Near-surface soil moisture contentSoil moisture estimates were obtained from remote sensing data
s described in detail in Zribi et al. (2007). The estimates wereased on 15 sets of ASAR/ENVISAT C-band radar data, acquired dur-
ng the 2004 and 2005 rainy seasons. Simultaneously with radarcquisitions, ground soil moisture measurements were carried outn a large number of test fields. A high correlation was observedetween in situ measurements and processed radar data. Imagesere available in 2005 for 5 July, 7 July, 21 July, 26 July, 9 August,
1 August, 30 August and 15 September.
Soil moisture data were interpolated between these dates,espite the occurrence of some rain events between those dates,ecause continuous remote � information was not available. Thisill lead to unavoidable errors in soil moisture estimates, whichill be evaluated and discussed in Section 3.3.
2.3.3. Land cover mappingThe Fakara region is characterised by dissected plateaus, which
are largely covered with tiger bush, a patterned ecosystem consist-ing of alternating bands of trees or shrubs separated by quasi-baresoils. In the valleys of these plateaus the vegetation is dominatedby cultivated fields (mainly millet) and fallow savannahs (Saux-Picart et al., 2009a). A land cover map was derived from SPOT-HRVimages (20 m resolution), identifying eight classes. Three classeswere identified over the plateaus: bare soils, sparse vegetationand dense vegetation (corresponding to the tiger bush bands),and four classes in the valleys: recent and old fallows, crops anddegraded soils; a water class was also considered. The result-ing land cover map is presented in Saux-Picart et al. (2009a),Fig. 2.
Bare soils represent the dominant class over the plateaus (17.6%)whereas fallows and crops are dominant in the valleys with respec-tive average fractions of 38.9% and 25.9%. Degraded soils represent10% of the total area and free water only 0.1%. The Wankama site isin a valley (Saux-Picart et al., 2009a).
2.3.4. Seasonal variations in LAIA set of nine SPOT-HRV images was acquired over the region
during the year 2005; seven images were cloudless and covered the

A. Verhoef et al. / Agricultural and Forest Meteorology 154– 155 (2012) 55– 66 59
Fig. 2. Leaf area index (LAI in m2 m−2) over the Fakara domain, based on SPOT-HRV images, for: a) 6 June (DOY 157); b) 7 July (DOY 188); c) 3 August (DOY 215); d) 12S
wv1TmP
2
cc(poimsnt
eptember, 2005 (DOY 255).
hole Fakara domain. These images were used to analyse seasonalariations in vegetation growth (dates: 6 June, 13 July, 3 August,2 September, 28 September, 14 October, and 25 October 2005).he leaf area index, LAI, was estimated with the neuronal inversionethodology summarised in Baret et al. (2007) and applied in Saux-
icart et al. (2009a).
.4. In-situ observations at the Wankama site
The soil texture for the Wankama site was determined as <10%lay, <10% silt and 80–90% sand. Hence, because fraction of sandontent, FS, was larger than 0.8, we used ı = 2.0 and = 1.78 in Eq.8). Dry bulk density was estimated by taking undisturbed sam-les of soil with known volume, and measuring their weight afterven drying for 48 h. At 10 cm, dry bulk density (from which poros-ty can be calculated) ranged between 1560–1650 kg m−3 near the
illet experimental station and 1400–1550 kg m−3 near the fallowtation. However, it was 1650–1810 kg m−3 at another fallow plotearby in the Wankama catchment. Bulk density for both surfaceypes was therefore assumed to be 1600 kg m−3 in all calculations.
Soil physical and meteorological variables were acquired at twomicrometeorological sites (fallow savannah and millet) situated inthe Fakara domain, close to Wankama village. For both sites, soilvolumetric water content was measured using six CS616 watercontent reflectometers (Campbell Scientific Inc., Logan, USA) atdepths of 0.1, 0.5, 1.0, 1.5, 2, and 2.5 m whereas soil temperaturewas obtained at these same depths with T108 temperature probes(Campbell Scientific Inc., Logan, USA). Shortwave and longwaveradiation (downwelling and upwelling), wind speed, air temper-ature, and humidity were measured with a 30 min time step (seeRamier et al., 2009). Surface temperatures were calculated from thelongwave upwelling radiation by inverting the Stefan–Boltzmannequation and assuming an emissivity of 0.95. The temperaturescalculated in this way represent a composite (vegetation andsoil) surface temperature. Rainfall was measured using a 0.5 mmtipping-bucket rain gauge (Précis Mécanique, Bezons, France).
In-situ LAI was estimated in the field every two weeks, in50 × 50 m plots in the millet and fallow fields, from hemispher-ical photographs (Boulain et al., 2009), and time-interpolated bySaux-Picart et al. (2009b).

6 orest Meteorology 154– 155 (2012) 55– 66
2
cw
G
fssebtusa3
ho0
1daa
3
3
3
ttocfpawhtiifilue
tcFdavt
3
s
DOY
180 21 0 24 0 27 0 30 0
LAI (
m2 m
-2)
0.0
0.5
1.0
1.5Ground -ba sed, Fall ow savanna hGround -ba sed, Mill etRemote sen sing, Wan kama pixelSPOT image s availab le da tesAverage in-situ LAI
0 A. Verhoef et al. / Agricultural and F
.4.1. Soil physical calculationsThe Analytical Method, already mentioned in Section 2.1, in this
ase involving a harmonic analysis of temperatures at depths z > 0,as used to estimate in situ G:
in-situ(t) =(
C√
D)
in-situ
M∑n=1
{A0n
√nω exp
(−z
√nω/2D
)
sin(
nωt + ϕ0n + �
4− z
√nω/2D
)}(9)
Symbols are as described for Eq. (2). Twenty harmonics obtainedrom the timeseries of Tsoil at z = 0.1 m obtained for the Wankamaites were used; to get the soil heat flux at the surface, G, involvesetting z = −0.1 m in Eq. (9). Knowledge of the harmonic param-ters also allowed calculation of surface temperature (z = 0), foroth sites, from the timeseries of Tsoil. For verification purposes,hese surface temperatures were compared to the MSG LST prod-ct obtained for the pixel in which the Wankama experimentalites are located (see Section 3.1), as well as to the surface temper-tures obtained from longwave upwelling radiation (see Section.1, Fig. 7).
Eq. (9) also required calculation of thermal diffusivity, D, andeat capacity, C, for the layer between 0 and 0.1 m depth. Estimatesf C were obtained using measurements of soil moisture content at.1 m depth and a value of dry bulk density (1600 kg m−3).
D was calculated with the Arctangent Method (Verhoef et al.,996), using soil temperature measurements, Tsoil, at 0.1 and 0.5 mepth. Despite the occurrence of vertical inhomogeneity, it wasssumed that this value was also valid for the soil layer between 0nd 0.1 m.
. Results and discussion
.1. Model driving data, including in situ verification
.1.1. Land use distributionFig. 1 shows the 3-by-3 km pixel land use coverage fraction, over
he entire Fakara domain, for the three most important surfaceypes. The X denotes the pixel where the Wankama micromete-rological field sites are situated. It has the following land useover fractions: 0.066, 0.045, 0.018, 0.012, 0.334, 0.175, and 0.35,or bare soil plateaus, sparse vegetation plateaus, dense vegetationlateaus, degraded hillslopes, crops, recently converted fallows,nd old fallows, respectively. Therefore, about a third of this pixelas covered by crops (during the growing season), and just overalf by fallow savannah (deciduous in the dry season). If we ignorehe minor land cover components, this means ∼40% was coveredn crops (millet essentially), the rest by fallow savannah, explain-ng the rationale behind the selection of the two meteorologicaleld sites. This weighting (a fraction of 0.4 covered by millet and a
and cover fraction of 0.6 covered by fallow savannah) will also besed when calculating the verification values of soil heat flux, forxample.
Crop cover (Fig. 1c) is generally largest in the bottom right quar-er of the Fakara domain (with a pronounced even denser strip forolumns 12–14, rows 8–14), whereas the old fallow coverage (seeig. 1a) is largest in the top centre area of the domain; a clearlyefined area (more or less in the shape of the letter X, see also Fig. 2nd related discussion) can be distinguished here. Recently con-erted fallow is relatively rare, with cover fraction <0.3 throughouthe domain.
.1.2. Leaf area indexFig. 2 shows LAI over the Fakara domain. Four dates out of the
even available were selected to illustrate the greening up of the
Fig. 3. LAI, as determined using manual methods over the fallow and millet experi-mental sites, as well as their average, plotted together with the remotely sensed LAIover the pixel representing the Wankama catchment (from SPOT-HRV).
area as a result of precipitation received during the rainy season andthe phenological behaviour of the vegetation in the Fakara domain.
According to the SPOT images and related analysis procedureemployed (see Section 2.3) LAI was never larger than 0.5. This valuecompares relatively well to the average of the ground-based LAIvalues at the Wankama site (presented in Fig. 3 as a function ofDay of Year, DOY, together with the individual LAI for savannahand millet; these data are based on interpolations of in situ LAI,determined manually, see Section 2.4).
The timing of the SPOT images unfortunately meant that partof the considerable peak in the 2005 growing season fallow savan-nah LAI was missed. This peak is visible for the fallow savannahin situ LAI data (around DOY 255, towards the middle of September).According to Fig. 3, SPOT-based LAI may have underestimatedin situ LAI between DOY 240–270, but taking into account within-pixel variability, remotely sensed LAI estimates can be consideredadequate.
Fig. 2a shows that LAI is 0.10 m2 m−2 or less on 6 June (DOY 157).However, the arrival of the rains in the Fakara domain at the end ofJune (i.e. around DOY 180, see Fig. 5, which shows the timeseriesof the Wankama rainfall as an illustration of this) causes a green-ing up, in particular in the X-shaped area where the old fallowsdominate (see land cover fraction in Fig. 1a, columns 6–14, rows1–8), as shown in Fig. 2b. The area of pixels with LAI > 0.30–0.35increases throughout August and early September; the pattern inFig. 2d (12 September, DOY 255) roughly reflects the areas cov-ered with old fallows and crops (see Fig. 1a and c). Although therainfall was obviously spatially variable over the Fakara domain,the Wankama precipitation data shown in Fig. 5 are a good rep-resentation of the sequence of wetting up and drying down cyclesobserved over the domain during the 2005 wet season and howthis affects LAI.
Fraction of vegetation cover and type of vegetation (as shown inFig. 1) will affect the soil heat flux as a result of shading: under thesame atmospheric and surface conditions (texture, soil moisturecontent), G for a pixel totally or largely occupied by bare soil will belarger than that for a vegetated pixel. Furthermore, the LAI of thevegetation (presented in Fig. 2) will affect the surface soil heat flux(see Eq. (4) in Section 2.1): the denser the vegetation, the smallerG.
However, vegetation can also have an indirect effect on soil heatflux via its influence on thermal soil properties through soil mois-ture content. Root water uptake will reduce soil moisture contentand hence reduce thermal conductivity. Furthermore, vegetation

A. Verhoef et al. / Agricultural and Forest Meteorology 154– 155 (2012) 55– 66 61
F centab ber (D
cb
3
tgi0AFaaasr
rbWblrsJttsi
data (apart from for DOY 223).Fig. 5 shows that towards the end of the period (after DOY 235),
in situ near surface � for millet is considerably larger than that forthe fallow savannah, despite the fact that rainfall amounts were
ig. 4. Spatial distribution of near-surface soil moisture content (expressed as a per) 26 July (DOY 207); c) 9 August (DOY 221); d) 30 August (DOY 242); e) 15 Septem
an act as an umbrella and intercept rainwater, part of which maye lost as direct evaporation from the canopy.
.1.3. Soil moisture contentThe spatial distribution of ASAR near-surface soil moisture con-
ent over the Fakara domain for 5 dates throughout the 2005rowing season is shown in Fig. 4 (expressed as a percentage, i.e. �n m3 m−3 × 100). Observed values for ASAR data never exceeded.15 m3 m−3 and were at their maximum in late August (Fig. 4d, 30ugust, DOY 242). After that, soil moisture rapidly declines (seeig. 4e) as a result of the high evaporative demand of this areand the peak in vegetation activity (see Figs. 2 and 3). Note a drynomaly for the pixel represented by column 6, row 7, on all imagesfter 7 July 2005. This is related to an interpolation error whereome data points have been removed due to their high surfaceoughness value (Plateaus) as this causes unreliable ASAR �-values.
Fig. 5 compares the ASAR data (with the actual data values rep-esented by open circles and the interpolations by a solid line inetween these points) for the domain gridbox representing theankama site, and the in situ soil moisture content assumed to
e representative of this gridbox, for the fallow savannah and mil-et site, throughout the rainy season. Correspondence betweenemotely sensed and in situ data is relatively good, although at thetart of the rainy season (DOY 186 (5 July), 188 (7 July) and 207 (26uly)) the 3-by-3 km average ASAR data are significantly lower than
hose measured in situ (up to approximately 0.04 m3 m−3 less). Theiming of these ASAR images also seems to coincide with the end ofignificant dry down periods, which causes Fig. 4a and b to give thempression of drought throughout the Fakara domain, even thoughge) over the Fakara domain, as derived from ASAR images, for: a) 7 July (DOY 188);OY 258), throughout the summer of 2005.
the LAI image (compare e.g. Fig. 2b to Fig. 4a) illustrates a greeningup of the area.
During the remainder of the period (i.e. for DOY 221 (9 August),242 (30 August) and 258 (15 September)) for which ASAR data areavailable, ASAR � corresponds well with either millet or savannah
Fig. 5. Rainfall recorded at the Wankama savannah site, as well as the in situ (10 cm)and remotely sensed (ASAR) near-surface soil moisture content, between DOY 160and 270 (9 June–27 September), 2005.

62 A. Verhoef et al. / Agricultural and Forest Meteorology 154– 155 (2012) 55– 66
F andar2 Y 246
p t noon
vnladFiodmtfr
ehThp
3
trsip
oah(sdsdl
r
ig. 6. Average land surface temperature (LST, obtained from MSG-data), and its st29, 234 and 239, figures a, b, c, and d, respectively) and 3 and 12 September (DOlaced at 0.25, 0.5, 0.75 and 1.0 of each DOY (i.e. every 6 h, with e.g. 222.5 represen
ery comparable. This may have been caused by the fact that savan-ah LAI increased substantially after DOY 240 (see Fig. 3), most
ikely as a result of a steep increase in understorey LAI (causing larger root water uptake and hence near-surface soil moistureepletion), whereas the millet crop LAI stayed more or less constant.urthermore, the millet roots would have been located deepern the soil profile than the fallow understorey layer composedf grasses and forbs. Hence, the savannah understorey may haveepleted near surface � more than would have been the case for theillet crop. Also, runoff would have been slightly different at the
wo sites; because of the propensity of these soils to develop sur-ace crusts and the high intensities of convective rainfall, Hortonianunoff can be very substantial.
ASAR data are particularly sensitive to vertical soil moisture het-rogeneity in the first centimeters of the soil profile and this mayave caused the discrepancy between the ASAR and in situ data.he high, and relatively variable, evaporation in this region willave induced a high variability in the near-surface soil moisturerofile, more so than in humid regions of Europe, for example.
.1.4. Spatiotemporal variation of LSTsReliable values of LST, or rather of their amplitude and fluctua-
ions, are crucial in the remote determination of G (see Eq. (2) andelated description); hence they are studied in more detail in thisection. In Section 3.3 the relative influence of thermal inertia, andts sensitivity to the variables determining this parameter, will beresented and discussed.
LST will vary throughout the domain, predominantly as a resultf spatial variation in vegetation cover fraction (Fig. 1), LAI (Fig. 2),nd surface soil moisture status, � (Fig. 4), as these variables willave a considerable effect on the fluxes in the energy balance (Eq.1)), in particular on evapotranspiration. Pixels with bare soil orparse vegetation are expected to have higher peak temperaturesuring the day (little or no transpiration and a rapidly declining bareoil evaporation after rainfall) and lower minimum temperatures
uring the night-time (no insulation by vegetation layer), hencearger diurnal surface temperature amplitudes.Fig. 6 shows the Fakara domain average LST, from hereon
eferred to as 〈LST〉 and standard deviation, �LST, for six dates
d deviation, over the Fakara domain for six dates: 10, 17, 22, 27 August (DOY 222,and 255, figures e and f, respectively) throughout the 2005 season. Tickmarks are
on DOY 222).
throughout the season. 〈LST〉 varies roughly between 20 ◦C (night-time) and 50 ◦C, hence the maximum amplitude (defined as(LSTmax − LSTmin)/2) is approximately 15 ◦C.
A clear contrast in 〈LST〉 amplitude is visible when comparingdays such as 17 August (DOY 229), 27 August (DOY 239) and 3September (DOY 246), that have a less pronounced diurnal curveand large �LST, with 10 August (DOY 222), 22 August (DOY 234) and12 September (DOY 255) that show a distinct peak and lower �LSTvalues.
For DOY 246 (3 September) very low values of Rn (maxi-mum of 200 Wm−2, data not shown) were measured for theWankama site during the daytime, illustrating this was a cloudyday, most likely throughout the entire domain. By contrast, DOY255 (12 September) was a perfectly clear day (maximum Rn of600 W m−2), hence the large amplitude in 〈LST〉. Furthermore, thisday had low �-values, and generally low spatial variation in �over the Fakara domain (see Fig. 4e) and hence low values of�LST.
The features presented in Figs. 2, 4 and 6, detailing the spatialvariability of LAI, � and LST, respectively, will affect the spatiotem-poral patterns of soil heat flux G. This will be discussed in Section3.2.
3.1.5. Surface temperature verificationVerification of the MSG LST estimates was possible via two sets
of in situ data: a composite Ts was derived from longwave upwellingradiation, whereas Tsoil at z = 0 was calculated from soil tempera-tures, using the procedures described in Section 2.4.
Fig. 7 shows the comparison between remotely sensed LST (forthe Wankama pixel) and in situ (derived from soil temperatures aswell as from longwave upwelling radiation) ‘LST’ for seven days,between early August and the middle of September. Both in situvalues are averages, based on the coverage fractions of savannahand millet (0.6 and 0.4, respectively).
The two sets of in situ data (Ts and Tsoil (z = 0)) are very similar,
which can be taken as proof of their reliability. It also emphasisesthe sparsity of the vegetation, i.e. the downward facing long-waveradiometer is mainly sensing soil, i.e. largely looking in betweenthe leaves of the low-LAI vegetation.
A. Verhoef et al. / Agricultural and Forest Meteorology 154– 155 (2012) 55– 66 63
Fig. 7. Comparison between LST obtained from MSG and average (40% millet, 60% fallow) in situ (soil) surface temperature derived from 1) a harmonic analysis on soilt mois( ed fro
dctrtu
3
idtfcL
hetptRt
utrvetF
O
emperatures at 0.10 m depth. Required thermal properties were derived from soilsee Section 2.4) and; 2) composite (soil and vegetation) surface temperature deriv
Fig. 7 shows that late afternoon and night-time MSG-SEVIRI LSTata are generally lower than in situ data, possibly because of theorrections related to cloud-cover. Notwithstanding, the ampli-udes of MSG LST, as well as their diurnal shape, are relativelyealistic compared to in situ data. This knowledge is important inhe context of estimation of G, and appraisal of its soundness, theltimate aim of this paper.
.2. Soil heat flux and verification
Fig. 8 shows the domain-average soil heat flux, 〈G〉, as well asts standard deviation �G (based on all pixels within the Fakaraomain), as calculated with Eq. (2) from remote sensing data. Thesehree plots present 2-day periods that coincide with those shownor Wankama LST in Fig. 7. Furthermore, these dates overlap or arelose to the days for which we have remotely sensed (SPOT-HRV)AI data and ASAR � data.
Soil heat fluxes derived from remote sensing shown in Fig. 8ave a realistic diurnal course, with a peak just before noon, asxpected. For each day, we anticipate net heating/cooling of the soilo approximately balance, i.e. the area below the curve reflectingositive 〈G〉 to be similar to that below zero; Fig. 8 certainly reflectshis. The soil undergoes net cooling during the monsoon season (seeamier et al., 2009), which causes the integral of negative G valueso be slightly larger than the integral of positive G values.
Maximum values of 〈G〉 are around 200 W m−2, minimum val-es around −100 W m−2. The range of maximum values of G overhe grid varies between 50 and 250 W m−2, the minimum valuesoughly between −25 and −150 W m−2 (data not shown). Thesealues are very similar to those presented in e.g. Passerat de Silanst al. (1997) and Verhoef and Allen (2000), as obtained during
he HAPEX-Sahel experiment in 1992 in the vicinity of the AMMAakara domain.The values of �G vary diurnally; �G can be as large as 〈G〉 itself.ne may expect it to be lowest during the night when �LST is lowest
Fig. 8. Domain average diurnal course of G estimated with Eq. (2), for three 2-d
ture content measured at 0.10 m and from knowledge of soil textural compositionm longwave upwelling radiation, for 7 days throughout the season.
(see Fig. 6 where a clear day-night distinction is visible, especiallyfor days with spatially variable cloud cover such as DOY 229, 239and 246). However, Fig. 8 shows that �G for negative 〈G〉 is relativelylarge during the night and especially during the afternoon, for DOY237–238. This has to do with the fact that it is not just the spatialvariability of TB (i.e. LST) that affects �G, but also that of � (affectingthermal inertia � , see Fig. 10). The contribution of � (and hencethe effect of its spatial variability on G) compared to Js is relativelylarge during the night.
Fig. 9 compares the remote surface soil heat flux for theWankama pixel and the average in situ soil heat flux derived by themethod described in Section 2.4. Gin-situ and Gremote compare rela-tively well, especially towards the middle (DOY 237–239) and end(DOY 256–258) of the period under consideration (DOY 214–258,before and after this time-span there were gaps in the LST data;the remote Analytical Method was only used for days when all 48half-hours were available).
The discrepancy between Gin-situ and Gremote for DOY 215–216is most probably linked to a larger landscape heterogeneity at thebeginning of the vegetation growing season. Indeed, we are com-paring G-fluxes that are representative of areas with completelydifferent sizes (<1 m2 compared to 9 km2), so that the effect ofsmall-scale variability may have caused Gin-situ to be atypical dur-ing this earlier part of the season, when vegetation was particularlysparse.
Other reasons may also explain the discrepancies observedbetween Gin-situ and Gremote in Fig. 9a. The values of in situ G dependon the harmonic analysis of Tsoil at 0.10 m, and on the thermalproperties thermal diffusivity, D, and heat capacity, C. Values ofD and C could have been overestimated because of the fact that soilmoisture sensors were installed at the same depth as the thermis-
tors (0.1 m), rather than at 0.05 m depth, for example, to be morerepresentative of the layer between 0 and 0.10 m.Gremote could have been underestimated because of � estimatedfrom ASAR being much lower than in situ � (and hence � being
ay periods throughout the season. Error bars denote standard deviation.

64 A. Verhoef et al. / Agricultural and Forest Meteorology 154– 155 (2012) 55– 66
Fig. 9. A comparison of the diurnal soil heat flux calculated with Eq. (2) (the remote Analytical Method, using MSG-SEVIRI land surface temperatures) for the Wankama pixel( tainedm
tl2
atal
vSds
nokflm
3
3
stFct
Fpts
3 by 3 km2) and an in situ estimate of G (at the Wankama meteorological site) obillet, 60% fallow).
oo low). Fig. 5 shows that this was not the case; ASAR � interpo-ated between DOY 207 and DOY 221 (to give the values for DOY15–216) matches rather well with in situ �.
Also, Fig. 3 shows that LAIremote was close to average in situ LAInd therefore most likely represented a realistic value. Therefore,he reason for the comparatively large discrepancy between Gin-sitund Gremote for DOY 215–216, other than being caused by largerandscape heterogeneity, is not immediately clear.
Finally, note that in situ G-values are much more temporallyariable; this is a general feature of the in situ Analytical Method.oil heat flux plates were installed at the Wankama site, but theirata were not used because adequate information to calculate heattorage above the plates was not available.
The remote method generally provides a much smoother sig-al, especially during the night. This is the result of the pixel sizef the temperature measurement: the spatial integration over theilometric pixel scale compensates the small-scale temperatureuctuations, driven by the turbulent atmospheric flow, which areeasured at the local site.
.3. Sensitivity of G to model input variables and parameters
.3.1. Effect of soil thermal inertia� will impact on absolute G-values in a linear fashion (it is a
traight multiplication factor in Eq. (2)). Fig. 10a shows how sensi-
ive � is to �, especially at low �-values, as is the case for the AMMAakara domain. The curve representing the MV2007a model is cal-ulated using parameter values characteristic for the sandy soils inhe Fakara domain.ig. 10. (a) Thermal inertia as a function of relative saturation, as calculated by the modaper), and as derived from the equations presented in Lu et al. (2009); (b) Thermal inerhe standard soil parameter configuration for the Fakara domain, as well as with a 10% ioil-texture dependent parameter and shape parameter in Eq. (8)).
from the in situ Analytical Method (Eq. (9)). In-situ G represents an average (40%
Fig. 10a highlights that it crucially important to use reliable esti-mates of EO-based � when calculating � . Note, however, that forsoils with a less sandy texture, � is not so strongly dependent on �(see MV2007a). The curve in Fig. 10a represents the most extremecase; the dry, sandy Fakara catchment therefore provides a rigor-ous test case for our method. In wetter climates, especially for soiltypes of a finer texture, an error in � would have a much smallereffect on G.
The interpolation of the ASAR � data between the avail-able dates (see large open circles in Fig. 5) will have causeda considerable error (especially when rainfall occurrences tookplace in between the ASAR observations), which would haveaffected � and hence G. It is therefore recommended to useremotely sensed � data with as high a temporal resolution aspossible.
In Fig. 10a we also briefly explore the effect of a different �parameterisation (that of Lu et al., 2009, as described briefly in Sec-tion 2.1.1). Fig. 10a shows that differences between both models arevery small and that remote G-estimates are unlikely to be affectedby choice of thermal inertia model.
As the MV2007a (as well as the Lu et al. (2009) method for thatmatter) method to calculate � relies on texture estimates from soilmaps and derivation of soil physical parameters (i.e. �*) from pedo-transfer functions, dependent on these texture estimates, Fig. 10billustrates the implications of a 10% relative error in �*, or in fraction
of sand, FS.The effect of �* on � increases as � increases, because � * is moreaffected than � 0 (a power function compared to a linear equation,see Eqs. (7a) and (7b)). At the mid-value of the range of soil moisture
el described by Murray and Verhoef (2007a) (i.e. from Eqs. (5), (7) and (8) in thistia as a function of relative saturation, as calculated by MV2007a, calculated usingncrease or decrease in �*, or a 10% decrease in fraction of sand (FS; this affects the

orest
cdi
tmi�1cc
3
rF0fwt0twˇtim
4
MLGmltdlti
arfiWmfm
wvG<b
bitTss
A. Verhoef et al. / Agricultural and F
ontents observed over the Fakara domain, the relative increase orecrease in � would have been 10–12% and hence a 10–12% change
n G would have occurred.A 10% relative decrease in sand content (from FS = 0.85
o 0.765) would have brought the Fakara soils just into theedium-textured soil grouping, thereby changing ı to 4.0 and
to 3.84. The curve representing this configuration is shownn Fig. 10b by the dotted line. This would have decreased
values, and hence G, in the Fakara �-range by about5–20%. Most soils, however, will fall unequivocally within theoarse (FS > 0.8), medium-textured, or fine-textured (FS < 0.4)ategories.
.3.2. Effect of LAI and canopy extinction coefficient on JS/JBFinally, the ratio JS/JB was calculated as a function of LAI, for the
ange of values found over the Fakara domain (0–0.75 m2 m−2, seeig. 3; 0–0.5 m2 m−2 for LAI derived from SPOT images and up to.75 m2 m−2 found for the average in situ LAI values), and three dif-erent values of canopy extinction coefficient ( = 0.3, 0.5 and 0.7; ˇas assumed to be 0.5 over the Fakara domain); data not shown. For
hese LAI values JS/JB ranged (in a linear fashion) between 1.0 and.75 (for = 0.7; JS/JB was higher for lower ˇ-values). It appearedhat an absolute error of 0.10 m2 m−2 in LAI at e.g. LAI = 0.25 m2 m−2
ould only cause an error in JS/JB, and hence in G, of around 3% (for = 0.7). This error was even less for smaller values. The rela-
ively small sensitivity of G to ˇ, LAI and viewing angle, �, was alsollustrated in MV2007b, which underlines the robustness of this
ethod.
. Conclusions
This paper presents a physically-based method (the Analyticalethod, based on harmonic analysis of land surface temperature,
ST) that allows spatiotemporal estimates of surface soil heat flux,, to be determined from remotely sensed variables and an esti-ate of soil texture. Variables required are surface temperature,
eaf area index and near-surface soil moisture content. In this casehese were obtained from MSG-SEVIRI LST, SPOT-HRV and ASARata over the AMMA Fakara domain. The scale of G estimates is
argely determined by the resolution and frequency with whichhe surface temperature is available; for MSG-SEVIRI LST data thiss 3 km × 3 km and every 15 min.
The approach requires a substantial amount of input, but thedvantage is that the method is robust, universal and ensures aeliable diurnal course of G, unlike existing methods that derive Grom net radiation and NDVI or albedo, with the latter two serv-ng as proxies of vegetation coverage and soil moisture content.
e encourage those research communities that require large-scaleodel verification or that provide evaporation products derived
rom the energy balance (see Eq. (1), LE = Rn − H − G) to test ourethod.Furthermore, with higher resolution EO data becoming more
idely available, this method will also be more successful at pro-iding ‘field-scale’ estimates of G, compared to methods that derive
from in situ soil physical equipment, as these have a footprint of1 m2 only. We postulate that this will generally improve energyalance closure.
Note that that this method requires diurnal data, which can onlye obtained from geostationary instruments. The spatial resolution
n the thermal infrared for these instruments may reach 300 m in
he near future, which is close to field-scale (approximately 100 m).his opens up the opportunity of using EO radiometers and down-caling techniques to obtain estimates of G at scales equal to ormaller than field-scale.Meteorology 154– 155 (2012) 55– 66 65
Acknowledgements
The data used in this study were obtained as part of the AMMAprogramme (Based on a French initiative, AMMA was built by aninternational scientific group and is currently funded by a largenumber of agencies, especially from France, UK, US and Africa. Ithas been the beneficiary of a major financial contribution fromthe European Community’s Sixth Framework Research Programme.Detailed information on scientific coordination and funding isavailable on the AMMA International web site, http://www.amma-international.org.), as well as the French ECCO-PNRH “Eau etvégétation au Niger” project and the AMMA-Catch observation sys-tem (www.amma-catch.org). The assistance with data-collectionof the IRD team in Niamey is gratefully acknowledged. We thankEUMETSAT-SAFLAND for providing the LST data. We are grateful toPier Luigi Vidale for optimising the Fortran modelling code.
References
Baret, F., Hagolle, O., Geiger, B., Bicheron, P., Miras, B., Huc, M., Berthelot, B., Nino,F., Weiss, M., Samain, O., Roujean, J.L., Leroy, M., 2007. LAI, fAPAR and FCoverCYCLOPES global products derived from VEGETATION, part 1: principles of thealgorithm. Remote Sens. Environ. 110, 275–286.
Bastiaanssen, W.G.M., Menenti, M., Feddes, R.A., Holtslag, A.A.M., 1998a. The Sur-face Energy Balance Algorithm for Land (SEBAL): Part 1 formulation. J. Hydrol.212–213, 198–212.
Bastiaanssen, W.G.M., Pelgrum, H., Wang, J., Ma, Y., Moreno, J., Roerink, G.J., Van DerWal, T., 1998b. The Surface Energy Balance Algorithm for Land (SEBAL): Part 2validation. J. Hydrol. 212–213, 213–229.
Blyth, E., Gash, J., Lloyd, A., Prior, M., Weedon, G., Shuttleworth, J., 2010. Evaluatingthe Jules land surface model energy fluxes using Fluxnet data. Bull. Am. Meteorol.Soc. 11, 509–519.
Boone, A., de Rosnay, P., Balsamo, G., Beljaars, A., Chopin, F., Decharme, B., Delire, C.,Ducharne, A., Gascoin, S., Grippa, M., Guichard, F., Gusev, Y., Harris, P., Jarlan, L.,Kergoat, L., Mougin, E., Nasonova, O., Norgaard, A., Orgeval, T., Ottlé, C., Poccard-Leclercq, I., Polcher, J., Sandholt, I., Saux-Picart, S., Taylor, C., Xue, Y., 2009. TheAMMA Land Surface Model Intercomparison Project (ALMIP). Bull. Am. Meteorol.Soc. 90, 1860–1880.
Boulain, N., Cappelaere, B., Ramier, D., Issoufou, H.B.A., Halilou, O., Seghieri, J.,Guillemin, F., Gignoux, J., Timouk, F., 2009. Towards an understanding of cou-pled physical and biological processes in the cultivated Sahel – 2. Vegetationand carbon dynamics. J. Hydrol. 375 (1–2), 190–203.
Cappelaere, B., Descroix, L., Lebel, T., Boulain, N., Ramier, D., Laurent, J.-P., Le Breton,E., Mamadou, I., Boubkraoui, S., Bouzou Moussa, I., Favreau, G., Issoufou, H.B.A.,Nazoumou, Y., Quantin, G., Chaffard, V., Ottlé, C., 2009. The AMMA-Catch exper-iment in the cultivated Sahelian area of south-west Niger – investigating watercycle response to a fluctuating climate and changing environment. J. Hydrol. 375(1–2), 34–51.
Choudhury, B.J., Idso, S.B., Reginato, J.R., 1987. Analysis of an empirical model forsoil heat flux under a growing wheat crop for estimating evaporation by aninfrared-temperature based energy balance equation. Agric. For. Meteorol. 39,283–297.
Clapp, R.B., Hornberger, G.M., 1978. Empirical equations for some soil hydraulicproperties. Water Resour. Res. 14, 601–604.
Cosby, B.J., Hornberger, G.M., Clapp, R.B., Ginn, T.R., 1984. A statistical exploration ofthe relationships of soil moisture characteristics to the physical characteristicsof soils. Water Resour. Res. 20, 682–690.
Evans, J.G., McNeil, D.D., Finch, J.F., Murray, T., Harding, R.J., Verhoef, A., 2010. Evap-oration measurements at kilometre scales determined using two-wavelengthscintillometry. In: Proceedings of the BHS Third International Symposium: Roleof Hydrology in Managing Consequences of a Changing Global Environment,19–23 July 2010, Newcastle University, Newcastle upon Tyne, UK, pp. 794–799.
Foken, T., 2008. The energy balance closure problem: an overview. Ecol. Appl. 18,1351–1367.
Franc ois, C., Ottlé, C., Prévot, L., 1997. Analytical parameterization of canopy direc-tional emissivity and canopy directional radiance in the thermal infrared.Application on the retrieval of soil and foliage temperatures using two direc-tional measurements. Part 1: Theory. Int. J. Remote Sens. 18, 2587–2621.
Friedl, M.A., 2002. Forward and inverse modelling of land surface energy balanceusing surface temperature measurements. Remote Sens. Environ. 79, 344–354.
Heitman, J.L., Horton, R., Sauer, T.J., Ren, T., Xiao, X., 2010. Latent heat in soil heatflux measurements. Agric. For. Meteorol. 150, 1147–1153.
Heusinkveld, B.G., Jacobs, A.F.G., Holtslag, A.A.M., Berkowicz, S.M., 2004. Surfaceenergy balance closure in an arid region: role of soil heat flux. Agric. For. Mete-orol. 122, 21–37.
Horton, R., Wierenga, P.J., Nielsen, D.R., 1983. Evaluation of methods for determiningthe apparent thermal diffusivity of soil near the surface. Soil Sci. Soc. Am. J. 47,25–32.
Horton, R., Wierenga, P., 1983. Estimating the soil heat flux from observations of soiltemperature near the surface. Soil Sci. Soc. Am. J. 47, 14–20.

6 orest
J
J
K
K
L
L
L
L
M
M
M
M
N
O
O
6 A. Verhoef et al. / Agricultural and F
acobs, A.F.G., Heusinkveld, B.G., Holtslag, A.A.M., 2008. Towards closing the sur-face energy budget of a mid-latitude grassland. Boundary-Layer Meteorol. 126,125–136.
acobsen, A., Hansen, B.U., 1999. Estimation of the soil heat flux/net radiation ratiobased on spectral vegetation indexes in high-latitude Artic areas. Int. J. RemoteSens. 20, 445–461.
ergoat, L., Grippa, M., Baille, A., Eymard, L., Lacaze, R., Mougin, E., Ottlé, C., Pel-larin, T., Polcher, J., de Rosnay, P., Roujean, J.-L., Sandholt, I., Taylor, C.M., Zin, I.,Zribi, M., 2011. Remote sensing of the land surface during the African MonsoonMultidisciplinary Analysis (AMMA). Atmos. Sci. Lett. 12, 129–134.
ustas, W.P., Daughtry, C.S.T., van Oevelen, P.J., 1993. Analytical treatment of therelationships between soil heat flux/net radiation ratio and vegetation indices.Remote Sens. Environ. 46, 319–330.
ebel, T., Cappelaere, B., Galle, S., Hanan, N., Kergoat, L., Levis, S., Vieux, B., Descroix,L., Gosset, M., Mougin, E., Peugeot, C., Seguis, L., 2009. AMMA-CATCH studies inthe Sahelian region of West-Africa: an overview. J. Hydrol. 375 (1–2), 3–13.
iebethal, C., Huwe, B., Foken, T., 2005. Sensitivity analysis for two ground heat fluxcalculation approaches. Agric. For. Meteorol. 132, 253–262.
u, S., Ren, T., Gong, Y., Horton, R., 2007. An improved model for predicting soilthermal conductivity from water content at room temperature. Soil Sci. Soc. AmJ. 71, 8–14.
u, S., Ju, Z., Ren, T., Horton, R., 2009. A general approach to estimate soil watercontent from thermal inertia. Agric. For. Meterorol. 149, 1693–1698.
ayocchi, C.L., Bristow, K.L., 1995. Soil surface heat flux: some general questionsand comments on measurements. Agric. For. Meteorol. 75, 43–50.
oncrieff, J.B., Massheder, J.M., De Bruin, H., Elbers, J., Friborg, T., Heusinkveld, B.,Kabat, P., Scott, S., Soegaard, H., Verhoef, A., 1997. A system to measure surfacefluxes of momentum, sensible heat, water vapour and carbon dioxide. J. Hydrol.188–189, 589–611.
urray, T., Verhoef, A., 2007a. Moving towards a more mechanistic approach inthe determination of soil heat flux from remote measurements. I. A universalapproach to calculate thermal inertia. Agric. For. Meteorol. 147, 80–87.
urray, T., Verhoef, A., 2007b. Moving towards a more mechanistic approach in thedetermination of soil heat flux from remote measurements. II. Diurnal shape ofsoil heat flux. Agric. For. Meteorol. 147, 88–97.
orman, J.M., Kustas, W.P., Humes, K.S., 1995. Source approach for estimating soiland vegetation energy fluxes in observations of directional radiometric surface
temperature. Agric. For. Meteorol. 77, 263–293.chsner, T.E., Sauer, T.J., Horton, R., 2006. Field tests of the soil heat flux plate methodand some alternatives. Agron. J. 98, 1005–1014.
chsner, T.E., Sauer, T.J., Horton, R., 2007. Soil heat storage measurements in energybalance studies. Agron. J. 99, 311–319.
Meteorology 154– 155 (2012) 55– 66
Passerat de Silans, A., Monteny, B.A., Lhomme, J.P., 1997. The correction of soil heatflux measurements to derive an accurate surface energy balance by the Bowenratio method. J. Hydrol. 188–189, 453–465.
Ramier, D., Boulain, N., Cappelaere, B., Timouk, F., Rabanit, M., Lloyd, C.R., Boubkraoui,S., Métayer, F., Descroix, L., Wawrzyniak, V., 2009. Towards an understanding ofcoupled physical and biological processes in the cultivated Sahel – 1. Energy andwater. J. Hydrol. 375 (1–2), 204–216.
Redelsperger, J.L., Thorncroft, C., Diedhiou, A., Lebel, T., Parker, D., Polcher, J., 2006.African monsoon multidisciplinary analysis (AMMA): an international researchproject and field campaign, Bull. Am. Meteorol. Soc. 87, 1739–1746.
Santanello, J.A., Friedl, M.A., 2003. Diurnal covariation in soil heat flux and net radi-ation. J. Appl. Meteorol. 42, 851–862.
Sauer, T.J., Ochsner, T.E., Horton, R., 2007. Soil heat flux plate: Heat flow distortionand thermal contact resistance. Agron. J. 99, 304–310.
Saux-Picart, S., Ottlé, C., Decharme, B., Andre, C., Zribi, M., Perrier, A., Coudert, B.,Boulain, N., Cappelaere, B., Descroix, L., Ramier, D., 2009a. Water and energybudgets simulation over the AMMA-Niger super-site spatially constrained withremote sensing data. J. Hydrol. 375, 287–295.
Saux-Picart, S., Ottlé, C., Perrier, A., Decharme, B., Coudert, B., Zribi, M., Boulain, N.,Cappelaere, B., Ramier, D., 2009b. SEtHyS Savannah: a multiple source land sur-face model applied to Sahelian landscapes. Agric. For. Meteorol. 149, 1421–1432.
Tsuang, B-J., 2005. Ground heat flux determination according to land skin tem-perature observations from in-situ stations and satellites. J. Hydrometeorol. 6,371–390.
Van Wijk, W.R., De Vries, D.A., 1963. Periodic temperature variations in a homoge-neous soil. In: Van Wijk, W.R. (Ed.), Physics of plant environment. North-Holland,Amsterdam, pp. 103–143.
Verhoef, A., 2004. Remote estimation of thermal inertia and soil heat flux for baresoil. Agric. For. Meteorol. 123, 221–236.
Verhoef, A., Van den Hurk, B.J.J.M., Jacobs, A.F.G., Heusinkveld, B.G., 1996. Thermalsoil properties for a vineyard (EFEDA-I) and a savanna (HAPEX-Sahel) site. Agric.For. Meteorol. 78, 1–18.
Verhoef, A., Allen, S.J., 2000. A SVAT scheme describing energy and CO2 fluxes formulti-component vegetation: calibration and test for a Sahelian savannah. Ecol.Model. 127, 245–267.
Wang, J., Bras, R.L., 1999. Ground heat flux estimated from surface soil temperature.J. Hydrol. 216, 214–226.
Zhaoliang, L., Stoll, M.P., Zhang, R., Jia, L., Zhongbo, S., 2001. On the separate retrievalof soil and vegetation temperatures from ATSR Data. Sci. China D 44, 97–111.
Zribi, M., Saux-Picart, S., André, C., Descroix, L., Ottlé, C., Kallel, A., 2007. Soil mois-ture mapping based on ASAR/ENVISAT radar data over a Sahelian region. Int. J.Remote Sens. 28, 3547–3565.