Sustained action of multi-particulate system of telithromycin

Vision Research 44 (2004) 563–575
www.elsevier.com/locate/visres
Spatial-scale interaction in human stereoscopic vision in responseto sustained and transient stimuli
Elena Gheorghiu *, Casper J. Erkelens
Helmholtz Institute, Utrecht University, P.O. Box 80 000, 3508 TA Utrecht, The Netherlands
Received 17 February 2003; received in revised form 10 September 2003
Abstract
We investigated temporal properties of stereopsis at different spatial scales in dynamic random-dot stereograms (DRS) consisting
of (i) the repeated presentation of two image pairs (i.e. sustained presentation) and (ii) single presentations of two image pairs
(transient presentation). In dense stereograms perception of depth is possible if the levels of interocular correlation are above a
certain threshold. Therefore, detection of correlation is an important step in stereopsis. Across different experiments, we varied the
level of interocular correlation as a function of time by alternating correlated and un/anticorrelated random-dot stereograms. Also,
we varied their spatial scale (coarse, fine and alternating between coarse and fine). The presence of stereopsis was examined using a
forced-choice depth detection task. For both sustained and transient presentations of the stimuli, the results show that (i) stereopsis
has similar temporal properties at coarse and fine spatial scales; (ii) interaction between spatial scales depends on their relative sizes.
The results indicate a strong inhibitory influence of rivalry at a coarse scale on stereopsis at a fine scale, and just a weak inhibitory
influence of rivalry at a fine scale on stereopsis at a coarse scale.
This study provides experimental evidence for a hierarchical organisation of spatial scales in human stereoscopic vision based on
neural interaction instead of vergence eye movements.
� 2003 Elsevier Ltd. All rights reserved.
Keywords: Spatial scales; Stereopsis; Coarse-to-fine; Fine-to-coarse
1. Introduction
Random-dot stereograms (RDS) are powerful stimuli
to study the relationship between binocular disparity
and depth perception in humans because, in these ste-
reograms, disparity is the only source of depth. In order
to extract depth from random-dot stereograms the bin-
ocular visual system must solve the correspondenceproblem: which features in the left retinal image match
the features in the right retinal image. It is known that
disparity-sensitive neurons in V1 and V2 detect dispar-
ities between the two retinal images (Barlow, Blake-
more, & Pettigrew, 1967; DeAngelis, Ohzawa, &
Freeman, 1991; Poggio & Fisher, 1977). It is also known
that eye movements change the locations of the recep-
tive fields relative to the stimuli. To bring the images
* Corresponding author. Fax: +31-30-2522664.
E-mail address: [email protected] (E. Gheorghiu).
0042-6989/$ - see front matter � 2003 Elsevier Ltd. All rights reserved.
doi:10.1016/j.visres.2003.10.016
within the fusible range of disparity, vergence eye
movements can act as a change-disparity and change-
resolution mechanism.
Marr and Poggio (1979) proposed a computational
model for solving the correspondence problem in which
matching of the images occurs with the help of vergence
eye movements. The model consists of the following
steps: (1) the two images are analysed through inde-pendent spatial-frequency-tuned channels of varying
coarseness; (2) matching takes place between channels of
equal scale, coarse channels processing large disparities
and fine channels processing small disparities; (3) coarse
scales control vergence eye movements and cause fine
scales to come into correspondence. Repetition of steps
(2) and (3) at finer scales will continue until disparity
becomes so small that the images are matched at thefinest scales. Then, the eye movements stop. By pro-
cessing the images at a range of spatial scales false
matches are avoided as much as possible. The collection
of spatial scales going from coarse-to-fine gives rise to a
coherent set of representations of the stimuli.

564 E. Gheorghiu, C.J. Erkelens / Vision Research 44 (2004) 563–575
Numerous physiological and psychophysical studies
have investigated spatial-scale characteristics of stere-
opsis. These studies provided estimates of spatial-fre-
quency bandwidths. Much of the evidence was based on
psychophysical paradigms such as masking (Campbell &
Kulikovski, 1966; Glennerster & Parker, 1997; Julesz &
Miller, 1975; Prince, Eagle, & Rogers, 1998; Shiori,
Hatori, Yaguchi, & Kubo, 1994; Wilson, McFarlane, &Phillips, 1983; Yang & Blake, 1991), adaptation
(Blakemore & Campbell, 1969; Regan & Beverley, 1983,
1985; Regan, 1982) and subthreshold summation (Gra-
ham & Robson, 1987).
While the existence of spatial scales is widely ac-
cepted, it is not clear how they interact in stereopsis.
Several studies investigated spatial-scale interactions in
stereopsis (Blake & Wilson, 1991; Mallot, Gillner, &Arndt, 1996; Prazdny, 1987; Rohaly & Wilson, 1993,
1994; Smallman, 1995; Smallman & MacLeod, 1994,
1997) and binocular fusion (Julesz & Miller, 1975;
Rohaly & Wilson, 1993; Wilson, Blake, & Halpern,
1991). Using a masking paradigm, Julesz and Miller
(1975) reported qualitatively that binocular high-pass
noise did not affect the perception of depth in a low-pass
filtered stereogram and vice versa. Therefore, Julesz andMiller suggested the existence of numerous independent
spatial-frequency-tuned channels for binocular stereop-
sis and rivalry. Other studies (Blake & Wilson, 1991;
Mallot et al., 1996; Rohaly & Wilson, 1993, 1994;
Smallman, 1995; Smallman & MacLeod, 1994, 1997;
Wilson et al., 1991) provided evidence for interactions
between spatial scales. Wilson et al. (1991) measured the
limits of binocular fusion ranges (diplopia thresholds)using flashed stimuli (lasting 165 or 500 ms) that con-
sisted of gratings of low spatial frequency to which a
grating of higher spatial frequency and different size was
added, and reported that coarse spatial scales constrain
stereoscopic processing on finer scales. Blake and Wil-
son (1991) reported that depth could be extracted from
rather large disparities on fine spatial scales during
presentations that lasted too short to permit eye move-ments and suggested that the model of Marr and Poggio
(1979) is not correct. Smallman (1995) and Smallman
and MacLeod (1997) reported that disparity informa-
tion on fine scales could disambiguate disparity infor-
mation on coarse scales. Watt (1987) investigated
another aspect of spatial-scale interactions––temporal
succession of processing––by measuring the sensitivity
to the length, orientation, curvature and stereoscopicdepth of short lines for different exposure durations.
Watt (1987) interpreted the results in terms of a change
over time of the spatial scale of analysis from coarse-
to-fine and concluded that the range of spatial filter sizes
shrinks with time. Watt (1987) suggests that depth in a
stereogram containing only low spatial-frequencies is
processed faster than the same depth in a stereogram
containing only high spatial frequencies. There are no
studies in the literature that investigated and determined
the temporal aspects of disparity detection at a given
spatial scale (Howard & Rogers, 2002).
Despite numerous investigations that have established
detailed knowledge about various aspects of spatial scales
in stereopsis it is still unclear how the interaction be-
tween scales takes place. Elucidation of this interaction
is the goal of this study. We designed stimuli that en-abled us to study systematically the temporal properties
of depth detection at different spatial scales. We exploited
the fact that depth is perceived in random-dot stereo-
grams if the two images are correlated but not if they are
anticorrelated or uncorrelated (Julesz, 1960, 1964, 1971).
By alternating correlated and anti/uncorrelated random-
dot patterns we varied the time course of interocular
correlation in a controlled way. From depth detectionresults obtained in response to a sustained stimulus
presentations and, also in response to transient stimulus
presentation, we analysed how coarse and fine spatial
scales interact. Our results provide experimental evi-
dence for a coarse-to-fine spatial-scale organisation in
human stereopsis. Also, the results indicate that the
interaction between scales is neural by nature and is not
necessarily mediated by vergence eye movements asproposed by Marr and Poggio (1979) and Marr (1982).
2. Experiment 1
In this experiment we investigated spatial-scale
interactions in human stereoscopic vision in response to
sustained stimulus presentation. In other words, we
studied temporal properties of sustained stereopsis,
which we define as the sustained presence of stereoscopic
depth perception in response to prolonged stimulation.
2.1. Methods
2.1.1. Observers
Four experienced subjects (ages between 25 and 50
years) participated in all experiments (the two authors
and two subjects who were naive with respect to the
purpose of the experiment). None of them showed any
visual or oculomotor pathologies other than refractionanomalies. All had normal or corrected-to-normal vi-
sual acuity. They were checked for normal stereopsis by
means of a recently developed stereoscopic depth per-
ception test (Van Ee & Richards, 2002).
2.1.2. Stimuli and procedure
The stimuli were large RDS of 51.2 (width) · 30(height) deg. The stereograms consisted of randomly
distributed bright and dark dots (square-like elements)of 50% density. The RDS were generated in real time at
a frequency of 70 Hz by an HP 750 Graphics computer
and back-projected onto a fronto-parallel translucent

E. Gheorghiu, C.J. Erkelens / Vision Research 44 (2004) 563–575 565
screen by a D-ILA projector (JVC DLA-G11E). Ste-
reoscopic vision was made possible by placing red and
green filters in front of the observer’s eyes so that each
image was visible to one of the eyes only (light separa-
tion better than 99%). The experiments were performed
in an otherwise dark room. Before each trial, the com-
puter generated three stereograms whose left and right
image pairs (L, R) which we denote by (A, A), (B, B),and (C, C) were fully correlated. The patterns A, B and
Fig. 1. Stimuli in the depth detection task of Experiment 1 (sustained stimul
image pairs: (a) stimulus (A, A)(B, )B) consisted of the repeated presentation
by an anticorrelated image pair (B, )B) during time interval Ta; (b) stimulus (A
pair (A, A) during the time interval Tc alternated by an uncorrelated image pa
like elements) in the two images. Different combinations of dot sizes were us
scale images where correlated images were at coarse scale and anticorrela
anticorrelated image at coarse scale (f). The same combinations were used f
C were uncorrelated. The dynamic random-dot stereo-
grams (DRS) consisted of the ongoing alternation of
two image pairs. Two types of DRS were used: (a)
stimulus (A, A)(B, )B) consisting of the repeated pre-
sentation of the correlated image pair (A, A) interleaved
by the anticorrelated image pair (B, )B) (see Fig. 1a); (b)stimulus (A, A)(B, C) consisting of the repeated pre-
sentation of the correlated image pair (A, A) interleavedby the uncorrelated image pair (B, C) (see Fig. 1b). In
us presentation). The DRS consisted of the ongoing alternation of two
of a correlated image pair (A, A) during the time interval Tc alternated, A)(B, C) consisted of the repeated presentation of a correlated image
ir (B, C) during time interval Tu. We varied the size of the dots (square-
ed: equal-scale images at fine scale (c) and at coarse scale (d); unequal-
ted images at fine scale (e); and, correlated images at fine scale and
or stimulus (A, A)(B, C).

1 For interpretation of colour in Figs. 2 and 3, the reader is referred
to the web version of this article.
566 E. Gheorghiu, C.J. Erkelens / Vision Research 44 (2004) 563–575
both types of DRS, the correlated images embedded a
square that stood out in depth during binocular viewing
and was located on either the left or right half of the
stereogram. The size of the square was 8 · 8 deg and the
disparity 48 arcmin (crossed disparity). The image of
each individual eye did not provide any information
about the position of the square. The presentation times
of the correlated image pairs were denoted by Tc, and ofthe un/anticorrelated image pairs by Tu and Ta, respec-tively. The presentation times Tc and Tu (or Tc and Ta)respectively, were adjustable in steps of 14 ms, between
14 and 168 ms (12 steps). The step size (14 ms) for the
presentation times was dictated by the frame rate of the
projector. In all experiments, the DRS were presented
on the screen until the subject gave his/her answer, by
pressing a key. The subjects were free to make eyemovements. We varied the coarseness of the dots in the
two images. Three different dot sizes were used: 24, 12
and 6 arcmin. Four stimulus configurations, corre-
sponding to different dot sizes of the correlated and un/
anticorrelated images were used: (i) equal scale stimuli in
which both correlated and un/anticorrelated images
were of the same scale (either coarse or fine); (ii) unequal
scale stimuli in which correlated and un/anticorrelatedimages were of different spatial scales. In this part of the
experiments, two dot sizes were alternated, namely (a)
24 and 12 arcmin, and (b) 24 and 6 arcmin.
We used a forced-choice paradigm in which the
subject’s task was to indicate (by pressing a key) whether
the square was presented on the left or right side of the
RDS. The task was easy for all subjects. For all stimuli,
each combination of Tc and Ta and, of Tc and Tu waspresented 10 times, in 10 separate sessions (144 trials in
each session). The combinations of Tc and Ta and, of Tcand Tu were presented in a random order within each
individual session. Depth detection scores were pre-
sented in 2D contour plots as a function of the time
periods Tc and Ta and, of Tc and Tu, respectively. We
used a level of 75% of correct answers as the criterion for
reliable depth detection. For each of the equal and un-equal-scale stimuli, depth is detected to the right of the
75% contours.
2.2. Results
Depth detection results in response to sustained
stimulus presentation are indicated in Fig. 2 for DRS
consisting of correlated and anticorrelated images and in
Fig. 3 for DRS containing correlated and uncorrelated
images. Figs. 2a and 3a indicate the results for dot sizes
of 12 and 24 arcmin and Figs. 2b and 3b for dot sizes of
6 and 24 arcmin. The 75% contours mark the minimum
period of high interocular correlation that is required forsustained depth detection in DRS of different spatial
scales. The contours corresponding to 67% (left to 75%)
and 83% (right of 75%) of correct answers indicate the
slope (steepness) of the transition from rivalry to depth.
Detection of depth was found to depend mainly on the
presentation duration, Tc, of the correlated pattern (A,
A). The presence of depth was sustained despite tem-
poral oscillations in the levels of correlation between
either, 1 and )1 (stimulus (A, A)(B, )B)) or 1 and 0
(stimulus (A, A)(B,C)). Depth remained present and
sustained even when the interleaving periods of anti-correlation, Ta, or uncorrelation, Tu, were as long as 168
ms. Qualitatively, the results showed the same trend in
the four subjects for both types of DRS.
2.2.1. Equal-scale sustained stimuli
Depth detection scores for equal-scale stimuli are
represented by the continuous red and black lines inFigs. 2 and 3. 1 These contours mark the minimum
period of high interocular correlation, Tc that is requiredfor depth detection in DRS of one scale. For each type
of DRS containing images of the same dot size, either 24
arcmin, 12 or 6 arcmin, the subjects detected depth for
approximately the same combinations of presentation
times of the two images (Figs. 2 and 3). In DRS contain-
ing correlated and anticorrelated images depth detectionwas possible when Tc was longer than 56 ms and in DRS
containing correlated and uncorrelated images depth
occurred when Tc was longer than 42 ms. For both types
of DRS, sustained depth detection results were inde-
pendent of dot size, indicating that coarse and fine scales
have similar temporal properties of disparity processing
in response to sustained stimulus presentation.
2.2.2. Unequal-scale sustained stimuli
2.2.2.1. Correlation at coarse scale and anticorrelation/
uncorrelation at fine scales. Depth detection scores for
unequal-scale DRS, containing correlation at the coarse
scale and anti- or uncorrelation at the fine scale, are
represented in Figs. 2 and 3 by the red dashed lines.Depth detection contours are shifted to the left with re-
spect to the results for equal scale stimuli (continuous
lines). This shift becomes slightly more pronounced when
the scales are more different from each other (compare
Fig. 2b–a and Fig. 3b–a). On average, the subjects de-
tected depth in DRS containing dots of 24 and 6 arcmin
when presentation times of the correlated image, Tc werelonger than 14 ms. For dot sizes of 12 and 24 arcmin,depth was detected when Tc was longer than 28 ms.
2.2.2.2. Correlation at fine scale and anticorrelation/
uncorrelation at coarse scale. Depth detection scores for
unequal scales DRS, containing correlation at the fine
scale and anti- or uncorrelation at the coarse scale, arerepresented in Figs. 2 and 3 by the black dashed lines.

EG
100 120 160 140 80 604020
100
120
160
140
80
60
40
20
Ta
(ms)
Tc (ms)
EG
100 120 160 140 80 604020
100
120
160
140
80
60
40
20
Ta
(ms)
Tc (ms)
CE
100
120
160
140
80
60
40
20
100 120 160 140 80 604020
Tc (ms)
Ta
(ms)
CE
100
120
160
140
80
60
40
20
100 120 160 140 80 604020
Tc (ms)
Ta
(ms)
AK
100
120
160
140
80
60
40
20
100 120 160 140 80 604020
Ta
(ms)
Tc (ms)
AK
100
120
160
140
80
60
40
20
100 120 160 140 80 604020
Tc (ms)
Ta
(ms)
LW
c / a
12' / 12'24' / 24'12' / 24'24' / 12'
100
120
160
140
80
60
40
20
100 120 160 140 80 604020
Tc (ms)
Ta
(ms)
LW
6 ' / 6 '24' / 24'6 ' / 24'24' / 6 '
c / a
100
120
160
140
80
60
40
20
100 120 160 140 80 604020
Tc (ms)
Ta
(ms)
(a) (b)
Fig. 2. Performances in the depth detection task in response to sustained presentation of stimulus (A, A)(B, )B) as a function of the time intervals Tcand Ta for different dot sizes of the two images: (a) 12 and 24 arcmin; (b) 6 and 24 arcmin. Different line types indicate different dot size combinations
of correlated and anticorrelated (c/a) images. For each dot size combination (each line type), three contour levels are drawn: 67% (left), 75% (middle)
and 83% (right). Depth is detected to the right of the 75% contours. The blue dashed line indicates presentation durations used in the Control
experiment 2.
E. Gheorghiu, C.J. Erkelens / Vision Research 44 (2004) 563–575 567
Depth detection contours are shifted to the right with
respect to the results for equal scale stimuli (continuous
lines). This shift is more prominent when the scales are
very different from each other (compare Fig. 2b–a and
Fig. 3b–a). On average, depth occurred in DRS con-taining dots of 12 and 24 arcmin when Tc was longer than70 ms. In DRS containing dots of 24 and 6 arcmin, depth
was detected if Tc was longer than 100 ms.
Although the values of Tc for which the subjects de-
tected depth varied slightly across the subjects, the
trends in the results were the same.
2.3. Discussion
Using two types of DRS (stimuli (A, A)(B, )B) and(A, A)(B, C)), we studied temporal aspects of depth

100
120
160
140
80
60
40
20100 120 160 140 80 604020
CE
100
120
160
140
80
60
40
20100 120 160 140 80 604020
CE
Tu
(ms)
Tu
(ms)
Tu
(ms)
Tu
(ms)
Tu
(ms)
Tu
(ms)
Tu
(ms)
Tu
(ms)
100 120 160 140 80 604020
100
120
160
140
80
60
40
20
AK
100 120 160 140 80 604020
100
120
160
140
80
60
40
20
AK
EG
100
120
160
140
80
60
40
20
100 120 160 140 80 604020
100
120
160
140
80
60
40
20
100 120 160 140 80 604020
EG
100
120
160
140
80
60
40
20
100
120
160
140
80
60
40
20100 120 160 140 80 604020 100 120 160 140 80 604020
c / u
12' / 12'24' / 24'12' / 24'24' / 12'
6 ' / 6 '24' / 24'6 ' / 24'24' / 6 '
c / u
LW LW
(a) (b)
Tc (ms) Tc (ms)
Tc (ms) Tc (ms)
Tc (ms)Tc (ms)
Tc (ms) Tc (ms)
Fig. 3. Performances in the depth detection task in response to sustained presentation of stimulus (A, A)(B, C) as a function of the time intervals Tcand Tu for different dot sizes of the two images: (a) 12 and 24 arcmin; (b) 6 and 24 arcmin. Different line types indicate different dot size combinations
of correlated and uncorrelated (c/u) images. For each dot size combination (each line type), three contour levels are drawn: 67% (left), 75% (middle)
and 83% (right). Depth is detected to the right of the 75% contours.
568 E. Gheorghiu, C.J. Erkelens / Vision Research 44 (2004) 563–575
perception at different spatial scales, in response to
sustained stimulation, and obtained similar trend in thepatterns of results for the two stimuli. Similar depth
detection results were obtained by Erkelens (2001) using
DRS consisting of ongoing alternation of correlated and
uncorrelated images containing dots of 10 arcmin.
Earlier studies on the subject of spatial-scale inter-
actions have used filtered RDS or gratings. We used
unfiltered random-dot stereograms. The results obtained
from unfiltered images may underestimate effects of
spatial-scale interaction but will not overestimate these.In summary, the main findings of our experiments are
(1) the temporal properties of depth perception in re-
sponse to sustained stimulus presentation are indepen-
dent of spatial scale; (2) the interaction between spatial
scales depends on their relative sizes.
We could think of two possible interpretations for the
observed interactions.

E. Gheorghiu, C.J. Erkelens / Vision Research 44 (2004) 563–575 569
A first possibility is that un/anticorrelated images
lead to binocular rivalry which temporally inhibits ste-
reopsis in response to correlated images. Inhibition is
strong when rivalry is caused by the scales coarser than
the ones that induce stereopsis and, it is weak when
rivalry is caused by scales finer than the ones that induce
stereopsis. Inhibition between rivalry and stereopsis at
the same scale can be characterised as inhibition at theintermediate level.
A second possibility is that the observed effects could
be due to the fact that coarse and fine spatial scale
channels could have different gains. If only one scale, for
instance the coarse one, is used to detect the disparity-
defined shape, then this scale will respond to both coarse
and fine scale stimuli. In other words, the coarse dot-size
image pairs would be effectively more visible to thedepth detection mechanisms of the coarse scale than the
fine dot-size image pairs. In consequence, in order to
evoke the same strength of response in the depth
detection mechanism of the coarse scale, the DRS con-
taining correlation at coarse scale and un/anticorrelation
at fine scale would need to be presented for less time
than DRS containing correlation at fine scale and un/
anticorrelation at coarse scale.In brief, our results could be interpreted in two pos-
sible ways. These alternative explanations will be tested
in Experiment 2.
Various computational models of stereopsis (Marr &
Poggio, 1979; Nishihara, 1987; Quam, 1987) used a
coarse-to-fine strategy in order to simplify the corre-
spondence problem by reducing the number of false
matches. The common feature of these models is thatcoarse spatial scale disparities are used to bring fine
spatial scales into correspondence. The models differ in
the method by which they implement the coarse-to-fine
scheme. Marr and Poggio (1979) suggested that coarse
spatial scales, by detecting large disparities, would drive
eye movements bringing fine scales into correspondence
for the processing of small disparities. Nishihara (1987)
and Quam (1987) suggested that coarse-scale disparitymatches produce a cortical shift in disparity matching
on finer scales. Smallman and MacLeod (1997) reported
that away from the fixation plane the fine-scale signals
actively degrade stereoacuity of the coarse scales and
therefore, argue against a shift in disparity matching.
They suggested that the visual system makes use of
vergence eye movements as suggested by Marr and
Poggio (1979). On the other hand, Rohaly and Wilson(1993) measured disparity thresholds for stimuli pre-
sented for 167 ms (too short to initiate eye movements)
and 500 ms and found no differences between the two
conditions. These authors concluded that eye move-
ments are not necessary for stereopsis. In summary,
various psychophysical studies and computational
models agree on the existence of spatial-scale interac-
tions and on a coarse-to-fine hierarchy but disagree on
how the interaction between scales is accomplished, i.e.
via eye movements or a neural mechanism. In Experi-
ment 2 we investigate whether the coarse-to-fine hier-
archy is active without eye movements.
2.3.1. Stereopsis in response to sustained and transient
stimuli
For clarity reasons, the terms transient and sustained
can refer to the types of stimuli, to the underlying
mechanism or to the percept. In this experiment we have
investigated sustained stereopsis, which we define as the
sustained presence of stereoscopic depth perception in
response to prolonged stimulation. Within each trial,
our stimuli were sustained with respect to the presen-
tation times but were transient with respect to interoc-ular correlation. The resulting depth percepts were
sustained and required a high level of interocular cor-
relation. Within each trial, we presented the same pat-
tern of random dots in all transient periods of high
correlation, Tc. Thus, there is the possibility that depth
perception could build up within first few Tc intervals
and then remain sustained for the rest of the trial.
Therefore, the present findings described only spatial-scale interaction in stereopsis, in response to sustained
stimulus presentation. However, the findings may not be
valid for depth perception in response to transient
stimulus presentation. This possibility will be tested in
the next experiment.
3. Experiment 2
The goal of this experiment is twofold: (1) to inves-
tigate spatial-scale interactions in human stereoscopic
vision in response to transient stimulus presentation; (2)
to examine whether or not vergence eye movements
played a role in the coarse-to-fine spatial-scale interac-
tion observed in Experiment 1.
3.1. Methods
3.1.1. Observers
Four experienced subjects participated in this exper-
iment. Three of them (CE, EG, LW) took also part in
Experiment 1. Subject AK was not available for this
experiment. We recruited subject LD who had cor-rected-to-normal visual acuity and was checked for
normal stereopsis by means of the recently developed
stereoscopic depth perception test (Van Ee & Richards,
2002).
3.1.2. Stimuli and procedure
We used the same experimental set up as in Experi-ment 1. The stimulus was composed of only two frames:
in one frame we presented the correlated image pair (A,
A) and in the other frame, the anticorrelated image pair
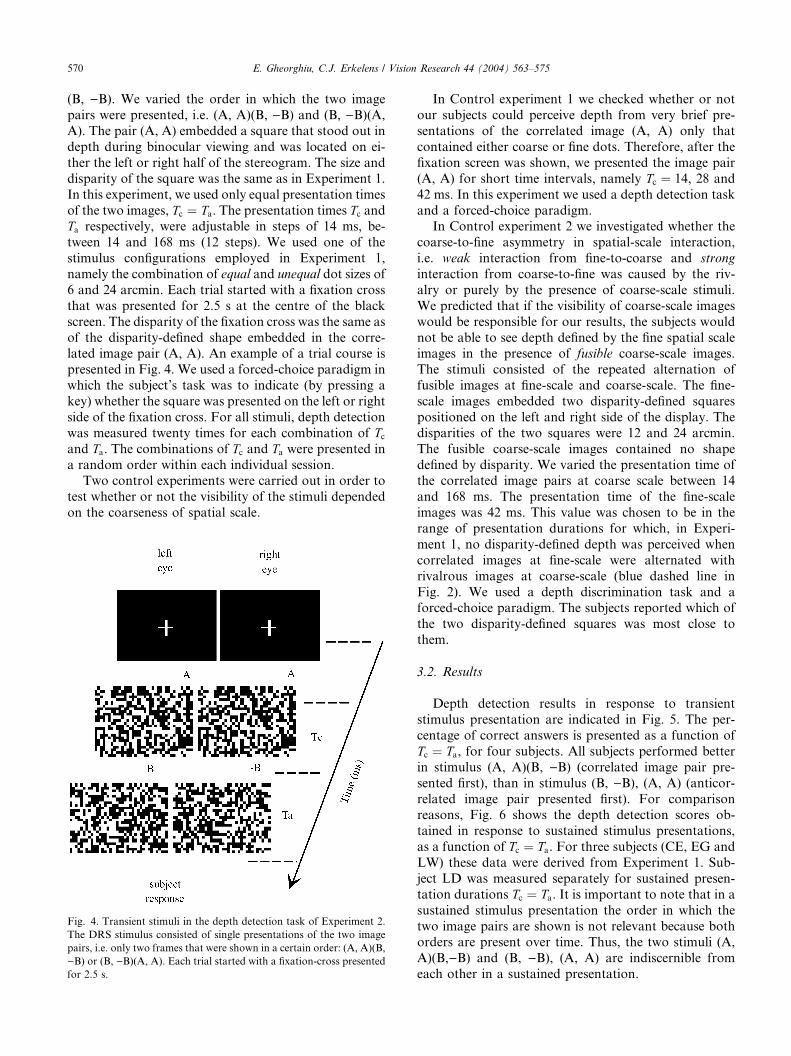
570 E. Gheorghiu, C.J. Erkelens / Vision Research 44 (2004) 563–575
(B, )B). We varied the order in which the two image
pairs were presented, i.e. (A, A)(B, )B) and (B, )B)(A,
A). The pair (A, A) embedded a square that stood out in
depth during binocular viewing and was located on ei-
ther the left or right half of the stereogram. The size and
disparity of the square was the same as in Experiment 1.
In this experiment, we used only equal presentation times
of the two images, Tc ¼ Ta. The presentation times Tc andTa respectively, were adjustable in steps of 14 ms, be-
tween 14 and 168 ms (12 steps). We used one of the
stimulus configurations employed in Experiment 1,
namely the combination of equal and unequal dot sizes of
6 and 24 arcmin. Each trial started with a fixation cross
that was presented for 2.5 s at the centre of the black
screen. The disparity of the fixation cross was the same as
of the disparity-defined shape embedded in the corre-lated image pair (A, A). An example of a trial course is
presented in Fig. 4. We used a forced-choice paradigm in
which the subject’s task was to indicate (by pressing a
key) whether the square was presented on the left or right
side of the fixation cross. For all stimuli, depth detection
was measured twenty times for each combination of Tcand Ta. The combinations of Tc and Ta were presented in
a random order within each individual session.Two control experiments were carried out in order to
test whether or not the visibility of the stimuli depended
on the coarseness of spatial scale.
Fig. 4. Transient stimuli in the depth detection task of Experiment 2.
The DRS stimulus consisted of single presentations of the two image
pairs, i.e. only two frames that were shown in a certain order: (A, A)(B,
)B) or (B, )B)(A, A). Each trial started with a fixation-cross presented
for 2.5 s.
In Control experiment 1 we checked whether or not
our subjects could perceive depth from very brief pre-
sentations of the correlated image (A, A) only that
contained either coarse or fine dots. Therefore, after the
fixation screen was shown, we presented the image pair
(A, A) for short time intervals, namely Tc ¼ 14, 28 and
42 ms. In this experiment we used a depth detection task
and a forced-choice paradigm.In Control experiment 2 we investigated whether the
coarse-to-fine asymmetry in spatial-scale interaction,
i.e. weak interaction from fine-to-coarse and strong
interaction from coarse-to-fine was caused by the riv-
alry or purely by the presence of coarse-scale stimuli.
We predicted that if the visibility of coarse-scale images
would be responsible for our results, the subjects would
not be able to see depth defined by the fine spatial scaleimages in the presence of fusible coarse-scale images.
The stimuli consisted of the repeated alternation of
fusible images at fine-scale and coarse-scale. The fine-
scale images embedded two disparity-defined squares
positioned on the left and right side of the display. The
disparities of the two squares were 12 and 24 arcmin.
The fusible coarse-scale images contained no shape
defined by disparity. We varied the presentation time ofthe correlated image pairs at coarse scale between 14
and 168 ms. The presentation time of the fine-scale
images was 42 ms. This value was chosen to be in the
range of presentation durations for which, in Experi-
ment 1, no disparity-defined depth was perceived when
correlated images at fine-scale were alternated with
rivalrous images at coarse-scale (blue dashed line in
Fig. 2). We used a depth discrimination task and aforced-choice paradigm. The subjects reported which of
the two disparity-defined squares was most close to
them.
3.2. Results
Depth detection results in response to transient
stimulus presentation are indicated in Fig. 5. The per-
centage of correct answers is presented as a function of
Tc ¼ Ta, for four subjects. All subjects performed better
in stimulus (A, A)(B, )B) (correlated image pair pre-
sented first), than in stimulus (B, )B), (A, A) (anticor-
related image pair presented first). For comparisonreasons, Fig. 6 shows the depth detection scores ob-
tained in response to sustained stimulus presentations,
as a function of Tc ¼ Ta. For three subjects (CE, EG and
LW) these data were derived from Experiment 1. Sub-
ject LD was measured separately for sustained presen-
tation durations Tc ¼ Ta. It is important to note that in a
sustained stimulus presentation the order in which the
two image pairs are shown is not relevant because bothorders are present over time. Thus, the two stimuli (A,
A)(B,)B) and (B, )B), (A, A) are indiscernible from
each other in a sustained presentation.

EG0
20
40
60
80
100
14 42 70 98 126 154 168
EG0
20
40
60
80
100
14 42 70 98 126 154 168
EG0
20
40
60
80
100
14 42 70 98 126 154 168
EG0
20
40
60
80
100
14 42 70 98 126 154 168
LW0
20
40
60
80
100
14 42 70 98 126 154 168
LW0
20
40
60
80
100
14 42 70 98 126 154 1680
20
40
60
80
100
LW
14 42 70 98 126 154 168
LW0
20
40
60
80
100
14 42 70 98 126 154 168
CE0
20
40
60
80
100
14 42 70 98 126 154 1680
20
40
60
80
100
CE
14 42 70 98 126 154 1680
20
40
60
80
100
CE
14 42 70 98 126 154 1680
20
40
60
80
100
CE
14 42 70 98 126 154 168
c / a24'/ 24'
LD0
20
40
60
80
100
14 42 70 98 126 154 168
c / a6 '/ 6 '
LD
14 42 70 98 126 154 168
0
20
40
60
80
100
c / a24'/ 6'
0
20
40
60
80
100
LD
14 42 70 98 126 154 168
LD
c / a6'/ 24'
14 42 70 98 126 154 1680
20
40
60
80
100
Tc = Ta (ms) Tc = Ta (ms) Tc = Ta (ms) Tc = Ta (ms)
Tc = Ta (ms) Tc = Ta (ms) Tc = Ta (ms) Tc = Ta (ms)
Tc = Ta (ms) Tc = Ta (ms) Tc = Ta (ms) Tc = Ta (ms)
Tc = Ta (ms) Tc = Ta (ms) Tc = Ta (ms) Tc = Ta (ms)
(a) (b) (c) (d)
% c
orre
ct a
nsw
ers
% c
orre
ct a
nsw
ers
% c
orre
ct a
nsw
ers
% c
orre
ct a
nsw
ers
Fig. 5. Performances in the depth detection task in response to transient presentation of stimulus (A, A)(B, )B) (filled symbols) and stimulus (B,
)B)(A, A) (open symbols) as a function of the time intervals, Tc ¼ Ta, for dot sizes of 6 and 24 arcmin: (a) coarse equal-scale stimuli; (b) fine equal-
scale stimuli; (c) correlation at coarse scale and anticorrelation at fine scale; (d) correlation at fine scale and anticorrelation at coarse scale.
E. Gheorghiu, C.J. Erkelens / Vision Research 44 (2004) 563–575 571
3.2.1. Equal-scale transient stimuli
Depth detection scores for equal-scale transient
stimuli are represented in Fig. 5a and b. The filled and
open symbols indicate percentages of correct answers
for stimuli (A, A)(B, )B) and (B, )B)(A, A), respec-
tively. Within each subject, depth detection scores
obtained in response to coarse-scale stimuli (Fig. 5a)
and fine-scale stimuli (Fig. 5b) showed a similar trend.
For each separate stimulus configuration, i.e. (B,)B)(A, A) and (A, A)(B, )B) respectively, and within
each subject, the fine and coarse scale data were testedfor statistically significance. This analysis revealed that
there were no significant differences between temporal
properties of stereopsis at coarse and fine scales for (i)
stimulus (A, A)(B, )B): tð11Þ ¼ 1:782 for CE, 1.301 for
LW, )1.682 for LD; p > 0:05; two-tailed test; and (ii)
stimulus (B, )B) (A, A): tð11Þ ¼ 0:861 for CE, 0.330 for
EG, )1.101 for LW, )1.459 for LD; p > 0:05; two-
tailed test. These findings indicate that depth detectionresults were independent of dot size. Thus, coarse and

Fig. 6. Performances in the depth detection task in response to sustained presentation of stimulus (A, A)(B, )B) as a function of the time intervals,
Tc ¼ Ta, for dot sizes of 6 and 24 arcmin: (a) coarse equal-scale stimuli; (b) fine equal-scale stimuli; (c) correlation at coarse scale and anticorrelation
at fine scale; (d) correlation at fine scale and anticorrelation at coarse scale.
572 E. Gheorghiu, C.J. Erkelens / Vision Research 44 (2004) 563–575
fine scales have similar temporal properties of dis-
parity processing in response to transient stimulus
presentation. Similar statistic analysis applied to the
data obtained in response to sustained stimulus pre-
sentation (Fig. 6a and b) indicated that there were no
significant differences between temporal properties ofstereopsis at coarse and fine scales (tð11Þ ¼ �0:561 for
CE, 0.804 for EG, 0 for LW and LD; p > 0:05; two-tailed test).
One can notice that depth detection scores are better
for stimulus (A, A)(B, )B) in which the correlated image
is presented first than in stimulus (B,)B) (A,A). A
comparison between these results (Fig. 5a and b) with
those obtained in response to sustained stimulus pre-
sentation (Fig. 6a and b) shows that depth detectionin response to sustained stimulus presentation is best
related to depth detection in response to transient
presentation of stimulus (B,)B)(A, A).

E. Gheorghiu, C.J. Erkelens / Vision Research 44 (2004) 563–575 573
3.2.2. Unequal-scale transient stimuli
3.2.2.1. Correlation at coarse scale and anticorrelation at
fine scales. Depth detection scores for transient stimuli
containing correlation at the coarse scale and anticor-
relation at the fine scale are represented in Fig. 5c. For
both transient stimulus conditions, all subjects detected
depth above the level of 75%, except subject CE for
stimulus (B, )B)(A, A). For sustained stimulus presen-tation (Fig. 6c), the subjects detected depth at the level
of 100% for all presentation times Tc ¼ Ta.
3.2.2.2. Correlation at fine scale and anticorrelation at
coarse scales. Depth detection scores for transient
stimuli containing correlation at the fine scale and an-
ticorrelation at the coarse scale are represented in Fig.
5d. On average, the level of 100% was reached forTc ¼ Ta longer than 112 ms in subjects CE, EG, LW, and
of 70 ms in subject LD. Although there are slight dif-
ferences between the subjects, the trends in the pattern
of results are the same.
Statistical analysis applied to unequal scale data for
both transient and sustained stimulus presentation re-
vealed a significant difference in temporal processing
between the unequal-scale stimuli A (Figs. 5c and 6c)and B (Figs. 5d and 6d). The statistical analysis indi-
cated that (i) tð11Þ ¼ 2:994 for CE, 3.930 for EG, 3.256
for LW, 2.231 for LD; p < 0:05, for stimulus (A, A)(B,
)B), and (ii) tð11Þ ¼ 5:043 for CE, 3.116 for EG, 3.811 for
LW; 2.472 for LD; p < 0:05, for stimulus (B, )B)(A, A).
For sustained stimulus presentation statistical analysis
indicated: tð11Þ ¼ 6:966 for CE, 3.252 for EG, 2.746 for
LW, 2.549 for LD; p < 0:05. All analysis involved a two-tailed test.
3.2.3. Control experiment 1
All subjects detected depth at the level of 100% for very
brief presentations (Tc ¼ 14, 28 and 42 ms) of the corre-
lated image (A, A) only, at either coarse or fine scale.
3.2.4. Control experiment 2
All subjects performed at the level of 100%. These
results demonstrated that depth at fine spatial scale was
easily seen for all presentation times of fusible coarse-
scale images. Therefore, the asymmetry in scale interac-
tion cannot be explained in terms of stimulus visibility.
3.3. Discussion
In summary, the present findings of this experiment
are as follows. (i) The temporal properties of depth
perception in response to transient stimulus presentation
are independent of the coarseness of spatial-scale. (ii)
The temporal inhibitory interaction between spatialscales depends on their relative sizes. (iii) For transient
stimulus presentation the inhibition between and within
spatial scales depends on the order in which correlated
and anticorrelated images are presented. (iv) Vergence
eye movements are not necessary for establishing the
interaction between spatial scales. These results clearly
indicate that the interaction between scales is neural by
nature.
The finding that the interaction between spatial scales
depends on the order in which correlated and anticor-
related images are presented is an indication that strong/weak temporal inhibition of stereopsis by rivalry occurs
when anticorrelated images precedes/follows correlated
images. In addition, within each subject, depth detection
scores for coarse and fine equal scale stimuli showed
similar trends. It is important to notice that our results
indicated that the inhibitory interaction between spatial
scales depends on their relative sizes, i.e. weak interac-
tion from fine-to-coarse and strong interaction fromcoarse-to-fine. This result suggests that there is a coarse-
to-fine asymmetry in spatial-scale interaction. It might
be objected that in order to draw a conclusion on the
symmetry or asymmetry of the spatial-scale interaction
one should take into account the modulation transfer
function (MTF) of the eye for contrast. Glennerster and
Parker (1997) reported that MTF could have a signifi-
cant effect on the interpretation of different experiments.The results of our control experiments showing that
depth was easily detected for very short presentations of
the correlated image (A,A) only at either coarse or fine
scale (Control experiment 1) and also easily discrimi-
nated for presentation times corresponding to values
along the blue line in Fig. 2 (Control experiment 2),
clearly indicated that the briefness of presentation, i.e.
stimulus visibility or MTF at either coarse or fine scalewas not the cause for the observed effects. Altogether,
these findings allow us to reject the interpretation of our
results in terms of differences in gains between coarse
and fine scale channels, i.e. the interpretation that coarse
dot-size image pairs would be effectively more visible to
the depth detection mechanisms of the coarse scale than
the fine dot-size image pairs. As a consequence, we
interpret our results in terms of inhibitory interactionsbetween rivalry and stereopsis at different spatial scales.
Psychophysical literature and computational models
argue on whether the coarse-to-fine hierarchy in spatial-
scale interaction is accomplished via eye movements
driven mechanisms or neural mechanisms. The vergence
eye movements driven mechanism implemented by
models such as that of Marr and Poggio (1979) is based
on the assumption that there is a link between spatial-scale and disparity size. The scale–disparity relationship
assumes that different sizes of disparity are processed in
distinct spatial-scale channels, i.e. coarse disparities by
coarse spatial scales and fine disparities by fine spatial
scales. In Marr & Poggio’s model, matches established
at coarse spatial scales are used to drive vergence eye
movements to reduce the disparities until these become
so small that the images are matched at the finest scale.

574 E. Gheorghiu, C.J. Erkelens / Vision Research 44 (2004) 563–575
In brief, the Marr & Poggio’s scheme assumes that,
initially the two retinal images are far out of register. In
situations in which fusion is not possible due to large
disparities, vergence eye movements are essential for
bringing the images into the fusible range of disparity.
Erkelens (1987) showed that ocular vergence movements
could be induced by large disparities of up to 10 degrees.
However, usually the retinal images will not be farout of register when we open our eyes after a blink or
fixate a new object after a large saccade. Incidentally,
the retinal images could even be in register or in the
range of fine-disparity system. In these situations, there
is no need for engaging eye driven mechanisms to obtain
sensory fusion. Normal stereopsis, which requires sen-
sory fusion, is based on relatively small differences be-
tween similar features on the two retinal images. Thesesmall differences are detected by disparity-selective
neurons whose sensitivity is limited to about 1 degree
(Poggio & Fisher, 1977). It is evident that there are
smaller numbers of matching features (contours) in
coarse scale stimuli than in fine-scale stimuli. Therefore,
it is likely to find fewer wrong matches in coarse-scale
stimuli than in fine-scale stimuli. A neural based hier-
archical organisation of spatial scales, as we found in thepresent experiments, may help to alleviate the matching
problem in conditions where Marr & Poggio’s scheme
does not work.
In summary, the inhibitory interaction between spa-
tial-scales shows that when matching is possible at scales
coarser than the ones that induce rivalry then the inhi-
bition of stereopsis by rivalry is weak. The inhibition is
strong when matching is possible at scales finer than theone that induce rivalry. The interaction between rivalry
and stereopsis at the same scale, either coarse or fine,
can be categorised as inhibition at the intermediate level.
4. General conclusion
Spatial-scale interactions in response to both sustained
and transient stimulus presentation indicate a strong
inhibitory influence of rivalry at a coarse scale on stere-
opsis at a fine scale, and weak inhibitory influence of
rivalry at a fine scale on stereopsis at a coarse scale. These
interactions are based on a neural circuitry rather than on
vergence eye movements. Temporal properties of stereo-
scopic depth perception are independent of spatial scale.
References
Barlow, H. B., Blakemore, C., & Pettigrew, J. D. (1967). The neural
mechanism of binocular depth discrimination. Journal of Physiol-
ogy, 193, 327–342.
Blake, R., & Wilson, H. R. (1991). Neural models of stereoscopic
vision. Trends in Neurosciences, 14, 445–452.
Blakemore, C., & Campbell, F. W. (1969). On the existence of
neurones in the human visual system selectively sensitive to the
orientation and size of the retinal images. Journal of Physiology
(London), 203, 237–260.
Campbell, F. W., & Kulikovski, J. J. (1966). Orientational selectivity
of the human visual system. Journal of Physiology, 187, 437–445.
DeAngelis, G. C., Ohzawa, I., & Freeman, R. D. (1991). Depth is
encoded in the visual cortex by a specialised receptive field
structure. Nature, 352, 156–159.
Erkelens, C. J. (1987). Adaptation of ocular vergence to stimulation
with large disparities. Experimental Brain Research, 66, 507–516.
Erkelens, C. J. (2001). Organisation of signals involved in binocular
perception and vergence control. Vision Research, 41, 3497–3503.
Glennerster, A., & Parker, A. J. (1997). Computing stereo channels
from masking data. Vision Research, 37, 2143–2152.
Graham, N., & Robson, J. G. (1987). Summation of very close spatial
frequencies: the importance of spatial probability summation.
Vision Research, 27, 1997–2007.
Howard, I. P., & Rogers, B. J. (2002). Seeing in depth. Depth perception
(Vol. 2). University of Toronto Press.
Julesz, B. (1960). Binocular depth perception of computer-generated
patterns. Bell System Technical Journal, 39, 1125–1162.
Julesz, B. (1964). Binocular depth perception without familiarity cues.
Science, 145, 356–362.
Julesz, B. (1971). Foundations of cyclopean perception. Chicago:
University of Chicago Press.
Julesz, B., & Miller, J. (1975). Independent spatial frequency tuned
channels in binocular fusion and rivalry. Perception, 4, 125–143.
Mallot, H. A., Gillner, S., & Arndt, P. A. (1996). Is correspondence
search in human stereo vision a coarse-to-fine process? Biological
Cybernetics, 74, 95–106.
Marr, D. (1982). Stereopsis. In Vision: a computational investigation
into the human representation and processing of visual information.
San Francisco: W.H. Freeman.
Marr, D., & Poggio, T. (1979). A computational theory of human stereo
vision. Proceedings of the Royal Society B (London), 204, 301–328.
Nishihara, H. K. (1987). Practical real-time imaging stereo matcher. In
M. A. Fischler & O. Firschein (Eds.), Readings in computer vision
(pp. 63–72). Los Altos, CA: Morgan Kaufmann.
Poggio, G. F., & Fisher, B. (1977). Binocular interaction and depth
sensitivity in striate and prestriate cortex of behaving rhesus
monkey. Journal of Neurophysiology, 40, 1392–1405.
Prazdny, K. (1987). On the coarse-to-fine strategy in stereomatching.
Bulletin of the Psychonomic Society, 25, 92–94.
Prince, S. J. D., Eagle, R. A., & Rogers, B. J. (1998). Contrast masking
reveals spatial-frequency channels in stereopsis. Perception, 27,
1287–1293.
Quam, L. H. (1987). Hierarchical warp stereo. In M. A. Fischler & O.
Firschein (Eds.), Readings in computer vision (pp. 80–86). Los
Altos, CA: Morgan Kaufmann.
Regan, D. (1982). Visual information channeling in normal and
disordered vision. Psychological Review, 89, 407–444.
Regan, D., & Beverley, K. I. (1983). Spatial frequency discrimination
and detection: comparison of post-adaptation thresholds. Journal
of the Optical Society of America, 73, 1684–1690.
Regan, D., & Beverley, K. I. (1985). Post-adaptation orientation
thresholds. Journal of the Optical Society of America A, 2, 147–155.
Rohaly, A. M., & Wilson, H. R. (1993). Nature of coarse-to-fine
constraints on binocular fusion. Journal of the Optical Society of
America, 10, 2433–2441.
Rohaly, A. M., & Wilson, H. R. (1994). Disparity averaging across
spatial scales. Vision Research, 34, 1315–1325.
Shiori, S., Hatori, T., Yaguchi, H., &Kubo, S. (1994). Spatial frequency
channels for stereoscopic depth. Optical Review, 1, 311–313.
Smallman, H. S. (1995). Fine-to-coarse scale disambiguation in
stereopsis. Vision Research, 35, 1047–1060.
Smallman, H. S., & MacLeod, D. I. A. (1994). Size-disparity
correlation in stereops is at contrast threshold. Journal of the
Optical Society of America A, 11, 2169–2183.

E. Gheorghiu, C.J. Erkelens / Vision Research 44 (2004) 563–575 575
Smallman, H. S., & MacLeod, D. I. A. (1997). Spatial scale
interactions stereosensitivity and the neural representation of
binocular disparity. Perception, 26, 977–994.
Van Ee, R., & Richards, W. (2002). A planar and a volumetric test for
stereoanomaly. Perception, 31, 51–64.
Watt, R. J. (1987). Scanning from coarse to fine spatial scales in the
human visual system after the onset of a stimulus. Journal of the
Optical Society of America A, 4, 2006–2016.
Wilson, H. R., Blake, R., & Halpern, D. L. (1991). Coarse spatial scale
constrain the range of binocular fusion on fine scales. Journal of the
Optical Society of America A, 8, 229–236.
Wilson, H. R., McFarlane, D. K., & Phillips, G. C. (1983). Spatial
frequency tuning of orientation selective units estimated by oblique
masking. Vision Research, 23, 873–882.
Yang, Y., & Blake, R. (1991). Spatial frequency tuning of human
stereopsis. Vision Research, 31, 1177–1189.
Copyright © 2022 FDOKUMEN