Spatial patterns in zooplankton communities and stable isotope ratios (d13C) and d15N) in relation...
19
Spatial patterns in zooplankton communities and stable isotope ratios (d 13 C and d 15 N) in relation to oceanographic conditions in the sub- Arctic Pacific and western Arctic regions during the summer of 2008 CORINNE POMERLEAU 1 *, R. JOHN NELSON 2 , BRIAN P.V. HUNT 3 , AKASH R. SASTRI 4,5 AND WILLIAM J. WILLIAMS 1 1 INSTITUTE OF OCEAN SCIENCES, FISHERIES AND OCEANS CANADA, 9860 WEST SAANICH RD, SIDNEY , BC, CANADAV8L 4B2, 2 UNIVERSITY OF VICTORIA, 3800 FINNERTY RD, VICTORIA, BC, CANADAV8W 3N5, 3 UNIVERSITY OF BRITISH COLUMBIA, 2329 W MALL, VANCOUVER, BC, CANADA V6T 1Z4, 4 UNIVERSITE ´ DU QUE ´ BEC A ` MONTRE ´ AL, 405 SAINTE-CATHERINE EST , MONTRE ´ AL, QC, CANADA H2L 2C4 AND 5 OCEAN NETWORKS CANADA, UNIVERSITY OF VICTORIA, VICTORIA, BC, CANADA V8W 3N5 *CORRESPONDING AUTHOR: [email protected] Received August 29, 2013; accepted December 1, 2013 Corresponding editor: Roger Harris We define the biogeographic status quo of zooplankton communities sampled during the summer of 2008 in the sub-Arctic Pacific and western Arctic regions and examine spatial patterns of stable isotopes in the context of regional oceanography. Eight zooplankton assemblages were identified and corresponded to these regions: Gulf of Alaska, Bering Sea Slope, St-Lawrence Island, Western Bering Strait, Eastern Bering Strait, Barrow Canyon, Beaufort Gyre and Beaufort Shelf. Neocalanus spp., Eucalanus bungii and Metridia pacifica were abundant in the warmer and saltier waters of the Gulf of Alaska and on the Bering Sea Slope, whereas Calanus hyperboreus, Calanus glacialis and Metridia longa were abundant in the cold and fresher Arctic waters on the Beaufort Shelf and in the Beaufort Gyre. Salinity, nitrate and tempera- ture, all of which were strongly correlated with latitude, and water column depth were the main factors influencing variation of zooplankton composition and spatial available online at www.plankt.oxfordjournals.org # The Author 2014. Published by Oxford University Press. All rights reserved. For permissions, please email: [email protected] Journal of Plankton Research plankt.oxfordjournals.org J. Plankton Res. (2014) 36(3): 757–775. First published online January 9, 2014 doi:10.1093/plankt/fbt129 at Fisheries and Oceans on May 22, 2014 http://plankt.oxfordjournals.org/ Downloaded from
-
Upload
dfo-mpo-gc -
Category
Documents
-
view
8 -
download
0
Transcript of Spatial patterns in zooplankton communities and stable isotope ratios (d13C) and d15N) in relation...
Spatial patterns in zooplanktoncommunities and stable isotope ratios(d13C and d15N) in relation tooceanographic conditions in the sub-Arctic Pacific and western Arctic regionsduring the summer of 2008
CORINNE POMERLEAU1*, R. JOHN NELSON2, BRIAN P.V. HUNT3, AKASH R. SASTRI4,5 AND WILLIAM J. WILLIAMS1
1INSTITUTE OF OCEAN SCIENCES, FISHERIES AND OCEANS CANADA, 9860 WEST SAANICH RD, SIDNEY, BC, CANADAV8L 4B2, 2UNIVERSITY OF VICTORIA, 3800
FINNERTY RD, VICTORIA, BC, CANADAV8W 3N5, 3UNIVERSITY OF BRITISH COLUMBIA, 2329 W MALL, VANCOUVER, BC, CANADAV6T 1Z4, 4UNIVERSITE DU QUEBEC
A MONTREAL, 405 SAINTE-CATHERINE EST, MONTREAL, QC, CANADA H2L 2C4 AND5
OCEAN NETWORKS CANADA, UNIVERSITY OF VICTORIA, VICTORIA, BC,CANADAV8W 3N5
*CORRESPONDING AUTHOR: [email protected]
Received August 29, 2013; accepted December 1, 2013
Corresponding editor: Roger Harris
We define the biogeographic status quo of zooplankton communities sampledduring the summer of 2008 in the sub-Arctic Pacific and western Arctic regions andexamine spatial patterns of stable isotopes in the context of regional oceanography.Eight zooplankton assemblages were identified and corresponded to these regions:Gulf of Alaska, Bering Sea Slope, St-Lawrence Island, Western Bering Strait,Eastern Bering Strait, Barrow Canyon, Beaufort Gyre and Beaufort Shelf. Neocalanus
spp., Eucalanus bungii and Metridia pacifica were abundant in the warmer and saltierwaters of the Gulf of Alaska and on the Bering Sea Slope, whereas Calanus hyperboreus,
Calanus glacialis and Metridia longa were abundant in the cold and fresher Arcticwaters on the Beaufort Shelf and in the Beaufort Gyre. Salinity, nitrate and tempera-ture, all of which were strongly correlated with latitude, and water column depthwere the main factors influencing variation of zooplankton composition and spatial
available online at www.plankt.oxfordjournals.org
# The Author 2014. Published by Oxford University Press. All rights reserved. For permissions, please email: [email protected]
Journal of
Plankton Research plankt.oxfordjournals.org
J. Plankton Res. (2014) 36(3): 757–775. First published online January 9, 2014 doi:10.1093/plankt/fbt129
at Fisheries and Oceans on M
ay 22, 2014http://plankt.oxfordjournals.org/
Dow
nloaded from
distribution. The d15N values were less enriched in the Gulf of Alaska and on theBering Sea Slope and more enriched in the eastern portion of Bering Strait and inBarrow Canyon. The d13C values of zooplankton were more depleted in the Gulf ofAlaska and in the Beaufort Sea regions and were more enriched in Western BeringStrait. The level of carnivory in the zooplankton community appeared highest in theBeaufort Gyre decreasing on the Beaufort Shelf and lowest in Western Bering Straitand in the Gulf of Alaska. Our results highlight the existence of large intra- andinter-specific differences in zooplankton isotopic signatures in relation to communitycomposition and environmental conditions.
KEYWORDS: Arctic; sub-Arctic Pacific; zooplankton; carbon; nitrogen; stableisotopes; oceanography; community structure
I N T RO D U C T I O N
Warming of the sub-Arctic and Arctic regions is currentlymore rapid than anywhere else on the planet (Barberet al., 2012). The fluctuations in sea ice regime, hydrog-raphy and increasing ocean temperatures are modifyingthe ecosystem and food-web processes (Darnis et al.,2012; Stroeve et al., 2012). Over the past 40 years, largeecological modifications have been observed in thePacific Arctic sector including shifts in the biogeographyof marine species (Grebmeier, 2012).
Zooplankton community composition and distributionpatterns are generally water mass-related (Mackas, 1984;Froneman and Pakhomov, 1998; Mackas and Coyle,2005), reflecting species’ physiological tolerance to tem-perature and salinity (Reynolds, 1993; Hughes, 2000).Therefore, changes in climate and oceanic conditionshave significant implications for zooplankton distributionand community composition (Beaugrand et al., 2002;Mackas et al., 2007; Keister et al., 2011). Zooplanktonplay a key role in marine food webs, acting as a linkbetween primary producers and higher trophic levelspecies such as fishes, marine mammals and seabirds(Wassmann et al., 2006). Recently, Matsuno et al. (Matsunoet al., 2011) suggested that the ongoing loss of sea ice willlead to a decline of arctic zooplankton species in theChukchi Sea. Thus, if the oceanic conditions in the Arcticstart to resemble those further south, endemic Pacificspecies could establish themselves in the arctic waters (seeNelson et al., 2009).
Previous sub-Arctic Pacific zooplankton studies haveidentified distinct regional populations of zooplankton(Kulikov, 1992; Springer and McRoy, 1993; Hopcroftet al., 2010; Hopcroft and Kosobokova, 2010). The pres-ence of water masses of different temperatures, salinitiesand nutrient contents across the region (Pickart et al.,2010) influences species assemblages (Springer et al.,
1989). For instance, sub-Arctic Pacific copepod species
such as Neocalanus spp. (N. cristatus, N. plumchrus andN. flemingeri), Eucalanus bungii and Calanus marshallae are thebiomass-dominant taxa in the Bering Sea and are typic-ally advected northward only as far as Bering Strait, butthey also occur in the Canada Basin (Hopcroft et al.,2010; Yoshiki et al., 2013). However, warming of seasurface temperatures and changes in the sea ice regimemay enhance their survival and northward penetrationand lead to a shift of sub-Arctic and temperate speciesinto the Arctic Ocean (Beaugrand et al., 2002; Carmackand Wassmann, 2006; Matsuno et al., 2011; Wassmannet al., 2011).
In addition to direct physiological response to climatechange, zooplankton are also expected to respond tochanges in aspects of food-web structure and dynamicssuch as in primary production. Thus, measurementof zooplankton food web structure can provide insightinto the functional response to changing conditions.Examination of carbon (d13C) and nitrogen (d15N)isotope ratios offers the opportunity to place food-webpathways into a biogeographical context (Hobson, 1999;Post, 2002). For example, previous arctic studies haveidentified a d13C gradient in zooplankton which follows apattern of depletion from west to east (e.g. Dunton et al.,1985; Saupe et al., 1989; Pomerleau, 2008). This gradienthas been attributed to large inputs of terrestrial-origincarbon from the Mackenzie River and proximity to thecoast (inshore vs. offshore) (Schell et al., 1998). Zooplanktond13C values are influenced by various processes that affectphytoplankton such as nutrient concentrations, growthrates and species-specific carbon fractionation (Hobsonet al., 1994; Rau et al., 2001).
Here, we identify the pattern of zooplankton commu-nity composition and nitrogen and carbon stable isotope(SI) ratios along a long transect from southern VancouverIsland across the North Pacific, Bering, Chuckchi andBeaufort seas to the Canadian Arctic Archipelago. The
JOURNAL OF PLANKTON RESEARCH j VOLUME 36 j NUMBER 3 j PAGES 757–775 j 2014
758
at Fisheries and Oceans on M
ay 22, 2014http://plankt.oxfordjournals.org/
Dow
nloaded from
aim of this study was two-fold; to define zooplankton-specific biogeographic regions and to relate these to bio-physical parameters that characterize the broad scaleoceanographic domains; and to examine how spatial pat-terns of SI ratios of carbon and nitrogen vary with thebiogeographical groupings identified. This spatial char-acterization is part of the larger suite of biophysicalmeasurements made during the IPY—Canada’s ThreeOceans project 2007–2008 and a longer time series ofzooplankton species assemblages (Nelson et al., pers.comm.).
M E T H O D
Zooplankton collection and identification
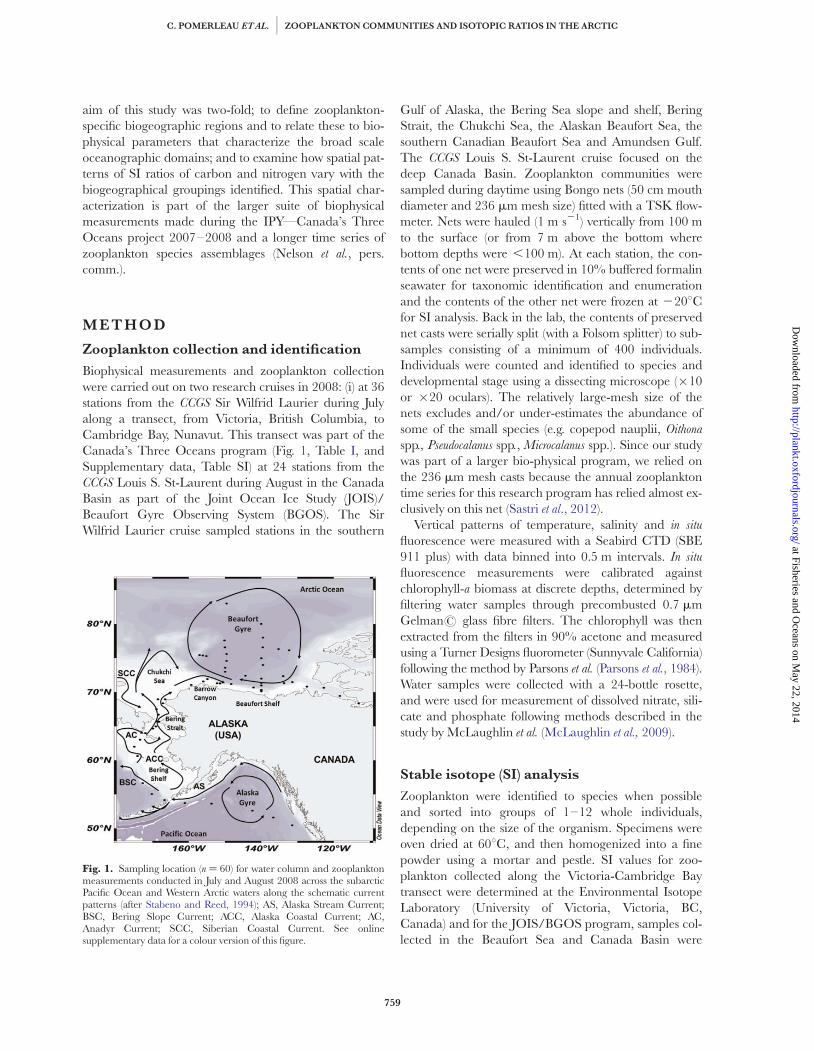
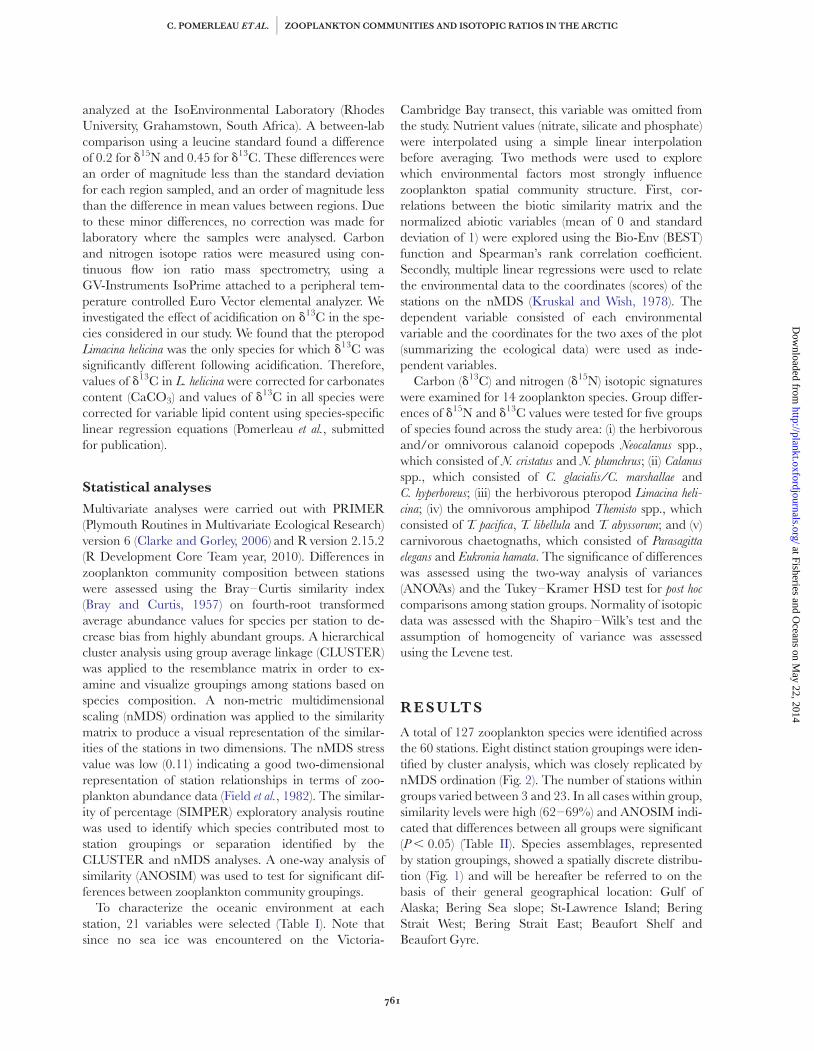
Biophysical measurements and zooplankton collectionwere carried out on two research cruises in 2008: (i) at 36stations from the CCGS Sir Wilfrid Laurier during Julyalong a transect, from Victoria, British Columbia, toCambridge Bay, Nunavut. This transect was part of theCanada’s Three Oceans program (Fig. 1, Table I, andSupplementary data, Table SI) at 24 stations from theCCGS Louis S. St-Laurent during August in the CanadaBasin as part of the Joint Ocean Ice Study (JOIS)/Beaufort Gyre Observing System (BGOS). The SirWilfrid Laurier cruise sampled stations in the southern
Gulf of Alaska, the Bering Sea slope and shelf, BeringStrait, the Chukchi Sea, the Alaskan Beaufort Sea, thesouthern Canadian Beaufort Sea and Amundsen Gulf.The CCGS Louis S. St-Laurent cruise focused on thedeep Canada Basin. Zooplankton communities weresampled during daytime using Bongo nets (50 cm mouthdiameter and 236 mm mesh size) fitted with a TSK flow-meter. Nets were hauled (1 m s21) vertically from 100 mto the surface (or from 7 m above the bottom wherebottom depths were ,100 m). At each station, the con-tents of one net were preserved in 10% buffered formalinseawater for taxonomic identification and enumerationand the contents of the other net were frozen at 2208Cfor SI analysis. Back in the lab, the contents of preservednet casts were serially split (with a Folsom splitter) to sub-samples consisting of a minimum of 400 individuals.Individuals were counted and identified to species anddevelopmental stage using a dissecting microscope (�10or �20 oculars). The relatively large-mesh size of thenets excludes and/or under-estimates the abundance ofsome of the small species (e.g. copepod nauplii, Oithona
spp., Pseudocalanus spp., Microcalanus spp.). Since our studywas part of a larger bio-physical program, we relied onthe 236 mm mesh casts because the annual zooplanktontime series for this research program has relied almost ex-clusively on this net (Sastri et al., 2012).
Vertical patterns of temperature, salinity and in situ
fluorescence were measured with a Seabird CTD (SBE911 plus) with data binned into 0.5 m intervals. In situ
fluorescence measurements were calibrated againstchlorophyll-a biomass at discrete depths, determined byfiltering water samples through precombusted 0.7 mmGelman# glass fibre filters. The chlorophyll was thenextracted from the filters in 90% acetone and measuredusing a Turner Designs fluorometer (Sunnyvale California)following the method by Parsons et al. (Parsons et al., 1984).Water samples were collected with a 24-bottle rosette,and were used for measurement of dissolved nitrate, sili-cate and phosphate following methods described in thestudy by McLaughlin et al. (McLaughlin et al., 2009).
Stable isotope (SI) analysis
Zooplankton were identified to species when possibleand sorted into groups of 1–12 whole individuals,depending on the size of the organism. Specimens wereoven dried at 608C, and then homogenized into a finepowder using a mortar and pestle. SI values for zoo-plankton collected along the Victoria-Cambridge Baytransect were determined at the Environmental IsotopeLaboratory (University of Victoria, Victoria, BC,Canada) and for the JOIS/BGOS program, samples col-lected in the Beaufort Sea and Canada Basin were
Fig. 1. Sampling location (n ¼ 60) for water column and zooplanktonmeasurements conducted in July and August 2008 across the subarcticPacific Ocean and Western Arctic waters along the schematic currentpatterns (after Stabeno and Reed, 1994); AS, Alaska Stream Current;BSC, Bering Slope Current; ACC, Alaska Coastal Current; AC,Anadyr Current; SCC, Siberian Coastal Current. See onlinesupplementary data for a colour version of this figure.
C. POMERLEAU ET AL. j ZOOPLANKTON COMMUNITIES AND ISOTOPIC RATIOS IN THE ARCTIC
759
at Fisheries and Oceans on M
ay 22, 2014http://plankt.oxfordjournals.org/
Dow
nloaded from
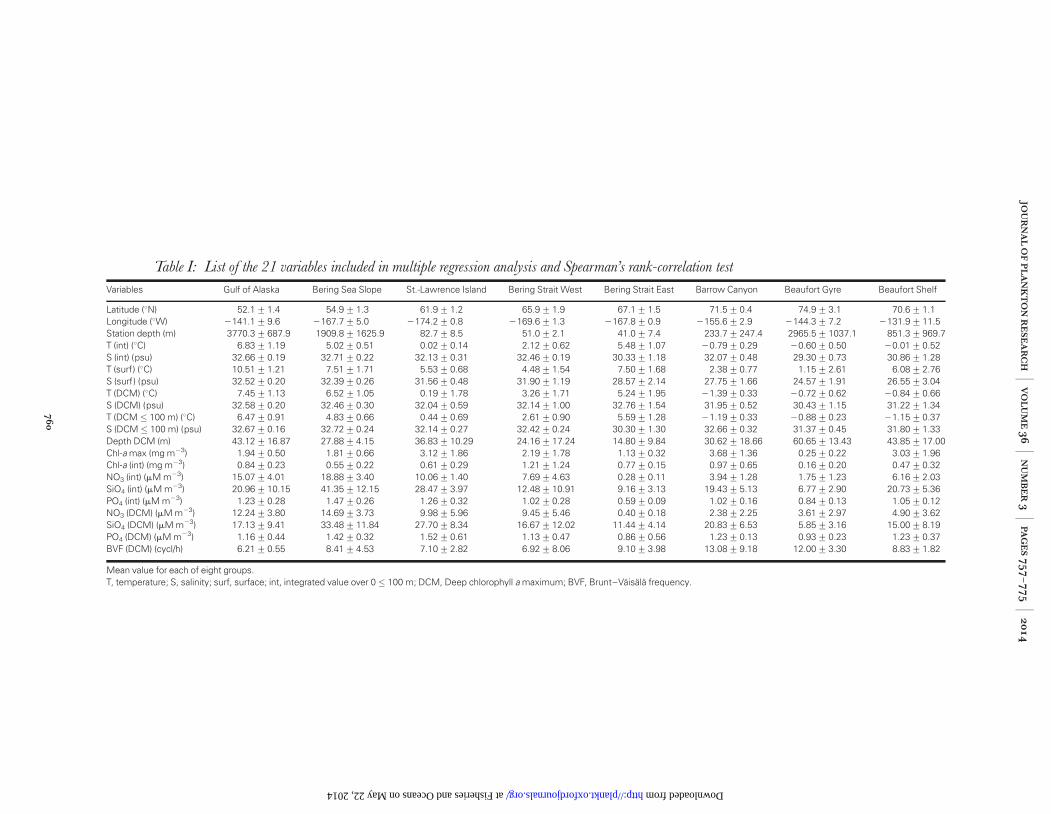
Table I: List of the 21 variables included in multiple regression analysis and Spearman’s rank-correlation test
Variables Gulf of Alaska Bering Sea Slope St.-Lawrence Island Bering Strait West Bering Strait East Barrow Canyon Beaufort Gyre Beaufort Shelf
Latitude (8N) 52.1+1.4 54.9+1.3 61.9+1.2 65.9+1.9 67.1+1.5 71.5+0.4 74.9+3.1 70.6+1.1Longitude (8W) 2141.1+9.6 2167.7+5.0 2174.2+0.8 2169.6+1.3 2167.8+0.9 2155.6+2.9 2144.3+7.2 2131.9+11.5Station depth (m) 3770.3+687.9 1909.8+1625.9 82.7+8.5 51.0+2.1 41.0+7.4 233.7+247.4 2965.5+1037.1 851.3+969.7T (int) (8C) 6.83+1.19 5.02+0.51 0.02+0.14 2.12+0.62 5.48+1.07 20.79+0.29 20.60+0.50 20.01+0.52S (int) (psu) 32.66+0.19 32.71+0.22 32.13+0.31 32.46+0.19 30.33+1.18 32.07+0.48 29.30+0.73 30.86+1.28T (surf) (8C) 10.51+1.21 7.51+1.71 5.53+0.68 4.48+1.54 7.50+1.68 2.38+0.77 1.15+2.61 6.08+2.76S (surf) (psu) 32.52+0.20 32.39+0.26 31.56+0.48 31.90+1.19 28.57+2.14 27.75+1.66 24.57+1.91 26.55+3.04T (DCM) (8C) 7.45+1.13 6.52+1.05 0.19+1.78 3.26+1.71 5.24+1.95 21.39+0.33 20.72+0.62 20.84+0.66S (DCM) (psu) 32.58+0.20 32.46+0.30 32.04+0.59 32.14+1.00 32.76+1.54 31.95+0.52 30.43+1.15 31.22+1.34T (DCM � 100 m) (8C) 6.47+0.91 4.83+0.66 0.44+0.69 2.61+0.90 5.59+1.28 21.19+0.33 20.88+0.23 21.15+0.37S (DCM � 100 m) (psu) 32.67+0.16 32.72+0.24 32.14+0.27 32.42+0.24 30.30+1.30 32.66+0.32 31.37+0.45 31.80+1.33Depth DCM (m) 43.12+16.87 27.88+4.15 36.83+10.29 24.16+17.24 14.80+9.84 30.62+18.66 60.65+13.43 43.85+17.00Chl-a max (mg m23) 1.94+0.50 1.81+0.66 3.12+1.86 2.19+1.78 1.13+0.32 3.68+1.36 0.25+0.22 3.03+1.96Chl-a (int) (mg m23) 0.84+0.23 0.55+0.22 0.61+0.29 1.21+1.24 0.77+0.15 0.97+0.65 0.16+0.20 0.47+0.32NO3 (int) (mM m23) 15.07+4.01 18.88+3.40 10.06+1.40 7.69+4.63 0.28+0.11 3.94+1.28 1.75+1.23 6.16+2.03SiO4 (int) (mM m23) 20.96+10.15 41.35+12.15 28.47+3.97 12.48+10.91 9.16+3.13 19.43+5.13 6.77+2.90 20.73+5.36PO4 (int) (mM m23) 1.23+0.28 1.47+0.26 1.26+0.32 1.02+0.28 0.59+0.09 1.02+0.16 0.84+0.13 1.05+0.12NO3 (DCM) (mM m23) 12.24+3.80 14.69+3.73 9.98+5.96 9.45+5.46 0.40+0.18 2.38+2.25 3.61+2.97 4.90+3.62SiO4 (DCM) (mM m23) 17.13+9.41 33.48+11.84 27.70+8.34 16.67+12.02 11.44+4.14 20.83+6.53 5.85+3.16 15.00+8.19PO4 (DCM) (mM m23) 1.16+0.44 1.42+0.32 1.52+0.61 1.13+0.47 0.86+0.56 1.23+0.13 0.93+0.23 1.23+0.37BVF (DCM) (cycl/h) 6.21+0.55 8.41+4.53 7.10+2.82 6.92+8.06 9.10+3.98 13.08+9.18 12.00+3.30 8.83+1.82
Mean value for each of eight groups.T, temperature; S, salinity; surf, surface; int, integrated value over 0 � 100 m; DCM, Deep chlorophyll a maximum; BVF, Brunt–Vaisala frequency.
JOU
RN
AL
OF
PL
AN
KT
ON
RE
SE
AR
CHj
VO
LU
ME36j
NU
MB
ER3j
PA
GE
S757
–775j
2014
760
at Fisheries and Oceans on May 22, 2014 http://plankt.oxfordjournals.org/ Downloaded from
analyzed at the IsoEnvironmental Laboratory (RhodesUniversity, Grahamstown, South Africa). A between-labcomparison using a leucine standard found a differenceof 0.2 for d15N and 0.45 for d13C. These differences werean order of magnitude less than the standard deviationfor each region sampled, and an order of magnitude lessthan the difference in mean values between regions. Dueto these minor differences, no correction was made forlaboratory where the samples were analysed. Carbonand nitrogen isotope ratios were measured using con-tinuous flow ion ratio mass spectrometry, using aGV-Instruments IsoPrime attached to a peripheral tem-perature controlled Euro Vector elemental analyzer. Weinvestigated the effect of acidification on d13C in the spe-cies considered in our study. We found that the pteropodLimacina helicina was the only species for which d13C wassignificantly different following acidification. Therefore,values of d13C in L. helicina were corrected for carbonatescontent (CaCO3) and values of d13C in all species werecorrected for variable lipid content using species-specificlinear regression equations (Pomerleau et al., submittedfor publication).
Statistical analyses
Multivariate analyses were carried out with PRIMER(Plymouth Routines in Multivariate Ecological Research)version 6 (Clarke and Gorley, 2006) and R version 2.15.2(R Development Core Team year, 2010). Differences inzooplankton community composition between stationswere assessed using the Bray–Curtis similarity index(Bray and Curtis, 1957) on fourth-root transformedaverage abundance values for species per station to de-crease bias from highly abundant groups. A hierarchicalcluster analysis using group average linkage (CLUSTER)was applied to the resemblance matrix in order to ex-amine and visualize groupings among stations based onspecies composition. A non-metric multidimensionalscaling (nMDS) ordination was applied to the similaritymatrix to produce a visual representation of the similar-ities of the stations in two dimensions. The nMDS stressvalue was low (0.11) indicating a good two-dimensionalrepresentation of station relationships in terms of zoo-plankton abundance data (Field et al., 1982). The similar-ity of percentage (SIMPER) exploratory analysis routinewas used to identify which species contributed most tostation groupings or separation identified by theCLUSTER and nMDS analyses. A one-way analysis ofsimilarity (ANOSIM) was used to test for significant dif-ferences between zooplankton community groupings.
To characterize the oceanic environment at eachstation, 21 variables were selected (Table I). Note thatsince no sea ice was encountered on the Victoria-
Cambridge Bay transect, this variable was omitted fromthe study. Nutrient values (nitrate, silicate and phosphate)were interpolated using a simple linear interpolationbefore averaging. Two methods were used to explorewhich environmental factors most strongly influencezooplankton spatial community structure. First, cor-relations between the biotic similarity matrix and thenormalized abiotic variables (mean of 0 and standarddeviation of 1) were explored using the Bio-Env (BEST)function and Spearman’s rank correlation coefficient.Secondly, multiple linear regressions were used to relatethe environmental data to the coordinates (scores) of thestations on the nMDS (Kruskal and Wish, 1978). Thedependent variable consisted of each environmentalvariable and the coordinates for the two axes of the plot(summarizing the ecological data) were used as inde-pendent variables.
Carbon (d13C) and nitrogen (d15N) isotopic signatureswere examined for 14 zooplankton species. Group differ-ences of d15N and d13C values were tested for five groupsof species found across the study area: (i) the herbivorousand/or omnivorous calanoid copepods Neocalanus spp.,which consisted of N. cristatus and N. plumchrus; (ii) Calanus
spp., which consisted of C. glacialis/C. marshallae andC. hyperboreus; (iii) the herbivorous pteropod Limacina heli-
cina; (iv) the omnivorous amphipod Themisto spp., whichconsisted of T. pacifica, T. libellula and T. abyssorum; and (v)carnivorous chaetognaths, which consisted of Parasagitta
elegans and Eukronia hamata. The significance of differenceswas assessed using the two-way analysis of variances(ANOVAs) and the Tukey–Kramer HSD test for post hoc
comparisons among station groups. Normality of isotopicdata was assessed with the Shapiro–Wilk’s test and theassumption of homogeneity of variance was assessedusing the Levene test.
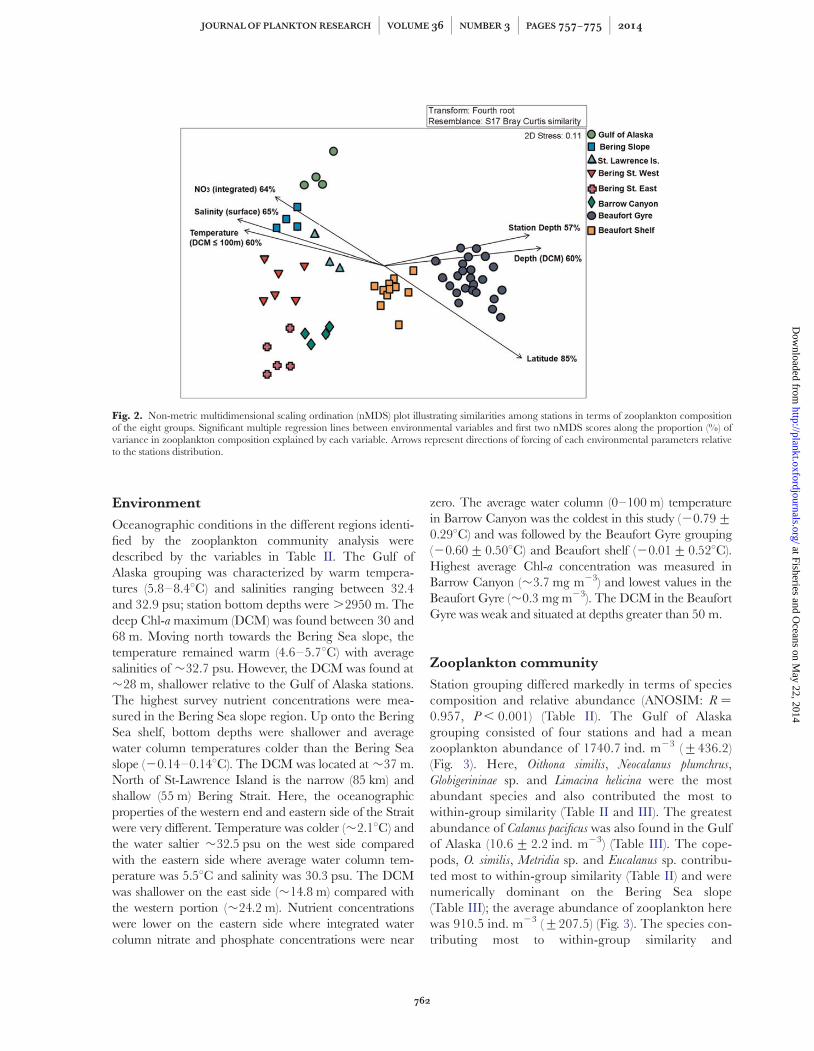
R E S U LT S
A total of 127 zooplankton species were identified acrossthe 60 stations. Eight distinct station groupings were iden-tified by cluster analysis, which was closely replicated bynMDS ordination (Fig. 2). The number of stations withingroups varied between 3 and 23. In all cases within group,similarity levels were high (62–69%) and ANOSIM indi-cated that differences between all groups were significant(P , 0.05) (Table II). Species assemblages, representedby station groupings, showed a spatially discrete distribu-tion (Fig. 1) and will be hereafter be referred to on thebasis of their general geographical location: Gulf ofAlaska; Bering Sea slope; St-Lawrence Island; BeringStrait West; Bering Strait East; Beaufort Shelf andBeaufort Gyre.
C. POMERLEAU ET AL. j ZOOPLANKTON COMMUNITIES AND ISOTOPIC RATIOS IN THE ARCTIC
761
at Fisheries and Oceans on M
ay 22, 2014http://plankt.oxfordjournals.org/
Dow
nloaded from
Environment
Oceanographic conditions in the different regions identi-fied by the zooplankton community analysis weredescribed by the variables in Table II. The Gulf ofAlaska grouping was characterized by warm tempera-tures (5.8–8.48C) and salinities ranging between 32.4and 32.9 psu; station bottom depths were .2950 m. Thedeep Chl-a maximum (DCM) was found between 30 and68 m. Moving north towards the Bering Sea slope, thetemperature remained warm (4.6–5.78C) with averagesalinities of �32.7 psu. However, the DCM was found at�28 m, shallower relative to the Gulf of Alaska stations.The highest survey nutrient concentrations were mea-sured in the Bering Sea slope region. Up onto the BeringSea shelf, bottom depths were shallower and averagewater column temperatures colder than the Bering Seaslope (20.14–0.148C). The DCM was located at �37 m.North of St-Lawrence Island is the narrow (85 km) andshallow (55 m) Bering Strait. Here, the oceanographicproperties of the western end and eastern side of the Straitwere very different. Temperature was colder (�2.18C) andthe water saltier �32.5 psu on the west side comparedwith the eastern side where average water column tem-perature was 5.58C and salinity was 30.3 psu. The DCMwas shallower on the east side (�14.8 m) compared withthe western portion (�24.2 m). Nutrient concentrationswere lower on the eastern side where integrated watercolumn nitrate and phosphate concentrations were near
zero. The average water column (0–100 m) temperaturein Barrow Canyon was the coldest in this study (20.79+0.298C) and was followed by the Beaufort Gyre grouping(20.60+0.508C) and Beaufort shelf (20.01+0.528C).Highest average Chl-a concentration was measured inBarrow Canyon (�3.7 mg m23) and lowest values in theBeaufort Gyre (�0.3 mg m23). The DCM in the BeaufortGyre was weak and situated at depths greater than 50 m.
Zooplankton community
Station grouping differed markedly in terms of speciescomposition and relative abundance (ANOSIM: R ¼
0.957, P , 0.001) (Table II). The Gulf of Alaskagrouping consisted of four stations and had a meanzooplankton abundance of 1740.7 ind. m23 (+436.2)(Fig. 3). Here, Oithona similis, Neocalanus plumchrus,Globigerininae sp. and Limacina helicina were the mostabundant species and also contributed the most towithin-group similarity (Table II and III). The greatestabundance of Calanus pacificus was also found in the Gulfof Alaska (10.6+ 2.2 ind. m23) (Table III). The cope-pods, O. similis, Metridia sp. and Eucalanus sp. contribu-ted most to within-group similarity (Table II) and werenumerically dominant on the Bering Sea slope(Table III); the average abundance of zooplankton herewas 910.5 ind. m23 (+207.5) (Fig. 3). The species con-tributing most to within-group similarity and
Fig. 2. Non-metric multidimensional scaling ordination (nMDS) plot illustrating similarities among stations in terms of zooplankton compositionof the eight groups. Significant multiple regression lines between environmental variables and first two nMDS scores along the proportion (%) ofvariance in zooplankton composition explained by each variable. Arrows represent directions of forcing of each environmental parameters relativeto the stations distribution.
JOURNAL OF PLANKTON RESEARCH j VOLUME 36 j NUMBER 3 j PAGES 757–775 j 2014
762
at Fisheries and Oceans on M
ay 22, 2014http://plankt.oxfordjournals.org/
Dow
nloaded from
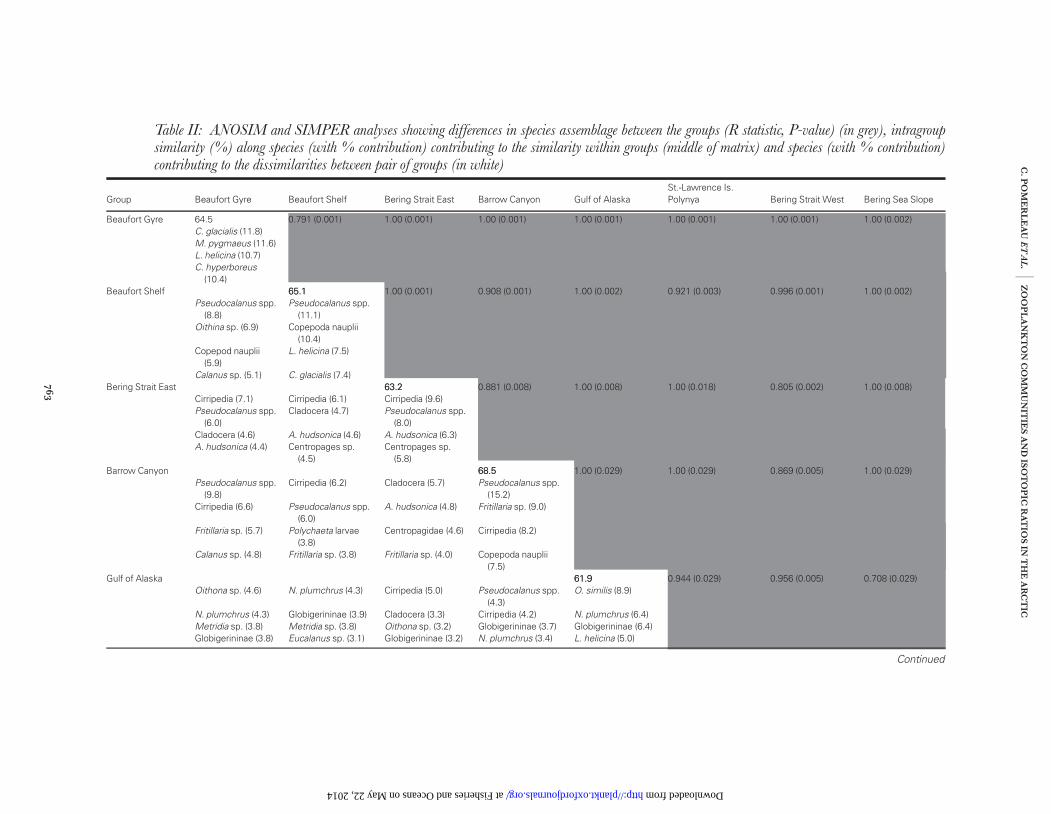
Table II: ANOSIM and SIMPER analyses showing differences in species assemblage between the groups (R statistic, P-value) (in grey), intragroupsimilarity (%) along species (with % contribution) contributing to the similarity within groups (middle of matrix) and species (with % contribution)contributing to the dissimilarities between pair of groups (in white)
Group Beaufort Gyre Beaufort Shelf Bering Strait East Barrow Canyon Gulf of AlaskaSt.-Lawrence Is.Polynya Bering Strait West Bering Sea Slope
Beaufort Gyre 64.5 0.791 (0.001) 1.00 (0.001) 1.00 (0.001) 1.00 (0.001) 1.00 (0.001) 1.00 (0.001) 1.00 (0.002)C. glacialis (11.8)M. pygmaeus (11.6)L. helicina (10.7)C. hyperboreus
(10.4)Beaufort Shelf 65.165.1 1.00 (0.001) 0.908 (0.001) 1.00 (0.002) 0.921 (0.003) 0.996 (0.001) 1.00 (0.002)
Pseudocalanus spp.(8.8)
Pseudocalanus spp.(11.1)
Oithina sp. (6.9) Copepoda nauplii(10.4)
Copepod nauplii(5.9)
L. helicina (7.5)
Calanus sp. (5.1) C. glacialis (7.4)Bering Strait East 63.263.2 0.881 (0.008) 1.00 (0.008) 1.00 (0.018) 0.805 (0.002) 1.00 (0.008)
Cirripedia (7.1) Cirripedia (6.1) Cirripedia (9.6)Pseudocalanus spp.
(6.0)Cladocera (4.7) Pseudocalanus spp.
(8.0)Cladocera (4.6) A. hudsonica (4.6) A. hudsonica (6.3)A. hudsonica (4.4) Centropages sp.
(4.5)Centropages sp.
(5.8)Barrow Canyon 68.568.5 1.00 (0.029) 1.00 (0.029) 0.869 (0.005) 1.00 (0.029)
Pseudocalanus spp.(9.8)
Cirripedia (6.2) Cladocera (5.7) Pseudocalanus spp.(15.2)
Cirripedia (6.6) Pseudocalanus spp.(6.0)
A. hudsonica (4.8) Fritillaria sp. (9.0)
Fritillaria sp. (5.7) Polychaeta larvae(3.8)
Centropagidae (4.6) Cirripedia (8.2)
Calanus sp. (4.8) Fritillaria sp. (3.8) Fritillaria sp. (4.0) Copepoda nauplii(7.5)
Gulf of Alaska 61.961.9 0.944 (0.029) 0.956 (0.005) 0.708 (0.029)Oithona sp. (4.6) N. plumchrus (4.3) Cirripedia (5.0) Pseudocalanus spp.
(4.3)O. similis (8.9)
N. plumchrus (4.3) Globigerininae (3.9) Cladocera (3.3) Cirripedia (4.2) N. plumchrus (6.4)Metridia sp. (3.8) Metridia sp. (3.8) Oithona sp. (3.2) Globigerininae (3.7) Globigerininae (6.4)Globigerininae (3.8) Eucalanus sp. (3.1) Globigerininae (3.2) N. plumchrus (3.4) L. helicina (5.0)
Continued
C.
PO
ME
RL
EA
UE
TA
L.j
ZO
OP
LA
NK
TO
NC
OM
MU
NIT
IES
AN
DIS
OT
OP
ICR
AT
IOS
INT
HE
AR
CT
IC
763
at Fisheries and Oceans on May 22, 2014 http://plankt.oxfordjournals.org/ Downloaded from
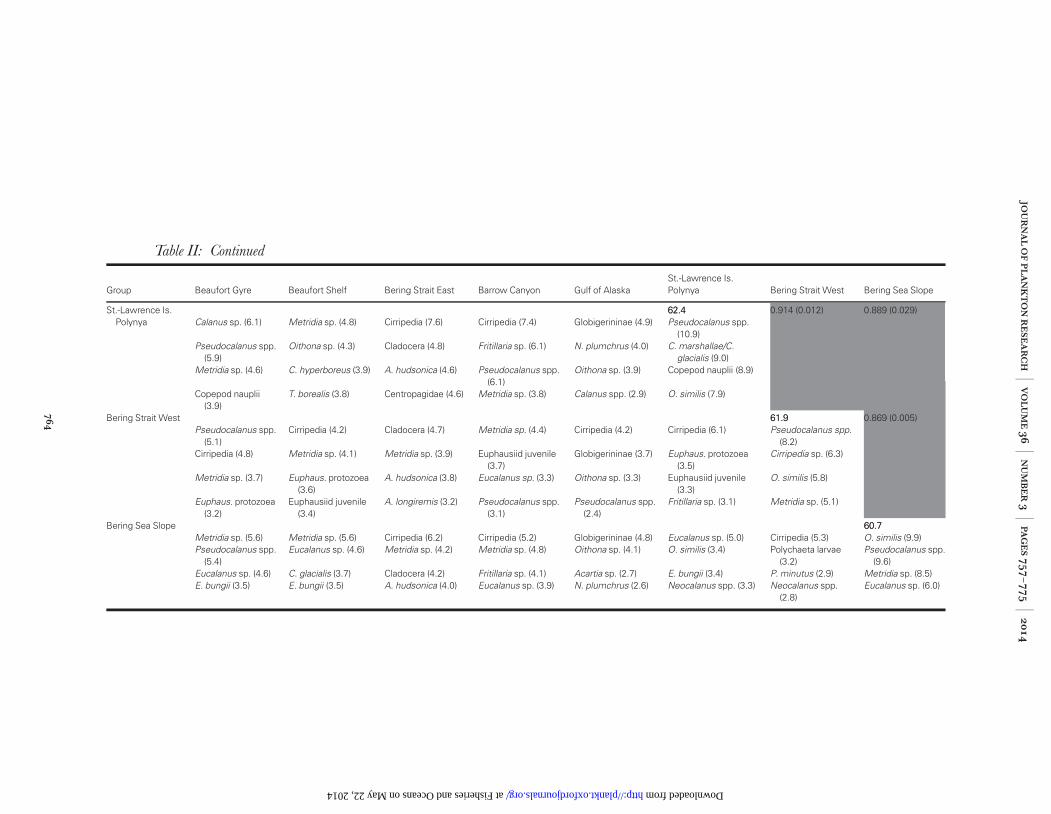
Table II: Continued
Group Beaufort Gyre Beaufort Shelf Bering Strait East Barrow Canyon Gulf of AlaskaSt.-Lawrence Is.Polynya Bering Strait West Bering Sea Slope
St.-Lawrence Is.Polynya
62.462.4 0.914 (0.012) 0.889 (0.029)Calanus sp. (6.1) Metridia sp. (4.8) Cirripedia (7.6) Cirripedia (7.4) Globigerininae (4.9) Pseudocalanus spp.
(10.9)Pseudocalanus spp.
(5.9)Oithona sp. (4.3) Cladocera (4.8) Fritillaria sp. (6.1) N. plumchrus (4.0) C. marshallae/C.
glacialis (9.0)Metridia sp. (4.6) C. hyperboreus (3.9) A. hudsonica (4.6) Pseudocalanus spp.
(6.1)Oithona sp. (3.9) Copepod nauplii (8.9)
Copepod nauplii(3.9)
T. borealis (3.8) Centropagidae (4.6) Metridia sp. (3.8) Calanus spp. (2.9) O. similis (7.9)
Bering Strait West 61.961.9 0.869 (0.005)Pseudocalanus spp.
(5.1)Cirripedia (4.2) Cladocera (4.7) Metridia sp. (4.4) Cirripedia (4.2) Cirripedia (6.1) Pseudocalanus spp.
(8.2)Cirripedia (4.8) Metridia sp. (4.1) Metridia sp. (3.9) Euphausiid juvenile
(3.7)Globigerininae (3.7) Euphaus. protozoea
(3.5)Cirripedia sp. (6.3)
Metridia sp. (3.7) Euphaus. protozoea(3.6)
A. hudsonica (3.8) Eucalanus sp. (3.3) Oithona sp. (3.3) Euphausiid juvenile(3.3)
O. similis (5.8)
Euphaus. protozoea(3.2)
Euphausiid juvenile(3.4)
A. longiremis (3.2) Pseudocalanus spp.(3.1)
Pseudocalanus spp.(2.4)
Fritillaria sp. (3.1) Metridia sp. (5.1)
Bering Sea Slope 60.760.7Metridia sp. (5.6) Metridia sp. (5.6) Cirripedia (6.2) Cirripedia (5.2) Globigerininae (4.8) Eucalanus sp. (5.0) Cirripedia (5.3) O. similis (9.9)Pseudocalanus spp.
(5.4)Eucalanus sp. (4.6) Metridia sp. (4.2) Metridia sp. (4.8) Oithona sp. (4.1) O. similis (3.4) Polychaeta larvae
(3.2)Pseudocalanus spp.
(9.6)Eucalanus sp. (4.6) C. glacialis (3.7) Cladocera (4.2) Fritillaria sp. (4.1) Acartia sp. (2.7) E. bungii (3.4) P. minutus (2.9) Metridia sp. (8.5)E. bungii (3.5) E. bungii (3.5) A. hudsonica (4.0) Eucalanus sp. (3.9) N. plumchrus (2.6) Neocalanus spp. (3.3) Neocalanus spp.
(2.8)Eucalanus sp. (6.0)
JOU
RN
AL
OF
PL
AN
KT
ON
RE
SE
AR
CHj
VO
LU
ME36j
NU
MB
ER3j
PA
GE
S757
–775j
2014
764
at Fisheries and Oceans on May 22, 2014 http://plankt.oxfordjournals.org/ Downloaded from
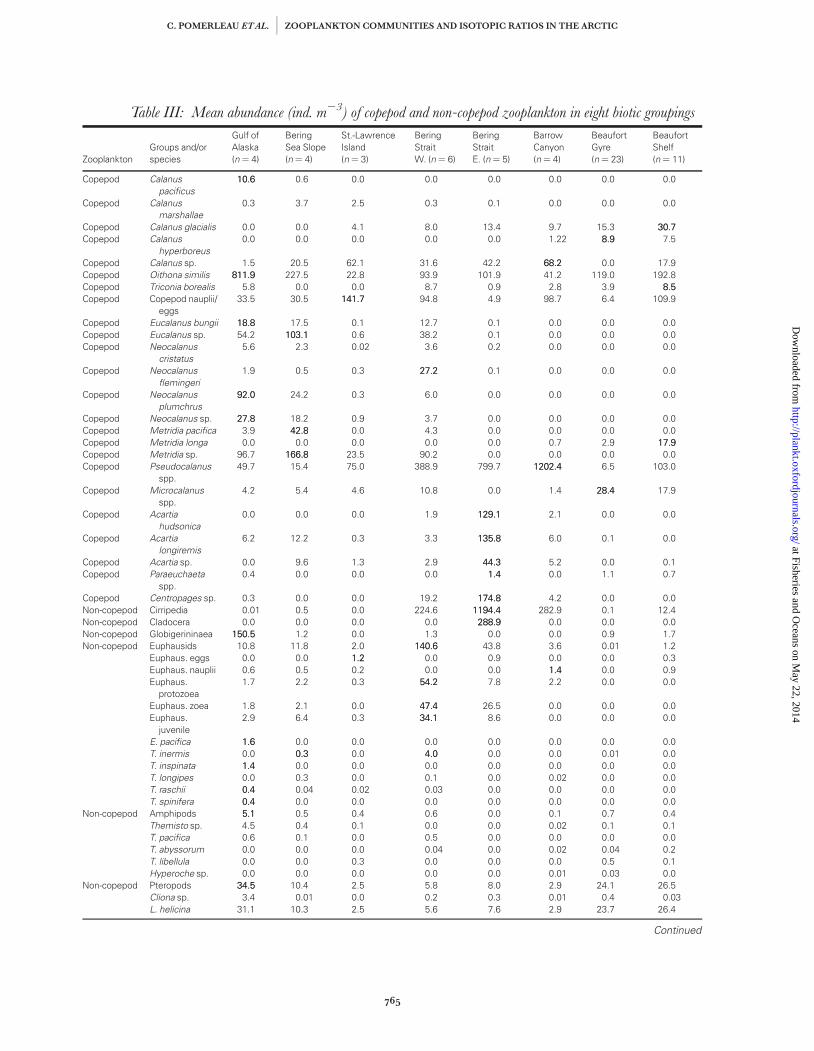
Table III: Mean abundance (ind. m23) of copepod and non-copepod zooplankton in eight biotic groupings
ZooplanktonGroups and/orspecies
Gulf ofAlaska(n ¼ 4)
BeringSea Slope(n ¼ 4)
St.-LawrenceIsland(n ¼ 3)
BeringStraitW. (n ¼ 6)
BeringStraitE. (n ¼ 5)
BarrowCanyon(n ¼ 4)
BeaufortGyre(n ¼ 23)
BeaufortShelf(n ¼ 11)
Copepod Calanuspacificus
10.610.6 0.6 0.0 0.0 0.0 0.0 0.0 0.0
Copepod Calanusmarshallae
0.3 3.7 2.5 0.3 0.1 0.0 0.0 0.0
Copepod Calanus glacialis 0.0 0.0 4.1 8.0 13.4 9.7 15.3 30.730.7Copepod Calanus
hyperboreus0.0 0.0 0.0 0.0 0.0 1.22 8.98.9 7.5
Copepod Calanus sp. 1.5 20.5 62.1 31.6 42.2 68.268.2 0.0 17.9Copepod Oithona similis 811.9811.9 227.5 22.8 93.9 101.9 41.2 119.0 192.8Copepod Triconia borealis 5.8 0.0 0.0 8.7 0.9 2.8 3.9 8.58.5Copepod Copepod nauplii/
eggs33.5 30.5 141.7141.7 94.8 4.9 98.7 6.4 109.9
Copepod Eucalanus bungii 18.818.8 17.5 0.1 12.7 0.1 0.0 0.0 0.0Copepod Eucalanus sp. 54.2 103.1103.1 0.6 38.2 0.1 0.0 0.0 0.0Copepod Neocalanus
cristatus5.6 2.3 0.02 3.6 0.2 0.0 0.0 0.0
Copepod Neocalanusflemingeri
1.9 0.5 0.3 27.227.2 0.1 0.0 0.0 0.0
Copepod Neocalanusplumchrus
92.092.0 24.2 0.3 6.0 0.0 0.0 0.0 0.0
Copepod Neocalanus sp. 27.827.8 18.2 0.9 3.7 0.0 0.0 0.0 0.0Copepod Metridia pacifica 3.9 42.842.8 0.0 4.3 0.0 0.0 0.0 0.0Copepod Metridia longa 0.0 0.0 0.0 0.0 0.0 0.7 2.9 17.917.9Copepod Metridia sp. 96.7 166.8166.8 23.5 90.2 0.0 0.0 0.0 0.0Copepod Pseudocalanus
spp.49.7 15.4 75.0 388.9 799.7 1202.41202.4 6.5 103.0
Copepod Microcalanusspp.
4.2 5.4 4.6 10.8 0.0 1.4 28.428.4 17.9
Copepod Acartiahudsonica
0.0 0.0 0.0 1.9 129.1129.1 2.1 0.0 0.0
Copepod Acartialongiremis
6.2 12.2 0.3 3.3 135.8135.8 6.0 0.1 0.0
Copepod Acartia sp. 0.0 9.6 1.3 2.9 44.344.3 5.2 0.0 0.1Copepod Paraeuchaeta
spp.0.4 0.0 0.0 0.0 1.41.4 0.0 1.1 0.7
Copepod Centropages sp. 0.3 0.0 0.0 19.2 174.8174.8 4.2 0.0 0.0Non-copepod Cirripedia 0.01 0.5 0.0 224.6 1194.41194.4 282.9 0.1 12.4Non-copepod Cladocera 0.0 0.0 0.0 0.0 288.9288.9 0.0 0.0 0.0Non-copepod Globigerininaea 150.5150.5 1.2 0.0 1.3 0.0 0.0 0.9 1.7Non-copepod Euphausids 10.8 11.8 2.0 140.6140.6 43.8 3.6 0.01 1.2
Euphaus. eggs 0.0 0.0 1.21.2 0.0 0.9 0.0 0.0 0.3Euphaus. nauplii 0.6 0.5 0.2 0.0 0.0 1.41.4 0.0 0.9Euphaus.
protozoea1.7 2.2 0.3 54.254.2 7.8 2.2 0.0 0.0
Euphaus. zoea 1.8 2.1 0.0 47.447.4 26.5 0.0 0.0 0.0Euphaus.
juvenile2.9 6.4 0.3 34.134.1 8.6 0.0 0.0 0.0
E. pacifica 1.61.6 0.0 0.0 0.0 0.0 0.0 0.0 0.0T. inermis 0.0 0.30.3 0.0 4.04.0 0.0 0.0 0.01 0.0T. inspinata 1.41.4 0.0 0.0 0.0 0.0 0.0 0.0 0.0T. longipes 0.0 0.3 0.0 0.1 0.0 0.02 0.0 0.0T. raschii 0.40.4 0.04 0.02 0.03 0.0 0.0 0.0 0.0T. spinifera 0.40.4 0.0 0.0 0.0 0.0 0.0 0.0 0.0
Non-copepod Amphipods 5.15.1 0.5 0.4 0.6 0.0 0.1 0.7 0.4Themisto sp. 4.5 0.4 0.1 0.0 0.0 0.02 0.1 0.1T. pacifica 0.6 0.1 0.0 0.5 0.0 0.0 0.0 0.0T. abyssorum 0.0 0.0 0.0 0.04 0.0 0.02 0.04 0.2T. libellula 0.0 0.0 0.3 0.0 0.0 0.0 0.5 0.1Hyperoche sp. 0.0 0.0 0.0 0.0 0.0 0.01 0.03 0.0
Non-copepod Pteropods 34.534.5 10.4 2.5 5.8 8.0 2.9 24.1 26.5Cliona sp. 3.4 0.01 0.0 0.2 0.3 0.01 0.4 0.03L. helicina 31.1 10.3 2.5 5.6 7.6 2.9 23.7 26.4
Continued
C. POMERLEAU ET AL. j ZOOPLANKTON COMMUNITIES AND ISOTOPIC RATIOS IN THE ARCTIC
765
at Fisheries and Oceans on M
ay 22, 2014http://plankt.oxfordjournals.org/
Dow
nloaded from
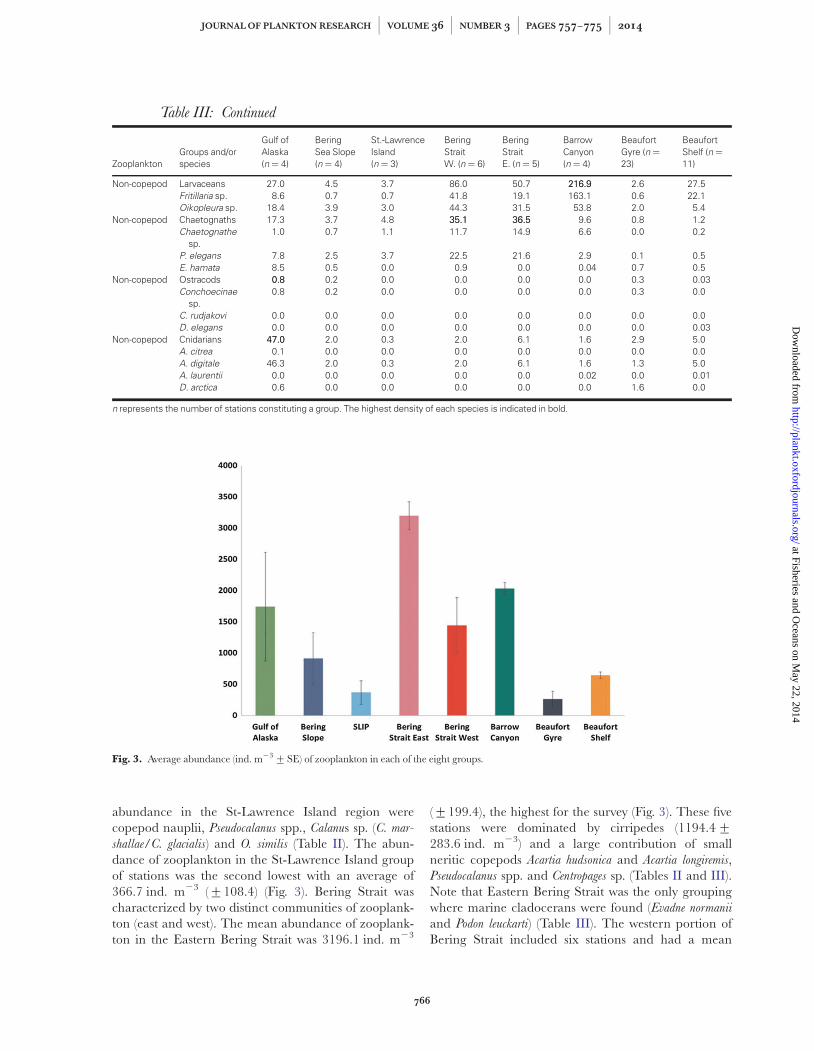
abundance in the St-Lawrence Island region werecopepod nauplii, Pseudocalanus spp., Calanus sp. (C. mar-
shallae/C. glacialis) and O. similis (Table II). The abun-dance of zooplankton in the St-Lawrence Island groupof stations was the second lowest with an average of366.7 ind. m23 (+108.4) (Fig. 3). Bering Strait wascharacterized by two distinct communities of zooplank-ton (east and west). The mean abundance of zooplank-ton in the Eastern Bering Strait was 3196.1 ind. m23
(+199.4), the highest for the survey (Fig. 3). These fivestations were dominated by cirripedes (1194.4+283.6 ind. m23) and a large contribution of smallneritic copepods Acartia hudsonica and Acartia longiremis,Pseudocalanus spp. and Centropages sp. (Tables II and III).Note that Eastern Bering Strait was the only groupingwhere marine cladocerans were found (Evadne normanii
and Podon leuckarti) (Table III). The western portion ofBering Strait included six stations and had a mean
Table III: Continued
ZooplanktonGroups and/orspecies
Gulf ofAlaska(n ¼ 4)
BeringSea Slope(n ¼ 4)
St.-LawrenceIsland(n ¼ 3)
BeringStraitW. (n ¼ 6)
BeringStraitE. (n ¼ 5)
BarrowCanyon(n ¼ 4)
BeaufortGyre (n ¼23)
BeaufortShelf (n ¼11)
Non-copepod Larvaceans 27.0 4.5 3.7 86.0 50.7 216.9216.9 2.6 27.5Fritillaria sp. 8.6 0.7 0.7 41.8 19.1 163.1 0.6 22.1Oikopleura sp. 18.4 3.9 3.0 44.3 31.5 53.8 2.0 5.4
Non-copepod Chaetognaths 17.3 3.7 4.8 35.135.1 36.536.5 9.6 0.8 1.2Chaetognathe
sp.1.0 0.7 1.1 11.7 14.9 6.6 0.0 0.2
P. elegans 7.8 2.5 3.7 22.5 21.6 2.9 0.1 0.5E. hamata 8.5 0.5 0.0 0.9 0.0 0.04 0.7 0.5
Non-copepod Ostracods 0.80.8 0.2 0.0 0.0 0.0 0.0 0.3 0.03Conchoecinae
sp.0.8 0.2 0.0 0.0 0.0 0.0 0.3 0.0
C. rudjakovi 0.0 0.0 0.0 0.0 0.0 0.0 0.0 0.0D. elegans 0.0 0.0 0.0 0.0 0.0 0.0 0.0 0.03
Non-copepod Cnidarians 47.047.0 2.0 0.3 2.0 6.1 1.6 2.9 5.0A. citrea 0.1 0.0 0.0 0.0 0.0 0.0 0.0 0.0A. digitale 46.3 2.0 0.3 2.0 6.1 1.6 1.3 5.0A. laurentii 0.0 0.0 0.0 0.0 0.0 0.02 0.0 0.01D. arctica 0.6 0.0 0.0 0.0 0.0 0.0 1.6 0.0
n represents the number of stations constituting a group. The highest density of each species is indicated in bold.
Fig. 3. Average abundance (ind. m23+SE) of zooplankton in each of the eight groups.
JOURNAL OF PLANKTON RESEARCH j VOLUME 36 j NUMBER 3 j PAGES 757–775 j 2014
766
at Fisheries and Oceans on M
ay 22, 2014http://plankt.oxfordjournals.org/
Dow
nloaded from
zooplankton abundance of 1440.8 ind. m23 (+91.1)(Fig. 3). Euphausiid abundance was highest in thisregion (140.6+ 15.6 ind. m23) (Table III), while O.
similis, Metridia sp., Pseudocalanus spp. and cirripedes con-tributed most to within group similarity (Table II). Thehighest abundances of chaetognaths were found inBering Strait and in similar numbers in both east andwest (Table III). The four stations making up the BarrowCanyon group were characterized by the highest abun-dance of Pseudocalanus spp. (1202.4+ 78.9 ind. m23) andlarvaceans (216.9+ 13.2 ind. m23) (Table III).Pseudocalanus spp., Fritillaria sp., cirripedes and copepodnauplii were the species that contributed most to similar-ity within this grouping (Table II). Zooplankton meanabundance in Barrow Canyon was the second highest(2028.5+ 51.9 ind. m23) (Fig. 3). The mean zooplank-ton abundance in the Beaufort Gyre region (23 stations)was the lowest of all groupings (262.6+10.6 ind. m23)(Fig. 3). Oithona similis was numerically dominant(Table III), but Calanus glacialis, Microcalanus pygmaeus,
L. helicina and Calanus hyperboreus were the species that con-tributed most to similarity within this group (Table II). Thesecond largest grouping of stations (11 stations) was theBeaufort Shelf which was characterized by high numbers ofPseudocalanus spp., copepod nauplii, L. helicina and C. glacialis
(Tables II and III). Zooplankton mean abundance in thisgrouping was 643.3+ 37.9 ind. m23 (Fig. 3).
Influence of environmental variables onspecies assemblages
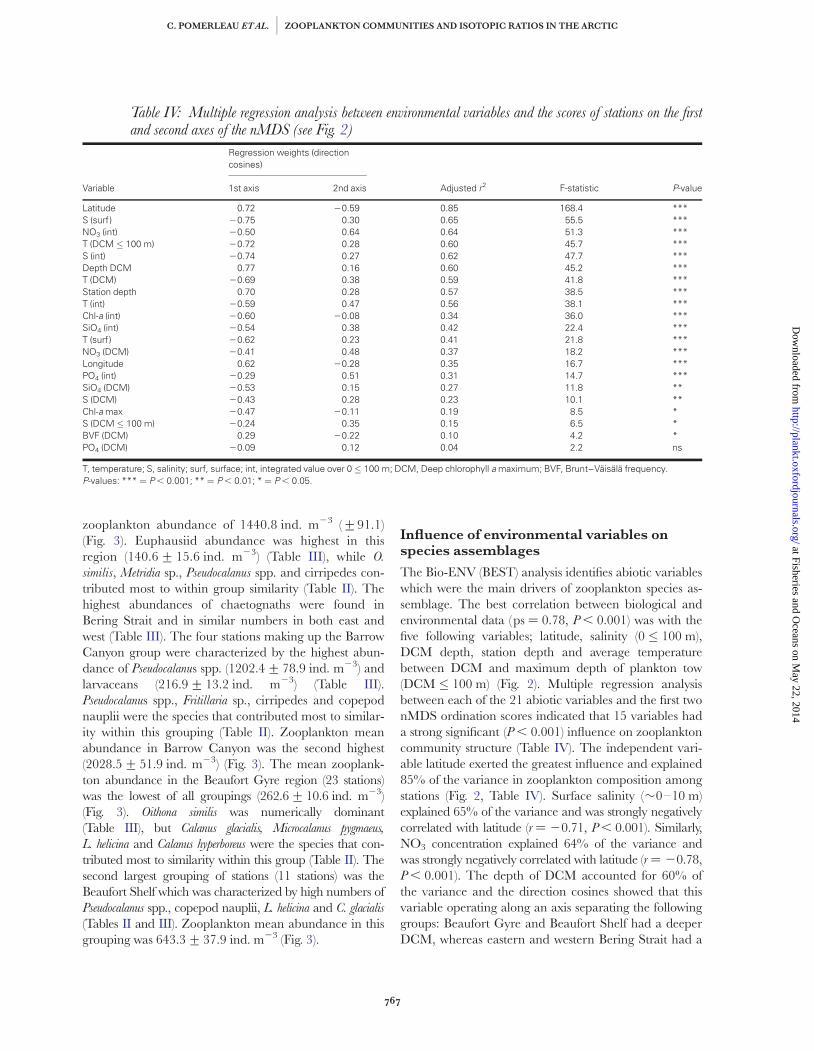
The Bio-ENV (BEST) analysis identifies abiotic variableswhich were the main drivers of zooplankton species as-semblage. The best correlation between biological andenvironmental data (ps ¼ 0.78, P , 0.001) was with thefive following variables; latitude, salinity (0 � 100 m),DCM depth, station depth and average temperaturebetween DCM and maximum depth of plankton tow(DCM � 100 m) (Fig. 2). Multiple regression analysisbetween each of the 21 abiotic variables and the first twonMDS ordination scores indicated that 15 variables hada strong significant (P , 0.001) influence on zooplanktoncommunity structure (Table IV). The independent vari-able latitude exerted the greatest influence and explained85% of the variance in zooplankton composition amongstations (Fig. 2, Table IV). Surface salinity (�0–10 m)explained 65% of the variance and was strongly negativelycorrelated with latitude (r ¼ 20.71, P , 0.001). Similarly,NO3 concentration explained 64% of the variance andwas strongly negatively correlated with latitude (r ¼ 20.78,P , 0.001). The depth of DCM accounted for 60% ofthe variance and the direction cosines showed that thisvariable operating along an axis separating the followinggroups: Beaufort Gyre and Beaufort Shelf had a deeperDCM, whereas eastern and western Bering Strait had a
Table IV: Multiple regression analysis between environmental variables and the scores of stations on the firstand second axes of the nMDS (see Fig. 2)
Variable
Regression weights (directioncosines)
Adjusted r2 F-statistic P-value1st axis 2nd axis
Latitude 0.72 20.59 0.85 168.4 ***S (surf) 20.75 0.30 0.65 55.5 ***NO3 (int) 20.50 0.64 0.64 51.3 ***T (DCM � 100 m) 20.72 0.28 0.60 45.7 ***S (int) 20.74 0.27 0.62 47.7 ***Depth DCM 0.77 0.16 0.60 45.2 ***T (DCM) 20.69 0.38 0.59 41.8 ***Station depth 0.70 0.28 0.57 38.5 ***T (int) 20.59 0.47 0.56 38.1 ***Chl-a (int) 20.60 20.08 0.34 36.0 ***SiO4 (int) 20.54 0.38 0.42 22.4 ***T (surf) 20.62 0.23 0.41 21.8 ***NO3 (DCM) 20.41 0.48 0.37 18.2 ***Longitude 0.62 20.28 0.35 16.7 ***PO4 (int) 20.29 0.51 0.31 14.7 ***SiO4 (DCM) 20.53 0.15 0.27 11.8 **S (DCM) 20.43 0.28 0.23 10.1 **Chl-a max 20.47 20.11 0.19 8.5 *S (DCM � 100 m) 20.24 0.35 0.15 6.5 *BVF (DCM) 0.29 20.22 0.10 4.2 *PO4 (DCM) 20.09 0.12 0.04 2.2 ns
T, temperature; S, salinity; surf, surface; int, integrated value over 0 � 100 m; DCM, Deep chlorophyll a maximum; BVF, Brunt–Vaisala frequency.P-values: *** ¼ P , 0.001; ** ¼ P , 0.01; * ¼ P , 0.05.
C. POMERLEAU ET AL. j ZOOPLANKTON COMMUNITIES AND ISOTOPIC RATIOS IN THE ARCTIC
767
at Fisheries and Oceans on M
ay 22, 2014http://plankt.oxfordjournals.org/
Dow
nloaded from
shallower DCM depth. The average water temperaturebetween DCM and maximum depth of plankton tow(�100 m) and the integrated water column (100 m) salin-ity both explained 60% of the variance in communitycomposition. Beaufort Gyre and Beaufort Shelf hadfresher and colder water compared with the Bering Seaslope and St-Lawrence Island (Fig. 2).
Species composition and relative abundance followeda latitudinal pattern. This pattern was particularlyevident between the lower latitude groups and the twoarctic groupings (Beaufort Gyre and Beaufort Shelf ). Forinstance, the Pacific-water-associated species C. pacificus,
M. pacifica, N. plumchrus and euphausiid Euphausia pacifica
were virtually absent at stations north of the Bering Seaslope, but were found in large numbers in the warm(4.6–8.48C) and salty (32.4–33.0 psu) waters of the Gulfof Alaska and Bering Sea slope regions (Table I).Abundances of Eucalanus sp. and Neocalanus spp. werelower in eastern Bering Strait compared with southerngroupings and neither of these genera were present in theBarrow Canyon or Arctic station groupings. The twolarge Arctic groupings included high latitude zooplank-ton species endemic to the region (Hopcroft et al., 2005):C. glacialis, C. hyperboreus and M. longa. Overall, thetwo arctic groupings were characterized by colder(,0.88C) and fresher (,32 psu) water than the southerngroupings.
At the species level, eight of the most dominant and/or indicative copepod species were strongly correlatedwith latitude (Supplementary data, Table SII). The arcticcopepod species C. glacialis, C. hyperboreus, M. longa andMicrocalanus spp. were positively correlated with latitude,whereas the sub-Arctic Pacific-water associated speciesNeocalanus spp., Eucalanus sp. and M. pacifica were negative-ly correlated with latitude (Supplementary data,Table SII). Overall, C. glacialis, C. hyperboreus, M. longa andMicrocalanus spp. were found to be strongly negativelycorrelated with water temperature and salinity, whilePseudocalanus spp., Neocalanus spp., Eucalanus sp. andM. pacifica were positively correlated with both tempera-ture and salinity (Supplementary data, Table SII). Theabundance of O. similis was not significantly correlatedwith any of the environmental variables. The abundanceof copepod nauplii was strongly positively correlated withsalinity, nutrient concentration and chlorophyll a concen-tration. One of the dominant species in Eastern BeringStrait, A. hudsonica, was found to be negatively correlatedwith longitude, station depth and DCM depth, but posi-tively correlated with temperature.
The abundance of non-copepod taxa was less corre-lated with environmental parameters than the abun-dances of copepod species (Supplementary data,Table SIII). The pteropod L. helicina was positively
correlated with longitude and station depth. Abundancesof L. helicina were greater in the Gulf of Alaska and withinthe Beaufort Gyre and Beaufort Shelf groups than theother groupings. Cirripedes were negatively correlatedwith station depth and positively correlated with Chl-a.Cirripedes were highly abundant in the Bering Strait andBarrow Canyon but virtually absent in all other areas.Fritillaria sp. was positively correlated with salinity andChl-a, and present in larger numbers in Barrow Canyonand western Bering Strait. Six species of euphausiidswere identified along the Victoria-Arctic Archipelagotransect. Younger euphausiid developmental stages (pro-tozoea, zoea and juveniles) occurred in large numbers inthe Bering Strait. Euphausiids were negatively correlatedwith latitude and station depth but positively correlatedwith water temperature, salinity and Chl-a concentration.
Stable isotopes
The d15N and d13C values of zooplankton species col-lected in this study are presented in Tables V and VI,respectively. Values of d15N were the lowest in the Gulf ofAlaska for all species with an average value of 6.4+1.6‰. Limacina helicina had an average d15N value of3.5‰ in the Gulf of Alaska compared with 10.4‰ inSt-Lawrence Island. There were large intraspecific d15Ndifferences amounting to up to þ6–7‰ enrichmentbetween the Gulf of Alaska and Barrow Canyon forThemisto sp. and Thysanoessa spp. The highest d15N valueswere recorded in Eastern Bering Strait zooplankton(11.4+ 1.8‰) and Barrow Canyon (11.1+ 0.5‰)(Table V). The lowest average d13C values were mea-sured in the Beaufort Gyre (223.4+ 1.6‰) andBeaufort shelf (222.4+ 1.0‰) groupings. Note thatvalues in these groupings were similar to those from theGulf of Alaska (222.1+ 1.2‰) (Table VI). All otherregions were relatively enriched with d13C values�220.0‰.
The d15N and d13C values of five of the most ubiqui-tous species varied significantly between regions(ANOVA, all P , 0.01). Values for Calanus spp. (C. mar-
shallae/C. glacialis and/or C. hyperboreus) d15N were higherin the Beaufort Gyre relative to the Beaufort Shelf andwestern Bering Strait. No differences were found forThemisto spp. d15N values between SLIP, Beaufort Gyreand Beaufort Shelf (post hoc pairwise Tukey’s HSD tests,P . 0.05). Neocalanus spp. d13C values were significantlymore depleted in the Gulf of Alaska relative to the BeringSea slope and Bering Strait areas. Calanus spp. in thewestern Bering Strait were significantly more enriched ind13C compared with the other areas (eastern BeringStrait, SLIP and the two arctic groupings). The d13Cvalues of Calanus spp., L. helicina and Themisto spp. were
JOURNAL OF PLANKTON RESEARCH j VOLUME 36 j NUMBER 3 j PAGES 757–775 j 2014
768
at Fisheries and Oceans on M
ay 22, 2014http://plankt.oxfordjournals.org/
Dow
nloaded from
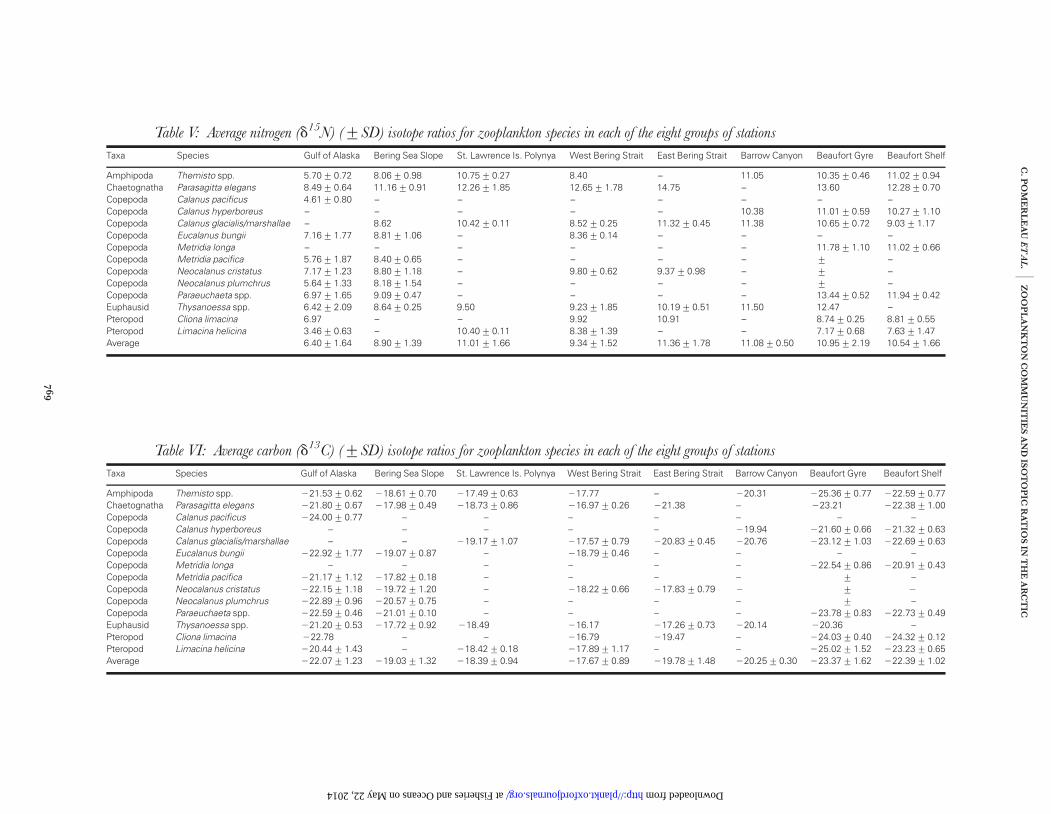
Table V: Average nitrogen (d15N) (+SD) isotope ratios for zooplankton species in each of the eight groups of stations
Taxa Species Gulf of Alaska Bering Sea Slope St. Lawrence Is. Polynya West Bering Strait East Bering Strait Barrow Canyon Beaufort Gyre Beaufort Shelf
Amphipoda Themisto spp. 5.70+0.72 8.06+0.98 10.75+0.27 8.40 – 11.05 10.35+0.46 11.02+0.94Chaetognatha Parasagitta elegans 8.49+0.64 11.16+0.91 12.26+1.85 12.65+1.78 14.75 – 13.60 12.28+0.70Copepoda Calanus pacificus 4.61+0.80 – – – – – – –Copepoda Calanus hyperboreus – – – – – 10.38 11.01+0.59 10.27+1.10Copepoda Calanus glacialis/marshallae – 8.62 10.42+0.11 8.52+0.25 11.32+0.45 11.38 10.65+0.72 9.03+1.17Copepoda Eucalanus bungii 7.16+1.77 8.81+1.06 – 8.36+0.14 – – – –Copepoda Metridia longa – – – – – – 11.78+1.10 11.02+0.66Copepoda Metridia pacifica 5.76+1.87 8.40+0.65 – – – – + –Copepoda Neocalanus cristatus 7.17+1.23 8.80+1.18 – 9.80+0.62 9.37+0.98 – + –Copepoda Neocalanus plumchrus 5.64+1.33 8.18+1.54 – – – – + –Copepoda Paraeuchaeta spp. 6.97+1.65 9.09+0.47 – – – – 13.44+0.52 11.94+0.42Euphausid Thysanoessa spp. 6.42+2.09 8.64+0.25 9.50 9.23+1.85 10.19+0.51 11.50 12.47 –Pteropod Cliona limacina 6.97 – – 9.92 10.91 – 8.74+0.25 8.81+0.55Pteropod Limacina helicina 3.46+0.63 – 10.40+0.11 8.38+1.39 – – 7.17+0.68 7.63+1.47Average 6.40+1.64 8.90+1.39 11.01+1.66 9.34+1.52 11.36+1.78 11.08+0.50 10.95+2.19 10.54+1.66
Table VI: Average carbon (d13C) (+SD) isotope ratios for zooplankton species in each of the eight groups of stations
Taxa Species Gulf of Alaska Bering Sea Slope St. Lawrence Is. Polynya West Bering Strait East Bering Strait Barrow Canyon Beaufort Gyre Beaufort Shelf
Amphipoda Themisto spp. 221.53+0.62 218.61+0.70 217.49+0.63 217.77 – 220.31 225.36+0.77 222.59+0.77Chaetognatha Parasagitta elegans 221.80+0.67 217.98+0.49 218.73+0.86 216.97+0.26 221.38 – 223.21 222.38+1.00Copepoda Calanus pacificus 224.00+0.77 – – – – – – –Copepoda Calanus hyperboreus – – – – – 219.94 221.60+0.66 221.32+0.63Copepoda Calanus glacialis/marshallae – – 219.17+1.07 217.57+0.79 220.83+0.45 220.76 223.12+1.03 222.69+0.63Copepoda Eucalanus bungii 222.92+1.77 219.07+0.87 – 218.79+0.46 – – – –Copepoda Metridia longa – – – – – – 222.54+0.86 220.91+0.43Copepoda Metridia pacifica 221.17+1.12 217.82+0.18 – – – – + –Copepoda Neocalanus cristatus 222.15+1.18 219.72+1.20 – 218.22+0.66 217.83+0.79 2 + 2
Copepoda Neocalanus plumchrus 222.89+0.96 220.57+0.75 – – – – + –Copepoda Paraeuchaeta spp. 222.59+0.46 221.01+0.10 – – – – 223.78+0.83 222.73+0.49Euphausid Thysanoessa spp. 221.20+0.53 217.72+0.92 218.49 216.17 217.26+0.73 220.14 220.36 –Pteropod Cliona limacina 222.78 – – 216.79 219.47 – 224.03+0.40 224.32+0.12Pteropod Limacina helicina 220.44+1.43 – 218.42+0.18 217.89+1.17 – – 225.02+1.52 223.23+0.65Average 222.07+1.23 219.03+1.32 218.39+0.94 217.67+0.89 219.78+1.48 220.25+0.30 223.37+1.62 222.39+1.02
C.
PO
ME
RL
EA
UE
TA
L.j
ZO
OP
LA
NK
TO
NC
OM
MU
NIT
IES
AN
DIS
OT
OP
ICR
AT
IOS
INT
HE
AR
CT
IC
769
at Fisheries and Oceans on May 22, 2014 http://plankt.oxfordjournals.org/ Downloaded from
significantly more depleted in the Beaufort Gyre com-pared with each of the other regions (post hoc pairwiseTukey’s HSD tests, all P , 0.05). In the case of Parasagitta
spp., the d13C values from the Beaufort Shelf weresimilar to those from the Gulf of Alaska.
D I S C U S S I O N
Our study represents the first large-scale analysis of zoo-plankton species composition and isotopic signatures(d13C and d15N) in relation to oceanographic conditionsin the NE sub-Arctic Pacific and western Arctic areas. Weidentified eight zooplankton assemblages, each corre-sponding to a geographical region. From south to norththese regions are: Gulf of Alaska, Bering Sea Slope,St Lawrence Island, Western Bering Strait (including 1station from the Chukchi Sea), Eastern Bering Strait (in-cluding 2 stations from the Chukchi Sea), BarrowCanyon, Beaufort Sea Gyre and Beaufort Sea Shelf.Although these regions are closely connected by oceancurrents, they are oceanographically distinct. In general,our results indicate that the overall community compos-ition is driven at two levels and revealed the occurrenceof a biogeographical break. The first is the separationbetween the Pacific community and the arctic commu-nity, at Barrow Canyon, and the second is the smallerscale regional variation in physical conditions (tempera-ture, salinity, water depth, nutrients) which determineszooplankton community structure.
Latitude was the main factor influencing variation ofzooplankton composition and spatial distribution. Wewere able to clearly identify water mass-specificity ofzooplankton community composition in the study areaextending north from 50 to 808N. The southern group-ings were characterized by subarctic Pacific species(Calanus pacificus, Metridia pacifica, Neocalanus spp. andEucalanus sp.) that were not found north of the BeringStrait. Northern assemblages were characterized by thepresence of arctic zooplankton species, such as Calanus
hyperboreus and Metridia longa. The most southerly occur-rence of C. hyperboreus and M. longa was northeast ofPoint Barrow, Alaska. Our results are similar to previousreports for waters of the Pacific sub-arctic or in theArctic (Auel and Hagen, 2002; Ashjian et al., 2003; Laneet al., 2008; Hopcroft et al., 2010; Matsuno et al., 2011,2012). The copepod species found in association withPacific waters mostly occur in the Bering Sea and in thesubarctic gyre south of the Aleutian Islands althoughNeocalanus spp. and E. bungii are seasonally found on theAlaskan continental shelf and occasionally in thewestern Arctic Ocean (Conover, 1988; Hopcroft et al.,2005; Matsuno et al., 2012). The northern range limit of
endemic subarctic Pacific zooplankton species is pres-ently limited by their intolerance to arctic conditionsrendering them unable to overwinter and reproduce athigher latitudes (Carmack and Wassmann, 2006;Nelson et al., 2009).
In this study, Barrow Canyon appeared to be a bound-ary between the occurrence of subarctic Pacific andarctic groups. Specifically, our results point to theabsence of Neocalanus spp., Eucalanus sp. and other Pacificspecies indicators such as C. pacificus and M. pacifica fromthe Barrow Canyon group. This choke point has beendescribed previously in terms of physical oceanographyand is caused by the particular topography of the areawhich concentrates and modifies Pacific waters throughshelf processes (Shroyer and Plueddemann, 2012). BarrowCanyon has also been designated as a ‘hot spot’ forprimary productivity, a marine mammal seasonal feedingground, and for high benthic biomass (Grebmeier et al.,
2006, Ashjian et al., 2010). The zooplankton taxonomiccomposition in Barrow Canyon is highly variable anddriven by short-term variability in the oceanography andassociated wind patterns (Ashjian et al., 2010). In our study,the species composition of Barrow Canyon grouping wasmostly characterized by large numbers of shelf copepodssuch as Pseudocalanus spp., along with copepod nauplii andcirripedes. Pseudocalanus spp. is expected to experiencemore favourable growth conditions as a result of reducedsea ice conditions which would in turn benefit fish larvaebody condition since the naupliar stages of Pseudocalanus
spp. and other copepod nauplii are major prey items offish larvae (Darnis et al., 2008).
Salinity, temperature and nitrate concentration weremajor factors linked to the observed latitudinal variationin species composition. The abundance of the dominantand/or indicative copepod species found in associationwith Pacific waters were all positively correlated with tem-perature and salinity. The only anomaly was for theSt-Lawrence Island waters in terms of low temperature,which is driven by presence of the cold pool bottomwater driven by ice formation (Schumacher et al., 1983).Salinity values were lower on the Eastern side of theBering Strait transect and on the western side of BarrowCanyon as a result of the Alaska coastal current (ACC)which carries low salinity, nutrient-poor water associatedwith riverine freshwater inputs (Woodgate and Aagaard,2005). On the eastern side of the Bering Strait, low-salinity tolerant small species were abundant such asCentropages abdominalis, Acartia hudsonica and A. longiremis,cirripedes, cladoceran species and Pseudocalanus spp.
These species are typical of the previously describedACC zooplankton community which thrives in thewarmer and fresher near shore waters on the east side ofBering Strait (Hopcroft et al., 2010). The Beaufort Gyre
JOURNAL OF PLANKTON RESEARCH j VOLUME 36 j NUMBER 3 j PAGES 757–775 j 2014
770
at Fisheries and Oceans on M
ay 22, 2014http://plankt.oxfordjournals.org/
Dow
nloaded from
was characterized by cold low salinity surface waters as aresult of freshwater accumulation from various sourcesincluding riverine inputs, sea ice melt and from theBering Strait inflow (Proshutinsky et al., 2002; Woodgateand Aagaard, 2005; Yamamoto-Kawaii et al., 2009).
The highest nitrate concentrations were found on theBering Sea slope and in the Gulf of Alaska, whereasthe Eastern Bering Strait and the Beaufort Gyre had thelowest values. New production fuelled by NO3 (Dugdaleand Goering, 1967) is primarily supplied by verticaltransport of nutrient rich water via upwelling or effectivemixing conditions (Broecker and Peng, 1982; Springeret al., 1996). It is the main form of inorganic nitrogenconsumed by microplankton (.20 mm); whereas nano-plankton (,20 mm) and picoplankton (,2 mm) assimi-late NO3 and ammonium (NH4
þ; regenerated production)
in similar proportions (Koike et al., 1986). The Gulf ofAlaska is a productive region and is under the influenceof the Alaska Stream Current (ASC) while the BeringSea outer-shelf is usually replenished by the on-shelftransport of nutrient-rich slope water (Shiomoto andOgura, 1994). The depleted d15N values in zooplanktonsamples from the Gulf of Alaska, Bering Sea slope andWestern Bering Strait probably originate from the highnitrate concentrations (e.g. upwelling from the deepBering Sea basin) (Woodgate and Aagaard, 2005) as frac-tionation tends to be higher when phytoplankton growthoccurs in nutrient-rich waters. Values of d15N were moreenriched in areas associated with low nitrate concentra-tions such as the Eastern Bering Strait and in the arcticgroupings.
Along with station depth, the depth of the DCM wasalso strongly correlated with zooplankton communitycomposition. The DCM is a prominent seasonal featurein subarctic and arctic regions and is typical of stratifiedconditions (Cullen, 1982; Holm-Hansen and Hewes,2004). As expected, both station depth and DCM depthwere significantly positively correlated since the configur-ation of the deep DCM is related to the various physicalproperties of the water column. Martin et al. (Martinet al., 2010) found that in the Canadian Arctic, the verti-cal position of the DCM was driven mainly by a shortageof inorganic nitrogen in the upper euphotic layer andthat 63–88% of the phytoplankton at the DCM of theBeaufort Sea was composed of dinoflagellates and flagel-lates. The deeper DCM and low nutrient concentrationsof the Beaufort Gyre and Beaufort Shelf resulted inenriched d15N values of zooplankton probably by effect-ive regeneration through grazing and excretion ofnitrogenous nutrients and rapid uptake dynamics (Schellet al., 1998).
Depth-dependant abiotic and biotic properties havebeen demonstrated to structure the zooplankton community
in the central Arctic Basin (Auel and Hagen, 2002).Here, station depth was found to have a strong influenceon the zooplankton community structure. Similarly,Darnis et al. (Darnis et al., 2008) found station depth tobe the strongest variable responsible for the drivingvariation of the zooplankton community composition inthe south-eastern Beaufort Sea. The shallower waters ofthe Beaufort Sea shelf encompassed two main watermasses, the Polar mixed layer (0–50 m) and the upperpart of the Pacific Halocline (50–200 m), and was char-acterized by the presence of neritic species such asPseudocalanus spp., M. longa and as well as high abundanceof copepod nauplii. The Beaufort Gyre group was typic-ally deep (.1500 m) and dominated by C. hyperboreus,C. glacialis, L. helicina and M. pygmaeus. Species such asC. hyperboreus are strong seasonal vertical migrants thatascend to the surface layer to actively feed for a shortperiod of time in summer months and descend to�500 m for the rest of the year (Ashjian et al., 2003). Agreater occurrence of small shelf species such as Acartia
ssp., cirripedes, cladoceran species, Centropages sp. andPseudocalanus spp. was observed in the shallow EasternBering Strait compared with the Western part of theStrait which had a greater number of larger size cope-pods and euphausiids.
The carbon and nitrogen SI ratios in the BeaufortGyre and the Beaufort Shelf were similar. Note, however,that greater d13C depletion in zooplankton from theBeaufort Gyre probably reflects a greater influence of ad-vective transport of terrestrial origin carbon in thesurface waters of the Canada Basin. Overall, d13C signa-tures of zooplankton from the Beaufort Gyre and theBeaufort Shelf were depleted relative to other groupingsas a result of the large terrestrial/riverine inputs of dis-solved organic carbon by the McKenzie River and fresh-water runoff from several arctic rivers (Gordeev et al.,
1996; Lobbes et al., 2000). The d13C values of zooplank-ton samples from Barrow Canyon were more depletedthan in the Bering Strait but more enriched relative tothe western Arctic groupings. Schell et al. (Schell et al.,1998) found that d13C depletion of zooplankton progres-sively increased between the northern Bering Sea andeastern Canadian Beaufort Sea. Our results supportthose of Schell et al. (Schell et al., 1998) and highlight thepresence of a longitudinal gradient in d13C in zooplank-ton with values becoming progressively more depletedmoving eastward. Typically, particulate organic matter ismore d13C enriched in productive areas such as coastalupwelling zones (Perry et al., 1999). The enriched zoo-plankton d13C values from the Western Bering Straitmay have originated from rapid phytoplankton growthfuelled by the inflow of nutrient rich Anadyr waters intothis shallow shelf area.
C. POMERLEAU ET AL. j ZOOPLANKTON COMMUNITIES AND ISOTOPIC RATIOS IN THE ARCTIC
771
at Fisheries and Oceans on M
ay 22, 2014http://plankt.oxfordjournals.org/
Dow
nloaded from
The results of this study suggest that certain speciesmay occupy different trophic positions between regionswhich suggest that the size, the community structure (e.g.picoplankton vs. nanoplankton) and/or the d15N of pro-ducers (e.g. phytoplankton and POM) varied throughoutthe study area. The trophic structure of secondary produ-cers is highly dependent upon primary producers, thusgoverned by the dynamics, and timing and succession ofspring/summer blooms. Fish production as well as thesuccess of higher trophic level species depend upon theefficient transfer of carbon via primary producers to zoo-plankton (Hunt and Stabeno, 2002). Li et al. (Li et al.,2009) demonstrated that a warmer and fresher Arcticmay induce conditions that will favour the growth ofsmaller cell sized (picoplankton) organisms. Becausemesozooplankton are inefficient grazers on small parti-cles, bacterial carbon must transit via the microbial foodweb, a process that leads to loss of energy at each level(Pomeroy and Wiebe, 1988). Recent studies suggest thatwarmer ocean temperature in late summer may shift thezooplankton community in the Bering Sea from large tosmall taxa with increasing dominance of Pseudocalanus
spp. (Coyle et al., 2011). Coyle et al. (Coyle et al., 2008)observed a marked decline in the biomass of large zoo-plankton (Calanus spp., euphausids) but an increase ofsmall copepods (Acartia spp., O. similis, Pseudocalanus spp.,copepod nauplii) during the warm year of 2004.Warming in the Bering Sea is expected to result in poorfeeding conditions for young-of-year walleye Pollock(Theragra chalcogramma) and a decline in recruitment (Huntet al., 2011; Mueter et al., 2011). In order to better predicthow higher trophic level species may be impacted bychanges in the trophic structure at the lower level of thefood chain, we need to either measure the isotopic vari-ability in primary producers or take advantage ofcompound-specific isotopic measurements (e.g. Hannideset al., 2009; Decima et al., 2013) in order to confidentlyrelate differences in zooplankton isotopic signatures toactual differences in trophic structure and food-web effi-ciency (Sommer et al., 2002).
CO N C LU S I O N
Climate change is causing multiple physical and bioticchanges in the marine environment (Walsh, 2008;Bintanja and Van der Linden, 2013). Seasonality in thesub-Arctic and Arctic regions has become more pro-nounced through earlier onset of melting sea ice and laterfreeze up (Markus et al., 2009; Screen and Simmonds,2010). These changes will have major impacts on zoo-plankton as their life cycles are coupled with sea ice regimeand primary production (Smith and Schnack-Schiel,
1990). The combined use of zooplankton species com-position and the analysis of their SI ratios in combinationwith various oceanographic parameters offer an oppor-tunity to assess how continuing warming at high latitudesmay impact zooplankton community structure with theattendant potential for cascading effects throughout thefood-web.
The biogeographic domains associated with largerfreshwater inputs and/or lower nitrate concentrations(East Bering Strait, Barrow Canyon, Beaufort Gyre andBeaufort Shelf ) resulted in zooplankton communitiesdominated by smaller-sized species with enriched d15Nsignatures (.10‰). This enrichment in the Arctic group-ings is presumably a consequence of complete nutrientutilization and greater regenerated production (not mea-sured in this study) due to an increase in stratification.Limiting nutrient supply to the euphotic zone tends tofavour the production of smaller sized cells (e.g. pico-plankton) that generally do not support large export ofcarbon either for top-down or bottom-up processes(Li et al., 2009; Moran et al., 2009). The more saline andnutrient rich waters in our study (Gulf of Alaska, BeringSea slope and Western Bering Strait) supported morelarge-bodied zooplankton species with less enrichedd15N (,10‰) values, suggesting that these areas aremore productive and effective in transferring energythrough various food webs. Here, we present the firstbroad scale picture of zooplankton community compos-ition and their isotope ratios in the context of the under-lying oceanographic conditions. This large-scalesnapshot of isotope signatures in zooplankton from var-ious regions can be used as tracers in other studies, suchas feeding zones of migratory species. We stress the needto continue the monitoring of these parameters at suchbroad scales in order to move beyond the scope of region-al processes and begin to address and detect pan-Arcticchanges in community structure and function.
S U P P L E M E N TA RY DATA
Supplementary data can be found online at http://plankt.oxfordjournals.org.
AC K N OW L E D G E M E N T S
We thank the officers and crew of the CCGS SirWilfrid-Laurier and CCGS Louis S. St-Laurent for all oftheir support during the cruises. We also thank KellyHyland for assistance with net sampling and zooplanktonidentification as well as Moira Galbraith for her helpwith taxonomy.
JOURNAL OF PLANKTON RESEARCH j VOLUME 36 j NUMBER 3 j PAGES 757–775 j 2014
772
at Fisheries and Oceans on M
ay 22, 2014http://plankt.oxfordjournals.org/
Dow
nloaded from
F U N D I N G
This research was carried out under the auspices of theInternational Polar Year project Canada’s Three Oceans(C3O) funded by the Canadian Government and underthe Joint Ocean Ice Study (JOIS) program as well asNational Science and Engineering Research Council(NSERC) of Canada grant 249994 to R.J.N. C.P. wassupported by an NSERC Visiting Fellowships inCanadian Government Laboratories Program. B.H. wassupported by a Marie Curie Research Fellowship duringpreparation of this manuscript.
R E F E R E N C E S
Ashjian, C. J., Braund, S. R., Campbell, R. G. et al. (2010) Climate vari-ability, oceanography, bowhead whale distribution, and Inupiat sub-sistence whaling near Barrow, Alaska. Arctic, 63, 179–194.
Ashjian, C. J., Campbell, R. G., Welch, H. E. et al. (2003) Annual cyclein abundance, distribution, and size in relation to hydrography of im-portant copepod species in the western Arctic Ocean. Deep-Sea Res. I,50, 1235–1261.
Auel, H. and Hagen, W. (2002) Mesozooplankton community structure,abundance and biomass in the central Arctic Ocean. Mar. Biol., 140,1013–1021.
Barber, D. G., Asplin, M. G., Raddatz, R. L. et al. (2012) Change andvariability in sea ice during the 2007–2008 Canadian InternationalPolar Year program. Clim. Change, 115, 115–133.
Beaugrand, G., Reid, P. C., Ibanez, F. et al. (2002) Reorganization ofNorth Atlantic marine copepod biodiversity and climate. Science, 296,1692–1694.
Bintanja, R. and Van der Linden, E. C. (2013) The changing seasonalclimate in the Arctic. Nat. Sci. Rep., 1556, doi:10.1038/srep01556.
Bray, J. R. and Curtis, J. T. (1957) An ordination of the upland forestcommunities of southern Wisconsin. Ecol. Monogr., 27, 325–349.
Broecker, W. S. and Peng, T. H. (1982) Tracers in the sea. Eldigio PressLamont Doherty Geological Observatory, 690 pp.
Carmack, E. and Wassmann, P. (2006) Food webs and physical-biological coupling on pan-Arctic shelves: unifying concepts andcomprehensive perspectives. Prog. Oceanogr., 71, 446–477.
Clarke, K. R. and Gorley, R. N. (2006) PRIMER v6: User Manual/
Tutorial. PRIMER-E. Plymouth, UK, 190 pp.
Conover, R. J. (1988) Comparative life histories in the genera Calanusand Neocalanus in high latitudes of the northern hemisphere.Hydrobiology, 167–168, 127–142.
Coyle, K. O., Eisner, L. B., Mueter, F. J. et al. (2011) Climate change inthe southeastern Bering Sea: impacts on pollock stocks and implica-tions for the oscillating control hypothesis. Fish. Oceanogr., 20, 139–156.
Coyle, K. O., Pinchuk, A. I., Eisner, L. B. et al. (2008) Zooplanktonspecies composition, abundance and biomass on the eastern BeringSea shelf during summer: the potential role of water column stabilityand nutrients in structuring the zooplankton community. Deep-Sea
Res. II, 55, 1755–1791.
Cullen, J. J. (1982) The deep chlorophyll maximum: Comparing verticalprofiles of chlorophyll a. Can. J. Fish. Aquat. Sci., 39, 791–803.
Darnis, G., Barber, D. G. and Fortier, L. (2008) Sea ice and theonshore–offshore gradient in pre-winter zooplankton assemblages insoutheastern Beaufort Sea. J. Mar. Syst., 74, 994–1011.
Darnis, G., Robert, D., Pomerleau, C. et al. (2012) Current state andtrends in Canadian Arctic marine ecosystems: II. Heterotrophic foodweb, pelagic-benthic coupling, and biodiversity. Clim. Change, 115,179–205.
Decima, M., Landry, M. R. and Popp, B. N. (2013) Environmental per-turbation effects on baseline d15N values and zooplankton trophicflexibility in the southern California Current Ecosystem. Limnol.
Oceanogr., 58, 624–634.
Dugdale, R. C. and Goering, J. J. (1967) Uptake of new and regeneratedforms of nitrogen in primary productivity. Limnol. Oceanogr., 12,196–206.
Dunton, K. H., Saupe, S. M., Golikov, A. N. et al. (1985) Trophic rela-tionships and isotopic gradients among arctic and subarctic marinefauna. Mar. Ecol. Prog. Ser., 56, 89–97.
Field, J. G., Clarke, K. R. and Warwick, R. M. (1982) A practical strat-egy for analysing multispecies distribution patterns. Mar. Ecol. Prog.
Ser., 8, 37–52.
Froneman, P. W. and Pakhomov, E. A. (1998) Biogeographic study ofthe plankton communities of the Prince Edward Islands (SouthernOcean). J. Plankton Res., 20, 653–669.
Gordeev, V. V., Martin, J.-M., Sidorov, I. S. et al. (1996) A reassessmentof the Eurasian river input of water, sediment, major elements andnutrients to the Arctic Ocean. Am. J. Sci., 296, 664–691.
Grebmeier, J. M. (2012) Shifting patterns of life in the Pacific Arctic andSub-Arctic Seas. Ann. Rev. Mar. Sci., 4, 63–78.
Grebmeier, J. M., Overland, J. E., Moore, S. E. et al. (2006) A majorecosystem shift in the northern Bering Sea. Science, 311,1461–1464.
Hannides, C. C. S., Landry, M. R., Benitez-Nelson, C. R. et al. (2009)Export stoichiometry and migrant-mediated flux of phosphorus inthe North Pacific Subtropical Gyre. Deep-Sea Res. I, 56, 73–88.
Hobson, K. A. (1999) Tracing origins and migration of wildlife usingstable isotopes: a review. Oecologia, 120, 314–326.
Hobson, K. A., Piatt, J. F. and Pitocchelli, J. (1994) Using stable isotopesto determine seabird trophic relationships. J. Anim. Ecol., 63,786–798.
Holm-Hansen, O. and Hewes, C. D. (2004) Deep chlorophyll-amaxima (DCMs) in Antarctic waters. I. Relationships betweenDCMs and the physical, chemical, and optical conditions in theupper water column. Polar Biol., 27, 699–710.
Hopcroft, R. R., Clarke, C., Nelson, R. J. et al. (2005) Zooplanktoncommunities of the Arctic’s Canada Basin: the contribution bysmaller taxa. Polar Biol., 28, 198–206.
Hopcroft, R. R. and Kosobokova, K. N. (2010) Distribution and eggproduction of Pseudocalanus species in the Chukchi Sea. Deep-Sea Res.
1, 57, 49–46.
Hopcroft, R. R., Kosobokova, K. N. and Pinchuk, A. I. (2010)Zooplankton community patterns in the Chukchi Sea duringsummer 2004. Deep-Sea Res. II, 57, 27–39.
Hughes, L. (2000) Biological consequences of global warming: is thesignal already? Trends Ecol., 15, 56–61.
Hunt, G. L. Jr, Coyle, K. O., Eisner, L. B. et al. (2011) Climate impactson eastern Bering Sea foodwebs: a synthesis of new data and an as-sessment of the Oscillating Control Hypothesis. ICES J. Mar. Sci., 68,1230–1243.
C. POMERLEAU ET AL. j ZOOPLANKTON COMMUNITIES AND ISOTOPIC RATIOS IN THE ARCTIC
773
at Fisheries and Oceans on M
ay 22, 2014http://plankt.oxfordjournals.org/
Dow
nloaded from
Hunt, G. L. Jr and Stabeno, P. J. (2002) Climate change and the controlof energy flow in the southeastern Bering Sea. Prog. Oceanogr., 55, 5–22.
Keister, J. E., Di Lorenzo, E., Morgan, C. A. et al. (2011) Zooplanktonspecies composition is linked to ocean transport in the NorthernCalifornia Current. Global Change Biol., 17, 242511.
Koike, I., Holm-Hansen, O. and Biggs, D. C. (1986) Inorganic nitrogenmetabolism by Antarctic phytoplankton with special reference toammonium cycling. Mar. Ecol. Prog. Ser., 30, 105–116.
Kruskal, J. B. and Wish, M. (1978) Multidimensional Scaling, Sage University
Paper Series on Quantitative Applications in the Social Sciences. SagePublications, Beverly Hills and London, pp. 7–11.
Kulikov, A. S. (1992) Characteristics of zooplankton communities. In:Nagel, P. A. (ed.) Results of the Third Joint US-USSR Bering and Chukchi
Seas Expedition (BERPAC), Summer 1988 US Fish and Wildlife Service.Washington, pp 161–176.
Lane, P. V. Z., Llinas, L., Smith, S. L. et al. (2008) Zooplankton distribu-tion in the western Arctic during summer 2002: hydrographichabitats and implications for food chain dynamics. J. Mar. Syst., 70,97–133.
Li, W. K. W., McLaughlin, F. A., Lovejoy, C. et al. (2009) Smallest algaethrive as the Arctic Ocean freshens. Science, 326, 539.
Lobbes, J. M., Fitznar, H. P. and Kattner, G. (2000) Biogeochemical char-acteristics of dissolved and particulate organic matter in Russian riversentering the Arctic Ocean. Geochim. Cosmochim. Acta, 64, 2973–2983.
Mackas, D. L. (1984) Spatial autocorrelation of plankton communitycomposition in a continental shelf ecosystem. Limnol. Oceanogr., 29,451–471.
Mackas, D. L., Batten, S. and Trudel, M. (2007) Effects on zooplanktonof a warmer ocean: recent evidence from the Northeast Pacific. Prog.
Oceanogr., 75, 223–252.
Mackas, D. L. and Coyle, K. O. (2005) Shelf offshore exchange pro-cesses and their effects on zooplankton biomass and community com-position patterns in the northeast Pacific. Deep- Sea Res. I, 52,707–725.
Markus, T., Stroeve, J. C. and Miller, J. (2009) Recent changes in Arcticsea ice melt onset, freeze up, and melt season length. J. Geophys. Res.,114, doi:10.1029/2009JC005436.
Martin, J., Tremblay, J. E., Gagnon, J. et al. (2010) Prevalence, structureand properties of subsurface chlorophyll maxima in Canadian Arcticwaters. Mar. Ecol. Prog. Ser., 412, 69–84.
Matsuno, K., Yamaguchi, A., Hirawake, T. et al. (2011) Year-to-yearchanges of the zooplankton community in the Chukchi Sea duringsummers of 1991, 1992 and 2007, 2008. Polar Biol., 34, 1349–1360.
Matsuno, K., Yamaguchi, A., Shimada, K. et al. (2012) Horizontal dis-tribution of calanoid copepods in the western Arctic Ocean duringthe summer of 2008. Polar Sci., 6, 105–119.
McLaughlin, F., Carmack, E., O’Brien, M. et al. (2009) Physical andchemical data from the Beaufort Sea and Canada Basin, August 16to September 5, 2002. Can. Data Rept. Hydrogr. Ocean Sci., 181, 223.
Mueter, F. J., Bond, N. A., Lanelli, J. N. et al. (2011) Expected declines inrecruitment of walleye Pollock (Theragra chalcogramma) in the easternBering Sea under future climate change. J. Mar. Sci., 68, 1284–1296.
Moran, X. A. G. F., Lopez-Urrutia, A., Calvo-Diax, A. et al. (2009)Increasing importance of small phytoplankton in a warmer ocean.Glob. Change Biol., 16, 1137–1144.
Nelson, R. J., Carmack, E. C., McLaughlin, F. A. et al. (2009)Penetration of Pacific zooplankton into the western Arctic Ocean
tracked with molecular population genetics. Mar. Ecol. Prog. Ser., 381,129–138.
Parsons, T. R., Maita, Y. and Lalli, C. M. (1984) A Manual of Chemical and
Biological Methods for Seawater Analysis. Pergamon Press, Oxford, 173 pp.
Perry, R. I., Thompson, P. A., Mackas, D. L. et al. (1999) Stable carbonisotopes as pelagic food web tracers in adjacent shelf and sloperegions off British Columbia, Canada. Can. J. Fish Aquat. Sci., 56,2477–2486.
Pickart, R. S., Pratt, L. J., Torres, D. J. et al. (2010) Evolution and dy-namics of the flow through Herald Canyon in the western ChukchiSea. Deep-Sea Res. II, 57, 5–26.
Pomerleau, C. (2008) Mercury and carbon in marine pelagic zooplank-ton: linkage with oceanographic processes in the Canadian HighArctic. M.Sc. thesis. University of Manitoba.
Pomeroy, L. R. and Wiebe, W. J. (1988) Energetics of microbial foodwebs. Hydrobiologica, 159, 7–18.
Post, D. M. (2002) Using stable isotopes to estimate trophic position:models, methods and assumptions. Ecology, 83, 703–718.
Proshutinsky, A., Bourke, R. H. and McLaughlin, F. A. (2002) The roleof the Beaufort Gyre in Arctic climate variability: seasonal to decadalclimate scales. Geo. Res. Lett., 29, 2100.
Rau, G. H., Chavez, F. P. and Friederich, G. E. (2001) Plankton C13/C12 variations in Monterey Bay, California: evidence of non-diffusiveinorganic carbon uptake by phytoplankton in an upwelling environ-ment. Deep Sea Res. I, 48, 79–94.
Reynolds, C. S. (1993) Scales of disturbance and their role in planktonecology. Hydrobiologica, 249, 157–171.
Sastri, A. R., Nelson, R. J., Varela, D. E. et al. (2012) Variationof chitobiase-based estimates of crustacean zooplanktonproduction rates in high latitude waters. J. Exp. Mar. Biol. Ecol., 414–415, 54–61.
Saupe, S. M., Schell, D. M. and Griffiths, W. B. (1989) Carbon-isotopegradients in western arctic zooplankton. Mar. Biol., 103, 427–432.
Schell, D. M., Barnett, B. A. and Vinette, K. A. (1998) Carbon and ni-trogen isotope ratios in zooplankton of the Bering, Chukchi andBeaufort Seas. Mar. Ecol. Prog. Ser., 162, 11–23.
Schumacher, J. D., Aagaard, K., Pease, H. and Tripp, R. B. (1983)Effects of a shelf polynya on flow and water properties in the north-ern Bering Sea. J. Geophys. Res., 88, 2723–2732.
Screen, J. A. and Simmonds, I. (2010) The central role of diminishingsea ice in recent Arctic temperature amplification. Nature, 464,1334–1337.
Shiomoto, A. and Ogura, M. (1994) Distribution of particulate matterwith special reference to biogenic silica of surface waters in theBering Sea gyre in summer 1991. Polar Biol., 7, 10–16.
Shroyer, E. L. and Plueddemann, A. J. (2012) Wind-driven modificationof the Alaskan coastal current. J. Geophys. Res., 117, C03031.
Smith, S. L. and Schnack-Schiel, S. B. (1990) Polar zooplankton. Smith,W. O. Jr. (ed.), Polar Oceanogr. Part B: Chemistry, Biology, and Geology.Academic Press, New York, pp. 527–598.
Sommer, U., Stibor, H., Katechakis, A. et al. (2002) Pelagic food webconfigurations at different levels of nutrient richness and their impli-cations for the ratio fish production: primary production.Hydrobiologica, 484, 11–20.
Springer, A. M. and McRoy, C. P. (1993) The paradox of pelagic foodwebs in the northern Bering Sea. III. Patterns of primary production.Cont. Shelf Res., 13, 575–599.
JOURNAL OF PLANKTON RESEARCH j VOLUME 36 j NUMBER 3 j PAGES 757–775 j 2014
774
at Fisheries and Oceans on M
ay 22, 2014http://plankt.oxfordjournals.org/
Dow
nloaded from
Springer, A. M., McRoy, C. P. and Flint, M. V. (1996) The Bering SeaGreen Belt: shelf-edge processes and ecosystem production. Fish
Oceanogr., 5, 205–223.
Springer, A. M., McRoy, C. P. and Turko, K. R. (1989) The paradox ofpelagic food webs in the northern Bering Sea. II. Zooplankton com-munities. Cont. Shelf Res., 9, 359–386.
Stabeno, P. J. and Reed, R. K. (1994) Circulation in the Bering Sea Basinobserved by satellite-tracked drifters: 1986–1993. J. Phys. Oceanogr., 24,848–854.
Stroeve, J., Serreze, M. C., Holland, M. M. et al. (2012) The Arctic’srapidly shrinking sea ice cover: a research synthesis. Clim. Change.,110, 1005–1027.
Walsh, J. E. (2008) Climate of the Arctic marine environment. Ecol.
Appl., 18, 3–22.
Wassmann, P., Duarte, C. M., Agusti, S. et al. (2011) Footprints of climatechange in the Arctic marine ecosystem. Glob. Change Biol., 17, 1235–1249.
Wassmann, P., Slagstad, D., Riser, C. W. et al. (2006) Modelling the eco-system dynamics of the Barents Sea including the marginal ice zoneII. Carbon flux and interannual variability. J. Mar. Syst., 59, 1–24.
Woodgate, R. A. and Aagaard, K. (2005) Revising the Bering Straitfreshwater flux into the Arctic Ocean. Geo. Res. Lett., 32, L02602.
Yamamoto-Kawai, M., McLaughlin, F. A., Carmack, E. C. et al. (2009)Aragonite undersaturation in the Arctic Ocean: effect of ocean acid-ification and sea ice melt. Science, 326, 1098–1100.
Yoshiki, T. M., Chiba, S., Sugisaki, H. et al. (2013) Interannual andregional variations in abundance patterns and developmental timing inzooplankton of the western North Pacific Ocean based on ContinuousPlankton Recorder during 2001–2009. J. Plankton Res., 35, 993–1008.
C. POMERLEAU ET AL. j ZOOPLANKTON COMMUNITIES AND ISOTOPIC RATIOS IN THE ARCTIC
775
at Fisheries and Oceans on M
ay 22, 2014http://plankt.oxfordjournals.org/
Dow
nloaded from