Laboratory study of cannibalism and interspecific predation in ladybirds
Upload
independentCategory
view
0download
0

Spatial ecology of refuge selection by an herbivoreunder risk of predation
TAMMY L. WILSON,1,3,� ANDREW P. RAYBURN,1,4 AND THOMAS C. EDWARDS, JR.1,2
1Department of Wildland Resources and Ecology Center, Utah State University, 5230 Old Main Hill, Logan, Utah 84322 USA2U.S. Geological Survey, Utah Cooperative Fish and Wildlife Research Unit, 5290 Old Main Hill, Logan, Utah 84322 USA
Citation: Wilson, T. L., A. P. Rayburn, and T. C. Edwards, Jr. 2011. Spatial ecology of refuge selection by an herbivore
under risk of predation. Ecosphere 3(1):6. http://dx.doi.org/10.1890/ES11-00247.1
Abstract. Prey species use structures such as burrows to minimize predation risk. The spatial
arrangement of these resources can have important implications for individual and population fitness. For
example, there is evidence that clustered resources can benefit individuals by reducing predation risk and
increasing foraging opportunity concurrently, which leads to higher population density. However, the scale
of clustering that is important in these processes has been ignored during theoretical and empirical
development of resource models. Ecological understanding of refuge exploitation by prey can be improved
by spatial analysis of refuge use and availability that incorporates the effect of scale. We measured the
spatial distribution of pygmy rabbit (Brachylagus idahoensis) refugia (burrows) through censuses in four 6-
ha sites. Point pattern analyses were used to evaluate burrow selection by comparing the spatial
distribution of used and available burrows. The presence of food resources and additional overstory cover
resources was further examined using logistic regression. Burrows were spatially clustered at scales up to
approximately 25 m, and then regularly spaced at distances beyond ;40 m. Pygmy rabbit exploitation of
burrows did not match availability. Burrows used by pygmy rabbits were likely to be located in areas with
high overall burrow density (resource clusters) and high overstory cover, which together minimized
predation risk. However, in some cases we observed an interaction between either overstory cover (safety)
or understory cover (forage) and burrow density. The interactions show that pygmy rabbits will use
burrows in areas with low relative burrow density (high relative predation risk) if understory food
resources are high. This points to a potential trade-off whereby rabbits must sacrifice some safety afforded
by additional nearby burrows to obtain ample forage resources. Observed patterns of clustered burrows
and non-random burrow use improve understanding of the importance of spatial distribution of refugia
for burrowing herbivores. The analyses used allowed for the estimation of the spatial scale where subtle
trade-offs between predation avoidance and foraging opportunity are likely to occur in a natural system.
Key words: burrow; Brachylagus idahoensis; foraging theory; K-function; point pattern analysis; prey; resource selection;
semi-fossorial mammal; Utah, USA.
Received 19 August 2011; revised and accepted 3 October 2011; final version received 19 December 2011; published 24
January 2012. Corresponding Editor: J. Drake.
Copyright: � 2012 Wilson et al. This is an open-access article distributed under the terms of the Creative Commons
Attribution License, which permits restricted use, distribution, and reproduction in any medium, provided the original
author and sources are credited.3 Present address: Southwest Alaska Inventory & Monitoring Network, National Park Service, 240 West 5th Avenue,
Anchorage, Alaska 99501 USA.4 Present address: Department of Plant Sciences, University of California, Davis, One Shields Avenue, Davis, California
95616 USA.
� E-mail: [email protected]
v www.esajournals.org 1 January 2012 v Volume 3(1) v Article 6

INTRODUCTION
The perceived risk of predation can lead tobehavioral changes of prey in the presence ofpredators (Laundre et al. 2001). In these cases,predators can cause suboptimal use of forage(sensu Charnov 1976, Ford 1983) by inducingbehaviors that reduce the risk of predation by theprey (Brown et al. 1999, Cresswell et al. 2010).Perceived predation risk also influences habitatselection patterns of prey (Abramsky et al. 1996,Creel et al. 2005, Cresswell et al. 2010). Forexample, some herbivores relying on vigilancebehavior to avoid predators will select sites withreduced vegetation height, allowing them visu-ally to detect predators more easily (Karels andBoonstra 1999, Iason et al. 2002, Cresswell et al.2010). Alternatively, some herbivores preferforage patches with dense overstory vegetationthat reduces their detection by predators (Jacoband Brown 2000). Herbivores may rely on acombination of these techniques, adjusting be-havior as needed for different conditions withintheir use areas (Creel et al. 2005). Regardless ofwhether or not an animal uses vigilance orconcealment for predator avoidance, many mayalso use structures, such as trees or burrows, toaid in their escape from predation. Thesestructures represent resources that affect thedistribution of herbivores as they balance theperceived risk of predation against foragingneeds.
The spatial distribution of refuge resources canaffect population abundance at a variety ofconceptual scales (Doncaster 2001). And al-though a positive association between refugeclustering and animal density was observed forintertidal snails (Skov et al. 2011), it is stillunclear how the spatial scale of resourcesspecifically affects animal distribution and abun-dance. Multiscale evaluation of refuge resourcescan improve understanding about how refugesmay be clustered, and how animals may useresource clusters to improve fitness. Multiscaleanalysis of point patterns is important becausespatial patterns can change with the scale ofobservation, and therefore observations made atone scale can lead to opposite interpretation thanthose made at another (O’Neill 1979, Bissonette1997).
We examined the spatial distribution of refuge
resources and selection patterns of pygmyrabbits. Pygmy rabbits are vulnerable to preda-tion by a suite of predators, including: long-tailedweasel (Mustela freneta), badger (Taxidea taxus),coyote (Canis latrans), and several species of birdsof prey (Crawford et al. 2010). Pygmy rabbits arecapable of digging their own burrows (Greenand Flinders 1980a), and burrows are an impor-tant component of pygmy rabbit habitat (Greenand Flinders 1980b). Additionally, pygmy rabbitsare known to use more than one burrow orburrow system (Sanchez and Rachlow 2008).Further, correlation between above-ground veg-etation resource depletion and time of burrowoccupancy has been shown for pygmy rabbitburrow systems in Idaho, and this is hypothe-sized to result in burrow switching behavior(Price 2009). Except for the case of smaller andmore isolated natal burrows (Rachlow et al.2005), pygmy rabbits are not known to useresidential burrows for food storage or nesting(Bradfield 1975). Therefore, burrows are likely tobe primarily used for refuge from predators forthis prey species.
Burrows may provide adequate refuge fromavian predators and coyote, but may be ineffec-tive protection from long-tailed weasel andbadger, which are known to pursue prey inburrows. In these cases, additional cover provid-ed by vegetation may be necessary for pygmyrabbits to avoid predation. Many researchershave studied use of burrows based on vegetationand site characteristics (e.g., Gabler et al. 2001,Simons and Laundre 2004, Larrucea 2007). Thesestudies found a positive correlation betweenshrub cover and burrow use, but did notadequately account for factors that determinedproportion of burrows used by rabbits, nor didthey provide a mechanistic understanding ofburrow use. We recently constructed spatialpredictive models for pygmy rabbit burrows bymodeling burrow abundance and rabbit use asseparate processes (Wilson et al. 2010), but thepotential mechanisms driving burrow selectionremain elusive.
The overall objective of this study was toimprove understanding of how prey select arefuge by examining the spatial distribution ofavailable, self-created refuges. We used fourspatially explicit burrow censuses to determinehow burrows were distributed within sites scaled
v www.esajournals.org 2 January 2012 v Volume 3(1) v Article 6
WILSON ET AL.

to pygmy rabbits. We determined if burrowswere used in proportion to their availability, andthen examined how vegetation cover affectedburrow use by pygmy rabbits. We hypothesizedthat burrows would be spatially clustered, andthat selection of refugia would be based on theavailability of vegetation-based resources such asoverhead cover and forage. Given these hypoth-eses, we expected that (1) burrow distributionwould be significantly clustered, (2) that rabbitswould not use burrows in proportion with theiravailability, (3) that rabbits would select burrowslocated near other burrows (high burrow densi-ty), and (4) that rabbits would use additionalcover resources when selecting burrows.
METHODS
Study areaThe study was conducted on the Duck Creek
allotment in Rich County, located in northernUtah, USA. The site was dominated by sagebrush(Artemisia tridentata ssp.) shrubsteppe vegetation,and known to be occupied by pygmy rabbits.Sagebrush cover in the study area was relativelycontinuous, with local variation caused bytreatments meant to reduce sagebrush cover,and by broad scale topographic effects. The siteharbored Uinta ground squirrels (Spermophilusarmatus) and American badger, which are alsoprimary burrowers. In addition, pocket gophers(Thomomys talpoides) created extensive burrowsystems in the study area, but their burrows werenot often open to the surface and were generallytoo small for pygmy rabbits. Commonly ob-served predators included golden eagle (Aquilachrysaetos), Northern Harrier (Circus cyaneus),coyote, long-tailed weasel, and badger. Predatordensities were not measured, but were notexpected to vary substantially within the studyarea. Sympatric lagomorphs included mountaincotton-tail rabbits (Sylvilagus nutallii ) and white-tailed jack rabbits (Lepus townsendii ), but theselagomorphs were not considered to be primaryburrowers.
Field techniquesWe censused all burrows large enough to be
used by pygmy rabbits on four sites within theDuck Creek allotment. These sites were scaled toencompass an area that was expected to be used
by an individual over the course of a year (;6ha). This does not imply exclusive use by oneindividual, but encompasses an area that wouldbe available to at least one individual. Indepen-dent sampling locations were separated by .1pygmy rabbit home range radii (;140 m;Sanchez and Rachlow 2008). To ensure thepresence of exploited burrows, the sites corre-sponded with the use-areas of four randomly-chosen pygmy rabbits that were monitored byradio telemetry for a separate study (Wilson et al.2011). We centered 6-ha circles on the medianNorthing and Easting coordinates of all locationsfor a single individual to delineate each of thefour sites.
Within each 6-ha area, two or three observerssystematically searched for all burrows .8 cm inany dimension (height or width) within thecircular site. The lower threshold of 8 cm wasset in order to distinguish pygmy rabbit burrowsfrom those of ground squirrels, which constructburrows that are typically ,8 cm in both heightand width (Laundre 1989). We recorded burrowlocations using a ProMark3 survey grade GPS(Magellan Professional GPS, Carquefou, Cedex,France). We post-processed burrow locationswith GNSS Solutions (v. 3.10.01; MagellanNavigation 2007) using one local and at leasttwo regional base-stations. The resulting spatialprecision of burrow locations was ,3 cm formost burrows (see Rayburn et al. 2011 for detailsof GPS methodology). Maps of burrows areavailable in Appendix A.
We found and recorded over 3000 burrowentrances during the burrow censuses. Whileevery attempt was made to find all burrowswithin the 6-ha areas, some burrows wereinevitably missed due to observer error. Howev-er, we are confident that almost all of theburrows were found and recorded, therebyreasonably satisfying assumptions of spatialpoint pattern analysis. In addition to location,we marked pygmy rabbit use by recording thepresence of scat near the burrow entrance.Burrows were considered to be used frequentlyif .5 pygmy rabbit pellets were found within 25cm of the burrow entrance. Sites with ,5 pygmyrabbits pellets were considered to be used rarely.Pygmy rabbit pellets overlapped in size with thatfrom juvenile cottontail rabbits, which made falsepositive burrow identification possible (J. L.
v www.esajournals.org 3 January 2012 v Volume 3(1) v Article 6
WILSON ET AL.

Rachlow, personal communication, Moscow, ID).To minimize this problem, the first author, whohad five years of experience conducting burrowsurveys, determined the presence of pygmyrabbit scat. Combined with the telemetry evi-dence of past occupancy, the observation ofseveral pygmy rabbits during surveys, and thelack of observation of juvenile cottontail rabbits,this methodology minimized false presenceerrors.
We measured vegetation covariates at a ran-domly selected sample of the burrows. Wedetermined the number of burrows to skipbetween vegetation measurements using a field-based randomization procedure based on thesecond hand of a watch. GPS locations wererecorded at skipped burrows, but covariateinformation was not. Between 0 and 20 burrowswere skipped between vegetation covariate sam-pling locations using this randomization proce-dure. We measured percent cover of overstory(.20 cm) and understory (,20 cm) vegetation ateach sampled burrow using a 0.25-m2 squareDaubenmire frame placed over the burrow.Plants ,20 cm in height consisted of grasses,forbs and small shrubs that were consideredforage resources for pygmy rabbits, but wereinadequate to provide visual obstruction toprotect rabbits from predation. Vegetation .20cm in height provided sufficient visual obstruc-tion to be considered as an additional source ofcover for predator avoidance, as well as a sourceof forage.
We used kernel density estimation to calculatea continuous index of the amount of escape coverprovided by burrows (no. burrows/m2). Thevalue of the bandwidth parameter was set to beequal to the mean bandwidth (as estimated byleast squares cross validation) for all burrows ateach site (mean¼ 2.732, SD¼ 0.645), rounded tothe nearest integer (3). This value was consistentwith other studies on clustering in burrowinganimals that considered burrow clusters to bedefined by a collection of burrows ,3 m apart(Hayes et al. 2007). We used measured covervariables and burrow density covariates in thelogistic regression analysis described below.
AnalysesWe used second-order spatial statistics that
were appropriate for detecting non-random
patterns in fine-scale point patterns to evaluatethe spatial distribution of burrows (Wiegand andMoloney 2004). We conducted spatial analysesusing the spatstat package (Baddeley and Turner2005) in program R (R Development Core Team2009). We used the common second-order spatialstatistic Ripley’s K (Ripley 1981) with Ripley edgecorrection to evaluate burrow patterns. Wefollowed common practice in transforming theK-functions to L-functions (Besag 1977) to stabi-lize variance and facilitate interpretation (seeAppendix B for additional information about K-and L- functions). Preliminary analyses of densitysurfaces created for rabbit burrow patternssuggested that burrows were affected by firstorder heterogeneity caused by topography andanthropogenic land-use (e.g., roads and treat-ments). As a result, inhomogeneous null modelswere fit for all L-functions in conjunction withMonte Carlo permutation procedures (Nsim ¼499) to generate approximate 95% simulationenvelopes. Values of L-functions that exceededthe 95% simulation envelopes indicated signifi-cant clustering of burrows, while values of L-functions that were lower than the 95% simula-tion envelopes indicated significant regularitybetween burrows. Simulation envelopes havebeen criticized for potentially leading to Type Ierrors when values of the evaluated function areclose to values of the simulation envelopes(Loosmore and Ford 2006, Blanco et al. 2008).Thus, we interpreted the significance of smalldepartures from the null model with caution(Blanco et al. 2008).
We used bivariate random labeling (e.g.,Lancaster and Downes 2004) to test if pygmyrabbits used burrows according to their avail-ability, given the underlying distribution ofburrows. We conducted tests of the bivariaterandom labeling hypothesis using the rlabelfunction in spatstat with Monte Carlo permuta-tions (Nsim ¼ 499) again used to generatesimulation envelopes. Under this hypothesis,the labels, or marks, associated with burrows(active or inactive) were conditionally indepen-dent and identically distributed, and the test ofthis statistical hypothesis involved generatingsimulated patterns from each burrow dataset byfixing burrow locations and randomly permutingburrow labels. For each burrow dataset, we thencalculated L-functions for each permutation and
v www.esajournals.org 4 January 2012 v Volume 3(1) v Article 6
WILSON ET AL.

compared to L-functions for the original pattern.Significant deviations relative to approximate95% simulation envelopes were evaluated withthe same interpretation as discussed above.
We evaluated the manner by which vegetationstructure and burrow distribution affected bur-row use by pygmy rabbits using individuallogistic regression models for each study land-scape (four sites), with pygmy rabbit pellets usedas the indicator of pygmy rabbit exploitation.Burrow density (Density; defined above) waslog-transformed for logistic analyses. Othercovariates of interest included vegetation coverover 20 cm in height (Ocov) and vegetation coverunder 20 cm in height (Ucov). Burrow densitywas included in all of the models in the candidatemodel set of 13 a priori models (Table 1) in orderto account for expected spatial structure inburrow distributions. Tests for multicollinearityof covariates were preformed prior to fittingregression models. There was a weak negativecorrelation between overstory and understorycover on all landscapes, but the correlation wasless than the minimum acceptable threshold forincluding variables in the same model (Pearson R, 0.5). Models were fit using PROC LOGISTIC inSAS. Mild over-dispersion was observed for oneof the four sites (Table 2). We therefore usedquasi-Akaike information criterion (QAIC) toevaluate relative support for the 13 models ateach of the four sites (Burnham and Anderson2002). We included main effects in all interactionmodels (Table 1).
RESULTS
There were between 612 and 1106 (mean¼ 778,1 SD ¼ 223) burrows in each 6-ha site. Of these,roughly 50% showed evidence of pygmy rabbituse (mean ¼ 407, 1 SD ¼ 118). Regardless ofexploitation by pygmy rabbits, burrows weresignificantly clustered at distances up to approx-imately 25 m (Fig. 1, row 1). At broader scales,burrows were either randomly or regularlydistributed. Similar patterns were observed foractive burrows at all sites (Fig. 1, row 2).
The random labeling hypothesis was rejectedat all sites except Site 3 (Fig. 1, row 3). Thisfinding indicates clustered use of existing bur-rows by pygmy rabbits at three of the four sites,which means that pygmy rabbits did not useburrows in proportion to their spatial availability.Use of burrow clusters matched availability atthe remaining site (Site 3), except at two scaleranges (;5–20 m and 40–45 m; Fig. 1k). Theobserved pattern at Site 3 was likely affected byan intermittent drainage that bisected the samplearea (Appendix A: Fig. A1).
Each site had different models included in thecandidate model set (DQAIC , 2; Table 2,Appendix C). All four models with DQAIC , 2on site 1 contained an interaction betweenburrow density and understory cover (Table 2).The interaction effect shows that the probabilityof rabbit use was positively correlated withburrow density at low values of understorycover, but negatively correlated with burrowdensity at high values of understory cover (Fig.
Table 1. The a priori candidate models for logistic regression on burrow utilization by pygmy rabbits in the Duck
Creek allotment in Rich County, Utah, USA. Density¼modeled burrow density (n/m2), log transformed; Ocov
¼measured percent cover of all plants . 20 cm tall; Ucov¼measured percent cover of all plants , 20 cm tall.
Please note that all models that include an interaction term also include the main effects.
Model shorthand Model description
1. I Density2. I, O Density þ Ocov3. I, U Density þ Ucov4. I, O, U Density þ Ocov þ Ucov5. I, O, I 3 O Density þ Ocov þ Density 3 Ocov6. I, U, I 3 U Density þ Ucov þ Density 3 Ucov7. I, O, U, O 3 U Density þ Ocov þ Ucov þ Ocov 3 Ucov8. I, O, U, I 3 O Density þ Ocov þ Ucov þ Density 3 Ocov9. I, O, U, I 3 U Density þ Ocov þ Ucov þ Density 3 Ucov10. I, O, U, I 3 O, I 3 U Density þ Ocov þ Ucov þ Density 3 Ocov þ Density 3 Ucov11. I, O, U, I 3 O, O 3 U Density þ Ocov þ Ucov þ Density 3 Ocov þ Ocov 3 Ucov12. I, O, U, I 3 U, O 3 U Density þ Ocov þ Ucov þ Density 3 Ucov þ Ocov 3 Ucov13. I, O, U, I 3 O, I 3 U, O 3 U Density þ Ocov þ Ucov þ Density 3 Ocov þ Density 3 Ucov þ Ocov 3 Ucov
v www.esajournals.org 5 January 2012 v Volume 3(1) v Article 6
WILSON ET AL.

2). For site 2, there were two models with DQAIC, 2, both of which included an interactionbetween burrow density and overstory cover(Table 2). At this site, the probability of rabbitexploitation was negatively correlated withburrow density where overstory cover valueswere low, but positively correlated where over-story cover values were high (Fig. 2). Site 3 hadthree models within two DQAIC of the bestmodel. The density-only model accounted for32% of the QAIC weights at this site. Theremaining candidate models had a positivecorrelation between overstory cover or a negativecorrelation with understory cover, respectively(Appendix D). There was considerable modelselection uncertainty for site 4. The first twomodels indicated a positive correlation betweenthe probability of pygmy rabbit burrow use andboth burrow density and overstory cover (Ap-pendix D). The third model included the inter-action with understory, which was similar to theinteraction at site 1, but not as strong.
DISCUSSION
We used spatial analysis of refuge resource
locations to evaluate within home range spaceuse of a prey species. We found that there weremany self-created burrows available for use byindividuals, and that burrows were clustered upto ;25 m and then regularly spaced at distancesbeyond ;40 m. The shape and scale of thispattern was similar among sites, indicatinggenerality in how burrows were distributedwithin the use areas of pygmy rabbits. We alsoobserved that pygmy rabbits often did not useburrows in proportion to their availability,further suggesting resource selection based onforage or refuge quality of individual burrows orburrow clusters. Pygmy rabbits selected siteswith a high level of escape resources, but burrowdensity and overstory cover were only part of thestory. At some sites in this study, rabbits mayhave made a trade-off between maximum coverresources and maximum forage resources.
That burrows would be clustered at very shortdistances is not surprising because there arephysiological limits to how far a small animal cantravel through soil (Vleck 1979). Similarly,burrowing herbivores are central place or multi-ple central place foragers. Central place foragersare most likely to be found closer to the central
Table 2. Quasi-Akaike information criteria (QAIC) model selection statistics of logistic regression models for four
pygmy rabbit site in the Duck Creek allotment in Rich County, Utah, USA. Models showed some support
(DQAICi , 2). The variance inflation factor c is bold if statistically significant (p . 0.05) overdispersion was
observed. If c¼1 then there was no overdispersion, and the QAIC correction reduces to AIC. The sample size is
shown next to the variance inflation factor (N ¼ x).
Model shorthand Model number ki LogLik QAIC DQAICi L(gijx) wi
Site 1, c ¼ 1.054; N ¼ 54I, O, U, I 3 U 9 6 52.014 61.373 0.000 1.000 0.327I, O, U, I 3 O, I 3 U 10 7 50.118 61.573 0.200 0.905 0.296I, O, U, I 3 U, O 3 U 12 7 51.381 62.772 1.399 0.497 0.162I, O, U, I 3 O, I 3 U, O 3 U 13 8 49.514 63.000 1.627 0.443 0.145
Site 2, c ¼ 1.000; N ¼ 59I, O, I 3 O 5 5 47.677 57.677 0.000 1.000 0.438I, O, U, I 3 O 8 6 47.501 59.501 1.824 0.402 0.176
Site 3, c ¼ 1.385, N ¼ 140I 1 3 186.499 140.666 0.000 1.000 0.262I, O 2 4 185.762 142.134 1.468 0.480 0.126I, U 3 4 185.994 142.301 1.635 0.441 0.116
Site 4, c ¼ 1.134; N ¼ 124I, O 2 4 135.331 127.350 0.000 1.000 0.232I, O, U 4 5 133.655 127.872 0.522 0.770 0.179I, U, I 3 U 6 5 134.572 128.681 1.331 0.514 0.119I, O, I 3 O 5 5 134.923 128.990 1.640 0.440 0.102I, O, U, I 3 U 9 6 132.998 129.293 1.942 0.379 0.088
Notes: Model shorthand notation as defined in Table 1 (interactions include main effects); Model number is the model orderas presented in Table 1; ki¼ the number of variables for model i; LogLik¼ the loglikelihood for each model; QAIC¼ the quasi-Akaike information criterion; DQAICi ¼ the difference of the QAIC for model i from that of the best model; L(gijx) ¼ thelikelihood of model i given the data; and wi ¼ the Akaike weights for model i.
v www.esajournals.org 6 January 2012 v Volume 3(1) v Article 6
WILSON ET AL.

place, thus a clustered use of refuge resources isexpected (Rosenberg and McKelvey 1999, Wilsonet al. 2011). Additionally, many burrowinganimals, including Columbia ground squirrels(Spermophilus columbianus; Weddell 1989), degus(Octodon degus; Hayes et al. 2007), and Europeanrabbits (Oryctolagus cuniculus; Cowan 1987),construct burrow systems with .1 entrance,which may result in a clustered pattern. Forthese herbivores, the increased number of bur-row openings is considered to decrease their riskof predation (Hayes et al. 2007). Additionally,there is evidence that clustered resource patternsmay be advantageous, allowing higher individ-
ual densities and perhaps aiding populationpersistence (Doncaster 2001).
While burrow patterns were clustered at finer-scales, patterns were random at intermediatescales and regular at broader-scales. The role ofspatial scale in influencing the expected patternsof animal movement, foraging, and space use hasnot been adequately addressed (Borger et al.2008). While the finer-scale clustered pattern iseasily described by the physiology and foragingbehavior of the study organism, the observedregularity at larger spatial scales is not as easilyexplained. This pattern could reflect the optimalspacing of refuge burrow clusters for animals
Fig. 1. L-functions (solid lines) and approximate 95% simulation envelopes (Nsim ¼ 499; dashed lines) for
pygmy rabbit burrow patterns at sites in the Duck Creek allotment in Rich County, Utah, USA. Rows represent
the three different sets of spatial analyses (from top to bottom): L-functions for all burrows, L-functions for active
burrows only, and bivariate L-functions for tests of random labelling hypothesis regarding pattern of active
burrows given locations of all burrows. Columns represent the four sites (from left to right): site 1, site 2, site 3,
and site 4. The y-axis represents values of the L-functions and the x-axis represents the distance in meters at
which the spatial structure is evaluated. In all plots, significant clustering of burrows is indicated if the L-function
(solid lines) extends above the upper simulation envelope (dashed lines). The pattern of burrows is random if the
L-function falls within the simulation envelope, and regular if the L-function falls below the simulation envelope.
v www.esajournals.org 7 January 2012 v Volume 3(1) v Article 6
WILSON ET AL.

that wish to maximize safety during foragingbouts in a heterogeneous landscape (e.g., Beh-rends et al. 1986). Our observation of bothclustered and regular spacing of resourcesdepending on the spatial scale at which burrowarrangement is observed illustrates the danger oftransmutation errors (sensu O’Neill 1979) wheninterpreting results. In all cases, the interpreta-tion of behavioral responses to predation riskchange depending on the spatial scale observed.The ability to view pattern at multiple spatialscales is a strong advantage of the point patternanalysis methods employed here.
Prey species must balance feeding behaviorswith those that allow them to avoid predation(Sih 1980). The spatially clustered pattern ofburrows and burrow exploitation could thereforeresult from a prey species that is minimizingdistance travelled from the relative safety of aburrow while foraging. Our observation thatpygmy rabbits do not use burrows in proportionto their availability suggests that the perceivedrisk of predation may be driving this behavior.Short foraging bouts near cover have beenobserved for a variety of prey species, includingvizcachas (Lagostomus maximus), which are reluc-tant to venture far from burrows when foragingin order to minimize their vulnerability topredation by reducing the distance to safetyprovided by burrows (Galende and Raffaele2008). Similarly, white-throated sparrows (Zono-trichia albicollis) tended to forage preferentiallynear protective cover (Schneider 1984). Thesepublished observations of foraging behavior andour spatial analysis of self-created refuge exploi-tation lend support to the idea that central placeforaging behavior is an evolutionary adaptation
Fig. 2. Logistic interactions between ln(burrow
density) and understory cover (site 1) and overstory
cover (site 2) for two sites in the Duck Creek allotment
in Rich County, Utah, USA. Each logistic function
represents the relationship between the probability of
pygmy rabbit burrow use and burrow density at each
of seven levels of understory cover (Site 1) and
overstory cover (site 2). Cover is represented by line
symbol, shade and weight, with lightly shaded fine
dashed lines indicating low cover values, proceeding
incrementally to darkly shaded, heavy, solid lines
indicating high cover. The values for % cover are 0.5,
3.0, 15.0, 37.5, 62.5, 85.0, 95.5. All of these cover values
were observed for both used and unused burrows in
both landscapes with significant interactions. The
equation used to generate curves for were based on
the parameter estimates from best model as chosen by
QAIC model selection. These equations include main
effects and interaction terms. Details about the
mathematics used to generate the curves (including
how main effects were handled) are available in
Appendix E. The two vertical lines mark the range of
observed burrow density. Inputs for burrow were
displayed on this plot that fall outside the observed
range of our data to show the characteristic shape of
the logistic curve. No inference should be made about
values of burrow density outside of the black bars.
v www.esajournals.org 8 January 2012 v Volume 3(1) v Article 6
WILSON ET AL.

to predation risk (Lima and Dill 1990).How optimal foragers under risk of predation
select resources can be further understoodthrough an examination of which factors affectedburrow exploitation by pygmy rabbits. Weobserved that in addition to burrow density,overstory cover was a positive predictor ofburrow use on some of the sites (Appendix D).Overstory cover was included in the supportedmodels (DQAIC , 2) for all sites. This observa-tion agrees with other studies of pygmy rabbitsthat found increasing sagebrush cover leads to anincreased probability of pygmy rabbit occurrence(e.g., Green and Flinders 1980b, Simons andLaundre 2004, Larrucea and Brussard 2008).Overhead vegetative cover was also positivelycorrelated with placement of burrows by degus,and is thought to reduce their risk of predation(Hayes et al. 2007). However, pygmy rabbits feedon big sagebrush, especially in winter (Green andFlinders 1980b), and sagebrush is the dominantoverstory plant in our system (T. L. Wilson,unpublished data). Therefore, distinguishing for-age abundance and protection provided byoverhead cover is difficult. Despite this, thepresence of significant interactions betweenburrow density and vegetation cover suggeststhat the spatial pattern of burrows and thepresence of overhead cover may both be impor-tant for minimizing predation risk by pygmyrabbits.
We found interactions between burrow densityand vegetation cover for the top-ranking modelat two sites, and within a supported model set foranother. Although the interactions occurred foroverstory cover on one site, and for understorycover on the others, the negative relationshipbetween overstory cover and understory coversuggest that the mechanism generating theinteractions is the same for all three sites. In allcases, the expected positive relationship betweenthe probability of pygmy rabbit use and burrowdensity is reversed, demonstrating that rabbitsuse areas of low overall refuge abundance (asmeasured by both burrow density and overstorycover) in order to access areas with highunderstory forage availability (Fig. 2). Thisobservation suggests that pygmy rabbits aremaking a tradeoff between high forage availabil-ity (understory cover) and high safety (overstorycover and burrow density) in some cases.
That animals must choose between optimizingprotection from predation with foraging oppor-tunities is not a new insight (Sih 1980, Verdolin2006). Our results quantify the spatial scale atwhich the subtle trade-off between foragingopportunity and predation risk is expected in anatural system. Further research in naturalsystems where observations are made at scalesthat capture normal prey movements is neces-sary to formalize this link between refugedistribution and foraging behavior. For example,both the amount of forage exploitation requiredto induce animals to make the risky decision tochange burrow clusters, and the optimal distancemoved, should be explored. Detailed observationof animal behavior in landscapes where preda-tion pressure is experimentally manipulatedwould be required to test hypotheses regardingresource distribution and use in relation topredation risk.
ACKNOWLEDGMENTS
We extend thanks to R. Groll and the landowners ofthe Duck Creek allotment for access to private lands.Research was funded by the Utah State UniversityEcology Center and supported by the U.S. GeologicalSurvey Cooperative Fish and Wildlife Research Unit.Technicians G. Diamond, E. Goss, S. Hunt, R. Pyles, C.Simeon, and S. Weston assisted with field work. TheRS/GIS lab, especially T.B. Murphy and C. Gerrard,assisted with the GPS unit and burrow analyses. A. J.Leffler helped with field work and provided valuableinput on early drafts. We thank R. T. Larsen and M. B.Hooten for providing valuable comments during FSPreview, and two anonymous reviewers for their helpfulinsights. Mention of specific products and servicesdoes not constitute endorsement by the United StatesGovernment or U.S. Geological Survey. Procedureswere approved by the Utah State University AnimalCare and Use Committee (Protocol #1258).
LITERATURE CITED
Abramsky, Z., E. Strauss, A. Subach, A. Riechman, andB. P. Kotler. 1996. The effect of barn owls (Tyto alba)on the activity and microhabitat selection ofGerbillus allenbyi and G. pyramidum. Oecologia105:313–319.
Baddeley, A. J. and R. Turner. 2005. Spatstat: an Rpackage for analyzing spatial point patterns.Journal of Statistical Software 12:1–42.
Behrends, P., M. Daly, and M. I. Wilson. 1986. Rangeuse patterns and spatial relationships of Merriam’s
v www.esajournals.org 9 January 2012 v Volume 3(1) v Article 6
WILSON ET AL.

kangaroo rats (Dipodomys merriami ). Behaviour96:187–209.
Besag, J. 1977. Contribution to the discussion of Dr.Ripley’s paper. Journal of the Royal StatisticalSociety B 39:193–195.
Bissonette, J. A. 1997. Scale-sensitive ecological pro-poerties: historical context, current meaning. Pages3–30 in J. A. Bissonette, editor. Wildlife andlandscape ecology: effects of pattern and scale.Springer-Verlag, New York, New York, USA.
Blanco, P. D., C. M. Rostagno, H. F. del Valle, A. M.Beeskow, and T. Wiegand. 2008. Grazing impacts invegetated dune fields: predictions from spatialpattern analysis. Rangeland Ecology and Manage-ment 61:194–203.
Borger, L., B. D. Dalziel, and J. M. Fryxell. 2008. Arethere general mechanisms of animal home rangebehaviour? A review and prospects for futureresearch. Ecology Letters 11:637–650.
Bradfield, T. D. 1975. On the behavior and ecology ofpygmy rabbit Sylvilagus idahoensis. Thesis. IdahoState University, Pocatello, Idaho, USA.
Brown, J. S., J. W. Laundre, and M. Gurung. 1999. Theecology of fear: optimal foraging, game theory, andtrophic interactions. Journal of Mammalogy80:385–399.
Burnham, K. P. and D. R. Anderson. 2002. Modelselection and multimodel inference: a practicalinformation-theoretic approach. Second edition.Springer, New York, New York, USA.
Charnov, E. L. 1976. Optimal foraging, the marginalvalue theorem. Theoretical Population Biology9:129–136.
Cowan, D. P. 1987. Group living in the European rabbit(Oryctolagus cuniculus): mutual benefit or resourcelocalization? Journal of Animal Ecology 56:779–795.
Crawford, J. A., R. G. Anthony, J. T. Forbes, and G. A.Lorton. 2010. Survival and causes of mortality forpygmy rabbits (Brachylagus idahoensis) in Oregonand Nevada. Journal of Mammalogy 91:838–847.
Creel, S., J. Winnie, Jr., B. Maxwell, K. Hamlin, and M.Creel. 2005. Elk alter habitat selection as anantipredator response to wolves. Ecology86:3387–3397.
Cresswell, W., J. Lind, and J. L. Quinn. 2010. Predator-hunting success and prey vulnerability: quantify-ing the spatial scale over which lethal and non-lethal effects of predation occur. Journal of AnimalEcology 79:556–562.
Doncaster, C. P. 2001. Healthy wrinkles for populationdynamics: unevenly spread resources can supportmore users. Journal of Animal Ecology 70:91–100.
Ford, R. G. 1983. Home range in a patchy environment:optimal foraging predictions. American Zoologist23:315–326.
Gabler, K. I., L. T. Heady, and J. W. Laundre. 2001. A
habitat suitability model for pygmy rabbits (Bra-chylagus Idahoensis) in southeastern Idaho. WesternNorth American Naturalist 61:480–489.
Galende, G. I. and E. Raffaele. 2008. Space use of a non-native species, the European hare (Lepus europaeus),in habitats of the southern vizcacha (Lagidiumviscacia) in northwestern Patagonia, Argentina.European Journal of Wildlife Research 54:299–304.
Green, J. S. and J. T. Flinders. 1980a. Brachylagusidahoensis. Mammalian Species 125:1–4.
Green, J. S. and J. T. Flinders. 1980b. Habitat anddietary relationships of the pygmy rabbit. Journalof Range Management 33:136–142.
Hayes, L. D., A. S. Chesh, and L. A. Ebensperger. 2007.Ecological predictors of range areas and use ofburrow systems in the diurnal rodent, Octodondegus. Ethology 113:155–165.
Iason, G. R., T. Manso, D. A. Sim, and F. G. Hartley.2002. The functional response does not predict thelocal distribution of European rabbits (Oryctolaguscuniculus) on grass swards: experimental evidence.Functional Ecology 16:394–402.
Jacob, J. and J. S. Brown. 2000. Microhabitat use,giving-up densities and temporal activity as short-and long-term anti-predator behaviors in commonvoles. Oikos 91:131–138.
Karels, T. J. and R. Boonstra. 1999. The impact ofpredation on burrow use by Arctic groundsquirrels in the boreal forest. Proceedings of theRoyal Society of London Series B 266:2117–2123.
Lancaster, J. and B. J. Downes. 2004. Spatial pointpattern analysis of avaiable and exploited resourc-es. Ecography 27:97–102.
Larrucea, E. S. 2007. Distribution, behavior, andhabitat preferences of the pygmy rabbit (Brachyla-gus idahoensis) in Nevada and California. Disserta-tion. University of Nevada, Reno, Nevada, USA.
Larrucea, E. S. and P. F. Brussard. 2008. Habitatselection and current distribution of the pygmyrabbit in Nevada and California, USA. Journal ofMammalogy 89:691–699.
Laundre, J. W. 1989. Horizontal and vertical diameterof burrows of five small mammal species insoutheastern Idaho. Great Basin Naturalist49:646–649.
Laundre, J. W., L. Hernandez, and K. B. Altendorf.2001. Wolves, elk, and bison: reestablishing the‘‘landscape of fear’’ in Yellowstone National Park,U.S.A. Canadian Journal of Zoology 79:1401–1409.
Lima, S. L. and L. M. Dill. 1990. Behavioral decisionsmade under the risk of predation: a review andprospectus. Canadian Journal of Zoology 68:619–640.
Loosmore, B. N. and D. E. Ford. 2006. Statisticalinference using the G or K point pattern spatialstatistics. Ecology 87:1925–1931.
O’Neill, R. V. 1979. Transmutations across hierarchical
v www.esajournals.org 10 January 2012 v Volume 3(1) v Article 6
WILSON ET AL.

levels. Pages 59–78 in G. S. Innis and R. V. O’Neill,editors. Systems analysis of ecosystems. Interna-tional Cooperative Publishing, Fairtland, Mary-land, USA.
Price, A. J. 2009. Survival and burrowing ecology ofpygmy rabbits: implications for sagebrush habitatand estimation of abundance. Thesis. University ofIdaho, Moscow.
R Development Core Team. 2009. R: a language andenvironment for statistical computing. Version2.9.1. R Foundation for Statistical Computing,Vienna, Austria.
Rachlow, J. L., D. M. Sanchez, and W. A. Estes-Zumpf.2005. Natal burrows and nests of free-rangingpygmy rabbits (Brachylagus idahoensis). WesternNorth American Naturalist 65:136–139.
Rayburn, A. P., K. Schiffers, and E. W. Schupp. 2011.Use of precise spatial data for describing spatialpatterns and plant interactions in a diverse GreatBasin shrub community. Plant Ecology 212:585–594.
Ripley, B. D. 1981. Spatial statisitics. Wiley, New York,New York, USA.
Rosenberg, D. K. and K. S. McKelvey. 1999. Estimationof habitat selection for central-place foraginganimals. Journal of Wildlife Management 63:1028–1038.
Sanchez, D. M. and J. L. Rachlow. 2008. Spatio-temporal factors shaping diurnal space use bypygmy rabbits. Journal of Wildlife Management72:1304–1310.
Schneider, K. J. 1984. Dominance, predation, andoptimal foraging in white-throated sparrow flocks.Ecology 65:1820–1827.
Sih, A. 1980. Optimal behavior: can foragers balancetwo conflicting demands? Science 210:1041–1043.
Simons, E. M. and J. W. Laundre. 2004. A large-scaleregional assessment of suitable habitat for pygmyrabbits in southwestern Idaho. Northwest Science78:33–41.
Skov, M. W., S. J. Hawkins, M. Volkelt-Igoe, J. Pike,R. C. Thompson, and C. P. Doncaster. 2011.Patchiness in resource distribution mitigates habi-tat loss: insights from high-shore grazers. Eco-sphere 2:art60.
Verdolin, J. 2006. Meta-analysis of foraging andpredation risk trade-offs in terrestrial systems.Behavioral Ecology and Sociobiology 60:457–464.
Vleck, D. 1979. The energy cost of burrowing by thepocket gopher Thomomys bottae. PhysiologicalZoology 52:122–136.
Weddell, B. J. 1989. Dispersion of Columbian groundsquirrels (Spermophilus columbianus) in meadowsteppe and coniferous forest. Journal of Mammal-ogy 70:842–845.
Wiegand, T. and K. A. Moloney. 2004. Rings, circles,and null-models for point pattern analysis inecology. Oikos 104:209–229.
Wilson, T. L., F. P. Howe, and T. C. Edwards, Jr. 2011.Effects of sagebrush treatments on multi-scaleresource selection by pygmy rabbits. Journal ofWildlife Management 75:393–398.
Wilson, T. L., J. B. Odei, M. B. Hooten, and T. C.Edwards, Jr. 2010. Hierarchical spatial models forpredicting pygmy rabbit distribution and relativeabundance. Journal of Applied Ecology 47:401–409.
v www.esajournals.org 11 January 2012 v Volume 3(1) v Article 6
WILSON ET AL.

SUPPLEMENTAL MATERIAL
APPENDIX A
Fig. A1. Pygmy rabbit burrow maps for the four sites censused in the Duck Creek Allotment in Rich County,
Utah, USA. The color ramp shows burrow density ranging from low values in cool colors to high values in warm
colors. Burrows are indicated by a circle. Burrows with five or more pygmy rabbit pellets are blue, and those with
less than five are white.
v www.esajournals.org 12 January 2012 v Volume 3(1) v Article 6
WILSON ET AL.

APPENDIX B
The K-function is used to evaluate secondorder point processes for significant nonrandomspatial patterns assuming stationarity and isot-ropy. This function works by determining theintensity of events (number/per unit area) withina specified area of each point. K is estimated for adefined radius (h) from each point by Eq. 1.
KðhÞ ¼ 1
kjDjXi 6¼j
XIhðdijÞ ð1Þ
where h is the radius of a search window, k is theintensity of event in the region, jDj is the area ofthe region, dij is the distance between the ith andjth events. K-hat is expected to be high if there ismuch clustering and low if the spacing is regular.
The distribution of K-hat is non-linear so we
applied a transformation to K-hat called L-hat
(Eq. 2).
LðhÞ ¼
ffiffiffiffiffiffiffiffiffiffiKðhÞ
p
s� h: ð2Þ
Plotted against h, L-hat gives a visual represen-
tation of a point pattern across the range of h. The
significant of a point pattern may be evaluated
using Monte Carlo simulation envelopes; a point
pattern is clustered if the value of the function
above the upper limits of the simulation enve-
lopes, and regular if the function is below the
lower limits of the simulation envelope.
APPENDIX C
Table C1. QAIC model selection statistics of logistic regression models for four pygmy rabbit sites in the Duck
Creek allotment in Rich County, Utah, USA. Models are grouped by support (models showing support:
DQAICi , 2; models lacking support: DQAICi . 2). The variance inflation factor c is bold if statistically
significant ( p . 0.05) overdispersion was observed. If c¼ 1 then there was no overdispersion, and the QAIC
correction reduces to AIC. The sample size is shown next to the variance inflation factor (N¼ x).
Model shorthand Model number ki LogLik QAIC DQAICi L(gijx) wi
Site 1, c ¼ 1.054; N ¼ 54I, O, U, I 3 U 9 6 52.014 61.373 0.000 1.000 0.327I, O, U, I 3 O, I 3 U 10 7 50.118 61.573 0.200 0.905 0.296I, O, U, I 3 U, O 3 U 12 7 51.381 62.772 1.399 0.497 0.162I, O, U, I 3 O, I 3 U, O 3 U 13 8 49.514 63.000 1.627 0.443 0.145I 1.1 3 64.205 66.944 5.572 0.062 0.020I, O 2 4 62.705 67.521 6.148 0.046 0.015I, U 3 4 64.108 68.852 7.480 0.024 0.008I, O, I 3 O 5 5 62.452 69.280 7.908 0.019 0.006I, O, U 4 5 62.469 69.297 7.924 0.019 0.006I, U, I 3 U 6 4 64.661 69.377 8.005 0.018 0.006I, O, U, I 3 O 8 3 68.595 71.111 9.739 0.008 0.003I, O, U, O 3 U 7 6 62.184 71.026 9.654 0.008 0.003O 1.2 6 62.388 71.220 9.847 0.007 0.002I, O, U, I 3 O, O 3 U 11 6 64.103 72.848 11.475 0.003 0.001U 1.3 3 71.121 73.509 12.137 0.002 0.001
Site 2, c ¼ 1.000; N ¼ 59I, O, I 3 O 5 5 47.677 57.677 0.000 1.000 0.438I, O, U, I 3 O 8 6 47.501 59.501 1.824 0.402 0.176I, O, U, I 3 O, O 3 U 11 7 46.172 60.172 2.495 0.287 0.126I, O, U, I 3 O, I 3 U 10 8 44.347 60.347 2.670 0.263 0.115O 1.2 3 55.854 61.854 4.177 0.124 0.050U 1.3 3 56.745 62.745 5.068 0.079 0.032I 1.1 3 56.756 62.756 5.079 0.079 0.035I, O, U, I 3 O, I 3 U, O 3 U 13 8 46.055 62.055 4.378 0.112 0.049I, O 2 4 55.836 63.836 6.159 0.046 0.020I, U 3 4 56.730 64.730 7.053 0.029 0.013I, U, I 3 U 6 5 54.798 64.798 7.121 0.028 0.012I, O, U 4 5 55.715 65.715 8.038 0.018 0.008I, O, U, O 3 U 7 6 55.142 67.142 9.465 0.009 0.004I, O, U, I 3 U 9 6 55.690 67.690 10.013 0.007 0.003I, O, U, I 3 U, O 3 U 12 7 55.142 69.142 11.465 0.003 0.001
v www.esajournals.org 13 January 2012 v Volume 3(1) v Article 6
WILSON ET AL.

Table C1. Continued.
Model shorthand Model number ki LogLik QAIC DQAICi L(gijx) wi
Site 3, c ¼ 1.385; N ¼ 140I 1.1 3 186.499 140.666 0.000 1.000 0.262O 1.2 3 188.299 141.966 1.300 0.522 0.137I, O 2 4 185.762 142.134 1.468 0.480 0.126I, U 3 4 185.994 142.301 1.635 0.441 0.116U 1.3 3 189.051 142.509 1.843 0.398 0.104I, O, I 3 O 5 5 185.150 143.692 3.026 0.220 0.058I, O, U 4 5 185.426 143.891 3.225 0.199 0.052I, U, I 3 U 6 5 185.654 144.056 3.390 0.184 0.048I, O, U, I 3 O 8 6 184.822 145.455 4.789 0.091 0.024I, O, U, I 3 U 9 6 185.159 145.698 5.032 0.081 0.021I, O, U, O 3 U 7 6 185.364 145.846 5.180 0.075 0.020I, O, U, I 3 O, I 3 U 10 7 184.390 147.143 6.477 0.039 0.010I, O, U, I 3 O, O 3 U 11 7 184.641 147.324 6.658 0.036 0.009I, O, U, I 3 U, O 3 U 12 7 185.103 147.658 6.992 0.030 0.008I, O, U, I 3 O, I 3 U, O 3 U 13 8 184.187 148.997 8.331 0.016 0.004
Site 4, c ¼ 1.134; N ¼ 124I, O 2 4 135.331 127.350 0.000 1.000 0.232I, O, U 4 5 133.655 127.872 0.522 0.770 0.179I, U, I 3 U 6 5 134.572 128.681 1.331 0.514 0.119I, O, I 3 O 5 5 134.923 128.990 1.640 0.440 0.102I, O, U, I 3 U 9 6 132.998 129.293 1.942 0.379 0.088I, O, U, I 3 O 8 6 133.143 129.420 2.070 0.355 0.082I, O, U, O 3 U 7 6 133.402 129.649 2.299 0.317 0.073I, O, U, I 3 O, I 3 U 10 7 132.748 131.072 3.722 0.156 0.036I, O, U, I 3 U, O 3 U 12 7 132.860 131.171 3.821 0.148 0.034I, O, U, I 3 O, O 3 U 11 7 133.007 131.300 3.950 0.139 0.032I, O, U, I 3 O, I 3 U, O 3 U 13 8 132.664 132.998 5.648 0.059 0.014I, U 3 4 143.828 134.844 7.494 0.024 0.005O 1.2 3 148.715 137.154 9.804 0.007 0.002I 1.1 3 149.885 138.185 10.835 0.004 0.001U 1.3 3 159.028 146.249 18.899 0.000 0.000
Notes:Model shorthand¼ short description of the model described in Table 2 (all interaction models include the main effects).ki,¼ the number of variables for model i; QAIC¼ the quasi-Akaike information criterion; DQAICi¼ the difference of the QAICfor model i from that of the best model; L(gijx) ¼ the likelihood of model i given the data; and wi ¼ the Akaike weights formodel i.
Table C2. AIC model selection statistics of logistic regression models for four pygmy rabbit sites in the Duck
Creek allotment in Rich County, Utah, USA. Models are grouped by support (models showing support: DAICi
, 2; models lacking support: DAICi . 2).The sample size is shown next to the site name (N ¼ x).
Model shorthand Model number ki QAIC DAICi L(gijx) wi
Site 1, N ¼ 54I, O, U, I 3 U 9 5 62.014 0.000 1.000 0.325I, O, U, I 3 O, I 3 U 10 6 62.118 0.104 0.949 0.308I, O, U, I 3 U, O 3 U 12 6 63.381 1.367 0.505 0.164I, O, U, I 3 O, I 3 U, O 3 U 13 7 63.514 1.500 0.472 0.153I 1.1 2 68.205 6.191 0.045 0.015I, O 2 3 68.705 6.691 0.035 0.011I, U 3 3 70.108 8.094 0.017 0.006I, O, I 3 O 5 4 70.452 8.438 0.015 0.005I, O, U 4 4 70.469 8.455 0.015 0.005I, U, I 3 U 6 3 70.661 8.647 0.013 0.004I, O, U, I 3 O 8 5 72.184 10.170 0.006 0.002I, O, U, O 3 U 7 5 72.388 10.374 0.006 0.002O 1.2 2 72.595 10.581 0.005 0.002I, O, U, I 3 O, O 3 U 11 5 74.103 12.089 0.002 0.001U 1.3 2 75.121 13.107 0.001 0.000
v www.esajournals.org 14 January 2012 v Volume 3(1) v Article 6
WILSON ET AL.
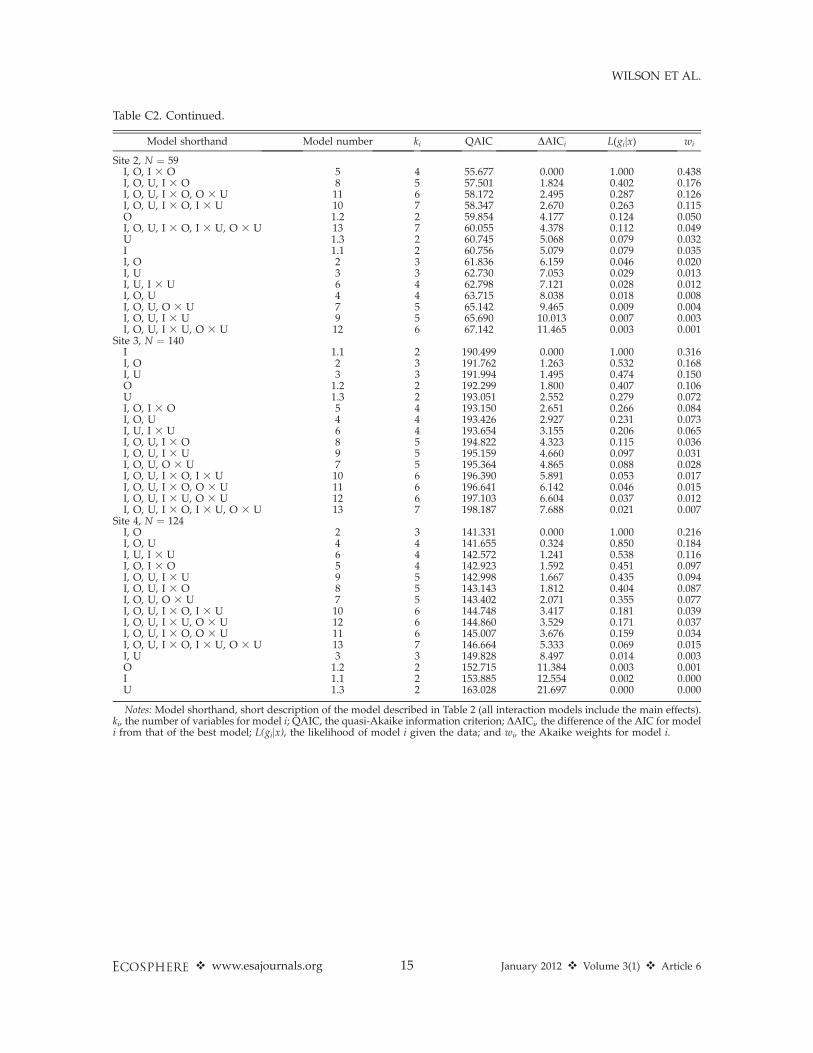
Table C2. Continued.
Model shorthand Model number ki QAIC DAICi L(gijx) wi
Site 2, N ¼ 59I, O, I 3 O 5 4 55.677 0.000 1.000 0.438I, O, U, I 3 O 8 5 57.501 1.824 0.402 0.176I, O, U, I 3 O, O 3 U 11 6 58.172 2.495 0.287 0.126I, O, U, I 3 O, I 3 U 10 7 58.347 2.670 0.263 0.115O 1.2 2 59.854 4.177 0.124 0.050I, O, U, I 3 O, I 3 U, O 3 U 13 7 60.055 4.378 0.112 0.049U 1.3 2 60.745 5.068 0.079 0.032I 1.1 2 60.756 5.079 0.079 0.035I, O 2 3 61.836 6.159 0.046 0.020I, U 3 3 62.730 7.053 0.029 0.013I, U, I 3 U 6 4 62.798 7.121 0.028 0.012I, O, U 4 4 63.715 8.038 0.018 0.008I, O, U, O 3 U 7 5 65.142 9.465 0.009 0.004I, O, U, I 3 U 9 5 65.690 10.013 0.007 0.003I, O, U, I 3 U, O 3 U 12 6 67.142 11.465 0.003 0.001
Site 3, N ¼ 140I 1.1 2 190.499 0.000 1.000 0.316I, O 2 3 191.762 1.263 0.532 0.168I, U 3 3 191.994 1.495 0.474 0.150O 1.2 2 192.299 1.800 0.407 0.106U 1.3 2 193.051 2.552 0.279 0.072I, O, I 3 O 5 4 193.150 2.651 0.266 0.084I, O, U 4 4 193.426 2.927 0.231 0.073I, U, I 3 U 6 4 193.654 3.155 0.206 0.065I, O, U, I 3 O 8 5 194.822 4.323 0.115 0.036I, O, U, I 3 U 9 5 195.159 4.660 0.097 0.031I, O, U, O 3 U 7 5 195.364 4.865 0.088 0.028I, O, U, I 3 O, I 3 U 10 6 196.390 5.891 0.053 0.017I, O, U, I 3 O, O 3 U 11 6 196.641 6.142 0.046 0.015I, O, U, I 3 U, O 3 U 12 6 197.103 6.604 0.037 0.012I, O, U, I 3 O, I 3 U, O 3 U 13 7 198.187 7.688 0.021 0.007
Site 4, N ¼ 124I, O 2 3 141.331 0.000 1.000 0.216I, O, U 4 4 141.655 0.324 0.850 0.184I, U, I 3 U 6 4 142.572 1.241 0.538 0.116I, O, I 3 O 5 4 142.923 1.592 0.451 0.097I, O, U, I 3 U 9 5 142.998 1.667 0.435 0.094I, O, U, I 3 O 8 5 143.143 1.812 0.404 0.087I, O, U, O 3 U 7 5 143.402 2.071 0.355 0.077I, O, U, I 3 O, I 3 U 10 6 144.748 3.417 0.181 0.039I, O, U, I 3 U, O 3 U 12 6 144.860 3.529 0.171 0.037I, O, U, I 3 O, O 3 U 11 6 145.007 3.676 0.159 0.034I, O, U, I 3 O, I 3 U, O 3 U 13 7 146.664 5.333 0.069 0.015I, U 3 3 149.828 8.497 0.014 0.003O 1.2 2 152.715 11.384 0.003 0.001I 1.1 2 153.885 12.554 0.002 0.000U 1.3 2 163.028 21.697 0.000 0.000
Notes: Model shorthand, short description of the model described in Table 2 (all interaction models include the main effects).ki, the number of variables for model i; QAIC, the quasi-Akaike information criterion; DAICi, the difference of the AIC for modeli from that of the best model; L(gijx), the likelihood of model i given the data; and wi, the Akaike weights for model i.
v www.esajournals.org 15 January 2012 v Volume 3(1) v Article 6
WILSON ET AL.

APPENDIX D
Table D1. Regression coefficient parameter estimates for all logistic regression models for four pygmy rabbit site
in the Duck Creek allotment in Rich County, Utah, USA. Models are described in shorthand that is defined by
Table 1 in the main manuscript. All interaction models include the main effects. Bold indicates models and
coefficients that are statistically significant at p ¼ 0.05.
Model shorthand AIC I O U I 3 O I 3 U O 3 U
Site 1I 68.205 1.3331O 72.595 0.0120U 75.121 0.0027I, O 68.705 1.2593 0.00973I, U 70.108 1.3365 0.0034I, O, U 70.469 1.2601 0.0103 0.0054I, O, I 3 O 70.452 1.5811 0.0419 �0.0073I, U, I 3 U 70.661 1.1715 0.0052 0.0022I, O, U, O 3 U 72.388 1.2726 0.0163 0.0105 �0.0001I, O, U, I 3 O 72.184 1.6030 0.0447 0.0058 �0.0078I, O, U, I 3 U 62.014 12.2843 0.0144 0.6031 �0.1365I, O, U, I 3 O, I 3 U 62.118 15.5134 0.1238 0.7186 �0.0245 �0.1622I, O, U, I 3 O, O 3 U 74.103 1.6157 0.0506 0.0109 �0.0078 �0.0001I, O, U, I 3 U, O 3 U 63.381 13.4993 0.0430 0.6771 �0.1499 �0.0004I, O, U, I 3 O, I 3 U, O 3 U 63.514 16.8111 0.1521 0.7956 �0.0243 �0.1763 �0.0004
Site 2I 60.756 �0.0397O 59.854 0.0091U 60.745 0.0015I, O 61.836 0.0823 0.0094I, U 62.730 �0.0564 0.0017I, O, U 63.715 0.0453 0.0101 0.0044I, O, I 3 O 55.677 �1.8040 �0.2165 0.0573I, U, I 3 U 62.798 �0.0396 0.0054 0.0034I, O, U, O 3 U 65.142 0.0441 0.0228 0.0136 �0.0003I, O, U, I 3 O 57.501 �1.8950 �0.2173 0.0057 0.0575I, OU, I 3 U 65.690 �0.0996 0.0101 �0.0097 0.0033I, O, U, I 3 O, I 3 U 58.347 �3.2488 �0.2417 �0.0930 0.0635 0.0236I, O, U, I 3 O, O 3 U 58.172 �2.0484 �0.2163 0.0197 0.0624 �0.0004I, O, U, I 3 U, O 3 U 67.142 0.0549 0.0229 0.0147 �0.0002 �0.0003I, O, U, I 3 O, I 3 U, O 3 U 60.055 �2.5993 �0.2252 �0.0307 0.0630 0.011 �0.0003
Site 3I 190.499 0.3938O 192.299 0.0044U 193.051 �0.0026I, O 191.762 0.3815 0.0040I, U 191.994 0.4237 �0.0045I, O, U 193.426 0.4076 0.0035 �0.0037I, O, I 3 O 193.150 0.5762 0.0219 �0.0051I, U, I 3 U 193.654 0.3827 �0.0039 0.0008I, O, U, O 3 U 195.364 0.4083 0.0009 �0.0055 0.0000I, O, U, I 3 O 194.822 0.6006 0.0214 �0.0037 �0.0051I, O, U, I 3 U 195.159 0.7092 0.0035 0.0119 �0.0045I, O, U, I 3 O, I 3 U 196.390 1.0193 0.0239 0.0166 �0.0058 �0.0059I, O, U, I 3 O, O 3 U 196.641 0.6251 0.0189 �0.0068 �0.0056 0.0000I, O, U, I 3 U, O 3 U 197.103 0.7060 0.0010 0.0100 �0.0045 0.0000I, O, U, I 3 O, I 3 U, O 3 U 198.187 1.0580 0.0215 0.0138 �0.0065 �0.0061 0.0000
Site 4I 153.885 1.1685O 152.715 0.0196U 163.028 �0.0129I, O 141.331 1.2849 0.0215I, U 149.828 1.3431 �0.0185I, O, U 141.655 1.3707 0.0190 �0.0109I, O, I 3 O 142.923 1.5277 0.0460 �0.0071I, U, I 3 U 142.572 1.1944 �0.011 0.00519I, O, U, O 3 U 143.402 1.3654 0.0232 �0.0077 �0.0001I, O, U, I 3 O 143.143 1.6497 0.0465 �0.0113 �0.0079I, O, U, I 3 U 142.998 0.8658 0.0192 �0.0536 0.0122
v www.esajournals.org 16 January 2012 v Volume 3(1) v Article 6
WILSON ET AL.

APPENDIX E
The equations used to generate curves for Fig.2 were based on the parameter estimates frombest model as chosen by AIC model selection. Inboth cases I is a vector of burrow densities goingfrom 1 to 8 in 0.01 increments. The interactionrepresented by the curves was generated byholding Oi (overstory cover) or Ui (understorycover) constant for each of the seven Daubenmiercover classes. The choice between Oi and Ui wasbased on which term showed a significantinteraction with burrow density. The equationsfollow the general logistic form: e(interceptþmain
effect1þmain effect 2þinteraction effect)/(1 � e(interceptþmain
effect1þmain effect 2þinteraction effect)). If a third main
effect was present in the selected model, then itwas added to the basic equation described above.The equation used to generate the figure for Site1 was: e(�54.3664þ0.0144 3 Oc þ 12.2843 3 Iþ0.6031 3 Ui þ
�0.1365 3 I 3 Ui)/(1 � e(�54.3664þ0.0144 3 Oc þ 12.2843 3
Iþ0.6031 3 Ui þ �0.1365 3 I 3 Ui)). Where I and Ui aredescribed above. Oc is a constant level ofoverstory cover (37.5). The equation used togenerate the figure for Site 2 was:e(8.8149þ�1.8040 3 Iþ�0.2165 3 Oi þ 0.0573 3 I 3 Oi )/(1 �e(8.8149þ�1.8040 3 Iþ�0.2165 3 Oi þ 0.0573 3 I 3 Oi )). Re-gression coefficients for both equations comefrom the logistic regression analyses.
Table D1. Continued.
Model shorthand AIC I O U I 3 O I 3 U O 3 U
I, O, U, I 3 O, I 3 U 144.748 1.1614 0.0391 �0.0462 �0.0058 0.0010I, O, U, I 3 O, O 3 U 145.007 1.6143 0.0467 �0.0088 �0.0071 �0.0001I, O, U, I 3 U, O 3 U 144.86 0.8979 0.0223 �0.0478 0.0112 �0.0001I, O, U, I 3 O, I 3 U, O 3 U 146.664 1.1585 0.0396 �0.0421 �0.0052 0.0094 �0.0001
##Fig. 2 plotsI1¼ seq (1,8,by¼ .01)O1¼ 0.5O2¼ 3O3¼ 15O4¼ 37.5O5¼ 62.5O6¼ 85O7¼ 95.5#Lil (Site 2) interaction term IXOIXO1¼ I1 * O1exp1¼ exp (8.8149þ�1.8040*I1þ�0.2165*O1þ .0573*IXO1)prob1¼ exp1/(1þexp1)plot (I1,prob1, pch ¼ 10, col ¼ ‘‘white’’, xlab ¼ ‘‘Burrow Intensity’’, ylab ¼
‘‘Probability of Use’’)lines (I1,prob1, lty¼ 3, lwd¼ 1,col¼ ‘‘darkgray’’, add¼ TRUE)IXO2¼ I1 * O2exp2¼ exp (8.8149þ�1.8040*I1þ�0.2165*O2þ .0573*IXO2)prob2¼ exp2/(1þexp2)lines (I1,prob2, lty¼ 2, lwd¼ 1.5,col¼ ‘‘darkgray’’, add¼ TRUE)IXO3¼ I1 * O3exp3¼ exp (8.8149þ�1.8040*I1þ�0.2165*O3þ .0573*IXO3)prob3¼ exp3/(1þexp3)lines (I1,prob3, lty¼ 2, lwd¼ 2.5,col¼ ‘‘darkgray’’, add¼ TRUE)IXO4¼ I1 * O4
v www.esajournals.org 17 January 2012 v Volume 3(1) v Article 6
WILSON ET AL.

exp4¼ exp (8.8149þ�1.8040*I1þ�0.2165*O4þ .0573*IXO4)
prob4¼ exp4/(1þexp4)
lines (I1,prob4, lty¼ 1, lwd¼ 1,col¼ ‘‘darkgray’’, add¼ TRUE)
IXO5¼ I1 * O5
exp5¼ exp (8.8149þ�1.8040*I1þ�0.2165*O5þ .0573*IXO5)
prob5¼ exp5/(1þexp5)
lines (I1,prob5, lty¼ 1, lwd¼ 1.5,col¼ ‘‘black’’, add¼ TRUE)
IXO6¼ I1 * O6
exp6¼ exp (8.8149þ�1.8040*I1þ�0.2165*O6þ .0573*IXO6)
prob6¼ exp6/(1þexp6)
lines (I1,prob6, lty¼ 1, lwd¼ 2.5,col¼ ‘‘black’’, add¼ TRUE)
IXO7¼ I1 * O7
exp7¼ exp (8.8149þ�1.8040*I1þ�0.2165*O7þ .0573*IXO7)
prob7¼ exp7/(1þexp7)
lines (I1,prob7, lty¼ 1, lwd¼ 5,col¼ ‘‘black’’, add¼ TRUE)
abline (v¼ 3.26)
abline (v¼ 5.23)
v www.esajournals.org 18 January 2012 v Volume 3(1) v Article 6
WILSON ET AL.
Copyright © 2022 FDOKUMEN