Spatial Distribution of some Important Heavy Metals in the Soils South of Manzala Lake in Bahr...
15
1 Nova Journal of Engineering and Applied Sciences Vol 2(3), Mar 2014: 1-15 Nova Explore Publications Nova Journal of Engineering and Applied Sciences Vol 2(3), Mar 2014: 1-15 www.novaexplore.com Research Article Spatial Distribution of some Important Heavy Metals in the Soils South of Manzala Lake in Bahr El-Baqar Region, Egypt Mohamed S.M. EL-Bady Department of Geological Sciences National Research Center, Dokki, Cairo, Egypt E-Mail: [email protected] Received 20 Feb 2014; Revised 2 Mar 2014; Accepted 15 Mar 2014 Abstract The present work attempts to establish the distribution of Iron, Copper, Cobalt, Nickel, Zinc, Lead, Cadmium and Chromium in the soils of Bahr EL-Baqar Region. Where, eight soil samples were collected from Bahr EL-Baqar Region, South of EL-Manzala Lake. Elements (Metals) concentrations in the soils were varied between 11987.67-33567.43; 62.22-270.20 ; 74.6-106.44 ; 54.29-80.30; 95.13-211.22 ; 33.73-54.40; 12.22-19.39; and 96.76-144.55 mg/kg for Fe, Cu, Co Ni, Zn, Pb, Cd and Cr respectively. The abundance of heavy metals measured in these soils decreases as follows: Fe > Zn > Cr > Cu > Co > Ni > Pb > Cd. The heavy metals concentrations of Fe, Cu , Co, Ni, Zn, Pb, Cd and Cr from the soil samples of Bahr EL-Baqar region compared with Canadian soil quality guidelines (CSQG) of Canadian Council of Ministers of the Environment.(CCME), (2007) and European Union Standards (EU,2002) as well as with average upper earth crust of Wedepohl (1995). Another assessment method was applied using certain indices to assess the environmental impacts of the heavy metal pollution of the soils of Bahr EL-Baqar Region. These indices include the Enrichment Factor, Contamination Factor, Pollution Load Index and Degree of Contamination. The most important heavy metals with regards to potential hazards in studied soils are Cu, Pb and Cd. Key Words: Bahr EL-Baqar – Heavy Metals – Pollution - Indices Calculations – Guidelines Introduction Due to rapid increase in population, Egypt is expanding its agricultural land require reuse of agricultural drainage water for irrigation. About 12 billion m3 (BCM) of water are drained yearly, and only about 4.2 BCM are currently being reused. Approximately, one million acre in the Nile delta depends on drainage water for irrigation (Abu, 2011). Reusing this drainage water without suitable treatment may cause adverse effects on soil, crop, animal, and human health. One of the most polluted drains in Egypt is Bahr El-Baqar drain (Abdel-Shafy and Aly, 2002). Bahr El-Baqar drain receives untreated waste water starting from east of Cairo, at the discharge point of El-Gebel El-Asfar and then joined by the Belbeis drain, down to the confluence with the Qalubiya drain. The length of the main drain is 170 km long and its depth is about 1-3 m and its width is about 30 - 70 m. A big part leads through cultivated agricultural areas. discharges in El-Manzala Lake and has two main branches, Qalubyia drain and the Bilbies drain (Taha et al., 2004). It receives and carries the greatest part of wastewater (about 3 BCM/year) into Lake Manzala through a very densely
Transcript of Spatial Distribution of some Important Heavy Metals in the Soils South of Manzala Lake in Bahr...
1
Nova Journal of Engineering and Applied Sciences Vol 2(3), Mar 2014: 1-15
Nova Explore Publications Nova Journal of Engineering and Applied Sciences Vol 2(3), Mar 2014: 1-15 www.novaexplore.com
Research Article
Spatial Distribution of some Important Heavy Metals in the Soils South of Manzala Lake in Bahr El-Baqar Region, Egypt
Mohamed S.M. EL-Bady
Department of Geological Sciences
National Research Center, Dokki, Cairo, Egypt E-Mail: [email protected]
Received 20 Feb 2014; Revised 2 Mar 2014; Accepted 15 Mar 2014
Abstract
The present work attempts to establish the distribution of Iron, Copper, Cobalt, Nickel, Zinc, Lead, Cadmium and Chromium in the soils of Bahr EL-Baqar Region. Where, eight soil samples were collected from Bahr EL-Baqar Region, South of EL-Manzala Lake. Elements (Metals) concentrations in the soils were varied between 11987.67-33567.43; 62.22-270.20 ; 74.6-106.44 ; 54.29-80.30; 95.13-211.22 ; 33.73-54.40; 12.22-19.39; and 96.76-144.55 mg/kg for Fe, Cu, Co Ni, Zn, Pb, Cd and Cr respectively. The abundance of heavy metals measured in these soils decreases as follows: Fe > Zn > Cr > Cu > Co > Ni > Pb > Cd. The heavy metals concentrations of Fe, Cu , Co, Ni, Zn, Pb, Cd and Cr from the soil samples of Bahr EL-Baqar region compared with Canadian soil quality guidelines (CSQG) of Canadian Council of Ministers of the Environment.(CCME), (2007) and European Union Standards (EU,2002) as well as with average upper earth crust of Wedepohl (1995). Another assessment method was applied using certain indices to assess the environmental impacts of the heavy metal pollution of the soils of Bahr EL-Baqar Region. These indices include the Enrichment Factor, Contamination Factor, Pollution Load Index and Degree of Contamination. The most important heavy metals with regards to potential hazards in studied soils are Cu, Pb and Cd.
Key Words: Bahr EL-Baqar – Heavy Metals – Pollution - Indices Calculations – Guidelines
Introduction
Due to rapid increase in population, Egypt is expanding its agricultural land require reuse of agricultural drainage water for irrigation. About 12 billion m3 (BCM) of water are drained yearly, and only about 4.2 BCM are currently being reused. Approximately, one million acre in the Nile delta depends on drainage water for irrigation (Abu, 2011). Reusing this drainage water without suitable treatment may cause adverse effects on soil, crop, animal, and human health. One of the most polluted drains in Egypt is Bahr El-Baqar drain (Abdel-Shafy and Aly, 2002). Bahr El-Baqar drain receives untreated waste water starting from east of Cairo, at the discharge point of El-Gebel El-Asfar and then joined by the Belbeis drain, down to the confluence with the Qalubiya drain. The length of the main drain is 170 km long and its depth is about 1-3 m and its width is about 30 - 70 m. A big part leads through cultivated agricultural areas. discharges in El-Manzala Lake and has two main branches, Qalubyia drain and the Bilbies drain (Taha et al., 2004). It receives and carries the greatest part of wastewater (about 3 BCM/year) into Lake Manzala through a very densely
2
Nova Journal of Engineering and Applied Sciences Vol 2(3), Mar 2014: 1-15
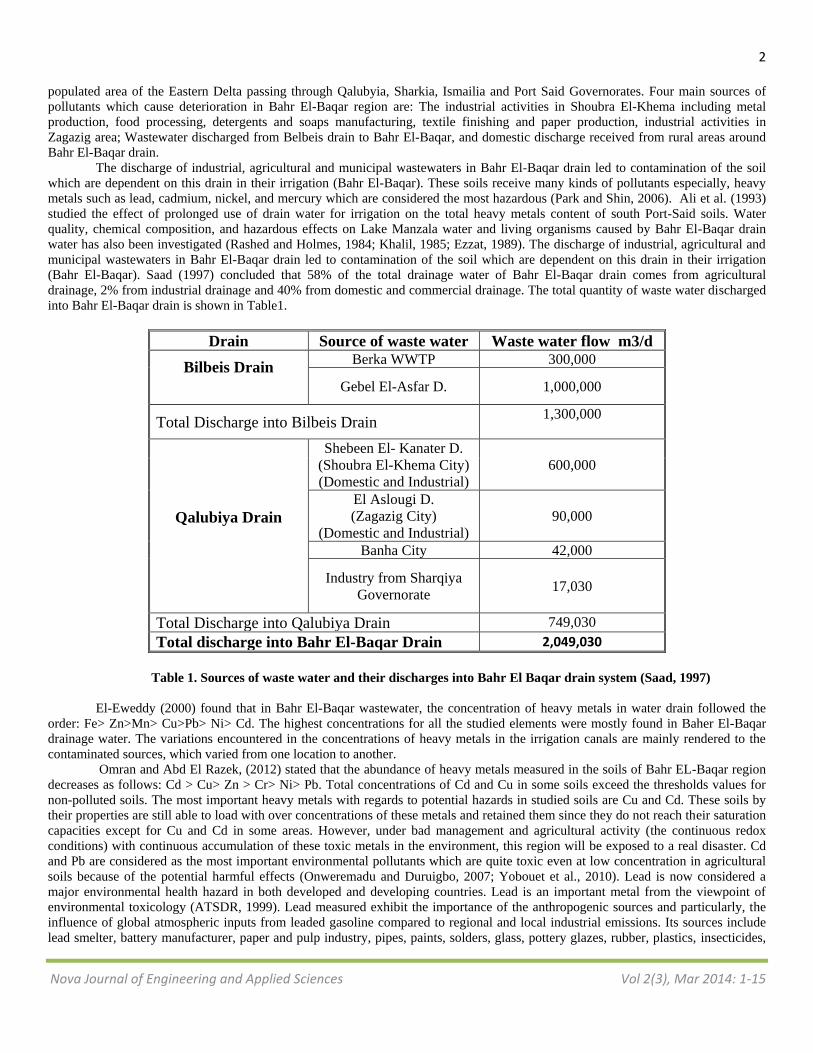
populated area of the Eastern Delta passing through Qalubyia, Sharkia, Ismailia and Port Said Governorates. Four main sources of pollutants which cause deterioration in Bahr El-Baqar region are: The industrial activities in Shoubra El-Khema including metal production, food processing, detergents and soaps manufacturing, textile finishing and paper production, industrial activities in Zagazig area; Wastewater discharged from Belbeis drain to Bahr El-Baqar, and domestic discharge received from rural areas around Bahr El-Baqar drain.
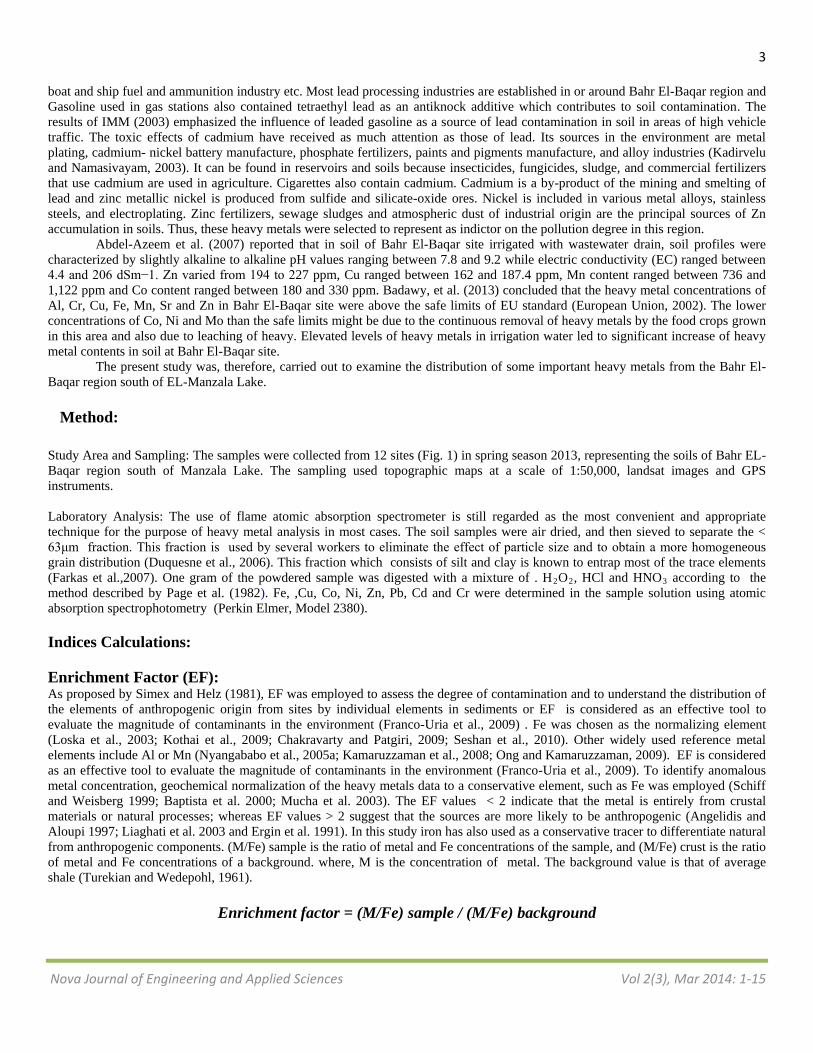
The discharge of industrial, agricultural and municipal wastewaters in Bahr El-Baqar drain led to contamination of the soil which are dependent on this drain in their irrigation (Bahr El-Baqar). These soils receive many kinds of pollutants especially, heavy metals such as lead, cadmium, nickel, and mercury which are considered the most hazardous (Park and Shin, 2006). Ali et al. (1993) studied the effect of prolonged use of drain water for irrigation on the total heavy metals content of south Port-Said soils. Water quality, chemical composition, and hazardous effects on Lake Manzala water and living organisms caused by Bahr El-Baqar drain water has also been investigated (Rashed and Holmes, 1984; Khalil, 1985; Ezzat, 1989). The discharge of industrial, agricultural and municipal wastewaters in Bahr El-Baqar drain led to contamination of the soil which are dependent on this drain in their irrigation (Bahr El-Baqar). Saad (1997) concluded that 58% of the total drainage water of Bahr El-Baqar drain comes from agricultural drainage, 2% from industrial drainage and 40% from domestic and commercial drainage. The total quantity of waste water discharged into Bahr El-Baqar drain is shown in Table1.
Drain Source of waste water Waste water flow m3/d
Bilbeis Drain
Berka WWTP 300,000
Gebel El-Asfar D. 1,000,000
Total Discharge into Bilbeis Drain 1,300,000
Qalubiya Drain
Shebeen El- Kanater D. (Shoubra El-Khema City) (Domestic and Industrial)
600,000
El Aslougi D. (Zagazig City)
(Domestic and Industrial) 90,000
Banha City 42,000
Industry from Sharqiya Governorate 17,030
Total Discharge into Qalubiya Drain 749,030 Total discharge into Bahr El-Baqar Drain 2,049,030
Table 1. Sources of waste water and their discharges into Bahr El Baqar drain system (Saad, 1997)
El-Eweddy (2000) found that in Bahr El-Baqar wastewater, the concentration of heavy metals in water drain followed the
order: Fe> Zn>Mn> Cu>Pb> Ni> Cd. The highest concentrations for all the studied elements were mostly found in Baher El-Baqar drainage water. The variations encountered in the concentrations of heavy metals in the irrigation canals are mainly rendered to the contaminated sources, which varied from one location to another.
Omran and Abd El Razek, (2012) stated that the abundance of heavy metals measured in the soils of Bahr EL-Baqar region decreases as follows: Cd > Cu> Zn > Cr> Ni> Pb. Total concentrations of Cd and Cu in some soils exceed the thresholds values for non-polluted soils. The most important heavy metals with regards to potential hazards in studied soils are Cu and Cd. These soils by their properties are still able to load with over concentrations of these metals and retained them since they do not reach their saturation capacities except for Cu and Cd in some areas. However, under bad management and agricultural activity (the continuous redox conditions) with continuous accumulation of these toxic metals in the environment, this region will be exposed to a real disaster. Cd and Pb are considered as the most important environmental pollutants which are quite toxic even at low concentration in agricultural soils because of the potential harmful effects (Onweremadu and Duruigbo, 2007; Yobouet et al., 2010). Lead is now considered a major environmental health hazard in both developed and developing countries. Lead is an important metal from the viewpoint of environmental toxicology (ATSDR, 1999). Lead measured exhibit the importance of the anthropogenic sources and particularly, the influence of global atmospheric inputs from leaded gasoline compared to regional and local industrial emissions. Its sources include lead smelter, battery manufacturer, paper and pulp industry, pipes, paints, solders, glass, pottery glazes, rubber, plastics, insecticides,
3
Nova Journal of Engineering and Applied Sciences Vol 2(3), Mar 2014: 1-15
boat and ship fuel and ammunition industry etc. Most lead processing industries are established in or around Bahr El-Baqar region and Gasoline used in gas stations also contained tetraethyl lead as an antiknock additive which contributes to soil contamination. The results of IMM (2003) emphasized the influence of leaded gasoline as a source of lead contamination in soil in areas of high vehicle traffic. The toxic effects of cadmium have received as much attention as those of lead. Its sources in the environment are metal plating, cadmium- nickel battery manufacture, phosphate fertilizers, paints and pigments manufacture, and alloy industries (Kadirvelu and Namasivayam, 2003). It can be found in reservoirs and soils because insecticides, fungicides, sludge, and commercial fertilizers that use cadmium are used in agriculture. Cigarettes also contain cadmium. Cadmium is a by-product of the mining and smelting of lead and zinc metallic nickel is produced from sulfide and silicate-oxide ores. Nickel is included in various metal alloys, stainless steels, and electroplating. Zinc fertilizers, sewage sludges and atmospheric dust of industrial origin are the principal sources of Zn accumulation in soils. Thus, these heavy metals were selected to represent as indictor on the pollution degree in this region.
Abdel-Azeem et al. (2007) reported that in soil of Bahr El-Baqar site irrigated with wastewater drain, soil profiles were characterized by slightly alkaline to alkaline pH values ranging between 7.8 and 9.2 while electric conductivity (EC) ranged between 4.4 and 206 dSm−1. Zn varied from 194 to 227 ppm, Cu ranged between 162 and 187.4 ppm, Mn content ranged between 736 and 1,122 ppm and Co content ranged between 180 and 330 ppm. Badawy, et al. (2013) concluded that the heavy metal concentrations of Al, Cr, Cu, Fe, Mn, Sr and Zn in Bahr El-Baqar site were above the safe limits of EU standard (European Union, 2002). The lower concentrations of Co, Ni and Mo than the safe limits might be due to the continuous removal of heavy metals by the food crops grown in this area and also due to leaching of heavy. Elevated levels of heavy metals in irrigation water led to significant increase of heavy metal contents in soil at Bahr El-Baqar site.
The present study was, therefore, carried out to examine the distribution of some important heavy metals from the Bahr El-Baqar region south of EL-Manzala Lake. Method:
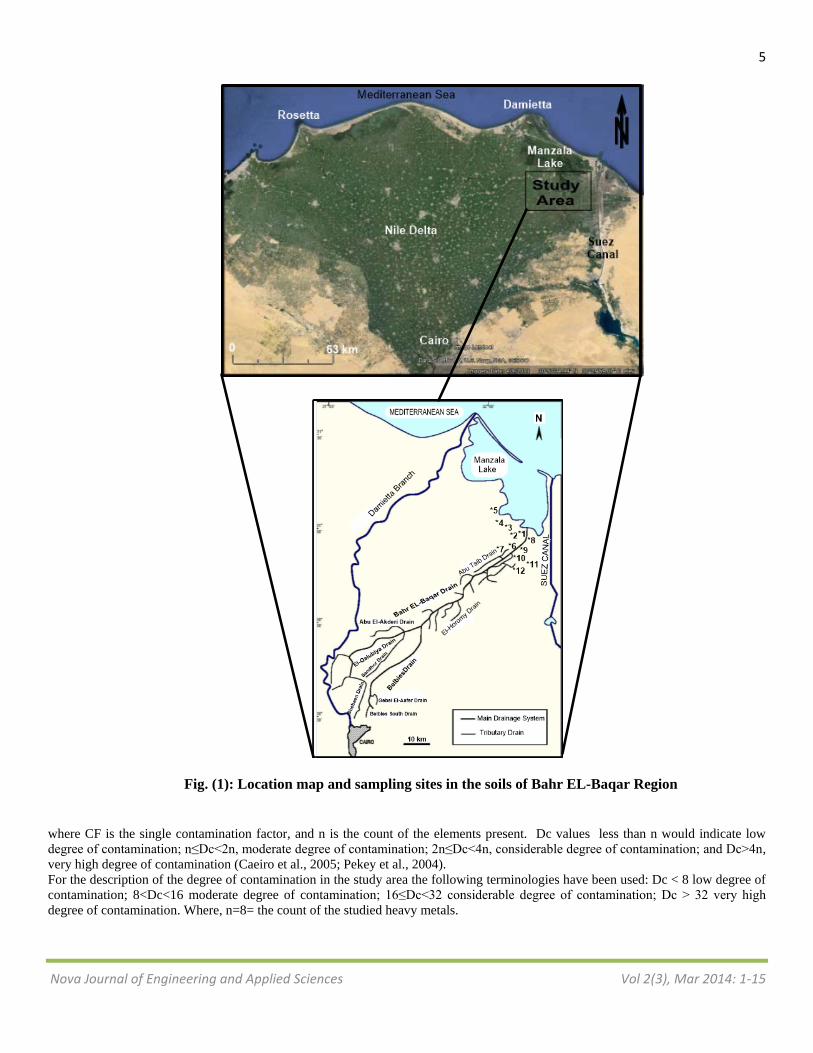
Study Area and Sampling: The samples were collected from 12 sites (Fig. 1) in spring season 2013, representing the soils of Bahr EL-Baqar region south of Manzala Lake. The sampling used topographic maps at a scale of 1:50,000, landsat images and GPS instruments.
Laboratory Analysis: The use of flame atomic absorption spectrometer is still regarded as the most convenient and appropriate technique for the purpose of heavy metal analysis in most cases. The soil samples were air dried, and then sieved to separate the < 63μm fraction. This fraction is used by several workers to eliminate the effect of particle size and to obtain a more homogeneous grain distribution (Duquesne et al., 2006). This fraction which consists of silt and clay is known to entrap most of the trace elements (Farkas et al.,2007). One gram of the powdered sample was digested with a mixture of . H2O2, HCl and HNO3 according to the method described by Page et al. (1982). Fe, ,Cu, Co, Ni, Zn, Pb, Cd and Cr were determined in the sample solution using atomic absorption spectrophotometry (Perkin Elmer, Model 2380).
Indices Calculations:
Enrichment Factor (EF): As proposed by Simex and Helz (1981), EF was employed to assess the degree of contamination and to understand the distribution of the elements of anthropogenic origin from sites by individual elements in sediments or EF is considered as an effective tool to evaluate the magnitude of contaminants in the environment (Franco-Uria et al., 2009) . Fe was chosen as the normalizing element (Loska et al., 2003; Kothai et al., 2009; Chakravarty and Patgiri, 2009; Seshan et al., 2010). Other widely used reference metal elements include Al or Mn (Nyangababo et al., 2005a; Kamaruzzaman et al., 2008; Ong and Kamaruzzaman, 2009). EF is considered as an effective tool to evaluate the magnitude of contaminants in the environment (Franco-Uria et al., 2009). To identify anomalous metal concentration, geochemical normalization of the heavy metals data to a conservative element, such as Fe was employed (Schiff and Weisberg 1999; Baptista et al. 2000; Mucha et al. 2003). The EF values < 2 indicate that the metal is entirely from crustal materials or natural processes; whereas EF values > 2 suggest that the sources are more likely to be anthropogenic (Angelidis and Aloupi 1997; Liaghati et al. 2003 and Ergin et al. 1991). In this study iron has also used as a conservative tracer to differentiate natural from anthropogenic components. (M/Fe) sample is the ratio of metal and Fe concentrations of the sample, and (M/Fe) crust is the ratio of metal and Fe concentrations of a background. where, M is the concentration of metal. The background value is that of average shale (Turekian and Wedepohl, 1961).
Enrichment factor = (M/Fe) sample / (M/Fe) background
4
Nova Journal of Engineering and Applied Sciences Vol 2(3), Mar 2014: 1-15
Elements which are naturally derived have an EF value of nearly unity, while elements of anthropogenic origin have EF values of several orders of magnitude. Six categories are recognized: ≤ 1 background concentration, 1- 2 depletion to minimal enrichment, 2 –5 moderate enrichment, 5 – 20 significant enrichment, 20 – 40 very high enrichment and > 40 extremely high enrichment (Sutherland, 2000). Enrichment factor (EF) can be used to differentiate between the metals originating from anthropogenic activities and those from natural procedure and to assess the degree of anthropogenic influence. As the EF values increase, the contributions of the anthropogenic origins also increase [Sutherland, 2000].
Contamination factor (CF) and Pollution load index (PLI) The level of contamination can be expressed by the contamination factor (CF); (Hökanson, 1980). The CF is the ratio obtained by dividing the concentration of each metal in the sediment by the baseline or Background value. The background value corresponds to the baseline concentrations reported by (Turekian and Wedepohl, 1961) and is based on element abundances in sedimentary rocks (shale). The following terminologies are used to describe the contamination factor: CF<1, low contamination factor; 1≤ CF <3, moderate contamination factors; 3≤ CF <6, considerable contamination factors; and CF ≥6, very high contamination factor.
The PLI proposed by Tomlinson et al. (1980) provide some understanding to the public of the area about the quantity of a component in the environment. The PLI of a single site is the nth root of n number of multiplied together Contamination factor (CF) values. A PLI value of zero indicates perfection, a value of one indicates the presence of only baseline levels of pollutants, and values above one would indicate progressive deterioration of the site and estuarine quality (Tomlinson et al., 1980). The PLI value > 1 is polluted whereas PLI value < 1 indicates no pollution (Chakravarty and Patgiri, 2009; Seshan et al., 2010).
PLI = (CF1 × CF2 × CF3 ×······ ×CFn)1/n
Where, n is the number of metals (seven in the present study) and CF is the contamination factor.
Degree of contamination (Dc):
Another index that can be derived from the CF values is the Degree of contamination (Dc) defined as the sum of all contamination factors for a given site (Hökanson, 1980):
Dc= ∑ 𝑪𝑭𝒏𝟏
5
Nova Journal of Engineering and Applied Sciences Vol 2(3), Mar 2014: 1-15
Fig. (1): Location map and sampling sites in the soils of Bahr EL-Baqar Region
where CF is the single contamination factor, and n is the count of the elements present. Dc values less than n would indicate low degree of contamination; n≤Dc<2n, moderate degree of contamination; 2n≤Dc<4n, considerable degree of contamination; and Dc>4n, very high degree of contamination (Caeiro et al., 2005; Pekey et al., 2004). For the description of the degree of contamination in the study area the following terminologies have been used: Dc < 8 low degree of contamination; 8<Dc<16 moderate degree of contamination; 16≤Dc<32 considerable degree of contamination; Dc > 32 very high degree of contamination. Where, n=8= the count of the studied heavy metals.
6
Nova Journal of Engineering and Applied Sciences Vol 2(3), Mar 2014: 1-15
Results and Discussion
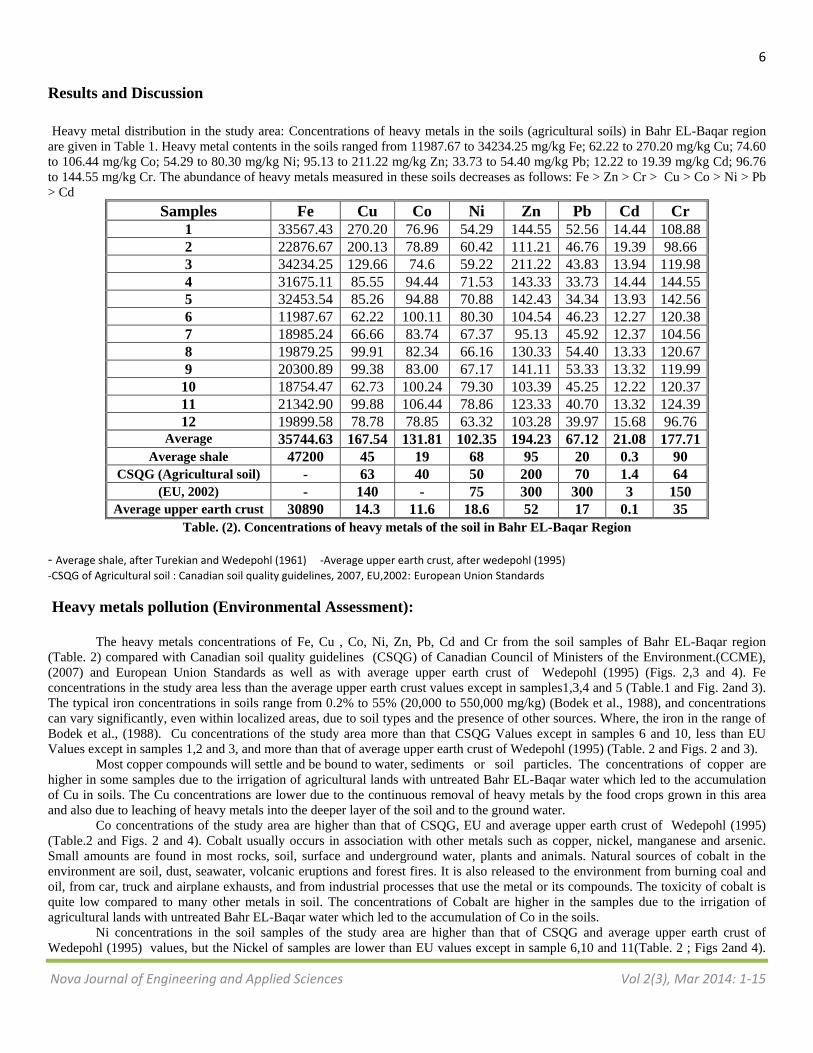
Heavy metal distribution in the study area: Concentrations of heavy metals in the soils (agricultural soils) in Bahr EL-Baqar region are given in Table 1. Heavy metal contents in the soils ranged from 11987.67 to 34234.25 mg/kg Fe; 62.22 to 270.20 mg/kg Cu; 74.60 to 106.44 mg/kg Co; 54.29 to 80.30 mg/kg Ni; 95.13 to 211.22 mg/kg Zn; 33.73 to 54.40 mg/kg Pb; 12.22 to 19.39 mg/kg Cd; 96.76 to 144.55 mg/kg Cr. The abundance of heavy metals measured in these soils decreases as follows: Fe > Zn > Cr > Cu > Co > Ni > Pb > Cd
Samples Fe Cu Co Ni Zn Pb Cd Cr 1 33567.43 270.20 76.96 54.29 144.55 52.56 14.44 108.88 2 22876.67 200.13 78.89 60.42 111.21 46.76 19.39 98.66 3 34234.25 129.66 74.6 59.22 211.22 43.83 13.94 119.98 4 31675.11 85.55 94.44 71.53 143.33 33.73 14.44 144.55 5 32453.54 85.26 94.88 70.88 142.43 34.34 13.93 142.56 6 11987.67 62.22 100.11 80.30 104.54 46.23 12.27 120.38 7 18985.24 66.66 83.74 67.37 95.13 45.92 12.37 104.56 8 19879.25 99.91 82.34 66.16 130.33 54.40 13.33 120.67 9 20300.89 99.38 83.00 67.17 141.11 53.33 13.32 119.99
10 18754.47 62.73 100.24 79.30 103.39 45.25 12.22 120.37 11 21342.90 99.88 106.44 78.86 123.33 40.70 13.32 124.39 12 19899.58 78.78 78.85 63.32 103.28 39.97 15.68 96.76
Average 35744.63 167.54 131.81 102.35 194.23 67.12 21.08 177.71 Average shale 47200 45 19 68 95 20 0.3 90
CSQG (Agricultural soil) - 63 40 50 200 70 1.4 64 (EU, 2002) - 140 - 75 300 300 3 150
Average upper earth crust 30890 14.3 11.6 18.6 52 17 0.1 35 Table. (2). Concentrations of heavy metals of the soil in Bahr EL-Baqar Region
- Average shale, after Turekian and Wedepohl (1961) -Average upper earth crust, after wedepohl (1995) -CSQG of Agricultural soil : Canadian soil quality guidelines, 2007, EU,2002: European Union Standards Heavy metals pollution (Environmental Assessment):
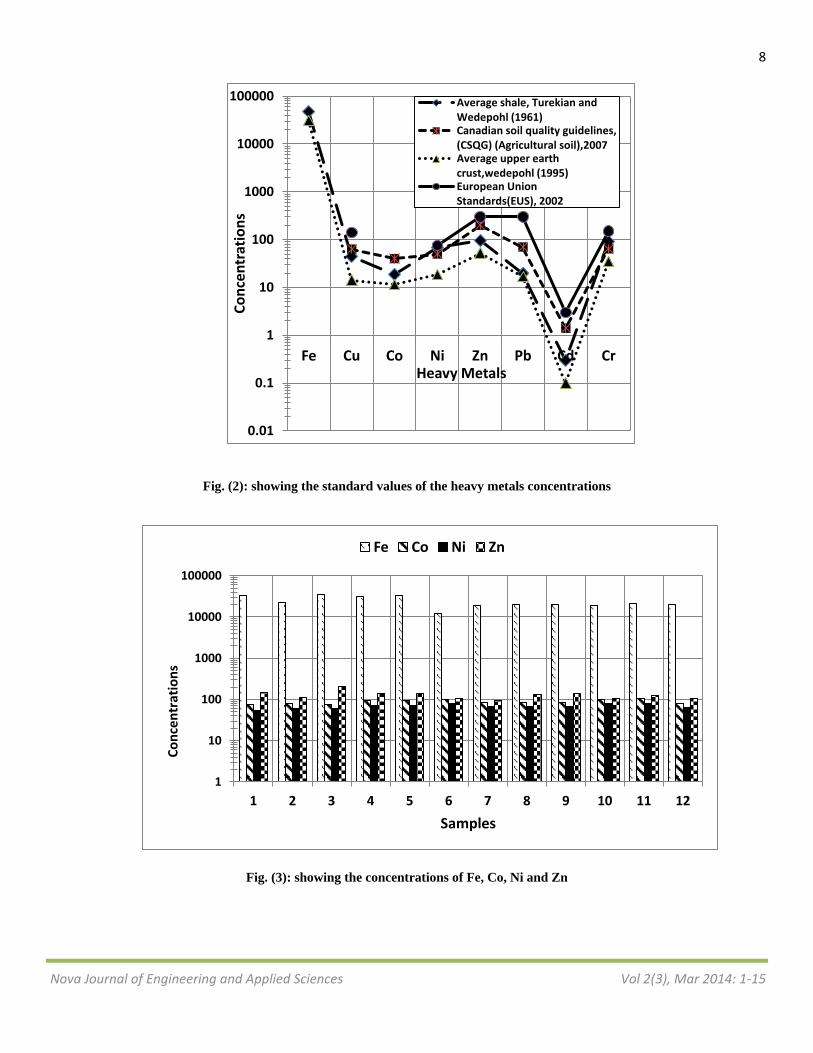
The heavy metals concentrations of Fe, Cu , Co, Ni, Zn, Pb, Cd and Cr from the soil samples of Bahr EL-Baqar region
(Table. 2) compared with Canadian soil quality guidelines (CSQG) of Canadian Council of Ministers of the Environment.(CCME), (2007) and European Union Standards as well as with average upper earth crust of Wedepohl (1995) (Figs. 2,3 and 4). Fe concentrations in the study area less than the average upper earth crust values except in samples1,3,4 and 5 (Table.1 and Fig. 2and 3). The typical iron concentrations in soils range from 0.2% to 55% (20,000 to 550,000 mg/kg) (Bodek et al., 1988), and concentrations can vary significantly, even within localized areas, due to soil types and the presence of other sources. Where, the iron in the range of Bodek et al., (1988). Cu concentrations of the study area more than that CSQG Values except in samples 6 and 10, less than EU Values except in samples 1,2 and 3, and more than that of average upper earth crust of Wedepohl (1995) (Table. 2 and Figs. 2 and 3).
Most copper compounds will settle and be bound to water, sediments or soil particles. The concentrations of copper are higher in some samples due to the irrigation of agricultural lands with untreated Bahr EL-Baqar water which led to the accumulation of Cu in soils. The Cu concentrations are lower due to the continuous removal of heavy metals by the food crops grown in this area and also due to leaching of heavy metals into the deeper layer of the soil and to the ground water.
Co concentrations of the study area are higher than that of CSQG, EU and average upper earth crust of Wedepohl (1995) (Table.2 and Figs. 2 and 4). Cobalt usually occurs in association with other metals such as copper, nickel, manganese and arsenic. Small amounts are found in most rocks, soil, surface and underground water, plants and animals. Natural sources of cobalt in the environment are soil, dust, seawater, volcanic eruptions and forest fires. It is also released to the environment from burning coal and oil, from car, truck and airplane exhausts, and from industrial processes that use the metal or its compounds. The toxicity of cobalt is quite low compared to many other metals in soil. The concentrations of Cobalt are higher in the samples due to the irrigation of agricultural lands with untreated Bahr EL-Baqar water which led to the accumulation of Co in the soils.
Ni concentrations in the soil samples of the study area are higher than that of CSQG and average upper earth crust of Wedepohl (1995) values, but the Nickel of samples are lower than EU values except in sample 6,10 and 11(Table. 2 ; Figs 2and 4).
7
Nova Journal of Engineering and Applied Sciences Vol 2(3), Mar 2014: 1-15
Nickel occurs naturally in soils as a result of the weathering of the parent rock (McGrath, 1995).The underlying geology and soil-forming processes strongly influence the amount of nickel in soils with higher median concentrations reported in clays, silts, and fine grained loams relative to coarser grained loams, sandy and peaty soils (kabata-Pendias and Mukherjee, 2007; McGrath, 1995). agricultural fertilisers, especially phosphates, are also a significant source of nickel in soil but it is unlikely to build-up in soil in the long term from their use (McGrath, 1995). The irrigation by Bahr El-Baqar wastewater and uses of agricultural fertilizers led to the increasing the Ni concentrations.
Zn concentrations of the study area are lower than that of CSQG, EU except in sample 3 and the Zn concentrations are higher than the average upper earth crust values of Wedepohl (1995) (Table.2 and Figs. 2 and 3). It is released to the environment from both natural and anthropogenic sources; however, releases from anthropogenic sources are greater than those from natural sources. The most important sources of anthropogenic zinc in soil come from discharges of smelter slags and wastes, mine tailings, coal and bottom fly ash, and the use of commercial products such as fertilizers and wood preservatives that contain zinc. Zinc does not volatilize from soil. Although zinc usually remains adsorbed to soil, leaching has been reported at waste disposal sites. The lower concentrations of the Zn than the safe limits of CSQG and EU at most sites might be due to the continuous removal of heavy metals by the food crops grown in this area and also due to leaching of heavy metals into the deeper layer of the soil and to the ground water.
Pb concentrations of the study area are lower than that of CSQG, EU and higher than the average upper earth crust values of Wedepohl (1995) (Table.2 and Figs. 2 and 4). Lead particles are deposited in the soil from flaking lead paint, from incinerators (and similar sources), and from motor vehicles that use leaded gasoline. Waste disposal is also a factor. Urban environments in general have received higher depositions of lead from vehicular emissions than have rural areas. When lead is deposited in soil from anthropogenic sources, it does not biodegrade or decay and is not rapidly absorbed by plants, so it remains in the soil at elevated levels. Lead is toxic to humans, and poisoning can occur either through ingestion of lead or by breathing in lead dust. Both long-term low-dose and short-term high-dose exposure can permanently damage the nervous, renal (kidney), and hematopoietic (blood-forming) systems. The concentrations of Lead is lower due to the study area has a little sources of Lead, where little vehicles and populations.
Cd concentrations of the study area are higher than that of CSQG, EU and average upper earth crust of Wedepohl (1995) (Table.2 and Figs. 2 and 4). Cadmium (Cd) is regarded as one of the most toxic trace elements in the environment.
Cadmium occurs naturally in soils as a result of the weathering of the parent rock (Alloway, 1995). Although most natural soils contain less than 1 mg kg-1 cadmium from the weathering of parent materials, those developed on black shales and those associated with mineralised deposits can have much higher levels (Alloway, 1995). Anthropogenic sources of cadmium are much more significant than natural emissions and account for its ubiquitous presence in soil (Alloway, 1995; ECB, 2007; ATSDR, 2008). Cadmium is a trace element in phosphatic fertilizers. Atmospheric deposition is also an important source of cadmium pollution (Alloway, 1995; ECB, 2007; ATSDR, 2008). Cadmium is much less mobile in soils than in air and water.
Cadmium strongly adsorbs to organic matter in soils. When cadmium is present in soils it can be extremely dangerous, as the uptake through food will increase. Sedimentary rocks contain greater concentrations of Cd than either igneous or metamorphic rocks, and therefore, recent soils derived from sedimentary rock should contain greater concentrations of Cd than those derived from igneous or metamorphic rocks. Among the commercial fertilizers, phosphorus fertilizers contain somewhat elevated levels of Cd. The fact that highly weathered soils are somewhat depleted in Cd suggest that greater quantities of Cd are removed by Crops and leaching than are added through fertilization and atmospheric deposition. Surface soils commonly contain higher concentrations of Cd than subsurface horizons. The higher concentrations of Cd in surface horizons are probably due to the cycling of Cd from lower depths to the surface by plants Page et al (1987). Cadmium is higher in the study area due to the uses of phosphatic fertilizers, irrigation by untreated wastewater of Bahr EL-Baqar Darin and due to the soils of the study area are recent and derived from sediments (sand, silt and clay).
Cr concentrations of the study area are higher than that of CSQG and average upper earth crust of Wedepohl (1995) and lower than EU values (Table.2 and Figs. 2 and 4). Chromium occurs naturally in the Earth’s crust and can be detected in all environmental media. The continental dust flux is the main natural source of chromium in the atmosphere, but much larger amounts are released by human activities. These include metal industries, the combustion of coal and oil, cement works, waste incineration, and fugitive emissions from road dusts. At many industrial and waste disposal locations, chromium has been released to the environment via leakage and poor storage during manufacturing or improper disposal practices (Palmer and Wittbrodt, 1991;Calder, 1988). Chromium concentrations are higher in some sites due to irrigation by untreated wastewater of Bahr EL-Baqar drain and the study area near from the waste incinerations and fugitive emissions from industrial sites in port said and around the Cairo Ismailia road. Chromium may be lower in some sites due to the continuous removal of heavy metals by the food crops grown in this area and also due to leaching of heavy metals into the deeper layer of the soil and to the ground water.
8
Nova Journal of Engineering and Applied Sciences Vol 2(3), Mar 2014: 1-15
Fig. (2): showing the standard values of the heavy metals concentrations
Fig. (3): showing the concentrations of Fe, Co, Ni and Zn
0.01
0.1
1
10
100
1000
10000
100000
Fe Cu Co Ni Zn Pb Cd Cr
Conc
entr
atio
ns
Heavy Metals
Average shale, Turekian and Wedepohl (1961) Canadian soil quality guidelines, (CSQG) (Agricultural soil),2007 Average upper earth crust,wedepohl (1995) European Union Standards(EUS), 2002
1
10
100
1000
10000
100000
1 2 3 4 5 6 7 8 9 10 11 12
Conc
entr
atio
ns
Samples
Fe Co Ni Zn
9
Nova Journal of Engineering and Applied Sciences Vol 2(3), Mar 2014: 1-15
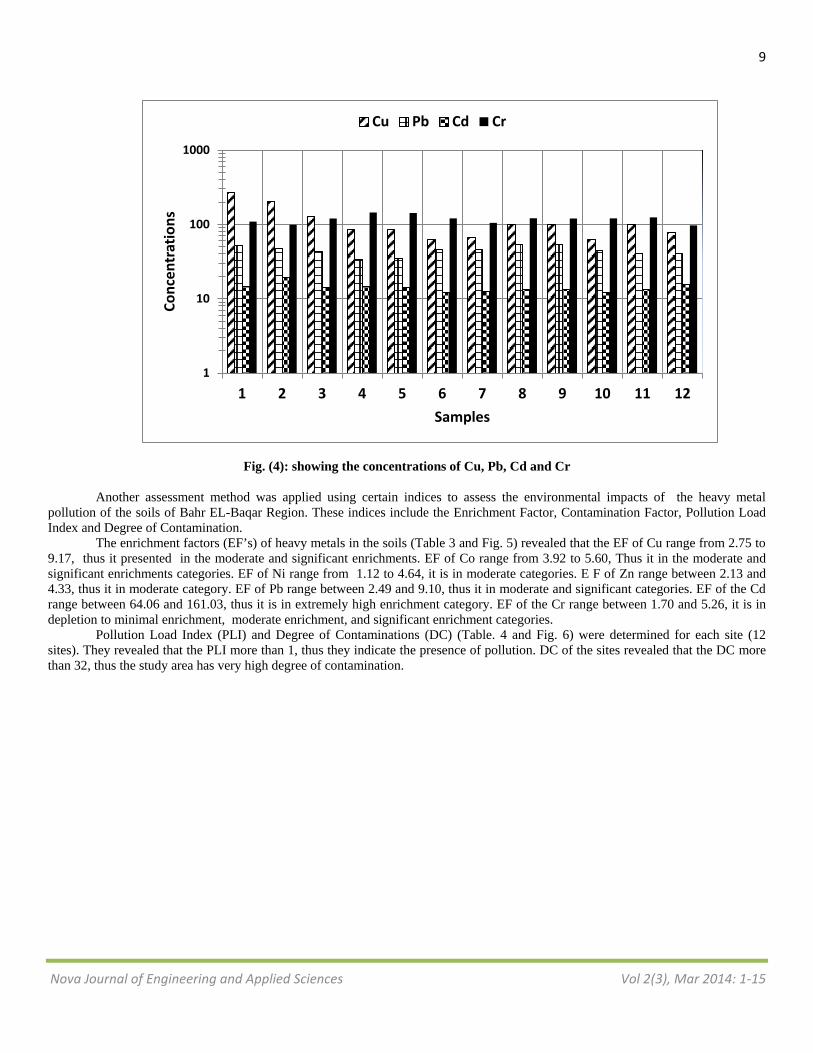
Fig. (4): showing the concentrations of Cu, Pb, Cd and Cr
Another assessment method was applied using certain indices to assess the environmental impacts of the heavy metal pollution of the soils of Bahr EL-Baqar Region. These indices include the Enrichment Factor, Contamination Factor, Pollution Load Index and Degree of Contamination.
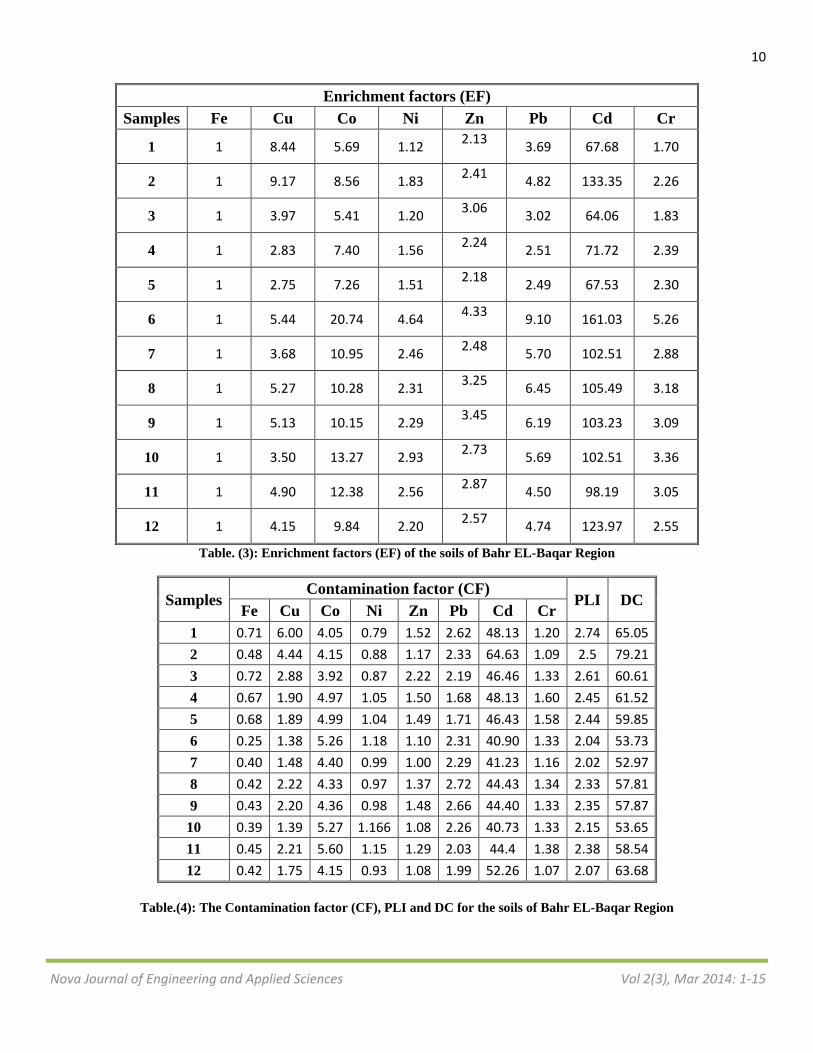
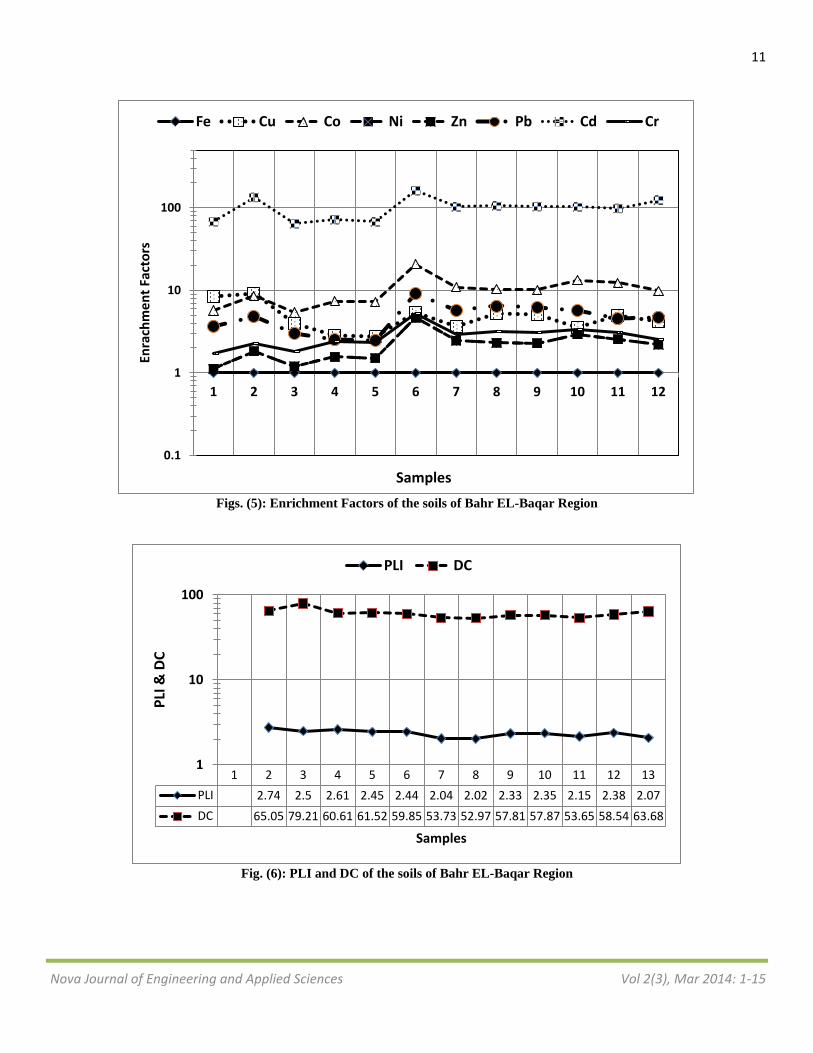
The enrichment factors (EF’s) of heavy metals in the soils (Table 3 and Fig. 5) revealed that the EF of Cu range from 2.75 to 9.17, thus it presented in the moderate and significant enrichments. EF of Co range from 3.92 to 5.60, Thus it in the moderate and significant enrichments categories. EF of Ni range from 1.12 to 4.64, it is in moderate categories. E F of Zn range between 2.13 and 4.33, thus it in moderate category. EF of Pb range between 2.49 and 9.10, thus it in moderate and significant categories. EF of the Cd range between 64.06 and 161.03, thus it is in extremely high enrichment category. EF of the Cr range between 1.70 and 5.26, it is in depletion to minimal enrichment, moderate enrichment, and significant enrichment categories.
Pollution Load Index (PLI) and Degree of Contaminations (DC) (Table. 4 and Fig. 6) were determined for each site (12 sites). They revealed that the PLI more than 1, thus they indicate the presence of pollution. DC of the sites revealed that the DC more than 32, thus the study area has very high degree of contamination.
1
10
100
1000
1 2 3 4 5 6 7 8 9 10 11 12
Conc
entr
atio
ns
Samples
Cu Pb Cd Cr
10
Nova Journal of Engineering and Applied Sciences Vol 2(3), Mar 2014: 1-15
Enrichment factors (EF) Samples Fe Cu Co Ni Zn Pb Cd Cr
1 1 8.44 5.69 1.12 2.13 3.69 67.68 1.70
2 1 9.17 8.56 1.83 2.41 4.82 133.35 2.26
3 1 3.97 5.41 1.20 3.06 3.02 64.06 1.83
4 1 2.83 7.40 1.56 2.24 2.51 71.72 2.39
5 1 2.75 7.26 1.51 2.18 2.49 67.53 2.30
6 1 5.44 20.74 4.64 4.33 9.10 161.03 5.26
7 1 3.68 10.95 2.46 2.48 5.70 102.51 2.88
8 1 5.27 10.28 2.31 3.25 6.45 105.49 3.18
9 1 5.13 10.15 2.29 3.45 6.19 103.23 3.09
10 1 3.50 13.27 2.93 2.73 5.69 102.51 3.36
11 1 4.90 12.38 2.56 2.87 4.50 98.19 3.05
12 1 4.15 9.84 2.20 2.57 4.74 123.97 2.55
Table. (3): Enrichment factors (EF) of the soils of Bahr EL-Baqar Region
Samples Contamination factor (CF)
PLI DC Fe Cu Co Ni Zn Pb Cd Cr
1 0.71 6.00 4.05 0.79 1.52 2.62 48.13 1.20 2.74 65.05 2 0.48 4.44 4.15 0.88 1.17 2.33 64.63 1.09 2.5 79.21 3 0.72 2.88 3.92 0.87 2.22 2.19 46.46 1.33 2.61 60.61 4 0.67 1.90 4.97 1.05 1.50 1.68 48.13 1.60 2.45 61.52 5 0.68 1.89 4.99 1.04 1.49 1.71 46.43 1.58 2.44 59.85 6 0.25 1.38 5.26 1.18 1.10 2.31 40.90 1.33 2.04 53.73 7 0.40 1.48 4.40 0.99 1.00 2.29 41.23 1.16 2.02 52.97 8 0.42 2.22 4.33 0.97 1.37 2.72 44.43 1.34 2.33 57.81 9 0.43 2.20 4.36 0.98 1.48 2.66 44.40 1.33 2.35 57.87
10 0.39 1.39 5.27 1.166 1.08 2.26 40.73 1.33 2.15 53.65 11 0.45 2.21 5.60 1.15 1.29 2.03 44.4 1.38 2.38 58.54 12 0.42 1.75 4.15 0.93 1.08 1.99 52.26 1.07 2.07 63.68
Table.(4): The Contamination factor (CF), PLI and DC for the soils of Bahr EL-Baqar Region
11
Nova Journal of Engineering and Applied Sciences Vol 2(3), Mar 2014: 1-15
Figs. (5): Enrichment Factors of the soils of Bahr EL-Baqar Region
Fig. (6): PLI and DC of the soils of Bahr EL-Baqar Region
0.1
1
10
100
1 2 3 4 5 6 7 8 9 10 11 12
Enra
chm
ent F
acto
rs
Samples
Fe Cu Co Ni Zn Pb Cd Cr
1 2 3 4 5 6 7 8 9 10 11 12 13 PLI 2.74 2.5 2.61 2.45 2.44 2.04 2.02 2.33 2.35 2.15 2.38 2.07 DC 65.05 79.21 60.61 61.52 59.85 53.73 52.97 57.81 57.87 53.65 58.54 63.68
1
10
100
PLI &
DC
Samples
PLI DC
12
Nova Journal of Engineering and Applied Sciences Vol 2(3), Mar 2014: 1-15
These conclusions will stand against those people supporting the use of polluted drain water for irrigation in Bahr EL-Baqar Region. Where, the irrigation water must be treated. The following conclusions are in partial agreement with many authors such as Omran and Abd El Razek, (2012) and Badawy, et al. (2013). From previous discussion, the conclusions are:-
1- The abundance of heavy metals measured in these soils decreases as follows: Fe > Zn > Cr > Cu > Co > Ni > Pb > Cd 2- The most important heavy metals with regards to potential hazards in studied soils are Cu, Pb and Cd. Where, Cu and Pb
have the moderate and significant enrichments and EF of the Cd has extremely high enrichment 3- The concentrations of copper are higher in some samples due to the irrigation of agricultural lands with untreated Bahr
EL-Baqar water which led to the accumulation of Cu in soils. The Cu concentrations are lower due to the continuous removal of heavy metals by the food crops grown in this area and also due to leaching of heavy metals into the deeper layer of the soil and to the ground water.
4- Cadmium is higher in the study area due to the uses of phosphatic fertilizers, irrigation by untreated wastewater of Bahr EL-Baqar Darin and due to the soils of the study area are recent and derived from sediments (sand, silt and clay). The toxic effects of cadmium have received as much attention as those of lead
5- The concentrations of Lead is lower due to the study area has a little sources of Lead, where little vehicles and populations
6- The concentrations of Cobalt and Nickel are higher in the samples due to the irrigation of agricultural lands with untreated Bahr EL-Baqar water and uses of agricultural fertilizers
7- The lower concentrations of the Zn than the safe limits of CSQG and EU at most sites might be due to the continuous removal of heavy metals by the food crops grown in this area and also due to leaching of heavy metals into the deeper layer of the soil and to the ground water.
8- Chromium concentrations are higher in some sites due to irrigation by untreated wastewater of Bahr EL-Baqar drain and the study area near from the waste incinerations and fugitive emissions from industrial sites in port said and around the Cairo Ismailia road. Chromium may be lower in some sites due to the continuous removal of heavy metals by the food crops grown in this area and also due to leaching of heavy metals into the deeper layer of the soil and to the ground water.
References Abdel-Azeem, A.M., T.S.Abdel-Moneim, M.E. Ibrahim, M.A. Hassan and Saleh, M.Y.(2007). Effects of Long-Term Heavy Metal Contamination on Diversity of Terricolous Fungi and Nematodes in Egypt -A Case Study. Water Air Soil Pollut, 186: 233-254. Abdel-Shafy, H.I. and Aly, R.O. (2002), "Water Issue in Egypt Resources, Pollution and Protection Endeavors", Central European J. Occupational and Environmental Medicine, 8 (1), pp. 3-21. Abu ZM (2011). Egyptian policies for using low quality water for irrigation. Wat. Res. Center- Cairo – Egypt. http://www.docstoc .com/docs/68231841/Egyptian-policies-for-using-low-quality-water-fo-irrigation. Ali OM, El-Sikhry EM and El-Farghal WM (1993). Effect of prolonged use of Bahr El-Baqar Drain water for irrigation on the total heavy metals content of south Port Said-Soils. Proc. 1st. Conf. Egypt. Hung. Environ. Egypt, pp. 53-57. ALLOWAY, B.J., (1995). Cadmium. InHeavy Metals in Soils (2nd edn.) (ed. B.J. Alloway). London: Blackie Academic & Professional. Angelidis, M.O. and M. Aloupi (1997). Assessment of metal contamination in shallow coastal sediments around Mytilene, Greece. International Journal of Environmental Analytical Chemistry, 68: (2), 281-293. ATSDR (1999). Toxicological Profile for Lead (Final Report). Agency for Toxic Substances and Disease Registry. http://www.atsdr.cdc.gov/toxprofiles/tp13. ATSDR, (2008). Draft toxicological profile for cadmium Atlanta: US Department of Health and Human Services, Agency for Toxic Substances and Disease Registry. Available from: http://www.atsdr.cdc.gov/toxprofiles/tp5-p.pdf [Accessed June 2009]
13
Nova Journal of Engineering and Applied Sciences Vol 2(3), Mar 2014: 1-15
Badawy,R.K., Abd El-Gawad, A.M. and Osman, H.E. (2013). Health risks assessment of heavy metals and microbial Contamination in water, soil and agricultural foodstuff from wastewater irrigation at Sahl El-Hessania area, Egypt. Journal of Applied Sciences Research, 9(4): 3091-3107, 2013 ISSN 1819-544X Baptista, N.J.A., B.J. Smith and J.J.and McAllister, (2000). Heavy metals concentrations in surface sediments in a near shore environment, Jurujuba Sound, Southeast Brazil. Environmental Pollution., 109: 1-9. Bodek, I., Lyman, W. J., Reehl, W. F., and D.H. Rosenblatt. (1988). Environmental Inorganic Chemistry: Properties, Processes, and Estimation Methods. SETAC Special Publication Series, B.T. Walton and R.A. Conway, editors. Pergamon Press. New York. Caeiro, S., Costa, M. H. and Ramos, T. B. (2005). Assessing Heavy Metal Contamination in Sado Estuary Sediment: An Index Analysis Approach. Ecological Indicators, 5: 151–169 Calder,L.M.,(1988). “Chromium Contamination of Groundwater”In: Chromium in the Natural and Human Environments. Vol. 20 (J.O. Nriagu and E.Nieboer, editors). John Wiley& Sons,NewYork:215 through 230. Canadian Soil Quality Guidelines (CSQG), (2007). Canadian soil quality guidelines (CSQG) for the protection of environmental and human health: Summary tables. Updated September, 2007. In: Canadian environmental quality guidelines, 1999, Canadian Council of Ministers of the Environment, Winnipeg.by Canadian Council of Ministers of the Environment.(CCME). Chakravarty, M. and Patgiri, A. D., (2009). Metal pollution assessment in sediments of the Dikrong River, NE India. J. Hum. Ecol., 27 (1), 63-67 (5 pages). Duquesne, S., Newton, L. C., Giusti, L., Marriott, S. B., Stark, A. J. and Bird, D. J. (2006). Evidence for declining levels of heavy metals in the Severn Estuary and Bristol Channel, U.K., and their spatial distribution in sediments. Environ. Pollut, 143, 187-196. ECB, (2007). European Union Risk Assessment Report. Cadmium oxide and cadmium metal, Part 1 – environment. Volume 72. EUR 22919EN. Luxembourg: Office for Official Publications of the European Communities. Available from: http://ecb.jrc.ec.europa.eu/documents/ExistingChemicals/RISK_ASSESSMENT/REPORT/cdmetal_cdo xideENVreport302.pdf [Accessed June 2009]. El-Eweddy, E.A.I., (2000). Factors Affecting the Accumulation Rate of Pollutants in Desert Soils under the Condition of Irrigation with El-Salam Canal Waters, Ph.D. Thesis, Agricultural Sciences, Minufiya University. Ergin, M., C. Saydam, O. Basturk, E. Erdem and R. Yoruk, (1991). Heavy metal concentrations in surface sediments from the two coastal inlets (Golden Horn Estuary and Izmit Bay) of the Northeastern Sea of Marmara. Chemical Geology, 91: 269-285. European Union, (2002). Heavy Metals in Wastes, European Commission on Environment. http://ec.europa.eu/environment/waste/studies/pdf/ heavymetalsreport.pdf Ezzat AI (1989). Studies on phytoplankton in some polluted areas of Lake Manzala. Bull. Nat. Inst. Ocean Fish, A.R.E., 15: 1-19. Farkas, A., Erratico, C. and Vigano, L. (2007). Assessment of the environmental significance of heavy metal pollution in surficial sediments of the River Po. Chemosphere, 68, 761-768. Franco-Uria, A.; Lopez-Mateo, C.; Roca, E.; and Fernandez- Marcos, M. L., (2009). Source identification of heavy metals in pasture land by multivariate analysis in NW Spain. J. Hazard. Mater., 165 (1-3), 1008-1015 (8 pages). Håkanson, L., (1980). An Ecological Risk Index for Aquatic Pollution Control: A Sedimentological Approach. Water Research, 14: 975–1001 IMM (2003). Contaminación por Metales en suelo. In: Informe Ambiental de Montevideo. Intendencia Municipal de Montevideo, Documentos de Desarrollo Ambiental. http://www. Montevideo .gub.uy/ambiente/documentos/infoamb03c.
14
Nova Journal of Engineering and Applied Sciences Vol 2(3), Mar 2014: 1-15
Kadirvelu K and Namasivayam , C. (2003). Activated carbon from coconut coirpith as metal adsorbent: adsorption of Cd(II) from aqueous solution. Adv. Environ. Res. 7:471-478. Kamaruzzaman, M. C.; Ong, M. S.; Noor, A.; Shahbudin, S. and Jalal, K. C. A., (2008). Geochemistry of sediment in the major estuarine mangrove forest of Terengganu Region, Malaysia. Am. J. Appl. Sci., 5 (12), 1707-1712 (6 pages). Khalil MT (1985). The effect of sewage and pollutional wastes upon Bahr El-Baqar Drain and the southern area of Lake Manzala, Egypt. Egypt. J. Wil Nat. Resourc. 6:162-171. Kothai, P.; Prathibha, P.; Saradhi, I. V.; Pandit, G. G. and Puranik, V. D., (2009). Characterization of atmospheric particulate matter using pixe technique. Int. J. Environ. Sci. Eng., 1 (1), 27 - 30 (4 pages). Liaghati, T., M. Preda and M. Cox, (2003). Heavy metal distribution and controlling factors within coastal plain sediments, Bells Creek catchments, southeast Queensland, Australia. Environment International., 29: 935- 948 Loska, K.; Wiechula, D.; Barska, B.; Cebula, E. and Chojnecka, A., (2003). Assessment of arsenic enrichment of cultivated soils in Southern Poland. Pol. J. Environ. Stud., 12 (2), 187 – 192 (6 pages). McGRATH, S. P., (1995). Nickel. In Heavy Metals in Soils (2nd edn.) (ed. B.J. Alloway). London: Blackie Academic & Professional. Mucha, A.P., M.T.S.D. Vasconcelos and Bordalo, A.A. (2003). Macrobenthic community in the Doura estuary: relations with trace metals and natural sediment characteristics. Environmental Pollution., 121: 169-180. Nyangababo, J. T.; Henry, E. and Omutange, E., (2005a). Lead, cadmium, copper, manganese and zinc in wetland waters of Victoria Lake Basin, East Africa. Bull. Environ. Contam. Toxicol., 74 (5), 1003-1010 (8 pages). Omran, E.E. and Abd El Razek, A.A.(2012). Mapping and screening risk assessment of heavy metals concentrations in soils of the Bahr El-Baker Region, Egypt . Journal of Soil Science and Environmental Management Vol. 6(7), pp. 182-195, Available online at http://www.academicjournals.org/JSSEM,ISSN 2141-2391 Onweremadu EU, and Duruigbo CI (2007). Assessment of Cd concentration of crude oil pollution arable soils. Int. J. Environ. Sci. Technol. 4:409-412 Ong, M. C. and Kamaruzzaman, B. Y., (2009). An assessment of metal (Pb and Cu) contamination in bottom sediments from South China Sea coastal waters, Malaysia. Am. J. Appl. Sci., 6 (7), 1418-1423 (6 pages). Page, A. L., R. H. Miller and D. R. Kenney, (editors). (1982). Heavy metals determination. In: Methods of Soil Analysis, Part 2, Chemical and Microbiological Properties. American Society of Agronomy, Madison, WI, USA. 8 pp. Page, A.L.; Chang, A.C. and EL-Amamy, M. (1987). Cadmium Levels in Soils and Crops in the United States (Chapter 10). Dept.of Soil and Environmental Sciences, University of California, Riverside, CA 92521 Palmer,C.D. and Wittbrodt, P.R. (1991). “Processes Affecting the Remediation of Chromium-Contaminated sites.” Environmental Health Perspectives. Vol. 92.Pages 25 through 40. Park JH, and Shin WS (2006). Immobilization of Pb contamined soil using Modified clay. Water Practice Technol. 1:1-10. Pekey, H., Karakaş, D., and Ayberk, S. (2004). Ecological Risk Assessment Using Trace Elements from Surface Sediments of İzmit Bay (Northeastern Marmara Sea) Turkey. Marine Pollution Bulletin, 48: 946–953 Rashed IG, and Holmes PG (1984). Chemical survey of Bahr El Bakar Drain system and its effects on Manzala Lake. In: Proceedings of the 2nd Egyptian Congress of Chemical Engineering. Cairo, Egypt, March 18-20, pp. 1-10 Saad AK (1997). Environmental hydrogeologic impacts groundwater withdrawal in the eastern Nile Delta region with emphasis on groundwater pollution potential. Ph. D. Thesis, Institute of Environmental Studies. Ain Shams Univ. p. 232.
15
Nova Journal of Engineering and Applied Sciences Vol 2(3), Mar 2014: 1-15
Schiff, K. C. and Weisberg, S. B., (1999). Iron as a reference element for determining trace metal enrichment in Southern California costal shelf sediments. Mar. Environ. Res., 48 (2), 161-176 (16 pages). Seshan, B. R. R.; Natesan, U. and Deepthi, K., (2010). Geochemical and statistical approach for evaluation of heavy metal pollution in core sediments in southeast coast of India. Int. J. Environ. Sci. Tech., 7 (2), 291-306 (16 pages). Simex, S. A. and Helz, G. R., (1981). Regional geochemistry of trace elements in Chesapeake Bay. Environ. Geo., 3 , 315- 323 (9 pages). Sutherland, R. A., (2000). Bed sediment associated trace metals in an urban stream Oahu. Hawaii. Environ. Geo., 39 (6), 611-627 (17 pages). Taha AA, El-Mahmoudi AS, and El-Haddad IM (2004). Pollution sources and related environmental impacts in the new communities southeast Nile delta, Egypt. Emirates J. Eng. Res. 9(1):35-49. Tomilson, D. C.; Wilson, D. J.; Harris, C. R.; and Jeffrey, D. W., (1980). Problem in assessment of heavy metals in estuaries and the formation of pollution index. Helgol. Wiss. Meeresunlter, 33 (1-4), 566-575 (10 pages). Turekian, K. K. and Wedepohl, K. H., (1961). Distribution of the elements in some major units of the earth’s crust. Geo. Soc. Am. Bull., 72 (2), 175-192 (13 pages). Wedepohl, K.H. (1995). The composition of the continental crust. Geochimica et Cosmochimica Acta 59: 1,217-1,239. doi: 10.1016/0016-7037(95)00038-2. Yobouet YA, Adouby K, Trokourey A, and Yao B (2010). Cadmium, Copper, Lead and Zinc speciation in contaminated soils. Int. J. Eng. Sci. Technol. 2:802-812.