Spatial and temporal variability of denitrification in the sediments of the northern Baltic Proper
12
Vol. 172: 13-24, 1998 MARINE ECOLOGY PROGRESS SERIES Mar Ecol Prog Ser Published October 22 Spatial and temporal variability of denitrification in the sediments of the northern Baltic Proper Liisa Tuominenl,*, Anne ~einanen',**, Jorma ~uparinen', Lars Peter ~ i e l s e n ~ 'Finnish Institute of Marine Research, PO Box 33, FIN-00931 Helsinki, Finland 2Department of Microbial Ecology, Institute of Biological Sciences, University of Aarhus, Ny Munkegade, Building 540, DK-8000 Aarhus C, Denmark ABSTRACT Denitnfication in the sediments of the open northern Baltic Sea was measured using the isotope palling method The highest denitnfication actlvity was found In the central Gulf of Flnland, where denitriflcation vaned between 150 and 650 pm01 N m d ' The bulk of the denitnfication was coupled to the No3- production by nitrification The mass of benthic fauna was found to be the most sig- nificant factor affecting the rate of denitnfication. Denitrification rate was highest in late summer and early autumn. Calculated as an average ior the Gulf of Finland, the denitrification rate obtained in the present study is 45 kt N yr-l. This gives a release of ca 30% of the external N input by denitrification. KEY WORDS: Denitnfication . Baltic Sea Isotope pairing method Sedllnent INTRODUCTION Denitrification is the bacterial process in which NO,- and NO2- are successively reduced to gaseous NZ.The process occurs mainly in the absence of oxygen and is centered at the oxic-anoxic interface where denitrify- ing bacterla have access to NO,-. These kinds of inter- faces appear both in sediment in the littoral and pi-o- fundal zones and in the water above anoxic deeps. Denitrification removes N from aquatic ecosystems, and partly counteracts the development of eutrophica- tion, especially in aquatlc systems where N is the limit- lng nutrient for phytoplankton growth. In the past decades, the nutilent concentrations as well as phyto- plankton growth have shown increasing trends in the northern Baltic Sea (Wulff et al. 1990, Perttila et al. 1995, Rahm et al. 1996) due to a large input of nutrients by human activities. In recent years, it has been shown that N is the most limiting nutrient in the Baltic Proper and the Gulf of Finland (e.g.Graneli et al. 1990, Kivi et al. 1993),and P in the Bothnian Bay (e.g. Alasaarela et 'E-mail: [email protected] "Present address: Academy of Finland, PO Box 99, FIN- 00501 Helsinki, Finland al. 1986, Graneli et al. 1990). At the same time, how- ever, discussion has been going on about the necessity of reducing N in waste water (Rinne 1988, Graneli et al. 1990, Seppanen 1992, Tamminen 1992a, b) with one open question being the intensity of the 'natural' purification by denitnfication. Denitrlfication has been calculated to efficiently remove N from the Baltic Sea ecosystem and therefore counteract eutrophication (Shaffer & Ronner 1984, Ronner 1985). Shaffer & Ronner (1984) calculated that 80 to 90% of denitrification takes place in sediments. However, direct measurements of denitrification in the open Baltic Sea have been carried out (and published) mostly with regard to the water column (Ronner & Sorensson 1985, Brettar & Rheinheimer 1991, 1992) with only 1 sediment study in the Gulf of Bothnia (Stockenberg & Johnstone 1997). All these studies used the acetylene blockage method. Thls method has some pitfalls, especially when applied to sediment samples, including the inhibition of nitrification pro- viding NO,- for denitrificatlon, and the reversal of the blockage of N20 reductase by sulfide (S~rensen et al. 1987, Seitzinger et al. 1993, Lohse et al. 1996). This study presents direct measurements of denitrifi- cation in the sediments of the open northern Baltic Sea O Inter-Research 1998 Resale of full article not pemiitted
Transcript of Spatial and temporal variability of denitrification in the sediments of the northern Baltic Proper
Vol. 172: 13-24, 1998 MARINE ECOLOGY PROGRESS SERIES Mar Ecol Prog Ser
Published October 22
Spatial and temporal variability of denitrification in the sediments of the northern Baltic Proper
Liisa Tuominenl,*, Anne ~einanen' ,**, Jorma ~uparinen', Lars Peter ~ i e l s e n ~
'Finnish Institute of Marine Research, PO Box 33, FIN-00931 Helsinki, Finland
2Department of Microbial Ecology, Institute of Biological Sciences, University of Aarhus, Ny Munkegade, Building 540, DK-8000 Aarhus C, Denmark
ABSTRACT Denitnfication in the sediments of the open northern Baltic Sea was measured using the isotope palling method The highest denitnfication actlvity was found In the central Gulf of Flnland, where denitriflcation vaned between 150 and 650 pm01 N m d ' The bulk of the denitnfication was coupled to the No3- production by nitrification The mass of benthic fauna was found to be the most sig- nificant factor affecting the rate of denitnfication. Denitrification rate was highest in late summer and early autumn. Calculated as an average ior the Gulf of Finland, the denitrification rate obtained in the present study is 45 kt N yr-l. This gives a release of ca 30% of the external N input by denitrification.
KEY WORDS: Denitnfication . Baltic Sea Isotope pairing method Sedllnent
INTRODUCTION
Denitrification is the bacterial process in which NO,- and NO2- are successively reduced to gaseous NZ. The process occurs mainly in the absence of oxygen and is centered at the oxic-anoxic interface where denitrify- ing bacterla have access to NO,-. These kinds of inter- faces appear both in sediment in the littoral and pi-o- fundal zones and in the water above anoxic deeps. Denitrification removes N from aquatic ecosystems, and partly counteracts the development of eutrophica- tion, especially in aquatlc systems where N is the limit- lng nutrient for phytoplankton growth. In the past decades, the nutilent concentrations as well as phyto- plankton growth have shown increasing trends in the northern Baltic Sea (Wulff et al. 1990, Perttila et al. 1995, Rahm et al. 1996) due to a large input of nutrients by human activities. In recent years, it has been shown that N is the most limiting nutrient in the Baltic Proper and the Gulf of Finland (e .g . Graneli et al. 1990, Kivi et al. 1993), and P in the Bothnian Bay (e.g. Alasaarela et
'E-mail: [email protected] "Present address: Academy of Finland, PO Box 99, FIN-
00501 Helsinki, Finland
al. 1986, Graneli et al. 1990). At the same time, how- ever, discussion has been going on about the necessity of reducing N in waste water (Rinne 1988, Graneli et al. 1990, Seppanen 1992, Tamminen 1992a, b) with one open question being the intensity of the 'natural' purification by denitnfication.
Denitrlfication has been calculated to efficiently remove N from the Baltic Sea ecosystem and therefore counteract eutrophication (Shaffer & Ronner 1984, Ronner 1985). Shaffer & Ronner (1984) calculated that 80 to 90% of denitrification takes place in sediments. However, direct measurements of denitrification in the open Baltic Sea have been carried out (and published) mostly with regard to the water column (Ronner &
Sorensson 1985, Brettar & Rheinheimer 1991, 1992) with only 1 sediment study in the Gulf of Bothnia (Stockenberg & Johnstone 1997). All these studies used the acetylene blockage method. Thls method has some pitfalls, especially when applied to sediment samples, including the inhibition of nitrification pro- viding NO,- for denitrificatlon, and the reversal of the blockage of N 2 0 reductase by sulfide ( S ~ r e n s e n et al. 1987, Seitzinger et al. 1993, Lohse et al. 1996).
This study presents direct measurements of denitrifi- cation in the sediments of the open northern Baltic Sea
O Inter-Research 1998 Resale of full article not pemiitted
14 Mar Ecol Prog Ser 112: 13-24, 1998
sampled with a Gemini twin-corer (corer tube 0 8 cm). Water samples for the analyses of NO:,- and NO,' (Grasshoff 1983) and O2 concentrations (Winkler titration) were collected from the near- bottom water (ca 1 to 2 m above the bot-
Gulf of Finland tom) on the same days and analysed immediately aboard (except NO3- and NOz- on the RV 'Alkor' cruise, which were frozen and analysed later). Tem- perature and salinity were determined with a SeaBird CTD probe.
Sediment denitrification was assayed with the isotope pairing method (Nielsen 1992). In each Gemini twin-corer tube, 3 replicate incubation cores (plastic cylin- ders with a height of ca 100 mm and 0 26 mm) were pushed into the sediment so that about half of the core length was filled with sediment and the rest with near-bottom water. The top of the incu- bation core was closed with a cap, the cores were gently lifted from the sedi- ment, and the bottom was closed. In a temperature controlled room set at the near-bottom temperature, KlSN03 solu-
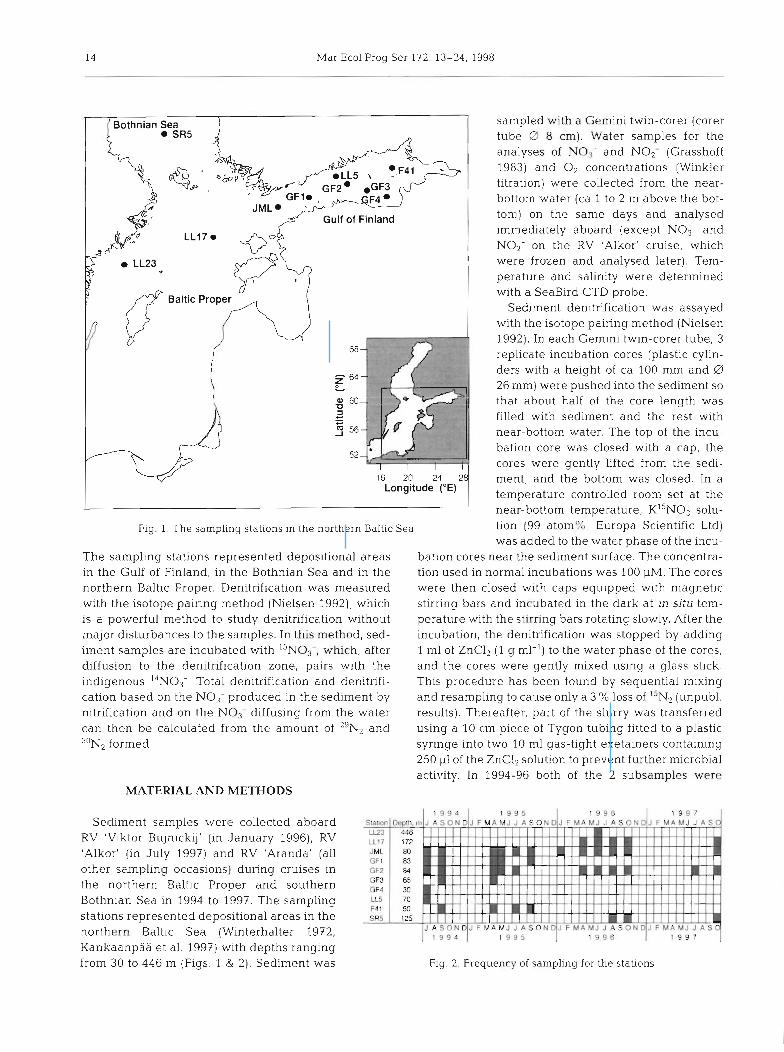
Fig. 1. The sampl~ng stations in the northern Baltic Sea tion (99 atom%,:,, Europa Scientific Ltd) was added to the water phase of the incu-
The sampling stations represented depositional areas bation cores near the sedlment surface. The concentra- in the Gulf of Finland, in the Bothnian Sea and in the tion used in normal incubations was 100 PM. The cores northern Baltic Proper. Denitrification was measured were then closed with caps equipped with magnetic with the isotope palring method (Nielsen 1992), which stirring bars and incubated in the dark at in s i tu tem- is a powerful method to study denitrification without perature with the stirring bars rotating slowly. After the major disturbances to the samples. In this method, sed- incubation, the denitrification was stopped by adding iment samples are incubated with 15N03 , which, after 1 m1 of ZnClz (1 g ml-l) to the water phase of the cores, diffusion to the denitrification zone, pairs with the and the cores were gently mixed using a glass stick. indigenous 1 4 N 0 3 Total denitrification and denitrifi- This procedure has been found by sequential mixing cation based on the N O 3 produced in the sediment by and resampling to cause only a 3 %I loss of 'WN, (unpubl. nitrification and on the NO; diffusing from the water resu1.t~). Thereafter, part of the slurry wa.s transferred can then be calculated from the amount of "N, and using a 10 cm piece of Tygon tubing fitted to a plastic 30N2 formed. syringe into two 10 m1 gas-tight exetainers containing
250 p1 of the ZnC12 solution to prevent further microbial activity. In 1994-96 both of the 2 subsamples were
MATERIAL AND METHODS
Sediment samples were collected aboard RV 'Viktor Bujnickij' (in January 1996), RV 'Alkor' (in July 1997) and RV 'Aranda' (all other sampling occasions) during cruises in the northern Baltic Proper and southern Bothnian Sea in 1994 to 1997. The sampling LLs
stations represented depositional areas in the northern Baltic Sea (Winterhalter 1972, Kankaanpaa et al. 1997) with depths ranging from 30 to 446 m (Figs. 1 & 2) . Sediment was Fig. 2. Frequency of sampling for the stations
Tuorninen et a1 Denitnfic :ation in Baltic sedirnents 15
analysed, but in 1997 the second subsample was only analysed if there were problems with the analysis of the first one (since the variability between the subsamples was low, see 'Results'). After replacing 4 m1 of the sus- pension in the exetainer with helium gas followed by vigorous shaking, the mass ratios of N2 in subsamples of the gas phase were analysed using a mass spectrom- eter at the National Environmental Research Institute in Silkeborg, Denmark.
For the calculation of results, the water content (W,
by drying at 70°C) and the porosity (p) of the samples were determined. The porosity was calculated as:
p = (wp)l[lOO + w(p - l ) ] (1)
where p = 2.6. The denitnfication rate based on the natural ',NO3-
was calculated from the ratios of 29N2 (14N15N) and 30N2 (I5Nl5N) formed during the incubation. These were calculated by dividing the 29 and 30 currents given by the mass spectrometer by the current of 28. Atmos- pheric air was used as reference and analysed after every 5 or 6 samples. The average of the reference samples before and after the actual samples was sub- tracted from the results. The results so obtained were transferred into pM by multiplying them by the solu- bility of N2 to sea water at in situ temperature and salinity (Kester 1975).
The denitrification rate based on the added 'WO3- (D,,) is the sum of all 15N species formed (Nielsen 1992):
D,, = (',N',N) + ~("N',N) (2)
When the added ''NO3- and the natural I4NO3- are uniformly mixed in the sample, the i n situ denitrifica- tion rate based on natural ',NO3- (Dl4) is:
D14 = D15(14N1sN)/[2(15N15N)] (3 )
The denitrification rate obtained was changed into pm01 N m-2 d-l by multiplying D,, by the total water volume of the sample (= volume of water phase + vol- ume of sediment X porosity) and by dividing by the sur- face area of the sample and the incubation time.
D,, can be divided into denitrification based on NO3- diffusing into the sediment from the overlying water (D,,) and on NO3- produced in the sediment by nitrifica- tion (D,) (Nielsen et al. 1996). D,, is calculated using the ratio of ',NO3- and ''NO3- available in the water phase:
D, = D15a/b (4)
where a = natural concentration of No3- in the near- bottom water, and b = added concentration of ',NO3-
D, is thereby:
D, = D1, - D, (5)
The optimal incubation time was determined by incubating samples for 1, 3 and 5 h. The time series
incubations were performed at Stns F41, GF1 and JML. The first-order kinetics and the minimization of the formation of unmeasurable '%l4N pairs were ensured by incubating the samples with increasing concentrations of I5NO3- (10 to 100 pM) and by plotting the DI5 and D, results obtained with the concentration used (Nielsen 1992). These experiments were per- formed at Stns LL17, JML and GF2.
The sources of variation in the denitrification mea- surements were identified by comparing coefficients of variation between 15N measurements from a single incubation core (2 subsamples), between the 3 incuba- tion cores collected from a single Gemini core and between the Gemini cores.
RESULTS
Methodological tests
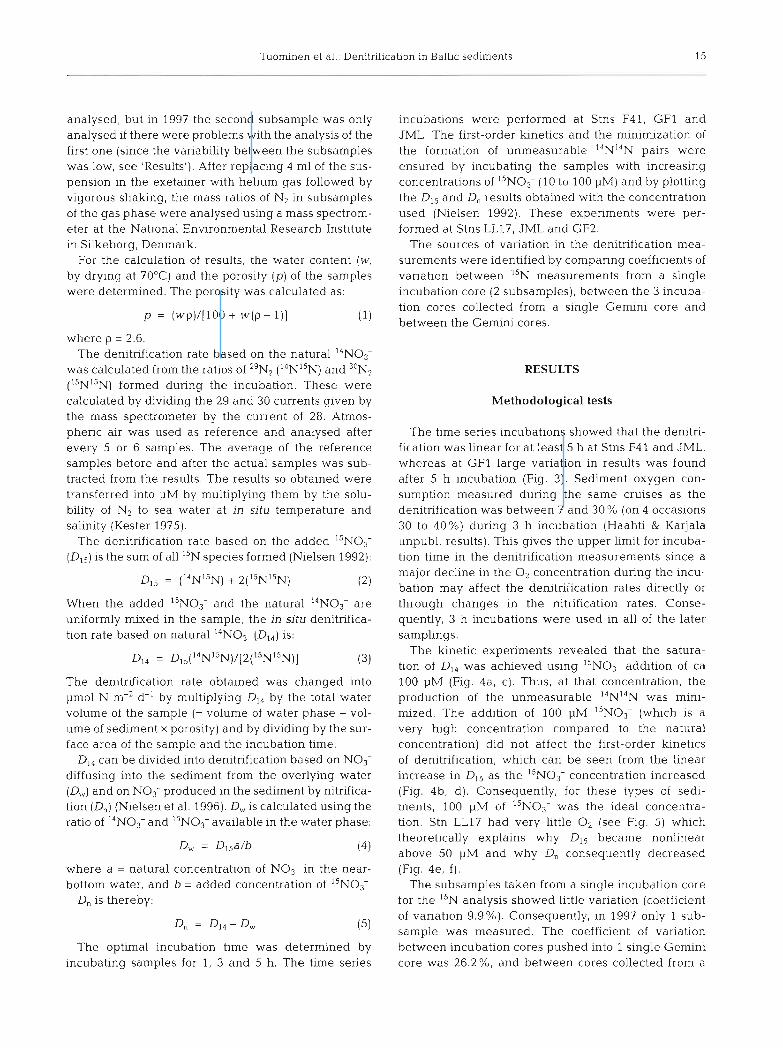
The time series incubations showed that the denitri- fication was linear for at least 5 h at Stns F41 and JML, whereas at GF1 large variation in results was found after 5 h incubation (Fig. 3). Sediment oxygen con- sumption measured during the same cruises as the denitrification was between 7 and 30 % (on 4 occasions 30 to 40%) during 3 h incubation (Haahti & Karjala unpubl. results). This gives the upper limit for incuba- tion time in the denitrification measurements since a major decline in the O2 concentration during the incu- bation may affect the denitrification rates directly or through changes in the nitrification rates. Conse- quently, 3 h incubations were used in all of the later samplings.
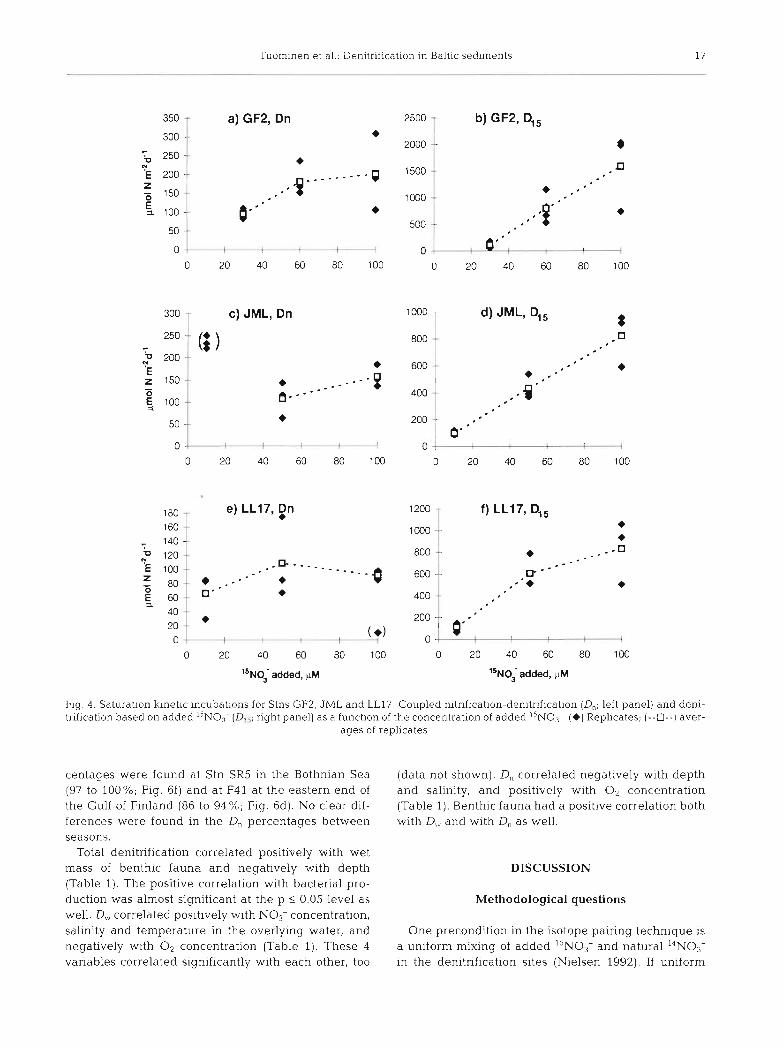
The kinetic experiments revealed that the satura- tion of D,, was achieved using 15N03- addition of ca 100 pM (Fig. 4a, c ) . Thus, at that concentration, the production of the unmeasurable l4N"'N was mini- mized. The addition of 100 pM ',NO3- (which is a very high concentration compared to the natural concentration) did not affect the flrst-order kinetics of denitrification, which can be seen from the linear increase in D,, as the ',NO3- concentration increased (Fig. 4b, d) . Consequently, for these types of sedi- ments, 100 pM of ''NO3- was the ideal concentra- tion. Stn LL17 had very little 0, (see Fig. 5) which theoretically explains why D,, became nonlinear above 50 pM and why D, consequently decreased (Fig. 4e, f ) .
The subsamples taken from a single incubation core for the 15N analysis showed little variation (coefficient of variation 9.9%). Consequently, in 1997 only 1 sub- sample was measured. The coefficient of variation between incubation cores pushed into 1 single Gemini core was 26.2%, and between cores collected from a
16 Mar Ecol Prog Ser 172: 13-24, 1998
lncubation time, h Incubation time, h
Fig. 3. Results from the time series incubations for samples collected from Stns (a) F41. JML and (b) GFl
single station 34.1%. Thus, a large part of the total variation was detected within 1 corer tube suggesting that the variability on the sea floor occurred on a cm scale.
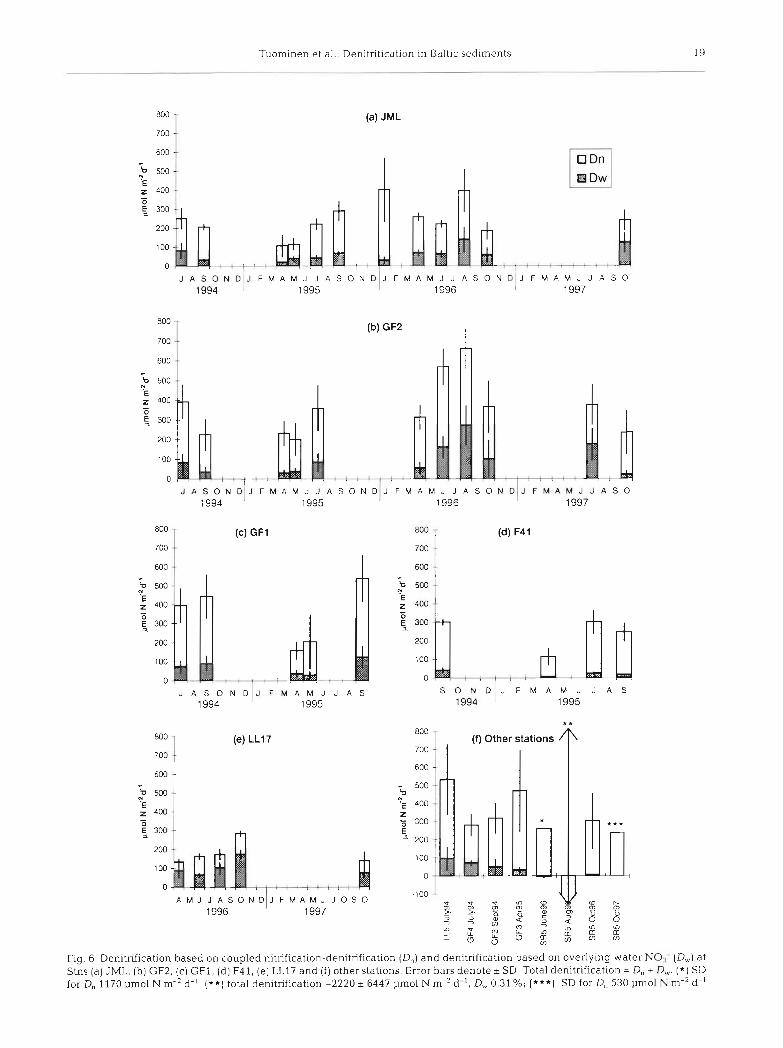
entrance to the Gulf of Finland and with a water depth of about 80 m, showed lower denitrification activity (100 to 400 pm01 N m-2 d-') than the other stations in the Gulf of Finland (Fig. 6a). Denitrification rate was statistically significantly higher (2-tailed t-test, p = 0.039) at GF2 than at JML (the 2 stations with most intense sampling). At the eastern end of the Gulf of Finland, at Stn F4 1, denitrification was l00 to 300 pm01 N m-2 d-' (Fig. 6d). At the deep stations in the northern Baltic Proper, denitrification rate was 15 + 9 pm01 N
d-' (& SD) at LL23 (446 m) and 125 to 300 pm01 N m-2 d-' at LLl? (172 m; Fig. 6e). The result from Stn LL23 is not shown in Fig. 6 due to a different order of magnitude. In addition, the denitrification at Stn LL23 was measured from the top centimeter of the sediment since, due to the loose structure of the sedi- ment, subsampling with the incubation cores was not possible at this station.
At Stn SR5 in the Bothnian Sea, denitrification was between 250 and 300 pm01 N m-' d-' (Fig 6f). How- ever, at that station negative values were sometimes observed and very high standard deviation was found between replicates (see legend for Fig. 6f). On 1 occa- sion (August 1996), variation was enormous, with an average of -2200 pm01 N m-2 d-' and SD 6400 pm01 N m-2 d-1
Denitrication was usually at its highest in late sum- mer and early autumn, from July to September (Fig. 6a, b) The lowest activity was found in spring during April and May. The only measurement carried out during winter, at Stn JML in January 1996, showed very high denltrification activity (400 pm01 N m-2 d-l), actually the highest measured at JML (Fig. 6a).
At all the other stations except LLl?, the bulk of the denitrification was based on NO3- produced in the sed- iment by nitrification, i.e. coupled n~trification-denitri- fication (D,,; Fig. 6). At LL17, D, was less than half of the total denitnfication (Fig. 6e). The highest D, per-
Hydrographical data
The salinity in the near-bottom water was 5.5 to 6.5 in the Bothnian Sea and in the eastern Gulf of Finland. Westwards of this in the Gulf of Finland, the salinity increased to ca 7.5-8.5 at Stn GF2 and to 8.5-9.5 at JML at the entrance to the Gulf of Finland. In the northern Baltic Proper (Stns LL17 and LL23), the salin- ity was 10 to 10.5. The temperature varied between 0.8 and 4.g°C, with the lowest temperatures at the shal- lowest stations.
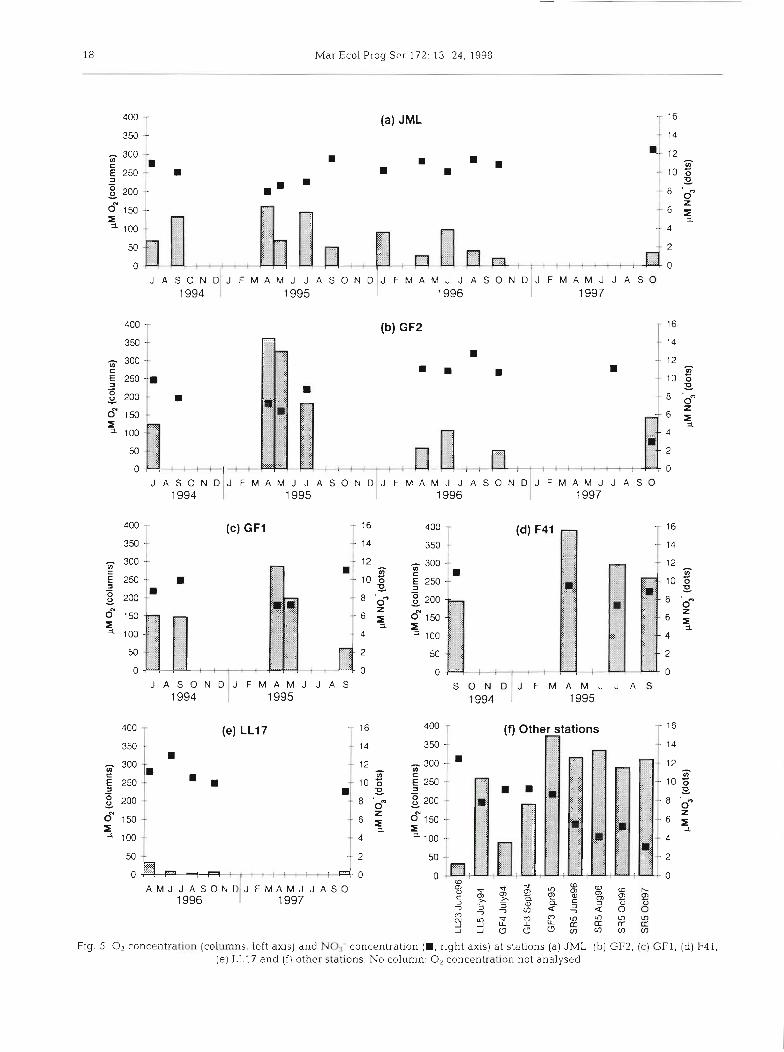
The 0, and N O , concentrations near the bottom are shown in Fig. 5. The 0, concentration was lowest at Stns LL23 and LL17 in the northern Baltic Proper (Fig. 5e, f ) , and highest at SR5 in the Bothian Sea (Fig. 5f) and at F41 in the eastern end of the Gulf of Finland (Fig. 5d). The NO3- concentration in the near- bottom water was lowest at Stn SR5 in the Bothnian Sea (ca 5 pM; Fig. 5f). In the Baltic Proper (Stns LL17 and LL23), the concentration was slightly above 10 pM, while in the Gulf of Finland it fluctuated around 10 pM (Fig. 5). The N O , concentration was always very low (0 to 0.2 pM, except for 0.7 pM at LL17 in August 1996 and 1.0 pM at F41 in July 1995).
Denitrification
The highest denitrification a.ctivity was found in the central Gulf of Finland, at Stns GF1, LL5, GF2 and GF3, where denitrification varied between 150 and 650 pm01 N m-2 d-' (Fig. 6b, c, f). JML, the station at the
Tuominen et al. Denitrlfication in Baltic sediments 17
300 T c) JML, Dn l W O T d) JML, DI5 :
l5~0,' added, pM l5~0,' added, pM
Fig 4 Saturation kinetic incubat~ons for Stns GF2, JML and LL17 Coupled nitrification-denitrification (D,, left panel) and deni- t n f~ca t~on based on added ''NO3 (D1' rlght panel) as a function of the concentration of added ''NO7 (+) Rephcates, (--m--) aver-
ages of replicates
centages were found at Stn SR5 in the Bothnian Sea (97 to 100%; Fig. 6f) and at F41 at the eastern end of the Gulf of Finland (86 to 94 %; Fig. 6d). No clear dif- ferences were found in the D, percentages between seasons.
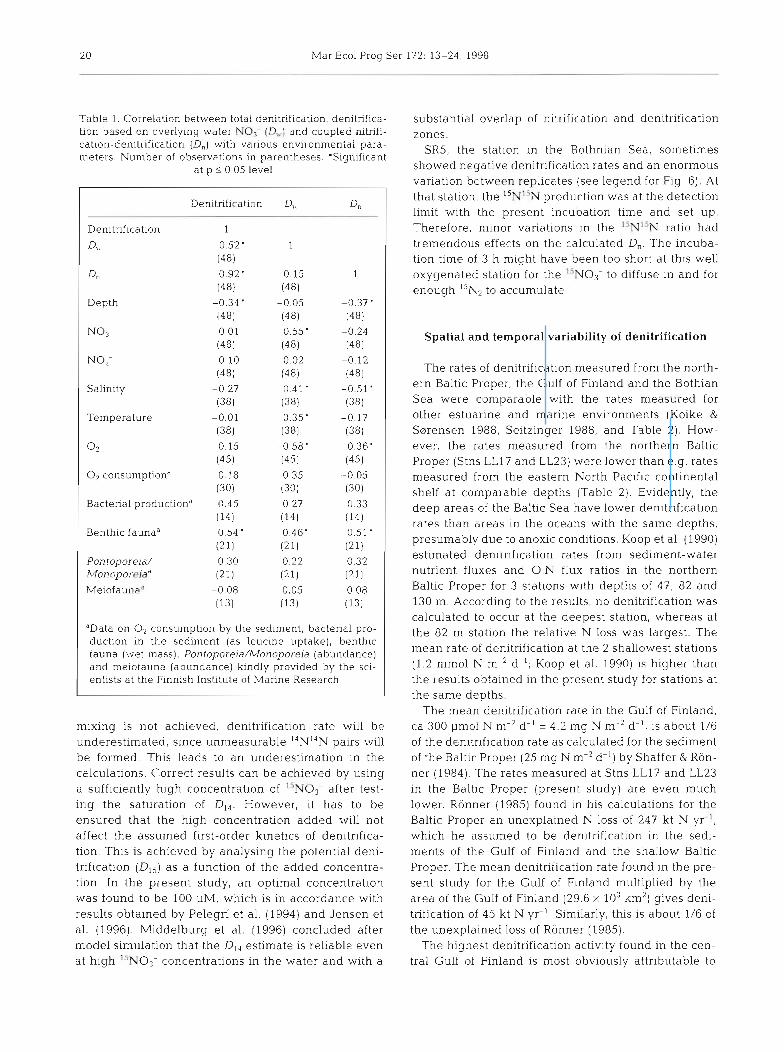
Total denitrification correlated positively with wet mass of benthic fauna and negatively with depth (Table 1). The positive correlation with bacterial pro- duction was almost significant at the p < 0.05 level as well. D, correlated positively with No3- concentration, sallnity and temperature in the overlying water, and negatively with O2 concentration (Table 1 ) . These 4 variables correlated significantly with each other, too
(data not shown). D, correlated negatively with depth and salinity, and positively with O2 concentration (Table 1). Benthic fauna had a positive correlation both with D,, and with D, as well.
DISCUSSION
Methodological questions
One precondition in the isotope pairing technique is a uniform mixing of added ISNO,- and natural 14N03- in the denitrification sites (Nielsen 1992). If uniform
18 Mar Ecol Prog S P ~ 172- 13-24, 1998
(a) JML
J A S O N D J F M A M J J A S O N D J F M A M J J A S O N D J F M A M J J A S O 1994 1995 1996 1 1997
(b) GF2
J A S O N D J F M A M J J A S O N D J F M A M J J A S O N D J F M A M J J A S O 1994 1995 1996 1 1997
(c) GF1
(e) LL17
Fig. 5 0, concentration (columns, left axis) and NO3- concentration (D, right axis) at stations (a) JML, (b) GF2, (c) GFI, (d) F41, (e) LL17 and ( f ) other stations. No column: O2 concentration, not analysed
2 0 Mar Ecol Prog Ser 172. 13-24, 1998
Table l . Correlation between total denitrification, denitrifica- tion based on overlying water N O ? (Q,.) and coupled nitrifi- cation-denitrification (D,] with various environmental para- meters. Number of observations in parentheses. 'Significant
at p 5 0.05 level
Denitrification
Denitrification 1
4, 0.52' (481
Dn 0.92' (48)
Depth -0.34 ' (481
N o 3 - 0.01 (48)
NOz- -0.10 (481
Salinlty -0.27 (381
Temperature -0.01 (381
0 2 0.15 (451
0, consumptiond -0.18 (30)
Bacterial productiond 0.45 (14)
Benthic faunaa 0.54 ' (21)
Pon toporeia/ 0.30 Monoporrtiad (21)
Melofaunad -0.08 (13)
'Data on O2 consumption by the sedlrnent, bactenal pro- duction In the sediment (as leuclne uptake), benthic fauna (wet mass), Pontopore~a/Monopore~a (abundance) and melofauna (abundance) klndly provided by the scl- entists at the Finnish Institute of Manne Research
mixing is not achieved, denitrification rate will be underestimated, since unmeasurable l4NI4N pairs will be formed. This leads to a n underestimation in the calculations. Correct results can be achieved by using a sufficiently high concentration of ''NO3- after test- ing the saturation of D,,. However, it has to be ensured that the high concentration added will not affect the assumed first-order kinetics of denitrifica- tion. This is achieved by analysing the potential deni- trification (Dl5) as a function of the added concentra- tion In the present study, an optimal concentration was found to be 100 PM, which is in accordance wlth results obtained by Pelegri et al. (1994) and Jensen et al. (1996). Middelburg et al. (1996) concluded after model simulation that the D,, estimate is rellable even at high "NO3- concentrations in the water and with a
substantial overlap of nitrification and denitrification zones.
SR5, the station in the Bothnian Sea, sometimes showed negative denitrification rates and an enormous variation between replicates (see legend for Fig. 6). At that station, the 15N''N production was at the detection limit with the present incubation time and set up. Therefore, minor variations in the I5NT5N ratio had tremendous effects on the calculated D,,. The incuba- tion time of 3 h might have been too short at this well oxygenated station for the 'iNO< to diffuse in and for enough 15N2 to accumulate.
Spatial and temporal variability of denitrification
The rates of denitrification measured from the north- ern Baltic Proper, the Gulf of Finland and the Bothlan Sea weie conlparable with the rates measured for other estuarine and marine environments (Koike &
Sorensen 1988, Seitzinger 1988, and Table 2). H o w ever, the rates measured from the northern Baltic Proper (Stns LL17 and LL23) were lower than e.g. rates measured from the eastern North Pacific continental shelf at comparable depths (Table 2). Evidently, the deep areas of the Baltic Sea have lower denitrification rates than areas in the oceans with the same depths. presumably due to anoxic conditions. Koop et al. (1990) estimated denitrification rates from sediment-water nutrient fluxes and 0 : N flux ratios in the northern Baltic Proper for 3 stations with depths of 47, 82 and 130 m. According to the results, no denitrlfication was calculated to occur at the deepest station, whereas at the 82 m station the relative N loss was largest. The mean rate of denitrificati.on at the 2 shallowest stations (1.2 mm01 N m-2 d-l; Koop et al. 1990) is h ~ g h e r than the results obtained in the present study for stations at the same depths.
The mean denitrification rate in the Gulf of F~nland, ca 300 pm01 N m-2 d- ' = 4 .2 mg N m-2 d-', is about 1/6 of the denitrification rate as calculated for the sediment of the Baltic Proper (25 mg N m-'d-') by Shaffer & Rijn- ner (1984). The rates measured a t Stns LL17 and LL23 in the Baltic Proper (present study) are even much lower. Ronner (1985) found in his calculations for the Baltic Proper a n unexplained N loss of 247 kt N yr-', which h e assumed to be denitrification in the sedi- ments of the Gulf of Finland and the shallow Baltic Proper. The mean denitrification rate found in the pre- sent study for the Gulf of Finland multiplied by the area of the Gulf of Finland (29.6 X 10%m2) gives deni- tnfjcation of 45 kt N yr-l Sim.ilarly, this is about 1/6 of the unexplained loss of Ronner (1985).
The highest denitrification activ~ty found in the cen- tral Gu.lf of Finland is most obviously attributable to
Tuominen et al.: Denitrification in Baltic sediments 21
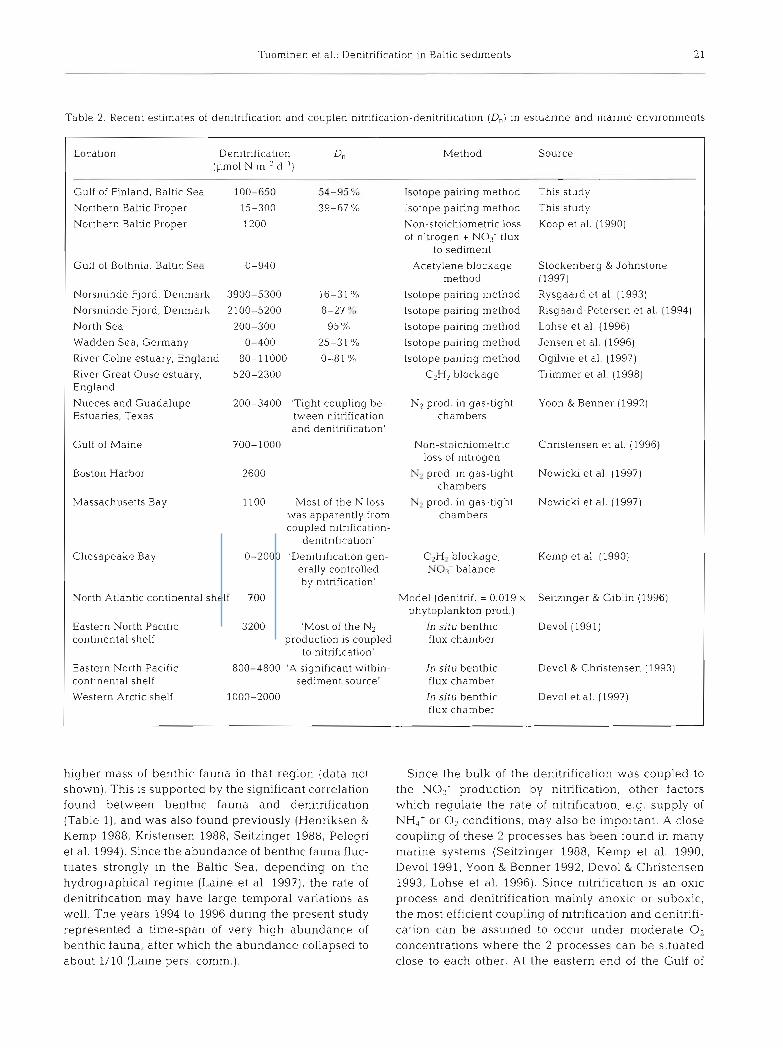
Table 2. Recent estimates of denitrificatlon and coupled n~trification-denitrification (D,) in estuarine and marine environments
Location Denitrification D, (1.1mol N m-' d-')
Method Source
Gulf of Finland. Baltic Sea 100-650 54-95?;
Northern Baltic Proper 15-300 39-67 'X,
Northern Baltic Proper 1200
Gulf of Bothnia. Baltic Sed 0-940
Norsminde Fjord, Denmark
Norsminde Fjord, Denmark
North Sea
Wadden Sea, Germany
River Colne estuary, England
River Great Ouse estuary, England
Nueces and Guadalupe Estuanes, Texas
Gulf of Maine
200-3400 'Tight coupling be- tween nitnfication and denitrification'
700- 1000
Boston Harbor 2600
Massachusetts Bay 11 00 'Most of the N loss was apparently from coupled nitrification-
denitr~f~cation'
Chesapeake Bay 0-2000 'Denitrification gen- erally controlled by nitnficatlon'
North Atlantic continental shelf 700
Eastern North Pacific 3200 'Most of the N, continental shelf production is coupled
to nitrification'
Eastern North Pacific 800-4800 'A significant within- continental shelf sediment source'
Western Arctic shelf 1000-2000
lsotope pairing method
lsotope pairing method
Non-stoichiometric loss of nitrogen t NO1- flux
to sediment
Acetylene blockage method
lsotope pairing method
Isotope pairing method
Isotope pairing method
Isotope pairing method
Isotope pairing method
CzH, blockage
N2 prod. in gas-tight chambers
Non-stoichiometric loss of nitrogen
N, prod. in gas-tight charn bers
N:, prod. in gas-tlght chambers
C2H2 blockage, NO3- balance
model (denitrif. = 0.019 X
phytoplankton prod.)
In situ benthic flux chamber
In situ benthic flux chamber
In situ benthic flux chamber
This study
This study
Koop e t al. (1990)
Stockenberg & Johnstone (1997)
Rysgaard e t al. (1993)
Risgaard-Petersen e t al. (1994)
Lohse et a1 (1996)
Jensen et al. (1996)
Ogilvie e t al. (1997)
Trimmer et al. (1998)
Yoon & Benner (1992)
Christensen et al. (1996)
Nowiclu et al. (1997)
Nowicki et al. (1997)
Kemp et al. (1990)
Seitzinger & Giblin (1996)
Devol (1991)
Devol & Christensen (1993)
Devol e t al. (1997)
higher mass of benthic fauna in that region (data not shown). This is supported by the significant correlation found between benthic fauna and denitrification (Table l ) , and was also found previously (Henriksen &
Kemp 1988, Kristensen 1988, Seitzinger 1988, Pelegri et al. 1994). Since the abundance of benthic fauna fluc- t'uates strongly in the Baltic Sea, depending on the hydrographical regime (Laine et al. 1997), the rate of denitrification may have large temporal variations as well. The years 1994 to 1996 during the present study represented a time-span of very high abundance of benthic fauna, after which the abundance collapsed to about 1/10 (Laine pei-S. comm.).
Since the bulk of the denitrification was coupled to the NO; production by nitrification, other factors which regulate the rate of nitnfication, e.g. supply of NH,' or O2 conditions, may also be important. A close coupling of these 2 processes has been found in many marine systems (Seitzinger 1988, Kemp et al. 1990, Devol 1991, Yoon & Benner 1992, Devol & Christensen 1993, Lohse et al. 1996). Since nitrification is an oxic process and denitrification mainly anoxic or suboxic, the most efficient coupling of nitrification and denitrifi- cation can be assumed to occur under moderate O2 concentrations where the 2 processes can be sltuated close to each other. At the eastern end of the Gulf of
Mar Ecol Prog Ser 172: 13-24. 1998
Finland at Stn F41, the O2 concentrations were proba- bly too high for efficient coupling. This is also sup- ported by the very low rate of D,,, indicating that deni- trification may have been restricted to deeper sediment layers (Fig. 6d; cf. Christensen et al. 1990).
The very low O2 concentrations (4.5 to 31 pM 1 m above the bottom) at the deep Stns LL17 and LL23 in the northern Baltic Proper obviously limited nitrifica- tion and therefore denitrification. The lower percent- age of D, compared to the other stations (Fig. 6e) fur- ther supports this. In addition, HS- has been found to inhibit denitrification (Ssrensen et al. 1987) and nitrifi- cation (e.g. Joye & Hollibaugh 1995). Although HS- was not found in our samples 1 m above the bottom (data not shown), the sediment may well have con- tained it.
The effect of benthic fauna in the activation of deni- trification has 2 routes. Directly, D, is activated by the pumping of NO3- from the overlying water into the burrows in the sediment. Indirectly, nitrification is high in the burrow walls (e.g. Kristensen 1988), which therefore activates D,. Other factors significant in the correlation analysis for D, and D,, i.e. NO3- concentra- tion, salinity, temperature and O2 concentration, all correlated significantly with each other. They reflect the presence of old, deep water from below the halo- cline with higher salinity and nutrient concentration, and lower O2 concentration. The presense of old, deep water was found to activate D, but suppress D,. The non-periodical inflows of water to the Baltic Sea from the North Sea fill the basins in the Baltic Proper with highly saline water containing high temperature and O2 concentration (Matthaus & Lass 1995). During stag- nation the salinity, temperature and O2 concentration of this deep water decrease until the o1.d water is replaced by the next inflow. The old, water mass then continues its way towards the Gulf of Finland along the bottom. If long stagnation periods occur, the basins become filled with H2S and no denitrification can therefore be expected to happen since NO3- cannot be produced by nitrification.
The denitrification rate was highest in late summer and early autumn. It has been found in many studies that denitrification was high in spring after the spring phytoplankton bloom with possibly another peak in the autumn (Jsrgensen & Serrensen 1988, Jsrgensen 1989, Kemp et al. 1990, Jensen et al. 1996). However, Smith et al. (1985) and Yoon & Benner (1992) found highest denitrification in late summer It must be noted that all these studies were made in relatively shallow areas where sedimentation of algae may have a more direct effect on the benthic processes. At Stns GF2 and JML (depths 84 and 80 m, respectively), other factors are probably of greater importance since the algal material is largely decomposed when reaching the
sedlment (cf. Wassmann 1990). However, the reason for the seasonal rhythm remained unclear.
The peak of denitrification observed in January 1996 at Stn JML is surprising since the input of set- tling material is scarce at the end of the year. As there was only 1 measurement carried out during wlnter, it must be viewed with caution. However, Devol et al. (1997) have likewise found that the deni- trification rate in the western Arctic shelf sediment did not differ between August-September and March although the sediment in March had not received fresh autochthonous settling material for months due to ice cover.
Importance of denitrification in N cycling
In estuaries, an average of 20 to 50% of external N input has been found to be released by denitrification (Smith et al. 1985, Jsrgensen & Sarensen 1988, Seitzinger 1988, Yoon & Benner 1992, Christensen et al. 1996, Stockenberg & Johnstone 1997). Calculated as an average for the area of the Gulf of Finland, the denitnfication rate obtained in the present study is 45 kt N yr-'. The loading of N to the Gulf of Finland via rivers and by direct discharges from coastal municipal- ities and industries was estimated to be 140 kt in 1990, and the annual total (wet + dry) atmospheric deposi- tion ca 13 kt in the late 1980s (HELCOM 1996), together giv~ng a yearly N input of ca 153 kt. This gives release of ca 30% of the external N ~ n p u t by denitrifi- cation. However, this is only an estimate since denitri- fication was calculated from results obtained only from the open area of the Gulf of Flnland. Nevertheless, the calculation probably gives a fairly correct estimate since the area of the open waters is by far larger than the area of the shallow and littoral waters. In addition, the area of the erosion bottoms where no or very little denitrification can be assumed to occur may be com- pensated for by the relatively more intense denitrifica- tion in the littoral areas. The value obtained is in good accordance with the 23 and 31 % obtained for the Both- nian Bay and the Bothnian Sea, respectively, by Stock- enberg & Johnstone (1997).
The release of N 2 0 during denitrification may also remove N from the ecosystem. However, the formation of N 2 0 during denitrification has been found to be minor (0 to 10%) in marine systems (Smith & DeLaune 1983, Seitzinger 1988, Capone 1991); N 2 0 may even be consumed during denitrification (Capone 1991). NzO, although advantageous for the N removal from eutrophicated marine systems together with N2, is harmful as a greenhouse gas (Dickenson & Cicerone 1986) and a participant in the destruction of stratos- pheric ozone (Cicerone 1987).
Tuonunen et al.: Denitrifica tion in Baltic sediments 23
Although release of N by denitnfication was quite efficient in the Gulf of Finland, it cannot be counted on that denitrification will compensate for increased N loading. Seitzinger & Nixon (1985) have found that under experimental nutrient addition, although deni- trification rate increased, the amount of N removed was a constant or progressively smaller fraction of the N input. In an extreme situation, observed in the Chesapeake Bay (Kemp et al. 1990), denitrification could be totally eliminated during midsummer since anoxic conditions led to the elimination of nitrification and subsequent coupled denitrification. This leads to a vicious circle where eutrophication catalyzes itself through repression of denitrification. In the Baltic Sea, this possibility is further enabled since the non-period- ical inflows of highly saline water cause anoxic periods which can be prolonged and extended by eutrophica- tion.
Acknowledgements. We are indebted to Riikka Oja, Susanna Hietanen and the crew of the research vessels for help in the field and laboratory. We thank Ann-Britt Andersin, Hannu Haahti. Susanna Hietanen, Leena Karjala and Jaana Raty from the Finnish Institute of Marine Research for providing us background information and Kalervo Makeld for ideas. This study was part of the BASYS project funded by the EU through the MAST programme (contract MAS3-CT96-0058).
LITERATURE CITED
Alasaarela E, Tolonen E, Eloranta V (1986) Nutrients regulat- ing algal growth in the Bothnian Bay. Ophelia Suppl 4: 323-328
Brettar I. Rheinheimer G (1991) Denitrification in the Central Baltic: evidence for H2S-oxidation as motor of denitrifica- tlon at the oxic-anoxic interface. Mar Ecol Prog Ser 77: 157-169
Brettar I , Rheinheimer G (1992) Influence of carbon availabil- ity on denitrification in the central Baltic Sea. Limnol Oceanogr 37.1 146-1 163
Capone DG (1991) Aspects of the nlanne nltrogen cycle with relevance to the dynamics of nitrous and nitric oxide. In: Rogers JE, Whitman WB (eds) Microbial production and consumption of greenhouse gases: methane, nitrogen oxides, and halomethanes. American Society for Microbi- ology, Washington, DC, p 255-275
Christensen JP. Townsend DW, Montoya JP (1996) Water col- umn nutrients and sedimentary denitrification in the Gulf of Maine Cont Shelf Res 16:489-515
Christensen PB, Nielsen LP, Ssrensen J , Revsbech NP (1990) Denitrification in nitrate-rich streams: d~urnal and sea- sonal vandtlon related to benthic oxygen metabolism. Limnol Oceanogr 35:640-651
Cicerone RJ (1987) Changes in stratospheric ozone. Science 237:35-42
Devol AH (1991) Direct measurement of nitrogen gas fluxes from continental shelf sediments. Nature 349:319-321
Devol AH. Christensen JP (1993) Benthic fluxes and nitrogen cycling in sedirnents of the continental margin of the east- ern North Pacific. J Mar Res 51:345-372
Devol AH, Cod~spoti LA, Christensen JP (1997) Summer and winter denitrification rates in western Arctic shelf sedi-
ments. Cont Shelf Res 17:1029-1050 Dickenson RE, Cicerone RJ (1986) Future global warming
from atmospheric trace gases. Nature 319:109-115 Graneli E. Wallstrom K, Larsson U, Graneli W, Elmgren R
(1990) Nutrient limitation of primary product.ion in the Baltic Sea area. Ambio 19:142-151
Grasshoff K (1983) Methods of seawater analysis, 2nd edn. Verlag Chemie, Weinheim
HELCOM (1996) Th:ird periodic assessment of the state of the marine environment of the Baltic Sea, 1989-1993; back- ground document. Balt Sea Environ Proc No. 64 B
Henriksen K, Kemp WM (1988) Nitrification in estuarine and coastal marine sediments. In: Blackburn TH, Ssrensen J (eds) Nitrogen cycling in coastal marine environments. John Wiley & Sons Ltd, Chichester, p 207-249
Jensen KM, Jensen MH, Kristensen E (1996) Nitrification and denitrification in Wadden Sea sediments (Konigshafen, Island of Sylt, Germany) as measured by nitrogen isotope painng and isotope dilution. Aquat h4icrob Ecol 11. 181-191
Jsrgensen KS (1989) Annual pattern of denitrification and nitrate ammonification in estuarine sediment. Appl Envi- ron Microbiol55: 184 1-1847
Jsrgensen KS, Ssrensen J (1988) Two annual maxima of nitrate reduction and denitrification in estuarine sediment (Norsminde Fjord, Denmark). Mar Ecol Prog Ser 48: 147-154
Joye SB, Hollibaugh JT (1995) Influence of sulfide inhibition of nitrification on nitrogen regeneration in sediments. Science 270:623-625
Kankaanpda H, Vallius H, Sandman 0, Niemisto L (1997) Determination of recent sedimentation in the Gulf of Fin- land uslng I3'Cs. Ocean01 Acta 20 823-836
Kemp WM, Sampou P, Caffrey J, Mayer M, Henriksen K, Boynton WR (1990) Ammonium recychng versus denitnfi- cation in Chesapeake Bay sediments. Lmnol Oceanogr 35:1545-1563
Kester DR (1975) Dissolved gases other than CO2. In: Riley JP, Skirrow G (eds) Chemical oceanography, Vol 1, 2nd edn. Academic Press, London, p 497-556
Kivi K, Kaitala S, Kuosa H, Kuparinen J , Leskinen E, Lignell R, Marcussen B, Tamminen T (1993) Nutrient limitation and grazing control of Baltic plankton community during annual succession. Limnol Oceanogr 38.893-905
Ko~ke I , Sorensen J (1988) Nitrate reduction and denitrifica- tion in marine sediments. In: Blackburn TH, Ssrensen J (eds) Nitrogen cycling in coastal ma~ine environments. John Wiley & Sons Ltd, Chichester, p 251-273
Koop K, Boynton WR, Wulff F. Carman R (1990) Sed.unent- water oxygen and nutrient exchanges along a depth gra- dient in the Baltic Sea. Mar Ecol Prog Ser 63:65-77
Kristensen E (1988) Benthic fauna and biogeochemical pro- cesses in marine sediments: microbial activities and fluxes In- Blackburn TH, Ssrensen J (eds) Nitrogen cycllng in coastal marine environments. John Wiley & Sons Ltd, Chichester, p 275-299
Laine AO, Sandler H, Andersin AB, Stigzelius J (1997) Long- term changes of macrozoobenthos In the Eastern Gotland Basin and the Gulf of Finland (Baltic Sea) in relation to the hydrographical regime. J Sea Res 38:135-159
Lohse L, Kloosterhuis HT, van Raaphorst W, Helder W (1996) Denitnfication rate as measured by the isotope pairing method and by the acetylene inhibition technique in con- tinental shelf sedirnents of the North Sea. Mar Ecol Prog Ser 132:169-179
Matthaus W. Lass HU (1995) The recent salt inflow into the Baltic Sea. J Phys Oceanogr 25:280-286
24 Mar Ecol Prog Ser 172: 13-24, 1998
Middelburg JJ, Soetaert K, Herman PMJ (1996) Evalution of the nltrogen isotope-pairing method for measuring ben- thic denitrification. a simulation analysis. Limnol Oceanogr 41:1839-1844
Nielsen LP (1992) Denitrification in sediment determined from nitrogen isotope pairing. FEMS Microb Ecol 86: 357-362
Nlelsen LP, Risgaard-Petersen N, Rysgaard S. Blackburn TH (1996) Reply to the note by Middelburg et al. Limnol Oceanogr 41:1845- 1846
Nowicki BL, Requintina E, Van Keuren D. Kelly JR (1997) Nitrogen losses through sediment denitrification in Boston Harbor and Massachusetts Bay. Estuaries 20:626-639
Ogilvie B, Nedwell DB, Harrison RM, Robinson A, Sage A (1997) High nitrate, muddy estuaries as nitrogen sinks: the nitrogen budget of the River Colne estuary (United King- dom). Mar Ecol Prog Ser 150:217-228
Pelegri SP, Nielsen LP, Blackburn TH (1994) Denitrification in estuarine sediment simulated by the irngation activity of the amphipod Corophium volutator. Mar Ecol Prog Ser 105:285-290
Perttila M, Niemlsto L, Makela K (1995) Distribution, devel- opment and total amounts of nutrients in the Gulf of Fin- land. Estuar Coast Shelf Sci 41:345-360
Rahm L, Conley D, Sanden :P, Wulff F, Stalnacke P (1996) Time series analysis of nutrient inputs to the Baltic Sea and changing DSi:DIN ratios. Mar Ecol Prog Ser 130: 221-228
Rinne I (1988) Typenpoiston tarpeellisuus Helsingin ja Espoon kaupunkien jatevesista. (Need for nitrogen removal from Helsinki and Espoo wastewaters). In: Peso- nen L (ed) Helsingin ]a Espoon edustan merialueiden velvoitetarkkailu vuosina 1970-1986 Tutkimustoimiston tiedonantoja 1.7:215-256
fisgaard-Petersen N. Rysgaard S, Nielsen LP. Revsbech NP (1994) D~urnal variation of denitrification and nitrification in sediments colonized by benthic microphytes. Limnol Oceanogr 39:573-579
Ronner U (1985) Nitrogen transformations in the Baltic Proper. denitrification counteracts eutrophication. Ambio 14:134-138
Ronner U, Sorensson F (1985) Denitrification rates in the low- oxygen waters of the stratified Baltic Proper. Appl Environ ~Microbiol 50:801-806
Rysgaard S, Risgaard-Petersen N. Nielsen LP, Revsbech NP (1993) Nitrification and denitrification in lake and estuar- ine sediments measured by the lSN dilution technique and isotope pairing. Appl Envi.ron Microbial 59 2093-2098
Seitzinger SP (1988) Denitrification in freshwater and coastal marine tlcosystems: ecolog~cal and geochemical signifi- cance. Limnol Oceanogr 33:707-724
Editorial responsibility: Otto Kinne (Editor), Oldendorf/Luhe, Germany
Seitzinger SP, Giblin AE (1996) Estimating denitrification in North Atlantic continental shelf sediments. Biogeochem- istry 35:235-260
Seitzinger SP, Nielsen LP, Caffrey J, Christensen PB (1993) Denitrification measurements in aquatic sediments: a comparison of three methods. Biogeochemistry 23: 147-167
Seitzinger SP, Nixon SW (1985) Eutrophication and the rate of denitrification and N 2 0 production in coastal marine sedi- ments. Limnol Oceanogr 30:1332-1339
Seppanen H ( l 992) Typenpoiston tarpeellisuudesta. (On the necessity of reducing N in waste water.) Vesitalous 33(1): 6-11
Shaffer G, Ronner U (1984) Denitrification in the Baltic Proper deep water. Deep-Sea Res 31:197-220
Smith CJ, DeLaune RD (1983) Nitrogen loss from freshwater and saline estuarine sediments. J Environ Qual 12: 514-518
Smith CJ, DeLaune RD, Patrick WH Jr (1985) Fate of riverine nitrate entering an estuary: I . Denitrification and nitrogen burial. Estuaries 8:15-21
Ssrensen J, Rasmussen LK, Koike I (1987) Micromolar sulfide concentrations d e v i a t e acetylene blockage of nitrous oxide reduction by denitrifying Pseudomonas fluorescens. Can J Microbiol33:lOO 1-1005
Stockenberg A, Johnstone RW (1997) Benthic denitnfication in the Gulf of Bothnia. Estuar Coast Shelf Sci 45:835-843
Tamminen T (1992a) Itameren typpikysymys-ymparis- tologiikan musta aukko? (Nitrogen in the Baltic Sea: the black hole of environmental logic.) Vesitalous 33(2):11-16
Tamminen T (1992b) Typenpoiston tarpeettomuudesta: ty- pensidonta, myrkkylevat ja denitnf~kaatio Suomenlahden vesiensuojelukeskustelussa. (On the unnecessity of reduc- ing N in waste water: nitrogen fixation, toxic algae and denitrification in the Gulf of Finland water protection debate.) Vesitalous 33(2):18-23
Trimmer M, Nedwell DB, Sivyer DB, Malcolm SJ (1998) Nitro- gen fluxes through the lower estuary of the river Great Ouse, England: the role of bottom sediments. Mar Ecol Prog Ser 163:109-124
Wassmann P (1990) Relationship between primary and export production in the boreal coastal zone of the North Atlantic. Limnol Oceanogr 35:464-471
Winterhalter B (1972) On the geology of the Bothnlan Sea, an epeiric sea that has undergone Pleistocene glaciation. Geol Surv Fin Bull 258:l-66
Wulff F, Stigebrandt A, Rahm L (1990) Nutrient dynamics of the Baltic Sea Ambio 1.9:126-133
Yoon WB, Benner R (1992) Denitrification and oxygen con- sumption in sediments of two south Texas estuaries. Mar Ecol Prog Ser 90:157-167
Submitted: February 25, 1998; Accepted: July 31, 1998 Proofs received from author(s): September 30, 1998