Spatial and temporal dynamics of urban sprawl along two urban–rural transects: A case study of...
14
Landscape and Urban Planning 79 (2007) 96–109 Spatial and temporal dynamics of urban sprawl along two urban–rural transects: A case study of Guangzhou, China Xi Jun Yu ∗ , Cho Nam Ng 1 Department of Geography, the University of Hong Kong, Hui Oi Chow Science Building, Pokfulam Road, Hong Kong, China Received 20 September 2005; received in revised form 21 March 2006; accepted 21 March 2006 Available online 27 June 2006 Abstract Detailed understanding of landscape changes along the urban–rural gradient provides a useful tool to compare the structural and functional differences of landscape patches at different orientations. Although several case studies have been conducted confirming the efficacy of this approach, integrating temporal data with gradient analysis is still rarely used in practice. In this study, a combination of remote sensing images, landscape metrics and gradient analysis are employed to analyze and compare both the spatial and temporal dynamics of urban sprawl in Guangzhou, China. The results show that landscape change in Guangzhou exhibits distinctive spatial differences from the urban center to rural areas, with higher fragmentation at urban fringes or in new urbanizing areas. Due to the complexity of top-down constraints and local interactions, Guangzhou exhibits a more complex, dynamic, multidimensional configuration of urban sprawl that is different from other cities in China. Urban area expanded towards the north and south areas due to the increased population and rapid economic development. Property market forces and government policy led to the rapid growth towards the southern areas. The study also confirms the hypothesis of diffusion-coalescence urban dynamics model in the process of urbanization. It demonstrates that in order to reveal the complexity of landscape pattern, temporal data are needed to capture the baseline as well as the spatio-temporal dynamics of landscape changes along the gradient. Combining temporal data with gradient analysis can characterize the complex spatial pattern of urbanization in Guangzhou well. © 2006 Elsevier B.V. All rights reserved. Keywords: Urbanization; Landscape metrics; Landscape pattern; Gradient analysis; Spatio-temporal analysis; Guangzhou, China 1. Introduction During the past century, the world’s population had been rapidly congregating in urban areas. The urban population in the world was estimated at 2.4 billion in 1995 and a doubling is expected at about the year 2025 (Antrop, 2000). Increasing population and urbanization result in the most complex process of land use and land cover changes from local to global scale. This process, in turn, has profoundly disrupted the structure and function of ecosystems. For example, although urban areas account for only 2% of Earth’s land surface, they produce 78% of greenhouse gases, thus contributing significantly to global cli- mate changes (Grimm et al., 2000). Increasing urbanization is also thought to be an important cause of species extinction and ∗ Corresponding author. Tel.: +852 22415970; fax: +852 25598994. E-mail addresses: [email protected] (X.J. Yu), [email protected] (C.N. Ng). 1 Tel.: +852 28597025; fax: +852 25598994. biotic homogenization (McKinney, 2006), hydrological alter- ations (Paul and Meyer, 2001), and rapid loss of cropland (Lin and Ho, 2003). Thus, the relationships between urbanization and ecological effects are gaining increasing attention in recent stud- ies (Sui and Zeng, 2001; Carsjens and Van Lier, 2002; Herold et al., 2003; Antrop, 2004). The morphology and evolution of cities caused by urban sprawl have long been hot topics in geography and other dis- ciplines, and several classic theories have been developed, such as the Concentric Zone Theory, the Sector Theory, and the Mul- tiple Nuclei Theory (Luck and Wu, 2002; Zhang et al., 2004). These theories tend to focus on economical and social issues and the urban hierarchy that cannot fully address environmen- tal and ecological parameters. Furthermore, the spatio-temporal characteristics of urban expansion have long been neglected or remained hypothetical due to the difficulties of data assem- blage (Batty, 2002). For example, a hypothetical framework of spatio-temporal urban expansion in the form of alternating pro- cesses of diffusion and coalescence was postulated by Dietzel et al. (2005) (Fig. 1). In fact, urbanization processes are com- 0169-2046/$ – see front matter © 2006 Elsevier B.V. All rights reserved. doi:10.1016/j.landurbplan.2006.03.008
Transcript of Spatial and temporal dynamics of urban sprawl along two urban–rural transects: A case study of...

A
dalChetlpat©
K
1
rtipoTaaoma
c
0d
Landscape and Urban Planning 79 (2007) 96–109
Spatial and temporal dynamics of urban sprawl along twourban–rural transects: A case study of Guangzhou, China
Xi Jun Yu ∗, Cho Nam Ng 1
Department of Geography, the University of Hong Kong, Hui Oi Chow Science Building, Pokfulam Road, Hong Kong, China
Received 20 September 2005; received in revised form 21 March 2006; accepted 21 March 2006Available online 27 June 2006
bstract
Detailed understanding of landscape changes along the urban–rural gradient provides a useful tool to compare the structural and functionalifferences of landscape patches at different orientations. Although several case studies have been conducted confirming the efficacy of thispproach, integrating temporal data with gradient analysis is still rarely used in practice. In this study, a combination of remote sensing images,andscape metrics and gradient analysis are employed to analyze and compare both the spatial and temporal dynamics of urban sprawl in Guangzhou,hina. The results show that landscape change in Guangzhou exhibits distinctive spatial differences from the urban center to rural areas, withigher fragmentation at urban fringes or in new urbanizing areas. Due to the complexity of top-down constraints and local interactions, Guangzhouxhibits a more complex, dynamic, multidimensional configuration of urban sprawl that is different from other cities in China. Urban area expandedowards the north and south areas due to the increased population and rapid economic development. Property market forces and government policy
ed to the rapid growth towards the southern areas. The study also confirms the hypothesis of diffusion-coalescence urban dynamics model in therocess of urbanization. It demonstrates that in order to reveal the complexity of landscape pattern, temporal data are needed to capture the baselines well as the spatio-temporal dynamics of landscape changes along the gradient. Combining temporal data with gradient analysis can characterizehe complex spatial pattern of urbanization in Guangzhou well.ysis;
baaeie
scat
2006 Elsevier B.V. All rights reserved.
eywords: Urbanization; Landscape metrics; Landscape pattern; Gradient anal
. Introduction
During the past century, the world’s population had beenapidly congregating in urban areas. The urban population inhe world was estimated at 2.4 billion in 1995 and a doublings expected at about the year 2025 (Antrop, 2000). Increasingopulation and urbanization result in the most complex processf land use and land cover changes from local to global scale.his process, in turn, has profoundly disrupted the structurend function of ecosystems. For example, although urban areasccount for only 2% of Earth’s land surface, they produce 78%
f greenhouse gases, thus contributing significantly to global cli-ate changes (Grimm et al., 2000). Increasing urbanization islso thought to be an important cause of species extinction and
∗ Corresponding author. Tel.: +852 22415970; fax: +852 25598994.E-mail addresses: [email protected] (X.J. Yu),
[email protected] (C.N. Ng).1 Tel.: +852 28597025; fax: +852 25598994.
Tatcobsce
169-2046/$ – see front matter © 2006 Elsevier B.V. All rights reserved.oi:10.1016/j.landurbplan.2006.03.008
Spatio-temporal analysis; Guangzhou, China
iotic homogenization (McKinney, 2006), hydrological alter-tions (Paul and Meyer, 2001), and rapid loss of cropland (Linnd Ho, 2003). Thus, the relationships between urbanization andcological effects are gaining increasing attention in recent stud-es (Sui and Zeng, 2001; Carsjens and Van Lier, 2002; Heroldt al., 2003; Antrop, 2004).
The morphology and evolution of cities caused by urbanprawl have long been hot topics in geography and other dis-iplines, and several classic theories have been developed, suchs the Concentric Zone Theory, the Sector Theory, and the Mul-iple Nuclei Theory (Luck and Wu, 2002; Zhang et al., 2004).hese theories tend to focus on economical and social issuesnd the urban hierarchy that cannot fully address environmen-al and ecological parameters. Furthermore, the spatio-temporalharacteristics of urban expansion have long been neglectedr remained hypothetical due to the difficulties of data assem-
lage (Batty, 2002). For example, a hypothetical framework ofpatio-temporal urban expansion in the form of alternating pro-esses of diffusion and coalescence was postulated by Dietzelt al. (2005) (Fig. 1). In fact, urbanization processes are com-
X.J. Yu, C.N. Ng / Landscape and Urban Planning 79 (2007) 96–109 97
scenc
pile(tftru2td
m2rtciet(elei1ssstaiecgtsgitimt
id
C‘itbpmtiWthLctipA
drdnwsitrosbu
tfstt
Fig. 1. A hypothesis of diffusion-coale
lex and varied, and so are the landscape ecological aspectsnvolved (Antrop, 2000). Thus, decisions on urban planning andand use management in any urban landscape must consider thecological, physical and social components of the whole systemZipperer et al., 2000; Leitao and Ahern, 2002). The introduc-ion of the concept of landscape ecology into urban studies canacilitate this effort. The rapid development of remote sensingechnology, together with the proliferation of landscape met-ics, also provides a potential means for understanding howrban patterns evolve and change over time (Herold et al., 2002,003, 2005). However, these studies seldom link temporal datao gradient analysis to investigate the specific process-relatedifferences.
Land use change is a dynamic process, and the direction andagnitude of landscape change could be different (Li and Yeh,
004). From an ecological perspective, the urban–rural gradientepresents the structural and functional differences of transi-ional patches in the temporal and spatial contexts, which canapture the spatio-temporal complexity of urban dynamics. Byntegrating ecological, social, and physical variables in differ-nt disciplines, the gradient paradigm has proved to be a usefulool for studying the ecological consequences of urbanizationMcDonnell and Pickett, 1990; Medley et al., 1995; Foresmant al., 1997). Studies have demonstrated that habitat diversity andife-support conditions vary greatly across the urban–rural gradi-nt (Bryant, 2006). Other environmental variables have also beennvestigated along the urban–rural gradient (Zhu and Carreiro,999; Honnay et al., 2003; Weng and Yang, 2004). Since land-cape metrics can describe the spatio-temporal changes of land-cape pattern, they thus provide an alternative method for mea-uring urban–rural change. Combining landscape metrics withhe gradient paradigm, the spatial properties of land use changeslong the specific transect have been systematically investigatedn recent studies (Luck and Wu, 2002; Zhang et al., 2004). How-ver, these pioneering studies can only address the static spatialharacteristics of the urban–rural gradient because only one sin-le data set was employed, so they cannot adequately reflecthe temporal differences of intra-city urban structure. A recenttudy has addressed this issue by evaluating a time series ofradients along multiple transects in Chengdu, a mid-sized cityn central and western China (Schneider et al., 2005). Due to
he complexity of urban morphology and the diversity of driv-ng forces during the transition from a centrally planned to aarket-oriented economy system, more comparative studies ofhe spatio-temporal characteristics of urban structure are needed
dWci
e urban process and metrics behaviors.
n order to formulate a more general theoretical framework ofynamic urban expansion.
Urbanization has also been a prominent phenomenon inhina’s economic development since the country adopted the
reform and openness’ policy in 1978. The urban built-up arean 1996 had reached 1.388 million hectares which was 2.6 timeshat in 1949 (Lin and Ho, 2003). The speed of urban sprawl haseen most prominent in the Pearl River Delta region during theast two decades. For example, urban areas have increased byore than 300% between 1988 and 1996 (Seto et al., 2002), and
he growth exhibited the characteristics of spatial dependencyn different parts of the region (Weng, 2002; Li and Yeh, 2004).
ith the power devolving gradually from the central governmento the municipalities, patterns and processes of China’s citiesave undergone fundamental transformation (Gaubatz, 1999).arge cities, such as Beijing, Shanghai, and Guangzhou, arehanging from the concentric zone cities of the industrial ageo the decentralized multi-nuclei cities of today. This changes also an indicator of the transition of Chinese cities to moreost-industrial forms, such as those seen in the USA, Canada,ustralia, and Europe (Schneider et al., 2005).As one of the largest cities in China, Guangzhou has a
evelopment history of almost 2000 years and has undergoneapid economic development and urbanization over the past twoecades. In 2000, the Guangzhou government put forward aew development strategy with the aim of building itself into aorld class metropolis by 2010 (Weng and Yang, 2003). Con-
idering the rapid transformations of land use requirements, it isnteresting, for both theoretical and practical reasons, to studyhe landscape change of Guangzhou at the strategic level overecent decades. The findings will also be useful for analyzingther Chinese cities. By combining gradient analysis with land-cape metrics, this study addresses the process of urbanization inoth spatial and temporal contexts, and investigates its dynamicssing a more quantitative approach.
In this study, four sets of Landsat TM images were used andwo transects were selected to analyze urban development at dif-erent orientations and its effects on landscape pattern. The tran-ects extend from the core of Guangzhou city to the boundarieshat border with other cities. The study focused on comparinghe differences of urban expansion over time to investigate the
riving forces. It addressed the following research questions: (1)hat are the general temporal and spatial trends of landscapehanges along the two transects? (2) Is there any differencen the rates of landscape changes through time by comparing
9 d Urb
ftpp
2
1aRscctR1RcZ
aGt4(a
bdicu
3
(wistrni1mtw
u
8 X.J. Yu, C.N. Ng / Landscape an
our remote sensing data sets? (3) What are the driving forceshat cause the differences in land use and their implications forlanning? (4) Does Guangzhou exhibit a diffusion-coalescencerocess with a multi-nucleated urban pattern?
. Study area
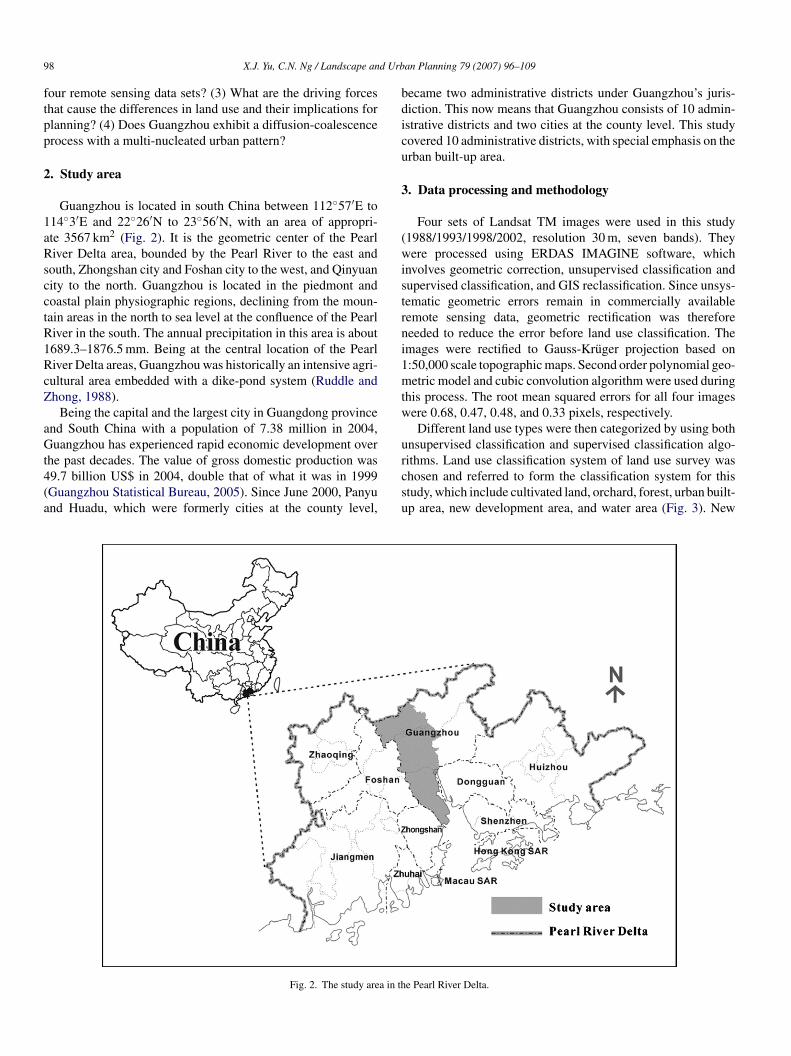
Guangzhou is located in south China between 112◦57′E to14◦3′E and 22◦26′N to 23◦56′N, with an area of appropri-te 3567 km2 (Fig. 2). It is the geometric center of the Pearliver Delta area, bounded by the Pearl River to the east and
outh, Zhongshan city and Foshan city to the west, and Qinyuanity to the north. Guangzhou is located in the piedmont andoastal plain physiographic regions, declining from the moun-ain areas in the north to sea level at the confluence of the Pearliver in the south. The annual precipitation in this area is about689.3–1876.5 mm. Being at the central location of the Pearliver Delta areas, Guangzhou was historically an intensive agri-ultural area embedded with a dike-pond system (Ruddle andhong, 1988).
Being the capital and the largest city in Guangdong provincend South China with a population of 7.38 million in 2004,uangzhou has experienced rapid economic development over
he past decades. The value of gross domestic production was9.7 billion US$ in 2004, double that of what it was in 1999Guangzhou Statistical Bureau, 2005). Since June 2000, Panyund Huadu, which were formerly cities at the county level,
rcsu
Fig. 2. The study area in th
an Planning 79 (2007) 96–109
ecame two administrative districts under Guangzhou’s juris-iction. This now means that Guangzhou consists of 10 admin-strative districts and two cities at the county level. This studyovered 10 administrative districts, with special emphasis on therban built-up area.
. Data processing and methodology
Four sets of Landsat TM images were used in this study1988/1993/1998/2002, resolution 30 m, seven bands). Theyere processed using ERDAS IMAGINE software, which
nvolves geometric correction, unsupervised classification andupervised classification, and GIS reclassification. Since unsys-ematic geometric errors remain in commercially availableemote sensing data, geometric rectification was thereforeeeded to reduce the error before land use classification. Themages were rectified to Gauss-Kruger projection based on:50,000 scale topographic maps. Second order polynomial geo-etric model and cubic convolution algorithm were used during
his process. The root mean squared errors for all four imagesere 0.68, 0.47, 0.48, and 0.33 pixels, respectively.Different land use types were then categorized by using both
nsupervised classification and supervised classification algo-
ithms. Land use classification system of land use survey washosen and referred to form the classification system for thistudy, which include cultivated land, orchard, forest, urban built-p area, new development area, and water area (Fig. 3). Newe Pearl River Delta.

X.J. Yu, C.N. Ng / Landscape and Urban Planning 79 (2007) 96–109 99
Gua
dbccattmLofLtsd
aaied1uar
wwcftipat
uerht1toc
t
Fig. 3. Land use changes in
evelopment area is defined as an area that has recently beenulldozed to make way for construction, and thus has a highontrast characteristic in remotely sensing images. It is thereforelassified separately to capture land use dynamics. ISODATAlgorithm was first used to perform unsupervised classificationo obtain different land use clusters. This preliminary interpre-ation can maximally reduce the artificial errors and select the
ost appropriate clusters for further processing. The Maximumikelihood algorithm was then used to improve the accuracyf land use classification. As a road network is very importantor calculating landscape metrics (Herzog and Lausch, 2001;ausch and Herzog, 2002), a vector road layer was merged with
he above classified images. Thus, the final land use classes con-ist of cultivated land, orchard, forest, urban built-up area, newevelopment area, road, and water area.
Accuracy assessment is critical for a map generated fromny remote sensing data (Congalton and Green, 1999; Lunettand Lyon, 2004). A confusion matrix was used for this purposen this study. In order to ensure that the dates of the refer-nced data were obtained from the same periods, three kinds ofata were employed to conduct an accuracy assessment. For the
988 and 1993 images, classification accuracies were evaluatedsing color aerial photography taken in the corresponding yearsnd the overall accuracy was found to be 92.67% and 93.00%,espectively. For the 1998 image, a 1:10,000 topographic mapctit
ngzhou in 1988 and 2002.
as used to select the referenced data and the overall accuracyas found to be 93.45%. The ground truth method has been
arried out for the 2002 image and the overall accuracy wasound to be 91.10%. Because land use types are closely relatedo geographical information such as altitude and grade, and thisnformation has some specific distribution rules, a GIS modelrogramme was finally used to reduce the errors with the help ofdigital elevation model, which was collected from a 1:50,000
opographic map.Land use misclassification will have a direct influence on land
se composition, which is reflected by the statistical variation ofach land use class. This is difficult to overcome due to the dataesolution and the accuracy of classification. However, studyas demonstrated that bias in landscape metrics did not appearo be amplified by land cover misclassification (Wichham et al.,997). Moreover, the objective of this study was to characterizehe overall dynamic trend of landscape change. Thus, the databtained can accordingly reflect the observed land use statisticalhange and its spatial configuration.
To detect the dynamics of landscape pattern in Guangzhou,wo transects were selected that cut across the entire Guangzhou
ity from the northwest to the southeast and from the west tohe east, respectively (Fig. 3). The northwest–southeast transects composed of twenty 5 km × 5 km blocks and the west–eastransect six blocks. The orientation was chosen to cover the dis-
100 X.J. Yu, C.N. Ng / Landscape and Urban Planning 79 (2007) 96–109
Table 1Landscape metrics selected in this study
Name Description Justification
Number of patches Total number of patches in the landscape Fragmentation indexMean patch size (ha) Average size of patches Fragmentation indexLargest patch index (%) The area of the largest patch in the landscape divided by total
landscape area, multiplied by 100Dominance index
Area weighted mean shape index Shape index adjusted for size Fragmentation indexArea weighted mean patch fractal dimension Shape complexity weighted by the area of patches Fragmentation indexShannon’s diversity index Equals minus the sum, across all patch types, of the proportional
abundance of each patch type multiplied by that proportionDiversity index
Contagion index (%) 0 < CONTAG ≤ 100. Approaches 0 when the patch types aremaximally disaggregated and interspersed
Fragmentation index
Patch cohesion index 0 ≤ COHESION < 100. Approaches 0 as the proportion of thefocal
d less
A measure of physical connectedness
N
tMRcIboEfr
4
4
otnttimwwattut
TL
COFUN
N
ga2ms
4
stsnp(poaitutppsl
landscape comprised of theincreasingly subdivided an
ote: The details of the parameters can be found in McGarigal et al. (2002).
inctive land use changes and to avoid the influence of Baiyunountain Reserve that located 7.5 km north of Guangzhou.oads were converted to raster format and then merged with theategorical data with a resolution of 30 m × 30 m using ERDASMAGINE. Landscape metrics were then calculated for eachlock at the class and landscape levels using the raster versionf FRAGSTATS program (Version 3.3) (McGarigal et al., 2002).ight metrics were selected in this study (Table 1), which can
ully reflect their conceptual basis and reduce correlation andedundancy.
. Result
.1. General trend of land use change in Guangzhou
In 1988 Guangzhou was dominated by cultivated land,rchard, and forest land, which together accounted for 80.8% ofhe total area (Table 2). In contrast, the urban built-up area andew development area covered only 30,507 ha, a mere 8.5% ofhe total area. This indicated that Guangzhou was still an agricul-ural dominated area, whereas urban development was still in itsnitial stages at that time. From 1988 to 2002, urban sprawl was
aintained at a rapid speed and a total of 46,008 ha urban landere added (including new development areas). The increaseas mainly due to the conversion from cultivated land and forest,loss of 30.2% of the total area during the study period. In 2002
he urban built-up area and new development areas amountedo 76,515 ha, more than twice that in 1988. The increases of therban built-up area were 6938, 20,049, and 19,021 ha, respec-ively during the three intervals. These changes, together with the
able 2and use statistics in Guangzhou between 1988 and 2002 (ha)
1988 1993 1998 2002
ultivated land 127514 117664 111535 85252rchard 45008 47308 49388 50908orest land 115670 105203 88213 84556rban built-up area 29036 33319 53877 74643ew development area 1471 4126 3617 1872
ote: Data calculated from the whole Guangzhou images.
umshptonsu
out
class decreases and becomesphysically connected
rowth of new development area, indicate that the rapid industri-lization and urbanization mainly took place between 1993 and002. This process accompanied the determination and com-itment of the Chinese government towards a market economy
ystem since 1992.
.2. Landscape metrics at class level along the transects
In general, the west–east transect shows a similar but moreimple pattern compared with that of the northwest–southeastransect. Thus, only the results of the northwest–southeast tran-ect at class level are present here. Cultivated land has a lowumber of patches at the urban center and gradually reaches theireak values at 15 km in the northwest and 15 km in the southeastFig. 4). But the peak values of the largest patch index and meanatch size appear at 25 km in the northwest. In the southern partf the transect, the peaks extend southward from 20 km in 1988nd 1993 to 35 km in 1998 and 2002. As the largest patch indexs a simple measure of dominance (McGarigal et al., 2002),he variation reflects the low dominance of cultivated land at therban center and the gradual loss towards the rural areas throughime. Area weighted mean shape index and area weighted meanatch fractal dimension increase from the urban center and reacheak values at 25 km in the northwest and around 20 km in theoutheast. This implies the high shape complexity of cultivatedand in these areas. In contrast with the relatively stable peak val-es at one distance in the northwest, the peaks of area weightedean shape index and area weighted mean patch fractal dimen-
ion extend southward from 20 to 35 km over time, suggesting aigher level of human activities in these areas. With increasingatch cohesion index values towards the ends of the transect, cul-ivated land patches became more aggregately distributed amongther types patches. When comparing though time, variation ofumber of patches is erratic and inconsistent, but the patch size,hape complexity, and patch connectivity are decreasing at therban center.
The number of patches of orchard has a similar pattern to thatf cultivated land. It increases from the urban center towards therban fringe, and subsequently decreases at both ends of theransect (Fig. 5). Two prominent peaks of largest patch index

X.J. Yu, C.N. Ng / Landscape and Urban Planning 79 (2007) 96–109 101
ics fo
agvtufastciF2tvc
aaescbtV
suwfideaca
tathdtisTh
Fig. 4. Variations in landscape metr
nd mean patch size appear at 5 and 55 km in the southeast, sug-esting the high dominance of orchards at these distances. Theiralues generally decrease over time, suggesting the decliningrend of dominance during the study period. Several peak val-es of shape indices are observed at rural areas or on the urbanringes. The declines of area weighted mean shape index andrea weighted mean patch fractal dimension from 1988 to 2002uggest that the shape complexity has become more regular overime. Low patch cohesion index values are observed at the urbanenter and at 20 km distance in the southeast, indicating orchards highly subdivided by other type patches at these distances.rom 1988 to 2002, the number of patches decreases between5 km in the northwest and 10 km in the southeast, and increasesowards both ends of the transect. The declining patch cohesionalues over time suggest increasing subdivision and less physi-al connection of orchard among other patch types.
The number of patches of forest is low at the urban centernd increases along the transect until 15 km in the northwestnd 20 km in the southeast, with subsequent decline towards thends of the transect (Fig. 6). The largest patch index shows a con-istent multi-peaked pattern along the transect, with relatively
onstant values over the study period. However, both the num-er of patches and mean patch size values decrease from 1988o 2002, together suggesting the process of the loss of forest.ariations of shape indices appear to be low in the urban center,atwi
r cultivated land along the transect.
uggesting that the forest patches have become more regular inrban areas. This can also be reflected by their declines over timeith the process of urbanization. The physical connectedness of
orest patches is also low at urban areas, which is character-zed by low values of the patch cohesion index. The constantecline of the patch cohesion index over time indicates that for-st is increasingly disaggregated with urbanization. High valuesppear at 40 km in the southeast because this area is mainlyovered by hilly forest that has reduced the impact of humanctivities.
The number of patches of urban built-up area is low athe urban center and increases until 15 km in the northwestnd around 20 km in the southeast, and subsequently decreasesowards the ends of the transect (Fig. 7). The largest patch indexas a multi-peaked pattern along the transect, indicating theominant status of urban patches at these distances. The rela-ively higher values appearing at 10 km in the northwest and 5 kmn the southeast, instead of at the urban center, may be due to theeparation of the urban center into two parts by the Pearl River.he mean patch size values can also reflect this character. Theigh complexity of urban patches appears at the urban center, 20
nd 50 km in the southeast, respectively, which are revealed byhe high values of area weighted mean shape index and areaeighted mean patch fractal dimension. The patch cohesionndex is high at 5 km in the northwest and 40 km in the southeast,

102 X.J. Yu, C.N. Ng / Landscape and Urban Planning 79 (2007) 96–109
etric
weTiobp2o
4
anhpr1oiimi
cpliiridoidwseuceiws
Fig. 5. Variations in landscape m
hich indicates the high connectedness of urban patches. How-ver, the highest value appears at 30 and 40 km in the northwest.his may be due to the relatively low urban area aggregating
n a small area that makes urban patches more clumped in itswn distribution. It has increased from 1988 to 2002 at eachlock, suggesting more aggregation of urban patches with therocess of urbanization. But an obvious increase is observed at0, 40, and 50 km in the southeast, revealing the higher degreef urbanization at these distances.
.3. Landscape metrics at landscape level
Along the west–east transect, the landscape generally showedsimilar but simpler character compared with that of the
orthwest–southeast transect. Thus, the results are not presentedere. Along the northwest–southeast transect the number ofatches shows several peaks at different distances. It increasesapidly away from the urban center and reaches the peaks at5 km in the northwest and 15 km in the southeast (Fig. 8). Thether peak values appear at 30 km in the northwest and 40 km
n the southeast, respectively. The high values at these distancesndicate an obvious increase in the degree of landscape frag-entation. The patches become increasingly disaggregated andrregular from the urban center to the peripheral areas, which
bled
s for orchard along the transect.
an be characterized by the increase of area weighted meanatch fractal dimension. A direct result of disaggregation is theow level physical connectedness revealed by the patch cohesionndex. This finding reveals the behavior of the patch cohesionndex over time in a rapidly urbanized area, which has not beeneported in current studies. Human activities, such as urban-zation, will first result in more fragmented patches and thenisconnect them from each other, which will decrease the valuef the patch cohesion index. This process can be confirmed byts variations at 20 and 40 km in the southeast, around two newevelopment areas. However, it will gradually increase over timehen urbanization reaches to a certain degree, which corre-
ponds to the percolation threshold at the class level (McGarigalt al., 2002). The gradual extension and final connection amongrban patches might contribute to this point. Variations in theontagion index can further confirm this inference. Although it isrratic and inconsistent along the transect, temporal variationsn Shannon’s diversity index decline around the urban centerhereas they increase at the ends of the transect. Thus, the land-
cape has become more unevenly distributed and is dominated
y an urban built-up area at the urban center. On the contrary, theandscape at the ends of the transect become more equitably andvenly distributed when urban areas gradually became embed-ed in these areas.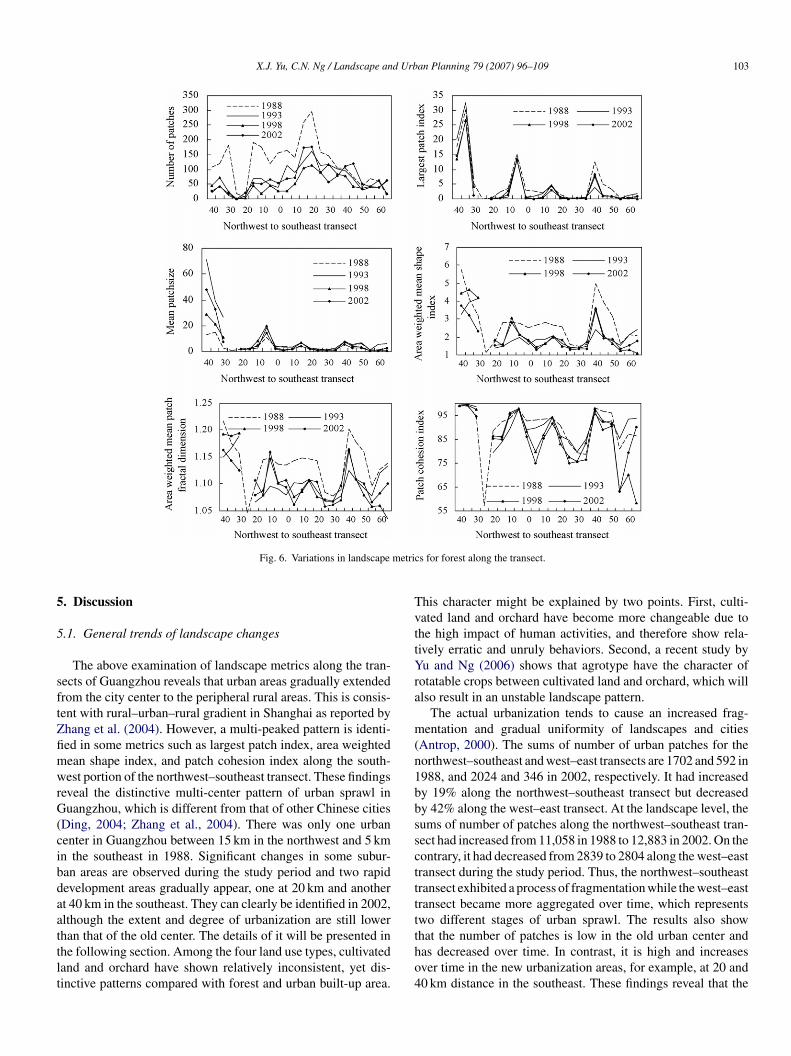
X.J. Yu, C.N. Ng / Landscape and Urban Planning 79 (2007) 96–109 103
metric
5
5
sftZfimwrG(cibdaattlt
TvttYra
m(n1bbssctttt
Fig. 6. Variations in landscape
. Discussion
.1. General trends of landscape changes
The above examination of landscape metrics along the tran-ects of Guangzhou reveals that urban areas gradually extendedrom the city center to the peripheral rural areas. This is consis-ent with rural–urban–rural gradient in Shanghai as reported byhang et al. (2004). However, a multi-peaked pattern is identi-ed in some metrics such as largest patch index, area weightedean shape index, and patch cohesion index along the south-est portion of the northwest–southeast transect. These findings
eveal the distinctive multi-center pattern of urban sprawl inuangzhou, which is different from that of other Chinese cities
Ding, 2004; Zhang et al., 2004). There was only one urbanenter in Guangzhou between 15 km in the northwest and 5 kmn the southeast in 1988. Significant changes in some subur-an areas are observed during the study period and two rapidevelopment areas gradually appear, one at 20 km and anothert 40 km in the southeast. They can clearly be identified in 2002,lthough the extent and degree of urbanization are still lower
han that of the old center. The details of it will be presented inhe following section. Among the four land use types, cultivatedand and orchard have shown relatively inconsistent, yet dis-inctive patterns compared with forest and urban built-up area.tho4
s for forest along the transect.
his character might be explained by two points. First, culti-ated land and orchard have become more changeable due tohe high impact of human activities, and therefore show rela-ively erratic and unruly behaviors. Second, a recent study byu and Ng (2006) shows that agrotype have the character of
otatable crops between cultivated land and orchard, which willlso result in an unstable landscape pattern.
The actual urbanization tends to cause an increased frag-entation and gradual uniformity of landscapes and cities
Antrop, 2000). The sums of number of urban patches for theorthwest–southeast and west–east transects are 1702 and 592 in988, and 2024 and 346 in 2002, respectively. It had increasedy 19% along the northwest–southeast transect but decreasedy 42% along the west–east transect. At the landscape level, theums of number of patches along the northwest–southeast tran-ect had increased from 11,058 in 1988 to 12,883 in 2002. On theontrary, it had decreased from 2839 to 2804 along the west–eastransect during the study period. Thus, the northwest–southeastransect exhibited a process of fragmentation while the west–eastransect became more aggregated over time, which representswo different stages of urban sprawl. The results also show
hat the number of patches is low in the old urban center andas decreased over time. In contrast, it is high and increasesver time in the new urbanization areas, for example, at 20 and0 km distance in the southeast. These findings reveal that the
104 X.J. Yu, C.N. Ng / Landscape and Urban Planning 79 (2007) 96–109
s for u
dottapctutp
5t
aamttigYc
sbtiag
a
wai
gTfsa1gt
Fig. 7. Variations in landscape metric
istinctive impacts of urbanization on landscape pattern varyver time. At first, the landscape becomes more fragmented dueo the initiation of urbanization. When the degree of urbaniza-ion increases to a threshold, the mean patch size will increasend the landscape will become more aggregated. In fact, thisrocess might be accompanied by a process of landscape matrixonversion. When comparing the number of urban patches overime, the decline in the urban center and the increase in newrbanized areas agree with the findings of Antrop (2004) thathe urban fringe or suburban landscapes are expressed in a com-lex, diverse and highly fragmented morphology.
.2. Rates and driving forces of landscape changes overime
Characterizing urban sprawl involves quantifying its patternnd analyzing the driving forces behind it. Landscape changeslong transects are profound due to the history of urban develop-ent, the physical geographic setting, and the characteristics of
he urban core (Medley et al., 1995). It is important to comparehem among different transects in order to capture the dynam-
cs of landscape change. The amount of urban built-up area isenerally considered as the parameter for this purpose (Li andeh, 2004; Sudhira et al., 2004). The growth rate of urban areaan be used to evaluate the spatial distribution of urban expan-tela
rban built-up area along the transect.
ion intensity (Xiao et al., 2006). In this study variations of urbanuilt-up area and new development area are employed to charac-erize the urban sprawl of Guangzhou. As the area of each blocks constant in this study, the annual urban growth, as defineds follow, of urban built-up area can be used to compare urbanrowth at different distances along the transects:
nnual urban growth = UAi+n − UAi
n
here n is the interval of the calculating period (in years); UAi+n
nd UAi are the urban built-up areas in the target blocks at time+ 1 and i, respectively. The results are illustrated in Fig. 9.
It is clear from Fig. 9 that the amounts and rates of urbanrowth differ strongly between transects and among locations.he southeast and east portions of the transects witnessed the
astest growth during the study period. This demonstrated thepatio-temporal differences of urban dynamics of the intra-cityreas. In particularly, high ratio of change is observed since993, which can be characterized by both higher annual urbanrowth and larger area of new development area. Investigatinghis difference requires the integration of land use policies at
he national and provincial levels and the responses of the localconomy and society. In Guangzhou, urban sprawl to the west isimited due to the influences of the border between Guangzhound Foshan. In the northwest, it is also restricted by the Baiyun
X.J. Yu, C.N. Ng / Landscape and Urban Planning 79 (2007) 96–109 105
scape
Mo1o
Fig. 8. Variations in landscape metrics at land
ountain Reserve and Baiyun International airport, and hencenly a slight increase occurred at 10 km in the north between993 and 1998. The growth towards the east reflects the processf inherent evolution from the inner city to the outer initiated by
pa
u
Fig. 9. Variations in urban built-up a
level along the northwest–southeast transect.
opulation growth and economic development since the ‘reformnd openness’ policy in the late 1970s.
With the increasing degree of urbanization in Guangzhou,rban expansion to the southeast has gradually replaced the tra-
rea and new development area.

1 d Urban Planning 79 (2007) 96–109
dptcoAdaomd2rkrci(waStse
seutsFewsseiochsmgb
5m
iufh1dtn
pdfsregsnenhuieemo
CitfoititreaitsrAhopid
5
06 X.J. Yu, C.N. Ng / Landscape an
itional eastward and northward expansion. Along the southeastortion of the northwest–southeast transect, two new urban cen-ers successively established: one located closer to Guangzhouenter (hereafter called the northern part of Panyu) and thether further south (hereafter called the southern part of Panyu).lthough there are social and economic causes, two differentriving forces are identified by further investigation. Since thennouncement of ‘the Provisional Regulation of the Land Rightsver State-owned Land in Cities and Towns’ in 1991, land priceechanisms began to have tangible effects on the land market
evelopment in China, especially in some large cities (Ding,004). The landscape in the northern part of Panyu clearlyeflects this process of market orientation in the real estate mar-et. Due to low land price, it has attracted much interest fromeal estate developers and residents from the Guangzhou urbanore. For example, there were a total of 116 real estate projectsn Panyu, amounting to 5127 ha floor spaces at June 2001Guangzhou Statistical Bureau, 2002). Most of these projectsere located close to Guangzhou in the northern part of Panyu
t Nancun (1243.8 ha), Dashi (935.6 ha), Zhongcun (522.0 ha),hawan (396.5 ha), and Shiqiao (174.1 ha). As compared with
he inherent evolution towards the east, low land price coulderve as a precursor for the recent urbanization in this area (Burgit al., 2004).
In contrast, landscape change in the southern part of Panyuhows a different character that is mainly influenced by gov-rnment policy and direct foreign investments. The area wasnderdeveloped and remote before the early 1990s. However,here have been rapid changes since the setting up of the Nan-ha Economic and Technological Development Zone in 1993.rom then on, several new policies were enacted to facilitateconomic development and foreign investment. By 2005, thereere already over 200 foreign companies established in Nan-
ha and that had also boosted the economic development in theurrounding areas (Guangzhou Statistical Bureau, 2005). Forxample, the total number of industrial enterprises in Panyu hadncreased about 54% from 4859 in 1995 to 7540 in 2003. Mostf them are established in Nansha Economic and Technologi-al Development Zone. The inflow of direct foreign investmentsas resulted in an obvious landscape change that can be clearlyeen by comparing the 1988 and 2002 images. This process wasainly due to the decision and development strategy from local
overnment. This kind of driving factor was defined as ‘initiator’y Antrop (2000).
.3. Implications for land use planning and urbananagement
Changes in landscape pattern along the transects may havemportant ecological implications to land management and landse planning. Studies have demonstrated that remnant forestragments, particularly larger ones, are critical for providingabitat and sustaining ecosystem functions (Christian et al.,
998; Lindenmayer et al., 1999). There is also evidence thatisconnected urban areas converge towards a pattern of con-iguous urban fabric (Seto and Fragkias, 2005). Along theorthwest–southeast transect, the number of patches and means
h
Fig. 10. Annual variation in forest areas during three intervals.
atch size of forest declined between 1988 and 1998. The rapidecline occurred in the urban core or in newly urbanized areas,or example between 20 km in the northwest and 30 km in theoutheast (Fig. 10). Thus, how to maintain the pre-urban naturalemnants that connect urban cores will be most important in anyffort to mitigate the potential impacts of urbanization. Linkingradient analysis with urban dynamics can help to detect suchpatially explicit urban patterns, and improve the ability of plan-ers to integrate ecological considerations in urban planning. Forxample, urban green space planning in Guangzhou has recog-ized the impact of urban expansion on the environment, andence important green corridors and nodes are proposed amongrban centers (Guangzhou Landscape Bureau, 2002). A signif-cant effort has been made by the Guangzhou Government tostablish two ‘green forest rings’ with a total area of 86 km2 thatncircle the urban cores of the city, and which can also help toitigate environmental pollution problems due to a high degree
f urban coalescence.Conservation of cultivated land is of great significance in
hina because of the scarce land resources per capita in compar-son to the world average (Lin and Ho, 2003). Thus, to maintainhe ‘dynamic equilibrium of farmland’ is proposed as one of theundamental objectives of land management of the country. Inrder to achieve this goal, ‘principle agricultural protecting area’s zoned and strictly controlled according to the ‘Ordinance forhe Protection of Primary Agricultural Land’, which was enactedn 1994, as well as other local regulations. Once the land is pro-ected as ‘principle agricultural protecting area’, it will be strictlyestricted from occupation by non-agricultural purposes. How-ver, this study reveals that the transition between cultivated landnd orchard has been rapid, especially along the main urban-zed gradients, where the urban–rural fringe is shifting rapidlyhrough time. For example, along the northwest–southeast tran-ect, only 57.9%, 51.9%, and 48.3% of the total cultivated landemained as the same type during three interval periods (Table 3).lso, conversion from cultivated land to other types is muchigher along the transect than in the whole Guangzhou area. Thisbservation indicates that the ‘dynamic equilibrium of farmland’olicy is ineffective in preserving farmland in Guangzhou. Thus,t is necessary to consider the spatial characters of landscapeynamics when reexamining land use policies.
.4. Testing the hypotheses and detecting stages of urban
prawlBy combining gradient analysis with time series data, twoypotheses postulated to investigate urban dynamics were tested

X.J. Yu, C.N. Ng / Landscape and Urban Planning 79 (2007) 96–109 107
Table 3Rates of change from cultivated land to other types
Interval Cultivated land to cultivated land Cultivated land to orchard
Guangzhou (%) NS transect (%) Guangzhou (%) NS transect (%)
1988–1993 62.0 57.9 12.0 15.51993–1998 59.9 51.9 17.0 17.91
iainst4oihsattca
dtugodnu1awiTzasdrdcsco
5t
cG
itustiiiuaolndagrtapaubompgpiestptcFacudt
A
998–2002 48.9 48.3
n this study. Seto and Fragkias (2005) hypothesized that therea weighted mean patch fractal dimension will increase dur-ng the early periods of urban land use change when new urbanuclei and expansion of existing urban space creates irregularlyhaped landscape pattern. The results of this study confirmedhis character in new development areas, for example at 20 and0 km in the southeast of the northwest–southeast transect. In theld urban core, however, a decline was revealed after the initialncrease from 1988 to 1993. This distinct process confirmed theypothesis proposed by Dietzel et al. (2005) that urban expan-ion exhibits an alternating process of diffusion and coalescence,nd the behaviors of landscape metrics vary accordingly duringhis process. The spatial evolution of cities can be described as awo-step process, starting with the expansion of an urban seed orore area, and beginning to coalesce when the diffusion reachescertain point.
Urban expansion in Guangzhou clearly demonstrated aiffusion-coalescence process with a multi-nucleated urban pat-ern. A shift from diffusion to coalescence was revealed in oldrban centers in 1993 when the landscape became more aggre-ated and compacted, which was characterized by the decreasef number of urban patches and an increase of mean patch size,ecline in shape complexity, and increase in contagion and con-ectivity. On the contrary, the shift appeared later in the newrbanized areas, for example at 20 and 40 km in the southeast in998. In fact, this pattern of urbanization can reflect the historynd strategy of urban development in Guangzhou. Before Panyuas designated as a district of Guangzhou in 2000, several urban-
zation centers were coexisting, but their rates of growth differed.his was the result of the establishment of targeted developmentones and other specialized centers, which reflect the economicnd social changes in China (Gaubatz, 1999). Variations in land-cape metrics values can detect the conversion process fromiffusion of new urban center to coalescence towards a satu-ated urban landscape (Dietzel et al., 2005). This distinct processemonstrates that different stages of urban growth and hierar-hical network might be more appropriate to explain the urbanprawl process in Guangzhou. It provides a useful method toapture, quantify, and understand the spatio-temporal patternsf urban growth, and to link them to social processes.
.5. Comparative analysis of urban sprawl along theransects
The combination of gradient analysis and landscape metricsan characterize the complex spatial pattern of urbanization inuangzhou well. Most of the changes can be detected by exam-
EW
22.9 18.1
ning landscape metrics variations that usually extended fromhe city center, through the suburbs, to the rural outskirts orrban fringes. This study also provides new findings about thepatial and temporal dynamics of urban sprawl in Guangzhouhat are different from that of other cities in China. Urbanizationn Guangzhou does not show a simple urban–rural gradient. Thiss because the changes or disturbances associated with urban-zation show a complex spatial pattern not clearly related torban–rural distance alone (Medley et al., 1995; McDonnell etl., 1997). The classical urban theories, which are mainly basedn social and economic rules, cannot capture local changes inand use pattern. A diffusion-coalescence process with multi-ucleated urban pattern might well explain the spatio-temporalynamics of urban sprawl and its relation to local-scale gener-ting processes. This character can be revealed by combiningradient analysis with time series data sets. The study alsoeveals that Chinese cities may exhibit different spatial pat-erns of urbanization due to the complexity of local historynd driving forces. The study provides some new interestingerspectives on urban morphology, especially from a compar-tive viewpoint. China is a highly centralized nation and landse policies have played a vital role in shaping the landscapeefore the reforms of the late 1970s. Thus, the strict hierarchyf the land use planning system and the restricted populationigration to cities resulted in relatively undifferentiated urban
attern (Ng and Tang, 1999; Seto and Fragkias, 2005). The emer-ence of multiple centers recently, which are driven by land useolicy changes, local economic development and direct foreignnvestments, characterizes the restructuring of the urban agglom-rations from a central planned system to a more market orientedystem in China. Bottom-up forces and local interactions begino play more and more important roles in forming this new urbanattern. The interactions of local, regional, national, and interna-ional forces have resulted in the complexity of centrifugal andentripetal forces at play in the economic environment (Seto andragkias, 2005). Thus, analysis of both top-down (constraints)nd bottom-up (local interactions) mechanisms are essential forharacterizing the complex, dynamic, multidimensional config-ration of urban pattern in China. This study demonstrates thatynamics analysis and comparison of landscape metrics alonghe urban–rural transects can serve this purpose.
cknowledgments
We would like to thank Prof. Li Xiuzhen, Institute of Appliedcology, Chinese Academy of Sciences, China and Dr. Sheneijun, South China Institute of Botany, Chinese Academy

1 d Urb
otDirp
R
A
A
B
B
B
C
C
C
D
D
F
G
G
G
G
G
H
H
H
H
H
L
L
L
L
L
L
L
M
M
M
M
M
N
P
R
S
S
S
S
S
W
W
W
W
08 X.J. Yu, C.N. Ng / Landscape an
f Sciences, China for their helpful discussion and sugges-ion in the revision of this manuscript. We are also grateful tor. W.L. Kyle, the University of Hong Kong for proof read-
ng. Special thanks to Dr. Denis Saunders and two anonymouseviewers for their valuable comments on the earlier draft of thisaper.
eferences
ntrop, M., 2000. Changing patterns in the urbanized countryside of WesternEurope. Landscape Ecol. 15, 257–270.
ntrop, M., 2004. Landscape change and the urbanization process in Europe.Landscape Urban Plan. 67, 9–26.
atty, M., 2002. Thinking about cities as spatial events. Environ. Plan. B 29,1–2.
ryant, M.M., 2006. Urban landscape conservation and the role of ecologicalgreenways at local and metropolitan scales. Landscape Urban Plan. 76 (1–4),23–44.
urgi, M., Hersperger, A.M., Schneeberger, N., 2004. Driving forces of land-scape change—current and new directions. Landscape Ecol. 19, 857–868.
arsjens, G.J., Van Lier, H.N., 2002. Fragmentation and land-use planning—anintroduction. Landscape Urban Plan. 58, 79–82.
hristian, D.P., Hoffman, W., Hanowski, J.M., Niemi, G., Beyea, J., 1998. Birdand mammal diversity on woody biomass plantations in North American.Biomass Bioenergy 14 (4), 395–402.
ongalton, R.G., Green, K., 1999. Assesssing the Accuracy of Remotely SensedData: Principles and Practices. Lewis Publications, Boca Raton.
ietzel, C., Herold, M., Hemphill, J.J., Clarke, K.C., 2005. Spatio-temporaldynamics in California’s Central Valley: empirical links to urban theory. Int.J. Geogr. Inf. Sci. 19 (2), 175–195.
ing, C.R., 2004. Urban spatial development in the land policy reform era:evidence from Beijing. Urban Stud. 41 (10), 1889–1907.
oresman, T.M., Pickett, S.T.A., Zipperer, W.C., 1997. Methods for spatial andtemporal land use and land cover assessment for urban ecosystems andapplication in the greater Baltimore-Chesapeake region. Urban Ecosyst. 1,210–216.
aubatz, P., 1999. China’s urban transformation: patterns and processes of mor-phological change in Beijing, Shanghai and Guangzhou. Urban Stud. 36 (9),1495–1521.
rimm, N.B., Grove, J.M., Pickett, S.T.A., Redman, C.L., 2000. Integratedapproaches to long-term studies of urban ecological systems. Bioscience50 (7), 571–584.
uangzhou Landscape Bureau, 2002. Urban Green Space System Planning ofGuangzhou (Urban Area). Internal Publication (in Chinese).
uangzhou Statistical Bureau, 2002. Guangzhou Statistical Yearbook. ChineseStatistical Press, Beijing, China (in Chinese).
uangzhou Statistical Bureau, 2005. Guangzhou Statistical Yearbook. ChineseStatistical Press, Beijing, China (in Chinese).
erold, M., Couclelis, H., Clarke, K.C., 2005. The role of spatial metrics in theanalysis and modeling of urban land use change. Comput. Environ. UrbanSyst. 29, 369–399.
erold, M., Goldstein, N.C., Clarke, K.C., 2003. The spatiotemporal form ofurban growth: measurement, analysis and modeling. Remote Sens. Environ.86, 286–302.
erold, M., Scepan, J., Clarke, K.C., 2002. The use of remote sensing andlandscape metrics to describe structures and changes in urban land uses.Environ. Plan. A 34, 1443–1458.
erzog, F., Lausch, A., 2001. Supplementing land-use statistics with landscapemetrics: some methodological considerations. Environ. Monitoring Assess-ment 72, 37–50.
onnay, O., Piessens, K., Landuyt, W.V., Hermy, M., Gulinck, H., 2003. Satellite
based land use and landscape complexity indices as predictors for regionalplant species diversity. Landscape Urban Plan. 63, 241–250.ausch, A., Herzog, F., 2002. Applicability of landscape metrics for the mon-itoring of landscape change: issues of scale, resolution and interpretability.Ecol. Indicators 2, 3–15.
X
an Planning 79 (2007) 96–109
eitao, A.B., Ahern, J., 2002. Applying landscape ecological concepts and met-rics in sustainable landscape planning. Landscape Urban Plan. 59, 65–93.
i, X., Yeh, A.G.O., 2004. Analyzing spatial restructuring of land use patternsin a fast growing region using remote sensing and GIS. Landscape UrbanPlan. 69, 335–354.
in, G.C.S., Ho, S.P.S., 2003. China’s land resources and land-use change:insights from the 1996 land survey. Land Use Policy 20, 87–107.
indenmayer, D.B., Cunningham, R.B., Pope, M.L., 1999. A large scale ‘exper-iment’ to examine the effects of landscape context and fragmentation onmammals. Biol. Conserv. 88, 387–403.
uck, M., Wu, J., 2002. A gradient analysis of urban landscape pattern: a casestudy from the Phoenix metropolitan region of USA. Landscape Ecol. 17,327–339.
unetta, R.S., Lyon, J.G. (Eds.), 2004. Remote Sensing and GIS AccuracyAssessment. CRC Press, Boca Raton, FL.
cDonnell, M.J., Pickett, S.T.A., 1990. Ecosystem structure and function alongurban–rural gradients: an unexploited opportunity for ecology. Ecology 71(4), 1232–1237.
cDonnell, M.J., Pickett, S.T.A., Groffman, P., Bohlen, P., Pouyat, R.V.,Zipperer, W.C., Parmelee, R.W., Carreiro, M.M., Medley, K., 1997.Ecosystem processed along an urban-to rural gradient. Urban Ecosyst. 1,21–36.
cGarigal, K., Cushman, S.A., Neel, M.C., Ene, E., 2002. FRAGSTATS:Spatial Pattern Analysis Programme for Categorical Maps. Com-puter Software Programme Produced by the Authors at the Univer-sity of Massachusetts, Amherst. Available at the following web site:http://www.umass.edu/landeco/research/fragstats/fragstats.html.
cKinney, M.L., 2006. Urbanization as a major cause of biotic homogenization.Biol. Conserv. 127, 247–260.
edley, K.E., McDonnell, M.J., Pickett, S.T.A., 1995. Human influences onforest-landscape structure along an urban-to-rural gradient. Prof. Geogra-pher 47, 159–168.
g, M.K., Tang, W.S., 1999. Land-sue planning in ‘one country, two systems’:Hong Kong, Guangzhou, and Shenzhen. Int. Plan. Stud. 4, 7–27.
aul, M.J., Meyer, J.L., 2001. Streams in the urban landscape. Ann. Rev. Ecol.Syst. 32, 333–365.
uddle, K., Zhong, G.F., 1988. Integrated Agriculture–aquaculture in SouthChina, the Dike-pond System of the Zhujiang Delta. Cambridge UniversityPress, New York.
chneider, A., Seto, K.C., Webster, D.R., 2005. Urban growth in Chengdu,Western China: application of remote sensing to assess planning and policyoutcomes. Environ. Plan. B 32, 323–345.
eto, K.C., Fragkias, M., 2005. Quantifying spatiotemporal patterns of urbanland-use change in four cities of China with time series landscape metrics.Landscape Ecol. 20, 871–888.
eto, K.C., Woodcock, C.E., Song, C., Huang, X., Lu, J., Kaufmann, R.K., 2002.Monitoring land-use change in the Pearl River Delta using Landsat TM. Int.J. Remote Sens. 23 (10), 1985–2004.
udhira, H.S., Ramachandra, T.V., Jagadish, K.S., 2004. Urban sprawl: metrics,dynamics and modelling using GIS. Int. J. Appl. Earth Observ. Geoinf. 5,29–39.
ui, D.Z., Zeng, H., 2001. Modeling the dynamics of landscape structure inAsia’s emerging desakota regions: a case study in Shenzhen. LandscapeUrban Plan. 53, 37–52.
eng, Q.H., 2002. Land use change analysis in the Zhujiang Delta of Chinausing satellite remote sensing, GIS and stochastic modelling. J. Environ.Manage. 64, 273–284.
eng, Q.H., Yang, S.H., 2003. An approach to evaluation of sustainability forGuangzhou’s urban ecosystem. Int. J. Sustain. Dev. World Ecol. 10, 69–81.
eng, Q.H., Yang, S.H., 2004. Managing the adverse thermal effects of urbandevelopment in a densely populated Chinese city. J. Environ. Manage. 70,145–156.
ichham, J.D., O’Neill, R.V., Ritters, K.H., Wade, T.G., Jones, K.B., 1997.
Sensitivity of selected landscape pattern metrics to land-cover misclassifica-tion and differences in land-cover composition. Photogramm. Eng. RemoteSens. 63, 397–402.iao, J.Y., Shen, Y.J., Ge, J.F., Tateishi, R., Tang, C.Y., Liang, Y.Q., Huang,Z.H., 2006. Evaluating urban expansion and land use change in Shijiazhuang,

d Urb
Y
Z
Z
Z
XtN
vesizC2
CUms
X.J. Yu, C.N. Ng / Landscape an
China, by using GIS and remote sensing. Landscape Urban Plan. 75 (1/2),69–80.
u, X., Ng, C., 2006. An integrated evaluation of landscape change using remotesensing and landscape metrics: a case study of Panyu, Guangzhou. Int. J.Remote Sens. 27 (5–6), 1075–1092.
hang, L.Q., Wu, J.P., Zhen, Y., Shu, J., 2004. A GIS-based gradient analysis ofurban landscape pattern of Shanghai metropolitan area, China. LandscapeUrban Plan. 69 (1), 1–16.
hu, W.X., Carreiro, M.M., 1999. Chemoautotrophic nitrification in acidic for-est soils along an urban-to-rural transect. Soil Biol. Biochem. 31, 1091–1100.
ipperer, W.C., Wu, J., Pouyat, R.V., Pickett, S.T.A., 2000. The application ofecological principles to urban and urbanizing landscapes. Ecol. Appl. 10 (3),
685–688.i jun Yu is currently a PhD candidate in the Department of Geography athe University of Hong Kong. He received a BS in geography from Shandongormal University and MS in environmental science from Zhongshan Uni-
cdcGU
an Planning 79 (2007) 96–109 109
ersity. His research focuses on landscape ecology assessment and strategicnvironmental assessment (SEA), with special emphasis on applying land-cape ecology principles into SEA on spatial plan. He had also been involvedn several programs in marine functional zonation and integrated coastalone management when he worked as an assistant researcher in Guangdongenter for Marine Resource Research and Development between 1999 and002.
ho Nam Ng is an associate professor of the Department of Geography at theniversity of Hong Kong. His research focuses on methodology for environ-ental modelling and impact assessment, with special emphasis on applying
patial and time-series analysis methods in environmental systems. He teaches
ourses on environmental management and impact assessment, and sustainableevelopment. He is the chairman of the Environmental Impact Assessment Sub-ommittee in the Advisory Council on the Environment of the Hong Kong SARovernment. He received a BSc and PhD in Environmental Science from theniversity of Lancaster, UK.