South Cambridgeshire Annual Monitoring Report - Greater ...
192
South Cambridgeshire Annual Monitoring Report Covering the period 1 st April 2014 – 31 st March 2015 January 2016 Published by South Cambridgeshire District Council © January 2016 Jo Mills – Director of Planning & New Communities
-
Upload
khangminh22 -
Category
Documents
-
view
3 -
download
0
Transcript of South Cambridgeshire Annual Monitoring Report - Greater ...
South Cambridgeshire Annual Monitoring Report
Covering the period 1st April 2014 – 31st March 2015
January 2016
Published by South Cambridgeshire District Council
© January 2016
Jo Mills – Director of Planning & New Communities

January 2016 Annual Monitoring Report
i
Contents
1. Introduction, Context and Indicators 1
2. Commentary 4
a. Progress against the Local Development Scheme 4
b. Action taken on Duty to Co-operate 5
c. Details of Neighbourhood Development Orders or Neighbourhood
Development Plans Made 9
d. Information relating to the Collection and Spending of Community
Infrastructure Levy (CIL) Monies 10
e. Monitoring the Local Development Framework policies and Sustainability
Appraisal objectives 11
3. List of Indicators 20
4. Core and Local Output Indicators 35
Housing Completions 35
The Housing Trajectory 38
The Five Year Housing Land Supply 54
Housing Completed on Previously Developed Land (PDL) 60
Housing Density 62
Affordable Housing 66
Gypsy & Traveller Sites 70
Housing Development by Settlement Category 72
Housing Mix 76
Housing Quality 79
Employment Development and Supply 84
Employment Land Lost 93
Retail, Office and Leisure Development 94
Mixed Use Developments 97
Community Facilities and Local Services 101
Developer Contributions 102
Open Space and Outdoor Recreation 107
Renewable Energy 109
Development in Locations of Particular Environmental Importance 111
Biodiversity 114
Listed Buildings 116
Flood Risk 117
Reviewing & Monitoring the Statement of Community Involvement 119
5. Significant Effects Indicators 121
Land and Water Resources 121
Biodiversity 124
Landscape, Townscape and Archaeology 126
Climate Change and Pollution 129
Healthy Communities 136
Inclusive Communities 138
Annual Monitoring Report January 2016
ii
Economic Activity 142
Appendix 1: Assessment of Housing Land Supply Sites 148
Appendix 2: Data for Indicators 179
January 2016 Annual Monitoring Report
1
1. Introduction, Context and Indicators
The Annual Monitoring Report
1.1. Monitoring is essential to establish what has been happening in the district, what is
happening now, what may happen in the future and what needs to be done to
achieve policies and targets.
1.2. The Planning and Compulsory Purchase Act 2004 and subsequent regulations
introduced the requirement for local planning authorities to produce an Annual
Monitoring Report (AMR) which sets out the Council’s progress in producing new
planning policy documents against the timetable included in the approved Local
Development Scheme and in implementing planning policies included in their Local
Development Framework (or Local Plan). The AMR was required to be submitted to
the Secretary of State by 31 December each year.
1.3. The Localism Act 2011 and Town and Country Planning (Local Planning) (England)
Regulations 2012 set out revised requirements for monitoring. Local planning
authorities are still required to publish information monitoring progress on the
implementation of their Local Development Scheme and planning policies included in
their development plan documents at least on an annual basis, however the
requirement to submit the AMR to the Secretary of State by 31 December has been
removed.
1.4. The Localism Act 2011 also created the duty to co-operate which places a legal duty
on local planning authorities and other specified organisations to co-operate with
each other to address strategic issues relevant to their areas. The Town and Country
Planning (Local Planning) (England) Regulations 2012 require the AMR to give
details of what action the Council has taken relating to the duty to co-operate.
1.5. The Town and Country Planning (Local Planning) (England) Regulations 2012 have
also introduced the requirements that the AMR includes: (i) details of any
neighbourhood development orders or neighbourhood development plans made; and
(ii) once the Council has an adopted Community Infrastructure Levy (CIL) Charging
Schedule, information relating to the collection and spending of CIL monies.
1.6. This Annual Monitoring Report covers the period from 1 April 2014 to 31 March 2015.
The adopted planning policies for the period covered by this AMR are those
contained in the:
Local Plan 2004 – adopted in February 2004, however there is now only one
remaining saved policy;
Core Strategy Development Plan Document (DPD) – adopted in January 2007;
Development Control Policies DPD – adopted in July 2007;
Northstowe Area Action Plan (AAP) – adopted in July 2007;
Cambridge East AAP – adopted in February 2008;
Cambridge Southern Fringe AAP – adopted in February 2008;
North West Cambridge AAP – adopted October 2009; and
Site Specific Policies DPD – adopted January 2010.
Annual Monitoring Report January 2016
2
Monitoring in South Cambridgeshire
1.7. Monitoring in Cambridgeshire is carried out through a partnership between the
Research & Monitoring Team at Cambridgeshire County Council and the Planning
departments at the five district councils. The Research & Monitoring Team maintains
a database of planning permissions involving the creation or removal of residential,
business, retail and leisure uses plus any planning permissions for renewable energy
generators. An annual survey of all extant planning permissions included in the
database takes place each year, involving officers from the County Council and
district councils, to collect information on their status: built, under construction or not
yet started.
1.8. The Research & Monitoring team then provides the district councils with the
necessary results for their AMR output indicators and a site-by-site list of planning
permissions and their status. The Research & Monitoring team also publish summary
tables and topic reports on housing, business, retail and renewable energy
completions and commitments on their website:
http://www.cambridgeshire.gov.uk/info/20099/planning_and_development/234/planni
ng/8. For some indicators the data for previous years has been revised from
the data previously published; this is a result of the on-going assessment of
data by the Research & Monitoring team to remove any inaccuracies.
1.9. Data required for the contextual indicators, significant effect indicators and some
local output indicators is obtained from various teams at Cambridgeshire County
Council and South Cambridgeshire District Council, and other external organisations
such as Natural England and the Environment Agency.
Monitoring Progress against the Local Development Scheme and the
Performance of Local development Framework Policies
1.10. The AMR outlines the progress that the Council has made in producing the
documents that will make up its LDF. Chapter 2 reviews progress on the preparation
of the LDF and indicates whether the timetable and milestones set out in the Local
Development Scheme (LDS) are being achieved.
1.11. The AMR measures various indicators to assess performance of the individual
planning policies but also to provide a general portrait of the social, economic and
environmental conditions in the district and the wider effects of the LDF on the
district. The different indicators used in this AMR can be grouped into three
categories: contextual indicators, output indicators and significant effect indicators.
Chapter 3 includes a list of all the Council’s output indicators and significant effect
indicators.
1.12. Contextual indicators are those that together provide a general portrait of the
social, economic and environmental conditions in the district against which planning
policies operate. The data for these indicators is also used for the significant effect
indicators.

January 2016 Annual Monitoring Report
3
1.13. Output indicators include both core output indicators and local output indicators,
and provide detailed analysis on how the Council’s adopted planning policies have
performed. Performance against the Council’s core and local output indicators is
analysed in Chapter 4.
1.14. Core output indicators were set by central government. The latest list of core output
indicators was included in ‘Regional Spatial Strategy and Local Development
Framework Core Output Indicators – Update 02/2008’ (published in July 2008),
however this publication was withdrawn on the 30 March 2011 by the coalition
Government. Whilst this monitoring information no longer has to be provided to
central Government, these indicators are useful in monitoring adopted planning
policies and therefore the Council has continued to monitor them through the AMR.
1.15. In addition to the core output indicators, the Council set local output indicators in
each of its adopted Development Plan Documents (DPDs) and Area Action Plans
(AAPs) that are relevant to the proposals in the document or plan.
1.16. In this AMR it has not been possible to provide data on all the local output indicators
included in the adopted AAPs. This is because many of the local output indicators
included in these plans rely on the major developments at Northstowe, Cambridge
East, Cambridge Southern Fringe (Trumpington Meadows) and North West
Cambridge having detailed planning permission and the development being under
construction.
1.17. On 28 March 2014, the Council submitted its new Local Plan to the Secretary of
State for examination. Once adopted the new Local Plan will supersede the Local
Plan 2004 saved policy, the Core Strategy DPD, the Development Control Policies
DPD, and the Site Specific Policies DPD. The new Local Plan includes a set of
output indicators that are relevant to the proposals in the plan. Once the Local Plan is
adopted, this set of output indicators will replace the majority of the existing core and
local output indicators, except for those included in the AAPs and Statement of
Community Involvement.
1.18. In this AMR, data has been provided for the new Local Plan indicators where the new
planning policy they are monitoring the implementation of is not significantly different
from the Council’s adopted planning policy. Data for monitoring indicators related to
new planning policies has not been collected, as these planning policies will only be
implemented following the adoption of the new Local Plan.
1.19. Significant effect indicators are those indicators based on the objectives set out in
the Council’s Sustainability Appraisal Scoping Report, and they look at the wider
effects of the LDF on the district. The Council has a Sustainability Appraisal Scoping
Report (January 2006) that supports the adopted LDF and has produced a revised
Sustainability Appraisal Scoping Report (July 2012) to support its new Local Plan.
The significant effect indicators from both Sustainability Appraisal Scoping Reports
are assessed in Chapter 5.
Annual Monitoring Report January 2016
4
2. Commentary
a. Progress against the Local Development Scheme
2.1. The adopted Local Development Scheme (LDS) at the start of the monitoring
period (1 April 2014) was the LDS adopted in February 2014. This LDS set the
timetable that the Council was progressing during the monitoring year.
2.2. The February 2014 LDS sets out the stages in the preparation of the Local Plan,
which incorporates a review of the Core Strategy, Development Control Policies
Development Plan Document (DPD) and Site Specific Policies DPD. It also
includes the policies and proposals for Gypsy and Traveller accommodation as this
is no longer to be progressed in a separate DPD.
2.3. The February 2014 LDS anticipated that the Local Plan would be submitted in
Spring 2014, that the examination would be undertaken in Summer / Autumn 2014
and that the Local Plan would be adopted in Spring 2015.
2.4. The Council submitted its Local Plan, alongside the Cambridge Local Plan, to the
Secretary of State on 28 March 2014. Miss Laura Graham has been appointed as the
lead Inspector to consider both the Cambridge Local Plan and South Cambridgeshire
Local Plan. A joint Pre-Hearing Meeting was held on 11 September 2014 and joint
examination hearing sessions were held between November 2014 and April 2015
on strategic issues, including housing and employment needs, development strategy,
Green Belt, transport, infrastructure and housing supply.
2.5. The Inspectors wrote to the Councils on 20 May 20151 in relation to three main
issues and invited the Councils to undertake additional work to address those issues
before the examinations progressed further. The issues are in relation to:
Objectively Assessed Need for new housing;
Overall Development Strategy; and
Conformity with revisions to National Planning Policy since the Local Plans were
submitted for examination.
The Councils agreed to undertake additional work and the examinations were
formally suspended until March 2016.
2.6. This additional work resulted in a small number of proposed modifications to both the
Cambridge Local Plan and South Cambridgeshire Local Plan. The modifications
were subject to Sustainability Appraisal. Public consultation is being carried out
(jointly with Cambridge City Council) on these modifications between 2 December
2015 and 25 January 20162. The results of the consultation will be considered by the
Councils who will decide whether any further modifications need to be made. The
Councils will then submit the consultation responses, evidence base documents and
proposed modifications to the Inspectors, so they can reopen the examinations.
1 Inspectors Initial Conclusions Letter of 20 May 2015:
https://www.scambs.gov.uk/sites/default/files/documents/Letter%20from%20Inspectors%20to%20Councils%20-%20Preliminary%20Conclusions%20200515.pdf 2 Cambridge and South Cambridgeshire Modifications Consultation:
https://www.scambs.gov.uk/localplanmods-dec2015
January 2016 Annual Monitoring Report
5
2.7. The suspension of the examination to allow for the further work and public
consultation to be undertaken on the proposed modifications means that the Local
Plan process is taking longer than originally anticipated. It is anticipated that the
examination will be completed in 2016 and the Local Plan adopted in 2017; this
revised timetable is set out in an addendum to the LDS agreed in November 2015.
2.8. The February 2014 LDS also sets out the timetable for the preparation of the
Cambridge Northern Fringe East Area Action Plan (AAP), Bourn Airfield New
Village AAP and Waterbeach New Town AAP.
2.9. The Cambridge Northern Fringe East AAP is being prepared jointly with
Cambridge City Council and the LDS anticipated that public consultation on issues
and options would be undertaken in Winter 2014/2015, that consultation on the
proposed submission AAP would be undertaken in Autumn 2015, and that the AAP
would be submitted to the Secretary of State for examination in Spring 2016. The
Councils undertook public consultation on issues and options between December
2014 and February 2015, which is consistent with the LDS. A report setting out the
results of the consultation, the proposed way forward to proposed submission, and a
revised timetable for the preparation of the AAP was considered by the relevant
members of both Councils in November 2015. It is anticipated that public consultation
on proposed submission will be undertaken in January - March 2017, and submission
to the Secretary of State for examination will be in June 2017; this revised timetable
is set out in an addendum to the LDS agreed in November 2015.
2.10. The Bourn Airfield New Village and Waterbeach New Town AAPs were
scheduled to begin in Winter 2015/16 and Winter 2017/18 respectively. However, the
AAPs are dependent upon the outcome of the Local Plan examination, which will not
now be known until 2016-17. The promoters of both sites have also advised that they
intend to prepare Development Framework Documents for the new settlements to be
published in Spring 2016 and to submit planning applications during 2016. These
factors may impact on the production of AAPs.
2.11. An addendum to the LDS was approved in July 2015 that sets out the timetable for
the preparation of the Cambridgeshire Flood and Water Supplementary Planning
Document (SPD). This addendum anticipated that public consultation on the draft
SPD would be undertaken in September – October 2015 and that the SPD would be
adopted in December 2015 / January 2016. Public consultation on the draft SPD was
carried out in September – October 2015, however to enable appropriate
consideration to be given to the comments received by all the local authorities, it is
now likely that adoption of the SPD will be in Spring 2016.
b. Action taken on Duty to Co-operate Working with Duty to Co-operate Bodies
2.12. South Cambridgeshire District and Cambridge City Councils have engaged
constructively, actively and on an ongoing basis during the preparation of the two
Local Plans, both with each other and each with the other Duty to Co-operate bodies
Annual Monitoring Report January 2016
6
to maximise the effectiveness of the Local Plan preparation in the context of strategic
cross boundary matters. The Councils have worked closely throughout the
preparation of joint evidence base documents and their respective Local Plans to
prepare complementary plans on similar timescales that together set out a clear
development strategy for the Greater Cambridge area.
2.13. Joint examination hearings on strategic issues for both plans were held between
November 2014 and April 2015. The Inspectors wrote to the Councils on 20 May
20153 raising some initial queries relating to objectively assessed need for new
housing, the development strategy and conformity with national planning policy, and
inviting the Councils to undertake additional work to address those issues before the
examinations progress further. The Councils agreed to undertake additional work and
the examinations have been formally suspended until March 2016. The Councils
have carried out additional work to address the issues raised by the Inspectors, and
have identified a small number of modifications to the Local Plans that arise from the
work. A joint public consultation4 is currently taking place seeking views on the
proposed modifications which illustrates the close working relationship that has
developed between the two Councils. The consultation runs until 25 January 2016.
2.14. The Council produced a Statement of Compliance with the Duty to Co-operate in
June 2013 setting out how the Council has co-operated with other bodies in
preparing the Local Plan. This was updated when the Local Plan was submitted to
the Secretary of State in March 20145. This document sets out how the Council has
engaged extensively with the prescribed Duty to Co-operate bodies, as appropriate
to the Local Plans, throughout the stages of evidence base production and plan-
making. This joint working has continued through the first part of the examination
process from November 2014 to May 2015 to assist the Council to respond to
questions raised in the Inspector’s Matters and in support at hearings.
2.15. Statements of Common Ground have been agreed with Uttlesford District Council,
Hertfordshire District Council and Hertfordshire County Council as part of confirming
the Council’s compliance with the duty to cooperate for the Local Plan examination
process. The Statements of Common Ground agree that the duty to co-operate has
been met and that all the districts involved are planning to deliver their full objectively
assessed needs within their own administrative boundaries.
2.16. A Statement of Co-operation between the Greater Cambridgeshire Local Nature
Partnership and the Cambridgeshire and Peterborough local planning
authorities6 (April 2013) sets out how the organisations will continue to cooperate.
3 Inspectors Initial Conclusions Letter of 20 May 2015:
https://www.scambs.gov.uk/sites/default/files/documents/Letter%20from%20Inspectors%20to%20Councils%20-%20Preliminary%20Conclusions%20200515.pdf 4 Cambridge and South Cambridgeshire Modifications Consultation:
https://www.scambs.gov.uk/localplanmods-dec2015 5 Statement of Compliance with Duty to Co-operate (March 2014):
https://www.scambs.gov.uk/sites/www.scambs.gov.uk/files/documents/Statement%20of%20Compliance%20with%20Duty%20to%20Cooperate%20March%202014.pdf 6 Statement of Co-operation between the Greater Cambridgeshire Local Nature Partnership and the
Cambridgeshire and Peterborough local planning authorities: https://www.scambs.gov.uk/sites/www.scambs.gov.uk/files/documents/Greater%20Cambridgeshire%20Local%20Nature%20Partnership%20Statement%20of%20Cooperation.pdf
January 2016 Annual Monitoring Report
7
South Cambridgeshire District Council, Anglian Water and the Environment Agency
have also produced a Joint Position Statement on Foul Water and
Environmental Capacity7 (January 2014) which sets out the current understanding
of the waste water treatment issues within South Cambridgeshire and its associated
environmental implications.
2.17. During the examination process the Council has agreed Statements of Common
Ground with a number of different organisations relating to issues raised during the
hearings. South Cambridgeshire District Council and Cambridge City Council have
agreed a joint statement of common ground with English Heritage relating to the
Green Belt8.
Memorandum of Co-operation signed by Cambridgeshire authorities, together with Peterborough City Council
2.18. The Council co-operated with other local authorities in the preparation of the
Strategic Housing Market Assessment 2013 (SHMA)9 and other evidence base
studies. The Memorandum of Co-operation10 (May 2013) was agreed by all
Cambridgeshire local authorities, together with Peterborough City Council, and
includes an agreement on the objectively assessed housing needs for each of the
districts in the Cambridge Sub-Region Housing Market Area as part of fulfilling the
Duty to Co-operate. Building on a strong legacy of joint working between the local
authorities, the Memorandum of Co-operation demonstrates that the full objectively
assessed needs of the Cambridge Sub Region housing market area identified in the
SHMA will be met. The Council committed to meeting its full objectively assessed
need within the district. The Council has undertaken further work on the assessment
of objectively assessed housing need as part of the further work requested by the
Inspectors.
2.19. The Memorandum of Co-operation has already been subject to scrutiny through the
examinations of the Fenland Local Plan – Core Strategy (adopted May 2014) and the
East Cambridgeshire Local Plan. The Fenland Inspector’s Report and East
Cambridgeshire Inspector’s Interim Conclusions both conclude that the
Memorandum of Co-operation provides clear evidence that co-operation has taken
place constructively, actively and on an on-going basis.
2.20. The Cambridgeshire authorities, together with Peterborough City Council, have also
agreed the Strategic Spatial Priorities: Addressing the Duty to Co-operate
7 Joint Position Statement on Foul Water and Environmental Capacity:
https://www.scambs.gov.uk/sites/www.scambs.gov.uk/files/documents/Anglian%20Water%20and%20Environment%20Agency%20Cooperation%20Statement%202014.pdf 8 Statement of Common Ground with English Heritage relating to the Green Belt:
https://www.cambridge.gov.uk/sites/default/files/documents/rd-scg-080_0.pdf 9 Strategic Housing Market Assessment:
https://www.cambridge.gov.uk/public/ldf/coredocs/RD-STRAT-090.pdf 10
Memorandum of Co-operation: https://www.scambs.gov.uk/sites/www.scambs.gov.uk/files/documents/Memorandum%20of%20Co-operation%20May%202013.pdf
Annual Monitoring Report January 2016
8
across Cambridgeshire & Peterborough11 document that was published in January
2014. This document supplements the Memorandum of Co-operation and provides
an overview of strategic spatial issues as they apply to Cambridgeshire and
Peterborough as a whole.
Memorandum of Understanding
2.21. In September 2014, Cambridge City Council and South Cambridgeshire District
Council also agreed a Memorandum of Understanding on the Greater Cambridge
Joint Housing Trajectory12. This confirms the agreement between the two Councils
under the duty to co-operate that the housing trajectories for the two areas should be
considered together for the purposes of phasing housing delivery, and for calculating
five year housing land supply for plan-making and decision-taking. The merits of the
Memorandum of Understanding were considered during the examination hearing
sessions for Matter 8: Housing Land Supply and Delivery in March 2015. The
Councils asked the Inspectors in September 2015 whether they would consider
issuing a view on the principle of the joint housing trajectory given the five year
housing land supply issues in South Cambridgeshire. The Inspectors have
responded that they do not consider it appropriate to reach any conclusions on the
principle of the joint housing trajectory in advance of knowing the outcome of the
further work that the Councils are undertaking whilst the examinations are
suspended.
Transport Issues
2.22. Cambridge City Council, South Cambridgeshire District Council and Cambridgeshire
County Council have worked together closely on transport issues as they have
prepared their Local Plans and a transport strategy for the Greater Cambridge area.
South Cambridgeshire District Council responded to a consultation on this strategy in
September 2013. The Cambridge City and South Cambridgeshire Transport
Strategy13 was adopted in March 2014. It is recognised that there is a close link
between planning for growth and development and for transport and accessibility to
ensure that growth can be accommodated in the most sustainable way and that
people can access the services and facilities they need in an efficient and affordable
way.
11
Strategic Spatial Priorities: Addressing the Duty to Co-operate across Cambridgeshire & Peterborough: https://www.scambs.gov.uk/sites/www.scambs.gov.uk/files/documents/Strategic%20Spatial%20Priorities%20January%202014.pdf 12
Memorandum of Understanding on the Greater Cambridge Joint Housing Trajectory: https://www.scambs.gov.uk/sites/www.scambs.gov.uk/files/documents/Memorandum%20of%20Understanding%20-%20Joint%20Housing%20Trajectory_0.pdf 13
Cambridge City and South Cambridgeshire Transport Strategy: http://www.cambridgeshire.gov.uk/info/20006/travel_roads_and_parking/66/transport_plans_and_policies/2
January 2016 Annual Monitoring Report
9
2.23. The Council responded to consultations on the Cambridgeshire Long Term
Transport Strategy14 and the revisions to the Local Transport Plan15 in July 2014
recognising the importance of planning for future transport within the county.
2.24. The Council has also worked closely with Highways England (formerly the Highways
Agency) as the A14 Cambridge to Huntingdon Scheme has progressed by
formally responding to consultations in February and May 2014. Highways England
submitted its Development Consent Order application to the Secretary of State in
December 2014 and the Council participated in the examination which was held
between May and November 2015. The Examining Authority will publish its report
and recommendations to the Secretary of State by February 2016 and the Secretary
of State must issue a decision by May 2016.
2.25. In the Road Investment Strategy16 the Government announced funding for
upgrading the A428 between the Caxton Gibbet and A1 (Black Cat junction) to create
an expressway standard link between Cambridge and Oxford. The Council will work
closely with Highways England and the Department for Transport to develop the
scheme. It is anticipated delivery will be late in the period 2015 to 2020.
Working with other Adjacent Local Planning Authorities
2.26. The Council has submitted representations to a number of consultations by
neighbouring planning authorities to ensure that joint issues that impact on South
Cambridgeshire continue to be considered. These include responding to Central
Bedfordshire Council in June 2013 and March 2014, Cambridge City Council in
September 2013, East Cambridgeshire District Council in November 2013, Uttlesford
District Council in May 2014 and December 2015, and Braintree District Council in
May 2014.
c. Details of Neighbourhood Development Orders or Neighbourhood Development Plans Made
2.27. There was initially limited interest shown by Parish Councils in preparing a
Neighbourhood Plan, as the Council had offered them the opportunity to put
forward proposals within their area through the Local Plan process as an alternative
to the preparation of Neighbourhood Plans. Some Parish Council proposals have as
a result been included in the Local Plan (submitted in March 2014), or
recommended as Major Modifications to it, but only where there has been clear local
support. Since the Local Plan was submitted for examination there has been a
14
Cambridgeshire Long Term Transport Strategy: http://www.cambridgeshire.gov.uk/info/20006/travel_roads_and_parking/66/transport_plans_and_policies/5 15
Local Transport Plan: http://www.cambridgeshire.gov.uk/info/20006/travel_roads_and_parking/66/transport_plans_and_policies 16
Road Investment Strategy: https://www.gov.uk/government/uploads/system/uploads/attachment_data/file/382813/dft-ris-road-investment-strategy.pdf
http://www.cambridgeshire.gov.uk/info/20006/travel_roads_and_parking/66/transport_plans_and_policies
Annual Monitoring Report January 2016
10
steady increase in interest from Parish Councils considering preparing
Neighbourhood Plans for their areas.
2.28. Before a Neighbourhood Plan can be prepared a neighbourhood area must be
designated. The Local Development Scheme is either updated or an addendum is
published when each Neighbourhood Area is designated. There are currently seven
designated neighbourhood areas in South Cambridgeshire:
Linton and Hildersham – these two parishes have joined together to form a
single neighbourhood area that was approved in May 2014;
Histon & Impington – this covers the area of the parish to the north of the A14
and was approved in September 2014;
Gamlingay – this covers the whole parish and was approved in February
2015;
Waterbeach – this covers the whole parish and was approved in August 2015
with South Cambridgeshire District Council and Waterbeach Parish Council
agreeing a framework as to how they will work together;
Cottenham – this covers the whole parish and was approved in November
2015;
Foxton – this covers the whole parish and was approved in November 2015;
and
West Wickham – this covers the whole parish and was approved in November
2015.
These Parish Councils are making progress in their plan-making.
2.29. Initial discussions have taken place with an increasing number of other Parish
Councils about neighbourhood planning and whether a Neighbourhood Plan would
be the right tool for them to achieve the aspirations they have for the future in their
villages. Some Parish Councils are considering preparing Neighbourhood Plans
jointly with their adjoining parishes as they have common issues and wish to pool
their resources. The Council is considering options and resources for providing
further support to Parish Councils undertaking Neighbourhood Plans.
2.30. The Council’s webpages relating to Neighbourhood Planning (accessed from
www.scambs.gov.uk/neighbourhood-planning) are being expanded to provide clearer
information about future consultations, events, and support given by the Council.
d. Information relating to the Collection and Spending of Community Infrastructure Levy Monies
2.31. The Council submitted its Community Infrastructure Levy (CIL) draft Charging
Schedule for independent examination on 6 October 2014. Given the close
relationship between the proposed rates in the CIL Charging Schedule and the Local
Plan, the CIL examination cannot take place until the Local Plan has been examined.
Until the Council has an adopted CIL Charging Schedule it cannot collect any CIL
monies.

January 2016 Annual Monitoring Report
11
2.32. Further details relating to the examination of the Council’s CIL draft Charging
Schedule are available on the Council’s website:
https://www.scambs.gov.uk/content/examination-draft-charging-schedule.
e. Monitoring the Local Development Framework policies and Sustainability Appraisal objectives
2.33. A complete list of indicators is included in Chapter 3, the data for all indicators is
included in Chapters 4 and 5, and the commentary is set out in this chapter. The
commentary highlights the key messages from the data collected and identifies any
areas where policies are not being implemented.
Housing
2.34. Housing completions: The development strategy for South Cambridgeshire is one
of supporting the economic success of the Cambridge area through continued jobs
growth, with housing provision at a level, and of a quality, to meet objectively
assessed needs.
2.35. In the last monitoring year, 869 net additional dwellings were completed in South
Cambridgeshire; this is 165 dwellings more than the number predicted in the housing
trajectory included in the Annual Monitoring Report 2013-2014. This is an increase
on the previous six monitoring years, where annual net housing completions were
consistently around 600 dwellings reflecting the slowdown in the housing market and
that the fringe sites coming forward were building out on the Cambridge side of the
administrative boundary. The increase in completions in the last monitoring year is
due to the first 29 dwellings in South Cambridgeshire being completed at
Trumpington Meadows and an increase in completions: at Cambourne and Orchard
Park compared to the preceding years; on the historic rural allocation at Papworth
Everard, which is nearing completion; and on large windfall sites such as Station
Road, Gamlingay, Long Drove / Beach Road, Cottenham, and the former EDF
Energy Depot and Training Centre at Milton.
2.36. Delivering housing requirements: The housing trajectory identifies predicted
annual housing completions from existing and proposed allocations, planning
permissions granted or with resolution to grant, and predicted windfalls. The new
Local Plan (submitted in March 2014) includes in Policy S/5 that provision is made
for 19,000 dwellings in the district during the period 2011 to 2031 to meet the current
objectively assessed need. Joint examination hearing sessions with Cambridge City
Council were held between November 2014 and April 2015 covering strategic issues,
including housing and employment needs. The Inspectors wrote to the Councils in
May 201517 setting out their initial findings and inviting the Councils to undertake
additional work, including in relation to objectively assessed need for new housing.
The additional work undertaken relating to calculating the objectively assessed
17
Inspectors Initial Conclusions Letter of 20 May 2015: https://www.scambs.gov.uk/sites/default/files/documents/Letter%20from%20Inspectors%20to%20Councils%20-%20Preliminary%20Conclusions%20200515.pdf
Annual Monitoring Report January 2016
12
need18 for the district has resulted in the Council concluding that provision should be
made for 19,500 dwellings in the district during the plan period from 2011 to 2031.
The Council has therefore included a proposed modification19 to Policy S/5, which
is currently subject to public consultation, to increase the housing requirement from
19,000 dwellings to 19,500 dwellings.
2.37. Against the Local Plan, the housing trajectory shows that 21,091 dwellings are
expected to be delivered, this is 8% (1,591 dwellings) more than the revised
requirement and allows flexibility to respond to changing conditions as required in the
National Planning Policy Framework (NPPF).
2.38. Against the Core Strategy (January 2007) which requires 20,000 dwellings to be
provided between 1999 and 2016, the housing trajectory shows that 12,577 dwellings
are expected to be delivered; this is 37% (7,423 dwellings) below the requirement. As
set out above, the new Local Plan identifies an up to date housing requirement for
2011-2031 that will provide for the identified objectively assessed needs of the
district. The Strategic Housing Market Assessment 201320 and Objectively
Assessed Housing Need: Further Evidence 201521 make clear that there is no
backlog to make up.
2.39. Five year housing land supply: The Council is currently unable to demonstrate a
five year supply of housing land, mainly due to delays in the delivery of strategic sites
during the recession, and to the fringe sites building out from the edge of Cambridge
and them having only just started to deliver completions in South Cambridgeshire.
2.40. There are two methodologies for calculating five year housing land supply. The
Liverpool methodology assumes that any shortfall will be made up during the
remaining years of the plan period. The Sedgefield methodology requires the whole
of any previous shortfall to be made up within the five year assessment period. The
NPPF requires that a 5% buffer be provided in the five year supply calculation to
provide greater confidence that the housing requirement will be delivered. In areas of
persistent historic undersupply the buffer should be 20%. The Council’s statement to
the Matter 8: Housing Land Supply and Delivery hearings addressed the appropriate
means of calculating the five year supply22.
18
Objectively Assessed Housing Need: Further Evidence: https://www.scambs.gov.uk/sites/default/files/documents/OAN%20%26%20Market%20Signals%20FINAL%20Nov%202015.pdf 19
Cambridge and South Cambridgeshire Modifications Consultation Report: https://www.scambs.gov.uk/sites/default/files/final_mods_consultation_document_website_8.12.15.pdf 20
Strategic Housing Market Assessment: https://www.cambridge.gov.uk/public/ldf/coredocs/RD-STRAT-090.pdf 21
Objectively Assessed Housing Need: Further Evidence: https://www.scambs.gov.uk/sites/default/files/documents/OAN%20%26%20Market%20Signals%20FINAL%20Nov%202015.pdf 22
Council’s statement to the Local Plan examination in relation to Matter 8: Housing Land Supply and Delivery: https://www.scambs.gov.uk/local-plan-examination-statements-matter-8
January 2016 Annual Monitoring Report
13
2.41. In response to a number of changes in circumstance23 since the Local Plan was
submitted in March 2014, the Council agreed in September 2014 to a Memorandum
of Understanding on the Greater Cambridge Joint Housing Trajectory with
Cambridge City Council. This memorandum set out the agreement between the two
Councils under the duty to co-operate that the housing trajectories for the two areas
should be considered together for the purposes of phasing housing delivery, and for
calculating five year housing land supply for plan-making and decision-taking. The
Council’s statement to Matter 1: Legal Requirements set out proposed modifications
to the Local Plan (submitted in March 2014) to give effect to the Memorandum24.
2.42. The merits of a joint housing trajectory for the Greater Cambridge area were
considered at the Matter 8: Housing Land Supply and Delivery hearings. The merits
of this approach were not addressed in the initial findings letter from the Inspectors of
20 May 201525. The Councils requested that the Inspectors reconsider issuing a view
on the principle of the joint housing trajectory given the five year land supply issues in
South Cambridgeshire. The Inspectors have responded that they do not consider it
appropriate to reach any conclusions on the principle of the joint housing trajectory in
advance of knowing the outcome of the further work that the Councils are
undertaking. The Councils remain committed to the Memorandum of
Understanding on the Greater Cambridge Joint Housing Trajectory and the
proposed modifications to the Local Plans to give effect to the joint trajectory have
been included in the public consultation being undertaken jointly with Cambridge City
Council on Proposed Modifications to the Local Plans.
2.43. The Memorandum of Understanding on the Greater Cambridge Joint Housing
Trajectory and the use of the five year supply calculations for Greater Cambridge
will not be relied upon or used in relation to planning decisions and planning appeals
until the Inspectors examining the Local Plan have reported on the approach and
found it to be ‘sound’.
2.44. In view of the various ways that five year supply can be calculated, and pending the
outcome of consideration at the Local Plan examination, this Annual Monitoring
Report shows the results for all ways of calculating the five year land supply for 2015-
2020 for both South Cambridgeshire and the Greater Cambridge area. These results
are set out in the tables below, and the calculations for the Local Plan are based on
the housing requirement of 19,500 dwellings included in the proposed
modification26 to Policy S/5 of the Local Plan, which is currently subject to public
consultation. When the Greater Cambridge area is considered as a whole, whichever
23
A detailed list of reasons is given in the Council’s statement to the Local Plan examination in relation to Matter 1: Legal Requirements (paragraph 34): https://www.scambs.gov.uk/sites/www.scambs.gov.uk/files/documents/Matter%201%20Statement%20CCC%20-%20SCDC.pdf 24
Council’s statement to the Local Plan examination in relation to Matter 1: Legal Requirements: https://www.scambs.gov.uk/sites/www.scambs.gov.uk/files/documents/Matter%201%20Statement%20CCC%20-%20SCDC.pdf 25
Inspectors initial conclusions letter of 20 May 2015: https://www.scambs.gov.uk/sites/default/files/documents/Letter%20from%20Inspectors%20to%20Councils%20-%20Preliminary%20Conclusions%20200515.pdf 26
Cambridge and South Cambridgeshire Modifications Consultation Report: https://www.scambs.gov.uk/sites/default/files/final_mods_consultation_document_website_8.12.15.pdf
Annual Monitoring Report January 2016
14
methodology or buffer is used, a five year supply can be demonstrated. This is a
logical and appropriate way of delivering sites to meet the combined objectively
assessed housing need across the Greater Cambridge area, consistent with the
development strategy contained in both submitted Local Plans.
2.45. Against the housing requirements in the new South Cambridgeshire Local Plan of
19,500 homes between 2011 and 2031, and the housing requirement for Greater
Cambridge of 33,500 homes between 2011 and 2031, the Council’s five year housing
land supply for 2015-2020 is:
‘Liverpool’ Methodology South Cambs Greater Cambridge
(City & South Cambs)
Five year supply (with 5%) 5.1 6.4
Five year supply (with 20%) 4.5 5.6
‘Sedgefield’ Methodology South Cambs Greater Cambridge
(City & South Cambs)
Five year supply (with 5%) 4.4 5.9
Five year supply (with 20%) 3.9 5.2
2.46. Against the housing requirement in the adopted Core Strategy of 20,000 homes
between 1999 and 2016, the Council’s five year housing land supply for 2015-2020
is:
‘Liverpool’
Methodology
‘Sedgefield’
Methodology
Five year supply (with 5%) 2.1 2.1
Five year supply (with 20%) 1.8 1.8
2.47. Gypsy & Traveller pitches: Four permanent Gypsy & Traveller pitches were
completed in the last monitoring year. At 31 March 2015, a further 8 permanent
Gypsy & Traveller pitches with planning permission were under construction; 3
permanent Gypsy & Traveller pitches with planning permission had not yet been
started; and 4 permanent Travelling Showpeople plots with planning permission had
not yet been started.
2.48. Housing completions on previously developed land (PDL): In the last monitoring
year, 31% of dwellings completed were on PDL and the cumulative percentage is still
below the target of at least 37% as included in Core Strategy Policy ST/3. It had
been anticipated that the percentage would increase when the major developments
at Northstowe and Cambridge East, which would involve the reuse of PDL, started
delivering towards the end of the plan period (which runs up to 2016); however,
January 2016 Annual Monitoring Report
15
delays in the major developments as a result of the recession mean this is now
unlikely to be achieved. In the last monitoring year, completions at Orchard Park,
Cambourne, and the historic rural allocation at Papworth Everard (Summersfield),
have contributed to a significant proportion of completions on ‘greenfield’ sites.
2.49. Housing density: Over the last 16 years, the average net density of dwellings
completed on sites of 9 or more dwellings has fluctuated. It is expected that the
average net density of new housing developments will increase in future monitoring
years as the major developments on the edge of Cambridge and Northstowe are
implemented with higher housing densities reflecting their urban character. Phase 1
at Trumpington Meadows includes 29 dwellings in South Cambridgeshire and this
parcel has a net density of over 70 dph. Over the last 16 years, the completed
parcels at Cambourne have achieved an average net density of 30.3 dph. In general,
lower densities have been achieved at Lower Cambourne (an early phase in the
construction of the settlement), and higher densities have been achieved at Upper
Cambourne (a more recent phase that is still being completed). Great Cambourne
includes a mixture of densities, with higher densities achieved on parcels located in
and around the village centre, where there is good access to services and facilities.
2.50. Affordable housing: The availability of housing that is affordable to local people is a
major issue in the district, especially as median house prices in the district have risen
from 4.9 times median earnings in 1999 to 8.0 times median earnings in 2013. In the
last monitoring year, 329 new affordable dwellings were completed; this amounts to
36% of all new dwellings completed. This an increase in the number of affordable
housing completions compared to the previous six monitoring years. In the last
monitoring year, affordable housing has been delivered at the major developments of
Cambourne, Orchard Park and Trumpington Meadows, and on large windfall sites at
Station Road, Gamlingay, and the former EDF Energy Depot and Training Centre at
Milton, as well as on three affordable housing exception sites providing 72 new
affordable dwellings to meet identified local need in Cottenham, Horseheath and
Orwell.
2.51. In the last four monitoring years there has been a fall in the proportion of social
rented affordable housing completed. Some of this shortfall has been made up by the
provision of ‘affordable rent’ housing.
2.52. In the last monitoring year, only 23% of dwellings permitted on sites of two or more
dwellings, where Development Control Policy HG/3 was applicable, were
affordable. This falls below the target of 40% set by the policy and is due to only 20%
of dwellings being secured as affordable dwellings on phase 1 of Northstowe and
also to there being a change part way through the year from applying the adopted
Development Control Policy HG/3 to applying the new Policy H/9 in the Local
Plan (submitted in March 2014) which changes the threshold at which the policy
applies to developments of three or more dwellings. The affordable dwellings
secured are a mixture of onsite provision and financial contributions that have been
converted into notional units that will be provided offsite.
2.53. Housing development by settlement category: The development strategy for the
district was changed by the adoption of the Core Strategy, which focuses the
Annual Monitoring Report January 2016
16
development proposed in a few major developments on the edge of Cambridge and
the new town of Northstowe, and provided for more development within the village
frameworks of the largest villages. Between 2006 and 2011, this change in
development strategy could be seen to be gradually taking effect with an increase in
the proportion of completions on the edge of Cambridge and at the Rural Centres,
which includes the new settlement of Cambourne, and a decrease in the proportion
of completions in the smaller and less sustainable villages.
2.54. In the last four monitoring years, less than half of the dwellings completed were in the
most sustainable locations on the edge of Cambridge and at Rural Centres. This
departure from the adopted development strategy is due to the completion of 297
dwellings at Summersfield, Papworth Everard (a Minor Rural Centre), and the
completion of 246 dwellings on a large development to the west of Longstanton (a
Group Village). Both of these developments are rural allocations carried forward from
previous Local Plans. Completions on the major developments at Orchard Park and
Cambourne had also fallen compared to previous years, although in the last
monitoring year there has been an increase in completions on these two major
developments and the first completions at Trumpington Meadows.
2.55. Housing quality: All new development will have an impact on its surroundings and
the predominantly rural character of the district makes it particularly important that
new development is sensitively located and designed to a high quality. The Council
has assessed 76 developments completed in the last six monitoring years against
the Building for Life (BfL) standard, which is a Government endorsed industry
standard for well-designed homes and neighbourhoods. The BfL standard was
redesigned in 2012, and is now based on a traffic light system rather than an
absolute scoring system. The developments completed in 2014-2015 have been
assessed against the new BfL 12 standard.
2.56. Of the 12 developments that were completed in the last monitoring year, 4
developments at Cambourne, Longstanton and Trumpington Meadows are eligible to
be put forward for ‘Built for Life’ accreditation as they have scored 9 or more ‘greens’
out of a possible total of 12 ‘greens’. The majority of the 12 developments assessed
received ‘greens’ for successfully addressing the following categories:
Meeting local housing requirements – the development has a mix of housing
types and tenures that suit local requirements;
Easy to find your way around – the streets are legible, and easy to move through;
Connections – developments connect well with their surroundings by reinforcing
existing connections or forming new ones;
Facilities and services – the developments are located close to community
facilities; and
External storage and amenity space – the design of the development integrates
bin storage, and / or provides convenient and secure cycle and vehicle storage.
2.57. The results also show that developments receiving ‘ambers’ tend not to satisfy the
categories relating to:
Public and private spaces – the definition between the public and private spaces
may be unclear, poorly designed or unmanaged;
January 2016 Annual Monitoring Report
17
Car parking – resident or visitor parking may be insufficient or not well integrated
so that it dominates the streets; and
Character – the design of the scheme does not fully create a place with a locally
inspired or otherwise distinctive character.
2.58. Accessibility to services and facilities by public transport: Over the last ten
monitoring years, less than 20% of new dwellings completed in each year were within
30 minutes public transport time of all six key services (GP surgery, hospital, primary
school, secondary school, employment and major retail centre). This is a reflection of
the rural nature of the district and also the changes in the provision and / or
frequency of rural bus services. Almost all new development is located close to the
key local services of a GP surgery and primary school. Access to services and
facilities is a key objective of the development strategy, and as the already adopted
allocations for sustainable major developments on the edge of Cambridge and at the
new town of Northstowe are implemented, together with the proposed major sites
included in the Local Plan (submitted in March 2014), it is expected that accessibility
to services and facilities will increase.
Employment and the Economy
2.59. Delivering jobs requirements: The Local Plan (submitted in March 2014) requires
22,000 additional jobs to be provided between 2011 and 2031 to support the
Cambridge Cluster and provide a diverse range of local jobs. Data suggests that
between 2011 and 2013 there was a net loss of 5,000 jobs in South Cambridgeshire,
of which a large proportion can be attributed to a loss of armed forces jobs. Other
sources of jobs data suggest that there has not been such a significant loss of jobs in
the district. Indications are that economic conditions have improved since 2012, and
the Council will continue to monitor the situation to ensure that it can take action if
necessary to deliver the additional jobs required to support the local economy.
2.60. Business floorspace completions: Business floorspace completions in the five
monitoring years from 2009 to 2014 were significantly lower than they were in the
early 2000s, although there has been a significant increase in business floorspace
completed in the last monitoring year due to the completion of over 21,000 sqm of
new floorspace as part of the redevelopment of TWI at Granta Park (Great Abington).
This new floorspace replaces nearly 13,000 sqm of floorspace demolished in the
previous monitoring year. The continued success of policies supporting research and
development, hi tech and biotech industries in the district can be seen in the net
increase of over 204,000 sqm of B1b (research & development) use completed
between 1999 and 2015, largely at research parks such as Granta Park (Great
Abington), Cambridge Research Park (Landbeach) and the Wellcome Institute
(Hinxton).
2.61. Between 1999 and 2013, there was a significant increase in the proportion of
business floorspace completed on PDL. This was followed by a fall to only 40% in the
2013-2014 monitoring year due to the completion of a new storage and distribution
warehouse at Papworth Business Park, which is a ‘greenfield’ allocation on the edge
of the village of Papworth Everard. In the last monitoring year, the proportion of
Annual Monitoring Report January 2016
18
business floorspace completed on PDL has increased again due to the completion of
new buildings as part of the redevelopment of TWI at Granta Park (Great Abington).
2.62. Supply of business land: South Cambridgeshire has a large supply of business
land with planning permission; at 31 March 2015 this amounted to over 80 ha of net
additional land, and of this 44% had detailed planning permission. Significant scale
sites with planning permission include:
land at Babraham Research Campus for research and development uses (9.8
ha);
phase 2 and other parcels at Granta Park for research and development uses (13
ha); and
land at Cambridge Research Park, Landbeach for a mixture of business uses
(Use Classes B1, B2 and B8) (9.5 ha).
2.63. Economy: Whilst the Cambridge area has withstood the effects of the recession
better than some areas, the recession has had an impact on the vitality of the local
economy. The district has consistently shown over 80% of the working age
population as economically active, even though there are more employed residents
in the district than the number of jobs (workplace population). The number of people
claiming job seekers allowance doubled in 2009 (from 636 claimants in 2008 to 1,508
claimants in 2009), but there has then been a gradual reduction over the last six
years to 556 claimants in February 2015. The number of businesses closing
outweighed the number of new businesses opening in 2009 and 2010, however this
has now reversed.
Climate Change, Resources and the Environment
2.64. Carbon dioxide emissions and air quality: A key factor affecting climate change is
carbon dioxide emissions and the aim nationally, and indeed internationally, is to
reduce levels of emissions of this greenhouse gas. The rate of carbon dioxide
emissions per person from domestic sources, for example. through the use of gas
and electricity, has shown a small reduction over the last nine years.
2.65. Air quality is an issue alongside the A14 and the Council has designated an Air
Quality Management Area with the objective of improving conditions in terms of
levels of nitrogen dioxide and the particulate PM10. There have been gradual
improvements in air quality recorded at the Council’s automatic monitoring stations
alongside the A14 at Bar Hill and Orchard Park, although the reason for this
improvement is unclear. It is possible that it is due to a combination of improvements
in cleaner vehicle engine technologies and changing meteorological conditions. A
new automatic monitoring station at Girton Road was introduced in 2012.
2.66. Household waste and recycling: Over the last thirteen years there has been a
significant increase in the proportion of waste that is recycled and composted in the
district. This is the result of the Council’s pro-active approach to recycling through the
introduction of blue and green bins, which allow the recycling and composting of a
significant amount of household waste. In the last monitoring year, 58% of household
waste was recycled or composted.
January 2016 Annual Monitoring Report
19
2.67. Renewable and non-renewable resources: The Council is committed to
encouraging and enabling a reduction in the use of fossil fuels and increasing the
proportion of energy used that is generated from renewable sources. In recent years,
household consumption of gas and electricity in the district has fallen, while the
generating potential of renewable energy sources in the district has increased. At 31
March 2015, four wind turbines, four biomass boilers and fourteen schemes for
photovoltaic panels including four solar farms that could provide over 120MW of
renewable energy at Shingay-cum-Wendy, Melbourn and Great Wilbraham, had
planning permission but had not yet been installed.
2.68. In the last four monitoring years, over 80% of planning permissions granted for
developments greater than 1,000 sqm or 10 dwellings, included renewable energy
technologies to provide 10% renewable energy. Although the remaining planning
permissions met the thresholds set out in Development Control Policy NE/3,
individual circumstances meant that they were not required to meet the policy.
2.69. Average water consumption by Cambridge Water Company and Anglian Water
customers is gradually falling. There is a general expectation that water consumption
will reduce as more efficient devices are installed, more properties are metered, and
as customer awareness increases. Anglian Water has run a “Drop 20” campaign that
encourages customers to save 20 litres per day and it has carried out many
household audits and provided water saving devices. Cambridge Water Company
attributes some of the variations to weather conditions. Wetter weather conditions
during the summer months tends to result in lower water consumption levels,
whereas drier weather conditions in the summer months tends to result in higher
water consumption levels.
2.70. Development in locations of environmental importance: Between 2004 and 2015
no new development was completed within, or is considered to adversely affect,
nationally or internationally important nature conservation sites. In the last monitoring
year, four proposals for development in the Green Belt have been completed that fall
within the definition of ‘inappropriate’ in terms of the uses normally acceptable in the
Green Belt. Very special circumstances for each of these proposals were considered
to outweigh the harm to the Green Belt.
2.71. Biodiversity: There are small areas of our Sites of Special Scientific Interest (SSSIs)
that are assessed as ‘unfavourable declining’ or ‘unfavourable no change’,
suggesting that their unique biodiversity characteristics are under threat. Natural
England is working with landowners to improve the management and therefore
condition of these areas of the district’s SSSIs.
2.72. The Council has successfully undertaken and / or supported a number of biodiversity
conservation projects in the last monitoring year. Examples include: continued
working with the Wildlife Trust to deliver the Hoffer Brook restoration project and its
maintenance; grant aid for bat surveys for St Denis Church, East Hatley; support for
the restoration of a meander of the Bourn Brook in association with the Countryside
Restoration Trust; and provision of bird and bat boxes to Council owned properties in
Ickleton and to Hatley St George Church.
Annual Monitoring Report January 2016
20
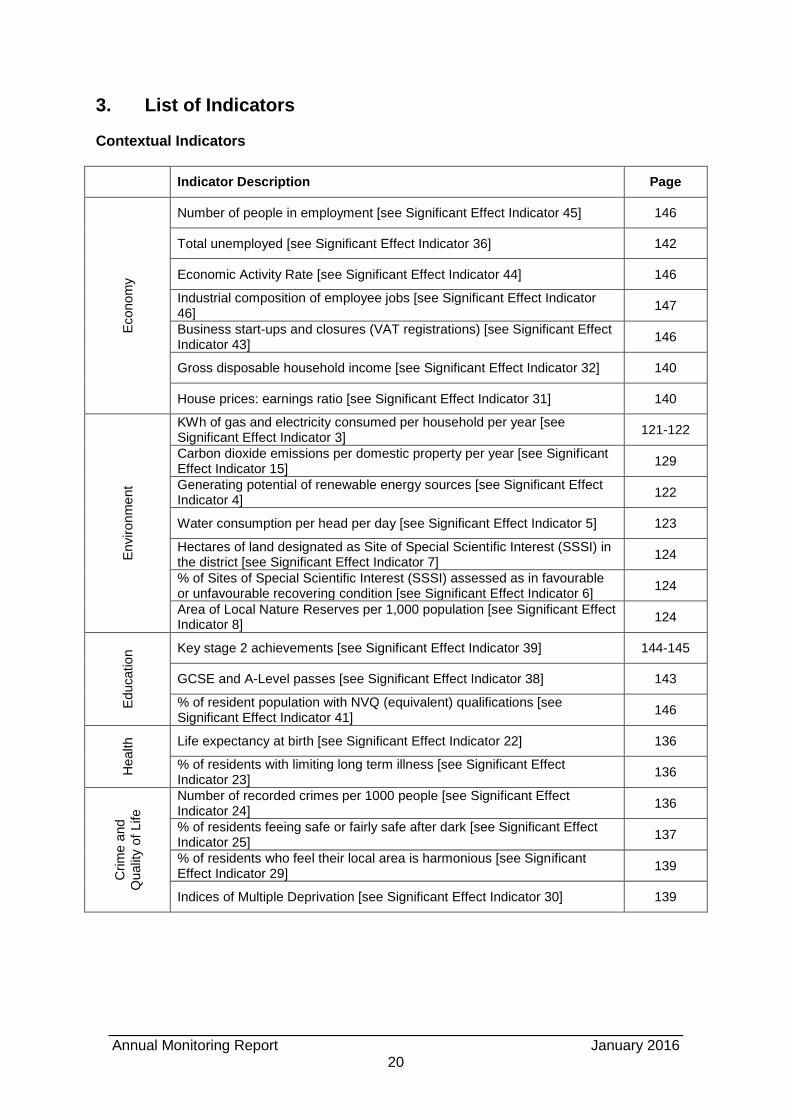
3. List of Indicators Contextual Indicators
Indicator Description Page
Econo
my
Number of people in employment [see Significant Effect Indicator 45] 146
Total unemployed [see Significant Effect Indicator 36] 142
Economic Activity Rate [see Significant Effect Indicator 44] 146
Industrial composition of employee jobs [see Significant Effect Indicator 46]
147
Business start-ups and closures (VAT registrations) [see Significant Effect Indicator 43]
146
Gross disposable household income [see Significant Effect Indicator 32] 140
House prices: earnings ratio [see Significant Effect Indicator 31] 140
Enviro
nm
ent
KWh of gas and electricity consumed per household per year [see Significant Effect Indicator 3]
121-122
Carbon dioxide emissions per domestic property per year [see Significant Effect Indicator 15]
129
Generating potential of renewable energy sources [see Significant Effect Indicator 4]
122
Water consumption per head per day [see Significant Effect Indicator 5] 123
Hectares of land designated as Site of Special Scientific Interest (SSSI) in the district [see Significant Effect Indicator 7]
124
% of Sites of Special Scientific Interest (SSSI) assessed as in favourable or unfavourable recovering condition [see Significant Effect Indicator 6]
124
Area of Local Nature Reserves per 1,000 population [see Significant Effect Indicator 8]
124
Educatio
n Key stage 2 achievements [see Significant Effect Indicator 39] 144-145
GCSE and A-Level passes [see Significant Effect Indicator 38] 143
% of resident population with NVQ (equivalent) qualifications [see Significant Effect Indicator 41]
146
Health
Life expectancy at birth [see Significant Effect Indicator 22] 136
% of residents with limiting long term illness [see Significant Effect Indicator 23]
136
Crim
e a
nd
Qualit
y o
f Life
Number of recorded crimes per 1000 people [see Significant Effect Indicator 24]
136
% of residents feeing safe or fairly safe after dark [see Significant Effect Indicator 25]
137
% of residents who feel their local area is harmonious [see Significant Effect Indicator 29]
139
Indices of Multiple Deprivation [see Significant Effect Indicator 30] 139
January 2016 Annual Monitoring Report
21
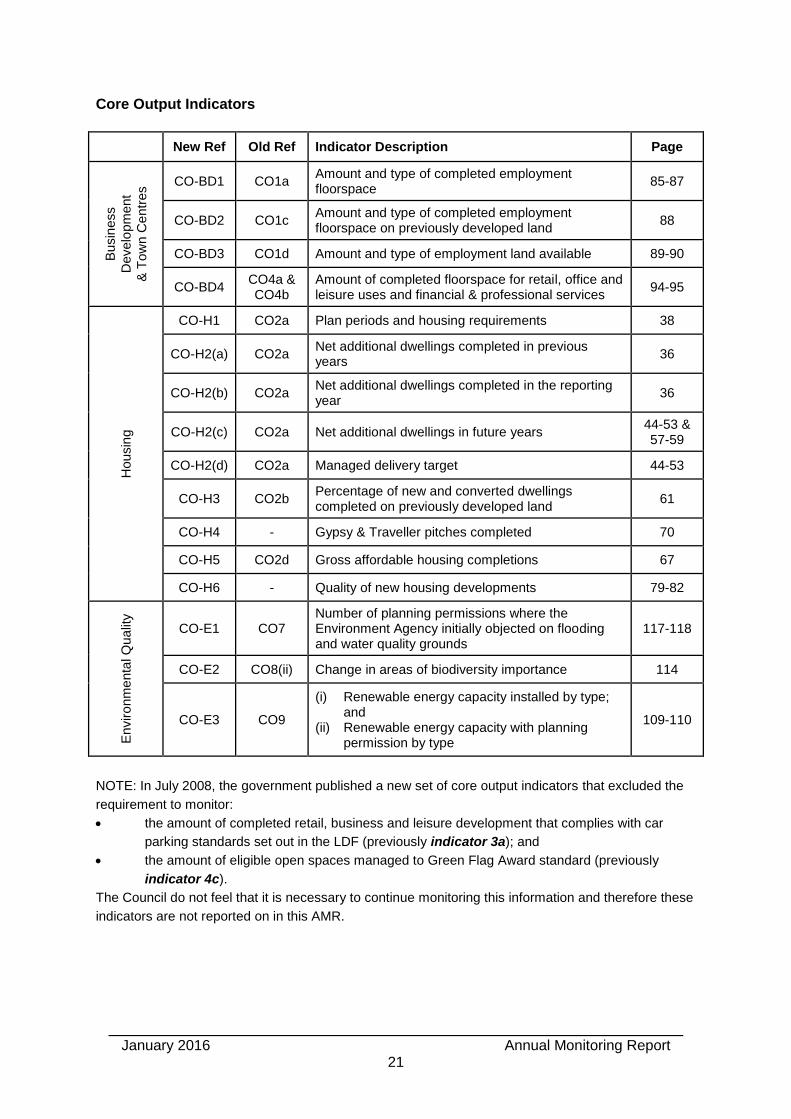
Core Output Indicators
New Ref Old Ref Indicator Description Page
Busin
ess
Develo
pm
ent
& T
ow
n C
entr
es CO-BD1 CO1a
Amount and type of completed employment floorspace
85-87
CO-BD2 CO1c Amount and type of completed employment floorspace on previously developed land
88
CO-BD3 CO1d Amount and type of employment land available 89-90
CO-BD4 CO4a & CO4b
Amount of completed floorspace for retail, office and leisure uses and financial & professional services
94-95
Housin
g
CO-H1 CO2a Plan periods and housing requirements 38
CO-H2(a) CO2a Net additional dwellings completed in previous years
36
CO-H2(b) CO2a Net additional dwellings completed in the reporting year
36
CO-H2(c) CO2a Net additional dwellings in future years 44-53 & 57-59
CO-H2(d) CO2a Managed delivery target 44-53
CO-H3 CO2b Percentage of new and converted dwellings completed on previously developed land
61
CO-H4 - Gypsy & Traveller pitches completed 70
CO-H5 CO2d Gross affordable housing completions 67
CO-H6 - Quality of new housing developments 79-82
Enviro
nm
enta
l Q
ua
lity
CO-E1 CO7 Number of planning permissions where the Environment Agency initially objected on flooding and water quality grounds
117-118
CO-E2 CO8(ii) Change in areas of biodiversity importance 114
CO-E3 CO9
(i) Renewable energy capacity installed by type; and
(ii) Renewable energy capacity with planning permission by type
109-110
NOTE: In July 2008, the government published a new set of core output indicators that excluded the
requirement to monitor:
the amount of completed retail, business and leisure development that complies with car
parking standards set out in the LDF (previously indicator 3a); and
the amount of eligible open spaces managed to Green Flag Award standard (previously
indicator 4c).
The Council do not feel that it is necessary to continue monitoring this information and therefore these
indicators are not reported on in this AMR.

Annual Monitoring Report January 2016
22
Local Output Indicators
Ref Indicator Description Page
Housin
g
LOA1 Housing completions by number of bedrooms 77
LOA2 Affordable housing completions by tenure 68
LOA3 Affordable housing completions on rural exception sites 68
LOA4 Number of caravans on unauthorised Gypsy & Traveller sites 71
LOA5 Market housing completions on developments of up to 10 dwellings by number of bedrooms
78
LOA6 Cumulative percentage of dwellings completed on previously developed land
60
LOA7 Affordable housing completions as a percentage of all housing completions on sites of 2 or more dwellings
*
LOA8 Affordable dwellings permitted as a percentage of all dwellings permitted on sites of 2 or more dwellings where Policy HG/3 applies
69
LOA14 Travelling Showpeople plots completed 70
CO2c LOB2
Net density of completed new housing developments on sites of 9 or more dwellings
63
LOB3 Average net density of completed new housing developments on sites of 9 or more dwellings
64
LOE1
(i) Average size of housing developments split by settlement category;
(ii) Largest housing development in each settlement category; and
(iii) Total dwellings built by settlement category.
73-75
Em
plo
ym
ent, C
om
mu
nity F
acili
ties &
Local S
erv
ices
LOA9 Amount of committed floorspace for retail, office and leisure uses and financial & professional services
96
LOA10 Amount and type of completed employment land 86-87
LOF1 Investment secured for infrastructure and community facilities through developer contributions
103-106
CO1b LOA11
Amount of completed employment floorspace on allocated land 88
CO1e LOA12
Amount of employment land lost on allocated land and in South Cambridgeshire
93
CO1f LOA13
Amount of employment land lost to residential development within village development frameworks and in South Cambridgeshire
93
CO3b LOB4
Amount of new residential development within 30 minutes public transport journey time of key services
101
* The Council does not feel that it is necessary to continue monitoring indicator LOA7 as indicator LOA8 more effectively monitors the implementation of the Council’s policy for the provision of affordable housing.
January 2016 Annual Monitoring Report
23
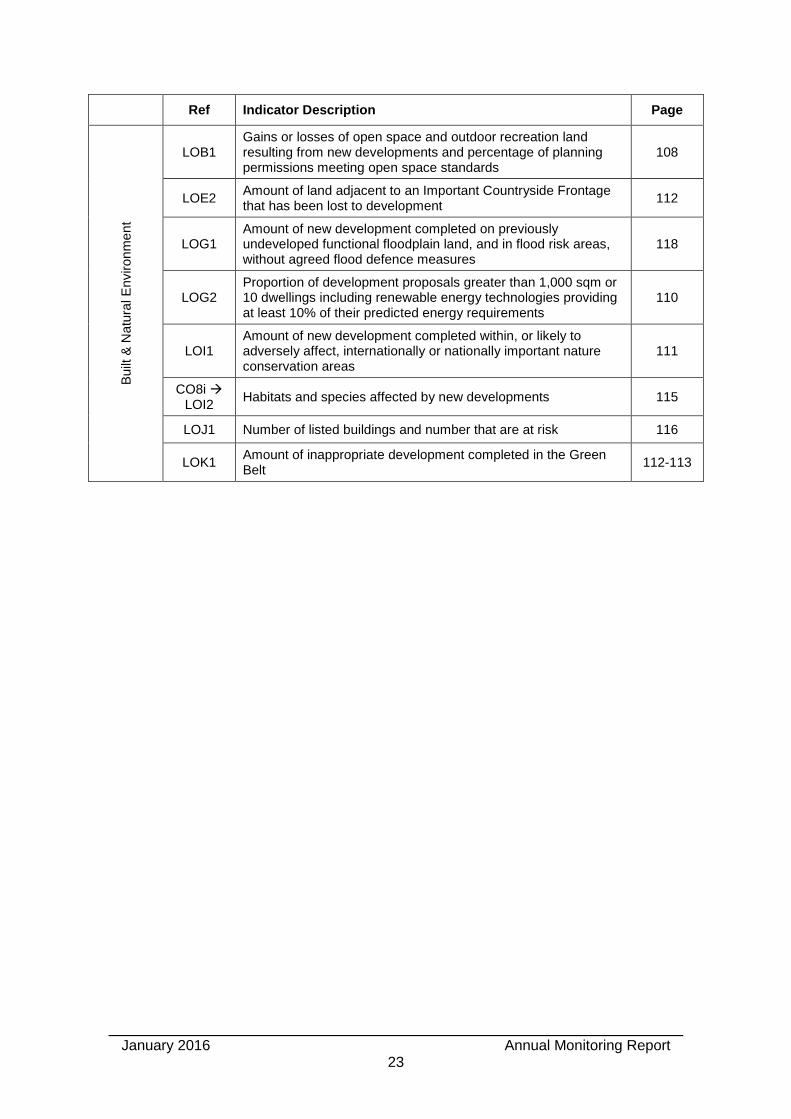
Ref Indicator Description Page B
uilt
& N
atu
ral E
nviron
me
nt
LOB1 Gains or losses of open space and outdoor recreation land resulting from new developments and percentage of planning permissions meeting open space standards
108
LOE2 Amount of land adjacent to an Important Countryside Frontage that has been lost to development
112
LOG1 Amount of new development completed on previously undeveloped functional floodplain land, and in flood risk areas, without agreed flood defence measures
118
LOG2 Proportion of development proposals greater than 1,000 sqm or 10 dwellings including renewable energy technologies providing at least 10% of their predicted energy requirements
110
LOI1 Amount of new development completed within, or likely to adversely affect, internationally or nationally important nature conservation areas
111
CO8i LOI2
Habitats and species affected by new developments 115
LOJ1 Number of listed buildings and number that are at risk 116
LOK1 Amount of inappropriate development completed in the Green Belt
112-113
Annual Monitoring Report January 2016
24
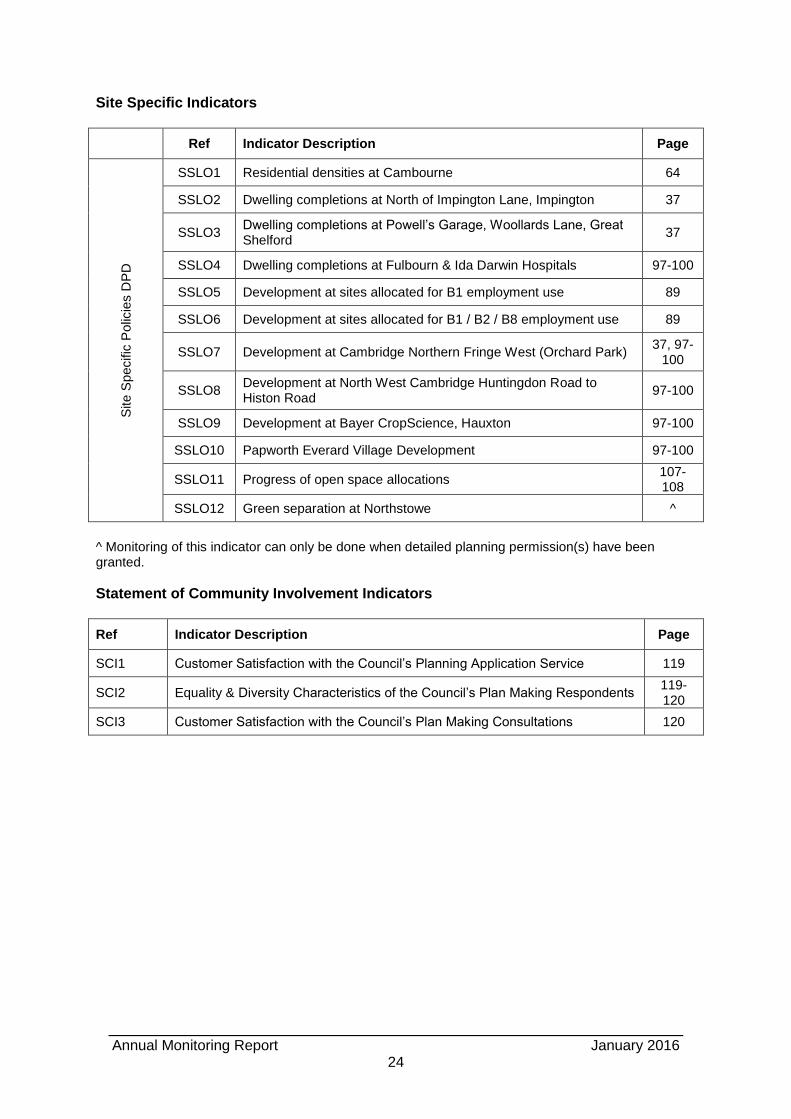
Site Specific Indicators
Ref Indicator Description Page
Site S
pecific
Polic
ies D
PD
SSLO1 Residential densities at Cambourne 64
SSLO2 Dwelling completions at North of Impington Lane, Impington 37
SSLO3 Dwelling completions at Powell’s Garage, Woollards Lane, Great Shelford
37
SSLO4 Dwelling completions at Fulbourn & Ida Darwin Hospitals 97-100
SSLO5 Development at sites allocated for B1 employment use 89
SSLO6 Development at sites allocated for B1 / B2 / B8 employment use 89
SSLO7 Development at Cambridge Northern Fringe West (Orchard Park) 37, 97-
100
SSLO8 Development at North West Cambridge Huntingdon Road to Histon Road
97-100
SSLO9 Development at Bayer CropScience, Hauxton 97-100
SSLO10 Papworth Everard Village Development 97-100
SSLO11 Progress of open space allocations 107-108
SSLO12 Green separation at Northstowe ^
^ Monitoring of this indicator can only be done when detailed planning permission(s) have been granted.
Statement of Community Involvement Indicators
Ref Indicator Description Page
SCI1 Customer Satisfaction with the Council’s Planning Application Service 119
SCI2 Equality & Diversity Characteristics of the Council’s Plan Making Respondents 119-120
SCI3 Customer Satisfaction with the Council’s Plan Making Consultations 120
January 2016 Annual Monitoring Report
25
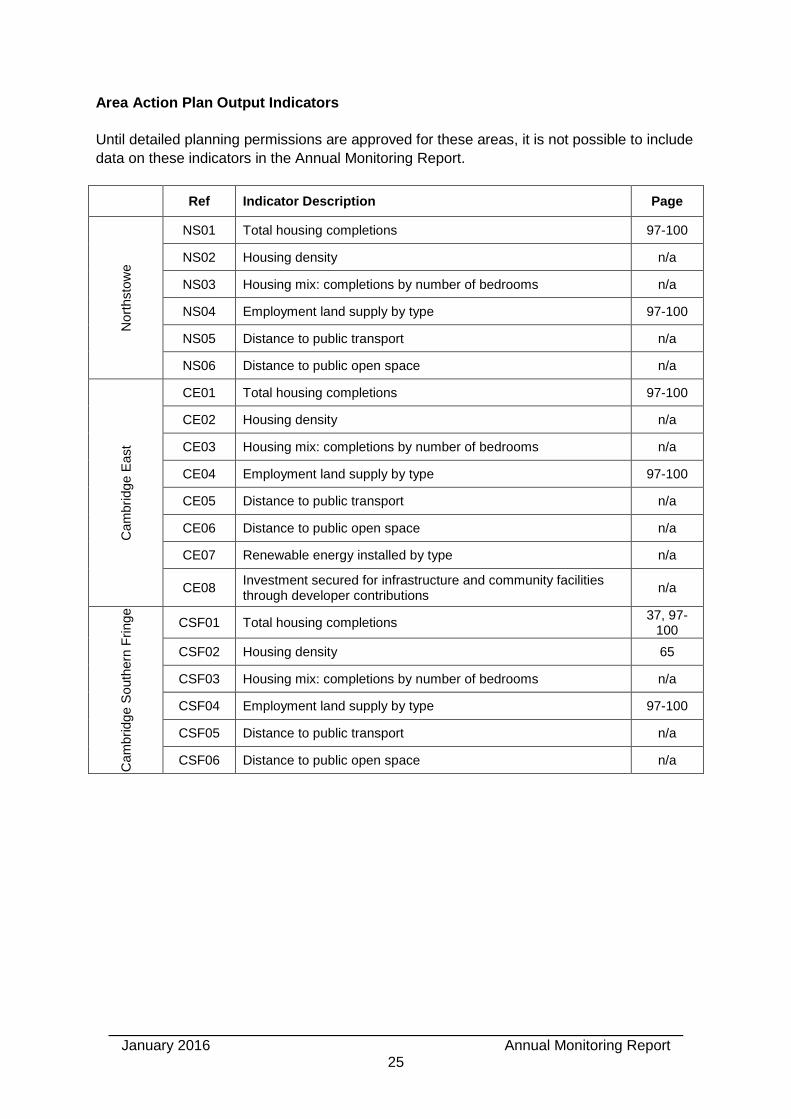
Area Action Plan Output Indicators
Until detailed planning permissions are approved for these areas, it is not possible to include
data on these indicators in the Annual Monitoring Report.
Ref Indicator Description Page
Nort
hsto
we
NS01 Total housing completions 97-100
NS02 Housing density n/a
NS03 Housing mix: completions by number of bedrooms n/a
NS04 Employment land supply by type 97-100
NS05 Distance to public transport n/a
NS06 Distance to public open space n/a
Cam
bri
dg
e E
ast
CE01 Total housing completions 97-100
CE02 Housing density n/a
CE03 Housing mix: completions by number of bedrooms n/a
CE04 Employment land supply by type 97-100
CE05 Distance to public transport n/a
CE06 Distance to public open space n/a
CE07 Renewable energy installed by type n/a
CE08 Investment secured for infrastructure and community facilities through developer contributions
n/a
Cam
bri
dg
e S
outh
ern
Fri
ng
e
CSF01 Total housing completions 37, 97-
100
CSF02 Housing density 65
CSF03 Housing mix: completions by number of bedrooms n/a
CSF04 Employment land supply by type 97-100
CSF05 Distance to public transport n/a
CSF06 Distance to public open space n/a
Annual Monitoring Report January 2016
26
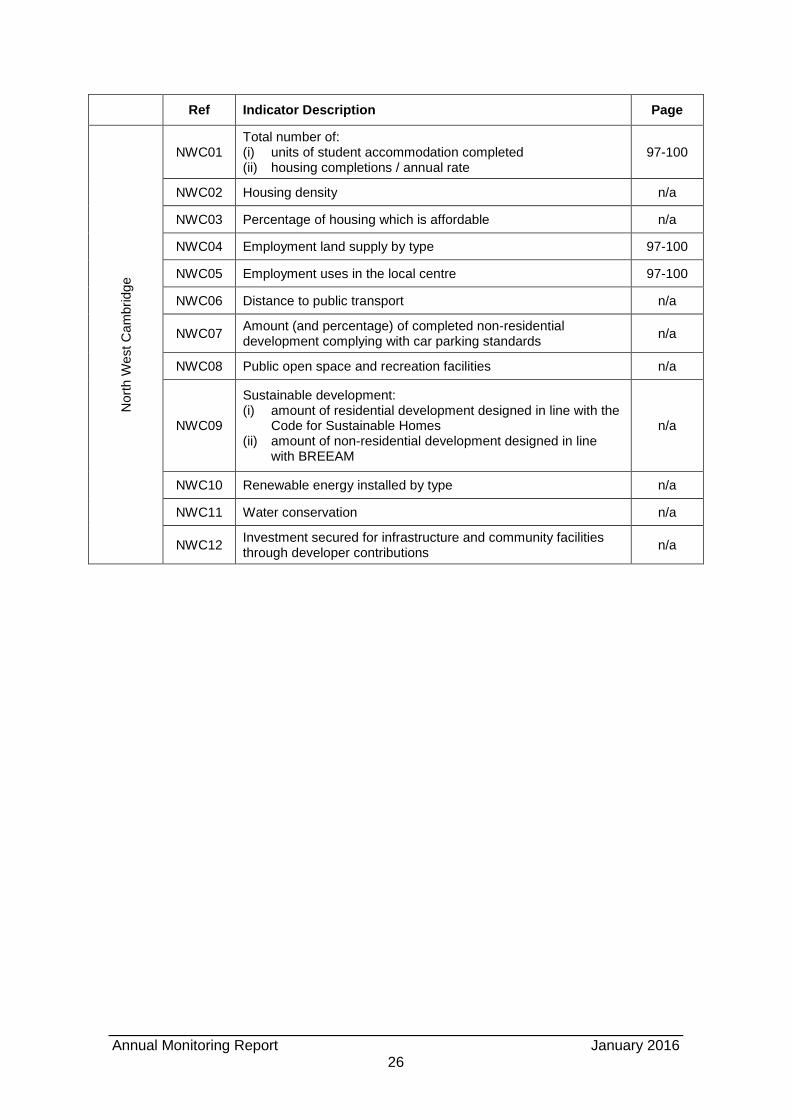
Ref Indicator Description Page N
ort
h W
est C
am
bri
dg
e
NWC01 Total number of: (i) units of student accommodation completed (ii) housing completions / annual rate
97-100
NWC02 Housing density n/a
NWC03 Percentage of housing which is affordable n/a
NWC04 Employment land supply by type 97-100
NWC05 Employment uses in the local centre 97-100
NWC06 Distance to public transport n/a
NWC07 Amount (and percentage) of completed non-residential development complying with car parking standards
n/a
NWC08 Public open space and recreation facilities n/a
NWC09
Sustainable development: (i) amount of residential development designed in line with the
Code for Sustainable Homes (ii) amount of non-residential development designed in line
with BREEAM
n/a
NWC10 Renewable energy installed by type n/a
NWC11 Water conservation n/a
NWC12 Investment secured for infrastructure and community facilities through developer contributions
n/a
January 2016 Annual Monitoring Report
27
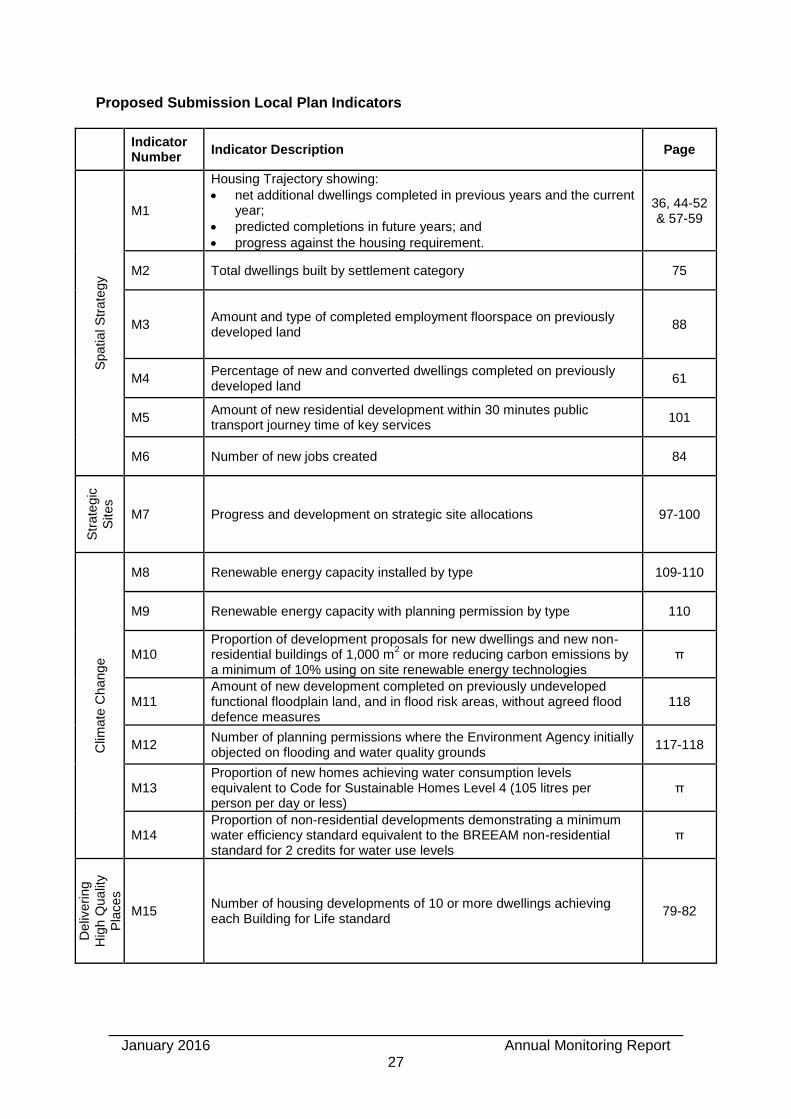
Proposed Submission Local Plan Indicators
Indicator Number
Indicator Description Page
Spatia
l S
trate
gy
M1
Housing Trajectory showing:
net additional dwellings completed in previous years and the current year;
predicted completions in future years; and
progress against the housing requirement.
36, 44-52 & 57-59
M2 Total dwellings built by settlement category 75
M3 Amount and type of completed employment floorspace on previously developed land
88
M4 Percentage of new and converted dwellings completed on previously developed land
61
M5 Amount of new residential development within 30 minutes public transport journey time of key services
101
M6 Number of new jobs created 84
Str
ate
gic
Sites
M7 Progress and development on strategic site allocations 97-100
Clim
ate
Ch
ang
e
M8 Renewable energy capacity installed by type 109-110
M9 Renewable energy capacity with planning permission by type 110
M10 Proportion of development proposals for new dwellings and new non-residential buildings of 1,000 m
2 or more reducing carbon emissions by
a minimum of 10% using on site renewable energy technologies π
M11 Amount of new development completed on previously undeveloped functional floodplain land, and in flood risk areas, without agreed flood defence measures
118
M12 Number of planning permissions where the Environment Agency initially objected on flooding and water quality grounds
117-118
M13 Proportion of new homes achieving water consumption levels equivalent to Code for Sustainable Homes Level 4 (105 litres per person per day or less)
π
M14 Proportion of non-residential developments demonstrating a minimum water efficiency standard equivalent to the BREEAM non-residential standard for 2 credits for water use levels
π
Deliv
erin
g
Hig
h Q
ua
lity
Pla
ces
M15 Number of housing developments of 10 or more dwellings achieving each Building for Life standard
79-82
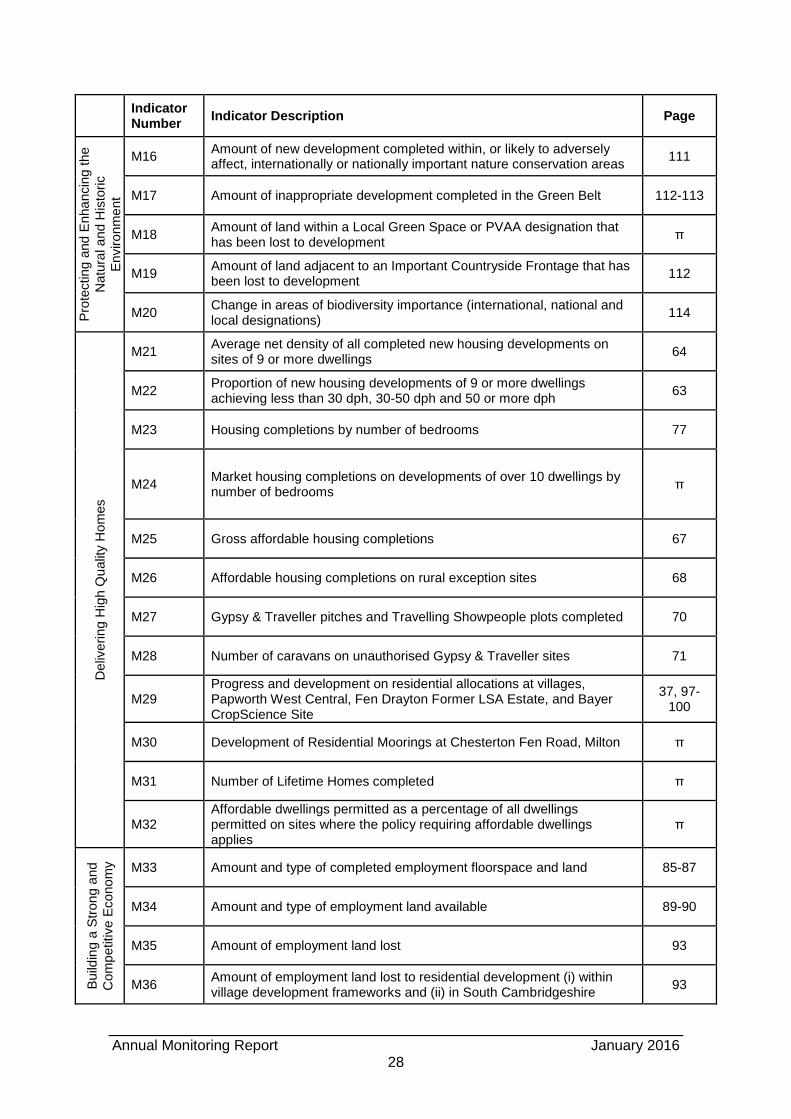
Annual Monitoring Report January 2016
28
Indicator Number
Indicator Description Page
Pro
tecting a
nd
Enha
ncin
g t
he
Natu
ral a
nd H
isto
ric
Enviro
nm
ent
M16 Amount of new development completed within, or likely to adversely affect, internationally or nationally important nature conservation areas
111
M17 Amount of inappropriate development completed in the Green Belt 112-113
M18 Amount of land within a Local Green Space or PVAA designation that has been lost to development
π
M19 Amount of land adjacent to an Important Countryside Frontage that has been lost to development
112
M20 Change in areas of biodiversity importance (international, national and local designations)
114
Deliv
erin
g H
igh Q
ualit
y H
om
es
M21 Average net density of all completed new housing developments on sites of 9 or more dwellings
64
M22 Proportion of new housing developments of 9 or more dwellings achieving less than 30 dph, 30-50 dph and 50 or more dph
63
M23 Housing completions by number of bedrooms 77
M24 Market housing completions on developments of over 10 dwellings by number of bedrooms
π
M25 Gross affordable housing completions 67
M26 Affordable housing completions on rural exception sites 68
M27 Gypsy & Traveller pitches and Travelling Showpeople plots completed 70
M28 Number of caravans on unauthorised Gypsy & Traveller sites 71
M29 Progress and development on residential allocations at villages, Papworth West Central, Fen Drayton Former LSA Estate, and Bayer CropScience Site
37, 97-100
M30 Development of Residential Moorings at Chesterton Fen Road, Milton π
M31 Number of Lifetime Homes completed π
M32 Affordable dwellings permitted as a percentage of all dwellings permitted on sites where the policy requiring affordable dwellings applies
π
Build
ing a
Str
on
g a
nd
Com
petitive E
cono
my
M33 Amount and type of completed employment floorspace and land 85-87
M34 Amount and type of employment land available 89-90
M35 Amount of employment land lost 93
M36 Amount of employment land lost to residential development (i) within village development frameworks and (ii) in South Cambridgeshire
93
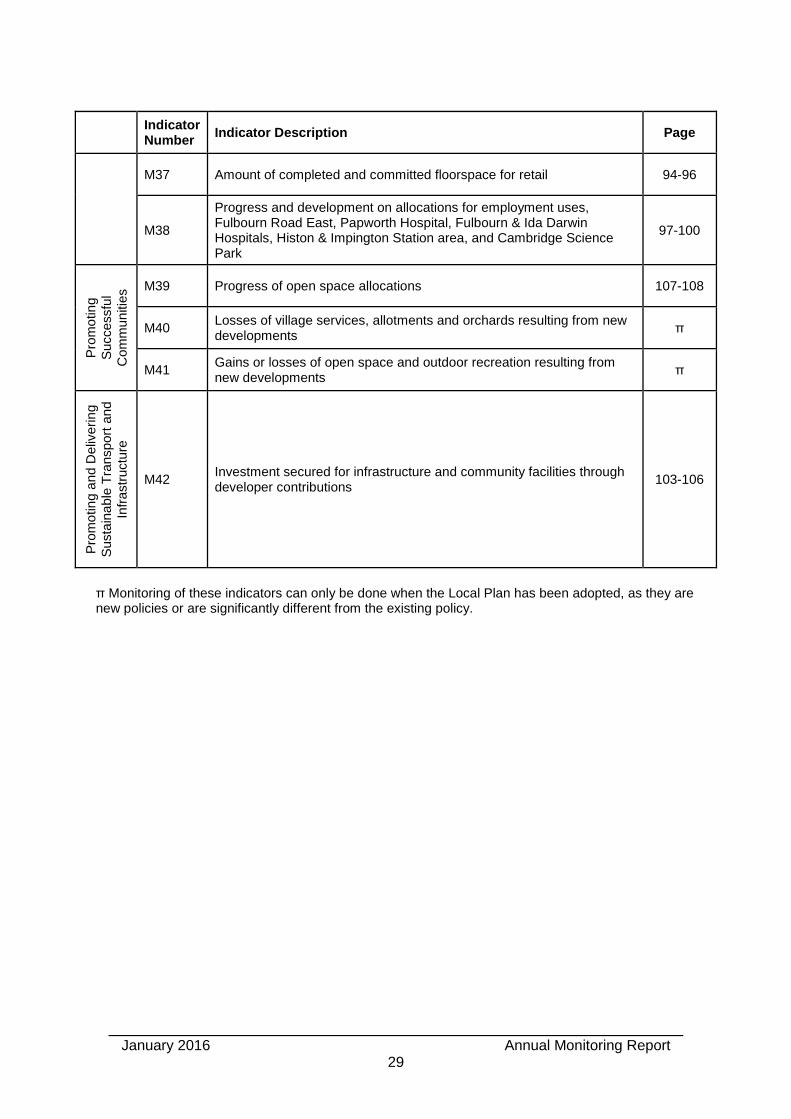
January 2016 Annual Monitoring Report
29
Indicator
Number Indicator Description Page
M37 Amount of completed and committed floorspace for retail 94-96
M38
Progress and development on allocations for employment uses, Fulbourn Road East, Papworth Hospital, Fulbourn & Ida Darwin Hospitals, Histon & Impington Station area, and Cambridge Science Park
97-100
Pro
mo
tin
g
Successfu
l
Com
mun
itie
s M39 Progress of open space allocations 107-108
M40 Losses of village services, allotments and orchards resulting from new developments
π
M41 Gains or losses of open space and outdoor recreation resulting from new developments
π
Pro
mo
tin
g a
nd D
eliv
erin
g
Susta
ina
ble
Tra
nsport
an
d
Infr
astr
uctu
re
M42 Investment secured for infrastructure and community facilities through developer contributions
103-106
π Monitoring of these indicators can only be done when the Local Plan has been adopted, as they are new policies or are significantly different from the existing policy.
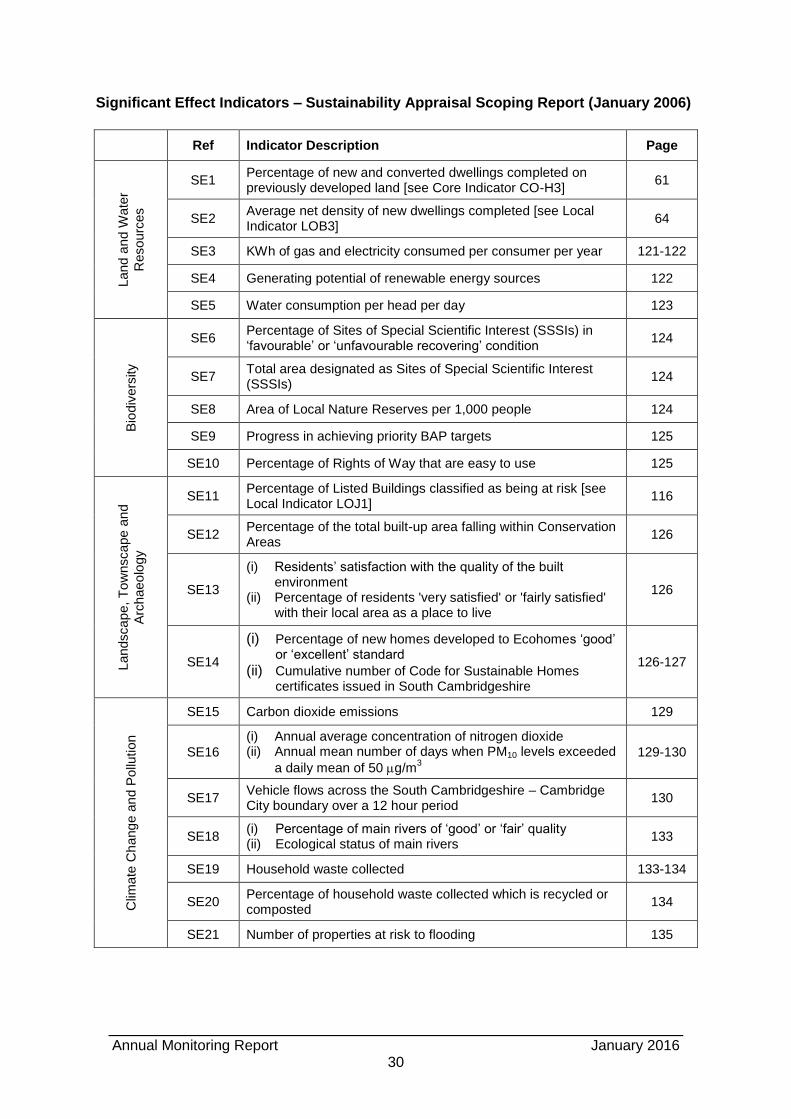
Annual Monitoring Report January 2016
30
Significant Effect Indicators – Sustainability Appraisal Scoping Report (January 2006)
Ref Indicator Description Page
Land
an
d W
ate
r
Resourc
es
SE1 Percentage of new and converted dwellings completed on previously developed land [see Core Indicator CO-H3]
61
SE2 Average net density of new dwellings completed [see Local Indicator LOB3]
64
SE3 KWh of gas and electricity consumed per consumer per year 121-122
SE4 Generating potential of renewable energy sources 122
SE5 Water consumption per head per day 123
Bio
div
ers
ity
SE6 Percentage of Sites of Special Scientific Interest (SSSIs) in ‘favourable’ or ‘unfavourable recovering’ condition
124
SE7 Total area designated as Sites of Special Scientific Interest (SSSIs)
124
SE8 Area of Local Nature Reserves per 1,000 people 124
SE9 Progress in achieving priority BAP targets 125
SE10 Percentage of Rights of Way that are easy to use 125
Landscap
e, T
ow
nscape a
nd
Arc
haeo
logy
SE11 Percentage of Listed Buildings classified as being at risk [see Local Indicator LOJ1]
116
SE12 Percentage of the total built-up area falling within Conservation Areas
126
SE13
(i) Residents’ satisfaction with the quality of the built environment
(ii) Percentage of residents 'very satisfied' or 'fairly satisfied' with their local area as a place to live
126
SE14
(i) Percentage of new homes developed to Ecohomes ‘good’ or ‘excellent’ standard
(ii) Cumulative number of Code for Sustainable Homes certificates issued in South Cambridgeshire
126-127
Clim
ate
Ch
ang
e a
nd P
ollu
tion
SE15 Carbon dioxide emissions 129
SE16
(i) Annual average concentration of nitrogen dioxide (ii) Annual mean number of days when PM10 levels exceeded
a daily mean of 50 g/m3
129-130
SE17 Vehicle flows across the South Cambridgeshire – Cambridge City boundary over a 12 hour period
130
SE18 (i) Percentage of main rivers of ‘good’ or ‘fair’ quality (ii) Ecological status of main rivers
133
SE19 Household waste collected 133-134
SE20 Percentage of household waste collected which is recycled or composted
134
SE21 Number of properties at risk to flooding 135
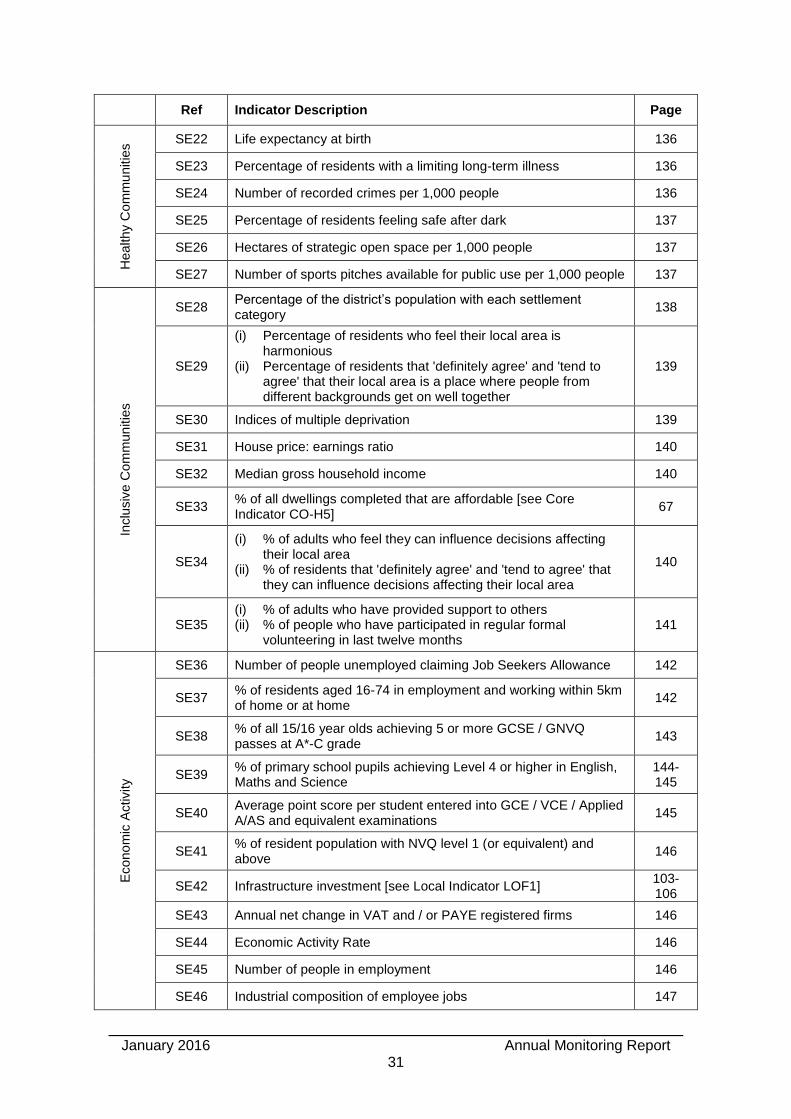
January 2016 Annual Monitoring Report
31
Ref Indicator Description Page H
ealthy C
om
mu
nitie
s SE22 Life expectancy at birth 136
SE23 Percentage of residents with a limiting long-term illness 136
SE24 Number of recorded crimes per 1,000 people 136
SE25 Percentage of residents feeling safe after dark 137
SE26 Hectares of strategic open space per 1,000 people 137
SE27 Number of sports pitches available for public use per 1,000 people 137
Inclu
siv
e C
om
mun
itie
s
SE28 Percentage of the district’s population with each settlement category
138
SE29
(i) Percentage of residents who feel their local area is harmonious
(ii) Percentage of residents that 'definitely agree' and 'tend to agree' that their local area is a place where people from different backgrounds get on well together
139
SE30 Indices of multiple deprivation 139
SE31 House price: earnings ratio 140
SE32 Median gross household income 140
SE33 % of all dwellings completed that are affordable [see Core Indicator CO-H5]
67
SE34
(i) % of adults who feel they can influence decisions affecting their local area
(ii) % of residents that 'definitely agree' and 'tend to agree' that they can influence decisions affecting their local area
140
SE35 (i) % of adults who have provided support to others (ii) % of people who have participated in regular formal
volunteering in last twelve months 141
Econo
mic
Activity
SE36 Number of people unemployed claiming Job Seekers Allowance 142
SE37 % of residents aged 16-74 in employment and working within 5km of home or at home
142
SE38 % of all 15/16 year olds achieving 5 or more GCSE / GNVQ passes at A*-C grade
143
SE39 % of primary school pupils achieving Level 4 or higher in English, Maths and Science
144-145
SE40 Average point score per student entered into GCE / VCE / Applied A/AS and equivalent examinations
145
SE41 % of resident population with NVQ level 1 (or equivalent) and above
146
SE42 Infrastructure investment [see Local Indicator LOF1] 103-106
SE43 Annual net change in VAT and / or PAYE registered firms 146
SE44 Economic Activity Rate 146
SE45 Number of people in employment 146
SE46 Industrial composition of employee jobs 147
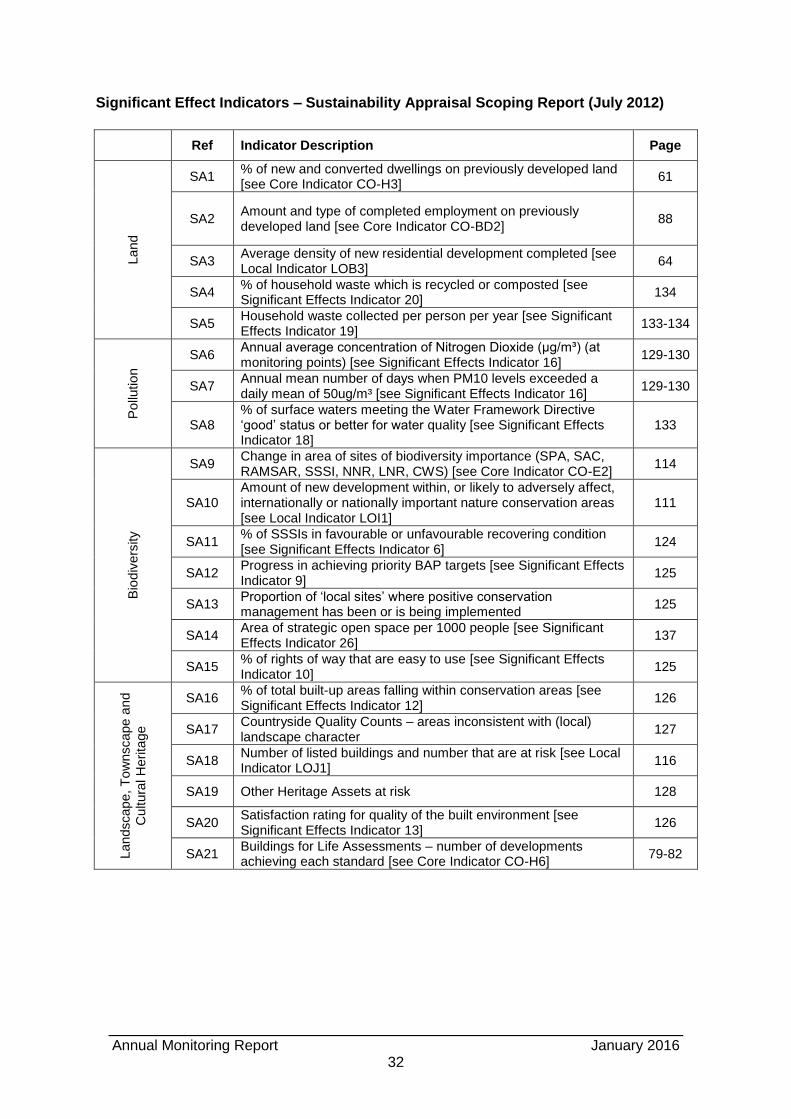
Annual Monitoring Report January 2016
32
Significant Effect Indicators – Sustainability Appraisal Scoping Report (July 2012)
Ref Indicator Description Page Land
SA1 % of new and converted dwellings on previously developed land [see Core Indicator CO-H3]
61
SA2 Amount and type of completed employment on previously developed land [see Core Indicator CO-BD2]
88
SA3 Average density of new residential development completed [see Local Indicator LOB3]
64
SA4 % of household waste which is recycled or composted [see Significant Effects Indicator 20]
134
SA5 Household waste collected per person per year [see Significant Effects Indicator 19]
133-134
Pollu
tio
n
SA6 Annual average concentration of Nitrogen Dioxide (μg/m³) (at monitoring points) [see Significant Effects Indicator 16]
129-130
SA7 Annual mean number of days when PM10 levels exceeded a daily mean of 50ug/m³ [see Significant Effects Indicator 16]
129-130
SA8 % of surface waters meeting the Water Framework Directive ‘good’ status or better for water quality [see Significant Effects Indicator 18]
133
Bio
div
ers
ity
SA9 Change in area of sites of biodiversity importance (SPA, SAC, RAMSAR, SSSI, NNR, LNR, CWS) [see Core Indicator CO-E2]
114
SA10 Amount of new development within, or likely to adversely affect, internationally or nationally important nature conservation areas [see Local Indicator LOI1]
111
SA11 % of SSSIs in favourable or unfavourable recovering condition [see Significant Effects Indicator 6]
124
SA12 Progress in achieving priority BAP targets [see Significant Effects Indicator 9]
125
SA13 Proportion of ‘local sites’ where positive conservation management has been or is being implemented
125
SA14 Area of strategic open space per 1000 people [see Significant Effects Indicator 26]
137
SA15 % of rights of way that are easy to use [see Significant Effects Indicator 10]
125
Landscap
e, T
ow
nscape a
nd
Cultura
l H
erita
ge
SA16 % of total built-up areas falling within conservation areas [see Significant Effects Indicator 12]
126
SA17 Countryside Quality Counts – areas inconsistent with (local) landscape character
127
SA18 Number of listed buildings and number that are at risk [see Local Indicator LOJ1]
116
SA19 Other Heritage Assets at risk 128
SA20 Satisfaction rating for quality of the built environment [see Significant Effects Indicator 13]
126
SA21 Buildings for Life Assessments – number of developments achieving each standard [see Core Indicator CO-H6]
79-82
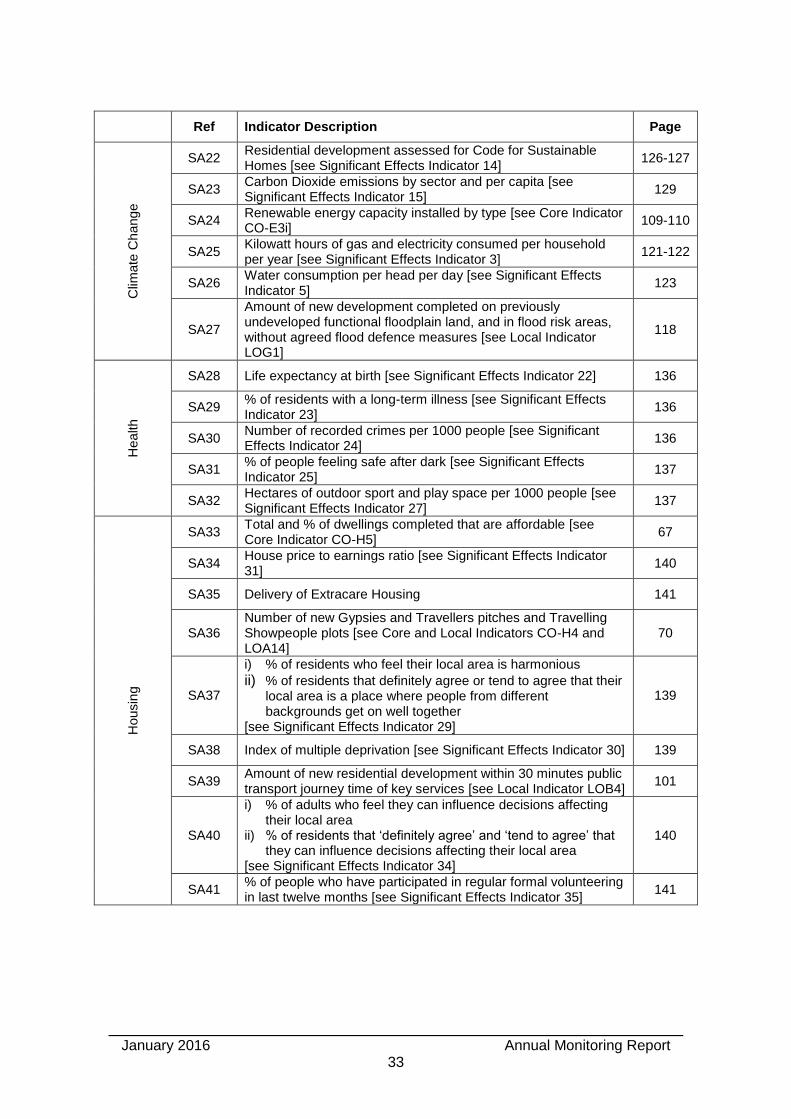
January 2016 Annual Monitoring Report
33
Ref Indicator Description Page C
limate
Ch
ang
e
SA22 Residential development assessed for Code for Sustainable Homes [see Significant Effects Indicator 14]
126-127
SA23 Carbon Dioxide emissions by sector and per capita [see Significant Effects Indicator 15]
129
SA24 Renewable energy capacity installed by type [see Core Indicator CO-E3i]
109-110
SA25 Kilowatt hours of gas and electricity consumed per household per year [see Significant Effects Indicator 3]
121-122
SA26 Water consumption per head per day [see Significant Effects Indicator 5]
123
SA27
Amount of new development completed on previously undeveloped functional floodplain land, and in flood risk areas, without agreed flood defence measures [see Local Indicator LOG1]
118
Health
SA28 Life expectancy at birth [see Significant Effects Indicator 22] 136
SA29 % of residents with a long-term illness [see Significant Effects Indicator 23]
136
SA30 Number of recorded crimes per 1000 people [see Significant Effects Indicator 24]
136
SA31 % of people feeling safe after dark [see Significant Effects Indicator 25]
137
SA32 Hectares of outdoor sport and play space per 1000 people [see Significant Effects Indicator 27]
137
Housin
g
SA33 Total and % of dwellings completed that are affordable [see Core Indicator CO-H5]
67
SA34 House price to earnings ratio [see Significant Effects Indicator 31]
140
SA35 Delivery of Extracare Housing 141
SA36 Number of new Gypsies and Travellers pitches and Travelling Showpeople plots [see Core and Local Indicators CO-H4 and LOA14]
70
SA37
i) % of residents who feel their local area is harmonious
ii) % of residents that definitely agree or tend to agree that their local area is a place where people from different backgrounds get on well together
[see Significant Effects Indicator 29]
139
SA38 Index of multiple deprivation [see Significant Effects Indicator 30] 139
SA39 Amount of new residential development within 30 minutes public transport journey time of key services [see Local Indicator LOB4]
101
SA40
i) % of adults who feel they can influence decisions affecting their local area
ii) % of residents that ‘definitely agree’ and ‘tend to agree’ that they can influence decisions affecting their local area
[see Significant Effects Indicator 34]
140
SA41 % of people who have participated in regular formal volunteering in last twelve months [see Significant Effects Indicator 35]
141
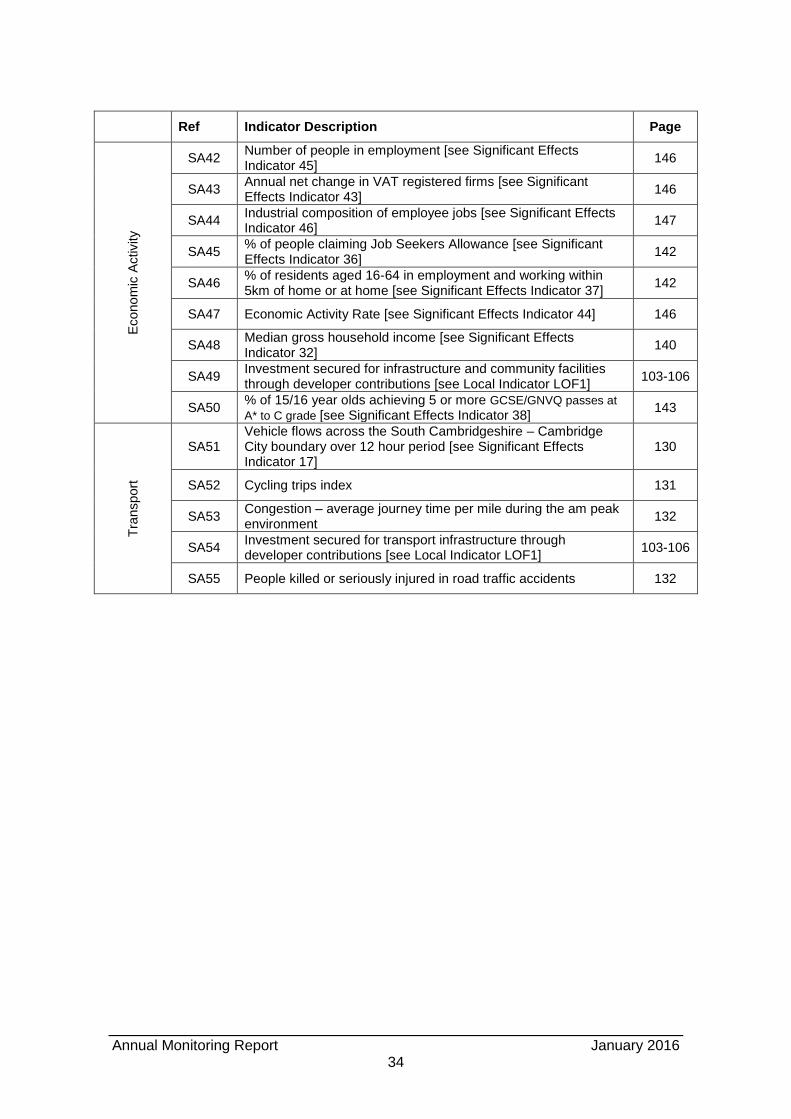
Annual Monitoring Report January 2016
34
Ref Indicator Description Page
Econo
mic
Activity
SA42 Number of people in employment [see Significant Effects Indicator 45]
146
SA43 Annual net change in VAT registered firms [see Significant Effects Indicator 43]
146
SA44 Industrial composition of employee jobs [see Significant Effects Indicator 46]
147
SA45 % of people claiming Job Seekers Allowance [see Significant Effects Indicator 36]
142
SA46 % of residents aged 16-64 in employment and working within 5km of home or at home [see Significant Effects Indicator 37]
142
SA47 Economic Activity Rate [see Significant Effects Indicator 44] 146
SA48 Median gross household income [see Significant Effects Indicator 32]
140
SA49 Investment secured for infrastructure and community facilities through developer contributions [see Local Indicator LOF1]
103-106
SA50 % of 15/16 year olds achieving 5 or more GCSE/GNVQ passes at
A* to C grade [see Significant Effects Indicator 38] 143
Tra
nsport
SA51 Vehicle flows across the South Cambridgeshire – Cambridge City boundary over 12 hour period [see Significant Effects Indicator 17]
130
SA52 Cycling trips index 131
SA53 Congestion – average journey time per mile during the am peak environment
132
SA54 Investment secured for transport infrastructure through developer contributions [see Local Indicator LOF1]
103-106
SA55 People killed or seriously injured in road traffic accidents 132
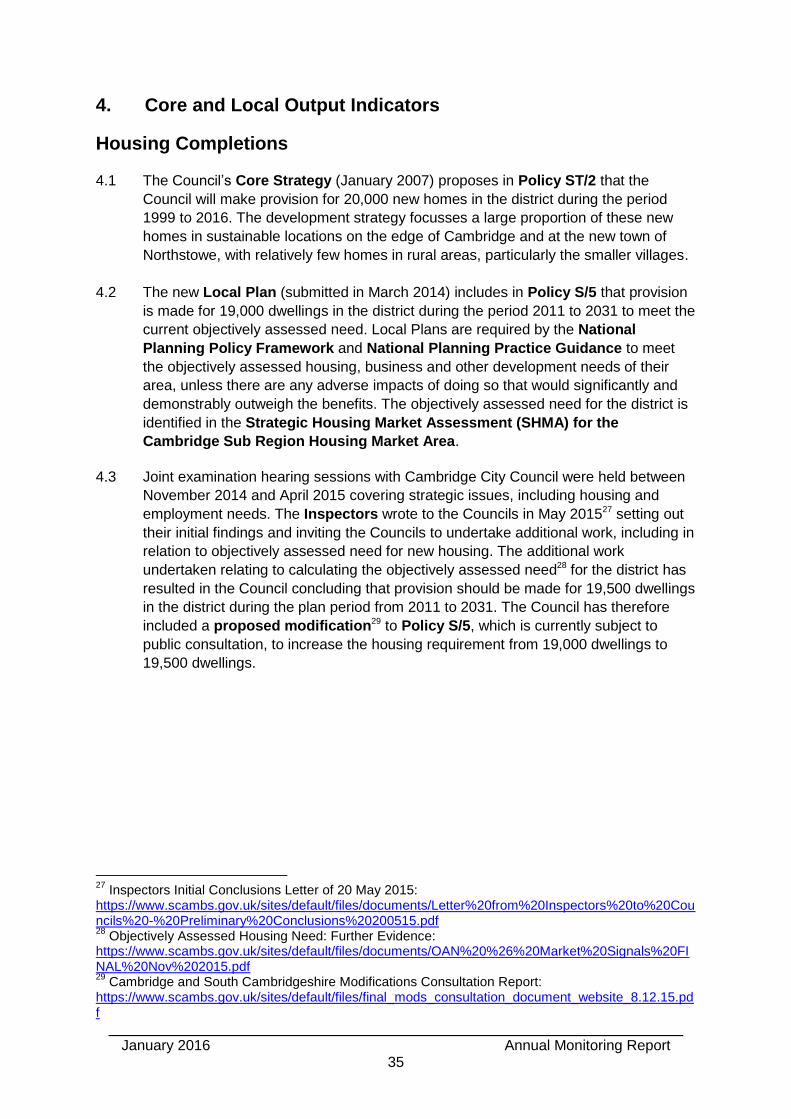
January 2016 Annual Monitoring Report
35
4. Core and Local Output Indicators
Housing Completions
4.1 The Council’s Core Strategy (January 2007) proposes in Policy ST/2 that the
Council will make provision for 20,000 new homes in the district during the period
1999 to 2016. The development strategy focusses a large proportion of these new
homes in sustainable locations on the edge of Cambridge and at the new town of
Northstowe, with relatively few homes in rural areas, particularly the smaller villages.
4.2 The new Local Plan (submitted in March 2014) includes in Policy S/5 that provision
is made for 19,000 dwellings in the district during the period 2011 to 2031 to meet the
current objectively assessed need. Local Plans are required by the National
Planning Policy Framework and National Planning Practice Guidance to meet
the objectively assessed housing, business and other development needs of their
area, unless there are any adverse impacts of doing so that would significantly and
demonstrably outweigh the benefits. The objectively assessed need for the district is
identified in the Strategic Housing Market Assessment (SHMA) for the
Cambridge Sub Region Housing Market Area.
4.3 Joint examination hearing sessions with Cambridge City Council were held between
November 2014 and April 2015 covering strategic issues, including housing and
employment needs. The Inspectors wrote to the Councils in May 201527 setting out
their initial findings and inviting the Councils to undertake additional work, including in
relation to objectively assessed need for new housing. The additional work
undertaken relating to calculating the objectively assessed need28 for the district has
resulted in the Council concluding that provision should be made for 19,500 dwellings
in the district during the plan period from 2011 to 2031. The Council has therefore
included a proposed modification29 to Policy S/5, which is currently subject to
public consultation, to increase the housing requirement from 19,000 dwellings to
19,500 dwellings.
27
Inspectors Initial Conclusions Letter of 20 May 2015: https://www.scambs.gov.uk/sites/default/files/documents/Letter%20from%20Inspectors%20to%20Councils%20-%20Preliminary%20Conclusions%20200515.pdf 28
Objectively Assessed Housing Need: Further Evidence: https://www.scambs.gov.uk/sites/default/files/documents/OAN%20%26%20Market%20Signals%20FINAL%20Nov%202015.pdf 29
Cambridge and South Cambridgeshire Modifications Consultation Report: https://www.scambs.gov.uk/sites/default/files/final_mods_consultation_document_website_8.12.15.pdf
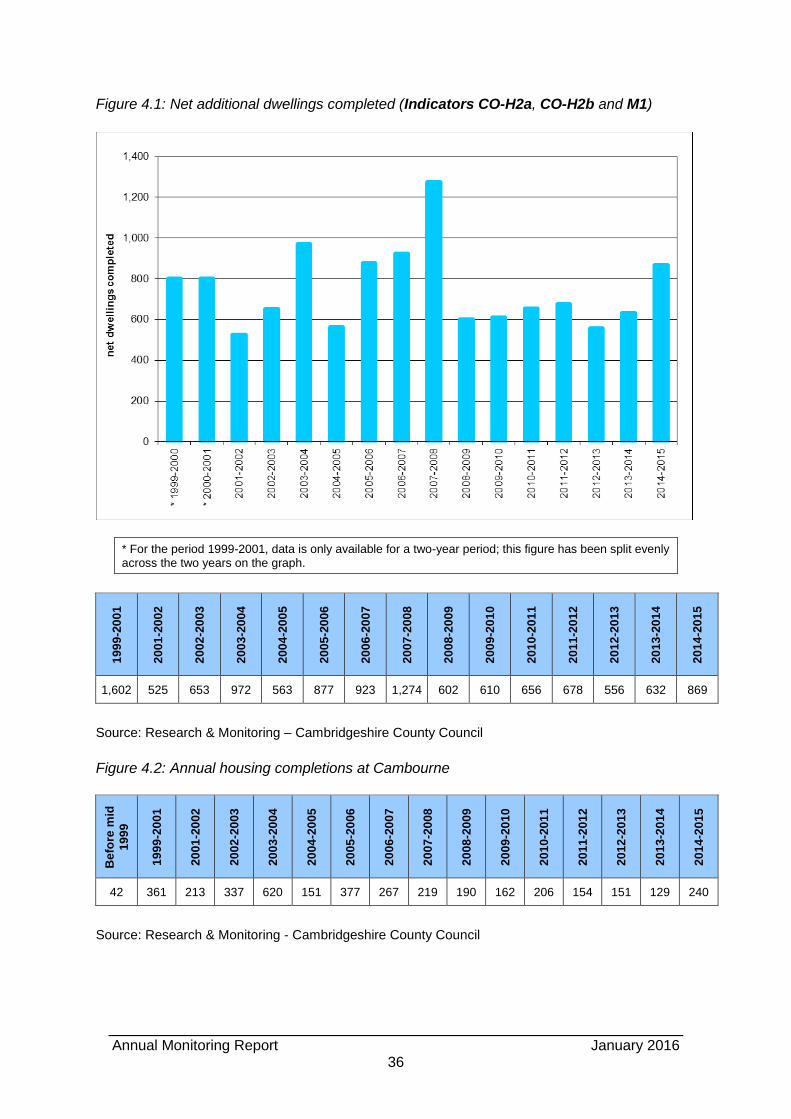
Annual Monitoring Report January 2016
36
Figure 4.1: Net additional dwellings completed (Indicators CO-H2a, CO-H2b and M1)
* For the period 1999-2001, data is only available for a two-year period; this figure has been split evenly across the two years on the graph.
19
99
-20
01
20
01
-20
02
20
02
-20
03
20
03
-20
04
20
04
-20
05
20
05
-20
06
20
06
-20
07
20
07
-20
08
20
08
-20
09
20
09
-20
10
20
10
-20
11
20
11
-20
12
20
12
-20
13
20
13
-20
14
20
14
-20
15
1,602 525 653 972 563 877 923 1,274 602 610 656 678 556 632 869
Source: Research & Monitoring – Cambridgeshire County Council
Figure 4.2: Annual housing completions at Cambourne
Befo
re m
id
19
99
19
99
-20
01
20
01
-20
02
20
02
-20
03
20
03
-20
04
20
04
-20
05
20
05
-20
06
20
06
-20
07
20
07
-20
08
20
08
-20
09
20
09
-20
10
20
10
-20
11
20
11
-20
12
20
12
-20
13
20
13
-20
14
20
14
-20
15
42 361 213 337 620 151 377 267 219 190 162 206 154 151 129 240
Source: Research & Monitoring - Cambridgeshire County Council
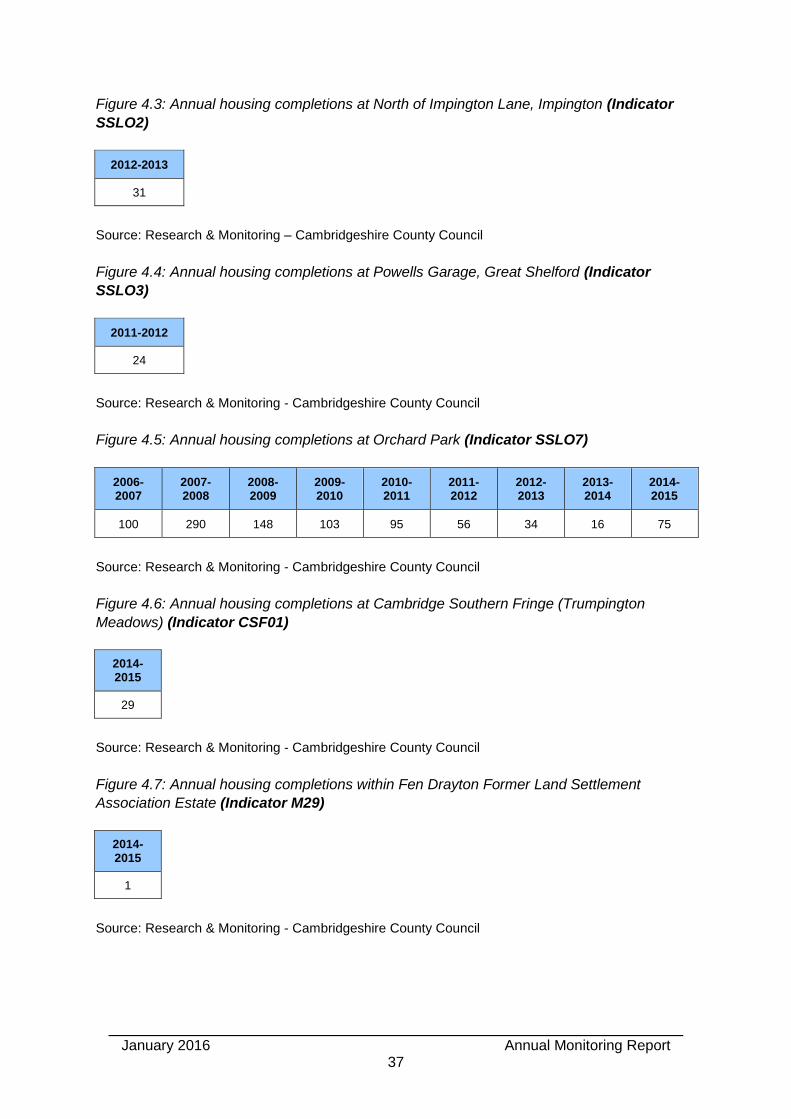
January 2016 Annual Monitoring Report
37
Figure 4.3: Annual housing completions at North of Impington Lane, Impington (Indicator
SSLO2)
2012-2013
31
Source: Research & Monitoring – Cambridgeshire County Council
Figure 4.4: Annual housing completions at Powells Garage, Great Shelford (Indicator
SSLO3)
2011-2012
24
Source: Research & Monitoring - Cambridgeshire County Council
Figure 4.5: Annual housing completions at Orchard Park (Indicator SSLO7)
2006- 2007
2007- 2008
2008- 2009
2009- 2010
2010- 2011
2011- 2012
2012- 2013
2013- 2014
2014- 2015
100 290 148 103 95 56 34 16 75
Source: Research & Monitoring - Cambridgeshire County Council
Figure 4.6: Annual housing completions at Cambridge Southern Fringe (Trumpington
Meadows) (Indicator CSF01)
2014- 2015
29
Source: Research & Monitoring - Cambridgeshire County Council
Figure 4.7: Annual housing completions within Fen Drayton Former Land Settlement
Association Estate (Indicator M29)
2014- 2015
1
Source: Research & Monitoring - Cambridgeshire County Council

Annual Monitoring Report January 2016
38
The Housing Trajectory
4.4 The Council’s adopted housing requirement is set out in Policy ST/2 of the Core
Strategy (adopted in January 2007). This has been determined to now be out of
date, but it remains part of the adopted development plan.
4.5 The new Local Plan (submitted in March 2014) includes in Policy S/5 that provision
is made for 19,000 dwellings in the district during the period 2011 to 2031 to meet the
current objectively assessed need. Joint examination hearing sessions with
Cambridge City Council were held between November 2014 and April 2015 covering
strategic issues, including housing and employment needs. The Inspectors wrote to
the Councils in May 201530 setting out their initial findings and inviting the Councils to
undertake additional work, including in relation to objectively assessed need for new
housing. The additional work undertaken relating to calculating the objectively
assessed need31 for the district has resulted in the Council concluding that provision
should be made for 19,500 dwellings in the district during the plan period from 2011
to 2031. The Council has therefore included a proposed modification32 to Policy
S/5, which is currently subject to public consultation, to increase the housing
requirement from 19,000 dwellings to 19,500 dwellings.
4.6 The housing requirements are summarised in figure 4.8.
Figure 4.8: Plan periods and housing requirements (Indicator CO-H1)
Adopted / Submitted Period of Plan Housing Provision Required
Annualised Requirement
Core Strategy Adopted January 2007 1 July 1999 – 31 March 2016
20,000 dwellings 1,176 dwellings
Local Plan Submitted in March 2014 1 April 2011 – 31 March 2031
19,000 dwellings 950 dwellings
Local Plan Modifications Consultation, December 2015
1 April 2011 – 31 March 2031
19,500 dwellings 975 dwellings
4.7 The Council prepares a housing trajectory as part of its Annual Monitoring Report to
set out the latest predictions of housing delivery over the following 15-year period or
to the end of the plan period, whichever is longer. The housing trajectory for South
Cambridgeshire is included as figure 4.10 and is also published in the Housing Land
30
Inspectors Initial Conclusions Letter of 20 May 2015: https://www.scambs.gov.uk/sites/default/files/documents/Letter%20from%20Inspectors%20to%20Councils%20-%20Preliminary%20Conclusions%20200515.pdf 31
Objectively Assessed Housing Need: Further Evidence: https://www.scambs.gov.uk/sites/default/files/documents/OAN%20%26%20Market%20Signals%20FINAL%20Nov%202015.pdf 32
Cambridge and South Cambridgeshire Modifications Consultation Report: https://www.scambs.gov.uk/sites/default/files/final_mods_consultation_document_website_8.12.15.pdf
January 2016 Annual Monitoring Report
39
Supply Update33 that forms part of the evidence base for the additional work
undertaken by the Councils in response to the letter from the Inspectors setting out
their initial findings and inviting the Councils to undertake additional work.
4.8 The Council aims to ensure that its housing trajectories are as robust and realistic as
possible. The housing trajectory has been produced in consultation with the various
agents, developers and landowners responsible for: the major developments
included in the adopted Area Action Plans; the housing allocations included in the
Site Specific Policies DPD; the new strategic and village allocations included in the
Local Plan; and sites of 10 or more dwellings with planning permission or a decision
to grant planning permission subject to the resolution of outstanding issues. An
assessment of each site in the housing trajectory is included in Appendix 1.
4.9 Data for the housing trajectory is gathered from various sources. A questionnaire is
sent to the agent, developer or landowner of each of the sites asking them to provide
details on whether the site is deliverable, available and achievable (these are the
tests set out in the National Planning Policy Framework), and their expected
delivery timetable, based on the latest understanding of any constraints, including
market conditions. A joint questionnaire is sent with Cambridge City Council to
developers of joint sites on the edge of Cambridge. For the small number of sites
where the Council does not receive a completed questionnaire, annual completions
are estimated based on survey data collected by Cambridgeshire County Council,
information included with the planning application or representations to the Local
Plan, or information known by the case officer. The information on sites being
developed by Registered Providers (previously known as Housing Associations) is
provided by the Housing Strategy Team and reflects their discussions on expected
start and completion dates.
4.10 The housing trajectories have proved to be reliable predictions of actual completions,
even if there has been some variation across individual sites. Predicted and actual
completions over the last 7 years are summarised in figure 4.9.
33
Housing Land Supply Update: https://www.scambs.gov.uk/sites/default/files/documents/Housing%20Land%20Supply%20Update%20Nov%202015.pdf
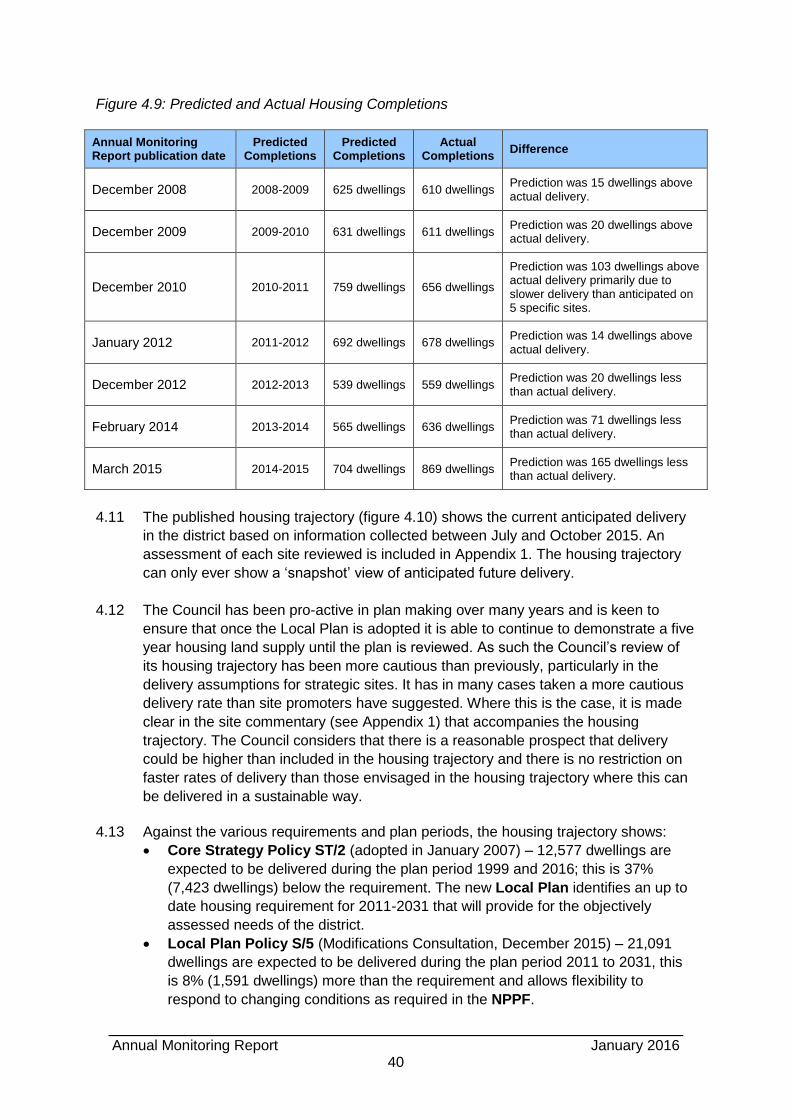
Annual Monitoring Report January 2016
40
Figure 4.9: Predicted and Actual Housing Completions
Annual Monitoring Report publication date
Predicted Completions
Predicted Completions
Actual Completions
Difference
December 2008 2008-2009 625 dwellings 610 dwellings Prediction was 15 dwellings above actual delivery.
December 2009 2009-2010 631 dwellings 611 dwellings Prediction was 20 dwellings above actual delivery.
December 2010 2010-2011 759 dwellings 656 dwellings
Prediction was 103 dwellings above actual delivery primarily due to slower delivery than anticipated on 5 specific sites.
January 2012 2011-2012 692 dwellings 678 dwellings Prediction was 14 dwellings above actual delivery.
December 2012 2012-2013 539 dwellings 559 dwellings Prediction was 20 dwellings less than actual delivery.
February 2014 2013-2014 565 dwellings 636 dwellings Prediction was 71 dwellings less than actual delivery.
March 2015 2014-2015 704 dwellings 869 dwellings Prediction was 165 dwellings less than actual delivery.
4.11 The published housing trajectory (figure 4.10) shows the current anticipated delivery
in the district based on information collected between July and October 2015. An
assessment of each site reviewed is included in Appendix 1. The housing trajectory
can only ever show a ‘snapshot’ view of anticipated future delivery.
4.12 The Council has been pro-active in plan making over many years and is keen to
ensure that once the Local Plan is adopted it is able to continue to demonstrate a five
year housing land supply until the plan is reviewed. As such the Council’s review of
its housing trajectory has been more cautious than previously, particularly in the
delivery assumptions for strategic sites. It has in many cases taken a more cautious
delivery rate than site promoters have suggested. Where this is the case, it is made
clear in the site commentary (see Appendix 1) that accompanies the housing
trajectory. The Council considers that there is a reasonable prospect that delivery
could be higher than included in the housing trajectory and there is no restriction on
faster rates of delivery than those envisaged in the housing trajectory where this can
be delivered in a sustainable way.
4.13 Against the various requirements and plan periods, the housing trajectory shows:
Core Strategy Policy ST/2 (adopted in January 2007) – 12,577 dwellings are
expected to be delivered during the plan period 1999 and 2016; this is 37%
(7,423 dwellings) below the requirement. The new Local Plan identifies an up to
date housing requirement for 2011-2031 that will provide for the objectively
assessed needs of the district.
Local Plan Policy S/5 (Modifications Consultation, December 2015) – 21,091
dwellings are expected to be delivered during the plan period 2011 to 2031, this
is 8% (1,591 dwellings) more than the requirement and allows flexibility to
respond to changing conditions as required in the NPPF.
January 2016 Annual Monitoring Report
41
Greater Cambridge Housing Trajectory
4.14 As outlined in Chapter 2 (section b), both South Cambridgeshire District Council and
Cambridge City Council are party to a Memorandum of Co-operation agreed in
May 2013, which sets out the continued support of all the Councils in the wider
Cambridge Sub Region housing market area to the development strategy for the area
and also the Councils’ commitment to meet in full the objectively assessed needs of
the housing market area. Both South Cambridgeshire District Council and Cambridge
City Council have committed to meeting their respective objectively assessed needs
in full in their Local Plans.
4.15 In September 2014, Cambridge City Council and South Cambridgeshire District
Council agreed a Memorandum of Understanding on the Greater Cambridge
Joint Housing Trajectory. This memorandum sets out the agreement between the
two Councils under the duty to co-operate that the housing trajectories for the two
areas should be considered together for the purposes of phasing housing delivery,
and for calculating five year housing land supply for plan-making and decision-taking.
The Council’s statement to Matter 1: Legal Requirements sets out proposed
modifications to the Local Plan (submitted in March 2014) to give effect to the
Memorandum34.
4.16 The merits of a joint housing trajectory for the Greater Cambridge area were
considered at the Matter 8: Housing Land Supply and Delivery hearings. The merits
of this approach were not addressed in the initial findings letter from the Inspectors of
20 May 201535. The Councils requested that the Inspectors reconsider issuing a view
on the principle of the joint housing trajectory given the five year land supply issues in
South Cambridgeshire. The Inspectors responded that they do not consider it
appropriate to reach any conclusions on the principle of the joint housing trajectory in
advance of knowing the outcome of the further work that the Councils are
undertaking. The Councils remain committed to the Memorandum of
Understanding on the Greater Cambridge Joint Housing Trajectory and the
proposed modifications to the Local Plans to give effect to the joint trajectory have
been included in the public consultation being undertaken jointly with Cambridge City
Council on Proposed Modifications to the Local Plans.
4.17 Each Council has produced its own housing trajectory to demonstrate how it is
meetings its own housing requirement within its own Local Plan in full. The
Memorandum of Understanding on the Greater Cambridge Joint Housing
Trajectory will not be relied upon or used in relation to planning decisions and
planning appeals until the Inspectors examining the Local Plan have reported on the
approach and found it to be ‘sound’.
4.18 The Greater Cambridge housing trajectory (see figure 4.10) has been produced by
combining the housing trajectories for both districts. Detailed information on the sites
34
Council’s statement to the Local Plan examination in relation to Matter 1: Legal Requirements: https://www.scambs.gov.uk/sites/www.scambs.gov.uk/files/documents/Matter%201%20Statement%20CCC%20-%20SCDC.pdf 35
Inspectors initial conclusions letter of 20 May 2015: https://www.scambs.gov.uk/sites/default/files/documents/Letter%20from%20Inspectors%20to%20Councils%20-%20Preliminary%20Conclusions%20200515.pdf
Annual Monitoring Report January 2016
42
in South Cambridgeshire is included in figure 4.10 and Appendix 1. Detailed
information on the sites in Cambridge is included in the Cambridge Annual Monitoring
Report 2014-201536.
4.19 The joint housing trajectory for the Greater Cambridge area shows that Cambridge is
delivering housing within the urban areas and urban fringe sites in the early and
middle parts of the plan period, whilst South Cambridgeshire is delivering housing in
the urban fringe sites and at new settlements, with an emphasis on the middle and
latter parts of the plan period, but with an element of village housing allocations to
provide some early delivery. In particular, the cross-boundary sites are building out
from the edge of the existing built-up area with more homes being built in Cambridge
in the early part of the plan period and then moving into South Cambridgeshire later
on. This is a logical and appropriate way of delivering sites to meet the combined
objectively assessed housing need across the Greater Cambridge area, consistent
with the development strategy contained in both submitted Local Plans.
36
Cambridge Annual Monitoring Reports: https://www.cambridge.gov.uk/content/annual-monitoring-reports
January 2016 Annual Monitoring Report
43
City Deal
4.20 The Greater Cambridge City Deal was signed with Government in June 201437 and
brings up to £500 million of grant funding to help deliver infrastructure to support
growth in the area with its highly successful economy. Through the City Deal, the
partners have committed to preparing a joint Local Plan and to the delivery of 1,000
additional new homes on rural exception sites by 2031. The submission of the Local
Plans for examination in March 2014 preceded the signing of the City Deal, and
therefore the Local Plans did not include the partners commitment to the additional
1,000 homes on rural exceptions sites.
4.21 The proposed modification38 to Policy S/5 of the South Cambridgeshire Local
Plan, which is currently subject to public consultation, to increase the housing
requirement from 19,000 dwellings to 19,500 dwellings goes halfway to incorporating
the commitment made by the partners to provide an additional 1,000 homes on rural
exception sites above the housing requirements included in the Local Plan
(submitted in March 2014). The second half of the commitment (the remaining 500
homes) will be considered as additional windfalls or as part of the preparation of the
joint Local Plan for Greater Cambridge, which the partners have committed to starting
in 2019.
37
Greater Cambridge City Deal: https://www.gov.uk/government/uploads/system/uploads/attachment_data/file/321722/Greater_Cambridge_City_Deal_Document.pdf 38
Cambridge and South Cambridgeshire Modifications Consultation Report: https://www.scambs.gov.uk/sites/default/files/final_mods_consultation_document_website_8.12.15.pdf
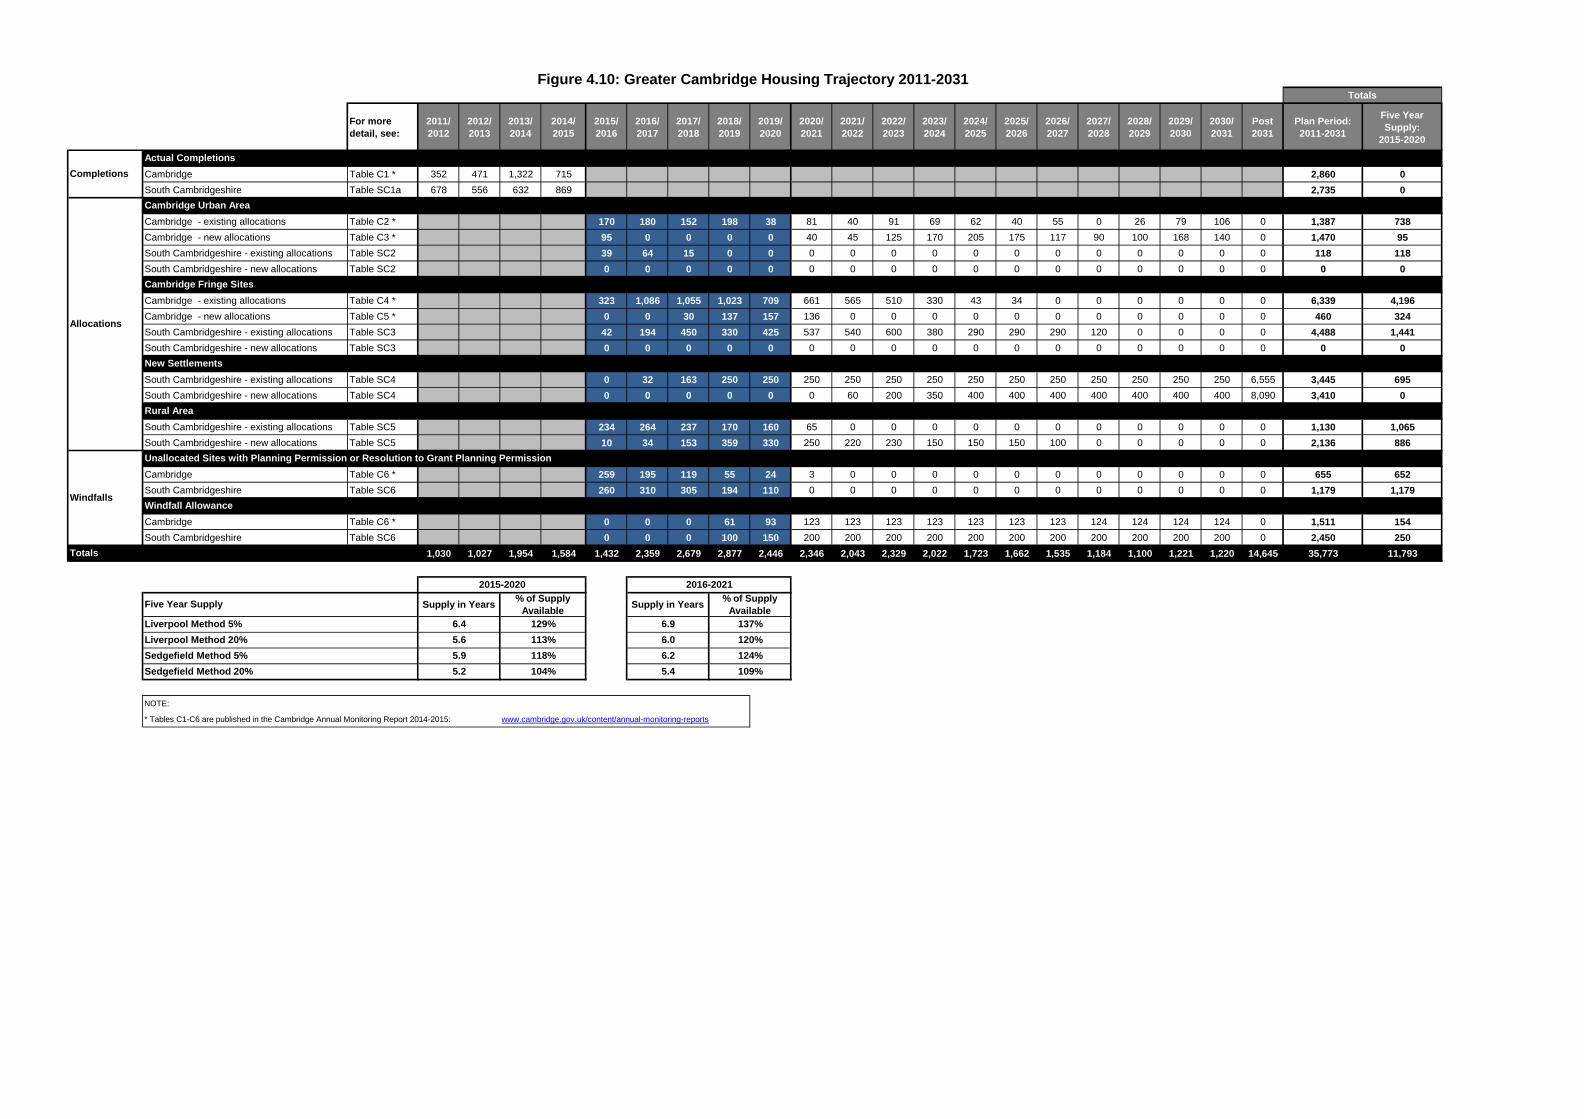
For more
detail, see:
2011/
2012
2012/
2013
2013/
2014
2014/
2015
2015/
2016
2016/
2017
2017/
2018
2018/
2019
2019/
2020
2020/
2021
2021/
2022
2022/
2023
2023/
2024
2024/
2025
2025/
2026
2026/
2027
2027/
2028
2028/
2029
2029/
2030
2030/
2031
Post
2031
Plan Period:
2011-2031
Five Year
Supply:
2015-2020
Cambridge Table C1 * 352 471 1,322 715 2,860 0
South Cambridgeshire Table SC1a 678 556 632 869 2,735 0
Cambridge - existing allocations Table C2 * 170 180 152 198 38 81 40 91 69 62 40 55 0 26 79 106 0 1,387 738
Cambridge - new allocations Table C3 * 95 0 0 0 0 40 45 125 170 205 175 117 90 100 168 140 0 1,470 95
South Cambridgeshire - existing allocations Table SC2 39 64 15 0 0 0 0 0 0 0 0 0 0 0 0 0 0 118 118
South Cambridgeshire - new allocations Table SC2 0 0 0 0 0 0 0 0 0 0 0 0 0 0 0 0 0 0 0
Cambridge - existing allocations Table C4 * 323 1,086 1,055 1,023 709 661 565 510 330 43 34 0 0 0 0 0 0 6,339 4,196
Cambridge - new allocations Table C5 * 0 0 30 137 157 136 0 0 0 0 0 0 0 0 0 0 0 460 324
South Cambridgeshire - existing allocations Table SC3 42 194 450 330 425 537 540 600 380 290 290 290 120 0 0 0 0 4,488 1,441
South Cambridgeshire - new allocations Table SC3 0 0 0 0 0 0 0 0 0 0 0 0 0 0 0 0 0 0 0
South Cambridgeshire - existing allocations Table SC4 0 32 163 250 250 250 250 250 250 250 250 250 250 250 250 250 6,555 3,445 695
South Cambridgeshire - new allocations Table SC4 0 0 0 0 0 0 60 200 350 400 400 400 400 400 400 400 8,090 3,410 0
South Cambridgeshire - existing allocations Table SC5 234 264 237 170 160 65 0 0 0 0 0 0 0 0 0 0 0 1,130 1,065
South Cambridgeshire - new allocations Table SC5 10 34 153 359 330 250 220 230 150 150 150 100 0 0 0 0 0 2,136 886
Cambridge Table C6 * 259 195 119 55 24 3 0 0 0 0 0 0 0 0 0 0 0 655 652
South Cambridgeshire Table SC6 260 310 305 194 110 0 0 0 0 0 0 0 0 0 0 0 0 1,179 1,179
Cambridge Table C6 * 0 0 0 61 93 123 123 123 123 123 123 123 124 124 124 124 0 1,511 154
South Cambridgeshire Table SC6 0 0 0 100 150 200 200 200 200 200 200 200 200 200 200 200 0 2,450 250
1,030 1,027 1,954 1,584 1,432 2,359 2,679 2,877 2,446 2,346 2,043 2,329 2,022 1,723 1,662 1,535 1,184 1,100 1,221 1,220 14,645 35,773 11,793
NOTE:
* Tables C1-C6 are published in the Cambridge Annual Monitoring Report 2014-2015: www.cambridge.gov.uk/content/annual-monitoring-reports
Figure 4.10: Greater Cambridge Housing Trajectory 2011-2031
Allocations
Five Year Supply
Liverpool Method 5%
Windfalls
Completions
Totals
Unallocated Sites with Planning Permission or Resolution to Grant Planning Permission
Windfall Allowance
129% 6.9 137%
Rural Area
Totals
Actual Completions
Sedgefield Method 20%
113%
118%
Supply in Years
6.4
5.6
5.9
Cambridge Urban Area
Cambridge Fringe Sites
New Settlements
6.2 124%
% of Supply
Available
Liverpool Method 20%
Sedgefield Method 5%
5.4 109%104%
2015-2020 2016-2021
Supply in Years% of Supply
Available
6.0 120%
5.2
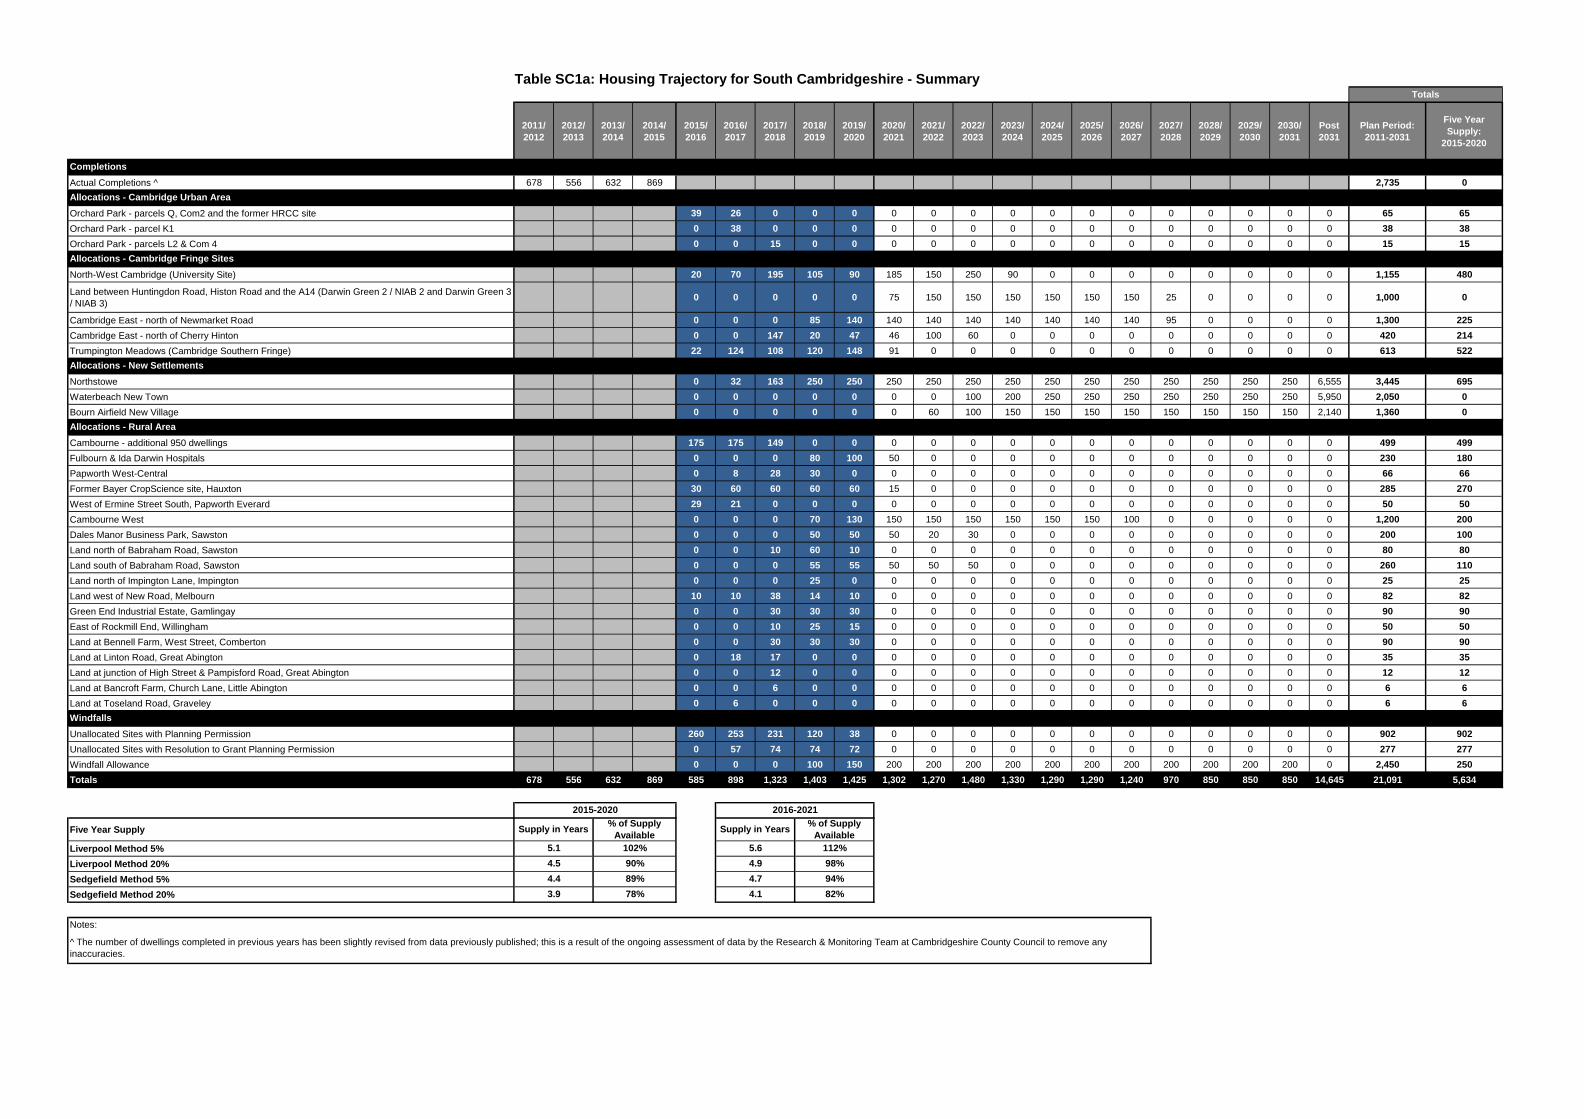
2011/
2012
2012/
2013
2013/
2014
2014/
2015
2015/
2016
2016/
2017
2017/
2018
2018/
2019
2019/
2020
2020/
2021
2021/
2022
2022/
2023
2023/
2024
2024/
2025
2025/
2026
2026/
2027
2027/
2028
2028/
2029
2029/
2030
2030/
2031
Post
2031
Plan Period:
2011-2031
Five Year
Supply:
2015-2020
Actual Completions ^ 678 556 632 869 2,735 0
Orchard Park - parcels Q, Com2 and the former HRCC site 39 26 0 0 0 0 0 0 0 0 0 0 0 0 0 0 0 65 65
Orchard Park - parcel K1 0 38 0 0 0 0 0 0 0 0 0 0 0 0 0 0 0 38 38
Orchard Park - parcels L2 & Com 4 0 0 15 0 0 0 0 0 0 0 0 0 0 0 0 0 0 15 15
North-West Cambridge (University Site) 20 70 195 105 90 185 150 250 90 0 0 0 0 0 0 0 0 1,155 480
Land between Huntingdon Road, Histon Road and the A14 (Darwin Green 2 / NIAB 2 and Darwin Green 3
/ NIAB 3)0 0 0 0 0 75 150 150 150 150 150 150 25 0 0 0 0 1,000 0
Cambridge East - north of Newmarket Road 0 0 0 85 140 140 140 140 140 140 140 140 95 0 0 0 0 1,300 225
Cambridge East - north of Cherry Hinton 0 0 147 20 47 46 100 60 0 0 0 0 0 0 0 0 0 420 214
Trumpington Meadows (Cambridge Southern Fringe) 22 124 108 120 148 91 0 0 0 0 0 0 0 0 0 0 0 613 522
Northstowe 0 32 163 250 250 250 250 250 250 250 250 250 250 250 250 250 6,555 3,445 695
Waterbeach New Town 0 0 0 0 0 0 0 100 200 250 250 250 250 250 250 250 5,950 2,050 0
Bourn Airfield New Village 0 0 0 0 0 0 60 100 150 150 150 150 150 150 150 150 2,140 1,360 0
Cambourne - additional 950 dwellings 175 175 149 0 0 0 0 0 0 0 0 0 0 0 0 0 0 499 499
Fulbourn & Ida Darwin Hospitals 0 0 0 80 100 50 0 0 0 0 0 0 0 0 0 0 0 230 180
Papworth West-Central 0 8 28 30 0 0 0 0 0 0 0 0 0 0 0 0 0 66 66
Former Bayer CropScience site, Hauxton 30 60 60 60 60 15 0 0 0 0 0 0 0 0 0 0 0 285 270
West of Ermine Street South, Papworth Everard 29 21 0 0 0 0 0 0 0 0 0 0 0 0 0 0 0 50 50
Cambourne West 0 0 0 70 130 150 150 150 150 150 150 100 0 0 0 0 0 1,200 200
Dales Manor Business Park, Sawston 0 0 0 50 50 50 20 30 0 0 0 0 0 0 0 0 0 200 100
Land north of Babraham Road, Sawston 0 0 10 60 10 0 0 0 0 0 0 0 0 0 0 0 0 80 80
Land south of Babraham Road, Sawston 0 0 0 55 55 50 50 50 0 0 0 0 0 0 0 0 0 260 110
Land north of Impington Lane, Impington 0 0 0 25 0 0 0 0 0 0 0 0 0 0 0 0 0 25 25
Land west of New Road, Melbourn 10 10 38 14 10 0 0 0 0 0 0 0 0 0 0 0 0 82 82
Green End Industrial Estate, Gamlingay 0 0 30 30 30 0 0 0 0 0 0 0 0 0 0 0 0 90 90
East of Rockmill End, Willingham 0 0 10 25 15 0 0 0 0 0 0 0 0 0 0 0 0 50 50
Land at Bennell Farm, West Street, Comberton 0 0 30 30 30 0 0 0 0 0 0 0 0 0 0 0 0 90 90
Land at Linton Road, Great Abington 0 18 17 0 0 0 0 0 0 0 0 0 0 0 0 0 0 35 35
Land at junction of High Street & Pampisford Road, Great Abington 0 0 12 0 0 0 0 0 0 0 0 0 0 0 0 0 0 12 12
Land at Bancroft Farm, Church Lane, Little Abington 0 0 6 0 0 0 0 0 0 0 0 0 0 0 0 0 0 6 6
Land at Toseland Road, Graveley 0 6 0 0 0 0 0 0 0 0 0 0 0 0 0 0 0 6 6
Unallocated Sites with Planning Permission 260 253 231 120 38 0 0 0 0 0 0 0 0 0 0 0 0 902 902
Unallocated Sites with Resolution to Grant Planning Permission 0 57 74 74 72 0 0 0 0 0 0 0 0 0 0 0 0 277 277
Windfall Allowance 0 0 0 100 150 200 200 200 200 200 200 200 200 200 200 200 0 2,450 250
Totals 678 556 632 869 585 898 1,323 1,403 1,425 1,302 1,270 1,480 1,330 1,290 1,290 1,240 970 850 850 850 14,645 21,091 5,634
Five Year Supply
Liverpool Method 5%
Liverpool Method 20%
Sedgefield Method 5%
Sedgefield Method 20%
2015-2020
Notes:
^ The number of dwellings completed in previous years has been slightly revised from data previously published; this is a result of the ongoing assessment of data by the Research & Monitoring Team at Cambridgeshire County Council to remove any
inaccuracies.
4.4 89%
3.9 78%
5.1 102%
4.5 90%
Supply in Years% of Supply
Available
2016-2021
Supply in Years% of Supply
Available
Windfalls
Table SC1a: Housing Trajectory for South Cambridgeshire - SummaryTotals
Allocations - Cambridge Urban Area
Allocations - Cambridge Fringe Sites
Allocations - New Settlements
Allocations - Rural Area
Completions
4.1 82%
5.6 112%
4.9 98%
4.7 94%
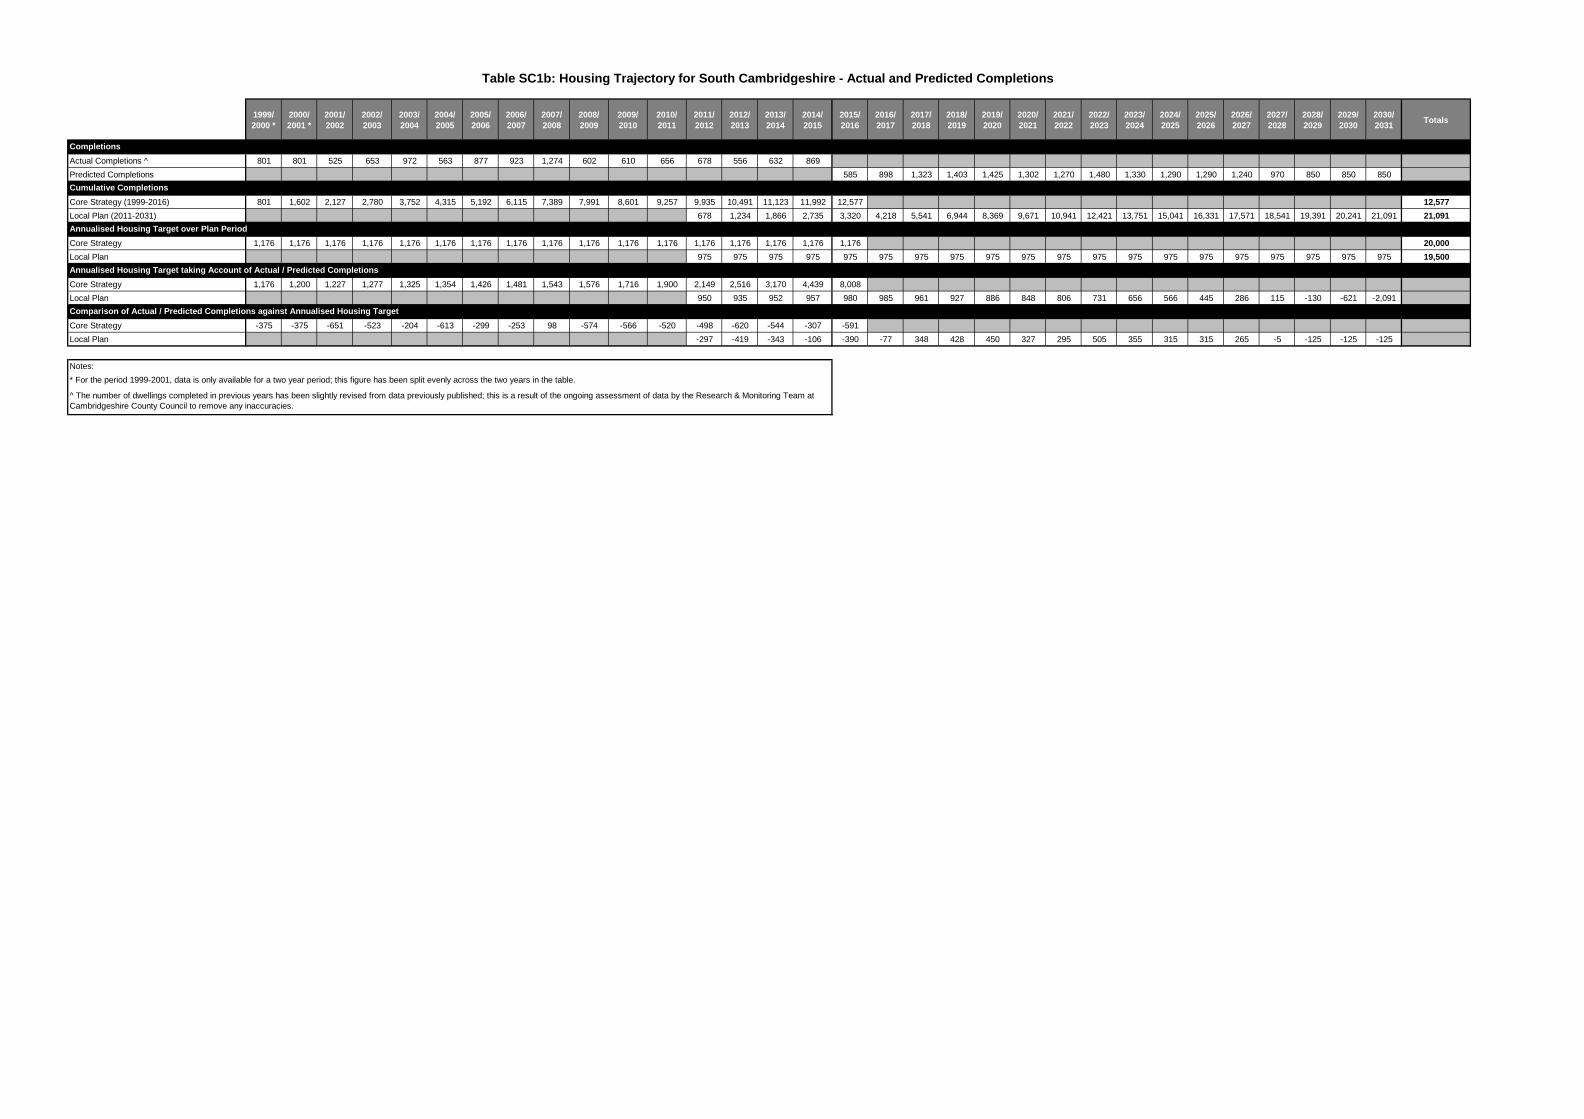
1999/
2000 *
2000/
2001 *
2001/
2002
2002/
2003
2003/
2004
2004/
2005
2005/
2006
2006/
2007
2007/
2008
2008/
2009
2009/
2010
2010/
2011
2011/
2012
2012/
2013
2013/
2014
2014/
2015
2015/
2016
2016/
2017
2017/
2018
2018/
2019
2019/
2020
2020/
2021
2021/
2022
2022/
2023
2023/
2024
2024/
2025
2025/
2026
2026/
2027
2027/
2028
2028/
2029
2029/
2030
2030/
2031Totals
Actual Completions ^ 801 801 525 653 972 563 877 923 1,274 602 610 656 678 556 632 869
Predicted Completions 585 898 1,323 1,403 1,425 1,302 1,270 1,480 1,330 1,290 1,290 1,240 970 850 850 850
Core Strategy (1999-2016) 801 1,602 2,127 2,780 3,752 4,315 5,192 6,115 7,389 7,991 8,601 9,257 9,935 10,491 11,123 11,992 12,577 12,577
Local Plan (2011-2031) 678 1,234 1,866 2,735 3,320 4,218 5,541 6,944 8,369 9,671 10,941 12,421 13,751 15,041 16,331 17,571 18,541 19,391 20,241 21,091 21,091
Core Strategy 1,176 1,176 1,176 1,176 1,176 1,176 1,176 1,176 1,176 1,176 1,176 1,176 1,176 1,176 1,176 1,176 1,176 20,000
Local Plan 975 975 975 975 975 975 975 975 975 975 975 975 975 975 975 975 975 975 975 975 19,500
Core Strategy 1,176 1,200 1,227 1,277 1,325 1,354 1,426 1,481 1,543 1,576 1,716 1,900 2,149 2,516 3,170 4,439 8,008
Local Plan 950 935 952 957 980 985 961 927 886 848 806 731 656 566 445 286 115 -130 -621 -2,091
Core Strategy -375 -375 -651 -523 -204 -613 -299 -253 98 -574 -566 -520 -498 -620 -544 -307 -591
Local Plan -297 -419 -343 -106 -390 -77 348 428 450 327 295 505 355 315 315 265 -5 -125 -125 -125
* For the period 1999-2001, data is only available for a two year period; this figure has been split evenly across the two years in the table.
^ The number of dwellings completed in previous years has been slightly revised from data previously published; this is a result of the ongoing assessment of data by the Research & Monitoring Team at
Cambridgeshire County Council to remove any inaccuracies.
Notes:
Comparison of Actual / Predicted Completions against Annualised Housing Target
Table SC1b: Housing Trajectory for South Cambridgeshire - Actual and Predicted Completions
Completions
Cumulative Completions
Annualised Housing Target over Plan Period
Annualised Housing Target taking Account of Actual / Predicted Completions

Site Name and Address Policy and / or Planning Permission(s) Site (ha)
Market (M), Affordable (A),
Key Worker (KW) or
Travelling Showpeople plots
(TS)
Total Number
of Dwellings
on Site (net)
Number of
Dwellings
Built (net) (at
31.03.15)
Outstanding
Dwellings (net)
2015/
2016
2016/
2017
2017/
2018
2018/
2019
2019/
2020
2020/
2021
2021/
2022
2022/
2023
2023/
2024
2024/
2025
2025/
2026
2026/
2027
2027/
2028
2028/
2029
2029/
2030
2030/
2031
Post
20312015-2031
Five Year
Supply:
2015-2020
Av
aila
ble
Su
ita
ble
Ac
hie
va
ble
Comments
M 89 40 49 23 26 0 0 0 0 0 0 0 0 0 0 0 0 0 0 0 49 49
A 51 35 16 16 0 0 0 0 0 0 0 0 0 0 0 0 0 0 0 0 16 16
Total 140 75 65 39 26 0 0 0 0 0 0 0 0 0 0 0 0 0 0 0 65 65
M (Co-Housing) 38 0 38 0 38 0 0 0 0 0 0 0 0 0 0 0 0 0 0 0 38 38
Total 38 0 38 0 38 0 0 0 0 0 0 0 0 0 0 0 0 0 0 0 38 38
M & A 80 0 80 0 0 15 0 0 0 0 0 0 0 0 0 0 0 0 0 0 15 15
Total 80 0 80 0 0 15 0 0 0 0 0 0 0 0 0 0 0 0 0 0 15 15
Total - Existing Allocations within Cambridge Urban Area 39 64 15 0 0 0 0 0 0 0 0 0 0 0 0 0 0 118 118
Table SC2: Housing Trajectory for South Cambridgeshire - Allocations within Cambridge Urban AreaTotals
Orchard Park - parcels L2 & Com 4Policy SP/1 (Site Specific Policies DPD), Policy SS/1 (Local Plan),
S/1760/141.23
Orchard Park - parcel K1Policy SP/1 (Site Specific Policies DPD), Policy SS/1 (Local Plan),
S/2725/14 (awaiting decision)0.94
Existing Allocations
Orchard Park - parcels Q, Com2 & the former HRCC
site
Policy SP/1 (Site Specific Policies DPD), Policy SS/1 (Local Plan),
S/2559/11, S/1179/13, S/2064/13 & S/0573/143.76
A planning application for a revised scheme of
40 dwellings is anticipated.
Outline planning permission for 15
townhouses on parcel L2 was granted in
October 2015. Noise and air quality
constraints will influence the design and layout
of parcel Com4, and therefore kaking a
precautionary approach, no allowance has
been made for housing on this parcel in the
housing trajectory as an acceptable scheme
has not yet been submitted.
Y
Y Y Y
Y Y
Y Y Y
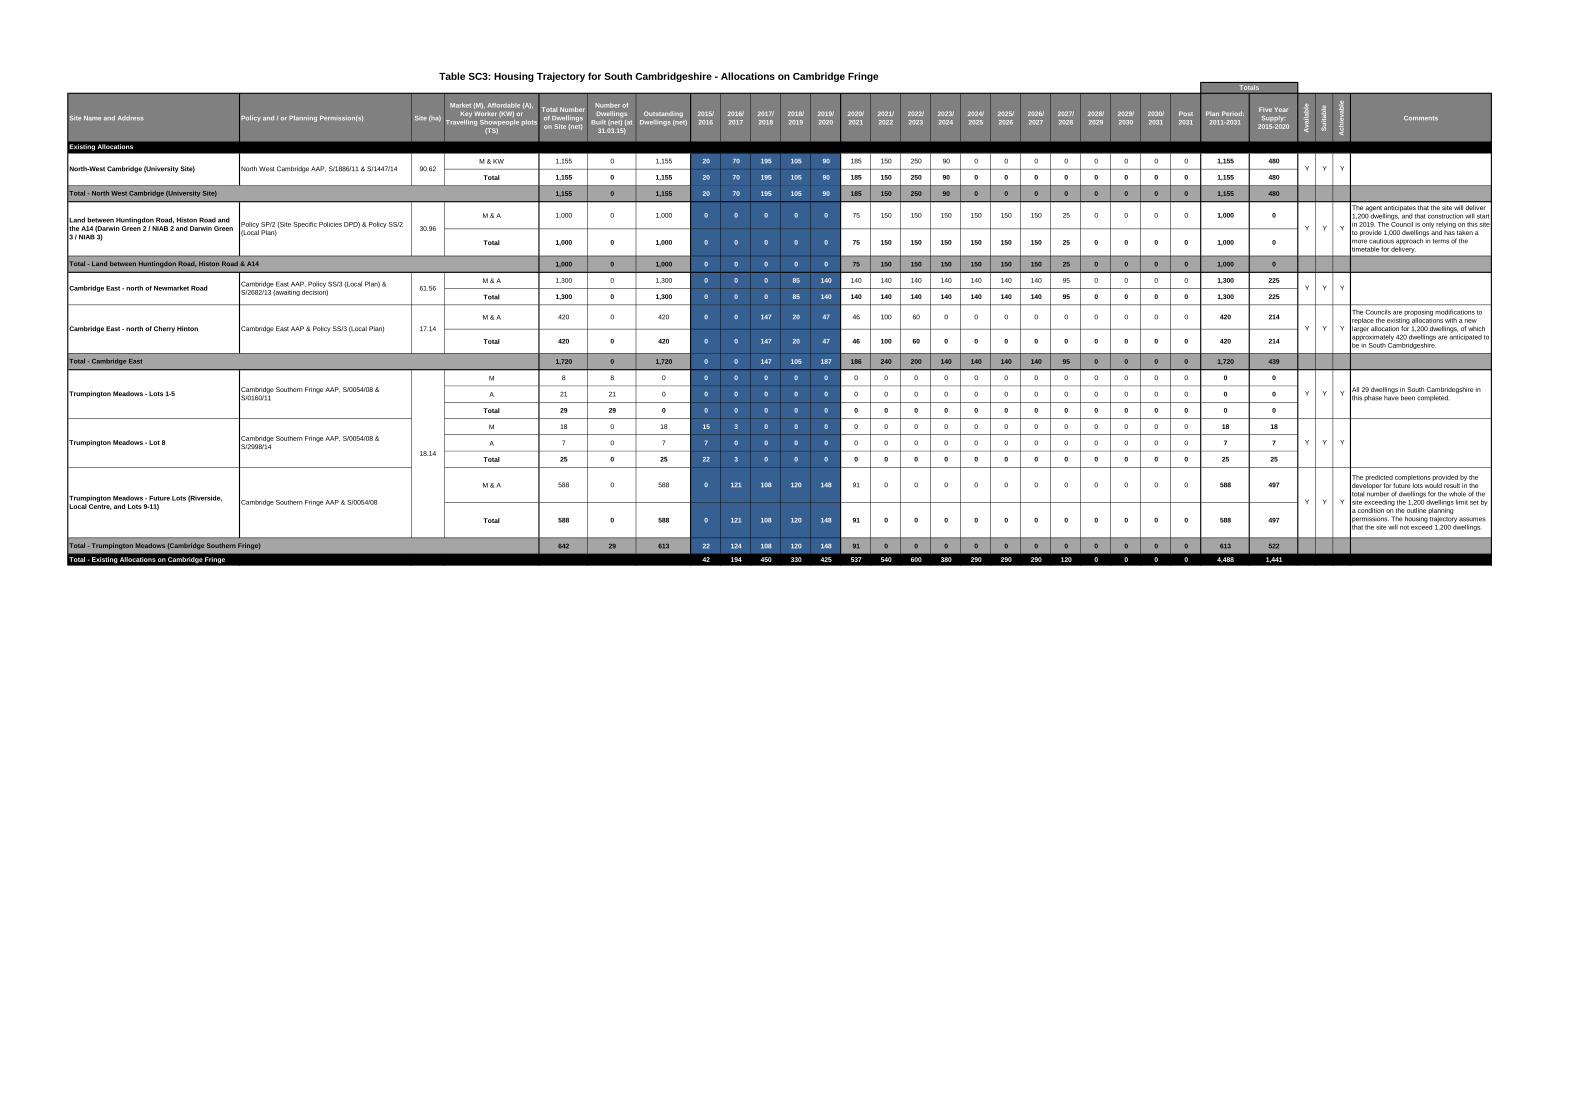
Site Name and Address Policy and / or Planning Permission(s) Site (ha)
Market (M), Affordable (A),
Key Worker (KW) or
Travelling Showpeople plots
(TS)
Total Number
of Dwellings
on Site (net)
Number of
Dwellings
Built (net) (at
31.03.15)
Outstanding
Dwellings (net)
2015/
2016
2016/
2017
2017/
2018
2018/
2019
2019/
2020
2020/
2021
2021/
2022
2022/
2023
2023/
2024
2024/
2025
2025/
2026
2026/
2027
2027/
2028
2028/
2029
2029/
2030
2030/
2031
Post
2031
Plan Period:
2011-2031
Five Year
Supply:
2015-2020
Avail
ab
le
Su
itab
le
Ach
ievab
le
Comments
M & KW 1,155 0 1,155 20 70 195 105 90 185 150 250 90 0 0 0 0 0 0 0 0 1,155 480
Total 1,155 0 1,155 20 70 195 105 90 185 150 250 90 0 0 0 0 0 0 0 0 1,155 480
1,155 0 1,155 20 70 195 105 90 185 150 250 90 0 0 0 0 0 0 0 0 1,155 480
M & A 1,000 0 1,000 0 0 0 0 0 75 150 150 150 150 150 150 25 0 0 0 0 1,000 0
Total 1,000 0 1,000 0 0 0 0 0 75 150 150 150 150 150 150 25 0 0 0 0 1,000 0
1,000 0 1,000 0 0 0 0 0 75 150 150 150 150 150 150 25 0 0 0 0 1,000 0
M & A 1,300 0 1,300 0 0 0 85 140 140 140 140 140 140 140 140 95 0 0 0 0 1,300 225
Total 1,300 0 1,300 0 0 0 85 140 140 140 140 140 140 140 140 95 0 0 0 0 1,300 225
M & A 420 0 420 0 0 147 20 47 46 100 60 0 0 0 0 0 0 0 0 0 420 214
Total 420 0 420 0 0 147 20 47 46 100 60 0 0 0 0 0 0 0 0 0 420 214
1,720 0 1,720 0 0 147 105 187 186 240 200 140 140 140 140 95 0 0 0 0 1,720 439
M 8 8 0 0 0 0 0 0 0 0 0 0 0 0 0 0 0 0 0 0 0 0
A 21 21 0 0 0 0 0 0 0 0 0 0 0 0 0 0 0 0 0 0 0 0
Total 29 29 0 0 0 0 0 0 0 0 0 0 0 0 0 0 0 0 0 0 0 0
M 18 0 18 15 3 0 0 0 0 0 0 0 0 0 0 0 0 0 0 0 18 18
A 7 0 7 7 0 0 0 0 0 0 0 0 0 0 0 0 0 0 0 0 7 7
Total 25 0 25 22 3 0 0 0 0 0 0 0 0 0 0 0 0 0 0 0 25 25
M & A 588 0 588 0 121 108 120 148 91 0 0 0 0 0 0 0 0 0 0 0 588 497
Total 588 0 588 0 121 108 120 148 91 0 0 0 0 0 0 0 0 0 0 0 588 497
642 29 613 22 124 108 120 148 91 0 0 0 0 0 0 0 0 0 0 0 613 522
Total - Existing Allocations on Cambridge Fringe 42 194 450 330 425 537 540 600 380 290 290 290 120 0 0 0 0 4,488 1,441
Total - Land between Huntingdon Road, Histon Road & A14
Total - North West Cambridge (University Site)
17.14
Trumpington Meadows - Lots 1-5
Cambridge East - north of Newmarket RoadCambridge East AAP, Policy SS/3 (Local Plan) &
S/2682/13 (awaiting decision)61.56
Land between Huntingdon Road, Histon Road and
the A14 (Darwin Green 2 / NIAB 2 and Darwin Green
3 / NIAB 3)
Cambridge Southern Fringe AAP, S/0054/08 &
S/0160/11
18.14
Cambridge East - north of Cherry Hinton Cambridge East AAP & Policy SS/3 (Local Plan)
Total - Trumpington Meadows (Cambridge Southern Fringe)
Total - Cambridge East
Trumpington Meadows - Lot 8
Cambridge Southern Fringe AAP & S/0054/08
Cambridge Southern Fringe AAP, S/0054/08 &
S/2998/14
Trumpington Meadows - Future Lots (Riverside,
Local Centre, and Lots 9-11)
Existing Allocations
Table SC3: Housing Trajectory for South Cambridgeshire - Allocations on Cambridge FringeTotals
Policy SP/2 (Site Specific Policies DPD) & Policy SS/2
(Local Plan)30.96
90.62North-West Cambridge (University Site) North West Cambridge AAP, S/1886/11 & S/1447/14 Y Y
Y Y Y
The agent anticipates that the site will deliver
1,200 dwellings, and that construction will start
in 2019. The Council is only relying on this site
to provide 1,000 dwellings and has taken a
more cautious approach in terms of the
timetable for delivery.
Y
The Councils are proposing modifications to
replace the existing allocations with a new
larger allocation for 1,200 dwellings, of which
approximately 420 dwellings are anticipated to
be in South Cambridgeshire.
Y
Y
Y
Y Y
Y Y Y
The predicted completions provided by the
developer for future lots would result in the
total number of dwellings for the whole of the
site exceeding the 1,200 dwellings limit set by
a condition on the outline planning
permissions. The housing trajectory assumes
that the site will not exceed 1,200 dwellings.
Y
Y Y YAll 29 dwellings in South Cambridegshire in
this phase have been completed.
Y Y Y
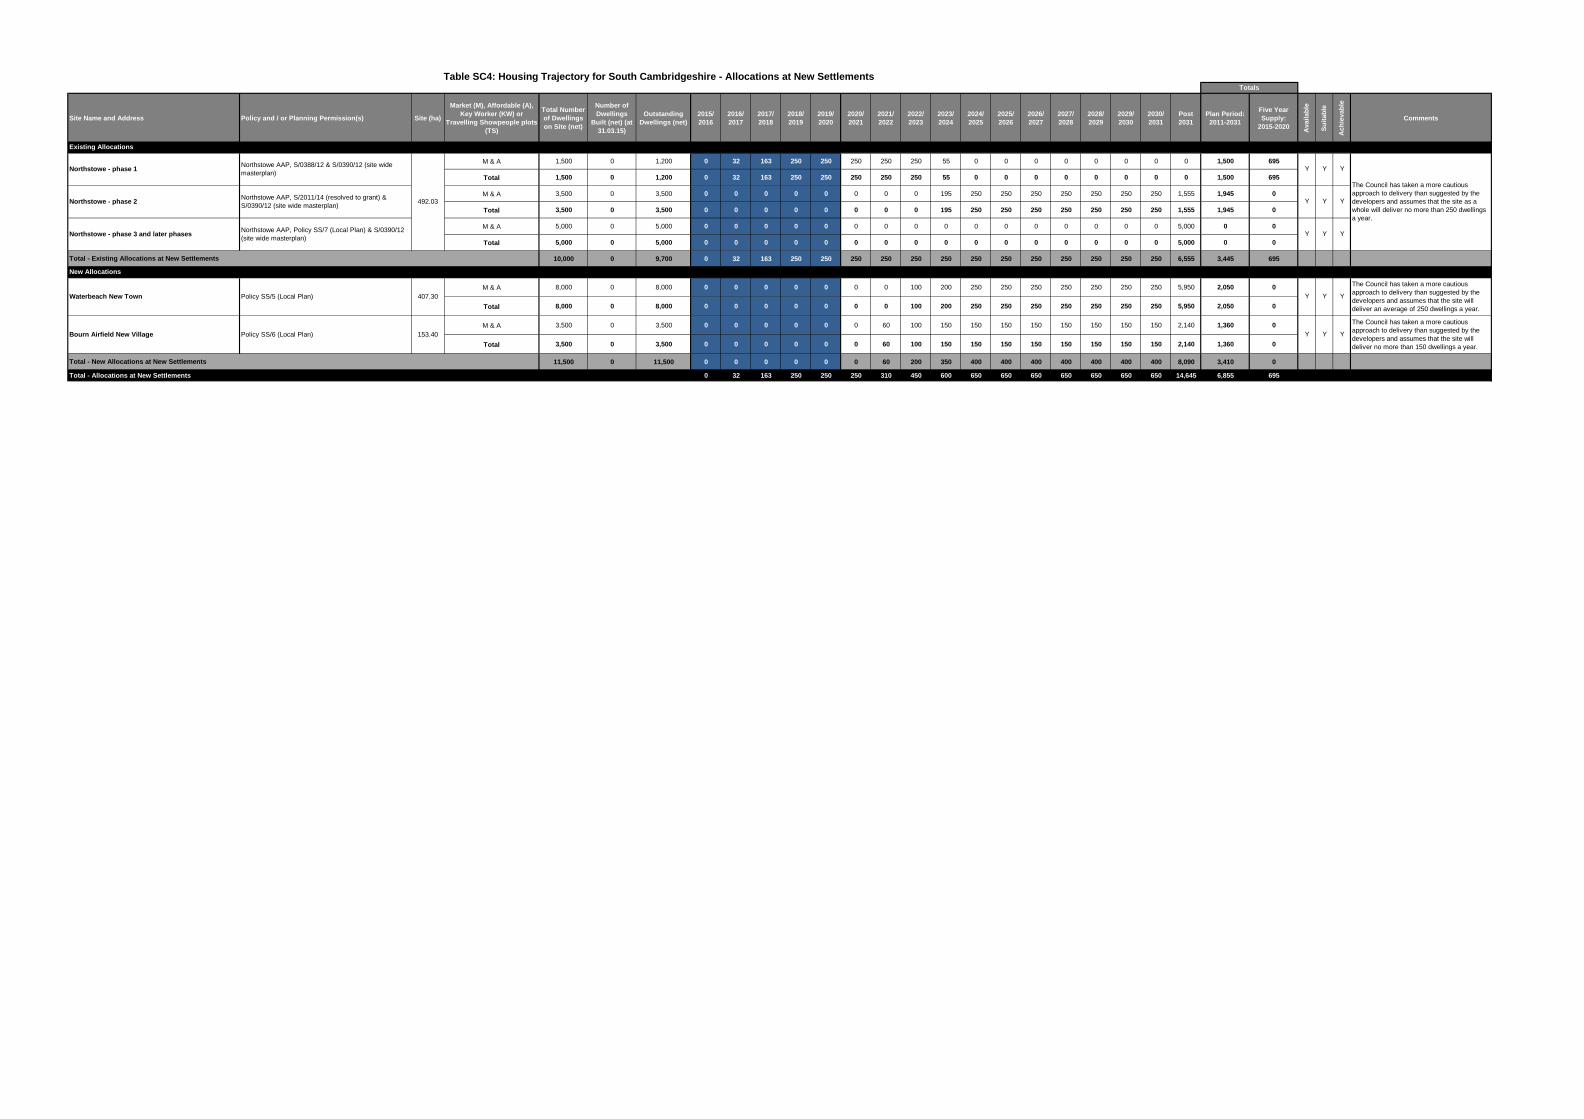
Site Name and Address Policy and / or Planning Permission(s) Site (ha)
Market (M), Affordable (A),
Key Worker (KW) or
Travelling Showpeople plots
(TS)
Total Number
of Dwellings
on Site (net)
Number of
Dwellings
Built (net) (at
31.03.15)
Outstanding
Dwellings (net)
2015/
2016
2016/
2017
2017/
2018
2018/
2019
2019/
2020
2020/
2021
2021/
2022
2022/
2023
2023/
2024
2024/
2025
2025/
2026
2026/
2027
2027/
2028
2028/
2029
2029/
2030
2030/
2031
Post
2031
Plan Period:
2011-2031
Five Year
Supply:
2015-2020
Avail
ab
le
Su
itab
le
Ach
ievab
le
Comments
M & A 1,500 0 1,200 0 32 163 250 250 250 250 250 55 0 0 0 0 0 0 0 0 1,500 695
Total 1,500 0 1,200 0 32 163 250 250 250 250 250 55 0 0 0 0 0 0 0 0 1,500 695
M & A 3,500 0 3,500 0 0 0 0 0 0 0 0 195 250 250 250 250 250 250 250 1,555 1,945 0
Total 3,500 0 3,500 0 0 0 0 0 0 0 0 195 250 250 250 250 250 250 250 1,555 1,945 0
M & A 5,000 0 5,000 0 0 0 0 0 0 0 0 0 0 0 0 0 0 0 0 5,000 0 0
Total 5,000 0 5,000 0 0 0 0 0 0 0 0 0 0 0 0 0 0 0 0 5,000 0 0
10,000 0 9,700 0 32 163 250 250 250 250 250 250 250 250 250 250 250 250 250 6,555 3,445 695
M & A 8,000 0 8,000 0 0 0 0 0 0 0 100 200 250 250 250 250 250 250 250 5,950 2,050 0
Total 8,000 0 8,000 0 0 0 0 0 0 0 100 200 250 250 250 250 250 250 250 5,950 2,050 0
M & A 3,500 0 3,500 0 0 0 0 0 0 60 100 150 150 150 150 150 150 150 150 2,140 1,360 0
Total 3,500 0 3,500 0 0 0 0 0 0 60 100 150 150 150 150 150 150 150 150 2,140 1,360 0
11,500 0 11,500 0 0 0 0 0 0 60 200 350 400 400 400 400 400 400 400 8,090 3,410 0
Total - Allocations at New Settlements 0 32 163 250 250 250 310 450 600 650 650 650 650 650 650 650 14,645 6,855 695
Total - New Allocations at New Settlements
Waterbeach New Town Policy SS/5 (Local Plan) 407.30
153.40Policy SS/6 (Local Plan)Bourn Airfield New Village
Table SC4: Housing Trajectory for South Cambridgeshire - Allocations at New SettlementsTotals
Existing Allocations
New Allocations
Northstowe - phase 1
Northstowe - phase 2
Northstowe - phase 3 and later phases
Northstowe AAP, S/0388/12 & S/0390/12 (site wide
masterplan)
Northstowe AAP, S/2011/14 (resolved to grant) &
S/0390/12 (site wide masterplan)
Northstowe AAP, Policy SS/7 (Local Plan) & S/0390/12
(site wide masterplan)
492.03
Total - Existing Allocations at New Settlements
Y
Y
Y
Y
The Council has taken a more cautious
approach to delivery than suggested by the
developers and assumes that the site as a
whole will deliver no more than 250 dwellings
a year.
The Council has taken a more cautious
approach to delivery than suggested by the
developers and assumes that the site will
deliver an average of 250 dwellings a year.
The Council has taken a more cautious
approach to delivery than suggested by the
developers and assumes that the site will
deliver no more than 150 dwellings a year.
Y Y Y
Y Y Y
Y
Y Y
Y Y
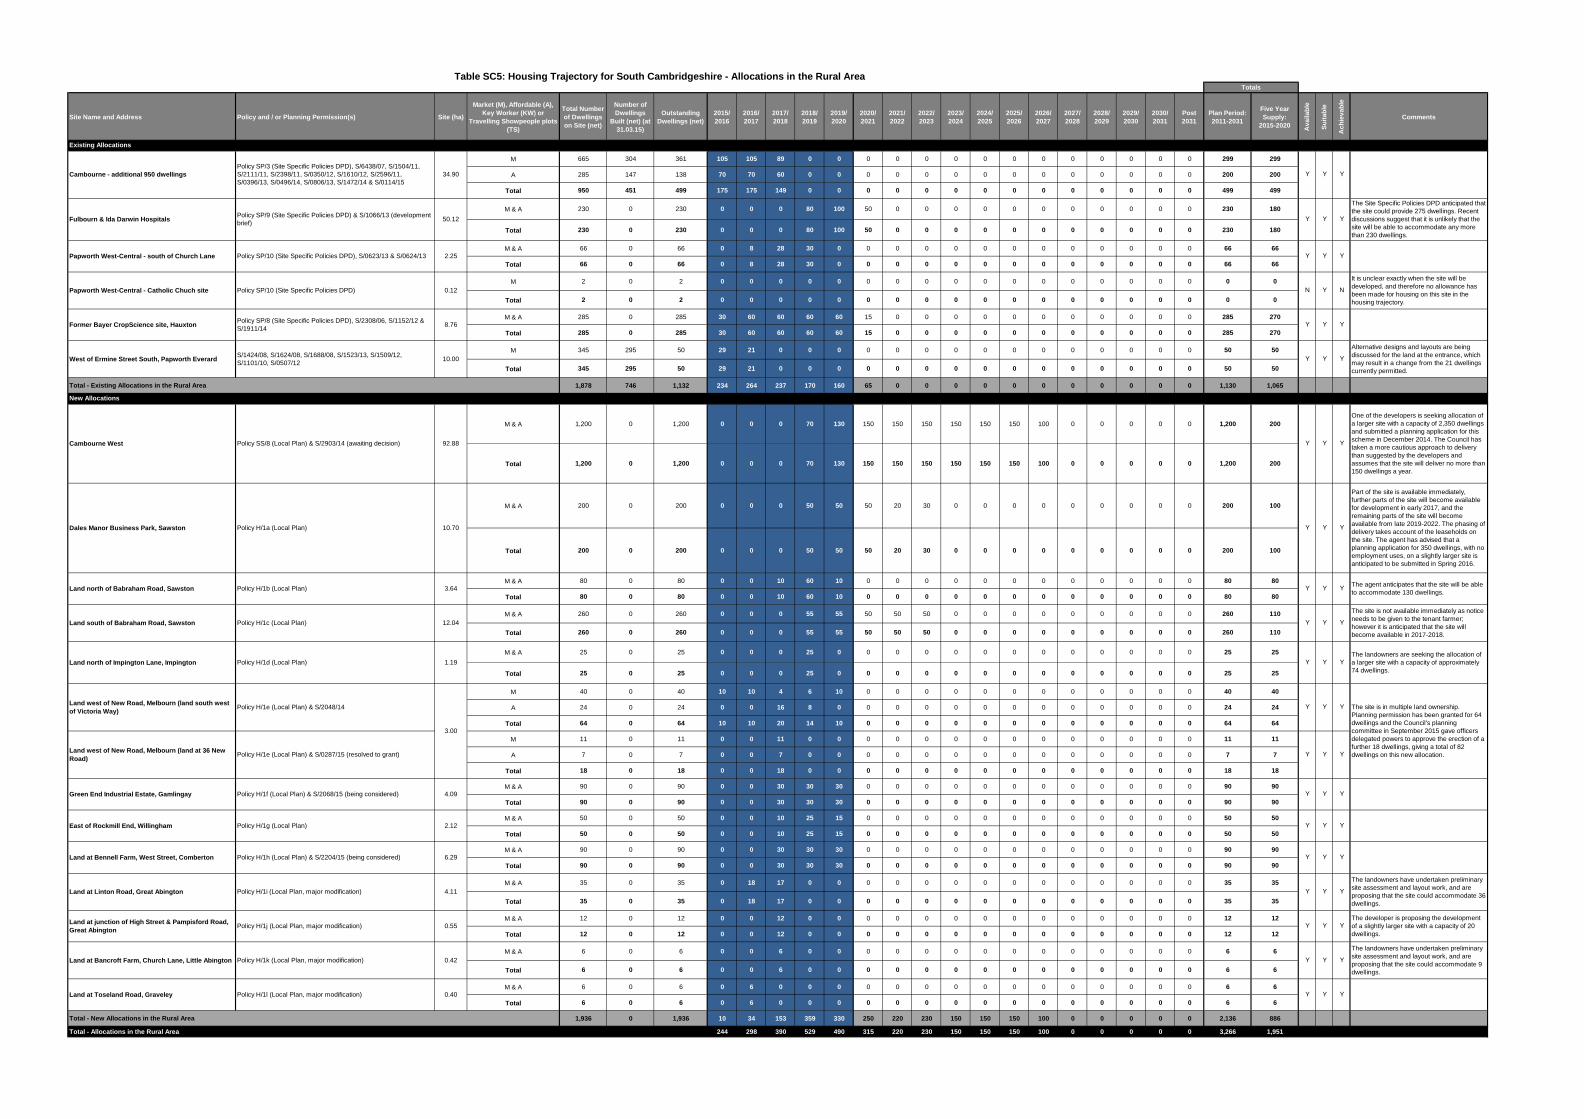
Site Name and Address Policy and / or Planning Permission(s) Site (ha)
Market (M), Affordable (A),
Key Worker (KW) or
Travelling Showpeople plots
(TS)
Total Number
of Dwellings
on Site (net)
Number of
Dwellings
Built (net) (at
31.03.15)
Outstanding
Dwellings (net)
2015/
2016
2016/
2017
2017/
2018
2018/
2019
2019/
2020
2020/
2021
2021/
2022
2022/
2023
2023/
2024
2024/
2025
2025/
2026
2026/
2027
2027/
2028
2028/
2029
2029/
2030
2030/
2031
Post
2031
Plan Period:
2011-2031
Five Year
Supply:
2015-2020
Av
aila
ble
Su
ita
ble
Ac
hie
va
ble
Comments
M 665 304 361 105 105 89 0 0 0 0 0 0 0 0 0 0 0 0 0 0 299 299
A 285 147 138 70 70 60 0 0 0 0 0 0 0 0 0 0 0 0 0 0 200 200
Total 950 451 499 175 175 149 0 0 0 0 0 0 0 0 0 0 0 0 0 0 499 499
M & A 230 0 230 0 0 0 80 100 50 0 0 0 0 0 0 0 0 0 0 0 230 180
Total 230 0 230 0 0 0 80 100 50 0 0 0 0 0 0 0 0 0 0 0 230 180
M & A 66 0 66 0 8 28 30 0 0 0 0 0 0 0 0 0 0 0 0 0 66 66
Total 66 0 66 0 8 28 30 0 0 0 0 0 0 0 0 0 0 0 0 0 66 66
M 2 0 2 0 0 0 0 0 0 0 0 0 0 0 0 0 0 0 0 0 0 0
Total 2 0 2 0 0 0 0 0 0 0 0 0 0 0 0 0 0 0 0 0 0 0
M & A 285 0 285 30 60 60 60 60 15 0 0 0 0 0 0 0 0 0 0 0 285 270
Total 285 0 285 30 60 60 60 60 15 0 0 0 0 0 0 0 0 0 0 0 285 270
M 345 295 50 29 21 0 0 0 0 0 0 0 0 0 0 0 0 0 0 0 50 50
Total 345 295 50 29 21 0 0 0 0 0 0 0 0 0 0 0 0 0 0 0 50 50
1,878 746 1,132 234 264 237 170 160 65 0 0 0 0 0 0 0 0 0 0 0 1,130 1,065
M & A 1,200 0 1,200 0 0 0 70 130 150 150 150 150 150 150 100 0 0 0 0 0 1,200 200
Total 1,200 0 1,200 0 0 0 70 130 150 150 150 150 150 150 100 0 0 0 0 0 1,200 200
M & A 200 0 200 0 0 0 50 50 50 20 30 0 0 0 0 0 0 0 0 0 200 100
Total 200 0 200 0 0 0 50 50 50 20 30 0 0 0 0 0 0 0 0 0 200 100
M & A 80 0 80 0 0 10 60 10 0 0 0 0 0 0 0 0 0 0 0 0 80 80
Total 80 0 80 0 0 10 60 10 0 0 0 0 0 0 0 0 0 0 0 0 80 80
M & A 260 0 260 0 0 0 55 55 50 50 50 0 0 0 0 0 0 0 0 0 260 110
Total 260 0 260 0 0 0 55 55 50 50 50 0 0 0 0 0 0 0 0 0 260 110
M & A 25 0 25 0 0 0 25 0 0 0 0 0 0 0 0 0 0 0 0 0 25 25
Total 25 0 25 0 0 0 25 0 0 0 0 0 0 0 0 0 0 0 0 0 25 25
M 40 0 40 10 10 4 6 10 0 0 0 0 0 0 0 0 0 0 0 0 40 40
A 24 0 24 0 0 16 8 0 0 0 0 0 0 0 0 0 0 0 0 0 24 24
Total 64 0 64 10 10 20 14 10 0 0 0 0 0 0 0 0 0 0 0 0 64 64
M 11 0 11 0 0 11 0 0 0 0 0 0 0 0 0 0 0 0 0 0 11 11
A 7 0 7 0 0 7 0 0 0 0 0 0 0 0 0 0 0 0 0 0 7 7
Total 18 0 18 0 0 18 0 0 0 0 0 0 0 0 0 0 0 0 0 0 18 18
M & A 90 0 90 0 0 30 30 30 0 0 0 0 0 0 0 0 0 0 0 0 90 90
Total 90 0 90 0 0 30 30 30 0 0 0 0 0 0 0 0 0 0 0 0 90 90
M & A 50 0 50 0 0 10 25 15 0 0 0 0 0 0 0 0 0 0 0 0 50 50
Total 50 0 50 0 0 10 25 15 0 0 0 0 0 0 0 0 0 0 0 0 50 50
M & A 90 0 90 0 0 30 30 30 0 0 0 0 0 0 0 0 0 0 0 0 90 90
Total 90 0 90 0 0 30 30 30 0 0 0 0 0 0 0 0 0 0 0 0 90 90
M & A 35 0 35 0 18 17 0 0 0 0 0 0 0 0 0 0 0 0 0 0 35 35
Total 35 0 35 0 18 17 0 0 0 0 0 0 0 0 0 0 0 0 0 0 35 35
M & A 12 0 12 0 0 12 0 0 0 0 0 0 0 0 0 0 0 0 0 0 12 12
Total 12 0 12 0 0 12 0 0 0 0 0 0 0 0 0 0 0 0 0 0 12 12
M & A 6 0 6 0 0 6 0 0 0 0 0 0 0 0 0 0 0 0 0 0 6 6
Total 6 0 6 0 0 6 0 0 0 0 0 0 0 0 0 0 0 0 0 0 6 6
M & A 6 0 6 0 6 0 0 0 0 0 0 0 0 0 0 0 0 0 0 0 6 6
Total 6 0 6 0 6 0 0 0 0 0 0 0 0 0 0 0 0 0 0 0 6 6
1,936 0 1,936 10 34 153 359 330 250 220 230 150 150 150 100 0 0 0 0 0 2,136 886
Total - Allocations in the Rural Area 244 298 390 529 490 315 220 230 150 150 150 100 0 0 0 0 0 3,266 1,951
Y Y Y
Y Y Y
Y Y YThe developer is proposing the development
of a slightly larger site with a capacity of 20
dwellings.
Y Y Y
The landowners have undertaken preliminary
site assessment and layout work, and are
proposing that the site could accommodate 36
dwellings.
Y Y Y
The landowners have undertaken preliminary
site assessment and layout work, and are
proposing that the site could accommodate 9
dwellings.
Y Y Y
Y Y Y
Y Y Y
Y Y Y
The site is in multiple land ownership.
Planning permission has been granted for 64
dwellings and the Council's planning
committee in September 2015 gave officers
delegated powers to approve the erection of a
further 18 dwellings, giving a total of 82
dwellings on this new allocation.
Y Y
The site is not available immediately as notice
needs to be given to the tenant farmer;
however it is anticipated that the site will
become available in 2017-2018.
Y Y YThe landowners are seeking the allocation of
a larger site with a capacity of approximately
74 dwellings.
Y Y Y
Part of the site is available immediately,
further parts of the site will become available
for development in early 2017, and the
remaining parts of the site will become
available from late 2019-2022. The phasing of
delivery takes account of the leaseholds on
the site. The agent has advised that a
planning application for 350 dwellings, with no
employment uses, on a slightly larger site is
anticipated to be submitted in Spring 2016.
Y Y YThe agent anticipates that the site will be able
to accommodate 130 dwellings.
Y Y
One of the developers is seeking allocation of
a larger site with a capacity of 2,350 dwellings
and submitted a planning application for this
scheme in December 2014. The Council has
taken a more cautious approach to delivery
than suggested by the developers and
assumes that the site will deliver no more than
150 dwellings a year.
Y Y Y
Y Y Y
Alternative designs and layouts are being
discussed for the land at the entrance, which
may result in a change from the 21 dwellings
currently permitted.
Y Y
N Y N
It is unclear exactly when the site will be
developed, and therefore no allowance has
been made for housing on this site in the
housing trajectory.
Y Y Y
Y Y Y
The Site Specific Policies DPD anticipated that
the site could provide 275 dwellings. Recent
discussions suggest that it is unlikely that the
site will be able to accommodate any more
than 230 dwellings.
Policy H/1c (Local Plan)Land south of Babraham Road, Sawston
Dales Manor Business Park, Sawston Policy H/1a (Local Plan) 10.70
Land north of Babraham Road, Sawston Policy H/1b (Local Plan) 3.64
Y
Y
Y
West of Ermine Street South, Papworth EverardS/1424/08, S/1624/08, S/1688/08, S/1523/13, S/1509/12,
S/1101/10, S/0507/1210.00
Papworth West-Central - Catholic Chuch site
Policy SS/8 (Local Plan) & S/2903/14 (awaiting decision)Cambourne West
12.04
0.40Land at Toseland Road, Graveley
Land at Bancroft Farm, Church Lane, Little Abington
Land at junction of High Street & Pampisford Road,
Great Abington
Land at Linton Road, Great Abington Policy H/1i (Local Plan, major modification)
Policy H/1j (Local Plan, major modification)
Policy H/1k (Local Plan, major modification)
Policy H/1l (Local Plan, major modification)
4.11
0.55
0.42
4.09
2.12
6.29
Land west of New Road, Melbourn (land south west
of Victoria Way)Policy H/1e (Local Plan) & S/2048/14
3.00
Land at Bennell Farm, West Street, Comberton
East of Rockmill End, Willingham
Green End Industrial Estate, Gamlingay
Land west of New Road, Melbourn (land at 36 New
Road)Policy H/1e (Local Plan) & S/0287/15 (resolved to grant)
Policy H/1f (Local Plan) & S/2068/15 (being considered)
Policy H/1g (Local Plan)
Policy H/1h (Local Plan) & S/2204/15 (being considered)
Table SC5: Housing Trajectory for South Cambridgeshire - Allocations in the Rural AreaTotals
Existing Allocations
Total - Existing Allocations in the Rural Area
Total - New Allocations in the Rural Area
Cambourne - additional 950 dwellings
Policy SP/3 (Site Specific Policies DPD), S/6438/07, S/1504/11,
S/2111/11, S/2398/11, S/0350/12, S/1610/12, S/2596/11,
S/0396/13, S/0496/14, S/0806/13, S/1472/14 & S/0114/15
34.90
Fulbourn & Ida Darwin HospitalsPolicy SP/9 (Site Specific Policies DPD) & S/1066/13 (development
brief)50.12
Former Bayer CropScience site, Hauxton
New Allocations
Land north of Impington Lane, Impington Policy H/1d (Local Plan) 1.19
Papworth West-Central - south of Church Lane Policy SP/10 (Site Specific Policies DPD), S/0623/13 & S/0624/13
Policy SP/10 (Site Specific Policies DPD)
2.25
Policy SP/8 (Site Specific Policies DPD), S/2308/06, S/1152/12 &
S/1911/148.76
92.88
0.12
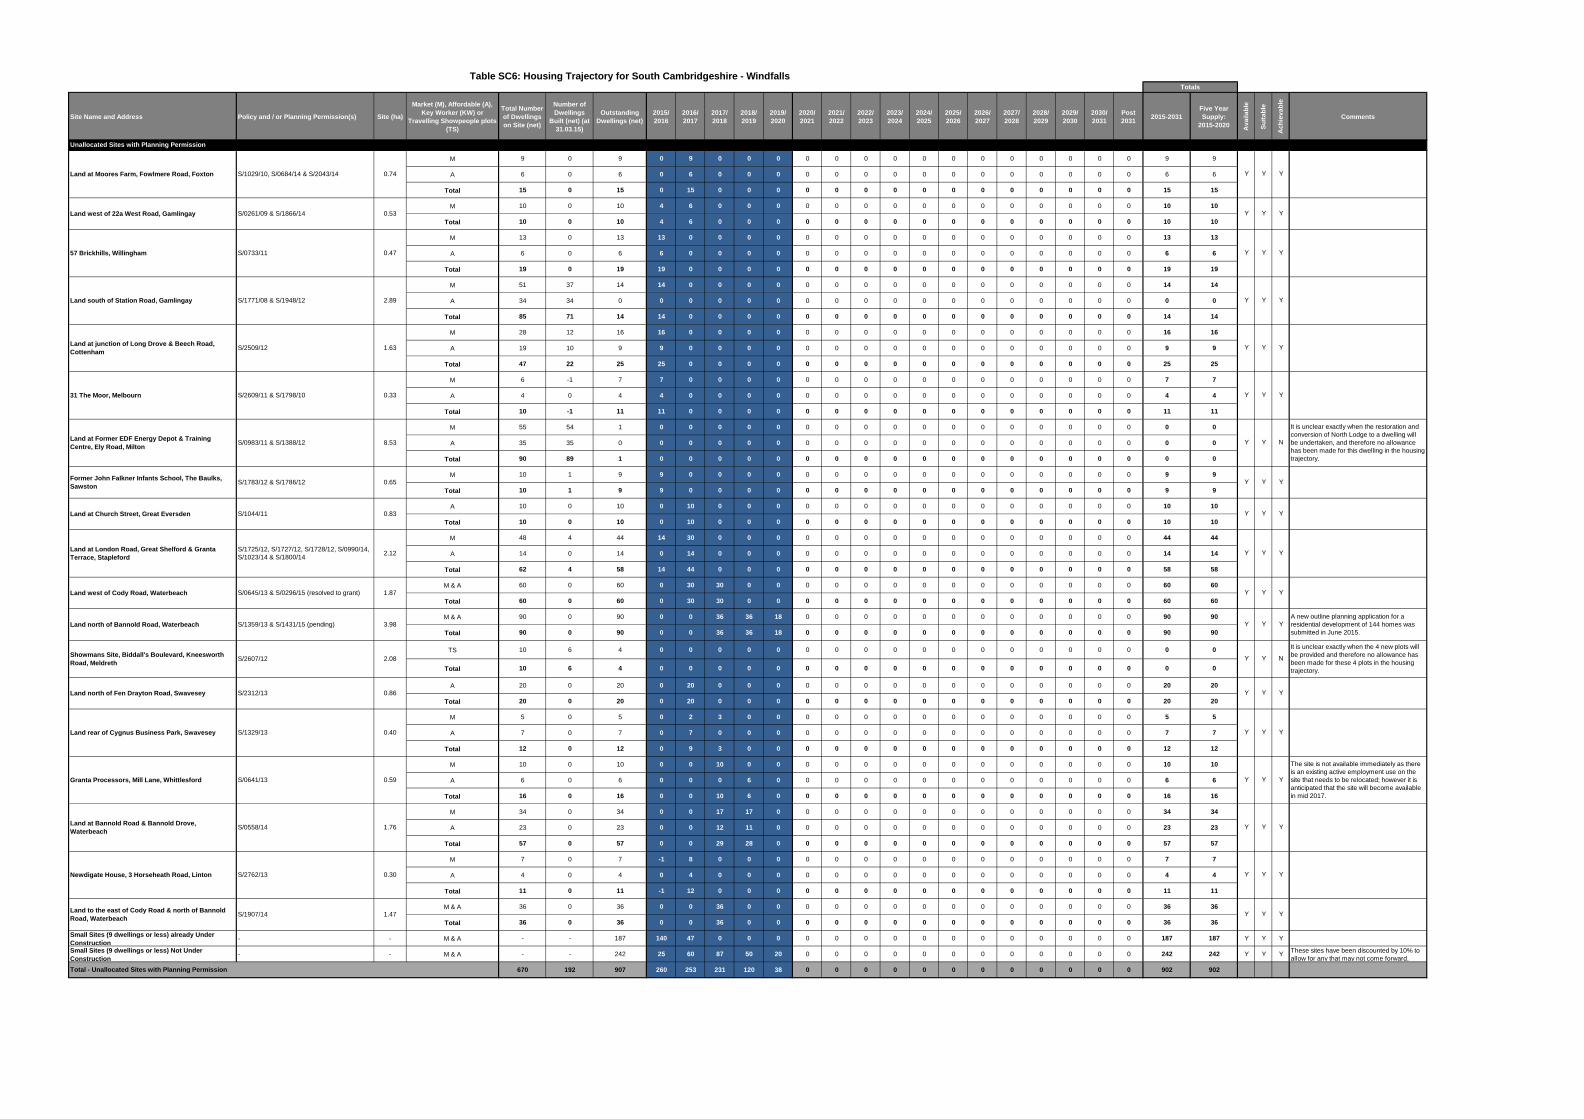
Site Name and Address Policy and / or Planning Permission(s) Site (ha)
Market (M), Affordable (A),
Key Worker (KW) or
Travelling Showpeople plots
(TS)
Total Number
of Dwellings
on Site (net)
Number of
Dwellings
Built (net) (at
31.03.15)
Outstanding
Dwellings (net)
2015/
2016
2016/
2017
2017/
2018
2018/
2019
2019/
2020
2020/
2021
2021/
2022
2022/
2023
2023/
2024
2024/
2025
2025/
2026
2026/
2027
2027/
2028
2028/
2029
2029/
2030
2030/
2031
Post
20312015-2031
Five Year
Supply:
2015-2020
Av
aila
ble
Su
ita
ble
Ac
hie
va
ble
Comments
M 9 0 9 0 9 0 0 0 0 0 0 0 0 0 0 0 0 0 0 0 9 9
A 6 0 6 0 6 0 0 0 0 0 0 0 0 0 0 0 0 0 0 0 6 6
Total 15 0 15 0 15 0 0 0 0 0 0 0 0 0 0 0 0 0 0 0 15 15
M 10 0 10 4 6 0 0 0 0 0 0 0 0 0 0 0 0 0 0 0 10 10
Total 10 0 10 4 6 0 0 0 0 0 0 0 0 0 0 0 0 0 0 0 10 10
M 13 0 13 13 0 0 0 0 0 0 0 0 0 0 0 0 0 0 0 0 13 13
A 6 0 6 6 0 0 0 0 0 0 0 0 0 0 0 0 0 0 0 0 6 6
Total 19 0 19 19 0 0 0 0 0 0 0 0 0 0 0 0 0 0 0 0 19 19
M 51 37 14 14 0 0 0 0 0 0 0 0 0 0 0 0 0 0 0 0 14 14
A 34 34 0 0 0 0 0 0 0 0 0 0 0 0 0 0 0 0 0 0 0 0
Total 85 71 14 14 0 0 0 0 0 0 0 0 0 0 0 0 0 0 0 0 14 14
M 28 12 16 16 0 0 0 0 0 0 0 0 0 0 0 0 0 0 0 0 16 16
A 19 10 9 9 0 0 0 0 0 0 0 0 0 0 0 0 0 0 0 0 9 9
Total 47 22 25 25 0 0 0 0 0 0 0 0 0 0 0 0 0 0 0 0 25 25
M 6 -1 7 7 0 0 0 0 0 0 0 0 0 0 0 0 0 0 0 0 7 7
A 4 0 4 4 0 0 0 0 0 0 0 0 0 0 0 0 0 0 0 0 4 4
Total 10 -1 11 11 0 0 0 0 0 0 0 0 0 0 0 0 0 0 0 0 11 11
M 55 54 1 0 0 0 0 0 0 0 0 0 0 0 0 0 0 0 0 0 0 0
A 35 35 0 0 0 0 0 0 0 0 0 0 0 0 0 0 0 0 0 0 0 0
Total 90 89 1 0 0 0 0 0 0 0 0 0 0 0 0 0 0 0 0 0 0 0
M 10 1 9 9 0 0 0 0 0 0 0 0 0 0 0 0 0 0 0 0 9 9
Total 10 1 9 9 0 0 0 0 0 0 0 0 0 0 0 0 0 0 0 0 9 9
A 10 0 10 0 10 0 0 0 0 0 0 0 0 0 0 0 0 0 0 0 10 10
Total 10 0 10 0 10 0 0 0 0 0 0 0 0 0 0 0 0 0 0 0 10 10
M 48 4 44 14 30 0 0 0 0 0 0 0 0 0 0 0 0 0 0 0 44 44
A 14 0 14 0 14 0 0 0 0 0 0 0 0 0 0 0 0 0 0 0 14 14
Total 62 4 58 14 44 0 0 0 0 0 0 0 0 0 0 0 0 0 0 0 58 58
M & A 60 0 60 0 30 30 0 0 0 0 0 0 0 0 0 0 0 0 0 0 60 60
Total 60 0 60 0 30 30 0 0 0 0 0 0 0 0 0 0 0 0 0 0 60 60
M & A 90 0 90 0 0 36 36 18 0 0 0 0 0 0 0 0 0 0 0 0 90 90
Total 90 0 90 0 0 36 36 18 0 0 0 0 0 0 0 0 0 0 0 0 90 90
TS 10 6 4 0 0 0 0 0 0 0 0 0 0 0 0 0 0 0 0 0 0 0
Total 10 6 4 0 0 0 0 0 0 0 0 0 0 0 0 0 0 0 0 0 0 0
A 20 0 20 0 20 0 0 0 0 0 0 0 0 0 0 0 0 0 0 0 20 20
Total 20 0 20 0 20 0 0 0 0 0 0 0 0 0 0 0 0 0 0 0 20 20
M 5 0 5 0 2 3 0 0 0 0 0 0 0 0 0 0 0 0 0 0 5 5
A 7 0 7 0 7 0 0 0 0 0 0 0 0 0 0 0 0 0 0 0 7 7
Total 12 0 12 0 9 3 0 0 0 0 0 0 0 0 0 0 0 0 0 0 12 12
M 10 0 10 0 0 10 0 0 0 0 0 0 0 0 0 0 0 0 0 0 10 10
A 6 0 6 0 0 0 6 0 0 0 0 0 0 0 0 0 0 0 0 0 6 6
Total 16 0 16 0 0 10 6 0 0 0 0 0 0 0 0 0 0 0 0 0 16 16
M 34 0 34 0 0 17 17 0 0 0 0 0 0 0 0 0 0 0 0 0 34 34
A 23 0 23 0 0 12 11 0 0 0 0 0 0 0 0 0 0 0 0 0 23 23
Total 57 0 57 0 0 29 28 0 0 0 0 0 0 0 0 0 0 0 0 0 57 57
M 7 0 7 -1 8 0 0 0 0 0 0 0 0 0 0 0 0 0 0 0 7 7
A 4 0 4 0 4 0 0 0 0 0 0 0 0 0 0 0 0 0 0 0 4 4
Total 11 0 11 -1 12 0 0 0 0 0 0 0 0 0 0 0 0 0 0 0 11 11
M & A 36 0 36 0 0 36 0 0 0 0 0 0 0 0 0 0 0 0 0 0 36 36
Total 36 0 36 0 0 36 0 0 0 0 0 0 0 0 0 0 0 0 0 0 36 36
Small Sites (9 dwellings or less) already Under
Construction- - M & A - - 187 140 47 0 0 0 0 0 0 0 0 0 0 0 0 0 0 0 187 187 Y Y Y
Small Sites (9 dwellings or less) Not Under
Construction- - M & A - - 242 25 60 87 50 20 0 0 0 0 0 0 0 0 0 0 0 0 242 242 Y Y Y
These sites have been discounted by 10% to
allow for any that may not come forward.
670 192 907 260 253 231 120 38 0 0 0 0 0 0 0 0 0 0 0 0 902 902
Y Y Y
Y Y Y
Y Y Y
Y Y Y
Y Y Y
The site is not available immediately as there
is an existing active employment use on the
site that needs to be relocated; however it is
anticipated that the site will become available
in mid 2017.
Y Y Y
Total - Unallocated Sites with Planning Permission
Land at Bannold Road & Bannold Drove,
Waterbeach
Newdigate House, 3 Horseheath Road, Linton S/2762/13
Land to the east of Cody Road & north of Bannold
Road, WaterbeachS/1907/14 1.47
Former John Falkner Infants School, The Baulks,
SawstonS/1783/12 & S/1786/12
2.89
Land at junction of Long Drove & Beech Road,
CottenhamS/2509/12 1.63
31 The Moor, Melbourn S/2609/11 & S/1798/10 0.33
Land south of Station Road, Gamlingay S/1771/08 & S/1948/12
Land at Former EDF Energy Depot & Training
Centre, Ely Road, Milton
0.83
2.08
Land north of Fen Drayton Road, Swavesey
S/1044/11
0.30
S/0558/14 1.76
S/0645/13 & S/0296/15 (resolved to grant) 1.87
Land north of Bannold Road, Waterbeach S/1359/13 & S/1431/15 (pending) 3.98
S/2312/13 0.86
S/0641/13 0.59
Land rear of Cygnus Business Park, Swavesey 0.40
Granta Processors, Mill Lane, Whittlesford
Table SC6: Housing Trajectory for South Cambridgeshire - WindfallsTotals
Unallocated Sites with Planning Permission
S/0983/11 & S/1388/12 8.53
S/0261/09 & S/1866/14 0.53Land west of 22a West Road, Gamlingay
S/0733/11
Y Y Y
Y Y Y
Y Y Y
Y Y
Land at Moores Farm, Fowlmere Road, Foxton S/1029/10, S/0684/14 & S/2043/14 0.74
57 Brickhills, Willingham 0.47
Land at Church Street, Great Eversden
Showmans Site, Biddall's Boulevard, Kneesworth
Road, Meldreth
Land west of Cody Road, Waterbeach
S/2607/12
S/1329/13
Land at London Road, Great Shelford & Granta
Terrace, Stapleford
S/1725/12, S/1727/12, S/1728/12, S/0990/14,
S/1023/14 & S/1800/142.12
0.65
Y Y N
It is unclear exactly when the restoration and
conversion of North Lodge to a dwelling will
be undertaken, and therefore no allowance
has been made for this dwelling in the housing
trajectory.
Y
Y Y Y
Y Y Y
Y Y Y
Y Y Y
Y Y N
It is unclear exactly when the 4 new plots will
be provided and therefore no allowance has
been made for these 4 plots in the housing
trajectory.
Y Y Y
Y Y Y
Y Y YA new outline planning application for a
residential development of 144 homes was
submitted in June 2015.
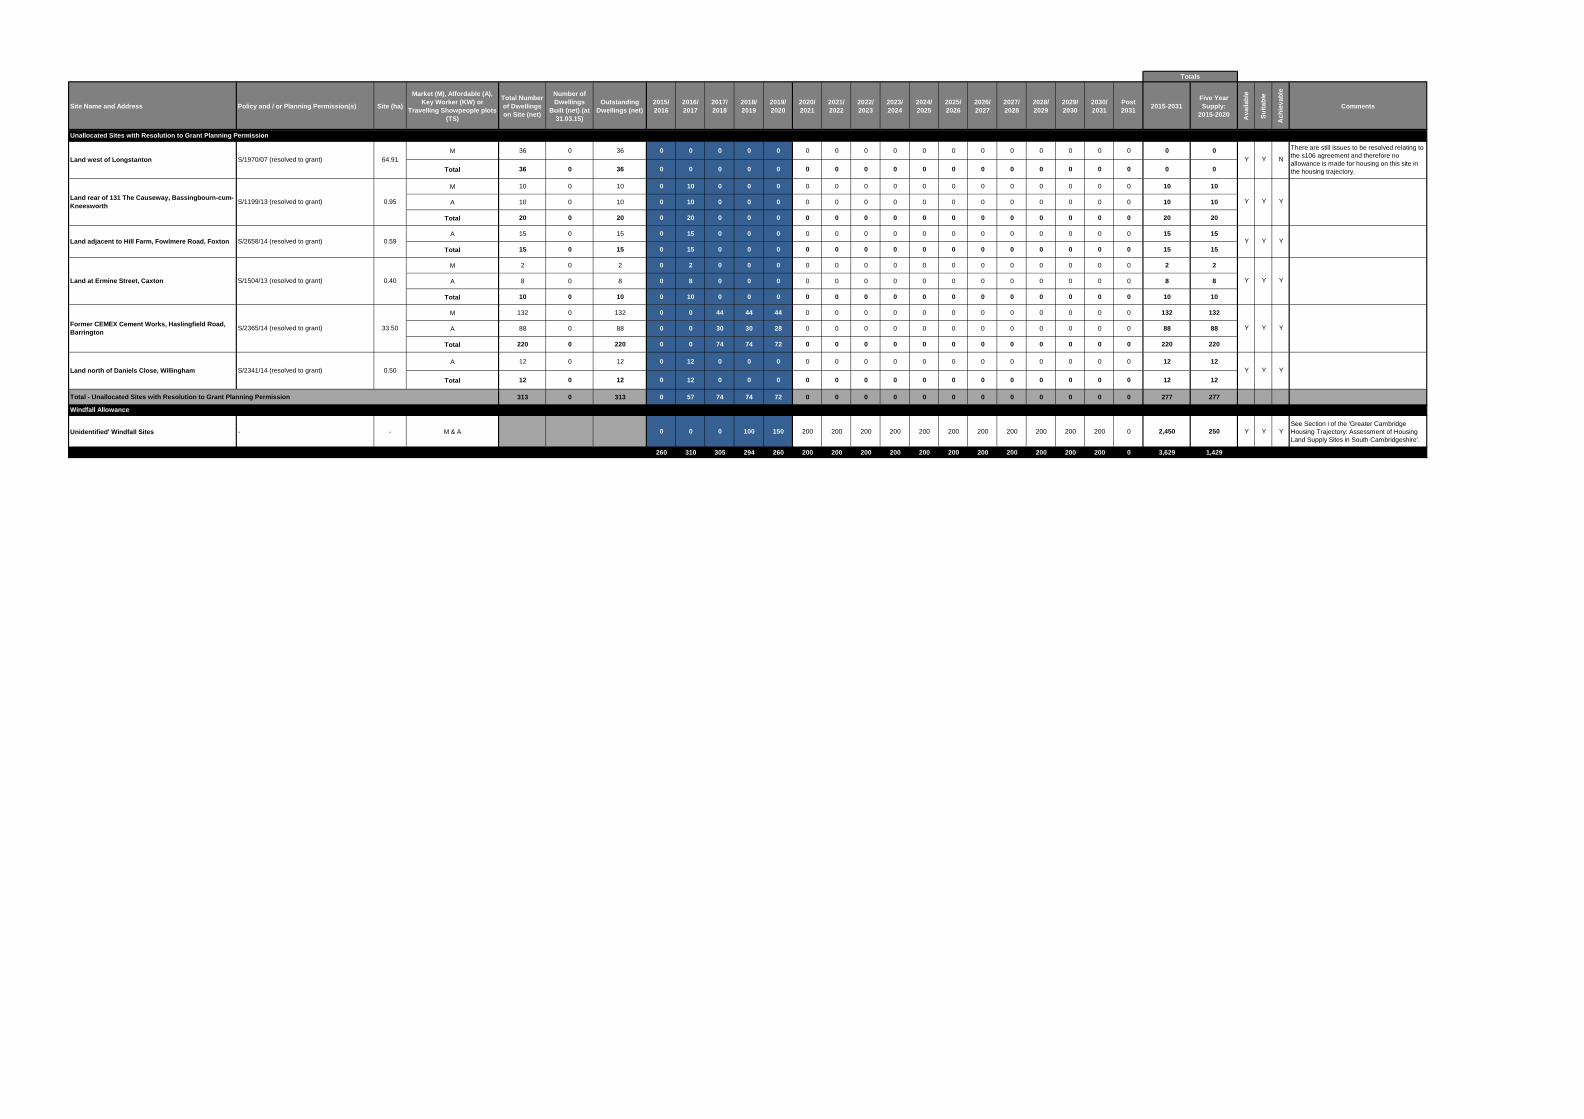
Site Name and Address Policy and / or Planning Permission(s) Site (ha)
Market (M), Affordable (A),
Key Worker (KW) or
Travelling Showpeople plots
(TS)
Total Number
of Dwellings
on Site (net)
Number of
Dwellings
Built (net) (at
31.03.15)
Outstanding
Dwellings (net)
2015/
2016
2016/
2017
2017/
2018
2018/
2019
2019/
2020
2020/
2021
2021/
2022
2022/
2023
2023/
2024
2024/
2025
2025/
2026
2026/
2027
2027/
2028
2028/
2029
2029/
2030
2030/
2031
Post
20312015-2031
Five Year
Supply:
2015-2020
Av
aila
ble
Su
ita
ble
Ac
hie
va
ble
Comments
Totals
Unallocated Sites with Planning Permission
M 36 0 36 0 0 0 0 0 0 0 0 0 0 0 0 0 0 0 0 0 0 0
Total 36 0 36 0 0 0 0 0 0 0 0 0 0 0 0 0 0 0 0 0 0 0
M 10 0 10 0 10 0 0 0 0 0 0 0 0 0 0 0 0 0 0 0 10 10
A 10 0 10 0 10 0 0 0 0 0 0 0 0 0 0 0 0 0 0 0 10 10
Total 20 0 20 0 20 0 0 0 0 0 0 0 0 0 0 0 0 0 0 0 20 20
A 15 0 15 0 15 0 0 0 0 0 0 0 0 0 0 0 0 0 0 0 15 15
Total 15 0 15 0 15 0 0 0 0 0 0 0 0 0 0 0 0 0 0 0 15 15
M 2 0 2 0 2 0 0 0 0 0 0 0 0 0 0 0 0 0 0 0 2 2
A 8 0 8 0 8 0 0 0 0 0 0 0 0 0 0 0 0 0 0 0 8 8
Total 10 0 10 0 10 0 0 0 0 0 0 0 0 0 0 0 0 0 0 0 10 10
M 132 0 132 0 0 44 44 44 0 0 0 0 0 0 0 0 0 0 0 0 132 132
A 88 0 88 0 0 30 30 28 0 0 0 0 0 0 0 0 0 0 0 0 88 88
Total 220 0 220 0 0 74 74 72 0 0 0 0 0 0 0 0 0 0 0 0 220 220
A 12 0 12 0 12 0 0 0 0 0 0 0 0 0 0 0 0 0 0 0 12 12
Total 12 0 12 0 12 0 0 0 0 0 0 0 0 0 0 0 0 0 0 0 12 12
313 0 313 0 57 74 74 72 0 0 0 0 0 0 0 0 0 0 0 0 277 277
Unidentified' Windfall Sites - - M & A 0 0 0 100 150 200 200 200 200 200 200 200 200 200 200 200 0 2,450 250 Y Y YSee Section i of the 'Greater Cambridge
Housing Trajectory: Assessment of Housing
Land Supply Sites in South Cambridgeshire'.
260 310 305 294 260 200 200 200 200 200 200 200 200 200 200 200 0 3,629 1,429
Y Y Y
Y Y Y
Y Y Y
Y Y N
There are still issues to be resolved relating to
the s106 agreement and therefore no
allowance is made for housing on this site in
the housing trajectory.
Y Y Y
Y Y Y
Total - Unallocated Sites with Resolution to Grant Planning Permission
64.91
0.95
0.40
33.50
0.50S/2341/14 (resolved to grant)
Former CEMEX Cement Works, Haslingfield Road,
BarringtonS/2365/14 (resolved to grant)
Land north of Daniels Close, Willingham
Land west of Longstanton
Land rear of 131 The Causeway, Bassingbourn-cum-
Kneesworth
Land at Ermine Street, Caxton
S/1970/07 (resolved to grant)
S/1199/13 (resolved to grant)
S/1504/13 (resolved to grant)
Windfall Allowance
Unallocated Sites with Resolution to Grant Planning Permission
S/2658/14 (resolved to grant) 0.59Land adjacent to Hill Farm, Fowlmere Road, Foxton
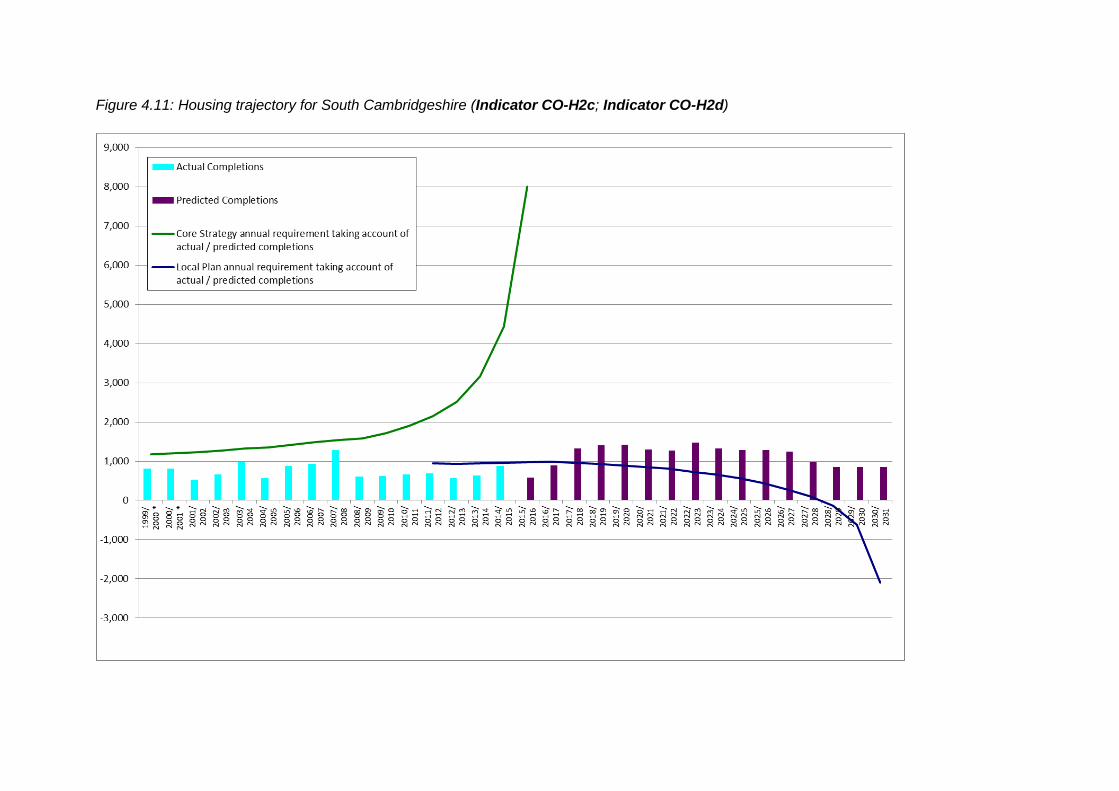
Figure 4.11: Housing trajectory for South Cambridgeshire (Indicator CO-H2c; Indicator CO-H2d)
Annual Monitoring Report January 2016
54
The Five Year Housing Land Supply
4.22 One of the Government's key housing objectives is to ensure that the planning
system delivers a flexible, responsive supply of land. The government through the
National Planning Policy Framework (NPPF) requires that all local planning
authorities identify sufficient specific deliverable sites to deliver five years worth of
housing against their requirement set out in their development plan. The NPPF in
paragraph 47 also introduced a requirement to provide an additional buffer of either
5% or, where there has been a record of persistent under delivery of housing, a
buffer of 20% to provide a realistic prospect of achieving the planned supply and to
ensure choice and competition in the market for land.
4.23 For sites to be included in the Council’s five year land supply they must be
considered deliverable; the NPPF states that deliverable sites are those that are:
available – the site is available now; suitable – the site offers a suitable location for
development now and would contribute towards the creation of mixed, sustainable
communities; and achievable – there is a reasonable prospect that housing will be
delivered on site within five years. An assessment of each site in the housing
trajectory is included in Appendix 1.
4.24 There are two methodologies for calculating five year housing land supply. The
Liverpool methodology assumes that any shortfall will be made up during the
remaining years of the plan period. The Sedgefield methodology requires the whole
of any previous shortfall to be made up within the five year assessment period. The
NPPF requires that a 5% buffer be provided in the five year supply calculation to
provide greater confidence that the housing requirement will be delivered. In areas of
persistent historic undersupply the buffer should be 20%. The Council’s statement to
the Matter 8: Housing Land Supply and Delivery hearings addressed the appropriate
means of calculating the five year supply39.
4.25 In response to a number of changes in circumstance40 since the Local Plan was
submitted in March 2014, the Council agreed in September 2014 to a Memorandum
of Understanding on the Greater Cambridge Joint Housing Trajectory with
Cambridge City Council. This memorandum set out the agreement between the two
Councils under the duty to co-operate that the housing trajectories for the two areas
should be considered together for the purposes of phasing housing delivery, and for
calculating five year housing land supply for plan-making and decision-taking. The
Council’s statement to Matter 1: Legal Requirements set out proposed modifications
to the Local Plan (submitted in March 2014) to give effect to the Memorandum41.
39
Council’s statement to the Local Plan examination in relation to Matter 8: Housing Land Supply and Delivery: https://www.scambs.gov.uk/local-plan-examination-statements-matter-8 40
A detailed list of reasons is given in the Council’s statement to the Local Plan examination in relation to Matter 1: Legal Requirements (paragraph 34): https://www.scambs.gov.uk/sites/www.scambs.gov.uk/files/documents/Matter%201%20Statement%20CCC%20-%20SCDC.pdf 41
Council’s statement to the Local Plan examination in relation to Matter 1: Legal Requirements: https://www.scambs.gov.uk/sites/www.scambs.gov.uk/files/documents/Matter%201%20Statement%20CCC%20-%20SCDC.pdf
January 2016 Annual Monitoring Report
55
4.26 The merits of a joint housing trajectory for the Greater Cambridge area were
considered at the Matter 8: Housing Land Supply and Delivery hearings. The merits
of this approach were not addressed in the initial findings letter from the Inspectors of
20 May 201542. The Councils requested that the Inspectors reconsider issuing a view
on the principle of the joint housing trajectory given the five year land supply issues in
South Cambridgeshire. The Inspectors replied that they do not consider it appropriate
to express any conclusions on the principle of the joint housing trajectory in advance
of knowing the outcome of the further work that is being undertaken. The Councils
remain committed to the Memorandum of Understanding on the Greater
Cambridge Joint Housing Trajectory and the proposed modifications to the Local
Plans to give effect to the joint trajectory have been included in the public
consultation being undertaken jointly with Cambridge City Council on Proposed
Modifications to the Local Plans.
4.27 The Memorandum of Understanding on the Greater Cambridge Joint Housing
Trajectory and the use of the five year supply calculations for Greater Cambridge will
not be relied upon or used in relation to planning decisions and planning appeals until
the Inspectors examining the Local Plan have reported on the approach and found it
to be ‘sound’.
4.28 In view of the various ways that five year supply can be calculated, and pending the
outcome of consideration at the Local Plan examination, this Annual Monitoring
Report shows the results for all ways of calculating the five year land supply for 2015-
2020 for both South Cambridgeshire and the Greater Cambridge area. These results
are set out in the tables below, and the calculations for the Local Plan are based on
the housing requirement of 19,500 dwellings included in the proposed
modification43 to Policy S/5 of the Local Plan, which is currently subject to public
consultation. When the Greater Cambridge area is considered as a whole, whichever
methodology or buffer is used, a five year supply can be demonstrated. This is a
logical and appropriate way of delivering sites to meet the combined objectively
assessed housing need across the Greater Cambridge area, consistent with the
development strategy contained in both submitted Local Plans.
4.29 Against the housing requirements in the new South Cambridgeshire Local Plan of
19,500 homes between 2011 and 2031, and the housing requirement for Greater
Cambridge of 33,500 homes between 2011 and 2031, the Council’s five year housing
land supply for 2015-2020 is:
42
Inspectors initial conclusions letter of 20 May 2015: https://www.scambs.gov.uk/sites/default/files/documents/Letter%20from%20Inspectors%20to%20Councils%20-%20Preliminary%20Conclusions%20200515.pdf 43
Cambridge and South Cambridgeshire Modifications Consultation Report: https://www.scambs.gov.uk/sites/default/files/final_mods_consultation_document_website_8.12.15.pdf
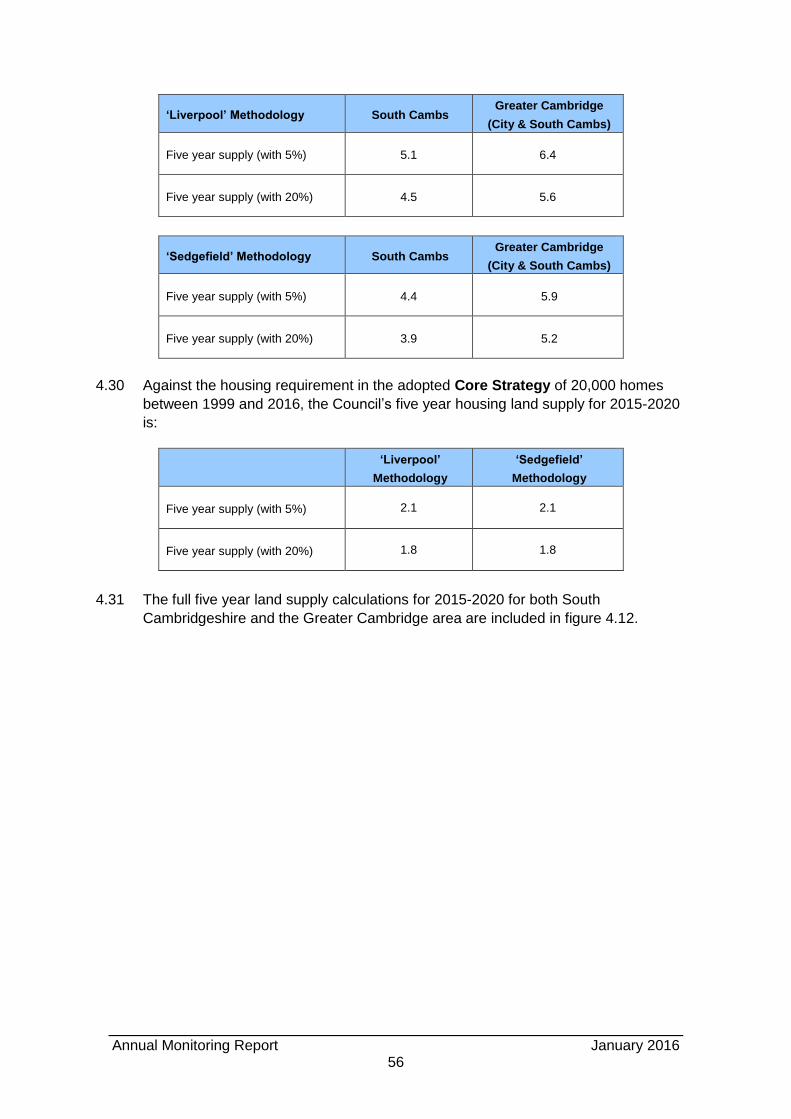
Annual Monitoring Report January 2016
56
‘Liverpool’ Methodology South Cambs Greater Cambridge
(City & South Cambs)
Five year supply (with 5%) 5.1 6.4
Five year supply (with 20%) 4.5 5.6
‘Sedgefield’ Methodology South Cambs Greater Cambridge
(City & South Cambs)
Five year supply (with 5%) 4.4 5.9
Five year supply (with 20%) 3.9 5.2
4.30 Against the housing requirement in the adopted Core Strategy of 20,000 homes
between 1999 and 2016, the Council’s five year housing land supply for 2015-2020
is:
‘Liverpool’
Methodology
‘Sedgefield’
Methodology
Five year supply (with 5%) 2.1 2.1
Five year supply (with 20%) 1.8 1.8
4.31 The full five year land supply calculations for 2015-2020 for both South
Cambridgeshire and the Greater Cambridge area are included in figure 4.12.
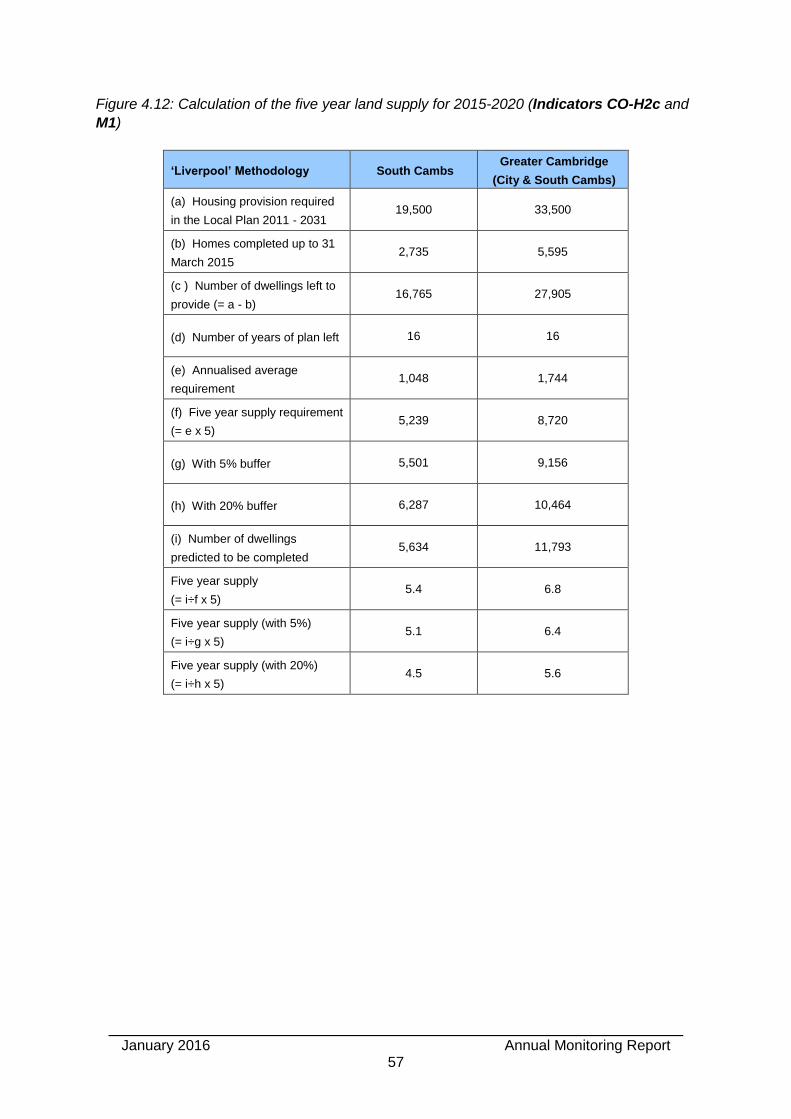
January 2016 Annual Monitoring Report
57
Figure 4.12: Calculation of the five year land supply for 2015-2020 (Indicators CO-H2c and
M1)
‘Liverpool’ Methodology South Cambs Greater Cambridge
(City & South Cambs)
(a) Housing provision required
in the Local Plan 2011 - 2031 19,500 33,500
(b) Homes completed up to 31
March 2015 2,735 5,595
(c ) Number of dwellings left to
provide (= a - b) 16,765 27,905
(d) Number of years of plan left 16 16
(e) Annualised average
requirement 1,048 1,744
(f) Five year supply requirement
(= e x 5) 5,239 8,720
(g) With 5% buffer 5,501 9,156
(h) With 20% buffer 6,287 10,464
(i) Number of dwellings
predicted to be completed 5,634 11,793
Five year supply
(= i÷f x 5) 5.4 6.8
Five year supply (with 5%)
(= i÷g x 5) 5.1 6.4
Five year supply (with 20%)
(= i÷h x 5) 4.5 5.6
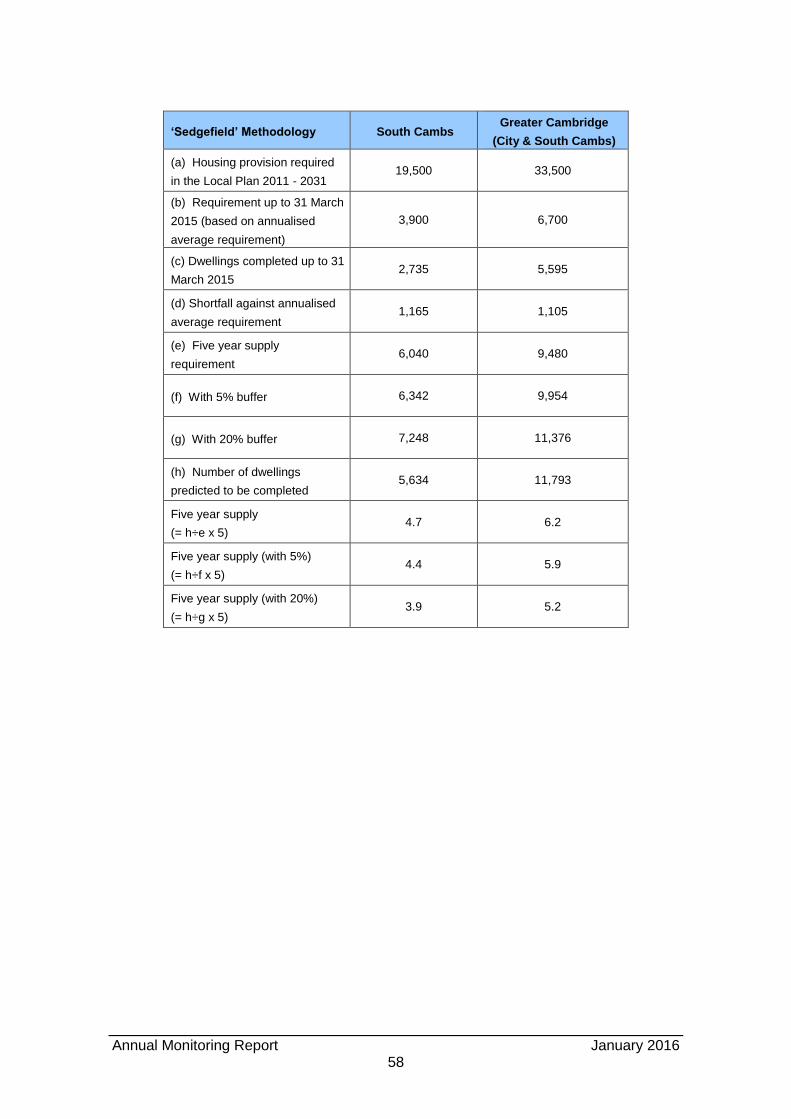
Annual Monitoring Report January 2016
58
‘Sedgefield’ Methodology South Cambs Greater Cambridge
(City & South Cambs)
(a) Housing provision required
in the Local Plan 2011 - 2031 19,500 33,500
(b) Requirement up to 31 March
2015 (based on annualised
average requirement)
3,900 6,700
(c) Dwellings completed up to 31
March 2015 2,735 5,595
(d) Shortfall against annualised
average requirement 1,165 1,105
(e) Five year supply
requirement 6,040 9,480
(f) With 5% buffer 6,342 9,954
(g) With 20% buffer 7,248 11,376
(h) Number of dwellings
predicted to be completed 5,634 11,793
Five year supply
(= h÷e x 5) 4.7 6.2
Five year supply (with 5%)
(= h÷f x 5) 4.4 5.9
Five year supply (with 20%)
(= h÷g x 5) 3.9 5.2
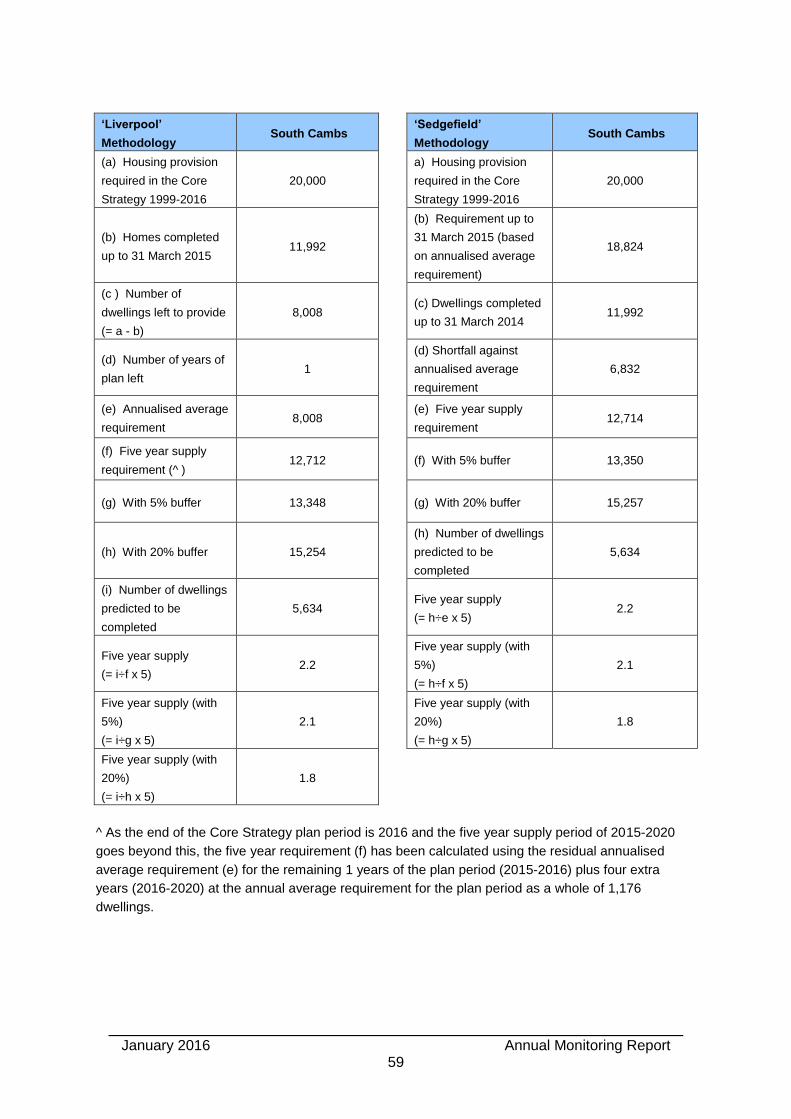
January 2016 Annual Monitoring Report
59
‘Liverpool’
Methodology South Cambs
‘Sedgefield’
Methodology South Cambs
(a) Housing provision
required in the Core
Strategy 1999-2016
20,000
a) Housing provision
required in the Core
Strategy 1999-2016
20,000
(b) Homes completed
up to 31 March 2015 11,992
(b) Requirement up to
31 March 2015 (based
on annualised average
requirement)
18,824
(c ) Number of
dwellings left to provide
(= a - b)
8,008 (c) Dwellings completed
up to 31 March 2014 11,992
(d) Number of years of
plan left 1
(d) Shortfall against
annualised average
requirement
6,832
(e) Annualised average
requirement 8,008
(e) Five year supply
requirement 12,714
(f) Five year supply
requirement (^ ) 12,712 (f) With 5% buffer 13,350
(g) With 5% buffer 13,348 (g) With 20% buffer 15,257
(h) With 20% buffer 15,254
(h) Number of dwellings
predicted to be
completed
5,634
(i) Number of dwellings
predicted to be
completed
5,634 Five year supply
(= h÷e x 5) 2.2
Five year supply
(= i÷f x 5) 2.2
Five year supply (with
5%)
(= h÷f x 5)
2.1
Five year supply (with
5%)
(= i÷g x 5)
2.1
Five year supply (with
20%)
(= h÷g x 5)
1.8
Five year supply (with
20%)
(= i÷h x 5)
1.8
^ As the end of the Core Strategy plan period is 2016 and the five year supply period of 2015-2020
goes beyond this, the five year requirement (f) has been calculated using the residual annualised
average requirement (e) for the remaining 1 years of the plan period (2015-2016) plus four extra
years (2016-2020) at the annual average requirement for the plan period as a whole of 1,176
dwellings.
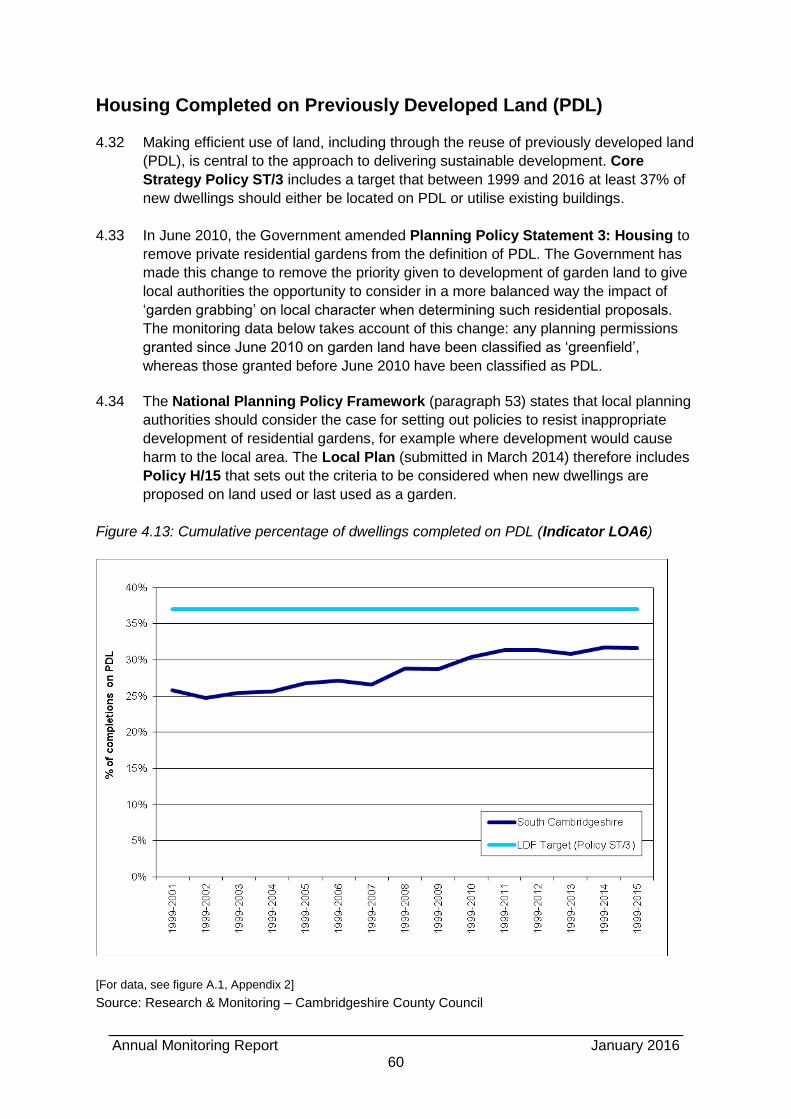
Annual Monitoring Report January 2016
60
Housing Completed on Previously Developed Land (PDL)
4.32 Making efficient use of land, including through the reuse of previously developed land
(PDL), is central to the approach to delivering sustainable development. Core
Strategy Policy ST/3 includes a target that between 1999 and 2016 at least 37% of
new dwellings should either be located on PDL or utilise existing buildings.
4.33 In June 2010, the Government amended Planning Policy Statement 3: Housing to
remove private residential gardens from the definition of PDL. The Government has
made this change to remove the priority given to development of garden land to give
local authorities the opportunity to consider in a more balanced way the impact of
‘garden grabbing’ on local character when determining such residential proposals.
The monitoring data below takes account of this change: any planning permissions
granted since June 2010 on garden land have been classified as ‘greenfield’,
whereas those granted before June 2010 have been classified as PDL.
4.34 The National Planning Policy Framework (paragraph 53) states that local planning
authorities should consider the case for setting out policies to resist inappropriate
development of residential gardens, for example where development would cause
harm to the local area. The Local Plan (submitted in March 2014) therefore includes
Policy H/15 that sets out the criteria to be considered when new dwellings are
proposed on land used or last used as a garden.
Figure 4.13: Cumulative percentage of dwellings completed on PDL (Indicator LOA6)
[For data, see figure A.1, Appendix 2]
Source: Research & Monitoring – Cambridgeshire County Council

January 2016 Annual Monitoring Report
61
Figure 4.14: Percentage of new and converted dwellings completed on PDL (Indicators CO-
H3 and M4)
[For data, see figure A.2, Appendix 2]
Source: Research & Monitoring – Cambridgeshire County Council
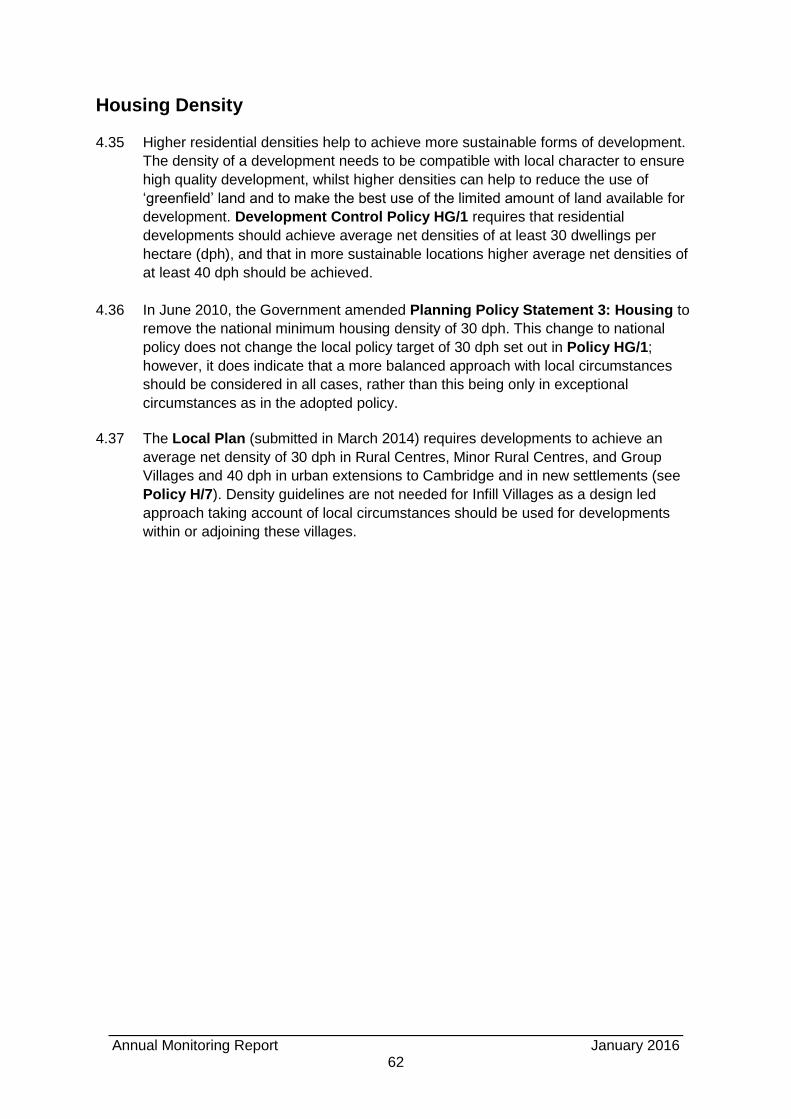
Annual Monitoring Report January 2016
62
Housing Density
4.35 Higher residential densities help to achieve more sustainable forms of development.
The density of a development needs to be compatible with local character to ensure
high quality development, whilst higher densities can help to reduce the use of
‘greenfield’ land and to make the best use of the limited amount of land available for
development. Development Control Policy HG/1 requires that residential
developments should achieve average net densities of at least 30 dwellings per
hectare (dph), and that in more sustainable locations higher average net densities of
at least 40 dph should be achieved.
4.36 In June 2010, the Government amended Planning Policy Statement 3: Housing to
remove the national minimum housing density of 30 dph. This change to national
policy does not change the local policy target of 30 dph set out in Policy HG/1;
however, it does indicate that a more balanced approach with local circumstances
should be considered in all cases, rather than this being only in exceptional
circumstances as in the adopted policy.
4.37 The Local Plan (submitted in March 2014) requires developments to achieve an
average net density of 30 dph in Rural Centres, Minor Rural Centres, and Group
Villages and 40 dph in urban extensions to Cambridge and in new settlements (see
Policy H/7). Density guidelines are not needed for Infill Villages as a design led
approach taking account of local circumstances should be used for developments
within or adjoining these villages.
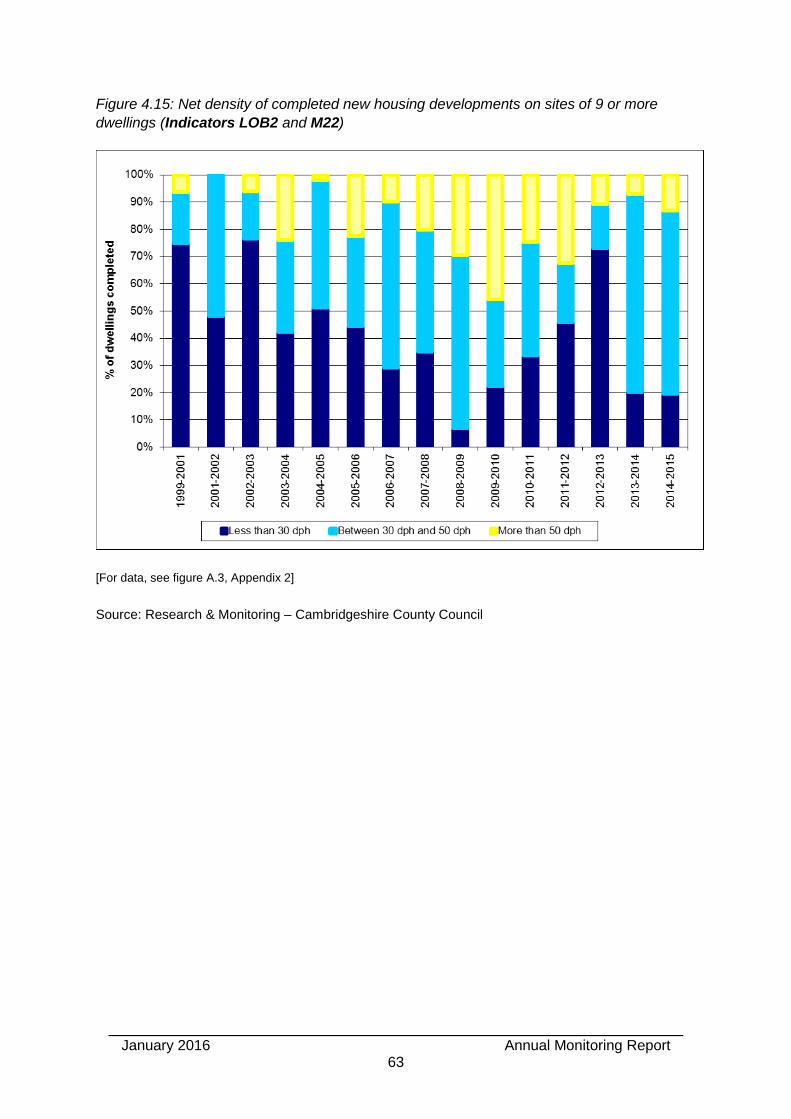
January 2016 Annual Monitoring Report
63
Figure 4.15: Net density of completed new housing developments on sites of 9 or more
dwellings (Indicators LOB2 and M22)
[For data, see figure A.3, Appendix 2]
Source: Research & Monitoring – Cambridgeshire County Council
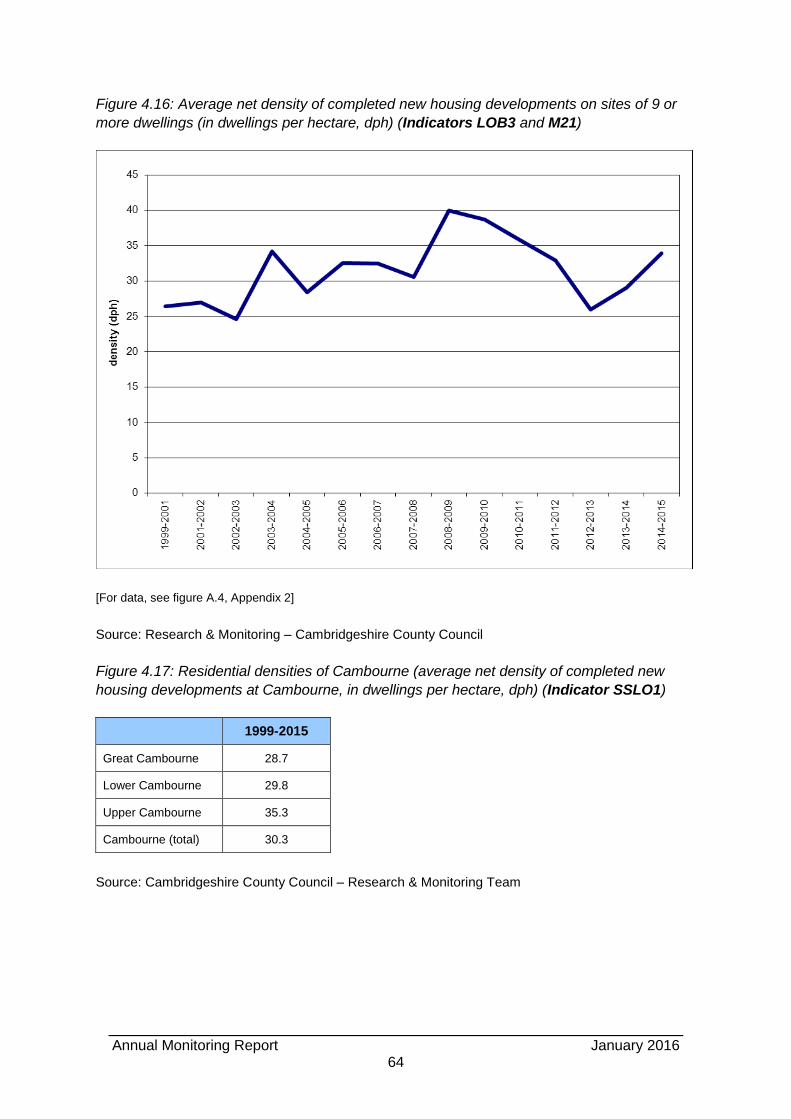
Annual Monitoring Report January 2016
64
Figure 4.16: Average net density of completed new housing developments on sites of 9 or
more dwellings (in dwellings per hectare, dph) (Indicators LOB3 and M21)
[For data, see figure A.4, Appendix 2]
Source: Research & Monitoring – Cambridgeshire County Council
Figure 4.17: Residential densities of Cambourne (average net density of completed new
housing developments at Cambourne, in dwellings per hectare, dph) (Indicator SSLO1)
1999-2015
Great Cambourne 28.7
Lower Cambourne 29.8
Upper Cambourne 35.3
Cambourne (total) 30.3
Source: Cambridgeshire County Council – Research & Monitoring Team
January 2016 Annual Monitoring Report
65
Figure 4.18: Residential densities of Cambridge Southern Fringe (average net density of
completed new housing developments at Trumpington Meadows within the South
Cambridgeshire District Council administrative boundary, in dwellings per hectare, dph)
(Indicator CSF02)
2014-2015
Cambridge Southern Fringe
74.2
Source: Cambridgeshire County Council – Research & Monitoring Team
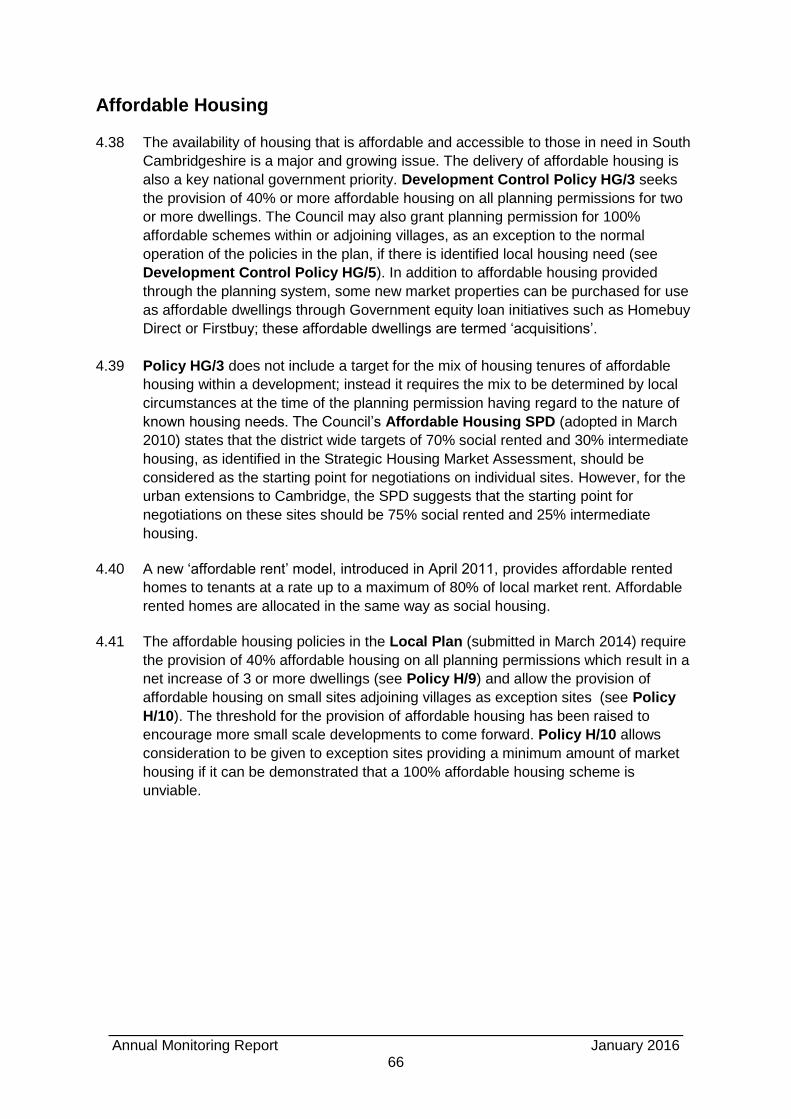
Annual Monitoring Report January 2016
66
Affordable Housing
4.38 The availability of housing that is affordable and accessible to those in need in South
Cambridgeshire is a major and growing issue. The delivery of affordable housing is
also a key national government priority. Development Control Policy HG/3 seeks
the provision of 40% or more affordable housing on all planning permissions for two
or more dwellings. The Council may also grant planning permission for 100%
affordable schemes within or adjoining villages, as an exception to the normal
operation of the policies in the plan, if there is identified local housing need (see
Development Control Policy HG/5). In addition to affordable housing provided
through the planning system, some new market properties can be purchased for use
as affordable dwellings through Government equity loan initiatives such as Homebuy
Direct or Firstbuy; these affordable dwellings are termed ‘acquisitions’.
4.39 Policy HG/3 does not include a target for the mix of housing tenures of affordable
housing within a development; instead it requires the mix to be determined by local
circumstances at the time of the planning permission having regard to the nature of
known housing needs. The Council’s Affordable Housing SPD (adopted in March
2010) states that the district wide targets of 70% social rented and 30% intermediate
housing, as identified in the Strategic Housing Market Assessment, should be
considered as the starting point for negotiations on individual sites. However, for the
urban extensions to Cambridge, the SPD suggests that the starting point for
negotiations on these sites should be 75% social rented and 25% intermediate
housing.
4.40 A new ‘affordable rent’ model, introduced in April 2011, provides affordable rented
homes to tenants at a rate up to a maximum of 80% of local market rent. Affordable
rented homes are allocated in the same way as social housing.
4.41 The affordable housing policies in the Local Plan (submitted in March 2014) require
the provision of 40% affordable housing on all planning permissions which result in a
net increase of 3 or more dwellings (see Policy H/9) and allow the provision of
affordable housing on small sites adjoining villages as exception sites (see Policy
H/10). The threshold for the provision of affordable housing has been raised to
encourage more small scale developments to come forward. Policy H/10 allows
consideration to be given to exception sites providing a minimum amount of market
housing if it can be demonstrated that a 100% affordable housing scheme is
unviable.
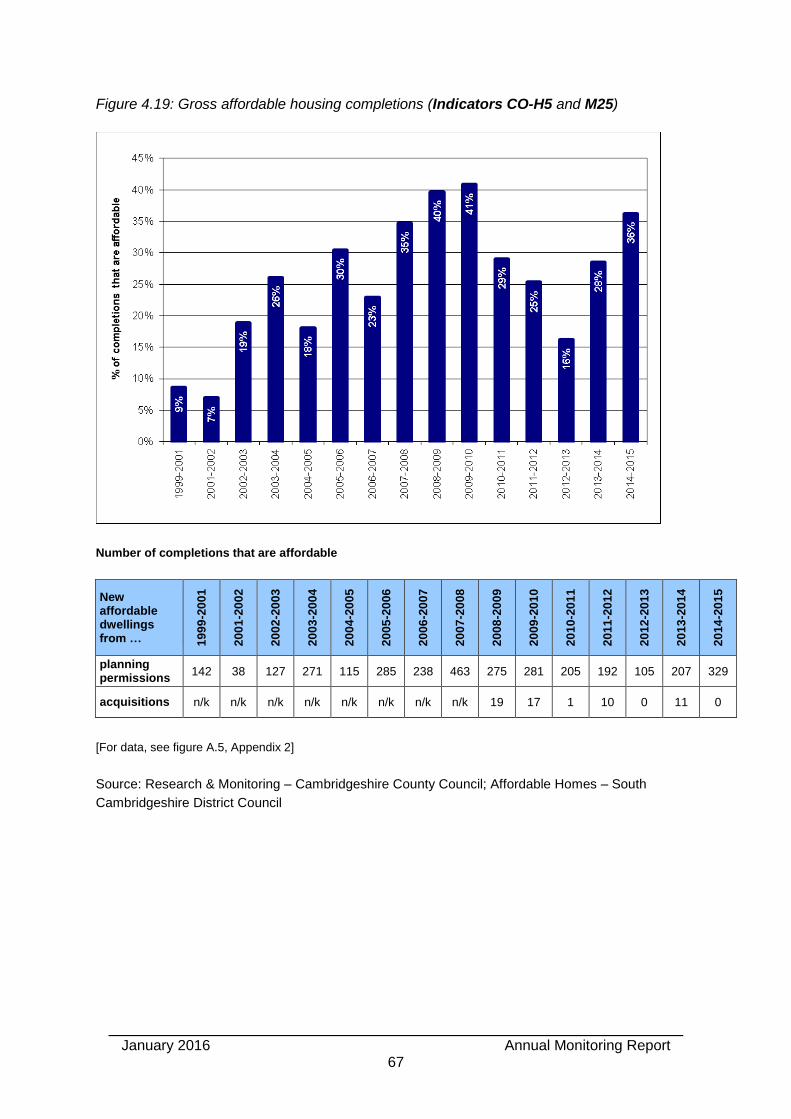
January 2016 Annual Monitoring Report
67
Figure 4.19: Gross affordable housing completions (Indicators CO-H5 and M25)
Number of completions that are affordable
New affordable dwellings from … 1
99
9-2
00
1
20
01
-20
02
20
02
-20
03
20
03
-20
04
20
04
-20
05
20
05
-20
06
20
06
-20
07
20
07
-20
08
20
08
-20
09
20
09
-20
10
20
10
-20
11
20
11
-20
12
20
12
-20
13
20
13
-20
14
20
14
-20
15
planning permissions
142 38 127 271 115 285 238 463 275 281 205 192 105 207 329
acquisitions n/k n/k n/k n/k n/k n/k n/k n/k 19 17 1 10 0 11 0
[For data, see figure A.5, Appendix 2]
Source: Research & Monitoring – Cambridgeshire County Council; Affordable Homes – South
Cambridgeshire District Council

Annual Monitoring Report January 2016
68
Figure 4.20: Affordable housing completions by tenure (Indicator LOA2)
[For data, see figure A.6, Appendix 2]
Source: Research & Monitoring – Cambridgeshire County Council; Affordable Homes – South
Cambridgeshire District Council
Figure 4.21: Affordable housing completions on rural exception sites (Indicators LOA3 and
M26)
20
04
-20
05
20
05
-20
06
20
06
-20
07
20
07
-20
08
20
08
-20
09
20
09
-20
10
20
10
-20
11
20
11
-20
12
20
12
-20
13
20
13
-20
14
20
14
-20
15
Number of affordable dwellings built on rural exception sites
36 (1 site)
6 (1 site)
85 (5 sites)
66 (4 sites)
60 (3 sites)
33 (3 sites)
27 (3 sites)
88 (5 sites)
19 (2 sites)
72 (6 sites)
23 (3 sites)
% of district affordable housing total
31% 2% 36% 14% 22% 12% 13% 46% 18% 35% 7%
Source: Affordable Homes – South Cambridgeshire District Council; Research & Monitoring –
Cambridgeshire County Council
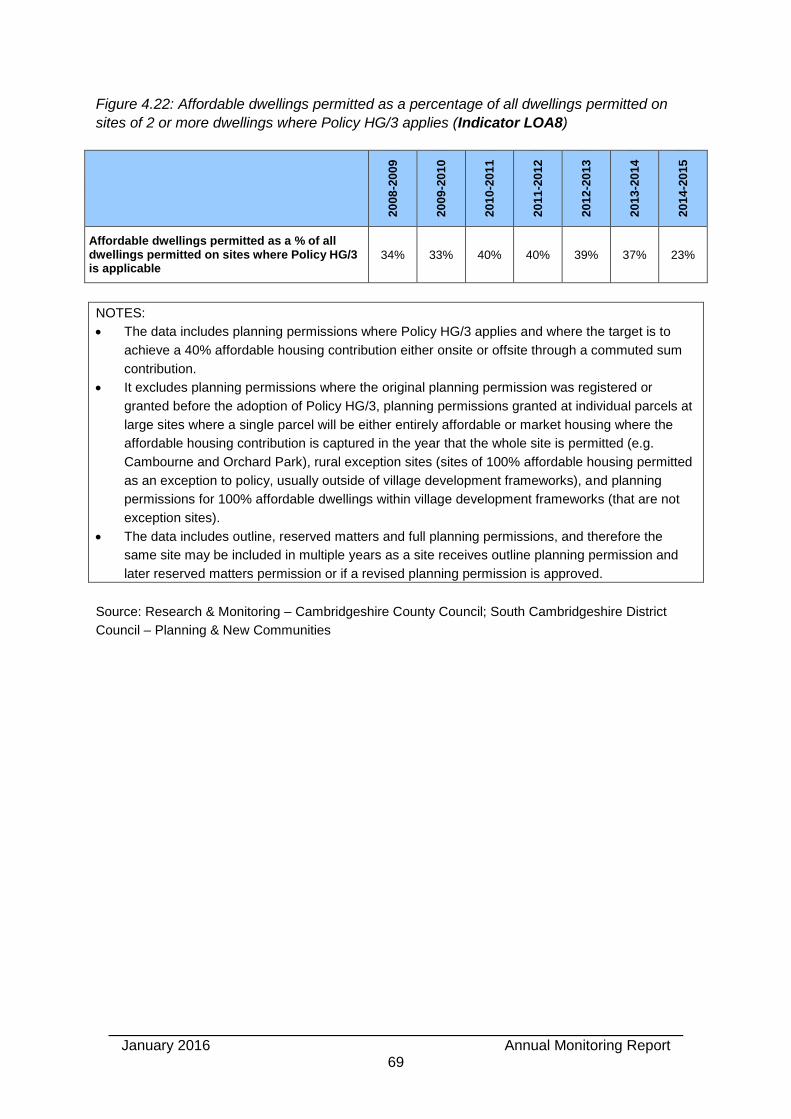
January 2016 Annual Monitoring Report
69
Figure 4.22: Affordable dwellings permitted as a percentage of all dwellings permitted on
sites of 2 or more dwellings where Policy HG/3 applies (Indicator LOA8)
20
08
-20
09
20
09
-20
10
20
10
-20
11
20
11
-20
12
20
12
-20
13
20
13
-20
14
20
14
-20
15
Affordable dwellings permitted as a % of all dwellings permitted on sites where Policy HG/3 is applicable
34% 33% 40% 40% 39% 37% 23%
NOTES:
The data includes planning permissions where Policy HG/3 applies and where the target is to
achieve a 40% affordable housing contribution either onsite or offsite through a commuted sum
contribution.
It excludes planning permissions where the original planning permission was registered or
granted before the adoption of Policy HG/3, planning permissions granted at individual parcels at
large sites where a single parcel will be either entirely affordable or market housing where the
affordable housing contribution is captured in the year that the whole site is permitted (e.g.
Cambourne and Orchard Park), rural exception sites (sites of 100% affordable housing permitted
as an exception to policy, usually outside of village development frameworks), and planning
permissions for 100% affordable dwellings within village development frameworks (that are not
exception sites).
The data includes outline, reserved matters and full planning permissions, and therefore the
same site may be included in multiple years as a site receives outline planning permission and
later reserved matters permission or if a revised planning permission is approved.
Source: Research & Monitoring – Cambridgeshire County Council; South Cambridgeshire District
Council – Planning & New Communities
Annual Monitoring Report January 2016
70
Gypsy & Traveller Sites
4.42 Local authorities are required to make provision for Gypsy & Traveller pitches and
Travelling Showpeople plots within their local authority, as nationally there is a
shortage of sites available for Gypsy & Traveller families to use. In June 2012, the
Council approved a new Gypsy & Traveller Accommodation Needs Assessment,
prepared by Cambridgeshire County Council, which calculates need between 2011
and 2031 in the nine districts in the study area. This is part of the evidence base for
establishing South Cambridgeshire’s requirement for Gypsy & Traveller pitches in the
new Local Plan.
4.43 The Local Plan (submitted in March 2014) sets out a requirement for at least 85
permanent Gypsy & Traveller pitches to be provided between 2011 and 2031 to meet
the objectively assessed need in the district (see Policies S/5 and H/19) and for at
least 4 Travelling Showpeople plots to be provided between 2011 and 2016 (see
Policy H/19). The Local Plan also includes policies which seek opportunities to
deliver Gypsy & Traveller pitches within large scale new communities (see Policy
H/20) and set out the criteria to be used when assessing planning permissions (see
Policies H/21 and H/22).
Figure 4.23: Gypsy & Traveller pitches and Travelling Showpeople plots completed
(Indicators CO-H4, LOA14 and M27)
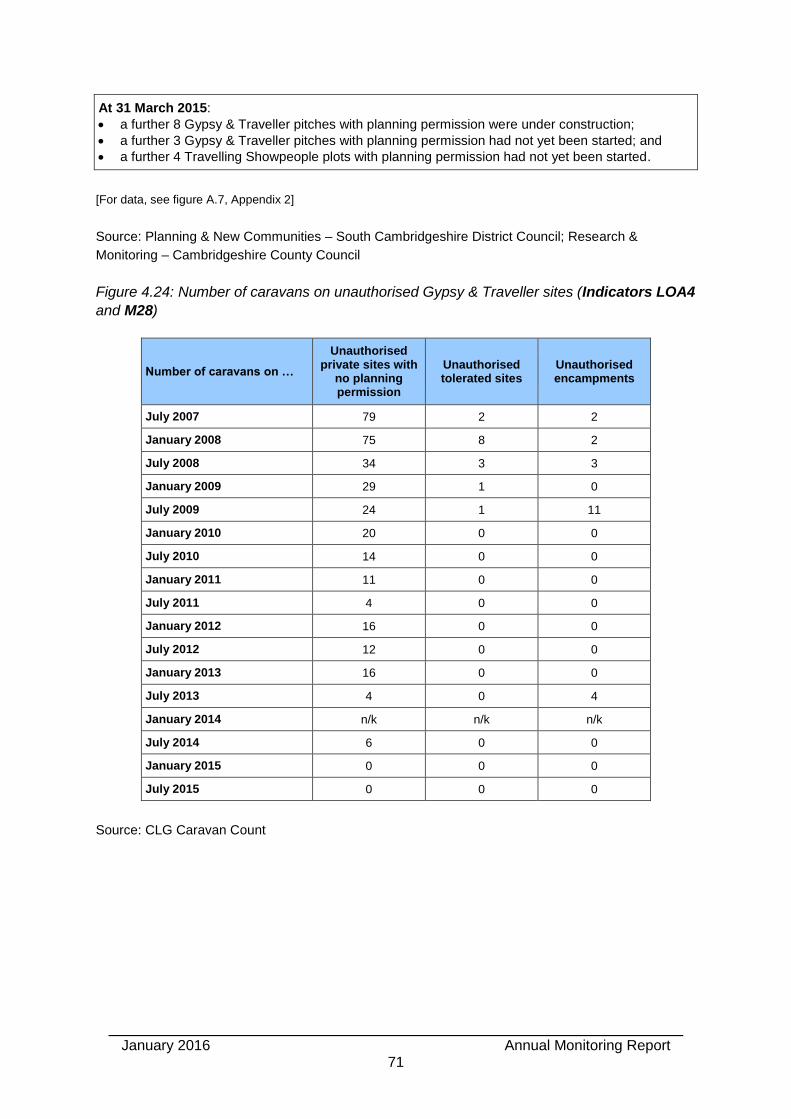
January 2016 Annual Monitoring Report
71
At 31 March 2015:
a further 8 Gypsy & Traveller pitches with planning permission were under construction;
a further 3 Gypsy & Traveller pitches with planning permission had not yet been started; and
a further 4 Travelling Showpeople plots with planning permission had not yet been started.
[For data, see figure A.7, Appendix 2]
Source: Planning & New Communities – South Cambridgeshire District Council; Research &
Monitoring – Cambridgeshire County Council
Figure 4.24: Number of caravans on unauthorised Gypsy & Traveller sites (Indicators LOA4
and M28)
Number of caravans on …
Unauthorised private sites with
no planning permission
Unauthorised tolerated sites
Unauthorised encampments
July 2007 79 2 2
January 2008 75 8 2
July 2008 34 3 3
January 2009 29 1 0
July 2009 24 1 11
January 2010 20 0 0
July 2010 14 0 0
January 2011 11 0 0
July 2011 4 0 0
January 2012 16 0 0
July 2012 12 0 0
January 2013 16 0 0
July 2013 4 0 4
January 2014 n/k n/k n/k
July 2014 6 0 0
January 2015 0 0 0
July 2015 0 0 0
Source: CLG Caravan Count
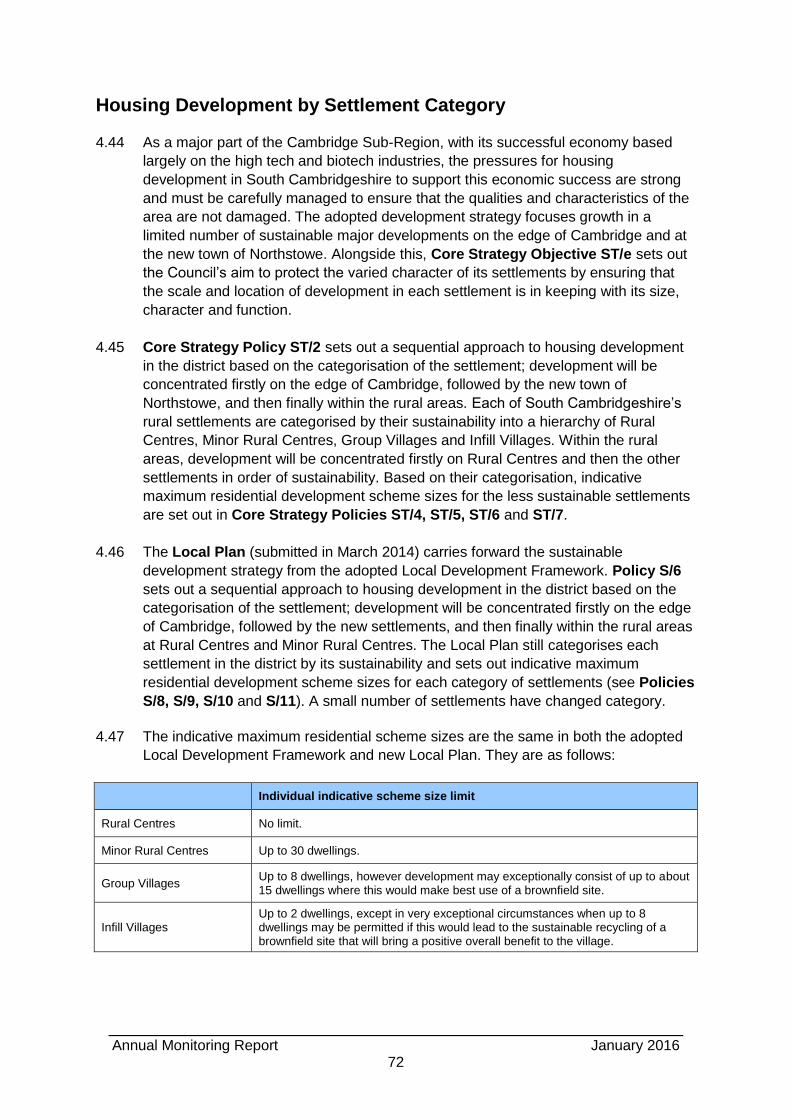
Annual Monitoring Report January 2016
72
Housing Development by Settlement Category
4.44 As a major part of the Cambridge Sub-Region, with its successful economy based
largely on the high tech and biotech industries, the pressures for housing
development in South Cambridgeshire to support this economic success are strong
and must be carefully managed to ensure that the qualities and characteristics of the
area are not damaged. The adopted development strategy focuses growth in a
limited number of sustainable major developments on the edge of Cambridge and at
the new town of Northstowe. Alongside this, Core Strategy Objective ST/e sets out
the Council’s aim to protect the varied character of its settlements by ensuring that
the scale and location of development in each settlement is in keeping with its size,
character and function.
4.45 Core Strategy Policy ST/2 sets out a sequential approach to housing development
in the district based on the categorisation of the settlement; development will be
concentrated firstly on the edge of Cambridge, followed by the new town of
Northstowe, and then finally within the rural areas. Each of South Cambridgeshire’s
rural settlements are categorised by their sustainability into a hierarchy of Rural
Centres, Minor Rural Centres, Group Villages and Infill Villages. Within the rural
areas, development will be concentrated firstly on Rural Centres and then the other
settlements in order of sustainability. Based on their categorisation, indicative
maximum residential development scheme sizes for the less sustainable settlements
are set out in Core Strategy Policies ST/4, ST/5, ST/6 and ST/7.
4.46 The Local Plan (submitted in March 2014) carries forward the sustainable
development strategy from the adopted Local Development Framework. Policy S/6
sets out a sequential approach to housing development in the district based on the
categorisation of the settlement; development will be concentrated firstly on the edge
of Cambridge, followed by the new settlements, and then finally within the rural areas
at Rural Centres and Minor Rural Centres. The Local Plan still categorises each
settlement in the district by its sustainability and sets out indicative maximum
residential development scheme sizes for each category of settlements (see Policies
S/8, S/9, S/10 and S/11). A small number of settlements have changed category.
4.47 The indicative maximum residential scheme sizes are the same in both the adopted
Local Development Framework and new Local Plan. They are as follows:
Individual indicative scheme size limit
Rural Centres No limit.
Minor Rural Centres Up to 30 dwellings.
Group Villages Up to 8 dwellings, however development may exceptionally consist of up to about 15 dwellings where this would make best use of a brownfield site.
Infill Villages Up to 2 dwellings, except in very exceptional circumstances when up to 8 dwellings may be permitted if this would lead to the sustainable recycling of a brownfield site that will bring a positive overall benefit to the village.
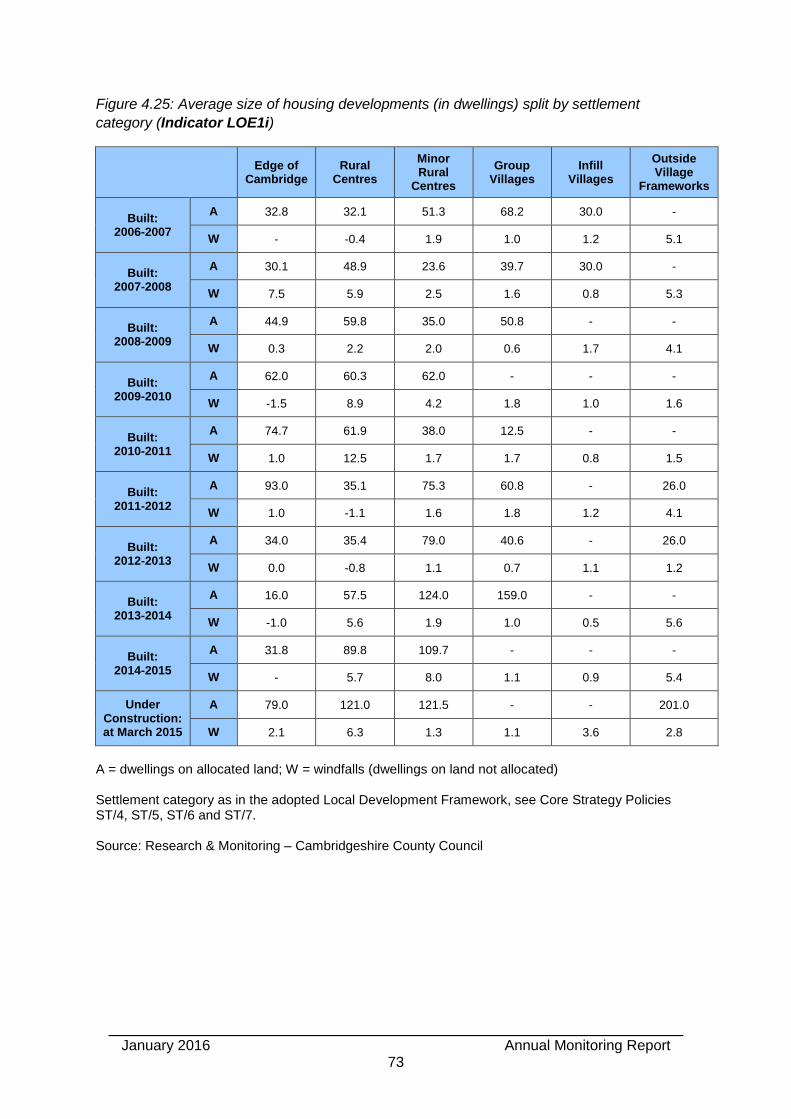
January 2016 Annual Monitoring Report
73
Figure 4.25: Average size of housing developments (in dwellings) split by settlement
category (Indicator LOE1i)
Edge of Cambridge
Rural Centres
Minor Rural
Centres
Group Villages
Infill Villages
Outside Village
Frameworks
Built: 2006-2007
A 32.8 32.1 51.3 68.2 30.0 -
W - -0.4 1.9 1.0 1.2 5.1
Built: 2007-2008
A 30.1 48.9 23.6 39.7 30.0 -
W 7.5 5.9 2.5 1.6 0.8 5.3
Built: 2008-2009
A 44.9 59.8 35.0 50.8 - -
W 0.3 2.2 2.0 0.6 1.7 4.1
Built: 2009-2010
A 62.0 60.3 62.0 - - -
W -1.5 8.9 4.2 1.8 1.0 1.6
Built: 2010-2011
A 74.7 61.9 38.0 12.5 - -
W 1.0 12.5 1.7 1.7 0.8 1.5
Built: 2011-2012
A 93.0 35.1 75.3 60.8 - 26.0
W 1.0 -1.1 1.6 1.8 1.2 4.1
Built: 2012-2013
A 34.0 35.4 79.0 40.6 - 26.0
W 0.0 -0.8 1.1 0.7 1.1 1.2
Built: 2013-2014
A 16.0 57.5 124.0 159.0 - -
W -1.0 5.6 1.9 1.0 0.5 5.6
Built: 2014-2015
A 31.8 89.8 109.7 - - -
W - 5.7 8.0 1.1 0.9 5.4
Under Construction: at March 2015
A 79.0 121.0 121.5 - - 201.0
W 2.1 6.3 1.3 1.1 3.6 2.8
A = dwellings on allocated land; W = windfalls (dwellings on land not allocated) Settlement category as in the adopted Local Development Framework, see Core Strategy Policies ST/4, ST/5, ST/6 and ST/7. Source: Research & Monitoring – Cambridgeshire County Council
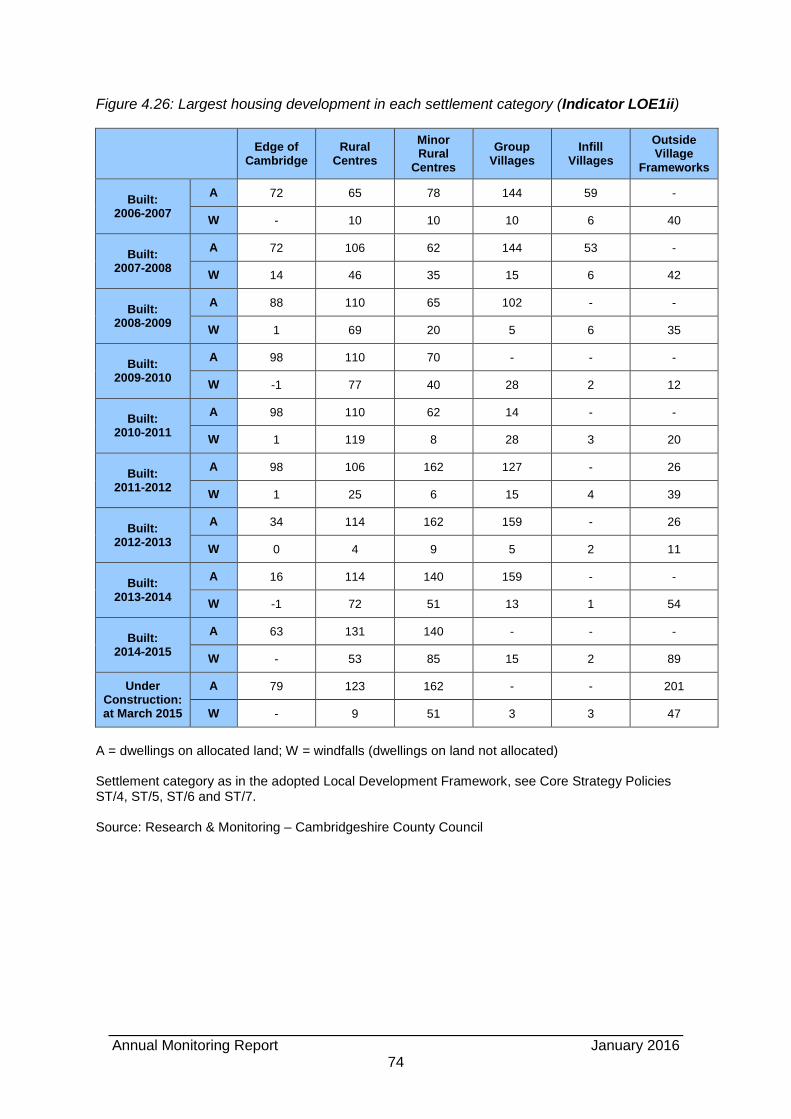
Annual Monitoring Report January 2016
74
Figure 4.26: Largest housing development in each settlement category (Indicator LOE1ii)
Edge of Cambridge
Rural Centres
Minor Rural
Centres
Group Villages
Infill Villages
Outside Village
Frameworks
Built: 2006-2007
A 72 65 78 144 59 -
W - 10 10 10 6 40
Built: 2007-2008
A 72 106 62 144 53 -
W 14 46 35 15 6 42
Built: 2008-2009
A 88 110 65 102 - -
W 1 69 20 5 6 35
Built: 2009-2010
A 98 110 70 - - -
W -1 77 40 28 2 12
Built: 2010-2011
A 98 110 62 14 - -
W 1 119 8 28 3 20
Built: 2011-2012
A 98 106 162 127 - 26
W 1 25 6 15 4 39
Built: 2012-2013
A 34 114 162 159 - 26
W 0 4 9 5 2 11
Built: 2013-2014
A 16 114 140 159 - -
W -1 72 51 13 1 54
Built: 2014-2015
A 63 131 140 - - -
W - 53 85 15 2 89
Under Construction: at March 2015
A 79 123 162 - - 201
W - 9 51 3 3 47
A = dwellings on allocated land; W = windfalls (dwellings on land not allocated) Settlement category as in the adopted Local Development Framework, see Core Strategy Policies ST/4, ST/5, ST/6 and ST/7. Source: Research & Monitoring – Cambridgeshire County Council
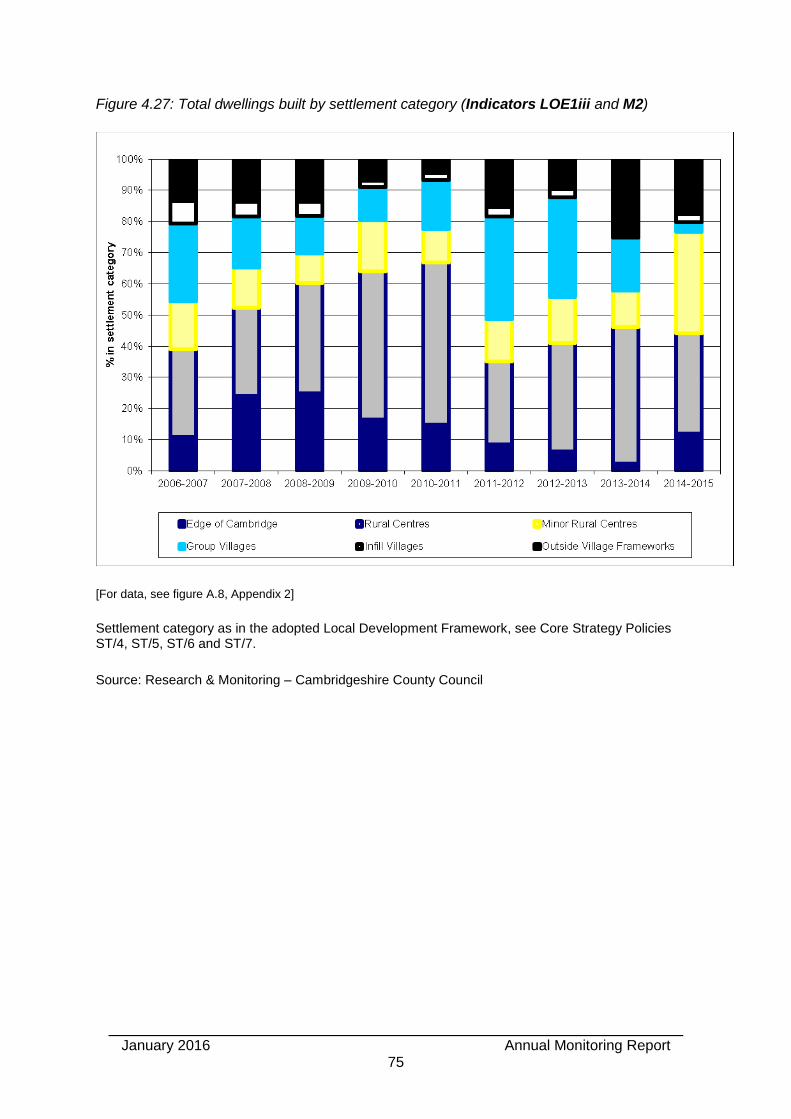
January 2016 Annual Monitoring Report
75
Figure 4.27: Total dwellings built by settlement category (Indicators LOE1iii and M2)
[For data, see figure A.8, Appendix 2]
Settlement category as in the adopted Local Development Framework, see Core Strategy Policies ST/4, ST/5, ST/6 and ST/7.
Source: Research & Monitoring – Cambridgeshire County Council
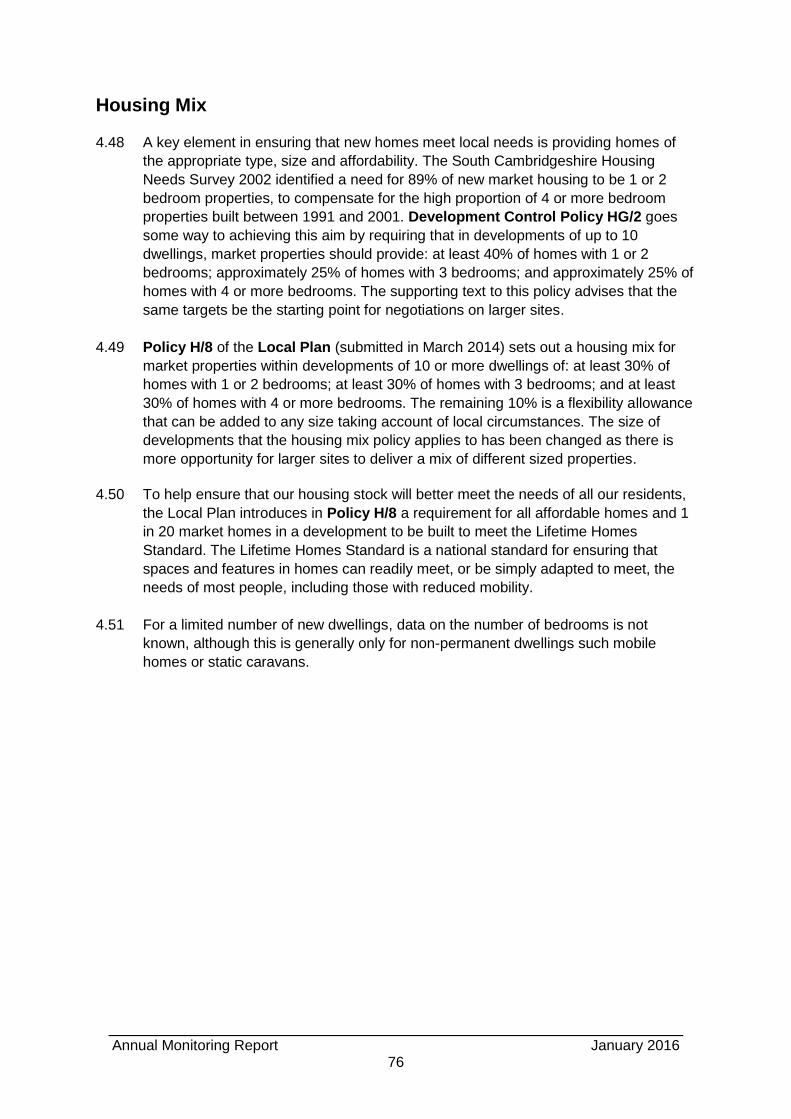
Annual Monitoring Report January 2016
76
Housing Mix
4.48 A key element in ensuring that new homes meet local needs is providing homes of
the appropriate type, size and affordability. The South Cambridgeshire Housing
Needs Survey 2002 identified a need for 89% of new market housing to be 1 or 2
bedroom properties, to compensate for the high proportion of 4 or more bedroom
properties built between 1991 and 2001. Development Control Policy HG/2 goes
some way to achieving this aim by requiring that in developments of up to 10
dwellings, market properties should provide: at least 40% of homes with 1 or 2
bedrooms; approximately 25% of homes with 3 bedrooms; and approximately 25% of
homes with 4 or more bedrooms. The supporting text to this policy advises that the
same targets be the starting point for negotiations on larger sites.
4.49 Policy H/8 of the Local Plan (submitted in March 2014) sets out a housing mix for
market properties within developments of 10 or more dwellings of: at least 30% of
homes with 1 or 2 bedrooms; at least 30% of homes with 3 bedrooms; and at least
30% of homes with 4 or more bedrooms. The remaining 10% is a flexibility allowance
that can be added to any size taking account of local circumstances. The size of
developments that the housing mix policy applies to has been changed as there is
more opportunity for larger sites to deliver a mix of different sized properties.
4.50 To help ensure that our housing stock will better meet the needs of all our residents,
the Local Plan introduces in Policy H/8 a requirement for all affordable homes and 1
in 20 market homes in a development to be built to meet the Lifetime Homes
Standard. The Lifetime Homes Standard is a national standard for ensuring that
spaces and features in homes can readily meet, or be simply adapted to meet, the
needs of most people, including those with reduced mobility.
4.51 For a limited number of new dwellings, data on the number of bedrooms is not
known, although this is generally only for non-permanent dwellings such mobile
homes or static caravans.
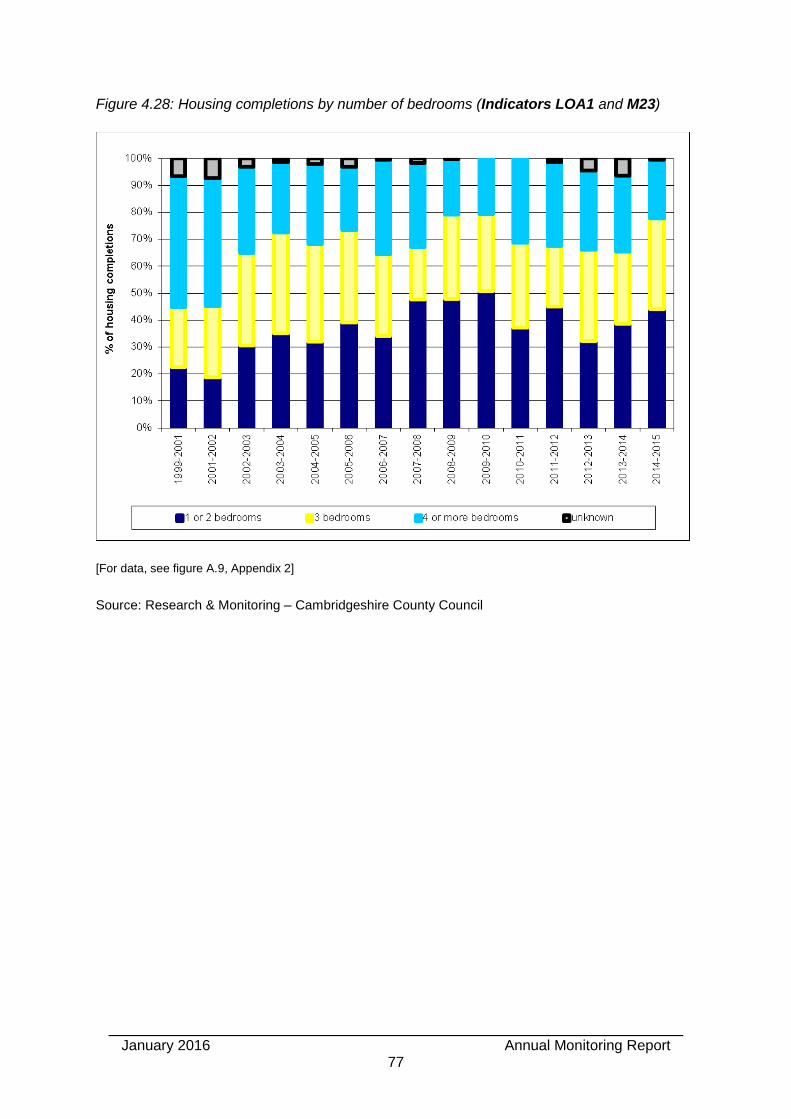
January 2016 Annual Monitoring Report
77
Figure 4.28: Housing completions by number of bedrooms (Indicators LOA1 and M23)
[For data, see figure A.9, Appendix 2]
Source: Research & Monitoring – Cambridgeshire County Council
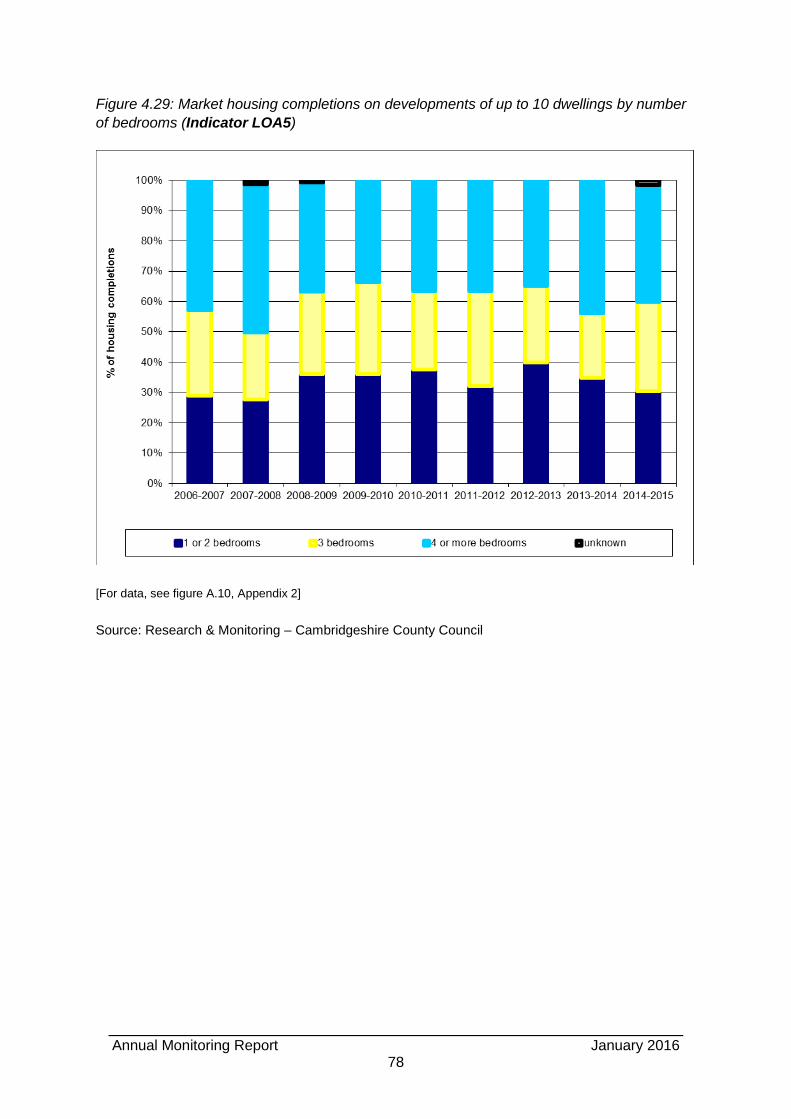
Annual Monitoring Report January 2016
78
Figure 4.29: Market housing completions on developments of up to 10 dwellings by number
of bedrooms (Indicator LOA5)
[For data, see figure A.10, Appendix 2]
Source: Research & Monitoring – Cambridgeshire County Council
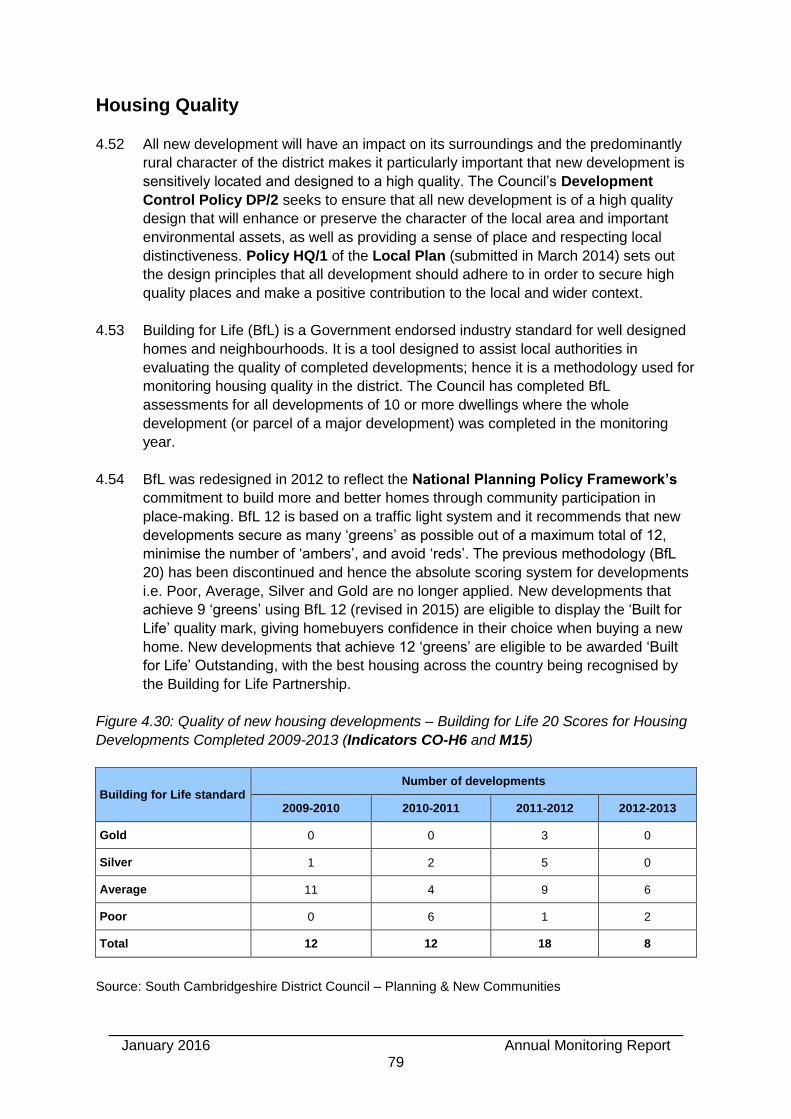
January 2016 Annual Monitoring Report
79
Housing Quality
4.52 All new development will have an impact on its surroundings and the predominantly
rural character of the district makes it particularly important that new development is
sensitively located and designed to a high quality. The Council’s Development
Control Policy DP/2 seeks to ensure that all new development is of a high quality
design that will enhance or preserve the character of the local area and important
environmental assets, as well as providing a sense of place and respecting local
distinctiveness. Policy HQ/1 of the Local Plan (submitted in March 2014) sets out
the design principles that all development should adhere to in order to secure high
quality places and make a positive contribution to the local and wider context.
4.53 Building for Life (BfL) is a Government endorsed industry standard for well designed
homes and neighbourhoods. It is a tool designed to assist local authorities in
evaluating the quality of completed developments; hence it is a methodology used for
monitoring housing quality in the district. The Council has completed BfL
assessments for all developments of 10 or more dwellings where the whole
development (or parcel of a major development) was completed in the monitoring
year.
4.54 BfL was redesigned in 2012 to reflect the National Planning Policy Framework’s
commitment to build more and better homes through community participation in
place-making. BfL 12 is based on a traffic light system and it recommends that new
developments secure as many ‘greens’ as possible out of a maximum total of 12,
minimise the number of ‘ambers’, and avoid ‘reds’. The previous methodology (BfL
20) has been discontinued and hence the absolute scoring system for developments
i.e. Poor, Average, Silver and Gold are no longer applied. New developments that
achieve 9 ‘greens’ using BfL 12 (revised in 2015) are eligible to display the ‘Built for
Life’ quality mark, giving homebuyers confidence in their choice when buying a new
home. New developments that achieve 12 ‘greens’ are eligible to be awarded ‘Built
for Life’ Outstanding, with the best housing across the country being recognised by
the Building for Life Partnership.
Figure 4.30: Quality of new housing developments – Building for Life 20 Scores for Housing
Developments Completed 2009-2013 (Indicators CO-H6 and M15)
Building for Life standard Number of developments
2009-2010 2010-2011 2011-2012 2012-2013
Gold 0 0 3 0
Silver 1 2 5 0
Average 11 4 9 6
Poor 0 6 1 2
Total 12 12 18 8
Source: South Cambridgeshire District Council – Planning & New Communities
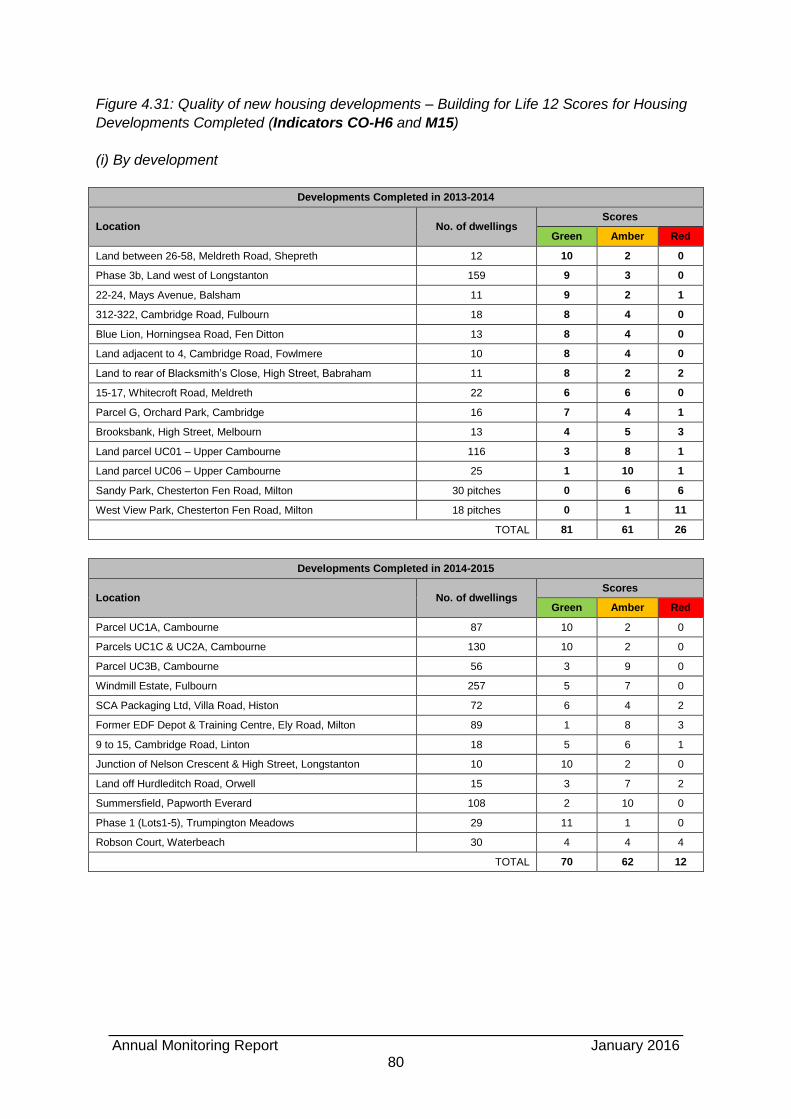
Annual Monitoring Report January 2016
80
Figure 4.31: Quality of new housing developments – Building for Life 12 Scores for Housing
Developments Completed (Indicators CO-H6 and M15)
(i) By development
Developments Completed in 2013-2014
Location No. of dwellings Scores
Green Amber Red
Land between 26-58, Meldreth Road, Shepreth 12 10 2 0
Phase 3b, Land west of Longstanton 159 9 3 0
22-24, Mays Avenue, Balsham 11 9 2 1
312-322, Cambridge Road, Fulbourn 18 8 4 0
Blue Lion, Horningsea Road, Fen Ditton 13 8 4 0
Land adjacent to 4, Cambridge Road, Fowlmere 10 8 4 0
Land to rear of Blacksmith’s Close, High Street, Babraham 11 8 2 2
15-17, Whitecroft Road, Meldreth 22 6 6 0
Parcel G, Orchard Park, Cambridge 16 7 4 1
Brooksbank, High Street, Melbourn 13 4 5 3
Land parcel UC01 – Upper Cambourne 116 3 8 1
Land parcel UC06 – Upper Cambourne 25 1 10 1
Sandy Park, Chesterton Fen Road, Milton 30 pitches 0 6 6
West View Park, Chesterton Fen Road, Milton 18 pitches 0 1 11
TOTAL 81 61 26
Developments Completed in 2014-2015
Location No. of dwellings Scores
Green Amber Red
Parcel UC1A, Cambourne 87 10 2 0
Parcels UC1C & UC2A, Cambourne 130 10 2 0
Parcel UC3B, Cambourne 56 3 9 0
Windmill Estate, Fulbourn 257 5 7 0
SCA Packaging Ltd, Villa Road, Histon 72 6 4 2
Former EDF Depot & Training Centre, Ely Road, Milton 89 1 8 3
9 to 15, Cambridge Road, Linton 18 5 6 1
Junction of Nelson Crescent & High Street, Longstanton 10 10 2 0
Land off Hurdleditch Road, Orwell 15 3 7 2
Summersfield, Papworth Everard 108 2 10 0
Phase 1 (Lots1-5), Trumpington Meadows 29 11 1 0
Robson Court, Waterbeach 30 4 4 4
TOTAL 70 62 12
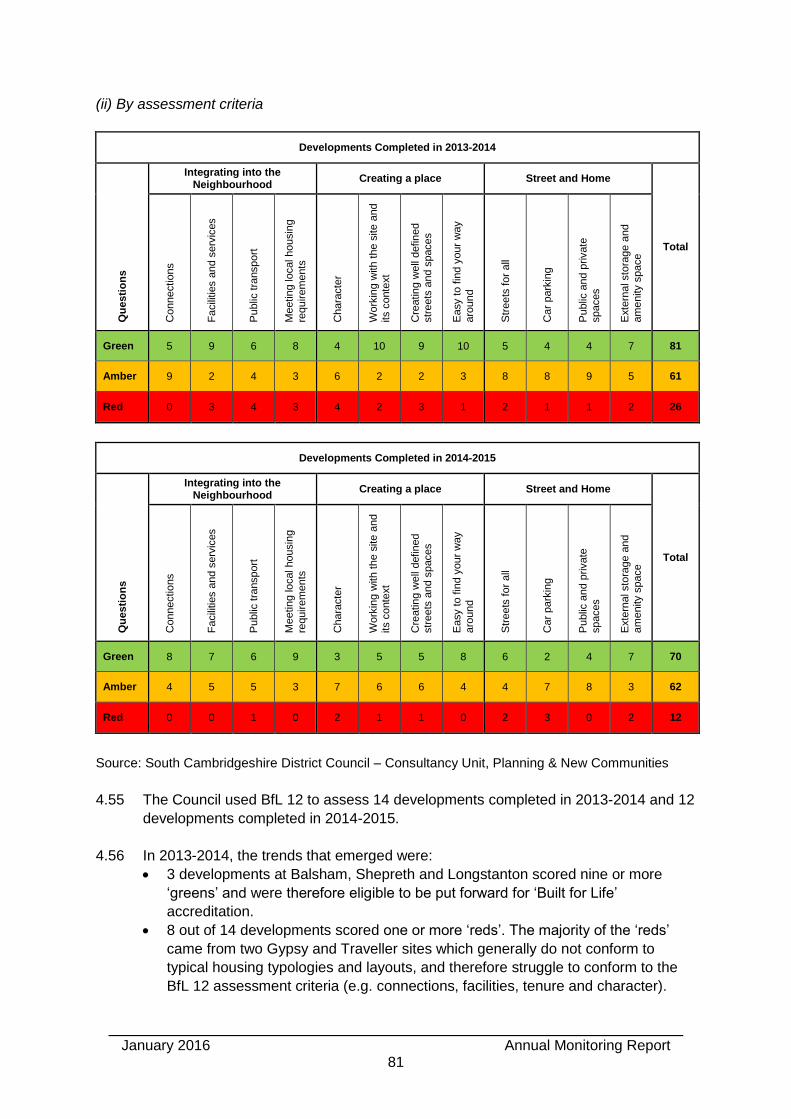
January 2016 Annual Monitoring Report
81
(ii) By assessment criteria
Developments Completed in 2013-2014
Qu
esti
on
s
Integrating into the Neighbourhood
Creating a place Street and Home
Total
Connectio
ns
Fa
cili
ties a
nd s
erv
ices
Public
tra
nsport
Me
etin
g lo
cal housin
g
requirem
ents
Chara
cte
r
Work
ing w
ith t
he s
ite a
nd
its c
onte
xt
Cre
atin
g w
ell
defin
ed
str
eets
and s
paces
Easy to fin
d y
our
way
aro
und
Str
eets
for
all
Car
park
ing
Public
and p
rivate
spaces
Exte
rnal sto
rage a
nd
am
enity s
pace
Green 5 9 6 8 4 10 9 10 5 4 4 7 81
Amber 9 2 4 3 6 2 2 3 8 8 9 5 61
Red 0 3 4 3 4 2 3 1 2 1 1 2 26
Developments Completed in 2014-2015
Qu
esti
on
s
Integrating into the Neighbourhood
Creating a place Street and Home
Total
Connectio
ns
Fa
cili
ties a
nd s
erv
ices
Public
tra
nsport
Me
etin
g lo
cal housin
g
requirem
ents
Chara
cte
r
Work
ing w
ith t
he s
ite a
nd
its c
onte
xt
Cre
atin
g w
ell
defin
ed
str
eets
and s
paces
Easy to fin
d y
our
way
aro
und
Str
eets
for
all
Car
park
ing
Public
and p
rivate
spaces
Exte
rnal sto
rage a
nd
am
enity s
pace
Green 8 7 6 9 3 5 5 8 6 2 4 7 70
Amber 4 5 5 3 7 6 6 4 4 7 8 3 62
Red 0 0 1 0 2 1 1 0 2 3 0 2 12
Source: South Cambridgeshire District Council – Consultancy Unit, Planning & New Communities
4.55 The Council used BfL 12 to assess 14 developments completed in 2013-2014 and 12
developments completed in 2014-2015.
4.56 In 2013-2014, the trends that emerged were:
3 developments at Balsham, Shepreth and Longstanton scored nine or more
‘greens’ and were therefore eligible to be put forward for ‘Built for Life’
accreditation.
8 out of 14 developments scored one or more ‘reds’. The majority of the ‘reds’
came from two Gypsy and Traveller sites which generally do not conform to
typical housing typologies and layouts, and therefore struggle to conform to the
BfL 12 assessment criteria (e.g. connections, facilities, tenure and character).
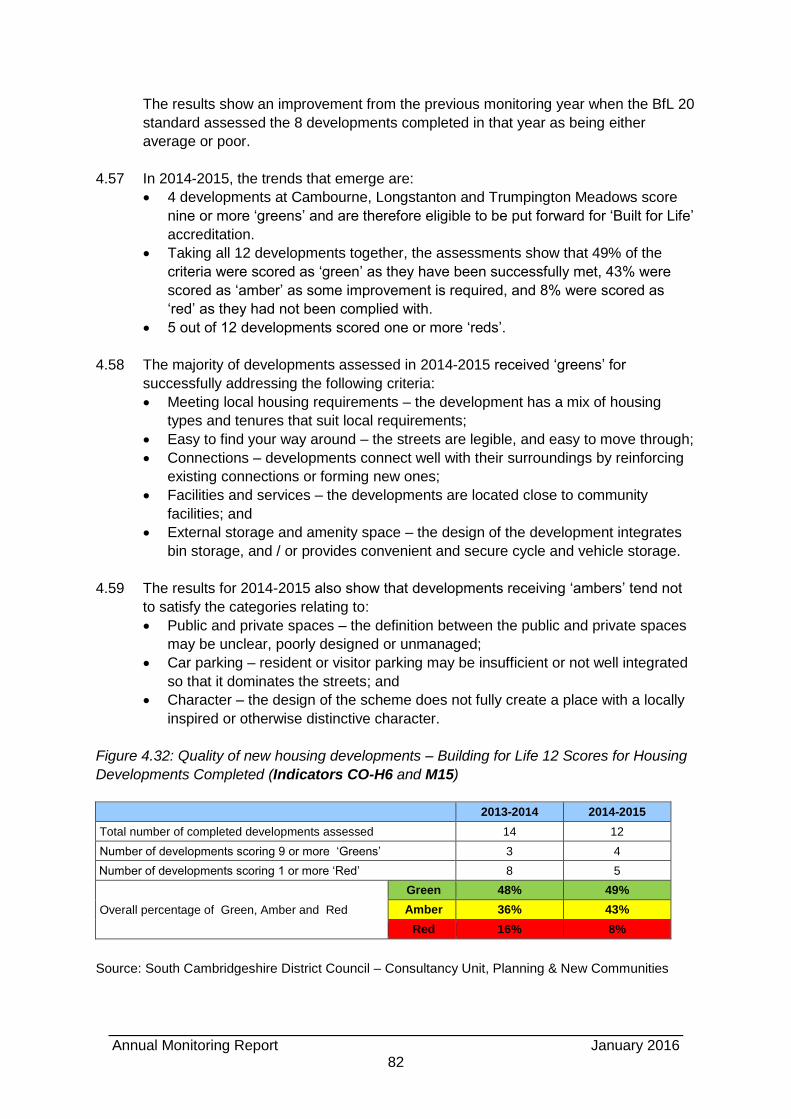
Annual Monitoring Report January 2016
82
The results show an improvement from the previous monitoring year when the BfL 20
standard assessed the 8 developments completed in that year as being either
average or poor.
4.57 In 2014-2015, the trends that emerge are:
4 developments at Cambourne, Longstanton and Trumpington Meadows score
nine or more ‘greens’ and are therefore eligible to be put forward for ‘Built for Life’
accreditation.
Taking all 12 developments together, the assessments show that 49% of the
criteria were scored as ‘green’ as they have been successfully met, 43% were
scored as ‘amber’ as some improvement is required, and 8% were scored as
‘red’ as they had not been complied with.
5 out of 12 developments scored one or more ‘reds’.
4.58 The majority of developments assessed in 2014-2015 received ‘greens’ for
successfully addressing the following criteria:
Meeting local housing requirements – the development has a mix of housing
types and tenures that suit local requirements;
Easy to find your way around – the streets are legible, and easy to move through;
Connections – developments connect well with their surroundings by reinforcing
existing connections or forming new ones;
Facilities and services – the developments are located close to community
facilities; and
External storage and amenity space – the design of the development integrates
bin storage, and / or provides convenient and secure cycle and vehicle storage.
4.59 The results for 2014-2015 also show that developments receiving ‘ambers’ tend not
to satisfy the categories relating to:
Public and private spaces – the definition between the public and private spaces
may be unclear, poorly designed or unmanaged;
Car parking – resident or visitor parking may be insufficient or not well integrated
so that it dominates the streets; and
Character – the design of the scheme does not fully create a place with a locally
inspired or otherwise distinctive character.
Figure 4.32: Quality of new housing developments – Building for Life 12 Scores for Housing
Developments Completed (Indicators CO-H6 and M15)
2013-2014 2014-2015
Total number of completed developments assessed 14 12
Number of developments scoring 9 or more ‘Greens’ 3 4
Number of developments scoring 1 or more ‘Red’ 8 5
Overall percentage of Green, Amber and Red
Green 48% 49%
Amber 36% 43%
Red 16% 8%
Source: South Cambridgeshire District Council – Consultancy Unit, Planning & New Communities
January 2016 Annual Monitoring Report
83
4.60 There has been an improvement on the overall quality of development in the district
between 2013-2014 and 2014-2015. The percentage of schemes scoring nine or
more ‘greens’ has increased and the percentage of developments scoring one or
more ‘reds’ has decreased. Four developments are eligible to be put forward for the
‘Built for Life’ accreditation as they have scored nine or more ‘greens’. There has also
been a slight increase in the overall percentage of ‘greens’ and a significant reduction
in the percentage of ‘reds’.
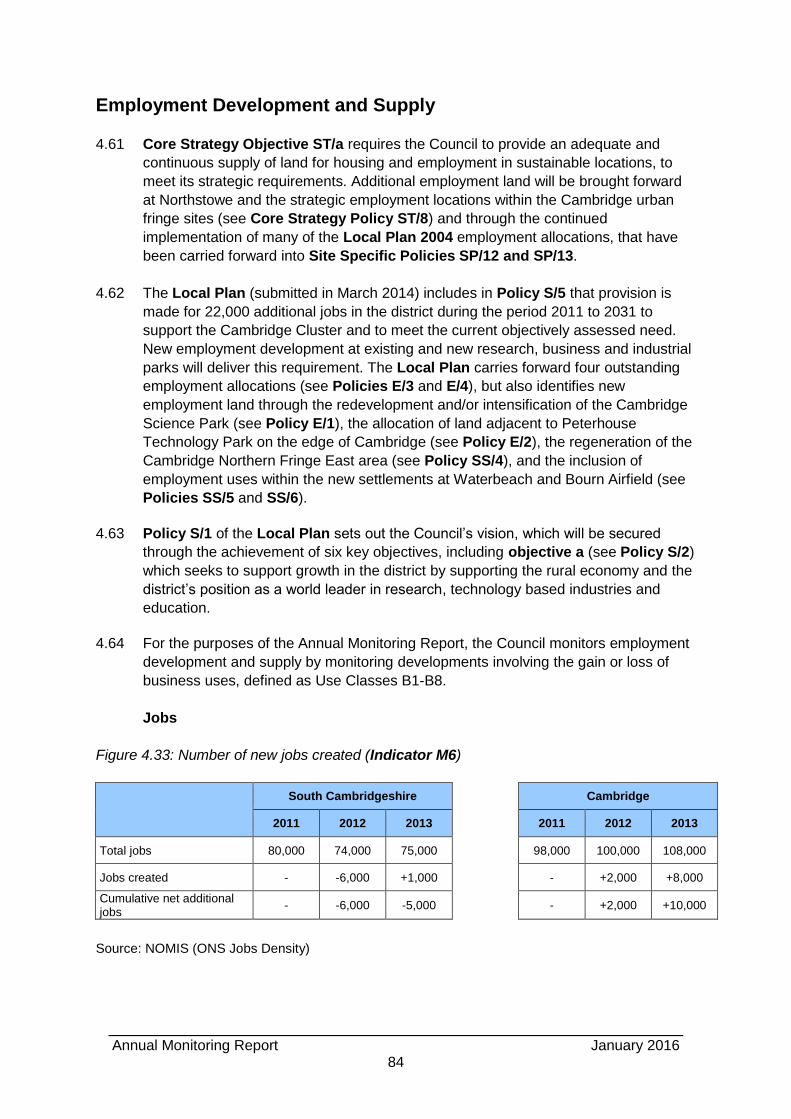
Annual Monitoring Report January 2016
84
Employment Development and Supply
4.61 Core Strategy Objective ST/a requires the Council to provide an adequate and
continuous supply of land for housing and employment in sustainable locations, to
meet its strategic requirements. Additional employment land will be brought forward
at Northstowe and the strategic employment locations within the Cambridge urban
fringe sites (see Core Strategy Policy ST/8) and through the continued
implementation of many of the Local Plan 2004 employment allocations, that have
been carried forward into Site Specific Policies SP/12 and SP/13.
4.62 The Local Plan (submitted in March 2014) includes in Policy S/5 that provision is
made for 22,000 additional jobs in the district during the period 2011 to 2031 to
support the Cambridge Cluster and to meet the current objectively assessed need.
New employment development at existing and new research, business and industrial
parks will deliver this requirement. The Local Plan carries forward four outstanding
employment allocations (see Policies E/3 and E/4), but also identifies new
employment land through the redevelopment and/or intensification of the Cambridge
Science Park (see Policy E/1), the allocation of land adjacent to Peterhouse
Technology Park on the edge of Cambridge (see Policy E/2), the regeneration of the
Cambridge Northern Fringe East area (see Policy SS/4), and the inclusion of
employment uses within the new settlements at Waterbeach and Bourn Airfield (see
Policies SS/5 and SS/6).
4.63 Policy S/1 of the Local Plan sets out the Council’s vision, which will be secured
through the achievement of six key objectives, including objective a (see Policy S/2)
which seeks to support growth in the district by supporting the rural economy and the
district’s position as a world leader in research, technology based industries and
education.
4.64 For the purposes of the Annual Monitoring Report, the Council monitors employment
development and supply by monitoring developments involving the gain or loss of
business uses, defined as Use Classes B1-B8.
Jobs
Figure 4.33: Number of new jobs created (Indicator M6)
South Cambridgeshire Cambridge
2011 2012 2013 2011 2012 2013
Total jobs 80,000 74,000 75,000 98,000 100,000 108,000
Jobs created - -6,000 +1,000 - +2,000 +8,000
Cumulative net additional jobs
- -6,000 -5,000 - +2,000 +10,000
Source: NOMIS (ONS Jobs Density)
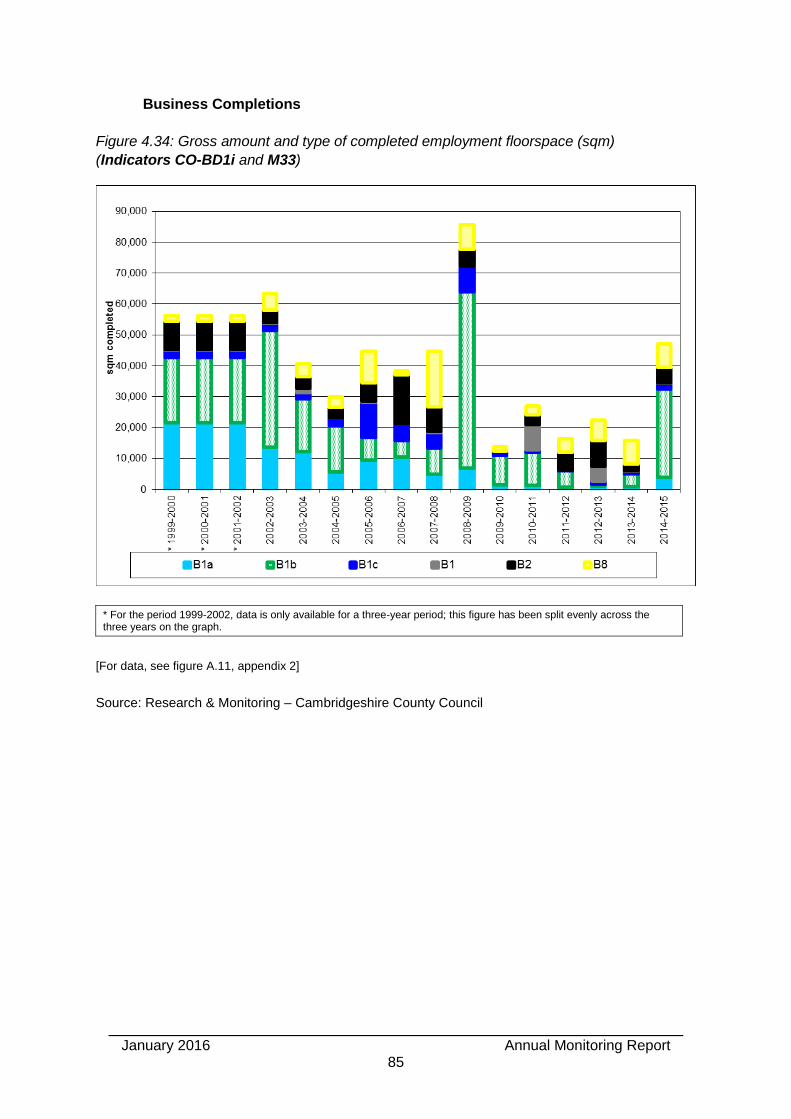
January 2016 Annual Monitoring Report
85
Business Completions
Figure 4.34: Gross amount and type of completed employment floorspace (sqm)
(Indicators CO-BD1i and M33)
* For the period 1999-2002, data is only available for a three-year period; this figure has been split evenly across the three years on the graph.
[For data, see figure A.11, appendix 2]
Source: Research & Monitoring – Cambridgeshire County Council

Annual Monitoring Report January 2016
86
Figure 4.35: Gross amount and type of completed employment land (ha) (Indicators
LOA10i and M33)
[For data, see figure A.12, appendix 2]
Source: Research & Monitoring – Cambridgeshire County Council
Figure 4.36: Net amount and type of completed employment floorspace (sqm) (Indicator
CO-BD1ii and M33)
B1 B1a B1b B1c B2 B8 TOTAL
1999-2002 28 64,666 63,182 630 20,483 -6,157 142,832
2002-2003 320 13,111 37,890 -11,629 -3,947 4,539 40,284
2003-2004 1,328 10,935 16,451 -330 2,216 4,166 34,766
2004-2005 0 5,285 3,428 1,119 1,807 -168 11,471
2005-2006 448 6,761 4,315 10,182 2,473 8,891 33,070
2006-2007 0 9,384 -814 3,660 10,366 -112 22,484
2007-2008 -188 3,833 3,877 3,934 6,642 12,729 30,827
2008-2009 64 5,011 51,626 3,030 1,149 6,389 67,269
2009-2010 -112 783 8,371 266 -47,881 792 -37,781
2010-2011 8,141 627 -1,713 -2,114 2,356 1,183 8,480
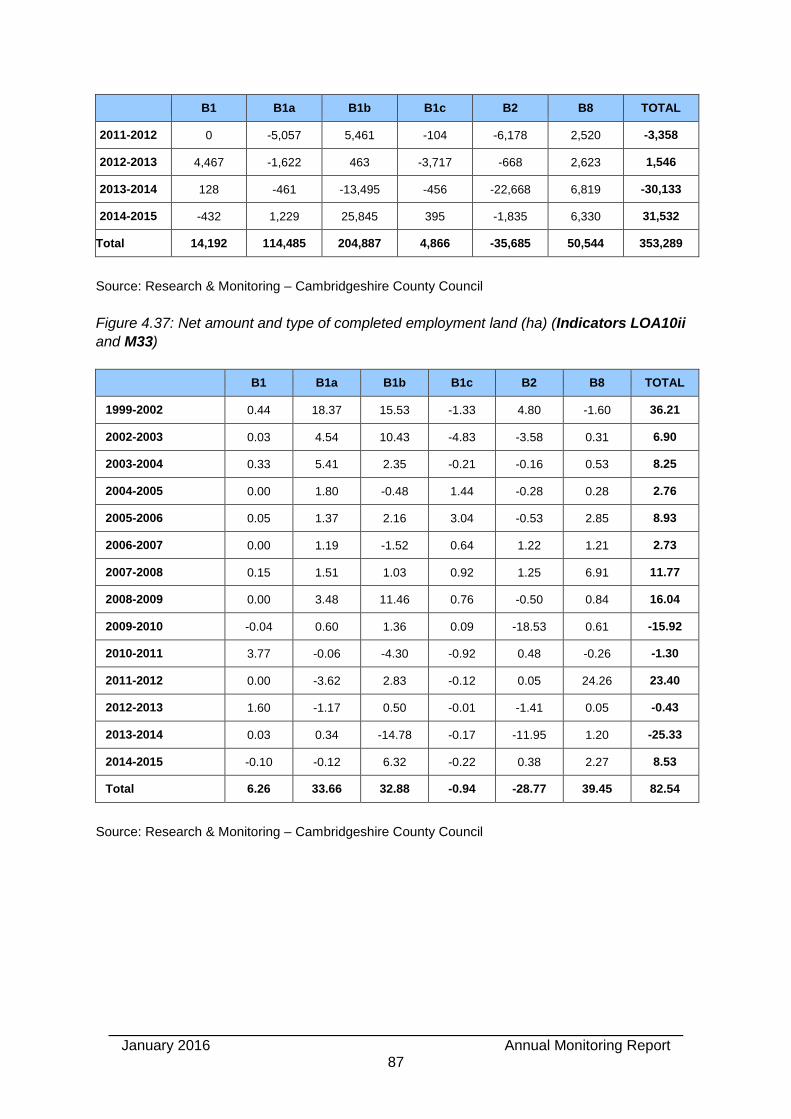
January 2016 Annual Monitoring Report
87
B1 B1a B1b B1c B2 B8 TOTAL
2011-2012 0 -5,057 5,461 -104 -6,178 2,520 -3,358
2012-2013 4,467 -1,622 463 -3,717 -668 2,623 1,546
2013-2014 128 -461 -13,495 -456 -22,668 6,819 -30,133
2014-2015 -432 1,229 25,845 395 -1,835 6,330 31,532
Total 14,192 114,485 204,887 4,866 -35,685 50,544 353,289
Source: Research & Monitoring – Cambridgeshire County Council
Figure 4.37: Net amount and type of completed employment land (ha) (Indicators LOA10ii
and M33)
B1 B1a B1b B1c B2 B8 TOTAL
1999-2002 0.44 18.37 15.53 -1.33 4.80 -1.60 36.21
2002-2003 0.03 4.54 10.43 -4.83 -3.58 0.31 6.90
2003-2004 0.33 5.41 2.35 -0.21 -0.16 0.53 8.25
2004-2005 0.00 1.80 -0.48 1.44 -0.28 0.28 2.76
2005-2006 0.05 1.37 2.16 3.04 -0.53 2.85 8.93
2006-2007 0.00 1.19 -1.52 0.64 1.22 1.21 2.73
2007-2008 0.15 1.51 1.03 0.92 1.25 6.91 11.77
2008-2009 0.00 3.48 11.46 0.76 -0.50 0.84 16.04
2009-2010 -0.04 0.60 1.36 0.09 -18.53 0.61 -15.92
2010-2011 3.77 -0.06 -4.30 -0.92 0.48 -0.26 -1.30
2011-2012 0.00 -3.62 2.83 -0.12 0.05 24.26 23.40
2012-2013 1.60 -1.17 0.50 -0.01 -1.41 0.05 -0.43
2013-2014 0.03 0.34 -14.78 -0.17 -11.95 1.20 -25.33
2014-2015 -0.10 -0.12 6.32 -0.22 0.38 2.27 8.53
Total 6.26 33.66 32.88 -0.94 -28.77 39.45 82.54
Source: Research & Monitoring – Cambridgeshire County Council
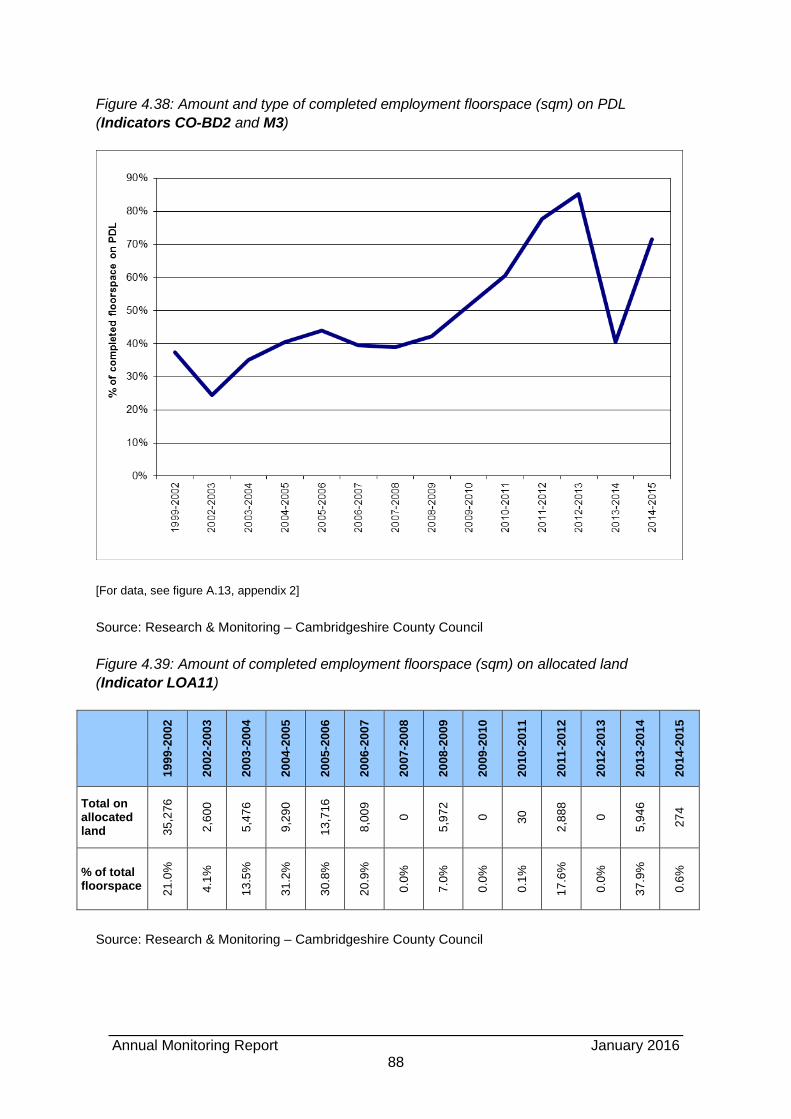
Annual Monitoring Report January 2016
88
Figure 4.38: Amount and type of completed employment floorspace (sqm) on PDL
(Indicators CO-BD2 and M3)
[For data, see figure A.13, appendix 2]
Source: Research & Monitoring – Cambridgeshire County Council
Figure 4.39: Amount of completed employment floorspace (sqm) on allocated land
(Indicator LOA11)
19
99
-20
02
20
02
-20
03
20
03
-20
04
20
04
-20
05
20
05
-20
06
20
06
-20
07
20
07
-20
08
20
08
-20
09
20
09
-20
10
20
10
-20
11
20
11
-20
12
20
12
-20
13
20
13
-20
14
20
14
-20
15
Total on allocated land 3
5,2
76
2,6
00
5,4
76
9,2
90
13
,716
8,0
09
0
5,9
72
0
30
2,8
88
0
5,9
46
27
4
% of total floorspace
21
.0%
4.1
%
13
.5%
31
.2%
30
.8%
20
.9%
0.0
%
7.0
%
0.0
%
0.1
%
17
.6%
0.0
%
37
.9%
0.6
%
Source: Research & Monitoring – Cambridgeshire County Council

January 2016 Annual Monitoring Report
89
Figure 4.40: Development at Employment Allocations identified in Policies SP/12 and SP/13
of the Site Specific Policies DPD as at 31 March 2015 (Indicators SSLO5 and SSLO6)
Summary of Development Progress
Development at sites allocated for B1 employment use (SP/12)
North of Hatton’s Road, Longstanton – the site had reserved matters planning permission, however this planning permission and the outline planning permission for the whole mixed-use development west of Longstanton have both now lapsed. West of Eastern Counties Leather, Pampisford – the southern part of the site has outline planning permission (S/1061/07 & S/1363/10).
Development at sites allocated for B1 / B2 / B8 employment use (SP/13)
Norman Way, Over – the site has no current planning permissions. Papworth Business Park – the last remaining parcel has planning permission for a warehouse with ancillary office use (S/1079/13). Phase 1 of this development has been completed and phase 2 is outstanding. Temporary planning permission (S/0588/14) was granted in October 2014 allowing the land identified for phase 2 to be used as a temporary car park for Papworth Hospital.
Business Commitments
Figure 4.41: Gross amount and type of employment land (ha) available with planning
permission at 31 March 2015 (Indicators CO-BD3i and M34)
[For data, see figure A.14, appendix 2]
Source: Research & Monitoring – Cambridgeshire County Council
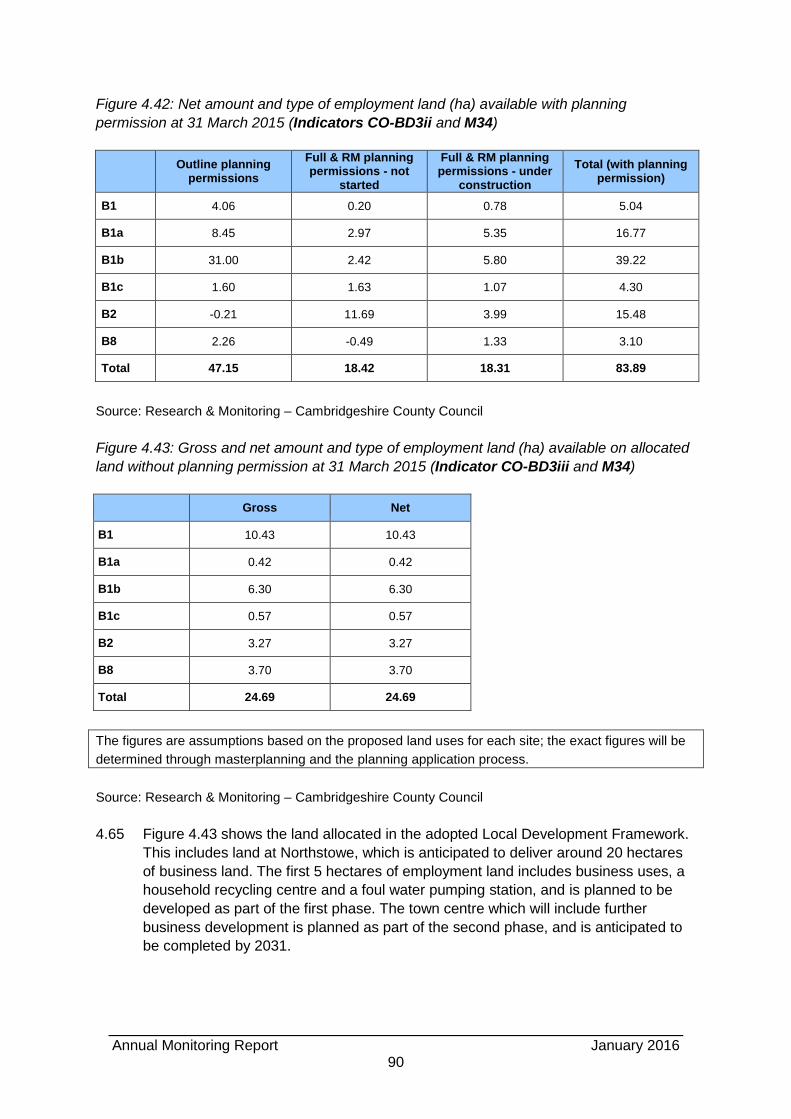
Annual Monitoring Report January 2016
90
Figure 4.42: Net amount and type of employment land (ha) available with planning
permission at 31 March 2015 (Indicators CO-BD3ii and M34)
Outline planning
permissions
Full & RM planning permissions - not
started
Full & RM planning permissions - under
construction
Total (with planning permission)
B1 4.06 0.20 0.78 5.04
B1a 8.45 2.97 5.35 16.77
B1b 31.00 2.42 5.80 39.22
B1c 1.60 1.63 1.07 4.30
B2 -0.21 11.69 3.99 15.48
B8 2.26 -0.49 1.33 3.10
Total 47.15 18.42 18.31 83.89
Source: Research & Monitoring – Cambridgeshire County Council
Figure 4.43: Gross and net amount and type of employment land (ha) available on allocated
land without planning permission at 31 March 2015 (Indicator CO-BD3iii and M34)
Gross Net
B1 10.43 10.43
B1a 0.42 0.42
B1b 6.30 6.30
B1c 0.57 0.57
B2 3.27 3.27
B8 3.70 3.70
Total 24.69 24.69
The figures are assumptions based on the proposed land uses for each site; the exact figures will be
determined through masterplanning and the planning application process.
Source: Research & Monitoring – Cambridgeshire County Council
4.65 Figure 4.43 shows the land allocated in the adopted Local Development Framework.
This includes land at Northstowe, which is anticipated to deliver around 20 hectares
of business land. The first 5 hectares of employment land includes business uses, a
household recycling centre and a foul water pumping station, and is planned to be
developed as part of the first phase. The town centre which will include further
business development is planned as part of the second phase, and is anticipated to
be completed by 2031.
January 2016 Annual Monitoring Report
91
4.66 A number of new employment developments are included in the Local Plan
(submitted in March 2014). Figure 4.43 does not include these sites. The sites are:
Cambridge Northern Fringe East: the Cambridge and South Cambridgeshire
Local Plans identify Cambridge Northern Fringe East as an area with potential for
mixed use employment led development. A joint Area Action Plan is being
prepared. Four redevelopment options for the area have been identified ranging
from a low level of development to more comprehensive redevelopment options,
and these were included in the Issues & Options Report that has been subject to
public consultation. The area includes the proposed new railway station. The
Chesterton Sidings area provides an opportunity for additional employment
development.
Cambridge Science Park: this site has played an important role in supporting
the research and development and high tech sectors since the 1970’s. Its
accessibility has been significantly enhanced by the Guided Bus and the planned
Science Park Station. Early parts of the site were built at low densities and were
built forty years ago. The Local Plan identifies the opportunity for their
redevelopment and densification, to make better use of the site. The Cambridge
Northern Fringe East – Employment Guidance for the Area Action Plan – Sector
Profile (October 2014) estimates potential for an additional 60,000 sqm to be
provided over the next 15-20 years.
Waterbeach New Town: the policy for the new town requires appropriate
employment provision to meet the needs of the town, provide access to local jobs
and support the continued development of the economy of the Cambridge area. It
is not specific regarding the quantity of employment land, as that would be
determined in more detail through preparation of an Area Action Plan.
Bourn Airfield New Village: in addition to employment opportunities from the
redevelopment of the 9 hectare former Thyssen Krupp site which adjoins the new
village site, the new village will incorporate employment opportunities, to be
identified through the preparation of an Area Action Plan.
Cambourne West: the policy for a fourth linked village at Cambourne seeks to
relocate the amount of employment land currently remaining undeveloped on the
southern side of the business park within the new Cambourne West site. The net
impact on the land that currently has planning permission is assumed as neutral
at this stage.
Fulbourn Road (Fulbourn / Edge of Cambridge): a site adjoining the
Peterhouse Technology Park was identified for 6.9 hectares of additional
employment development in the Local Plan (submitted in March 2014). An
independent review of the Green Belt44, undertaken in response to the Inspectors
initial findings, has concluded that a smaller site would be more appropriate in
terms of Green Belt impact and therefore the Council has included a proposed
44
Cambridge Inner Green Belt Boundary Study: https://www.scambs.gov.uk/localplanmods-dec2015
Annual Monitoring Report January 2016
92
modification45 to Policy E/2, which is currently subject to public consultation, to
reduce the size of the site to 4.3 hectares.
Land south of Cambridge Biomedical Campus (Edge of Cambridge): the
independent review of the Green Belt, undertaken in response to the Inspectors
initial findings, concluded that this area of land could be released from the Green
Belt without significant harm to its purposes. The Council has undertaken an
assessment of the site and consider that it is suitable for development for
employment use, subject to further modelling work being carried out to assess
surface water flood risk in this area. The Council has included a provisional
modification46 to allocate this site for employment uses in the public consultation
being undertaken jointly with Cambridge City Council on Proposed Modifications
to the Local Plans.
4.67 The Local Plan (submitted in March 2014) identifies two industrial estates for partial
redevelopment. Both sites will still provide some employment land. The sites are:
Dales Manor Business Park, Sawston: an area of 1.5 hectares bound by East
Way, Middle Way and Grove Road will be developed for B1 uses. The remainder
of site, 9 hectares of B2/B8 uses and vacant land, will be lost to residential.
Green End Industrial Estate, Gamlingay: the site is 4.09 hectares of mixed
B1/B2/B8, which is proposed for residential led development. The Local Plan
requires redevelopment to provide 25% employment land, therefore resulting in a
loss of around 3 hectares.
45
Cambridge and South Cambridgeshire Modifications Consultation Report: https://www.scambs.gov.uk/sites/default/files/final_mods_consultation_document_website_8.12.15.pdf 46
Cambridge and South Cambridgeshire Modifications Consultation Report: https://www.scambs.gov.uk/sites/default/files/final_mods_consultation_document_website_8.12.15.pdf
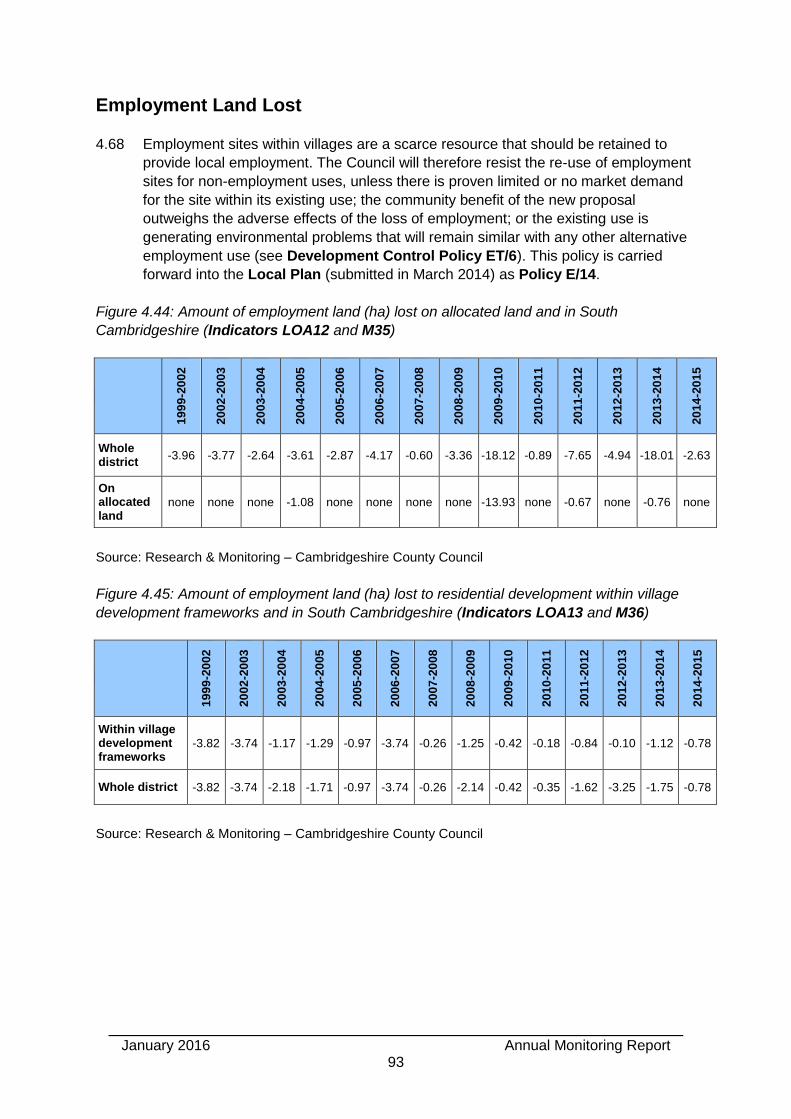
January 2016 Annual Monitoring Report
93
Employment Land Lost
4.68 Employment sites within villages are a scarce resource that should be retained to
provide local employment. The Council will therefore resist the re-use of employment
sites for non-employment uses, unless there is proven limited or no market demand
for the site within its existing use; the community benefit of the new proposal
outweighs the adverse effects of the loss of employment; or the existing use is
generating environmental problems that will remain similar with any other alternative
employment use (see Development Control Policy ET/6). This policy is carried
forward into the Local Plan (submitted in March 2014) as Policy E/14.
Figure 4.44: Amount of employment land (ha) lost on allocated land and in South
Cambridgeshire (Indicators LOA12 and M35)
19
99
-20
02
20
02
-20
03
20
03
-20
04
20
04
-20
05
20
05
-20
06
20
06
-20
07
20
07
-20
08
20
08
-20
09
20
09
-20
10
20
10
-20
11
20
11
-20
12
20
12
-20
13
20
13
-20
14
20
14
-20
15
Whole district
-3.96 -3.77 -2.64 -3.61 -2.87 -4.17 -0.60 -3.36 -18.12 -0.89 -7.65 -4.94 -18.01 -2.63
On allocated land
none none none -1.08 none none none none -13.93 none -0.67 none -0.76 none
Source: Research & Monitoring – Cambridgeshire County Council
Figure 4.45: Amount of employment land (ha) lost to residential development within village
development frameworks and in South Cambridgeshire (Indicators LOA13 and M36)
19
99
-20
02
20
02
-20
03
20
03
-20
04
20
04
-20
05
20
05
-20
06
20
06
-20
07
20
07
-20
08
20
08
-20
09
20
09
-20
10
20
10
-20
11
20
11
-20
12
20
12
-20
13
20
13
-20
14
20
14
-20
15
Within village development frameworks
-3.82 -3.74 -1.17 -1.29 -0.97 -3.74 -0.26 -1.25 -0.42 -0.18 -0.84 -0.10 -1.12 -0.78
Whole district -3.82 -3.74 -2.18 -1.71 -0.97 -3.74 -0.26 -2.14 -0.42 -0.35 -1.62 -3.25 -1.75 -0.78
Source: Research & Monitoring – Cambridgeshire County Council
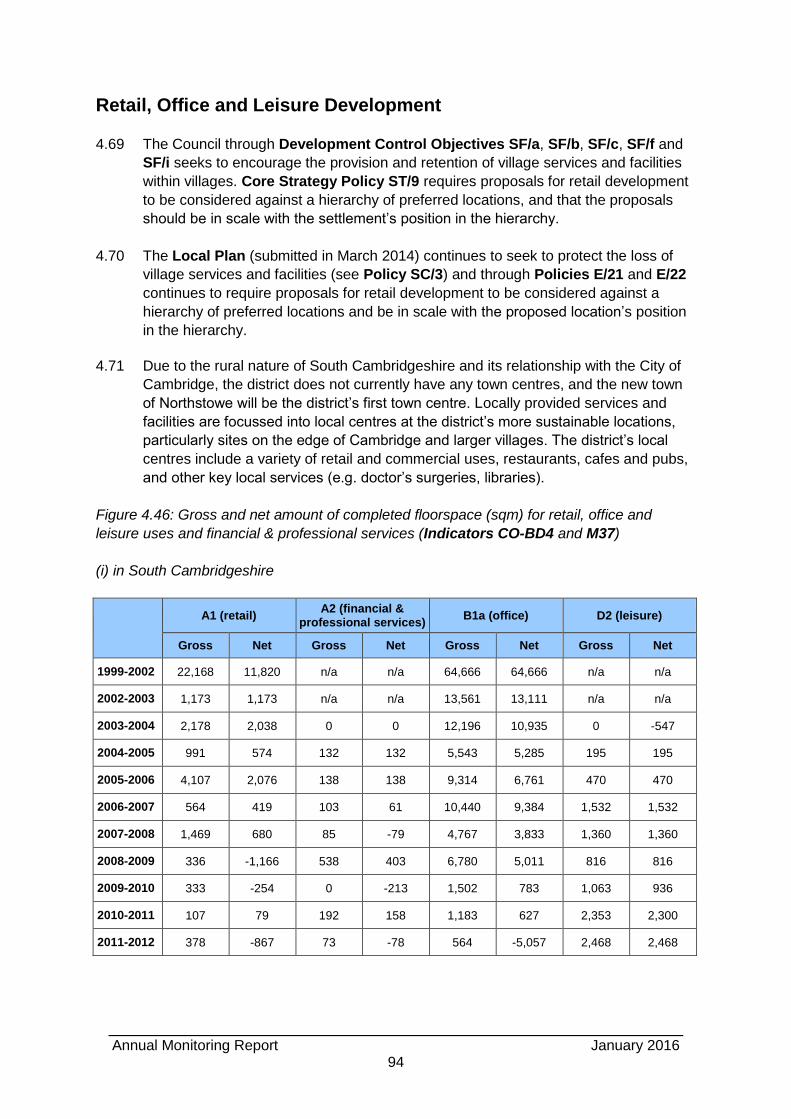
Annual Monitoring Report January 2016
94
Retail, Office and Leisure Development
4.69 The Council through Development Control Objectives SF/a, SF/b, SF/c, SF/f and
SF/i seeks to encourage the provision and retention of village services and facilities
within villages. Core Strategy Policy ST/9 requires proposals for retail development
to be considered against a hierarchy of preferred locations, and that the proposals
should be in scale with the settlement’s position in the hierarchy.
4.70 The Local Plan (submitted in March 2014) continues to seek to protect the loss of
village services and facilities (see Policy SC/3) and through Policies E/21 and E/22
continues to require proposals for retail development to be considered against a
hierarchy of preferred locations and be in scale with the proposed location’s position
in the hierarchy.
4.71 Due to the rural nature of South Cambridgeshire and its relationship with the City of
Cambridge, the district does not currently have any town centres, and the new town
of Northstowe will be the district’s first town centre. Locally provided services and
facilities are focussed into local centres at the district’s more sustainable locations,
particularly sites on the edge of Cambridge and larger villages. The district’s local
centres include a variety of retail and commercial uses, restaurants, cafes and pubs,
and other key local services (e.g. doctor’s surgeries, libraries).
Figure 4.46: Gross and net amount of completed floorspace (sqm) for retail, office and
leisure uses and financial & professional services (Indicators CO-BD4 and M37)
(i) in South Cambridgeshire
A1 (retail) A2 (financial &
professional services) B1a (office) D2 (leisure)
Gross Net Gross Net Gross Net Gross Net
1999-2002 22,168 11,820 n/a n/a 64,666 64,666 n/a n/a
2002-2003 1,173 1,173 n/a n/a 13,561 13,111 n/a n/a
2003-2004 2,178 2,038 0 0 12,196 10,935 0 -547
2004-2005 991 574 132 132 5,543 5,285 195 195
2005-2006 4,107 2,076 138 138 9,314 6,761 470 470
2006-2007 564 419 103 61 10,440 9,384 1,532 1,532
2007-2008 1,469 680 85 -79 4,767 3,833 1,360 1,360
2008-2009 336 -1,166 538 403 6,780 5,011 816 816
2009-2010 333 -254 0 -213 1,502 783 1,063 936
2010-2011 107 79 192 158 1,183 627 2,353 2,300
2011-2012 378 -867 73 -78 564 -5,057 2,468 2,468
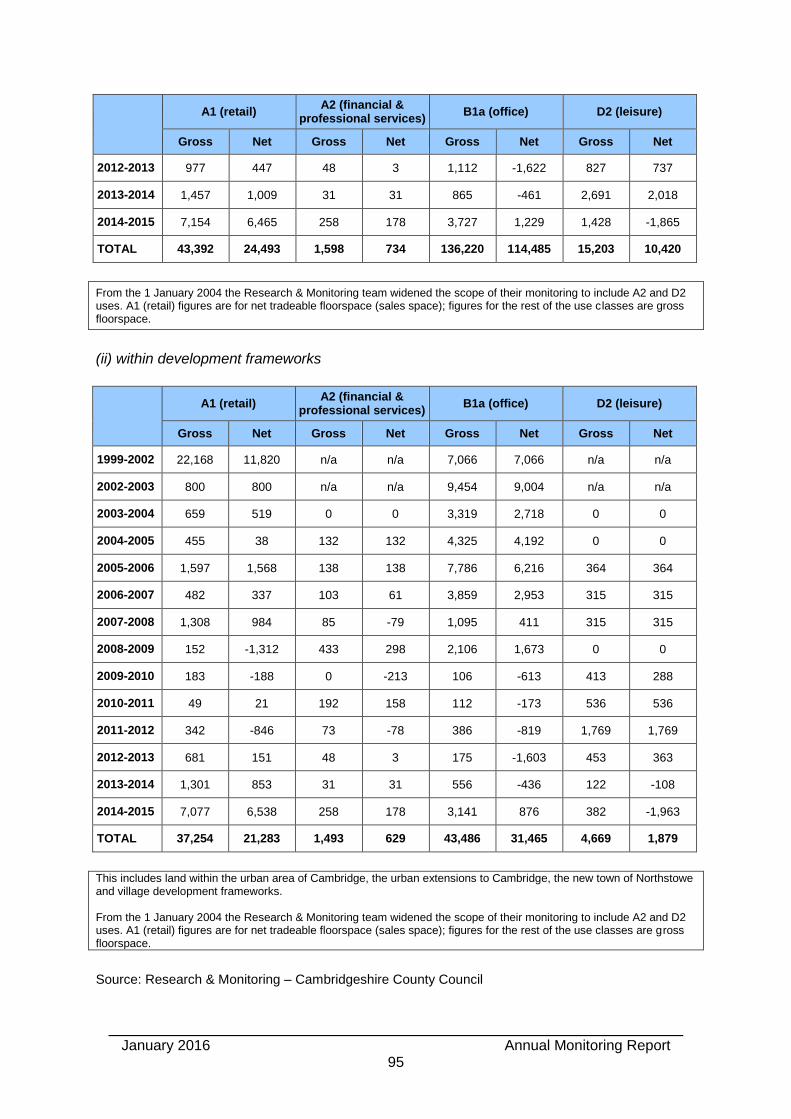
January 2016 Annual Monitoring Report
95
A1 (retail) A2 (financial &
professional services) B1a (office) D2 (leisure)
Gross Net Gross Net Gross Net Gross Net
2012-2013 977 447 48 3 1,112 -1,622 827 737
2013-2014 1,457 1,009 31 31 865 -461 2,691 2,018
2014-2015 7,154 6,465 258 178 3,727 1,229 1,428 -1,865
TOTAL 43,392 24,493 1,598 734 136,220 114,485 15,203 10,420
From the 1 January 2004 the Research & Monitoring team widened the scope of their monitoring to include A2 and D2 uses. A1 (retail) figures are for net tradeable floorspace (sales space); figures for the rest of the use classes are gross floorspace.
(ii) within development frameworks
A1 (retail) A2 (financial &
professional services) B1a (office) D2 (leisure)
Gross Net Gross Net Gross Net Gross Net
1999-2002 22,168 11,820 n/a n/a 7,066 7,066 n/a n/a
2002-2003 800 800 n/a n/a 9,454 9,004 n/a n/a
2003-2004 659 519 0 0 3,319 2,718 0 0
2004-2005 455 38 132 132 4,325 4,192 0 0
2005-2006 1,597 1,568 138 138 7,786 6,216 364 364
2006-2007 482 337 103 61 3,859 2,953 315 315
2007-2008 1,308 984 85 -79 1,095 411 315 315
2008-2009 152 -1,312 433 298 2,106 1,673 0 0
2009-2010 183 -188 0 -213 106 -613 413 288
2010-2011 49 21 192 158 112 -173 536 536
2011-2012 342 -846 73 -78 386 -819 1,769 1,769
2012-2013 681 151 48 3 175 -1,603 453 363
2013-2014 1,301 853 31 31 556 -436 122 -108
2014-2015 7,077 6,538 258 178 3,141 876 382 -1,963
TOTAL 37,254 21,283 1,493 629 43,486 31,465 4,669 1,879
This includes land within the urban area of Cambridge, the urban extensions to Cambridge, the new town of Northstowe and village development frameworks. From the 1 January 2004 the Research & Monitoring team widened the scope of their monitoring to include A2 and D2 uses. A1 (retail) figures are for net tradeable floorspace (sales space); figures for the rest of the use classes are gross floorspace.
Source: Research & Monitoring – Cambridgeshire County Council
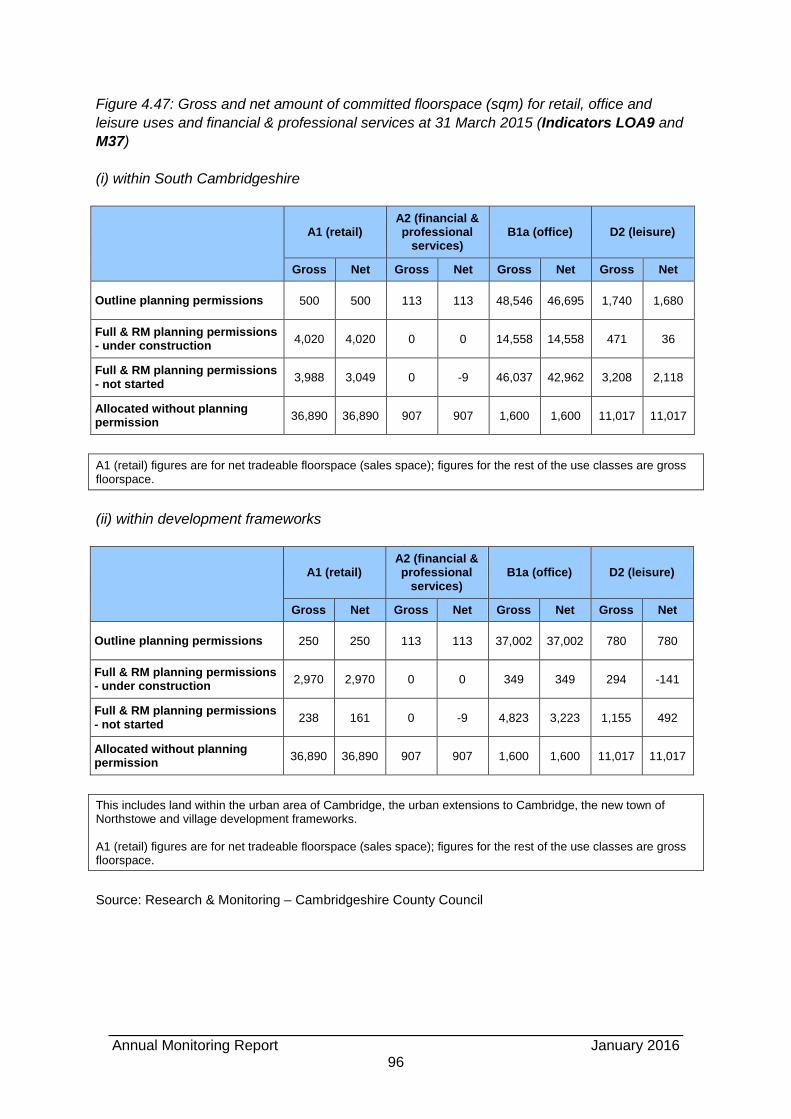
Annual Monitoring Report January 2016
96
Figure 4.47: Gross and net amount of committed floorspace (sqm) for retail, office and
leisure uses and financial & professional services at 31 March 2015 (Indicators LOA9 and
M37)
(i) within South Cambridgeshire
A1 (retail)
A2 (financial & professional
services) B1a (office) D2 (leisure)
Gross Net Gross Net Gross Net Gross Net
Outline planning permissions 500 500 113 113 48,546 46,695 1,740 1,680
Full & RM planning permissions - under construction
4,020 4,020 0 0 14,558 14,558 471 36
Full & RM planning permissions - not started
3,988 3,049 0 -9 46,037 42,962 3,208 2,118
Allocated without planning permission
36,890 36,890 907 907 1,600 1,600 11,017 11,017
A1 (retail) figures are for net tradeable floorspace (sales space); figures for the rest of the use classes are gross floorspace.
(ii) within development frameworks
A1 (retail)
A2 (financial & professional
services) B1a (office) D2 (leisure)
Gross Net Gross Net Gross Net Gross Net
Outline planning permissions 250 250 113 113 37,002 37,002 780 780
Full & RM planning permissions - under construction
2,970 2,970 0 0 349 349 294 -141
Full & RM planning permissions - not started
238 161 0 -9 4,823 3,223 1,155 492
Allocated without planning permission
36,890 36,890 907 907 1,600 1,600 11,017 11,017
This includes land within the urban area of Cambridge, the urban extensions to Cambridge, the new town of Northstowe and village development frameworks. A1 (retail) figures are for net tradeable floorspace (sales space); figures for the rest of the use classes are gross floorspace.
Source: Research & Monitoring – Cambridgeshire County Council
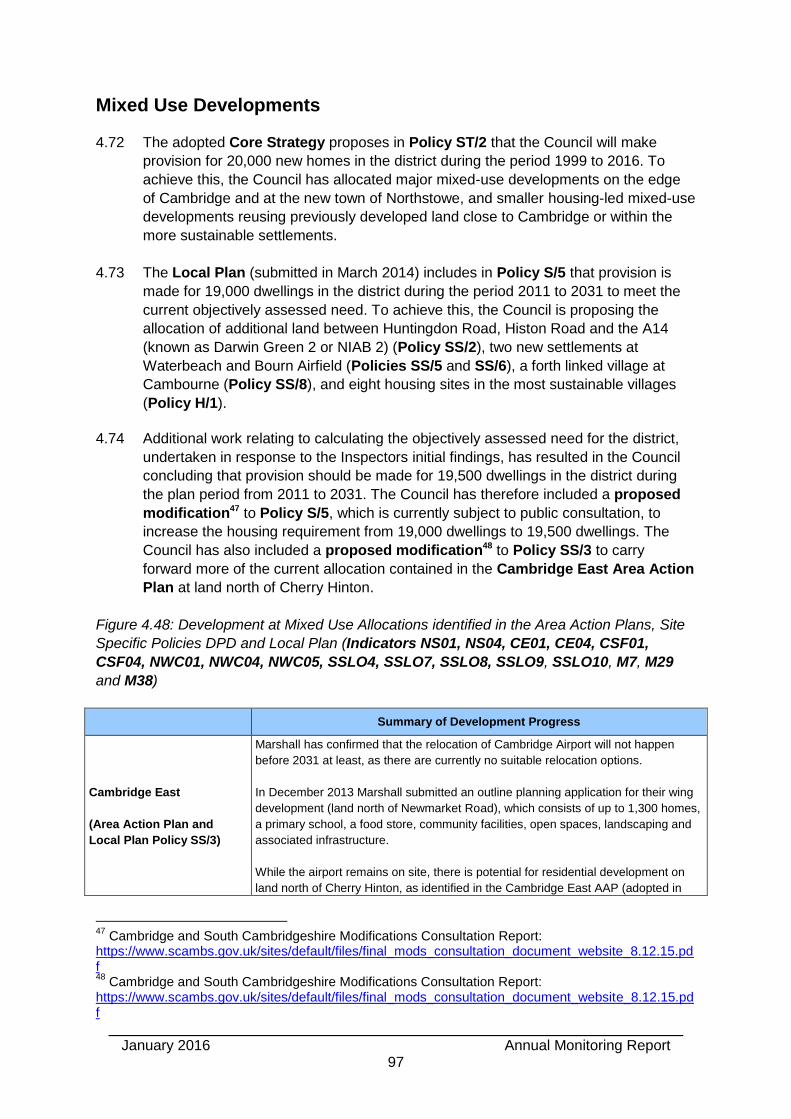
January 2016 Annual Monitoring Report
97
Mixed Use Developments
4.72 The adopted Core Strategy proposes in Policy ST/2 that the Council will make
provision for 20,000 new homes in the district during the period 1999 to 2016. To
achieve this, the Council has allocated major mixed-use developments on the edge
of Cambridge and at the new town of Northstowe, and smaller housing-led mixed-use
developments reusing previously developed land close to Cambridge or within the
more sustainable settlements.
4.73 The Local Plan (submitted in March 2014) includes in Policy S/5 that provision is
made for 19,000 dwellings in the district during the period 2011 to 2031 to meet the
current objectively assessed need. To achieve this, the Council is proposing the
allocation of additional land between Huntingdon Road, Histon Road and the A14
(known as Darwin Green 2 or NIAB 2) (Policy SS/2), two new settlements at
Waterbeach and Bourn Airfield (Policies SS/5 and SS/6), a forth linked village at
Cambourne (Policy SS/8), and eight housing sites in the most sustainable villages
(Policy H/1).
4.74 Additional work relating to calculating the objectively assessed need for the district,
undertaken in response to the Inspectors initial findings, has resulted in the Council
concluding that provision should be made for 19,500 dwellings in the district during
the plan period from 2011 to 2031. The Council has therefore included a proposed
modification47 to Policy S/5, which is currently subject to public consultation, to
increase the housing requirement from 19,000 dwellings to 19,500 dwellings. The
Council has also included a proposed modification48 to Policy SS/3 to carry
forward more of the current allocation contained in the Cambridge East Area Action
Plan at land north of Cherry Hinton.
Figure 4.48: Development at Mixed Use Allocations identified in the Area Action Plans, Site
Specific Policies DPD and Local Plan (Indicators NS01, NS04, CE01, CE04, CSF01,
CSF04, NWC01, NWC04, NWC05, SSLO4, SSLO7, SSLO8, SSLO9, SSLO10, M7, M29
and M38)
Summary of Development Progress
Cambridge East
(Area Action Plan and
Local Plan Policy SS/3)
Marshall has confirmed that the relocation of Cambridge Airport will not happen
before 2031 at least, as there are currently no suitable relocation options.
In December 2013 Marshall submitted an outline planning application for their wing
development (land north of Newmarket Road), which consists of up to 1,300 homes,
a primary school, a food store, community facilities, open spaces, landscaping and
associated infrastructure.
While the airport remains on site, there is potential for residential development on
land north of Cherry Hinton, as identified in the Cambridge East AAP (adopted in
47
Cambridge and South Cambridgeshire Modifications Consultation Report: https://www.scambs.gov.uk/sites/default/files/final_mods_consultation_document_website_8.12.15.pdf 48
Cambridge and South Cambridgeshire Modifications Consultation Report: https://www.scambs.gov.uk/sites/default/files/final_mods_consultation_document_website_8.12.15.pdf
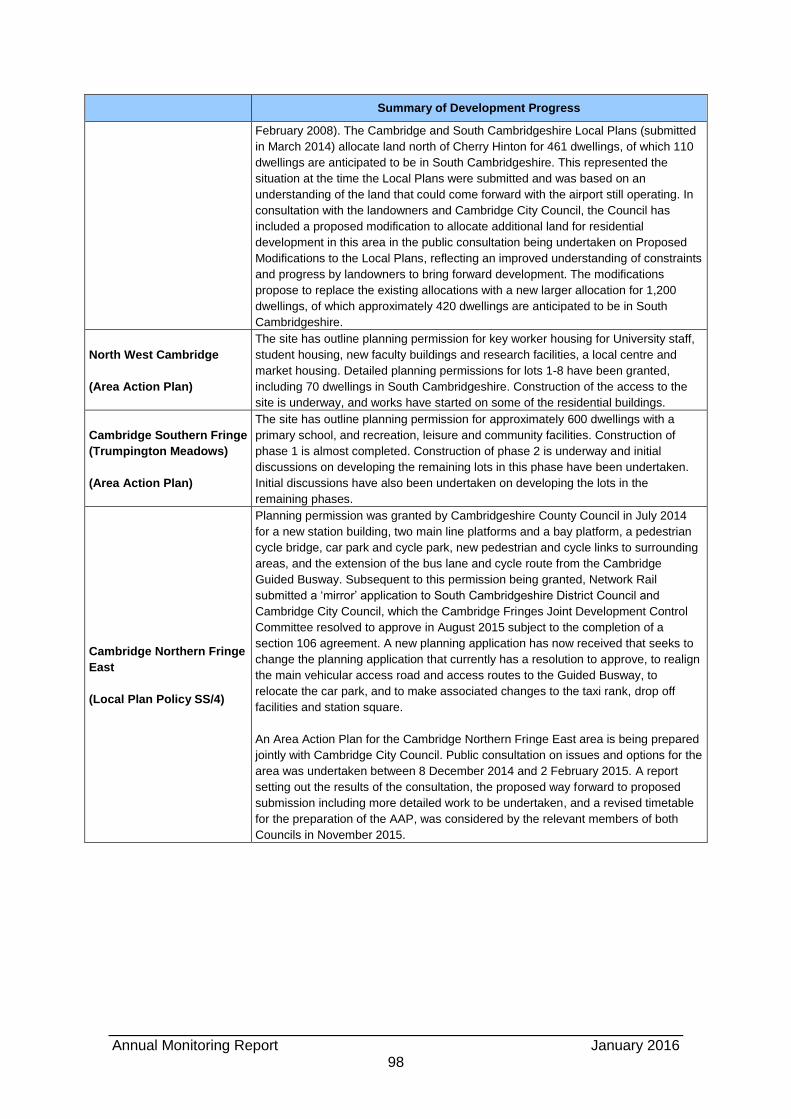
Annual Monitoring Report January 2016
98
Summary of Development Progress
February 2008). The Cambridge and South Cambridgeshire Local Plans (submitted
in March 2014) allocate land north of Cherry Hinton for 461 dwellings, of which 110
dwellings are anticipated to be in South Cambridgeshire. This represented the
situation at the time the Local Plans were submitted and was based on an
understanding of the land that could come forward with the airport still operating. In
consultation with the landowners and Cambridge City Council, the Council has
included a proposed modification to allocate additional land for residential
development in this area in the public consultation being undertaken on Proposed
Modifications to the Local Plans, reflecting an improved understanding of constraints
and progress by landowners to bring forward development. The modifications
propose to replace the existing allocations with a new larger allocation for 1,200
dwellings, of which approximately 420 dwellings are anticipated to be in South
Cambridgeshire.
North West Cambridge
(Area Action Plan)
The site has outline planning permission for key worker housing for University staff,
student housing, new faculty buildings and research facilities, a local centre and
market housing. Detailed planning permissions for lots 1-8 have been granted,
including 70 dwellings in South Cambridgeshire. Construction of the access to the
site is underway, and works have started on some of the residential buildings.
Cambridge Southern Fringe
(Trumpington Meadows)
(Area Action Plan)
The site has outline planning permission for approximately 600 dwellings with a
primary school, and recreation, leisure and community facilities. Construction of
phase 1 is almost completed. Construction of phase 2 is underway and initial
discussions on developing the remaining lots in this phase have been undertaken.
Initial discussions have also been undertaken on developing the lots in the
remaining phases.
Cambridge Northern Fringe
East
(Local Plan Policy SS/4)
Planning permission was granted by Cambridgeshire County Council in July 2014
for a new station building, two main line platforms and a bay platform, a pedestrian
cycle bridge, car park and cycle park, new pedestrian and cycle links to surrounding
areas, and the extension of the bus lane and cycle route from the Cambridge
Guided Busway. Subsequent to this permission being granted, Network Rail
submitted a ‘mirror’ application to South Cambridgeshire District Council and
Cambridge City Council, which the Cambridge Fringes Joint Development Control
Committee resolved to approve in August 2015 subject to the completion of a
section 106 agreement. A new planning application has now received that seeks to
change the planning application that currently has a resolution to approve, to realign
the main vehicular access road and access routes to the Guided Busway, to
relocate the car park, and to make associated changes to the taxi rank, drop off
facilities and station square.
An Area Action Plan for the Cambridge Northern Fringe East area is being prepared
jointly with Cambridge City Council. Public consultation on issues and options for the
area was undertaken between 8 December 2014 and 2 February 2015. A report
setting out the results of the consultation, the proposed way forward to proposed
submission including more detailed work to be undertaken, and a revised timetable
for the preparation of the AAP, was considered by the relevant members of both
Councils in November 2015.
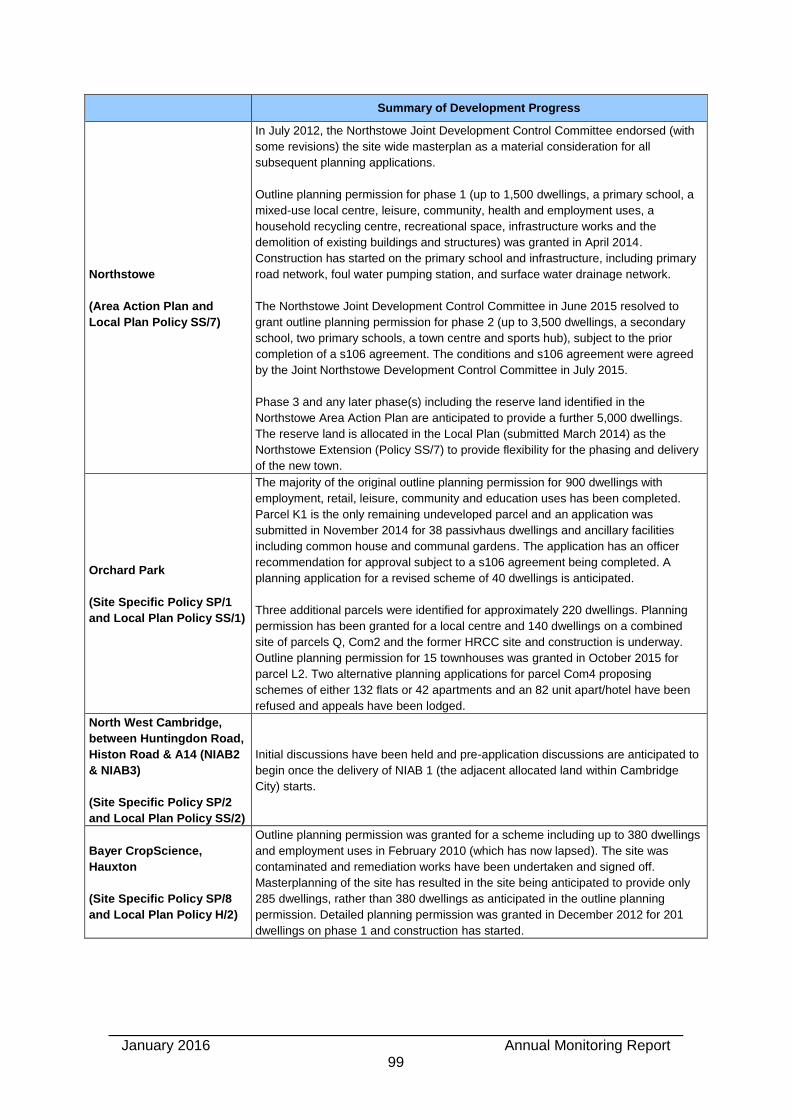
January 2016 Annual Monitoring Report
99
Summary of Development Progress
Northstowe
(Area Action Plan and
Local Plan Policy SS/7)
In July 2012, the Northstowe Joint Development Control Committee endorsed (with
some revisions) the site wide masterplan as a material consideration for all
subsequent planning applications.
Outline planning permission for phase 1 (up to 1,500 dwellings, a primary school, a
mixed-use local centre, leisure, community, health and employment uses, a
household recycling centre, recreational space, infrastructure works and the
demolition of existing buildings and structures) was granted in April 2014.
Construction has started on the primary school and infrastructure, including primary
road network, foul water pumping station, and surface water drainage network.
The Northstowe Joint Development Control Committee in June 2015 resolved to
grant outline planning permission for phase 2 (up to 3,500 dwellings, a secondary
school, two primary schools, a town centre and sports hub), subject to the prior
completion of a s106 agreement. The conditions and s106 agreement were agreed
by the Joint Northstowe Development Control Committee in July 2015.
Phase 3 and any later phase(s) including the reserve land identified in the
Northstowe Area Action Plan are anticipated to provide a further 5,000 dwellings.
The reserve land is allocated in the Local Plan (submitted March 2014) as the
Northstowe Extension (Policy SS/7) to provide flexibility for the phasing and delivery
of the new town.
Orchard Park
(Site Specific Policy SP/1
and Local Plan Policy SS/1)
The majority of the original outline planning permission for 900 dwellings with
employment, retail, leisure, community and education uses has been completed.
Parcel K1 is the only remaining undeveloped parcel and an application was
submitted in November 2014 for 38 passivhaus dwellings and ancillary facilities
including common house and communal gardens. The application has an officer
recommendation for approval subject to a s106 agreement being completed. A
planning application for a revised scheme of 40 dwellings is anticipated.
Three additional parcels were identified for approximately 220 dwellings. Planning
permission has been granted for a local centre and 140 dwellings on a combined
site of parcels Q, Com2 and the former HRCC site and construction is underway.
Outline planning permission for 15 townhouses was granted in October 2015 for
parcel L2. Two alternative planning applications for parcel Com4 proposing
schemes of either 132 flats or 42 apartments and an 82 unit apart/hotel have been
refused and appeals have been lodged.
North West Cambridge,
between Huntingdon Road,
Histon Road & A14 (NIAB2
& NIAB3)
(Site Specific Policy SP/2
and Local Plan Policy SS/2)
Initial discussions have been held and pre-application discussions are anticipated to
begin once the delivery of NIAB 1 (the adjacent allocated land within Cambridge
City) starts.
Bayer CropScience,
Hauxton
(Site Specific Policy SP/8
and Local Plan Policy H/2)
Outline planning permission was granted for a scheme including up to 380 dwellings
and employment uses in February 2010 (which has now lapsed). The site was
contaminated and remediation works have been undertaken and signed off.
Masterplanning of the site has resulted in the site being anticipated to provide only
285 dwellings, rather than 380 dwellings as anticipated in the outline planning
permission. Detailed planning permission was granted in December 2012 for 201
dwellings on phase 1 and construction has started.
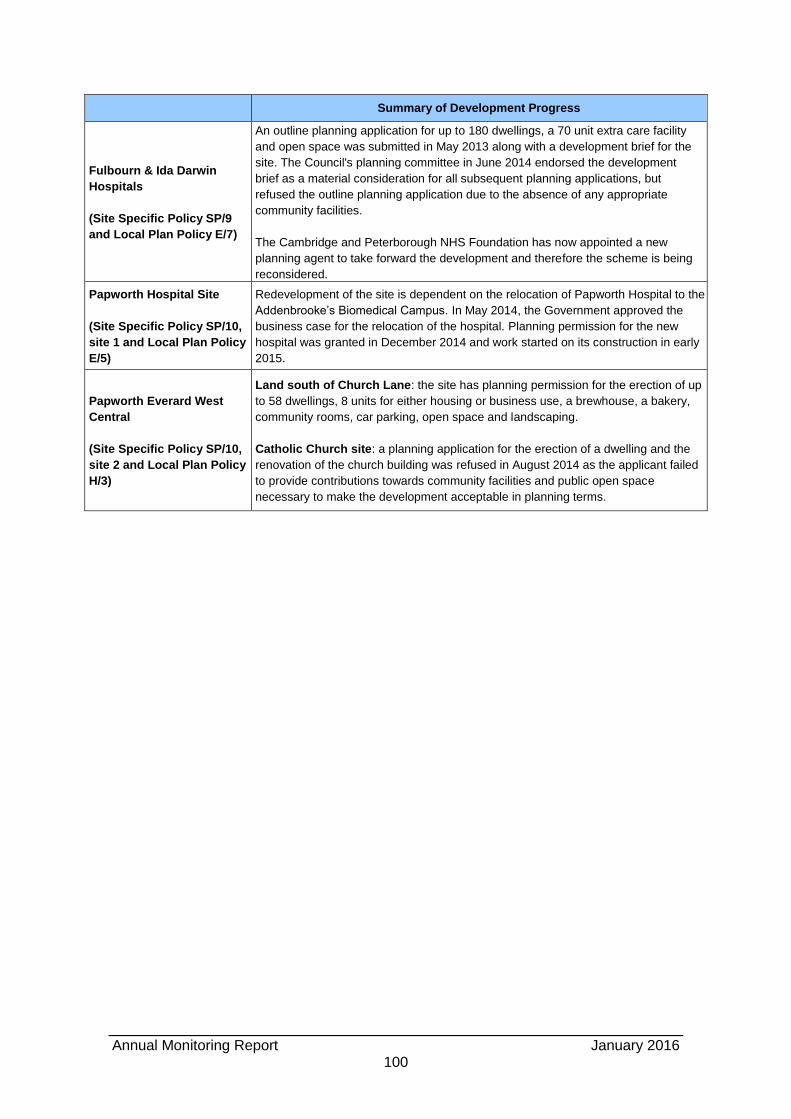
Annual Monitoring Report January 2016
100
Summary of Development Progress
Fulbourn & Ida Darwin
Hospitals
(Site Specific Policy SP/9
and Local Plan Policy E/7)
An outline planning application for up to 180 dwellings, a 70 unit extra care facility
and open space was submitted in May 2013 along with a development brief for the
site. The Council's planning committee in June 2014 endorsed the development
brief as a material consideration for all subsequent planning applications, but
refused the outline planning application due to the absence of any appropriate
community facilities.
The Cambridge and Peterborough NHS Foundation has now appointed a new
planning agent to take forward the development and therefore the scheme is being
reconsidered.
Papworth Hospital Site
(Site Specific Policy SP/10,
site 1 and Local Plan Policy
E/5)
Redevelopment of the site is dependent on the relocation of Papworth Hospital to the
Addenbrooke’s Biomedical Campus. In May 2014, the Government approved the
business case for the relocation of the hospital. Planning permission for the new
hospital was granted in December 2014 and work started on its construction in early
2015.
Papworth Everard West
Central
(Site Specific Policy SP/10,
site 2 and Local Plan Policy
H/3)
Land south of Church Lane: the site has planning permission for the erection of up
to 58 dwellings, 8 units for either housing or business use, a brewhouse, a bakery,
community rooms, car parking, open space and landscaping.
Catholic Church site: a planning application for the erection of a dwelling and the
renovation of the church building was refused in August 2014 as the applicant failed
to provide contributions towards community facilities and public open space
necessary to make the development acceptable in planning terms.

January 2016 Annual Monitoring Report
101
Community Facilities and Local Services
4.75 Good access from housing to a range of services can help to reduce car dependence
and may also help to support the vitality of rural communities. Core Strategy
Objective ST/b therefore requires all new development to be located where access
to day-to-day needs such as employment, shopping, education, recreation and health
facilities are available by public transport, walking and cycling. The Council will also
refuse planning permission for proposals that will cause an unacceptable reduction in
the level of community or service provision in the locality (see Development Control
Policy SF/1).
4.76 The Local Plan (submitted in March 2014) seeks to ensure that all new development
provides or has access to a range of services and facilities and to maximise the
potential for journeys to be undertaken by sustainable modes of transport including
walking, cycling and public transport (see Policy S/2). The Council will also refuse
planning permission for proposals that would result in the loss of a village service and
therefore cause an unacceptable reduction in the level of community or service
provision in the locality (Policy SC/3).
Figure 4.49: Amount of new residential development within 30 minutes public transport
journey time of key services (Indicators LOB4 and M5)
20
05
-
20
06
†
20
06
-
20
07
†
20
07
-
20
08
†
20
08
-
20
09
*
20
09
-
20
10
*
20
10
-
20
11
*
20
11
-
20
12
*
20
12
-
20
13
*
20
13
-
20
14
*
20
14
-
20
15
*
General Practitioner
87% 97% 99% 96% 97% 98% 97% 98% 97% 97%
Hospital 68% 53% 38% 18% 36% 13% 22% 10% 17% 11%
Primary School 96% 97% 99% 97% 95% 96% 98% 97% 96% 97%
Secondary School
40% 73% 79% 78% 73% 59% 59% 92% 79% 95%
Employment 97% 97% 99% 96% 96% 99% 98% 98% 95% 77%
Major Retail Centre
41% 44% 44% 53% 39% 50% 67% 65% 49% 39%
All of the Above 19% 18% 8% 16% 18% 8% 5% 7% 5% 7%
† The data has been calculated using a list of all NHS hospitals and therefore includes Papworth
Hospital which is a specialist hospital.
* The data has been calculated using a list of general NHS hospitals: Addenbrooke’s Hospital and
Hinchingbrooke Hospital. (Excludes any specialist hospitals such as Papworth Hospital).
The journey time is the sum of the time taken to walk to the bus stop, the duration of the bus journey
and the time taken to walk from the bus stop to the service.
Source: New Communities – Cambridgeshire County Council
Annual Monitoring Report January 2016
102
Developer Contributions
4.77 New developments can create additional demands for physical infrastructure and
social facilities, and can have an adverse impact on the environment. The Council, in
accordance with government guidance, therefore requires developers to make the
scheme acceptable in planning terms by making a contribution towards any
necessary improvements or new facilities, and also by providing mitigation for any
loss or damage created by the proposed development (see Development Control
Policy DP/4).
4.78 Where infrastructure and community facilities cannot reasonably be provided on the
development itself, it may be appropriate to secure a financial contribution for off-site
provision. Developer contributions are secured through section 106 agreements, a
legal agreement between the developer, the appropriate local authority and other
relevant parties, as a result of negotiations on a planning application.
4.79 The Government has now introduced a new development charge known as the
Community Infrastructure Levy (CIL). CIL is the Government’s preferred mechanism
for securing developer contributions towards local and strategic infrastructure
improvements and where possible the Council intends to use CIL to fund offsite
provision of facilities and services. The Council is committed to introducing a CIL
charge and submitted its draft Charging Schedule for independent examination in
October 2014. The CIL Regulations mean that section 106 agreements will revert
back to their original intention and mitigate site specific impacts only.
4.80 The Local Plan (submitted in March 2014) states in Policy TI/8 that planning
permission will only be granted for proposals that have made suitable arrangements
for the improvement or provision of infrastructure necessary to make the scheme
acceptable in planning terms.
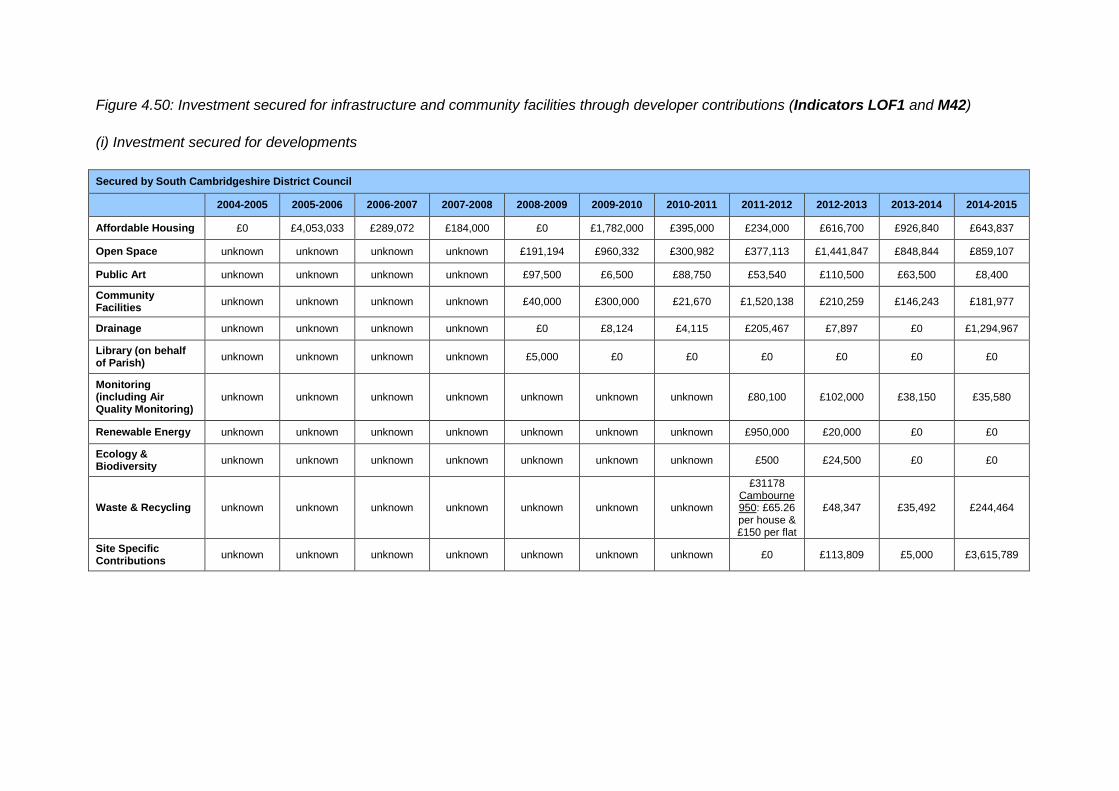
Figure 4.50: Investment secured for infrastructure and community facilities through developer contributions (Indicators LOF1 and M42)
(i) Investment secured for developments
Secured by South Cambridgeshire District Council
2004-2005 2005-2006 2006-2007 2007-2008 2008-2009 2009-2010 2010-2011 2011-2012 2012-2013 2013-2014 2014-2015
Affordable Housing £0 £4,053,033 £289,072 £184,000 £0 £1,782,000 £395,000 £234,000 £616,700 £926,840 £643,837
Open Space unknown unknown unknown unknown £191,194 £960,332 £300,982 £377,113 £1,441,847 £848,844 £859,107
Public Art unknown unknown unknown unknown £97,500 £6,500 £88,750 £53,540 £110,500 £63,500 £8,400
Community Facilities
unknown unknown unknown unknown £40,000 £300,000 £21,670 £1,520,138 £210,259 £146,243 £181,977
Drainage unknown unknown unknown unknown £0 £8,124 £4,115 £205,467 £7,897 £0 £1,294,967
Library (on behalf of Parish)
unknown unknown unknown unknown £5,000 £0 £0 £0 £0 £0 £0
Monitoring (including Air Quality Monitoring)
unknown unknown unknown unknown unknown unknown unknown £80,100 £102,000 £38,150 £35,580
Renewable Energy unknown unknown unknown unknown unknown unknown unknown £950,000 £20,000 £0 £0
Ecology & Biodiversity
unknown unknown unknown unknown unknown unknown unknown £500 £24,500 £0 £0
Waste & Recycling unknown unknown unknown unknown unknown unknown unknown
£31178 Cambourne 950: £65.26 per house & £150 per flat
£48,347 £35,492 £244,464
Site Specific Contributions
unknown unknown unknown unknown unknown unknown unknown £0 £113,809 £5,000 £3,615,789
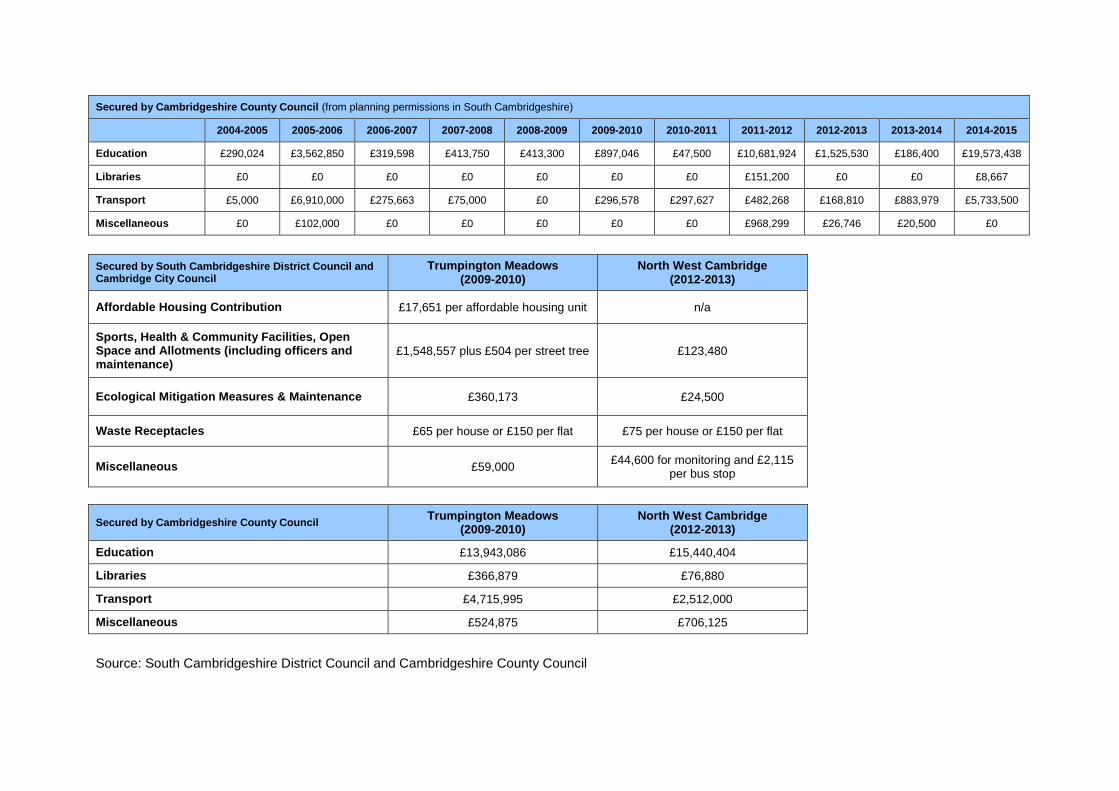
Secured by Cambridgeshire County Council (from planning permissions in South Cambridgeshire)
2004-2005 2005-2006 2006-2007 2007-2008 2008-2009 2009-2010 2010-2011 2011-2012 2012-2013 2013-2014 2014-2015
Education £290,024 £3,562,850 £319,598 £413,750 £413,300 £897,046 £47,500 £10,681,924 £1,525,530 £186,400 £19,573,438
Libraries £0 £0 £0 £0 £0 £0 £0 £151,200 £0 £0 £8,667
Transport £5,000 £6,910,000 £275,663 £75,000 £0 £296,578 £297,627 £482,268 £168,810 £883,979 £5,733,500
Miscellaneous £0 £102,000 £0 £0 £0 £0 £0 £968,299 £26,746 £20,500 £0
Secured by South Cambridgeshire District Council and Cambridge City Council
Trumpington Meadows (2009-2010)
North West Cambridge (2012-2013)
Affordable Housing Contribution £17,651 per affordable housing unit n/a
Sports, Health & Community Facilities, Open Space and Allotments (including officers and maintenance)
£1,548,557 plus £504 per street tree £123,480
Ecological Mitigation Measures & Maintenance £360,173 £24,500
Waste Receptacles £65 per house or £150 per flat £75 per house or £150 per flat
Miscellaneous £59,000 £44,600 for monitoring and £2,115
per bus stop
Secured by Cambridgeshire County Council Trumpington Meadows
(2009-2010) North West Cambridge
(2012-2013)
Education £13,943,086 £15,440,404
Libraries £366,879 £76,880
Transport £4,715,995 £2,512,000
Miscellaneous £524,875 £706,125
Source: South Cambridgeshire District Council and Cambridgeshire County Council
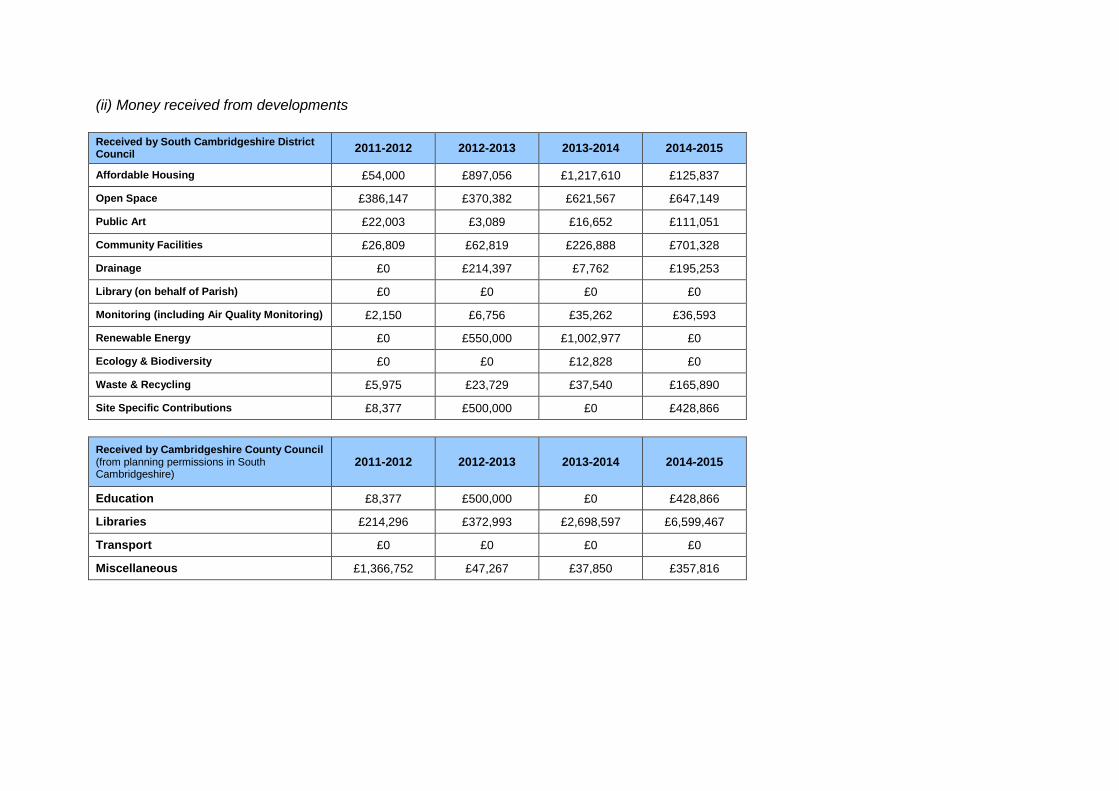
(ii) Money received from developments
Received by South Cambridgeshire District Council
2011-2012 2012-2013 2013-2014 2014-2015
Affordable Housing £54,000 £897,056 £1,217,610 £125,837
Open Space £386,147 £370,382 £621,567 £647,149
Public Art £22,003 £3,089 £16,652 £111,051
Community Facilities £26,809 £62,819 £226,888 £701,328
Drainage £0 £214,397 £7,762 £195,253
Library (on behalf of Parish) £0 £0 £0 £0
Monitoring (including Air Quality Monitoring) £2,150 £6,756 £35,262 £36,593
Renewable Energy £0 £550,000 £1,002,977 £0
Ecology & Biodiversity £0 £0 £12,828 £0
Waste & Recycling £5,975 £23,729 £37,540 £165,890
Site Specific Contributions £8,377 £500,000 £0 £428,866
Received by Cambridgeshire County Council (from planning permissions in South Cambridgeshire)
2011-2012 2012-2013 2013-2014 2014-2015
Education £8,377 £500,000 £0 £428,866
Libraries £214,296 £372,993 £2,698,597 £6,599,467
Transport £0 £0 £0 £0
Miscellaneous £1,366,752 £47,267 £37,850 £357,816
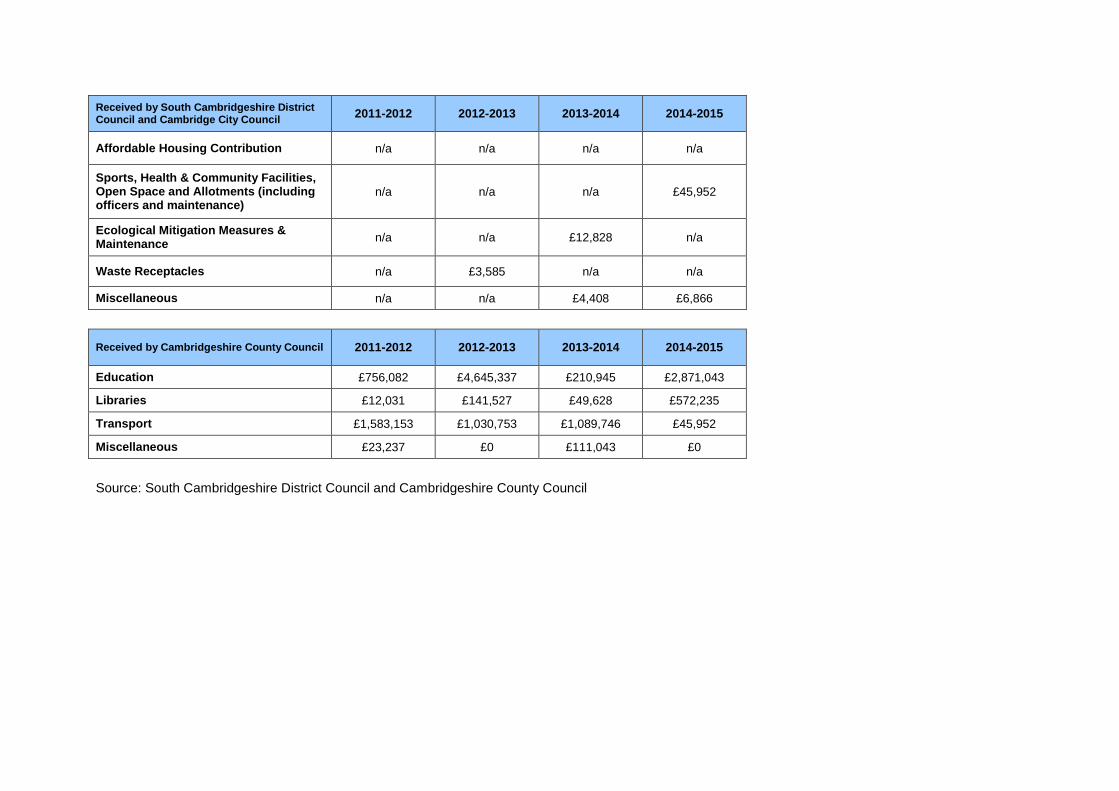
Received by South Cambridgeshire District Council and Cambridge City Council
2011-2012 2012-2013 2013-2014 2014-2015
Affordable Housing Contribution n/a n/a n/a n/a
Sports, Health & Community Facilities, Open Space and Allotments (including officers and maintenance)
n/a n/a n/a £45,952
Ecological Mitigation Measures & Maintenance
n/a n/a £12,828 n/a
Waste Receptacles n/a £3,585 n/a n/a
Miscellaneous n/a n/a £4,408 £6,866
Received by Cambridgeshire County Council 2011-2012 2012-2013 2013-2014 2014-2015
Education £756,082 £4,645,337 £210,945 £2,871,043
Libraries £12,031 £141,527 £49,628 £572,235
Transport £1,583,153 £1,030,753 £1,089,746 £45,952
Miscellaneous £23,237 £0 £111,043 £0
Source: South Cambridgeshire District Council and Cambridgeshire County Council
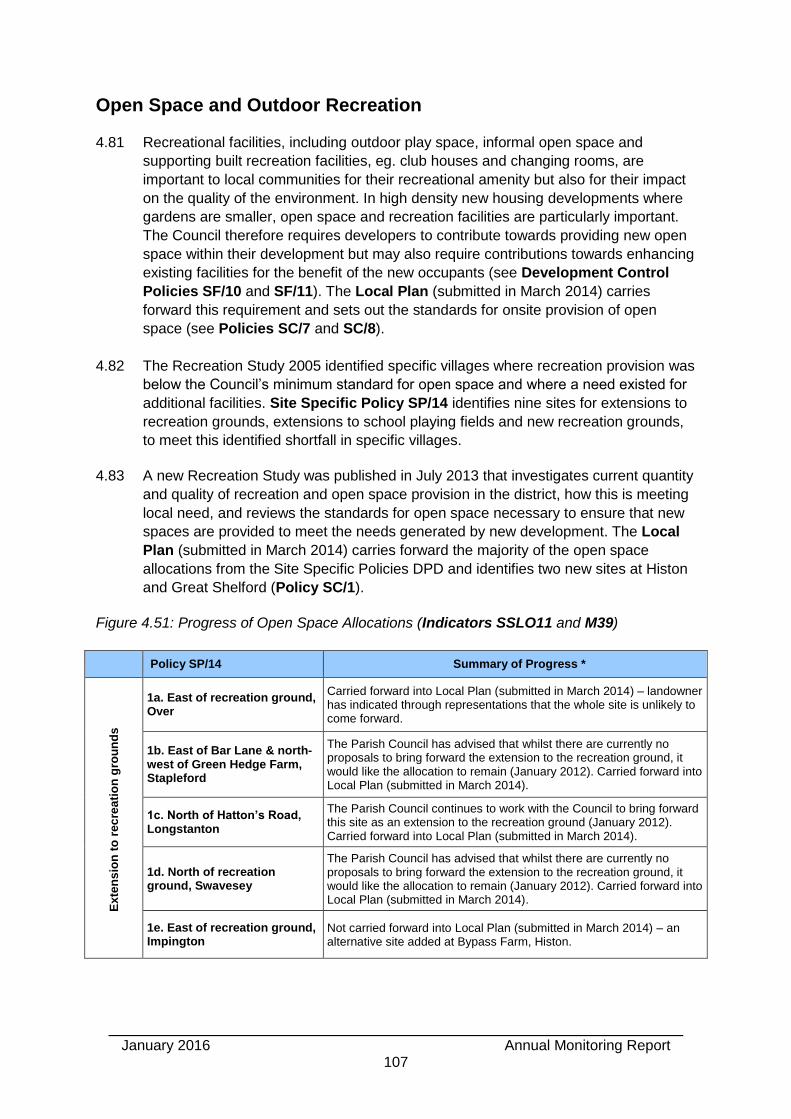
January 2016 Annual Monitoring Report
107
Open Space and Outdoor Recreation
4.81 Recreational facilities, including outdoor play space, informal open space and
supporting built recreation facilities, eg. club houses and changing rooms, are
important to local communities for their recreational amenity but also for their impact
on the quality of the environment. In high density new housing developments where
gardens are smaller, open space and recreation facilities are particularly important.
The Council therefore requires developers to contribute towards providing new open
space within their development but may also require contributions towards enhancing
existing facilities for the benefit of the new occupants (see Development Control
Policies SF/10 and SF/11). The Local Plan (submitted in March 2014) carries
forward this requirement and sets out the standards for onsite provision of open
space (see Policies SC/7 and SC/8).
4.82 The Recreation Study 2005 identified specific villages where recreation provision was
below the Council’s minimum standard for open space and where a need existed for
additional facilities. Site Specific Policy SP/14 identifies nine sites for extensions to
recreation grounds, extensions to school playing fields and new recreation grounds,
to meet this identified shortfall in specific villages.
4.83 A new Recreation Study was published in July 2013 that investigates current quantity
and quality of recreation and open space provision in the district, how this is meeting
local need, and reviews the standards for open space necessary to ensure that new
spaces are provided to meet the needs generated by new development. The Local
Plan (submitted in March 2014) carries forward the majority of the open space
allocations from the Site Specific Policies DPD and identifies two new sites at Histon
and Great Shelford (Policy SC/1).
Figure 4.51: Progress of Open Space Allocations (Indicators SSLO11 and M39)
Policy SP/14 Summary of Progress *
Ex
ten
sio
n t
o r
ec
rea
tio
n g
rou
nd
s
1a. East of recreation ground, Over
Carried forward into Local Plan (submitted in March 2014) – landowner has indicated through representations that the whole site is unlikely to come forward.
1b. East of Bar Lane & north-west of Green Hedge Farm, Stapleford
The Parish Council has advised that whilst there are currently no proposals to bring forward the extension to the recreation ground, it would like the allocation to remain (January 2012). Carried forward into Local Plan (submitted in March 2014).
1c. North of Hatton’s Road, Longstanton
The Parish Council continues to work with the Council to bring forward this site as an extension to the recreation ground (January 2012). Carried forward into Local Plan (submitted in March 2014).
1d. North of recreation ground, Swavesey
The Parish Council has advised that whilst there are currently no proposals to bring forward the extension to the recreation ground, it would like the allocation to remain (January 2012). Carried forward into Local Plan (submitted in March 2014).
1e. East of recreation ground, Impington
Not carried forward into Local Plan (submitted in March 2014) – an alternative site added at Bypass Farm, Histon.
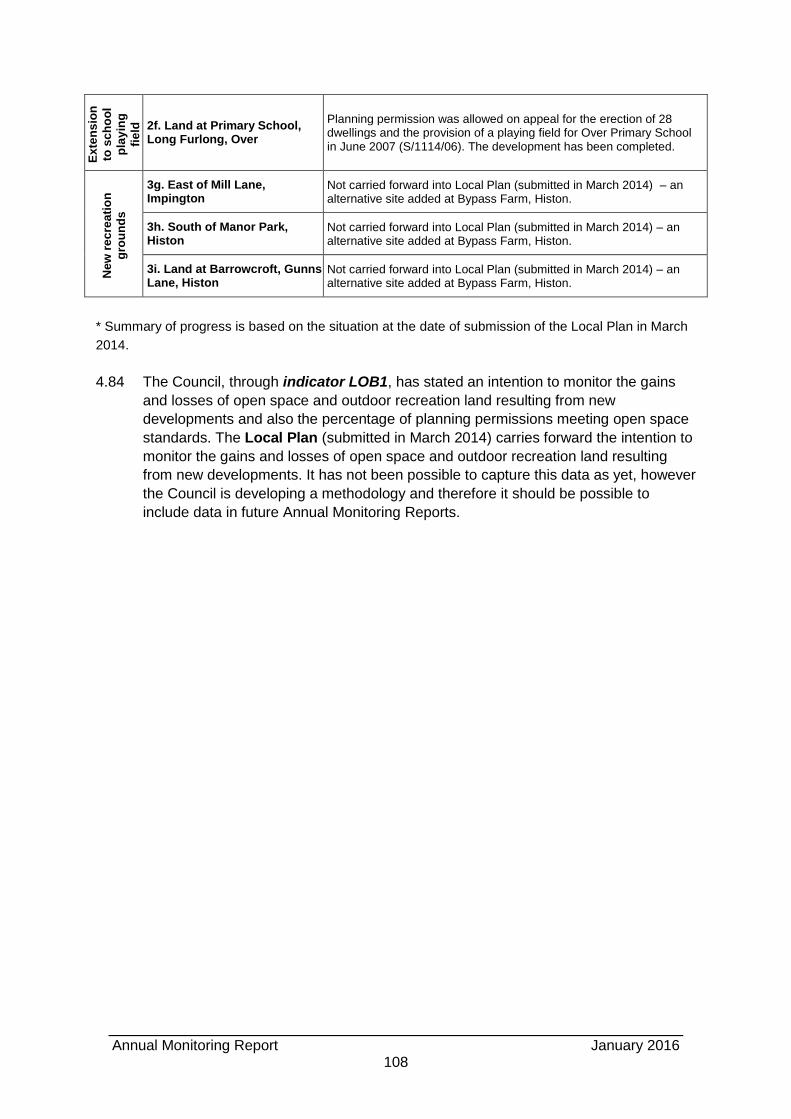
Annual Monitoring Report January 2016
108
Ex
ten
sio
n
to s
ch
oo
l
pla
yin
g
fie
ld
2f. Land at Primary School, Long Furlong, Over
Planning permission was allowed on appeal for the erection of 28 dwellings and the provision of a playing field for Over Primary School in June 2007 (S/1114/06). The development has been completed.
Ne
w r
ec
rea
tio
n
gro
un
ds
3g. East of Mill Lane, Impington
Not carried forward into Local Plan (submitted in March 2014) – an alternative site added at Bypass Farm, Histon.
3h. South of Manor Park, Histon
Not carried forward into Local Plan (submitted in March 2014) – an alternative site added at Bypass Farm, Histon.
3i. Land at Barrowcroft, Gunns Lane, Histon
Not carried forward into Local Plan (submitted in March 2014) – an alternative site added at Bypass Farm, Histon.
* Summary of progress is based on the situation at the date of submission of the Local Plan in March
2014.
4.84 The Council, through indicator LOB1, has stated an intention to monitor the gains
and losses of open space and outdoor recreation land resulting from new
developments and also the percentage of planning permissions meeting open space
standards. The Local Plan (submitted in March 2014) carries forward the intention to
monitor the gains and losses of open space and outdoor recreation land resulting
from new developments. It has not been possible to capture this data as yet, however
the Council is developing a methodology and therefore it should be possible to
include data in future Annual Monitoring Reports.
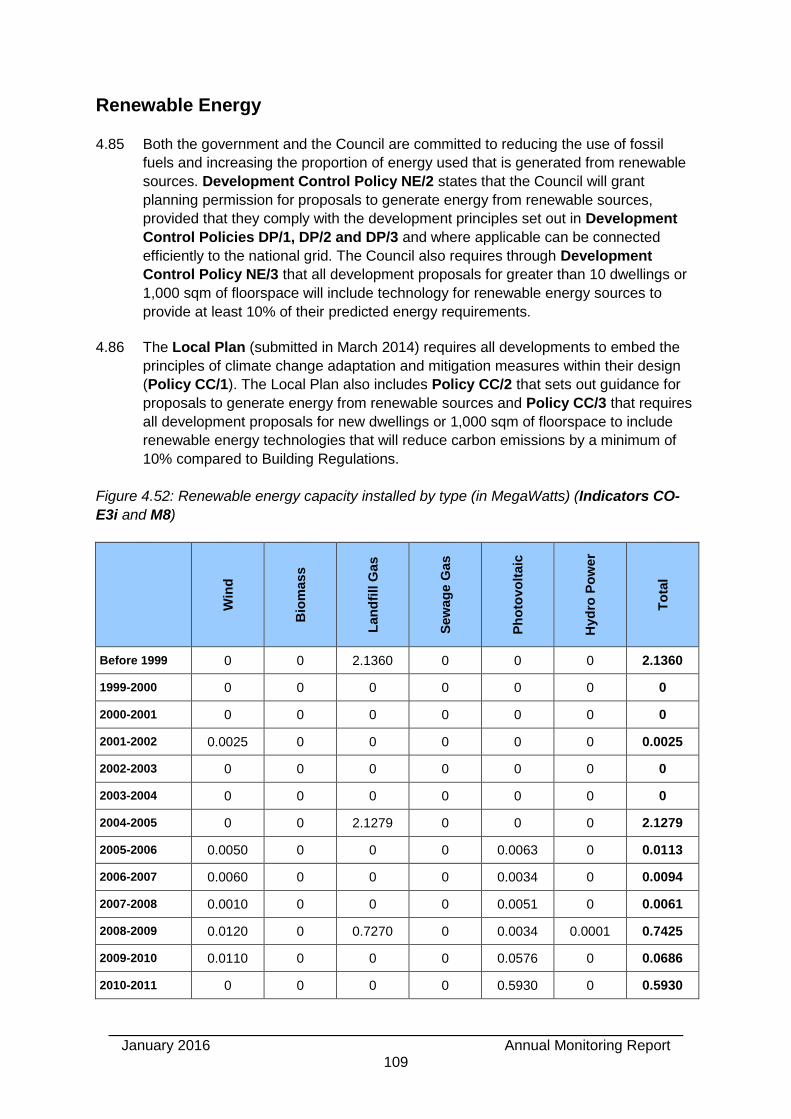
January 2016 Annual Monitoring Report
109
Renewable Energy
4.85 Both the government and the Council are committed to reducing the use of fossil
fuels and increasing the proportion of energy used that is generated from renewable
sources. Development Control Policy NE/2 states that the Council will grant
planning permission for proposals to generate energy from renewable sources,
provided that they comply with the development principles set out in Development
Control Policies DP/1, DP/2 and DP/3 and where applicable can be connected
efficiently to the national grid. The Council also requires through Development
Control Policy NE/3 that all development proposals for greater than 10 dwellings or
1,000 sqm of floorspace will include technology for renewable energy sources to
provide at least 10% of their predicted energy requirements.
4.86 The Local Plan (submitted in March 2014) requires all developments to embed the
principles of climate change adaptation and mitigation measures within their design
(Policy CC/1). The Local Plan also includes Policy CC/2 that sets out guidance for
proposals to generate energy from renewable sources and Policy CC/3 that requires
all development proposals for new dwellings or 1,000 sqm of floorspace to include
renewable energy technologies that will reduce carbon emissions by a minimum of
10% compared to Building Regulations.
Figure 4.52: Renewable energy capacity installed by type (in MegaWatts) (Indicators CO-
E3i and M8)
Win
d
Bio
mass
Lan
dfi
ll G
as
Sew
ag
e G
as
Ph
oto
vo
ltaic
Hyd
ro P
ow
er
To
tal
Before 1999 0 0 2.1360 0 0 0 2.1360
1999-2000 0 0 0 0 0 0 0
2000-2001 0 0 0 0 0 0 0
2001-2002 0.0025 0 0 0 0 0 0.0025
2002-2003 0 0 0 0 0 0 0
2003-2004 0 0 0 0 0 0 0
2004-2005 0 0 2.1279 0 0 0 2.1279
2005-2006 0.0050 0 0 0 0.0063 0 0.0113
2006-2007 0.0060 0 0 0 0.0034 0 0.0094
2007-2008 0.0010 0 0 0 0.0051 0 0.0061
2008-2009 0.0120 0 0.7270 0 0.0034 0.0001 0.7425
2009-2010 0.0110 0 0 0 0.0576 0 0.0686
2010-2011 0 0 0 0 0.5930 0 0.5930
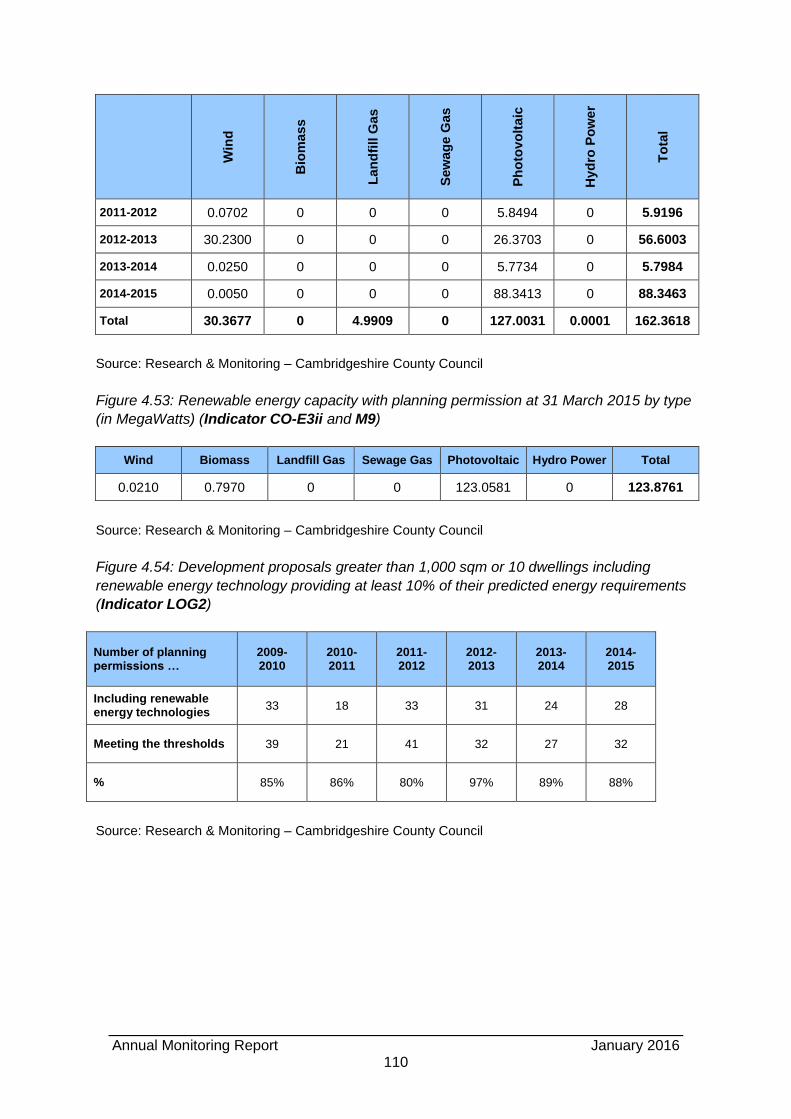
Annual Monitoring Report January 2016
110
Win
d
Bio
mass
Lan
dfi
ll G
as
Sew
ag
e G
as
Ph
oto
vo
ltaic
Hyd
ro P
ow
er
To
tal
2011-2012 0.0702 0 0 0 5.8494 0 5.9196
2012-2013 30.2300 0 0 0 26.3703 0 56.6003
2013-2014 0.0250 0 0 0 5.7734 0 5.7984
2014-2015 0.0050 0 0 0 88.3413 0 88.3463
Total 30.3677 0 4.9909 0 127.0031 0.0001 162.3618
Source: Research & Monitoring – Cambridgeshire County Council
Figure 4.53: Renewable energy capacity with planning permission at 31 March 2015 by type
(in MegaWatts) (Indicator CO-E3ii and M9)
Wind Biomass Landfill Gas Sewage Gas Photovoltaic Hydro Power Total
0.0210 0.7970 0 0 123.0581 0 123.8761
Source: Research & Monitoring – Cambridgeshire County Council
Figure 4.54: Development proposals greater than 1,000 sqm or 10 dwellings including
renewable energy technology providing at least 10% of their predicted energy requirements
(Indicator LOG2)
Number of planning permissions …
2009-2010
2010-2011
2011-2012
2012-2013
2013-2014
2014-2015
Including renewable energy technologies
33 18 33 31 24 28
Meeting the thresholds 39 21 41 32 27 32
% 85% 86% 80% 97% 89% 88%
Source: Research & Monitoring – Cambridgeshire County Council
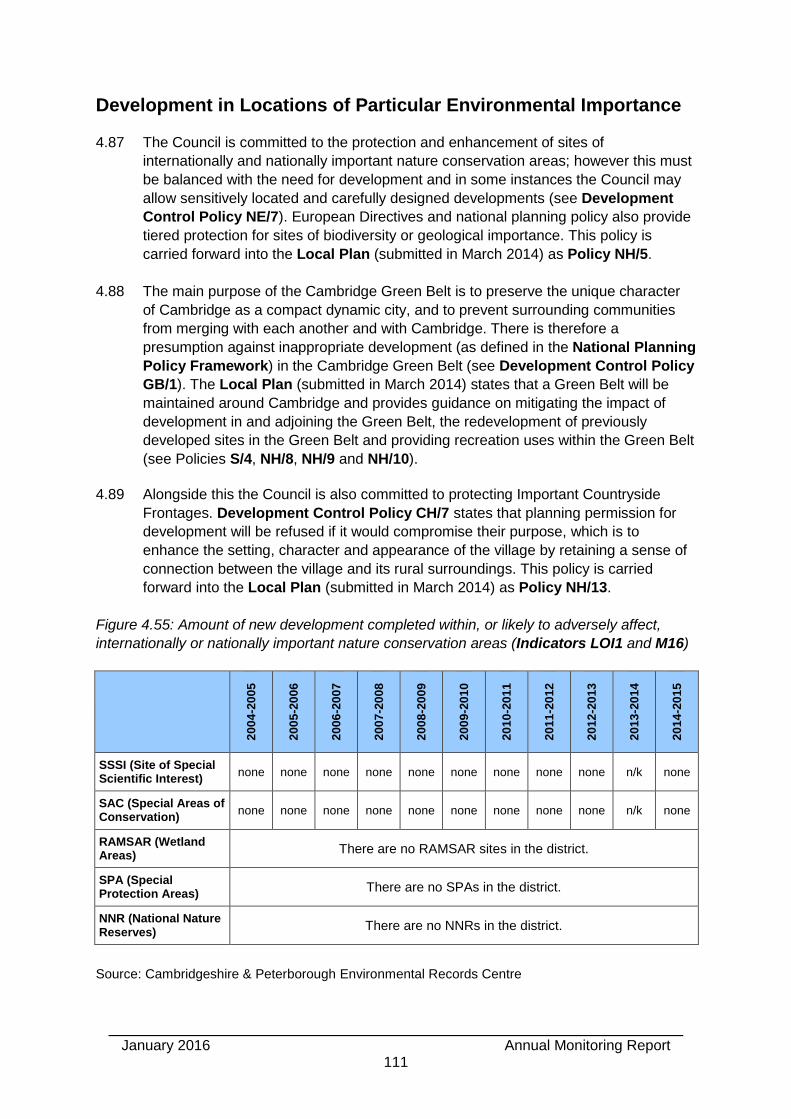
January 2016 Annual Monitoring Report
111
Development in Locations of Particular Environmental Importance
4.87 The Council is committed to the protection and enhancement of sites of
internationally and nationally important nature conservation areas; however this must
be balanced with the need for development and in some instances the Council may
allow sensitively located and carefully designed developments (see Development
Control Policy NE/7). European Directives and national planning policy also provide
tiered protection for sites of biodiversity or geological importance. This policy is
carried forward into the Local Plan (submitted in March 2014) as Policy NH/5.
4.88 The main purpose of the Cambridge Green Belt is to preserve the unique character
of Cambridge as a compact dynamic city, and to prevent surrounding communities
from merging with each another and with Cambridge. There is therefore a
presumption against inappropriate development (as defined in the National Planning
Policy Framework) in the Cambridge Green Belt (see Development Control Policy
GB/1). The Local Plan (submitted in March 2014) states that a Green Belt will be
maintained around Cambridge and provides guidance on mitigating the impact of
development in and adjoining the Green Belt, the redevelopment of previously
developed sites in the Green Belt and providing recreation uses within the Green Belt
(see Policies S/4, NH/8, NH/9 and NH/10).
4.89 Alongside this the Council is also committed to protecting Important Countryside
Frontages. Development Control Policy CH/7 states that planning permission for
development will be refused if it would compromise their purpose, which is to
enhance the setting, character and appearance of the village by retaining a sense of
connection between the village and its rural surroundings. This policy is carried
forward into the Local Plan (submitted in March 2014) as Policy NH/13.
Figure 4.55: Amount of new development completed within, or likely to adversely affect,
internationally or nationally important nature conservation areas (Indicators LOI1 and M16)
20
04
-20
05
20
05
-20
06
20
06
-20
07
20
07
-20
08
20
08
-20
09
20
09
-20
10
20
10
-20
11
20
11
-20
12
20
12
-20
13
20
13
-20
14
20
14
-20
15
SSSI (Site of Special Scientific Interest)
none none none none none none none none none n/k none
SAC (Special Areas of Conservation)
none none none none none none none none none n/k none
RAMSAR (Wetland Areas)
There are no RAMSAR sites in the district.
SPA (Special Protection Areas)
There are no SPAs in the district.
NNR (National Nature Reserves)
There are no NNRs in the district.
Source: Cambridgeshire & Peterborough Environmental Records Centre
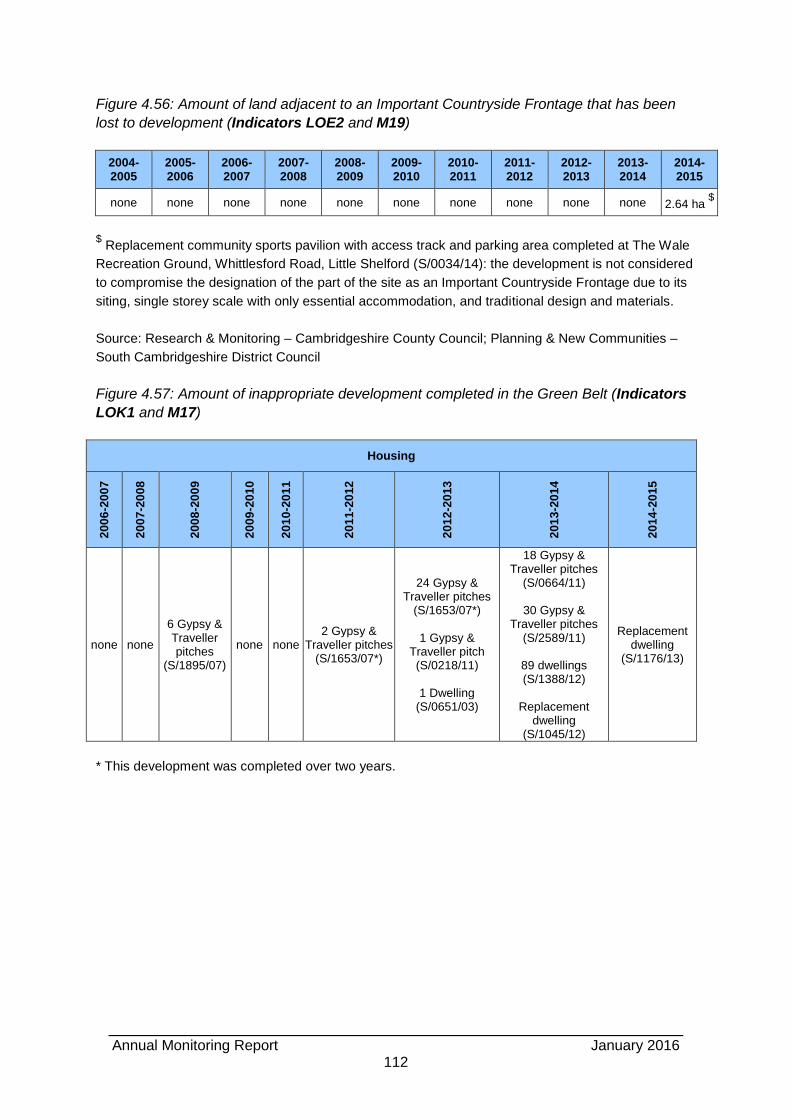
Annual Monitoring Report January 2016
112
Figure 4.56: Amount of land adjacent to an Important Countryside Frontage that has been
lost to development (Indicators LOE2 and M19)
2004- 2005
2005- 2006
2006- 2007
2007- 2008
2008- 2009
2009- 2010
2010- 2011
2011- 2012
2012- 2013
2013- 2014
2014- 2015
none none none none none none none none none none 2.64 ha $
$ Replacement community sports pavilion with access track and parking area completed at The Wale
Recreation Ground, Whittlesford Road, Little Shelford (S/0034/14): the development is not considered
to compromise the designation of the part of the site as an Important Countryside Frontage due to its
siting, single storey scale with only essential accommodation, and traditional design and materials.
Source: Research & Monitoring – Cambridgeshire County Council; Planning & New Communities –
South Cambridgeshire District Council
Figure 4.57: Amount of inappropriate development completed in the Green Belt (Indicators
LOK1 and M17)
Housing
20
06
-20
07
20
07
-20
08
20
08
-20
09
20
09
-20
10
20
10
-20
11
20
11
-20
12
20
12
-20
13
20
13
-20
14
20
14
-20
15
none none
6 Gypsy & Traveller pitches
(S/1895/07)
none none 2 Gypsy &
Traveller pitches (S/1653/07*)
24 Gypsy & Traveller pitches
(S/1653/07*)
1 Gypsy & Traveller pitch (S/0218/11)
1 Dwelling
(S/0651/03)
18 Gypsy & Traveller pitches
(S/0664/11)
30 Gypsy & Traveller pitches
(S/2589/11)
89 dwellings (S/1388/12)
Replacement
dwelling (S/1045/12)
Replacement dwelling
(S/1176/13)
* This development was completed over two years.

January 2016 Annual Monitoring Report
113
Business
20
06
-20
07
20
07
-20
08
20
08
-20
09
20
09
-20
10
20
10
-20
11
20
11
-20
12
20
12
-20
13
20
13
-20
14
20
14
-20
15
none none
B1b use:
8015 sqm (S/1464/01)
Retail:
415 sqm (S/0692/07)
D1 use:
613 sqm (S/0956/07);
29 sqm (S/0358/08)
D2 use:
381 sqm (S/1025/08)
A3 use:
475 sqm (S/1300/09);
252 sqm (S/1503/09)
B1b use:
8931 sqm (S/0349/07)
B1c use:
35 sqm (S/2209/10)
C1 use:
283 sqm (S/0297/08)
D1 use:
222 sqm (S/0198/08);
113 sqm (S/1938/09)
D2 use:
880 sqm (S/1945/08)
B1b use:
3,723 sqm (S/0853/09)
B8 use:
78 sqm (S/1672/10)
D1 use:
103 sqm (S/1862/09)
Retail:
17sqm (S/0356/12);
B1a use:
99sqm (S/0227/12);
C2 use:
54 sqm (S/1785/12); 1,324sqm
(S/1492/11) ^
Sui Generis:
225sqm (S/0227/12)
Retail:
26 sqm (S/0318/13)
B1b use:
2,256 sqm (S/0600/12)
D1 use:
680 sqm (S/2215/11)
Retail:
450 sqm (S/2065/14)
B1c use:
112 sqm
(S/0787/12) &
B8 use:
29 sqm (S/0923/14)
C1 use:
138 sqm
(S/0787/12) &
^ This replaces 1,584sqm of C2 use that was demolished in 2011-2012. &
These replace 240 sqm of B1c use that was demolished in 2014-2015.
Source: Research & Monitoring – Cambridgeshire County Council; Planning & New Communities –
South Cambridgeshire District Council
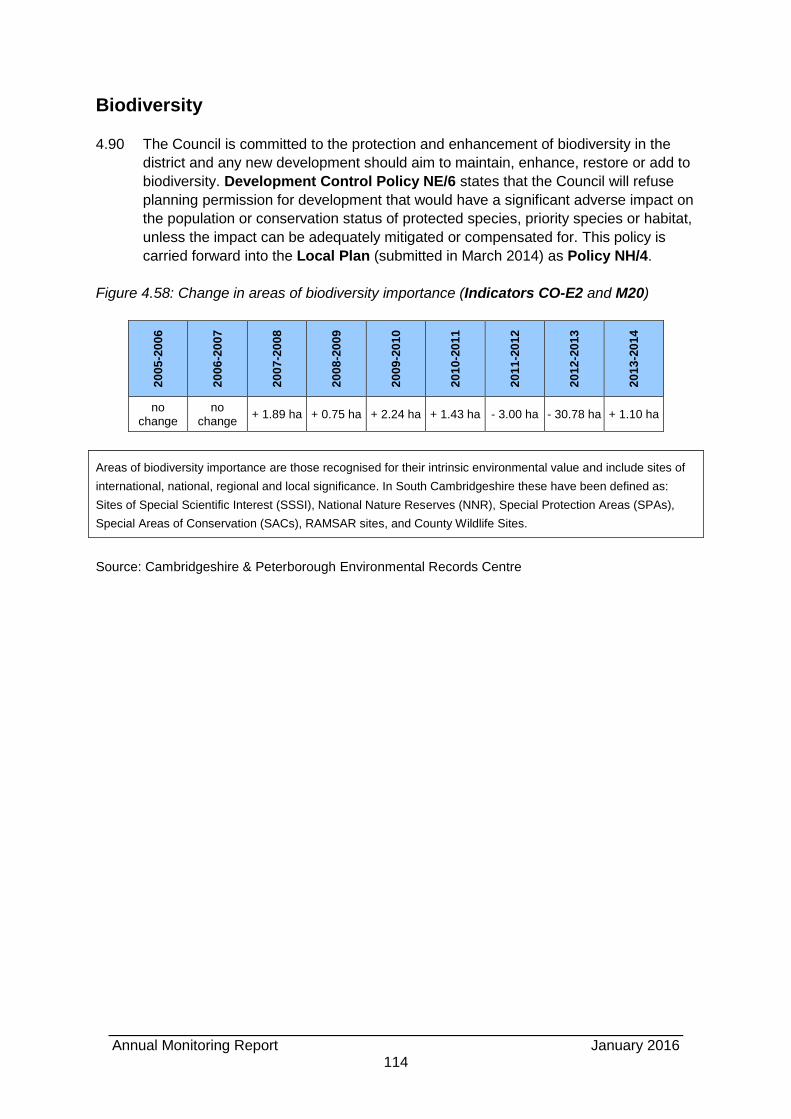
Annual Monitoring Report January 2016
114
Biodiversity
4.90 The Council is committed to the protection and enhancement of biodiversity in the
district and any new development should aim to maintain, enhance, restore or add to
biodiversity. Development Control Policy NE/6 states that the Council will refuse
planning permission for development that would have a significant adverse impact on
the population or conservation status of protected species, priority species or habitat,
unless the impact can be adequately mitigated or compensated for. This policy is
carried forward into the Local Plan (submitted in March 2014) as Policy NH/4.
Figure 4.58: Change in areas of biodiversity importance (Indicators CO-E2 and M20)
20
05
-20
06
20
06
-20
07
20
07
-20
08
20
08
-20
09
20
09
-20
10
20
10
-20
11
20
11
-20
12
20
12
-20
13
20
13
-20
14
no change
no change
+ 1.89 ha + 0.75 ha + 2.24 ha + 1.43 ha - 3.00 ha - 30.78 ha + 1.10 ha
Areas of biodiversity importance are those recognised for their intrinsic environmental value and include sites of
international, national, regional and local significance. In South Cambridgeshire these have been defined as:
Sites of Special Scientific Interest (SSSI), National Nature Reserves (NNR), Special Protection Areas (SPAs),
Special Areas of Conservation (SACs), RAMSAR sites, and County Wildlife Sites.
Source: Cambridgeshire & Peterborough Environmental Records Centre
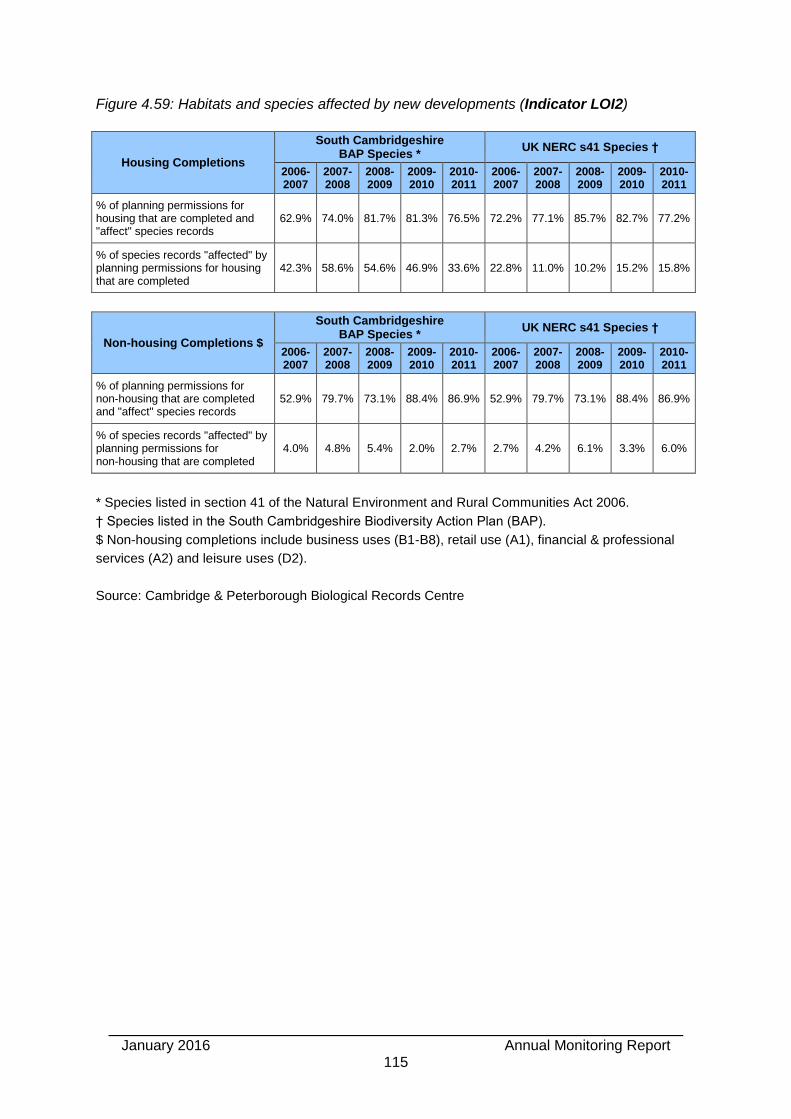
January 2016 Annual Monitoring Report
115
Figure 4.59: Habitats and species affected by new developments (Indicator LOI2)
Housing Completions
South Cambridgeshire BAP Species *
UK NERC s41 Species †
2006-2007
2007-2008
2008-2009
2009-2010
2010-2011
2006-2007
2007-2008
2008-2009
2009-2010
2010-2011
% of planning permissions for housing that are completed and "affect" species records
62.9% 74.0% 81.7% 81.3% 76.5% 72.2% 77.1% 85.7% 82.7% 77.2%
% of species records "affected" by planning permissions for housing that are completed
42.3% 58.6% 54.6% 46.9% 33.6% 22.8% 11.0% 10.2% 15.2% 15.8%
Non-housing Completions $
South Cambridgeshire BAP Species *
UK NERC s41 Species †
2006-2007
2007-2008
2008-2009
2009-2010
2010-2011
2006-2007
2007-2008
2008-2009
2009-2010
2010-2011
% of planning permissions for non-housing that are completed and "affect" species records
52.9% 79.7% 73.1% 88.4% 86.9% 52.9% 79.7% 73.1% 88.4% 86.9%
% of species records "affected" by planning permissions for non-housing that are completed
4.0% 4.8% 5.4% 2.0% 2.7% 2.7% 4.2% 6.1% 3.3% 6.0%
* Species listed in section 41 of the Natural Environment and Rural Communities Act 2006.
† Species listed in the South Cambridgeshire Biodiversity Action Plan (BAP).
$ Non-housing completions include business uses (B1-B8), retail use (A1), financial & professional
services (A2) and leisure uses (D2).
Source: Cambridge & Peterborough Biological Records Centre
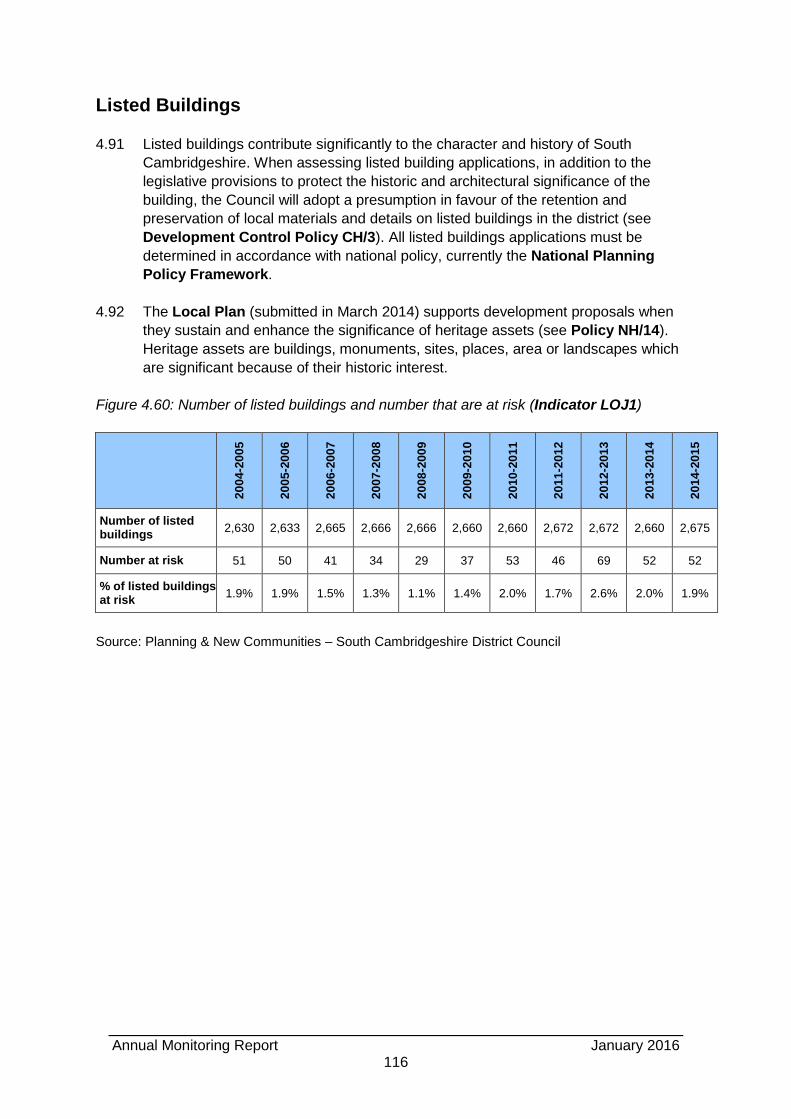
Annual Monitoring Report January 2016
116
Listed Buildings
4.91 Listed buildings contribute significantly to the character and history of South
Cambridgeshire. When assessing listed building applications, in addition to the
legislative provisions to protect the historic and architectural significance of the
building, the Council will adopt a presumption in favour of the retention and
preservation of local materials and details on listed buildings in the district (see
Development Control Policy CH/3). All listed buildings applications must be
determined in accordance with national policy, currently the National Planning
Policy Framework.
4.92 The Local Plan (submitted in March 2014) supports development proposals when
they sustain and enhance the significance of heritage assets (see Policy NH/14).
Heritage assets are buildings, monuments, sites, places, area or landscapes which
are significant because of their historic interest.
Figure 4.60: Number of listed buildings and number that are at risk (Indicator LOJ1)
20
04
-20
05
20
05
-20
06
20
06
-20
07
20
07
-20
08
20
08
-20
09
20
09
-20
10
20
10
-20
11
20
11
-20
12
20
12
-20
13
20
13
-20
14
20
14
-20
15
Number of listed buildings
2,630 2,633 2,665 2,666 2,666 2,660 2,660 2,672 2,672 2,660 2,675
Number at risk 51 50 41 34 29 37 53 46 69 52 52
% of listed buildings at risk
1.9% 1.9% 1.5% 1.3% 1.1% 1.4% 2.0% 1.7% 2.6% 2.0% 1.9%
Source: Planning & New Communities – South Cambridgeshire District Council
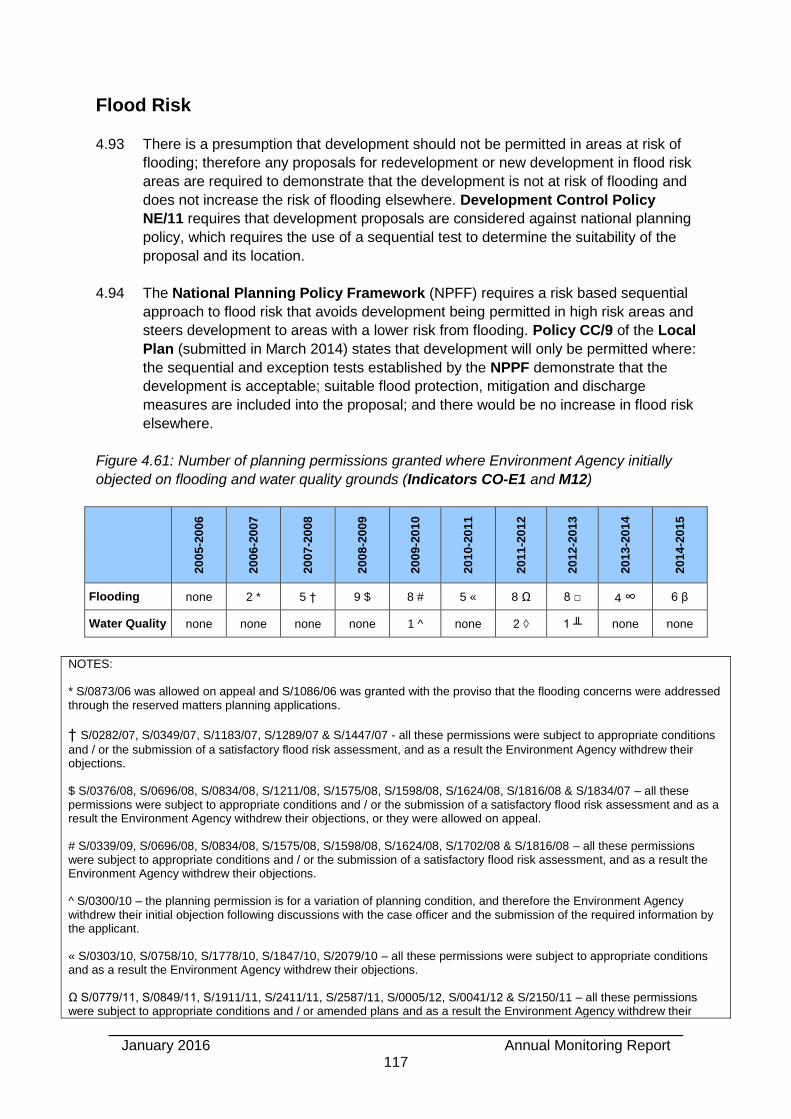
January 2016 Annual Monitoring Report
117
Flood Risk
4.93 There is a presumption that development should not be permitted in areas at risk of
flooding; therefore any proposals for redevelopment or new development in flood risk
areas are required to demonstrate that the development is not at risk of flooding and
does not increase the risk of flooding elsewhere. Development Control Policy
NE/11 requires that development proposals are considered against national planning
policy, which requires the use of a sequential test to determine the suitability of the
proposal and its location.
4.94 The National Planning Policy Framework (NPFF) requires a risk based sequential
approach to flood risk that avoids development being permitted in high risk areas and
steers development to areas with a lower risk from flooding. Policy CC/9 of the Local
Plan (submitted in March 2014) states that development will only be permitted where:
the sequential and exception tests established by the NPPF demonstrate that the
development is acceptable; suitable flood protection, mitigation and discharge
measures are included into the proposal; and there would be no increase in flood risk
elsewhere.
Figure 4.61: Number of planning permissions granted where Environment Agency initially
objected on flooding and water quality grounds (Indicators CO-E1 and M12)
20
05
-20
06
20
06
-20
07
20
07
-20
08
20
08
-20
09
20
09
-20
10
20
10
-20
11
20
11
-20
12
20
12
-20
13
20
13
-20
14
20
14
-20
15
Flooding none 2 * 5 † 9 $ 8 # 5 « 8 Ω 8 4 ∞ 6 β
Water Quality none none none none 1 ^ none 2 ◊ 1 none none
NOTES: * S/0873/06 was allowed on appeal and S/1086/06 was granted with the proviso that the flooding concerns were addressed through the reserved matters planning applications.
† S/0282/07, S/0349/07, S/1183/07, S/1289/07 & S/1447/07 - all these permissions were subject to appropriate conditions
and / or the submission of a satisfactory flood risk assessment, and as a result the Environment Agency withdrew their objections. $ S/0376/08, S/0696/08, S/0834/08, S/1211/08, S/1575/08, S/1598/08, S/1624/08, S/1816/08 & S/1834/07 – all these permissions were subject to appropriate conditions and / or the submission of a satisfactory flood risk assessment and as a result the Environment Agency withdrew their objections, or they were allowed on appeal. # S/0339/09, S/0696/08, S/0834/08, S/1575/08, S/1598/08, S/1624/08, S/1702/08 & S/1816/08 – all these permissions were subject to appropriate conditions and / or the submission of a satisfactory flood risk assessment, and as a result the Environment Agency withdrew their objections. ^ S/0300/10 – the planning permission is for a variation of planning condition, and therefore the Environment Agency withdrew their initial objection following discussions with the case officer and the submission of the required information by the applicant. « S/0303/10, S/0758/10, S/1778/10, S/1847/10, S/2079/10 – all these permissions were subject to appropriate conditions and as a result the Environment Agency withdrew their objections. Ω S/0779/11, S/0849/11, S/1911/11, S/2411/11, S/2587/11, S/0005/12, S/0041/12 & S/2150/11 – all these permissions were subject to appropriate conditions and / or amended plans and as a result the Environment Agency withdrew their

Annual Monitoring Report January 2016
118
objections, or they were allowed on appeal. ◊ S/1656/11 & S/2411/11 – all these permissions were subject to appropriate conditions and / or amended plans and as a result the Environment Agency withdrew their objections. S/0921/12, S/1349/12, S/1725/12, S/1726/12, S/2378/12, S/2491/12, S/2557/12 & S/2122/12 – all these permissions were subject to appropriate conditions and / or the submission of a satisfactory flood risk assessment and as a result the Environment Agency withdrew their objections, or they were allowed on appeal. S/2411/11 – this permission was subject to appropriate conditions.
∞ S/0395/13, S/1038/13, S/2150/11 & S/2312/13 – all these permissions were subject to appropriate conditions and / or
the submission of a satisfactory flood risk assessment and as a result the Environment Agency withdrew their objections. β S/0431/15, S/0581/14, S/1427/14, S/1897/14, S/2713/14 & S/2944/14 - all these permissions were subject to appropriate conditions and / or the submission of a satisfactory flood risk assessment and as a result the Environment Agency withdrew their objections.
Source: Environment Agency
Figure 4.62: Amount of new development completed on previously undeveloped functional
floodplain land, and in flood risk areas, without agreed flood defence measures (Indicators
LOG1 and M11)
20
05
-20
06
20
06
-20
07
20
07
-20
08
20
08
-20
09
20
09
-20
10
20
10
-20
11
20
11
-20
12
20
12
-20
13
20
13
-20
14
20
14
-20
15
Previously undeveloped functional floodplain land *
none none none none none none none none none none
Flood risk areas none none none none none none none none 1 dwelling
(S/0101/11) none
* The Council has functional floodplain modelling for large areas of the district as a result of the
completion of its revised Strategic Flood Risk Assessment, however there are still areas in the north
of the district where modelling of functional floodplain is not yet available. Functional floodplain
(identified as Flood Zone 3b) is the land where there is the highest level of flood risk and is a subset
of the areas of flood risk identified by the Environment Agency.
Source: Planning & New Communities – South Cambridgeshire District Council
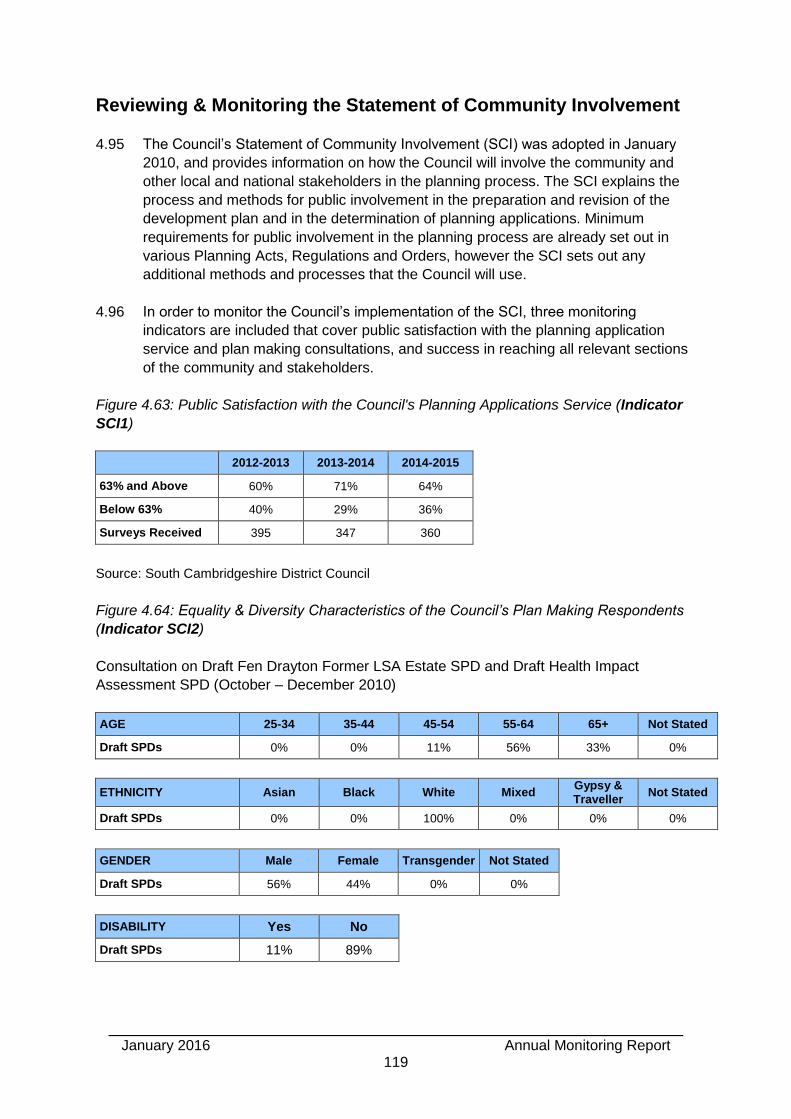
January 2016 Annual Monitoring Report
119
Reviewing & Monitoring the Statement of Community Involvement
4.95 The Council’s Statement of Community Involvement (SCI) was adopted in January
2010, and provides information on how the Council will involve the community and
other local and national stakeholders in the planning process. The SCI explains the
process and methods for public involvement in the preparation and revision of the
development plan and in the determination of planning applications. Minimum
requirements for public involvement in the planning process are already set out in
various Planning Acts, Regulations and Orders, however the SCI sets out any
additional methods and processes that the Council will use.
4.96 In order to monitor the Council’s implementation of the SCI, three monitoring
indicators are included that cover public satisfaction with the planning application
service and plan making consultations, and success in reaching all relevant sections
of the community and stakeholders.
Figure 4.63: Public Satisfaction with the Council's Planning Applications Service (Indicator
SCI1)
2012-2013 2013-2014 2014-2015
63% and Above 60% 71% 64%
Below 63% 40% 29% 36%
Surveys Received 395 347 360
Source: South Cambridgeshire District Council
Figure 4.64: Equality & Diversity Characteristics of the Council’s Plan Making Respondents
(Indicator SCI2)
Consultation on Draft Fen Drayton Former LSA Estate SPD and Draft Health Impact
Assessment SPD (October – December 2010)
AGE 25-34 35-44 45-54 55-64 65+ Not Stated
Draft SPDs 0% 0% 11% 56% 33% 0%
ETHNICITY Asian Black White Mixed Gypsy & Traveller
Not Stated
Draft SPDs 0% 0% 100% 0% 0% 0%
GENDER Male Female Transgender Not Stated
Draft SPDs 56% 44% 0% 0%
DISABILITY Yes No
Draft SPDs 11% 89%
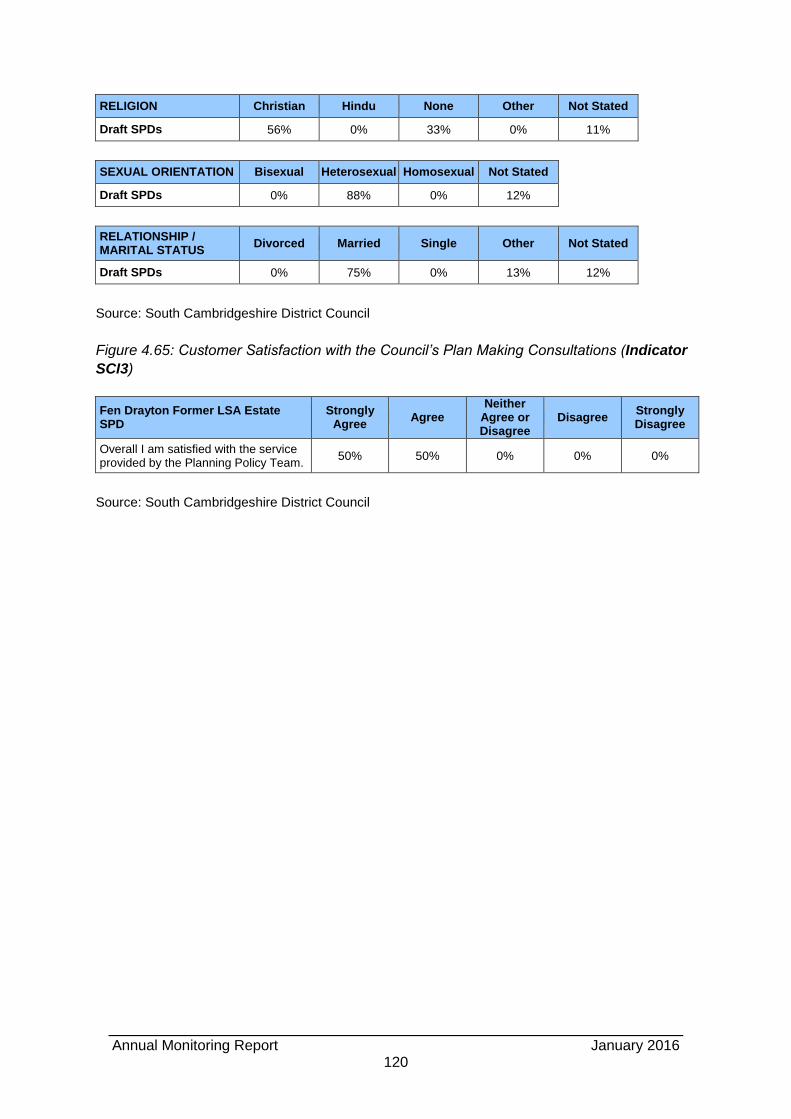
Annual Monitoring Report January 2016
120
RELIGION Christian Hindu None Other Not Stated
Draft SPDs 56% 0% 33% 0% 11%
SEXUAL ORIENTATION Bisexual Heterosexual Homosexual Not Stated
Draft SPDs 0% 88% 0% 12%
RELATIONSHIP / MARITAL STATUS
Divorced Married Single Other Not Stated
Draft SPDs 0% 75% 0% 13% 12%
Source: South Cambridgeshire District Council
Figure 4.65: Customer Satisfaction with the Council’s Plan Making Consultations (Indicator
SCI3)
Fen Drayton Former LSA Estate SPD
Strongly Agree
Agree Neither
Agree or Disagree
Disagree Strongly Disagree
Overall I am satisfied with the service provided by the Planning Policy Team.
50% 50% 0% 0% 0%
Source: South Cambridgeshire District Council
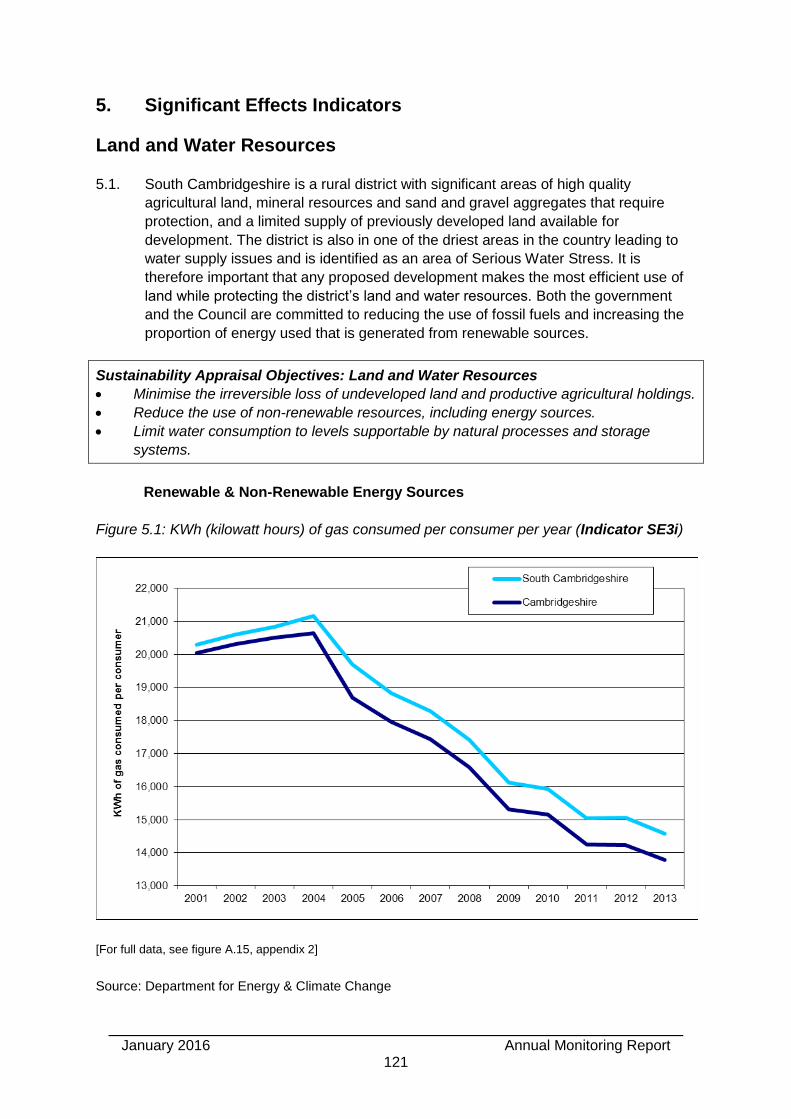
January 2016 Annual Monitoring Report
121
5. Significant Effects Indicators
Land and Water Resources
5.1. South Cambridgeshire is a rural district with significant areas of high quality
agricultural land, mineral resources and sand and gravel aggregates that require
protection, and a limited supply of previously developed land available for
development. The district is also in one of the driest areas in the country leading to
water supply issues and is identified as an area of Serious Water Stress. It is
therefore important that any proposed development makes the most efficient use of
land while protecting the district’s land and water resources. Both the government
and the Council are committed to reducing the use of fossil fuels and increasing the
proportion of energy used that is generated from renewable sources.
Sustainability Appraisal Objectives: Land and Water Resources
Minimise the irreversible loss of undeveloped land and productive agricultural holdings.
Reduce the use of non-renewable resources, including energy sources.
Limit water consumption to levels supportable by natural processes and storage
systems.
Renewable & Non-Renewable Energy Sources
Figure 5.1: KWh (kilowatt hours) of gas consumed per consumer per year (Indicator SE3i)
[For full data, see figure A.15, appendix 2]
Source: Department for Energy & Climate Change
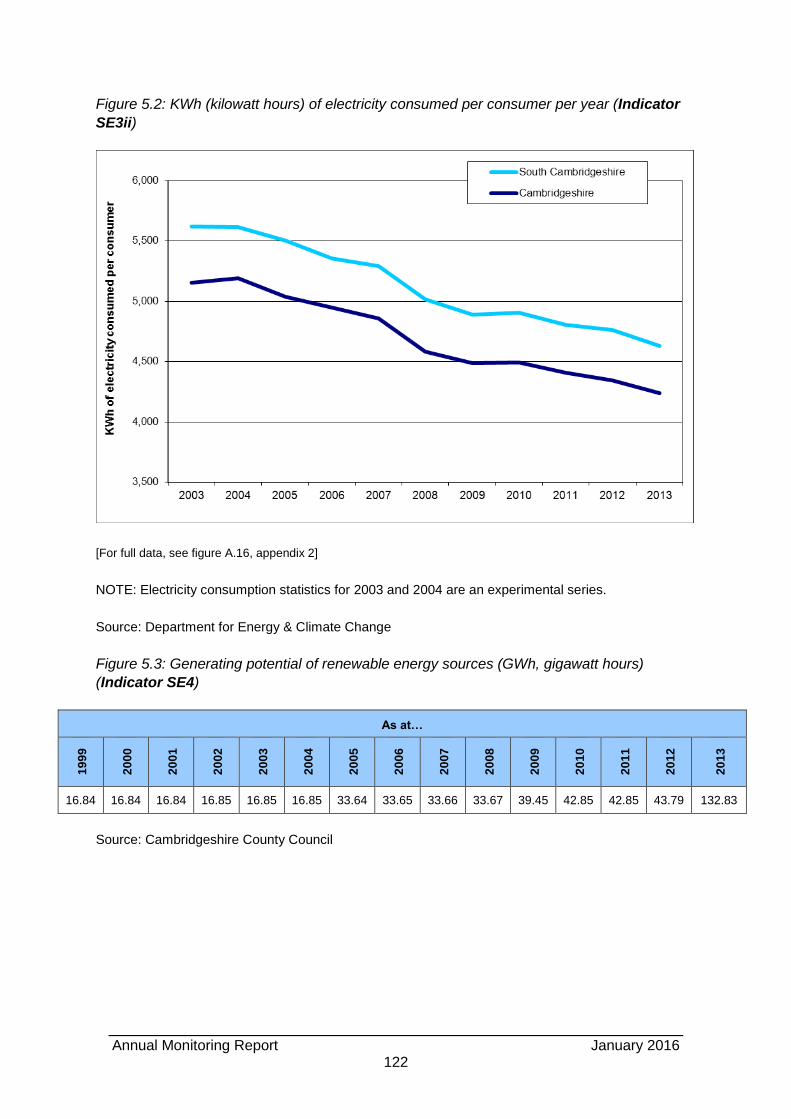
Annual Monitoring Report January 2016
122
Figure 5.2: KWh (kilowatt hours) of electricity consumed per consumer per year (Indicator
SE3ii)
[For full data, see figure A.16, appendix 2]
NOTE: Electricity consumption statistics for 2003 and 2004 are an experimental series.
Source: Department for Energy & Climate Change
Figure 5.3: Generating potential of renewable energy sources (GWh, gigawatt hours)
(Indicator SE4)
As at…
19
99
20
00
20
01
20
02
20
03
20
04
20
05
20
06
20
07
20
08
20
09
20
10
20
11
20
12
20
13
16.84 16.84 16.84 16.85 16.85 16.85 33.64 33.65 33.66 33.67 39.45 42.85 42.85 43.79 132.83
Source: Cambridgeshire County Council
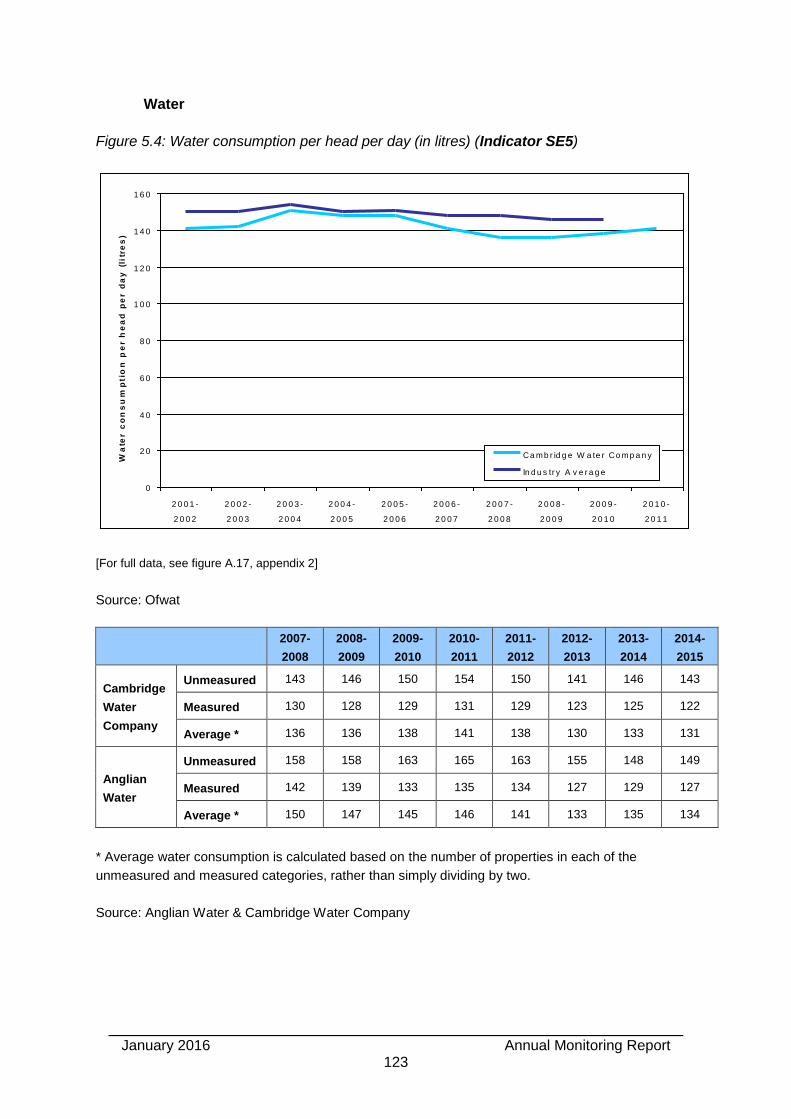
January 2016 Annual Monitoring Report
123
Water
Figure 5.4: Water consumption per head per day (in litres) (Indicator SE5)
0
2 0
4 0
6 0
8 0
1 0 0
1 2 0
1 4 0
1 6 0
2 0 0 1 -
2 0 0 2
2 0 0 2 -
2 0 0 3
2 0 0 3 -
2 0 0 4
2 0 0 4 -
2 0 0 5
2 0 0 5 -
2 0 0 6
2 0 0 6 -
2 0 0 7
2 0 0 7 -
2 0 0 8
2 0 0 8 -
2 0 0 9
2 0 0 9 -
2 0 1 0
2 0 1 0 -
2 0 1 1
Wa
ter c
on
su
mp
tio
n p
er h
ea
d p
er d
ay
(l
itr
es
)
Ca mb r id g e W a te r Co mp a n y
In d u s tr y A v e r a g e
[For full data, see figure A.17, appendix 2]
Source: Ofwat
2007-
2008
2008-
2009
2009-
2010
2010-
2011
2011-
2012
2012-
2013
2013-
2014
2014-
2015
Cambridge
Water
Company
Unmeasured 143 146 150 154 150 141 146 143
Measured 130 128 129 131 129 123 125 122
Average * 136 136 138 141 138 130 133 131
Anglian
Water
Unmeasured 158 158 163 165 163 155 148 149
Measured 142 139 133 135 134 127 129 127
Average * 150 147 145 146 141 133 135 134
* Average water consumption is calculated based on the number of properties in each of the
unmeasured and measured categories, rather than simply dividing by two.
Source: Anglian Water & Cambridge Water Company
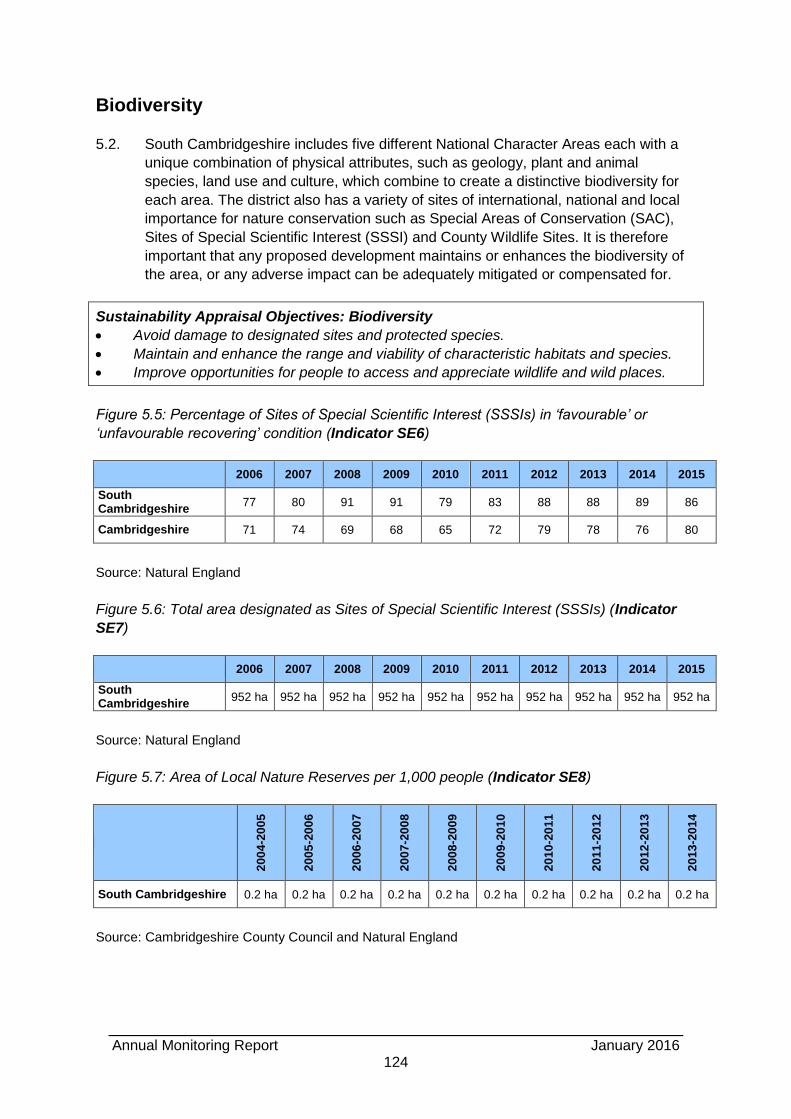
Annual Monitoring Report January 2016
124
Biodiversity
5.2. South Cambridgeshire includes five different National Character Areas each with a
unique combination of physical attributes, such as geology, plant and animal
species, land use and culture, which combine to create a distinctive biodiversity for
each area. The district also has a variety of sites of international, national and local
importance for nature conservation such as Special Areas of Conservation (SAC),
Sites of Special Scientific Interest (SSSI) and County Wildlife Sites. It is therefore
important that any proposed development maintains or enhances the biodiversity of
the area, or any adverse impact can be adequately mitigated or compensated for.
Sustainability Appraisal Objectives: Biodiversity
Avoid damage to designated sites and protected species.
Maintain and enhance the range and viability of characteristic habitats and species.
Improve opportunities for people to access and appreciate wildlife and wild places.
Figure 5.5: Percentage of Sites of Special Scientific Interest (SSSIs) in ‘favourable’ or
‘unfavourable recovering’ condition (Indicator SE6)
2006 2007 2008 2009 2010 2011 2012 2013 2014 2015
South Cambridgeshire
77 80 91 91 79 83 88 88 89 86
Cambridgeshire 71 74 69 68 65 72 79 78 76 80
Source: Natural England
Figure 5.6: Total area designated as Sites of Special Scientific Interest (SSSIs) (Indicator
SE7)
2006 2007 2008 2009 2010 2011 2012 2013 2014 2015
South Cambridgeshire
952 ha 952 ha 952 ha 952 ha 952 ha 952 ha 952 ha 952 ha 952 ha 952 ha
Source: Natural England
Figure 5.7: Area of Local Nature Reserves per 1,000 people (Indicator SE8)
20
04
-20
05
20
05
-20
06
20
06
-20
07
20
07
-20
08
20
08
-20
09
20
09
-20
10
20
10
-20
11
20
11
-20
12
20
12
-20
13
20
13
-20
14
South Cambridgeshire 0.2 ha 0.2 ha 0.2 ha 0.2 ha 0.2 ha 0.2 ha 0.2 ha 0.2 ha 0.2 ha 0.2 ha
Source: Cambridgeshire County Council and Natural England
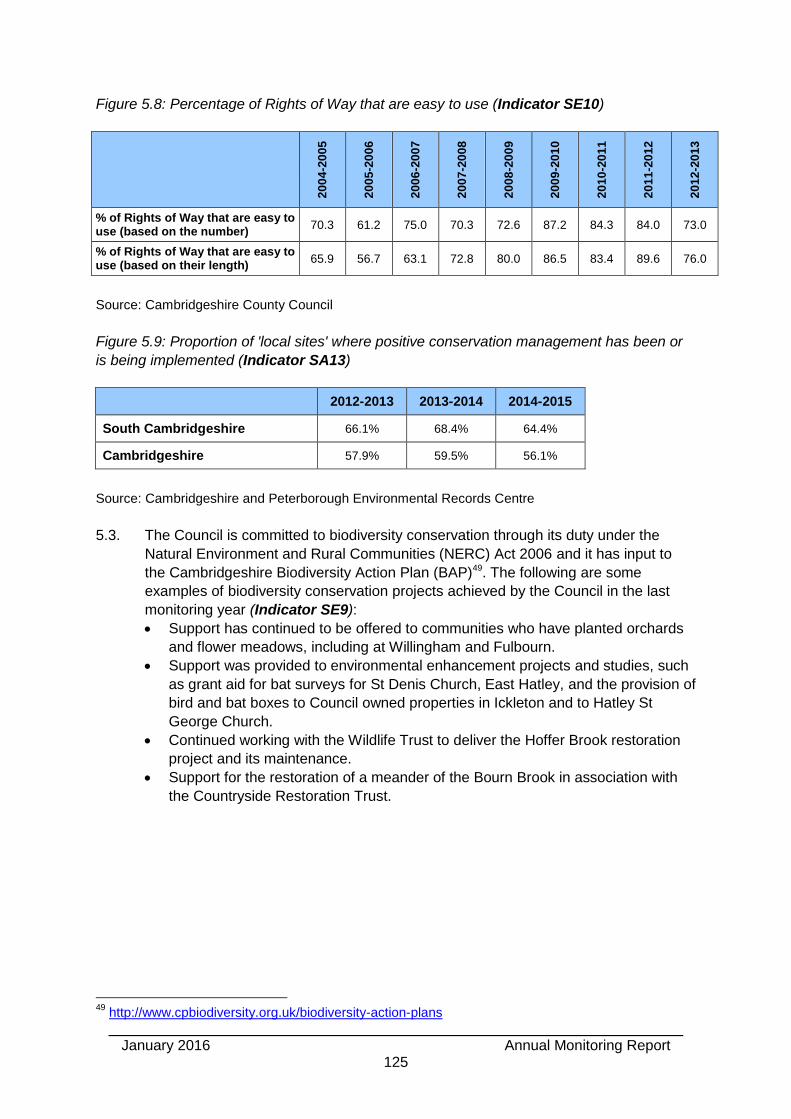
January 2016 Annual Monitoring Report
125
Figure 5.8: Percentage of Rights of Way that are easy to use (Indicator SE10)
20
04
-20
05
20
05
-20
06
20
06
-20
07
20
07
-20
08
20
08
-20
09
20
09
-20
10
20
10
-20
11
20
11
-20
12
20
12
-20
13
% of Rights of Way that are easy to use (based on the number)
70.3 61.2 75.0 70.3 72.6 87.2 84.3 84.0 73.0
% of Rights of Way that are easy to use (based on their length)
65.9 56.7 63.1 72.8 80.0 86.5 83.4 89.6 76.0
Source: Cambridgeshire County Council
Figure 5.9: Proportion of 'local sites' where positive conservation management has been or
is being implemented (Indicator SA13)
2012-2013 2013-2014 2014-2015
South Cambridgeshire 66.1% 68.4% 64.4%
Cambridgeshire 57.9% 59.5% 56.1%
Source: Cambridgeshire and Peterborough Environmental Records Centre
5.3. The Council is committed to biodiversity conservation through its duty under the
Natural Environment and Rural Communities (NERC) Act 2006 and it has input to
the Cambridgeshire Biodiversity Action Plan (BAP)49. The following are some
examples of biodiversity conservation projects achieved by the Council in the last
monitoring year (Indicator SE9):
Support has continued to be offered to communities who have planted orchards
and flower meadows, including at Willingham and Fulbourn.
Support was provided to environmental enhancement projects and studies, such
as grant aid for bat surveys for St Denis Church, East Hatley, and the provision of
bird and bat boxes to Council owned properties in Ickleton and to Hatley St
George Church.
Continued working with the Wildlife Trust to deliver the Hoffer Brook restoration
project and its maintenance.
Support for the restoration of a meander of the Bourn Brook in association with
the Countryside Restoration Trust.
49
http://www.cpbiodiversity.org.uk/biodiversity-action-plans
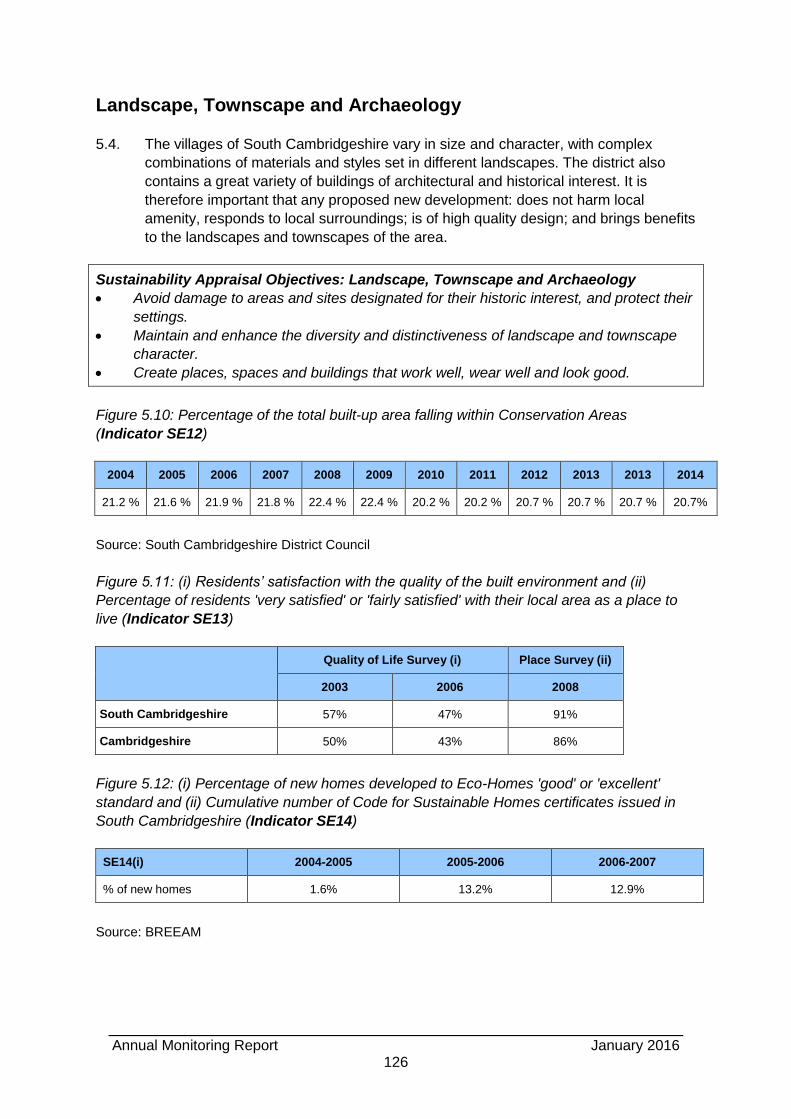
Annual Monitoring Report January 2016
126
Landscape, Townscape and Archaeology
5.4. The villages of South Cambridgeshire vary in size and character, with complex
combinations of materials and styles set in different landscapes. The district also
contains a great variety of buildings of architectural and historical interest. It is
therefore important that any proposed new development: does not harm local
amenity, responds to local surroundings; is of high quality design; and brings benefits
to the landscapes and townscapes of the area.
Sustainability Appraisal Objectives: Landscape, Townscape and Archaeology
Avoid damage to areas and sites designated for their historic interest, and protect their
settings.
Maintain and enhance the diversity and distinctiveness of landscape and townscape
character.
Create places, spaces and buildings that work well, wear well and look good.
Figure 5.10: Percentage of the total built-up area falling within Conservation Areas
(Indicator SE12)
2004 2005 2006 2007 2008 2009 2010 2011 2012 2013 2013 2014
21.2 % 21.6 % 21.9 % 21.8 % 22.4 % 22.4 % 20.2 % 20.2 % 20.7 % 20.7 % 20.7 % 20.7%
Source: South Cambridgeshire District Council
Figure 5.11: (i) Residents’ satisfaction with the quality of the built environment and (ii)
Percentage of residents 'very satisfied' or 'fairly satisfied' with their local area as a place to
live (Indicator SE13)
Quality of Life Survey (i) Place Survey (ii)
2003 2006 2008
South Cambridgeshire 57% 47% 91%
Cambridgeshire 50% 43% 86%
Figure 5.12: (i) Percentage of new homes developed to Eco-Homes 'good' or 'excellent'
standard and (ii) Cumulative number of Code for Sustainable Homes certificates issued in
South Cambridgeshire (Indicator SE14)
SE14(i) 2004-2005 2005-2006 2006-2007
% of new homes 1.6% 13.2% 12.9%
Source: BREEAM
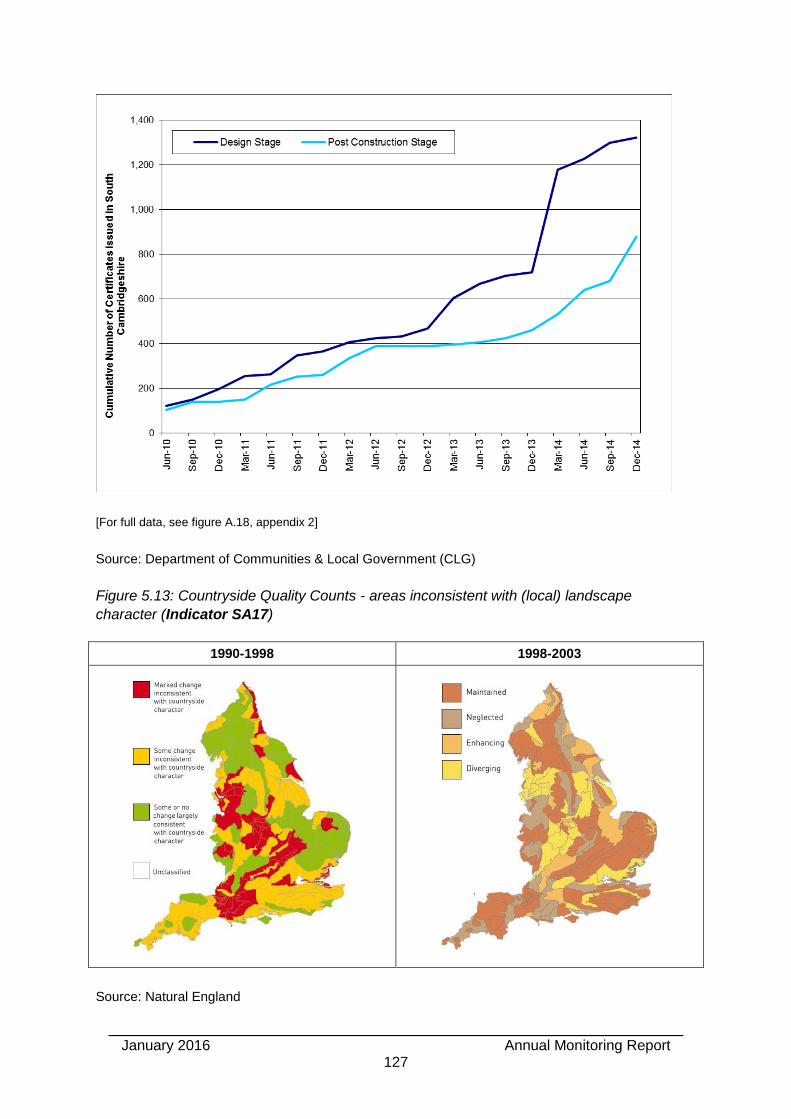
January 2016 Annual Monitoring Report
127
[For full data, see figure A.18, appendix 2]
Source: Department of Communities & Local Government (CLG)
Figure 5.13: Countryside Quality Counts - areas inconsistent with (local) landscape
character (Indicator SA17)
1990-1998 1998-2003
Source: Natural England
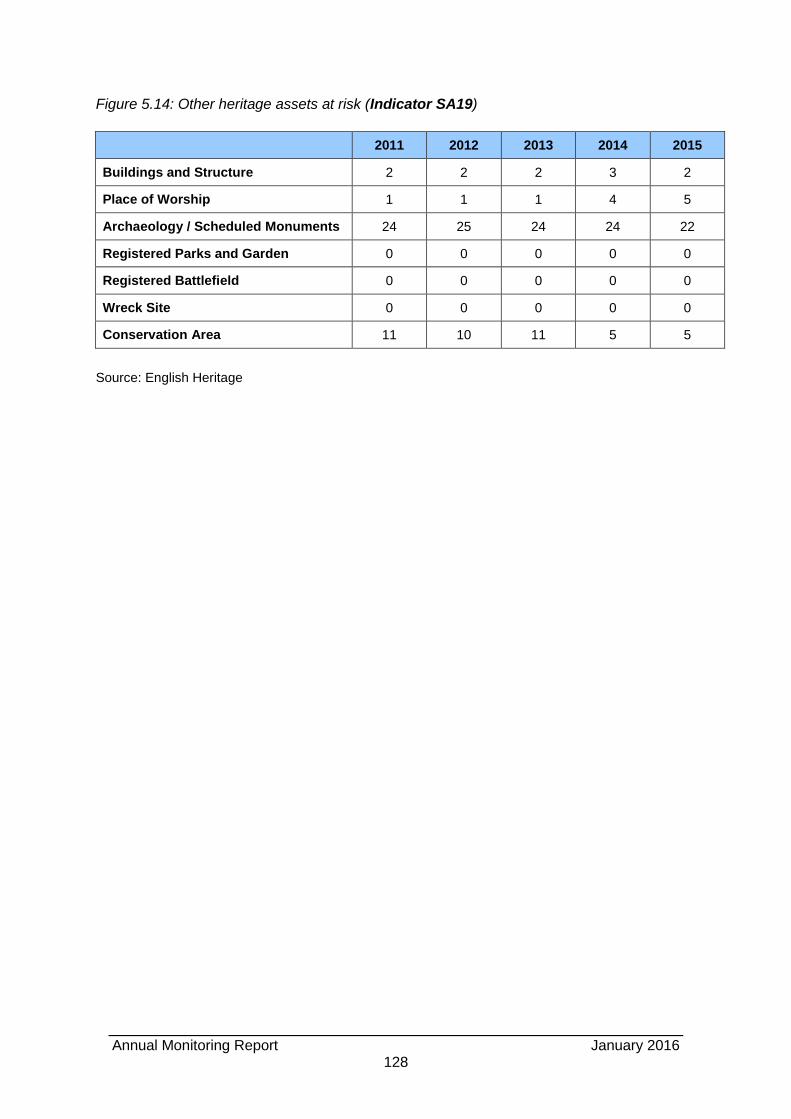
Annual Monitoring Report January 2016
128
Figure 5.14: Other heritage assets at risk (Indicator SA19)
2011 2012 2013 2014 2015
Buildings and Structure 2 2 2 3 2
Place of Worship 1 1 1 4 5
Archaeology / Scheduled Monuments 24 25 24 24 22
Registered Parks and Garden 0 0 0 0 0
Registered Battlefield 0 0 0 0 0
Wreck Site 0 0 0 0 0
Conservation Area 11 10 11 5 5
Source: English Heritage
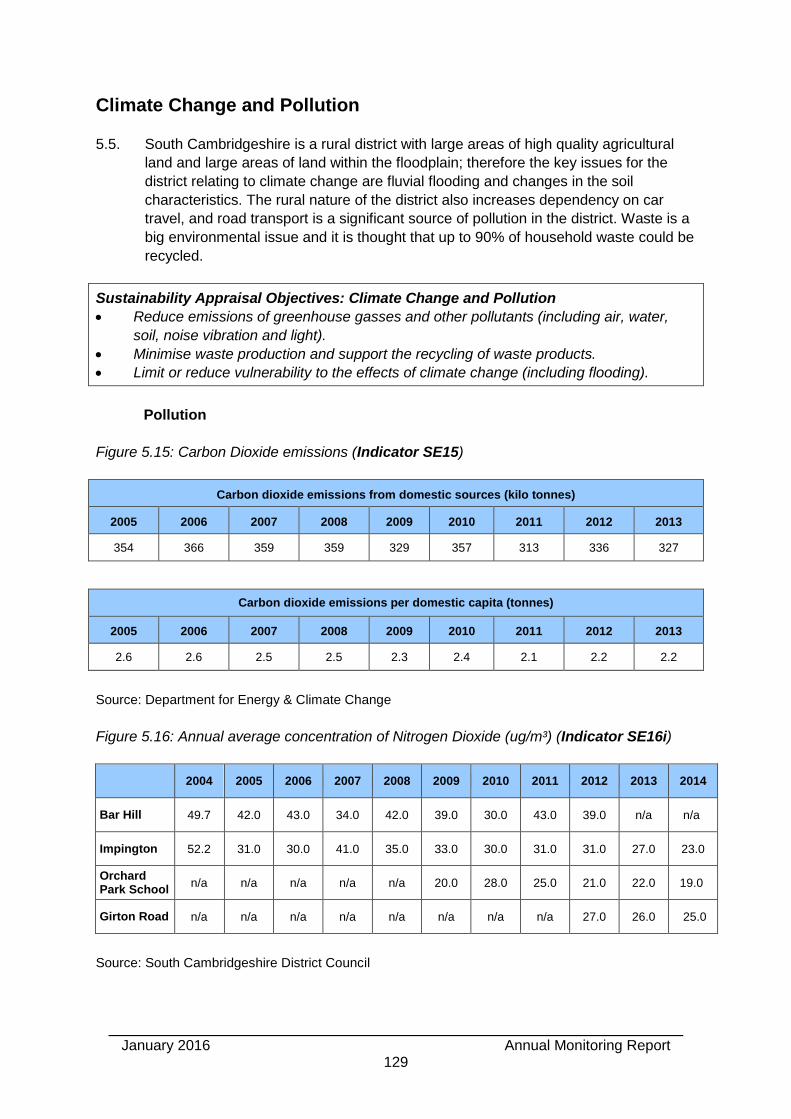
January 2016 Annual Monitoring Report
129
Climate Change and Pollution
5.5. South Cambridgeshire is a rural district with large areas of high quality agricultural
land and large areas of land within the floodplain; therefore the key issues for the
district relating to climate change are fluvial flooding and changes in the soil
characteristics. The rural nature of the district also increases dependency on car
travel, and road transport is a significant source of pollution in the district. Waste is a
big environmental issue and it is thought that up to 90% of household waste could be
recycled.
Sustainability Appraisal Objectives: Climate Change and Pollution
Reduce emissions of greenhouse gasses and other pollutants (including air, water,
soil, noise vibration and light).
Minimise waste production and support the recycling of waste products.
Limit or reduce vulnerability to the effects of climate change (including flooding).
Pollution
Figure 5.15: Carbon Dioxide emissions (Indicator SE15)
Carbon dioxide emissions from domestic sources (kilo tonnes)
2005 2006 2007 2008 2009 2010 2011 2012 2013
354 366 359 359 329 357 313 336 327
Carbon dioxide emissions per domestic capita (tonnes)
2005 2006 2007 2008 2009 2010 2011 2012 2013
2.6 2.6 2.5 2.5 2.3 2.4 2.1 2.2 2.2
Source: Department for Energy & Climate Change
Figure 5.16: Annual average concentration of Nitrogen Dioxide (ug/m³) (Indicator SE16i)
2004 2005 2006 2007 2008 2009 2010 2011 2012 2013 2014
Bar Hill 49.7 42.0 43.0 34.0 42.0 39.0 30.0 43.0 39.0 n/a n/a
Impington 52.2 31.0 30.0 41.0 35.0 33.0 30.0 31.0 31.0 27.0 23.0
Orchard Park School
n/a n/a n/a n/a n/a 20.0 28.0 25.0 21.0 22.0 19.0
Girton Road n/a n/a n/a n/a n/a n/a n/a n/a 27.0 26.0 25.0
Source: South Cambridgeshire District Council
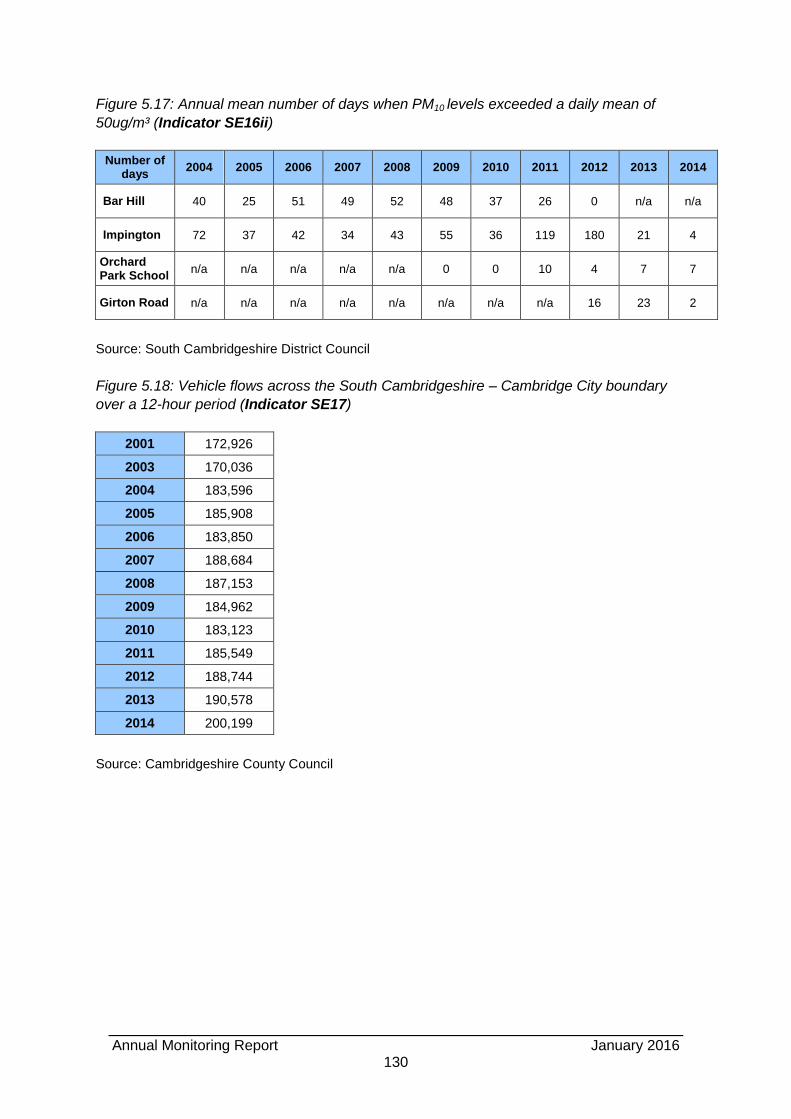
Annual Monitoring Report January 2016
130
Figure 5.17: Annual mean number of days when PM10 levels exceeded a daily mean of
50ug/m³ (Indicator SE16ii)
Number of days
2004 2005 2006 2007 2008 2009 2010 2011 2012 2013 2014
Bar Hill 40 25 51 49 52 48 37 26 0 n/a n/a
Impington 72 37 42 34 43 55 36 119 180 21 4
Orchard Park School
n/a n/a n/a n/a n/a 0 0 10 4 7 7
Girton Road n/a n/a n/a n/a n/a n/a n/a n/a 16 23 2
Source: South Cambridgeshire District Council
Figure 5.18: Vehicle flows across the South Cambridgeshire – Cambridge City boundary
over a 12-hour period (Indicator SE17)
2001 172,926
2003 170,036
2004 183,596
2005 185,908
2006 183,850
2007 188,684
2008 187,153
2009 184,962
2010 183,123
2011 185,549
2012 188,744
2013 190,578
2014 200,199
Source: Cambridgeshire County Council
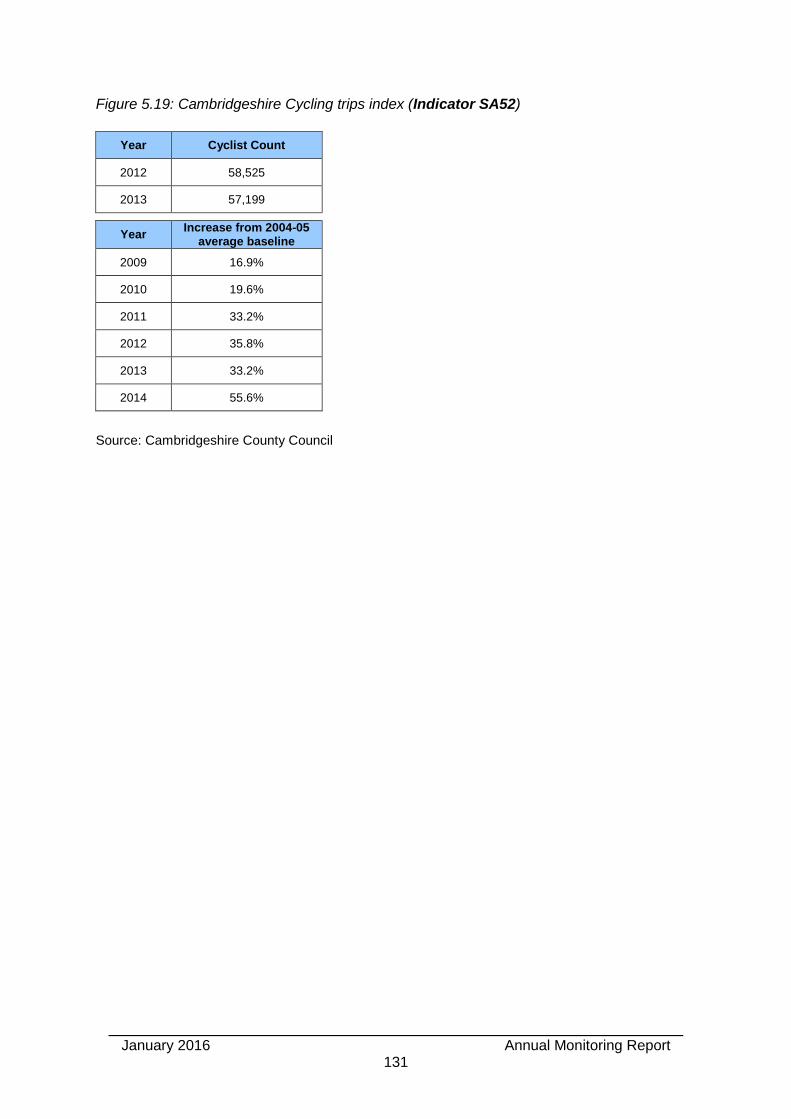
January 2016 Annual Monitoring Report
131
Figure 5.19: Cambridgeshire Cycling trips index (Indicator SA52)
Year Cyclist Count
2012 58,525
2013 57,199
Year
Increase from 2004-05 average baseline
2009 16.9%
2010 19.6%
2011 33.2%
2012 35.8%
2013 33.2%
2014 55.6%
Source: Cambridgeshire County Council
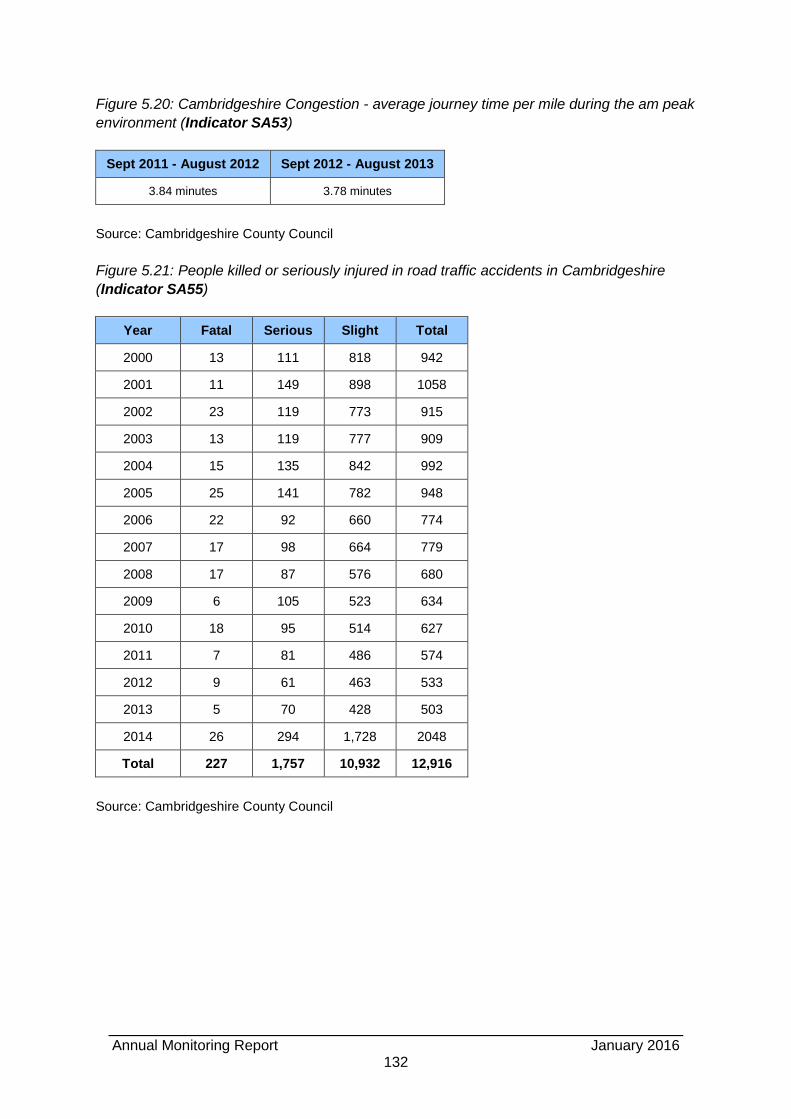
Annual Monitoring Report January 2016
132
Figure 5.20: Cambridgeshire Congestion - average journey time per mile during the am peak
environment (Indicator SA53)
Sept 2011 - August 2012 Sept 2012 - August 2013
3.84 minutes 3.78 minutes
Source: Cambridgeshire County Council
Figure 5.21: People killed or seriously injured in road traffic accidents in Cambridgeshire
(Indicator SA55)
Year Fatal Serious Slight Total
2000 13 111 818 942
2001 11 149 898 1058
2002 23 119 773 915
2003 13 119 777 909
2004 15 135 842 992
2005 25 141 782 948
2006 22 92 660 774
2007 17 98 664 779
2008 17 87 576 680
2009 6 105 523 634
2010 18 95 514 627
2011 7 81 486 574
2012 9 61 463 533
2013 5 70 428 503
2014 26 294 1,728 2048
Total 227 1,757 10,932 12,916
Source: Cambridgeshire County Council
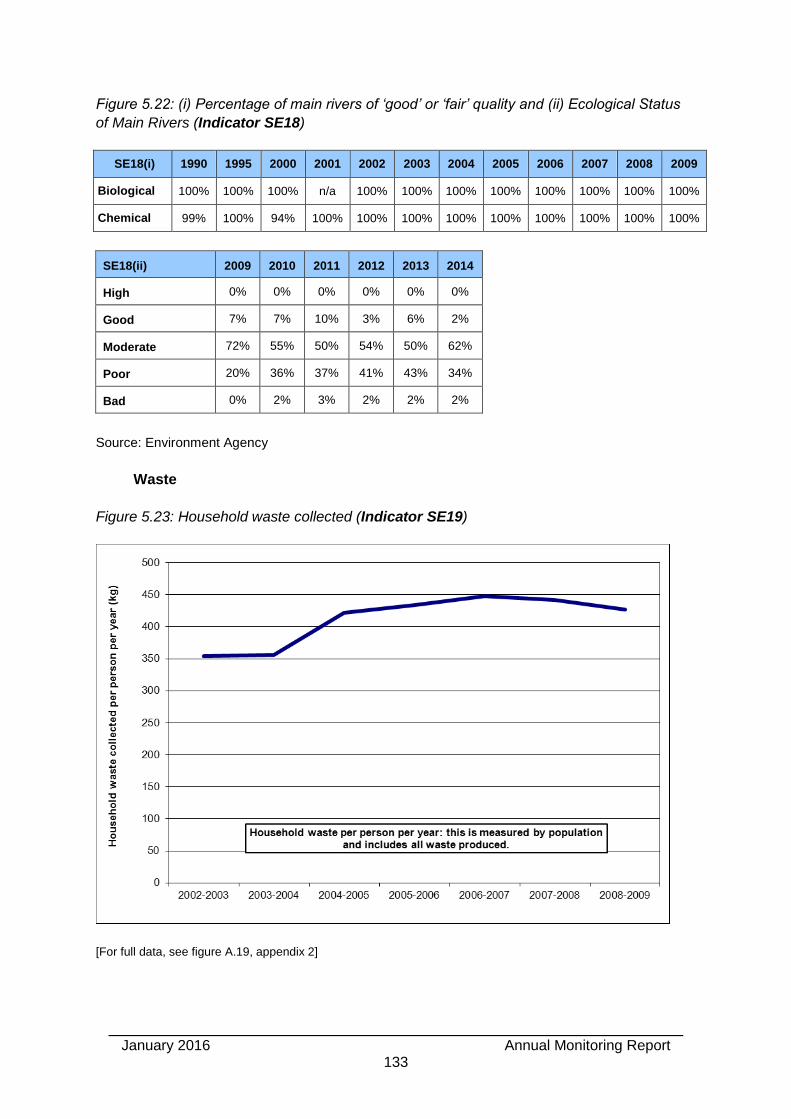
January 2016 Annual Monitoring Report
133
Figure 5.22: (i) Percentage of main rivers of ‘good’ or ‘fair’ quality and (ii) Ecological Status
of Main Rivers (Indicator SE18)
SE18(i) 1990 1995 2000 2001 2002 2003 2004 2005 2006 2007 2008 2009
Biological 100% 100% 100% n/a 100% 100% 100% 100% 100% 100% 100% 100%
Chemical 99% 100% 94% 100% 100% 100% 100% 100% 100% 100% 100% 100%
SE18(ii) 2009 2010 2011 2012 2013 2014
High 0% 0% 0% 0% 0% 0%
Good 7% 7% 10% 3% 6% 2%
Moderate 72% 55% 50% 54% 50% 62%
Poor 20% 36% 37% 41% 43% 34%
Bad 0% 2% 3% 2% 2% 2%
Source: Environment Agency
Waste
Figure 5.23: Household waste collected (Indicator SE19)
[For full data, see figure A.19, appendix 2]
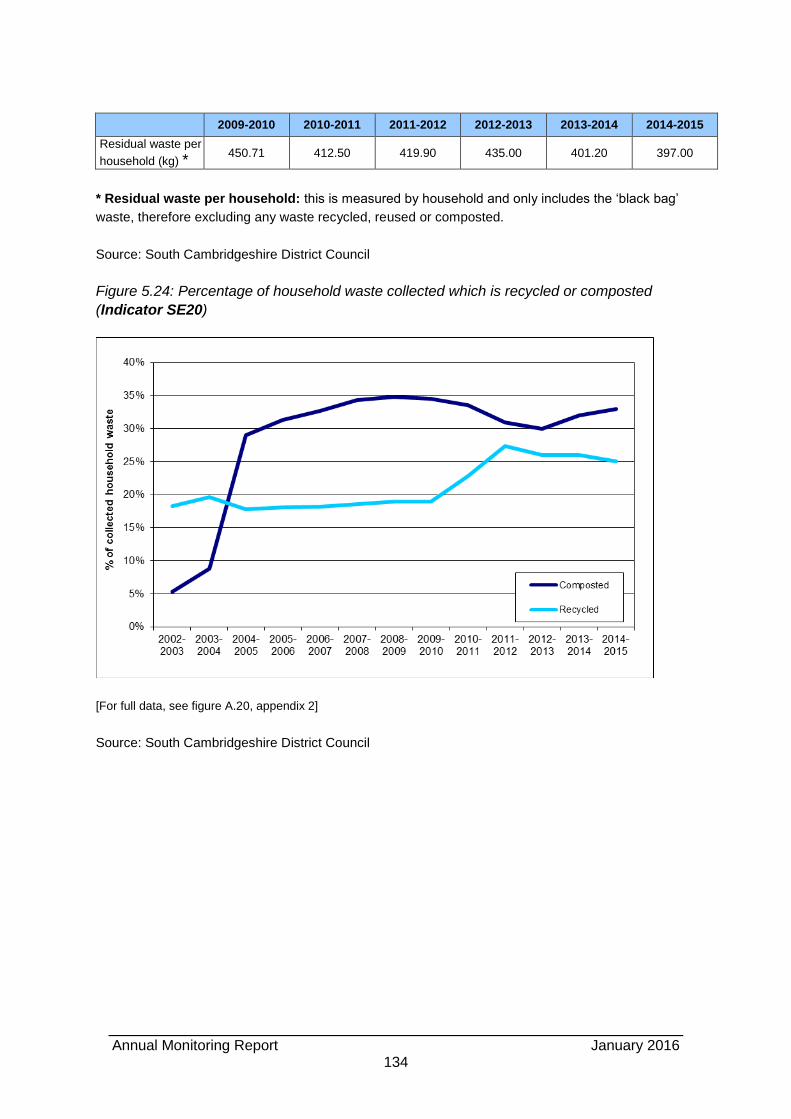
Annual Monitoring Report January 2016
134
2009-2010 2010-2011 2011-2012 2012-2013 2013-2014 2014-2015
Residual waste per
household (kg) * 450.71 412.50 419.90 435.00 401.20 397.00
* Residual waste per household: this is measured by household and only includes the ‘black bag’
waste, therefore excluding any waste recycled, reused or composted.
Source: South Cambridgeshire District Council
Figure 5.24: Percentage of household waste collected which is recycled or composted
(Indicator SE20)
[For full data, see figure A.20, appendix 2]
Source: South Cambridgeshire District Council
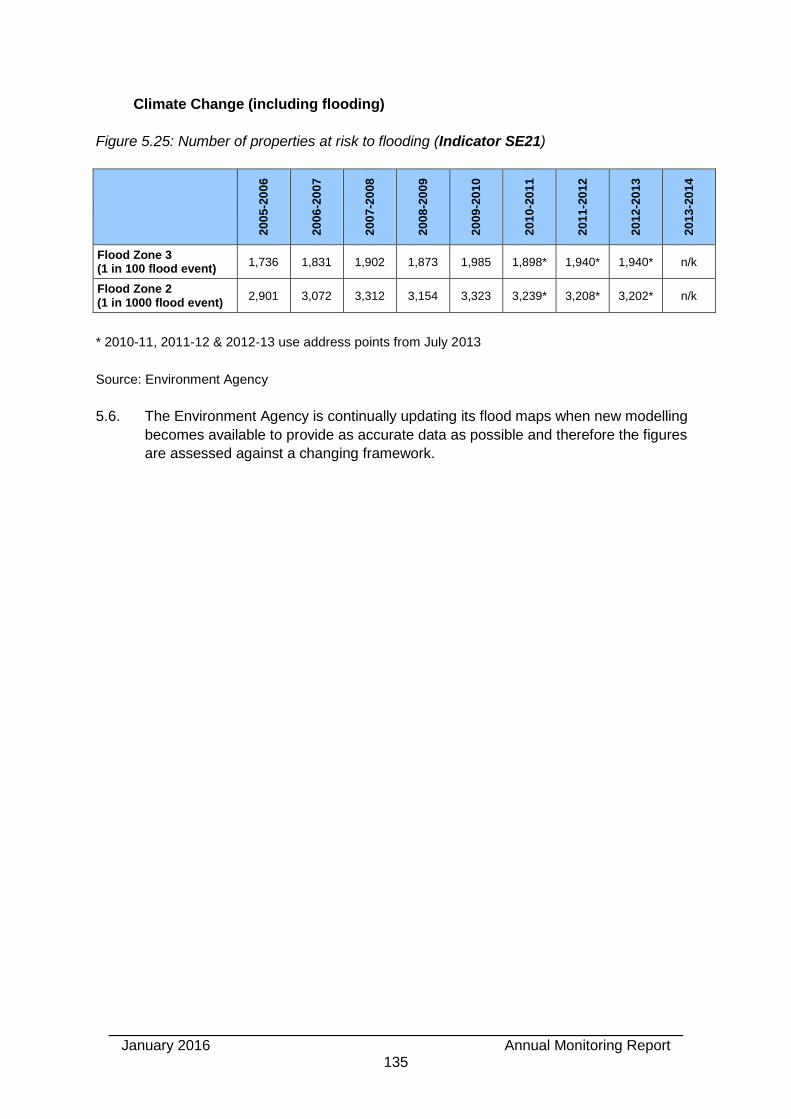
January 2016 Annual Monitoring Report
135
Climate Change (including flooding)
Figure 5.25: Number of properties at risk to flooding (Indicator SE21)
20
05
-20
06
20
06
-20
07
20
07
-20
08
20
08
-20
09
20
09
-20
10
20
10
-20
11
20
11
-20
12
20
12
-20
13
20
13
-20
14
Flood Zone 3 (1 in 100 flood event)
1,736 1,831 1,902 1,873 1,985 1,898* 1,940* 1,940* n/k
Flood Zone 2 (1 in 1000 flood event)
2,901 3,072 3,312 3,154 3,323 3,239* 3,208* 3,202* n/k
* 2010-11, 2011-12 & 2012-13 use address points from July 2013
Source: Environment Agency
5.6. The Environment Agency is continually updating its flood maps when new modelling
becomes available to provide as accurate data as possible and therefore the figures
are assessed against a changing framework.
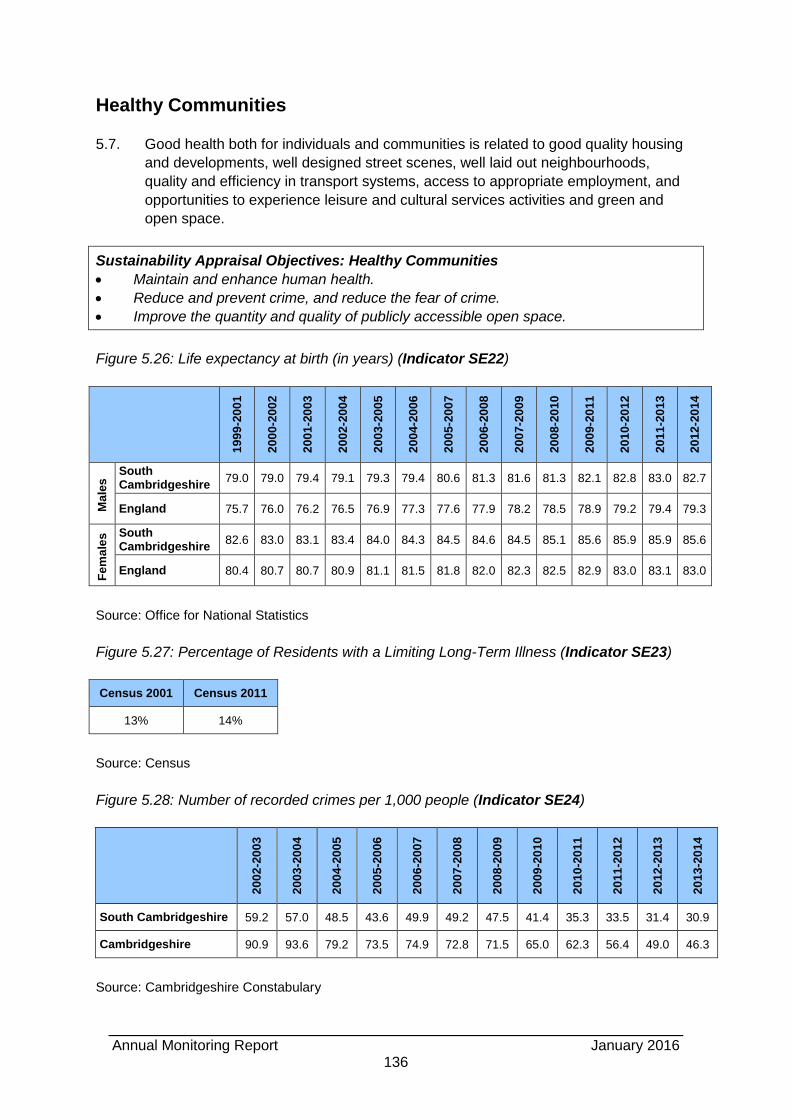
Annual Monitoring Report January 2016
136
Healthy Communities
5.7. Good health both for individuals and communities is related to good quality housing
and developments, well designed street scenes, well laid out neighbourhoods,
quality and efficiency in transport systems, access to appropriate employment, and
opportunities to experience leisure and cultural services activities and green and
open space.
Sustainability Appraisal Objectives: Healthy Communities
Maintain and enhance human health.
Reduce and prevent crime, and reduce the fear of crime.
Improve the quantity and quality of publicly accessible open space.
Figure 5.26: Life expectancy at birth (in years) (Indicator SE22)
19
99
-20
01
20
00
-20
02
20
01
-20
03
20
02
-20
04
20
03
-20
05
20
04
-20
06
20
05
-20
07
20
06
-20
08
20
07
-20
09
20
08
-20
10
20
09
-20
11
20
10
-20
12
20
11
-20
13
20
12
-20
14
Ma
les South
Cambridgeshire 79.0 79.0 79.4 79.1 79.3 79.4 80.6 81.3 81.6 81.3 82.1 82.8 83.0 82.7
England 75.7 76.0 76.2 76.5 76.9 77.3 77.6 77.9 78.2 78.5 78.9 79.2 79.4 79.3
Fe
ma
les South
Cambridgeshire 82.6 83.0 83.1 83.4 84.0 84.3 84.5 84.6 84.5 85.1 85.6 85.9 85.9 85.6
England 80.4 80.7 80.7 80.9 81.1 81.5 81.8 82.0 82.3 82.5 82.9 83.0 83.1 83.0
Source: Office for National Statistics
Figure 5.27: Percentage of Residents with a Limiting Long-Term Illness (Indicator SE23)
Census 2001 Census 2011
13% 14%
Source: Census
Figure 5.28: Number of recorded crimes per 1,000 people (Indicator SE24)
20
02
-20
03
20
03
-20
04
20
04
-20
05
20
05
-20
06
20
06
-20
07
20
07
-20
08
20
08
-20
09
20
09
-20
10
20
10
-20
11
20
11
-20
12
20
12
-20
13
20
13
-20
14
South Cambridgeshire 59.2 57.0 48.5 43.6 49.9 49.2 47.5 41.4 35.3 33.5 31.4 30.9
Cambridgeshire 90.9 93.6 79.2 73.5 74.9 72.8 71.5 65.0 62.3 56.4 49.0 46.3
Source: Cambridgeshire Constabulary
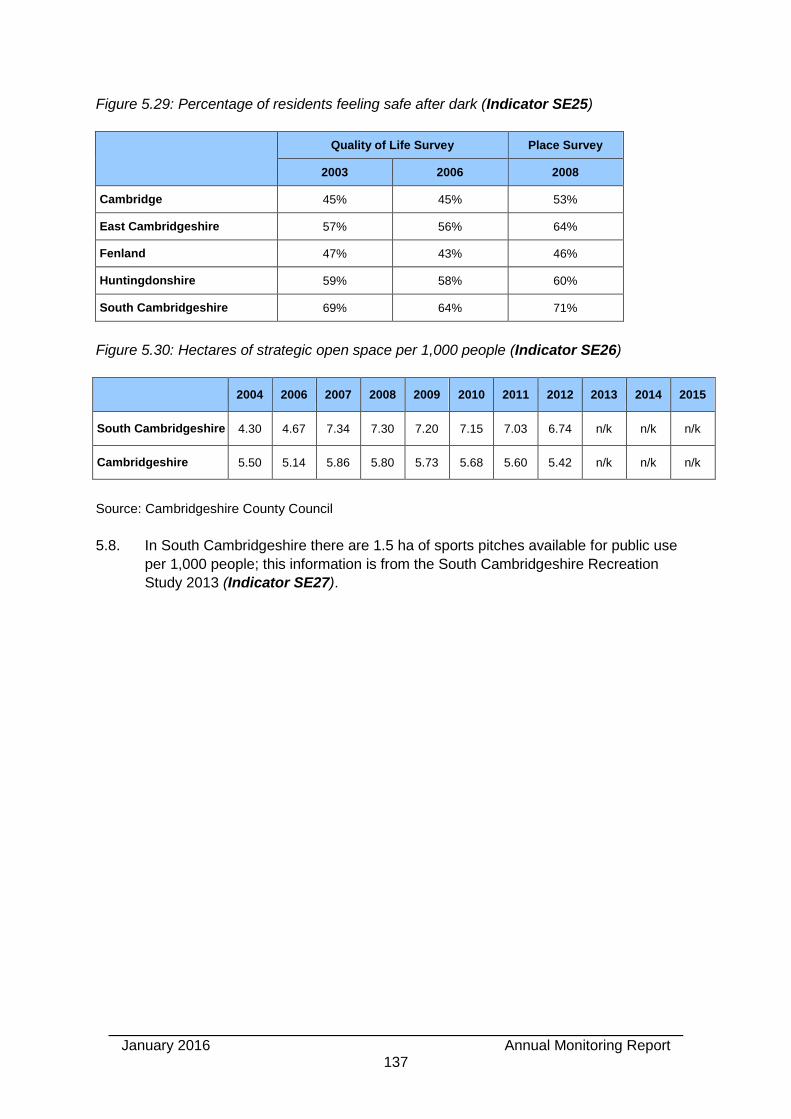
January 2016 Annual Monitoring Report
137
Figure 5.29: Percentage of residents feeling safe after dark (Indicator SE25)
Quality of Life Survey Place Survey
2003 2006 2008
Cambridge 45% 45% 53%
East Cambridgeshire 57% 56% 64%
Fenland 47% 43% 46%
Huntingdonshire 59% 58% 60%
South Cambridgeshire 69% 64% 71%
Figure 5.30: Hectares of strategic open space per 1,000 people (Indicator SE26)
2004 2006 2007 2008 2009 2010 2011 2012 2013 2014 2015
South Cambridgeshire 4.30 4.67 7.34 7.30 7.20 7.15 7.03 6.74 n/k n/k n/k
Cambridgeshire 5.50 5.14 5.86 5.80 5.73 5.68 5.60 5.42 n/k n/k n/k
Source: Cambridgeshire County Council
5.8. In South Cambridgeshire there are 1.5 ha of sports pitches available for public use
per 1,000 people; this information is from the South Cambridgeshire Recreation
Study 2013 (Indicator SE27).
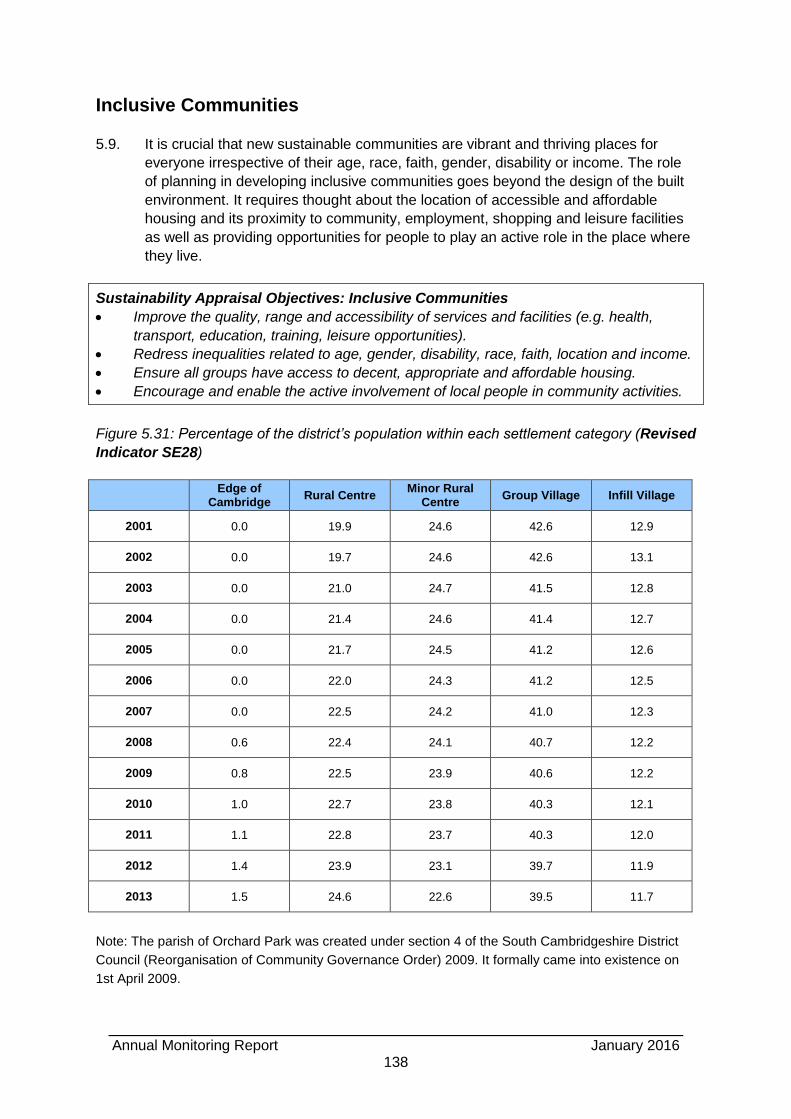
Annual Monitoring Report January 2016
138
Inclusive Communities
5.9. It is crucial that new sustainable communities are vibrant and thriving places for
everyone irrespective of their age, race, faith, gender, disability or income. The role
of planning in developing inclusive communities goes beyond the design of the built
environment. It requires thought about the location of accessible and affordable
housing and its proximity to community, employment, shopping and leisure facilities
as well as providing opportunities for people to play an active role in the place where
they live.
Sustainability Appraisal Objectives: Inclusive Communities
Improve the quality, range and accessibility of services and facilities (e.g. health,
transport, education, training, leisure opportunities).
Redress inequalities related to age, gender, disability, race, faith, location and income.
Ensure all groups have access to decent, appropriate and affordable housing.
Encourage and enable the active involvement of local people in community activities.
Figure 5.31: Percentage of the district’s population within each settlement category (Revised
Indicator SE28)
Edge of
Cambridge Rural Centre
Minor Rural Centre
Group Village Infill Village
2001 0.0 19.9 24.6 42.6 12.9
2002 0.0 19.7 24.6 42.6 13.1
2003 0.0 21.0 24.7 41.5 12.8
2004 0.0 21.4 24.6 41.4 12.7
2005 0.0 21.7 24.5 41.2 12.6
2006 0.0 22.0 24.3 41.2 12.5
2007 0.0 22.5 24.2 41.0 12.3
2008 0.6 22.4 24.1 40.7 12.2
2009 0.8 22.5 23.9 40.6 12.2
2010 1.0 22.7 23.8 40.3 12.1
2011 1.1 22.8 23.7 40.3 12.0
2012 1.4 23.9 23.1 39.7 11.9
2013 1.5 24.6 22.6 39.5 11.7
Note: The parish of Orchard Park was created under section 4 of the South Cambridgeshire District
Council (Reorganisation of Community Governance Order) 2009. It formally came into existence on
1st April 2009.
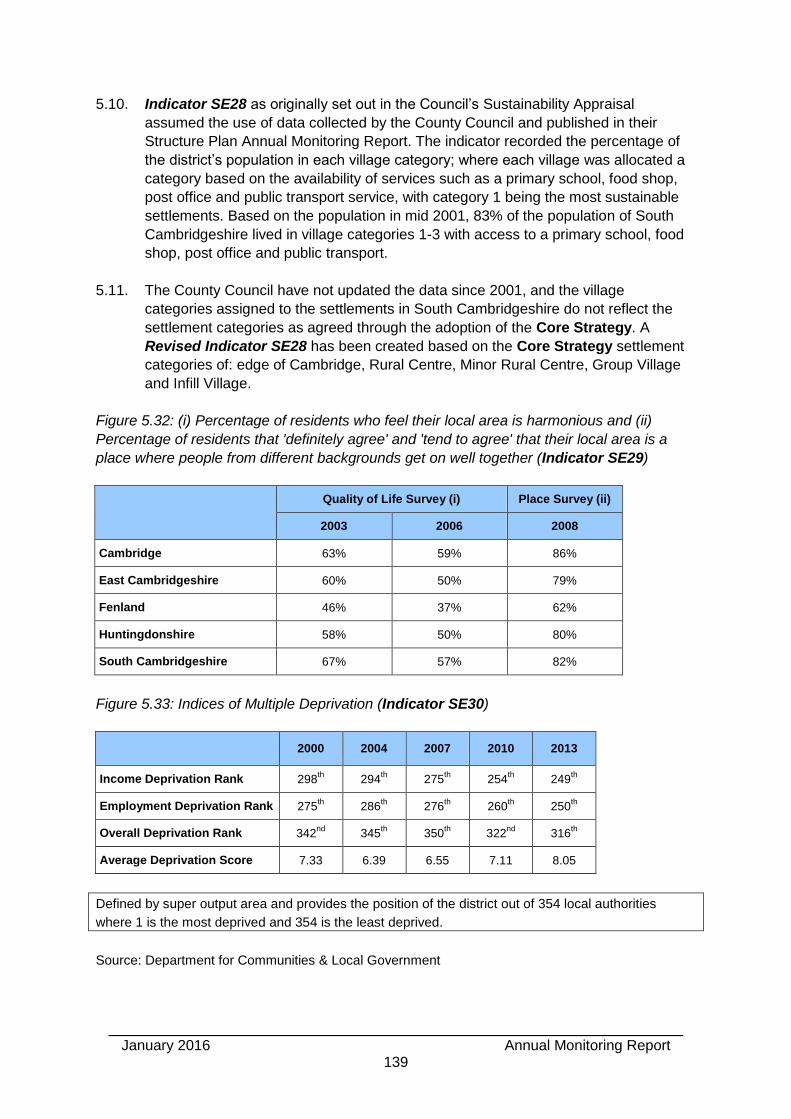
January 2016 Annual Monitoring Report
139
5.10. Indicator SE28 as originally set out in the Council’s Sustainability Appraisal
assumed the use of data collected by the County Council and published in their
Structure Plan Annual Monitoring Report. The indicator recorded the percentage of
the district’s population in each village category; where each village was allocated a
category based on the availability of services such as a primary school, food shop,
post office and public transport service, with category 1 being the most sustainable
settlements. Based on the population in mid 2001, 83% of the population of South
Cambridgeshire lived in village categories 1-3 with access to a primary school, food
shop, post office and public transport.
5.11. The County Council have not updated the data since 2001, and the village
categories assigned to the settlements in South Cambridgeshire do not reflect the
settlement categories as agreed through the adoption of the Core Strategy. A
Revised Indicator SE28 has been created based on the Core Strategy settlement
categories of: edge of Cambridge, Rural Centre, Minor Rural Centre, Group Village
and Infill Village.
Figure 5.32: (i) Percentage of residents who feel their local area is harmonious and (ii)
Percentage of residents that 'definitely agree' and 'tend to agree' that their local area is a
place where people from different backgrounds get on well together (Indicator SE29)
Quality of Life Survey (i) Place Survey (ii)
2003 2006 2008
Cambridge 63% 59% 86%
East Cambridgeshire 60% 50% 79%
Fenland 46% 37% 62%
Huntingdonshire 58% 50% 80%
South Cambridgeshire 67% 57% 82%
Figure 5.33: Indices of Multiple Deprivation (Indicator SE30)
2000 2004 2007 2010 2013
Income Deprivation Rank 298th 294
th 275
th 254
th 249
th
Employment Deprivation Rank 275th 286
th 276
th 260
th 250
th
Overall Deprivation Rank 342nd
345th 350
th 322
nd 316
th
Average Deprivation Score 7.33 6.39 6.55 7.11 8.05
Defined by super output area and provides the position of the district out of 354 local authorities
where 1 is the most deprived and 354 is the least deprived.
Source: Department for Communities & Local Government
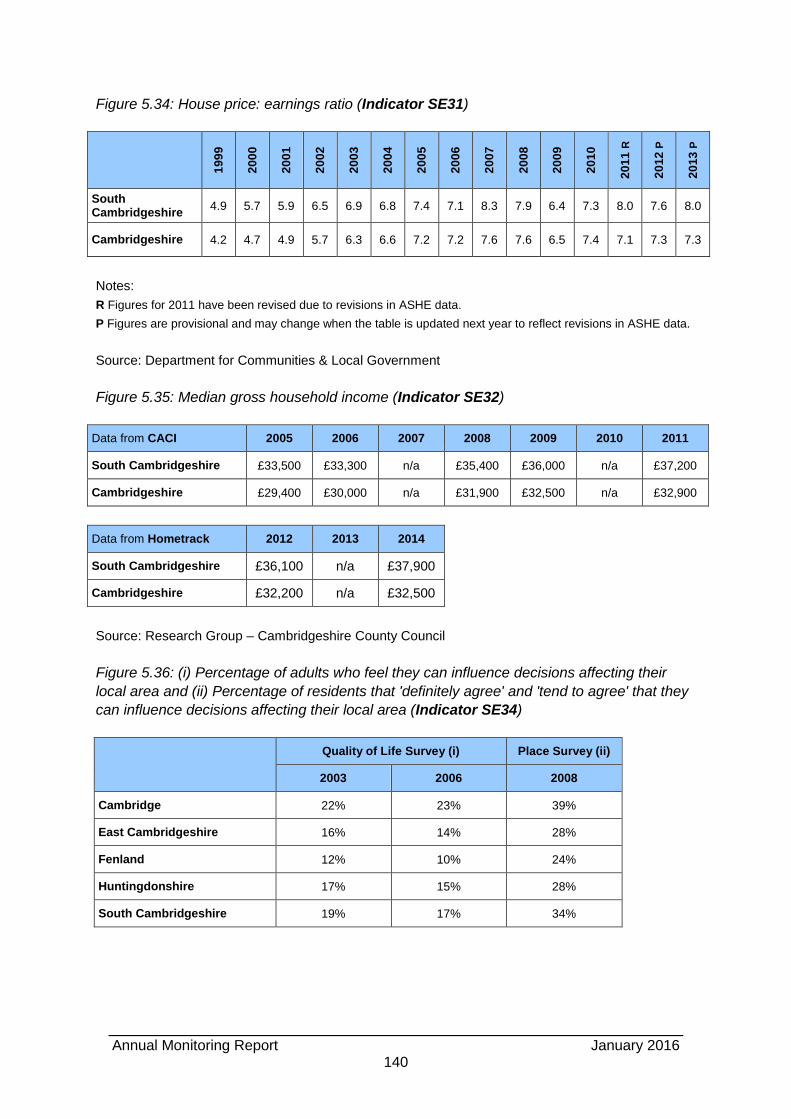
Annual Monitoring Report January 2016
140
Figure 5.34: House price: earnings ratio (Indicator SE31)
19
99
20
00
20
01
20
02
20
03
20
04
20
05
20
06
20
07
20
08
20
09
20
10
20
11
R
20
12
P
20
13
P
South Cambridgeshire
4.9 5.7 5.9 6.5 6.9 6.8 7.4 7.1 8.3 7.9 6.4 7.3 8.0 7.6 8.0
Cambridgeshire 4.2 4.7 4.9 5.7 6.3 6.6 7.2 7.2 7.6 7.6 6.5 7.4 7.1 7.3 7.3
Notes:
R Figures for 2011 have been revised due to revisions in ASHE data.
P Figures are provisional and may change when the table is updated next year to reflect revisions in ASHE data.
Source: Department for Communities & Local Government
Figure 5.35: Median gross household income (Indicator SE32)
Data from CACI 2005 2006 2007 2008 2009 2010 2011
South Cambridgeshire £33,500 £33,300 n/a £35,400 £36,000 n/a £37,200
Cambridgeshire £29,400 £30,000 n/a £31,900 £32,500 n/a £32,900
Data from Hometrack 2012 2013 2014
South Cambridgeshire £36,100 n/a £37,900
Cambridgeshire £32,200 n/a £32,500
Source: Research Group – Cambridgeshire County Council
Figure 5.36: (i) Percentage of adults who feel they can influence decisions affecting their
local area and (ii) Percentage of residents that 'definitely agree' and 'tend to agree' that they
can influence decisions affecting their local area (Indicator SE34)
Quality of Life Survey (i) Place Survey (ii)
2003 2006 2008
Cambridge 22% 23% 39%
East Cambridgeshire 16% 14% 28%
Fenland 12% 10% 24%
Huntingdonshire 17% 15% 28%
South Cambridgeshire 19% 17% 34%
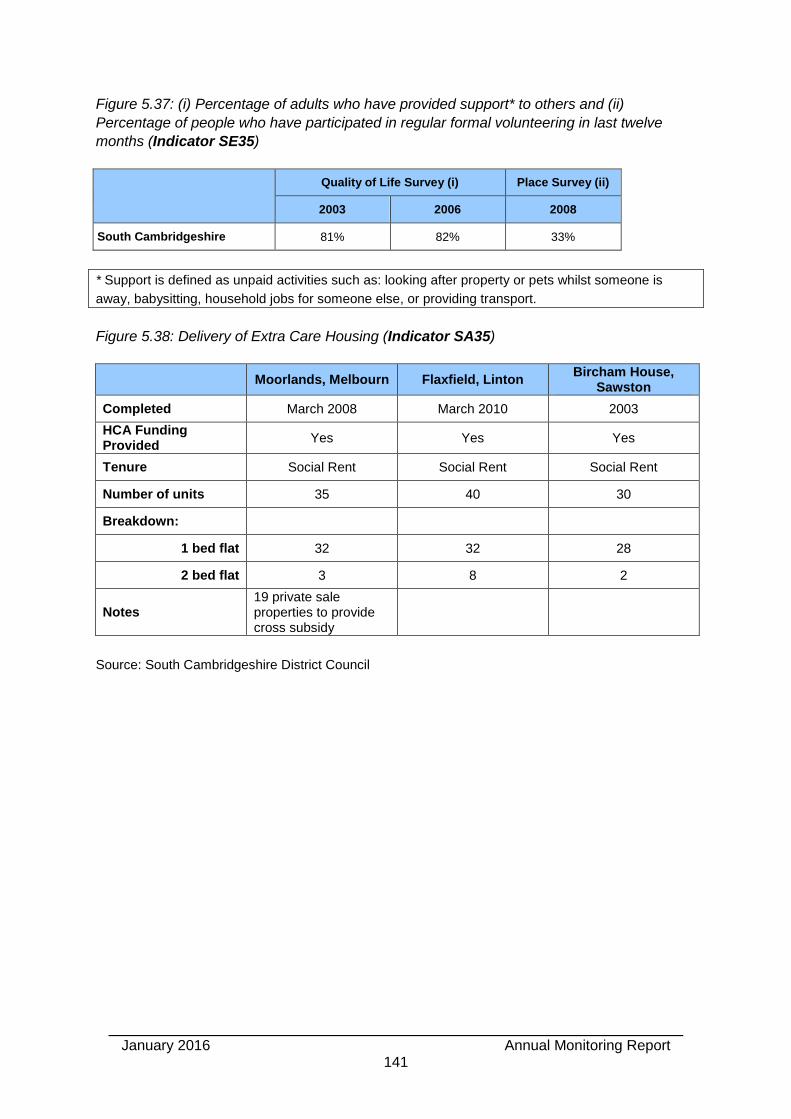
January 2016 Annual Monitoring Report
141
Figure 5.37: (i) Percentage of adults who have provided support* to others and (ii)
Percentage of people who have participated in regular formal volunteering in last twelve
months (Indicator SE35)
Quality of Life Survey (i) Place Survey (ii)
2003 2006 2008
South Cambridgeshire 81% 82% 33%
* Support is defined as unpaid activities such as: looking after property or pets whilst someone is
away, babysitting, household jobs for someone else, or providing transport.
Figure 5.38: Delivery of Extra Care Housing (Indicator SA35)
Moorlands, Melbourn Flaxfield, Linton Bircham House,
Sawston
Completed March 2008 March 2010 2003
HCA Funding Provided
Yes Yes Yes
Tenure Social Rent Social Rent Social Rent
Number of units 35 40 30
Breakdown:
1 bed flat 32 32 28
2 bed flat 3 8 2
Notes 19 private sale properties to provide cross subsidy
Source: South Cambridgeshire District Council
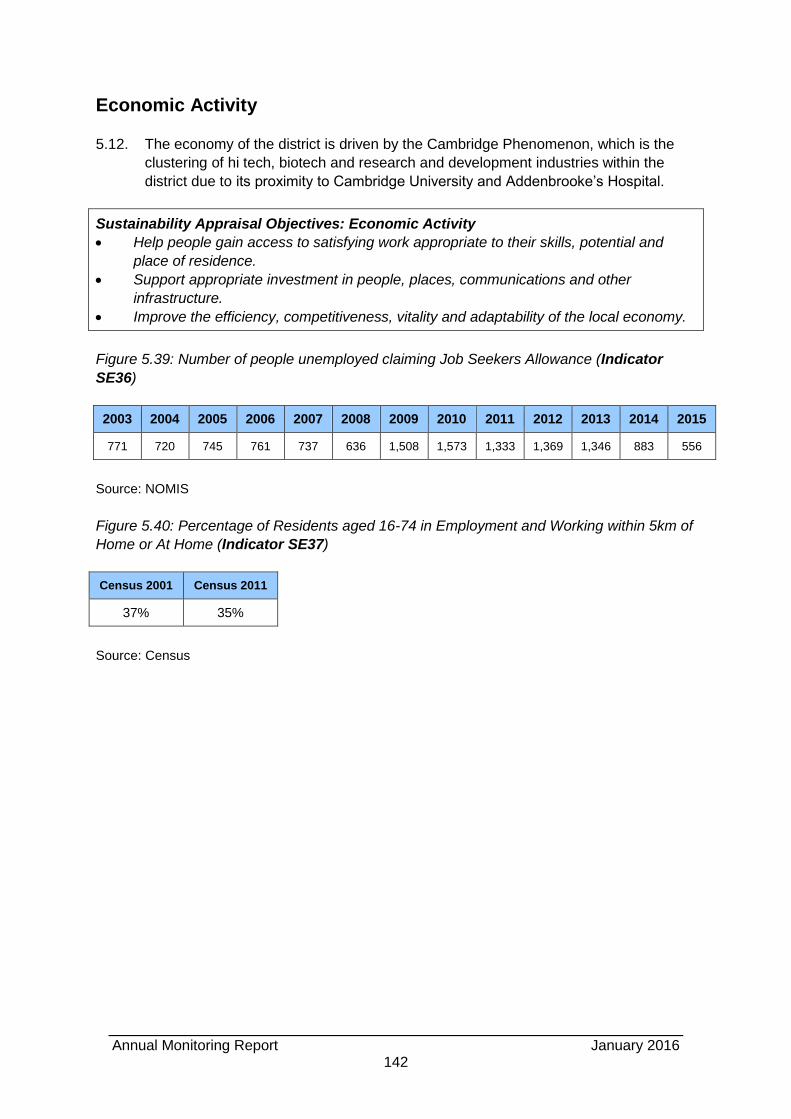
Annual Monitoring Report January 2016
142
Economic Activity
5.12. The economy of the district is driven by the Cambridge Phenomenon, which is the
clustering of hi tech, biotech and research and development industries within the
district due to its proximity to Cambridge University and Addenbrooke’s Hospital.
Sustainability Appraisal Objectives: Economic Activity
Help people gain access to satisfying work appropriate to their skills, potential and
place of residence.
Support appropriate investment in people, places, communications and other
infrastructure.
Improve the efficiency, competitiveness, vitality and adaptability of the local economy.
Figure 5.39: Number of people unemployed claiming Job Seekers Allowance (Indicator
SE36)
2003 2004 2005 2006 2007 2008 2009 2010 2011 2012 2013 2014 2015
771 720 745 761 737 636 1,508 1,573 1,333 1,369 1,346 883 556
Source: NOMIS
Figure 5.40: Percentage of Residents aged 16-74 in Employment and Working within 5km of
Home or At Home (Indicator SE37)
Census 2001 Census 2011
37% 35%
Source: Census
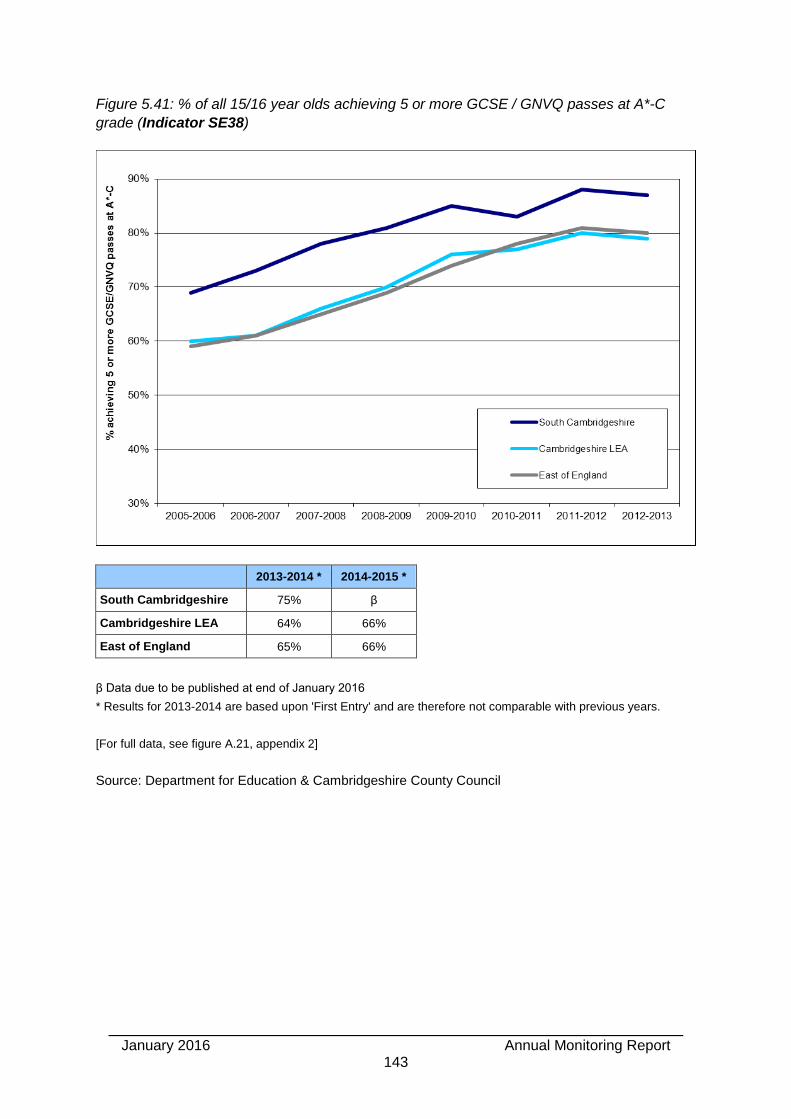
January 2016 Annual Monitoring Report
143
Figure 5.41: % of all 15/16 year olds achieving 5 or more GCSE / GNVQ passes at A*-C
grade (Indicator SE38)
2013-2014 * 2014-2015 *
South Cambridgeshire 75% β
Cambridgeshire LEA 64% 66%
East of England 65% 66%
β Data due to be published at end of January 2016
* Results for 2013-2014 are based upon 'First Entry' and are therefore not comparable with previous years.
[For full data, see figure A.21, appendix 2]
Source: Department for Education & Cambridgeshire County Council
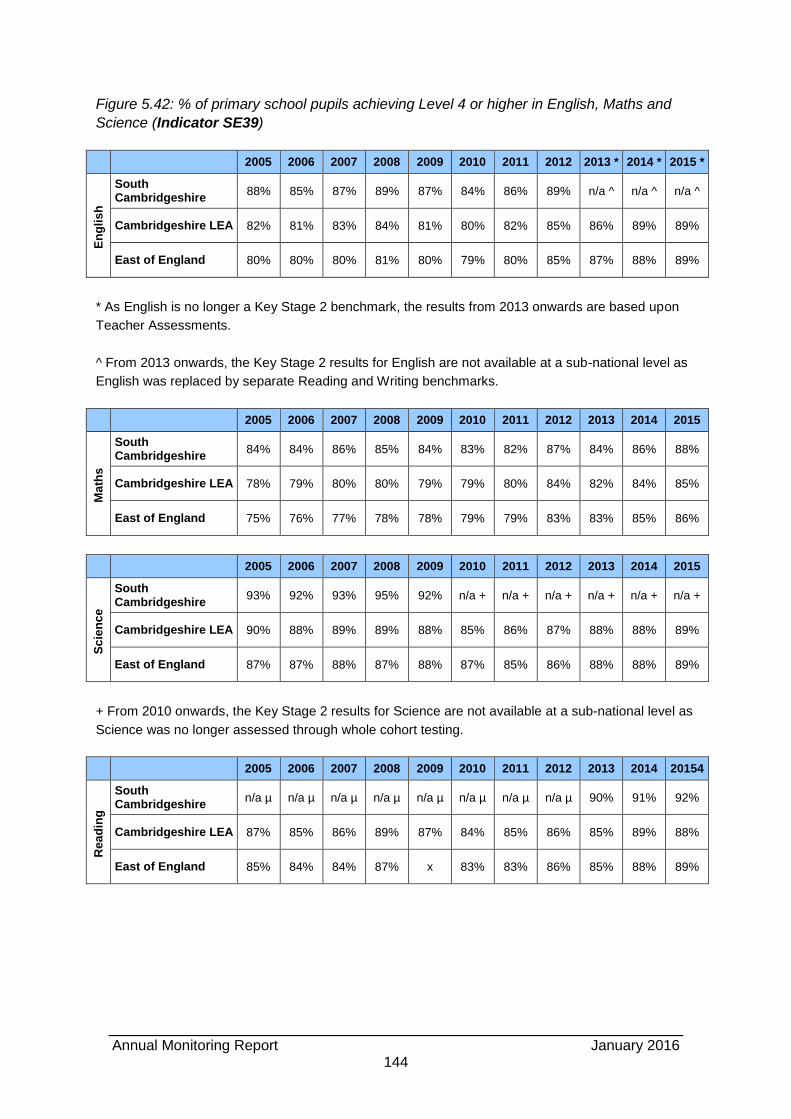
Annual Monitoring Report January 2016
144
Figure 5.42: % of primary school pupils achieving Level 4 or higher in English, Maths and
Science (Indicator SE39)
2005 2006 2007 2008 2009 2010 2011 2012 2013 * 2014 * 2015 *
En
gli
sh
South Cambridgeshire
88% 85% 87% 89% 87% 84% 86% 89% n/a ^ n/a ^ n/a ^
Cambridgeshire LEA 82% 81% 83% 84% 81% 80% 82% 85% 86% 89% 89%
East of England 80% 80% 80% 81% 80% 79% 80% 85% 87% 88% 89%
* As English is no longer a Key Stage 2 benchmark, the results from 2013 onwards are based upon
Teacher Assessments.
^ From 2013 onwards, the Key Stage 2 results for English are not available at a sub-national level as
English was replaced by separate Reading and Writing benchmarks.
2005 2006 2007 2008 2009 2010 2011 2012 2013 2014 2015
Ma
ths
South Cambridgeshire
84% 84% 86% 85% 84% 83% 82% 87% 84% 86% 88%
Cambridgeshire LEA 78% 79% 80% 80% 79% 79% 80% 84% 82% 84% 85%
East of England 75% 76% 77% 78% 78% 79% 79% 83% 83% 85% 86%
2005 2006 2007 2008 2009 2010 2011 2012 2013 2014 2015
Sc
ien
ce
South Cambridgeshire
93% 92% 93% 95% 92% n/a + n/a + n/a + n/a + n/a + n/a +
Cambridgeshire LEA 90% 88% 89% 89% 88% 85% 86% 87% 88% 88% 89%
East of England 87% 87% 88% 87% 88% 87% 85% 86% 88% 88% 89%
+ From 2010 onwards, the Key Stage 2 results for Science are not available at a sub-national level as
Science was no longer assessed through whole cohort testing.
2005 2006 2007 2008 2009 2010 2011 2012 2013 2014 20154
Rea
din
g
South Cambridgeshire
n/a µ n/a µ n/a µ n/a µ n/a µ n/a µ n/a µ n/a µ 90% 91% 92%
Cambridgeshire LEA 87% 85% 86% 89% 87% 84% 85% 86% 85% 89% 88%
East of England 85% 84% 84% 87% x 83% 83% 86% 85% 88% 89%
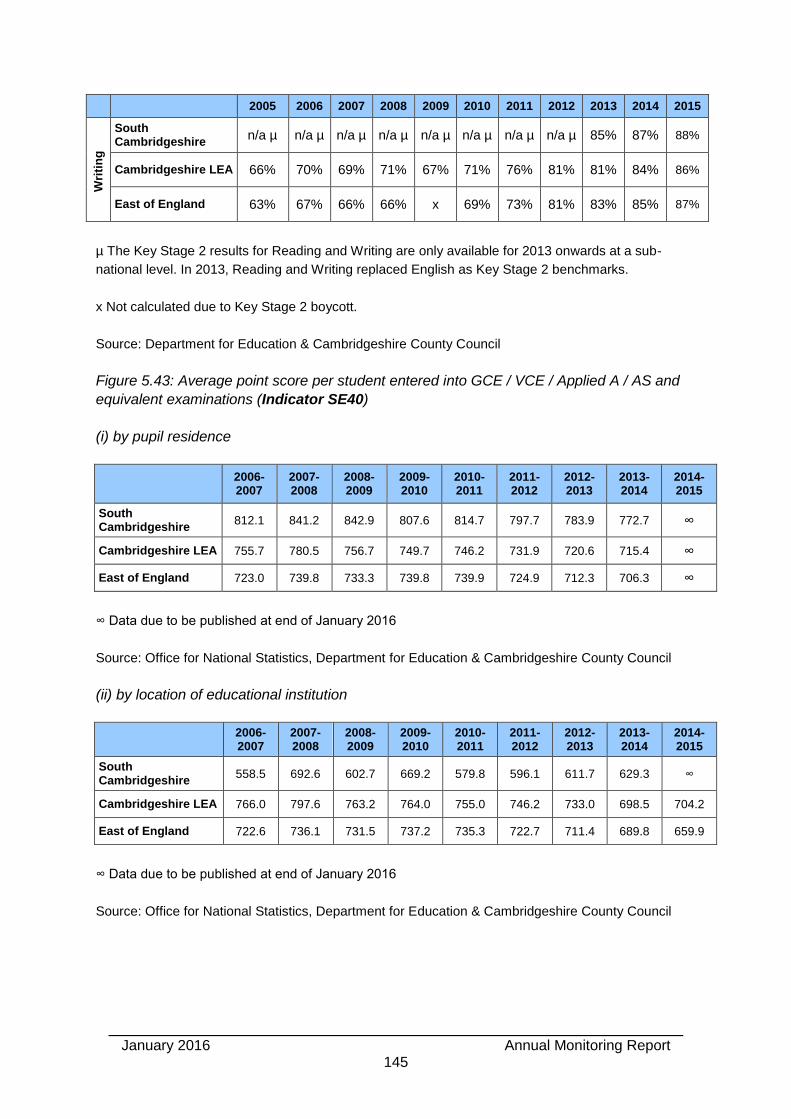
January 2016 Annual Monitoring Report
145
2005 2006 2007 2008 2009 2010 2011 2012 2013 2014 2015 W
riti
ng
South Cambridgeshire
n/a µ n/a µ n/a µ n/a µ n/a µ n/a µ n/a µ n/a µ 85% 87% 88%
Cambridgeshire LEA 66% 70% 69% 71% 67% 71% 76% 81% 81% 84% 86%
East of England 63% 67% 66% 66% x 69% 73% 81% 83% 85% 87%
µ The Key Stage 2 results for Reading and Writing are only available for 2013 onwards at a sub-
national level. In 2013, Reading and Writing replaced English as Key Stage 2 benchmarks.
x Not calculated due to Key Stage 2 boycott.
Source: Department for Education & Cambridgeshire County Council
Figure 5.43: Average point score per student entered into GCE / VCE / Applied A / AS and
equivalent examinations (Indicator SE40)
(i) by pupil residence
2006- 2007
2007- 2008
2008- 2009
2009- 2010
2010- 2011
2011- 2012
2012- 2013
2013- 2014
2014-2015
South Cambridgeshire
812.1 841.2 842.9 807.6 814.7 797.7 783.9 772.7 ∞
Cambridgeshire LEA 755.7 780.5 756.7 749.7 746.2 731.9 720.6 715.4 ∞
East of England 723.0 739.8 733.3 739.8 739.9 724.9 712.3 706.3 ∞
∞ Data due to be published at end of January 2016
Source: Office for National Statistics, Department for Education & Cambridgeshire County Council
(ii) by location of educational institution
2006- 2007
2007- 2008
2008- 2009
2009- 2010
2010- 2011
2011- 2012
2012- 2013
2013- 2014
2014-2015
South Cambridgeshire
558.5 692.6 602.7 669.2 579.8 596.1 611.7 629.3 ∞
Cambridgeshire LEA 766.0 797.6 763.2 764.0 755.0 746.2 733.0 698.5 704.2
East of England 722.6 736.1 731.5 737.2 735.3 722.7 711.4 689.8 659.9
∞ Data due to be published at end of January 2016
Source: Office for National Statistics, Department for Education & Cambridgeshire County Council
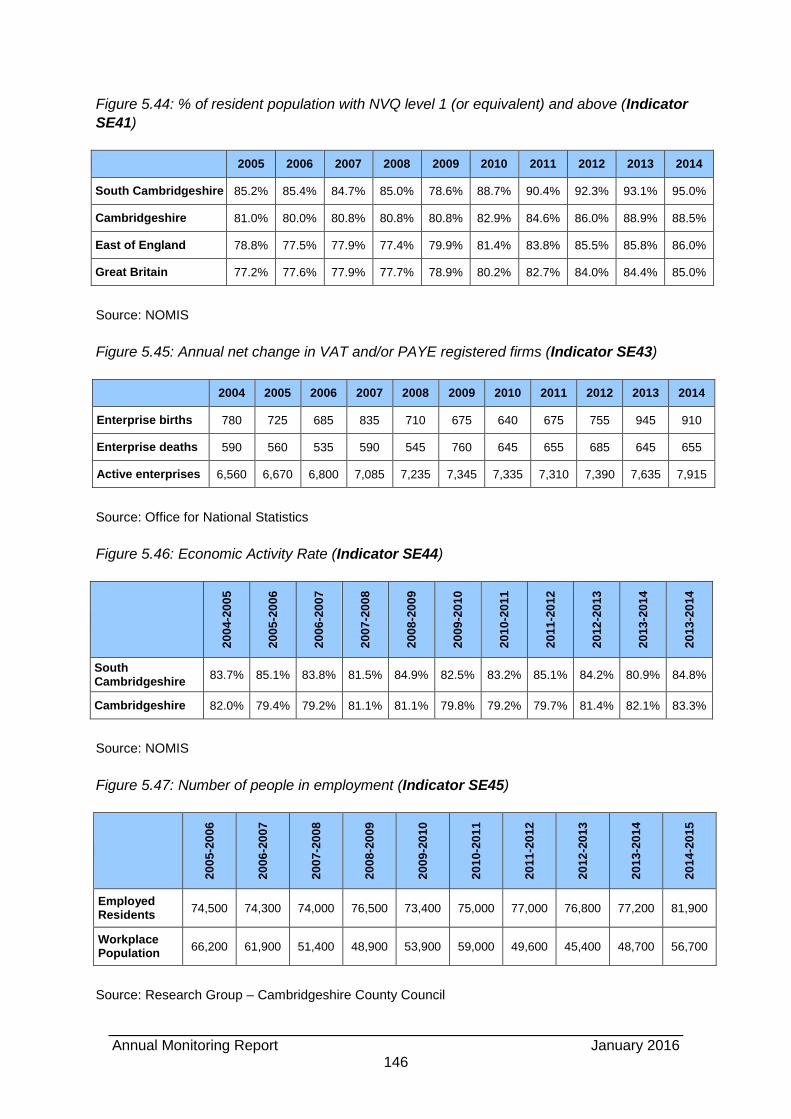
Annual Monitoring Report January 2016
146
Figure 5.44: % of resident population with NVQ level 1 (or equivalent) and above (Indicator
SE41)
2005 2006 2007 2008 2009 2010 2011 2012 2013 2014
South Cambridgeshire 85.2% 85.4% 84.7% 85.0% 78.6% 88.7% 90.4% 92.3% 93.1% 95.0%
Cambridgeshire 81.0% 80.0% 80.8% 80.8% 80.8% 82.9% 84.6% 86.0% 88.9% 88.5%
East of England 78.8% 77.5% 77.9% 77.4% 79.9% 81.4% 83.8% 85.5% 85.8% 86.0%
Great Britain 77.2% 77.6% 77.9% 77.7% 78.9% 80.2% 82.7% 84.0% 84.4% 85.0%
Source: NOMIS
Figure 5.45: Annual net change in VAT and/or PAYE registered firms (Indicator SE43)
2004 2005 2006 2007 2008 2009 2010 2011 2012 2013 2014
Enterprise births 780 725 685 835 710 675 640 675 755 945 910
Enterprise deaths 590 560 535 590 545 760 645 655 685 645 655
Active enterprises 6,560 6,670 6,800 7,085 7,235 7,345 7,335 7,310 7,390 7,635 7,915
Source: Office for National Statistics
Figure 5.46: Economic Activity Rate (Indicator SE44)
20
04
-20
05
20
05
-20
06
20
06
-20
07
20
07
-20
08
20
08
-20
09
20
09
-20
10
20
10
-20
11
20
11
-20
12
20
12
-20
13
20
13
-20
14
20
13
-20
14
South Cambridgeshire
83.7% 85.1% 83.8% 81.5% 84.9% 82.5% 83.2% 85.1% 84.2% 80.9% 84.8%
Cambridgeshire 82.0% 79.4% 79.2% 81.1% 81.1% 79.8% 79.2% 79.7% 81.4% 82.1% 83.3%
Source: NOMIS
Figure 5.47: Number of people in employment (Indicator SE45)
20
05
-20
06
20
06
-20
07
20
07
-20
08
20
08
-20
09
20
09
-20
10
20
10
-20
11
20
11
-20
12
20
12
-20
13
20
13
-20
14
20
14
-20
15
Employed Residents
74,500 74,300 74,000 76,500 73,400 75,000 77,000 76,800 77,200 81,900
Workplace Population
66,200 61,900 51,400 48,900 53,900 59,000 49,600 45,400 48,700 56,700
Source: Research Group – Cambridgeshire County Council
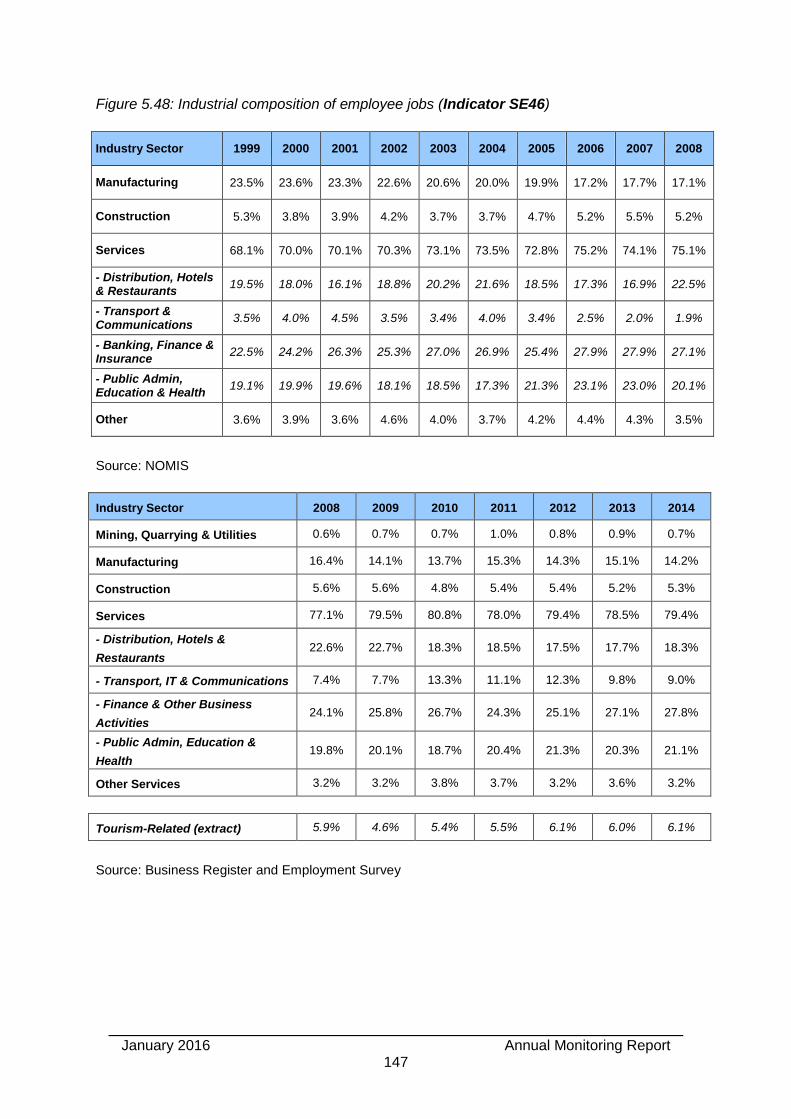
January 2016 Annual Monitoring Report
147
Figure 5.48: Industrial composition of employee jobs (Indicator SE46)
Industry Sector 1999 2000 2001 2002 2003 2004 2005 2006 2007 2008
Manufacturing 23.5% 23.6% 23.3% 22.6% 20.6% 20.0% 19.9% 17.2% 17.7% 17.1%
Construction 5.3% 3.8% 3.9% 4.2% 3.7% 3.7% 4.7% 5.2% 5.5% 5.2%
Services 68.1% 70.0% 70.1% 70.3% 73.1% 73.5% 72.8% 75.2% 74.1% 75.1%
- Distribution, Hotels & Restaurants
19.5% 18.0% 16.1% 18.8% 20.2% 21.6% 18.5% 17.3% 16.9% 22.5%
- Transport & Communications
3.5% 4.0% 4.5% 3.5% 3.4% 4.0% 3.4% 2.5% 2.0% 1.9%
- Banking, Finance & Insurance
22.5% 24.2% 26.3% 25.3% 27.0% 26.9% 25.4% 27.9% 27.9% 27.1%
- Public Admin, Education & Health
19.1% 19.9% 19.6% 18.1% 18.5% 17.3% 21.3% 23.1% 23.0% 20.1%
Other 3.6% 3.9% 3.6% 4.6% 4.0% 3.7% 4.2% 4.4% 4.3% 3.5%
Source: NOMIS
Industry Sector 2008 2009 2010 2011 2012 2013 2014
Mining, Quarrying & Utilities 0.6% 0.7% 0.7% 1.0% 0.8% 0.9% 0.7%
Manufacturing 16.4% 14.1% 13.7% 15.3% 14.3% 15.1% 14.2%
Construction 5.6% 5.6% 4.8% 5.4% 5.4% 5.2% 5.3%
Services 77.1% 79.5% 80.8% 78.0% 79.4% 78.5% 79.4%
- Distribution, Hotels &
Restaurants 22.6% 22.7% 18.3% 18.5% 17.5% 17.7% 18.3%
- Transport, IT & Communications 7.4% 7.7% 13.3% 11.1% 12.3% 9.8% 9.0%
- Finance & Other Business
Activities 24.1% 25.8% 26.7% 24.3% 25.1% 27.1% 27.8%
- Public Admin, Education &
Health 19.8% 20.1% 18.7% 20.4% 21.3% 20.3% 21.1%
Other Services 3.2% 3.2% 3.8% 3.7% 3.2% 3.6% 3.2%
Tourism-Related (extract) 5.9% 4.6% 5.4% 5.5% 6.1% 6.0% 6.1%
Source: Business Register and Employment Survey
Annual Monitoring Report January 2016
148
Appendix 1: Assessment of Housing Land Supply Sites
South Cambridgeshire Housing Trajectory – Summary of Sites
a. Existing Allocations within Cambridge Urban Area (see Table SC2)
Orchard Park
A.1. Orchard Park is a mixed-use development on the northern edge of Cambridge
between Kings Hedges Road, Histon Road and the A14. The site was originally
allocated in the Local Plan 2004, and received outline planning permission in June
2005 (which has now lapsed). The Site Specific Policies DPD (adopted in January
2010) and Local Plan (submitted in March 2014) carry forward the allocation, and
also allow the potential for additional housing development on three parcels in place
of other uses.
A.2. Parcels Q, Com2 and the former HRCC site: this is a combined package of three
parcels where additional housing development has been allowed. A hybrid planning
application incorporating an outline planning application for 112 dwellings and a full
planning application for a local centre and 28 flats above was granted in February
2013, and three detailed planning permissions for 112 dwellings have since been
granted. The developer anticipates that the remaining 39 dwellings on parcels Q and
the former HRCC site will be completed by March 2016 and that the construction of
the final 26 dwellings on land adjacent to the local centre will be started and
completed in 2016-2017.
A.3. In accordance with footnote 11 to paragraph 47 of the NPPF parcels Q, Com2 and
the former HRCC site are considered deliverable for the following reasons:
Available: the site has planning permission and is under construction.
Suitable: the site is part of Orchard Park, which is allocated for development in
the adopted Site Specific Policies DPD (January 2010) and in the Local Plan
(submitted in March 2014). The site has planning permission. It is at the first
stage in the development sequence.
Achievable and Viable: the site has planning permission and is under
construction, and the developer anticipates that the development will be
completed by March 2017.
A.4. Parcel K1: this is the only remaining parcel from the original outline planning
permission without detailed planning permission. A planning application for 38
PassivHaus dwellings and ancillary facilities including common house and communal
gardens was submitted in November 2014, and has an officer recommendation for
approval subject to a s106 agreement being completed. The agent anticipates that
construction will start on site in Spring 2016 and that the development will be
completed in Spring 2017. A planning application for a revised scheme of 40
dwellings is anticipated.
A.5. In accordance with footnote 11 to paragraph 47 of the NPPF parcel K1 is considered
deliverable for the following reasons:
January 2016 Annual Monitoring Report
149
Available: a planning application for the site has an officer recommendation for
approval subject to a s106 agreement being completed and the agent has
advised that the site is available immediately, subject to planning permission
being granted.
Suitable: the site is part of Orchard Park, which is allocated for development in
the adopted Site Specific Policies DPD (January 2010) and in the Local Plan
(submitted in March 2014). It is at the first stage in the development sequence.
Achievable and Viable: the agent has advised that the scheme for Cambridge
Co-Housing is achievable and viable, and anticipates that the development will
be completed in 2016-2017.
A.6. Parcels L2 and Com4: the Site Specific Policies DPD (adopted in January 2010)
identified these two parcels as having the potential for additional housing
development and anticipated that together they could provide 80 dwellings. Design
criteria for these two sites are included in the Orchard Park Design Guidance SPD
(adopted in March 2011). The proximity of these two sites to the A14 means that
noise and air quality constraints will influence the design and layout of the sites, and
mitigation measures will need to be agreed through the planning application process.
A.7. Outline planning permission for 15 townhouses on parcel L2 was granted in October
2015. It is unclear exactly when construction will start as the landowner has not
provided a completed questionnaire this year; however it is reasonable to assume
the site will be completed in five years.
A.8. Two alternative planning applications for parcel Com4 proposing schemes of either
132 flats or 42 apartments and an 82 unit apart/hotel have been refused and appeals
have been lodged. Noise and air quality constraints will influence the design and
layout of this parcel. Taking a precautionary approach, no allowance has been made
for housing on this parcel in the housing trajectory as an acceptable scheme has not
yet been submitted.
A.9. In accordance with footnote 11 to paragraph 47 of the NPPF parcel L2 is considered
deliverable for the following reasons:
Available: the site has outline planning permission.
Suitable: the site is part of Orchard Park, which is allocated for development in
the adopted Site Specific Policies DPD (January 2010) and in the Local Plan
(submitted in March 2014). The site has outline planning permission. It is at the
first stage in the development sequence.
Achievable and Viable: there is a reasonable prospect that the scheme will be
delivered in five years as the site has outline planning permission and a s106
agreement has been signed for the provision of onsite affordable housing and
financial contributions for community space, education, household waste,
monitoring and public open space.
A.10. In accordance with footnotes 11 and 12 to paragraph 47 of the NPPF it is not
considered possible to provide sufficient confidence that parcel Com4 is deliverable
or developable in order to include an allowance in the housing trajectory for the
following reasons:
Annual Monitoring Report January 2016
150
Available: the landowner has previously advised that the site is available
immediately.
Suitable: the site is part of Orchard Park, which is allocated for development in
the adopted Site Specific Policies DPD (January 2010) and the suitability of the
site has therefore been tested through examination. The site is allocated for
development in the Local Plan (submitted in March 2014). It is at the first stage in
the development sequence.
Achievable and Viable: an acceptable scheme for the development of this site
has not yet been submitted. The two alternative schemes for the site were
refused as the planning applications failed to demonstrate that it was possible to
construct a building(s) in conformance with the design parameters set out in the
Orchard Park Design Guidance SPD, and that the noise and air quality
considerations had been addressed. Therefore there is uncertainty over the
achievability of the site until a scheme that addresses these considerations
appropriately has been approved.
b. Existing Allocations on Cambridge Fringe (see Table SC3)
North West Cambridge (University Site)
A.11. South Cambridgeshire District Council and Cambridge City Council jointly adopted
the North West Cambridge Area Action Plan in October 2009. The development,
between Madingley Road and Huntingdon Road, will be predominantly for the long-
term needs of Cambridge University. This will include 50% key worker housing for
University staff, student housing, new faculty buildings and research facilities, a local
centre and market housing. The site as a whole is expected to deliver 3,000
dwellings plus 2,000 student units, and the Area Action Plan anticipated that 1,450
dwellings would be provided in South Cambridgeshire.
A.12. Outline planning permission for the site was granted in February 2013 and the
landowner anticipates that on the basis of the approved scheme 1,155 dwellings will
be provided in South Cambridgeshire. Detailed planning permissions for lots 1-8
have been granted, including 70 dwellings in South Cambridgeshire. Construction of
the access to the site is underway, and works have started on some of the residential
buildings.
A.13. Pre-application discussions are underway for lots M1, M2, S1 and S2, and a
planning application for lots M1 and M2 is expected in Autumn 2015. The landowner
has previously advised that the first 20 dwellings in South Cambridgeshire will be
completed in 2015-2016.
A.14. In accordance with footnotes 11 and 12 to paragraph 47 of the NPPF this site is
considered deliverable and developable for the following reasons:
Available: the whole site has outline planning permission, and reserved matters
planning permissions have been approved for lots 1-8. The development is under
construction.
Suitable: the site is allocated for development in the adopted North West
Cambridge Area Action Plan (October 2009), having been released from the
Cambridge Green Belt. The whole site has outline planning permission and
January 2016 Annual Monitoring Report
151
detailed planning permissions for lots 1-8 have been granted. It is at the second
stage in the development sequence.
Achievable and Viable: the development has planning permission and is under
construction.
Land between Huntingdon Road, Histon Road and the A14 (Darwin Green 2 /
NIAB 2 and Darwin Green 3 / NIAB 3)
A.15. The site is allocated as a sustainable housing-led urban extension to Cambridge in
the Site Specific Policies DPD (adopted in January 2010) and in the Local Plan
(submitted in March 2014). The site known as Darwin Green (and formerly known as
NIAB) is adjacent to the Cambridge City Council allocation (Darwin Green 1 / NIAB
1) and will provide a secondary school to serve development in the whole of the
north-west part of Cambridge. Outline planning permission for Darwin Green 1 (land
within Cambridge) was approved in December 2013. The Local Plan proposes the
removal of a small additional area of land from the Green Belt, and reduces the
notional capacity of the site from approximately 1,100 dwellings to 1,000 dwellings.
This change takes account of concerns that the higher figure could result in densities
that are too high and not compatible with achieving a high quality development on
this edge of Cambridge, although it does not preclude a higher number of dwellings if
demonstrated to be appropriate through a design-led approach.
A.16. Initial discussions have been held and pre-application discussions are anticipated to
begin once the delivery of Darwin Green 1 starts. The agent anticipates that the first
completions on Darwin Green 1 will be delivered in 2016-2017; however Cambridge
City Council has assumed that the first completions will be delivered in 2017-2018.
The agent anticipates that construction of Darwin Green 2 and 3 will start in 2019
and that the site (with the proposed small extension included in the Local Plan) will
deliver 1,200 dwellings. Until the developer’s proposals have been considered
through the examination of the Local Plan, or until planning permission is granted,
the Council is only relying on this site to provide 1,000 dwellings. The Council has
also taken a more cautious approach in terms of the timetable for delivery of the site,
by anticipating that the first housing completions will not be delivered until 2020-
2021.
A.17. In accordance with footnote 12 to paragraph 47 of the NPPF land between
Huntingdon Road, Histon Road and the A14 is considered developable for the
following reasons:
Available: the agent has advised the site is available immediately and pre-
application discussions are anticipated to begin once delivery of Darwin Green 1
starts.
Suitable: the site is allocated for development in the adopted Site Specific
Policies DPD (January 2010) and in the Local Plan (submitted in March 2014),
having been released from the Cambridge Green Belt. It is at the second stage in
the development sequence.
Achievable and Viable: the agent anticipates that construction will start in 2019
and has advised that the development is achievable and viable, subject to
securing a suitable planning permission.
Annual Monitoring Report January 2016
152
Cambridge East
A.18. Cambridge East is allocated for a major mixed-use development on the edge of
Cambridge including land within South Cambridgeshire and Cambridge City. The two
Councils jointly adopted the Cambridge East Area Action Plan in February 2008
which planned for a new urban quarter to Cambridge and provided for an early
phase of development North of Newmarket Road. The whole site has a capacity of
10,000 to 12,000 dwellings.
A.19. The main landowner, Marshall of Cambridge, announced in April 2010 that the
relocation of Cambridge Airport will not happen before 2031 at least, as there are
currently no suitable relocation options. The Local Plan (submitted in March 2014)
carries forward the parts of Cambridge East that can be delivered with the airport
remaining and proposes that land the remainder of the land at Cambridge Airport is
identified as safeguarded land that could be brought forward for development at a
later date through a review of the Local Plan if circumstances change. As no housing
is expected to be delivered on the Airport site in the plan period to 2031, no
allowance is made for housing in the housing trajectory on the land proposed to be
safeguarded.
A.20. Land north of Newmarket Road (WING): this land is allocated as Phase 1 in the
Cambridge East AAP (adopted in February 2008) and as Policy SS/3(2) in the
Local Plan (submitted in March 2014). In December 2013, Marshall submitted an
outline planning permission for up to 1,300 homes, a primary school, a food store,
community facilities and open space. The landowner has indicated that, subject to
resolving viability discussions and securing outline planning permission in 2016,
construction is anticipated to start on site in 2017, with the first 85 homes completed
in 2018-2019. It is anticipated that the development will be completed in 2028.
A.21. In accordance with footnotes 11 and 12 to paragraph 47 of the NPPF land north of
Newmarket Road is considered deliverable and developable for the following
reasons:
Available: the landowner has advised that the site is available immediately,
subject to the approval of the submitted planning application.
Suitable: the site is part of the land allocated for development in the adopted
Cambridge East Area Action Plan (February 2008) and in the Local Plan
(submitted in March 2014), having been released from the Cambridge Green
Belt. It is at the second stage in the development sequence.
Achievable and Viable: the landowner anticipates that construction will start in
2017 and has advised that the development is achievable and viable, subject to
resolving the viability discussions being undertaken relating to the submitted
planning application.
A.22. Land north of Cherry Hinton: while the airport remains on site, there is potential for
residential development on land north of Cherry Hinton, as identified in the
Cambridge East AAP (adopted in February 2008). The Cambridge and South
Cambridgeshire Local Plans (submitted in March 2014) allocate land north of Cherry
Hinton for 461 dwellings, of which 110 dwellings are anticipated to be in South
Cambridgeshire. This represented the situation at the time the Local Plans were
January 2016 Annual Monitoring Report
153
submitted and was based on an understanding of the land that could come forward
with the airport still operating. The land is in two separate ownerships and
discussions are in progress with both landowners. One landowner has taken a
development partner to take forward the development.
A.23. In consultation with the landowners, the Councils are proposing modifications
through the examinations of the Local Plans to allocate additional land for
residential development in the area north of Cherry Hinton, reflecting an improved
understanding of constraints and progress by landowners to bring forward
development. The additional work required by the Inspectors has resulted in new
modifications being proposed to replace the existing allocations with a new larger
allocation for 1,200 dwellings, of which approximately 420 dwellings are anticipated
to be in South Cambridgeshire.
A.24. The two landowners have indicated that development of the proposed new larger
allocation could start on site in mid-2017 and be completed in 2023-2024.
A.25. In accordance with footnotes 11 and 12 to paragraph 47 of the NPPF land north of
Cherry Hinton is considered deliverable and developable for the following
reasons:
Available: the landowners have advised that the site is available immediately,
and pre-application discussions are in progress with both landowners and their
development partners.
Suitable: the site is part of the land allocated for development in the adopted
Cambridge East Area Action Plan (February 2008) and in the Local Plan
(submitted in March 2014), having been released from the Cambridge Green
Belt. It is at the second stage in the development sequence.
Achievable and Viable: the landowners anticipate that construction could start
on site in mid-2017 and have advised that the development is achievable and
viable.
Trumpington Meadows (Cambridge Southern Fringe)
A.26. Trumpington Meadows is a housing-led mixed-use development on the southern
edge of Cambridge including land in both South Cambridgeshire and Cambridge
City. The Cambridge Southern Fringe Area Action Plan covers the part of the site
within South Cambridgeshire and was adopted in February 2008. The s106
agreement was signed and outline planning permission was granted on 9 October
2009. The site is expected to deliver 1,200 dwellings on land straddling the
Cambridge – South Cambridgeshire boundary, with approximately half in South
Cambridgeshire.
A.27. Detailed planning permissions for phase 1 (353 dwellings, including 29 dwellings in
in South Cambridgeshire) were granted in Summer 2011. Construction of this phase
is almost completed. All 29 dwellings in South Cambridgeshire have been
completed.
A.28. Construction of phase 2 is underway. Detailed planning permissions have been
granted for lots 6-8 (161 dwellings, including 25 dwellings in South Cambridgeshire).
Annual Monitoring Report January 2016
154
At March 2015, none of the dwellings in South Cambridgeshire had been started.
The remainder of phase 2 is anticipated to provide a further 203 dwellings, and
consists of the Local Centre (43 dwellings, all of which will be within South
Cambridgeshire) and the Riverside lot (160 dwellings, of which 99 dwellings are
anticipated to be in South Cambridgeshire). Initial discussions on developing these
lots have been undertaken. The developers anticipate that the remaining phases
(lots 9, 10 and 11) will provide 501 dwellings, of which 464 dwellings are anticipated
to be in South Cambridgeshire. Initial discussions on developing these lots have
been undertaken.
A.29. The developer anticipates that the dwellings in South Cambridgeshire will be
completed in 2020-2021. Using the predicted completions for future lots provided by
the developer, it is anticipated that the total number of dwellings for the whole of the
Trumpington Meadows site will exceed 1,200 dwellings. The outline planning
permissions for the site include a condition limiting the number to 1,200 dwellings,
unless a change is agreed in writing with the local planning authorities. Until the
developer’s proposals for the remaining lots have been considered through reserved
matters planning applications for each lot, the Councils are only assuming that
Trumpington Meadows as a whole will provide 1,200 dwellings, and therefore the
housing trajectory assumes that lots 9, 10 and 11 will deliver less dwellings in South
Cambridgeshire than anticipated by the developers.
A.30. In accordance with footnotes 11 and 12 to paragraph 47 of the NPPF this site is
considered deliverable and developable for the following reasons:
Available: the whole site has outline planning permission, and reserved matters
planning permissions have been approved for lots 1-8. Construction of phase 1 is
almost completed and construction of phase 2 is underway.
Suitable: the site is allocated for development in the adopted Cambridge
Southern Fringe Area Action Plan (February 2008), having been released from
the Cambridge Green Belt. The whole site has outline planning permission and
reserved matters planning permissions have been approved for lots 1-8. It is at
the second stage in the development sequence.
Achievable and Viable: the development has planning permission and the
developer anticipates that the development will be completed in 2020-2021 and
has advised that the development is achievable and viable.
c. Existing Allocations at New Settlements (see Table SC4)
Northstowe
A.31. Northstowe is a planned new settlement of up to 10,000 dwellings to the north west
of Cambridge, adjacent to the villages of Longstanton and Oakington. The new town
was originally planned in the Northstowe Area Action Plan (adopted in July 2007)
with an area of reserve land to the west of the town. In July 2012, the Northstowe
Joint Development Control Committee endorsed (with some revisions) the site wide
masterplan (Development Framework Document) as a material consideration for all
subsequent planning applications.
January 2016 Annual Monitoring Report
155
A.32. Development beyond 1,500 homes is dependent on the completion of the
improvement works to the A14 to provide the necessary transport capacity. The
Development Consent Order for the A14 improvements is currently undergoing
examination50. The scheme is planned to be open in 2020.
A.33. Phase 1: outline planning permission for phase 1 (up to 1,500 dwellings, a primary
school, a mixed-use local centre, leisure, community, health and employment uses, a
household recycling centre, recreational space, infrastructure works and the
demolition of existing buildings and structures) was granted in April 2014.
Construction has started on the primary school and infrastructure, including primary
road network, foul water pumping station, and surface water drainage network. The
landowner anticipates that the first 32 dwellings will be completed in 2017-2018 and
that the construction of phase 1 will be completed in 2023-2024, and anticipates
annual delivery rates of up to 260 dwellings. Gallagher’s are currently marketing the
first parcels of land within phase 1 to housebuilders, and the delivery timetable that
they have provided takes account of the timetable for this process.
A.34. The Council has taken a more cautious approach in the housing trajectory than
suggested by the landowner. The housing trajectory assumes that the site as a
whole will deliver no more than 250 dwellings a year. There are no controls on the
rate of delivery of Northstowe, so if more than 250 dwellings can be delivered in a
year there are no planning policy barriers to that. The landowners are working with
the Council to accelerate delivery of the site.
A.35. In accordance with footnotes 11 and 12 to paragraph 47 of the NPPF phase 1 is
considered deliverable and developable for the following reasons:
Available: the site has outline planning permission and construction has started
on site. The landowner has advised this land is available immediately. The
majority of the development is now controlled by the two main landowners:
Gallagher’s and the Homes & Communities Agency.
Suitable: the site is allocated for development in the adopted Northstowe Area
Action Plan (July 2007). The site has outline planning permission. It is at the third
stage in the development sequence. A site wide masterplan was endorsed by the
Northstowe Joint Development Control Committee in July 2012.
Achievable and Viable: the site has outline planning permission and a s106
agreement has been signed. The landowner anticipates that this phase will be
completed in 2023-2024 and has advised that the development is achievable and
viable.
A.36. Phase 2, phase 3 and later phases: the Northstowe Joint Development Control
Committee in June 2015 resolved to grant outline planning permission for phase 2
(up to 3,500 dwellings, a secondary school, two primary schools, a town centre and
sports hub), subject to the prior completion of a s106 agreement. The conditions and
s106 agreement were agreed by the Joint Northstowe Development Control
Committee in July 2015. Phase 3 and any later phase(s) including the reserve land
identified in the Northstowe AAP are anticipated to provide a further 5,000 dwellings.
The reserve land is allocated in the Local Plan (submitted March 2014) as the
50
http://www.highways.gov.uk/roads/road-projects/a14-cambridge-to-huntingdon-improvement-scheme/
Annual Monitoring Report January 2016
156
Northstowe Extension (Policy SS/7) to provide flexibility for the phasing and
delivery of the new town.
A.37. The landowner has not provided a completed questionnaire this year, however they
have previously advised that early enabling works for phase 2 are planned for 2016
with the first housing completions in 2019. The delivery of the majority of phase 2
and later phases is constrained until improvements have been made to the A14.
A.38. The Council has taken a more cautious approach in the housing trajectory than
suggested by the landowner. The housing trajectory assumes that the site as a
whole will deliver no more than 250 dwellings a year. There are no controls on the
rate of delivery of Northstowe, so if more than 250 dwellings can be delivered in a
year there are no planning policy barriers to that. The landowners are working with
the Council to accelerate delivery of the site.
A.39. In accordance with footnote 12 to paragraph 47 of the NPPF phase 2, phase 3 and
later phases are considered developable for the following reasons:
Available: the Northstowe Joint Development Control Committee has resolved to
grant outline planning permission for phase 2 and has agreed the conditions and
s106 agreement. The majority of the development is now controlled by the two
main landowners: Gallagher’s and the Homes & Communities Agency. The
delivery of the majority of phase 2 and later phases is constrained until
improvements have been made to the A14.
Suitable: the site is allocated for development in the adopted Northstowe Area
Action Plan (July 2007). The Northstowe Joint Development Control Committee
has resolved to grant outline planning permission for phase 2 and has agreed the
conditions and s106 agreement. It is at the third stage in the development
sequence. A site wide masterplan was endorsed by the Northstowe Joint
Development Control Committee in July 2012.
Achievable and Viable: the landowner has previously advised that the
development is achievable and viable.
d. New Allocations at New Settlements (see Table SC4)
Waterbeach New Town
A.40. Land north of Waterbeach is allocated in the Local Plan (submitted in March 2014)
for the creation of a sustainable new town. The new town will provide 8,000 to 9,000
dwellings and employment, retail, sports and leisure, community, and education
uses. Policy SS/5 of the Local Plan assumes that no more than 1,400 dwellings will
be completed by 2031 and Policy SS/12 requires the development to be phased so
that the first housing completions will be in 2026.
A.41. The site is owned by multiple landowners but has two joint promoters. The promoters
have indicated that the total capacity of the site could be up to 12,000 dwellings.
They have advised that preparatory work is being undertaken to inform more detailed
masterplanning of the site, to inform work on a Development Framework Document
for the site, and to support the submission of a planning application(s). A
Neighbourhood Plan for the parish of Waterbeach is due to be produced, and will be
January 2016 Annual Monitoring Report
157
undertaken in close consultation with the local authorities, local community and other
stakeholders. A Joint Working Agreement51 has been agreed and signed by both the
Parish and District Councils that sets out a framework for how the two Councils will
work together in relation to key projects such as the Local Plan, Neighbourhood
Plan, Development Framework Document and the City Deal.
A.42. The promoters anticipate that development could start on site in Spring 2018 and
that the first new dwellings could be completed in 2019. Conversion of the existing
barracks accommodation could deliver an additional 250 dwellings before 2019.
Initial transport and infrastructure assessments have indicated that an early phase of
development could start in 2018, as there is some capacity in existing infrastructure.
The promoters of the former barracks and airfield are intending to deliver private
rental sector dwellings in the early phases, which will boost the initial annual
completions. The promoters anticipate that annual completions of 400-500 dwellings
could be achieved.
A.43. Policy SS/5 of the Local Plan assumes that no more than 1,400 dwellings will be
completed by 2031 and Policy SS/12 requires the development to be phased so that
the first housing completions will be in 2026. The promoters’ timetable is not
consistent with these policy requirements; however, as a result of the additional work
undertaken by the Council in response to the Inspectors’ preliminary conclusions and
progress made by the promoters, the Council is now proposing modifications to the
Local Plan including removing these restrictions.
A.44. Although, the Council is proposing a modification to remove these restrictions, the
Council has taken a more cautious approach in the housing trajectory on a
precautionary basis than suggested by the promoters, who advise that development
could start in Spring 2018. Through discussions with the promoters, they have
advised that they intend to prepare a Development Framework Document by Spring
2016 and to submit an outline planning application in Autumn/Winter 2016 (the exact
timing will depend on the issues that arise during the early stages of preparation),
and that they have started engagement with the local communities. The housing
trajectory assumes that the first homes will be completed in 2022-2023 and that the
site will deliver an average of 250 dwellings a year following a gradual build up in the
early years. The proposed modifications mean that there will be no controls on the
rate of delivery of Waterbeach New Town, so if development could start earlier and if
more than 250 dwellings can be delivered in a year there would be no planning
policy barriers to that.
A.45. In accordance with footnote 12 to paragraph 47 of the NPPF this site is considered
developable for the following reasons:
Available: the promoters have advised that the site is available immediately.
Suitable: the site is allocated for development in the Local Plan (submitted in
March 2014). It is at the third stage in the development sequence.
Achievable and Viable: the promoters anticipate that construction will start on
site in Spring 2018 (although the conversion of the existing barracks
51
https://www.scambs.gov.uk/sites/default/files/documents/Waterbeach%20Joint%20Working%20Agreement%20for%20website.pdf
Annual Monitoring Report January 2016
158
accommodation could deliver additional dwellings before then) and have advised
that the development is achievable and viable.
Bourn Airfield New Village
A.46. Land at Bourn Airfield is allocated in the Local Plan (submitted in March 2014) for
the development of a new village of approximately 3,500 dwellings. The development
will include a new secondary school and at least two primary schools.
A.47. The developer has indicated that the site is available immediately and that
construction of the strategic infrastructure could start in late 2017 and that
construction of the dwellings could start in late 2018. The developer anticipates that
annual completions of up to 270 dwellings could be achieved and that the
development could be completed in 2032. The developer’s timetable for delivery is
based on an outline planning application being submitted in Spring 2016 and takes
account of the development of Cambourne West being taken forward. Through
discussions with the developers, they have advised that they intend to prepare a
Development Framework Document by Spring 2016 in consultation with the local
authorities, local community, and other stakeholders.
A.48. Policy SS/6 of the Local Plan (as submitted in March 2014) requires the
development to be phased so that the first housing completions will be in 2022 and
that no more than 1,700 dwellings will be completed by 2031. The developer’s
timetable is not consistent with these policy requirements; however, as a result of the
additional work undertaken by the Council in response to the Inspectors’ preliminary
conclusions and progress made by the developers, the Council is now proposing
modifications to the Local Plan including removing these restrictions.
A.49. Although, the Council is proposing a modification to remove these restrictions, the
Council has taken a more cautious approach in the housing trajectory on a
precautionary basis than suggested by the developer. The housing trajectory
assumes that the first homes will be completed in Spring 2021 and that the site will
deliver no more than 150 dwellings a year, so that together this site and Cambourne
West will deliver no more than 300 dwellings a year. The proposed modifications
mean that there will be no controls on the rate of delivery of Bourn Airfield New
Village, so if more than 150 dwellings can be delivered in a year there would be no
planning policy barriers to that.
A.50. In accordance with footnote 12 to paragraph 47 of the NPPF this site is considered
developable for the following reasons:
Available: the developer has advised that the site is available immediately, and
that they intend to submit an outline planning application in Spring 2016.
Suitable: the site is allocated for development in the Local Plan (submitted in
March 2014). It is at the third stage in the development sequence.
Achievable and Viable: the developer anticipates that construction will start on
site in late 2017 and has advised that the development is achievable and viable.
January 2016 Annual Monitoring Report
159
e. Existing Allocations in the Rural Area (see Table SC5)
Cambourne – additional 950 dwellings
A.51. Cambourne is a new settlement to the west of Cambridge and was originally
anticipated to provide approximately 3,000 dwellings with a 10% reserve. Changes to
government policy required higher minimum densities from new development to
make more efficient use of land, and therefore the Site Specific Policies DPD
(adopted in January 2010) states that it is appropriate that the remaining areas at
Cambourne should be developed at higher densities so that the average net density
of the settlement as a whole is raised to 30 dwellings per hectare.
A.52. Outline planning permission to increase the capacity by 950 dwellings was granted in
October 2011. Detailed planning permissions for 741 dwellings have been granted.
At March 2015, 451 dwellings were built, 108 dwellings were under construction and
182 dwellings were not started. It is unclear exactly when the development will be
completed as the developer has not provided a completed questionnaire this year;
however it is reasonable to assume the site will be completed in five years.
A.53. In accordance with footnote 11 to paragraph 47 of the NPPF this site is considered
deliverable for the following reasons:
Available: the site has outline planning permission for 950 dwellings, of which
741 dwellings have detailed planning permission. The development is under
construction.
Suitable: the site is allocated for development in the adopted Site Specific
Policies DPD (January 2010). The site has outline planning permission for 950
dwellings, of which 741 dwellings have detailed planning permission.
Achievable and Viable: the development has planning permission and is under
construction.
Fulbourn & Ida Darwin Hospitals
A.54. Within the Fulbourn and Ida Darwin Hospitals Major Developed Site in the Green
Belt, the Ida Darwin Hospital part of the site was allocated in the Site Specific
Policies DPD (adopted in January 2010) for redevelopment for housing with the
relocation of the medical and related uses to the Fulbourn Hospital part of the site.
The site could provide up to 275 dwellings. The site will be developed in phases,
starting with the relocation of the medical uses to the Fulbourn Hospital site.
A.55. An outline planning application for up to 180 dwellings, a 70 unit extra care facility
and open space was submitted to the Council in May 2013 along with a development
brief for the site. The Council's planning committee in June 2014 endorsed the
development brief as a material consideration for all subsequent planning
applications, but refused the outline planning application due to the absence of any
appropriate community facilities.
A.56. Due to the discussions undertaken during the consideration of the planning
application it is unlikely that the site will be able to accommodate any more than 230
dwellings. It is unclear exactly when construction will start as the landowner has not
Annual Monitoring Report January 2016
160
provided a completed questionnaire this year; however it is reasonable to assume
the site will be started within five years as the agent has previously advised that the
first housing completions could be in 2017-2018.
A.57. The Council has taken a more cautious approach in terms of the timetable for
delivery of the site, by anticipating that the first housing completions will not be
delivered until 2018-2019.
A.58. In accordance with footnotes 11 and 12 to paragraph 47 of the NPPF this site is
considered deliverable and developable for the following reasons:
Available: the site is not available immediately as the existing medical uses need
to be relocated; however there is a reasonable prospect that the site will be
available during the early part of the plan period.
Suitable: the site is allocated for development in the adopted Site Specific
Policies DPD (January 2010) and in the Local Plan (submitted in March 2014). A
development brief for the site was endorsed by Planning Committee in June
2014.
Achievable and Viable: the agent has previously advised that the development
is achievable and viable.
Papworth Everard West Central
A.59. The Site Specific Policies DPD (adopted in January 2010) identifies an area in the
centre of Papworth Everard for mixed-use redevelopment to enhance the village
centre. This is anticipated to take the form of a number of separate developments of
individual land parcels within the policy area. Discussions have taken place with
landowners and stakeholders regarding the implementation of the policy.
A.60. Land south of Church Lane: a hybrid planning permission for the erection of up to
58 dwellings, 8 units for either housing or business use, a brewhouse, a bakery,
community rooms and open space was granted in October 2014. The agent
anticipates that construction will start in 2016 and be completed in 2019.
A.61. In accordance with footnote 11 to paragraph 47 of the NPPF land south of Church
Lane is considered deliverable for the following reasons:
Available: the site has planning permission and the agent has advised that the
site is available immediately.
Suitable: the site is allocated for development in the adopted Site Specific
Policies DPD (January 2010) and in the Local Plan (submitted in March 2014).
The site has planning permission.
Achievable and Viable: the site has planning permission and the agent
anticipates that the development will be completed in 2017-2019 and has advised
that the development is achievable and viable.
A.62. Catholic Church site: this site could provide 2 dwellings. A planning application for
the erection of a dwelling and the renovation of the church building was refused in
August 2014 as the applicant failed to provide contributions towards community
facilities and public open space necessary to make the development acceptable in
planning terms. It is unclear exactly when the site will be developed as the landowner
January 2016 Annual Monitoring Report
161
/ agent has not provided a completed questionnaire this year, and therefore no
allowance has been made for housing on this site in the housing trajectory.
A.63. In accordance with footnotes 11 and 12 to paragraph 47 of the NPPF the Catholic
Church site is not considered deliverable or developable for the following
reasons:
Available: a planning application for a dwelling and the renovation of the church
building was refused as the applicant failed to agree to provide the necessary
contributions. It is unclear exactly when the site will become available.
Suitable: the site is allocated for development in the adopted Site Specific
Policies DPD (January 2010) and in the Local Plan (submitted in March 2014).
Achievable and Viable: it is unclear whether the development will be achievable
and viable.
Former Bayer CropScience Site
A.64. The former Bayer CropScience site is a brownfield redevelopment site located on the
A10 near Hauxton. The site is allocated for a sustainable mixed-use development in
the Site Specific Policies DPD (adopted in January 2010). Outline planning
permission was granted for a scheme including up to 380 dwellings in February 2010
(which has now lapsed). The site was contaminated and remediation works have
been undertaken and signed off.
A.65. Detailed masterplanning of the site has resulted in the site being anticipated to
provide only 285 dwellings, rather than 380 dwellings as anticipated in the outline
planning permission. The housing trajectory therefore assumes that only 285
dwellings will be provided on this site. Detailed planning permission was granted in
December 2012 for 201 dwellings on phase 1 and at March 2015, construction had
started with 25 dwellings under construction.
A.66. In accordance with footnotes 11 and 12 to paragraph 47 of the NPPF this site is
considered deliverable and developable for the following reasons:
Available: the site has outline planning permission for up to 380 dwellings, of
which 201 dwellings have detailed planning permission. Detailed masterplanning
of the site has resulted in the site being anticipated to provide only 285 dwellings,
and therefore the housing trajectory assumes this lower number of dwellings will
be provided. The development is under construction.
Suitable: the site is allocated for development in the adopted Site Specific
Policies DPD (January 2010) and in the Local Plan (submitted in March 2014).
The site has outline planning permission, and detailed planning permission for
phase 1.
Achievable and Viable: the development has planning permission and is under
construction.
West of Ermine Street South, Papworth Everard
A.67. This is a village extension originally allocated in the Local Plan 1993. The site has
detailed planning permission for 351 dwellings following the demolition of the 6
existing dwellings. At March 2015, all 6 existing dwellings had been demolished, 301
Annual Monitoring Report January 2016
162
new dwellings had been completed, 22 dwellings were under construction and 28
dwellings were not started. Two housebuilders are working on the site, and they
anticipate that the development will be completed in late 2016. Alternative designs
and layouts are being discussed for the land at the entrance, which may result in a
change from the 21 dwellings currently permitted.
A.68. In accordance with footnote 11 to paragraph 47 of the NPPF this site is considered
deliverable as the site has planning permission, is under construction and is largely
completed.
f. New Allocations in the Rural Area (see Table SC5)
Cambourne West
A.69. Land north west of Lower Cambourne, including an area of land within the current
Business Park, is allocated in the Local Plan (submitted in March 2014) for the
development of a sustainable, fourth linked village to Cambourne. The site allocated
in the Local Plan (submitted in March 2014) has multiple landowners and capacity for
approximately 1,200 dwellings with high levels of green infrastructure.
A.70. Land north west of Lower Cambourne: the developer is seeking, through
representations submitted on the Proposed Submission Local Plan (July 2013), the
allocation of a larger development site with a capacity of 2,350 dwellings (on land
outside of the Business Park) and submitted a planning application for this larger
scheme in December 2014. Council officers have advised that: “Whilst the proposed
allocation in the Submission Local Plan remains sound, the arguments made by the
applicant for development of the wider site have some merit. Especially with regards
to place making and the comprehensive delivery of services and facilities that may
not come forward if the additional land were developed as part of a potential, future
allocation. It is recognised that a lot of work has gone into the proposed masterplan
and that designing it around the landscape constraints reflects the approach
originally taken at Cambourne. However, there remain a number of key matters that
would need to be addressed to ensure a sustainable development. The officer view
is that if these matters can be satisfactorily addressed, it is anticipated that a
recommendation of approval is likely to be appropriate.” The developer of this land
has previously indicated that for this larger scheme, construction could start in 2016
and be completed in 2028, assuming an average of 220 dwellings per year.
A.71. Land within the Business Park: this area is has capacity for approximately 240
dwellings, and forms part of the overall capacity of the allocation proposed in the
Local Plan (submitted in March 2014) of approximately 1,200 dwellings. Initial
discussions have been undertaken with the landowner / agent; however it is unclear
exactly when construction will start as the landowner has not provided a completed
questionnaire this year. Further discussions are expected soon.
A.72. Cambourne West (proposed allocation included in the Local Plan, submitted in
March 2014): the developer’s proposal for a larger allocation on land north west of
Lower Cambourne together with the land within the Business Park could provide a
total capacity of 2,590 dwellings. However until the developer’s proposal for a larger
January 2016 Annual Monitoring Report
163
allocation has been considered through the examination of the Local Plan, or until
planning permission is granted or has a resolution to grant planning permission, the
Council is only relying on Cambourne West (as proposed in the Local Plan,
submitted in March 2014) to provide 1,200 dwellings. The housing trajectory
assumes that the site will deliver no more than 150 dwellings a year, so that together
this site and Bourn Airfield New Village will deliver no more than 300 dwellings a
year. This is a more cautious approach on a precautionary basis than the developers
have previously advised (in August 2014 they indicated delivery rates of up to 220
dwellings per year) and lower than the 220 dwellings per year average for the
delivery of Cambourne so far. There are no controls on the rate of delivery of
Cambourne West, so if more than 150 dwellings can be delivered in a year there are
no planning policy barriers to that.
A.73. In accordance with footnotes 11 and 12 to paragraph 47 of the NPPF Cambourne
West is considered deliverable and developable for the following reasons:
Available: a planning application has been submitted for land north west of
Lower Cambourne and initial discussions have been undertaken with the
landowner / agent of land within the business park.
Suitable: the site is allocated for development in the Local Plan (submitted in
March 2014).
Achievable and Viable: the agent has previously advised that the development
is achievable and viable, and a planning application has been submitted.
Dales Manor Business Park, Sawston
A.74. The site is allocated in the Local Plan (submitted in March 2014) for 200 dwellings
and light industrial and office uses. Part of the site is available immediately, further
parts of the site will become available for development in early 2017, and the
remaining parts of the site will become available from late 2019 – 2022. The phasing
of delivery takes account of the leaseholds on the site. The agent has advised that a
planning application for 350 dwellings, with no employment uses, on a slightly larger
site is anticipated to be submitted in Spring 2016, and based on this proposal that
development will start on site in 2018, deliver 50 dwellings per year, and be
completed in 2025. Until the landowners’ proposals have been considered through
the examination of the Local Plan, or until planning permission is granted, the
Council is only relying on this site to provide 200 dwellings. The Council has also
revised the landowners’ delivery timetable to take account of when the existing
leases expire across the site and to allow for the phasing of the development to be
fully considered.
A.75. In accordance with footnotes 11 and 12 to paragraph 47 of the NPPF this site is
considered deliverable and developable for the following reasons:
Available: the site is not available immediately, but part will become available for
development in early 2017. The phasing of delivery takes account of the
leaseholds on the site.
Suitable: the site is allocated for development in the Local Plan (submitted in
March 2014).
Achievable and Viable: the agent has previously advised that the development
is achievable and viable.
Annual Monitoring Report January 2016
164
Land north of Babraham Road, Sawston
A.76. The site is allocated in the Local Plan (submitted in March 2014) for 80 dwellings.
The agent anticipates that development will start on site in Autumn 2016 / Spring
2017 and be completed in Spring 2019. Initial pre-application discussions have been
undertaken and the agent anticipates that the site will be able to accommodate 130
dwellings. Until the capacity has been considered through the examination of the
Local Plan, or until planning permission is granted, the Council is only relying on this
site to provide 80 dwellings. The site is currently in the Green Belt and this is taken
into account in the timetable for its delivery.
A.77. In accordance with footnote 11 to paragraph 47 of the NPPF this site is considered
deliverable for the following reasons:
Available: initial pre-application discussions have been undertaken and the
agent has advised that the site is available immediately.
Suitable: the site is allocated for development in the Local Plan (submitted in
March 2014).
Achievable and Viable: the agent anticipates that the development will be
completed in 2017-2020 and has advised that the development is achievable and
viable.
Land south of Babraham Road, Sawston
A.78. The site is allocated in the Local Plan (submitted in March 2014) for 260 dwellings.
The site is not available immediately as notice needs to be given to the tenant
farmer. The agent responding on behalf of all landowners anticipates that the site will
become available in 2017-2018, construction will start at the same time, and be
completed in 2023. The site is currently in the Green Belt and this is taken into
account in the timetable for its delivery.
A.79. In accordance with footnotes 11 and 12 to paragraph 47 of the NPPF this site is
considered deliverable and developable for the following reasons:
Available: the agent has advised that the site will become available in 2017-2018
and that notice needs to be given to the tenant farmer.
Suitable: the site is allocated for development in the Local Plan (submitted in
March 2014).
Achievable and Viable: the agent anticipates that the development will be
completed in 2018-2023 and has advised that the development is achievable and
viable.
Land north of Impington Lane, Impington
A.80. The site is allocated in the Local Plan (submitted in March 2014) for 25 dwellings.
The landowners are seeking, through representations submitted on the Proposed
Submission Local Plan (July 2013), the allocation of a larger residential development
with a capacity of approximately 74 dwellings. Until the landowners proposals have
been considered through the examination of the Local Plan, the Council is only
relying on this site to provide 25 dwellings. The site is not available immediately as a
developer has not yet been confirmed. The agent anticipates that development will
January 2016 Annual Monitoring Report
165
start on site in early 2018 and be completed by late 2019. The site is currently in the
Green Belt and this is taken into account in the timetable for its delivery.
A.81. In accordance with footnote 11 to paragraph 47 of the NPPF this site is considered
deliverable for the following reasons:
Available: the agent has advised that the site will become available in early 2018
and that a developer needs to be confirmed.
Suitable: the site is allocated for development in the Local Plan (submitted in
March 2014).
Achievable and Viable: the agent anticipates that the development will be
completed within five years and has advised that the development is achievable
and viable.
Land west of New Road, Melbourn
A.82. The site is allocated in the Local Plan (submitted in March 2014) for 65 dwellings.
The site has multiple landowners and is being brought forward as two separate but
complementary developments.
A.83. Land south west of Victoria Way: the site has planning permission for 64
dwellings. The development would not normally have been considered acceptable in
principle as a result of its location. However, as the site forms part of a proposed
allocation in the Local Plan (submitted in March 2014), and as a result of the Council
not being able to demonstrate a five year housing land supply, any adverse impacts
of the development were not considered to demonstrably outweigh the benefits of
the development. At March 2015 construction works had started and the agent has
indicated that this scheme will be completed in 2019.
A.84. Land at 36 New Road: the Council's planning committee in September 2015 gave
officers delegated powers to approve the erection of 18 dwellings and the retention
of the existing dwelling at 36 New Road, subject to the prior completion of a s106
agreement. The development would not normally have been considered acceptable
in principle as a result of its location. However, as the site forms part of a proposed
allocation in the Local Plan (submitted in March 2014), and as a result of the Council
not being able to demonstrate a five year housing land supply, any adverse impacts
of the development were not considered to demonstrably outweigh the benefits of
the development. The agent acting on behalf of the landowner anticipates that this
scheme will be delivered in 2017-2018.
A.85. In accordance with footnote 11 to paragraph 47 of the NPPF land west of New
Road, Melbourn is considered deliverable for the following reasons:
Available: the site has multiple landowners and is being brought forward as two
separate but complementary developments. The site has planning permission for
64 dwellings and a resolution to grant planning permission for an additional 18
dwellings, subject to the completion of a s106 agreement.
Suitable: the site is allocated for development in the Local Plan (submitted in
March 2014). The site has planning permission for 64 dwellings and a resolution
to grant planning permission for an additional 18 dwellings.
Annual Monitoring Report January 2016
166
Achievable and Viable: construction has started on site to deliver the 64
dwellings on land south of Victoria Way, and the agent anticipates the
development will be completed in 2019 and has advised that this development is
achievable and viable. The agent for land at 36 New Road anticipates that this
development will be completed in 2017-2018.
Green End Industrial Estate, Gamlingay
A.86. The site is allocated in the Local Plan (submitted in March 2014) for 90 dwellings
and light industrial and/or office uses. An outline planning application covering
approximately 75% of the site was submitted in August 2015 for the demolition of 5
dwellings and industrial and office units and the erection of up to 90 dwellings
together with associated parking, public open space, landscaping, and infrastructure
works. The agent has indicated that development could start on site in September
2016 and be completed in September 2019.
A.87. In accordance with footnote 11 to paragraph 47 of the NPPF this site is considered
deliverable for the following reasons:
Available: the agent has advised that the site is available immediately.
Suitable: the site is allocated for development in the Local Plan (submitted in
March 2014).
Achievable and Viable: the agent anticipates that the development will be
completed in 2017-2020 and has advised that the development is achievable and
viable.
East of Rockmill End, Willingham
A.88. The site is allocated in the Local Plan (submitted in March 2014) for 50 dwellings. It
is unclear exactly when construction will start as the landowner has not provided a
completed questionnaire this year; however it is reasonable to assume the site will
be completed in five years. The agent has previously advised that development will
start on site in 2016 and be completed in 2018. The Council has taken a more
cautious approach in terms of the timetable for delivery of the site, by anticipating
that the first housing completions will not be delivered until 2017-2018 and that the
development will not be completed until 2019-2020.
A.89. In accordance with footnote 11 to paragraph 47 of the NPPF this site is considered
deliverable for the following reasons:
Available: the agent has previously advised that the site is available immediately.
Suitable: the site is allocated for development in the Local Plan (submitted in
March 2014).
Achievable and Viable: the agent has previously advised that the development
is achievable and viable.
Land at Bennell Farm, West Street, Comberton
A.90. The site is allocated in the Local Plan (submitted in March 2014) for 90 dwellings, a
full size football pitch and changing facilities, and community car parking. An outline
planning application for up to 90 dwellings, a car park, football pitch and changing
January 2016 Annual Monitoring Report
167
facilities, and associated infrastructure works was submitted in August 2015. The
agent has indicated that, subject to planning approval and the Local Plan being
found ‘sound’, development will start on site in 2016-2017 and be completed in 2019-
2020. The Council has also taken a more cautious approach in terms of the timetable
for delivery of the site as the site is currently in the Green Belt, by anticipating that
the first housing completions will not be delivered until 2017-2018.
A.91. In accordance with footnote 11 to paragraph 47 of the NPPF this site is considered
deliverable for the following reasons:
Available: the agent has advised that the site is available immediately, subject to
the granting of planning permission.
Suitable: the site is allocated for development in the Local Plan (submitted in
March 2014).
Achievable and Viable: the agent anticipates that the development will be
completed in 2016-2020 and has advised that the development is achievable and
viable.
Three Sites in Great and Little Abington
A.92. The Parish Councils of Great and Little Abington are promoting three small scale
housing developments to meet identified local housing needs, primarily for market
housing but also including some affordable homes. All of the sites were considered
through the Strategic Housing Land Availability Assessment (SHLAA) which
concluded that they were not potentially capable of providing residential development
due to site factors and constraints including landscape, heritage and noise impacts.
A.93. The Parish Council did not concur with the conclusions in the SHLAA and as an
alternative to taking forward a Neighbourhood Plan consulted local people about
whether the sites should or should not be allocated for housing development. The
consultation provided clear evidence of local support and therefore the Council has
proposed a major modification (MM/7/0152) to the Local Plan to allocate these three
sites for housing. These sites will be subject to public consultation as part of the
consultation resulting from the additional work undertaken in response to the
Inspectors’ preliminary conclusions.
A.94. Land at Linton Road, Great Abington: the major modification proposes that the site
is allocated for 35 dwellings. The landowners have undertaken preliminary site
assessment and design layout work on this site, and are proposing that the site could
accommodate 36 dwellings, of which 50% would be affordable. This level of
affordable housing is in excess of the current policy requirement and reflects the fact
that there would be no affordable housing provided on the site at Bancroft Farm,
Little Abington. Until this proposal has been considered through the examination of
the Local Plan, or until planning permission is granted, the Council is only relying on
this site to provide 35 dwellings. The agent anticipates that development will start on
site in 2016-2017 and be completed in 2017-2018.
52
Schedule of Proposed Major Modifications to the Proposed Submission Local Plan:
https://www.scambs.gov.uk/major-modifications-and-minor-changes
Annual Monitoring Report January 2016
168
A.95. In accordance with footnote 11 to paragraph 47 of the NPPF this site is considered
deliverable for the following reasons:
Available: the agent has advised that subject to the granting of planning
permission, the site is available immediately, and the landowners have
undertaken preliminary site assessment and design layout work for the site.
Suitable: the site is proposed for allocation as a major modification to the Local
Plan (submitted in March 2014).
Achievable and Viable: the agent anticipates that the development will be
completed in 2016-2018 and has advised that the development is achievable and
viable.
A.96. Land at junction of High Street & Pampisford Road, Great Abington: the major
modification proposes that the site is allocated for 12 dwellings. The developer is
proposing the development of a slightly larger site with a capacity of 20 dwellings.
Until this proposal has been considered through the examination of the Local Plan,
or until planning permission is granted, the Council is only relying on this site to
provide 12 dwellings. The developer anticipates that construction will start on site in
mid 2016 and the scheme will be completed by the end of 2017.
A.97. In accordance with footnote 11 to paragraph 47 of the NPPF this site is considered
deliverable for the following reasons:
Available: the developer has advised that the site is available immediately.
Suitable: the site is proposed for allocation as a major modification to the Local
Plan (submitted in March 2014).
Achievable and Viable: the developer anticipates that the development will be
completed in 2017-2018 and has advised that the development is achievable and
viable.
A.98. Land at Bancroft Farm, Church Lane, Little Abington: the major modification
proposes that the site is allocated for 6 dwellings. The landowners have undertaken
preliminary site assessment and design layout work on this site, and are proposing
that the site could accommodate 9 dwellings, all of which would be market housing.
A higher level of affordable housing than the current policy requirement is being
proposed on the site at Linton Road, Great Abington to reflect the fact there would be
no affordable housing provided on this site. Until this proposal has been considered
through the examination of the Local Plan, or until planning permission is granted,
the Council is only relying on this site to provide 6 dwellings. The agent anticipates
that development will start on site in 2016-2017 and be completed in 2017-2018. The
site is a former farmyard and therefore decontamination may be required.
A.99. In accordance with footnote 11 to paragraph 47 of the NPPF this site is considered
deliverable for the following reasons:
Available: the agent has advised that the site is available immediately, and the
landowners have undertaken preliminary site assessment and design layout work
for the site.
Suitable: the site is proposed for allocation as a major modification to the Local
Plan (submitted in March 2014).
January 2016 Annual Monitoring Report
169
Achievable and Viable: the agent anticipates that the development will be
completed in 2017-2018 and has advised that the development is achievable and
viable.
Land at Toseland Road, Graveley
A.100. Graveley Parish Council is promoting a small scale housing development at
Toseland Road to meet identified local housing needs, primarily for market housing
but also including some affordable homes. As an alternative to taking forward a
Neighbourhood Plan the Parish Council consulted local people about whether the
site should or should not be allocated for housing development. The consultation
provided clear evidence of local support and therefore the Council has proposed a
major modification (MM/7/0253) to the Local Plan to allocate this site for 6 dwellings.
This site will be subject to public consultation as part of the consultation resulting
from the additional work undertaken in response to the Inspectors’ preliminary
conclusions. A planning application is being prepared and the agent anticipates that
the development will start and be completed in 2016-2017.
A.101. In accordance with footnote 11 to paragraph 47 of the NPPF this site is considered
deliverable for the following reasons:
Available: the agent has advised that a planning application is being prepared.
Suitable: the site is proposed for allocation as a major modification to the Local
Plan (submitted in March 2014).
Achievable and Viable: the agent anticipates that the development will be
completed in 2016-2017.
g. Windfalls: Unallocated Sites with Planning Permission (see Table SC6)
Land at Moores Farm, Fowlmere Road, Foxton
A.102. The site has planning permission for 15 dwellings. Initial construction works have
started on site. It is unclear exactly when the development will be completed as the
landowner / agent has not provided a completed questionnaire this year; however it
is reasonable to assume the site will be completed in five years.
A.103. In accordance with footnote 11 to paragraph 47 of the NPPF this site is considered
deliverable as the site has planning permission and is under construction.
Land west of 22a West Road, Gamlingay
A.104. The site has planning permission for 10 dwellings. At March 2015, the access road
had been completed and construction had started on 4 dwellings. It is unclear exactly
when the development will be completed as the landowner / agent has not provided
a completed questionnaire this year; however it is reasonable to assume the site will
be completed in five years.
53
Schedule of Proposed Major Modifications to the Proposed Submission Local Plan:
https://www.scambs.gov.uk/major-modifications-and-minor-changes
Annual Monitoring Report January 2016
170
A.105. In accordance with footnote 11 to paragraph 47 of the NPPF this site is considered
deliverable as the site has planning permission and is under construction.
57 Brickhills, Willingham
A.106. The site has planning permission for 19 dwellings. At March 2015, construction had
started on 17 dwellings. The agent anticipates that the scheme will be completed in
Autumn 2015.
A.107. In accordance with footnote 11 to paragraph 47 of the NPPF this site is considered
deliverable as the site has planning permission and is under construction.
Land south of Station Road, Gamlingay
A.108. The site has detailed planning permission for 85 dwellings and outline planning
permission for employment and open space uses. At March 2015, 71 dwellings had
been completed and the remaining 14 dwellings were under construction. The
developer anticipates that all dwellings will be completed by March 2016.
A.109. In accordance with footnote 11 to paragraph 47 of the NPPF this site is considered
deliverable as the site has planning permission and is under construction.
Land at the junction of Long Drove and Beech Road, Cottenham
A.110. The site has planning permission for 47 dwellings. At March 2015, 22 dwellings had
been completed and the remaining 25 dwellings were under construction. The
developer anticipates that the scheme will be completed in Summer 2016.
A.111. In accordance with footnote 11 to paragraph 47 of the NPPF this site is considered
deliverable as the site has planning permission and is under construction.
31 The Moor, Melbourn
A.112. The site has planning permission for 11 dwellings following the demolition of the
existing dwelling. At March 2015, the existing dwelling had been demolished, and
construction had started on 8 dwellings. The agent anticipates that the scheme will
be completed in early 2016.
A.113. In accordance with footnote 11 to paragraph 47 of the NPPF this site is considered
deliverable as the site has planning permission and is under construction.
Land at Former EDF Energy Depot and Training Centre, Ely Road, Milton
A.114. The site has detailed planning permission for 89 dwellings, a sports pavilion and
open space, and the restoration the Humphrey Repton landscape, and outline
planning permission for the restoration of North Lodge. At March 2015, 89 dwellings
and the sports pavilion were built. It is unclear exactly when the restoration and
conversion of North Lodge to a dwelling will be undertaken, and therefore no
allowance has been made for this dwelling in the housing trajectory.
January 2016 Annual Monitoring Report
171
A.115. In accordance with footnotes 11 and 12 to paragraph 47 of the NPPF this site is not
considered deliverable or developable as although the restoration and conversion
of North Lodge has outline planning permission, it is unclear exactly when the
restoration and conversion will be undertaken.
Former John Faulkner Infants School, The Baulks, Sawston
A.116. The site has planning permission for 10 dwellings. At March 2015, 1 dwelling had
been completed and the remaining 9 dwellings were under construction. The agent
anticipates that the scheme will be completed by December 2015.
A.117. In accordance with footnote 11 to paragraph 47 of the NPPF this site is considered
deliverable as the site has planning permission and is under construction.
Land at Church Street, Great Eversden
A.118. The site has planning permission for 10 affordable dwellings. The Council's Planning
Committee in March 2015 gave officers delegated powers to approve a revised
planning application, subject to a condition requiring low level lighting. It is
anticipated that construction will start on site in Autumn 2015 and be completed in
Autumn 2016.
A.119. In accordance with footnote 11 to paragraph 47 of the NPPF this site is considered
deliverable as the site has planning permission and there is no evidence to suggest
the development will not be completed within five years.
Land at London Road, Great Shelford and Granta Terrace, Stapleford
A.120. Three sites have detailed planning permission for 62 dwellings and open space
following the demolition of existing Welch’s Group buildings. At March 2015, 4
dwellings had been completed and 14 dwellings were under construction. The
developer anticipates that the development will be completed in December 2016,
and has provided information that anticipates that 20 dwellings will be completed by
March 2016, and that the remaining 38 dwellings will be completed in the following
year. The completed questionnaire was provided after the preparation of the housing
trajectory, which assumes a slightly different split of completions: 14 dwellings in
2015-2016, and 44 dwellings in 2016-2017.
A.121. In accordance with footnote 11 to paragraph 47 of the NPPF this site is considered
deliverable as the site has planning permission and is under construction.
Land west of Cody Road, Waterbeach
A.122. Planning permission for 60 dwellings, car parking, open space and a children’s play
area was allowed on appeal in June 2014. The planning inspector considering the
appeal lodged concluded that the Council cannot demonstrate a five year supply of
housing land and that having regard to the development plan and the presumption in
favour of sustainable development in the NPPF this is a suitable and sustainable
Annual Monitoring Report January 2016
172
location for this scale of residential development. The Council's planning committee
in May 2015 gave officers delegated powers to approve a revised planning
application subject to the resolution of issues and the prior completion of a s106
agreement. The developer anticipates that the scheme will be completed by Spring
2018.
A.123. In accordance with footnote 11 to paragraph 47 of the NPPF this site is considered
deliverable for the following reasons:
Available: the site has planning permission and the Council’s planning
committee has given officers delegated powers to approve a revised scheme
subject to the resolution of issues and the completion of a s106 agreement.
Suitable: the planning inspector considering the appeal lodged concluded that
the Council cannot demonstrate a five year supply of housing land and that
having regard to the development plan and the presumption in favour of
sustainable development in the NPPF this is a suitable and sustainable location
for this scale of residential development. Planning permission was allowed on
appeal.
Achievable and Viable: the site has planning permission and the developer
anticipates that the scheme will be completed by Spring 2018.
Land north of Bannold Road, Waterbeach
A.124. Outline planning permission for residential development of up to 90 homes was
allowed on appeal in June 2014. The planning inspector considering the appeal
lodged concluded that the Council cannot demonstrate a five year supply of housing
land and that having regard to the development plan and the presumption in favour
of sustainable development in the NPPF this is a suitable and sustainable location
for this scale of residential development. The developer anticipates that the first
dwellings will be completed in 2017-2018 and that the scheme will be completed in
2018-2019. A new outline planning application for a residential development of 144
homes was submitted in June 2015.
A.125. In accordance with footnote 11 to paragraph 47 of the NPPF this site is considered
deliverable for the following reasons:
Available: the site has planning permission and a new outline planning
application for a revised scheme has been submitted.
Suitable: the planning inspector considering the appeal lodged concluded that
the Council cannot demonstrate a five year supply of housing land and that
having regard to the development plan and the presumption in favour of
sustainable development in the NPPF this is a suitable and sustainable location
for this scale of residential development. Planning permission was allowed on
appeal.
Achievable and Viable: the site has planning permission and the developer
anticipates that the scheme will be completed in 2018-2019.
Showmans Site, Biddall's Boulevard, Kneesworth Road, Meldreth
A.126. Planning permission for the variation of the original planning permission to allow an
additional 10 plots was granted in May 2014. This planning permission regularises 6
January 2016 Annual Monitoring Report
173
plots and permits 4 new plots. The 4 new plots can be occupied as conditions
relating to the provision and implementation of surface water drainage, the provision
and maintenance of the area of public open space, and the provision of a footpath
along the north west side of Kneesworth Road have been discharged. It is unclear
exactly when the 4 new plots will be provided and therefore no allowance has been
made for these 4 plots in the housing trajectory.
A.127. In accordance with footnotes 11 and 12 to paragraph 47 of the NPPF this site is not
considered deliverable or developable as although the site has planning
permission for 4 new plots and the conditions have been discharged, it is unclear
exactly when the new plots will be provided.
Land north of Fen Drayton Road, Swavesey
A.128. The site has planning permission for 20 affordable dwellings. Construction has
started and it is anticipated that the scheme will be completed in May 2016.
A.129. In accordance with footnote 11 to paragraph 47 of the NPPF this site is considered
deliverable as the site has planning permission and is under construction.
Land rear of Cygnus Business Park, Swavesey
A.130. Planning permission for 12 dwellings was granted in May 2015. The agent
anticipates that development will start on site in early 2016 and be completed in
Autumn 2017.
A.131. In accordance with footnote 11 to paragraph 47 of the NPPF this site is considered
deliverable as the site has planning permission and there is no evidence to suggest
the development will not be completed within five years.
Granta Processors, Mill Lane, Whittlesford
A.132. The site has outline planning permission for 16 dwellings following the demolition of
existing buildings. The site is not available immediately as there is an existing active
employment use on the site that needs to be relocated. The agent anticipates that
the site will become available in mid 2017, that construction could start on site at the
same time, and that the scheme will be completed in 2018-2019.
A.133. In accordance with footnote 11 to paragraph 47 of the NPPF this site is considered
deliverable as the site has planning permission, and although the site is not
available immediately as the existing employment use needs to be relocated, there is
no evidence to suggest the development will not be completed within five years.
Land at Bannold Road and Bannold Drove, Waterbeach
A.134. Outline planning permission for up to 57 dwellings was allowed on appeal in
February 2015. The planning inspector considering the appeal lodged notes that the
parties agree that the Council cannot demonstrate a five year supply of deliverable
housing sites and therefore that relevant policies for the supply of housing should not
Annual Monitoring Report January 2016
174
be considered up-to-date. The Inspector concluded that the proposal would not
adversely affect the character and appearance of the area and would accord with the
NPPF. It is unclear exactly when construction will start as the landowner has not
provided a completed questionnaire this year; however it is reasonable to assume
the site will be completed in five years.
A.135. In accordance with footnote 11 to paragraph 47 of the NPPF this site is considered
deliverable for the following reasons:
Available: the site has planning permission.
Suitable: the planning inspector considering the appeal lodged concludes that
the site is a sustainable location with good access on foot to local services and
facilities and good access to public transport. Planning permission was allowed
on appeal.
Achievable and Viable: the site has planning permission and there is no
evidence to suggest the development will not be completed within five years.
Newdigate House, 3 Horseheath Road, Linton
A.136. The site has planning permission for 12 dwellings following demolition of existing
dwelling. Construction has started and the agent anticipates that the scheme will be
completed in 2016-2017.
A.137. In accordance with footnote 11 to paragraph 47 of the NPPF this site is considered
deliverable as the site has planning permission and is under construction.
Land to east of Cody Road and north of Bannold Road, Waterbeach
A.138. Outline planning permission for up to 36 dwellings was granted in April 2015. The
site was recommended for approval by the case officer as the adverse impacts of
this development were not considered to significantly and demonstrably outweigh the
benefits of the development, when assessed against the policies in the NPPF which
establish a presumption in favour of sustainable development in the context of the
lack of a five year housing land supply. The developer has confirmed that, subject to
the granting of detailed planning permission for the site, it is reasonable to assume
that the scheme will be completed in 2017-2018.
A.139. In accordance with footnote 11 to paragraph 47 of the NPPF this site is considered
deliverable as the site has planning permission and the developer has advised that
it is reasonable to assume that the scheme will be completed in 2017-2018.
Small Sites (9 dwellings or less)
A.140. At 31 March 2015, there were 187 dwellings with planning permission on small sites
already under construction. It has not been practical to explore the delivery of each
of these sites with the landowner, developer or agent, however as the majority of
dwellings are under construction it is considered reasonable to count all of these
dwellings. All these dwellings are anticipated to be completed within two years.
January 2016 Annual Monitoring Report
175
A.141. In accordance with footnote 11 to paragraph 47 of the NPPF these sites are
considered deliverable as the sites have planning permission and are under
construction.
A.142. At 31 March 2015, there were 234 dwellings with planning permission on small sites
not under construction. It has not been practical to explore the delivery of each of
these sites with the landowner, developer or agent, and as development has yet to
start it is considered necessary to make an allowance for a proportion of sites that
may not come forward for development. A 10% allowance for non-delivery has been
used, which is an approach supported by the Inspectors examining the Council’s
Local Development Framework documents when assessing housing supply. On this
basis, 211 dwellings are anticipated to be completed within five years.
A.143. Between 1 April and 30 June 2015, 34 dwellings were granted planning permission
on small sites that did not already have planning permission at 31 March 2015. It has
not been practical to explore the delivery of each of these sites with the landowner,
developer or agent, and as development has yet to start it is considered necessary to
make an allowance for a proportion of sites that may not come forward for
development. A 10% allowance for non-delivery has been used, which is an
approach supported by the Inspectors examining the Council’s Local Development
Framework documents when assessing housing supply. On this basis, 31 dwellings
are anticipated to be completed within five years.
A.144. In accordance with footnote 11 to paragraph 47 of the NPPF these sites are
considered deliverable as the sites have planning permission and a discount of 10%
has been applied to allow for any that may not come forward. There is no clear
evidence that these sites will not be delivered within five years.
h. Windfalls: Unallocated Sites with Resolution to Grant Planning Permission (see
Table SC6)
Land west of Longstanton
A.145. The Council's planning committee has approved an application to increase the site
from 510 to 546 dwellings subject to the prior completion of a s106 agreement. This
would provide an additional 36 dwellings. There are still issues to be resolved
relating to the s106 agreement and therefore no allowance is made for housing on
this site in the housing trajectory.
A.146. In accordance with footnotes 11 and 12 to paragraph 47 of the NPPF this site is not
considered deliverable or developable as there are still issues to be resolved
relating to the s106 agreement and therefore it is unclear exactly when the
development will be delivered.
Land rear of 131 The Causeway, Bassingbourn-cum-Kneesworth
A.147. The Council's planning committee in August 2014 gave officers delegated powers to
approve the erection of 20 dwellings, subject to an independent assessment being
undertaken to determine the viability of providing additional affordable housing within
Annual Monitoring Report January 2016
176
the scheme and the prior completion of a s106 agreement. The agent anticipates
that development will start on site in 2016 and be completed in 2017.
A.148. In accordance with footnote 11 to paragraph 47 of the NPPF this site is considered
deliverable as the site has planning permission and there is no evidence to suggest
the development will not be completed within five years.
Land adjacent to Hill Farm, Fowlmere Road, Foxton
A.149. The Council's planning committee in February 2015 gave officers delegated powers
to approve the erection of 15 affordable dwellings, subject to outstanding comments
from and any further work required by Cambridgeshire County Council’s Archaeology
Service, and the prior completion of a s106 agreement. It is anticipated that
construction will start on site in January 2016 and that the development will be
completed in January 2017.
A.150. In accordance with footnote 11 to paragraph 47 of the NPPF this site is considered
deliverable as the site has planning permission and there is no evidence to suggest
the development will not be completed within five years.
Ermine Street, Caxton
A.151. The Council's planning committee in March 2015 gave officers delegated powers to
approve the erection of 10 dwellings, subject to the prior completion of a s106
agreement. The agent anticipates that, subject to the completion of the s106
agreement, development will start on site in Autumn 2015 and that the scheme will
be completed by December 2016.
A.152. In accordance with footnote 11 to paragraph 47 of the NPPF this site is considered
deliverable as the site has planning permission and there is no evidence to suggest
the development will not be completed within five years.
Former CEMEX Works, Haslingfield Road, Barrington
A.153. The Council's planning committee in June 2015 gave officers delegated powers to
approve the demolition of all existing buildings and structures and redevelopment to
provide up to 220 residential units, formal and informal open space including
allotments, car parking for Barrington Primary School, new pedestrian and cycle links
to Barrington village and Foxton Station, and associated works, subject to the prior
completion of a s106 agreement. The site was recommended for approval by the
case officer as the Council does not have an up-to-date five year housing land
supply and therefore on balance, the harm arising from the scheme does not
significantly and demonstrably outweigh the benefits. The agent anticipates that the
demolition of the existing buildings and the clean-up / restoration of the site will be
undertaken in 2016, that the construction of dwellings will start in late 2016 / early
2017, and that the scheme will be completed by 2020.
January 2016 Annual Monitoring Report
177
A.154. In accordance with footnote 11 to paragraph 47 of the NPPF this site is considered
deliverable as the site has planning permission and the agent anticipates that the
development will be completed by 2020.
Land north of Daniels Close, Willingham
A.155. The Council's planning committee in April 2015 gave officers delegated powers to
approve the erection of 12 affordable dwellings subject to officers discussing with the
applicant and Local Highways Authority options for a footpath on at least one side of
the access road, and the prior completion of a s106 agreement. It is anticipated that
construction will start on site in Autumn 2015 and that the development will be
completed in Autumn 2017.
A.156. In accordance with footnote 11 to paragraph 47 of the NPPF this site is considered
deliverable as the site has planning permission and there is no evidence to suggest
the development will not be completed within five years.
i. Windfalls: Windfall Allowance (see Table SC6)
A.157. The NPPF says that an allowance may be made for windfall sites if local planning
authorities have compelling evidence that such sites have consistently become
available in the local area and will continue to provide a reliable source of supply.
A.158. In South Cambridgeshire, analysis of housing completions between 2006 and 2014,
shows that an average of 203 dwellings per year have been completed on windfall
sites. This excludes any dwellings completed on garden land as required by the
NPPF, and dwellings completed on allocated land as these are not windfall sites.
A.159. The housing trajectory includes two types of windfall sites: (i) identified; and (ii)
unidentified. Identified windfall sites are developments with planning permission that
are on land not land allocated in the Local Plan or Local Development Framework.
Unidentified windfalls are developments that are not yet known about that will come
forward in future on land not allocated. The housing trajectory includes an allowance
for unidentified windfall sites.
A.160. Identified windfall sites are predicted to deliver over 200 dwellings a year in the first
two years of the housing trajectory (2015-2017) and just under 200 dwellings in
2017-2018 and therefore no allowance for unidentified windfall sites is included in the
housing trajectory for these years. For the remaining years an annual windfall
allowance (rounded to the nearest 50 dwellings) is included that together with the
predicted completions on identified windfall sites does not exceed 200 dwellings a
year. It is anticipated that unidentified windfall sites will deliver 2,450 dwellings by
2031.
A.161. In accordance with footnotes 11 and 12 to paragraph 47 of the NPPF these sites are
considered deliverable and developable as historic data shows that an average of
203 dwellings per year have been completed on windfall sites (compliant with the
Annual Monitoring Report January 2016
178
definition in the NPPF) and therefore the Council’s assumption of no more than 200
dwellings on ‘unidentified’ windfall sites a year is a realistic allowance.
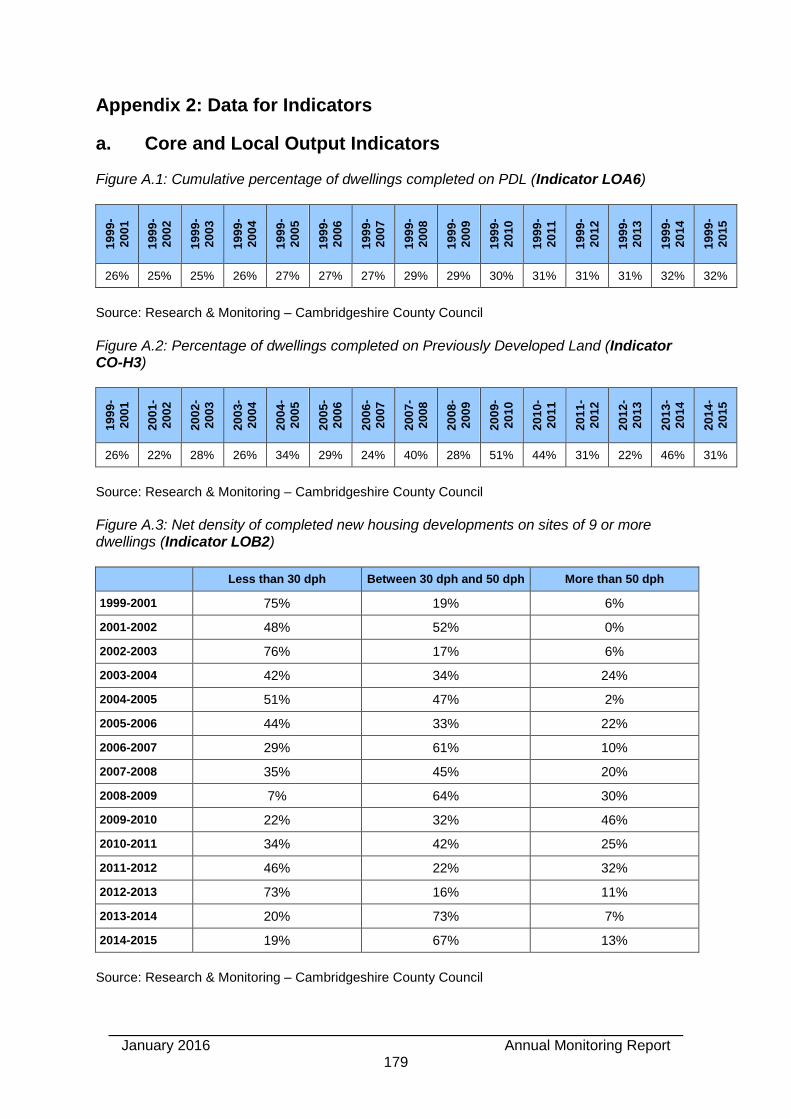
January 2016 Annual Monitoring Report
179
Appendix 2: Data for Indicators
a. Core and Local Output Indicators Figure A.1: Cumulative percentage of dwellings completed on PDL (Indicator LOA6)
19
99
-
20
01
19
99
-
20
02
19
99
-
20
03
19
99
-
20
04
19
99
-
20
05
19
99
-
20
06
19
99
-
20
07
19
99
-
20
08
19
99
-
20
09
19
99
-
20
10
19
99
-
20
11
19
99
-
20
12
19
99
-
20
13
19
99
-
20
14
19
99
-
20
15
26% 25% 25% 26% 27% 27% 27% 29% 29% 30% 31% 31% 31% 32% 32%
Source: Research & Monitoring – Cambridgeshire County Council
Figure A.2: Percentage of dwellings completed on Previously Developed Land (Indicator CO-H3)
19
99
-
20
01
20
01
-
20
02
20
02
-
20
03
20
03
-
20
04
20
04
-
20
05
20
05
-
20
06
20
06
-
20
07
20
07
-
20
08
20
08
-
20
09
20
09
-
20
10
20
10
-
20
11
20
11
-
20
12
20
12
-
20
13
20
13
-
20
14
20
14
-
20
15
26% 22% 28% 26% 34% 29% 24% 40% 28% 51% 44% 31% 22% 46% 31%
Source: Research & Monitoring – Cambridgeshire County Council
Figure A.3: Net density of completed new housing developments on sites of 9 or more dwellings (Indicator LOB2)
Less than 30 dph Between 30 dph and 50 dph More than 50 dph
1999-2001 75% 19% 6%
2001-2002 48% 52% 0%
2002-2003 76% 17% 6%
2003-2004 42% 34% 24%
2004-2005 51% 47% 2%
2005-2006 44% 33% 22%
2006-2007 29% 61% 10%
2007-2008 35% 45% 20%
2008-2009 7% 64% 30%
2009-2010 22% 32% 46%
2010-2011 34% 42% 25%
2011-2012 46% 22% 32%
2012-2013 73% 16% 11%
2013-2014 20% 73% 7%
2014-2015 19% 67% 13%
Source: Research & Monitoring – Cambridgeshire County Council
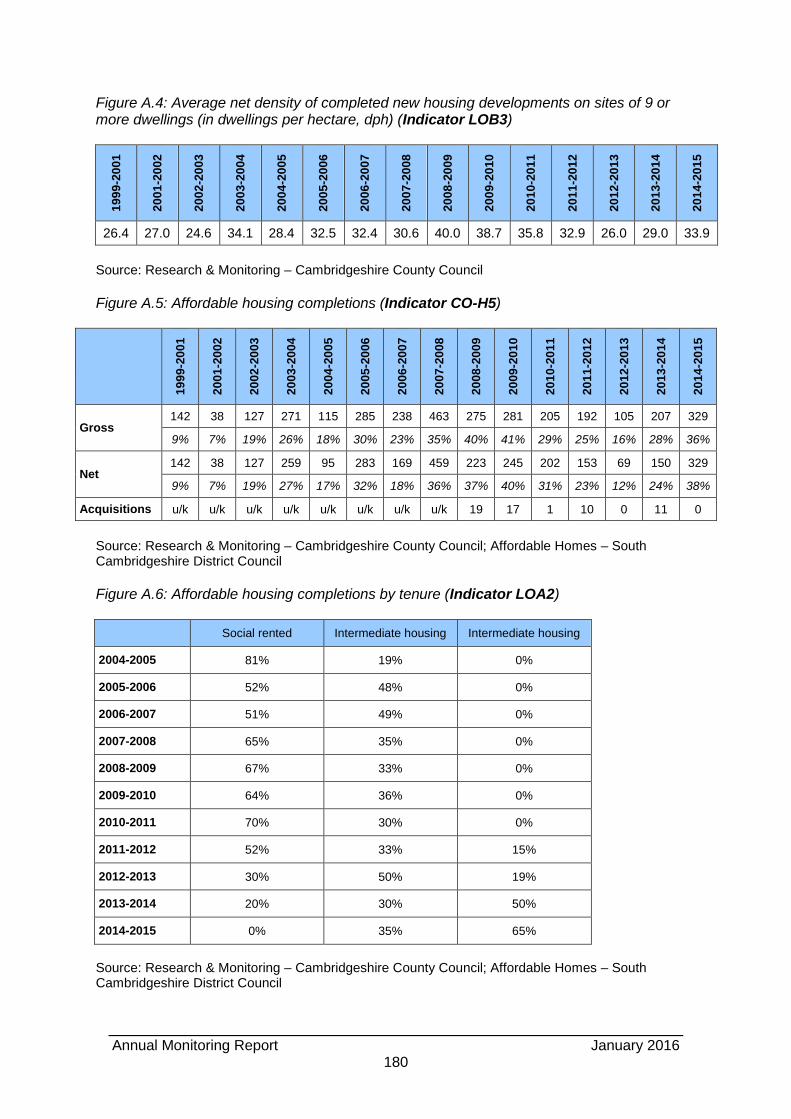
Annual Monitoring Report January 2016
180
Figure A.4: Average net density of completed new housing developments on sites of 9 or more dwellings (in dwellings per hectare, dph) (Indicator LOB3)
19
99
-20
01
20
01
-20
02
20
02
-20
03
20
03
-20
04
20
04
-20
05
20
05
-20
06
20
06
-20
07
20
07
-20
08
20
08
-20
09
20
09
-20
10
20
10
-20
11
20
11
-20
12
20
12
-20
13
20
13
-20
14
20
14
-20
15
26.4 27.0 24.6 34.1 28.4 32.5 32.4 30.6 40.0 38.7 35.8 32.9 26.0 29.0 33.9
Source: Research & Monitoring – Cambridgeshire County Council
Figure A.5: Affordable housing completions (Indicator CO-H5)
19
99
-20
01
20
01
-20
02
20
02
-20
03
20
03
-20
04
20
04
-20
05
20
05
-20
06
20
06
-20
07
20
07
-20
08
20
08
-20
09
20
09
-20
10
20
10
-20
11
20
11
-20
12
20
12
-20
13
20
13
-20
14
20
14
-20
15
Gross 142 38 127 271 115 285 238 463 275 281 205 192 105 207 329
9% 7% 19% 26% 18% 30% 23% 35% 40% 41% 29% 25% 16% 28% 36%
Net 142 38 127 259 95 283 169 459 223 245 202 153 69 150 329
9% 7% 19% 27% 17% 32% 18% 36% 37% 40% 31% 23% 12% 24% 38%
Acquisitions u/k u/k u/k u/k u/k u/k u/k u/k 19 17 1 10 0 11 0
Source: Research & Monitoring – Cambridgeshire County Council; Affordable Homes – South Cambridgeshire District Council
Figure A.6: Affordable housing completions by tenure (Indicator LOA2)
Social rented Intermediate housing Intermediate housing
2004-2005 81% 19% 0%
2005-2006 52% 48% 0%
2006-2007 51% 49% 0%
2007-2008 65% 35% 0%
2008-2009 67% 33% 0%
2009-2010 64% 36% 0%
2010-2011 70% 30% 0%
2011-2012 52% 33% 15%
2012-2013 30% 50% 19%
2013-2014 20% 30% 50%
2014-2015 0% 35% 65%
Source: Research & Monitoring – Cambridgeshire County Council; Affordable Homes – South Cambridgeshire District Council

January 2016 Annual Monitoring Report
181
Figure A.7: Gypsy & Traveller pitches and Travelling Showpeople plots completed (Indicators CO-H4 and LOA14)
Permanent Gypsy & Traveller Pitches
Gypsy & Traveller Pitches for Emergency Stopping
Permanent Travelling Showpeople Plots
Private Public Private Public Private Public
1999-2001 18 0 0 0 0 0
2001-2002 19 0 0 0 0 0
2002-2003 17 0 0 0 0 0
2003-2004 0 0 0 0 10 0
2004-2005 0 0 0 0 11 0
2005-2006 3 0 0 0 0 0
2006-2007 0 0 0 0 0 0
2007-2008 4 0 0 1 0 0
2008-2009 0 0 0 0 0 0
2009-2010 0 0 0 0 0 0
2010-2011 0 0 0 0 0 0
2011-2012 10 1 0 0 0 0
2012-2013 29 0 0 0 0 0
2013-2014 54 0 0 0 0 0
2014-2015 4 0 0 0 6 0
At 31 March 2015:
a further 8 Gypsy & Traveller pitches with planning permission were under construction;
a further 3 Gypsy & Traveller pitches with planning permission had not yet been started; and
a further 4 Travelling Showpeople plots with planning permission had not yet been started.
Source: Planning & New Communities – South Cambridgeshire District Council; Research & Monitoring – Cambridgeshire County Council
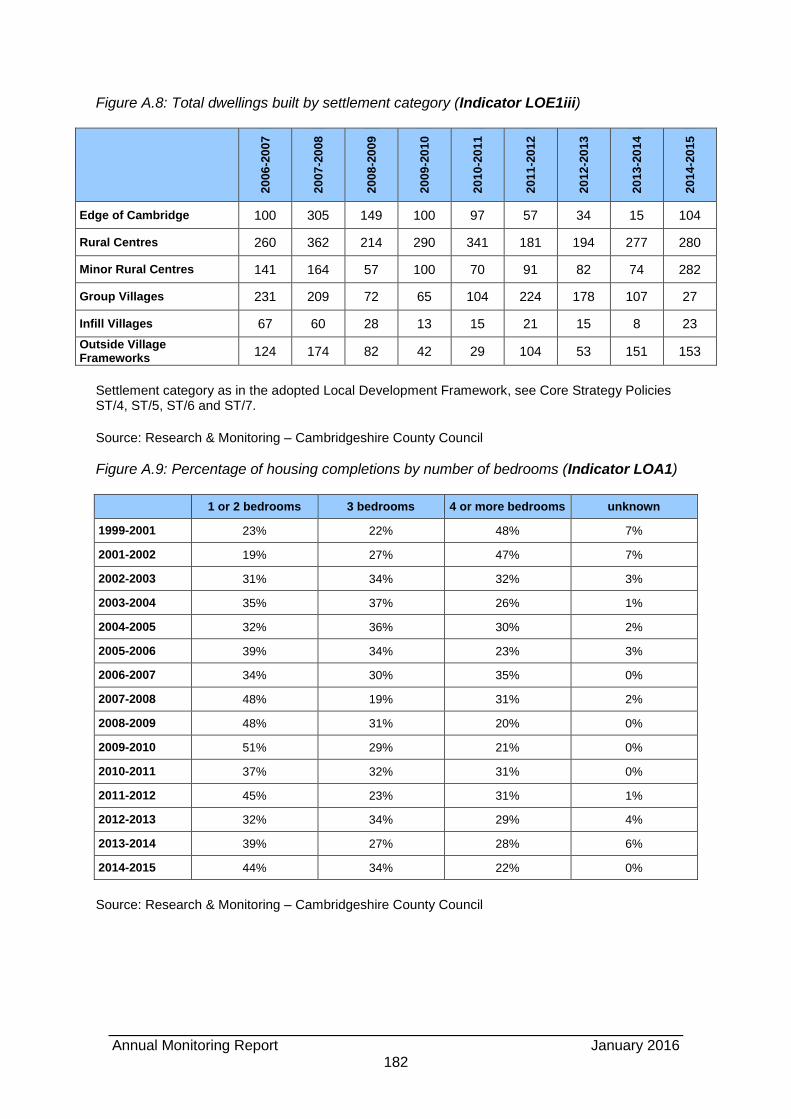
Annual Monitoring Report January 2016
182
Figure A.8: Total dwellings built by settlement category (Indicator LOE1iii)
20
06
-20
07
20
07
-20
08
20
08
-20
09
20
09
-20
10
20
10
-20
11
20
11
-20
12
20
12
-20
13
20
13
-20
14
20
14
-20
15
Edge of Cambridge 100 305 149 100 97 57 34 15 104
Rural Centres 260 362 214 290 341 181 194 277 280
Minor Rural Centres 141 164 57 100 70 91 82 74 282
Group Villages 231 209 72 65 104 224 178 107 27
Infill Villages 67 60 28 13 15 21 15 8 23
Outside Village Frameworks
124 174 82 42 29 104 53 151 153
Settlement category as in the adopted Local Development Framework, see Core Strategy Policies ST/4, ST/5, ST/6 and ST/7.
Source: Research & Monitoring – Cambridgeshire County Council
Figure A.9: Percentage of housing completions by number of bedrooms (Indicator LOA1)
1 or 2 bedrooms 3 bedrooms 4 or more bedrooms unknown
1999-2001 23% 22% 48% 7%
2001-2002 19% 27% 47% 7%
2002-2003 31% 34% 32% 3%
2003-2004 35% 37% 26% 1%
2004-2005 32% 36% 30% 2%
2005-2006 39% 34% 23% 3%
2006-2007 34% 30% 35% 0%
2007-2008 48% 19% 31% 2%
2008-2009 48% 31% 20% 0%
2009-2010 51% 29% 21% 0%
2010-2011 37% 32% 31% 0%
2011-2012 45% 23% 31% 1%
2012-2013 32% 34% 29% 4%
2013-2014 39% 27% 28% 6%
2014-2015 44% 34% 22% 0%
Source: Research & Monitoring – Cambridgeshire County Council
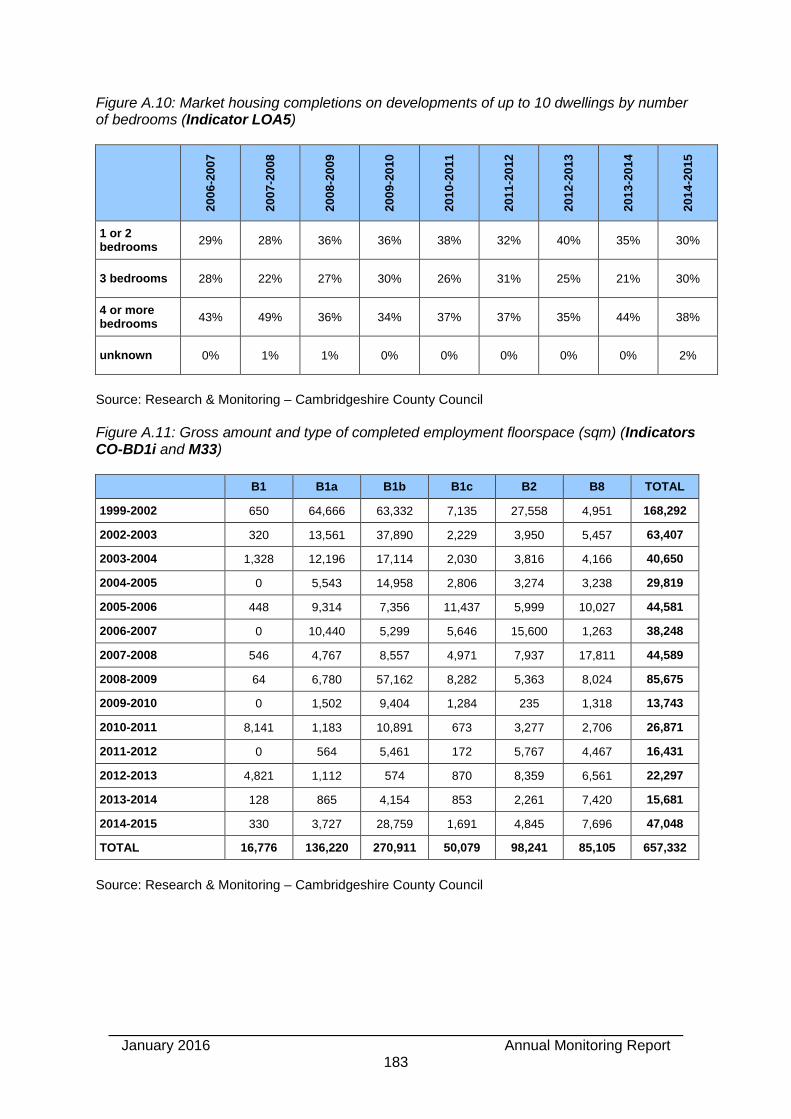
January 2016 Annual Monitoring Report
183
Figure A.10: Market housing completions on developments of up to 10 dwellings by number of bedrooms (Indicator LOA5)
20
06
-20
07
20
07
-20
08
20
08
-20
09
20
09
-20
10
20
10
-20
11
20
11
-20
12
20
12
-20
13
20
13
-20
14
20
14
-20
15
1 or 2 bedrooms
29% 28% 36% 36% 38% 32% 40% 35% 30%
3 bedrooms 28% 22% 27% 30% 26% 31% 25% 21% 30%
4 or more bedrooms
43% 49% 36% 34% 37% 37% 35% 44% 38%
unknown 0% 1% 1% 0% 0% 0% 0% 0% 2%
Source: Research & Monitoring – Cambridgeshire County Council
Figure A.11: Gross amount and type of completed employment floorspace (sqm) (Indicators CO-BD1i and M33)
B1 B1a B1b B1c B2 B8 TOTAL
1999-2002 650 64,666 63,332 7,135 27,558 4,951 168,292
2002-2003 320 13,561 37,890 2,229 3,950 5,457 63,407
2003-2004 1,328 12,196 17,114 2,030 3,816 4,166 40,650
2004-2005 0 5,543 14,958 2,806 3,274 3,238 29,819
2005-2006 448 9,314 7,356 11,437 5,999 10,027 44,581
2006-2007 0 10,440 5,299 5,646 15,600 1,263 38,248
2007-2008 546 4,767 8,557 4,971 7,937 17,811 44,589
2008-2009 64 6,780 57,162 8,282 5,363 8,024 85,675
2009-2010 0 1,502 9,404 1,284 235 1,318 13,743
2010-2011 8,141 1,183 10,891 673 3,277 2,706 26,871
2011-2012 0 564 5,461 172 5,767 4,467 16,431
2012-2013 4,821 1,112 574 870 8,359 6,561 22,297
2013-2014 128 865 4,154 853 2,261 7,420 15,681
2014-2015 330 3,727 28,759 1,691 4,845 7,696 47,048
TOTAL 16,776 136,220 270,911 50,079 98,241 85,105 657,332
Source: Research & Monitoring – Cambridgeshire County Council
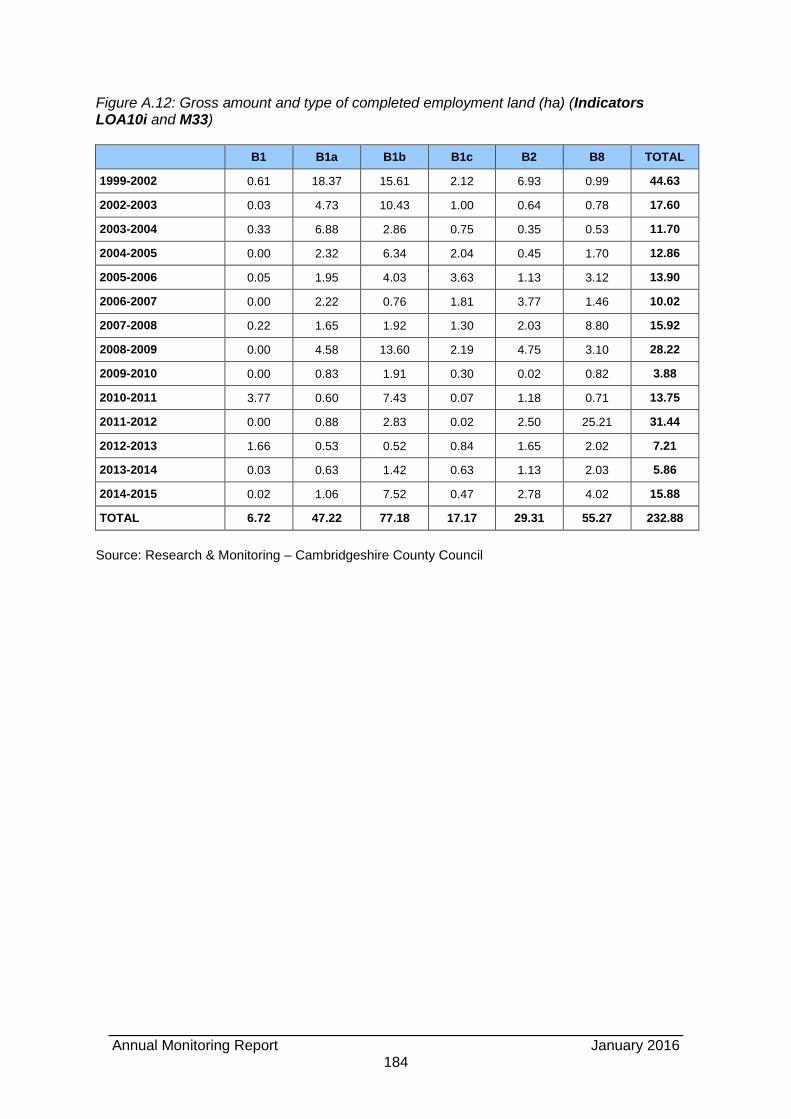
Annual Monitoring Report January 2016
184
Figure A.12: Gross amount and type of completed employment land (ha) (Indicators LOA10i and M33)
B1 B1a B1b B1c B2 B8 TOTAL
1999-2002 0.61 18.37 15.61 2.12 6.93 0.99 44.63
2002-2003 0.03 4.73 10.43 1.00 0.64 0.78 17.60
2003-2004 0.33 6.88 2.86 0.75 0.35 0.53 11.70
2004-2005 0.00 2.32 6.34 2.04 0.45 1.70 12.86
2005-2006 0.05 1.95 4.03 3.63 1.13 3.12 13.90
2006-2007 0.00 2.22 0.76 1.81 3.77 1.46 10.02
2007-2008 0.22 1.65 1.92 1.30 2.03 8.80 15.92
2008-2009 0.00 4.58 13.60 2.19 4.75 3.10 28.22
2009-2010 0.00 0.83 1.91 0.30 0.02 0.82 3.88
2010-2011 3.77 0.60 7.43 0.07 1.18 0.71 13.75
2011-2012 0.00 0.88 2.83 0.02 2.50 25.21 31.44
2012-2013 1.66 0.53 0.52 0.84 1.65 2.02 7.21
2013-2014 0.03 0.63 1.42 0.63 1.13 2.03 5.86
2014-2015 0.02 1.06 7.52 0.47 2.78 4.02 15.88
TOTAL 6.72 47.22 77.18 17.17 29.31 55.27 232.88
Source: Research & Monitoring – Cambridgeshire County Council
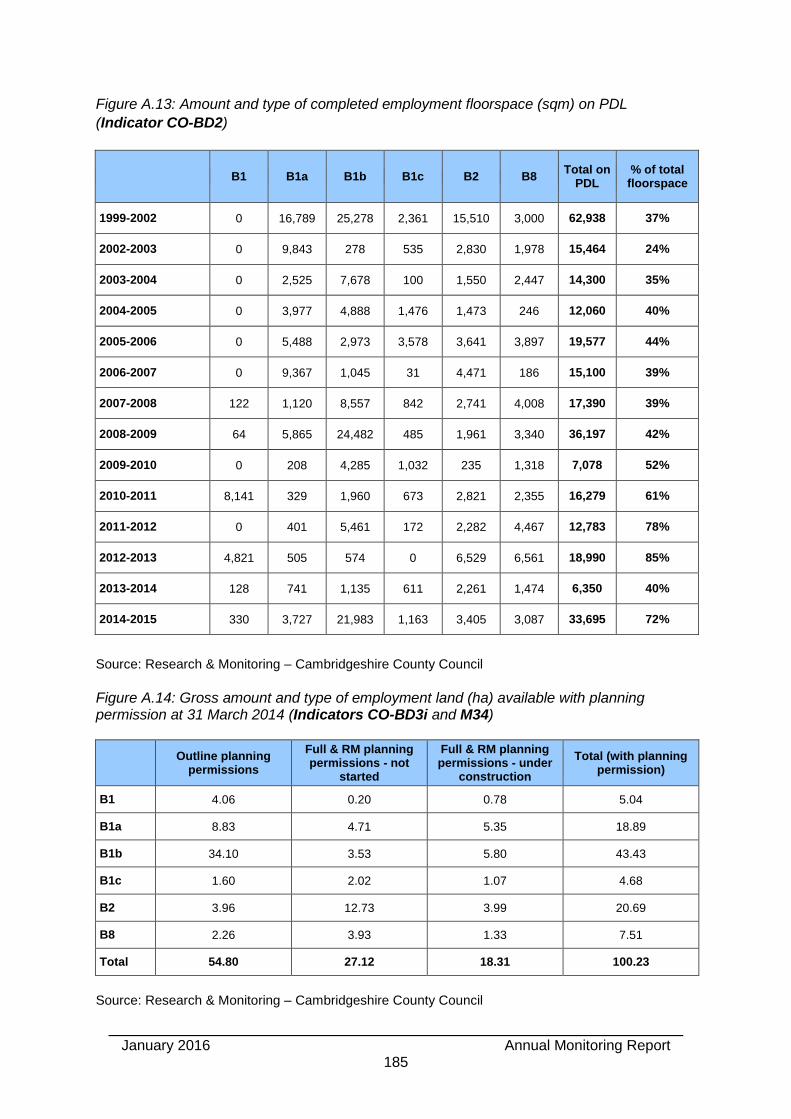
January 2016 Annual Monitoring Report
185
Figure A.13: Amount and type of completed employment floorspace (sqm) on PDL
(Indicator CO-BD2)
B1 B1a B1b B1c B2 B8 Total on
PDL % of total
floorspace
1999-2002 0 16,789 25,278 2,361 15,510 3,000 62,938 37%
2002-2003 0 9,843 278 535 2,830 1,978 15,464 24%
2003-2004 0 2,525 7,678 100 1,550 2,447 14,300 35%
2004-2005 0 3,977 4,888 1,476 1,473 246 12,060 40%
2005-2006 0 5,488 2,973 3,578 3,641 3,897 19,577 44%
2006-2007 0 9,367 1,045 31 4,471 186 15,100 39%
2007-2008 122 1,120 8,557 842 2,741 4,008 17,390 39%
2008-2009 64 5,865 24,482 485 1,961 3,340 36,197 42%
2009-2010 0 208 4,285 1,032 235 1,318 7,078 52%
2010-2011 8,141 329 1,960 673 2,821 2,355 16,279 61%
2011-2012 0 401 5,461 172 2,282 4,467 12,783 78%
2012-2013 4,821 505 574 0 6,529 6,561 18,990 85%
2013-2014 128 741 1,135 611 2,261 1,474 6,350 40%
2014-2015 330 3,727 21,983 1,163 3,405 3,087 33,695 72%
Source: Research & Monitoring – Cambridgeshire County Council
Figure A.14: Gross amount and type of employment land (ha) available with planning permission at 31 March 2014 (Indicators CO-BD3i and M34)
Outline planning
permissions
Full & RM planning permissions - not
started
Full & RM planning permissions - under
construction
Total (with planning permission)
B1 4.06 0.20 0.78 5.04
B1a 8.83 4.71 5.35 18.89
B1b 34.10 3.53 5.80 43.43
B1c 1.60 2.02 1.07 4.68
B2 3.96 12.73 3.99 20.69
B8 2.26 3.93 1.33 7.51
Total 54.80 27.12 18.31 100.23
Source: Research & Monitoring – Cambridgeshire County Council
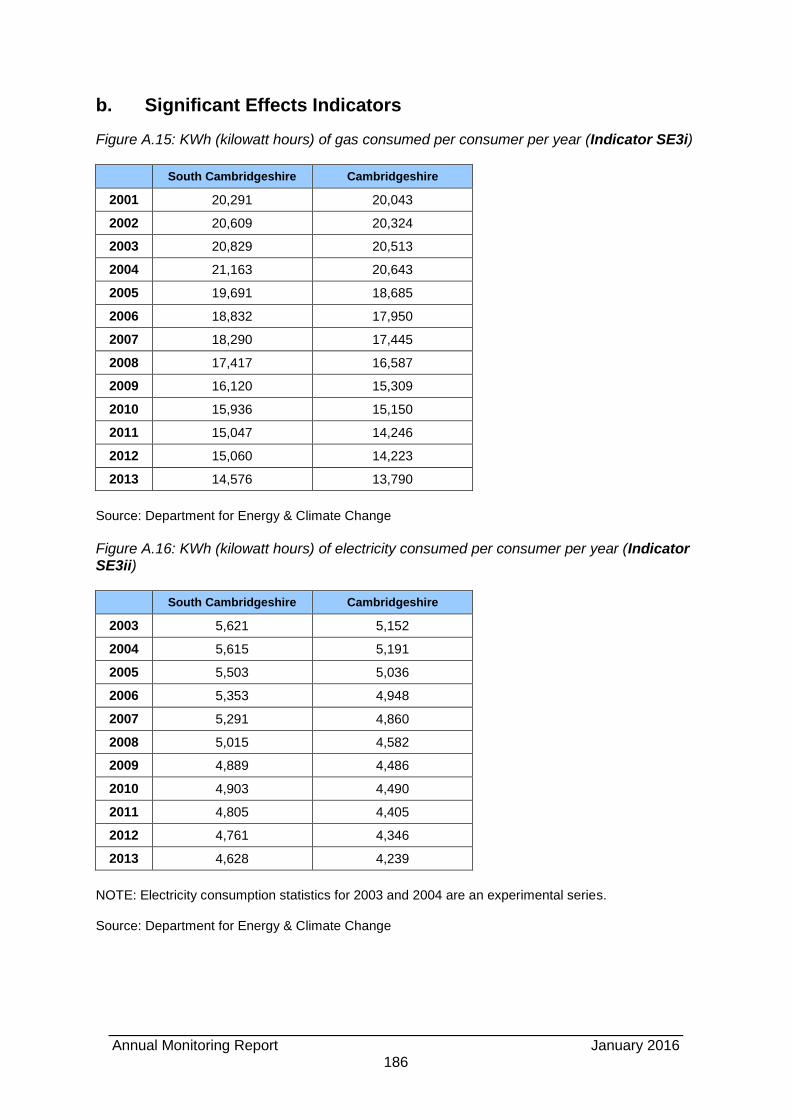
Annual Monitoring Report January 2016
186
b. Significant Effects Indicators
Figure A.15: KWh (kilowatt hours) of gas consumed per consumer per year (Indicator SE3i)
South Cambridgeshire Cambridgeshire
2001 20,291 20,043
2002 20,609 20,324
2003 20,829 20,513
2004 21,163 20,643
2005 19,691 18,685
2006 18,832 17,950
2007 18,290 17,445
2008 17,417 16,587
2009 16,120 15,309
2010 15,936 15,150
2011 15,047 14,246
2012 15,060 14,223
2013 14,576 13,790
Source: Department for Energy & Climate Change
Figure A.16: KWh (kilowatt hours) of electricity consumed per consumer per year (Indicator SE3ii)
South Cambridgeshire Cambridgeshire
2003 5,621 5,152
2004 5,615 5,191
2005 5,503 5,036
2006 5,353 4,948
2007 5,291 4,860
2008 5,015 4,582
2009 4,889 4,486
2010 4,903 4,490
2011 4,805 4,405
2012 4,761 4,346
2013 4,628 4,239
NOTE: Electricity consumption statistics for 2003 and 2004 are an experimental series. Source: Department for Energy & Climate Change
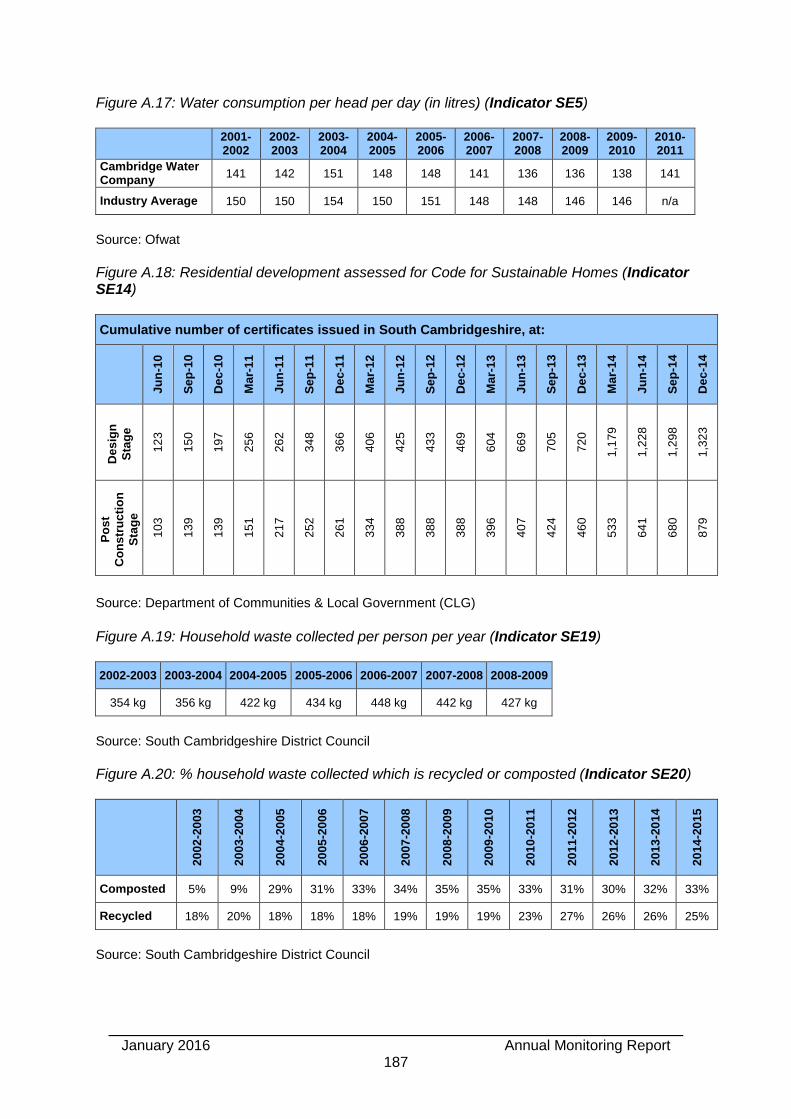
January 2016 Annual Monitoring Report
187
Figure A.17: Water consumption per head per day (in litres) (Indicator SE5)
2001- 2002
2002- 2003
2003- 2004
2004- 2005
2005- 2006
2006- 2007
2007- 2008
2008- 2009
2009- 2010
2010- 2011
Cambridge Water Company
141 142 151 148 148 141 136 136 138 141
Industry Average 150 150 154 150 151 148 148 146 146 n/a
Source: Ofwat Figure A.18: Residential development assessed for Code for Sustainable Homes (Indicator SE14)
Cumulative number of certificates issued in South Cambridgeshire, at:
Ju
n-1
0
Se
p-1
0
De
c-1
0
Ma
r-1
1
Ju
n-1
1
Se
p-1
1
De
c-1
1
Ma
r-1
2
Ju
n-1
2
Se
p-1
2
De
c-1
2
Ma
r-1
3
Ju
n-1
3
Se
p-1
3
De
c-1
3
Ma
r-1
4
Ju
n-1
4
Se
p-1
4
De
c-1
4
Des
ign
Sta
ge
12
3
15
0
19
7
25
6
26
2
34
8
36
6
40
6
42
5
43
3
46
9
60
4
66
9
70
5
72
0
1,1
79
1,2
28
1,2
98
1,3
23
Po
st
Co
ns
tru
cti
on
Sta
ge
10
3
13
9
13
9
15
1
21
7
25
2
26
1
33
4
38
8
38
8
38
8
39
6
40
7
42
4
46
0
53
3
64
1
68
0
87
9
Source: Department of Communities & Local Government (CLG)
Figure A.19: Household waste collected per person per year (Indicator SE19)
2002-2003 2003-2004 2004-2005 2005-2006 2006-2007 2007-2008 2008-2009
354 kg 356 kg 422 kg 434 kg 448 kg 442 kg 427 kg
Source: South Cambridgeshire District Council
Figure A.20: % household waste collected which is recycled or composted (Indicator SE20)
20
02
-20
03
20
03
-20
04
20
04
-20
05
20
05
-20
06
20
06
-20
07
20
07
-20
08
20
08
-20
09
20
09
-20
10
20
10
-20
11
20
11
-20
12
20
12
-20
13
20
13
-20
14
20
14
-20
15
Composted 5% 9% 29% 31% 33% 34% 35% 35% 33% 31% 30% 32% 33%
Recycled 18% 20% 18% 18% 18% 19% 19% 19% 23% 27% 26% 26% 25%
Source: South Cambridgeshire District Council
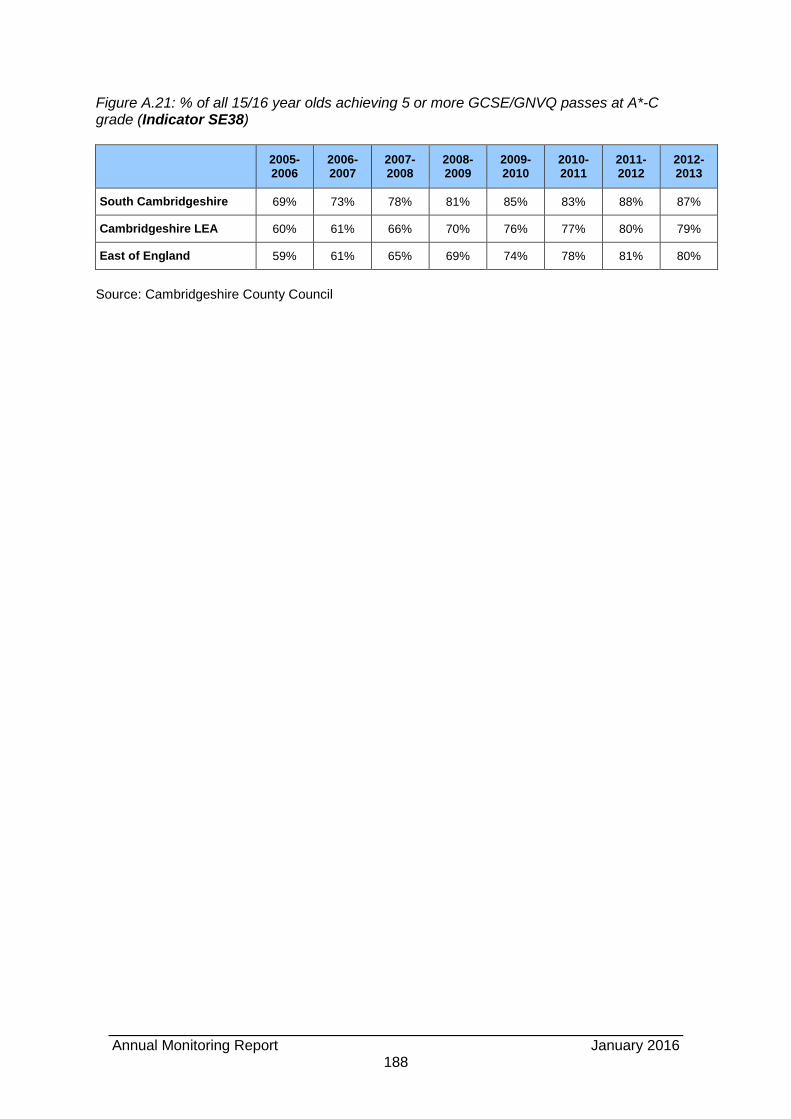
Annual Monitoring Report January 2016
188
Figure A.21: % of all 15/16 year olds achieving 5 or more GCSE/GNVQ passes at A*-C grade (Indicator SE38)
2005-2006
2006-2007
2007-2008
2008-2009
2009-2010
2010-2011
2011-2012
2012-2013
South Cambridgeshire 69% 73% 78% 81% 85% 83% 88% 87%
Cambridgeshire LEA 60% 61% 66% 70% 76% 77% 80% 79%
East of England 59% 61% 65% 69% 74% 78% 81% 80%
Source: Cambridgeshire County Council